As filed with the U.S. Securities and Exchange Commission on July 23, 2012
Securities Act File No. 333-181668
UNITED STATES
SECURITIES AND EXCHANGE COMMISSION
Washington, D.C. 20549
FORM N-14
REGISTRATION STATEMENT
UNDER THE SECURITIES ACT OF 1933 x
Pre-Effective Amendment No. 1 x
Post-Effective Amendment No. o
(Check appropriate box or boxes)
Morgan Stanley Institutional Fund, Inc.
(Exact Name of Registrant as Specified in Charter)
522 Fifth Avenue
New York, New York 10036
(Address of Principal Executive Offices: (Number, Street, City, State, Zip Code))
(212) 296-6970
(Area Code and Telephone Number)
Stefanie V. Chang Yu, Esq.
Morgan Stanley Investment Management Inc.
522 Fifth Avenue
New York, New York 10036
(Name and Address of Agent for Service)
Copy to:
Carl Frischling, Esq.
Kramer Levin Naftalis & Frankel LLP
1177 Avenue of the Americas
New York, New York 10036 | | Stuart M. Strauss, Esq.
Dechert LLP
1095 Avenue of the Americas
New York, New York 10036 | |
|
Approximate Date of Proposed Public Offering: As soon as practicable after the effective date of this Registration Statement.
No filing fee is required because an indefinite number of common shares of beneficial interest of Morgan Stanley Institutional Fund, Inc. have previously been registered pursuant to Rule 24f-2 under the Investment Company Act of 1940.
The Registrant hereby amends this Registration Statement on such date or dates as may be necessary to delay its effective date until the Registrant shall file a further amendment which specifically states that this Registration Statement shall thereafter become effective in accordance with Section 8(a) of the Securities Act of 1933 or until this Registration Statement shall become effective on such date as the Commission, acting pursuant to said Section 8(a), may determine.
MORGAN STANLEY INTERNATIONAL VALUE EQUITY FUND
MORGAN STANLEY INTERNATIONAL FUND
522 Fifth Avenue
New York, NY 10036
(800) 869-6397
NOTICE OF JOINT SPECIAL MEETING OF SHAREHOLDERS
TO BE HELD SEPTEMBER 27, 2012
To the Shareholders of Morgan Stanley International Value Equity Fund and Morgan Stanley International Fund:
Notice is hereby given of a Joint Special Meeting of Shareholders (the "Meeting") of Morgan Stanley International Value Equity Fund ("International Value Equity") and Morgan Stanley International Fund ("International"), to be held in Conference Room 3N, 3rd Floor, 522 Fifth Avenue, New York, NY 10036, at 9:00 a.m., New York time, on September 27, 2012, and any adjournments or postponements thereof, for the following purposes:
1. With respect to shareholders of International Value Equity, to consider and vote upon a proposal to approve the actions and transactions described in that certain Agreement and Plan of Reorganization, dated June 28, 2012 (the "International Equity Reorganization Agreement"), between International Value Equity and Morgan Stanley Institutional Fund, Inc. (the "Company"), on behalf of the International Equity Portfolio ("MSIF International Equity"), pursuant to which substantially all of the assets and liabilities of International Value Equity will be transferred to MSIF International Equity in exchange for shares of MSIF International Equity of the Class described in the accompanying Joint Proxy Statement and Prospectus and pursuant to which International Value Equity will be liquidated and terminated (the "International Equity Reorganization"). As a result of this transaction, shareholders of International Value Equity will become shareholders of MSIF International Equity receiving shares of MSIF International Equity with a value equal to the aggregate net asset value of their shares of International Value Equity held immediately prior to the International Equity Reorganization;
2. With respect to shareholders of International, to consider and vote upon a proposal to approve the actions and transactions described in that certain Agreement and Plan of Reorganization, dated June 28, 2012 (the "Active International Reorganization Agreement"), between International and the Company, on behalf of the Active International Allocation Portfolio ("MSIF Active International"), pursuant to which substantially all of the assets and liabilities of International will be transferred to MSIF Active International in exchange for shares of MSIF Active International of the Class described in the accompanying Joint Proxy Statement and Prospectus and pursuant to which International will be liquidated and terminated (the "Active International Reorganization"). As a result of this transaction, shareholders of International will become shareholders of MSIF Active International receiving shares of MSIF Active International with a value equal to the aggregate net asset value of their shares of International held immediately prior to the Active International Reorganization; and
3. To act upon such other matters as may properly come before the Meeting.
MSIF International Equity and MSIF Active International are each referred to herein as an "Acquiring Fund," and together as the "Acquiring Funds." International Value Equity and International are each referred to herein as an "Acquired Fund," and together as the "Acquired Funds." The International Equity Reorganization Agreement and Active International Reorganization Agreement are each referred to herein as a "Reorganization Agreement," and together as the "Reorganization Agreements." The International Equity Reorganization and Active International Reorganization are each referred to herein as a "Reorganization," and together as the "Reorganizations."
Each Reorganization is more fully described in the accompanying Joint Proxy Statement and Prospectus and a form of each Reorganization Agreement is attached as Exhibit A thereto. Shareholders of record of each of the Acquired Funds at the close of business on July 2, 2012 are entitled to notice of, and to vote at, the Meeting. Please read the Joint Proxy Statement and Prospectus carefully before telling us, through your Proxy or in person, how
you wish your shares to be voted. Alternatively, if you are eligible to vote telephonically by touchtone telephone or electronically on the Internet (as discussed in the enclosed Joint Proxy Statement and Prospectus), you may do so in lieu of attending the Meeting in person. The Board of Trustees of each of International Value Equity and International recommends that you vote in favor of the applicable Reorganization. WE URGE YOU TO PROMPTLY SIGN, DATE AND MAIL THE ENCLOSED PROXY OR RECORD YOUR VOTE ELECTRONICALLY VIA TELEPHONE OR THE INTERNET.
By Order of the Boards of Trustees,
Mary E. Mullin
Secretary
July 24, 2012
You can help avoid the necessity and expense of sending follow-up letters to ensure a quorum by promptly returning the enclosed Proxy. If you are unable to be present in person, please fill in, sign and return the enclosed Proxy in order that the necessary quorum be represented at the Meeting. The enclosed envelope requires no postage if mailed in the United States. Shareholders will be able to vote telephonically by touchtone telephone or electronically on the Internet by following instructions on their proxy cards or on the enclosed Voting Information Card.
MORGAN STANLEY INSTITUTIONAL FUND, INC.
INTERNATIONAL EQUITY PORTFOLIO
ACTIVE INTERNATIONAL ALLOCATION PORTFOLIO
522 Fifth Avenue
New York, NY 10036
(800) 548-7786
This Joint Proxy Statement and Prospectus is being furnished to shareholders ("Shareholders") of each of Morgan Stanley International Value Equity Fund ("International Value Equity") and Morgan Stanley International Fund ("International") in connection with a Joint Special Meeting of Shareholders (the "Meeting") to be held in Conference Room 3N, 3rd Floor, 522 Fifth Avenue, New York, NY 10036, at 9:00 a.m., New York time, on September 27, 2012, and any adjournments or postponements thereof, for the following purposes:
1. With respect to shareholders of International Value Equity, to consider and vote upon a proposal to approve the actions and transactions described in that certain Agreement and Plan of Reorganization, dated June 28, 2012 (the "International Equity Reorganization Agreement"), between International Value Equity and Morgan Stanley Institutional Fund, Inc. (the "Company"), on behalf of the International Equity Portfolio ("MSIF International Equity"), pursuant to which substantially all of the assets and liabilities of International Value Equity will be transferred to MSIF International Equity in exchange for shares of MSIF International Equity of the Class described in this Joint Proxy Statement and Prospectus and pursuant to which International Value Equity will be liquidated and terminated (the "International Equity Reorganization"). As a result of this transaction, shareholders of International Value Equity will become shareholders of MSIF International Equity receiving shares of MSIF International Equity with a value equal to the aggregate net asset value of their shares of International Value Equity held immediately prior to the International Equity Reorganization;
2. With respect to shareholders of International, to consider and vote upon a proposal to approve the actions and transactions described in that certain Agreement and Plan of Reorganization, dated June 28, 2012 (the "Active International Reorganization Agreement"), between International and the Company, on behalf of the Active International Allocation Portfolio ("MSIF Active International"), pursuant to which substantially all of the assets and liabilities of International will be transferred to MSIF Active International in exchange for shares of MSIF Active International of the Class described in this Joint Proxy Statement and Prospectus and pursuant to which International will be liquidated and terminated (the "Active International Reorganization"). As a result of this transaction, shareholders of International will become shareholders of MSIF Active International receiving shares of MSIF Active International with a value equal to the aggregate net asset value of their shares of International held immediately prior to the Active International Reorganization; and
3. To act upon such other matters as may properly come before the Meeting.
MSIF International Equity and MSIF Active International are each referred to herein as an "Acquiring Fund," and together as the "Acquiring Funds." International Value Equity and International are each referred to herein as an "Acquired Fund," and together as the "Acquired Funds" and, along with the Acquiring Funds, the "Funds." The International Equity Reorganization Agreement and Active International Reorganization Agreement are each referred to herein as a "Reorganization Agreement," and together as the "Reorganization Agreements." The International Equity Reorganization and Active International Reorganization are each referred to herein as a "Reorganization," and together as the "Reorganizations."
The terms and conditions of each transaction are more fully described in this Joint Proxy Statement and Prospectus and in the form of each Reorganization Agreement attached hereto as Exhibit A. The address and telephone number of the Acquired Funds is the same as that of the Acquiring Funds set forth above. This Joint Proxy Statement also constitutes a Prospectus of each Acquiring Fund, filed by the Company with the Securities and Exchange Commission (the "Commission") as part of the Company's Registration Statement on Form N-14 (the "Registration Statement").
The Company is an open-end management investment company. The investment objective of MSIF International Equity is to seek long-term capital appreciation by investing primarily in equity securities of non-U.S. issuers. The investment objective of MSIF Active International is to seek long-term capital appreciation by investing primarily, in accordance with country and sector weightings determined by MSIF Active International's investment adviser, in equity securities of non-U.S. issuers which, in the aggregate, replicate broad market indices.
This Joint Proxy Statement and Prospectus sets forth concisely information about the Acquiring Funds that Shareholders of the Acquired Funds should know before voting on the applicable Reorganization Agreement. A copy of the Prospectuses for the Acquiring Funds, each dated April 30, 2012, as it may be amended and supplemented from time to time, is attached as Exhibit B and incorporated herein by reference. Also incorporated herein by reference are the Prospectuses of International Value Equity, dated December 30, 2011, and International, dated February 29, 2012.
In addition, also enclosed and incorporated herein by reference is the Annual Report of the Company relating to the Acquiring Funds for the fiscal year ended December 31, 2011. Also incorporated herein by reference are the Annual Reports of International Value Equity for the fiscal year ended August 31, 2011 and International for the fiscal year ended October 31, 2011 and the Semi-Annual Report of International Value Equity for the six-month period ended February 29, 2012 and International for the six-month period ended April 30, 2012. A Joint Statement of Additional Information relating to the Reorganizations, described in this Joint Proxy Statement and Prospectus, dated July 24, 2012, has been filed with the Commission and is also incorporated herein by reference. Such documents are available upon request and without charge by calling (800) 869-6397 with respect to the Acquired Fund and (800) 548-7786 with respect to the Acquiring Fund or by visiting the Commission's website at www.sec.gov.
Shareholders are advised to read and retain this Joint Proxy Statement and Prospectus for future reference.
The Securities and Exchange Commission has not approved or disapproved these securities or passed upon the adequacy of this Prospectus. Any representation to the contrary is a criminal offense.
This Joint Proxy Statement and Prospectus is dated July 24, 2012.
TABLE OF CONTENTS
JOINT PROXY STATEMENT AND PROSPECTUS
| Synopsis | | | 1 | | |
|
| General | | | 1 | | |
|
| The Reorganizations | | | 1 | | |
|
| Fee Tables | | | 2 | | |
|
| International Equity Reorganization | | | 2 | | |
|
| Active International Reorganization | | | 5 | | |
|
| Annual Fund Operating Expenses | | | 7 | | |
|
| Portfolio Turnover | | | 7 | | |
|
| Tax Consequences of the Reorganizations | | | 7 | | |
|
| Comparison of each Acquired Fund and Acquiring Fund | | | 7 | | |
|
| Record Date; Quorum | | | 16 | | |
|
| Proxies | | | 16 | | |
|
| Expenses of Solicitation | | | 17 | | |
|
| Vote Required | | | 17 | | |
|
| Principal Risk Factors | | | 18 | | |
|
| Performance Information | | | 21 | | |
|
| The Reorganizations | | | 21 | | |
|
| The Boards' Considerations | | | 21 | | |
|
| The Reorganization Agreements | | | 22 | | |
|
| Tax Aspects of the Reorganizations | | | 23 | | |
|
| Description of Shares | | | 24 | | |
|
| Capitalization Tables (unaudited) | | | 25 | | |
|
| Appraisal Rights | | | 26 | | |
|
| Comparison of Investment Objectives, Principal Policies and Restrictions | | | 26 | | |
|
| Investment Objectives and Policies | | | 26 | | |
|
| International Value Equity | | | 26 | | |
|
| MSIF International Equity | | | 27 | | |
|
| International | | | 28 | | |
|
| MSIF Active International | | | 29 | | |
|
| Investment Restrictions | | | 29 | | |
|
| Additional Information About the Acquiring Funds and the Acquired Funds | | | 30 | | |
|
| General | | | 30 | | |
|
| Rights of Acquired Fund Shareholders and Acquiring Fund Shareholders | | | 30 | | |
|
| Financial Information | | | 32 | | |
|
| Shareholder Proposals | | | 32 | | |
|
| Management | | | 32 | | |
|
| Description of Shares and Shareholder Inquiries | | | 32 | | |
|
| Dividends, Distributions and Taxes | | | 32 | | |
|
| Purchases, Exchanges and Redemptions | | | 33 | | |
|
| Share Information | | | 33 | | |
|
| Financial Statements and Experts | | | 37 | | |
|
| Legal Matters | | | 37 | | |
|
| Available Information | | | 37 | | |
|
| Other Business | | | 38 | | |
|
| Exhibit A – Form of Agreement and Plan of Reorganization | | | |
|
Exhibit B – Prospectus of each Acquiring Fund dated April 30, 2012, as it may be amended and
supplemented from time to time | | | |
|
| Exhibit C – Annual Report for the Company relating to the Acquiring Funds for the fiscal year ended December 31, 2011 | | | |
|
SYNOPSIS
The following is a synopsis of certain information contained in or incorporated by reference in this Joint Proxy Statement and Prospectus. This synopsis is only a summary and is qualified in its entirety by the more detailed information contained or incorporated by reference in this Joint Proxy Statement and Prospectus and the Reorganization Agreements. Shareholders should carefully review this Joint Proxy Statement and Prospectus and the Reorganization Agreements in their entirety and, in particular, the Acquiring Funds' Prospectuses, which are attached to this Joint Proxy Statement and Prospectus as Exhibit B and incorporated herein by reference.
General
This Joint Proxy Statement and Prospectus is being furnished to Shareholders of each of International Value Equity and International, each an open-end management investment company, in connection with the solicitation by the Board of Trustees of each of International Value Equity and International (each a "Board," and together, the "Boards") of proxies ("Proxies") to be used at the Meeting to consider the Reorganizations. It is expected that the first mailing of this Joint Proxy Statement and Prospectus will be made on or about July 27, 2012.
Shareholders of each Acquired Fund will vote separately on the Reorganization for that Acquired Fund. Each Reorganization is not dependent on the approval of the other. Pursuant to each Reorganization, Class A, Class B, Class R and Class W Shareholders of each Acquired Fund will receive Class H shares of each respective Acquiring Fund, while Class I Shareholders of each Acquired Fund will receive Class I shares of each respective Acquiring Fund and Class C Shareholders of each Acquired Fund will receive Class L shares of each respective Acquiring Fund. The shares to be issued by each Acquiring Fund pursuant to each Reorganization (the "Acquiring Fund Shares") will be issued at net asset value without any sales charges. Any subsequent purchases of Class H shares, including through the dividend reinvestment plan, of the applicable Acquiring Fund after the applicable Reorganization by the former Class A, Class B, Class R and Class W Shareholders of an Acquired Fund will be subject to the initial sales charge schedule. See "Comparison of each Acquired Fund and Acquiring Fund—Purchases, Exchanges and Redemptions" below. Further information relating to the Acquiring Funds is set forth herein and in the applicable Acquiring Funds' current Prospectus, dated April 30, 2012 (the "Acquiring Funds' Prospectus"), attached to this Joint Proxy Statement and Prospectus as Exhibit B and incorporated herein by reference.
As of May 16, 2012, each Acquired Fund suspended the offering of its Class R and Class W shares to all investors and the offering of Class B shares to new investors in anticipation of the applicable Reorganization. In addition, as of June 12, 2012, each Acquired Fund suspended the offering of its Class A, Class C and Class I shares to new investors in anticipation of the applicable Reorganization. The Company's Board of Directors has authorized the issuance of the Acquiring Fund Shares to Shareholders of the Acquired Funds, as applicable, in connection with each Reorganization.
The information concerning the Acquired Funds contained herein has been supplied by each respective Acquired Fund. The information concerning the Acquiring Funds contained herein has been supplied by the Company.
The Reorganizations
Each Reorganization is being proposed because the Board of Trustees of each Acquired Fund has determined that such Reorganization is in the best interests of the applicable Acquired Fund and its Shareholders. Each Reorganization will allow Shareholders of the applicable Acquired Fund to be invested in a fund that is managed according to similar investment objectives, strategies and restrictions with lower total operating expenses. See "The Reorganizations—The Boards' Considerations."
Each Reorganization Agreement provides for the transfer of substantially all the assets of the applicable Acquired Fund, and the assumption of liabilities, to the applicable Acquiring Fund in exchange for the applicable Acquiring Fund Shares. The aggregate net asset value of the applicable Acquiring Fund Shares issued in the exchange will equal the aggregate value of the net assets of the applicable Acquired Fund received by the applicable Acquiring Fund. On or after the closing date scheduled for each Reorganization (the "Closing Date"), the applicable Acquired Fund will distribute the applicable Acquiring Fund Shares received by such Acquired Fund to its Shareholders as of
1
the Valuation Date (as defined below) in complete liquidation of such Acquired Fund and, without further notice, the outstanding shares of such Acquired Fund held by such Shareholders will then be redeemed and canceled as permitted by the organizational documents of the Acquired Fund and applicable law. Each Acquired Fund thereafter will be deregistered as an investment company under the Investment Company Act of 1940, as amended (the "1940 Act"). As a result of each Reorganization, each Shareholder will receive that number of full and fractional Acquiring Fund Shares, as applicable, equal in value to such Shareholder's pro rata interest in the net assets of the applicable Acquired Fund transferred to the applicable Acquiring Fund. Pursuant to each Reorganization, Class A, Class B, Class R and Class W Shareholders of each Acquired Fund will receive Class H shares of each Acquiring Fund, while Class C Shareholders of each Acquired Fund will receive Class L of each Acquiring Fund and Class I Shareholders of each Acquired Fund will receive Class I shares of each Acquiring Fund. The Boards have determined that the interests of the Shareholders will not be diluted as a result of the applicable Reorganization. The "Valuation Date" is the date following the receipt of the requisite approval of the applicable Reorganization Agreement by Shareholders on which the number of applicable Acquiring Fund Shares to be delivered to each Acquired Fund will be determined.
For the reasons set forth below under "The Reorganization—The Board's Considerations," each Board, including the Trustees who are not "interested persons" of an Acquired Fund ("Independent Board Members"), as that term is defined in the 1940 Act, has concluded that each respective Reorganization is advisable and in the best interests of the applicable Acquired Fund and its Shareholders and recommends approval of each respective Reorganization.
Fee Tables
The following tables briefly describe the shareholder fees and annual Fund operating expenses that Shareholders of the Funds bear directly and indirectly from an investment in the Funds. Shareholder fees will not be charged on those Acquiring Fund Shares received in connection with the Reorganizations. Each Fund pays expenses for management of its assets, distribution of its shares and other services, and those expenses are reflected in the net asset value per share of each Fund. These expenses are deducted from each respective Fund's assets and are based on actual expenses incurred by each of International Value Equity and International for its fiscal years ended August 31, 2011 and October 31, 2011, respectively (except that for each Acquired Fund, the actual 12b-1 fees incurred by Class B Shares and Class C Shares of such Acquired Fund for such period may have been less than the maximum 1.00% permitted under the plans). The tables also set forth pro forma fees for the applicable surviving combined fund (MSIF International Equity and MSIF Active International) (each a "Combined Fund") reflecting what the fee schedule would have been on December 31, 2011, if each Reorganization had been consummated twelve (12) months prior to that date.
International Equity Reorganization
Shareholder Fees
(fees paid directly from your investment)
| International Value Equity (Acquired Fund) | | Class A | | Class B | | Class R | | Class W | | Class C | | Class I | |
Maximum sales charge (load)
imposed on purchases (as a
percentage of offering price) | | | 5.25 | %(1) | | | None | | | | None | | | | None | | | | None | | | | None | | |
Maximum deferred sales charge
(load) (as a percentage based on
the lesser of the offering price or
net asset value at redemption) | | | None(2) | | | | 5.00 | %(3) | | | None | | | | None | | | | 1.00 | %(3) | | | None | | |
| Redemption Fee(4) | | | 2.00 | % | | | 2.00 | % | | | 2.00 | % | | | 2.00 | % | | | 2.00 | % | | | 2.00 | % | |
2
| MSIF International Equity (Acquiring Fund) | | Class H | | Class L | | Class I | |
Maximum sales charge (load)
imposed on purchases (as a
percentage of offering price) | | | 4.75 | %(5) | | | None | | | | None | | |
| Redemption Fee(4) | | | 2.00 | % | | | 2.00 | % | | | 2.00 | % | |
| Pro Forma Combined Fund (MSIF International Equity) | | Class H | | Class L | | Class I | |
Maximum sales charge (load)
imposed on purchases (as a
percentage of offering price) | | | 4.75 | %(5) | | | None | | | | None | | |
| Redemption Fee(4) | | | 2.00 | % | | | 2.00 | % | | | 2.00 | % | |
(1) Reduced for purchases of $25,000 and over.
(2) Investments that are not subject to any sales charges at the time of purchase are subject to a contingent deferred sales charge ("CDSC") of 1.00% that will be imposed if you sell your shares within 18 months after purchase, except for certain specific circumstances.
(3) The Class B CDSC is scaled down to 1.00% during the sixth year, reaching zero thereafter and the Class C CDSC is only applicable if you sell your shares within one year after purchase.
(4) Payable to the fund on shares redeemed or exchanged within 30 days of purchase. The redemption fee is based on the redemption proceeds.
(5) Reduced for purchases of $50,000 and over.
Annual Fund Operating Expenses
(expenses that are deducted from Fund assets)
| International Value Equity (Acquired Fund) | | Class A | | Class B | | Class R | | Class W | | Class C | | Class I | |
| Advisory Fees | | | 0.80 | % | | | 0.80 | % | | | 0.80 | % | | | 0.80 | % | | | 0.80 | % | | | 0.80 | % | |
| Distribution and/or Service (12b-1) Fees | | | 0.25 | % | | | 0.24 | % | | | 0.50 | % | | | 0.35 | % | | | 0.99 | % | | | None | | |
| Other Expenses | | | 0.42 | % | | | 0.42 | % | | | 0.42 | % | | | 0.42 | % | | | 0.42 | % | | | 0.42 | % | |
| Total Annual Fund Operating Expenses | | | 1.47 | % | | | 1.46 | % | | | 1.72 | % | | | 1.57 | % | | | 2.21 | % | | | 1.22 | % | |
| MSIF International Equity (Acquiring Fund) | | Class H | | Class L | | Class I | |
| Advisory Fees | | | 0.80 | % | | | 0.80 | % | | | 0.80 | % | |
| Distribution and/or Service (12b-1) Fees | | | 0.25 | % | | | 0.75 | % | | | None | | |
| Other Expenses | | | 0.18 | %‡ | | | 0.18 | %‡ | | | 0.18 | % | |
| Total Annual Fund Operating Expenses* | | | 1.23 | % | | | 1.73 | % | | | 0.98 | % | |
| Fee Waiver and/or Expense Reimbursement* | | | 0.03 | % | | | 0.03 | % | | | 0.03 | % | |
Total Annual Fund Operating Expenses After
Fee Waiver and/or Expense Reimbursement* | | | 1.20 | % | | | 1.70 | % | | | 0.95 | % | |
3
| Pro Forma Combined Fund (MSIF International Equity) | | Class H | | Class L | | Class I | |
| Advisory Fees | | | 0.80 | % | | | 0.80 | % | | | 0.80 | % | |
| Distribution and/or Service (12b-1) Fees | | | 0.25 | % | | | 0.75 | % | | | None | | |
| Other Expenses | | | 0.18 | % | | | 0.18 | % | | | 0.18 | % | |
| Total Annual Fund Operating Expenses* | | | 1.23 | % | | | 1.73 | % | | | 0.98 | % | |
| Fee Waiver and/or Expense Reimbursement* | | | 0.03 | % | | | 0.03 | % | | | 0.03 | % | |
Total Annual Fund Operating Expenses After
Fee Waiver and/or Expense Reimbursement* | | | 1.20 | % | | | 1.70 | % | | | 0.95 | % | |
* Morgan Stanley Investment Management Inc. ("MSIM"), the Acquiring Fund's investment adviser, has agreed to reduce its advisory fee and/or reimburse the Acquiring Fund so that Total Annual Portfolio Operating Expenses, excluding certain investment related expenses, will not exceed 0.95% for Class I, 1.20% for Class H and 1.70% for Class L. The fee waivers and/or expense reimbursements will continue for at least two years from the date of the Reorganization or until such time as the Board acts to discontinue all or a portion of such waivers and/or reimbursements when it deems such action is appropriate.
‡ Other expenses have been estimated for the current fiscal year.
Example
To attempt to show the effect of these expenses on an investment over time, the hypothetical shown below has been created. The example assumes that an investor invests $10,000 in either International Value Equity or MSIF International Equity for the time periods indicated and that an investor then redeems all of his or her shares at the end of those periods. The example also assumes that the investment has a 5% return each year and that the operating expenses for each Fund remains the same (as set forth in the chart above) (except for the ten-year amounts for Class B shares of International Value Equity which reflect the conversion to Class A shares of International Value Equity eight years after the end of the calendar month in which shares were purchased). Although a Shareholder's actual costs may be higher or lower, the table below shows a Shareholder's costs at the end of each period based on these assumptions.
| International Value Equity (Acquired Fund) | | 1 Year | | 3 Years | | 5 Years | | 10 Years | |
| Class A | | $ | 667 | | | $ | 965 | | | $ | 1,286 | | | $ | 2,190 | | |
| Class B | | $ | 649 | | | $ | 762 | | | $ | 997 | | | $ | 1,746 | ** | |
| Class R | | $ | 175 | | | $ | 542 | | | $ | 933 | | | $ | 2,030 | | |
| Class W | | $ | 160 | | | $ | 496 | | | $ | 855 | | | $ | 1,867 | | |
| Class C | | $ | 324 | | | $ | 691 | | | $ | 1,185 | | | $ | 2,544 | | |
| Class I | | $ | 124 | | | $ | 387 | | | $ | 670 | | | $ | 1,477 | | |
| MSIF International Equity (Acquiring Fund) | | | | | | | | | |
| Class H* | | $ | 591 | | | $ | 838 | | | $ | 1,103 | | | $ | 1,860 | | |
| Class L* | | $ | 173 | | | $ | 536 | | | $ | 923 | | | $ | 2,009 | | |
| Class I | | $ | 97 | | | $ | 303 | | | $ | 525 | | | $ | 1,166 | | |
| Pro Forma Combined Fund (MSIF International Equity) | | | | | | | | | |
| Class H | | $ | 591 | | | $ | 838 | | | $ | 1,103 | | | $ | 1,860 | | |
| Class L | | $ | 173 | | | $ | 536 | | | $ | 923 | | | $ | 2,009 | | |
| Class I | | $ | 97 | | | $ | 303 | | | $ | 525 | | | $ | 1,166 | | |
* The figures shown reflect the estimated expenses of Class H and Class L and the maximum sales charge of 4.75% applicable to purchases of Class H shares.
** Does not reflect conversion to Class A shares eight years after the end of the calendar month in which shares were purchased. The conversion feature is currently suspended because the total annual operating expense ratio of Class B is currently lower than that of Class A.
4
Active International Reorganization
Shareholder Fees
(fees paid directly from your investment)
| International (Acquired Fund) | | Class A | | Class B | | Class R | | Class W | | Class C | | Class I | |
Maximum sales charge (load)
imposed on purchases (as a
percentage of offering price) | | | 5.25 | %(1) | | | None | | | | None | | | | None | | | | None | | | | None | | |
Maximum deferred sales charge
(load) (as a percentage based on
the lesser of the offering price or
net asset value at redemption) | | | None(2) | | | | 5.00 | %(3) | | | None | | | | None | | | | 1.00 | %(3) | | | None | | |
| Redemption fee(4) | | | 2.00 | % | | | 2.00 | % | | | 2.00 | % | | | 2.00 | % | | | 2.00 | % | | | 2.00 | % | |
| MSIF Active International (Acquiring Fund) | | Class H | | Class L | | Class I | |
Maximum sales charge (load)
imposed on purchases (as a
percentage of offering price) | | | 4.75 | %(5) | | | None | | | | None | | |
| Redemption fee(4) | | | 2.00 | % | | | 2.00 | % | | | 2.00 | % | |
| Pro Forma Combined Fund (MSIF Active International) | | Class H | | Class L | | Class I | |
Maximum sales charge (load)
imposed on purchases (as a
percentage of offering price) | | | 4.75 | %(5) | | | None | | | | None | | |
| Redemption fee(4) | | | 2.00 | % | | | 2.00 | % | | | 2.00 | % | |
(1) Reduced for purchases of $25,000 and over.
(2) Investments that are not subject to any sales charges at the time of purchase are subject to a CDSC of 1.00% that will be imposed if you sell your shares within 18 months after purchase, except for certain specific circumstances.
(3) The Class B CDSC is scaled down to 1.00% during the sixth year, reaching zero thereafter and the Class C CDSC is only applicable if you sell your shares within one year after purchase.
(4) Payable to the fund on shares redeemed or exchanged within 30 days of purchase. The redemption fee is based on the redemption proceeds.
(5) Reduced for purchases of $50,000 and over.
Annual Fund Operating Expenses
(expenses that are deducted from Fund assets)
| International (Acquired Fund) | | Class A | | Class B | | Class R | | Class W | | Class C | | Class I | |
| Advisory Fees | | | 0.65 | % | | | 0.65 | % | | | 0.65 | % | | | 0.65 | % | | | 0.65 | % | | | 0.65 | % | |
| Distribution and/or Service (12b-1) Fees | | | 0.25 | % | | | 1.00 | % | | | 0.50 | % | | | 0.35 | % | | | 0.99 | % | | | None | | |
| Other Expenses | | | 0.68 | % | | | 0.68 | % | | | 0.68 | % | | | 0.68 | % | | | 0.68 | % | | | 0.68 | % | |
| Total Annual Fund Operating Expenses | | | 1.58 | % | | | 2.33 | % | | | 1.83 | % | | | 1.68 | % | | | 2.32 | % | | | 1.33 | % | |
5
| MSIF Active International (Acquiring Fund) | | Class H | | Class L | | Class I | |
| Advisory Fees | | | 0.65 | % | | | 0.65 | % | | | 0.65 | % | |
| Distribution and/or Service (12b-1) Fees | | | 0.25 | % | | | 0.75 | % | | | None | | |
| Other Expenses | | | 0.30 | %‡ | | | 0.30 | %‡ | | | 0.30 | % | |
| Total Annual Fund Operating Expenses* | | | 1.20 | % | | | 1.70 | % | | | 0.95 | % | |
| Fee Waiver and/or Expense Reimbursement* | | | 0.05 | % | | | 0.05 | % | | | 0.05 | % | |
Total Annual Fund Operating Expenses After
Fee Waiver and/or Expense Reimbursement* | | | 1.15 | % | | | 1.65 | % | | | 0.90 | % | |
| Pro Forma Combined Fund (MSIF Active International) | | Class H | | Class L | | Class I | |
| Advisory Fees | | | 0.65 | % | | | 0.65 | % | | | 0.65 | % | |
| Distribution and/or Service (12b-1) Fees | | | 0.25 | % | | | 0.75 | % | | | None | | |
| Other Expenses | | | 0.35 | % | | | 0.35 | % | | | 0.35 | % | |
| Total Annual Fund Operating Expenses* | | | 1.25 | % | | | 1.75 | % | | | 1.00 | % | |
| Fee Waiver and/or Expense Reimbursement* | | | 0.10 | % | | | 0.10 | % | | | 0.10 | % | |
Total Annual Fund Operating Expenses After
Fee Waiver and/or Expense Reimbursement* | | | 1.15 | % | | | 1.65 | % | | | 0.90 | % | |
* MSIM has agreed to reduce its advisory fee and/or reimburse the Acquiring Fund so that Total Annual Portfolio Operating Expenses, excluding certain investment related expenses, will not exceed 0.90% for Class I, 1.15% for Class H and 1.65% for Class L. The fee waivers and/or expense reimbursements will continue for at least two years from the date of the Reorganization or until such time as the Board acts to discontinue all or a portion of such waivers and/or reimbursements when it deems such action is appropriate.
‡ Other expenses have been estimated for the current fiscal year.
Example
To attempt to show the effect of these expenses on an investment over time, the hypothetical shown below has been created. The example assumes that an investor invests $10,000 in either International or MSIF Active International for the time periods indicated and that an investor then redeems all of his or her shares at the end of those periods. The example also assumes that the investment has a 5% return each year and that the operating expenses for each Fund remains the same (as set forth in the chart above) (except for the ten-year amounts for Class B shares of International which reflect the conversion to Class A shares of International eight years after the end of the calendar month in which shares were purchased). Although a Shareholder's actual costs may be higher or lower, the table below shows a Shareholder's costs at the end of each period based on these assumptions.
| International (Acquired Fund) | | 1 Year | | 3 Years | | 5 Years | | 10 Years | |
| Class A | | $ | 677 | | | $ | 998 | | | $ | 1,340 | | | $ | 2,305 | | |
| Class B | | $ | 736 | | | $ | 1,027 | | | $ | 1,445 | | | $ | 2,479 | | |
| Class R | | $ | 186 | | | $ | 576 | | | $ | 990 | | | $ | 2,148 | | |
| Class W | | $ | 171 | | | $ | 530 | | | $ | 913 | | | $ | 1,987 | | |
| Class C | | $ | 335 | | | $ | 724 | | | $ | 1,240 | | | $ | 2,656 | | |
| Class I | | $ | 135 | | | $ | 421 | | | $ | 729 | | | $ | 1,601 | | |
| MSIF Active International (Acquiring Fund) | | | | | | | | | |
| Class H* | | $ | 587 | | | $ | 823 | | | $ | 1,078 | | | $ | 1,806 | | |
| Class L* | | $ | 168 | | | $ | 520 | | | $ | 898 | | | $ | 1,955 | | |
| Class I | | $ | 92 | | | $ | 287 | | | $ | 498 | | | $ | 1,108 | | |
6
| Pro Forma Combined Fund (MSIF Active International) | | 1 Year | | 3 Years | | 5 Years | | 10 Years | |
| Class H | | $ | 587 | | | $ | 823 | | | $ | 1,078 | | | $ | 1,806 | | |
| Class L | | $ | 168 | | | $ | 520 | | | $ | 898 | | | $ | 1,955 | | |
| Class I | | $ | 92 | | | $ | 287 | | | $ | 498 | | | $ | 1,108 | | |
* The figures shown reflect the estimated expenses of Class H and Class L and the maximum sales charge of 4.75% applicable to purchases of Class H shares.
Annual Fund Operating Expenses
The purpose of the foregoing fee tables is to assist Shareholders in understanding the various costs and expenses that a Shareholder in each Fund will bear directly or indirectly. For a more complete description of these costs and expenses, see "Comparison of each Acquired Fund and Acquiring Fund—Investment Advisory Fees," "—Distribution Plan and Shareholder Services Plan Fees," "—Other Significant Fees" and "—Purchases, Exchanges and Redemptions" below.
Portfolio Turnover
Each Fund pays transaction costs, such as commissions, when it buys and sells securities (or "turns over" its portfolio). A higher portfolio turnover rate may indicate higher transaction costs and may result in higher taxes when Fund shares are held in a taxable account. These costs, which are not reflected in Total Annual Fund Operating Expenses or in the Example, affect Fund performance. During the most recent fiscal year, MSIF International Equity's and MSIF Active International's portfolio turnover rates were 34% and 26%, respectively, of the average value of their portfolios.
Tax Consequences of the Reorganizations
As a condition to each Reorganization, each Acquired Fund has requested an opinion of Dechert LLP to the effect that, based upon certain facts, assumptions and representations, the applicable Reorganization will constitute a tax-free reorganization for federal income tax purposes, and no gain or loss will be recognized by the Acquired Fund, the corresponding Acquiring Fund or the Acquired Fund's Shareholders for federal income tax purposes as a result of the transactions included in the applicable Reorganization. Receipt of such opinion is a condition to each Reorganization. For further information about the tax consequences of the Reorganizations, see "The Reorganizations—Tax Aspects of the Reorganizations" below.
Comparison of each Acquired Fund and Acquiring Fund
Investment Objectives and Principal Investment Policies. The investment objective and principal investment policies of the Acquired Funds are similar to those of the Acquiring Funds and are set forth below. Each Fund is a diversified fund. The principal differences between the principal investment policies of each Acquired Fund and its corresponding Acquiring Fund are more fully described under "Comparison of Investment Objectives, Principal Policies and Restrictions" below. Each Acquired Fund's investment objective is a fundamental policy and may not be changed without shareholder approval of a majority of the Acquired Fund's outstanding voting securities, as defined in the 1940 Act.
| International Value Equity | | MSIF International Equity | |
| Investment Objective | | Investment Objective | |
|
| • seeks long-term capital appreciation | | • seeks long-term capital appreciation by investing primarily in equity securities of non-U.S. issuers | |
|
| Principal Investment Policies | | Principal Investment Policies | |
|
| • will normally invest at least 80% of its assets in a diversified portfolio of common stocks and other equity securities, including depositary receipts and securities convertible into common stock, of companies located outside of the United States | | • under normal circumstances, invests at least 80% of its assets in equity securities | |
|
7
| International Value Equity | | MSIF International Equity | |
| • companies may be of any asset size, including small and medium capitalization companies, and may be located in developed or emerging market countries | | • seeks to maintain a diversified portfolio of equity securities of non-U.S. issuers based on individual stock selection | |
|
| • invests in at least three different countries located outside of the United States | | • focuses on developed markets, but may invest in emerging markets | |
|
| • may also use forward foreign currency exchange contracts, which are derivative instruments, in connection with its investments in foreign securities | | • may purchase and sell derivative instruments such as futures, options, swaps and contracts for difference ("CFDs"), and other related instruments and techniques | |
|
| • derivative instruments will be counted toward the 80% policy discussed above to the extent they have economic characteristics similar to the securities included within that policy | | • derivative instruments will be counted toward the 80% policy discussed above to the extent they have economic characteristics similar to the securities included within that policy | |
|
| • a diversified fund | | • a diversified fund | |
|
| International | | MSIF Active International | |
| Investment Objective | | Investment Objective | |
|
| • seeks long-term capital growth | | • seeks long-term capital appreciation by investing primarily, in accordance with country and sector weightings determined by MSIM, in equity securities of non-U.S. issuers which, in the aggregate, replicate broad market indices | |
|
| Investment Policies | | Investment Policies | |
|
| • will normally invest at least 65% of its assets in a diversified portfolio of international common stocks and other equity securities | | • seeks to maintain a diversified portfolio of international equity securities based on a top-down approach that emphasizes region, country, sector and industry selection and weighting rather than individual stock selection | |
|
| • invests in the regions and countries (including emerging market or developing countries) and sectors and industries represented in the Morgan Stanley Capital International ("MSCI") EAFE (Europe, Australasia and Far East) Index | | • focuses mainly on the industrialized countries comprising the MSCI EAFE Index | |
|
| • may invest in emerging market or developing countries | | • may invest in emerging market or developing countries | |
|
| • may invest up to 10% of its net assets in real estate investment trusts ("REIT") | | • purchases and sells derivative instruments such as futures, options, swaps and CFDs, and other related instruments and techniques | |
|
| • may use derivative instruments such as futures, options, swaps, CFDs and other related instruments and techniques | | • derivative instruments will be counted toward MSIF Active International's exposure in the types of securities listed above to the extent they have economic characteristics similar to such securities | |
|
8
| International | | MSIF Active International | |
| • derivative instruments will be counted toward the 65% policy discussed above to the extent they have economic characteristics similar to the securities included within that policy | | | |
|
| • a diversified fund | | • a diversified fund | |
|
Fund Management.
The current portfolio management team for each Acquired Fund is expected to continue to be primarily responsible for the day-to-day management of the applicable Acquiring Fund.
International Equity Reorganization
International Value Equity and MSIF International Equity are both managed within MSIM's International Equity team and, if the International Value Reorganization is approved, MSIF International Equity is expected to continue to be managed within MSIM's International Equity team. The team consists of a portfolio manager and analysts. Current members of the team jointly and primarily responsible for the day-to-day management of International Value Equity and MSIF International Equity, and those members that are expected to continue to be responsible for the day-to-day management of MSIM International Equity if the Active International Reorganization is approved, are William D. Lock, Walter B. Riddell, Peter J. Wright, Vladimir A. Demine, Christian Derold, John S. Goodacre and Bruno Paulson.
Mr. Lock, a Managing Director of MSIM Limited, has been associated with MSIM Limited in an investment management capacity since 1994, and has managed International Value Equity since 2001 and MSIF International Equity since 1999. Mr. Riddell, a Managing Director of MSIM Limited, has been associated with MSIM Limited in an investment management capacity since 1995, and has managed International Value Equity since 2003 and MSIF International Equity since 1999. Mr. Wright, a Managing Director of MSIM Company, has been associated with MSIM Company or its affiliates in an investment management capacity since 1996, and has managed International Value Equity since 2001 and MSIF International Equity since 1999. Mr. Demine, an Executive Director of MSIM Limited, has been associated with MSIM Limited in an investment management capacity since May 2009, and has managed International Value Equity and MSIF International Equity since June 2009. Prior to May 2009, Mr. Demine was associated in an investment management capacity with UBS Global Asset Management. Mr. Derold, an Executive Director of MSIM Company, has been associated with MSIM Company in an investment management capacity since 2006, and has managed International Value Equity and MSIF International Equity since 2006. Mr. Goodacre, an Executive Director of MSIM Limited, has been associated with MSIM Limited in an investment management capacity since 2003, and has managed International Value Equity and MSIF International Equity since 2006. Mr. Paulson, an Executive Director of MSIM Limited, has been associated with MSIM Limited in an investment management capacity since June 2009, and has managed International Value Equity and MSIF International Equity since June 2009. Prior to June 2009, Mr. Paulson was associated in an investment management capacity with Sanford Bernstein. Each member of the team has both global sector research responsibilities and makes investment management decisions. Messrs. Lock, Wright, Riddell, Goodacre and Derold have day-to-day portfolio administration responsibilities as well.
Active International Reorganization
International and MSIF Active International are both managed within MSIM's Active International Allocation team and, if the Active International Reorganization is approved, MSIF Active International is expected to continue to be managed within MSIM's Active International Allocation team. The team consists of portfolio managers and analysts. The current member of the team primarily responsible for the day-to-day management of International and MSIF Active International, and the member that is expected to continue to be responsible for the day-to-day management of MSIF Active International if the Active International Reorganization is approved, is Ann D. Thivierge. Ms. Thivierge, a Managing Director of MSIM, has been associated with MSIM in an investment management capacity since 1986, and has managed International since 1999 and MSIF Active International since 1995.
9
Additional information about the portfolio managers' compensation structure, other accounts managed by the portfolio managers and the portfolio managers' ownership of securities in the Funds is provided in each Fund's Statement of Additional Information.
Investment Advisory Fees. Each Acquiring Fund and Acquired Fund currently obtains advisory services from MSIM. MSIM is a wholly-owned subsidiary of Morgan Stanley with its principal office located at 522 Fifth Avenue, New York, NY 10036. Morgan Stanley is a preeminent global financial services firm engaged in securities trading and brokerage activities, as well as providing investment banking, research and analysis, financing and financial advisory services.
The annual advisory fee (as a percentage of daily net assets) payable by each Acquiring Fund and Acquired Fund is set forth below. Each Acquiring Fund pays its advisory fee on a quarterly basis while each Acquired Fund pays its advisory fee on a monthly basis.
| International Value Equity: | | 0.80% of the daily net assets | |
|
| MSIF International Equity: | | 0.80% of the portion of the daily net assets not exceeding $10 billion; and 0.75% of the portion of the daily net assets exceeding $10 billion | |
|
| International and MSIF Active International: | | 0.65% of the portion of daily net assets not exceeding $1 billion; and 0.60% of the portion of daily net assets exceeding $1 billion | |
|
MSIM has entered into sub-advisory agreements with Morgan Stanley Investment Management Limited ("MSIM Limited" or a "Sub-Adviser"), located at 25 Cabot Square, Canary Wharf, London, E14 4QA, England and Morgan Stanley Investment Management Company ("MSIM Company" or a "Sub-Adviser"), located at 23 Church Street, 16-01 Capital Square, Singapore 049481. Both MSIM Limited and MSIM Company are wholly-owned subsidiaries of Morgan Stanley. MSIM Limited and MSIM Company provide International Value Equity and MSIF International Equity with investment advisory services subject to the overall supervision of MSIM and the International Value Equity's and MSIF International Equity's Officers and Trustees. MSIM pays each of MSIM Limited and MSIM Company on a monthly basis a portion of the net advisory fees MSIM receives from International Value Equity and MSIF International Equity.
Comparison of Other Service Providers. The following table identifies the principal service providers that service the Acquiring Funds and the Acquired Funds:
| | | Acquired Funds | | Acquiring Funds | |
| Administrator: | | Morgan Stanley Services Company Inc. | | Morgan Stanley Investment Management Inc. | |
|
| Transfer Agent: | | Morgan Stanley Services Company Inc. | | Morgan Stanley Services Company Inc. | |
|
| Custodian: | | State Street Bank and Trust Company | | State Street Bank and Trust Company | |
|
| Distributor: | | Morgan Stanley Distribution, Inc. | | Morgan Stanley Distribution, Inc. | |
|
| Independent Registered Public Accounting Firm: | | Ernst & Young LLP | | Ernst & Young LLP | |
|
Distribution Plan and Shareholder Services Plan Fees.
Descriptions of the Plans. Each Acquired Fund has adopted a plan of distribution with respect to each of its Class A shares, Class B shares and Class C shares, pursuant to Rule 12b-1 under the 1940 Act and a plan of distribution and a shareholder services plan with respect to its Class R and Class W shares pursuant to Rule 12b-1 under the 1940 Act (the "MS Plans"). Under the MS Plans, each Acquired Fund pays distribution and/or shareholder services fees in connection with the sale and distribution of its shares and the provision of ongoing services to Shareholders of each such class and the maintenance of shareholder accounts. For a complete description of these arrangements with respect to each Acquired Fund, see the section of each Acquired Fund's prospectus entitled
10
"Share Class Arrangements" and the section of each Acquired Fund's Statement of Additional Information entitled "Rule 12b-1 Plan."
The Company has adopted a shareholder services plan (the "MSIF Service Plan") with respect to Class H shares of each Acquiring Fund and a distribution and shareholder services plan (the "MSIF Distribution Plan" and, together with the MSIF Service Plan, the "MSIF Plans") with respect to Class L shares of each Acquiring Fund pursuant to Rule 12b-1 under the 1940 Act.
Class A, Class B, Class R and Class W Shares of Acquired Fund/Class H Shares of Acquiring Fund. Under the MS Plans, each Acquired Fund may pay up to 0.25%, 1.00%, 0.50% and 0.35% of their respective average daily net assets attributable to each of Class A shares, Class B shares, Class R shares and Class W shares, respectively, for distribution-related expenses and for the provision of ongoing services to Shareholders.
Under the MSIF Service Plan, each Acquiring Fund may pay a shareholder services fee of up to 0.25% of Class H shares' average daily net assets on an annualized basis. The Distributor may compensate other parties for providing shareholder support services to investors who purchase Class H shares. For further information relating to shareholder services applicable to Class H shares of each Acquiring Fund, see the section entitled "Shareholder Information—Distribution of Portfolio Shares" in the Acquiring Funds' Prospectuses attached hereto as Exhibit B.
Class C Shares of Acquired Fund/Class L Shares of Acquiring Fund. Under the MS Plans, each Acquired Fund may pay up to 1.00% of their respective average daily net assets attributable to Class C shares for distribution-related expenses and for the provision of ongoing services to Shareholders.
Under the MSIF Distribution Plan, each Acquiring Fund may pay a shareholder services fee of up to 0.25% of the Class L shares' average daily net assets on an annualized basis and a distribution fee of 0.50% of the Class L shares' average daily net assets on an annualized basis. The Distributor may compensate other parties for providing shareholder support services to investors who purchase Class L shares. For further information relating to the shareholder services and distribution fees applicable to Class L shares of each Acquiring Fund, see the section entitled "Shareholder Information—Distribution of Portfolio Shares" in the Acquiring Funds' Prospectuses attached hereto as Exhibit B.
Class I Shares of Acquired Fund/Class I Shares of Acquiring Fund. Class I shares of each Acquired Fund are not subject to the MS Distribution Plan and Class I shares of each Acquiring Fund are not subject to the MSIF Plans.
Other Significant Fees. Each of the Acquiring Funds and Acquired Funds pay additional fees in connection with their operations, including legal, auditing, transfer agent and custodial fees. See "Synopsis—Fee Tables" above for the percentage of average net assets represented by such "Other Expenses."
Purchases, Exchanges and Redemptions. The Company's Board of Directors has authorized the issuance of the Acquiring Fund Shares in connection with the applicable Reorganization.
Class A, Class B, Class R and Class W Shares of Acquired Funds/Class H Shares of Acquiring Fund
Minimum Investments. The minimum initial investment amount for Class A, Class B, Class R and Class W shares of each Acquired Fund is $1,000 for regular accounts and individual retirement accounts; $500 for Coverdell Education Savings Accounts; and $100 for purchase plans that allow you to transfer money automatically from your checking or savings account or from a Morgan Stanley Money Market Fund on a semi-monthly, monthly or quarterly basis ("EasyInvest®"). The minimum subsequent investment amount for Class A, Class B, Class R and Class W shares of each Acquired Fund is $100 for all account types, except for an account opened through EasyInvest®, which requires a Shareholder's schedule of investments to total $1,000 in 12 months.
Class R shares are offered only to certain tax-exempt retirement plans (including 401(k) plans, 457 plans, employees-sponsored 403(b) plans, profit-sharing and money purchase pension plans, defined benefit plans and non-qualified deferred compensation plans) held in plan level or omnibus accounts. Individual retirement plans, such as IRAs, are not eligible to purchase Class R shares.
Class W shares are offered only to investors purchasing through investment programs managed by investment professionals, including discretionary managed account programs approved by the Acquired Fund's distributor.
11
The minimum initial investment for Class H shares of each Acquiring Fund generally is $25,000. If the value of an investor's account falls below the minimum initial investment amount for Class H shares as a result of share redemptions or if such investor no longer meets one of the waiver criteria, the investor's account may be subject to involuntary conversion (to another class of shares offered by the Acquired Fund (if an account meets the minimum investment amount for such class)) or involuntary redemption. Shareholders will be notified prior to any such conversion or redemption. For further information relating to the minimum investment amounts for Class H shares of each Acquiring Fund, please see the section entitled "Shareholder Information—How To Purchase Class H Shares" in the Acquiring Funds' Prospectuses attached hereto as Exhibit B.
The higher minimum initial investment for Class H shares of each Acquiring Fund will be waived for Class H shares of each Acquiring Fund acquired in connection with the Reorganizations. In addition, the Acquiring Funds' ability to impose an involuntary conversion or redemption will be waived for the life of the applicable Combined Fund for Class A, Class B, Class R and Class W Shareholders of the Acquired Funds that receive Class H shares of the applicable Acquiring Fund in connection with the Reorganizations.
Sales Charges. Class A shares of each Acquired Fund are subject to an initial sales charge of up to 5.25%. The initial sales charge is reduced for purchases of Class A shares in amounts of $25,000 or more. Investments of $1 million or more are not subject to an initial sales charge, but are generally subject to a CDSC of 1.00% on sales made within 18 months after the last day of the month of purchase.
Class B shares of each Acquired Fund are offered at net asset value with no initial sales charge but are subject to a CDSC. The CSDC is reduced to zero after a seven year period as follows: Year 1—5.00%; Year 2—4.00%; Year 3—3.00%; Year 4—2.00%; Year 5—2.00%; Year 6—1.00%; Year 7 and thereafter—None. The CDSC is assessed on an amount equal to the lesser of the then market value of the Class B shares or the historical cost of the Class B shares (which is the amount actually paid for the Class B shares at the time of original purchase) being redeemed.
Class R shares and Class W shares of each Acquired Fund are not subject to either an initial sales charge or a CDSC.
Class H shares of each Acquiring Fund are offered at net asset value and are subject to an initial sales charge equal to a maximum of 4.75% calculated as a percentage of the offering price on a single transaction. The sales charge is reduced for purchases of $50,000 and over. Class H shares are not subject to a CDSC. For further information relating to the initial sales charge for Class H shares of each Acquiring Fund, please see the section entitled "Shareholder Information—How To Purchase Class H Shares" in the Acquiring Funds' Prospectuses attached hereto as Exhibit B.
The initial sales charge applicable to Class H shares of the Acquiring Funds will be waived for Class H shares acquired in each Reorganization. Any subsequent purchases of Class H shares of the Acquiring Fund after the applicable Reorganization by the former Class A, Class B, Class R and Class W Shareholders of an Acquired Fund will be subject to the initial sales charge schedule. No CDSCs will be imposed on Class B shares of each Acquired Fund that are exchanged for Class H shares of the corresponding Acquiring Fund in connection with the applicable Reorganization.
Redemption of Fund Shares. Class A, Class B, Class R and Class W shares of each Acquired Fund and Class H shares of each Acquiring Fund redeemed or exchanged within 30 days of purchase will be subject to a 2% redemption fee, payable to the applicable Fund. The redemption fee is designed to protect the applicable Fund and its remaining Shareholders from the effects of short-term trading. For all Funds, the redemption fee is not imposed on redemptions made: (i) through systematic withdrawal/exchange plans, (ii) through preapproved asset allocation programs, (iii) of shares received by reinvesting income dividends or capital gain distributions, (iv) through certain collective trust funds or other pooled vehicles and (v) on behalf of advisory accounts where client allocations are solely at the discretion of the Morgan Stanley Investment Management investment team. The redemption fee is based on, and deducted from, the redemption proceeds. Each time you redeem or exchange Class A, Class B, Class R and/or Class W shares of each Acquired Fund or Class H shares of each Acquiring Fund, the shares held the longest will be redeemed or exchanged first. For greater details relating to redemption of shares and redemption fees applicable to Class A, Class B, Class R and Class W shares of each Acquired Fund and Class H shares of each
12
Acquiring Fund, see the section entitled "Shareholder Information—How to Redeem Class H Shares" in the Acquiring Funds' Prospectuses and "Shareholder Information—How to Sell Shares" section of the Acquired Funds' Prospectuses, incorporated herein by reference.
The redemption fee will be waived on any redemption of Class H shares of the applicable Acquiring Fund received by Shareholders of the applicable Acquired Fund in connection with the applicable Reorganization where the redemption is effected within 30 days following the consummation of such Reorganization.
Exchange Privileges. Class A shares, Class B shares, Class R shares and Class W shares of each Acquired Fund may be exchanged for shares of the same class of any other continuously offered Morgan Stanley Multi-Class Fund, or for shares of a Morgan Stanley Money Market Fund or the Morgan Stanley Limited Duration U.S. Government Trust (together the "Morgan Stanley Funds"), based on the next determined net asset value per share of each fund after requesting the exchange without any sales charge, subject to certain limitations. Class A, Class B, Class R and Class W shares of each Acquired Fund may be exchanged for shares of any Morgan Stanley Fund only if shares of that Morgan Stanley Fund are available for sale.
Class H shares of each Acquiring Fund may be exchanged for shares of the same class of any other available portfolio of the Company and available portfolios of Morgan Stanley Institutional Fund Trust (each, an "Exchange Fund"). Exchanges are effected based on the respective net asset values of the applicable portfolios (subject to any applicable redemption fee). The redemption fee will be waived on any exchange of Class H shares received by Acquired Fund Shareholders in connection with the Reorganizations where the exchange is effected within 30 days following the consummation of such Reorganization. Upon consummation of the applicable Reorganization, the foregoing exchange privileges will apply to Shareholders of each Combined Fund; however, Shareholders must satisfy the applicable Class H minimum initial investment amount of the Exchange Fund at the time of the exchange.
Each Fund provides telephone exchange privileges to its Shareholders. For greater details relating to exchange privileges applicable to the Acquiring Funds, see the section entitled "Shareholder Information—How to Redeem Class H Shares—Exchange Privilege" in the Acquiring Funds' Prospectuses attached hereto as Exhibit B. For greater details relating to exchange privileges applicable to the Acquired Funds, see the section entitled "Shareholder Information—How to Exchange Shares" in the Acquired Funds' Prospectuses, incorporated herein by reference.
Class C Shares of Acquired Fund/Class L Shares of Acquiring Fund
Minimum Investments. The minimum initial investment amount for Class C shares of each Acquired Fund is $1,000 for regular accounts and individual retirement accounts; $500 for Coverdell Education Savings Accounts; and $100 for EasyInvest®. The minimum subsequent investment amount for Class C shares of each Acquired Fund is $100 for all account types, except for an account opened through EasyInvest®, which requires a Shareholder's schedule of investments to total $1,000 in 12 months.
The minimum initial investment for Class L shares of each Acquiring Fund generally is $25,000. If the value of an investor's account falls below the minimum initial investment amount for Class L shares as a result of share redemptions or if such investor no longer meets one of the waiver criteria, the investor's account may be subject to involuntary conversion (to another class of shares offered by the Acquired Fund (if an account meets the minimum investment amount for such class)) or involuntary redemption. Shareholders will be notified prior to any such conversion or redemption. For further information relating to the minimum investment amounts for Class L shares of each Acquiring Fund, please see the section entitled "Shareholder Information—How To Purchase Class I, Class P and Class L Shares" in the Acquiring Funds' Prospectuses attached hereto as Exhibit B.
The higher minimum initial investment for Class L shares of each Acquiring Fund will be waived for Class L shares of each Acquiring Fund acquired in connection with the Reorganizations. In addition, the Acquiring Funds' ability to impose an involuntary conversion or redemption will be waived for the life of the applicable Combined Fund for Class C Shareholders of the Acquired Funds that receive Class L shares of the applicable Acquiring Fund in connection with the Reorganizations.
Sales Charges. Class C shares of each Acquired Fund do not incur an initial sales charge when purchased, but generally are subject to a CDSC of 1.00% of the lesser of the then current net asset value or the original purchase
13
price on Class C shares redeemed within one year after purchase, which sales charge is reduced to zero thereafter. Class L shares of each Acquiring Fund are offered at net asset value with no initial sales charge or CDSC.
No CDSCs will be imposed on Class C shares of each Acquired Fund that are exchanged for Class L shares of the corresponding Acquiring Fund in connection with the Reorganizations.
Redemption of Fund Shares. Class C shares of each Acquired Fund and Class L shares of each Acquiring Fund redeemed or exchanged within 30 days of purchase will be subject to a 2% redemption fee, payable to the Funds. The redemption fee is designed to protect the Fund and its remaining Shareholders from the effects of short-term trading. For the Funds, the redemption fee is not imposed on redemptions made: (i) through systematic withdrawal/exchange plans, (ii) through preapproved asset allocation programs, (iii) of shares received by reinvesting income dividends or capital gain distributions, (iv) through certain collective trust funds or other pooled vehicles and (v) on behalf of advisory accounts where client allocations are solely at the discretion of the Morgan Stanley Investment Management investment team. The redemption fee is based on, and deducted from, the redemption proceeds. Each time you redeem or exchange Class C shares of an Acquired Fund or Class L shares of an Acquiring Fund, the shares held the longest will be redeemed or exchanged first. For greater details relating to redemption of shares and redemption fees applicable to Class C shares of each Acquired Fund and Class L shares of each Acquiring Fund, see the section entitled "Shareholder Information—How to Redeem Class I, Class P and Class L Shares" in the Acquiring Funds' Prospectuses attached hereto as Exhibit B and "Shareholder Information—How to Sell Shares" section of the Acquired Funds' Prospectuses, incorporated herein by reference.
The redemption fee will be waived on any redemption of Class L shares of Acquiring Funds received by Acquired Fund Shareholders in connection with the Reorganizations where the redemption is effected within 30 days following the consummation of the applicable Reorganization.
Exchange Privileges. Class C shares of each Acquired Fund may be exchanged for shares of the same class of any Morgan Stanley Fund, based on the next determined net asset value per share of each fund after requesting the exchange without any sales charge, subject to certain limitations. Class C shares of each Acquired Fund may be exchanged for shares of any Morgan Stanley Fund only if shares of that Morgan Stanley Fund are available for sale.
Class L shares of each Acquiring Fund may be exchanged for shares of the same class of any Exchange Fund. Exchanges are effected based on the respective net asset values of the applicable portfolios (subject to any applicable redemption fee). The redemption fee will be waived on any exchange of Class L shares received by International Shareholders in connection with the Active International Reorganization where the exchange is effected within 30 days following the consummation of such Reorganization. Upon consummation of the applicable Reorganization, the foregoing exchange privileges will apply to Shareholders of each Combined Fund; however, Shareholders must satisfy the applicable Class L minimum initial investment amount of the Exchange Fund at the time of the exchange.
Each Fund provides telephone exchange privileges to its Shareholders. For greater details relating to exchange privileges applicable to the Acquiring Funds, see the section entitled "Shareholder Information—How to Redeem Class I, Class P and Class L Shares—Exchange Privilege" in the Acquiring Funds' Prospectuses attached hereto as Exhibit B. For greater details relating to exchange privileges applicable to the Acquired Funds, see the section entitled "Shareholder Information—How to Exchange Shares" in the Acquired Funds' Prospectuses, incorporated herein by reference.
Class I Shares of Acquired Fund/Class I Shares of Acquiring Fund
Minimum Investments. Class I shares of each Acquired Fund are offered only to investors meeting an initial investment minimum of $5,000,000 ($25,000,000 for employer-sponsored employee benefit plans, whether or not qualified under the Internal Revenue Code of 1986, as amended (the "Code"), for which an entity independent from Morgan Stanley serves as record-keeper under an alliance or similar agreement with Morgan Stanley's Retirement Plan Solutions) and are available only to limited categories of investors.
The minimum initial investment for Class I shares of each Acquiring Fund generally is $5,000,000. If the value of an investor's account falls below the minimum initial investment amount for Class I shares as a result of share redemptions or if such investor no longer meets one of the waiver criteria, the investor's account may be subject to involuntary conversion (to another class of shares offered by the Acquired Fund (if an account meets the
14
minimum investment amount for such class)) or involuntary redemption. Shareholders will be notified prior to any such conversion or redemption. For further information relating to minimum investment requirements for Class I shares of each Acquiring Fund, please see the section entitled "Shareholder Information—How To Purchase Class I, Class P and Class L Shares" in the Acquiring Funds' Prospectuses attached hereto as Exhibit B.
The minimum initial investment for Class I shares of each Acquiring Fund will be waived for Class I shares of each Acquiring Fund acquired in connection with the Reorganizations. In addition, the Acquiring Funds' ability to impose an involuntary conversion or redemption will be waived for the life of the applicable Combined Fund for Class I Shareholders of the Acquired Funds that receive Class I shares of the applicable Acquiring Fund in connection with the Reorganizations.
Sales Charges. Class I shares of each Acquired Fund and each Acquiring Fund are not subject to either an initial sales charge or a CDSC.
Redemption of Fund Shares. Class I shares of each Acquired Fund and Class I shares of each Acquiring Fund redeemed or exchanged within 30 days of purchase will be subject to a 2% redemption fee, payable to the Funds. The redemption fee is designed to protect the Fund and its remaining Shareholders from the effects of short-term trading. For the Funds, the redemption fee is not imposed on redemptions made: (i) through systematic withdrawal/exchange plans, (ii) through preapproved asset allocation programs, (iii) of shares received by reinvesting income dividends or capital gain distributions, (iv) through certain collective trust funds or other pooled vehicles and (v) on behalf of advisory accounts where client allocations are solely at the discretion of the Morgan Stanley Investment Management investment team. The redemption fee is based on, and deducted from, the redemption proceeds. Each time you redeem or exchange Class I shares of an Acquired Fund or Class I shares of an Acquiring Fund, the shares held the longest will be redeemed or exchanged first. For greater details relating to redemption of shares and redemption fees applicable to Class I shares of the Acquired Funds and Class I shares of the Acquiring Funds, see the section entitled "Shareholder Information—How to Redeem Class I, Class P and Class L Shares" in the Acquiring Funds' Prospectuses attached hereto as Exhibit B and "Shareholder Information—How to Sell Shares" section of the Acquired Funds' Prospectuses, incorporated herein by reference.
The redemption fee will be waived on any redemption of Class I shares of the Acquired Funds received by the applicable Acquiring Funds Shareholders in connection with the Reorganizations where the redemption is effected within 30 days following the consummation of the applicable Reorganization.
Exchange Privileges. Class I shares of each Acquired Fund may be exchanged for shares of the same class of any Morgan Stanley Fund based on the next determined net asset value per share of each fund after requesting the exchange without any sales charge, subject to minimum purchase requirements and certain limitations. Class I shares of each Acquired Fund may be exchanged for shares of any Morgan Stanley Fund only if shares of that Morgan Stanley Fund are available for sale.
Class I shares of each Acquiring Fund may be exchanged for shares of the same class of any Exchange Fund. Exchanges are effected based on the respective net asset values of the applicable portfolios (subject to any applicable redemption fee). The redemption fee will be waived on any exchange of Class I shares received by International Shareholders in connection with the Active International Reorganization where the exchange is effected within 30 days following the consummation of such Reorganization. Upon consummation of the applicable Reorganization, the foregoing exchange privileges will apply to Shareholders of each Combined Fund; however, Shareholders must satisfy the applicable Class I minimum initial investment amount of the Exchange Fund at the time of the exchange.
Each Fund provides telephone exchange privileges to its Shareholders. For greater details relating to exchange privileges applicable to the Acquiring Funds, see the section entitled "Shareholder Information—How to Redeem Class I, Class P and Class L Shares—Exchange Privilege" in the Acquiring Funds' Prospectuses attached hereto as Exhibit B. For greater details relating to exchange privileges applicable to the Acquired Funds, see the section entitled "Shareholder Information—How to Exchange Shares" in the Acquired Funds' Prospectuses, incorporated herein by reference.
Dividends. Each Fund declares dividends separately for each of its classes. Each Fund pays dividends from net investment income, if any, annually and distributes net realized capital gains, if any, annually. Dividends and
15
capital gains distributions are automatically reinvested in additional shares of the same class of shares of such Fund at net asset value unless the shareholder instructs otherwise.
Record Date; Quorum
Each Board has fixed the close of business on July 2, 2012 as the record date (the "Record Date") for the determination of Shareholders of each Acquired Fund entitled to notice of, and to vote at, the Meeting. As of the Record Date, there were 20,836,052 shares of International Value Equity and 8,220,819 shares of International issued and outstanding. Shareholders on the Record Date are entitled to one vote per share and a fractional vote for a fractional share on each matter submitted to a vote at the Meeting. Shareholders of each class of each Acquired Fund will vote together as a single class in connection with the applicable Reorganization Agreement. The holders of a majority of the shares issued and outstanding and entitled to vote of each of International Value Equity and International, represented in person or by proxy, will constitute a quorum at the applicable Meeting.
Proxies
The enclosed form of Proxy for each Acquired Fund, if properly executed and returned, will be voted in accordance with the choice specified thereon. The Proxy will be voted in favor of the applicable Reorganization unless a choice is indicated to vote against or to abstain from voting on the Reorganization. If a Shareholder executes and returns a Proxy but fails to indicate how the votes should be cast, the Proxy will be voted in favor of the applicable Reorganization. The Board knows of no business, other than that set forth in the Notice of Joint Special Meeting of Shareholders, to be presented for consideration at the Meeting. However, the Proxy confers discretionary authority upon the persons named therein to vote as they determine on other business, not currently contemplated, which may come before the Meeting.
The Proxy may be revoked at any time prior to the voting thereof by: (i) delivering written notice of revocation to the Secretary of International Value Equity or International, as applicable, 522 Fifth Avenue, New York, NY 10036; (ii) attending the Meeting and voting in person; or (iii) completing and returning a new Proxy (whether by mail or, as discussed below, by touchtone telephone or the Internet) (if returned and received in time to be voted). Attendance at the Meeting will not in and of itself revoke a Proxy.
In the event that the necessary quorum to transact business or the vote required to approve or reject the Reorganization with respect to an Acquired Fund is not obtained at the applicable Meeting, the persons named as Proxies may propose one or more adjournments of the Meeting to permit further solicitation of Proxies. Any such adjournment will require the affirmative vote of the holders of a majority of shares of International Value Equity or International, as applicable, present in person or by Proxy at the Meeting. Where an adjournment is proposed because the necessary quorum to transact business is not obtained at the applicable Meeting, the persons named as Proxies will vote in favor of such adjournment provided that such persons named as Proxies determine that such adjournment and additional solicitation is reasonable and in the interests of Shareholders based on all relevant factors, including the nature of the proposal, the percentage of Shareholders present, the nature of the proposed solicitation activities and the nature of the reasons for the further solicitation. Where an adjournment is proposed because the vote required to approve or reject the Reorganization with respect to an Acquired Fund is not obtained at the applicable Meeting, the persons named as Proxies will vote in favor of such adjournment those Proxies which they are entitled to vote in favor of the Reorganization and will vote against any such adjournment those Proxies required to be voted against the Reorganization. Abstentions will not be voted either for or against any such adjournment.
Shareholders will be able to vote their shares by touchtone telephone or by Internet by following the instructions on the Proxy Card or on the Voting Information Card accompanying this Joint Proxy Statement and Prospectus. To vote by Internet or by telephone, Shareholders can access the website or call the toll-free number listed on the Proxy Card or noted in the enclosed voting instructions. To vote by touchtone telephone, Shareholders will need the number that appears on the Proxy Card. In certain instances, a proxy solicitor may call Shareholders to ask if they would be willing to have their votes recorded by telephone. The telephone voting procedure is designed to authenticate Shareholders' identities, to allow Shareholders to authorize the voting of their shares in accordance with their instructions and to confirm that their instructions have been recorded properly. No recommendation will be made as
16
to how a Shareholder should vote on any proposal other than to refer to the recommendations of the Board. Shareholders voting by telephone in this manner will be asked for identifying information and will be given an opportunity to authorize Proxies to vote their shares in accordance with their instructions. To ensure that Shareholders' instructions have been recorded correctly they will receive a confirmation of their instructions in the mail. A special toll-free number set forth in the confirmation will be available in case the information contained in the confirmation is incorrect. Although a Shareholder's vote may be taken by telephone, each Shareholder will receive a copy of this Joint Proxy Statement and may vote by mail using the enclosed Proxy Card or by touchtone telephone or the Internet as set forth above. The last proxy vote received in time to be voted, whether by Proxy Card, touchtone telephone or Internet, will be the vote that is counted and will revoke all previous votes by Shareholders.
Expenses of Solicitation
Solicitation of Proxies is being made primarily by the mailing of this Joint Proxy Statement and Prospectus with its enclosures. In addition to the solicitation of Proxies by mail, employees of MSIM and its affiliates, without additional compensation, may solicit proxies in person or by telephone, telegraph, facsimile or oral communication. Each Acquired Fund may retain Computershare Fund Services, a professional proxy solicitation firm, to assist with any necessary solicitation of Proxies. The estimated cost of additional telephone solicitation by Computershare Fund Services is approximately $102,569, with respect to International Value Equity, and $46,504, with respect to International. The expenses of the Reorganizations, including the cost of printing, filing and proxy solicitation (including the aforementioned cost of additional telephone solicitation by Computershare Fund Services), and legal and accounting expenses, with respect to International Value Equity are expected to be approximately $619,636, all of which will be borne by International Value Equity, and with respect to International are expected to be approximately $391,560, all of which will be borne by International.
Vote Required
Approval of the International Equity Reorganization and Active International Reorganization by Shareholders requires the affirmative vote of the lesser of: (1) more than 50% of the outstanding shares of the applicable Acquired Fund, or (2) 67% or more of the shares of the applicable Acquired Fund represented at the Meeting if the holders of more than 50% of the outstanding shares of the applicable Acquired Fund are present or represented by Proxy. Abstentions are not considered votes "FOR" a Reorganization at the Meeting. As a result, abstentions have the same effect as a vote against a Reorganization because approval of a Reorganization requires the affirmative vote of a percentage of the voting securities present or represented by proxy or a percentage of the outstanding voting securities.
If a Reorganization is not approved by Shareholders of an Acquired Fund, that Acquired Fund will continue in existence and the Board will consider alternative actions for such Fund.
17
PRINCIPAL RISK FACTORS
The principal risks of investing in an Acquiring Fund are substantially similar to those of investing in its corresponding Acquired Fund. The value of an investment in all of the Funds is based on the market prices of the securities such Fund holds. These prices change daily due to economic and other events that affect markets generally, as well as those that affect particular regions, countries, industries, companies or governments.
Equity Securities. Each Fund may invest in equity securities. Equity securities may include common and preferred stocks, convertible securities and equity-linked securities, rights and warrants to purchase common stocks, depositary receipts, limited partnership interests and other specialty securities having equity features. The Funds may invest in equity securities that are publicly-traded on securities exchanges or over-the-counter or in equity securities that are not publicly traded. Securities that are not publicly traded may be more difficult to sell and their value may fluctuate more dramatically than other securities.
A convertible security is a bond, debenture, note, preferred stock, right, warrant or other security that may be converted into or exchanged for a prescribed amount of common stock or other security of the same or a different issuer or into cash within a particular period of time at a specified price or formula. A convertible security generally entitles the holder to receive interest paid or accrued on debt securities or the dividend paid on preferred stock until the convertible security matures or is redeemed, converted or exchanged. Before conversion, convertible securities generally have characteristics similar to both debt and equity securities. The value of convertible securities tends to decline as interest rates rise and, because of the conversion feature, tends to vary with fluctuations in the market value of the underlying securities. Convertible securities ordinarily provide a stream of income with generally higher yields than those of common stock of the same or similar issuers. Convertible securities generally rank senior to common stock in a corporation's capital structure but are usually subordinated to comparable nonconvertible securities. Convertible securities generally do not participate directly in any dividend increases or decreases of the underlying securities although the market prices of convertible securities may be affected by any dividend changes or other changes in the underlying securities.
Foreign Securities. Each Fund may invest in foreign securities. Foreign issuers generally are subject to different accounting, auditing and financial reporting standards than U.S. issuers. There may be less information available to the public about foreign issuers. Securities of foreign issuers can be less liquid and experience greater price movements. In addition, the prices of such securities may be susceptible to influence by large traders, due to the limited size of many foreign securities markets. Moreover, investments in certain foreign markets, which have historically been considered stable, may become more volatile and subject to increased risk due to ongoing developments and changing conditions in such markets.
Also, the growing interconnectivity of global economies and financial markets has increased the probability that adverse developments and conditions in one country or region will affect the stability of economies and financial markets in other countries or regions. In some foreign countries, there is also the risk of government expropriation, excessive taxation, political or social instability, the imposition of currency controls or diplomatic developments that could affect the Funds' investments. There also can be difficulty obtaining and enforcing judgments against issuers in foreign countries. Foreign stock exchanges, broker-dealers and listed issuers may be subject to less government regulation and oversight. The cost of investing in foreign securities, including brokerage commissions and custodial expenses, can be higher than in the United States.
In connection with their investments in foreign securities, the Funds also may enter into contracts with banks, brokers or dealers to purchase or sell securities or foreign currencies at a future date. A foreign currency forward exchange contract is a negotiated agreement between the contracting parties to exchange a specified amount of currency at a specified future time at a specified rate. The rate can be higher or lower than the spot rate between the currencies that are the subject of the contract. Foreign currency forward exchange contracts may be used to protect against uncertainty in the level of future foreign currency exchange rates or to gain or modify exposure to a particular currency. In addition, the Funds may use cross currency hedging or proxy hedging with respect to currencies in which the Funds have or expect to have portfolio or currency exposure. Cross currency hedges involve the sale of one currency against the positive exposure to a different currency and may be used for hedging purposes or to establish an active exposure to the exchange rate between any two currencies.
18
Emerging Market Risks. Each Fund may invest in emerging market or developing countries, which are countries that major international financial institutions, such as the World Bank, generally consider to be less economically mature than developed nations, such as the United States or most nations in Western Europe. Emerging market or developing countries can include every nation in the world except the United States, Canada, Japan, Australia, New Zealand and most countries located in Western Europe. Emerging market or developing countries may be more likely to experience political turmoil or rapid changes in economic conditions than more developed countries, and the financial condition of issuers in emerging market or developing countries may be more precarious than in other countries. In addition, emerging market securities generally are less liquid and subject to wider price and currency fluctuations than securities issued in more developed countries. These characteristics result in greater risk of price volatility in emerging market or developing countries, which may be heightened by currency fluctuations relative to the U.S. dollar.
Small and Medium Capitalization Companies. International Value Equity and MSIF International Equity may invest in stocks of small and medium capitalization companies. Investing in securities of these companies involves greater risk than is customarily associated with investing in more established companies. These companies' stocks may be more volatile and less liquid than the stocks of more established companies. These stocks may have returns that vary, sometimes significantly, from the overall stock market. Often smaller and medium capitalization companies and the industries in which they are focused are still evolving and, while this may offer better growth potential than larger, more established companies, it also may make them more sensitive to changing market conditions.
Derivatives Risk. MSIF International Equity, MSIF Active International and International may, but are not required to, use derivative instruments for a variety of purposes, including hedging, risk management, portfolio management or to earn income. Derivatives are financial instruments whose value is based on the value of an underlying asset, interest rate, index or financial instrument.
A derivative instrument often has risks similar to its underlying asset and may have additional risks, including imperfect correlation between the value of the derivative and the underlying asset, risks of default by the counterparty to certain transactions, magnification of losses incurred due to changes in the market value of the securities, instruments, indices or interest rates to which they relate, and risks that the transactions may not be liquid. The use of derivatives involves risks that are different from, and possibly greater than, the risks associated with other portfolio investments. Derivatives may involve the use of highly specialized instruments that require investment techniques and risk analyses different from those associated with other portfolio investments.
Certain derivative transactions may give rise to a form of leverage. Leverage magnifies the potential for gain and the risk of loss. Leverage associated with derivative transactions may cause the Funds to liquidate portfolio positions when it may not be advantageous to do so to satisfy its obligations or to meet earmarking or segregation requirements, pursuant to applicable SEC rules and regulations, or may cause the Funds to be more volatile than if the Funds had not been leveraged. Although MSIM and/or Sub-Advisers seek to use derivatives to further the Funds' investment objectives, there is no assurance that the use of derivatives will achieve this result.
The derivative instruments and techniques that certain Funds may principally use include:
• Futures. A futures contract is a standardized, exchange-traded agreement to buy or sell a specific quantity of an underlying asset, reference rate or index at a specific price at a specific future time. The value of a futures contract tends to increase and decrease in tandem with the value of the underlying instrument. Depending on the terms of the particular contract, futures contracts are settled through either physical delivery of the underlying instrument on the settlement date or by payment of a cash settlement amount on the settlement date. A decision as to whether, when and how to use futures involves the exercise of skill and judgment and even a well-conceived futures transaction may be unsuccessful because of market behavior or unexpected events. In addition to the derivatives risks discussed above, the prices of futures contracts can be highly volatile, using futures can lower total return, and the potential loss from futures can exceed the Funds' initial investments in such contracts.
19
• Options. If a Fund buys an option, it buys a legal contract giving it the right to buy or sell a specific amount of the underlying instrument or futures contract on the underlying instrument at an agreed-upon price typically in exchange for a premium paid by the Fund. If a Fund sells an option, it sells to another person the right to buy from or sell to the Fund a specific amount of the underlying instrument or futures contract on the underlying instrument at an agreed-upon price typically in exchange for a premium received by the Fund. A decision as to whether, when and how to use options involves the exercise of skill and judgment and even a well-conceived option transaction may be unsuccessful because of market behavior or unexpected events. The prices of options can be highly volatile and the use of options can lower total returns.
• Swaps. An over-the-counter ("OTC") swap contract is an agreement between two parties pursuant to which the parties exchange payments at specified dates on the basis of a specified notional amount, with the payments calculated by reference to specified securities, indices, reference rates, currencies or other instruments. A small percentage of swap contracts are cleared through a central clearinghouse. Most swap agreements provide that when the period payment dates for both parties are the same, the payments are made on a net basis (i.e., the two payment streams are netted out, with only the net amount paid by one party to the other). The Funds' obligations or rights under swap contracts entered into on a net basis will generally be equal only to the net amount to be paid or received under the agreements, based on the relative values of the positions held by each party. Most swap agreements are not entered into or traded on exchanges and often there is no central clearing or guaranty function for swaps. These OTC swaps are often subject to credit risk or the risk of default or non-performance by the counterparty. Swaps could result in losses if interest rates or foreign currency exchange rates or credit quality changes are not correctly anticipated by Funds or if the reference index, security or investments do not perform as expected.
• CFDs. A CFD is a privately negotiated contract between two parties, buyer and seller, stipulating that the seller will pay to or receive from the buyer the difference between the nominal value of the underlying instrument at the opening of the contract and that instrument's value at the end of the contract. The underlying instrument may be a single security, stock basket or index. A CFD can be set up to take either a short or long position on the underlying instrument. The buyer and seller are typically both required to post margin, which is adjusted daily. The buyer will also pay to the seller a financing rate on the notional amount of the capital employed by the seller less the margin deposit. In addition to the general risks of derivatives, CFDs may be subject to liquidity risk and counterparty risk.
REITs and Foreign Real Estate Companies. International may invest in REITs and foreign real estate companies. REITs and foreign real estate companies generally derive their income from rents on the underlying properties or interest on the underlying loans, and their value is impacted by changes in the value of the underlying property or changes in interest rates affecting the underlying loans owned by the REITs and/or foreign real estate companies. REITs and foreign real estate companies are more susceptible to risks associated with the ownership of real estate and the real estate industry in general. These risks can include fluctuations in the value of underlying properties; defaults by borrowers or tenants; market saturation; changes in general and local economic conditions; decreases in market rates for rents; increases in competition, property taxes, capital expenditures or operating expenses; and other economic, political or regulatory occurrences affecting the real estate industry. In addition, REITs and foreign real estate companies depend upon specialized management skills, may not be diversified (which may increase the volatility of a REIT's and/or a foreign real estate company's value), may have less trading volume and may be subject to more abrupt or erratic price movements than the overall securities market. Foreign real estate companies may be subject to laws, rules and regulations governing those entities and their failure to comply with those laws, rules and regulations could negatively impact the performance of those entities. Operating REITs and foreign real estate companies requires specialized management skills and International indirectly bears REIT and foreign real estate company management expenses along with the direct expenses of International. REITs are not taxed on income distributed to shareholders provided they comply with several requirements of the Code. REITs are subject to the risk of failing to qualify for tax-free pass-through of income under the Code.
20
The foregoing discussion is a summary of the principal risk factors. For a more complete discussion of the risks of each Acquiring Fund, see "Details of the Portfolio—International Equity Portfolio—Risks," "Details of the Portfolio—Active International Allocation Portfolio—Risks" and "Additional Information About the Portfolios' Investment Strategies and Related Risks" in the Acquiring Funds' Prospectuses attached hereto as Exhibit B. For a more complete discussion of the risks of each Acquired Fund, see "Additional Information about the Fund's Investment Objective, Principal Investment Strategies and Risks" in each Acquired Funds' Prospectus, each incorporated herein by reference.
PERFORMANCE INFORMATION
For a discussion of each Acquiring Fund's performance information, see "Portfolio Summary—International Equity Portfolio—Performance Information" and "Portfolio Summary—Active International Allocation Portfolio—Performance Information" in the Acquiring Funds' Prospectuses attached hereto as Exhibit B.
THE REORGANIZATIONS
The Boards' Considerations
The Boards, including the Independent Board Members, unanimously declared advisable and approved a Reorganization on behalf of each Acquired Fund and determined to recommend that Shareholders of each Acquired Fund approve the applicable Reorganization. In reaching this decision, the Boards made an extensive inquiry into a number of factors, particularly each Acquiring Fund's substantially larger asset base and the comparative expenses currently incurred in the operations of the Acquiring Funds. The Boards also considered other factors, including, but not limited to: the similarity of the investment objective of the Acquiring Funds; the continuity of the portfolio management teams; the current and future sales and asset growth potential of the Funds; that the total expenses of the Shareholders of the Acquired Funds would be lower as a result of the Reorganizations; the annual expense savings for Shareholders of the Acquired Funds; the terms and conditions of the Reorganizations, which would affect the price of shares to be issued in the Reorganizations; that there is not expected to be a significant amount of portfolio turnover as a result of the Reorganizations; with respect to the Active International Reorganization, that capital loss carry forwards would not be lost as a result of the Reorganizations; the tax-free nature of the Reorganizations; and the expenses of this solicitation, including the cost of preparing and mailing this Joint Proxy Statement and Prospectus, which will be borne by the respective Acquired Fund in connection with the Reorganization.
The Boards considered information provided by MSIM. The parties discussed the overlap among Morgan Stanley Fund offerings, and the goal of finding a cost effective solution to streamline the Morgan Stanley fund offerings, reducing costs to shareholders and removing potential point of sale conflicts in the marketplace. The parties also discussed the exchangeability among funds within the Morgan Stanley fund family, the expense caps on the Acquiring Funds and the waivers of sales charges and minimum investment amounts applicable to the Acquiring Funds for Shareholders of the Acquired Funds in connection with the Reorganizations.
The Boards discussed with MSIM the foreseeable short- and long-term effects on the Acquired Funds and their Shareholders. The members of the Boards who are not "interested persons" of the Acquired Funds, as that term is defined in the 1940 Act, conferred separately with their counsel about the Reorganizations on several occasions.
In connection with the Board review of the Reorganizations, MSIM advised the Boards about a variety of matters, including, but not limited to:
1. the continuity of the portfolio management team before and after the Reorganizations;
2. the similar investment process and objectives of the Acquired Funds and Acquiring Funds;
3. the Acquiring Funds will have lower total operating expenses;
4. the current and future sales and asset growth potential of the Funds;
5. the estimated expenses of the Reorganizations; and
21
6. with respect to the Active International Reorganization, while the Reorganizations may delay when capital losses can be utilized, there is no expectation that any amount of losses would be written off.
With respect to the International Equity Reorganization, the capital loss carry forwards utilized by International Value Equity may be limited to approximately $6.7 million per year and the Combined Fund may write off potentially as much as $50 million of capital loss carry forwards. However, even without the merger (given the small asset base), International Value Equity may never realize enough gains to offset the potential write-off.
In their deliberations, the Boards considered all information they received, as described above, as well as advice and analysis from its counsel. The Boards considered each Reorganization and the impact of each Reorganization on each Acquired Fund and its Shareholders. The Boards concluded, based on all of the information presented, that each Reorganization is advisable and in the best interest of each respective Acquired Fund's Shareholders and that Shareholders will not be diluted as a result thereof, and decided to recommend that each Acquired Fund's Shareholders approve the applicable Reorganization.
If Shareholders of an Acquired Fund do not approve the respective Reorganization, the Board of that Acquired Fund will consider other courses of action for such Acquired Fund.
The Reorganization Agreements
The terms and conditions under which each Reorganization would be consummated, as summarized below, are set forth in the Reorganization Agreement. This summary is qualified in its entirety by reference to the Agreement and Plan of Reorganization, a copy of which is attached as Exhibit A to this Joint Proxy Statement and Prospectus.
Each Reorganization Agreement provides that (i) an Acquired Fund will transfer substantially all of its assets, including portfolio securities, cash, cash equivalents and receivables, to the applicable Acquiring Fund on the Closing Date in exchange for the assumption by the Acquiring Fund of stated liabilities of the Acquired Fund, including all expenses, costs, charges and reserves, as reflected on an unaudited statement of assets and liabilities of Acquired Fund prepared by the Treasurer of the Acquired Fund as of the Valuation Date (as defined below) in accordance with generally accepted accounting principles consistently applied from the prior audited period, and the delivery of the Acquiring Fund Shares; (ii) such Acquiring Fund Shares would be distributed to Shareholders on the Closing Date or as soon as practicable thereafter; (iii) the Acquired Fund would be liquidated and terminated; and (iv) the outstanding shares of Acquired Fund would be canceled.
The number of Acquiring Fund Shares to be delivered to the applicable Acquired Fund will be determined by dividing the aggregate net asset value of each class of shares of the Acquired Fund acquired by the Acquiring Fund by the net asset value per share of the corresponding class of shares of the Acquiring Fund; these values will be calculated as of the close of business of the New York Stock Exchange on the third business day following the receipt of the requisite approval by Shareholders of the applicable Reorganization Agreement or at such other time as the Acquiring Fund and Acquired Fund may agree (the "Valuation Date"). As an illustration, assume that on the Valuation Date, Class I shares of an Acquired Fund had an aggregate net asset value of $100,000. If the net asset value per Class I share of the applicable Acquiring Fund were $10 per share at the close of business on the Valuation Date, the number of Class I shares of the Acquiring Fund to be issued would be 10,000 ($100,000 ÷ $10). These 10,000 Class I shares of the Acquiring Fund would be distributed to the former Class I shareholders of the Acquired Fund. This example is given for illustration purposes only and does not bear any relationship to the dollar amounts or shares expected to be involved in the Reorganization.
On the Closing Date or as soon as practicable thereafter, each Acquired Fund will distribute pro rata to its Shareholders of record as of the close of business on the Valuation Date, the Acquiring Fund Shares it receives. Each Shareholder will receive the class of shares of the Acquiring Fund that corresponds to the class of shares of the Acquired Fund currently held by that Shareholder. Accordingly, the Acquiring Fund Shares will be distributed as follows: each of the Class I shares of an Acquiring Fund will be distributed to holders of the Class I shares of the applicable Acquired Fund, each of the Class H shares of an Acquiring Fund will be distributed to holders of Class A, Class B, Class R and Class W shares of applicable Acquired Fund and each of the Class L shares of an Acquiring Fund will be distributed to holders of Class C shares of applicable Acquired Fund. Each Acquiring Fund will cause its transfer agent to credit and confirm an appropriate number of the Acquiring Fund's Shares to each Shareholder.
22
The Closing Date will be the Valuation Date or the next business day following the Valuation Date. The consummation of the Reorganization is contingent upon the approval of the applicable Reorganization by the Shareholders and the receipt of the other opinions and certificates set forth in Sections 6, 7 and 8 of each Reorganization Agreement and the occurrence of the events described in those Sections, certain of which may be waived by a Fund. Each Reorganization Agreement may be amended in any mutually agreeable manner.
Each Reorganization Agreement may be terminated and the applicable Reorganization abandoned at any time, before or after approval by Shareholders, by mutual consent of the Company, on behalf of the Acquiring Funds, and the Acquired Funds. In addition, either party may terminate the applicable Reorganization Agreement upon the occurrence of a material breach of the Reorganization Agreement by the other party or if, by June 28, 2013, any condition set forth in the Reorganization Agreement has not been fulfilled or waived by the party entitled to its benefits.
Under each Reorganization Agreement, within one year after the Closing Date, the applicable Acquired Fund shall either pay or make provision for all of its liabilities to former Shareholders of the Acquired Fund that received Acquiring Fund Shares. Each Acquired Fund shall be terminated following the distribution of applicable Acquiring Fund Shares to Shareholders of record of the Acquired Funds.
The effect of the Reorganizations is that Shareholders who vote their shares in favor of a Reorganization Agreement are electing to sell their shares of an Acquired Fund and reinvest the proceeds in the applicable Acquiring Fund Shares at net asset value and without recognition of taxable gain or loss for federal income tax purposes. See "Tax Aspects of the Reorganization" below. As noted in "Tax Aspects of the Reorganization" below, if an Acquired Fund recognizes net gain from the sale of securities prior to the Closing Date, such gain, to the extent not offset by capital loss carry-forwards, will be distributed to Shareholders prior to the Closing Date and will be taxable to Shareholders as capital gain.
Shareholders will continue to be able to redeem their shares of Acquired Funds at net asset value next determined after receipt of the redemption request until the close of business on the business day next preceding the Closing Date. Redemption requests received by Acquired Funds thereafter will be treated as requests for redemption of shares of the applicable Acquiring Fund.
To the extent that a Shareholder holds shares of an Acquired Fund through a retirement plan separate account for which the relevant Acquiring Fund is not an investment option, the disposition of such Shareholder's shares will be governed by such Shareholder's contract with the retirement plan.
Tax Aspects of the Reorganizations
The following is a general summary of the material federal income tax consequences of the Reorganizations and is based upon the current provisions of the Code, the existing U.S. Treasury Regulations thereunder, current administrative rulings of the Internal Revenue Service ("IRS") and published judicial decisions, all of which are subject to change. This discussion is limited to U.S. persons who hold shares of an Acquired Fund as capital assets for federal income tax purposes. This summary does not address all of the U.S. federal income tax consequences that may be relevant to a particular shareholder or to Shareholders who may be subject to special treatment under federal income tax laws.
Tax Consequences of each Reorganization to Shareholders. Each Reorganization is intended to qualify for federal income tax purposes as a tax-free reorganization under Section 368(a)(1) of the Code.
As a condition to each Reorganization, each Acquired Fund and the Acquiring Fund, has requested an opinion of Dechert LLP substantially to the effect that, based on certain assumptions, facts, the terms of the Reorganization Agreement and representations set forth in the Reorganization Agreement or otherwise provided by the applicable Acquired Fund and the applicable Acquiring Fund:
1. The transfer of substantially all of the assets of the Acquired Fund in exchange solely for the applicable Acquiring Fund Shares and the assumption by such Acquiring Fund of certain stated liabilities of the Acquired Fund followed by the distribution by the Acquired Fund of the applicable Acquiring Fund Shares to Shareholders in
23
exchange for their Acquired Fund shares pursuant to and in accordance with the terms of the Reorganization Agreement will constitute a "reorganization" within the meaning of Section 368(a)(1) of the Code;
2. No gain or loss will be recognized by the applicable Acquiring Fund upon the receipt of the assets of the Acquired Fund solely in exchange for the applicable Acquiring Fund Shares and the assumption by such Acquiring Fund of the stated liabilities of the Acquired Fund;
3. No gain or loss will be recognized by the Acquired Fund upon the transfer of substantially all of the assets of the Acquired Fund to the applicable Acquiring Fund solely in exchange for the applicable Acquiring Fund Shares and the assumption by the Acquiring Fund of the stated liabilities or upon the distribution of the Acquiring Fund Shares to Shareholders in exchange for their Acquired Fund Shares, except that the Acquired Fund may be required to recognize gain or loss with respect to contracts described in Section 1256(b) of the Code or stock in a passive foreign investment company, as defined in Section 1297(a) of the Code;
4. No gain or loss will be recognized by Shareholders upon the exchange of the shares of the Acquired Fund solely for the Acquiring Fund Shares;
5. The aggregate tax basis for the Acquiring Fund Shares received by each Shareholder pursuant to the Reorganization will be the same as the aggregate tax basis of the shares in the Acquired Fund surrendered by each such Shareholder in exchange therefor;
6. The holding period of the Acquiring Fund Shares to be received by each Shareholder will include the period during which the shares in the Acquired Fund surrendered in exchange therefor were held (provided such shares in the Acquired Fund were held as capital assets on the date of the Reorganization);
7. The tax basis of the assets of the Acquired Fund acquired by the applicable Acquiring Fund will be the same as the tax basis of such assets of the Acquired Fund immediately prior to the Reorganization; and
8. The holding period of the assets of the Acquired Fund in the hands of the applicable Acquiring Fund will include the period during which those assets were held by the Acquired Fund (except where the investment activities of the applicable Acquiring Fund have the effect of reducing or eliminating such period with respect to an asset).
Prior to the closing of a Reorganization, each Acquired Fund will distribute to its shareholders any undistributed income and gains to the extent required to avoid entity level tax or as otherwise deemed desirable. The advice of counsel is not binding on the IRS or the courts and neither the Acquired Funds nor the Acquiring Funds has sought a ruling with respect to the tax treatment of the applicable Reorganization. The opinion of counsel, if delivered, will be based on the Code, regulations issued by the Treasury Department under the Code, court decisions, and administrative pronouncements issued by the IRS with respect to all of the foregoing, all as in effect on the date of the opinion, and all of which may be repealed, revoked or modified thereafter, possibly on a retroactive basis.
After the Reorganization, you will continue to be responsible for tracking the adjusted tax basis and holding period of your shares for federal income tax purposes.
Shareholders should consult their tax advisors regarding the effect, if any, of the proposed Reorganizations in light of their individual circumstances. Because the foregoing discussion only relates to the federal income tax consequences of the proposed Reorganizations, Shareholders should also consult their tax advisors as to state and local tax consequences, if any, of the proposed Reorganizations.
Description of Shares
The Acquiring Fund Shares to be issued pursuant to the applicable Reorganization Agreement will, when issued in exchange for the consideration therefor, be fully paid and non-assessable by the applicable Acquiring Fund and transferable without restrictions and will have no preemptive rights. For greater details regarding each Acquiring Fund's shares, see "Shareholder Information" in the Acquiring Funds' Prospectuses attached hereto as Exhibit B.
24
Capitalization Tables (unaudited)
The following tables set forth the capitalization of each Acquired Fund as of June 29, 2012 and the Acquiring Fund on a pro forma combined basis as if each Reorganization had occurred on that date:
International Value
Equity (Acquired Fund) | | Class A | | Class B | | Class R | | Class W | | Class C | | Class I | | Total | |
| Net Assets | | $ | 34,181,622 | | | $ | 38,577,961 | | | $ | 83,526 | | | $ | 84,671 | | | $ | 12,916,657 | | | $ | 83,544,899 | | | $ | 169,389,336 | | |
Pro Forma
Adjustments† | | $ | (125,038 | ) | | $ | (141,120 | ) | | $ | (306 | ) | | $ | (310 | ) | | $ | (47,250 | ) | | $ | (305,612 | ) | | $ | (619,636 | ) | |
Net Assets minus
Pro Forma Adjustments | | $ | 34,056,584 | | | $ | 38,436,841 | | | $ | 83,220 | | | $ | 84,361 | | | $ | 12,869,407 | | | $ | 83,239,287 | | | $ | 168,769,700 | | |
| Shares Outstanding | | | 4,202,482 | | | | 4,769,438 | | | | 10,347 | | | | 10,476 | | | | 1,599,267 | | | | 10,247,268 | | | | 20,839,278 | | |
Net Asset Value
Per Share | | $ | 8.10 | | | $ | 8.06 | | | $ | 8.04 | | | $ | 8.05 | | | $ | 8.05 | | | $ | 8.12 | | | | — | | |
MSIF International Equity
(Acquiring Fund) | | Class H | | Class L | | Class I | | Total | |
| Net Assets | | $ | 10,392 | | | $ | 10,390 | | | $ | 3,212,581,808 | | | $ | 3,212,602,590 | | |
| Shares Outstanding | | | 809 | | | | 809 | | | | 246,823,281 | | | | 246,824,899 | | |
| Net Asset Value Per Share | | $ | 12.84 | | | $ | 12.84 | | | $ | 13.02 | | | | — | | |
Pro Forma Combined Fund
(MSIF International Equity) | | Class H | | Class L | | Class I | | Total | |
| Net Assets | | $ | 72,671,398 | | | $ | 12,879,797 | | | $ | 3,295,821,095 | | | $ | 3,381,372,290 | | |
| Shares Outstanding | | | 5,659,766 | | | | 1,003,099 | | | | 253,216,467 | | | | 259,879,332 | | |
| Net Asset Value Per Share | | $ | 12.84 | | | $ | 12.84 | | | $ | 13.02 | | | | — | | |
International
(Acquired Fund) | | Class A | | Class B | | Class R | | Class W | | Class C | | Class I | | Total | |
| Net Assets | | $ | 72,624,087 | | | $ | 4,412,062 | | | $ | 76,276 | | | $ | 81,281 | | | $ | 10,149,512 | | | $ | 646,832 | | | $ | 87,990,050 | | |
Pro Forma
Adjustments†† | | $ | (323,181 | ) | | $ | (19,634 | ) | | $ | (339 | ) | | $ | (362 | ) | | $ | (45,166 | ) | | $ | (2,878 | ) | | $ | (391,560 | ) | |
Net Assets minus
Pro Forma Adjustments | | $ | 72,300,906 | | | $ | 4,392,428 | | | $ | 75,937 | | | $ | 80,919 | | | $ | 10,104,346 | | | $ | 643,954 | | | $ | 87,598,490 | | |
| Shares Outstanding | | | 6,776,467 | | | | 415,275 | | | | 7,150 | | | | 7,604 | | | | 969,466 | | | | 59,965 | | | | 8,235,927 | | |
Net Asset Value
Per Share | | $ | 10.67 | | | $ | 10.58 | | | $ | 10.62 | | | $ | 10.64 | | | $ | 10.42 | | | $ | 10.74 | | | | — | | |
MSIF Active International
(Acquiring Fund) | | Class H | | Class L | | Class I | | Total | |
| Net Assets | | $ | 10,438 | | | $ | 10,436 | | | $ | 290,145,462 | | | $ | 290,166,336 | | |
| Shares Outstanding | | | 991 | | | | 991 | | | | 28,061,931 | | | | 28,063,913 | | |
| Net Asset Value Per Share | | $ | 10.53 | | | $ | 10.53 | | | $ | 10.34 | | | | — | | |
Pro Forma Combined Fund
(MSIF Active International) | | Class H | | Class L | | Class I | | Total | |
| Net Assets | | $ | 76,860,628 | | | $ | 10,114,782 | | | $ | 290,789,416 | | | $ | 377,764,826 | | |
| Shares Outstanding | | | 7,299,205 | | | | 960,568 | | | | 28,124,209 | | | | 36,383,982 | | |
| Net Asset Value Per Share | | $ | 10.53 | | | $ | 10.53 | | | $ | 10.34 | | | | — | | |
† Reflects the charge for estimated reorganization expenses of $125,038, $141,120, $306, $310, $47,250 and $305,612 by Class A shares, Class B shares, Class R shares, Class W shares, Class C shares and Class I shares, respectively, of International Value Equity.
25
†† Reflects the charge for estimated reorganization expenses of $323,181, $19,634, $339, $362, $45,166 and $2,878 by Class A shares, Class B shares, Class R shares, Class W shares, Class C shares and Class I shares, respectively, of International.
Appraisal Rights
Shareholders will have no appraisal rights in connection with the Reorganization.
COMPARISON OF INVESTMENT OBJECTIVES, PRINCIPAL POLICIES AND RESTRICTIONS
Investment Objectives and Policies
The investment objective of each Acquiring Fund and each Acquired Fund is set forth in the table below:
| | | International Value Equity | | MSIF International Equity | |
| Investment Objective | | • seeks long-term capital appreciation | | • seeks long-term capital appreciation by investing primarily in equity securities of non-U.S. issuers | |
|
| | • International Value Equity's investment objective is a fundamental policy and may not be changed without shareholder approval of a majority of the Fund's outstanding voting securities, as defined in the 1940 Act | | • MSIF International Equity's investment objective is a fundamental policy and may not be changed without shareholder approval of a majority of the Fund's outstanding voting securities, as defined in the 1940 Act | |
|
| | | International | | MSIF Active International | |
| Investment Objective | | • seeks long-term capital growth | | • seeks long-term capital appreciation by investing primarily, in accordance with country and sector weightings determined by MSIM, in equity securities of non-U.S. issuers which, in the aggregate, replicate broad market indices | |
|
| | • International's investment objective is a fundamental policy and may not be changed without shareholder approval of a majority of the Fund's outstanding voting securities, as defined in the 1940 Act | | • MSIF Active International's investment objective is a fundamental policy and may not be changed without shareholder approval of a majority of the Fund's outstanding voting securities, as defined in the 1940 Act | |
|
International Value Equity
International Value Equity normally invests at least 80% of its assets in a diversified portfolio of common stocks and other equity securities, including depositary receipts and securities convertible into common stock, of companies located outside of the United States. These companies may be of any asset size, including small and medium capitalization companies, and may be located in developed or emerging market countries. International Value Equity invests in at least three different countries located outside of the United States. International Value Equity's Sub-Advisers may consider an issuer to be from a particular country or geographic region if (i) its principal securities trading market is in that country or geographic region; (ii) alone or on a consolidated basis it derives 50% or more of its annual revenue from goods produced, sales made or services performed in that country or geographic region; or (iii) it is organized under the laws of, or has a principal office in, that country or geographic region. By applying this test, it is possible that a particular issuer could be deemed to be from more than one country or geographic region. In accordance with the International Value Equity's investment strategy, companies within a capitalization range of $1 billion to $10 billion at the time of purchase are considered to be small and medium
26
capitalization companies by the Sub-Advisers. International Value Equity may also use derivative instruments, which will be counted toward the 80% policy discussed above to the extent they have economic characteristics similar to the securities included within that policy.
International Value Equity's Sub-Advisers utilize a bottom-up investment process that seeks to identify undervalued companies. In selecting portfolio investments, the Sub-Advisers first screen more than 1,000 issuers seeking to identify companies whose equity appears to be undervalued based on its analysis of price/cash flow, price/book value and/or price/earnings ratios, as well as other value-based quantitative criteria. Then, the Sub-Advisers perform an in-depth fundamental analysis of, among other things: (i) the company's balance sheet and income statements; (ii) the quality of the company's management; and (iii) the company's business competitiveness and market positioning (including the applicable industry's structure). This analysis typically involves meetings with the company's senior management. In deciding whether to sell a particular security, the Sub-Advisers will consider a number of factors, including changes in the company's prospects, financial condition or industry position, as well as general economic and market conditions.
Common stock is a share ownership or equity interest in a corporation. It may or may not pay dividends, as some companies reinvest all of their profits back into their businesses, while others pay out some of their profits to shareholders as dividends. A depositary receipt is generally issued by a bank or financial institution and represents an ownership interest in the common stock or other equity securities of a foreign company.
The remaining 20% of the International Value Equity's assets may be invested in equity securities of companies located in the United States.
International Value Equity may also use forward foreign currency exchange contracts, which are derivative instruments, in connection with its investments in foreign securities.
In pursuing International Value Equity's investment objective, MSIM and/or the Sub-Advisers have considerable leeway in deciding which investments they buy, hold or sell on a day-to-day basis and which trading strategies they use. For example, MSIM and/or the Sub-Advisers in their discretion may determine to use some permitted trading strategies while not using others.
MSIF International Equity
MSIF International Equity's Sub-Advisers seek to maintain a diversified portfolio of equity securities of non-U.S. issuers based on individual stock selection. The Sub-Advisers emphasize a bottom-up approach to investing that seeks to identify securities of issuers they believe are undervalued. The Sub-Advisers focus on developed markets, but they may invest in emerging markets.
The Sub-Advisers select issuers from a universe comprised of approximately 1,200 companies in non-U.S. markets. The investment process is value driven and based on individual stock selection. In assessing investment opportunities, the Sub-Advisers consider value criteria with an emphasis on cash flow and the intrinsic value of company assets. Securities which appear undervalued according to these criteria are then subjected to in-depth fundamental analysis. The Sub-Advisers conduct a thorough investigation of the issuer's balance sheet, cash flow and income statement and assesses the company's business franchise, including product competitiveness, market positioning and industry structure. Meetings with senior company management are integral to the investment process. The Sub-Advisers generally consider selling a portfolio holding when they determine that the holding has reached its fair value target.
Under normal market conditions, at least 80% of MSIF International Equity's assets will be invested in equity securities. This policy may be changed without shareholder approval; however, shareholders would be notified in writing of any changes. MSIF International Equity's equity investments may include convertible securities.
MSIF International Equity may, but it is not required to, use derivative instruments for a variety of purposes, including hedging, risk management, portfolio management or to earn income. Derivatives are financial instruments whose value is based on the value of an underlying asset, interest rate, index or financial instrument. MSIF International Equity's use of derivatives may involve the purchase and sale of derivative instruments such as futures,
27
options, swaps and CFDs, and other related instruments and techniques. MSIF International Equity may utilize foreign currency forward exchange contracts, which are also derivatives, in connection with its investments in foreign securities. Derivative instruments used by MSIF International Equity will be counted toward the 80% policy discussed above to the extent they have economic characteristics similar to the securities included within that policy.
International
International will normally invest at least 65% of its assets in a diversified portfolio of international common stocks and other equity securities. MSIM uses a "top-down" approach that emphasizes region, country, sector and industry selection and weightings over individual stock selection. International may also use derivative instruments, which will be counted toward the 65% policy discussed above to the extent they have economic characteristics similar to the securities included within that policy.
MSIM first considers the countries (including emerging market or developing countries) and sectors represented in the MSCI EAFE Index. MSIM, on an ongoing basis, establishes the proportion or weighting for each country and/or sector (e.g., overweight, underweight or neutral) relative to the index for investment by International. MSIM may choose to overweight or underweight particular sectors or industries, such as telecommunications or banking, within each country or region. In making its determinations, MSIM evaluates factors such as valuation, economic outlook, corporate earnings growth, inflation, liquidity and risk characteristics, investor sentiment, interest rates and currency outlook. International invests in at least three separate countries.
MSIM invests International's assets within each country and/or sector based on its assigned weighting. Within each country and/or sector, MSIM tries to broadly replicate, in the aggregate, the performance of a broad local market index by investing in "baskets" of common stocks and other equity securities, which may include depositary receipts, preferred securities and convertible securities. International may invest in emerging market or developing countries and, with regard to such investments, may make global, regional and sector allocations to specific emerging market or developing countries. In most cases, the local MSCI index for that country will be one of the broad local market indexes.
Common stock is a share ownership or equity interest in a corporation. It may or may not pay dividends, as some companies reinvest all of their profits back into their businesses, while others pay out some of their profits to shareholders as dividends. A depositary receipt is generally issued by a bank or financial institution and represents an ownership interest in the common stock or other equity securities of a foreign company.
In addition to the securities discussed above, International may also invest in equity and/or fixed-income and convertible securities of issuers located anywhere in the world, including the United States, and securities of other investment companies. International may also invest up to 10% of its net assets in REITs and foreign real estate companies, which are similar to entities organized and operated as REITs in the United States. REITs and foreign real estate companies pool investor funds for investments primarily in real estate properties or real estate-related loans. They may also include, among other businesses, real estate developers, brokers and operating companies whose products and services are significantly related to the real estate industry such as building suppliers and mortgage lenders.
International may, but it is not required to, use derivative instruments for a variety of purposes, including hedging, risk management, portfolio management or to earn income. Derivatives are financial instruments whose value is based on the value of an underlying asset, interest rate, index or financial instrument. International's use of derivatives may involve the purchase and sale of derivative instruments such as futures, options, swaps, CFDs and other related instruments and techniques. International may also use forward foreign currency exchange contracts, which are also derivatives, in connection with its investments in foreign securities.
In pursuing International's investment objective, MSIM has considerable leeway in deciding which investments it buys, holds or sells on a day-to-day basis and which trading strategies it uses. For example, MSIM in its discretion may determine to use some permitted trading strategies while not using others.
28
MSIF Active International
MSIF Active International seeks to maintain a diversified portfolio of international equity securities based on a top-down approach that emphasizes region, country, sector and industry selection and weighting rather than individual stock selection. MSIM seeks to capitalize on the significance of region, country, sector and industry selection in international equity portfolio returns by over and underweighting countries and/or sectors based primarily on three factors: (i) valuation; (ii) dynamics/fundamental change; and (iii) market momentum/technicals.
MSIM's Active International Allocation team analyzes both the global economic environment and the economies of countries throughout the world, focusing mainly on the industrialized countries comprising the MSCI EAFE Index. EAFE countries include Japan, most nations in Western Europe, Australia, New Zealand, Hong Kong and Singapore. MSIM views each region, country, sector and industry as a unique investment opportunity and evaluates factors such as valuation, growth, inflation, interest rates, corporate earnings growth, liquidity and risk characteristics, investor sentiment and economic and currency outlook. MSIM, on an ongoing basis, establishes the proportion or weighting for each region, country, sector and/or industry (e.g., overweight, underweight or neutral) relative to the MSCI EAFE Index for investment by MSIF Active International. MSIM invests MSIF Active International's assets within each region, country, sector and/or industry based on its assigned weighting. Within each region, country, sector and/or industry, MSIM will try to broadly replicate, in the aggregate, the performance of a broad local market index by investing in "baskets" of common stocks and other equity securities. In most cases, the local MSCI index for that country will be one of the broad local market indices. The equity securities in which MSIF Active International may invest include common stock, preferred stock, convertible securities, depositary receipts, rights and warrants. MSIF Active International may invest in emerging market or developing countries and, with regard to such investments, may make global, regional and sector allocations to emerging markets, as well as allocations to specific emerging market or developing countries. MSIM generally considers selling a portfolio holding when it determines that the holding no longer satisfies its investment criteria.
MSIF Active International may, but it is not required to, use derivative instruments for a variety of purposes, including hedging, risk management, portfolio management or to earn income. Derivatives are financial instruments whose value is based on the value of an underlying asset, interest rate, index or financial instrument. MSIF Active International's use of derivatives may involve the purchase and sale of derivative instruments such as futures, options, swaps and CFDs, and other related instruments and techniques. MSIF Active International may utilize foreign currency forward exchange contracts, which are also derivatives, in connection with its investments in foreign securities. Derivative instruments used by MSIF Active International will be counted toward the exposure in the types of securities listed above to the extent they have economic characteristics similar to such securities.
Investment Restrictions
The investment restrictions adopted by each Acquired Fund and each Acquiring Fund as fundamental policies are substantially similar. Each Acquiring Fund's investment restrictions are summarized under the caption "Investment Limitations" in the Statement of Additional Information dated April 30, 2012, as it may be amended and supplemented from time to time, with respect to each Acquiring Fund. Each Acquired Fund's investment restrictions are summarized under the caption "Fund Policies/Investment Restrictions" in each Acquired Fund's Statement of Additional Information, dated December 30, 2011 (with respect to International Value Equity) and February 29, 2012 (with respect to International Equity), each as may be amended and supplemented from time to time. A fundamental investment restriction cannot be changed without the vote of the majority of the outstanding voting securities of a Fund, which is defined by the 1940 Act as the lesser of (i) at least 67% of the voting securities of a fund or portfolio present at a meeting if the holders of more than 50% of the outstanding voting securities of a fund or portfolio are present or represented by proxy; or (ii) more than 50% of the outstanding voting securities of a fund or portfolio. The differences in the investment restrictions adopted by the Funds as fundamental policies are discussed below:
1. Neither Acquiring Fund may write or acquire options or interests in oil, gas or other mineral exploration or development. The Acquired Funds are not subject to this investment restriction.
29
The non-fundamental investment restrictions of the Acquiring Funds and the Acquired Funds are set forth below:
The Acquired Funds
International Value Equity
International Value Equity will not invest in other investment companies in reliance on Section 12(d)(1)(F), 12(d)(1)(G) or 12(d)(1)(J) of the 1940 Act.
International
International will not:
1. Invest in other investment companies in reliance on Sections 12(d)(1)(F), 12(d)(1)(G) or 12(d)(1)(J) of the 1940 Act.
2. Make short sales of securities, except short sales against the box.
The Acquiring Funds
Each Acquiring Fund will not:
1. purchase on margin or sell short except (i) that each Acquiring Fund may enter into option transactions and futures contracts as described in its Prospectus; and (ii) that each Acquiring Fund may purchase and sell options, futures contracts and related options thereon, forward contracts, swaps, caps, floors, collars and any other financial instruments, as described in its fundamental investment restrictions;
2. make loans except (i) by purchasing bonds, debentures or similar obligations (including repurchase agreements, subject to the limitations as described in the respective Prospectuses) that are publicly distributed; and (ii) by lending its portfolio securities to banks, brokers, dealers and other financial institutions so long as such loans are not inconsistent with the 1940 Act or the rules and regulations or interpretations of the Commission thereunder;
3. borrow money, except from banks for extraordinary or emergency purposes, and then only in amounts up to 10% of the value of the Acquiring Fund's total assets (including, in each case, the amount borrowed less liabilities (other than borrowings)), or purchase securities while borrowings exceed 5% of its total assets; and
4. invest in other investment companies in reliance on Sections 12(d)(1)(F), 12(d)(1)(G) or 12(d)(1)(J) of the 1940 Act.
ADDITIONAL INFORMATION ABOUT THE ACQUIRING FUNDS AND THE ACQUIRED FUNDS
General
For a discussion of the organization and operation of each Acquiring Fund, see "Portfolio Summary" and "Fund Details—Fund Management" in the Acquiring Funds' Prospectuses attached hereto as Exhibit B. For a discussion of the organization and operation of the Company, see "General Information—Fund History" in the Statements of Additional Information relating to each Acquiring Fund.
For a discussion of the organization and operation of each Acquired Fund, see "Fund Summary" and "Fund Management" in their respective prospectuses. For a discussion of the organization and operation of each of International Value Equity and International see "Fund History" in each Acquired Fund's Statement of Additional Information.
Rights of Acquired Fund Shareholders and Acquiring Fund Shareholders
Each Acquiring Fund is organized as a separate series of the Company, a Maryland corporation that is governed by its Charter and Bylaws, as amended, and Maryland law. Each Acquired Fund is organized as a Massachusetts
30
business trust that is governed by its Declaration of Trust, as amended and supplemented, its Amended and Restated Bylaws and Massachusetts law.
While Maryland corporate law contains many provisions specifically applicable to management investment companies and Massachusetts statutory trust law is specifically drafted to accommodate some of the unique corporate governance needs of management investment companies, certain statutory differences do exist and the Funds' organizational documents contain certain differences summarized below. Each Fund is subject to federal securities laws, including the 1940 Act and the rules and regulations promulgated by the Commission thereunder, and applicable state securities laws.
Consistent with Maryland law, the Company's Board of Directors, on behalf of each Acquiring Fund, has authorized the issuance of a specific number of shares, although the organizational documents authorize such Board of Directors to increase or decrease, from time to time, as it considers necessary, the aggregate number of shares of stock or of any class of stock which the Company has the authority to issue. Consistent with Massachusetts law, the Acquired Funds are authorized to issue an unlimited number of shares. The Acquiring Funds' and the Company's organizational documents allow the respective Board of Directors/Trustees to create one or more separate investment portfolios and to establish a separate series of shares for each portfolio and to further subdivide the shares of a series into one or more classes.
Neither the Charter nor the By-Laws of the Company contain specific provisions regarding the personal liability of Shareholders. However, under the Maryland General Corporation Law, Shareholders of a Maryland corporation generally will not be held personally liable for the acts or obligations of the corporation, except that a shareholder may be liable to the extent that (i) consideration for the shares has not been paid, (ii) the shareholder knowingly accepts a distribution in violation of the charter or Maryland law, or (iii) the shareholder receives assets of the corporation upon its liquidation and the corporation is unable to meet its debts and obligations, in which case the shareholder may be liable for such debts and obligations to the extent of the assets received in the distribution.
Under Massachusetts law, shareholders of a business trust may, under certain limited circumstances, be held personally liable as partners for the obligations of an Acquired Fund. However, the Declaration of Trust of each Acquired Fund contains an express disclaimer of shareholder liability for acts or obligations of the Acquired Fund, requires that notice of such Acquired Fund obligations include such disclaimer, and provides for indemnification out of the Acquired Fund's property for any shareholder held personally liable for the obligations of the Acquired Fund.
No Fund is required, and no Fund anticipates, holding annual meetings of its Shareholders. Each Fund has certain mechanics whereby Shareholders can call a special meeting of their Fund. Shareholders generally have the right to approve investment advisory agreements, elect trustees/directors, change fundamental investment policies, ratify the selection of independent auditors and vote on other matters required by law or the applicable Fund's organizational documents or deemed desirable by their Boards.
The business of each of the Acquiring Funds and the Acquired Funds is supervised by the respective Boards of the Acquired Funds and the Company. Each respective Board of the Acquired Funds consists of the same members; and similarly, the Board of the Company consists of the same members. The responsibilities, powers and fiduciary duties of directors under Maryland law are generally similar in certain respects to those for trustees under Massachusetts law, although significant differences do exist and shareholders should refer to the provisions of the Company's and the Acquired Funds' applicable organizational documents and applicable law for a more thorough comparison. For the Acquiring Funds and the Acquired Funds, director/trustee vacancies may be filled by approval of a majority of the directors/trustees then in office subject to provisions of the 1940 Act. The term of a director/trustee lasts until the election of such person's successor or until such person's earlier resignation or removal. In addition, the Acquired Funds' Declarations of Trust specify that a Trustee's term will terminate in the event of the death, bankruptcy, adjudicated incompetence or other incapacity to perform the duties of the office of a Trustee. Directors of the Company may be removed with or without cause by vote of a majority of the shares present in person or by proxy at a meeting, provided a quorum is present. Trustees of the Acquired Funds may be removed with or without cause by the action of the shareholders of record of not less than two-thirds of the shares outstanding or by the action of two-thirds of the remaining Trustees.
31
The foregoing is only a summary of certain differences between the Acquiring Funds and the Acquired Funds under applicable law. It is not intended to be a complete list of differences and Shareholders should refer to the provisions of each Fund's applicable organizational documents for a more thorough comparison. Such documents are filed as part of each Fund's registration statements with the Commission, and Shareholders may obtain copies of such documents as described herein.
Financial Information
For certain financial information about each Fund, see "Financial Highlights" with respect to such Funds in its Prospectus.
Shareholder Proposals
The Funds are not required and do not intend to hold regular shareholder meetings unless shareholder action is required in accordance with the 1940 Act. Shareholders who would like to submit proposals for consideration at future shareholder meetings of either an Acquired Fund (in the event the applicable Reorganization is not completed) or an Acquiring Fund should send written proposals to Mary E. Mullin, Secretary, 522 Fifth Avenue, New York, NY 10036. To be considered for presentation at a shareholders' meeting, rules promulgated by the Commission require that, among other things, a shareholder's proposal must be received at the offices of the applicable Fund within a reasonable time before a solicitation is made. Timely submission of a proposal does not necessarily mean that such proposal will be included.
Management
For information about the Board of Directors, MSIM and the distributor of each Acquiring Fund, see "Fund Management—Investment Adviser" in the Acquiring Funds' Prospectuses attached hereto as Exhibit B and "Management of the Fund" in the Company's Statements of Additional Information.
For information about the Board, MSIM and the distributor of each Acquired Fund, see "Fund Management" in their Prospectus and "Management of the Fund" in each Acquired Fund's Statement of Additional Information.
Description of Shares and Shareholder Inquiries
For a description of the nature and most significant attributes of shares of each Acquiring Fund, and information regarding Shareholder inquiries, see "General Information" in the Company's Statement of Additional Information as well as "Shareholder Information" and "Where to Find Additional Information" in the Acquiring Funds' Prospectuses attached hereto as Exhibit B.
For a description of the nature and most significant attributes of shares of each Acquired Fund, and information regarding Shareholder inquiries, see "Capital Stock and Other Securities" in each Acquired Fund's Statement of Additional Information as well as "Shareholder Information—Additional Information" in each Acquired Fund's prospectus.
Dividends, Distributions and Taxes
For a discussion of each Acquiring Fund's policies with respect to dividends, distributions and taxes, see "Shareholder Information—Dividends and Distributions; Taxes" in their Prospectus, "Taxes" in the Company's Statements of Additional Information, and the discussions herein under "Synopsis—Comparison of each Acquired Fund and Acquiring Fund—Dividends," "Synopsis—Tax Consequences of the Reorganizations" and "The Reorganizations—Tax Aspects of the Reorganizations."
For a discussion of each Acquired Fund's policies with respect to dividends, distributions and taxes, see "Distributions" in their Prospectus, "Taxation of the Fund and Shareholders" in each Acquired Fund's Statement of Additional Information, and the discussions herein under "Synopsis—Comparison of each Acquired Fund and Acquiring Fund—Dividends," "Synopsis—Tax Consequences of the Reorganizations" and "The Reorganization—Tax Aspects of the Reorganizations."
32
Purchases, Exchanges and Redemptions
For a discussion of how each Acquiring Fund's shares may be purchased, exchanged and redeemed, see "Shareholder Information—How To Purchase Class I, Class P and Class L Shares; How To Purchase Class H Shares; How To Redeem Class I, Class P and Class L Shares; and How To Redeem Class H Shares" in the Acquiring Funds' Prospectuses, "Purchase of Shares" and "Redemption of Shares" in the Company's Statements of Additional Information, and the discussion herein under "Synopsis—Comparison of each Acquired Fund and Acquiring Fund—Purchases, Exchanges and Redemptions."
For a discussion of how each Acquired Fund's shares may be purchased, exchanged and redeemed, see "Shareholder Information—How to Buy Shares; How to Exchange Shares; and How to Sell Shares" in their Prospectus and "Purchase, Redemption and Pricing of Shares" in each Acquired Fund's Statement of Additional Information, and the discussion herein under "Synopsis—Comparison of each Acquired Fund and Acquiring Fund—Purchases, Exchanges and Redemptions."
For a discussion of each Acquiring Fund's policies with respect to frequent purchases and redemptions, see "Shareholder Information—Frequent Purchases and Redemptions of Shares" in their Prospectus attached hereto in Exhibit B.
For a discussion of each Acquired Fund's policies with respect to frequent purchases and redemptions, see "Shareholder Information—Frequent Purchases and Redemptions of Fund Shares" in their Prospectus.
SHARE INFORMATION
The following persons were known to own of record or beneficially 5% or more of the outstanding shares of a class of International Value Equity as of the Record Date:
| Shareholder | | Percentage of
Outstanding Shares | |
| Class A | |
MORGAN STANLEY & CO
HARBORSIDE FINANCIAL CENTER
PLAZA II 3RD FLOOR
JERSEY CITY NJ 07311 | | 70.5197% | |
STATE STREET BANK AND TRUST CO
FBO ADP/MORGAN STANLEY ALLIANCE
105 ROSEMONT AVE
WESTWOOD MA 02090-2318 | | 11.0075% | |
| Class B | |
MORGAN STANLEY & CO
HARBORSIDE FINANCIAL CENTER
PLAZA II 3RD FLOOR
JERSEY CITY NJ 07311 | | 75.9844% | |
FIRST CLEARING, LLC
A/C 1699-0135
SPECIAL CUSTODY ACCT FOR THE EXCLUSIVE
BENEFIT OF CUSTOMER
2801 MARKET ST
SAINT LOUIS MO 63103-2523 | | 6.5066% | |
33
| Shareholder | | Percentage of
Outstanding Shares | |
| Class R | |
MORGAN STANLEY INVESTMENT
MANAGEMENT INC
ATTN LAWRENCE MARKEY—CONTROLLERS
100 FRONT STREET
WEST CONSHOHOCKEN PA 19428-2800 | | 100.00% | |
| Class W | |
MORGAN STANLEY INVESTMENT
MANAGEMENT INC
ATTN LAWRENCE MARKEY—CONTROLLERS
100 FRONT STREET
WEST CONSHOHOCKEN PA 19428-2800 | | 98.8572% | |
| Class C | |
MORGAN STANLEY & CO
HARBORSIDE FINANCIAL CENTER
PLAZA II 3RD FLOOR
JERSEY CITY NJ 07311 | | 76.2946% | |
| Class I | |
MORGAN STANLEY & CO
HARBORSIDE FINANCIAL CENTER
PLAZA II 3RD FLOOR
JERSEY CITY NJ 07311 | | 95.5376% | |
As of the Record Date, the trustees and officers of International Value Equity, as a group, owned less than 1% of the outstanding shares of International Value Equity.
The following persons were known to own of record or beneficially 5% or more of the outstanding shares of a class of International as of the Record Date:
| Shareholder | | Percentage of
Outstanding Shares | |
| Class A | |
MORGAN STANLEY & CO
HARBORSIDE FINANCIAL CENTER
PLAZA II 3RD FLOOR
JERSEY CITY NJ 07311 | | 70.2981% | |
STATE STREET BANK AND TRUST CO
FBO ADP/MORGAN STANLEY ALLIANCE
105 ROSEMONT AVE
WESTWOOD MA 02090-2318 | | 12.0021% | |
| Class B | |
MORGAN STANLEY & CO
HARBORSIDE FINANCIAL CENTER
PLAZA II 3RD FLOOR
JERSEY CITY NJ 07311 | | 70.3487% | |
MERRILL LYNCH PIERCE FENNER & SMITH
INC FOR THE SOLE BENEFIT OF ITS CUSTOMERS
4800 DEER LAKE DRIVE EAST
JACKSONVILLE FL 32246-6484 | | 8.1351% | |
34
| Shareholder | | Percentage of
Outstanding Shares | |
| Class R | |
MORGAN STANLEY INVESTMENT
MANAGEMENT INC
ATTN LAWRENCE MARKEY—CONTROLLERS
100 FRONT STREET
WEST CONSHOHOCKEN PA 19428-2800 | | 98.9119% | |
| Class W | |
MORGAN STANLEY INVESTMENT
MANAGEMENT INC
ATTN LAWRENCE MARKEY—CONTROLLERS
100 FRONT STREET
WEST CONSHOHOCKEN PA 19428-2800 | | 93.0038% | |
CHARLES SCHWAB & CO INC
SPECIAL CUSTODY ACCT FOR THE EXCLUSIVE
BENEFIT OF CUSTOMERS
ATTN MUTUAL FUNDS
101 MONTGOMERY ST
SAN FRANCISCO CA 94104-4151 | | 6.9962% | |
| Class C | |
MORGAN STANLEY & CO
HARBORSIDE FINANCIAL CENTER
PLAZA II 3RD FLOOR
JERSEY CITY NJ 07311 | | 80.7945% | |
| Class I | |
MORGAN STANLEY & CO
HARBORSIDE FINANCIAL CENTER
PLAZA II 3RD FLOOR
JERSEY CITY NJ 07311 | | 62.9214% | |
UBS FINANCIAL SERVICES INC. FBO
ESTHER LORY JACOBS TOD
RJ JACOBS, KM JACOBS, SJ JACOBS
104 KBS RD
YORK PA 17408-8973 | | 12.2733% | |
As of the Record Date, the trustees and officers of International, as a group, owned less than 1% of the outstanding shares of International.
The following persons were known to own of record or beneficially 5% or more of the outstanding shares of a class of MSIF International Equity as of the Record Date:
| Shareholder | | Percentage of
Outstanding Shares | |
| Class I | |
CHARLES SHCWAB & CO INC
ATTN MUTUAL FUNDS
101 MONTGOMERY STREET
SAN FRANCISCO CA 94104-4151 | | | 20.562 | % | |
35
| Shareholder | | Percentage of
Outstanding Shares | |
NATIONAL FINCL SERVICES
200 LIBERTY ST
NEW YORK NY 10281-1003 | | | 14.508 | % | |
NORTHERN TRUST COMPANY AS TTEE FBO
MORGAN STANLEY 401K SAVINGS PLAN DV
PO BOX 92994
CHICAGO IL 60675-2994 | | | 6.011 | % | |
FIDELITY INVESTMENTS INST'L
OPERATIONS CO FIIOC AS AGENT FOR
EMPLOYEE BENEFIT PLANS
100 MAGELLAN WAY KW1C
COVINGTON KY 41015-1999 | | | 5.799 | % | |
| Class P | |
NATIONAL FINCL SERVICES
200 LIBERTY ST
NEW YORK NY 10281-1003 | | | 92.942 | % | |
As of the Record Date, the directors and officers of MSIF International Equity, as a group, owned less than 1% of the outstanding shares of MSIF International Equity.
The following persons were known to own of record or beneficially 5% or more of the outstanding shares of a class of MSIF Active International as of the Record Date:
| Shareholder | | Percentage of
Outstanding Shares | |
| Class I | |
MORGAN STANLEY & CO
HARBORSIDE FINANCIAL CENTER
PLAZA II 3RD FLOOR
JERSEY CITY NJ 07311 | | | 70.388 | % | |
MORGAN STANLEY & CO FBO
EMILY H FISHER
517 KELSEY RD
SHEFFIELD MA 01257-9699 | | | 5.4462 | % | |
| Class P | |
MORGAN STANLEY & CO
HARBORSIDE FINANCIAL CENTER
PLAZA II 3RD FLOOR
JERSEY CITY NJ 07311 | | | 68.5115 | % | |
FIDELITY INVESTMENTS INST'L
OPERATIONS CO FIIOC AS AGENT
FOR CERTAIN EMPLOYEE BENEFIT PLANS
100 MAGELLAN WAY KW1C
COVINGTON KY 41015-1999 | | | 18.9360 | % | |
As of the Record Date, the directors and officers of MSIF Active International, as a group, owned less than 1% of the outstanding shares of MSIF Active International.
36
FINANCIAL STATEMENTS AND EXPERTS
The financial statements of the Acquiring Funds, for the fiscal year ended December 31, 2011, and International Value Equity and International, for the fiscal years ended August 31, 2011 and October 31, 2011, respectively, that are incorporated by reference in the Statement of Additional Information relating to the Registration Statement on Form N-14 of which this Joint Proxy Statement and Prospectus forms a part, have been audited by Ernst & Young LLP, the Company's and the Acquired Funds' independent registered public accounting firm (except that the financial information for the Acquired Funds for the fiscal years ended prior to 2011 was audited by the Acquired Funds' prior independent registered public accounting firm). The financial statements for International Value Equity for the six-month period ended February 29, 2012 and International for the six-month period ended April 30, 2012 have not been audited and are also incorporated by reference in the Statement of Additional Information relating to the Registration Statement on Form N-14 of which this Joint Proxy Statement and Prospectus forms a part. Each set of audited financial statements is incorporated herein by reference in reliance upon such reports given upon the authority of said independent registered public accounting firms as experts in accounting and auditing.
LEGAL MATTERS
Certain legal matters concerning the issuance of the Acquiring Fund Shares will be passed upon by Dechert LLP, New York, NY. Such firm will rely on Maryland counsel as to matters of Maryland law.
AVAILABLE INFORMATION
Additional information about each Fund is available, as applicable, in the following documents which are incorporated herein by reference: (i) the Acquiring Funds' Prospectuses dated April 30, 2012, attached to this Joint Proxy Statement and Prospectus as Exhibit B, which Prospectus forms a part of Post-Effective Amendment No. 104 to the Company's Registration Statement on Form N-1A (File Nos. 033-23166; 811-05624); (ii) International Value Equity's Prospectus dated December 30, 2011, which Prospectus forms a part of Post-Effective Amendment No. 15 to International Value Equity's Registration Statement on Form N-1A (File Nos. 333-53546; 811-10273); (iii) International's Prospectus dated February 29, 2012, which Prospectus forms a part of Post-Effective Amendment No. 18 to International's Registration Statement on Form N-1A (File Nos. 333-66203; 811-09081); (v) the Company's Annual Report for its fiscal year ended December 31, 2011; (vi) International Value Equity's Annual Report for its fiscal year ended August 31, 2011; (vii) International Value Equity's Semi-Annual Report for the six-month period ended February 29, 2012; (viii) International's Annual Report for its fiscal year ended October 31, 2011; and (ix) ) International's Semi-Annual Report for the six-month period ended April 30, 2012.
Each Fund is subject to the informational requirements of the Securities Exchange Act of 1934, as amended, and in accordance therewith, files reports and other information with the Commission. Proxy materials, reports and other information about the Funds which are of public record can be viewed and copied at the Commission's Public Reference Room in Washington, D.C. Information about the Reference Room's operations may be obtained by calling the Commission at (202) 551-8090. Reports and other information about the Funds and the Company are available on the EDGAR Database on the Commission's Internet site (www.sec.gov) and copies of this information may be obtained, after paying a duplicating fee, by electronic request at the following E-mail address: publicinfo@sec.gov, or by writing the Public Reference Branch, Office of Consumer Affairs and Information Services, Securities and Exchange Commission, Washington, D.C. 20549-1520.
37
OTHER BUSINESS
Management of each Acquired Fund knows of no business other than the matters specified above which will be presented at the Meeting. Since matters not known at the time of the solicitation may come before the Meeting, the Proxy as solicited confers discretionary authority with respect to such matters as properly come before the Meeting, including any adjournment or adjournments thereof, and it is the intention of the persons named as attorneys-in-fact in the Proxy to vote this Proxy in accordance with their judgment on such matters.
By Order of the Board of Trustees,
Mary E. Mullin
Secretary
July 24, 2012
38
Exhibit A
FORM OF AGREEMENT AND PLAN OF REORGANIZATION
THIS AGREEMENT AND PLAN OF REORGANIZATION ("Agreement") is made as of June 28, 2012, by and between MORGAN STANLEY INSTITUTIONAL FUND, INC. (the "Company"), a Maryland corporation, on behalf of ______________ Portfolio ("Acquiring Fund"), and ___________________, a Massachusetts business trust ("Acquired Fund").
This Agreement is intended to be and is adopted as a "plan of reorganization" within the meaning of Treas. Reg. 1.368-2(g), for a reorganization under Section 368(a)(1) of the Internal Revenue Code of 1986, as amended (the "Code"). The reorganization ("Reorganization") will consist of the transfer to Acquiring Fund of substantially all of the assets of Acquired Fund in exchange for the assumption by Acquiring Fund of all stated liabilities of Acquired Fund and the issuance by Acquiring Fund of shares of common stock, par value $0.001 per share (the "Acquiring Fund Shares"), to be distributed, after the Closing Date hereinafter referred to, to the shareholders of Acquired Fund in liquidation of Acquired Fund as provided herein, all upon the terms and conditions hereinafter set forth in this Agreement.
In consideration of the premises and of the covenants and agreements hereinafter set forth, the parties hereto covenant and agree as follows:
1. The Reorganization and Liquidation of Acquired Fund
1.1 Subject to the terms and conditions herein set forth and on the basis of the representations and warranties contained herein, Acquired Fund agrees to assign, deliver and otherwise transfer the Acquired Fund Assets (as defined in paragraph 1.2) to Acquiring Fund, and the Company, on behalf of Acquiring Fund, agrees in exchange therefor to assume all of Acquired Fund's stated liabilities on the Closing Date as set forth in paragraph 1.3 and to deliver to Acquired Fund the number of Acquiring Fund Shares, including fractional Acquiring Fund Shares, determined in the manner set forth in paragraph 2.3. Such transactions shall take place at the closing provided for in paragraph 3.1 ("Closing").
1.2 (a) The "Acquired Fund Assets" shall consist of all property, including without limitation, all cash, cash equivalents, securities and dividend and interest receivables owned by Acquired Fund, and any deferred or prepaid expenses shown as an asset on Acquired Fund's books on the Valuation Date.
(b) On or prior to the Valuation Date, Acquired Fund will provide Acquiring Fund with a list of all of Acquired Fund's assets to be assigned, delivered and otherwise transferred to Acquiring Fund and a list of the stated liabilities to be assumed by Acquiring Fund pursuant to this Agreement. Acquired Fund reserves the right to sell any of the securities on such list but will not, without the prior approval of the Company, on behalf of Acquiring Fund, acquire any additional securities other than securities of the type in which Acquiring Fund is permitted to invest and in amounts agreed to in writing by the Company, on behalf of Acquiring Fund. The Company, on behalf of Acquiring Fund, will, within a reasonable time prior to the Valuation Date, furnish Acquired Fund with a statement of Acquiring Fund's investment objective, policies and restrictions and a list of the securities, if any, on the list referred to in the first sentence of this paragraph that do not conform to Acquiring Fund's investment objective, policies and restrictions. In the event that Acquired Fund holds any investments that Acquiring Fund is not permitted to hold, Acquired Fund will dispose of such securities on or prior to the Valuation Date. In addition, if it is determined that the portfolios of Acquired Fund and Acquiring Fund, when aggregated, would contain investments exceeding certain percentage limitations imposed upon Acquiring Fund with respect to such investments, Acquired Fund if requested by the Company, on behalf of Acquiring Fund, will, on or prior to the Valuation Date, dispose of and/or reinvest a sufficient amount of such investments as may be necessary to avoid violating such limitations as of the Closing Date (as defined in paragraph 3.1).
A-1
1.3 Acquired Fund will endeavor to discharge all of Acquired Fund's liabilities and obligations on or prior to the Valuation Date. The Company, on behalf of Acquiring Fund, will assume all stated liabilities, which includes, without limitation, all expenses, costs, charges and reserves reflected on an unaudited Statement of Assets and Liabilities of Acquired Fund prepared by the Treasurer of Acquired Fund as of the Valuation Date in accordance with generally accepted accounting principles consistently applied from the prior audited period.
1.4 In order for the Acquired Fund to comply with Section 852(a)(1) of the Code and to avoid having any investment company taxable income or net capital gain (as defined in Sections 852(b)(2) and 1222(11) of the Code, respectively) in the short taxable year ending with its dissolution, Acquired Fund will on or before the Valuation Date (a) declare a dividend in an amount large enough so that Acquired Fund will have declared dividends of substantially all of its investment company taxable income and net capital gain, if any, for such taxable year (determined without regard to any deduction for dividends paid) and (b) distribute such dividend.
1.5 On the Closing Date or as soon as practicable thereafter, Acquired Fund will distribute Acquiring Fund Shares received by Acquired Fund pursuant to paragraph 1.1 pro rata to Acquired Fund's shareholders of record determined as of the close of business on the Valuation Date ("Acquired Fund Shareholders"). Each Acquired Fund Shareholder will receive the class of shares of Acquiring Fund that corresponds to the class of shares of Acquired Fund currently held by that Acquired Fund shareholder. Accordingly, the Acquiring Fund Shares will be distributed as follows: each of the Class I shares of Acquiring Fund will be distributed to holders of Class I shares of Acquired Fund, each of the Class H shares of Acquiring Fund will be distributed to holders of Class A, Class B, Class R and Class W shares of Acquired Fund and each of the Class L shares of Acquiring Fund will be distributed to holders of Class C shares of Acquired Fund. Such distribution will be accomplished by an instruction, signed by Acquired Fund's Secretary, to transfer Acquiring Fund Shares then credited to Acquired Fund's account on the books of Acquiring Fund to open accounts on the books of Acquiring Fund in the names of the Acquired Fund shareholders and representing the respective pro rata number of Acquiring Fund Shares due such Acquired Fund shareholders. All issued and outstanding shares of Acquired Fund simultaneously will be canceled on Acquired Fund's books.
1.6 Ownership of Acquiring Fund Shares will be shown on the books of Acquiring Fund's transfer agent. Acquiring Fund Shares will be issued in the manner described in Acquiring Fund's current Prospectus, as supplemented, and the Company's Statement of Additional Information.
1.7 Any transfer taxes payable upon issuance of Acquiring Fund Shares in a name other than the registered holder of Acquiring Fund Shares on Acquired Fund's books as of the close of business on the Valuation Date shall, as a condition of such issuance and transfer, be paid by the person to whom Acquiring Fund Shares are to be issued and transferred.
1.8 Any reporting responsibility of Acquired Fund is and shall remain the responsibility of Acquired Fund up to and including the date on which Acquired Fund is dissolved and terminated pursuant to paragraph 1.9.
1.9 Within one year after the Closing Date, Acquired Fund shall pay or make provision for the payment of all Acquired Fund's liabilities and taxes. If and to the extent that any trust, escrow account, or other similar entity continues after the close of such one-year period in connection either with making provision for payment of liabilities or taxes or with distributions to shareholders of Acquired Fund, such entity shall either (i) qualify as a liquidating trust under Section 7701 of the Code (and applicable Treasury Regulations thereunder) or other entity which does not constitute a continuation of Acquired Fund for federal income tax purposes, or (ii) be subject to a waiver under Section 368(a)(2)(G)(ii) of the complete distribution requirement of Section 368(a)(2)(G)(i) of the Code. Acquired Fund shall be terminated following the making of all distributions pursuant to paragraph 1.5.
1.10 Copies of all books and records maintained on behalf of Acquired Fund in connection with its obligations under the Investment Company Act of 1940, as amended (the "1940 Act"), the Code, state blue sky laws or otherwise in connection with this Agreement will promptly be delivered after the Closing to officers of Acquiring Fund or their designee, and Acquiring Fund or its designee shall comply with applicable record retention requirements to which Acquired Fund is subject under the 1940 Act.
A-2
2. Valuation
2.1 The value of the Acquired Fund Assets shall be the value of such assets computed as of 4:00 p.m. on the New York Stock Exchange on the third business day following the receipt of the requisite approval of this Agreement by shareholders of Acquired Fund or at such time on such earlier or later date after such approval as may be mutually agreed upon in writing (such time and date being hereinafter called the "Valuation Date"), using the valuation procedures set forth in Acquiring Fund's then current Prospectus, as supplemented, and the Company's Statement of Additional Information.
2.2 The net asset value of an Acquiring Fund Share shall be the net asset value per share computed on the Valuation Date, using the valuation procedures set forth in Acquiring Fund's then current Prospectus, as supplemented, and the Company's Statement of Additional Information.
2.3 The number of Acquiring Fund Shares (including fractional shares, if any) to be issued hereunder shall be determined, with respect to each class, by dividing the aggregate net asset value of each class of Acquired Fund shares (determined in accordance with paragraph 2.1) by the net asset value per share of the corresponding class of shares of Acquiring Fund (determined in accordance with paragraph 2.2).
2.4 All computations of value shall be made by Morgan Stanley Services Company Inc. ("Morgan Stanley Services") in accordance with its regular practice in pricing Acquiring Fund. The Company, on behalf of Acquiring Fund, shall cause Morgan Stanley Services to deliver a copy of Acquiring Fund's valuation report at the Closing.
3. Closing and Closing Date
3.1 The Closing shall take place on the Valuation Date or on the next business day following the Valuation Date (the "Closing Date"). The Closing shall be held as of 9:00 a.m. Eastern time, or at such other time as the parties may agree. The Closing shall be held in a location mutually agreeable to the parties hereto. All acts taking place at the Closing shall be deemed to take place simultaneously as of 9:00 a.m. Eastern time on the Closing Date unless otherwise provided.
3.2 Portfolio securities held by Acquired Fund and represented by a certificate or other written instrument shall be presented by it or on its behalf to State Street Bank and Trust Company (the "Custodian"), as custodian for Acquiring Fund, for examination no later than five business days preceding the Valuation Date. Such portfolio securities (together with any cash or other assets) shall be delivered by Acquired Fund to the Custodian for the account of Acquiring Fund on or before the Closing Date in conformity with applicable custody provisions under the 1940 Act and duly endorsed in proper form for transfer in such condition as to constitute good delivery thereof in accordance with the custom of brokers. The portfolio securities shall be accompanied by all necessary federal and state stock transfer stamps or a check for the appropriate purchase price of such stamps. Portfolio securities and instruments deposited with a securities depository (as defined in Rule 17f-4 under the 1940 Act) shall be delivered on or before the Closing Date by book-entry in accordance with customary practices of such depository and the Custodian. The cash delivered shall be in the form of a Federal Funds wire, payable to the order of "State Street Bank and Trust Company, Custodian for Morgan Stanley Institutional Fund, Inc."
3.3 In the event that on the Valuation Date, (a) the New York Stock Exchange shall be closed to trading or trading thereon shall be restricted or (b) trading or the reporting of trading on such Exchange or elsewhere shall be disrupted so that, in the judgment of both the Company, on behalf of Acquiring Fund, and Acquired Fund accurate appraisal of the value of the net assets of Acquiring Fund or the Acquired Fund Assets is impracticable, the Valuation Date shall be postponed until the first business day after the day when trading shall have been fully resumed without restriction or disruption and reporting shall have been restored.
3.4 If requested, Acquired Fund shall deliver to the Company, on behalf of Acquiring Fund, or its designee (a) at the Closing, a list, certified by Acquired Fund's Secretary, of the names, addresses and taxpayer identification numbers of the Acquired Fund shareholders and the number and percentage ownership of outstanding Acquired Fund shares owned by each such Acquired Fund shareholder, all as of the Valuation Date, and (b) as soon as practicable after the Closing, all original documentation (including Internal Revenue Service forms, certificates,
A-3
certifications and correspondence) relating to the Acquired Fund shareholders' taxpayer identification numbers and their liability for or exemption from back-up withholding. The Company, on behalf of Acquiring Fund, shall issue and deliver to such Secretary a confirmation evidencing delivery of Acquiring Fund Shares to be credited on the Closing Date to Acquired Fund or provide evidence satisfactory to Acquired Fund that such Acquiring Fund Shares have been credited to Acquired Fund's account on the books of Acquiring Fund. At the Closing, each party shall deliver to the other such bills of sale, checks, assignments, share certificates, if any, receipts or other documents as such other party or its counsel may reasonably request.
4. Covenants of Acquiring Fund and Acquired Fund
4.1 Except as otherwise expressly provided herein, the Acquired Fund and the Company, on behalf of Acquiring Fund, will operate in the ordinary course between the date hereof and the Closing Date, it being understood that such ordinary course of business will include customary dividends and other distributions.
4.2 The Company will prepare and file with the Securities and Exchange Commission ("Commission") a registration statement on Form N-14 under the Securities Act of 1933, as amended ("1933 Act"), relating to Acquiring Fund Shares ("Registration Statement"). Acquired Fund, will provide the Proxy Materials as described in paragraph 4.3 below for inclusion in the Registration Statement. The Company, on behalf of the Acquiring Fund, and the Acquired Fund agree that each of Acquired Fund and Acquiring Fund will further provide such other information and documents as are reasonably necessary for the preparation of the Registration Statement.
4.3 Acquired Fund will call a meeting of Acquired Fund's shareholders to consider and act upon this Agreement and to take all other action necessary to obtain approval of the transactions contemplated herein. Acquired Fund will prepare the notice of meeting, form of proxy and proxy statement (collectively, "Proxy Materials") to be used in connection with such meeting; provided that the Company, on behalf of Acquiring Fund, will furnish Acquired Fund with its currently effective prospectus for inclusion in the Proxy Materials and with such other information relating to Acquiring Fund as is reasonably necessary for the preparation of the Proxy Materials.
4.4 Acquired Fund will assist Acquiring Fund in obtaining such information as Acquiring Fund reasonably requests concerning the beneficial ownership of Acquired Fund shares.
4.5 Subject to the provisions of this Agreement, the Company, on behalf of the Acquiring Fund, and the Acquired Fund agree that each respective Fund will take, or cause to be taken, all action, and do or cause to be done, all things reasonably necessary, proper or advisable to consummate and make effective the transactions contemplated by this Agreement.
4.6 Acquired Fund, shall furnish or cause to be furnished to Acquiring Fund within 30 days after the Closing Date a statement of Acquired Fund's assets and liabilities as of the Closing Date, which statement shall be certified by the Acquired Fund's Treasurer and shall be in accordance with generally accepted accounting principles consistently applied. As promptly as practicable, but in any case within 60 days after the Closing Date, Acquired Fund shall furnish Acquiring Fund, in such form as is reasonably satisfactory to Acquiring Fund, a statement certified by the Acquired Fund's Treasurer of Acquired Fund's earnings and profits for federal income tax purposes that will be carried over to Acquiring Fund pursuant to Section 381 of the Code.
4.7 As soon after the Closing Date as is reasonably practicable, the Company (a) shall prepare and file all federal and other tax returns and reports of Acquired Fund required by law to be filed with respect to all periods ending on or before the Closing Date but not theretofore filed and (b) shall pay all federal and other taxes shown as due thereon and/or all federal and other taxes that were unpaid as of the Closing Date, including without limitation, all taxes for which the provision for payment was made as of the Closing Date (as represented in paragraph 5.2(k)).
4.8 The Company agrees to use all reasonable efforts to obtain the approvals and authorizations required by the 1933 Act and the 1940 Act and to make such filings required by the state Blue Sky and securities laws as it may deem appropriate in order to continue the Acquiring Fund's operations after the Closing Date.
A-4
5. Representations and Warranties
5.1 The Company, on behalf of Acquiring Fund, represents and warrants to Acquired Fund, as follows:
(a) Acquiring Fund is a series of the Company, a validly existing Maryland corporation with full power to carry on its business as presently conducted;
(b) The Company is a duly registered, open-end management investment company, and its registration with the Commission as an investment company under the 1940 Act and the registration of its shares under the 1933 Act are in full force and effect;
(c) All of the issued and outstanding shares of Acquiring Fund have been offered and sold in compliance in all material respects with applicable registration requirements of the 1933 Act and state securities laws. Shares of Acquiring Fund are registered in all jurisdictions in which they are required to be registered under state securities laws and other laws, and said registrations, including any periodic reports or supplemental filings, are complete and current, all fees required to be paid have been paid, and Acquiring Fund is not subject to any stop order and is fully qualified to sell its shares in each state in which its shares have been registered;
(d) The current Prospectus of the Acquiring Fund and Statement of Additional Information of the Company conform in all material respects to the applicable requirements of the 1933 Act and the 1940 Act and the regulations thereunder and do not include any untrue statement of a material fact or omit to state any material fact required to be stated therein or necessary to make the statements therein, in light of the circumstances under which they were made, not misleading;
(e) The Company is not in, and the execution, delivery and performance of this Agreement will not result in a, material violation of any provision of its Articles of Incorporation or By-Laws, each as amended, or of any agreement, indenture, instrument, contract, lease or other undertaking to which Acquiring Fund is a party or by which it is bound;
(f) No litigation or administrative proceeding or investigation of or before any court or governmental body is presently pending or, to its knowledge, threatened against the Company, Acquiring Fund or any of their properties or assets which, if adversely determined, would materially and adversely affect Acquiring Fund's financial condition or the conduct of its business; and the Company knows of no facts that might form the basis for the institution of such proceedings and is not a party to or subject to the provisions of any order, decree or judgment of any court or governmental body which materially and adversely affects, or is reasonably likely to materially and adversely affect, its business or its ability to consummate the transactions herein contemplated;
(g) The Statement of Assets and Liabilities, Statement of Operations, Statements of Changes in Net Assets and Financial Highlights for its last completed fiscal year, audited by Ernst & Young LLP (copies of which will be furnished to Acquired Fund), fairly present, in all material respects, Acquiring Fund's financial condition as of such date in accordance with generally accepted accounting principles, and its results of such operations, changes in its net assets and financial highlights for such period, and as of such date there will be no known liabilities of Acquiring Fund (contingent or otherwise) not disclosed therein that would be required in accordance with generally accepted accounting principles to be disclosed therein;
(h) All issued and outstanding Acquiring Fund Shares are, and at the Closing Date will be, duly and validly issued and outstanding, fully paid and non-assessable with no personal liability attaching to the ownership thereof. Acquiring Fund does not have outstanding any options, warrants or other rights to subscribe for or purchase any of its shares;
(i) The execution, delivery and performance of this Agreement have been duly authorized by all necessary action on the part of the Company, and this Agreement constitutes a valid and binding obligation of Acquiring Fund enforceable in accordance with its terms, subject as to enforcement, to bankruptcy, insolvency, reorganization, moratorium and other laws relating to or affecting creditors' rights and to general equity principles. No other consents, authorizations or approvals are necessary in connection with Acquiring Fund's performance of this Agreement;
A-5
�� (j) Acquiring Fund Shares to be issued and delivered to Acquired Fund, for the account of the Acquired Fund shareholders, pursuant to the terms of this Agreement will at the Closing Date have been duly authorized and, when so issued and delivered, will be duly and validly issued Acquiring Fund Shares, and will be fully paid and non-assessable with no personal liability attaching to the ownership thereof;
(k) All material federal and other tax returns and reports of Acquiring Fund required by law to be filed on or before the Closing Date have been filed and are correct, and all federal and other taxes shown as due or required to be shown as due on said returns and reports have been paid or provision has been made for the payment thereof, and to the best of the Company's knowledge, no such return is currently under audit and no assessment has been asserted with respect to any such return;
(l) For each taxable year since its inception, Acquiring Fund has met the requirements of Subchapter M of the Code for qualification and treatment as a "regulated investment company" and neither the execution or delivery of nor the performance of the Company's obligations with respect to Acquiring Fund under this Agreement will adversely affect, and no other events are reasonably likely to occur which will adversely affect, the ability of Acquiring Fund to continue to meet the requirements of Subchapter M of the Code;
(m) Since December 31, 2011, there has been no change by Acquiring Fund in accounting methods, principles, or practices, including those required by generally accepted accounting principles;
(n) The information furnished or to be furnished by the Company on behalf of Acquiring Fund for use in registration statements, proxy materials and other documents which may be necessary in connection with the transactions contemplated hereby shall be accurate and complete in all material respects and shall comply in all material respects with federal securities and other laws and regulations applicable thereto; and
(o) The Proxy Materials to be included in the Registration Statement (only insofar as they relate to Acquiring Fund) will, on the effective date of the Registration Statement and on the Closing Date, not contain any untrue statement of a material fact or omit to state a material fact required to be stated therein or necessary to make the statements therein, in light of the circumstances under which such statements were made, not materially misleading.
5.2 Acquired Fund represents and warrants to the Company, on behalf of Acquiring Fund as follows:
(a) Acquired Fund is a validly existing Massachusetts business trust with full power to carry on its business as presently conducted;
(b) Acquired Fund is a duly registered, open-end management investment company, and its registration with the Commission as an investment company under the 1940 Act and the registration of its shares under the 1933 Act are in full force and effect;
(c) All of the issued and outstanding shares of Acquired Fund have been offered and sold in compliance in all material respects with applicable requirements of the 1933 Act and state securities laws. Shares of Acquired Fund are registered in all jurisdictions in which they are required to be registered and said registrations, including any periodic reports or supplemental filings, are complete and current, all fees required to be paid have been paid, and Acquired Fund is not subject to any stop order and is fully qualified to sell its shares in each state in which its shares have been registered;
(d) The current Prospectus, as supplemented, of Acquired Fund and Statement of Additional Information of Acquired Fund conform in all material respects to the applicable requirements of the 1933 Act and the 1940 Act and the regulations thereunder and do not include any untrue statement of a material fact or omit to state any material fact required to be stated therein or necessary to make the statements therein, in light of the circumstances under which they were made, not misleading;
(e) Acquired Fund is not in, and the execution, delivery and performance of this Agreement will not result in a, material violation of any provision of its Declaration of Trust or By-Laws, each as amended, or of any agreement, indenture, instrument, contract, lease or other undertaking to which Acquired Fund is a party or by which it is bound;
A-6
(f) No litigation or administrative proceeding or investigation of or before any court or governmental body is presently pending or, to its knowledge, threatened against Acquired Fund or any of its properties or assets which, if adversely determined, would materially and adversely affect Acquired Fund's financial condition or the conduct of its business; and Acquired Fund knows of no facts that might form the basis for the institution of such proceedings and is not a party to or subject to the provisions of any order, decree or judgment of any court or governmental body which materially and adversely affects, or is reasonably likely to materially and adversely affect, its business or its ability to consummate the transactions herein contemplated;
(g) The Statement of Assets and Liabilities, Statement of Operations, Statement of Changes in Net Assets and Financial Highlights of Acquired Fund for its last completed fiscal year, audited by Ernst & Young LLP except that the financial information for the Acquired Funds for the fiscal years ended prior to 2011 was audited by the Acquired Funds' prior independent registered public accounting firm (copies of which have been or will be furnished to Acquiring Fund) fairly present, in all material respects, Acquired Fund's financial condition as of such date, and its results of operations, changes in its net assets and financial highlights for such period in accordance with generally accepted accounting principles, and as of such date there were no known liabilities of Acquired Fund (contingent or otherwise) not disclosed therein that would be required in accordance with generally accepted accounting principles to be disclosed therein;
(h) Acquired Fund has no material contracts or other commitments (other than this Agreement) that will be terminated with liability to it prior to the Closing Date;
(i) All issued and outstanding shares of Acquired Fund are, and at the Closing Date will be, duly and validly issued and outstanding, fully paid and non-assessable with no personal liability attaching to the ownership thereof. Acquired Fund does not have outstanding any options, warrants or other rights to subscribe for or purchase any of its shares, nor is there outstanding any security convertible to any of its shares. All such shares will, at the time of Closing, be held by the persons and in the amounts set forth in the list of shareholders submitted to Acquiring Fund pursuant to paragraph 3.4;
(j) The execution, delivery and performance of this Agreement will have been duly authorized prior to the Closing Date by all necessary action on the part of Acquired Fund, and subject to the approval of Acquired Fund's shareholders, this Agreement constitutes a valid and binding obligation of Acquired Fund, enforceable in accordance with its terms, subject as to enforcement to bankruptcy, insolvency, reorganization, moratorium and other laws relating to or affecting creditors' rights and to general equity principles. No other consents, authorizations or approvals are necessary in connection with Acquired Fund's performance of this Agreement;
(k) All material federal and other tax returns and reports of Acquired Fund required by law to be filed on or before the Closing Date shall have been filed and are correct and all federal and other taxes shown as due or required to be shown as due on said returns and reports have been paid or provision has been made for the payment thereof, and to the best of Acquired Fund's knowledge, no such return is currently under audit and no assessment has been asserted with respect to any such return;
(l) For each taxable year since its inception, Acquired Fund has met all the requirements of Subchapter M of the Code for qualification and treatment as a "regulated investment company" and neither the execution or delivery of nor the performance of Acquired Fund's obligations under this Agreement will adversely affect, and no other events are reasonably likely to occur which will adversely affect, the ability of Acquired Fund to continue to meet the requirements of Subchapter M of the Code for its final taxable year ending on the Closing Date;
(m) At the Closing Date, Acquired Fund will have good and valid title to the Acquired Fund Assets, subject to no liens (other than the obligation, if any, to pay the purchase price of portfolio securities purchased by Acquired Fund which have not settled prior to the Closing Date), security interests or other encumbrances, and full right, power and authority to assign, deliver and otherwise transfer such assets hereunder, and upon delivery and payment for such assets, the Company, on behalf of Acquiring Fund, will acquire good and marketable title
A-7
thereto, subject to no restrictions on the full transfer thereof, including any restrictions as might arise under the 1933 Act;
(n) On the effective date of the Registration Statement, at the time of the meeting of Acquired Fund's shareholders and on the Closing Date, the Proxy Materials (exclusive of the currently effective Acquiring Fund Prospectus contained therein) will (i) comply in all material respects with the provisions of the 1933 Act, the Securities Exchange Act of 1934, as amended ("1934 Act"), and the 1940 Act and the regulations thereunder and (ii) not contain any untrue statement of a material fact or omit to state a material fact required to be stated therein or necessary to make the statements therein not misleading. Any other information furnished by Acquired Fund for use in the Registration Statement or in any other manner that may be necessary in connection with the transactions contemplated hereby shall be accurate and complete and shall comply in all material respects with applicable federal securities and other laws and regulations thereunder;
(o) Acquired Fund will, on or prior to the Valuation Date, declare one or more dividends or other distributions to shareholders that, together with all previous dividends and other distributions to shareholders, shall have the effect of distributing to the shareholders all of its investment company taxable income and net capital gain, if any, through the Valuation Date (computed without regard to any deduction for dividends paid);
(p) Acquired Fund has maintained or has caused to be maintained on its behalf all books and accounts as required of a registered investment company in compliance with the requirements of Section 31 of the 1940 Act and the rules thereunder; and
(q) Acquired Fund is not acquiring Acquiring Fund Shares to be issued hereunder for the purpose of making any distribution thereof other than in accordance with the terms of this Agreement.
6. Conditions Precedent to Obligations of Acquired Fund
The obligations of Acquired Fund to consummate the transactions provided for herein shall be subject, at its election, to the performance by the Company, on behalf of Acquiring Fund, of all the obligations to be performed by it hereunder on or before the Closing Date and, in addition thereto, the following conditions:
6.1 All representations and warranties of the Company made on behalf of Acquiring Fund contained in this Agreement shall be true and correct in all material respects as of the date hereof and, except as they may be affected by the transactions contemplated by this Agreement, as of the Closing Date with the same force and effect as if made on and as of the Closing Date;
6.2 The Company, on behalf of Acquiring Fund, shall have delivered to Acquired Fund a certificate of the Company's President and Treasurer, in a form reasonably satisfactory to Acquired Fund and dated as of the Closing Date, to the effect that the representations and warranties of the Company, on behalf of Acquiring Fund, made in this Agreement are true and correct at and as of the Closing Date, except as they may be affected by the transactions contemplated by this Agreement, and as to such other matters as Acquired Fund, shall reasonably request;
6.3 Acquired Fund, shall have received a favorable opinion from Dechert LLP, counsel to Acquiring Fund, dated as of the Closing Date, to the effect that:
(a) Acquiring Fund is a series of the Company, a validly existing Maryland corporation, and has the power to own all of its properties and assets and to carry on its business as presently conducted (Maryland counsel may be relied upon in delivering such opinion); (b) the Company is a duly registered, open-end, management investment company, and its registration with the Commission as an investment company under the 1940 Act is in full force and effect; (c) this Agreement has been duly authorized, executed and delivered by the Company and, assuming that the Registration Statement complies with the 1933 Act, the 1934 Act and the 1940 Act and regulations thereunder and assuming due authorization, execution and delivery of this Agreement by Acquired Fund, is a valid and binding obligation of Acquiring Fund enforceable against Acquiring Fund in accordance with its terms, subject as to enforcement, to bankruptcy, insolvency, reorganization, moratorium and other laws relating to or affecting creditors' rights and to general equity principles; (d) Acquiring Fund Shares to be issued to Acquired Fund shareholders as provided by this Agreement are duly authorized and upon such delivery will be validly issued, fully
A-8
paid and non-assessable, and no shareholder of Acquiring Fund has any preemptive rights to subscription or purchase in respect thereof (Maryland counsel may be relied upon in delivering such opinion); (e) the execution and delivery of this Agreement did not, and the consummation of the transactions contemplated hereby will not, violate the Company's Articles of Incorporation or By-Laws, each as amended; and (f) to the knowledge of such counsel, no consent, approval, authorization or order of any court or governmental authority of the United States or any state is required for the consummation by Acquiring Fund of the transactions contemplated herein, except such as have been obtained under the 1933 Act, the 1934 Act and the 1940 Act and such as may be required under state securities laws; and
6.4 As of the Closing Date, there shall have been no material change in the investment objective, policies and restrictions of Acquiring Fund or any increase in the investment management fees or annual fees pursuant to Acquiring Fund's shareholder services plan from those described in Acquiring Fund's Prospectus dated April 30, 2012, as may be supplemented, and the Company's Statement of Additional Information dated April 30, 2012, as may be supplemented.
7. Conditions Precedent to Obligations of Acquiring Fund
The obligations of the Company, on behalf of Acquiring Fund, to complete the transactions provided for herein shall be subject, at its election, to the performance by Acquired Fund, of all the obligations to be performed by it hereunder on or before the Closing Date and, in addition thereto, the following conditions:
7.1 All representations and warranties of Acquired Fund contained in this Agreement shall be true and correct in all material respects as of the date hereof and, except as they may be affected by the transactions contemplated by this Agreement, as of the Closing Date with the same force and effect as if made on and as of the Closing Date;
7.2 Acquired Fund shall have delivered to Acquiring Fund at the Closing a certificate of Acquired Fund's President and its Treasurer, in form and substance satisfactory to Acquiring Fund and dated as of the Closing Date, to the effect that the representations and warranties of Acquired Fund, made in this Agreement are true and correct at and as of the Closing Date, except as they may be affected by the transactions contemplated by this Agreement, and as to such other matters as the Company, on behalf of Acquiring Fund, shall reasonably request;
7.3 Acquired Fund shall have delivered to Acquiring Fund a statement of the Acquired Fund Assets and its liabilities, together with a list of Acquired Fund's portfolio securities and other assets showing the respective adjusted bases and holding periods thereof for income tax purposes, as of the Closing Date, certified by the Treasurer of the Acquired Fund;
7.4 The Company, on behalf of Acquiring Fund, shall have received at the Closing a favorable opinion from Dechert LLP, counsel to Acquired Fund, dated as of the Closing Date to the effect that:
(a) Acquired Fund is a validly existing Massachusetts business trust, and has the power to own all of its properties and assets and to carry on its business as presently conducted; (b) Acquired Fund is a duly registered, open-end, management investment company under the 1940 Act, and its registration with the Commission as an investment company under the 1940 Act is in full force and effect; (c) this Agreement has been duly authorized, executed and delivered by Acquired Fund, and, assuming that the Registration Statement complies with the 1933 Act, the 1934 Act and the 1940 Act and the regulations thereunder and assuming due authorization, execution and delivery of this Agreement by the Company, on behalf of Acquiring Fund, is a valid and binding obligation of Acquired Fund enforceable against Acquired Fund in accordance with its terms, subject as to enforcement, to bankruptcy, insolvency, reorganization, moratorium and other laws relating to or affecting creditors' rights and to general equity principles; (d) the execution and delivery of this Agreement did not, and the consummation of the transactions contemplated hereby will not, violate Acquired Fund's Declaration of Trust or By-Laws, each as amended; and (e) to the knowledge of such counsel, no consent, approval, authorization or order of any court or governmental authority of the United States or any state is required for the consummation by Acquired Fund of the transactions contemplated herein, except such as have been obtained under the 1933 Act, the 1934 Act and the 1940 Act and such as may be required under state securities laws; and
A-9
7.5 On the Closing Date, the Acquired Fund Assets shall include no assets that the Acquiring Fund, by reason of limitations of the Acquired Fund's Declaration of Trust, as amended, or otherwise, may not properly acquire.
8. Further Conditions Precedent to Obligations of Acquiring Fund and Acquired Fund
The obligations of Acquired Fund and the Company, on behalf of Acquiring Fund, hereunder are each subject to the further conditions that on or before the Closing Date:
8.1 This Agreement and the transactions contemplated herein shall have been approved by the requisite vote of the holders of the outstanding shares of Acquired Fund in accordance with the provisions of Acquired Fund's Declaration of Trust, as amended, and certified copies of the resolutions evidencing such approval shall have been delivered to Acquiring Fund;
8.2 On the Closing Date, no action, suit or other proceeding shall be pending before any court or governmental agency in which it is sought to restrain or prohibit, or obtain damages or other relief in connection with, this Agreement or the transactions contemplated herein;
8.3 All consents of other parties and all other consents, orders and permits of federal, state and local regulatory authorities (including those of the Commission and of state Blue Sky and securities authorities, including "no-action" positions of and exemptive orders from such federal and state authorities) deemed necessary by the Company, on behalf of Acquiring Fund, or Acquired Fund to permit consummation, in all material respects, of the transactions contemplated herein shall have been obtained, except where failure to obtain any such consent, order or permit would not involve risk of a material adverse effect on the assets or properties of Acquiring Fund or Acquired Fund;
8.4 The Registration Statement shall have become effective under the 1933 Act, no stop orders suspending the effectiveness thereof shall have been issued and, to the best knowledge of the parties hereto, no investigation or proceeding for that purpose shall have been instituted or be pending, threatened or contemplated under the 1933 Act;
8.5 Acquired Fund, shall have declared and paid a dividend or dividends and/or other distribution or distributions that, together with all previous such dividends or distributions, shall have the effect of distributing to the Acquired Fund shareholders all of Acquired Fund's investment company taxable income (computed without regard to any deduction for dividends paid) and all of its net capital gain (after reduction for any capital loss carry-forward and computed without regard to any deduction for dividends paid) for all taxable years ending on or before the Closing Date; and
8.6 The parties shall have received the opinion of the law firm of Dechert LLP (based on certain facts, assumptions and representations), addressed to Acquiring Fund and Acquired Fund, which opinion may be relied upon by the shareholders of Acquired Fund, substantially to the effect that, for federal income tax purposes:
(a) The transfer of substantially all of Acquired Fund's assets in exchange solely for Acquiring Fund Shares and the assumption by Acquiring Fund of certain stated liabilities of Acquired Fund followed by the distribution by Acquired Fund of Acquiring Fund Shares to the Acquired Fund shareholders in exchange for their Acquired Fund shares pursuant to and in accordance with the terms of the Reorganization Agreement will constitute a "reorganization" within the meaning of Section 368(a)(1)(C) of the Code;
(b) No gain or loss will be recognized by Acquiring Fund upon the receipt of the assets of Acquired Fund solely in exchange for Acquiring Fund Shares and the assumption by Acquiring Fund of the stated liabilities of Acquired Fund;
(c) No gain or loss will be recognized by Acquired Fund upon the transfer of substantially all of the assets of Acquired Fund to Acquiring Fund in exchange solely for Acquiring Fund Shares and the assumption by Acquiring Fund of the stated liabilities or upon the distribution of Acquiring Fund Shares to the Acquired Fund shareholders in exchange for their Acquired Fund shares, except that Acquired Fund may be required to recognize
A-10
gain or loss with respect to contracts described in Section 1256(b) of the Code or stock in a passive foreign investment company, as defined in Section 1297(a) of the Code;
(d) No gain or loss will be recognized by the Acquired Fund shareholders upon the exchange of the Acquired Fund shares for Acquiring Fund Shares;
(e) The aggregate tax basis for Acquiring Fund Shares received by each Acquired Fund shareholder pursuant to the reorganization will be the same as the aggregate tax basis of the Acquired Fund shares held by each such Acquired Fund shareholder immediately prior to the Reorganization;
(f) The holding period of Acquiring Fund Shares to be received by each Acquired Fund shareholder will include the period during which the Acquired Fund shares surrendered in exchange therefor were held (provided such Acquired Fund shares were held as capital assets on the date of the Reorganization);
(g) The tax basis of the assets of Acquired Fund acquired by Acquiring Fund will be the same as the tax basis of such assets to Acquired Fund in exchange therefor; and
(h) The holding period of the assets of Acquired Fund in the hands of Acquiring Fund will include the period during which those assets were held by Acquired Fund (except where the investment activities of Acquiring Fund have the effect of reducing or eliminating such periods with respect to an asset).
Notwithstanding anything herein to the contrary, neither the Company, on behalf of Acquiring Fund, nor Acquired Fund, may waive the conditions set forth in this paragraph 8.6.
9. Fees and Expenses
9.1 (a) Acquired Fund shall bear expenses incurred in connection with the entering into, and carrying out of, the provisions of this Agreement, including printing, filing and proxy solicitation expenses, legal, accounting, Commission registration fees and Blue Sky expenses.
(b) In the event the transactions contemplated herein are not consummated by reason of Acquired Fund being either unwilling or unable to go forward (other than by reason of the non-fulfillment or failure of any condition to Acquired Fund's obligations specified in this Agreement), Acquired Fund's only obligation hereunder shall be to reimburse Acquiring Fund for all reasonable out-of-pocket fees and expenses incurred by Acquiring Fund in connection with those transactions.
(c) In the event the transactions contemplated herein are not consummated by reason of Acquiring Fund being either unwilling or unable to go forward (other than by reason of the non-fulfillment or failure of any condition to Acquiring Fund's obligations specified in this Agreement), Acquiring Fund's only obligation hereunder shall be to reimburse Acquired Fund for all reasonable out-of-pocket fees and expenses incurred by Acquired Fund in connection with those transactions.
10. Entire Agreement; Survival of Warranties
10.1 This Agreement constitutes the entire agreement between the parties.
10.2 The representations, warranties and covenants contained in this Agreement or in any document delivered pursuant hereto or in connection herewith shall survive the consummation of the transactions contemplated herein, except that the representations, warranties and covenants of Acquired Fund hereunder shall not survive the dissolution and complete liquidation of Acquired Fund in accordance with paragraph 1.9.
11. Termination
11.1 This Agreement may be terminated and the transactions contemplated hereby may be abandoned at any time prior to the Closing:
(a) by the mutual written consent of Acquired Fund and the Company, on behalf of Acquiring Fund;
A-11
(b) by either the Company, on behalf of Acquiring Fund, or Acquired Fund, by notice to the other, without liability to the terminating party on account of such termination (providing the terminating party is not otherwise in material default or breach of this Agreement), if the Closing shall not have occurred on or before June 28, 2013; or
(c) by either the Company, on behalf of Acquiring Fund, or Acquired Fund, in writing without liability to the terminating party on account of such termination (provided the terminating party is not otherwise in material default or breach of this Agreement), if (i) the other party shall fail to perform in any material respect its agreements contained herein required to be performed on or prior to the Closing Date, (ii) the other party materially breaches any of its representations, warranties or covenants contained herein, (iii) the Acquired Fund shareholders fail to approve this Agreement at any meeting called for such purpose at which a quorum was present or (iv) any other condition herein expressed to be precedent to the obligations of the terminating party has not been met and it reasonably appears that it will not or cannot be met.
11.2 (a) Termination of this Agreement pursuant to paragraphs 11.1(a) or (b) shall terminate all obligations of the parties hereunder and there shall be no liability for damages on the part of the Company, Acquiring Fund or Acquired Fund, or the directors or officers of the Company, on behalf of Acquiring Fund, or the trustees or officers of the Acquired Fund, to any other party or its directors, trustees or officers.
(b) Termination of this Agreement pursuant to paragraph 11.1(c) shall terminate all obligations of the parties hereunder and there shall be no liability for damages on the part of the Company, Acquiring Fund or Acquired Fund, or the directors or officers of the Company, on behalf of Acquiring Fund, or the trustees or officers of Acquired Fund, except that any party in breach of this Agreement shall, upon demand, reimburse the non-breaching party for all reasonable out-of-pocket fees and expenses incurred in connection with the transactions contemplated by this Agreement, including legal, accounting and filing fees.
12. Amendments
This Agreement may be amended, modified or supplemented in such manner as may be mutually agreed upon in writing by the parties.
13. Miscellaneous
13.1 The article and paragraph headings contained in this Agreement are for reference purposes only and shall not affect in any way the meaning or interpretation of this Agreement.
13.2 This Agreement may be executed in any number of counterparts, each of which shall be deemed an original.
13.3 This Agreement shall be governed by and construed in accordance with the laws of the State of New York.
13.4 This Agreement shall bind and inure to the benefit of the parties hereto and their respective successors and assigns, but no assignment or transfer hereof or of any rights or obligations hereunder shall be made by any party without the written consent of the other party. Nothing herein expressed or implied is intended or shall be construed to confer upon or give any person, firm or corporation, other than the parties hereto and their respective successors and assigns, any rights or remedies hereunder or by reason of this Agreement.
13.5 The obligations and liabilities of Acquiring Fund hereunder are solely those of Acquiring Fund. It is expressly agreed that no shareholder, nominee, director, officer, agent, or employee of Acquiring Fund, or the directors or officers of the Company, acting on behalf of Acquiring Fund, shall be personally liable hereunder. The execution and delivery of this Agreement have been authorized by the directors of Acquiring Fund and signed by authorized officers of the Company, acting on behalf of Acquiring Fund, and neither such authorization by such directors nor such execution and delivery by such officers shall be deemed to have been made by any of them individually or to impose any liability on any of them personally.
A-12
13.6 The obligations and liabilities of Acquired Fund hereunder are solely those of Acquired Fund. It is expressly agreed that no shareholder, nominee, trustee, officer, agent, or employee of Acquired Fund, or the trustees or officers of Acquired Fund shall be personally liable hereunder. The execution and delivery of this Agreement have been authorized by the trustees of the Acquired Fund and signed by authorized officers of the Acquired Fund, and neither such authorization by such directors nor such execution and delivery by such officers shall be deemed to have been made by any of them individually or to impose any liability on any of them personally.
IN WITNESS WHEREOF, each of the parties hereto has caused this Agreement to be executed by a duly authorized officer.
MORGAN STANLEY INSTITUTIONAL FUND, INC.,
on behalf of the Acquiring Fund | |
|
By:
Name:
Title: | |
|
| ACQUIRED FUND | |
|
By:
Name:
Title: | |
|
A-13
Prospectus Supplement
June 12, 2012
Morgan Stanley Institutional Fund, Inc.
Supplement dated June 12, 2012 to the Morgan Stanley Institutional Fund, Inc. (the "Fund") Prospectus dated April 30, 2012 of:
Active International Allocation Portfolio
International Equity Portfolio
On June 15, 2012, the Fund will commence offering Class H and Class L shares of each of the Active International Allocation Portfolio and International Equity Portfolio. As a result, effective June 15, 2012, the Prospectus is revised as follows:
The first paragraph under the section entitled "Portfolio Summary—Active International Allocation Portfolio—Purchase and Sale of Fund Shares" is hereby deleted in its entirety.
The first paragraph under the section entitled "Portfolio Summary—International Equity Portfolio—Purchase and Sale of Fund Shares" is hereby deleted in its entirety.
The first paragraph under the section entitled "Shareholder Information—How To Purchase Class I, Class P and Class L Shares" is hereby deleted in its entirety.
The first paragraph under the section entitled "Shareholder Information—How To Purchase Class H Shares" is hereby deleted in its entirety.
Please retain this supplement for future reference.
MSIGLINSPT2 6/12
INVESTMENT MANAGEMENT

Morgan Stanley
Institutional Fund, Inc.

Non U.S. and Global Portfolios
Active International Allocation Portfolio
Asian Equity Portfolio
Emerging Markets Portfolio
Global Franchise Portfolio
International Equity Portfolio
International Small Cap Portfolio
Select Global Infrastructure Portfolio
| | | Share Class and Ticker Symbol | |
| Portfolio | | Class I | | Class P | | Class H | | Class L | |
| Active International Allocation Portfolio | | MSACX | | MSIBX | | MSAHX | | MSLLX | |
|
| Asian Equity Portfolio | | MEQIX | | MEQPX | | MEQHX | | MEQLX | |
|
| Emerging Markets Portfolio | | MGEMX | | MMKBX | | MSMHX | | MSELX | |
|
| Global Franchise Portfolio | | MSFAX | | MSFBX | | MSIHX | | MSFLX | |
|
| International Equity Portfolio | | MSIQX | | MIQBX | | MSQHX | | MSQLX | |
|
| International Small Cap Portfolio | | MSISX | | MSCPX | | MSCHX | | MSNLX | |
|
| Select Global Infrastructure Portfolio | | MTIIX | | MTIPX | | MTIHX | | MTILX | |
|
Prospectus
April 30, 2012

The Securities and Exchange Commission ("SEC") has not approved or disapproved these securities or passed upon the adequacy of this Prospectus. Any representation to the contrary is a criminal offense.
Table of Contents
| | | Page | |
| Portfolio Summary | |
|
| Active International Allocation Portfolio | | | 1 | | |
|
| Asian Equity Portfolio | | | 5 | | |
|
| Emerging Markets Portfolio | | | 9 | | |
|
| Global Franchise Portfolio | | | 13 | | |
|
| International Equity Portfolio | | | 17 | | |
|
| International Small Cap Portfolio | | | 21 | | |
|
| Select Global Infrastructure Portfolio | | | 25 | | |
|
| Details of the Portfolios | | | |
|
| Active International Allocation Portfolio | | | 29 | | |
|
| Asian Equity Portfolio | | | 31 | | |
|
| Emerging Markets Portfolio | | | 33 | | |
|
| Global Franchise Portfolio | | | 35 | | |
|
| International Equity Portfolio | | | 37 | | |
|
| International Small Cap Portfolio | | | 39 | | |
|
| Select Global Infrastructure Portfolio | | | 41 | | |
|
Additional Information about the Portfolios' Investment
Strategies and Related Risks | | | 44 | | |
|
| Fund Management | | | 48 | | |
|
| Shareholder Information | | | 51 | | |
|
| Financial Highlights | | | 59 | | |
|
| Active International Allocation Portfolio | | | 59 | | |
|
| Asian Equity Portfolio | | | 61 | | |
|
| Emerging Markets Portfolio | | | 65 | | |
|
| Global Franchise Portfolio | | | 67 | | |
|
| International Equity Portfolio | | | 69 | | |
|
| International Small Cap Portfolio | | | 71 | | |
|
| Select Global Infrastructure Portfolio | | | 73 | | |
|
Morgan Stanley Institutional Fund, Inc. Prospectus
Portfolio Summary
Active International Allocation Portfolio
Objective
The Active International Allocation Portfolio seeks long-term capital appreciation by investing primarily, in accordance with country and sector weightings determined by the Adviser, Morgan Stanley Investment Management Inc., in equity securities of non-U.S. issuers which, in the aggregate, replicate broad market indices.
Fees and Expenses
The table below describes the fees and expenses that you may pay if you buy and hold shares of the Portfolio. For shareholders of Class H shares, you may qualify for sales charge discounts if the cumulative net asset value ("NAV") of Class H shares of the Portfolio purchased in a single transaction, together with the NAV of all Class H shares of a portfolio of Morgan Stanley Institutional Fund, Inc. (the "Fund") or of a portfolio of Morgan Stanley Institutional Fund Trust held in related accounts, amounts to $50,000 or more. More information about these and other discounts is available from your financial adviser and in the "Shareholder Information—How To Purchase Class H Shares" section on page 52 of this Prospectus.
Shareholder Fees (fees paid directly from your investment)
| | | Class I | | Class P | | Class H | | Class L | |
Maximum
sales charge
(load)
imposed on
purchases
(as a
percentage
of offering
price) | | | None | | | | None | | | | 4.75 | %† | | | None | | |
Redemption
Fee (as a
percentage
of the amount
redeemed on
redemptions
made within
30 days of
purchase) | | | 2.00 | % | | | 2.00 | % | | | 2.00 | % | | | 2.00 | % | |
Annual Portfolio Operating Expenses (expenses that you pay each year as a percentage of the value of your investment)
| | | Class I | | Class P | | Class H | | Class L | |
| Advisory Fee | | | 0.65 | % | | | 0.65 | % | | | 0.65 | % | | | 0.65 | % | |
Distribution
and/or
Service (12b-1)
Fee | | | None | | | | 0.25 | % | | | 0.25 | % | | | 0.75 | % | |
Other
Expenses | | | 0.30 | % | | | 0.30 | % | | | 0.30 | %‡ | | | 0.30 | %‡ | |
Total Annual
Portfolio
Operating
Expenses* | | | 0.95 | % | | | 1.20 | % | | | 1.20 | % | | | 1.70 | % | |
| | | Class I | | Class P | | Class H | | Class L | |
Fee Waiver
and/or Expense
Reimbursement* | | | 0.05 | % | | | 0.05 | % | | | 0.05 | % | | | 0.05 | % | |
Total Annual
Portfolio
Operating
Expenses After
Fee Waiver
and/or Expense
Reimbursement* | | | 0.90 | % | | | 1.15 | % | | | 1.15 | % | | | 1.65 | % | |
Example
The example below is intended to help you compare the cost of investing in the Portfolio with the cost of investing in other mutual funds.
The example assumes that you invest $10,000 in the Portfolio, your investment has a 5% return each year and that the Portfolio's operating expenses remain the same. Although your actual costs may be higher or lower, based on these assumptions your costs would be:
| | | 1 Year | | 3 Years | | 5 Years | | 10 Years | |
| Class I | | $ | 92 | | | $ | 287 | | | $ | 498 | | | $ | 1,108 | | |
| Class P | | $ | 117 | | | $ | 365 | | | $ | 633 | | | $ | 1,398 | | |
| Class H | | $ | 587 | | | $ | 823 | | | $ | 1,078 | | | $ | 1,806 | | |
| Class L | | $ | 168 | | | $ | 520 | | | $ | 898 | | | $ | 1,955 | | |
† The sales charge is calculated as a percentage of the offering price. The sales charge is reduced for purchases of $50,000 and over. See "Shareholder Information—How To Purchase Class H Shares."
‡ Other expenses have been estimated for the Portfolio's Class H and Class L shares for the current fiscal year.
* The Adviser has agreed to reduce its advisory fee and/or reimburse the Portfolio so that Total Annual Portfolio Operating Expenses, excluding certain investment related expenses, will not exceed 0.90% for Class I, 1.15% for Class P, 1.15% for Class H and 1.65% for Class L. The fee waivers and/or expense reimbursements will continue for at least one year or until such time as the Fund's Board of Directors acts to discontinue all or a portion of such waivers and/or reimbursements when it deems such action is appropriate.
Portfolio Turnover
The Portfolio pays transaction costs, such as commissions, when it buys and sells securities (or "turns over" its portfolio). A higher portfolio turnover rate may indicate higher transaction costs and may result in higher taxes when Portfolio shares are held in a taxable account. These costs, which are not reflected in Total Annual Portfolio Operating Expenses or in the Example, affect Portfolio performance. During the most recent fiscal year, the Portfolio's portfolio turnover rate was 26% of the average value of its portfolio.
Principal Investment Strategies
The Adviser seeks to maintain a diversified portfolio of international equity securities based on a top-down approach that emphasizes region, country, sector and
1
Active International Allocation Portfolio (Cont'd)
industry selection and weighting rather than individual stock selection. The Adviser seeks to capitalize on the significance of region, country, sector and industry selection in international equity portfolio returns by over and underweighting countries and/or sectors based primarily on three factors: (i) valuation; (ii) dynamics/fundamental change; and (iii) market momentum/technicals.
The Adviser's Active International Allocation team analyzes both the global economic environment and the economies of countries throughout the world, focusing mainly on the industrialized countries comprising the MSCI Europe, Australasia, Far East Index (the "MSCI EAFE Index"). The Adviser—on an ongoing basis—establishes the proportion or weighting for each region, country, sector and/or industry (e.g., overweight, underweight or neutral) relative to the MSCI EAFE Index and within each region, country, sector and/or industry, will try to broadly replicate, in the aggregate, the performance of a broad local market index by investing in "baskets" of common stocks and other equity securities. In most cases, the local MSCI index for that country will be one of the broad local market indices. The equity securities in which the Portfolio may invest include common stock, preferred stock, convertible securities, depositary receipts, rights and warrants.
The Portfolio may invest in emerging market or developing countries and, with regard to such investments, may make global, regional and sector allocations to emerging markets, as well as allocations to specific emerging market or developing countries. The Portfolio may also use derivative instruments as discussed below. These derivative instruments used by the Portfolio will be counted toward the Portfolio's exposure in the types of securities listed above to the extent they have economic characteristics similar to such securities. The Adviser generally considers selling an investment when it determines the company no longer satisfies its investment criteria.
The Portfolio may, but it is not required to, use derivative instruments for a variety of purposes, including hedging, risk management, portfolio management or to earn income. The Portfolio's use of derivatives may involve the purchase and sale of derivative instruments such as futures, options, swaps and contracts for difference ("CFDs"), and other related instruments and techniques. The Portfolio may utilize foreign currency forward exchange contracts, which are also derivatives, in connection with its investments in foreign securities.
Principal Risks
There is no assurance that the Portfolio will achieve its investment objective and you can lose money investing in this Portfolio. The principal risks of investing in the Portfolio include:
• Equity Securities. In general, prices of equity securities are more volatile than those of fixed income securities. The prices of equity securities will rise and fall in response to a number of different factors, including events that affect particular issuers as well as events that affect entire financial markets or industries. To the extent that the Portfolio invests in convertible securities, and the convertible security's investment value is greater than its conversion value, its price will be likely to increase when interest rates fall and decrease when interest rates rise. If the conversion value exceeds the investment value, the price of the convertible security will tend to fluctuate directly with the price of the underlying equity security.
• Foreign and Emerging Market Securities. Investments in foreign markets entail special risks such as currency, political, economic and market risks. There also may be greater market volatility, less reliable financial information, higher transaction and custody costs, decreased market liquidity and less government and exchange regulation associated with investments in foreign markets. In addition, investments in certain foreign markets, which have historically been considered stable, may become more volatile and subject to increased risk due to ongoing developments and changing conditions in such markets. Moreover, the growing interconnectivity of global economies and financial markets has increased the probability that adverse developments and conditions in one country or region will affect the stability of economies and financial markets in other countries or regions. The risks of investing in emerging market countries are greater than risks associated with investments in foreign developed countries. In addition, the Portfolio's investments may be denominated in foreign currencies and therefore, changes in the value of a country's currency compared to the U.S. dollar may affect the value of the Portfolio's investments. Hedging the Portfolio's currency risks through foreign currency forward exchange contracts involves the risk of mismatching the Portfolio's objectives under a foreign currency forward exchange contract with the value of securities denominated in a particular currency. There is additional risk that such transactions reduce or preclude the opportunity for gain and that currency contracts create exposure to currencies in which the Portfolio's securities are not denominated. The use of foreign currency forward exchange contracts involves the risk of loss from the insolvency or bankruptcy of the counterparty to the contract or the failure of the counterparty to make payments or otherwise comply with the terms of the contract.
• Derivatives Risk. A derivative instrument often has risks similar to its underlying asset and may have additional risks, including imperfect correlation between the value of the derivative and the underlying asset, risks of default by the counterparty to certain transactions, magnification of losses incurred due to changes in the market value of the securities, instruments, indices or interest rates to which they relate and risks that the transactions may not be liquid. Certain derivative transactions may give rise to a form of leverage. Leverage magnifies the potential for gain and the risk of loss.
2
Morgan Stanley Institutional Fund, Inc. Prospectus
Portfolio Summary
Active International Allocation Portfolio (Cont'd)
Shares of the Portfolio are not bank deposits and are not guaranteed or insured by the Federal Deposit Insurance Corporation or any other government agency.
Performance Information
The bar chart and table below provide some indication of the risks of investing in the Portfolio by showing changes in the Portfolio's Class I shares' performance from year-to-year and by showing how the Portfolio's average annual returns for the past one, five and 10 year periods compare with those of a broad measure of market performance, as well as an index that represents a group of similar mutual funds, over time. The performance of the other Classes will differ because the Classes have different ongoing fees. The Portfolio's past performance, before and after taxes, is not necessarily an indication of how the Portfolio will perform in the future. Updated performance information is available online at www.morganstanley.com/im.
Annual Total Returns—Calendar Years
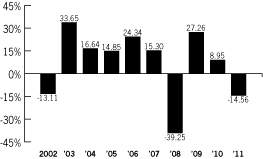
| High Quarter | | 6/30/09 | | | 24.16 | % | |
|
| Low Quarter | | 9/30/11 | | | –20.43 | % | |
|
Average Annual Total Returns
(for the calendar periods ended December 31, 2011)
| | | Past
One Year | | Past
Five Years | | Past
Ten Years | |
| Class I | | | | | | | |
| Return before Taxes | | | –14.56 | % | | | –3.66 | % | | | 4.84 | % | |
Return after Taxes on
Distributions | | | –14.79 | % | | | –4.32 | % | | | 4.22 | % | |
Return after Taxes on
Distributions and Sale of
Portfolio Shares | | | –9.03 | % | | | –3.03 | % | | | 4.13 | % | |
| Class P | | | | | | | |
| Return before Taxes | | | –14.75 | % | | | –3.90 | % | | | 4.57 | % | |
| Class H* | |
| Return before Taxes | | | N/A | | | | N/A | | | | N/A | | |
| Class L* | |
| Return before Taxes | | | N/A | | | | N/A | | | | N/A | | |
MSCI EAFE Index (reflects
no deduction for fees,
expenses or taxes)1 | | | –12.14 | % | | | –4.72 | % | | | 4.67 | % | |
Lipper International
Large-Cap Core Funds
Index (reflects no
deduction for taxes)2 | | | –13.56 | % | | | –4.96 | % | | | 3.91 | % | |
* As of December 31, 2011, the Fund had not commenced offering Class H and Class L shares of the Portfolio. The returns for Class H and Class L shares would be lower than the returns for Class I shares of the Portfolio as expenses of Class H and Class L are higher. Return information for the Portfolio's Class H and Class L shares will be shown in future prospectuses offering the Portfolio's Class H and Class L shares after the Portfolio's Class H and Class L shares have a full calendar year of return information to report.
1 The Morgan Stanley Capital International (MSCI) EAFE Index (Europe, Australasia, Far East) is a free float-adjusted market capitalization index that is designed to measure the international equity market performance of developed markets, excluding the United States and Canada. The term "free float" represents the portion of shares outstanding that are deemed to be available for purchase in the public equity markets by investors. The MSCI EAFE Index currently consists of 22 developed market country indices. The performance of the Index is listed in U.S. dollars and assumes reinvestment of net dividends. "Net dividends" reflects a reduction in dividends after taking into account withholding of taxes by certain foreign countries represented in the Index. It is not possible to invest directly in an index.
2 The Lipper International Large-Cap Core Funds Index is an equally weighted performance index of the largest qualifying funds (based on net assets) in the Lipper International Large-Cap Core Funds classification. There are currently 30 funds represented in this Index.
The after-tax returns shown in the table above are calculated using the historical highest individual federal marginal income tax rates during the period shown and do not reflect the impact of state and local taxes. After-tax returns for the Portfolio's other Classes will vary from Class I shares' returns. Actual after-tax returns depend on the investor's tax situation and may differ from those shown, and after-tax returns are not relevant to investors who hold their Portfolio shares through tax deferred arrangements such as 401(k) plans or individual retirement accounts. After-tax returns may be higher than before-tax returns due to an assumed benefit from capital losses that would have been realized had Portfolio shares been sold at the end of the relevant periods, as applicable.
Adviser. Morgan Stanley Investment Management Inc.
Portfolio Managers. The Portfolio is managed by members of the Active International Allocation team. Information about the member primarily responsible for the day-to-day management of the Portfolio is shown below:
| Name | | Title with
Adviser | | Date Began
Managing
Portfolio | |
| Ann D. Thivierge | | Managing Director | | June 1995 | |
|
Purchase and Sale of Fund Shares
The Fund is not currently offering Class H and Class L shares of the Portfolio. The Fund may commence offering Class H and Class L shares of the Portfolio in the future. Any such offerings of the Portfolio's Class H and Class L
3
Active International Allocation Portfolio (Cont'd)
shares may commence and terminate without any prior notice.
The minimum initial investment generally is $5,000,000 for Class I shares, $1,000,000 for Class P shares and $25,000 for each of Class H and Class L shares of the Portfolio. The minimum initial investment will be waived for certain investments. For more information, please refer to the "Shareholder Information—How To Purchase Class I, Class P and Class L Shares" and "—How To Purchase Class H Shares" sections beginning on pages 51 and 52, respectively, of this Prospectus.
Class I, Class P and Class L shares of the Portfolio may be purchased or sold on any day the New York Stock Exchange ("NYSE") is open for business directly through the Fund by mail (c/o Morgan Stanley Services Company Inc., P.O. Box 219804, Kansas City, MO 64121-9804) or by telephone (1-800-548-7786) or by contacting your financial intermediary.
For more information, please refer to the "Shareholder Information—How To Purchase Class I, Class P and Class L Shares" and "—How To Redeem Class I, Class P and Class L Shares" sections beginning on pages 51 and 54, respectively, of this Prospectus.
Class H shares of the Portfolio may be purchased or redeemed by contacting your authorized financial representative.
Tax Information
The Portfolio intends to make distributions that may be taxed as ordinary income or capital gains, unless you are investing through a tax-deferred arrangement, such as a 401(k) plan or an individual retirement account.
Payments to Broker-Dealers and Other Financial Intermediaries
If you purchase the Portfolio through a broker-dealer or other financial intermediary (such as a bank), the Adviser and/or the Portfolio's "Distributor," Morgan Stanley Distribution, Inc., may pay the intermediary for the sale of Portfolio shares and related services. These payments, which may be significant in amount, may create a conflict of interest by influencing the broker-dealer or other intermediary and your salesperson to recommend the Portfolio over another investment. Ask your salesperson or visit your financial intermediary's web site for more information.
4
Morgan Stanley Institutional Fund, Inc. Prospectus
Portfolio Summary
Asian Equity Portfolio
Objective
The Asian Equity Portfolio seeks long-term capital appreciation.
Fees and Expenses
The table below describes the fees and expenses that you may pay if you buy and hold shares of the Portfolio. For shareholders of Class H shares, you may qualify for sales charge discounts if the cumulative net asset value ("NAV") of Class H shares of the Portfolio purchased in a single transaction, together with the NAV of all Class H shares of a portfolio of Morgan Stanley Institutional Fund, Inc. (the "Fund") or of a portfolio of Morgan Stanley Institutional Fund Trust held in related accounts, amounts to $50,000 or more. More information about these and other discounts is available from your financial adviser and in the "Shareholder Information—How To Purchase Class H Shares" section on page 52 of this Prospectus.
Shareholder Fees (fees paid directly from your investment)
| | | Class I | | Class P | | Class H | | Class L | |
Maximum
sales charge
(load)
imposed on
purchases
(as a
percentage
of offering
price) | | | None | | | | None | | | | 4.75 | %† | | | None | | |
Redemption
Fee (as a
percentage
of the amount
redeemed on
redemptions
made within
30 days of
purchase) | | | 2.00 | % | | | 2.00 | % | | | 2.00 | % | | | 2.00 | % | |
Annual Portfolio Operating Expenses (expenses that you pay each year as a percentage of the value of your investment)
| | | Class I | | Class P | | Class H | | Class L | |
| Advisory Fee | | | 0.95 | % | | | 0.95 | % | | | 0.95 | % | | | 0.95 | % | |
Distribution
and/or
Service (12b-1)
Fee | | | None | | | | 0.25 | % | | | 0.25 | % | | | 0.75 | % | |
Other
Expenses | | | 10.91 | % | | | 10.91 | % | | | 10.91 | % | | | 10.91 | % | |
Total Annual
Portfolio
Operating
Expenses* | | | 11.86 | % | | | 12.11 | % | | | 12.11 | % | | | 12.61 | % | |
Fee Waiver
and/or Expense
Reimbursement* | | | 10.41 | % | | | 10.41 | % | | | 10.41 | % | | | 10.41 | % | |
Total Annual
Portfolio
Operating
Expenses After
Fee Waiver
and/or Expense
Reimbursement* | | | 1.45 | % | | | 1.70 | % | | | 1.70 | % | | | 2.20 | % | |
Example
The example below is intended to help you compare the cost of investing in the Portfolio with the cost of investing in other mutual funds.
The example assumes that you invest $10,000 in the Portfolio, your investment has a 5% return each year and that the Portfolio's operating expenses remain the same. Although your actual costs may be higher or lower, based on these assumptions your costs would be:
| | | 1 Year | | 3 Years | | 5 Years | | 10 Years | |
| Class I | | $ | 148 | | | $ | 459 | | | $ | 792 | | | $ | 1,735 | | |
| Class P | | $ | 173 | | | $ | 536 | | | $ | 923 | | | $ | 2,009 | | |
| Class H | | $ | 640 | | | $ | 985 | | | $ | 1,354 | | | $ | 2,388 | | |
| Class L | | $ | 223 | | | $ | 688 | | | $ | 1,180 | | | $ | 2,534 | | |
† The sales charge is calculated as a percentage of the offering price. The sales charge is reduced for purchases of $50,000 and over. See "Shareholder Information—How To Purchase Class H Shares."
* The Portfolio's "Adviser," Morgan Stanley Investment Management Inc., has agreed to reduce its advisory fee and/or reimburse the Portfolio so that Total Annual Portfolio Operating Expenses, excluding certain investment related expenses, will not exceed 1.45% for Class I, 1.70% for Class P, 1.70% for Class H and 2.20% for Class L. The fee waivers and/or expense reimbursements will continue for at least one year or until such time as the Fund's Board of Directors acts to discontinue all or a portion of such waivers and/or reimbursements when it deems such action is appropriate.
Portfolio Turnover
The Portfolio pays transaction costs when it buys and sells securities (or "turns over" its portfolio). A higher portfolio turnover rate may indicate higher transaction costs and may result in higher taxes when Portfolio shares are held in a taxable account. These costs, which are not reflected in Total Annual Portfolio Operating Expenses or in the Example, affect Portfolio performance. During the most recent fiscal year, the Portfolio's portfolio turnover rate was 38% of the average value of its portfolio.
Principal Investment Strategies
The Adviser and/or the Portfolio's "Sub-Adviser," Morgan Stanley Investment Management Company ("MSIM Company"), seek to achieve the Portfolio's investment objective by investing primarily in equity securities of companies in the Asia-Pacific region, excluding Japan.
The Adviser and/or Sub-Adviser combine a top-down investment approach that focuses on country, sector and thematic allocation with a bottom-up approach for stock selection. The Adviser and/or Sub-Adviser allocate the Portfolio's assets among equity securities in markets within the Asia Pacific region, excluding Japan, based on relative economic, political and social fundamentals, stock valuations and investor sentiment. To manage risk, the Adviser and/or Sub-Adviser emphasize macroeconomic and fundamental research.
Under normal circumstances, at least 80% of the Portfolio's assets will be invested in equity securities of issuers located in the Asia-Pacific region. The Portfolio's
5
Asian Equity Portfolio (Cont'd)
equity investments may include convertible securities. The Adviser and/or Sub-Adviser generally consider selling an investment when they determine the company no longer satisfies its investment criteria.
The Portfolio may, but it is not required to, use derivative instruments for a variety of purposes, including hedging, risk management, portfolio management or to earn income. The Portfolio's use of derivatives may involve the purchase and sale of derivative instruments such as futures, swaps, contracts for difference ("CFDs") and structured investments, and other related instruments and techniques. The Portfolio may utilize foreign currency forward exchange contracts, which are also derivatives, in connection with its investments in foreign securities. The Portfolio's equity investments may include convertible securities.
Principal Risks
There is no assurance that the Portfolio will achieve its investment objective and you can lose money investing in this Portfolio. The principal risks of investing in the Portfolio include:
• Asia-Pacific Market Risk. The small size of securities markets and the low trading volume in many countries in the Asia-Pacific region may lead to a lack of liquidity. The share prices of companies in the region tend to be volatile and there is a significant possibility of loss. Many of the countries in the region are developing, both politically and economically, and as a result companies in the region may be subject to risks like nationalization or other forms of government interference, and/or may be heavily reliant on only a few industries or commodities. Investments in the region may also be subject to currency risks, such as restrictions on the flow of money in and out of the country, extreme volatility relative to the U.S. dollar and devaluation, all of which could decrease the value of the Portfolio. In addition, because the Portfolio concentrates in a single region of the world, the Portfolio's performance may be more volatile than that of a fund that invests globally. Consequently, if Asian securities fall out of favor, it may cause the Portfolio to underperform funds that do not concentrate in a single region of the world.
• Equity Securities. In general, prices of equity securities are more volatile than those of fixed income securities. The prices of equity securities will rise and fall in response to a number of different factors, including events that affect particular issuers as well as events that affect entire financial markets or industries. To the extent that the Portfolio invests in convertible securities, and the convertible security's investment value is greater than its conversion value, its price will be likely to increase when interest rates fall and decrease when interest rates rise. If the conversion value exceeds the investment value, the price of the convertible security will tend to fluctuate directly with the price of the underlying equity security.
• Foreign and Emerging Market Securities. Investments in foreign markets entail special risks such as currency, political, economic and market risks. There also may be greater market volatility, less reliable financial information, higher transaction and custody costs, decreased market liquidity and less government and exchange regulation associated with investments in foreign markets. In addition, investments in certain foreign markets, which have historically been considered stable, may become more volatile and subject to increased risk due to ongoing developments and changing conditions in such markets. Moreover, the growing interconnectivity of global economies and financial markets has increased the probability that adverse developments and conditions in one country or region will affect the stability of economies and financial markets in other countries or regions. The risks of investing in emerging market countries are greater than risks associated with investments in foreign developed countries. In addition, the Portfolio's investments may be denominated in foreign currencies and therefore, changes in the value of a country's currency compared to the U.S. dollar may affect the value of the Portfolio's investments. Hedging the Portfolio's currency risks through foreign currency forward exchange contracts involves the risk of mismatching the Portfolio's objectives under a foreign currency forward exchange contract with the value of securities denominated in a particular currency. There is additional risk that such transactions reduce or preclude the opportunity for gain and that currency contracts create exposure to currencies in which the Portfolio's securities are not denominated. The use of foreign currency forward exchange contracts involves the risk of loss from the insolvency or bankruptcy of the counterparty to the contract or the failure of the counterparty to make payments or otherwise comply with the terms of the contract.
• Derivatives Risk. A derivative instrument often has risks similar to its underlying asset and may have additional risks, including imperfect correlation between the value of the derivative and the underlying asset, risks of default by the counterparty to certain transactions, magnification of losses incurred due to changes in the market value of the securities, instruments, indices or interest rates to which they relate and risks that the transactions may not be liquid. Certain derivative transactions may give rise to a form of leverage. Leverage magnifies the potential for gain and the risk of loss.
Shares of the Portfolio are not bank deposits and are not guaranteed or insured by the Federal Deposit Insurance Corporation or any other government agency.
Performance Information
The bar chart and table below provide some indication of the risks of investing in the Portfolio by showing the Portfolio's Class I shares' performance for one year and by showing how the Portfolio's average annual returns
6
Morgan Stanley Institutional Fund, Inc. Prospectus
Portfolio Summary
Asian Equity Portfolio (Cont'd)
for the past one year period and since inception compare with those of a broad measure of market performance, as well as an index that represents a group of similar mutual funds, over time. The performance of the other Classes will differ because the Classes have different ongoing fees. The Portfolio's returns in the table include the maximum applicable sales charge for Class H and assume you sold your shares at the end of each period (unless otherwise noted). The Portfolio's past performance, before and after taxes, is not necessarily an indication of how the Portfolio will perform in the future. Updated performance information is available online at www.morganstanley.com/im.
Annual Total Returns—Calendar Years
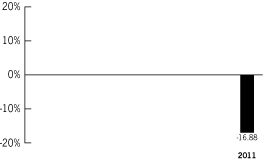
| High Quarter | | 12/31/11 | | | 3.93 | % | |
|
| Low Quarter | | 9/30/11 | | | –21.18 | % | |
|
Average Annual Total Returns
(for the calendar periods ended December 31, 2011)
| | | Past
One Year | | Since
Inception | |
Class I (commenced
operations on 12/28/10) | | | | | | | | | |
| Return before Taxes | | | –16.88 | % | | | –15.19 | % | |
| Return after Taxes on Distributions | | | –16.88 | % | | | –15.19 | % | |
Return after Taxes on Distributions
and Sale of Portfolio Shares | | | –10.97 | % | | | –12.91 | % | |
Class P (commenced
operations on 12/28/10) | |
| Return before Taxes | | | –17.08 | % | | | –15.38 | % | |
Class H (commenced
operations on 12/28/10) | |
| Return before Taxes | | | –21.03 | % | | | –19.38 | % | |
Class L (commenced
operations on 12/28/10) | |
| Return before Taxes | | | –17.57 | % | | | –15.88 | % | |
MSCI All Country Asia Ex-Japan Index
(reflects no deduction for fees,
expenses or taxes)1 | | | –17.31 | % | | | –15.45 | % | |
Lipper Pacific Region Ex-Japan Funds
Index (reflects no deduction for taxes)2 | | | –15.66 | % | | | –13.73 | % | |
1 The Morgan Stanley Capital International (MSCI) All Country Asia Ex-Japan Index is a free float-adjusted market capitalization weighted index that is designed to measure the equity market performance of Asia, excluding Japan. The performance of the Index is listed in U.S. dollars and assumes reinvestment of net dividends. "Net dividends" reflects a reduction in dividends after taking into account withholding of taxes by certain foreign countries represented in the Index. It is not possible to invest directly in an index.
2 The Lipper Pacific Region Ex-Japan Funds Index is an equally weighted performance index of the largest qualifying funds (based on net assets) in the Lipper Pacific Region Ex-Japan Funds classification. There are currently 10 funds represented in this Index.
The after-tax returns shown in the table above are calculated using the historical highest individual federal marginal income tax rates during the period shown and do not reflect the impact of state and local taxes. After-tax returns for the Portfolio's other Classes will vary from Class I shares' returns. Actual after-tax returns depend on the investor's tax situation and may differ from those shown, and after-tax returns are not relevant to investors who hold their Portfolio shares through tax deferred arrangements such as 401(k) plans or individual retirement accounts. After-tax returns may be higher than before-tax returns due to an assumed benefit from capital losses that would have been realized had Portfolio shares been sold at the end of the relevant periods, as applicable.
Adviser. Morgan Stanley Investment Management Inc.
Sub-Adviser. Morgan Stanley Investment Management Company.
Portfolio Managers. The Portfolio is managed by members of the Asian Equity team. Information about the member primarily responsible for the day-to-day management of the Portfolio is shown below:
| Name | | Title with
MSIM Company | | Date Began
Managing
Portfolio | |
| James Cheng | | Managing Director | | December 2010 | |
|
Purchase and Sale of Fund Shares
The minimum initial investment generally is $5,000,000 for Class I shares, $1,000,000 for Class P shares and $25,000 for each of Class H and Class L shares of the Portfolio. The minimum initial investment will be waived for certain investments. For more information, please refer to the "Shareholder Information—How To Purchase Class I, Class P and Class L Shares" and "—How To Purchase Class H Shares" sections beginning on pages 51 and 52, respectively of this Prospectus.
Class I, Class P and Class L shares of the Portfolio may be purchased or sold on any day the New York Stock Exchange ("NYSE") is open for business directly through the Fund by mail (c/o Morgan Stanley Services Company Inc., P.O. Box 219804, Kansas City, MO 64121-9804) or by telephone (1-800-548-7786) or by contacting your financial intermediary.
For more information, please refer to the "Shareholder Information—How To Purchase Class I, Class P and
7
Asian Equity Portfolio (Cont'd)
Class L Shares" and "—How To Redeem Class I, Class P and Class L Shares" sections beginning on pages 51 and 54, respectively, of this Prospectus.
Class H shares of the Portfolio may be purchased or redeemed by contacting your authorized financial representative.
Tax Information
The Portfolio intends to make distributions that may be taxed as ordinary income or capital gains, unless you are investing through a tax-deferred arrangement, such as a 401(k) plan or an individual retirement account.
Payments to Broker-Dealers and Other Financial Intermediaries
If you purchase the Portfolio through a broker-dealer or other financial intermediary (such as a bank), the Adviser and/or the Portfolio's "Distributor," Morgan Stanley Distribution, Inc., may pay the intermediary for the sale of Portfolio shares and related services. These payments, which may be significant in amount, may create a conflict of interest by influencing the broker-dealer or other intermediary and your salesperson to recommend the Portfolio over another investment. Ask your salesperson or visit your financial intermediary's web site for more information.
8
Morgan Stanley Institutional Fund, Inc. Prospectus
Portfolio Summary
Emerging Markets Portfolio
Objective
The Emerging Markets Portfolio seeks long-term capital appreciation by investing primarily in growth-oriented equity securities of issuers in emerging market countries.
Fees and Expenses
The table below describes the fees and expenses that you may pay if you buy and hold shares of the Portfolio. For shareholders of Class H shares, you may qualify for sales charge discounts if the cumulative net asset value ("NAV") of Class H shares of the Portfolio purchased in a single transaction, together with the NAV of all Class H shares of a portfolio of Morgan Stanley Institutional Fund, Inc. (the "Fund") or of a portfolio of Morgan Stanley Institutional Fund Trust held in related accounts, amounts to $50,000 or more. More information about these and other discounts is available from your financial adviser and in the "Shareholder Information—How To Purchase Class H Shares" section on page 52 of this Prospectus.
Shareholder Fees (fees paid directly from your investment)
| | | Class I | | Class P | | Class H | | Class L | |
Maximum
sales charge
(load)
imposed on
purchases
(as a
percentage
of offering
price) | | | None | | | | None | | | | 4.75 | %† | | | None | | |
Redemption
Fee (as a
percentage
of the amount
redeemed on
redemptions
made within
30 days of
purchase) | | | 2.00 | % | | | 2.00 | % | | | 2.00 | % | | | 2.00 | % | |
Annual Portfolio Operating Expenses (expenses that you pay each year as a percentage of the value of your investment)
| | | Class I | | Class P | | Class H | | Class L | |
| Advisory Fee | | | 1.19 | % | | | 1.19 | % | | | 1.19 | % | | | 1.19 | % | |
Distribution
and/or
Service (12b-1)
Fee | | | None | | | | 0.25 | % | | | 0.25 | % | | | 0.75 | % | |
Other
Expenses | | | 0.30 | % | | | 0.30 | % | | | 0.30 | %‡ | | | 0.30 | %‡ | |
Total Annual
Portfolio
Operating
Expenses* | | | 1.49 | % | | | 1.74 | % | | | 1.74 | % | | | 2.24 | % | |
| | | Class I | | Class P | | Class H | | Class L | |
Fee Waiver
and/or Expense
Reimbursement* | | | 0.24 | % | | | 0.24 | % | | | 0.24 | % | | | 0.24 | % | |
Total Annual
Portfolio
Operating
Expenses After
Fee Waiver
and/or Expense
Reimbursement* | | | 1.25 | % | | | 1.50 | % | | | 1.50 | % | | | 2.00 | % | |
Example
The example below is intended to help you compare the cost of investing in the Portfolio with the cost of investing in other mutual funds.
The example assumes that you invest $10,000 in the Portfolio, your investment has a 5% return each year and that the Portfolio's operating expenses remain the same. Although your actual costs may be higher or lower, based on these assumptions your costs would be:
| | | 1 Year | | 3 Years | | 5 Years | | 10 Years | |
| Class I | | $ | 127 | | | $ | 397 | | | $ | 686 | | | $ | 1,511 | | |
| Class P | | $ | 153 | | | $ | 474 | | | $ | 818 | | | $ | 1,791 | | |
| Class H | | $ | 620 | | | $ | 927 | | | $ | 1,255 | | | $ | 2,180 | | |
| Class L | | $ | 203 | | | $ | 627 | | | $ | 1,078 | | | $ | 2,327 | | |
† The sales charge is calculated as a percentage of the offering price. The sales charge is reduced for purchases of $50,000 and over. See "Shareholder Information—How To Purchase Class H Shares."
‡ Other expenses have been estimated for the Portfolio's Class H and Class L shares for the current fiscal year.
* The Portfolio's "Adviser," Morgan Stanley Investment Management Inc., has agreed to reduce its advisory fee and/or reimburse the Portfolio so that Total Annual Portfolio Operating Expenses, excluding certain investment related expenses, will not exceed 1.25% for Class I, 1.50% for Class P, 1.50% for Class H and 2.00% for Class L. The fee waivers and/or expense reimbursement will continue for at least one year or until such time as the Fund's Board of Directors acts to discontinue all or a portion of such waivers and/or reimbursements when it deems such action is appropriate.
Portfolio Turnover
The Portfolio pays transaction costs, such as commissions, when it buys and sells securities (or "turns over" its portfolio). A higher portfolio turnover rate may indicate higher transaction costs and may result in higher taxes when Portfolio shares are held in a taxable account. These costs, which are not reflected in Total Annual Portfolio Operating Expenses or in the Example, affect Portfolio performance. During the most recent fiscal year, the Portfolio's portfolio turnover rate was 60% of the average value of its portfolio.
9
Emerging Markets Portfolio (Cont'd)
Principal Investment Strategies
The Adviser and the Portfolio's "Sub-Advisers," Morgan Stanley Investment Management Company ("MSIM Company") and Morgan Stanley Investment Management Limited ("MSIM Limited"), seek to maximize returns by investing primarily in growth-oriented equity securities in emerging markets.
The Adviser's and Sub-Advisers' investment approach combines top-down country allocation with bottom-up stock selection. The Adviser and Sub-Advisers allocate the Portfolio's assets among emerging markets based on relative economic, political and social fundamentals, stock valuations and investor sentiment. To manage risk, the Adviser and/or Sub-Advisers emphasize macroeconomic and fundamental research.
Under normal circumstances, at least 80% of the Portfolio's assets will be invested in equity securities of issuers located in emerging market countries. The Portfolio's equity investments may include convertible securities. The Adviser and/or Sub-Advisers generally consider selling an investment when they determine the company no longer satisfies their investment criteria.
The Portfolio may, but it is not required to, use derivative instruments for a variety of purposes, including hedging, risk management, portfolio management or to earn income. The Portfolio's use of derivatives may involve the purchase and sale of derivative instruments such as futures, swaps and contracts for difference ("CFDs"), and other related instruments and techniques. The Portfolio may utilize foreign currency forward exchange contracts, which are also derivatives, in connection with its investments in foreign securities.
Principal Risks
There is no assurance that the Portfolio will achieve its investment objective and you can lose money investing in this Portfolio. The principal risks of investing in the Portfolio include:
• Equity Securities. In general, prices of equity securities are more volatile than those of fixed income securities. The prices of equity securities will rise and fall in response to a number of different factors, including events that affect particular issuers as well as events that affect entire financial markets or industries. To the extent that the Portfolio invests in convertible securities, and the convertible security's investment value is greater than its conversion value, its price will be likely to increase when interest rates fall and decrease when interest rates rise. If the conversion value exceeds the investment value, the price of the convertible security will tend to fluctuate directly with the price of the underlying equity security.
• Foreign and Emerging Market Securities. Investments in foreign markets entail special risks such as currency, political, economic and market risks. There also may be greater market volatility, less reliable financial information, higher transaction and custody costs, decreased market liquidity and less government and exchange regulation associated with investments in foreign markets. In addition, investments in certain foreign markets, which have historically been considered stable, may become more volatile and subject to increased risk due to ongoing developments and changing conditions in such markets. Moreover, the growing interconnectivity of global economies and financial markets has increased the probability that adverse developments and conditions in one country or region will affect the stability of economies and financial markets in other countries or regions. The risks of investing in emerging market countries are greater than risks associated with investments in foreign developed countries. In addition, the Portfolio's investments may be denominated in foreign currencies and therefore, changes in the value of a country's currency compared to the U.S. dollar may affect the value of the Portfolio's investments. Hedging the Portfolio's currency risks through foreign currency forward exchange contracts involves the risk of mismatching the Portfolio's objectives under a foreign currency forward exchange contract with the value of securities denominated in a particular currency. There is additional risk that such transactions reduce or preclude the opportunity for gain and that currency contracts create exposure to currencies in which the Portfolio's securities are not denominated. The use of foreign currency forward exchange contracts involves the risk of loss from the insolvency or bankruptcy of the counterparty to the contract or the failure of the counterparty to make payments or otherwise comply with the terms of the contract.
• Derivatives Risk. A derivative instrument often has risks similar to its underlying asset and may have additional risks, including imperfect correlation between the value of the derivative and the underlying asset, risks of default by the counterparty to certain transactions, magnification of losses incurred due to changes in the market value of the securities, instruments, indices or interest rates to which they relate and risks that the transactions may not be liquid. Certain derivative transactions may give rise to a form of leverage. Leverage magnifies the potential for gain and the risk of loss.
Shares of the Portfolio are not bank deposits and are not guaranteed or insured by the Federal Deposit Insurance Corporation or any other government agency.
Performance Information
The bar chart and table below provide some indication of the risks of investing in the Portfolio by showing changes in the Portfolio's Class I shares' performance from year-to-year and by showing how the Portfolio's average annual returns for the past one, five and 10 year periods compare with those of a broad measure of market performance, as well as an index that represents a group of similar mutual funds, over time. The performance of the other Classes will differ because the Classes
10
Morgan Stanley Institutional Fund, Inc. Prospectus
Portfolio Summary
Emerging Markets Portfolio (Cont'd)
have different ongoing fees. The Portfolio's past performance, before and after taxes, is not necessarily an indication of how the Portfolio will perform in the future. Updated performance information is available online at www.morganstanley.com/im.
Annual Total Returns—Calendar Years
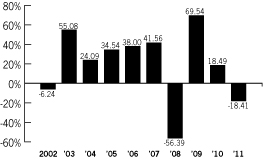
| High Quarter | | 6/30/09 | | | 35.03 | % | |
|
| Low Quarter | | 12/31/08 | | | –29.79 | % | |
|
Average Annual Total Returns
(for the calendar periods ended December 31, 2011)
| | | Past
One Year | | Past
Five Years | | Past
Ten Years | |
| Class I | | | | | | | |
| Return before Taxes | | | –18.41 | % | | | 0.23 | % | | | 12.98 | % | |
Return after Taxes on
Distributions | | | –18.48 | % | | | –0.71 | % | | | 12.17 | % | |
Return after Taxes on
Distributions and Sale of
Portfolio Shares | | | –11.50 | % | | | 0.29 | % | | | 11.80 | % | |
| Class P | | | | | | | |
| Return before Taxes | | | –18.63 | % | | | –0.02 | % | | | 12.69 | % | |
| Class H* | |
| Return before Taxes | | | N/A | | | | N/A | | | | N/A | | |
| Class L* | |
| Return before Taxes | | | N/A | | | | N/A | | | | N/A | | |
MSCI Emerging Markets
Net Index (reflects no
deduction for fees,
expenses or taxes)1 | | | –18.42 | % | | | 2.40 | % | | | 13.86 | % | |
Lipper Emerging Markets
Funds Index (reflects no
deduction for taxes)2 | | | –18.37 | % | | | 1.04 | % | | | 13.26 | % | |
* As of December 31, 2011, the Fund had not commenced offering Class H and Class L shares of the Portfolio. The returns for Class H and Class L shares would be lower than the returns for Class I shares of the Portfolio as expenses of Class H and Class L are higher. Return information for the Portfolio's Class H and Class L shares will be shown in future prospectuses offering the Portfolio's Class H and Class L shares after the Portfolio's Class H and Class L shares have a full calendar year of return information to report.
1 The Morgan Stanley Capital International (MSCI) Emerging Markets Net Index is a free float-adjusted market capitalization weighted index that is designed to measure equity market performance of emerging markets. The term "free float" represents the portion of shares outstanding that are deemed to be available for purchase in the public equity markets by investors. The MSCI Emerging Markets Net Index currently consists of 21 emerging market country indices. The performance of the Index is listed in U.S. dollars and assumes reinvestment of net dividends. "Net dividends" reflects a reduction in dividends after taking into account withholding of taxes by certain foreign countries represented in the Index. It is not possible to invest directly in an index.
2 The Lipper Emerging Markets Funds Index is an equally weighted performance index of the largest qualifying funds (based on net assets) in the Lipper Emerging Markets Funds classification. There are currently 30 funds represented in this Index.
The after-tax returns shown in the table above are calculated using the historical highest individual federal marginal income tax rates during the period shown and do not reflect the impact of state and local taxes. After-tax returns for the Portfolio's other Classes will vary from Class I shares' returns. Actual after-tax returns depend on the investor's tax situation and may differ from those shown, and after-tax returns are not relevant to investors who hold their Portfolio shares through tax deferred arrangements such as 401(k) plans or individual retirement accounts. After-tax returns may be higher than before-tax returns due to an assumed benefit from capital losses that would have been realized had Portfolio shares been sold at the end of the relevant periods, as applicable.
Adviser. Morgan Stanley Investment Management Inc.
Sub-Advisers. Morgan Stanley Investment Management Limited and Morgan Stanley Investment Management Company.
Portfolio Managers. The Portfolio is managed by members of the Emerging Markets Equity team. Information about the members jointly and primarily responsible for the day-to-day management of the Portfolio is shown below:
| Name | | Title with
Adviser | | Date Began
Managing
Portfolio | |
| Ruchir Sharma | | Managing Director | | April 2002 | |
|
| Paul Psaila | | Managing Director | | February 1994 | |
|
| Eric Carlson | | Managing Director | | September 1997 | |
|
| Name | | Title with
MSIM Company | | Date Began
Managing
Portfolio | |
| James Cheng | | Managing Director | | August 2006 | |
|
| Name | | Title with
MSIM Limited | | Date Began
Managing
Portfolio | |
| Ana Cristina Piedrahita | | Executive Director | | January 2002 | |
|
Purchase and Sale of Fund Shares
The minimum initial investment generally is $5,000,000 for Class I shares, $1,000,000 for Class P shares and $25,000 for each of Class H and Class L shares of the Portfolio. The minimum initial investment will be
11
Emerging Markets Portfolio (Cont'd)
waived for certain investments. For more information, please refer to the "Shareholder Information—How To Purchase Class I, Class P and Class L Shares" and "—How To Purchase Class H Shares" sections beginning on pages 51 and 52, respectively, of this Prospectus.
Class I, Class P and Class L shares of the Portfolio may be purchased or sold on any day the New York Stock Exchange ("NYSE") is open for business directly through the Fund by mail (c/o Morgan Stanley Services Company Inc., P.O. Box 219804, Kansas City, MO 64121-9804) or by telephone (1-800-548-7786) or by contacting your financial intermediary.
For more information, please refer to the "Shareholder Information—How To Purchase Class I, Class P and Class L Shares" and "—How To Redeem Class I, Class P and Class L Shares" sections beginning on pages 51 and 54, respectively, of this Prospectus.
Class H shares of the Portfolio may be purchased or redeemed by contacting your authorized financial representative.
Tax Information
The Portfolio intends to make distributions that may be taxed as ordinary income or capital gains, unless you are investing through a tax-deferred arrangement, such as a 401(k) plan or an individual retirement account.
Payments to Broker-Dealers and Other Financial Intermediaries
If you purchase the Portfolio through a broker-dealer or other financial intermediary (such as a bank), the Adviser and/or the Portfolio's "Distributor," Morgan Stanley Distribution, Inc., may pay the intermediary for the sale of Portfolio shares and related services. These payments, which may be significant in amount, may create a conflict of interest by influencing the broker-dealer or other intermediary and your salesperson to recommend the Portfolio over another investment. Ask your salesperson or visit your financial intermediary's web site for more information.
12
Morgan Stanley Institutional Fund, Inc. Prospectus
Portfolio Summary
Global Franchise Portfolio
Objective
The Global Franchise Portfolio seeks long-term capital appreciation.
Fees and Expenses
The table below describes the fees and expenses that you may pay if you buy and hold shares of the Portfolio. For shareholders of Class H shares, you may qualify for sales charge discounts if the cumulative net asset value ("NAV") of Class H shares of the Portfolio purchased in a single transaction, together with the NAV of all Class H shares of a portfolio of Morgan Stanley Institutional Fund, Inc. (the "Fund") or of a portfolio of Morgan Stanley Institutional Fund Trust held in related accounts, amounts to $50,000 or more. More information about these and other discounts is available from your financial adviser and in the "Shareholder Information—How To Purchase Class H Shares" section on page 52 of this Prospectus.
Shareholder Fees (fees paid directly from your investment)
| | | Class I | | Class P | | Class H | | Class L | |
Maximum
sales charge
(load)
imposed on
purchases
(as a
percentage
of offering
price) | | | None | | | | None | | | | 4.75 | %† | | | None | | |
Annual Portfolio Operating Expenses (expenses that you pay each year as a percentage of the value of your investment)
| | | Class I | | Class P | | Class H | | Class L | |
| Advisory Fee | | | 0.80 | % | | | 0.80 | % | | | 0.80 | % | | | 0.80 | % | |
Distribution
and/or
Service (12b-1)
Fee | | | None | | | | 0.25 | % | | | 0.25 | % | | | 0.75 | % | |
Other
Expenses | | | 0.21 | % | | | 0.21 | % | | | 0.21 | %‡ | | | 0.21 | %‡ | |
Total Annual
Portfolio
Operating
Expenses* | | | 1.01 | % | | | 1.26 | % | | | 1.26 | % | | | 1.76 | % | |
Fee Waiver
and/or Expense
Reimbursement* | | | 0.01 | % | | | 0.01 | % | | | 0.01 | % | | | 0.01 | % | |
Total Annual
Portfolio
Operating
Expenses After
Fee Waiver
and/or Expense
Reimbursement* | | | 1.00 | % | | | 1.25 | % | | | 1.25 | % | | | 1.75 | % | |
Example
The example below is intended to help you compare the cost of investing in the Portfolio with the cost of investing in other mutual funds.
The example assumes that you invest $10,000 in the Portfolio, your investment has a 5% return each year and that the Portfolio's operating expenses remain the same. Although your actual costs may be higher or lower, based on these assumptions your costs would be:
| | | 1 Year | | 3 Years | | 5 Years | | 10 Years | |
| Class I | | $ | 102 | | | $ | 318 | | | $ | 552 | | | $ | 1,225 | | |
| Class P | | $ | 127 | | | $ | 397 | | | $ | 686 | | | $ | 1,511 | | |
| Class H | | $ | 596 | | | $ | 853 | | | $ | 1,129 | | | $ | 1,915 | | |
| Class L | | $ | 178 | | | $ | 551 | | | $ | 949 | | | $ | 2,062 | | |
† The sales charge is calculated as a percentage of the offering price. The sales charge is reduced for purchases of $50,000 and over. See "Shareholder Information—How To Purchase Class H Shares."
‡ Other expenses have been estimated for the Portfolio's Class H and Class L shares for the current fiscal year.
* The Portfolio's "Adviser," Morgan Stanley Investment Management Inc., has agreed to reduce its advisory fee and/or reimburse the Portfolio so that Total Annual Portfolio Operating Expenses, excluding certain investment related expenses, will not exceed 1.00% for Class I, 1.25% for Class P, 1.25% for Class H and 1.75% for Class L. The fee waivers and/or expense reimbursements will continue for at least one year or until such time as the Fund's Board of Directors acts to discontinue all or a portion of such waivers and/or reimbursements when it deems such action is appropriate.
Portfolio Turnover
The Portfolio pays transaction costs, such as commissions, when it buys and sells securities (or "turns over" its portfolio). A higher portfolio turnover rate may indicate higher transaction costs and may result in higher taxes when Portfolio shares are held in a taxable account. These costs, which are not reflected in Total Annual Portfolio Operating Expenses or in the Example, affect Portfolio performance. During the most recent fiscal year, the Portfolio's portfolio turnover rate was 30% of the average value of its portfolio.
Principal Investment Strategies
The Portfolio's "Sub-Advisers," Morgan Stanley Investment Management Limited ("MSIM Limited") and Morgan Stanley Investment Management Company ("MSIM Company"), seek long-term capital appreciation by investing primarily in equity securities of issuers located throughout the world that they believe have, among other things, resilient business franchises and growth potential. Under normal market conditions, the Portfolio invests in securities of issuers from at least three different countries, which may include the United States.
13
Global Franchise Portfolio (Cont'd)
The Sub-Advisers emphasize individual stock selection and seek to identify undervalued securities of issuers located throughout the world, including both developed and emerging market countries. The franchise focus of the Portfolio is based on the Sub-Advisers' belief that the intangible assets underlying a strong business franchise (such as patents, copyrights, brand names, licenses or distribution methods) are difficult to create or to replicate and that carefully selected franchise companies can yield above-average potential for long-term capital appreciation.
The Sub-Advisers believe that the number of issuers with strong business franchises meeting its criteria may be limited, and accordingly, the Portfolio is non-diversified and may focus its holdings in a relatively small number of companies and may invest up to 25% of its assets in a single issuer. The Portfolio may also invest in the equity securities of any size company. The Portfolio's equity investments may include convertible securities.
The Sub-Advisers generally consider selling a portfolio holding when they determine that the holding no longer satisfies their investment criteria or that replacing the holding with another investment should improve the Portfolio's valuation and/or quality.
The Portfolio may utilize foreign currency forward exchange contracts, which are derivatives, in connection with its investments in foreign securities.
Principal Risks
There is no assurance that the Portfolio will achieve its investment objective and you can lose money investing in this Portfolio. The principal risks of investing in the Portfolio include:
• Equity Securities. In general, prices of equity securities are more volatile than those of fixed income securities. The prices of equity securities will rise and fall in response to a number of different factors, including events that affect particular issuers as well as events that affect entire financial markets or industries. To the extent that the Portfolio invests in convertible securities, and the convertible security's investment value is greater than its conversion value, its price will be likely to increase when interest rates fall and decrease when interest rates rise. If the conversion value exceeds the investment value, the price of the convertible security will tend to fluctuate directly with the price of the underlying equity security.
• Foreign and Emerging Market Securities. Investments in foreign markets entail special risks such as currency, political, economic and market risks. There also may be greater market volatility, less reliable financial information, higher transaction and custody costs, decreased market liquidity and less government and exchange regulation associated with investments in foreign markets. In addition, investments in certain foreign markets, which have historically been considered stable, may become more volatile and subject to increased risk due to ongoing developments and changing conditions in such markets. Moreover, the growing interconnectivity of global economies and financial markets has increased the probability that adverse developments and conditions in one country or region will affect the stability of economies and financial markets in other countries or regions. The risks of investing in emerging market countries are greater than risks associated with investments in foreign developed countries. In addition, the Portfolio's investments may be denominated in foreign currencies and therefore, changes in the value of a country's currency compared to the U.S. dollar may affect the value of the Portfolio's investments. Hedging the Portfolio's currency risks through foreign currency forward exchange contracts involves the risk of mismatching the Portfolio's objectives under a foreign currency forward exchange contract with the value of securities denominated in a particular currency. There is additional risk that such transactions reduce or preclude the opportunity for gain and that currency contracts create exposure to currencies in which the Portfolio's securities are not denominated. The use of foreign currency forward exchange contracts involves the risk of loss from the insolvency or bankruptcy of the counterparty to the contract or the failure of the counterparty to make payments or otherwise comply with the terms of the contract.
• Small Capitalization Companies. Investments in small capitalization companies entail greater risks than those associated with larger, more established companies. Often the securities issued by small capitalization companies may be less liquid. Such companies may have more limited markets, financial resources and product lines, and may lack the depth of management of larger companies.
• Risk of Investing in Global Franchise Companies. Changes in the worldwide economy, consumer spending, competition, demographics and consumer preferences, government regulation and economic conditions may adversely affect global franchise companies and may negatively impact the Portfolio to a greater extent than if the Portfolio's assets were invested in a wider variety of companies.
• Non-Diversified Portfolio. Because the Portfolio is non-diversified, it may be more susceptible to an adverse event affecting a portfolio investment than a diversified portfolio and a decline in the value of that instrument would cause the Portfolio's overall value to decline to a greater degree.
Shares of the Portfolio are not bank deposits and are not guaranteed or insured by the Federal Deposit Insurance Corporation or any other government agency.
14
Morgan Stanley Institutional Fund, Inc. Prospectus
Portfolio Summary
Global Franchise Portfolio (Cont'd)
Performance Information
The bar chart and table below provide some indication of the risks of investing in the Portfolio by showing changes in the Portfolio's Class I shares' performance from year-to-year and by showing how the Portfolio's average annual returns for the past one, five and 10 year periods compare with those of a broad measure of market performance, as well as an index that represents a group of similar mutual funds, over time. The performance of the other Classes will differ because the Classes have different ongoing fees. The Portfolio's past performance, before and after taxes, is not necessarily an indication of how the Portfolio will perform in the future. Updated performance information is available online at www.morganstanley.com/im.
Annual Total Returns—Calendar Years
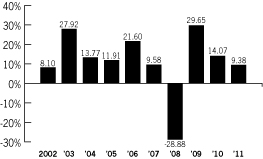
| High Quarter | | 6/30/09 | | | 18.11 | % | |
|
| Low Quarter | | 12/31/08 | | | –13.37 | % | |
|
Average Annual Total Returns
(for the calendar periods ended December 31, 2011)
| | | Past
One Year | | Past
Five Years | | Past
Ten Years | |
| Class I | | | | | | | |
| Return before Taxes | | | 9.38 | % | | | 4.74 | % | | | 10.44 | % | |
Return after Taxes on
Distributions | | | 8.95 | % | | | 3.72 | % | | | 9.57 | % | |
Return after Taxes on
Distributions and Sale of
Portfolio Shares | | | 6.76 | % | | | 3.91 | % | | | 9.16 | % | |
| Class P | | | | | | | |
| Return before Taxes | | | 8.98 | % | | | 4.46 | % | | | 10.15 | % | |
| Class H* | |
| Return before Taxes | | | N/A | | | | N/A | | | | N/A | | |
| Class L* | |
| Return before Taxes | | | N/A | | | | N/A | | | | N/A | | |
MSCI World Index (reflects
no deduction for fees,
expenses or taxes)1 | | | –5.54 | % | | | –2.37 | % | | | 3.62 | % | |
Lipper Global Multi-Cap
Growth Funds Index (reflects
no deduction for taxes)2 | | | –11.85 | % | | | –0.18 | % | | | 5.02 | % | |
* As of December 31, 2011, the Fund had not commenced offering Class H and Class L shares of the Portfolio. The returns for Class H and Class L shares would be lower than the returns for Class I shares of the Portfolio as expenses of Class H and Class L are higher. Return information for the Portfolio's Class H and Class L shares will be shown in future prospectuses offering the Portfolio's Class H and Class L shares after the Portfolio's Class H and Class L shares have a full calendar year of return information to report.
1 The Morgan Stanley Capital International (MSCI) World Index is a free float-adjusted market capitalization weighted index that is designed to measure global equity market performance of developed markets. The term "free float" represents the portion of shares outstanding that are deemed to be available for purchase in the public equity markets by investors. The MSCI World Index currently consists of 24 developed market country indices. The performance of the Index is listed in U.S. dollars and assumes reinvestment of net dividends. "Net dividends" reflects a reduction in dividends after taking into account withholding of taxes by certain foreign countries represented in the Index. It is not possible to invest directly in an index.
2 The Lipper Global Multi-Cap Growth Funds Index is an equally weighted performance index of the largest qualifying funds (based on net assets) in the Lipper Global Multi-Cap Growth Funds classification. There are currently 30 funds represented in this Index.
The after-tax returns shown in the table above are calculated using the historical highest individual federal marginal income tax rates during the period shown and do not reflect the impact of state and local taxes. After-tax returns for the Portfolio's other Classes will vary from Class I shares' returns. Actual after-tax returns depend on the investor's tax situation and may differ from those shown, and after-tax returns are not relevant to investors who hold their Portfolio shares through tax deferred arrangements such as 401(k) plans or individual retirement accounts. After-tax returns may be higher than before-tax returns due to an assumed benefit from capital losses that would have been realized had Portfolio shares been sold at the end of the relevant periods, as applicable.
Adviser. Morgan Stanley Investment Management Inc.
Sub-Advisers. Morgan Stanley Investment Management Limited and Morgan Stanley Investment Management Company.
Portfolio Managers. The Portfolio is managed by members of the International Equity team. Information about the members jointly and primarily responsible for the day-to-day management of the Portfolio is shown below:
| Name | | Title with
MSIM Limited | | Date Began
Managing
Portfolio | |
| William D. Lock | | Managing Director | | June 2009 | |
|
| Walter B. Riddell | | Managing Director | | June 2009 | |
|
| Vladimir A. Demine | | Executive Director | | June 2009 | |
|
| John S. Goodacre | | Executive Director | | June 2009 | |
|
| Bruno Paulson | | Executive Director | | June 2009 | |
|
15
Global Franchise Portfolio (Cont'd)
| Name | | Title with
MSIM Company | | Date Began
Managing
Portfolio | |
| Peter J. Wright | | Managing Director | | June 2009 | |
|
| Christian Derold | | Executive Director | | June 2009 | |
|
Purchase and Sale of Fund Shares
The minimum initial investment generally is $5,000,000 for Class I shares, $1,000,000 for Class P shares and $25,000 for each of Class H and Class L shares of the Portfolio. The minimum initial investment will be waived for certain investments. For more information, please refer to the "Shareholder Information—How To Purchase Class I, Class P and Class L Shares" and "—How To Purchase Class H Shares" sections beginning on pages 51 and 52, respectively, of this Prospectus.
Class I, Class P and Class L shares of the Portfolio may be purchased or sold on any day the New York Stock Exchange ("NYSE") is open for business directly through the Fund by mail (c/o Morgan Stanley Services Company Inc., P.O. Box 219804, Kansas City, MO 64121-9804) or by telephone (1-800-548-7786) or by contacting your financial intermediary.
For more information, please refer to the "Shareholder Information—How To Purchase Class I, Class P and Class L Shares" and "—How To Redeem Class I, Class P and Class L Shares" sections beginning on pages 51 and 54, respectively, of this Prospectus.
Class H shares of the Portfolio may be purchased or redeemed by contacting your authorized financial representative.
Tax Information
The Portfolio intends to make distributions that may be taxed as ordinary income or capital gains, unless you are investing through a tax-deferred arrangement, such as a 401(k) plan or an individual retirement account.
Payments to Broker-Dealers and Other Financial Intermediaries
If you purchase the Portfolio through a broker-dealer or other financial intermediary (such as a bank), the Adviser and/or the Portfolio's "Distributor," Morgan Stanley Distribution, Inc., may pay the intermediary for the sale of Portfolio shares and related services. These payments, which may be significant in amount, may create a conflict of interest by influencing the broker-dealer or other intermediary and your salesperson to recommend the Portfolio over another investment. Ask your salesperson or visit your financial intermediary's web site for more information.
16
Morgan Stanley Institutional Fund, Inc. Prospectus
Portfolio Summary
International Equity Portfolio
Objective
The International Equity Portfolio seeks long-term capital appreciation by investing primarily in equity securities of non-U.S. issuers.
Fees and Expenses
The table below describes the fees and expenses that you may pay if you buy and hold shares of the Portfolio. For shareholders of Class H shares, you may qualify for sales charge discounts if the cumulative net asset value ("NAV") of Class H shares of the Portfolio purchased in a single transaction, together with the NAV of all Class H shares of a portfolio of Morgan Stanley Institutional Fund, Inc. (the "Fund") or of a portfolio of Morgan Stanley Institutional Fund Trust held in related accounts, amounts to $50,000 or more. More information about these and other discounts is available from your financial adviser and in the "Shareholder Information—How To Purchase Class H Shares" section on page 52 of this Prospectus.
Shareholder Fees (fees paid directly from your investment)
| | | Class I | | Class P | | Class H | | Class L | |
Maximum
sales charge
(load) imposed
on purchases
(as a percentage
of offering price) | | | None | | | | None | | | | 4.75 | %† | | | None | | |
Redemption Fee
(as a percentage
of the amount
redeemed on
redemptions
made within
30 days of
purchase) | | | 2.00 | % | | | 2.00 | % | | | 2.00 | % | | | 2.00 | % | |
Annual Portfolio Operating Expenses (expenses that you pay each year as a percentage of the value of your investment)
| | | Class I | | Class P | | Class H | | Class L | |
| Advisory Fee | | | 0.80 | % | | | 0.80 | % | | | 0.80 | % | | | 0.80 | % | |
Distribution
and/or Service
(12b-1) Fee | | | None | | | | 0.25 | % | | | 0.25 | % | | | 0.75 | % | |
| Other Expenses | | | 0.18 | % | | | 0.18 | % | | | 0.18 | %‡ | | | 0.18 | %‡ | |
Total Annual
Portfolio
Operating
Expenses* | | | 0.98 | % | | | 1.23 | % | | | 1.23 | % | | | 1.73 | % | |
Fee Waiver
and/or Expense
Reimbursement* | | | 0.03 | % | | | 0.03 | % | | | 0.03 | % | | | 0.03 | % | |
Total Annual
Portfolio
Operating
Expenses After
Fee Waiver
and/or Expense
Reimbursement* | | | 0.95 | % | | | 1.20 | % | | | 1.20 | % | | | 1.70 | % | |
Example
The example below is intended to help you compare the cost of investing in the Portfolio with the cost of investing in other mutual funds.
The example assumes that you invest $10,000 in the Portfolio, your investment has a 5% return each year and that the Portfolio's operating expenses remain the same. Although your actual costs may be higher or lower, based on these assumptions your costs would be:
| | | 1 Year | | 3 Years | | 5 Years | | 10 Years | |
| Class I | | $ | 97 | | | $ | 303 | | | $ | 525 | | | $ | 1,166 | | |
| Class P | | $ | 122 | | | $ | 381 | | | $ | 660 | | | $ | 1,455 | | |
| Class H | | $ | 591 | | | $ | 838 | | | $ | 1,103 | | | $ | 1,860 | | |
| Class L | | $ | 173 | | | $ | 536 | | | $ | 923 | | | $ | 2,009 | | |
† The sales charge is calculated as a percentage of the offering price. The sales charge is reduced for purchases of $50,000 and over. See "Shareholder Information—How To Purchase Class H Shares."
‡ Other expenses have been estimated for the Portfolio's Class H and Class L shares for the current fiscal year.
* The Portfolio's "Adviser," Morgan Stanley Investment Management Inc., has agreed to reduce its advisory fee and/or reimburse the Portfolio so that Total Annual Portfolio Operating Expenses, excluding certain investment related expenses, will not exceed 0.95% for Class I, 1.20% for Class P, 1.20% for Class H and 1.70% for Class L. The fee waivers and/or expense reimbursements will continue for at least one year or until such time as the Fund's Board of Directors acts to discontinue all or a portion of such waivers and/or reimbursements when it deems such action is appropriate.
Portfolio Turnover
The Portfolio pays transaction costs, such as commissions, when it buys and sells securities (or "turns over" its portfolio). A higher portfolio turnover rate may indicate higher transaction costs and may result in higher taxes when Portfolio shares are held in a taxable account. These costs, which are not reflected in Total Annual Portfolio Operating Expenses or in the Example, affect Portfolio performance. During the most recent fiscal year, the Portfolio's portfolio turnover rate was 34% of the average value of its portfolio.
Principal Investment Strategies
The Portfolio's "Sub-Advisers," Morgan Stanley Investment Management Limited ("MSIM Limited") and Morgan Stanley Investment Management Company ("MSIM Company"), seek to maintain a diversified portfolio of equity securities of non-U.S. issuers based on individual stock selection. The Sub-Advisers emphasize a bottom-up approach to investing that seeks to identify securities of issuers they believe are undervalued. The Sub-Advisers focus on developed markets, but they may invest in emerging markets.
17
International Equity Portfolio (Cont'd)
The Sub-Advisers select issuers from a universe comprised of approximately 1,200 companies in non-U.S. markets. In assessing investment opportunities, the Sub-Advisers consider value criteria with an emphasis on cash flow and the intrinsic value of company assets. Securities which appear undervalued according to these criteria are then subjected to in-depth fundamental analysis.
Under normal circumstances, at least 80% of the Portfolio's assets will be invested in equity securities. The Portfolio's equity investments may include convertible securities.
The Portfolio may, but it is not required to, use derivative instruments for a variety of purposes, including hedging, risk management, portfolio management or to earn income. The Portfolio's use of derivatives may involve the purchase and sale of derivative instruments such as futures, options, swaps and contracts for difference ("CFDs"), and other related instruments and techniques. The Portfolio may utilize foreign currency forward exchange contracts, which are also derivatives, in connection with its investments in foreign securities.
Principal Risks
There is no assurance that the Portfolio will achieve its investment objective and you can lose money investing in this Portfolio. The principal risks of investing in the Portfolio include:
• Equity Securities. In general, prices of equity securities are more volatile than those of fixed income securities. The prices of equity securities will rise and fall in response to a number of different factors, including events that affect particular issuers as well as events that affect entire financial markets or industries. To the extent that the Portfolio invests in convertible securities, and the convertible security's investment value is greater than its conversion value, its price will be likely to increase when interest rates fall and decrease when interest rates rise. If the conversion value exceeds the investment value, the price of the convertible security will tend to fluctuate directly with the price of the underlying equity security.
• Foreign and Emerging Market Securities. Investments in foreign markets entail special risks such as currency, political, economic and market risks. There also may be greater market volatility, less reliable financial information, higher transaction and custody costs, decreased market liquidity and less government and exchange regulation associated with investments in foreign markets. In addition, investments in certain foreign markets, which have historically been considered stable, may become more volatile and subject to increased risk due to ongoing developments and changing conditions in such markets. Moreover, the growing interconnectivity of global economies and financial markets has increased the probability that adverse developments and conditions in one country or region will affect the stability of economies and financial markets in other countries or regions. The risks of investing in emerging market countries are greater than risks associated with investments in foreign developed countries. In addition, the Portfolio's investments may be denominated in foreign currencies and therefore, changes in the value of a country's currency compared to the U.S. dollar may affect the value of the Portfolio's investments. Hedging the Portfolio's currency risks through foreign currency forward exchange contracts involves the risk of mismatching the Portfolio's objectives under a foreign currency forward exchange contract with the value of securities denominated in a particular currency. There is additional risk that such transactions reduce or preclude the opportunity for gain and that currency contracts create exposure to currencies in which the Portfolio's securities are not denominated. The use of foreign currency forward exchange contracts involves the risk of loss from the insolvency or bankruptcy of the counterparty to the contract or the failure of the counterparty to make payments or otherwise comply with the terms of the contract.
• Small and Medium Capitalization Companies. Investments in small and medium capitalization companies may involve greater risk than investments in larger, more established companies. The securities issued by small and medium capitalization companies may be less liquid and their prices subject to more abrupt or erratic price movements.
• Derivatives Risk. A derivative instrument often has risks similar to its underlying asset and may have additional risks, including imperfect correlation between the value of the derivative and the underlying asset, risks of default by the counterparty to certain transactions, magnification of losses incurred due to changes in the market value of the securities, instruments, indices or interest rates to which they relate and risks that the transactions may not be liquid. Certain derivative transactions may give rise to a form of leverage. Leverage magnifies the potential for gain and the risk of loss.
Shares of the Portfolio are not bank deposits and are not guaranteed or insured by the Federal Deposit Insurance Corporation or any other government agency.
Performance Information
The bar chart and table below provide some indication of the risks of investing in the Portfolio by showing changes in the Portfolio's Class I shares' performance from year-to-year and by showing how the Portfolio's average annual returns for the past one, five and 10 year periods compare with those of a broad measure of market performance, as well as an index that represents a group of similar mutual funds, over time. The performance of the other Classes will differ because the Classes
18
Morgan Stanley Institutional Fund, Inc. Prospectus
Portfolio Summary
International Equity Portfolio (Cont'd)
have different ongoing fees. The Portfolio's past performance, before and after taxes, is not necessarily an indication of how the Portfolio will perform in the future. Updated performance information is available online at www.morganstanley.com/im.
Annual Total Returns—Calendar Years
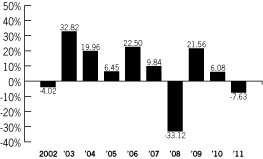
| High Quarter | | 6/30/09 | | | 18.41 | % | |
|
| Low Quarter | | 9/30/11 | | | –17.04 | % | |
|
Average Annual Total Returns
(for the calendar periods ended December 31, 2011)
| | | Past
One Year | | Past
Five Years | | Past
Ten Years | |
| Class I | | | | | | | |
| Return before Taxes | | | –7.63 | % | | | –2.63 | % | | | 5.72 | % | |
Return after Taxes on
Distributions | | | –7.93 | % | | | –3.71 | % | | | 4.44 | % | |
Return after Taxes on
Distributions and Sale of
Portfolio Shares | | | –4.46 | % | | | –2.21 | % | | | 4.94 | % | |
| Class P | | | | | | | |
| Return before Taxes | | | –7.83 | % | | | –2.88 | % | | | 5.47 | % | |
| Class H* | | | | | | | |
| Return before Taxes | | | N/A | | | | N/A | | | | N/A | | |
| Class L* | | | | | | | |
| Return before Taxes | | | N/A | | | | N/A | | | | N/A | | |
MSCI EAFE Index (reflects
no deduction for fees,
expenses or taxes)1 | | | –12.14 | % | | | –4.72 | % | | | 4.67 | % | |
Lipper International
Large-Cap Core Funds
Index (reflects no
deduction for taxes)2 | | | –13.56 | % | | | –4.96 | % | | | 3.91 | % | |
* As of December 31, 2011, the Fund had not commenced offering Class H and Class L shares of the Portfolio. The returns for Class H and Class L shares would be lower than the returns for Class I shares of the Portfolio as expenses of Class H and Class L are higher. Return information for the Portfolio's Class H and Class L shares will be shown in future prospectuses offering the Portfolio's Class H and Class L shares after the Portfolio's Class H and Class L shares have a full calendar year of return information to report.
1 The Morgan Stanley Capital International (MSCI) EAFE Index (Europe, Australasia, Far East) is a free float-adjusted market capitalization index that is designed to measure the international equity market performance of developed markets, excluding the United States and Canada. The term "free float" represents the portion of shares outstanding that are deemed to be available for purchase in the public equity markets by investors. The MSCI EAFE Index currently consists of 22 developed market country indices. The performance of the Index is listed in U.S. dollars and assumes reinvestment of net dividends. "Net dividends" reflects a reduction in dividends after taking into account withholding of taxes by certain foreign countries represented in the Index. It is not possible to invest directly in an index.
2 The Lipper International Large-Cap Core Funds Index is an equally weighted performance index of the largest qualifying funds (based on net assets) in the Lipper International Large-Cap Core Funds classification. There are currently 30 funds represented in this Index.
The after-tax returns shown in the table above are calculated using the historical highest individual federal marginal income tax rates during the period shown and do not reflect the impact of state and local taxes. After-tax returns for the Portfolio's other Classes will vary from Class I shares' returns. Actual after-tax returns depend on the investor's tax situation and may differ from those shown, and after-tax returns are not relevant to investors who hold their Portfolio shares through tax deferred arrangements such as 401(k) plans or individual retirement accounts. After-tax returns may be higher than before-tax returns due to an assumed benefit from capital losses that would have been realized had Portfolio shares been sold at the end of the relevant periods, as applicable.
Adviser. Morgan Stanley Investment Management Inc.
Sub-Advisers. Morgan Stanley Investment Management Limited and Morgan Stanley Investment Management Company.
Portfolio Managers. The Portfolio is managed by members of the International Equity team. Information about the members jointly and primarily responsible for the day-to-day management of the Portfolio is shown below:
| Name | | Title with
MSIM Limited | | Date Began
Managing
Portfolio | |
| William D. Lock | | Managing Director | | May 1999 | |
|
| Walter B. Riddell | | Managing Director | | May 1999 | |
|
| Vladimir A. Demine | | Executive Director | | June 2009 | |
|
| John S. Goodacre | | Executive Director | | February 2006 | |
|
| Bruno Paulson | | Executive Director | | June 2009 | |
|
| Name | | Title with
MSIM Company | | Date Began
Managing
Portfolio | |
| Peter J. Wright | | Managing Director | | May 1999 | |
|
| Christian Derold | | Executive Director | | May 2006 | |
|
19
International Equity Portfolio (Cont'd)
Purchase and Sale of Fund Shares
The Fund is not currently offering Class H and Class L shares of the Portfolio. The Fund may commence offering Class H and Class L shares of the Portfolio in the future. Any such offerings of the Portfolio's Class H and Class L shares may be limited in amount and may commence and terminate without any prior notice.
The minimum initial investment generally is $5,000,000 for Class I shares, $1,000,000 for Class P shares and $25,000 for each of Class H and Class L shares of the Portfolio. The minimum initial investment will be waived for certain investments. For more information, please refer to the "Shareholder Information—How To Purchase Class I, Class P and Class L Shares" and "—How To Purchase Class H Shares" sections beginning on pages 51 and 52, respectively, of this Prospectus.
Class I, Class P and Class L shares of the Portfolio may be purchased or sold on any day the New York Stock Exchange ("NYSE") is open for business directly through the Fund by mail (c/o Morgan Stanley Services Company Inc., P.O. Box 219804, Kansas City, MO 64121-9804) or by telephone (1-800-548-7786) or by contacting your financial intermediary.
For more information, please refer to the "Shareholder Information—How To Purchase Class I, Class P and Class L Shares" and "—How To Redeem Class I, Class P and Class L Shares" sections beginning on pages 51 and 54, respectively, of this Prospectus.
Class H shares of the Portfolio may be purchased or redeemed by contacting your authorized financial representative.
Tax Information
The Portfolio intends to make distributions that may be taxed as ordinary income or capital gains, unless you are investing through a tax-deferred arrangement, such as a 401(k) plan or an individual retirement account.
Payments to Broker-Dealers and Other Financial Intermediaries
If you purchase the Portfolio through a broker-dealer or other financial intermediary (such as a bank), the Adviser and/or the Portfolio's "Distributor," Morgan Stanley Distribution, Inc., may pay the intermediary for the sale of Portfolio shares and related services. These payments, which may be significant in amount, may create a conflict of interest by influencing the broker-dealer or other intermediary and your salesperson to recommend the Portfolio over another investment. Ask your salesperson or visit your financial intermediary's web site for more information.
20
Morgan Stanley Institutional Fund, Inc. Prospectus
Portfolio Summary
International Small Cap Portfolio
Objective
The International Small Cap Portfolio seeks long-term capital appreciation by investing primarily in equity securities of small non-U.S. companies.
Fees and Expenses
The table below describes the fees and expenses that you may pay if you buy and hold shares of the Portfolio. For shareholders of Class H shares, you may qualify for sales charge discounts if the cumulative net asset value ("NAV") of Class H shares of the Portfolio purchased in a single transaction, together with the NAV of all Class H shares of a portfolio of Morgan Stanley Institutional Fund, Inc. (the "Fund") or of a portfolio of Morgan Stanley Institutional Fund Trust held in related accounts, amounts to $50,000 or more. More information about these and other discounts is available from your financial adviser and in the "Shareholder Information—How To Purchase Class H Shares" section on page 52 of this Prospectus.
Shareholder Fees (fees paid directly from your investment)
| | | Class I | | Class P | | Class H | | Class L | |
Maximum
sales charge
(load) imposed
on purchases
(as a percentage
of offering price) | | | None | | | | None | | | | 4.75 | %† | | | None | | |
Redemption Fee
(as a percentage
of the amount
redeemed on
redemptions
made within
30 days of
purchase) | | | 2.00 | % | | | 2.00 | % | | | 2.00 | % | | | 2.00 | % | |
Annual Portfolio Operating Expenses (expenses that you pay each year as a percentage of the value of your investment)
| | | Class I | | Class P | | Class H | | Class L | |
| Advisory Fee | | | 0.95 | % | | | 0.95 | % | | | 0.95 | % | | | 0.95 | % | |
Distribution
and/or Service
(12b-1) Fee | | | None | | | | 0.25 | % | | | 0.25 | % | | | 0.75 | % | |
| Other Expenses | | | 0.24 | % | | | 0.24 | % | | | 0.24 | %‡ | | | 0.24 | %‡ | |
Total Annual
Portfolio
Operating
Expenses* | | | 1.19 | % | | | 1.44 | % | | | 1.44 | % | | | 1.94 | % | |
Fee Waiver
and/or Expense
Reimbursement* | | | 0.04 | % | | | 0.04 | % | | | 0.04 | % | | | 0.04 | % | |
Total Annual
Portfolio
Operating
Expenses After
Fee Waiver
and/or
Expense
Reimbursement* | | | 1.15 | % | | | 1.40 | % | | | 1.40 | % | | | 1.90 | % | |
Example
The example below is intended to help you compare the cost of investing in the Portfolio with the cost of investing in other mutual funds.
The example assumes that you invest $10,000 in the Portfolio, your investment has a 5% return each year and that the Portfolio's operating expenses remain the same. Although your actual costs may be higher or lower, based on these assumptions your costs would be:
| | | 1 Year | | 3 Years | | 5 Years | | 10 Years | |
| Class I | | $ | 117 | | | $ | 365 | | | $ | 633 | | | $ | 1,398 | | |
| Class P | | $ | 143 | | | $ | 443 | | | $ | 766 | | | $ | 1,680 | | |
| Class H | | $ | 611 | | | $ | 897 | | | $ | 1,204 | | | $ | 2,075 | | |
| Class L | | $ | 193 | | | $ | 597 | | | $ | 1,026 | | | $ | 2,222 | | |
† The sales charge is calculated as a percentage of the offering price. The sales charge is reduced for purchases of $50,000 and over. See "Shareholder Information—How To Purchase Class H Shares."
‡ Other expenses have been estimated for the Portfolio's Class H and Class L shares for the current fiscal year.
* The Portfolio's "Adviser," Morgan Stanley Investment Management Inc., has agreed to reduce its advisory fee and/or reimburse the Portfolio so that Total Annual Portfolio Operating Expenses, excluding certain investment related expenses, will not exceed 1.15% for Class I, 1.40% for Class P, 1.40% for Class H and 1.90% for Class L. The fee waivers and/or expense reimbursements will continue for at least one year or until such time as the Fund's Board of Directors acts to discontinue all or a portion of such waivers and/or reimbursements when it deems such action is appropriate.
Portfolio Turnover
The Portfolio pays transaction costs, such as commissions, when it buys and sells securities (or "turns over" its portfolio). A higher portfolio turnover rate may indicate higher transaction costs and may result in higher taxes when Portfolio shares are held in a taxable account. These costs, which are not reflected in Total Annual Portfolio Operating Expenses or in the Example, affect Portfolio performance. During the most recent fiscal year, the Portfolio's portfolio turnover rate was 64% of the average value of its portfolio.
Principal Investment Strategies
The Portfolio's "Sub-Adviser," Morgan Stanley Investment Management Limited ("MSIM Limited"), seeks to maintain a diversified portfolio of equity securities of small non-U.S. issuers based on individual stock selection. The Sub-Adviser emphasizes a bottom-up approach to investing that seeks to identify securities of issuers it believes are undervalued.
The Sub-Adviser selects issuers from a universe comprised of small cap companies (those with total market capitalizations of $5 billion or less) in non-U.S. markets, including emerging markets. In assessing investment
21
International Small Cap Portfolio (Cont'd)
opportunities, the Sub-Adviser considers value criteria with an emphasis on cash flow and the intrinsic value of company assets. Securities which appear undervalued according to these criteria are then subjected to in-depth fundamental analysis.
Under normal circumstances, at least 80% of the assets of the Portfolio will be invested in equity securities of non-U.S. small cap companies. The Portfolio's equity investments may include convertible securities.
The Portfolio may, but it is not required to, use derivative instruments for a variety of purposes, including hedging, risk management, portfolio management or to earn income. The Portfolio's use of derivatives may involve the purchase and sale of derivative instruments such as futures, options, swaps and contracts for difference ("CFDs"), and other related instruments and techniques. The Portfolio may utilize foreign currency forward exchange contracts, which are also derivatives, in connection with its investments in foreign securities.
Principal Risks
There is no assurance that the Portfolio will achieve its investment objective and you can lose money investing in this Portfolio. The principal risks of investing in the Portfolio include:
• Equity Securities. In general, prices of equity securities are more volatile than those of fixed income securities. The prices of equity securities will rise and fall in response to a number of different factors, including events that affect particular issuers as well as events that affect entire financial markets or industries. To the extent that the Portfolio invests in convertible securities, and the convertible security's investment value is greater than its conversion value, its price will be likely to increase when interest rates fall and decrease when interest rates rise. If the conversion value exceeds the investment value, the price of the convertible security will tend to fluctuate directly with the price of the underlying equity security.
• Small Cap Companies. Investments in small cap companies entail greater risks than those associated with larger, more established companies. Often the securities issued by small cap companies may be less liquid. Such companies may have more limited markets, financial resources and product lines, and may lack the depth of management of larger companies.
• Foreign and Emerging Market Securities. Investments in foreign markets entail special risks such as currency, political, economic and market risks. There also may be greater market volatility, less reliable financial information, higher transaction and custody costs, decreased market liquidity and less government and exchange regulation associated with investments in foreign markets. In addition, investments in certain foreign markets, which have historically been considered stable, may become more volatile and subject to increased risk due to ongoing developments and changing conditions in such markets. Moreover, the growing interconnectivity of global economies and financial markets has increased the probability that adverse developments and conditions in one country or region will affect the stability of economies and financial markets in other countries or regions. The risks of investing in emerging market countries are greater than risks associated with investments in foreign developed countries. In addition, the Portfolio's investments may be denominated in foreign currencies and therefore, changes in the value of a country's currency compared to the U.S. dollar may affect the value of the Portfolio's investments. Hedging the Portfolio's currency risks through foreign currency forward exchange contracts involves the risk of mismatching the Portfolio's objectives under a foreign currency forward exchange contract with the value of securities denominated in a particular currency. There is additional risk that such transactions reduce or preclude the opportunity for gain and that currency contracts create exposure to currencies in which the Portfolio's securities are not denominated. The use of foreign currency forward exchange contracts involves the risk of loss from the insolvency or bankruptcy of the counterparty to the contract or the failure of the counterparty to make payments or otherwise comply with the terms of the contract.
• Derivatives Risk. A derivative instrument often has risks similar to its underlying asset and may have additional risks, including imperfect correlation between the value of the derivative and the underlying asset, risks of default by the counterparty to certain transactions, magnification of losses incurred due to changes in the market value of the securities, instruments, indices or interest rates to which they relate and risks that the transactions may not be liquid. Certain derivative transactions may give rise to a form of leverage. Leverage magnifies the potential for gain and the risk of loss.
Shares of the Portfolio are not bank deposits and are not guaranteed or insured by the Federal Deposit Insurance Corporation or any other government agency.
Performance Information
The bar chart and table below provide some indication of the risks of investing in the Portfolio by showing changes in the Portfolio's Class I shares' performance from year-to-year and by showing how the Portfolio's average annual returns for the past one, five and 10 year periods and since inception compare with those of a broad measure of market performance, as well as an average that represents a group of similar mutual funds, over time. The performance of the other Classes will differ because the Classes have different ongoing fees. The Portfolio's past performance, before and after taxes, is not necessarily an indication of how the Portfolio will perform in the future. Updated performance information is available online at www.morganstanley.com/im.
22
Morgan Stanley Institutional Fund, Inc. Prospectus
Portfolio Summary
International Small Cap Portfolio (Cont'd)
Annual Total Returns—Calendar Years
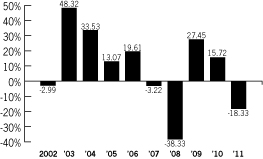
| High Quarter | | 6/30/09 | | | 25.75 | % | |
|
| Low Quarter | | 9/30/08 | | | –20.74 | % | |
|
Average Annual Total Returns
(for the calendar periods ended December 31, 2011)
| | | Past
One Year | | Past
Five Years | | Past
Ten Years | | Since
Inception | |
Class I (commenced
operations on 12/5/92) | |
Return before
Taxes | | | –18.33 | % | | | –6.39 | % | | | 6.45 | % | | | 8.29 | % | |
Return after
Taxes on
Distributions | | | –18.22 | % | | | –7.28 | % | | | 5.18 | % | | | 6.88 | % | |
Return after
Taxes on
Distributions
and Sale of
Portfolio Shares | | | –11.81 | % | | | –4.96 | % | | | 5.96 | % | | | 7.20 | % | |
MSCI EAFE
Small Cap
Total Return
Index (reflects
no deduction
for fees,
expenses
or taxes)1 | | | –15.94 | % | | | –4.14 | % | | | 9.01 | % | | | 4.93 | % | |
Lipper
International
Small/Mid-Cap
Value Funds
Average
(reflects no
deduction
for taxes)2 | | | –17.73 | % | | | –3.11 | % | | | 8.43 | % | | | 7.95 | % | |
Class P (commenced
operations on 10/21/08) | |
Return
before Taxes | | | –18.56 | % | | | N/A | | | | N/A | | | | 6.25 | % | |
MSCI EAFE
Small Cap
Total Return
Index (reflects
no deduction
for fees,
expenses
or taxes)1 | | | –15.94 | % | | | N/A | | | | N/A | | | | 12.11 | % | |
Lipper
International
Small/Mid-Cap
Value Funds
Average
(reflects
no deduction
for taxes)2 | | | –17.73 | % | | | N/A | | | | N/A | | | | 15.48 | % | |
| | | Past
One Year | | Past
Five Years | | Past
Ten Years | | Since
Inception | |
| Class H* | |
Return before
Taxes | | | N/A | | | | N/A | | | | N/A | | | | N/A | | |
| Class L* | |
Return before
Taxes | | | N/A | | | | N/A | | | | N/A | | | | N/A | | |
* As of December 31, 2011, the Fund had not commenced offering Class H and Class L shares of the Portfolio. The returns for Class H and Class L shares would be lower than the returns for Class I shares of the Portfolio as expenses of Class H and Class L are higher. Return information for the Portfolio's Class H and Class L shares will be shown in future prospectuses offering the Portfolio's Class H and Class L shares after the Portfolio's Class H and Class L shares have a full calendar year of return information to report.
1 The Morgan Stanley Capital International (MSCI) EAFE Small Cap Total Return Index is an unmanaged, market value weighted average of the performance of over 900 securities of companies listed on the stock exchanges of countries in Europe, Australasia and the Far East, including price performance and income from dividend payments. The performance of the Index is listed in U.S. dollars and assumes reinvestment of net dividends. "Net dividends" reflects a reduction in dividends after taking into account withholding of taxes by certain foreign countries represented in the Index. The MSCI EAFE Small Cap Total Return Index commenced as of January 31, 2002. Returns, including periods prior to January 31, 2002, are calculated using the return data of the MSCI EAFE Small Cap Index through January 30, 2002 and the return data of the MSCI EAFE Small Cap Total Return Index since January 31, 2002. It is not possible to invest directly in an index.
2 The Lipper International Small/Mid-Cap Value Funds Average tracks the performance of all funds in the Lipper International Small/Mid-Cap Value Funds classification.
The after-tax returns shown in the table above are calculated using the historical highest individual federal marginal income tax rates during the period shown and do not reflect the impact of state and local taxes. After-tax returns for the Portfolio's other Classes will vary from Class I shares' returns. Actual after-tax returns depend on the investor's tax situation and may differ from those shown, and after-tax returns are not relevant to investors who hold their Portfolio shares through tax deferred arrangements such as 401(k) plans or individual retirement accounts. After-tax returns may be higher than before-tax returns due to an assumed benefit from capital losses that would have been realized had Portfolio shares been sold at the end of the relevant periods, as applicable.
Adviser. Morgan Stanley Investment Management Inc.
Sub-Adviser. Morgan Stanley Investment Management Limited.
23
International Small Cap Portfolio (Cont'd)
Portfolio Managers. The Portfolio is managed by members of the International Small Cap team. Information about the members jointly and primarily responsible for the day-to-day management of the Portfolio is shown below:
| Name | | Title with
MSIM Limited | | Date Began
Managing
Portfolio | |
| Margaret Naylor | | Managing Director | | December 1992 | |
|
| Arthur Pollock | | Executive Director | | May 2000 | |
|
| Alistair Corden-Lloyd | | Executive Director | | April 2004 | |
|
| Alexander Vislykh | | Executive Director | | April 2009 | |
|
Purchase and Sale of Fund Shares
The minimum initial investment generally is $5,000,000 for Class I shares, $1,000,000 for Class P shares and $25,000 for each of Class H and Class L shares of the Portfolio. The minimum initial investment will be waived for certain investments. For more information, please refer to the "Shareholder Information—How To Purchase Class I, Class P and Class L Shares" and "—How To Purchase Class H Shares" sections beginning on pages 51 and 52, respectively, of this Prospectus.
Class I, Class P and Class L shares of the Portfolio may be purchased or sold on any day the New York Stock Exchange ("NYSE") is open for business directly through the Fund by mail (c/o Morgan Stanley Services Company Inc., P.O. Box 219804, Kansas City, MO 64121-9804) or by telephone (1-800-548-7786) or by contacting your financial intermediary.
For more information, please refer to the "Shareholder Information—How To Purchase Class I, Class P and Class L Shares" and "—How To Redeem Class I, Class P and Class L Shares" sections beginning on pages 51 and 54, respectively, of this Prospectus.
Class H shares of the Portfolio may be purchased or redeemed by contacting your authorized financial representative.
Tax Information
The Portfolio intends to make distributions that may be taxed as ordinary income or capital gains, unless you are investing through a tax-deferred arrangement, such as a 401(k) plan or an individual retirement account.
Payments to Broker-Dealers and Other Financial Intermediaries
If you purchase the Portfolio through a broker-dealer or other financial intermediary (such as a bank), the Adviser and/or the Portfolio's "Distributor," Morgan Stanley Distribution, Inc., may pay the intermediary for the sale of Portfolio shares and related services. These payments, which may be significant in amount, may create a conflict of interest by influencing the broker-dealer or other intermediary and your salesperson to recommend the Portfolio over another investment. Ask your salesperson or visit your financial intermediary's web site for more information.
24
Morgan Stanley Institutional Fund, Inc. Prospectus
Portfolio Summary
Select Global Infrastructure Portfolio
Objective
The Select Global Infrastructure Portfolio seeks to provide both capital appreciation and income.
Fees and Expenses
The table below describes the fees and expenses that you may pay if you buy and hold shares of the Portfolio. For shareholders of Class H shares, you may qualify for sales charge discounts if the cumulative net asset value ("NAV") of Class H shares of the Portfolio purchased in a single transaction, together with the NAV of all Class H shares of a portfolio of Morgan Stanley Institutional Fund, Inc. (the "Fund") or of a portfolio of Morgan Stanley Institutional Fund Trust held in related accounts, amounts to $50,000 or more. More information about these and other discounts is available from your financial adviser and in the "Shareholder Information—How To Purchase Class H Shares" section on page 52 of this Prospectus.
Shareholder Fees (fees paid directly from your investment)
| | | Class I | | Class P | | Class H | | Class L | |
Maximum
sales charge
(load)
imposed on
purchases
(as a
percentage
of offering
price) | | | None | | | | None | | | | 4.75 | %† | | | None | | |
Annual Portfolio Operating Expenses (expenses that you pay each year as a percentage of the value of your investment)
| | | Class I | | Class P | | Class H | | Class L | |
| Advisory Fee | | | 0.85 | % | | | 0.85 | % | | | 0.85 | % | | | 0.85 | % | |
Distribution
and/or
Service (12b-1)
Fee | | | None | | | | 0.25 | % | | | 0.25 | % | | | 0.75 | % | |
Other
Expenses | | | 2.08 | % | | | 2.08 | % | | | 2.08 | % | | | 2.08 | % | |
Total Annual
Portfolio
Operating
Expenses* | | | 2.93 | % | | | 3.18 | % | | | 3.18 | % | | | 3.68 | % | |
Fee Waiver
and/or Expense
Reimbursement* | | | 1.78 | % | | | 1.78 | % | | | 1.78 | % | | | 1.78 | % | |
Total Annual
Portfolio
Operating
Expenses After
Fee Waiver
and/or Expense
Reimbursement* | | | 1.15 | % | | | 1.40 | % | | | 1.40 | % | | | 1.90 | % | |
Example
The example below is intended to help you compare the cost of investing in the Portfolio with the cost of investing in other mutual funds.
The example assumes that you invest $10,000 in the Portfolio, your investment has a 5% return each year and that the Portfolio's operating expenses remain the same. Although your actual costs may be higher or lower, based on these assumptions your costs would be:
| | | 1 Year | | 3 Years | | 5 Years | | 10 Years | |
| Class I | | $ | 117 | | | $ | 365 | | | $ | 633 | | | $ | 1,398 | | |
| Class P | | $ | 143 | | | $ | 443 | | | $ | 766 | | | $ | 1,680 | | |
| Class H | | $ | 611 | | | $ | 897 | | | $ | 1,204 | | | $ | 2,075 | | |
| Class L | | $ | 193 | | | $ | 597 | | | $ | 1,026 | | | $ | 2,222 | | |
† The sales charge is calculated as a percentage of the offering price. The sales charge is reduced for purchases of $50,000 and over. See "Shareholder Information—How To Purchase Class H Shares."
* The Portfolio's "Adviser," Morgan Stanley Investment Management Inc., has agreed to reduce its advisory fee and/or reimburse the Portfolio so that Total Annual Portfolio Operating Expenses, excluding certain investment related expenses, will not exceed 1.15% for Class I, 1.40% for Class P, 1.40% for Class H and 1.90% for Class L. The fee waivers and/or expense reimbursements will continue for at least one year or until such time as the Fund's Board of Directors acts to discontinue all or a portion of such waivers and/or reimbursements when it deems such action is appropriate.
Portfolio Turnover
The Portfolio pays transaction costs when it buys and sells securities (or "turns over" its portfolio). A higher portfolio turnover rate may indicate higher transaction costs and may result in higher taxes when Portfolio shares are held in a taxable account. These costs, which are not reflected in Total Annual Portfolio Operating Expenses or in the Example, affect Portfolio performance. During the most recent fiscal year, the Portfolio's portfolio turnover rate was 51% of the average value of its portfolio.
Principal Investment Strategies
The Portfolio normally invests at least 80% of its assets in equity securities issued by companies located throughout the world that are engaged in the infrastructure business. A company is considered to be in the infrastructure business if it derives at least 50% of its revenues or earnings from, or devotes at least 50% of its assets to, infrastructure-related activities. Infrastructure refers to the systems and networks of energy, transportation, communication and other services required for the normal function of society. The Portfolio's equity investments may include convertible securities. The Portfolio's investments may include securities of small and medium capitalization companies. The Portfolio may invest up to 100% of its net assets in foreign securities, which may include emerging market securities. Under normal market conditions, the Portfolio invests at least 40% of its assets in the securities of issuers located outside of the United States.
The Portfolio's Adviser and/or "Sub-Advisers," Morgan Stanley Investment Management Limited ("MSIM Limited") and Morgan Stanley Investment Management Company ("MSIM Company"), shift the Portfolio's assets between the different types of companies in the
25
Select Global Infrastructure
Portfolio (Cont'd)
infrastructure business described above based on relative valuation, underlying company fundamentals, and demographic and macroeconomic considerations. Utility companies represent a significant component of the universe of companies engaged in the infrastructure business. These companies may include traditionally regulated public utilities or fully or partially deregulated utility companies as well as unregulated utility companies and energy-related and telecommunications-related companies. The Portfolio has a fundamental policy (i.e., one that cannot be changed without shareholder approval) of investing 25% or more of its assets in the utilities industry.
In selecting securities to buy, hold or sell for the Portfolio, the Adviser and/or Sub-Advisers actively manage the Portfolio using a combination of bottom-up and top-down methodologies. The value-driven approach to bottom-up security selection utilizes proprietary research models to identify infrastructure companies that offer the best value relative to their underlying assets and growth prospects. The top-down allocation provides exposure to major economic infrastructure sectors and countries, with an overweighting to those sectors/countries that offer the best relative valuation. The Adviser and/or Sub-Advisers generally consider selling a portfolio holding when it determines that the holding no longer satisfies its investment criteria.
Principal Risks
There is no assurance that the Portfolio will achieve its investment objective and you can lose money investing in this Portfolio. The principal risks of investing in the Portfolio include:
• Infrastructure-Related Companies. Because the Portfolio focuses its investments in infrastructure-related companies, the Portfolio has greater exposure to the potential adverse economic, regulatory, political and other changes affecting such entities. Infrastructure-related companies are subject to a variety of factors that may adversely affect their business or operations including high interest costs in connection with capital construction programs, costs associated with compliance with and changes in environmental and other regulations, difficulty in raising capital in adequate amounts on reasonable terms in periods of high inflation and unsettled capital markets, the effects of surplus capacity, increased competition from other providers of services in a developing deregulatory environment, uncertainties concerning the availability of fuel at reasonable prices, the effects of energy conservation policies and other factors.
Other factors that may affect the operations of infrastructure-related companies include innovations in technology, significant changes to the number of ultimate end-users of a company's products, increased susceptibility to terrorist acts, risks of environmental damage due to a company's operations or an accident, and general changes in market sentiment towards infrastructure and utilities assets.
• Utilities Industry. Changing regulation constitutes one of the key industry-specific risks for the Portfolio. State and other regulators often monitor and control utility revenues and costs. Regulatory authorities also may restrict a company's access to new markets. The deregulation of certain utility companies may subject these companies to greater risks of loss. Individual sectors of the utility market are subject to additional risks. These risks apply to all utility companies—regulated, fully or partially deregulated, and unregulated.
Certain utility companies may incur unexpected increases in fuel and other operating costs. They are adversely affected when long-term interest rates rise. Long-term borrowings are used to finance most utility investments, and rising interest rates lead to higher financing costs and reduced earnings. There are also considerable costs associated with environmental compliance, nuclear waste clean-up and safety regulation. Increasingly, regulators are calling upon electric utilities to bear these added costs, and there is a risk that these costs will not be fully recovered through an increase in revenues.
• Equity Securities. In general, prices of equity securities are more volatile than those of fixed income securities. The prices of equity securities will rise and fall in response to a number of different factors, including events that affect particular issuers as well as events that affect entire financial markets or industries. To the extent that the Portfolio invests in convertible securities, and the convertible security's investment value is greater than its conversion value, its price will be likely to increase when interest rates fall and decrease when interest rates rise. If the conversion value exceeds the investment value, the price of the convertible security will tend to fluctuate directly with the price of the underlying equity security.
• Small and Medium Capitalization Companies. Investments in small and medium capitalization companies may involve greater risk than investments in larger, more established companies. The securities issued by small and medium capitalization companies may be less liquid and their prices subject to more abrupt or erratic price movements.
• Foreign and Emerging Market Securities. Investments in foreign markets entail special risks such as currency, political, economic and market risks. There also may be greater market volatility, less reliable financial information, higher transaction and custody costs, decreased market liquidity and less government and exchange regulation associated with investments in foreign markets. In addition, investments in certain foreign markets, which have historically been considered stable, may become more volatile and subject to increased risk due to ongoing developments and changing conditions in such markets. Moreover, the growing interconnectivity of global economies and financial markets has increased the probability that adverse developments and
26
Morgan Stanley Institutional Fund, Inc. Prospectus
Portfolio Summary
Select Global Infrastructure
Portfolio (Cont'd)
conditions in one country or region will affect the stability of economies and financial markets in other countries or regions. The risks of investing in emerging market countries are greater than risks associated with investments in foreign developed countries. In addition, the Portfolio's investments may be denominated in foreign currencies and therefore, changes in the value of a country's currency compared to the U.S. dollar may affect the value of the Portfolio's investments.
• Non-Diversified Risk. Because the Portfolio is non-diversified, it may be more susceptible to an adverse event affecting a portfolio investment than a diversified portfolio and a decline in the value of that instrument would cause the Portfolio's overall value to decline to a greater degree.
Shares of the Portfolio are not bank deposits and are not guaranteed or insured by the Federal Deposit Insurance Corporation or any other government agency.
Performance Information
The bar chart and table below provide some indication of the risks of investing in the Portfolio by showing the Portfolio's Class I shares' performance for one year and by showing how the Portfolio's average annual returns for the past one year period and since inception compare with those of a broad measure of market performance, as well as a comparative sector index, over time. The performance of the other Classes will differ because the Classes have different ongoing fees. The Portfolio's returns in the table include the maximum applicable sales charge for Class H and assume you sold your shares at the end of each period (unless otherwise noted). The Portfolio's past performance, before and after taxes, is not necessarily an indication of how the Portfolio will perform in the future. Updated performance information is available online at www.morganstanley.com/im.
Annual Total Returns—Calendar Years
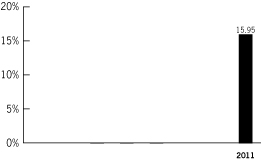
| High Quarter | | 12/31/11 | | | 11.15 | % | |
|
| Low Quarter | | 9/30/11 | | | –6.54 | % | |
|
Average Annual Total Returns
(for the calendar periods ended December 31, 2011)
| | | Past
One Year | | Since
Inception | |
Class I (commenced
operations on 9/20/10) | | | | | | | | | |
| Return before Taxes | | | 15.95 | % | | | 16.57 | % | |
| Return after Taxes on Distributions | | | 14.82 | % | | | 15.66 | % | |
Return after Taxes on Distributions
and Sale of Portfolio Shares | | | 11.10 | % | | | 13.92 | % | |
Class P (commenced
operations on 9/20/10) | |
| Return before Taxes | | | 15.67 | % | | | 16.29 | % | |
Class H (commenced
operations on 9/20/10) | |
| Return before Taxes | | | 10.17 | % | | | 11.94 | % | |
Class L (commenced
operations on 9/20/10) | |
| Return before Taxes | | | 15.12 | % | | | 15.73 | % | |
Dow Jones Brookfield Global
Infrastructure IndexSM (reflects no
deduction for fees, expenses or taxes)1 | | | 13.75 | % | | | 15.80 | % | |
S&P Global BMI Index (reflects no
deduction for fees, expenses or taxes)2 | | | –7.72 | % | | | 1.77 | % | |
1 The Dow Jones Brookfield Global Infrastructure IndexSM is a float-adjusted market capitalization weighted index that measures the stock performance of companies that exhibit strong infrastructure characteristics. The Index intends to measure all sectors of the infrastructure market. It is not possible to invest directly in an index.
2 The Standard & Poor's Global BMI Index (S&P Global BMI Index) is a broad market index designed to capture exposure to equities in all countries in the world that meet minimum size and liquidity requirements. As of the date of this Prospectus, there are approximately 11,000 index members representing 26 developed and 20 emerging market countries. It is not possible to invest directly in an index.
The after-tax returns shown in the table above are calculated using the historical highest individual federal marginal income tax rates during the period shown and do not reflect the impact of state and local taxes. After-tax returns for the Portfolio's other Classes will vary from Class I shares' returns. Actual after-tax returns depend on the investor's tax situation and may differ from those shown, and after-tax returns are not relevant to investors who hold their Portfolio shares through tax deferred arrangements such as 401(k) plans or individual retirement accounts. After-tax returns may be higher than before-tax returns due to an assumed benefit from capital losses that would have been realized had Portfolio shares been sold at the end of the relevant periods, as applicable.
Adviser. Morgan Stanley Investment Management Inc.
27
Select Global Infrastructure
Portfolio (Cont'd)
Sub-Advisers. Morgan Stanley Investment Management Limited and Morgan Stanley Investment Management Company.
Portfolio Managers. The Portfolio is managed by members of the Global Infrastructure Securities team. Information about the members jointly and primarily responsible for the day-to-day management of the Portfolio is shown below:
| Name | | Title with
Adviser | | Date Began
Managing
Portfolio | |
| Theodore R. Bigman | | Managing Director | | Since 2010 | |
|
| Matthew King | | Vice President | | Since 2010 | |
|
Purchase and Sale of Fund Shares
The minimum initial investment generally is $5,000,000 for Class I shares, $1,000,000 for Class P shares and $25,000 for each of Class H and Class L shares of the Portfolio. The minimum initial investment will be waived for certain investments. For more information, please refer to the "Shareholder Information—How To Purchase Class I, Class P and Class L Shares" and "—How To Purchase Class H Shares" sections beginning on pages 51 and 52, respectively of this Prospectus.
Class I, Class P and Class L shares of the Portfolio may be purchased or sold on any day the New York Stock Exchange ("NYSE") is open for business directly through the Fund by mail (c/o Morgan Stanley Services Company Inc., P.O. Box 219804, Kansas City, MO 64121-9804) or by telephone (1-800-548-7786) or by contacting your financial intermediary.
For more information, please refer to the "Shareholder Information—How To Purchase Class I, Class P and Class L Shares" and "—How To Redeem Class I, Class P and Class L Shares" sections beginning on pages 51 and 54, respectively, of this Prospectus.
Class H shares of the Portfolio may be purchased or redeemed by contacting your authorized financial representative.
Tax Information
The Portfolio intends to make distributions that may be taxed as ordinary income or capital gains, unless you are investing through a tax-deferred arrangement, such as a 401(k) plan or an individual retirement account.
Payments to Broker-Dealers and Other Financial Intermediaries
If you purchase the Portfolio through a broker-dealer or other financial intermediary (such as a bank), the Adviser and/or the Portfolio's "Distributor," Morgan Stanley Distribution, Inc., may pay the intermediary for the sale of Portfolio shares and related services. These payments, which may be significant in amount, may create a conflict of interest by influencing the broker-dealer or other intermediary and your salesperson to recommend the Portfolio over another investment. Ask your salesperson or visit your financial intermediary's web site for more information.
28
Morgan Stanley Institutional Fund, Inc. Prospectus
Details of the Portfolios
Active International Allocation Portfolio
Objective
The Active International Allocation Portfolio seeks long-term capital appreciation by investing primarily, in accordance with country and sector weightings determined by the Adviser, in equity securities of non-U.S. issuers which, in the aggregate, replicate broad market indices.
Approach
The Adviser seeks to maintain a diversified portfolio of international equity securities based on a top-down approach that emphasizes region, country, sector and industry selection and weighting rather than individual stock selection. The Adviser seeks to capitalize on the significance of region, country, sector and industry selection in international equity portfolio returns by over and underweighting countries and/or sectors based primarily on three factors: (i) valuation; (ii) dynamics/fundamental change; and (iii) market momentum/technicals.
Process
The Adviser's Active International Allocation team analyzes both the global economic environment and the economies of countries throughout the world, focusing mainly on the industrialized countries comprising the MSCI EAFE Index. EAFE countries include Japan, most nations in Western Europe, Australia, New Zealand, Hong Kong and Singapore. The Adviser views each region, country, sector and industry as a unique investment opportunity and evaluates factors such as valuation, growth, inflation, interest rates, corporate earnings growth, liquidity and risk characteristics, investor sentiment and economic and currency outlook. The Adviser—on an ongoing basis—establishes the proportion or weighting for each region, country, sector and/or industry (e.g., overweight, underweight or neutral) relative to the MSCI EAFE Index for investment by the Portfolio. The Adviser invests the Portfolio's assets within each region, country, sector and/or industry based on its assigned weighting. Within each region, country, sector and/or industry, the Adviser will try to broadly replicate, in the aggregate, the performance of a broad local market index by investing in "baskets" of common stocks and other equity securities. In most cases, the local MSCI index for that country will be one of the broad local market indices. The equity securities in which the Portfolio may invest include common stock, preferred stock, convertible securities, depositary receipts, rights and warrants. The Portfolio may invest in emerging market or developing countries and, with regard to such investments, may make global, regional and sector allocations to emerging markets, as well as allocations to specific emerging market or developing countries. The Adviser generally considers selling a portfolio holding when it determines that the holding no longer satisfies its investment criteria.
The Portfolio may, but it is not required to, use derivative instruments for a variety of purposes, including hedging, risk management, portfolio management or to earn income. Derivatives are financial instruments whose value is based on the value of an underlying asset, interest rate, index or financial instrument. The Portfolio's use of derivatives may involve the purchase and sale of derivative instruments such as futures, options, swaps and CFDs, and other related instruments and techniques. The Portfolio may utilize foreign currency forward exchange contracts, which are also derivatives, in connection with its investments in foreign securities. Derivative instruments used by the Portfolio will be counted toward the Portfolio's exposure in the types of securities listed above to the extent they have economic characteristics similar to such securities.
Risks
The Portfolio's principal investment strategies are subject to the following principal risks:
Investing in the Portfolio may be appropriate for you if you are willing to accept the risks and uncertainties of investing in the equity securities of issuers in foreign countries, including emerging market or developing countries. In general, prices of equity securities are more volatile than those of fixed income securities. The prices of equity securities will rise and fall in response to a number of different factors. In particular, prices of equity securities will respond to events that affect entire financial markets or industries (changes in inflation or consumer demand, for example) and to events that affect particular issuers (news about the success or failure of a new product, for example). In addition, at times the Portfolio's market sector, foreign equity securities, may underperform relative to other sectors or the overall market.
To the extent that the Portfolio invests in convertible securities, and the convertible security's investment value is greater than its conversion value, its price will be likely to increase when interest rates fall and decrease when interest rates rise. If the conversion value exceeds the investment value, the price of the convertible security will tend to fluctuate directly with the price of the underlying equity security.
Investing in the securities of foreign issuers, particularly those located in emerging market or developing countries, entails the risk that news and events unique to a country or region will affect those markets and their issuers. The value of the Portfolio's shares may vary widely in response to political and economic factors affecting companies in foreign countries. These same events will not necessarily have an effect on the U.S. economy or similar issuers located in the United States. In addition, investments in certain foreign markets, which have historically been considered stable, may become more
29
Active International Allocation Portfolio (Cont'd)
volatile and subject to increased risk due to ongoing developments and changing conditions in such markets. Moreover, the growing interconnectivity of global economies and financial markets has increased the probability that adverse developments and conditions in one country or region will affect the stability of economies and financial markets in other countries or regions. Furthermore, the Portfolio's investments in foreign issuers generally will be denominated in foreign currencies. As a result, changes in the value of a country's currency compared to the U.S. dollar may affect the value of the Portfolio's investments. These changes may occur separately from and in response to events that do not otherwise affect the value of the security in the issuer's home country. Hedging the Portfolio's currency risks through foreign currency forward exchange contracts involves the risk of mismatching the Portfolio's objectives under a foreign currency forward exchange contract with the value of securities denominated in a particular currency. Furthermore, such transactions reduce or preclude the opportunity for gain if the value of the currency should move in the direction opposite to the position taken. There is additional risk to the effect that currency contracts create exposure to currencies in which the Portfolio's securities are not denominated. Unanticipated changes in currency prices may result in poorer overall performance for the Portfolio than if it had not entered into such contracts. The use of foreign currency forward exchange contracts involves the risk of loss from the insolvency or bankruptcy of the counterparty to the contract or the failure of the counterparty to make payments or otherwise comply with the terms of the contract.
A derivative instrument often has risks similar to its underlying asset and may have additional risks, including imperfect correlation between the value of the derivative and the underlying asset, risks of default by the counterparty to certain transactions, magnification of losses incurred due to changes in the market value of the securities, instruments, indices or interest rates to which they relate, and risks that the transactions may not be liquid. Certain derivative transactions may give rise to a form of leverage. Leverage magnifies the potential for gain and the risk of loss.
Please see "Additional Information about the Portfolios' Investment Strategies and Related Risks" for further information about these and other risks of investing in the Portfolio.
30
Morgan Stanley Institutional Fund, Inc. Prospectus
Details of the Portfolios
Asian Equity Portfolio
Objective
The Asian Equity Portfolio seeks long-term capital appreciation.
The Portfolio's investment objective may be changed by the Fund's Board of Directors without shareholder approval, but no change is anticipated. If the Portfolio's investment objective changes, the Portfolio will notify shareholders and shareholders should consider whether the Portfolio remains an appropriate investment in light of the change.
Approach
The Adviser and/or Sub-Adviser seek to achieve the Portfolio's investment objective by investing primarily in equity securities of companies in the Asia-Pacific region, excluding Japan. The Adviser and/or Sub-Adviser combine a top-down investment approach that focuses on country, sector and thematic allocation with a bottom-up approach for stock selection. Investment selection criteria include attractive growth characteristics, reasonable valuations and company managements with strong shareholder value orientation.
Process
The Adviser's and/or Sub-Adviser's global strategists analyze the global economic environment, particularly its impact on markets within the Asia-Pacific region, and allocate the Portfolio's assets among countries in the Asia-Pacific region, excluding Japan, based on relative economic, political and social fundamentals, stock valuations and investor sentiment. The Adviser and/or Sub-Adviser invest in countries based on the work of country specialists who conduct extensive fundamental analysis of companies within these markets and seek to identify companies with strong earnings growth prospects. To manage risk, the Adviser and/or Sub-Adviser emphasize global macroeconomic and fundamental research. The Adviser and/or Sub-Adviser generally consider selling a portfolio holding when it determines that the holding no longer satisfies its investment criteria.
Under normal circumstances, at least 80% of the Portfolio's assets will be invested in equity securities of issuers located in Asia-Pacific region. This policy may be changed without shareholder approval; however, you would be notified in writing of any changes. The Portfolio's equity investments may include convertible securities.
The Adviser and/or Sub-Adviser consider an issuer to be located in the Asia-Pacific region if (i) its principal securities trading market is in the Asia-Pacific region, (ii) alone or on a consolidated basis it derives 50% or more of its annual revenue from goods produced, sales made or services performed in the Asia-Pacific region or (iii) it is organized under the laws of, or has a principal office in, the Asia-Pacific region. By applying this test, it is possible that a particular issuer could be deemed to be from more than one region.
The Portfolio invests in established markets of the Asia-Pacific region, such as China, Hong Kong, India, Indonesia, Korea, Malaysia, Philippines, Singapore, Taiwan, Thailand, Australia and New Zealand, but additional opportunities are also sought, whenever regulations permit, in any of the emerging markets in the Asia-Pacific region.
The Portfolio may, but it is not required to, use derivative instruments for a variety of purposes, including hedging, risk management, portfolio management or to earn income. Derivatives are financial instruments whose value is based on the value of an underlying asset, interest rate, index or financial instrument. The Portfolio's use of derivatives may involve the purchase and sale of derivative instruments such as futures, swaps, CFDs and structured investments, and other related instruments and techniques. The Portfolio may utilize foreign currency forward exchange contracts, which are also derivatives, in connection with its investments in foreign securities. Derivative instruments used by the Portfolio will be counted toward the 80% policy discussed above to the extent they have economic characteristics similar to the securities included within that policy.
Risks
The Portfolio's principal investment strategies are subject to the following principal risks:
The small size of securities markets and the low trading volume in many countries in the Asia-Pacific region may lead to a lack of liquidity. Also, some Asian economies and financial markets have been extremely volatile in recent years. Many of the countries in the region are developing, both politically and economically. They may have relatively unstable governments and economies based on only a few commodities or industries. The share prices of companies in the region tend to be volatile and there is a significant possibility of loss. Also, some companies in the region may have less established product markets or a small management group and they may be more vulnerable to political or economic conditions, like nationalization. In addition, some countries have restricted the flow of money in and out of the country.
Many of the currencies in the Asia-Pacific region have recently experienced extreme volatility relative to the U.S. dollar. For example, Thailand, Indonesia, the Philippines and South Korea have had currency crises and have sought help from the International Monetary Fund. Holding securities in currencies that are devalued (or in companies whose revenues are substantially in currencies that are devalued) will likely decrease the value of the Portfolio.
31
Asian Equity Portfolio (Cont'd)
The trading volume on some Asian stock exchanges is much lower than in the United States, and Asian securities of some companies are less liquid and more volatile than similar U.S. securities. In addition, brokerage commissions on regional stock exchanges are fixed and are generally higher than the negotiated commissions in the United States. Because the Portfolio concentrates in a single region of the world, the Portfolio's performance may be more volatile than that of a fund that invests globally. If Asian securities fall out of favor, it may cause the Portfolio to underperform funds that do not concentrate in a single region of the world.
Investing in the Portfolio may be appropriate for you if you are willing to accept the risks and uncertainties of investing in a portfolio of equity securities issued by companies located in the Asia-Pacific region, excluding Japan. In general, prices of equity securities are more volatile than those of fixed income securities. The prices of equity securities will rise and fall in response to a number of different factors. In particular, prices of equity securities will respond to events that affect entire financial markets or industries (changes in inflation or consumer demand, for example) and to events that affect particular issuers (news about the success or failure of a new product, for example).
To the extent that the Portfolio invests in convertible securities, and the convertible security's investment value is greater than its conversion value, its price will be likely to increase when interest rates fall and decrease when interest rates rise. If the conversion value exceeds the investment value, the price of the convertible security will tend to fluctuate directly with the price of the underlying equity security.
Investing in the securities of foreign issuers, particularly those located in emerging market or developing countries, entails the risk that news and events unique to a country or region will affect those markets and their issuers. The value of the Portfolio's shares may vary widely in response to political and economic factors affecting companies in foreign countries. These same events will not necessarily have an effect on the U.S. economy or similar issuers located in the United States. In addition, investments in certain foreign markets, which have historically been considered stable, may become more volatile and subject to increased risk due to ongoing developments and changing conditions in such markets. Moreover, the growing interconnectivity of global economies and financial markets has increased the probability that adverse developments and conditions in one country or region will affect the stability of economies and financial markets in other countries or regions. Furthermore, a substantial portion of the Portfolio's investments in foreign issuers may be denominated in foreign currencies. As a result, changes in the value of a country's currency compared to the U.S. dollar may affect the value of the Portfolio's investments. These changes may occur separately from and in response to events that do not otherwise affect the value of the security in the issuer's home country. Hedging the Portfolio's currency risks through foreign currency forward exchange contracts involves the risk of mismatching the Portfolio's objectives under a foreign currency forward exchange contract with the value of securities denominated in a particular currency. Furthermore, such transactions reduce or preclude the opportunity for gain if the value of the currency should move in the direction opposite to the position taken. There is additional risk to the effect that currency contracts create exposure to currencies in which the Portfolio's securities are not denominated. Unanticipated changes in currency prices may result in poorer overall performance for the Portfolio than if it had not entered into such contracts. The use of foreign currency forward exchange contracts involves the risk of loss from the insolvency or bankruptcy of the counterparty to the contract or the failure of the counterparty to make payments or otherwise comply with the terms of the contract.
A derivative instrument often has risks similar to its underlying asset and may have additional risks, including imperfect correlation between the value of the derivative and the underlying asset, risks of default by the counterparty to certain transactions, magnification of losses incurred due to changes in the market value of the securities, instruments, indices or interest rates to which they relate, and risks that the transactions may not be liquid. Certain derivative transactions may give rise to a form of leverage. Leverage magnifies the potential for gain and the risk of loss.
Please see "Additional Information about the Portfolios' Investment Strategies and Related Risks" for further information about these and other risks of investing in the Portfolio.
32
Morgan Stanley Institutional Fund, Inc. Prospectus
Details of the Portfolios
Emerging Markets Portfolio
Objective
The Emerging Markets Portfolio seeks long-term capital appreciation by investing primarily in growth-oriented equity securities of issuers in emerging market countries.
Approach
The Adviser and Sub-Advisers seek to maximize returns by investing primarily in growth-oriented equity securities in emerging markets. The Adviser's and Sub-Advisers' investment approach combines top-down country allocation with bottom-up stock selection. Investment selection criteria include attractive growth characteristics, reasonable valuations and company managements with strong shareholder value orientation.
Process
The Adviser's and Sub-Advisers' global strategists analyze the global economic environment, particularly its impact on emerging markets, and allocate the Portfolio's assets among emerging markets based on relative economic, political and social fundamentals, stock valuations and investor sentiment. The Adviser and/or Sub-Advisers invest in countries based on the work of country specialists who conduct extensive fundamental analysis of companies within these markets and seeks to identify companies with strong earnings growth prospects. To manage risk, the Adviser and/or Sub-Advisers emphasize macroeconomic and fundamental research. The Adviser and/or Sub-Advisers generally consider selling a portfolio holding when they determines that the holding no longer satisfies its investment criteria.
Under normal circumstances, at least 80% of the Portfolio's assets will be invested in equity securities of issuers located in emerging market countries. This policy may be changed without shareholder approval; however, you would be notified in writing of any changes. The Portfolio's equity investments may include convertible securities.
The Adviser and/or Sub-Advisers consider an issuer to be located in an emerging market country if (i) its principal securities trading market is in an emerging market country, (ii) alone or on a consolidated basis it derives 50% or more of its annual revenue from goods produced, sales made or services performed in emerging market countries or (iii) it is organized under the laws of, or has a principal office in, an emerging market country. By applying this test, it is possible that a particular issuer could be deemed to be from more than one emerging market country.
Emerging market or developing countries are countries that major international financial institutions, such as the World Bank or the Portfolio's benchmark index, generally consider to be less economically mature than developed nations, such as the United States or most nations in Western Europe. Emerging market or developing countries can include every nation in the world except the United States, Canada, Japan, Australia, New Zealand and most countries located in Western Europe.
The Portfolio may, but it is not required to, use derivative instruments for a variety of purposes, including hedging, risk management, portfolio management or to earn income. Derivatives are financial instruments whose value is based on the value of an underlying asset, interest rate, index or financial instrument. The Portfolio's use of derivatives may involve the purchase and sale of derivative instruments such as futures, swaps and CFDs, and other related instruments and techniques. The Portfolio may utilize foreign currency forward exchange contracts, which are also derivatives, in connection with its investments in foreign securities. Derivative instruments used by the Portfolio will be counted toward the 80% policy discussed above to the extent they have economic characteristics similar to the securities included within that policy.
Risks
The Portfolio's principal investment strategies are subject to the following principal risks:
Investing in the Portfolio may be appropriate for you if you are willing to accept the risks and uncertainties of investing in the equity securities of issuers in emerging markets. In general, prices of equity securities are more volatile than those of fixed income securities. The prices of equity securities will rise and fall in response to a number of different factors. In particular, prices of equity securities will respond to events that affect entire financial markets or industries (changes in inflation or consumer demand, for example) and to events that affect particular issuers (news about the success or failure of a new product, for example).
To the extent that the Portfolio invests in convertible securities, and the convertible security's investment value is greater than its conversion value, its price will be likely to increase when interest rates fall and decrease when interest rates rise. If the conversion value exceeds the investment value, the price of the convertible security will tend to fluctuate directly with the price of the underlying equity security.
Investing in the securities of foreign issuers, particularly those located in emerging market or developing countries, entails the risk that news and events unique to a country or region will affect those markets and their issuers. The value of the Portfolio's shares may vary widely in response to political and economic factors affecting companies in foreign countries. These same events will not necessarily have an effect on the U.S. economy or similar issuers located in the United States. In addition, investments in certain foreign markets, which have historically been considered stable, may become more volatile and subject to increased risk due to ongoing
33
Emerging Markets Portfolio (Cont'd)
developments and changing conditions in such markets. Moreover, the growing interconnectivity of global economies and financial markets has increased the probability that adverse developments and conditions in one country or region will affect the stability of economies and financial markets in other countries or regions. Furthermore, the Portfolio's investments in foreign issuers generally will be denominated in foreign currencies. As a result, changes in the value of a country's currency compared to the U.S. dollar may affect the value of the Portfolio's investments. These changes may occur separately from and in response to events that do not otherwise affect the value of the security in the issuer's home country. Hedging the Portfolio's currency risks through foreign currency forward exchange contracts involves the risk of mismatching the Portfolio's objectives under a foreign currency forward exchange contract with the value of securities denominated in a particular currency. Furthermore, such transactions reduce or preclude the opportunity for gain if the value of the currency should move in the direction opposite to the position taken. There is additional risk to the effect that currency contracts create exposure to currencies in which the Portfolio's securities are not denominated. Unanticipated changes in currency prices may result in poorer overall performance for the Portfolio than if it had not entered into such contracts. The use of foreign currency forward exchange contracts involves the risk of loss from the insolvency or bankruptcy of the counterparty to the contract or the failure of the counterparty to make payments or otherwise comply with the terms of the contract.
A derivative instrument often has risks similar to its underlying asset and may have additional risks, including imperfect correlation between the value of the derivative and the underlying asset, risks of default by the counterparty to certain transactions, magnification of losses incurred due to changes in the market value of the securities, instruments, indices or interest rates to which they relate, and risks that the transactions may not be liquid. Certain derivative transactions may give rise to a form of leverage. Leverage magnifies the potential for gain and the risk of loss.
Please see "Additional Information about the Portfolios' Investment Strategies and Related Risks" for further information about these and other risks of investing in the Portfolio.
34
Morgan Stanley Institutional Fund, Inc. Prospectus
Details of the Portfolios
Global Franchise Portfolio
Objective
The Global Franchise Portfolio seeks long-term capital appreciation.
Approach
The Portfolio's Sub-Advisers seek long-term capital appreciation by investing primarily in equity securities of issuers located throughout the world that they believe have, among other things, resilient business franchises and growth potential. The Sub-Advisers emphasize individual stock selection and seek to identify undervalued securities of issuers located throughout the world, including both developed and emerging market countries. Under normal market conditions, the Portfolio invests in securities of issuers from at least three different countries, which may include the United States.
Process
The Sub-Advisers seek to invest in companies that they believe have resilient business franchises, strong cash flows, modest capital requirements, capable managements and growth potential. Securities are selected on a global basis with a strong bias towards value. The franchise focus of the Portfolio is based on the Sub-Advisers' belief that the intangible assets underlying a strong business franchise (such as patents, copyrights, brand names, licenses or distribution methods) are difficult to create or to replicate and that carefully selected franchise companies can yield above-average potential for long-term capital appreciation.
The Sub-Advisers rely on their research capabilities, analytical resources and judgment to identify and monitor franchise businesses meeting their investment criteria. The Sub-Advisers believe that the number of issuers with strong business franchises meeting its criteria may be limited, and accordingly, the Portfolio is non-diversified and may focus its holdings in a relatively small number of companies and may invest up to 25% of its assets in a single issuer. The Portfolio's equity investments may include convertible securities. The Sub-Advisers generally consider selling a portfolio holding when they determine that the holding no longer satisfies their investment criteria or that replacing the holding with another investment should improve the Portfolio's valuation and/or quality.
The Portfolio may utilize foreign currency forward exchange contracts, which are derivatives, in connection with its investments in foreign securities.
Risks
The Portfolio's principal investment strategies are subject to the following principal risks:
Investing in the Portfolio may be appropriate for you if you are willing to accept the risks and uncertainties of investing in a portfolio of equity securities of issuers throughout the world, including emerging market or developing countries. In general, prices of equity securities are more volatile than those of fixed income securities. The prices of equity securities will rise and fall in response to a number of different factors. In particular, prices of equity securities will respond to events that affect entire financial markets or industries (changes in inflation or consumer demand, for example) and to events that affect particular issuers (news about the success or failure of a new product, for example).
To the extent that the Portfolio invests in convertible securities, and the convertible security's investment value is greater than its conversion value, its price will be likely to increase when interest rates fall and decrease when interest rates rise. If the conversion value exceeds the investment value, the price of the convertible security will tend to fluctuate directly with the price of the underlying equity security.
Investing in the securities of foreign issuers, particularly those located in emerging market or developing countries, entails the risk that news and events unique to a country or region will affect those markets and their issuers. The value of the Portfolio's shares may vary widely in response to political and economic factors affecting companies in foreign countries. These same events will not necessarily have an effect on the U.S. economy or similar issuers located in the United States. In addition, investments in certain foreign markets, which have historically been considered stable, may become more volatile and subject to increased risk due to ongoing developments and changing conditions in such markets. Moreover, the growing interconnectivity of global economies and financial markets has increased the probability that adverse developments and conditions in one country or region will affect the stability of economies and financial markets in other countries or regions. Furthermore, the Portfolio's investments in foreign issuers generally will be denominated in foreign currencies. As a result, changes in the value of a country's currency compared to the U.S. dollar may affect the value of the Portfolio's investments. These changes may occur separately from and in response to events that do not otherwise affect the value of the security in the issuer's home country. Hedging the Portfolio's currency risks through foreign currency forward exchange contracts involves the risk of mismatching the Portfolio's objectives under a foreign currency forward exchange contract with the value of securities denominated in a particular currency. Furthermore, such transactions reduce or preclude the opportunity for gain if the value of the currency should move in the direction opposite to the position taken. There is additional risk to the effect that currency contracts create exposure to currencies in which the Portfolio's securities are not denominated. Unanticipated changes in currency prices may result in poorer overall performance for the Portfolio than if it had not entered into such contracts. The use of foreign currency forward exchange contracts involves the risk of loss from the
35
Global Franchise Portfolio (Cont'd)
insolvency or bankruptcy of the counterparty to the contract or the failure of the counterparty to make payments or otherwise comply with the terms of the contract.
The Portfolio may also invest in the equity securities of any size company. While the Sub-Advisers believe that smaller companies may provide greater growth potential than larger, more established firms, investing in the securities of smaller companies also involves greater risk and price volatility.
Changes in the worldwide economy, consumer spending, competition, demographics and consumer preferences, government regulation and economic conditions may adversely affect global franchise companies and may negatively impact the Portfolio to a greater extent than if the Portfolio's assets were invested in a wider variety of companies.
The risks of investing in the Portfolio may be intensified because the Portfolio is non-diversified, which means that it may invest in securities of a limited number of issuers. As a result, the performance of a particular investment or a small group of investments may affect the Portfolio's performance more than if the Portfolio were diversified.
Please see "Additional Information about the Portfolios' Investment Strategies and Related Risks" for further information about these and other risks of investing in the Portfolio.
36
Morgan Stanley Institutional Fund, Inc. Prospectus
Details of the Portfolios
International Equity Portfolio
Objective
The International Equity Portfolio seeks long-term capital appreciation by investing primarily in equity securities of non-U.S. issuers.
Approach
The Portfolio's Sub-Advisers seek to maintain a diversified portfolio of equity securities of non-U.S. issuers based on individual stock selection. The Sub-Advisers emphasize a bottom-up approach to investing that seeks to identify securities of issuers they believe are undervalued. The Sub-Advisers focus on developed markets, but they may invest in emerging markets.
Process
The Sub-Advisers select issuers from a universe comprised of approximately 1,200 companies in non-U.S. markets. The investment process is value driven and based on individual stock selection. In assessing investment opportunities, the Sub-Advisers consider value criteria with an emphasis on cash flow and the intrinsic value of company assets. Securities which appear undervalued according to these criteria are then subjected to in-depth fundamental analysis. The Sub-Advisers conduct a thorough investigation of the issuer's balance sheet, cash flow and income statement and assesses the company's business franchise, including product competitiveness, market positioning and industry structure. Meetings with senior company management are integral to the investment process. The Sub-Advisers generally consider selling a portfolio holding when they determine that the holding has reached its fair value target.
Under normal circumstances, at least 80% of the Portfolio's assets will be invested in equity securities. This policy may be changed without shareholder approval; however, you would be notified in writing of any changes. The Portfolio's equity investments may include convertible securities.
The Portfolio may, but it is not required to, use derivative instruments for a variety of purposes, including hedging, risk management, portfolio management or to earn income. Derivatives are financial instruments whose value is based on the value of an underlying asset, interest rate, index or financial instrument. The Portfolio's use of derivatives may involve the purchase and sale of derivative instruments such as futures, options, swaps and CFDs, and other related instruments and techniques. The Portfolio may utilize foreign currency forward exchange contracts, which are also derivatives, in connection with its investments in foreign securities. Derivative instruments used by the Portfolio will be counted toward the 80% policy discussed above to the extent they have economic characteristics similar to the securities included within that policy.
Risks
The Portfolio's principal investment strategies are subject to the following principal risks:
Investing in the Portfolio may be appropriate for you if you are willing to accept the risks and uncertainties of investing in equity securities of non-U.S. issuers. In general, prices of equity securities are more volatile than those of fixed income securities. The prices of equity securities will rise and fall in response to a number of different factors. In particular, prices of equity securities will respond to events that affect entire financial markets or industries (changes in inflation or consumer demand, for example) and to events that affect particular issuers (news about the success or failure of a new product, for example). In addition, at times the Portfolio's market sector, equity securities of foreign issuers, may underperform relative to other sectors or the overall market.
In addition, at times, small and medium capitalization equity securities may underperform relative to the overall market. Investments in small and medium capitalization companies may involve greater risk than investments in larger, more established companies. The securities issued by small and medium capitalization companies may be less liquid and their prices subject to more abrupt or erratic price movements. In addition, small and medium capitalization companies may have more limited markets, financial resources and product lines, and may lack the depth of management of larger companies. The Adviser's perception that a stock is under- or over-valued may not be accurate or may not be realized.
To the extent that the Portfolio invests in convertible securities, and the convertible security's investment value is greater than its conversion value, its price will be likely to increase when interest rates fall and decrease when interest rates rise. If the conversion value exceeds the investment value, the price of the convertible security will tend to fluctuate directly with the price of the underlying equity security.
Investing in the securities of foreign issuers, particularly those located in emerging market or developing countries, entails the risk that news and events unique to a country or region will affect those markets and their issuers. The value of the Portfolio's shares may vary widely in response to political and economic factors affecting companies in foreign countries. These same events will not necessarily have an effect on the U.S. economy or similar issuers located in the United States. In addition, investments in certain foreign markets, which have historically been considered stable, may become more volatile and subject to increased risk due to ongoing developments and changing conditions in such markets. Moreover, the growing interconnectivity of global
37
International Equity Portfolio (Cont'd)
economies and financial markets has increased the probability that adverse developments and conditions in one country or region will affect the stability of economies and financial markets in other countries or regions. Furthermore, the Portfolio's investments in foreign issuers generally will be denominated in foreign currencies. As a result, changes in the value of a country's currency compared to the U.S. dollar may affect the value of the Portfolio's investments. These changes may occur separately from and in response to events that do not otherwise affect the value of the security in the issuer's home country. Hedging the Portfolio's currency risks through foreign currency forward exchange contracts involves the risk of mismatching the Portfolio's objectives under a foreign currency forward exchange contract with the value of securities denominated in a particular currency. Furthermore, such transactions reduce or preclude the opportunity for gain if the value of the currency should move in the direction opposite to the position taken. There is additional risk to the effect that currency contracts create exposure to currencies in which the Portfolio's securities are not denominated. Unanticipated changes in currency prices may result in poorer overall performance for the Portfolio than if it had not entered into such contracts. The use of foreign currency forward exchange contracts involves the risk of loss from the insolvency or bankruptcy of the counterparty to the contract or the failure of the counterparty to make payments or otherwise comply with the terms of the contract.
A derivative instrument often has risks similar to its underlying asset and may have additional risks, including imperfect correlation between the value of the derivative and the underlying asset, risks of default by the counterparty to certain transactions, magnification of losses incurred due to changes in the market value of the securities, instruments, indices or interest rates to which they relate, and risks that the transactions may not be liquid. Certain derivative transactions may give rise to a form of leverage. Leverage magnifies the potential for gain and the risk of loss.
Please see "Additional Information about the Portfolios' Investment Strategies and Related Risks" for further information about these and other risks of investing in the Portfolio.
38
Morgan Stanley Institutional Fund, Inc. Prospectus
Details of the Portfolios
International Small Cap Portfolio
Objective
The International Small Cap Portfolio seeks long-term capital appreciation by investing primarily in equity securities of small non-U.S. companies.
Approach
The Portfolio's Sub-Adviser seeks to maintain a diversified portfolio of equity securities of small non-U.S. issuers based on individual stock selection. The Sub-Adviser emphasizes a bottom-up approach to investing that seeks to identify securities of issuers it believes are undervalued.
Process
The Sub-Adviser selects issuers from a universe comprised of small cap companies (those with total market capitalizations of $5 billion or less) in non-U.S. markets, including emerging markets. The investment process is value driven and based on individual stock selection. In assessing investment opportunities, the Sub-Adviser considers value criteria with an emphasis on cash flow and the intrinsic value of company assets. Securities which appear undervalued according to these criteria are then subjected to in-depth fundamental analysis. The Sub-Adviser conducts a thorough investigation of the issuer's balance sheet, cash flow and income statement and assesses the company's business franchise, including product competitiveness, market positioning and industry structure. Meetings with senior company management are integral to the investment process. The Sub-Adviser generally considers selling a portfolio holding when it determines that the holding has reached its fair value target.
Under normal circumstances, at least 80% of the assets of the Portfolio will be invested in equity securities of non-U.S. small cap companies. This policy may be changed without shareholder approval; however, you would be notified in writing of any changes. The Portfolio's equity investments may include convertible securities.
A company is considered to be a small cap company if it has a total market capitalization at the time of purchase of $5 billion or less. The market capitalization limit is subject to adjustment annually based upon the Sub-Adviser's assessment as to the capitalization range of companies which possess the fundamental characteristics of small cap companies.
The Portfolio may, but it is not required to, use derivative instruments for a variety of purposes, including hedging, risk management, portfolio management or to earn income. Derivatives are financial instruments whose value is based on the value of an underlying asset, interest rate, index or financial instrument. The Portfolio's use of derivatives may involve the purchase and sale of derivative instruments such as futures, options, swaps and CFDs, and other related instruments and techniques. The Portfolio may utilize forward foreign currency exchange contracts, which are also derivatives, in connection with its investments in foreign securities. Derivative instruments used by the Portfolio will be counted toward the 80% policy discussed above to the extent they have economic characteristics similar to the securities included within that policy.
Risks
The Portfolio's principal investment strategies are subject to the following principal risks:
Investing in the Portfolio may be appropriate for you if you are willing to accept the risks and uncertainties of investing in the equity securities of small non-U.S. issuers. In general, prices of equity securities are more volatile than those of fixed income securities. The prices of equity securities will rise and fall in response to a number of different factors. In particular, prices of equity securities will respond to events that affect entire financial markets or industries (changes in inflation or consumer demand, for example) and to events that affect particular issuers (news about the success or failure of a new product, for example). In addition, at times the Portfolio's market sector, equity securities of smaller foreign issuers, may underperform relative to other sectors or the overall market.
To the extent that the Portfolio invests in convertible securities, and the convertible security's investment value is greater than its conversion value, its price will be likely to increase when interest rates fall and decrease when interest rates rise. If the conversion value exceeds the investment value, the price of the convertible security will tend to fluctuate directly with the price of the underlying equity security.
The risk of investing in equity securities is intensified in the case of the small cap companies in which the Portfolio invests. Market prices for such companies' equity securities tend to be more volatile than those of larger, more established companies. Small cap companies may themselves be more vulnerable to economic or company specific problems.
Investing in the securities of foreign issuers, particularly those located in emerging market or developing countries, entails the risk that news and events unique to a country or region will affect those markets and their issuers. The value of the Portfolio's shares may vary widely in response to political and economic factors affecting companies in foreign countries. These same events will not necessarily have an effect on the U.S. economy or similar issuers located in the United States. In addition, investments in certain foreign markets, which have historically been considered stable, may become more volatile and subject to increased risk due to ongoing developments and changing conditions in such markets. Moreover, the growing interconnectivity of global economies and financial markets has increased the probability that adverse developments and conditions in one
39
International Small Cap Portfolio (Cont'd)
country or region will affect the stability of economies and financial markets in other countries or regions. Furthermore, the Portfolio's investments in foreign issuers generally will be denominated in foreign currencies. As a result, changes in the value of a country's currency compared to the U.S. dollar may affect the value of the Portfolio's investments. These changes may occur separately from and in response to events that do not otherwise affect the value of the security in the issuer's home country. Hedging the Portfolio's currency risks through foreign currency forward exchange contracts involves the risk of mismatching the Portfolio's objectives under a foreign currency forward exchange contract with the value of securities denominated in a particular currency. Furthermore, such transactions reduce or preclude the opportunity for gain if the value of the currency should move in the direction opposite to the position taken. There is additional risk to the effect that currency contracts create exposure to currencies in which the Portfolio's securities are not denominated. Unanticipated changes in currency prices may result in poorer overall performance for the Portfolio than if it had not entered into such contracts. The use of foreign currency forward exchange contracts involves the risk of loss from the insolvency or bankruptcy of the counterparty to the contract or the failure of the counterparty to make payments or otherwise comply with the terms of the contract.
A derivative instrument often has risks similar to its underlying asset and may have additional risks, including imperfect correlation between the value of the derivative and the underlying asset, risks of default by the counterparty to certain transactions, magnification of losses incurred due to changes in the market value of the securities, instruments, indices or interest rates to which they relate, and risks that the transactions may not be liquid. Certain derivative transactions may give rise to a form of leverage. Leverage magnifies the potential for gain and the risk of loss.
Please see "Additional Information about the Portfolios' Investment Strategies and Related Risks" for further information about these and other risks of investing in the Portfolio.
40
Morgan Stanley Institutional Fund, Inc. Prospectus
Details of the Portfolios
Select Global Infrastructure Portfolio
Objective
The Select Global Infrastructure Portfolio seeks to provide both capital appreciation and income.
The Portfolio's investment objective may be changed by the Fund's Board of Directors without shareholder approval, but no change is anticipated. If the Portfolio's investment objective changes, the Portfolio will notify shareholders and shareholders should consider whether the Portfolio remains an appropriate investment in light of the change.
Approach
The Adviser and/or Sub-Advisers seeks to provide both capital appreciation and income by investing primarily in equity securities issued by companies located throughout the world that are engaged in the infrastructure business. Using internal proprietary research, the Adviser seeks to identify public infrastructure companies that are believed to offer the best value relative to their underlying assets and growth prospects.
Process
The Portfolio normally invests at least 80% of its assets in equity securities issued by companies located throughout the world that are engaged in the infrastructure business. A company is considered to be in the infrastructure business if it derives at least 50% of its revenues or earnings from, or devotes at least 50% of its assets to, infrastructure-related activities. Infrastructure refers to the systems and networks of energy, transportation, communication and other services required for the normal function of society. Companies in the infrastructure business may be involved in, among other areas, the transmission and distribution of electric energy; the storage, transportation and distribution of natural resources, such as natural gas, used to produce energy; the building, operation and maintenance of highways, toll roads, tunnels, bridges and parking lots; the building, operation and maintenance of airports and ports, railroads and mass transit systems; telecommunications; water treatment and distribution; other emerging infrastructure sectors; and other new or emerging technologies. The Portfolio's investments may include securities of small and medium capitalization companies. The Portfolio may invest up to 100% of its net assets in foreign securities, which may include emerging market securities. Under normal market conditions, the Portfolio invests at least 40% of its assets in the securities of issuers located outside of the United States. The Portfolio's equity investments may include convertible securities.
The Adviser and/or Sub-Advisers shift the Portfolio's assets between the different types of companies in the infrastructure business described above based on relative valuation, underlying company fundamentals, and demographic and macroeconomic considerations. Utility companies represent a significant component of the universe of companies engaged in the infrastructure business. These companies may include traditionally regulated public utilities or fully or partially deregulated utility companies as well as unregulated utility companies and energy-related and telecommunications-related companies. The Portfolio has a fundamental policy (i.e., one that cannot be changed without shareholder approval) of investing 25% or more of its assets in the utilities industry. Utility companies are involved in, among other areas, gas and electric energy, water distribution, telecommunications, and other new or emerging technologies.
In selecting securities to buy, hold or sell for the Portfolio, the Adviser and/or Sub-Advisers actively manage the Portfolio using a combination of bottom-up and top-down methodologies. The value-driven approach to bottom-up security selection utilizes proprietary research models to identify infrastructure companies that offer the best value relative to their underlying assets and growth prospects. The top-down allocation provides exposure to major economic infrastructure sectors and countries, with an overweighting to those sectors/countries that offer the best relative valuation. The Adviser and/or Sub-Advisers generally consider selling a portfolio holding when it determines that the holding no longer satisfies its investment criteria.
The remaining 20% of the Portfolio's assets may be invested in fixed income securities, equity securities of companies not engaged in the infrastructure business, U.S. government securities issued, or guaranteed as to principal and interest, by the U.S. Government or its agencies or instrumentalities, and asset-backed securities. The Portfolio may also invest in real estate investment trusts ("REITs") and convertible securities. The Portfolio may invest up to 5% of its assets in fixed income securities and convertible securities rated below investment grade (commonly known as "junk bonds").
Risks
The Portfolio's principal investment strategies are subject to the following principal risks:
Because the Portfolio focuses its investments in infrastructure-related companies, the Portfolio has greater exposure to the potential adverse economic, regulatory, political and other changes affecting such entities. Infrastructure-related companies are subject to a variety of factors that may adversely affect their business or operations including high interest costs in connection with capital construction programs, costs associated with compliance with and changes in environmental and other regulations, difficulty in raising capital in adequate amounts on reasonable terms in periods of high inflation and unsettled capital markets, the effects of surplus capacity, increased competition from other providers of services in a developing deregulatory environment, uncertainties concerning the availability of fuel at reasonable prices, the effects of energy conservation policies and other factors. Additionally,
41
Select Global Infrastructure Portfolio (Cont'd)
infrastructure-related entities may be subject to regulation by various governmental authorities and may also be affected by governmental regulation of rates charged to customers, government budgetary constraints, service interruption due to environmental, operational or other mishaps and the imposition of special tariffs and changes in tax laws, regulatory policies and accounting standards.
Other factors that may affect the operations of infrastructure-related companies include innovations in technology that could render the way in which a company delivers a product or service obsolete, significant changes to the number of ultimate end-users of a company's products, increased susceptibility to terrorist acts, risks of environmental damage due to a company's operations or an accident, and general changes in market sentiment towards infrastructure and utilities assets.
The Portfolio's investments in the utilities industry are impacted by risks particular to that industry. Changing regulation constitutes one of the key industry-specific risks for the Portfolio. State and other regulators often monitor and control utility revenues and costs, and therefore may limit utility profits and dividends paid to investors. Regulatory authorities also may restrict a company's access to new markets, thereby diminishing the company's long-term prospects. The deregulation of certain utility companies may subject these companies to greater risks of loss. Individual sectors of the utility market are subject to additional risks. These risks apply to all utility companies—regulated, fully or partially deregulated, and unregulated.
Certain utility companies may incur unexpected increases in fuel and other operating costs. They are adversely affected when long-term interest rates rise. Long-term borrowings are used to finance most utility investments, and rising interest rates lead to higher financing costs and reduced earnings. There are also considerable costs associated with environmental compliance, nuclear waste clean-up, and safety regulation. Increasingly, regulators are calling upon electric utilities to bear these added costs, and there is a risk that these costs will not be fully recovered through an increase in revenues.
In the case of the water utility sector, the industry is highly fragmented, and most water supply companies find themselves in mature markets, although upgrading of fresh water and waste water systems is an expanding business.
Investing in the Portfolio may be appropriate for you if you are willing to accept the risks and uncertainties of investing in a portfolio of equity securities issued by companies located throughout the world that are engaged in the infrastructure business. In general, prices of equity securities are more volatile than those of fixed income securities. The prices of equity securities will rise and fall in response to a number of different factors. In particular, prices of equity securities will respond to events that affect entire financial markets or industries (changes in inflation or consumer demand, for example) and to events that affect particular issuers (news about the success or failure of a new product, for example).
In addition, at times, small and medium capitalization equity securities may underperform relative to the overall market. Investments in small and medium capitalization companies may involve greater risk than investments in larger, more established companies. The securities issued by small and medium capitalization companies may be less liquid and their prices subject to more abrupt or erratic price movements. In addition, small and medium capitalization companies may have more limited markets, financial resources and product lines, and may lack the depth of management of larger companies. The Adviser's perception that a stock is under- or over-valued may not be accurate or may not be realized.
To the extent that the Portfolio invests in convertible securities, and the convertible security's investment value is greater than its conversion value, its price will be likely to increase when interest rates fall and decrease when interest rates rise. If the conversion value exceeds the investment value, the price of the convertible security will tend to fluctuate directly with the price of the underlying equity security.
Investing in the securities of foreign issuers, particularly those located in emerging market or developing countries, entails the risk that news and events unique to a country or region will affect those markets and their issuers. The value of the Portfolio's shares may vary widely in response to political and economic factors affecting companies in foreign countries. These same events will not necessarily have an effect on the U.S. economy or similar issuers located in the United States. In addition, investments in certain foreign markets, which have historically been considered stable, may become more volatile and subject to increased risk due to ongoing developments and changing conditions in such markets. Moreover, the growing interconnectivity of global economies and financial markets has increased the probability that adverse developments and conditions in one country or region will affect the stability of economies and financial markets in other countries or regions. Furthermore, a substantial portion of the Portfolio's investments in foreign issuers may be denominated in foreign currencies. As a result, changes in the value of a country's currency compared to the U.S. dollar may affect the value of the Portfolio's investments. These changes may occur separately from and in response to events that do not otherwise affect the value of the security in the issuer's home country.
The risks of investing in the Portfolio may be intensified because the Portfolio is non-diversified, which means that it may invest in securities of a limited number of
42
Morgan Stanley Institutional Fund, Inc. Prospectus
Details of the Portfolios
Select Global Infrastructure Portfolio (Cont'd)
issuers. As a result, the performance of a particular investment or a small group of investments may affect the Portfolio's performance more than if the Portfolio were diversified.
Please see "Additional Information about the Portfolios' Investment Strategies and Related Risks" for further information about these and other risks of investing in the Portfolio.
43
This section discusses additional information relating to the Portfolios' investment strategies, other types of investments that the Portfolios may make and related risk factors. The Portfolios' investment practices and limitations are described in more detail in the Statement of Additional Information ("SAI"), which is incorporated by reference and legally is a part of this Prospectus. For details on how to obtain a copy of the SAI and other reports and information, see the back cover of this Prospectus.
Equity Securities
Equity securities may include common and preferred stocks, convertible securities and equity-linked securities, rights and warrants to purchase common stocks, depositary receipts, limited partnership interests and other specialty securities having equity features. The Portfolios may invest in equity securities that are publicly-traded on securities exchanges or over-the-counter or in equity securities that are not publicly traded. Securities that are not publicly traded may be more difficult to sell and their value may fluctuate more dramatically than other securities.
A convertible security is a bond, debenture, note, preferred stock, right, warrant or other security that may be converted into or exchanged for a prescribed amount of common stock or other security of the same or a different issuer or into cash within a particular period of time at a specified price or formula. A convertible security generally entitles the holder to receive interest paid or accrued on debt securities or the dividend paid on preferred stock until the convertible security matures or is redeemed, converted or exchanged. Before conversion, convertible securities generally have characteristics similar to both debt and equity securities. The value of convertible securities tends to decline as interest rates rise and, because of the conversion feature, tends to vary with fluctuations in the market value of the underlying securities. Convertible securities ordinarily provide a stream of income with generally higher yields than those of common stock of the same or similar issuers. Convertible securities generally rank senior to common stock in a corporation's capital structure but are usually subordinated to comparable nonconvertible securities. Convertible securities generally do not participate directly in any dividend increases or decreases of the underlying securities although the market prices of convertible securities may be affected by any dividend changes or other changes in the underlying securities.
Fixed Income Securities
Certain Portfolios may invest in fixed income securities. Fixed income securities are securities that pay a fixed or a variable rate of interest until a stated maturity date. Fixed income securities include U.S. government securities, securities issued by federal or federally sponsored agencies and instrumentalities, corporate bonds and notes, asset-backed securities, mortgage securities, high yield securities (commonly referred to as "junk bonds" or high risk securities), municipal bonds, loan participations and assignments, zero coupon bonds, convertible securities, Eurobonds, Brady Bonds, Yankee Bonds, repurchase agreements, commercial paper and cash equivalents.
These securities are subject to risks related to changes in interest rates and in the financial health or credit rating of the issuers. The maturity and duration of a fixed income instrument also affects the extent to which the price of the security will change in response to these and other factors. Longer term securities tend to experience larger price changes than shorter term securities because they are more sensitive to changes in interest rates or in the credit ratings of the issuers.
Fixed income securities may be called (i.e., redeemed by the issuer) prior to final maturity. If a callable security is called, the Portfolio may have to reinvest the proceeds at a lower rate of interest.
Price Volatility
The value of your investment in a Portfolio is based on the market prices of the securities the Portfolio holds. These prices change daily due to economic and other events that affect markets generally, as well as those that affect particular regions, countries, industries, companies or governments. These price movements, sometimes called volatility, may be greater or less depending on the types of securities the Portfolio owns and the markets in which the securities trade. Over time, equity securities have generally shown gains superior to fixed income securities, although they have tended to be more volatile in the short term. Fixed income securities, regardless of credit quality, also experience price volatility, especially in response to interest rate changes. As a result of price volatility, there is a risk that you may lose money by investing in a Portfolio.
Foreign Investing
To the extent that a Portfolio invests in foreign issuers, there is the risk that news and events unique to a country or region will affect those markets and their issuers. These same events will not necessarily have an effect on the U.S. economy or similar issuers located in the United States. In addition, some of the Portfolios' securities, including underlying securities represented by depositary receipts, generally will be denominated in foreign currencies. As a result, changes in the value of a country's currency compared to the U.S. dollar may affect the value of a Portfolio's investments. These changes may happen separately from, and in response to, events that do not otherwise affect the value of the security in the issuer's home country. These risks may be intensified for a Portfolio's investments in securities of issuers located in emerging market or developing countries.
Foreign Securities
Foreign issuers generally are subject to different accounting, auditing and financial reporting standards than U.S. issuers. There may be less information available to the public about foreign issuers. Securities of foreign issuers can be less liquid and experience greater price movements. In addition, the prices of such securities may be susceptible to influence by large traders, due to the limited size of many foreign securities markets. Moreover, investments in certain foreign markets, which have historically been considered stable, may become more volatile and subject to increased risk due to ongoing developments and changing conditions in such markets.
44
Morgan Stanley Institutional Fund, Inc. Prospectus
Additional Information About the Portfolios' Investment
Strategies and Related Risks
Also, the growing interconnectivity of global economies and financial markets has increased the probability that adverse developments and conditions in one country or region will affect the stability of economies and financial markets in other countries or regions. In some foreign countries, there is also the risk of government expropriation, excessive taxation, political or social instability, the imposition of currency controls or diplomatic developments that could affect a Portfolio's investment. There also can be difficulty obtaining and enforcing judgments against issuers in foreign countries. Foreign stock exchanges, broker-dealers and listed issuers may be subject to less government regulation and oversight. The cost of investing in foreign securities, including brokerage commissions and custodial expenses, can be higher than in the United States.
Certain Portfolios may invest in debt obligations known as "sovereign debt," which are obligations of governmental issuers in emerging market or developing countries and industrialized countries. Certain emerging market or developing countries are among the largest debtors to commercial banks and foreign governments. The issuer or governmental authority that controls the repayment of sovereign debt may not be willing or able to repay the principal and/or pay interest when due in accordance with the terms of such obligations.
In connection with their investments in foreign securities, certain Portfolios also may enter into contracts with banks, brokers or dealers to purchase or sell securities or foreign currencies at a future date. A foreign currency forward exchange contract is a negotiated agreement between the contracting parties to exchange a specified amount of currency at a specified future time at a specified rate. The rate can be higher or lower than the spot rate between the currencies that are the subject of the contract. Foreign currency forward exchange contracts may be used to protect against uncertainty in the level of future foreign currency exchange rates or to gain or modify exposure to a particular currency. In addition, a Portfolio may use cross currency hedging or proxy hedging with respect to currencies in which the Portfolio has or expects to have portfolio or currency exposure. Cross currency hedges involve the sale of one currency against the positive exposure to a different currency and may be used for hedging purposes or to establish an active exposure to the exchange rate between any two currencies.
Emerging Market Risks
Certain Portfolios may invest in emerging market or developing countries, which are countries that major international financial institutions, such as the World Bank, generally consider to be less economically mature than developed nations, such as the United States or most nations in Western Europe. Emerging market or developing countries can include every nation in the world except the United States, Canada, Japan, Australia, New Zealand and most countries located in Western Europe. Emerging market or developing countries may be more likely to experience political turmoil or rapid changes in economic conditions than more developed countries, and the financial condition of issuers in emerging market or developing countries may be more precarious than in other countries. In addition, emerging market securities generally are less liquid and subject to wider price and currency fluctuations than securities issued in more developed countries. These characteristics result in greater risk of price volatility in emerging market or developing countries, which may be heightened by currency fluctuations relative to the U.S. dollar.
Foreign Currency
The investments of the Portfolios generally will be denominated in foreign currencies. The value of foreign currencies may fluctuate relative to the value of the U.S. dollar. Since the Portfolios may invest in such non-U.S. dollar-denominated securities and therefore may convert the value of such securities into U.S. dollars, changes in currency exchange rates can increase or decrease the U.S. dollar value of the Portfolios' assets. The Adviser and/or the Sub-Advisers may use derivatives to reduce this risk. The Adviser and/or the Sub-Advisers may in their discretion choose not to hedge against currency risk. In addition, certain market conditions may make it impossible or uneconomical to hedge against currency risk.
Real Estate Investment Trusts and Foreign Real Estate Companies
Investing in REITs and foreign real estate companies exposes investors to the risks of owning real estate directly, as well as to risks that relate specifically to the way in which REITs and foreign real estate companies are organized and operated. REITs and foreign real estate companies generally invest directly in real estate, in mortgages or in some combination of the two. Operating REITs and foreign real estate companies requires specialized management skills and a Portfolio may indirectly bear management expenses along with the direct expenses of the Portfolio. Individual REITs and foreign real estate companies may own a limited number of properties and may concentrate in a particular region or property type.
REITs also must satisfy specific requirements of the Internal Revenue Code of 1986, as amended (the "Code"), in order to qualify for the tax-free pass through of income. Foreign real estate companies may be subject to laws, rules and regulations governing those entities and their failure to comply with those laws, rules and regulations could negatively impact the performance of those entities. In addition, REITs and foreign real estate companies, like mutual funds, have expenses, including management and administration fees, that are paid by their shareholders.
45
Asset-Backed Securities
Certain Portfolios may invest in asset-backed securities. Asset-backed securities apply the securitization techniques used to develop mortgage-backed securities to a broad range of other assets. Various types of assets, primarily automobile and credit card receivables and home equity loans, are pooled and securitized in pass-through structures similar to pass-through structures developed with respect to mortgage securitizations. Asset-backed securities have risk characteristics similar to mortgage-backed securities. Like mortgage-backed securities, they generally decrease in value as a result of interest rate increases, but may benefit less than other fixed income securities from declining interest rates, principally because of prepayments. Also, as in the case of mortgage-backed securities, prepayments generally increase during a period of declining interest rates, although other factors, such as changes in credit use and payment patterns, may also influence prepayment rates. Asset-backed securities also involve the risk that various federal and state consumer laws and other legal and economic factors may result in the collateral backing the securities being insufficient to support payment on the securities.
Derivatives
Certain Portfolios may, but are not required to, use derivative instruments for a variety of purposes, including hedging, risk management, portfolio management or to earn income. Derivatives are financial instruments whose value is based on the value of an underlying asset, interest rate, index or financial instrument.
A derivative instrument often has risks similar to its underlying asset and may have additional risks, including imperfect correlation between the value of the derivative and the underlying asset, risks of default by the counterparty to certain transactions, magnification of losses incurred due to changes in the market value of the securities, instruments, indices or interest rates to which they relate, and risks that the transactions may not be liquid. The use of derivatives involves risks that are different from, and possibly greater than, the risks associated with other portfolio investments. Derivatives may involve the use of highly specialized instruments that require investment techniques and risk analyses different from those associated with other portfolio investments.
Certain derivative transactions may give rise to a form of leverage. Leverage magnifies the potential for gain and the risk of loss. Leverage associated with derivative transactions may cause a Portfolio to liquidate portfolio positions when it may not be advantageous to do so to satisfy its obligations or to meet earmarking or segregation requirements, pursuant to applicable SEC rules and regulations, or may cause a Portfolio to be more volatile than if the Portfolio had not been leveraged. Although the Adviser and/or Sub-Advisers seek to use derivatives to further a Portfolio's investment objectives, there is no assurance that the use of derivatives will achieve this result.
The derivative instruments and techniques that certain Portfolios may principally use include:
Futures. A futures contract is a standardized, exchange-traded agreement to buy or sell a specific quantity of an underlying instrument at a specific price at a specific future time. The value of a futures contract tends to increase and decrease in tandem with the value of the underlying instrument. Depending on the terms of the particular contract, futures contracts are settled through either physical delivery of the underlying instrument on the settlement date or by payment of a cash settlement amount on the settlement date. A decision as to whether, when and how to use futures involves the exercise of skill and judgment and even a well-conceived futures transaction may be unsuccessful because of market behavior or unexpected events. In addition to the derivatives risks discussed above, the prices of futures can be highly volatile, using futures can lower total return, and the potential loss from futures can exceed a Portfolio's initial investment in such contracts.
Options. If a Portfolio buys an option, it buys a legal contract giving it the right to buy or sell a specific amount of the underlying instrument or futures contract on the underlying instrument at an agreed-upon price typically in exchange for a premium paid by the Portfolio. If a Portfolio sells an option, it sells to another person the right to buy from or sell to the Portfolio a specific amount of the underlying instrument or futures contract on the underlying instrument at an agreed-upon price typically in exchange for a premium received by the Portfolio. A decision as to whether, when and how to use options involves the exercise of skill and judgment and even a well-conceived option transaction may be unsuccessful because of market behavior or unexpected events. The prices of options can be highly volatile and the use of options can lower total returns.
Swaps. An over-the-counter ("OTC") swap contract is an agreement between two parties pursuant to which the parties exchange payments at specified dates on the basis of a specified notional amount, with the payments calculated by reference to specified securities, indices, reference rates, currencies or other instruments. A small percentage of swap contracts are cleared through a central clearinghouse. Most swap agreements provide that when the period payment dates for both parties are the same, the payments are made on a net basis (i.e., the two payment streams are netted out, with only the net amount paid by one party to the other). A Portfolio's obligations or rights under a swap contract entered into on a net basis will generally be equal only to the net amount to be paid or received under the agreement, based on the relative values of the positions held by each counterparty. Most swap agreements are not entered into or traded on
46
Morgan Stanley Institutional Fund, Inc. Prospectus
Additional Information About the Portfolios' Investment
Strategies and Related Risks
exchanges and often there is no central clearing or guaranty function for swaps. These OTC swaps are often subject to credit risk or the risk of default or non-performance by the counterparty. Swaps could result in losses if interest rates or foreign currency exchange rates or credit quality changes are not correctly anticipated by a Portfolio or if the reference index, security or investments do not perform as expected.
CFDs. A CFD is a privately negotiated contract between two parties, buyer and seller, stipulating that the seller will pay to or receive from the buyer the difference between the nominal value of the underlying instrument at the opening of the contract and that instrument's value at the end of the contract. The underlying instrument may be a single security, stock basket or index. A CFD can be set up to take either a short or long position on the underlying instrument. The buyer and seller are typically both required to post margin, which is adjusted daily. The buyer will also pay to the seller a financing rate on the notional amount of the capital employed by the seller less the margin deposit. In addition to the general risks of derivatives, CFDs may be subject to liquidity risk and counterparty risk.
Structured Investments. Certain Portfolios also may invest a portion of their assets in structured investments. A structured investment is a derivative security designed to offer a return linked to a particular underlying security, currency, commodity or market. Structured investments may come in various forms including notes (such as exchange-traded notes), warrants and options to purchase securities. A Portfolio will typically use structured investments to gain exposure to a permitted underlying security, currency, commodity or market when direct access to a market is limited or inefficient from a tax or cost standpoint. Investments in structured investments involve risks including issuer risk, counterparty risk and market risk. Holders of structured investments bear risks of the underlying investment and are subject to issuer or counterparty risk because a Portfolio is relying on the creditworthiness of such issuer or counterparty and has no rights with respect to the underlying investment. Certain structured investments may be thinly traded or have a limited trading market and may have the effect of increasing a Portfolio's illiquidity to the extent that the Portfolio, at a particular point in time, may be unable to find qualified buyers for these securities.
Initial Public Offerings
Certain Portfolios may purchase shares issued as part of, or a short period after, a company's initial public offering ("IPOs"), and may at times dispose of those shares shortly after their acquisition. A Portfolio's purchase of shares issued in IPOs exposes it to the risks associated with companies that have little operating history as public companies, as well as to the risks inherent in those sectors of the market where these new issuers operate. The market for IPO issuers has been volatile, and share prices of newly-public companies have fluctuated significantly over short periods of time. IPOs may produce high, double-digit returns. Such returns are highly unusual and may not be sustainable.
Private Placements and Restricted Securities
Certain Portfolios' investments may also include privately placed securities, which are subject to resale restrictions. These securities could have the effect of increasing the level of Portfolio illiquidity to the extent a Portfolio may be unable to sell or transfer these securities due to restrictions on transfers or on the ability to find buyers interested in purchasing the securities. The illiquidity of the market, as well as the lack of publicly available information regarding these securities, may also adversely affect the ability to arrive at a fair value for certain securities at certain times and could make it difficult for a Portfolio to sell certain securities.
Investment Discretion
In pursuing the Portfolios' investment objectives, the Adviser and/or Sub-Advisers have considerable leeway in deciding which investments they buy, hold or sell on a day-to-day basis, and which trading stategies they use. For example, the Adviser and/or Sub-Advisers, in their discretion, may determine to use some permitted trading strategies while not using others. The success or failure of such decisions will affect the Portfolios' performance.
Temporary Defensive Investments
When the Adviser or Sub-Advisers believe that changes in economic, financial or political conditions warrant, each Portfolio may invest without limit in certain short- and medium-term fixed income securities for temporary defensive purposes that may be inconsistent with a Portfolio's principal investment strategies. If the Adviser or Sub-Advisers incorrectly predict the effects of these changes, such defensive investments may adversely affect a Portfolio's performance and the Portfolio may not achieve its investment objective.
Portfolio Turnover
Consistent with its investment policies, the Global Franchise Portfolio will purchase and sell securities without regard to the effect on portfolio turnover. Higher portfolio turnover (e.g., over 100% per year) will cause the Global Franchise Portfolio to incur additional transaction costs and may result in taxable gains being passed through to shareholders. The Portfolio may engage in frequent trading of securities to achieve its investment objective.
47
Adviser
Morgan Stanley Investment Management Inc., with principal offices at 522 Fifth Avenue, New York, NY 10036, conducts a worldwide portfolio management business and provides a broad range of portfolio management services to customers in the United States and abroad. Morgan Stanley is the direct parent of the Adviser and the indirect parent of the Distributor. Morgan Stanley is a preeminent global financial services firm engaged in securities trading and brokerage activities, as well as providing investment banking, research and analysis, financing and financial advisory services. As of March 31, 2012, the Adviser, together with its affiliated asset management companies, had approximately $303.8 billion in assets under management or supervision.
Sub-Advisers
The Adviser has entered into Sub-Advisory Agreements with MSIM Limited, located at 25 Cabot Square, Canary Wharf, London, E14 4QA, England (with respect to the Emerging Markets, Global Franchise, International Equity, International Small Cap and Select Global Infrastructure Portfolios) and MSIM Company, located at 23 Church Street, 16-01 Capital Square, Singapore 049481 (with respect to the Asian Equity, Emerging Markets, Global Franchise, International Equity and Select Global Infrastructure Portfolios). The Sub-Advisers are wholly owned subsidiaries of Morgan Stanley. The Sub-Advisers provide the relevant Portfolios with investment advisory services subject to the overall supervision of the Adviser and the Fund's Officers and Directors. The Adviser pays the Sub-Advisers on a monthly basis a portion of the net advisory fees the Adviser receives from the relevant Portfolios.
Advisory Fees
For the fiscal year ended December 31, 2011, the Adviser received from each Portfolio the advisory fee (net of fee waivers and/or affiliated rebates, if applicable) set forth in the table below.
Adviser's Rates of Compensation
(as a percentage of average net assets) | |
| Active International Allocation Portfolio | | | 0.54% | | |
| Asian Equity Portfolio | | | 0.00% | | |
| Emerging Markets Portfolio | | | 1.18% | | |
| Global Franchise Portfolio | | | 0.79% | | |
| International Equity Portfolio | | | 0.76% | | |
| International Small Cap Portfolio | | | 0.91% | | |
| Select Global Infrastructure Portfolio | | | 0.00% | | |
48
Morgan Stanley Institutional Fund, Inc. Prospectus
Fund Management
Advisory Fees (Cont'd)
The Adviser has agreed to reduce its advisory fee and/or reimburse the Portfolios, if necessary, if such fees would cause the total annual operating expenses of each Portfolio to exceed the percentage of average daily net assets set forth in the table below. In determining the actual amount of fee waiver and/or expense reimbursement for a Portfolio, if any, the Adviser excludes from annual operating expenses certain investment related expenses. The fee waivers and/or expense reimbursements for a Portfolio will continue for at least one year or until such time as the Fund's Board of Directors acts to discontinue all or a portion of such waivers and/or reimbursements when it deems such action is appropriate.
| | | Expense Cap
Class I | | Expense Cap
Class P | | Expense Cap
Class H | | Expense Cap
Class L | |
| Active International Allocation Portfolio | | | 0.90 | % | | | 1.15 | % | | | 1.15 | % | | | 1.65 | % | |
| Asian Equity Portfolio | | | 1.45 | % | | | 1.70 | % | | | 1.70 | % | | | 2.20 | % | |
| Emerging Markets Portfolio | | | 1.25 | % | | | 1.50 | % | | | 1.50 | % | | | 2.00 | % | |
| Global Franchise Portfolio | | | 1.00 | % | | | 1.25 | % | | | 1.25 | % | | | 1.75 | % | |
| International Equity Portfolio | | | 0.95 | % | | | 1.20 | % | | | 1.20 | % | | | 1.70 | % | |
| International Small Cap Portfolio | | | 1.15 | % | | | 1.40 | % | | | 1.40 | % | | | 1.90 | % | |
| Select Global Infrastructure | | | 1.15 | % | | | 1.40 | % | | | 1.40 | % | | | 1.90 | % | |
Portfolio Management
Active International Allocation Portfolio
The Portfolio is managed by members of the Active International Allocation team. The team consists of portfolio managers and analysts. The current member of the team primarily responsible for the day-to-day management of the Portfolio is Ann D. Thivierge.
Ms. Thivierge has been associated with the Adviser in an investment management capacity since 1986.
Asian Equity Portfolio
The Portfolio is managed by members of the Asian Equity team. The team consists of portfolio managers and analysts. The current member of the team primarily responsible for the day-to-day management of the Portfolio is James Cheng.
Mr. Cheng has been associated with MSIM Company in an investment management capacity since 2006.
As lead portfolio manager, Mr. Cheng determines the investment strategy, establishes asset-allocation frameworks and directs the implementation of investment strategy.
Emerging Markets Portfolio
The Portfolio is managed by members of the Emerging Markets Equity team. The team consists of portfolio managers and analysts. The team works collaboratively when making portfolio decisions. Current members of the team jointly and primarily responsible for the day-to-day management of the Portfolio are Ruchir Sharma, James Cheng, Paul Psaila, Eric Carlson and Ana Cristina Piedrahita.
Mr. Sharma has been associated with the Adviser in an investment management capacity since 1996. Mr. Cheng has been associated with MSIM Company in an investment management capacity since 2006. Mr. Psaila has been associated with the Adviser in an investment management capacity since 1994. Mr. Carlson has been associated with the Adviser in an investment management capacity since 1997. Ms. Piedrahita has been associated with MSIM Limited or its affiliates in an investment management capacity since 2002.
The Emerging Markets Equity team is comprised of dedicated portfolio managers/analysts that have extensive experience in analyzing emerging markets equity securities for investors. Mr. Sharma is the lead portfolio manager and is responsible for the overall portfolio performance and construction. Mr. Sharma focuses on country allocation, relying heavily on input from the regional co-portfolio manager teams who are responsible for stock selection for their respective regions. Portfolio managers generally specialize by region, with the exception of a few specialized groups focusing on specific sectors.
Global Franchise Portfolio
The Portfolio is managed by members of the International Equity team. The team consists of portfolio managers. Current members of the team jointly and primarily responsible for the day-to-day management of the Portfolio are William D. Lock, Walter B. Riddell, Peter J. Wright, Vladimir A. Demine, Christian Derold, John S. Goodacre and Bruno Paulson.
Mr. Lock has been associated with MSIM Limited in an investment management capacity since 1994. Mr. Riddell has been associated with MSIM Limited in an investment management capacity since 1995. Mr. Wright has been associated with MSIM Company or its affiliates in an investment management capacity
49
Portfolio Management (Cont'd)
since 1996. Mr. Demine has been associated with MSIM Limited in an investment management capacity since May 2009. Prior to May 2009, Mr. Demine was associated in an investment management capacity with UBS Global Asset Management. Mr. Derold has been associated with MSIM Company in an investment management capacity since 2006. Mr. Goodacre has been associated with MSIM Limited in an investment management capacity since 2003. Mr. Paulson has been associated with MSIM Limited in an investment management capacity since June 2009. Prior to June 2009, Mr. Paulson was associated in an investment management capacity with Sanford Bernstein.
International Equity Portfolio
The Portfolio is managed by members of the International Equity team. The team consists of portfolio managers and analysts. Current members of the team jointly and primarily responsible for the day-to-day management of the Portfolio are William D. Lock, Walter B. Riddell, Peter J. Wright, Vladimir A. Demine, Christian Derold, John S. Goodacre and Bruno Paulson.
Mr. Lock has been associated with MSIM Limited in an investment management capacity since 1994. Mr. Riddell has been associated with MSIM Limited in an investment management capacity since 1995. Mr. Wright has been associated with MSIM Company or its affiliates in an investment management capacity since 1996. Mr. Demine has been associated with MSIM Limited in an investment management capacity since May 2009. Prior to May 2009, Mr. Demine was associated in an investment management capacity with UBS Global Asset Management. Mr. Derold has been associated with MSIM Company in an investment management capacity since 2006. Mr. Goodacre has been associated with MSIM Limited in an investment management capacity since 2003. Mr. Paulson has been associated with MSIM Limited in an investment management capacity since June 2009. Prior to June 2009, Mr. Paulson was associated in an investment management capacity with Sanford Bernstein.
Each member of the team has both global sector research responsibilities and makes investment management decisions for the Portfolio. Messrs. Lock, Wright, Riddell, Goodacre and Derold have day-to-day portfolio administration responsibilities as well.
International Small Cap Portfolio
The Portfolio is managed by members of the International Small Cap team. The team consists of portfolio managers and analysts. Current members of the team jointly and primarily responsible for the day-to-day management of the Portfolio are Margaret Naylor, Arthur Pollock, Alistair Corden-Lloyd and Alexander Vislykh.
Ms. Naylor has been associated with MSIM Limited in an investment management capacity since 1987. Mr. Pollock has been associated with MSIM Limited in an investment management capacity since 1999. Mr. Corden-Lloyd has been associated with MSIM Limited in an investment management capacity since 1997. Mr. Vislkyh has been associated with MSIM Limited in an investment management capacity since 2002.
Select Global Infrastructure Portfolio
The Portfolio is managed by members of the Global Infrastructure Securities team. Current members of the team jointly and primarily responsible for the day-to-day management of the Portfolio are Theodore R. Bigman and Matthew King.
Mr. Bigman has been associated with the Adviser in an investment management capacity since 1995. Mr. King has been associated with the Adviser in an investment management capacity since 2008. Prior to 2008, Mr. King worked at Bear Stearns in a variety of roles, including investment banking, capital markets and research during which time he provided research and analytical support for a number of infrastructure-related financings.
As lead portfolio manager, Mr. Bigman, together with co-portfolio manager Mr. King, determine the investment strategy, establish asset-allocation frameworks and direct the implementation of investment strategy.
Additional Information
The Portfolios' SAI provides additional information about the portfolio managers' compensation structure, other accounts managed by the portfolio managers and the portfolio managers' ownership of securities in the Portfolios.
The composition of each team may change from time to time.
A discussion regarding the Board of Directors' approval of the Investment Advisory Agreement and the Sub-Advisory Agreements is available in the Fund's Semiannual Report to Shareholders for the period ended June 30, 2011.
50
Morgan Stanley Institutional Fund, Inc. Prospectus
Shareholder Information
Shareholder Information
Share Class
This Prospectus offers Class I, Class P, Class H and Class L shares of each Portfolio. Neither Class I, Class P nor Class L shares are subject to a sales charge, and Class I shares are not subject to a shareholder services fee. Both Class I and Class P shares generally require investments in minimum amounts that are substantially higher than Class H and Class L shares.
Distribution of Portfolio Shares
Morgan Stanley Distribution, Inc. is the exclusive Distributor of Class I, Class P, Class H and Class L shares of each Portfolio. The Distributor receives no compensation from the Fund for distributing Class I shares of the Portfolios. The Fund has adopted a Shareholder Services Plan with respect to the Class P and Class H shares of each Portfolio and a Distribution and Shareholder Services Plan with respect to the Class L shares of each Portfolio (the "Plans") pursuant to Rule 12b-1 under the Investment Company Act of 1940, as amended (the "1940 Act"). Under the Plans, each Portfolio pays the Distributor a shareholder services fee of up to 0.25% of the average daily net assets of each of the Class P, Class H and Class L shares on an annualized basis and a distribution fee of up to 0.50% of the average daily net assets of the Class L shares on an annualized basis. The Distributor may compensate other parties for providing distribution-related and/or shareholder support services to investors who purchase Class P, Class H and Class L shares. Such fees relate solely to the Class P, Class H and Class L shares and will reduce the net investment income and total return of the Class P, Class H and Class L shares, respectively.
The Adviser and/or Distributor may pay compensation to certain brokers or other service providers in connection with the sale, distribution, marketing and retention of a Portfolio's shares and/or shareholder servicing. Such compensation may be significant in amount and the prospect of receiving any such additional compensation may provide affiliated or unaffiliated entities with an incentive to favor sales of shares of the Portfolios over other investment options. Any such payments will not change the NAV or the price of a Portfolio's shares. For more information, please see the Portfolios' SAI.
About Net Asset Value
The NAV per share of a class of shares of a Portfolio is determined by dividing the total of the value of the Portfolio's investments and other assets attributable to the class, less any liabilities attributable to the class, by the total number of outstanding shares of that class of the Portfolio. In making this calculation, each Portfolio generally values securities at market price. If market prices are unavailable or may be unreliable because of events occurring after the close of trading, including circumstances under which the Adviser or Sub-Adviser determines that a security's market price is not accurate, fair value prices may be determined in good faith using methods approved by the Board of Directors.
In addition, with respect to securities that primarily are listed on foreign exchanges, when an event occurs after the close of such exchanges that is likely to have changed the value of the securities (e.g., a percentage change in value of one or more U.S. securities indices in excess of specified thresholds), such securities will be valued at their fair value, as determined under procedures established by the Fund's Board of Directors. Securities also may be fair valued in the event of a significant development affecting a country or region or an issuer-specific development which is likely to have changed the value of the security. In these cases, a Portfolio's NAV will reflect certain portfolio securities' fair value rather than their market price. To the extent the Portfolio invests in open-end management companies that are registered under the 1940 Act, the Portfolio's NAV is calculated based upon the NAV of such funds. The prospectuses for such funds explain the circumstances under which they will use fair value pricing and its effects.
Fair value pricing involves subjective judgments and it is possible that the fair value determined for a security is materially different than the value that could be realized upon the sale of that security. With respect to securities that are primarily listed on foreign exchanges, the values of a Portfolio's investment securities may change on days when you will not be able to purchase or sell your shares.
Pricing of Portfolio Shares
You may buy or sell (redeem) Class I, Class P and Class L shares of the Portfolios at the NAV next determined for the class after receipt of your order, plus any applicable sales charge. The Fund determines the NAV per share for the Portfolios as of the close of the NYSE (normally 4:00 p.m. Eastern Time) on each day that the NYSE is open for business (the "Pricing Time").
Portfolio Holdings
A description of the Fund's policies and procedures with respect to the disclosure of each Portfolio's securities is available in the Portfolios' SAI.
How To Purchase Class I, Class P and Class L Shares
The Fund is not currently offering Class L shares of the Active International Allocation and International Equity Portfolios. The Fund may commence offering Class L shares of the Active International Allocation and International Equity Portfolios in the future. Any such offerings of the Active International Allocation Portfolio's and the International Equity Portfolio's Class L shares may commence and terminate without any prior notice.
You may purchase Class I, Class P and Class L shares of a Portfolio directly from the Fund, from the Distributor or through certain third parties ("Financial Intermediaries") on each day that the Portfolios are open for business.
Investors purchasing Class I, Class P and Class L shares through a Financial Intermediary may be charged a transaction-based or other fee by the Financial Intermediary for its services. If you are purchasing Class I, Class P or Class L shares through a Financial
51
Shareholder Information (Cont'd)
Intermediary, please consult your Financial Intermediary for purchase instructions.
The minimum initial investment generally is $5,000,000 for Class I shares, $1,000,000 for Class P shares and $25,000 for Class L shares of a Portfolio. The minimum initial investment will be waived for certain investments, including sales through banks, broker-dealers and other financial institutions (including registered investment advisers and financial planners) purchasing shares on behalf of their clients in (i) discretionary and non-discretionary advisory programs, (ii) fund supermarkets, (iii) asset allocation programs or (iv) other programs in which the client pays an asset-based fee for advice or for executing transactions in Portfolio shares or for otherwise participating in the program. In addition, the minimum initial investment will be waived for: (i) certain retirement plans investing directly with the Fund; (ii) retirement plans investing through certain retirement plan platforms; (iii) certain endowments, foundations and other not for profit entities investing directly with the Fund; (iv) other registered investment companies advised by Morgan Stanley Investment Management or any of its affiliates; (v) Morgan Stanley Investment Management and its affiliates with respect to shares held in connection with certain retirement and deferred compensation programs established for their employees; (vi) the independent Directors of the Fund; (vii) clients who owned Portfolio shares as of December 31, 2007; and (viii) investments made in connection with certain reorganizations as determined by the Adviser. If the value of your account falls below the minimum initial investment amount for Class I, Class P or Class L shares as a result of share redemptions or you no longer meet one of the waiver criteria set forth above, your account may be subject to involuntary conversion or involuntary redemption. You will be notified prior to any such conversions or redemptions.
Initial Purchase by Mail
You may open an account, subject to acceptance by the Fund, by completing and signing an Account Registration Form provided by Morgan Stanley Services Company Inc. ("Morgan Stanley Services"), the Fund's transfer agent, which you can obtain by calling Morgan Stanley Services at 1-800-548-7786 and mailing it to Morgan Stanley Institutional Fund, Inc., c/o Morgan Stanley Services Company Inc., P.O. Box 219804, Kansas City, MO 64121-9804 together with a check payable to Morgan Stanley Institutional Fund, Inc.
Please note that payments to investors who redeem Class I, Class P and Class L shares purchased by check will not be made until payment of the purchase has been collected, which may take up to 15 business days after purchase. You can avoid this delay by purchasing Class I, Class P and Class L shares by wire.
Initial Purchase by Wire
You may purchase Class I, Class P and Class L shares of each Portfolio by wiring Federal Funds (monies credited by a Federal Reserve Bank) to State Street Bank and Trust Company (the "Custodian"). You should forward a completed Account Registration Form to Morgan Stanley Services in advance of the wire. See the section above entitled "Pricing of Portfolio Shares." Instruct your bank to send a Federal Funds wire in a specified amount to the Custodian using the following wire instructions:
State Street Bank and Trust Company
One Lincoln Street
Boston, MA 02111-2101
ABA #011000028
DDA #00575373
Attn: Morgan Stanley Institutional Fund, Inc.
Subscription Account
Ref: (Portfolio Name, Account Number,
Account Name)
Additional Investments
You may purchase additional Class I, Class P and Class L shares for your account at any time by purchasing shares at NAV by any of the methods described above. For additional purchases directly from the Fund, your account name, account number, the Portfolio name and the class selected must be specified in the letter to assure proper crediting to your account. In addition, you may purchase additional shares by wire by following instructions under "Initial Purchase by Wire."
How To Purchase Class H Shares
The Fund is not currently offering Class H shares of the Active International Allocation and International Equity Portfolios. The Fund may commence offering Class H shares of the Active International Allocation and International Equity Portfolios in the future. Any such offerings of the Active International Allocation Portfolio's and the International Equity Portfolio's Class H shares may commence and terminate without any prior notice.
Class H shares of a Portfolio may be purchased by contacting your authorized financial representative who will assist you, step-by-step, with the procedures to invest in Class H shares.
Class H shares are available to investors with a minimum investment of $25,000. The minimum initial investment may be waived for investments made in connection with certain reorganizations as determined by the Adviser. If the value of your account falls below the minimum initial investment amount for Class H shares as a result of share redemptions, your account may be subject to involuntary redemption. You will be notified prior to any such redemptions.
Class H shares are subject to a sales charge equal to a maximum of 4.75% calculated as a percentage of the offering price on a single transaction as shown in the table below. As shown below, the sales charge is reduced for purchases of $50,000 and over.
52
Morgan Stanley Institutional Fund, Inc. Prospectus
Shareholder Information
Shareholder Information (Cont'd)
| | | Front End Sales Charge | |
| Amount of Single Transaction | | Percentage of
Public Offering Price | | Approximate Percentage
of Net Amount Invested | |
| $25,000 but less than $50,000 | | | 4.75 | % | | | 4.99 | % | |
| $50,000 but less than $100,000 | | | 4.00 | % | | | 4.17 | % | |
| $100,000 but less than $250,000 | | | 3.00 | % | | | 3.09 | % | |
| $250,000 but less than $500,000 | | | 2.50 | % | | | 2.56 | % | |
| $500,000 but less than $1 million | | | 2.00 | % | | | 2.04 | % | |
| $1 million and over | | | 0.00 | % | | | 0.00 | % | |
You may benefit from a reduced sales charge schedule (i.e., breakpoint discount) for purchases of Class H shares of a Portfolio, by combining, in a single transaction, your purchase with purchases of Class H shares of a Portfolio by the following related accounts:
• A single account (including an individual, trust or fiduciary account).
• A family member account (limited to spouse, and children under the age of 21).
• Pension, profit sharing or other employee benefit plans of companies and their affiliates.
• Employer sponsored and individual retirement accounts (including IRAs, Keogh, 401(k), 403(b), 408(k) and 457(b) Plans).
• Tax-exempt organizations.
• Groups organized for a purpose other than to buy mutual fund shares.
In addition to investments of $1 million or more, purchases of Class H shares are not subject to a front-end sales charge for accounts of employees of Morgan Stanley and its subsidiaries, such persons' family members (limited to spouse, and children under the age of 21) and trust accounts for which any such person is a beneficiary. The front-end sales charge may also be waived in connection with certain reorganizations as determined by the Adviser.
Combined Purchase Privilege
You will have the benefit of reduced sales charges by combining purchases of Class H shares of a Portfolio for any related account in a single transaction with purchases of Class H shares of another portfolio of the Fund or of a portfolio of Morgan Stanley Institutional Fund Trust for the related account or any other related account. For the purpose of this combined purchase privilege, a "related account" is:
• A single account (including an individual account, a joint account and a trust account established solely for the benefit of the individual).
• A family member account (limited to spouse, and children under the age of 21, but including trust accounts established solely for the benefit of a spouse, or children under the age of 21).
• An IRA and single participant retirement account (such as a Keogh).
• An UGMA/UTMA account.
Right of Accumulation
You may benefit from a reduced sales charge if the cumulative NAV of Class H shares of a Portfolio purchased in a single transaction, together with the NAV of all Class H shares of a portfolio of the Fund or of a portfolio of Morgan Stanley Institutional Fund Trust held in related accounts, amounts to $50,000 or more. For the purposes of the right of accumulation privilege, a related account is any one of the accounts listed under "Combined Purchase Privilege" above.
Notification
You must notify your authorized financial representative at the time a purchase order is placed, that the purchase qualifies for a reduced sales charge under any of the privileges discussed above. The reduced sales charge will not be granted if: (i) notification is not furnished at the time of the order; or (ii) a review of the records of Morgan Stanley Smith Barney LLC ("Morgan Stanley Smith Barney") or your authorized financial representative or the Fund's transfer agent, Morgan Stanley Services, does not confirm your represented holdings.
In order to obtain a reduced sales charge under any of the privileges discussed above, it may be necessary at the time of purchase for you to inform your authorized financial representative of the existence of other accounts in which there are holdings eligible to be aggregated to meet the sales load breakpoint and/or right of accumulation threshold. In order to verify your eligibility, you may be required to provide account statements and/or confirmations regarding Class H shares of a portfolio of the Fund or of a portfolio of Morgan Stanley Institutional Fund Trust held in all related accounts described above at your authorized financial representative, as well as shares held by related parties, such as members of the same family or household, in order to determine whether you have met the sales load breakpoint and/or right of accumulation threshold.
Letter of Intent
The above schedule of reduced sales charges for larger purchases also will be available to you if you enter into a written "Letter of Intent." A Letter of Intent provides for the purchase of Class H shares of a portfolio of the Fund or of a portfolio of Morgan Stanley Institutional Fund Trust within a 13-month period. The initial purchase under a Letter of Intent must be at least 5% of the stated investment goal. The Letter of Intent does not preclude a Portfolio from discontinuing sales of its shares. To determine the applicable sales charge reduction, you may
53
Shareholder Information (Cont'd)
also include (1) the cost of other Class H shares which were previously purchased at a price including a front-end sales charge during the 90-day period prior to the Distributor receiving the Letter of Intent and (2) the historical cost of Class H shares of other portfolios of the Fund or portfolios of Morgan Stanley Institutional Fund Trust you currently own acquired in exchange for shares of other portfolios of the Fund or portfolios of Morgan Stanley Institutional Fund Trust purchased during that period at a price including a front-end sales charge. You may combine purchases and exchanges by family members (limited to spouse, and children under the age of 21) during the period referenced above. You should retain any records necessary to substantiate historical costs because the Fund, Morgan Stanley Services and your authorized financial representative may not maintain this information. You can obtain a Letter of Intent by contacting your authorized financial representative. If you do not achieve the stated investment goal within the 13-month period, you are required to pay the difference between the sales charges otherwise applicable and sales charges actually paid, which may be deducted from your investment. Shares acquired through reinvestment of distributions are not aggregated to achieve the stated investment goal.
Additional Investments
You may purchase additional Class H shares for your account at any time by purchasing shares at NAV, plus any applicable sales charge.
Order Processing Fees
Your financial intermediary may charge processing or other fees in connection with the purchase or sale of Class H shares. Please consult your authorized financial representative for more information regarding any such fee.
General
Class I, Class P Class H and Class L shares may, in the Fund's discretion, be purchased with investment securities (in lieu of or, in conjunction with, cash) acceptable to the Fund. The securities would be accepted by the Fund at their market value in return for Portfolio shares of equal value, taking into account any applicable sales charge.
To help the U.S. Government fight the funding of terrorism and money laundering activities, federal law requires all financial institutions to obtain, verify and record information that identifies each person who opens an account. What this means to you: when you open an account, we will ask your name, address, date of birth and other information that will allow us to identify you. If we are unable to verify your identity, we reserve the right to restrict additional transactions and/or liquidate your account at the next calculated NAV after your account is closed (less any applicable sales/account charges and/or tax penalties) or take any other action required by law. In accordance with federal law requirements, the Fund has implemented an anti-money laundering compliance program, which includes the designation of an anti-money laundering compliance officer.
Other Transaction Information
The Fund may suspend the offering of shares, or any class of shares, of the Portfolios or reject any purchase orders when we think it is in the best interests of the Fund.
Certain patterns of exchange and/or purchase or sale transactions involving the Portfolios may result in the Fund rejecting, limiting or prohibiting, at its sole discretion, and without prior notice, additional purchases and/or exchanges and may result in a shareholder's account being closed. Determination in this regard may be made based on the frequency or dollar amount of the previous exchange or purchase or sale transaction. See "Frequent Purchases and Redemptions of Shares."
How To Redeem Class I, Class P and Class L Shares
You may redeem Class I, Class P and Class L shares of a Portfolio by mail or, if authorized, by telephone, at no charge other than as described below. The value of shares redeemed may be more or less than the purchase price, depending on the NAV at the time of redemption. Class I, Class P and Class L shares of a Portfolio will be redeemed at the NAV next determined after we receive your redemption request in good order.
Requests should be addressed to Morgan Stanley Institutional Fund, Inc., c/o Morgan Stanley Services Company Inc., P.O. Box 219804, Kansas City, MO 64121-9804.
To be in good order, redemption requests must include the following documentation:
(a) A letter of instruction, if required, or a stock assignment specifying the number of shares or dollar amount to be redeemed, signed by all registered owners of the shares in the exact names in which the shares are registered;
(b) The share certificates, if issued;
(c) Any required signature guarantees; and
(d) Other supporting legal documents, if required, in the case of estates, trusts, guardianships, custodianship, corporations, pension and profit sharing plans and other organizations.
You automatically have telephone redemption and exchange privileges unless you indicate otherwise by checking the applicable box on the new account application form or calling Morgan Stanley Services to opt out of such privileges. You may request a redemption of Class I, Class P and Class L shares by calling the Fund at 1-800-548-7786 and requesting that the redemption proceeds be wired to you. You cannot redeem Class I, Class P and Class L shares by telephone if you hold share certificates for those shares. For your protection when calling the Fund, we will employ reasonable procedures to confirm that instructions communicated over the telephone are genuine. These procedures may include requiring various forms of personal identification such as name, mailing address, social security number or other tax identification number. Telephone instructions may
54
Morgan Stanley Institutional Fund, Inc. Prospectus
Shareholder Information
Shareholder Information (Cont'd)
also be recorded. If reasonable procedures are employed, none of Morgan Stanley, Morgan Stanley Services or the Fund will be liable for following telephone instructions which it reasonably believes to be genuine. Telephone redemptions and exchanges may not be available if you cannot reach Morgan Stanley Services by telephone, whether because all telephone lines are busy or for any other reason; in such case, a shareholder would have to use the Fund's other redemption and exchange procedures described in this Prospectus. During periods of drastic economic or market changes, it is possible that the telephone privileges may be difficult to implement, although this has not been the case with the Fund in the past. To opt out of telephone privileges, please contact Morgan Stanley Services at 1-800-548-7786.
The Fund will ordinarily distribute redemption proceeds in cash within one business day of your redemption request, but it may take up to seven days. However, if you purchased Class I, Class P and Class L shares by check, the Fund will not distribute redemption proceeds until it has collected your purchase payment, which may take up to eight days.
If we determine that it is in the best interest of the Fund or Portfolio not to pay redemption proceeds in cash, we may distribute to you securities held by the Portfolio. If requested, we will pay a portion of your redemption(s) in cash (during any 90 day period) up to the lesser of $250,000 or 1% of the net assets of the Portfolio at the beginning of such period. Such in-kind securities may be illiquid and difficult or impossible for a shareholder to sell at a time and at a price that a shareholder would like. Redemptions paid in such securities generally will give rise to income, gain or loss for income tax purposes in the same manner as redemptions paid in cash. In addition, you may incur brokerage costs and a further gain or loss for income tax purposes when you ultimately sell the securities.
Class I, Class P and Class L shares of a Portfolio (except Global Franchise and Select Global Infrastructure Portfolios) redeemed within 30 days of purchase may be subject to a 2% redemption fee, payable to the Portfolio. The redemption fee is designed to protect the Portfolios and their remaining shareholders from the effects of short-term trading. The redemption fee is not imposed on redemptions made: (i) through systematic withdrawal/exchange plans, (ii) through pre-approved asset allocation programs, (iii) of shares received by reinvesting income dividends or capital gain distributions, (iv) through certain collective trust funds or other pooled vehicles, (v) on behalf of advisory accounts where client allocations are solely at the discretion of the Morgan Stanley Investment Management investment team and (vi) transactions by funds of funds advised by Morgan Stanley Investment Management. The redemption fee is based on, and deducted from, the redemption proceeds. Each time you redeem or exchange Class I, Class P and Class L shares, the shares held the longest will be redeemed or exchanged first.
The redemption fee may not be imposed on transactions that occur through certain omnibus accounts at Financial Intermediaries. Certain Financial Intermediaries may not have the ability to assess a redemption fee. Certain Financial Intermediaries may apply different methodologies than those described above in assessing redemption fees, may impose their own redemption fee that may differ from a Portfolio's redemption fee or may impose certain trading restrictions to deter market-timing and frequent trading. If you invest in a Portfolio through a Financial Intermediary, please read that Financial Intermediary's materials carefully to learn about any other restrictions or fees that may apply.
Exchange Privilege
You may exchange Class I, Class P and Class L shares for the same class of shares of other available portfolios of the Fund and available portfolios of Morgan Stanley Institutional Fund Trust. Exchanges are effected based on the respective NAVs of the applicable portfolios (subject to any applicable redemption fee). To obtain a prospectus for another portfolio, call the Fund at 1-800-548-7786 or contact your Financial Intermediary. If you purchased Portfolio shares through a Financial Intermediary, certain portfolios may be unavailable for exchange. Contact your Financial Intermediary to determine which portfolios are available for exchange.
You can process your exchange by contacting your Financial Intermediary. Otherwise, you should send exchange requests to Morgan Stanley Services by mail to Morgan Stanley Institutional Fund, Inc., c/o Morgan Stanley Services Company Inc., P.O. Box 219804, Kansas City, MO 64121-9804. Exchange requests can also be made by calling 1-800-548-7786.
When you exchange for Class I, Class P or Class L shares of another portfolio, your transaction will be treated the same as an initial purchase. You will be subject to the same minimum initial investment and account size as an initial purchase. Your exchange price will be the price calculated at the next Pricing Time after the Fund receives your exchange order. The Fund, in its sole discretion, may waive the minimum initial investment amount in certain cases. An exchange of Class I, Class P or Class L shares of a Portfolio (except the Global Franchise and Select Global Infrastructure Portfolios) held for less than 30 days from the date of purchase will be subject to the 2% redemption fee described above. The Fund may terminate or revise the exchange privilege upon required notice or in certain cases without notice.
How To Redeem Class H Shares
You may redeem Class H shares of a Portfolio by contacting your authorized financial representative. The value of Class H shares redeemed may be more or less than the purchase price, depending on the NAV at the time of redemption. Class H shares of the Portfolios will
55
Shareholder Information (Cont'd)
be redeemed at the NAV next determined after we receive your redemption request in good order.
The Fund will ordinarily distribute redemption proceeds in cash within one business day of your redemption request, but it may take up to seven days.
If we determine that it is in the best interest of the Fund or Portfolio not to pay redemption proceeds in cash, we may distribute to you securities held by the Portfolio. If requested, we will pay a portion of your redemption(s) in cash (during any 90 day period) up to the lesser of $250,000 or 1% of the net assets of the Portfolio at the beginning of such period. Such in-kind securities may be illiquid and difficult or impossible for a shareholder to sell at a time and at a price that a shareholder would like. Redemptions paid in such securities generally will give rise to income, gain or loss for income tax purposes in the same manner as redemptions paid in cash. In addition, you may incur brokerage costs and a further gain or loss for income tax purposes when you ultimately sell the securities.
Class H shares of a Portfolio (except Global Franchise and Select Global Infrastructure Portfolios) redeemed within 30 days of purchase may be subject to a 2% redemption fee, payable to the Portfolio. The redemption fee is designed to protect the Portfolio and its remaining shareholders from the effects of short-term trading. The redemption fee is not imposed on redemptions made: (i) through systematic withdrawal/exchange plans, (ii) through preapproved asset allocation programs, (iii) of shares received by reinvesting income dividends or capital gain distributions, (iv) through certain collective trust funds or other pooled vehicles, (v) on behalf of advisory accounts where client allocations are solely at the discretion of the Morgan Stanley Investment Management investment team and (vi) transactions by funds of funds advised by Morgan Stanley Investment Management. The redemption fee is based on, and deducted from, the redemption proceeds. Each time you redeem or exchange Class H shares, the shares held the longest will be redeemed or exchanged first.
The redemption fee may not be imposed on transactions that occur through certain omnibus accounts at Financial Intermediaries. Certain Financial Intermediaries may not have the ability to assess a redemption fee. Certain Financial Intermediaries may apply different methodologies than those described above in assessing redemption fees, may impose their own redemption fee that may differ from a Portfolio's redemption fee or may impose certain trading restrictions to deter market-timing and frequent trading. If you invest in a Portfolio through a Financial Intermediary, please read that Financial Intermediary's materials carefully to learn about any other restrictions or fees that may apply.
Exchange Privilege
You may exchange Class H shares of a Portfolio for Class H shares of other available portfolios of the Fund. In addition, you may exchange Class H shares for Class H shares of available portfolios of Morgan Stanley Institutional Fund Trust. Not all portfolios of Morgan Stanley Institutional Fund Trust offer Class H shares. Your ability to exchange Class H shares may therefore be limited. A front-end sales charge (load) is not imposed on exchanges of Class H shares. Exchanges are effected based on the respective NAVs of the applicable portfolios (subject to any applicable redemption fee). To obtain a prospectus for another portfolio, call the Fund at 1-800-548-7786 or contact your Financial Intermediary. If you purchased Portfolio shares through a Financial Intermediary, certain portfolios may be unavailable for exchange. Contact your Financial Intermediary to determine which portfolios are available for exchange.
You can process your exchange by contacting your Financial Intermediary.
When you exchange for Class H shares of another portfolio, your transaction will be treated the same as an initial purchase. You will be subject to the same minimum initial investment and account size as an initial purchase, except that it will not be subject to a front-end sales charge. Your exchange price will be the price calculated at the next Pricing Time after the Fund receives your exchange order. The Fund, in its sole discretion, may waive the minimum initial investment amount in certain cases. An exchange of Class H shares of a Portfolio (except Global Franchise and Select Global Infrastructure Portfolios) held for less than 30 days from the date of purchase will be subject to the 2% redemption fee described above. The Fund may terminate or revise the exchange privilege upon required notice or in certain cases without notice.
Frequent Purchases and Redemptions of Shares
Frequent purchases and redemptions of shares by Portfolio shareholders are referred to as "market-timing" or "short-term trading" and may present risks for other shareholders of a Portfolio, which may include, among other things, diluting the value of a Portfolio's shares held by long-term shareholders, interfering with the efficient management of the Portfolio, increasing brokerage and administrative costs, incurring unwanted taxable gains and forcing the Portfolio to hold excess levels of cash.
In addition, a Portfolio is subject to the risk that market-timers and/or short-term traders may take advantage of time zone differences between the foreign markets on which a Portfolio's securities trade and the time the Portfolio's NAV is calculated ("time-zone arbitrage"). For example, a market-timer may purchase shares of a Portfolio based on events occurring after foreign market closing prices are established, but before the Portfolio's NAV calculation, that are likely to result in higher prices in foreign markets the following day. The market-timer
56
Morgan Stanley Institutional Fund, Inc. Prospectus
Shareholder Information
Shareholder Information (Cont'd)
would redeem the Portfolio's shares the next day when the Portfolio's share price would reflect the increased prices in foreign markets for a quick profit at the expense of long-term Portfolio shareholders.
Investments in other types of securities also may be susceptible to short-term trading strategies. These investments include securities that are, among other things, thinly traded, traded infrequently or relatively illiquid, which have the risk that the current market price for the securities may not accurately reflect current market values. A shareholder may seek to engage in short-term trading to take advantage of these pricing differences (referred to as "price arbitrage"). Investment in certain types of fixed income securities may be adversely affected by price arbitrage trading securities.
The Fund discourages and does not accommodate frequent purchases and redemptions of Portfolio shares by Portfolio shareholders and the Fund's Board of Directors has adopted policies and procedures with respect to such frequent purchases and redemptions.
The Fund's policies with respect to purchases and redemptions of Portfolio shares are described in the "Shareholder Information—How To Purchase Class I, Class P and Class L Shares," "Shareholder Information—How to Purchase Class H Shares," "Shareholder Information—Other Transaction Information," "Shareholder Information—How To Redeem Class I, Class P and Class L Shares" and "Shareholder Information—How to Redeem Class H Shares" sections of this Prospectus. Except as described in each of these sections, and with respect to trades that occur through omnibus accounts at Financial Intermediaries, as described below, the Fund's policies regarding frequent trading of Portfolio shares are applied uniformly to all shareholders. With respect to trades that occur through omnibus accounts at Financial Intermediaries, such as investment advisers, broker-dealers, transfer agents and third party administrators, the Fund (i) has requested assurance that such Financial Intermediaries currently selling Portfolio shares have in place internal policies and procedures reasonably designed to address market-timing concerns and has instructed such Financial Intermediaries to notify the Fund immediately if they are unable to comply with such policies and procedures and (ii) requires all prospective Financial Intermediaries (or, upon prior written approval only, a Financial Intermediary's own policies) to agree to cooperate in enforcing the Fund's policies with respect to frequent purchases, redemptions and exchanges of Portfolio shares.
With respect to trades that occur through omnibus accounts at Financial Intermediaries, to some extent, the Fund relies on the Financial Intermediary to monitor frequent short-term trading within a Portfolio by the Financial Intermediary's customers and to collect the Portfolio's redemption fee, as applicable, from its customers. However, the Fund has entered into agreements with Financial Intermediaries whereby Financial Intermediaries are required to provide certain customer identification and transaction information upon the Fund's request. The Fund may use this information to help identify and prevent market-timing activity in the Fund. There can be no assurance that the Fund will be able to identify or prevent all market-timing activities.
Dividends and Distributions
Each Portfolio's policy is to distribute to shareholders substantially all of its net investment income, if any, in the form of an annual dividend and to distribute net realized capital gains, if any, at least annually.
The Fund automatically reinvests all dividends and distributions in additional shares. However, you may elect to receive distributions in cash by giving written notice to the Fund or your Financial Intermediary or by checking the appropriate box in the Distribution Option section on the Account Registration Form.
Taxes
The dividends and distributions you receive from a Portfolio may be subject to federal, state and local taxation, depending on your tax situation. The tax treatment of dividends and distributions is the same whether or not you reinvest them. For taxable years beginning before January 1, 2013, dividends paid by a Portfolio that are attributable to "qualified dividends" received by the Portfolio may be taxed at reduced rates to individual shareholders (15% at the maximum), if certain requirements are met by the Portfolio and the shareholders. "Qualified dividends" include dividends distributed by certain foreign corporations (generally, corporations incorporated in a possession of the United States, some corporations eligible for treaty benefits under a treaty with the United States, and corporations whose stock with respect to which such dividend is paid is readily tradable on an established securities market in the United States).
Dividends paid by a Portfolio not attributable to "qualified dividends" received by the Portfolio, including distributions of short-term capital gains, will be taxed at normal tax rates applicable to ordinary income. Long-term capital gains distributions to individuals are taxed at a reduced rate (15% at the maximum) before January 1, 2013, regardless of how long you have held your shares. Unless further Congressional legislative action is taken, reduced rates for dividends and long-term capital gain will cease to be in effect after December 31, 2012. A Portfolio may be able to pass through to you a credit for foreign income taxes it pays. The Fund will tell you annually how to treat dividends and distributions.
If you redeem shares of a Portfolio, you may be subject to tax on any gains you earn based on your holding period for the shares and your marginal tax rate. An exchange of shares of a Portfolio for shares of another portfolio is treated for tax purposes as a sale of the original shares in the Portfolio, followed by the purchase
57
Shareholder Information (Cont'd)
of shares in the other portfolio. Conversions of shares between classes will not result in taxation.
Due to recent legislation, the Portfolios (or their administrative agent) are required to report to the Internal Revenue Service and furnish to Portfolio shareholders the cost basis information for sale transactions of shares purchased on or after January 1, 2012. Shareholders may elect to have one of several cost basis methods applied to their account when calculating the cost basis of shares sold, including average cost, FIFO ("first-in, first-out") or some other specific identification method. Unless you instruct otherwise, each Portfolio will use average cost as its default cost basis method, and will treat sales as first coming from shares purchased prior to January 1, 2012. If average cost is used for the first sale of Portfolio shares covered by these new rules, the shareholder may only use an alternative cost basis method for shares purchased prospectively. Portfolio shareholders should consult with their tax advisors to determine the best cost basis method for their tax situation.
Because each investor's tax circumstances are unique and the tax laws may change, you should consult your tax advisor about your investment.
The Fund currently consists of the following portfolios:
U.S. Equity
Advantage Portfolio
Focus Growth Portfolio
Growth Portfolio
Insight Portfolio
Opportunity Portfolio
Small Company Growth Portfolio*
U.S. Real Estate Portfolio
Global and International Equity
Active International Allocation Portfolio
Asian Equity Portfolio
Emerging Markets Portfolio
Global Advantage Portfolio
Global Discovery Portfolio
Global Franchise Portfolio
Global Insight Portfolio
Global Opportunity Portfolio
Global Real Estate Portfolio
International Advantage Portfolio
International Equity Portfolio
International Opportunity Portfolio
International Real Estate Portfolio
International Small Cap Portfolio
Select Global Infrastructure Portfolio
Fixed Income
Emerging Markets Domestic Debt Portfolio
* Portfolio is currently closed to new investors
58
Morgan Stanley Institutional Fund, Inc. Prospectus
Financial Highlights
Financial Highlights
The financial highlights tables that follow are intended to help you understand the financial performance of the Class I, Class P, Class H and Class L shares of each Portfolio, as applicable, for the past five years or since inception if less than five years. Class H and Class L shares of the Active International Allocation, Emerging Markets, Global Franchise, International Equity and International Small Cap Portfolios had not commenced operations as of December 31, 2011. Certain information reflects financial results for a single Portfolio share. The total returns in the tables represent the rate that an investor would have earned (or lost) on an investment in each Portfolio (assuming reinvestment of all dividends and distributions).
The ratio of expenses to average net assets listed in the tables below for each class of shares of the Portfolios are based on the average net assets of such Portfolio for each of the periods listed in the tables. To the extent that a Portfolio's average net assets decrease over the Portfolio's next fiscal year, such expense ratios can be expected to increase, potentially significantly, because certain fixed costs will be spread over a smaller amount of assets.
The information below has been audited by Ernst & Young LLP, an independent registered public accounting firm. Ernst & Young LLP's report, along with each Portfolio's financial statements, are incorporated by reference into the Portfolios' SAI and are included in the Fund's Annual Report to Shareholders. The Annual Report to Shareholders and each Portfolio's financial statements, as well as the SAI, are available at no cost from the Fund at the toll-free number noted on the back cover to this Prospectus.
Active International Allocation Portfolio
| | | Class I | |
| | | Year Ended December 31, | |
| Selected Per Share Data and Ratios | | 2011 | | 2010 | | 2009 | | 2008 | | 2007 | |
| Net Asset Value, Beginning of Period | | $ | 12.06 | | | $ | 11.30 | | | $ | 9.11 | | | $ | 15.92 | | | $ | 15.10 | | |
| Income (Loss) from Investment Operations: | |
| Net Investment Income† | | | 0.27 | | | | 0.20 | | | | 0.21 | | | | 0.35 | | | | 0.30 | | |
| Net Realized and Unrealized Gain (Loss) | | | (2.03 | ) | | | 0.81 | | | | 2.26 | | | | (6.41 | ) | | | 1.96 | | |
| Total from Investment Operations | | | (1.76 | ) | | | 1.01 | | | | 2.47 | | | | (6.06 | ) | | | 2.26 | | |
| Distributions from and/or in Excess of: | |
| Net Investment Income | | | (0.23 | ) | | | (0.25 | ) | | | (0.28 | ) | | | (0.14 | ) | | | (0.54 | ) | |
| Net Realized Gain | | | — | | | | — | | | | — | | | | (0.61 | ) | | | (0.90 | ) | |
| Total Distributions | | | (0.23 | ) | | | (0.25 | ) | | | (0.28 | ) | | | (0.75 | ) | | | (1.44 | ) | |
| Redemption Fees | | | 0.00 | ‡ | | | 0.00 | ‡ | | | 0.00 | ‡ | | | 0.00 | ‡ | | | 0.00 | ‡ | |
| Net Asset Value, End of Period | | $ | 10.07 | | | $ | 12.06 | | | $ | 11.30 | | | $ | 9.11 | | | $ | 15.92 | | |
| Total Return++ | | | (14.56 | )% | | | 8.95 | % | | | 27.26 | % | | | (39.25 | )% | | | 15.30 | % | |
| Ratios and Supplemental Data: | |
| Net Assets, End of Period (Thousands) | | $ | 302,048 | | | $ | 441,350 | | | $ | 532,584 | | | $ | 565,313 | | | $ | 1,093,735 | | |
| Ratio of Expenses to Average Net Assets (1) | | | 0.84 | %+††^ | | | 0.79 | %+†† | | | 0.79 | %+ | | | 0.79 | %+ | | | 0.80 | %+ | |
| Ratio of Expenses to Average Net Assets Excluding Non Operating Expenses | | | 0.84 | %+††^ | | | 0.79 | %+†† | | | 0.79 | %+ | | | 0.79 | %+ | | | 0.80 | %+ | |
| Ratio of Net Investment Income to Average Net Assets (1) | | | 2.33 | %+†† | | | 1.82 | %+†† | | | 2.23 | %+ | | | 2.70 | %+ | | | 1.93 | %+ | |
| Ratio of Rebate from Morgan Stanley Affiliates to Average Net Assets | | | 0.01 | %†† | | | 0.01 | %†† | | | 0.01 | % | | | 0.01 | % | | | 0.00 | %§ | |
| Portfolio Turnover Rate | | | 26 | % | | | 19 | % | | | 33 | % | | | 34 | % | | | 28 | % | |
| (1) Supplemental Information on the Ratios to Average Net Assets: | |
| Ratios Before Expense Limitation: | |
| Expenses to Average Net Assets | | | 0.95 | %†† | | | 0.92 | %+†† | | | 0.85 | %+ | | | 0.82 | %+ | | | 0.81 | %+ | |
| Net Investment Income to Average Net Assets | | | 2.22 | %†† | | | 1.69 | %+†† | | | 2.17 | %+ | | | 2.67 | %+ | | | 1.92 | %+ | |
† Per share amount is based on average shares outstanding.
‡ Amount is less than $0.005 per share.
++ Calculated based on the net asset value as of the last business day of the period.
+ The Ratios of Expenses and Net Investment Income reflect the rebate of certain Portfolio expenses in connection with the investments in Morgan Stanley affiliates during the period. The effect of the rebate on the ratios is disclosed in the above table as "Ratio of Rebate from Morgan Stanley Affiliates to Average Net Assets."
†† Reflects overall Portfolio ratios for investment income and non-class specific expenses.
§ Amount is less than 0.005%.
^ Effective July 1, 2011, the Adviser has agreed to limit the ratio of expenses to average net assets to the maximum ratio of 0.90% for Class I shares. Prior to July 1, 2011, the maximum ratio was 0.80% for Class I shares.
59
Active International Allocation Portfolio
| | | Class P | |
| | | Year Ended December 31, | |
| Selected Per Share Data and Ratios | | 2011 | | 2010 | | 2009 | | 2008 | | 2007 | |
| Net Asset Value, Beginning of Period | | $ | 12.28 | | | $ | 11.50 | | | $ | 9.27 | | | $ | 16.20 | | | $ | 15.36 | | |
| Income (Loss) from Investment Operations: | |
| Net Investment Income† | | | 0.25 | | | | 0.18 | | | | 0.18 | | | | 0.29 | | | | 0.24 | | |
| Net Realized and Unrealized Gain (Loss) | | | (2.07 | ) | | | 0.81 | | | | 2.31 | | | | (6.48 | ) | | | 2.01 | | |
| Total from Investment Operations | | | (1.82 | ) | | | 0.99 | | | | 2.49 | | | | (6.19 | ) | | | 2.25 | | |
| Distributions from and/or in Excess of: | |
| Net Investment Income | | | (0.19 | ) | | | (0.21 | ) | | | (0.26 | ) | | | (0.13 | ) | | | (0.51 | ) | |
| Net Realized Gain | | | — | | | | — | | | | — | | | | (0.61 | ) | | | (0.90 | ) | |
| Total Distributions | | | (0.19 | ) | | | (0.21 | ) | | | (0.26 | ) | | | (0.74 | ) | | | (1.41 | ) | |
| Redemption Fees | | | 0.00 | ‡ | | | 0.00 | ‡ | | | 0.00 | ‡ | | | 0.00 | ‡ | | | 0.00 | ‡ | |
| Net Asset Value, End of Period | | $ | 10.27 | | | $ | 12.28 | | | $ | 11.50 | | | $ | 9.27 | | | $ | 16.20 | | |
| Total Return++ | | | (14.75 | )% | | | 8.69 | % | | | 26.99 | % | | | (39.41 | )% | | | 14.95 | % | |
| Ratios and Supplemental Data: | |
| Net Assets, End of Period (Thousands) | | $ | 10,387 | | | $ | 14,477 | | | $ | 16,479 | | | $ | 7,614 | | | $ | 5,285 | | |
| Ratio of Expenses to Average Net Assets (1) | | | 1.09 | %+††^ | | | 1.04 | %+†† | | | 1.04 | %+ | | | 1.04 | %+ | | | 1.05 | %+ | |
| Ratio of Expenses to Average Net Assets Excluding Non Operating Expenses | | | 1.09 | %+††^ | | | 1.04 | %+†† | | | 1.04 | %+ | | | 1.04 | %+ | | | 1.05 | %+ | |
| Ratio of Net Investment Income to Average Net Assets (1) | | | 2.08 | %+†† | | | 1.57 | %+†† | | | 1.80 | %+ | | | 2.32 | %+ | | | 1.52 | %+ | |
| Ratio of Rebate from Morgan Stanley Affiliates to Average Net Assets | | | 0.01 | %†† | | | 0.01 | %†† | | | 0.01 | % | | | 0.01 | % | | | 0.00 | %§ | |
| Portfolio Turnover Rate | | | 26 | % | | | 19 | % | | | 33 | % | | | 34 | % | | | 28 | % | |
| (1) Supplemental Information on the Ratios to Average Net Assets: | |
| Ratios Before Expense Limitation: | |
| Expenses to Average Net Assets | | | 1.20 | %†† | | | 1.17 | %+†† | | | 1.10 | %+ | | | 1.07 | %+ | | | 1.06 | %+ | |
| Net Investment Income to Average Net Assets | | | 1.97 | %†† | | | 1.44 | %+†† | | | 1.74 | %+ | | | 2.29 | %+ | | | 1.51 | %+ | |
† Per share amount is based on average shares outstanding.
‡ Amount is less than $0.005 per share.
++ Calculated based on the net asset value as of the last business day of the period.
+ The Ratios of Expenses and Net Investment Income reflect the rebate of certain Portfolio expenses in connection with the investments in Morgan Stanley affiliates during the period. The effect of the rebate on the ratios is disclosed in the above table as "Ratio of Rebate from Morgan Stanley Affiliates to Average Net Assets."
†† Reflects overall Portfolio ratios for investment income and non-class specific expenses.
§ Amount is less than 0.005%.
^ Effective July 1, 2011, the Adviser has agreed to limit the ratio of expenses to average net assets to the maximum ratio of 1.15% for Class P shares. Prior to July 1, 2011, the maximum ratio was 1.05% for Class P shares.
60
Morgan Stanley Institutional Fund, Inc. Prospectus
Financial Highlights
Asian Equity Portfolio
| | | Class I | |
| Selected Per Share Data and Ratios | | Year Ended
December 31,
2011 | | Period from
December 28,
2010^ to
December 31,
2010 | |
| Net Asset Value, Beginning of Period | | $ | 10.19 | | | $ | 10.00 | | |
| Income (Loss) from Investment Operations: | |
| Net Investment Income (Loss)† | | | 0.00 | ‡ | | | (0.00 | )‡ | |
| Net Realized and Unrealized Gain (Loss) | | | (1.72 | ) | | | 0.19 | | |
| Total from Investment Operations | | | (1.72 | ) | | | 0.19 | | |
| Net Asset Value, End of Period | | $ | 8.47 | | | $ | 10.19 | | |
| Total Return++ | | | (16.88 | )% | | | 1.90 | %# | |
| Ratios and Supplemental Data:†† | |
| Net Assets, End of Period (Thousands) | | $ | 1,201 | | | $ | 1,223 | | |
| Ratio of Expenses to Average Net Assets (1) | | | 1.45 | %+ | | | 1.45 | %* | |
| Ratio of Net Investment Income (Loss) to Average Net Assets (1) | | | 0.01 | %+ | | | (1.34 | )%* | |
| Ratio of Rebate from Morgan Stanley Affiliates to Average Net Assets | | | 0.00 | %§ | | | N/A | | |
| Portfolio Turnover Rate | | | 38 | % | | | 0.00 | %# | |
| (1) Supplemental Information on the Ratios to Average Net Assets:†† | |
| Ratios Before Expense Limitation: | |
| Expenses to Average Net Assets | | | 11.86 | % | | | 176.73 | %* | |
| Net Investment Loss to Average Net Assets | | | (10.40 | )% | | | (176.62 | )%* | |
^ Commencement of Operations.
† Per share amount is based on average shares outstanding.
‡ Amount is less than $0.005 per share.
++ Calculated based on the net asset value as of the last business day of the period.
+ The Ratios of Expenses and Net Investment Income (Loss) reflect the rebate of certain Portfolio expenses in connection with the investments in Morgan Stanley affiliates during the period. The effect of the rebate on the ratios is disclosed in the above table as "Ratio of Rebate from Morgan Stanley Affiliates to Average Net Assets."
†† Reflects overall Portfolio ratios for investment income and non-class specific expenses.
§ Amount is less than 0.005%.
# Not Annualized.
* Annualized.
61
Asian Equity Portfolio
| | | Class P | |
| Selected Per Share Data and Ratios | | Year Ended
December 31,
2011 | | Period from
December 28,
2010^ to
December 31,
2010 | |
| Net Asset Value, Beginning of Period | | $ | 10.19 | | | $ | 10.00 | | |
| Income (Loss) from Investment Operations: | |
| Net Investment Loss† | | | (0.02 | ) | | | (0.00 | )‡ | |
| Net Realized and Unrealized Gain (Loss) | | | (1.72 | ) | | | 0.19 | | |
| Total from Investment Operations | | | (1.74 | ) | | | 0.19 | | |
| Net Asset Value, End of Period | | $ | 8.45 | | | $ | 10.19 | | |
| Total Return++ | | | (17.08 | )% | | | 1.90 | %# | |
| Ratios and Supplemental Data:†† | |
| Net Assets, End of Period (Thousands) | | $ | 84 | | | $ | 102 | | |
| Ratio of Expenses to Average Net Assets (1) | | | 1.70 | %+ | | | 1.70 | %* | |
| Ratio of Net Investment Loss to Average Net Assets (1) | | | (0.24 | )%+ | | | (1.59 | )%* | |
| Ratio of Rebate from Morgan Stanley Affiliates to Average Net Assets | | | 0.00 | %§ | | | N/A | | |
| Portfolio Turnover Rate | | | 38 | % | | | 0.00 | %# | |
| (1) Supplemental Information on the Ratios to Average Net Assets:†† | |
| Ratios Before Expense Limitation: | |
| Expenses to Average Net Assets | | | 12.11 | % | | | 176.98 | %* | |
| Net Investment Loss to Average Net Assets | | | (10.65 | )% | | | (176.87 | )%* | |
^ Commencement of Operations.
† Per share amount is based on average shares outstanding.
‡ Amount is less than $0.005 per share.
++ Calculated based on the net asset value as of the last business day of the period.
+ The Ratios of Expenses and Net Investment Loss reflect the rebate of certain Portfolio expenses in connection with the investments in Morgan Stanley affiliates during the period. The effect of the rebate on the ratios is disclosed in the above table as "Ratio of Rebate from Morgan Stanley Affiliates to Average Net Assets."
†† Reflects overall Portfolio ratios for investment income and non-class specific expenses.
§ Amount is less than 0.005%.
# Not Annualized.
* Annualized.
62
Morgan Stanley Institutional Fund, Inc. Prospectus
Financial Highlights
Asian Equity Portfolio
| | | Class H | |
| Selected Per Share Data and Ratios | | Year Ended
December 31,
2011 | | Period from
December 28,
2010^ to
December 31,
2010 | |
| Net Asset Value, Beginning of Period | | $ | 10.19 | | | $ | 10.00 | | |
| Income (Loss) from Investment Operations: | |
| Net Investment Loss† | | | (0.02 | ) | | | (0.00 | )‡ | |
| Net Realized and Unrealized Gain (Loss) | | | (1.72 | ) | | | 0.19 | | |
| Total from Investment Operations | | | (1.74 | ) | | | 0.19 | | |
| Net Asset Value, End of Period | | $ | 8.45 | | | $ | 10.19 | | |
| Total Return++ | | | (17.08 | )% | | | 1.90 | %# | |
| Ratios and Supplemental Data:†† | |
| Net Assets, End of Period (Thousands) | | $ | 84 | | | $ | 102 | | |
| Ratio of Expenses to Average Net Assets (1) | | | 1.70 | %+ | | | 1.70 | %* | |
| Ratio of Net Investment Loss to Average Net Assets (1) | | | (0.24 | )%+ | | | (1.59 | )%* | |
| Ratio of Rebate from Morgan Stanley Affiliates to Average Net Assets | | | 0.00 | %§ | | | N/A | | |
| Portfolio Turnover Rate | | | 38 | % | | | 0.00 | %# | |
| (1) Supplemental Information on the Ratios to Average Net Assets:†† | |
| Ratios Before Expense Limitation: | |
| Expense to Average Net Assets | | | 12.11 | % | | | 176.98 | %* | |
| Net Investment Loss to Average Net Assets | | | (10.65 | )% | | | (176.87 | )%* | |
^ Commencement of Operations.
† Per share amount is based on average shares outstanding.
‡ Amount is less than $0.005 per share.
++ Calculated based on the net asset value which does not reflect sales charges, if applicable, as of the last business day of the period.
+ The Ratios of Expenses and Net Investment Loss reflect the rebate of certain Portfolio expenses in connection with the investments in Morgan Stanley affiliates during the period. The effect of the rebate on the ratios is disclosed in the above table as "Ratio of Rebate from Morgan Stanley Affiliates to Average Net Assets."
†† Reflects overall Portfolio ratios for investment income and non-class specific expenses.
§ Amount is less than 0.005%.
# Not Annualized.
* Annualized.
63
Asian Equity Portfolio
| | | Class L | |
| Selected Per Share Data and Ratios | | Year Ended
December 31,
2011 | | Period from
December 28,
2010^ to
December 31,
2010 | |
| Net Asset Value, Beginning of Period | | $ | 10.19 | | | $ | 10.00 | | |
| Income (Loss) from Investment Operations: | |
| Net Investment Loss† | | | (0.07 | ) | | | (0.00 | )‡ | |
| Net Realized and Unrealized Gain (Loss) | | | (1.72 | ) | | | 0.19 | | |
| Total from Investment Operations | | | (1.79 | ) | | | 0.19 | | |
| Net Asset Value, End of Period | | $ | 8.40 | | | $ | 10.19 | | |
| Total Return++ | | | (17.57 | )% | | | 1.90 | %# | |
| Ratios and Supplemental Data:†† | |
| Net Assets, End of Period (Thousands) | | $ | 84 | | | $ | 102 | | |
| Ratio of Expenses to Average Net Assets (1) | | | 2.20 | %+ | | | 2.20 | %* | |
| Ratio of Net Investment Loss to Average Net Assets (1) | | | (0.74 | )%+ | | | (2.09 | )%* | |
| Ratio of Rebate from Morgan Stanley Affiliates to Average Net Assets | | | 0.00 | %§ | | | N/A | | |
| Portfolio Turnover Rate | | | 38 | % | | | 0.00 | %# | |
| (1) Supplemental Information on the Ratios to Average Net Assets:†† | |
| Ratios Before Expense Limitation: | |
| Expenses to Average Net Assets | | | 12.61 | % | | | 177.48 | %* | |
| Net Investment Loss to Average Net Assets | | | (11.15 | )% | | | (177.37 | )%* | |
^ Commencement of Operations.
† Per share amount is based on average shares outstanding.
‡ Amount is less than $0.005 per share.
++ Calculated based on the net asset value as of the last business day of the period.
+ The Ratios of Expenses and Net Investment Loss reflect the rebate of certain Portfolio expenses in connection with the investments in Morgan Stanley affiliates during the period. The effect of the rebate on the ratios is disclosed in the above table as "Ratio of Rebate from Morgan Stanley Affiliates to Average Net Assets."
†† Reflects overall Portfolio ratios for investment income and non-class specific expenses.
§ Amount is less than 0.005%.
# Not Annualized.
* Annualized.
64
Morgan Stanley Institutional Fund, Inc. Prospectus
Financial Highlights
Emerging Markets Portfolio
| | | Class I | |
| | | Year Ended December 31, | |
| Selected Per Share Data and Ratios | | 2011 | | 2010 | | 2009 | | 2008 | | 2007 | |
| Net Asset Value, Beginning of Period | | $ | 27.14 | | | $ | 23.10 | | | $ | 13.79 | | | $ | 34.02 | | | $ | 29.29 | | |
| Income (Loss) from Investment Operations: | |
| Net Investment Income† | | | 0.22 | | | | 0.10 | | | | 0.10 | | | | 0.19 | | | | 0.10 | | |
| Net Realized and Unrealized Gain (Loss) | | | (5.22 | ) | | | 4.15 | | | | 9.49 | | | | (18.78 | ) | | | 11.76 | | |
| Total from Investment Operations | | | (5.00 | ) | | | 4.25 | | | | 9.59 | | | | (18.59 | ) | | | 11.86 | | |
| Distributions from and/or in Excess of: | |
| Net Investment Income | | | — | | | | (0.21 | ) | | | (0.28 | ) | | | — | | | | (0.13 | ) | |
| Net Realized Gain | | | (0.41 | ) | | | — | | | | — | | | | (1.64 | ) | | | (7.01 | ) | |
| Total Distributions | | | (0.41 | ) | | | (0.21 | ) | | | (0.28 | ) | | | (1.64 | ) | | | (7.14 | ) | |
| Redemption Fees | | | 0.00 | ‡ | | | 0.00 | ‡ | | | 0.00 | ‡ | | | 0.00 | ‡ | | | 0.01 | | |
| Net Asset Value, End of Period | | $ | 21.73 | | | $ | 27.14 | | | $ | 23.10 | | | $ | 13.79 | | | $ | 34.02 | | |
| Total Return++ | | | (18.41 | )% | | | 18.49 | % | | | 69.54 | % | | | (56.39 | )% | | | 41.56 | % | |
| Ratios and Supplemental Data: | |
| Net Assets, End of Period (Thousands) | | $ | 1,198,857 | | | $ | 2,031,778 | | | $ | 2,198,793 | | | $ | 1,191,199 | | | $ | 3,323,130 | | |
| Ratio of Expenses to Average Net Assets | | | 1.48 | %+†† | | | 1.47 | %+†† | | | 1.40 | %+ | | | 1.43 | %+ | | | 1.35 | %+ | |
| Ratio of Expenses to Average Net Assets Excluding Non Operating Expenses | | | N/A | | | | 1.47 | %+†† | | | 1.40 | %+ | | | 1.43 | %+ | | | 1.35 | %+ | |
| Ratio of Net Investment Income to Average Net Assets | | | 0.86 | %+†† | | | 0.40 | %+†† | | | 0.56 | %+ | | | 0.78 | %+ | | | 0.28 | %+ | |
| Ratio of Rebate from Morgan Stanley Affiliates to Average Net Assets | | | 0.01 | %†† | | | 0.01 | %†† | | | 0.01 | % | | | 0.00 | %§ | | | 0.00 | %§ | |
| Portfolio Turnover Rate | | | 60 | % | | | 59 | % | | | 64 | % | | | 96 | % | | | 101 | % | |
† Per share amount is based on average shares outstanding.
‡ Amount is less than $0.005 per share.
++ Calculated based on the net asset value as of the last business day of the period.
+ The Ratios of Expenses and Net Investment Income reflect the rebate of certain Portfolio expenses in connection with the investments in Morgan Stanley affiliates during the period. The effect of the rebate on the ratios is disclosed in the above table as "Ratio of Rebate from Morgan Stanley Affiliates to Average Net Assets."
†† Reflects overall Portfolio ratios for investment income and non-class specific expenses.
§ Amount is less than 0.005%.
65
Emerging Markets Portfolio
| | | Class P | |
| | | Year Ended December 31, | |
| Selected Per Share Data and Ratios | | 2011 | | 2010 | | 2009 | | 2008 | | 2007 | |
| Net Asset Value, Beginning of Period | | $ | 26.56 | | | $ | 22.61 | | | $ | 13.51 | | | $ | 33.46 | | | $ | 28.91 | | |
| Income (Loss) from Investment Operations: | |
| Net Investment Income† | | | 0.15 | | | | 0.04 | | | | 0.06 | | | | 0.13 | | | | 0.01 | | |
| Net Realized and Unrealized Gain (Loss) | | | (5.10 | ) | | | 4.06 | | | | 9.28 | | | | (18.44 | ) | | | 11.60 | | |
| Total from Investment Operations | | | (4.95 | ) | | | 4.10 | | | | 9.34 | | | | (18.31 | ) | | | 11.61 | | |
| Distributions from and/or in Excess of: | |
| Net Investment Income | | | — | | | | (0.15 | ) | | | (0.24 | ) | | | — | | | | (0.05 | ) | |
| Net Realized Gain | | | (0.41 | ) | | | — | | | | — | | | | (1.64 | ) | | | (7.01 | ) | |
| Total Distributions | | | (0.41 | ) | | | (0.15 | ) | | | (0.24 | ) | | | (1.64 | ) | | | (7.06 | ) | |
| Redemption Fees | | | 0.00 | ‡ | | | 0.00 | ‡ | | | 0.00 | ‡ | | | 0.00 | ‡ | | | 0.00 | ‡ | |
| Net Asset Value, End of Period | | $ | 21.20 | | | $ | 26.56 | | | $ | 22.61 | | | $ | 13.51 | | | $ | 33.46 | | |
| Total Return++ | | | (18.63 | )% | | | 18.20 | % | | | 69.11 | % | | | (56.50 | )% | | | 41.20 | % | |
| Ratios and Supplemental Data: | |
| Net Assets, End of Period (Thousands) | | $ | 46,521 | | | $ | 113,434 | | | $ | 126,487 | | | $ | 67,559 | | | $ | 179,834 | | |
| Ratio of Expenses to Average Net Assets | | | 1.73 | %+†† | | | 1.72 | %+†† | | | 1.65 | %+ | | | 1.68 | %+ | | | 1.60 | %+ | |
| Ratio of Expenses to Average Net Assets Excluding Non Operating Expenses | | | N/A | | | | 1.72 | %+†† | | | 1.65 | %+ | | | 1.68 | %+ | | | 1.60 | %+ | |
| Ratio of Net Investment Income to Average Net Assets | | | 0.61 | %+†† | | | 0.15 | %+†† | | | 0.32 | %+ | | | 0.52 | %+ | | | 0.02 | %+ | |
| Ratio of Rebate from Morgan Stanley Affiliates to Average Net Assets | | | 0.01 | %†† | | | 0.01 | %†† | | | 0.01 | % | | | 0.00 | %§ | | | 0.00 | %§ | |
| Portfolio Turnover Rate | | | 60 | % | | | 59 | % | | | 64 | % | | | 96 | % | | | 101 | % | |
† Per share amount is based on average shares outstanding.
‡ Amount is less than $0.005 per share.
++ Calculated based on the net asset value as of the last business day of the period.
+ The Ratios of Expenses and Net Investment Income reflect the rebate of certain Portfolio expenses in connection with the investments in Morgan Stanley affiliates during the period. The effect of the rebate on the ratios is disclosed in the above table as "Ratio of Rebate from Morgan Stanley Affiliates to Average Net Assets."
†† Reflects overall Portfolio ratios for investment income and non-class specific expenses.
§ Amount is less than 0.005%.
66
Morgan Stanley Institutional Fund, Inc. Prospectus
Financial Highlights
Global Franchise Portfolio
| | | Class I | |
| | | Year Ended December 31, | |
| Selected Per Share Data and Ratios | | 2011 | | 2010 | | 2009 | | 2008 | | 2007 | |
| Net Asset Value, Beginning of Period | | $ | 15.29 | | | $ | 13.81 | | | $ | 10.82 | | | $ | 16.62 | | | $ | 17.98 | | |
| Income (Loss) from Investment Operations: | |
| Net Investment Income† | | | 0.31 | | | | 0.32 | | | | 0.19 | | | | 0.35 | | | | 0.40 | | |
| Net Realized and Unrealized Gain (Loss) | | | 1.11 | | | | 1.62 | | | | 2.98 | | | | (5.11 | ) | | | 1.30 | | |
| Total from Investment Operations | | | 1.42 | | | | 1.94 | | | | 3.17 | | | | (4.76 | ) | | | 1.70 | | |
| Distributions from and/or in Excess of: | |
| Net Investment Income | | | (0.30 | ) | | | (0.46 | ) | | | (0.18 | ) | | | (0.84 | ) | | | (0.15 | ) | |
| Net Realized Gain | | | (0.17 | ) | | | — | | | | — | | | | (0.20 | ) | | | (2.91 | ) | |
| Total Distributions | | | (0.47 | ) | | | (0.46 | ) | | | (0.18 | ) | | | (1.04 | ) | | | (3.06 | ) | |
| Net Asset Value, End of Period | | $ | 16.24 | | | $ | 15.29 | | | $ | 13.81 | | | $ | 10.82 | | | $ | 16.62 | | |
| Total Return++ | | | 9.38 | % | | | 14.07 | % | | | 29.65 | % | | | (28.88 | )% | | | 9.58 | % | |
| Ratios and Supplemental Data: | |
| Net Assets, End of Period (Thousands) | | $ | 211,677 | | | $ | 89,666 | | | $ | 111,852 | | | $ | 78,029 | | | $ | 110,135 | | |
| Ratio of Expenses to Average Net Assets (1) | | | 1.00 | %+†† | | | 1.00 | %+†† | | | 1.00 | %+ | | | 1.00 | %+ | | | 0.99 | %+ | |
| Ratio of Expenses to Average Net Assets Excluding Non Operating Expenses | | | N/A | | | | 1.00 | %+†† | | | 1.00 | %+ | | | 1.00 | %+ | | | 0.98 | %+ | |
| Ratio of Net Investment Income to Average Net Assets (1) | | | 1.87 | %+†† | | | 2.19 | %+†† | | | 1.62 | %+ | | | 2.49 | %+ | | | 2.10 | %+ | |
| Ratio of Rebate from Morgan Stanley Affiliates to Average Net Assets | | | 0.00 | %††§ | | | 0.00 | %††§ | | | 0.00 | %§ | | | 0.01 | % | | | 0.00 | %§ | |
| Portfolio Turnover Rate | | | 30 | % | | | 74 | % | | | 18 | % | | | 31 | % | | | 22 | % | |
| (1) Supplemental Information on the Ratios to Average Net Assets: | |
| Ratios Before Expense Limitation: | |
| Expenses to Average Net Assets | | | 1.01 | %†† | | | 1.08 | %+†† | | | 1.01 | %+ | | | 1.01 | %+ | | | N/A | | |
| Net Investment Income to Average Net Assets | | | 1.86 | %†† | | | 2.11 | %+†† | | | 1.61 | %+ | | | 2.48 | %+ | | | N/A | | |
† Per share amount is based on average shares outstanding.
++ Calculated based on the net asset value as of the last business day of the period.
+ The Ratios of Expenses and Net Investment Income reflect the rebate of certain Portfolio expenses in connection with the investments in Morgan Stanley affiliates during the period. The effect of the rebate on the ratios is disclosed in the above table as "Ratio of Rebate from Morgan Stanley Affiliates to Average Net Assets."
†† Reflects overall Portfolio ratios for investment income and non-class specific expenses.
§ Amount is less than 0.005%.
67
Global Franchise Portfolio
| | | Class P | |
| | | Year Ended December 31, | |
| Selected Per Share Data and Ratios | | 2011 | | 2010 | | 2009 | | 2008 | | 2007 | |
| Net Asset Value, Beginning of Period | | $ | 15.10 | | | $ | 13.65 | | | $ | 10.71 | | | $ | 16.44 | | | $ | 17.82 | | |
| Income (Loss) from Investment Operations: | |
| Net Investment Income† | | | 0.26 | | | | 0.28 | | | | 0.11 | | | | 0.34 | | | | 0.30 | | |
| Net Realized and Unrealized Gain (Loss) | | | 1.09 | | | | 1.59 | | | | 2.99 | | | | (5.07 | ) | | | 1.34 | | |
| Total from Investment Operations | | | 1.35 | | | | 1.87 | | | | 3.10 | | | | (4.73 | ) | | | 1.64 | | |
| Distributions from and/or in Excess of: | |
| Net Investment Income | | | (0.27 | ) | | | (0.42 | ) | | | (0.16 | ) | | | (0.80 | ) | | | (0.11 | ) | |
| Net Realized Gain | | | (0.17 | ) | | | — | | | | — | | | | (0.20 | ) | | | (2.91 | ) | |
| Total Distributions | | | (0.44 | ) | | | (0.42 | ) | | | (0.16 | ) | | | (1.00 | ) | | | (3.02 | ) | |
| Net Asset Value, End of Period | | $ | 16.01 | | | $ | 15.10 | | | $ | 13.65 | | | $ | 10.71 | | | $ | 16.44 | | |
| Total Return++ | | | 8.98 | % | | | 13.83 | % | | | 29.24 | % | | | (29.00 | )% | | | 9.26 | % | |
| Ratios and Supplemental Data: | |
| Net Assets, End of Period (Thousands) | | $ | 15,327 | | | $ | 9,653 | | | $ | 9,332 | | | $ | 2,892 | | | $ | 6,327 | | |
| Ratio of Expenses to Average Net Assets (1) | | | 1.25 | %+†† | | | 1.25 | %+†† | | | 1.25 | %+ | | | 1.25 | %+ | | | 1.24 | %+ | |
| Ratio of Expenses to Average Net Assets Excluding Non Operating Expenses | | | N/A | | | | 1.25 | %+†† | | | 1.25 | %+ | | | 1.25 | %+ | | | 1.23 | %+ | |
| Ratio of Net Investment Income to Average Net Assets (1) | | | 1.62 | %+†† | | | 1.94 | %+†† | | | 0.92 | %+ | | | 2.43 | %+ | | | 1.62 | %+ | |
| Ratio of Rebate from Morgan Stanley Affiliates to Average Net Assets | | | 0.00 | %††§ | | | 0.00 | %††§ | | | 0.00 | %§ | | | 0.01 | % | | | 0.00 | %§ | |
| Portfolio Turnover Rate | | | 30 | % | | | 74 | % | | | 18 | % | | | 31 | % | | | 22 | % | |
| (1) Supplemental Information on the Ratios to Average Net Assets: | |
| Ratios Before Expense Limitation: | |
| Expenses to Average Net Assets | | | 1.26 | %†† | | | 1.33 | %+†† | | | 1.26 | %+ | | | 1.26 | %+ | | | N/A | | |
| Net Investment Income to Average Net Assets | | | 1.61 | %†† | | | 1.86 | %+†† | | | 0.91 | %+ | | | 2.42 | %+ | | | N/A | | |
† Per share amount is based on average shares outstanding.
++ Calculated based on the net asset value as of the last business day of the period.
+ The Ratios of Expenses and Net Investment Income reflect the rebate of certain Portfolio expenses in connection with the investments in Morgan Stanley affiliates during the period. The effect of the rebate on the ratios is disclosed in the above table as "Ratio of Rebate from Morgan Stanley Affiliates to Average Net Assets."
†† Reflects overall Portfolio ratios for investment income and non-class specific expenses.
§ Amount is less than 0.005%.
68
Morgan Stanley Institutional Fund, Inc. Prospectus
Financial Highlights
International Equity Portfolio
| | | Class I | |
| | | Year Ended December 31, | |
| Selected Per Share Data and Ratios | | 2011 | | 2010 | | 2009 | | 2008 | | 2007 | |
| Net Asset Value, Beginning of Period | | $ | 13.61 | | | $ | 13.02 | | | $ | 11.01 | | | $ | 18.92 | | | $ | 20.58 | | |
| Income (Loss) from Investment Operations: | |
| Net Investment Income† | | | 0.32 | | | | 0.26 | | | | 0.27 | | | | 0.44 | | | | 0.43 | | |
| Net Realized and Unrealized Gain (Loss) | | | (1.37 | ) | | | 0.53 | | | | 2.10 | | | | (6.76 | ) | | | 1.53 | | |
| Total from Investment Operations | | | (1.05 | ) | | | 0.79 | | | | 2.37 | | | | (6.32 | ) | | | 1.96 | | |
| Distributions from and/or in Excess of: | |
| Net Investment Income | | | (0.31 | ) | | | (0.20 | ) | | | (0.36 | ) | | | (0.41 | ) | | | (0.46 | ) | |
| Net Realized Gain | | | — | | | | — | | | | — | | | | (1.18 | ) | | | (3.16 | ) | |
| Total Distributions | | | (0.31 | ) | | | (0.20 | ) | | | (0.36 | ) | | | (1.59 | ) | | | (3.62 | ) | |
| Redemption Fees | | | 0.00 | ‡ | | | 0.00 | ‡ | | | 0.00 | ‡ | | | 0.00 | ‡ | | | 0.00 | ‡ | |
| Net Asset Value, End of Period | | $ | 12.25 | | | $ | 13.61 | | | $ | 13.02 | | | $ | 11.01 | | | $ | 18.92 | | |
| Total Return++ | | | (7.63 | )% | | | 6.08 | % | | | 21.56 | % | | | (33.12 | )% | | | 9.84 | % | |
| Ratios and Supplemental Data: | |
| Net Assets, End of Period (Thousands) | | $ | 2,959,403 | | | $ | 3,372,029 | | | $ | 3,148,980 | | | $ | 2,606,704 | | | $ | 5,105,807 | | |
| Ratio of Expenses to Average Net Assets (1) | | | 0.95 | %+†† | | | 0.95 | %+†† | | | 0.94 | %+ | | | 0.95 | %+ | | | 0.93 | %+ | |
| Ratio of Expenses to Average Net Assets Excluding Non Operating Expenses | | | 0.95 | %+†† | | | 0.95 | %+†† | | | 0.94 | %+ | | | 0.95 | %+ | | | 0.93 | %+ | |
| Ratio of Net Investment Income to Average Net Assets (1) | | | 2.36 | %+†† | | | 2.05 | %+†† | | | 2.35 | %+ | | | 2.73 | %+ | | | 1.97 | %+ | |
| Ratio of Rebate from Morgan Stanley Affiliates to Average Net Assets | | | 0.00 | %††§ | | | 0.00 | %††§ | | | 0.01 | % | | | 0.00 | %§ | | | 0.00 | %§ | |
| Portfolio Turnover Rate | | | 34 | % | | | 40 | % | | | 38 | % | | | 34 | % | | | 31 | % | |
| (1) Supplemental Information on the Ratios to Average Net Assets: | |
| Ratios Before Expense Limitation: | |
| Expenses to Average Net Assets | | | 0.98 | %†† | | | 0.98 | %+†† | | | 0.95 | %+ | | | N/A | | | | N/A | | |
| Net Investment Income to Average Net Assets | | | 2.33 | %†† | | | 2.02 | %+†† | | | 2.34 | %+ | | | N/A | | | | N/A | | |
† Per share amount is based on average shares outstanding.
‡ Amount is less than $0.005 per share.
++ Calculated based on the net asset value as of the last business day of the period.
+ The Ratios of Expenses and Net Investment Income reflect the rebate of certain Portfolio expenses in connection with the investments in Morgan Stanley affiliates during the period. The effect of the rebate on the ratios is disclosed in the above table as "Ratio of Rebate from Morgan Stanley Affiliates to Average Net Assets."
†† Reflects overall Portfolio ratios for investment income and non-class specific expenses.
§ Amount is less than 0.005%.
69
International Equity Portfolio
| | | Class P | |
| | | Year Ended December 31, | |
| Selected Per Share Data and Ratios | | 2011 | | 2010 | | 2009 | | 2008 | | 2007 | |
| Net Asset Value, Beginning of Period | | $ | 13.45 | | | $ | 12.87 | | | $ | 10.90 | | | $ | 18.73 | | | $ | 20.40 | | |
| Income (Loss) from Investment Operations: | |
| Net Investment Income† | | | 0.28 | | | | 0.23 | | | | 0.23 | | | | 0.38 | | | | 0.37 | | |
| Net Realized and Unrealized Gain (Loss) | | | (1.34 | ) | | | 0.51 | | | | 2.07 | | | | (6.66 | ) | | | 1.52 | | |
| Total from Investment Operations | | | (1.06 | ) | | | 0.74 | | | | 2.30 | | | | (6.28 | ) | | | 1.89 | | |
| Distributions from and/or in Excess of: | |
| Net Investment Income | | | (0.28 | ) | | | (0.16 | ) | | | (0.33 | ) | | | (0.37 | ) | | | (0.40 | ) | |
| Net Realized Gain | | | — | | | | — | | | | — | | | | (1.18 | ) | | | (3.16 | ) | |
| Total Distributions | | | (0.28 | ) | | | (0.16 | ) | | | (0.33 | ) | | | (1.55 | ) | | | (3.56 | ) | |
| Redemption Fees | | | 0.00 | ‡ | | | 0.00 | ‡ | | | 0.00 | ‡ | | | 0.00 | ‡ | | | 0.00 | ‡ | |
| Net Asset Value, End of Period | | $ | 12.11 | | | $ | 13.45 | | | $ | 12.87 | | | $ | 10.90 | | | $ | 18.73 | | |
| Total Return++ | | | (7.83 | )% | | | 5.78 | % | | | 21.18 | % | | | (33.21 | )% | | | 9.52 | % | |
| Ratios and Supplemental Data: | |
| Net Assets, End of Period (Thousands) | | $ | 916,002 | | | $ | 928,966 | | | $ | 1,131,919 | | | $ | 687,196 | | | $ | 1,019,595 | | |
| Ratio of Expenses to Average Net Assets (1) | | | 1.20 | %+†† | | | 1.20 | %+†† | | | 1.19 | %+ | | | 1.20 | %+ | | | 1.18 | %+ | |
| Ratio of Expenses to Average Net Assets Excluding Non Operating Expenses | | | 1.20 | %+†† | | | 1.20 | %+†† | | | 1.19 | %+ | | | 1.20 | %+ | | | 1.18 | %+ | |
| Ratio of Net Investment Income to Average Net Assets (1) | | | 2.11 | %+†† | | | 1.80 | %+†† | | | 2.02 | %+ | | | 2.43 | %+ | | | 1.71 | %+ | |
| Ratio of Rebate from Morgan Stanley Affiliates to Average Net Assets | | | 0.00 | %††§ | | | 0.00 | %††§ | | | 0.01 | % | | | 0.00 | %§ | | | 0.00 | %§ | |
| Portfolio Turnover Rate | | | 34 | % | | | 40 | % | | | 38 | % | | | 34 | % | | | 31 | % | |
| (1) Supplemental Information on the Ratios to Average Net Assets: | |
| Ratios Before Expense Limitation: | |
| Expenses to Average Net Assets | | | 1.23 | %†† | | | 1.23 | %+†† | | | 1.20 | %+ | | | N/A | | | | N/A | | |
| Net Investment Income to Average Net Assets | | | 2.08 | %†† | | | 1.77 | %+†† | | | 2.01 | %+ | | | N/A | | | | N/A | | |
† Per share amount is based on average shares outstanding.
‡ Amount is less than $0.005 per share.
++ Calculated based on the net asset value as of the last business day of the period.
+ The Ratios of Expenses and Net Investment Income reflect the rebate of certain Portfolio expenses in connection with the investments in Morgan Stanley affiliates during the period. The effect of the rebate on the ratios is disclosed in the above table as "Ratio of Rebate from Morgan Stanley Affiliates to Average Net Assets."
†† Reflects overall Portfolio ratios for investment income and non-class specific expenses.
§ Amount is less than 0.005%.
70
Morgan Stanley Institutional Fund, Inc. Prospectus
Financial Highlights
International Small Cap Portfolio
| | | Class I | |
| | | Year Ended December 31, | |
| Selected Per Share Data and Ratios | | 2011 | | 2010 | | 2009 | | 2008 | | 2007 | |
| Net Asset Value, Beginning of Period | | $ | 13.80 | | | $ | 11.97 | | | $ | 9.53 | | | $ | 17.08 | | | $ | 23.72 | | |
| Income (Loss) from Investment Operations: | |
| Net Investment Income† | | | 0.18 | | | | 0.11 | | | | 0.14 | | | | 0.34 | | | | 0.27 | | |
| Net Realized and Unrealized Gain (Loss) | | | (2.71 | ) | | | 1.76 | | | | 2.47 | | | | (6.66 | ) | | | (1.11 | ) | |
| Total from Investment Operations | | | (2.53 | ) | | | 1.87 | | | | 2.61 | | | | (6.32 | ) | | | (0.84 | ) | |
| Distributions from and/or in Excess of: | |
| Net Investment Income | | | — | | | | (0.04 | ) | | | (0.17 | ) | | | (0.41 | ) | | | (0.27 | ) | |
| Net Realized Gain | | | — | | | | — | | | | — | | | | (0.82 | ) | | | (5.53 | ) | |
| Total Distributions | | | — | | | | (0.04 | ) | | | (0.17 | ) | | | (1.23 | ) | | | (5.80 | ) | |
| Redemption Fees | | | 0.00 | ‡ | | | 0.00 | ‡ | | | 0.00 | ‡ | | | 0.00 | ‡ | | | 0.00 | ‡ | |
| Net Asset Value, End of Period | | $ | 11.27 | | | $ | 13.80 | | | $ | 11.97 | | | $ | 9.53 | | | $ | 17.08 | | |
| Total Return++ | | | (18.33 | )% | | | 15.72 | % | | | 27.45 | % | | | (38.33 | )% | | | (3.22 | )% | |
| Ratios and Supplemental Data: | |
| Net Assets, End of Period (Thousands) | | $ | 213,983 | | | $ | 320,362 | | | $ | 349,589 | | | $ | 316,526 | | | $ | 796,050 | | |
| Ratio of Expenses to Average Net Assets (1) | | | 1.15 | %+†† | | | 1.15 | %+†† | | | 1.14 | %+ | | | 1.13 | %+ | | | 1.09 | %+ | |
| Ratio of Expenses to Average Net Assets Excluding Non Operating Expenses | | | N/A | | | | 1.15 | %+†† | | | 1.14 | %+ | | | 1.12 | %+ | | | 1.09 | %+ | |
| Ratio of Net Investment Income to Average Net Assets (1) | | | 1.33 | %+†† | | | 0.87 | %+†† | | | 1.31 | %+ | | | 2.47 | %+ | | | 1.10 | %+ | |
| Ratio of Rebate from Morgan Stanley Affiliates to Average Net Assets | | | 0.00 | %††§ | | | 0.00 | %††§ | | | 0.00 | %§ | | | 0.00 | %§ | | | 0.00 | %§ | |
| Portfolio Turnover Rate | | | 64 | % | | | 66 | % | | | 127 | % | | | 49 | % | | | 53 | % | |
| (1) Supplemental Information on the Ratios to Average Net Assets: | |
| Ratios Before Expense Limitation: | |
| Expenses to Average Net Assets | | | 1.19 | %†† | | | 1.18 | %+†† | | | N/A | | | | 1.15 | %+ | | | N/A | | |
| Net Investment Income to Average Net Assets | | | 1.29 | %†† | | | 0.84 | %+†† | | | N/A | | | | 2.44 | %+ | | | N/A | | |
† Per share amount is based on average shares outstanding.
‡ Amount is less than $0.005 per share.
++ Calculated based on the net asset value as of the last business day of the period.
+ The Ratios of Expenses and Net Investment Income reflect the rebate of certain Portfolio expenses in connection with the investments in Morgan Stanley affiliates during the period. The effect of the rebate on the ratios is disclosed in the above table as "Ratio of Rebate from Morgan Stanley Affiliates to Average Net Assets."
†† Reflects overall Portfolio ratios for investment income and non-class specific expenses.
§ Amount is less than 0.005%.
71
International Small Cap Portfolio
| | | Class P | |
| | | Year Ended December 31, | | Period from
October 21,
2008^ to
December 31, | |
| Selected Per Share Data and Ratios | | 2011 | | 2010 | | 2009 | | 2008 | |
| Net Asset Value, Beginning of Period | | $ | 13.74 | | | $ | 11.95 | | | $ | 9.53 | | | $ | 9.80 | | |
| Income (Loss) from Investment Operations: | |
| Net Investment Income† | | | 0.14 | | | | 0.07 | | | | 0.01 | | | | 0.00 | ‡ | |
| Net Realized and Unrealized Gain (Loss) | | | (2.69 | ) | | | 1.76 | | | | 2.57 | | | | 0.14 | | |
| Total from Investment Operations | | | (2.55 | ) | | | 1.83 | | | | 2.58 | | | | 0.14 | | |
| Distributions from and/or in Excess of: | |
| Net Investment Income | | | — | | | | (0.04 | ) | | | (0.16 | ) | | | (0.41 | ) | |
| Redemption Fees | | | 0.00 | ‡ | | | 0.00 | ‡ | | | 0.00 | ‡ | | | — | | |
| Net Asset Value, End of Period | | $ | 11.19 | | | $ | 13.74 | | | $ | 11.95 | | | $ | 9.53 | | |
| Total Return++ | | | (18.56 | )% | | | 15.41 | % | | | 27.14 | % | | | 1.56 | %# | |
| Ratios and Supplemental Data: | |
| Net Assets, End of Period (Thousands) | | $ | 82,170 | | | $ | 101,074 | | | $ | 63,326 | | | $ | 119 | | |
| Ratio of Expenses to Average Net Assets (1) | | | 1.40 | %+††** | | | 1.40 | %+††** | | | 1.37 | %+** | | | 1.39 | %+* | |
| Ratio of Expenses to Average Net Assets Excluding Non Operating Expenses | | | N/A | | | | 1.40 | %+††** | | | 1.37 | %+** | | | 1.39 | %+* | |
| Ratio of Net Investment Income to Average Net Assets (1) | | | 1.08 | %+†† | | | 0.62 | %+†† | | | 0.12 | %+ | | | 0.09 | %+* | |
| Ratio of Rebate from Morgan Stanley Affiliates to Average Net Assets | | | 0.00 | %††§ | | | 0.00 | %††§ | | | 0.00 | %§ | | | 0.00 | %§* | |
| Portfolio Turnover Rate | | | 64 | % | | | 66 | % | | | 127 | % | | | 49 | %# | |
| (1) Supplemental Information on the Ratios to Average Net Assets: | |
| Ratios Before Expense Limitation: | |
| Expenses to Average Net Assets | | | 1.44 | %†† | | | 1.43 | %+†† | | | N/A | | | | 1.86 | %+* | |
| Net Investment Income (Loss) to Average Net Assets | | | 1.04 | %†† | | | 0.59 | %+†† | | | N/A | | | | (0.38 | )%+* | |
^ Commencement of Operations.
† Per share amount is based on average shares outstanding.
‡ Amount is less than $0.005 per share.
++ Calculated based on the net asset value as of the last business day of the period.
+ The Ratios of Expenses and Net Investment Income reflect the rebate of certain Portfolio expenses in connection with the investments in Morgan Stanley affiliates during the period. The effect of the rebate on the ratios is disclosed in the above table as "Ratio of Rebate from Morgan Stanley Affiliates to Average Net Assets."
†† Reflects overall Portfolio ratios for investment income and non-class specific expenses.
** Ratios of Expenses to Average Net Assets for Class P may vary by more than the shareholder servicing fees due to fluctuations in daily net asset amounts.
§ Amount is less than 0.005%.
# Not Annualized.
* Annualized.
72
Morgan Stanley Institutional Fund, Inc. Prospectus
Financial Highlights
Select Global Infrastructure Portfolio
| | | Class I | |
| Selected Per Share Data and Ratios | | Year Ended
December 31,
2011 | | Period from
September 20,
2010^ to
December 31,
2010 | |
| Net Asset Value, Beginning of Period | | $ | 10.40 | | | $ | 10.00 | | |
| Income from Investment Operations: | |
| Net Investment Income† | | | 0.23 | | | | 0.08 | | |
| Net Realized and Unrealized Gain | | | 1.42 | | | | 0.40 | | |
| Total from Investment Operations | | | 1.65 | | | | 0.48 | | |
| Distributions from and/or in Excess of: | |
| Net Investment Income | | | (0.22 | ) | | | (0.08 | ) | |
| Net Realized Gain | | | (0.33 | ) | | | — | | |
| Total Distributions | | | (0.55 | ) | | | (0.08 | ) | |
| Net Asset Value, End of Period | | $ | 11.50 | | | $ | 10.40 | | |
| Total Return++ | | | 15.95 | % | | | 4.94 | %# | |
| Ratios and Supplemental Data:†† | |
| Net Assets, End of Period (Thousands) | | $ | 12,589 | | | $ | 10,086 | | |
| Ratio of Expenses to Average Net Assets (1) | | | 1.15 | %+ | | | 1.14 | %+* | |
| Ratio of Net Investment Income to Average Net Assets (1) | | | 2.09 | %+ | | | 2.71 | %+* | |
| Ratio of Rebate from Morgan Stanley Affiliates to Average Net Assets | | | 0.00 | %§ | | | 0.01 | %* | |
| Portfolio Turnover Rate | | | 51 | % | | | 6 | %# | |
| (1) Supplemental Information on the Ratios to Average Net Assets:†† | |
| Ratios Before Expense Limitation: | |
| Expenses to Average Net Assets | | | 2.93 | % | | | 3.61 | %+* | |
| Net Investment Income to Average Net Assets | | | 0.31 | % | | | 0.24 | %+* | |
^ Commencement of Operations.
† Per share amount is based on average shares outstanding.
++ Calculated based on the net asset value as of the last business day of the period.
†† Reflects overall Portfolio ratios for investment income and non-class specific expenses.
+ The Ratios of Expenses and Net Investment Income reflect the rebate of certain Portfolio expenses in connection with the investments in Morgan Stanley affiliates during the period. The effect of the rebate on the ratios is disclosed in the above table as "Ratio of Rebate from Morgan Stanley Affiliates to Average Net Assets."
§ Amount is less than 0.005%.
# Not Annualized.
* Annualized.
73
Select Global Infrastructure Portfolio
| | | Class P | |
| Selected Per Share Data and Ratios | | Year Ended
December 31,
2011 | | Period from
September 20,
2010^ to
December 31,
2010 | |
| Net Asset Value, Beginning of Period | | $ | 10.40 | | | $ | 10.00 | | |
| Income from Investment Operations: | |
| Net Investment Income† | | | 0.21 | | | | 0.07 | | |
| Net Realized and Unrealized Gain | | | 1.41 | | | | 0.41 | | |
| Total from Investment Operations | | | 1.62 | | | | 0.48 | | |
| Distributions from and/or in Excess of: | |
| Net Investment Income | | | (0.19 | ) | | | (0.08 | ) | |
| Net Realized Gain | | | (0.33 | ) | | | — | | |
| Total Distributions | | | (0.52 | ) | | | (0.08 | ) | |
| Net Asset Value, End of Period | | $ | 11.50 | | | $ | 10.40 | | |
| Total Return++ | | | 15.67 | % | | | 4.86 | %# | |
| Ratios and Supplemental Data:†† | |
| Net Assets, End of Period (Thousands) | | $ | 115 | | | $ | 104 | | |
| Ratio of Expenses to Average Net Assets (1) | | | 1.40 | %+ | | | 1.39 | %+* | |
| Ratio of Net Investment Income to Average Net Assets (1) | | | 1.84 | %+ | | | 2.46 | %+* | |
| Ratio of Rebate from Morgan Stanley Affiliates to Average Net Assets | | | 0.00 | %§ | | | 0.01 | %* | |
| Portfolio Turnover Rate | | | 51 | % | | | 6 | %# | |
| (1) Supplemental Information on the Ratios to Average Net Assets:†† | |
| Ratios Before Expense Limitation: | |
| Expenses to Average Net Assets | | | 3.18 | % | | | 3.86 | %+* | |
| Net Investment Income (Loss) to Average Net Assets | | | 0.06 | % | | | (0.01 | )%+* | |
^ Commencement of Operations.
† Per share amount is based on average shares outstanding.
++ Calculated based on the net asset value as of the last business day of the period.
†† Reflects overall Portfolio ratios for investment income and non-class specific expenses.
+ The Ratios of Expenses and Net Investment Income reflect the rebate of certain Portfolio expenses in connection with the investments in Morgan Stanley affiliates during the period. The effect of the rebate on the ratios is disclosed in the above table as "Ratio of Rebate from Morgan Stanley Affiliates to Average Net Assets."
§ Amount is less than 0.005%.
# Not Annualized.
* Annualized.
74
Morgan Stanley Institutional Fund, Inc. Prospectus
Financial Highlights
Select Global Infrastructure Portfolio
| | | Class H | |
| Selected Per Share Data and Ratios | | Year Ended
December 31,
2011 | | Period from
September 20,
2010^ to
December 31,
2010 | |
| Net Asset Value, Beginning of Period | | $ | 10.40 | | | $ | 10.00 | | |
| Income from Investment Operations: | |
| Net Investment Income† | | | 0.21 | | | | 0.07 | | |
| Net Realized and Unrealized Gain | | | 1.41 | | | | 0.41 | | |
| Total from Investment Operations | | | 1.62 | | | | 0.48 | | |
| Distributions from and/or in Excess of: | |
| Net Investment Income | | | (0.19 | ) | | | (0.08 | ) | |
| Net Realized Gain | | | (0.33 | ) | | | — | | |
| Total Distributions | | | (0.52 | ) | | | (0.08 | ) | |
| Net Asset Value, End of Period | | $ | 11.50 | | | $ | 10.40 | | |
| Total Return++ | | | 15.67 | % | | | 4.86 | %# | |
| Ratios and Supplemental Data:†† | |
| Net Assets, End of Period (Thousands) | | $ | 115 | | | $ | 104 | | |
| Ratio of Expenses to Average Net Assets (1) | | | 1.40 | %+ | | | 1.39 | %+* | |
| Ratio of Net Investment Income to Average Net Assets (1) | | | 1.84 | %+ | | | 2.46 | %+* | |
| Rebate from Morgan Stanley Affiliates to Average Net Assets | | | 0.00 | %§ | | | 0.01 | %* | |
| Portfolio Turnover Rate | | | 51 | % | | | 6 | %# | |
| (1) Supplemental Information on the Ratios to Average Net Assets:†† | |
| Ratios Before Expense Limitation: | |
| Expense to Average Net Assets | | | 3.18 | % | | | 3.86 | %+* | |
| Net Investment Income (Loss) to Average Net Assets | | | 0.06 | % | | | (0.01 | )%+* | |
^ Commencement of Operations.
† Per share amount is based on average shares outstanding.
++ Calculated based on the net asset value which does not reflect sales charges, if applicable, as of the last business day of the period.
†† Reflects overall Portfolio ratios for investment income and non-class specific expenses.
+ The Ratios of Expenses and Net Investment Income reflect the rebate of certain Portfolio expenses in connection with the investments in Morgan Stanley affiliates during the period. The effect of the rebate on the ratios is disclosed in the above table as "Ratio of Rebate from Morgan Stanley Affiliates to Average Net Assets."
§ Amount is less than 0.005%.
# Not Annualized.
* Annualized.
75
Select Global Infrastructure Portfolio
| | | Class L | |
| Selected Per Share Data and Ratios | | Year Ended
December 31,
2011 | | Period from
September 20,
2010^ to
December 31,
2010 | |
| Net Asset Value, Beginning of Period | | $ | 10.40 | | | $ | 10.00 | | |
| Income from Investment Operations: | |
| Net Investment Income† | | | 0.15 | | | | 0.06 | | |
| Net Realized and Unrealized Gain | | | 1.42 | | | | 0.40 | | |
| Total from Investment Operations | | | 1.57 | | | | 0.46 | | |
| Distributions from and/or in Excess of: | |
| Net Investment Income | | | (0.14 | ) | | | (0.06 | ) | |
| Net Realized Gain | | | (0.33 | ) | | | — | | |
| Total Distributions | | | (0.47 | ) | | | (0.06 | ) | |
| Net Asset Value, End of Period | | $ | 11.50 | | | $ | 10.40 | | |
| Total Return++ | | | 15.12 | % | | | 4.72 | %# | |
| Ratios and Supplemental Data:†† | |
| Net Assets, End of Period (Thousands) | | $ | 115 | | | $ | 104 | | |
| Ratio of Expenses to Average Net Assets (1) | | | 1.90 | %+ | | | 1.89 | %+* | |
| Ratio of Net Investment Income to Average Net Assets (1) | | | 1.34 | %+ | | | 1.96 | %+* | |
| Ratio of Rebate from Morgan Stanley Affiliates to Average Net Assets | | | 0.00 | %§ | | | 0.01 | %* | |
| Portfolio Turnover Rate | | | 51 | % | | | 6 | %# | |
| (1) Supplemental Information on the Ratios to Average Net Assets:†† | |
| Ratios Before Expense Limitation: | |
| Expenses to Average Net Assets | | | 3.68 | % | | | 4.36 | %+* | |
| Net Investment Loss to Average Net Assets | | | (0.44 | )% | | | (0.51 | )%+* | |
^ Commencement of Operations.
† Per share amount is based on average shares outstanding.
++ Calculated based on the net asset value as of the last business day of the period.
†† Reflects overall Portfolio ratios for investment income and non-class specific expenses.
+ The Ratios of Expenses and Net Investment Income reflect the rebate of certain Portfolio expenses in connection with the investments in Morgan Stanley affiliates during the period. The effect of the rebate on the ratios is disclosed in the above table as "Ratio of Rebate from Morgan Stanley Affiliates to Average Net Assets."
§ Amount is less than 0.005%.
# Not Annualized.
* Annualized.
76
The page has been left blank intentionally
Morgan Stanley Institutional Fund, Inc. Prospectus
Additional Information
Where to Find
Additional Information
In addition to this Prospectus, the Fund has a Statement of Additional Information, dated April 30, 2012, which contains additional, more detailed information about the Fund and the Portfolios. The Statement of Additional Information is incorporated by reference into this Prospectus and, therefore, legally forms a part of this Prospectus.
Shareholder Reports
The Fund publishes Annual and Semiannual Reports to Shareholders, ("Shareholder Reports") that contain additional information about each Portfolio's investments. In the Fund's Annual Report to Shareholders, you will find a discussion of the market conditions and the investment strategies that significantly affected each Portfolio's performance during the last fiscal year. For additional Fund information, including information regarding the investments comprising each of the Portfolios, please call the toll-free number below.
You may obtain the Statement of Additional Information and Shareholder Reports without charge by contacting the Fund at the toll-free number below or on our internet site at: www.morganstanley.com/im. If you purchased shares through a Financial Intermediary, you may also obtain these documents, without charge, by contacting your Financial Intermediary.
Information about the Fund, including the Statement of Additional Information and Shareholder Reports, may be obtained from the SEC in any of the following ways: (1) in person: you may review and copy documents in the SEC's Public Reference Room in Washington D.C. (for information call 1-202-551-8090); (2) on-line: you may retrieve information from the SEC's web site at http://www.sec.gov; (3) by mail: you may request documents, upon payment of a duplicating fee, by writing to the Securities and Exchange Commission, Public Reference Section, Washington, D.C. 20549-1520; or (4) by e-mail: you may request documents, upon payment of a duplicating fee, by e-mailing the SEC at the following address: publicinfo@sec.gov.
Morgan Stanley Institutional Fund, Inc.
c/o Morgan Stanley Services Company Inc.
P.O. Box 219804
Kansas City, MO 64121-9804
For Shareholder Inquiries,
call 1-800-548-7786.
Prices and Investment Results are available at www.morganstanley.com/im.
The Fund's Investment Company Act registration number is 811-05624.
MSIGLINPRO-0412
INVESTMENT MANAGEMENT

Morgan Stanley
Institutional Fund, Inc.

Global and International
Equity Portfolios
Active International Allocation
Portfolio
Asian Equity Portfolio
Emerging Markets Portfolio
Global Advantage Portfolio
Global Discovery Portfolio
Global Franchise Portfolio
Global Insight Portfolio
Global Opportunity Portfolio
Global Real Estate Portfolio
International Advantage Portfolio
International Equity Portfolio
International Opportunity Portfolio
International Real Estate Portfolio
International Small Cap Portfolio
Select Global Infrastructure Portfolio
U.S. Equity Portfolios
Advantage Portfolio
Focus Growth Portfolio
Growth Portfolio
(formerly Capital Growth Portfolio)
Insight Portfolio
Opportunity Portfolio
Small Company Growth Portfolio
U.S. Real Estate Portfolio
Fixed Income Portfolio
Emerging Markets Debt Portfolio
Annual
Report
December 31, 2011
2011 Annual Report
December 31, 2011
Table of Contents
| Shareholders' Letter | | | 2 | | |
|
| Investment Advisory Agreement Approval | | | 3 | | |
|
| Performance Summary | | | 6 | | |
|
| Expense Examples | | | 8 | | |
|
| Investment Overview and Portfolios of Investments | |
|
| Global and International Equity Portfolios: | |
|
| Active International Allocation Portfolio | | | 11 | | |
|
| Asian Equity Portfolio | | | 25 | | |
|
| Emerging Markets Portfolio | | | 30 | | |
|
| Global Advantage Portfolio | | | 37 | | |
|
| Global Discovery Portfolio | | | 41 | | |
|
| Global Franchise Portfolio | | | 45 | | |
|
| Global Insight Portfolio | | | 48 | | |
|
| Global Opportunity Portfolio | | | 52 | | |
|
| Global Real Estate Portfolio | | | 56 | | |
|
| International Advantage Portfolio | | | 62 | | |
|
| International Equity Portfolio | | | 66 | | |
|
| International Opportunity Portfolio | | | 70 | | |
|
| International Real Estate Portfolio | | | 74 | | |
|
| International Small Cap Portfolio | | | 79 | | |
|
| Select Global Infrastructure Portfolio | | | 85 | | |
|
| U.S. Equity Portfolios: | |
|
| Advantage Portfolio | | | 90 | | |
|
| Focus Growth Portfolio | | | 94 | | |
|
| Growth Portfolio (formerly Capital Growth Portfolio) | | | 98 | | |
|
| Insight Portfolio | | | 102 | | |
|
| Opportunity Portfolio | | | 106 | | |
|
| Small Company Growth Portfolio | | | 111 | | |
|
| U.S. Real Estate Portfolio | | | 116 | | |
|
| Fixed Income Portfolio: | |
|
| Emerging Markets Debt Portfolio | | | 120 | | |
|
| Statements of Assets and Liabilities | | | 126 | | |
|
| Statements of Operations | | | 138 | | |
|
| Statements of Changes in Net Assets | | | 143 | | |
|
| Financial Highlights | | | 167 | | |
|
| Notes to Financial Statements | �� | | 241 | | |
|
Report of Independent Registered
Public Accounting Firm | | | 256 | | |
|
| Federal Income Tax Information | | | 257 | | |
|
| U.S. Privacy Policy | | | 259 | | |
|
| Director and Officer Information | | | 262 | | |
|
This report is authorized for distribution only when preceded or accompanied by prospectuses of the Morgan Stanley Institutional Fund, Inc. To receive a prospectus and/or SAI, which contains more complete information such as investment objectives, charges, expenses, policies for voting proxies, risk considerations, and describes in detail each of the Portfolio's investment policies to the prospective investor, please call toll free 1-(800) 548-7786. Please read the prospectuses carefully before you invest or send money.
Additionally, you can access portfolio information including performance, characteristics, and investment team commentary through Morgan Stanley Investment Management's website: www.morganstanley.com/im.
Market forecasts provided in this report may not necessarily come to pass. There is no guarantee that any sectors mentioned will continue to perform as discussed herein or that securities in such sectors will be held by the Portfolio in the future. There is no assurance that a Portfolio will achieve its investment objective. Portfolios are subject to market risk, which is the possibility that market values of securities owned by the Portfolio will decline and, therefore, the value of the Portfolio's shares may be less than what you paid for them. Accordingly, you can lose money investing in Portfolios. Please see the prospectus for more complete information on investment risks.
1
2011 Annual Report
December 31, 2011
Shareholders' Letter (unaudited)
Dear Shareholders:
We are pleased to present to you the Fund's Annual Report for the year ended December 31, 2011. Our Fund currently offers 23 portfolios providing investors with a full array of global and domestic equity and fixed-income products. The Fund's portfolios, together with the portfolios of the Morgan Stanley Institutional Fund Trust, provide investors with a means to help them meet specific investment needs and to allocate their investments among equities and fixed income.
Sincerely,

Arthur Lev
President and Principal Executive Officer
January 2012
2
2011 Annual Report
December 31, 2011
Investment Advisory Agreement Approval (unaudited)
Global Insight and Insight Portfolios ("Portfolios")
At the organizational meeting of the Portfolios, the Board of Directors, including the independent Directors, considered the following factors in approving the Investment Advisory Agreement with respect to the Portfolios:
Nature, Extent and Quality of Services
The Board reviewed and considered the nature and extent of the investment advisory services to be provided by the Adviser (as defined herein) under the advisory agreement, including portfolio management, investment research and equity and fixed income securities trading. The Board also reviewed and considered the nature and extent of the non-advisory, administrative services to be provided by the Adviser under the administration agreement, including accounting, clerical, bookkeeping, compliance, business management and planning, and the provision of supplies, office space and utilities at the Adviser's expense. (The advisory and administration agreements together are referred to as the "Management Agreement.")
The Board reviewed and considered the qualifications of the portfolio managers, the senior administrative managers and other key personnel of the Adviser who will provide the administrative and advisory services to the Portfolios. The Board determined that the Adviser's portfolio managers and key personnel are well qualified by education and/or training and experience to perform the services in an efficient and professional manner. The Board concluded that the nature and extent of the advisory and administrative services to be provided were necessary and appropriate for the conduct of the business and investment activities of the Portfolios and supported its decision to approve the Management Agreement.
Performance, Fees and Expenses of the Portfolios
The Board considered that the Adviser plans to arrange for a public offering of shares of the Portfolios to raise assets for investment and that the offering had not yet begun and concluded that, since the Portfolios currently had no assets to invest (other than seed capital required under the Investment Company Act) and had no track record of performance, this was not a factor it needed to address at the present time.
The Board reviewed the advisory and administrative fee rates (the "management fee rates") proposed to be paid by the Portfolios under the Management Agreement relative to comparable funds advised by the Adviser, when applicable, and compared to their peers as determined by Lipper, Inc., and reviewed the anticipated total expense ratios of the Portfolios. The Board considered that the Portfolios require the Adviser to develop processes, invest in additional resources and incur additional risks to successfully manage the Portfolios and concluded that the proposed management fee rates and anticipated total expense ratios would be competitive with their peer group averages.
Economies of Scale
The Board considered the growth prospects of the Portfolios and the structure of the proposed management fee schedules, which include breakpoints for each of the Portfolios. The Board considered that the Portfolios' potential growth was uncertain and concluded that it would be premature to consider economies of scale as a factor in approving the Management Agreement at the present time.
Profitability of the Adviser and Affiliates
Since the Portfolios have not begun operations and have not paid any fees to the Adviser, the Board concluded that this was not a factor that needed to be considered at the present time.
Other Benefits of the Relationship
The Board considered other benefits to the Adviser and its affiliates derived from their relationship with the Portfolios and other funds advised by the Adviser. These benefits may include, among other things, "float" benefits derived from handling of checks for purchases and sales, research received by the Adviser generated from commission dollars spent on funds' portfolio trading and fees for distribution and/or shareholder servicing. Since the Portfolios have not begun operations and have not paid any fees to the Adviser, the Board concluded that these benefits were not a factor that needed to be considered at the present time.
3
2011 Annual Report
December 31, 2011
Investment Advisory Agreement Approval (unaudited) (cont'd)
Resources of the Adviser and Historical Relationship Between the Portfolios and the Adviser
The Board considered whether the Adviser is financially sound and has the resources necessary to perform its obligations under the Management Agreement. The Board also reviewed and considered the historical relationship between the Fund and the Adviser, including the organizational structure of the Adviser, the policies and procedures formulated and adopted by the Adviser for managing the Portfolios' operations and the Board's confidence in the competence and integrity of the senior managers and key personnel of the Adviser. The Board concluded that the Adviser has the financial resources necessary to fulfill its obligations under the Management Agreement and that it is beneficial for the Portfolios to enter into this relationship with the Adviser.
Other Factors and Current Trends
The Board considered the controls and procedures adopted and implemented by the Adviser and monitored by the Fund's Chief Compliance Officer and concluded that the conduct of business by the Adviser indicates a good faith effort on its part to adhere to high ethical standards in the conduct of the Fund's business.
General Conclusion
After considering and weighing all of the above factors, the Board concluded that it would be in the best interest of the Portfolios' and their future shareholders to approve the Management Agreement, which will remain in effect for two years and thereafter must be approved annually by the Board of the Fund if it is to continue in effect. In reaching this conclusion the Board did not give particular weight to any single factor referenced above. It is possible that individual Board members may have weighed these factors differently in reaching their individual decisions to approve the Management Agreement.
4
(This Page has been left blank intentionally.)
2011 Annual Report
December 31, 2011
Performance Summary (unaudited)
| | | Inception Dates | | One Year Total Return | | Five Years
Average Annual Total Return | |
| | | Class I | | Class P | | Class H | | Class L | | Class I | | Class P | | Class H | | Class L | | Index | | | | Class I | | Class P | | Class H | | Class L | | Index | | | |
| Global and International Equity Portfolios: | |
| Active International Allocation | | 1/17/92 | | 1/2/96 | | | — | | | | — | | | | –14.56 | % | | | –14.75 | % | | | — | % | | | — | % | | | –12.14 | % | | | (1 | ) | | | –3.66 | % | | | –3.90 | % | | | — | % | | | — | % | | | –4.72 | % | | | (1 | ) | |
| Asian Equity | | 12/28/10 | | 12/28/10 | | 12/28/10 | | 12/28/10 | | | –16.88 | | | | –17.08 | | | | –17.08 | | | | –17.57 | | | | –17.31 | | | | (2 | ) | | | — | | | | — | | | | — | | | | — | | | | — | | | | (2 | ) | |
| Emerging Markets | | 9/25/92 | | 1/2/96 | | | — | | | | — | | | | –18.41 | | | | –18.63 | | | | — | | | | — | | | | –18.42 | | | | (3 | ) | | | 0.23 | | | | –0.02 | | | | — | | | | — | | | | 2.40 | | | | (3 | ) | |
| Global Advantage | | 12/28/10 | | 12/28/10 | | 12/28/10 | | 12/28/10 | | | 0.34 | | | | 0.07 | | | | 0.08 | | | | –0.44 | | | | –7.35 | | | | (4 | ) | | | — | | | | — | | | | — | | | | — | | | | — | | | | (4 | ) | |
| Global Discovery | | 12/28/10 | | 12/28/10 | | 12/28/10 | | 12/28/10 | | | –7.72 | | | | –7.98 | | | | –7.96 | | | | –8.41 | | | | –7.35 | | | | (4 | ) | | | — | | | | — | | | | — | | | | — | | | | — | | | | (4 | ) | |
| Global Franchise | | 11/28/01 | | 11/28/01 | | | — | | | | — | | | | 9.38 | | | | 8.98 | | | | — | | | | — | | | | –5.54 | | | | (5 | ) | | | 4.74 | | | | 4.46 | | | | — | | | | — | | | | –2.37 | | | | (5 | ) | |
| Global Insight | | 12/28/11 | | | — | | | 12/28/11 | | 12/28/11 | | | — | | | | — | | | | — | | | | — | | | | — | | | | (4 | ) | | | — | | | | — | | | | — | | | | — | | | | — | | | | (4 | ) | |
| Global Opportunity | | 5/30/08 | | 5/21/10 | | 5/30/08 | | 5/30/08 | | | –4.90 | | | | –5.16 | | | | –5.18 | | | | –5.19 | | | | –7.35 | | | | (4 | ) | | | — | | | | — | | | | — | | | | — | | | | — | | | | (4 | ) | |
| Global Real Estate | | 8/30/06 | | 8/30/06 | | 1/2/08 | | 6/16/08 | | | –9.67 | | | | –9.91 | | | | –9.90 | | | | –10.33 | | | | –6.00 | | | | (6 | ) | | | –4.94 | | | | –5.21 | | | | — | | | | — | | | | –5.46 | | | | (6 | ) | |
| International Advantage | | 12/28/10 | | 12/28/10 | | 12/28/10 | | 12/28/10 | | | –1.31 | | | | –1.57 | | | | –1.57 | | | | –2.09 | | | | –13.71 | | | | (7 | ) | | | — | | | | — | | | | — | | | | — | | | | — | | | | (7 | ) | |
| International Equity | | 8/4/89 | | 1/2/96 | | | — | | | | — | | | | –7.63 | | | | –7.83 | | | | — | | | | — | | | | –12.14 | | | | (1 | ) | | | –2.63 | | | | –2.88 | | | | — | | | | — | | | | –4.72 | | | | (1 | ) | |
| International Opportunity | | 3/31/10 | | 3/31/10 | | 3/31/10 | | 3/31/10 | | | –10.16 | | | | –10.33 | | | | –10.30 | | | | –10.81 | | | | –13.71 | | | | (7 | ) | | | — | | | | — | | | | — | | | | — | | | | — | | | | (7 | ) | |
| International Real Estate | | 10/1/97 | | 10/1/97 | | | — | | | | — | | | | –19.92 | | | | –20.16 | | | | — | | | | — | | | | –17.81 | | | | (8 | ) | | | –11.92 | | | | –12.14 | | | | — | | | | — | | | | –8.75 | | | | (8 | ) | |
| International Small Cap | | 12/15/92 | | 10/21/08 | | | — | | | | — | | | | –18.33 | | | | –18.56 | | | | — | | | | — | | | | –15.94 | | | | (9 | ) | | | –6.39 | | | | — | | | | — | | | | — | | | | –4.14 | | | | (9 | ) | |
| Select Global Infrastructure | | 9/20/10 | | 9/20/10 | | 9/20/10 | | 9/20/10 | | | 15.95 | | | | 15.67 | | | | 15.67 | | | | 15.12 | | | | 13.75 | | | | (10 | ) | | | — | | | | — | | | | — | | | | — | | | | — | | | | (10 | ) | |
| U.S. Equity Portfolios: | |
| Advantage | | 6/30/08 | | 5/21/10 | | 6/30/08 | | 6/30/08 | | | 5.33 | | | | 5.07 | | | | 5.06 | | | | 5.19 | | | | 2.64 | | | | (11 | ) | | | — | | | | — | | | | — | | | | — | | | | — | | | | (11 | ) | |
| Focus Growth | | 3/8/95 | | 1/2/96 | | | — | | | | — | | | | –7.30 | | | | –7.53 | | | | — | | | | — | | | | 2.64 | | | | (11 | ) | | | 3.76 | | | | 3.49 | | | | — | | | | — | | | | 2.50 | | | | (11 | ) | |
| Growth | | 4/2/91 | | 1/2/96 | | | — | | | | — | | | | –3.01 | | | | –3.27 | | | | — | | | | — | | | | 2.64 | | | | (11 | ) | | | 3.34 | | | | 3.09 | | | | — | | | | — | | | | 2.50 | | | | (11 | ) | |
| Insight | | 12/28/11 | | | — | | | 12/28/11 | | 12/28/11 | | | — | | | | — | | | | — | | | | — | | | | — | | | | (12 | ) | | | — | | | | — | | | | — | | | | — | | | | — | | | | (12 | ) | |
| Opportunity | | 8/12/05 | | 5/21/10 | | 5/28/98 | | 5/28/98 | | | –0.46 | | | | –0.72 | | | | –0.73 | | | | –1.17 | | | | 2.64 | | | | (11 | ) | | | 5.16 | | | | — | | | | 4.86 | | | | 4.18 | | | | 2.50 | | | | (11 | ) | |
| Small Company Growth | | 11/1/89 | | 1/2/96 | | 11/11/11 | | 11/11/11 | | | –9.12 | | | | –9.28 | | | | — | | | | — | | | | –2.91 | | | | (13 | ) | | | 0.49 | | | | 0.24 | | | | — | | | | — | | | | 2.09 | | | | (13 | ) | |
| U.S. Real Estate | | 2/24/95 | | 1/2/96 | | 11/11/11 | | 11/11/11 | | | 5.57 | | | | 5.26 | | | | — | | | | — | | | | 8.29 | | | | (14 | ) | | | –1.70 | | | | –1.97 | | | | — | | | | — | | | | –1.42 | | | | (14 | ) | |
| Fixed Income Portfolio: | |
| Emerging Markets Debt | | 2/1/94 | | 1/2/96 | | 1/2/08 | | 6/16/08 | | | –3.66 | | | | –3.90 | | | | –3.88 | | | | –4.34 | | | | –1.75 | | | | (15 | ) | | | 5.15 | | | | 4.86 | | | | — | | | | — | | | | 7.02 | | | | (15 | ) | |
6
2011 Annual Report
December 31, 2011
Performance Summary (unaudited) (cont'd)
| | | Ten Years
Average Annual Total Return | | Since Inception
Average Annual Total Return* | |
| | | Class I | | Class P | | Class H | | Class L | | Index | | | | Class I | | Index | | Class P | | Index | | Class H | | Index | | Class L | | Index | | | |
| Global and International Equity Portfolios: | |
| Active International Allocation | | | 4.84 | % | | | 4.57 | % | | | — | % | | | — | % | | | 4.67 | % | | | (1 | ) | | | 5.36 | % | | | 4.82 | % | | | 4.35 | % | | | 3.55 | % | | | — | % | | | — | % | | | — | % | | | — | % | | | (1 | ) | |
| Asian Equity | | | — | | | | — | | | | — | | | | — | | | | — | | | | (2 | ) | | | –15.19 | | | | –15.45 | | | | –15.38 | | | | –15.45 | | | | –15.38 | | | | –15.45 | | | | –15.88 | | | | –15.45 | | | | (2 | ) | |
| Emerging Markets | | | 12.98 | | | | 12.69 | | | | — | | | | — | | | | 13.86 | | | | (3 | ) | | | 8.70 | | | | 8.46 | | | | 7.48 | | | | 6.79 | | | | — | | | | — | | | | — | | | | — | | | | (3 | ) | |
| Global Advantage | | | — | | | | — | | | | — | | | | — | | | | — | | | | (4 | ) | | | 0.43 | | | | –6.71 | | | | 0.17 | | | | –6.71 | | | | 0.18 | | | | –6.71 | | | | –0.34 | | | | –6.71 | | | | (4 | ) | |
| Global Discovery | | | — | | | | — | | | | — | | | | — | | | | — | | | | (4 | ) | | | –7.93 | | | | –6.71 | | | | –8.19 | | | | –6.71 | | | | –8.17 | | | | –6.71 | | | | –8.62 | | | | –6.71 | | | | (4 | ) | |
| Global Franchise | | | 10.44 | | | | 10.15 | | | | — | | | | — | | | | 3.62 | | | | (5 | ) | | | 10.85 | | | | 3.76 | | | | 10.55 | | | | 3.76 | | | | — | | | | — | | | | — | | | | — | | | | (5 | ) | |
| Global Insight | | | — | | | | — | | | | — | | | | — | | | | — | | | | (4 | ) | | | 0.70 | | | | 1.15 | | | | — | | | | — | | | | 0.70 | | | | 1.15 | | | | 0.70 | | | | 1.15 | | | | (4 | ) | |
| Global Opportunity | | | — | | | | — | | | | — | | | | — | | | | — | | | | (4 | ) | | | 2.83 | | | | –4.90 | | | | 16.07 | | | | 7.82 | | | | 2.60 | | | | –4.90 | | | | 2.51 | | | | –4.90 | | | | (4 | ) | |
| Global Real Estate | | | — | | | | — | | | | — | | | | — | | | | — | | | | (6 | ) | | | –1.76 | | | | –2.29 | | | | –2.03 | | | | –2.29 | | | | –4.34 | | | | –4.99 | | | | –4.13 | | | | –3.76 | | | | (6 | ) | |
| International Advantage | | | — | | | | — | | | | — | | | | — | | | | — | | | | (7 | ) | | | –1.40 | | | | –12.66 | | | | –1.66 | | | | –12.66 | | | | –1.65 | | | | –12.66 | | | | –2.17 | | | | –12.66 | | | | (7 | ) | |
| International Equity | | | 5.72 | | | | 5.47 | | | | — | | | | — | | | | 4.67 | | | | (1 | ) | | | 8.53 | | | | 3.63 | | | | 7.34 | | | | 3.55 | | | | — | | | | — | | | | — | | | | — | | | | (1 | ) | |
| International Opportunity | | | — | | | | — | | | | — | | | | — | | | | — | | | | (7 | ) | | | 4.73 | | | | –3.22 | | | | 4.47 | | | | –3.22 | | | | 4.49 | | | | –3.22 | | | | 3.95 | | | | –3.22 | | | | (7 | ) | |
| International Real Estate | | | 9.59 | | | | 9.31 | | | | — | | | | — | | | | 9.02 | | | | (8 | ) | | | 6.87 | | | | 4.45 | | | | 6.61 | | | | 4.45 | | | | — | | | | — | | | | — | | | | — | | | | (8 | ) | |
| International Small Cap | | | 6.45 | | | | — | | | | — | | | | — | | | | 9.01 | | | | (9 | ) | | | 8.29 | | | | 4.93 | | | | 6.25 | | | | 12.11 | | | | — | | | | — | | | | — | | | | — | | | | (9 | ) | |
| Select Global Infrastructure | | | — | | | | — | | | | — | | | | — | | | | — | | | | (10 | ) | | | 16.57 | | | | 15.80 | | | | 16.29 | | | | 15.80 | | | | 16.29 | | | | 15.80 | | | | 15.73 | | | | 15.80 | | | | (10 | ) | |
| U.S. Equity Portfolios: | |
| Advantage | | | — | | | | — | | | | — | | | | — | | | | — | | | | (11 | ) | | | 4.73 | | | | 3.09 | | | | 16.05 | | | | 13.66 | | | | 4.49 | | | | 3.09 | | | | 4.53 | | | | 3.09 | | | | (11 | ) | |
| Focus Growth | | | 3.79 | | | | 3.53 | | | | — | | | | — | | | | 2.60 | | | | (11 | ) | | | 9.87 | | | | 6.88 | | | | 7.73 | | | | 5.48 | | | | — | | | | — | | | | — | | | | — | | | | (11 | ) | |
| Growth | | | 3.42 | | | | 3.17 | | | | — | | | | — | | | | 2.60 | | | | (11 | ) | | | 8.73 | | | | 7.20 | | | | 6.83 | | | | 5.48 | | | | — | | | | — | | | | — | | | | — | | | | (11 | ) | |
| Insight | | | — | | | | — | | | | — | | | | — | | | | — | | | | (12 | ) | | | 0.60 | | | | 0.72 | | | | — | | | | — | | | | 0.60 | | | | 0.72 | | | | 0.60 | | | | 0.72 | | | | (12 | ) | |
| Opportunity | | | — | | | | — | | | | 3.85 | | | | 3.17 | | | | 2.60 | | | | (11 | ) | | | 6.58 | | | | 3.79 | | | | 14.44 | | | | 13.66 | | | | 3.68 | | | | 1.89 | | | | 2.97 | | | | 1.89 | | | | (11 | ) | |
| Small Company Growth | | | 5.68 | | | | 5.42 | | | | — | | | | — | | | | 4.48 | | | | (13 | ) | | | 10.39 | | | | 6.40 | | | | 8.99 | | | | 4.38 | | | | –3.46 | | | | –1.26 | | | | –3.54 | | | | –1.26 | | | | (13 | ) | |
| U.S. Real Estate | | | 10.99 | | | | 10.70 | | | | — | | | | — | | | | 10.20 | | | | (14 | ) | | | 12.69 | | | | 10.77 | | | | 11.71 | | | | 10.40 | | | | 1.24 | | | | 2.25 | | | | 1.17 | | | | 2.25 | | | | (14 | ) | |
| Fixed Income Portfolio: | |
| Emerging Markets Debt | | | 9.74 | | | | 9.46 | | | | — | | | | — | | | | 10.49 | | | | (15 | ) | | | 9.58 | | | | 9.82 | | | | 9.78 | | | | 10.81 | | | | 5.03 | | | | 6.96 | | | | 4.84 | | | | 7.67 | | | | (15 | ) | |
Performance data quoted assumes that all dividends and distributions, if any, were reinvested and represents past performance, which is no guarantee of future results. Returns do not reflect the deduction of any applicable sales charges for Class H shares. Such costs would lower performance. Current performance may be lower or higher than the figures shown. For the most recent month-end performance figures, please visit www.morganstanley.com/im or call 1-800-548-7786. Investment returns and principal value will fluctuate and fund shares, when redeemed, may be worth more or less than their original cost.
* Returns for periods less than one year are not annualized.
Indices:
(1) MSCI EAFE (Europe, Australasia, Far East) Index
(2) MSCI All Country Asia Ex-Japan Index
(3) MSCI Emerging Markets Net Index
(4) MSCI All Country World Index
(5) MSCI World Index
(6) FTSE EPRA/NAREIT Developed Real Estate (Net) Index
(7) MSCI All Country World Index Ex-U.S. Index
(8) FTSE EPRA/NAREIT Developed ex-North America Real Estate Index
(9) MSCI EAFE Small Cap Total Return Index
(10) Dow Jones Brookfield Global Infrastructure IndexSM
(11) Russell 1000® Growth Index
(12) Russell 3000® Value Index
(13) Russell 2000® Growth Index
(14) FTSE NAREIT Equity REITs Index
(15) JP Morgan EMBI Global Bond Index/JP Morgan GBI-EM Global Diversified Bond Index
7
2011 Annual Report
December 31, 2011
Expense Examples (unaudited)
As a shareholder of a Portfolio, you may incur two types of costs: (1) transactional costs, including redemptions fees, and (2) ongoing costs, including management fees, shareholder servicing and distribution fees (in the case of Class P, Class H and Class L) and other Portfolio expenses. These examples are intended to help you understand your ongoing costs (in dollars) of investing in a Portfolio and to compare these costs with the ongoing costs of investing in other mutual funds.
These examples are based on an investment of $1,000 invested at the beginning of the six-month period ended December 31, 2011 and held for the entire six-month period.
Actual Expenses
The table below provides information about actual account values and actual expenses. You may use the information in this table, together with the amount you invested, to estimate the expenses that you paid over the period. Simply divide your account value by $1,000 (for example, an $8,600 account value divided by $1,000 = 8.6), then multiply the result by the number in the table under the heading entitled "Actual Expenses Paid During Period" to estimate the expenses you paid on your account during this period.
Please note that "Actual Expenses Paid During Period" are grossed up to reflect Portfolio expenses prior to the effect of Expense Offset (See Note F in the Notes to Financial Statements). Therefore, the annualized net expense ratios may differ from the ratio of expenses to average net assets shown in the Financial Highlights.
Hypothetical Example for Comparison Purposes
The table below provides information about hypothetical account values and hypothetical expenses based on the Portfolio's actual expense ratio and an assumed rate of return of 5% per year before expenses, which is not the Portfolio's actual return. The hypothetical account values and expenses may not be used to estimate the actual ending account balance or expenses you paid for the period. You may use this information to compare the ongoing costs of investing in the Portfolio and other funds. To do so, compare this 5% hypothetical example with the 5% hypothetical examples that appear in the shareholder reports of the other funds.
Please note that the expenses shown in the table are meant to highlight your ongoing costs only and do not reflect any transactional costs, such as redemption fees. Therefore, the second line of the table is useful in comparing ongoing costs only, and will not help you determine the relative total costs of owning different funds. In addition, if these transactional costs were included, your costs would have been higher.
8
2011 Annual Report
December 31, 2011
Expense Examples (unaudited) (cont'd)
| Portfolio | | Beginning
Account
Value
7/1/11 | | Actual Ending
Account
Value
12/31/11 | | Hypothetical
Ending Account
Value | | Actual
Expenses
Paid
During
Period* | | Hypothetical
Expenses Paid
During Period* | | Net
Expense
Ratio
During
Period** | |
| Active International Allocation Portfolio Class I | | $ | 1,000.00 | | | $ | 815.80 | | | $ | 1,020.72 | | | $ | 4.07 | | | $ | 4.53 | | | | 0.89 | % | |
| Active International Allocation Portfolio Class P | | | 1,000.00 | | | | 814.70 | | | | 1,019.46 | | | | 5.21 | | | | 5.80 | | | | 1.14 | | |
| Asian Equity Portfolio Class I | | | 1,000.00 | | | | 819.10 | | | | 1,017.95 | | | | 6.60 | | | | 7.32 | | | | 1.44 | | |
| Asian Equity Portfolio Class P | | | 1,000.00 | | | | 818.00 | | | | 1,016.69 | | | | 7.74 | | | | 8.59 | | | | 1.69 | | |
| Asian Equity Portfolio Class H | | | 1,000.00 | | | | 818.00 | | | | 1,016.69 | | | | 7.74 | | | | 8.59 | | | | 1.69 | | |
| Asian Equity Portfolio Class L | | | 1,000.00 | | | | 815.50 | | | | 1,014.17 | | | | 10.02 | | | | 11.12 | | | | 2.19 | | |
| Emerging Markets Portfolio Class I | | | 1,000.00 | | | | 823.40 | | | | 1,017.69 | | | | 6.85 | | | | 7.58 | | | | 1.49 | | |
| Emerging Markets Portfolio Class P | | | 1,000.00 | | | | 822.40 | | | | 1,016.43 | | | | 7.99 | | | | 8.84 | | | | 1.74 | | |
| Global Advantage Portfolio Class I | | | 1,000.00 | | | | 930.80 | | | | 1,018.65 | | | | 6.33 | | | | 6.61 | | | | 1.30 | | |
| Global Advantage Portfolio Class P | | | 1,000.00 | | | | 930.10 | | | | 1,017.39 | | | | 7.54 | | | | 7.88 | | | | 1.55 | | |
| Global Advantage Portfolio Class H | | | 1,000.00 | | | | 930.20 | | | | 1,017.39 | | | | 7.54 | | | | 7.88 | | | | 1.55 | | |
| Global Advantage Portfolio Class L | | | 1,000.00 | | | | 927.90 | | | | 1,014.87 | | | | 9.96 | | | | 10.41 | | | | 2.05 | | |
| Global Discovery Portfolio Class I | | | 1,000.00 | | | | 828.10 | | | | 1,018.40 | | | | 6.22 | | | | 6.87 | | | | 1.35 | | |
| Global Discovery Portfolio Class P | | | 1,000.00 | | | | 827.20 | | | | 1,017.14 | | | | 7.37 | | | | 8.13 | | | | 1.60 | | |
| Global Discovery Portfolio Class H | | | 1,000.00 | | | | 826.70 | | | | 1,017.14 | | | | 7.37 | | | | 8.13 | | | | 1.60 | | |
| Global Discovery Portfolio Class L | | | 1,000.00 | | | | 824.90 | | | | 1,014.62 | | | | 9.66 | | | | 10.66 | | | | 2.10 | | |
| Global Franchise Portfolio Class I | | | 1,000.00 | | | | 974.60 | | | | 1,020.16 | | | | 4.98 | | | | 5.09 | | | | 1.00 | | |
| Global Franchise Portfolio Class P | | | 1,000.00 | | | | 972.60 | | | | 1,018.90 | | | | 6.22 | | | | 6.36 | | | | 1.25 | | |
| Global Insight Portfolio Class I | | | 1,000.00 | | | | 1,007.00 | | | | 1,000.30 | | | | 0.11 | + | | | 0.11 | | | | 1.35 | | |
| Global Insight Portfolio Class H | | | 1,000.00 | | | | 1,007.00 | | | | 1,000.28 | | | | 0.13 | + | | | 0.13 | | | | 1.60 | | |
| Global Insight Portfolio Class L | | | 1,000.00 | | | | 1,007.00 | | | | 1,000.24 | | | | 0.17 | + | | | 0.17 | | | | 2.10 | | |
| Global Opportunity Portfolio Class I | | | 1,000.00 | | | | 869.20 | | | | 1,018.95 | | | | 5.84 | | | | 6.31 | | | | 1.24 | | |
| Global Opportunity Portfolio Class P | | | 1,000.00 | | | | 868.00 | | | | 1,017.69 | | | | 7.02 | | | | 7.58 | | | | 1.49 | | |
| Global Opportunity Portfolio Class H | | | 1,000.00 | | | | 868.40 | | | | 1,017.69 | | | | 7.02 | | | | 7.58 | | | | 1.49 | | |
| Global Opportunity Portfolio Class L | | | 1,000.00 | | | | 868.10 | | | | 1,017.44 | | | | 7.25 | | | | 7.83 | | | | 1.54 | | |
| Global Real Estate Portfolio Class I | | | 1,000.00 | | | | 857.40 | | | | 1,019.81 | | | | 5.01 | | | | 5.45 | | | | 1.07 | | |
| Global Real Estate Portfolio Class P | | | 1,000.00 | | | | 855.90 | | | | 1,018.55 | | | | 6.17 | | | | 6.72 | | | | 1.32 | | |
| Global Real Estate Portfolio Class H | | | 1,000.00 | | | | 856.80 | | | | 1,018.55 | | | | 6.18 | | | | 6.72 | | | | 1.32 | | |
| Global Real Estate Portfolio Class L | | | 1,000.00 | | | | 854.10 | | | | 1,016.03 | | | | 8.51 | | | | 9.25 | | | | 1.82 | | |
| International Advantage Portfolio Class I | | | 1,000.00 | | | | 915.40 | | | | 1,018.90 | | | | 6.03 | | | | 6.36 | | | | 1.25 | | |
| International Advantage Portfolio Class P | | | 1,000.00 | | | | 913.80 | | | | 1,017.64 | | | | 7.24 | | | | 7.63 | | | | 1.50 | | |
| International Advantage Portfolio Class H | | | 1,000.00 | | | | 913.90 | | | | 1,017.64 | | | | 7.24 | | | | 7.63 | | | | 1.50 | | |
| International Advantage Portfolio Class L | | | 1,000.00 | | | | 911.50 | | | | 1,015.12 | | | | 9.64 | | | | 10.16 | | | | 2.00 | | |
| International Equity Portfolio Class I | | | 1,000.00 | | | | 871.20 | | | | 1,020.42 | | | | 4.48 | | | | 4.84 | | | | 0.95 | | |
| International Equity Portfolio Class P | | | 1,000.00 | | | | 870.00 | | | | 1,019.16 | | | | 5.66 | | | | 6.11 | | | | 1.20 | | |
| International Opportunity Portfolio Class I | | | 1,000.00 | | | | 836.00 | | | | 1,019.46 | | | | 5.28 | | | | 5.80 | | | | 1.14 | | |
| International Opportunity Portfolio Class P | | | 1,000.00 | | | | 835.00 | | | | 1,018.20 | | | | 6.43 | | | | 7.07 | | | | 1.39 | | |
| International Opportunity Portfolio Class H | | | 1,000.00 | | | | 835.30 | | | | 1,018.20 | | | | 6.43 | | | | 7.07 | | | | 1.39 | | |
| International Opportunity Portfolio Class L | | | 1,000.00 | | | | 832.90 | | | | 1,015.68 | | | | 8.73 | | | | 9.60 | | | | 1.89 | | |
| International Real Estate Portfolio Class I | | | 1,000.00 | | | | 780.90 | | | | 1,020.16 | | | | 4.49 | | | | 5.09 | | | | 1.00 | | |
| International Real Estate Portfolio Class P | | | 1,000.00 | | | | 779.30 | | | | 1,018.90 | | | | 5.61 | | | | 6.36 | | | | 1.25 | | |
| International Small Cap Portfolio Class I | | | 1,000.00 | | | | 788.10 | | | | 1,019.41 | | | | 5.18 | | | | 5.85 | | | | 1.15 | | |
| International Small Cap Portfolio Class P | | | 1,000.00 | | | | 786.40 | | | | 1,018.15 | | | | 6.30 | | | | 7.12 | | | | 1.40 | | |
| Select Global Infrastructure Portfolio Class I | | | 1,000.00 | | | | 1,038.80 | | | | 1,019.41 | | | | 5.91 | | | | 5.85 | | | | 1.15 | | |
| Select Global Infrastructure Portfolio Class P | | | 1,000.00 | | | | 1,037.20 | | | | 1,018.15 | | | | 7.19 | | | | 7.12 | | | | 1.40 | | |
| Select Global Infrastructure Portfolio Class H | | | 1,000.00 | | | | 1,037.20 | | | | 1,018.15 | | | | 7.19 | | | | 7.12 | | | | 1.40 | | |
| Select Global Infrastructure Portfolio Class L | | | 1,000.00 | | | | 1,034.90 | | | | 1,015.63 | | | | 9.75 | | | | 9.65 | | | | 1.90 | | |
| Advantage Portfolio Class I | | | 1,000.00 | | | | 974.40 | | | | 1,019.91 | | | | 5.23 | | | | 5.35 | | | | 1.05 | | |
| Advantage Portfolio Class P | | | 1,000.00 | | | | 973.60 | | | | 1,018.65 | | | | 6.47 | | | | 6.61 | | | | 1.30 | | |
| Advantage Portfolio Class H | | | 1,000.00 | | | | 973.50 | | | | 1,018.65 | | | | 6.47 | | | | 6.61 | | | | 1.30 | | |
| Advantage Portfolio Class L | | | 1,000.00 | | | | 974.10 | | | | 1,019.71 | | | | 5.42 | | | | 5.55 | | | | 1.09 | | |
| Focus Growth Portfolio Class I | | | 1,000.00 | | | | 860.20 | | | | 1,020.21 | | | | 4.64 | | | | 5.04 | | | | 0.99 | | |
| Focus Growth Portfolio Class P | | | 1,000.00 | | | | 859.20 | | | | 1,018.95 | | | | 5.81 | | | | 6.31 | | | | 1.24 | | |
| Growth Portfolio Class I | | | 1,000.00 | | | | 886.50 | | | | 1,021.53 | | | | 3.47 | | | | 3.72 | | | | 0.73 | | |
9
2011 Annual Report
December 31, 2011
Expense Examples (unaudited) (cont'd)
| Portfolio | | Beginning
Account
Value
7/1/11 | | Actual Ending
Account
Value
12/31/11 | | Hypothetical
Ending Account
Value | | Actual
Expenses
Paid
During
Period* | | Hypothetical
Expenses Paid
During Period* | | Net
Expense
Ratio
During
Period** | |
| Growth Portfolio Class P | | $ | 1,000.00 | | | $ | 885.50 | | | $ | 1,020.27 | | | $ | 4.66 | | | $ | 4.99 | | | | 0.98 | % | |
| Insight Portfolio Class I | | | 1,000.00 | | | | 1,006.00 | | | | 1,000.32 | | | | 0.09 | + | | | 0.09 | | | | 1.05 | | |
| Insight Portfolio Class H | | | 1,000.00 | | | | 1,006.00 | | | | 1,000.30 | | | | 0.11 | + | | | 0.11 | | | | 1.30 | | |
| Insight Portfolio Class L | | | 1,000.00 | | | | 1,006.00 | | | | 1,000.26 | | | | 0.15 | + | | | 0.15 | | | | 1.80 | | |
| Opportunity Portfolio Class I | | | 1,000.00 | | | | 926.70 | | | | 1,020.77 | | | | 4.27 | | | | 4.48 | | | | 0.88 | | |
| Opportunity Portfolio Class P | | | 1,000.00 | | | | 925.20 | | | | 1,019.51 | | | | 5.48 | | | | 5.75 | | | | 1.13 | | |
| Opportunity Portfolio Class H | | | 1,000.00 | | | | 924.90 | | | | 1,019.51 | | | | 5.48 | | | | 5.75 | | | | 1.13 | | |
| Opportunity Portfolio Class L | | | 1,000.00 | | | | 923.10 | | | | 1,016.99 | | | | 7.90 | | | | 8.29 | | | | 1.63 | | |
| Small Company Growth Portfolio Class I | | | 1,000.00 | | | | 889.40 | | | | 1,019.91 | | | | 5.00 | | | | 5.35 | | | | 1.05 | | |
| Small Company Growth Portfolio Class P | | | 1,000.00 | | | | 888.40 | | | | 1,018.65 | | | | 6.19 | | | | 6.61 | | | | 1.30 | | |
| Small Company Growth Portfolio Class H | | | 1,000.00 | | | | 965.40 | | | | 1,004.87 | | | | 1.68 | ++ | | | 1.71 | | | | 1.30 | | |
| Small Company Growth Portfolio Class L | | | 1,000.00 | | | | 964.60 | | | | 1,004.21 | | | | 2.33 | ++ | | | 2.37 | | | | 1.80 | | |
| U.S. Real Estate Portfolio Class I | | | 1,000.00 | | | | 964.40 | | | | 1,020.06 | | | | 5.05 | | | | 5.19 | | | | 1.02 | | |
| U.S. Real Estate Portfolio Class P | | | 1,000.00 | | | | 962.50 | | | | 1,018.80 | | | | 6.28 | | | | 6.46 | | | | 1.27 | | |
| U.S. Real Estate Portfolio Class H | | | 1,000.00 | | | | 1,012.40 | | | | 1,004.93 | | | | 1.65 | ++ | | | 1.65 | | | | 1.25 | | |
| U.S. Real Estate Portfolio Class L | | | 1,000.00 | | | | 1,011.70 | | | | 1,004.27 | | | | 2.31 | ++ | | | 2.31 | | | | 1.75 | | |
| Emerging Markets Debt Portfolio Class I | | | 1,000.00 | | | | 914.50 | | | | 1,021.02 | | | | 4.01 | | | | 4.23 | | | | 0.83 | | |
| Emerging Markets Debt Portfolio Class P | | | 1,000.00 | | | | 913.20 | | | | 1,019.76 | | | | 5.21 | | | | 5.50 | | | | 1.08 | | |
| Emerging Markets Debt Portfolio Class H | | | 1,000.00 | | | | 913.50 | | | | 1,019.76 | | | | 5.21 | | | | 5.50 | | | | 1.08 | | |
| Emerging Markets Debt Portfolio Class L | | | 1,000.00 | | | | 911.50 | | | | 1,017.24 | | | | 7.61 | | | | 8.03 | | | | 1.58 | | |
* Expenses are calculated using each Portfolio Class' annualized net expense ratio (as disclosed), multiplied by the average account value over the period, and multiplied by 184/365 (to reflect the most recent one-half year period).
** Annualized.
+ Expenses are calculated using each Portfolio Class' annualized net expense ratio (as disclosed), multiplied by the average account value over the period, and multiplied by 3/365 (to reflect the actual days in the period).
++Expenses are calculated using each Portfolio Class' annualized net expense ratio (as disclosed), multiplied by the average account value over the period, and multiplied by 48/365 (to reflect the actual days in the period).
10
2011 Annual Report
December 31, 2011
Investment Overview (unaudited)
Active International Allocation Portfolio
The Active International Allocation Portfolio (the "Portfolio") seeks long-term capital appreciation by investing primarily, in accordance with country and sector weightings determined by the Adviser, in equity securities of non-U.S. issuers which, in the aggregate, replicate broad market indices.
Performance
For the year ended December 31, 2011, the Portfolio had a total return based on net asset value and reinvestment of distributions per share of -14.56%, net of fees, for Class I shares. The Portfolio's Class I shares underperformed against its benchmark, the MSCI EAFE Index (the "Index"), which returned -12.14%.
Factors Affecting Performance
• For 2011, international equities, as represented by the MSCI EAFE Index (the Index), lost 12%. On a regional basis, U.S. equities (+1%) led the developed markets, followed by the equity markets of Europe (-11%), Asia Ex-Japan (-13%), and Japan (-14%). Emerging markets (-18%) lagged developed markets. Within the Index, health care (+6%), consumer staples (+4%), energy (+1%) were the best-performing sectors, while utilities (-19%), financials (-22%), and materials (-23%) lagged the most. (The country and regional returns shown are based on their respective MSCI indexes and are quoted in U.S. dollars.) Versus the U.S. dollar, the Japanese yen was up 5%, the Swiss franc was flat, the British pound declined 1%, and the euro fell 3%.
• The overweight to the materials and industrials sectors and underweights to Europe and the U.K. were the main detractors from relative performance. Conversely, the most significant contributors were the above-benchmark weight in energy and the underweight positions in Asia Ex-Japan, financials, and utilities.
Management Strategies
• 2011 was an agonizing year. After beginning the year with decent positive momentum, the global markets and economy battled the after-effects of Japan's tragic March earthquake and tsunami, a jarring increase in European bond yields and tightening of bank funding, the U.S. Treasury downgrade and political dysfunction over the debt ceiling, and a sharp fall in Chinese property transactions and in the purchasing managers index (PMI). Rolling Arab revolutions, Libya's civil war, and the growing anti-business-as-usual overtones of the global Occupy Wall Street movements further dampened confidence. Market volatility shot up sharply in August and remained elevated through year-end. Under a fragile world economy and an extremely heated and highly fractioned political backdrop, investors were whipsawed on the global equity market roller coaster, with violent movements to the upside and downside on the back of political indecision and rapid shifts in sentiment.
• We believe that the Great Financial Crisis of 2008-2009 marked the end of both the debt super cycle and the extra-long, central bank-managed economic cycles. Many feared both in the summer of 2010 and the summer of 2011 that the U.S. and Europe were on the verge of double-dip recessions. While positive credit and labor market data in the fourth quarter suggests that the U.S. has skirted a recession, "peripheral" European and Chinese growth indicators have lagged. Developments in both regions present significant hurdles to global growth. Europe has just begun a recession that is likely to intensify in coming quarters, as banks de-leverage and sovereigns implement significant fiscal tightening (estimated at 2% of GDP growth). In China, declining residential real estate demand and falling property prices as a result of restrictive property sector regulations may have a serious impact on growth. If the recent weakness in the property demand and prices of major cities spreads to the smaller, but more numerous, lower tier cities, China could have difficulty managing a soft landing. As optimists, we highlight the U.S. economic resilience, the continued growth potential of China, and the tendency of policymakers to do the right thing when all else has failed. However, there is a non-trivial chance of an economic and financial unwinding, apocalyptic scenario.
• We imagine that the apocalyptic scenario would entail the following events. In the months ahead, the Europeans still do not implement a plausible game plan to resolve their sovereign crisis, potentially resulting in Greece having a disorderly default, French debt being downgraded (Standard & Poor's did cut France's credit rating by one notch after the close of the reporting period), Italy and Spain being unable to rollover their maturing debt, and the euro as we know it
11
2011 Annual Report
December 31, 2011
Investment Overview (unaudited) (cont'd)
Active International Allocation Portfolio
disappearing. The resulting disruption and bank freeze would severely deepen the recession already underway in Europe and would drag the U.S. and Chinese economies into sharp double-dip recessions. In a quasi-depressed and highly charged political environment, global capital would retreat within national borders, trade and corporate spending would dry up, and equity markets would once again test the lows of early 2009. While we do not put high odds on such a disorderly scenario (below 25%), other highly regarded investors, whose opinions we take into consideration, think the chances of such a scenario are more like 50-50.
• As we begin 2012, U.S. equities are as cheap versus Treasuries as they have been since the 1930s. Global equity valuations appear to be relatively inexpensive for a stable economic environment, in our view, but not discounted enough to withstand disappointment in global growth or policy. As this letter went to print, the fourth quarter 2011 earnings season was underway. Investors are listening to corporate expectations for 2012 very carefully and subsequently readjusting market multiples.
• On balance, we are wary, but not immediately bearish. The "gloom-and-doom" scenario we outlined above is well known and equity allocations in portfolios ranging from giant pension and sovereign wealth funds to hedge funds are relatively low. Progress in Europe, an easing of the tax/entitlement stalemate in the U.S., signs of a renewal in emerging markets, and improving data points suggest a moderate economic recovery could cause a major shift from current risk adverse sentiment.
• The current cash position in the Portfolio is roughly 4%, which seems prudent to us as political and economic event risk in Europe remains heightened during the first quarter. While we do not neglect the potential for market rallies on the back of reasonable valuations and marginally better economic news, we do note that under the current environment of high levels of debt, skittish investors, limited policy options, as well as a very political year ahead, poor economic and financial market outcomes are quite possible.
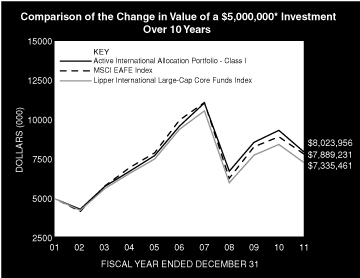
* Minimum Investment
In accordance with SEC regulations, Portfolio's performance shown assumes that all recurring fees (including management fees) were deducted and all dividends and distributions were reinvested. The performance of Class P shares will vary from the Class I shares based upon its different inception date and will be negatively impacted by additional fees assessed to that class.
Performance Compared to the Morgan Stanley Capital International (MSCI) EAFE Index(1) and the Lipper International Large-Cap Core Funds Index(2)
| | | Period Ended December 31, 2011 | |
| | | Total Returns(3) | |
| | | | | Average Annual | |
| | | One
Year | | Five
Years | | Ten
Years | | Since
Inception(6) | |
Portfolio — Class I Shares
w/o sales charges(4) | | | –14.56 | % | | | –3.66 | % | | | 4.84 | % | | | 5.36 | % | |
| MSCI EAFE Index | | | –12.14 | | | | –4.72 | | | | 4.67 | | | | 4.82 | | |
Lipper International Large-Cap
Core Funds Index | | | –13.56 | | | | –4.96 | | | | 3.91 | | | | 5.92 | | |
Portfolio — Class P Shares
w/o sales charges(5) | | | –14.75 | | | | –3.90 | | | | 4.57 | | | | 4.35 | | |
| MSCI EAFE Index | | | –12.14 | | | | –4.72 | | | | 4.67 | | | | 3.55 | | |
Lipper International Large-Cap
Core Funds Index | | | –13.56 | | | | –4.96 | | | | 3.91 | | | | 4.65 | | |
Performance data quoted represents past performance, which is no guarantee of future results, and current performance may be lower or higher than the figures shown. Performance assumes that all dividends and distributions, if any, were reinvested. For the most recent month-end performance figures, please visit www.morganstanley.com/im. Investment return and principal value will fluctuate so that Portfolio shares, when redeemed, may be worth more or less than their original cost. Total returns do not reflect the deduction of taxes that a shareholder would pay on Portfolio distributions or the redemption of Portfolio shares. Performance of share classes will vary due to difference in expenses.
12
2011 Annual Report
December 31, 2011
Investment Overview (unaudited) (cont'd)
Active International Allocation Portfolio
(1) The Morgan Stanley Capital International (MSCI) EAFE Index (Europe, Australasia, Far East) is a free float-adjusted market capitalization index that is designed to measure the international equity market performance of developed markets, excluding the US & Canada. The term "free float" represents the portion of shares outstanding that are deemed to be available for purchase in the public equity markets by investors. The MSCI EAFE Index currently consists of 22 developed market country indices. The performance of the Index is listed in U.S. dollars and assumes reinvestment of net dividends. The Index is unmanaged and its returns do not include any sales charges or fees. Such costs would lower performance. It is not possible to invest directly in an index.
(2) The Lipper International Large-Cap Core Funds Index is an equally weighted performance index of the largest qualifying funds (based on net assets) in the Lipper International Large-Cap Core Funds classification. The Index, which is adjusted for capital gains distributions and income dividends, is unmanaged and should not be considered an investment. There are currently 30 funds represented in this Index. As of the date of this report, the Portfolio was in the Lipper International Large-Cap Core Funds classification.
(3) Total returns for the Portfolio reflect fees waived and expenses reimbursed, if applicable, by the Adviser. Without such waivers and reimbursements, total returns would have been lower. The fee waivers and/or expense reimbursements will continue for one year or until such time as the Fund's Board of Directors acts to discontinue all or a portion of such waivers and/or expense reimbursements when it deems that such action is appropriate.
(4) Commenced operations on January 17, 1992.
(5) Commenced offering on January 2, 1996.
(6) For comparative purposes, average annual since inception returns listed for the Indexes refer to the inception date or initial offering of the respective share class of the Portfolio, not the inception of the Index.
Portfolio Composition*
| Classification | | Percentage of
Total Investments | |
| Other** | | | 61.5 | % | |
| Investment Company | | | 9.7 | | |
| Pharmaceuticals | | | 8.5 | | |
| Metals & Mining | | | 7.3 | | |
| Oil, Gas & Consumable Fuels | | | 7.1 | | |
| Commercial Banks | | | 5.9 | | |
| Total Investments | | | 100.0 | %*** | |
* Percentages indicated are based upon total investments (excluding Securities held as Collateral on Loaned Securities) as of December 31, 2011.
** Industries representing less than 5% of total investments.
*** Does not include open long/short futures contracts with an underlying face amount of approximately $26,968,000 and net unrealized depreciation of approximately $144,000. Also does not include open foreign currency exchange contracts with net unrealized depreciation of approximately $265,000.
13
2011 Annual Report
December 31, 2011
Portfolio of Investments
Active International Allocation Portfolio
| | | Shares | | Value
(000) | |
| Common Stocks (88.6%) | |
| Australia (3.9%) | |
| AGL Energy Ltd. | | | 4,864 | | | $ | 71 | | |
| Alumina Ltd. | | | 61,436 | | | | 70 | | |
| Amcor Ltd. | | | 32,344 | | | | 239 | | |
| AMP Ltd. | | | 20,428 | | | | 85 | | |
| ASX Ltd. | | | 896 | | | | 28 | | |
| Australia & New Zealand Banking Group Ltd. | | | 24,702 | | | | 519 | | |
| BHP Billiton Ltd. (a) | | | 128,952 | | | | 4,540 | | |
| Boral Ltd. (a) | | | 23,491 | | | | 86 | | |
| Brambles Ltd. | | | 12,583 | | | | 92 | | |
| Caltex Australia Ltd. | | | 3,825 | | | | 46 | | |
| Coca-Cola Amatil Ltd. | | | 5,977 | | | | 70 | | |
| Cochlear Ltd. (a) | | | 319 | | | | 20 | | |
| Commonwealth Bank of Australia (a) | | | 3,975 | | | | 200 | | |
| Computershare Ltd. | | | 2,767 | | | | 23 | | |
| CSL Ltd. | | | 4,636 | | | | 152 | | |
| CSR Ltd. (a) | | | 5,902 | | | | 12 | | |
| DuluxGroup Ltd. (a) | | | 14,641 | | | | 43 | | |
| Echo Entertainment Group Ltd. (b) | | | 4,938 | | | | 18 | | |
| Fortescue Metals Group Ltd. | | | 52,090 | | | | 227 | | |
| GPT Group REIT (Stapled Securities) (c) | | | 4,988 | | | | 16 | | |
| Incitec Pivot Ltd. | | | 65,003 | | | | 207 | | |
| Insurance Australia Group Ltd. | | | 16,506 | | | | 50 | | |
| James Hardie Industries SE CDI | | | 16,816 | | | | 117 | | |
| Leighton Holdings Ltd. (a) | | | 1,886 | | | | 37 | | |
| Macquarie Group Ltd. (a) | | | 2,367 | | | | 58 | | |
| Mirvac Group REIT (Stapled Securities) (a)(c)(d) | | | 8,147 | | | | 10 | | |
| National Australia Bank Ltd. (a) | | | 5,099 | | | | 122 | | |
| Newcrest Mining Ltd. | | | 61,509 | | | | 1,862 | | |
| OneSteel Ltd. | | | 32,592 | | | | 23 | | |
| Orica Ltd. | | | 14,276 | | | | 354 | | |
| Origin Energy Ltd. | | | 10,576 | | | | 144 | | |
| OZ Minerals Ltd. | | | 11,364 | | | | 116 | | |
| Perpetual Ltd. (a) | | | 315 | | | | 7 | | |
| Qantas Airways Ltd. (b) | | | 5,339 | | | | 8 | | |
| QBE Insurance Group Ltd. | | | 7,459 | | | | 99 | | |
| Rio Tinto Ltd. (a) | | | 10,857 | | | | 670 | | |
| Santos Ltd. | | | 6,289 | | | | 79 | | |
| Sims Metal Management Ltd. (a) | | | 6,190 | | | | 80 | | |
| Sonic Healthcare Ltd. | | | 2,599 | | | | 30 | | |
| Stockland REIT (Stapled Securities) (c)(d) | | | 8,391 | | | | 27 | | |
| Suncorp Group Ltd. (a) | | | 8,001 | | | | 69 | | |
| TABCORP Holdings Ltd. | | | 4,933 | | | | 14 | | |
| Telstra Corp, Ltd. | | | 34,266 | | | | 117 | | |
| Toll Holdings Ltd. (a) | | | 5,604 | | | | 24 | | |
| Transurban Group (Stapled Securities) (c) | | | 10,994 | | | | 63 | | |
| Treasury Wine Estates Ltd. | | | 6,561 | | | | 25 | | |
| Wesfarmers Ltd. | | | 8,383 | | | | 253 | | |
| Westfield Group REIT (Stapled Securities) (c)(d) | | | 10,520 | | | | 84 | | |
| Westfield Retail Trust REIT | | | 10,501 | | | | 27 | | |
| Westpac Banking Corp. (a) | | | 7,742 | | | | 158 | | |
| | | Shares | | Value
(000) | |
| Woodside Petroleum Ltd. | | | 6,199 | | | $ | 194 | | |
| Woolworths Ltd. | | | 11,881 | | | | 305 | | |
| WorleyParsons Ltd. | | | 926 | | | | 24 | | |
| | | | 12,014 | | |
| Austria (0.5%) | |
| Erste Group Bank AG | | | 11,823 | | | | 208 | | |
| OMV AG | | | 6,528 | | | | 198 | | |
| Raiffeisen Bank International AG (a) | | | 3,341 | | | | 87 | | |
| Telekom Austria AG | | | 32,532 | | | | 390 | | |
| Verbund AG (a) | | | 4,525 | | | | 122 | | |
Vienna Insurance Group AG Wiener
Versicherung Gruppe | | | 2,934 | | | | 116 | | |
| Voestalpine AG | | | 9,872 | | | | 278 | | |
| | | | 1,399 | | |
| Belgium (0.9%) | |
| Ageas | | | 12,628 | | | | 20 | | |
| Anheuser-Busch InBev N.V. | | | 26,825 | | | | 1,642 | | |
| Anheuser-Busch InBev N.V. VVPR (b) | | | 17,784 | | | | — | @ | |
| Belgacom SA | | | 6,959 | | | | 218 | | |
| Delhaize Group SA | | | 164 | | | | 9 | | |
| Groupe Bruxelles Lambert SA | | | 3,704 | | | | 247 | | |
| Mobistar SA | | | 96 | | | | 5 | | |
| Solvay SA, Class A | | | 2,263 | | | | 186 | | |
| UCB SA | | | 4,789 | | | | 202 | | |
| Umicore SA | | | 4,728 | | | | 195 | | |
| | | | 2,724 | | |
| Brazil (0.1%) | |
| All America Latina Logistica SA (Units) (d) | | | 10,200 | | | | 51 | | |
| Banco do Brasil SA | | | 8,100 | | | | 103 | | |
| BRF - Brasil Foods SA | | | 14,848 | | | | 290 | | |
| Cia Energetica de Minas Gerais (Preference) | | | 1 | | | | — | @ | |
| | | | 444 | | |
| Canada (1.3%) | |
| Agnico-Eagle Mines Ltd. (a) | | | 4,900 | | | | 178 | | |
| Barrick Gold Corp. | | | 28,100 | | | | 1,273 | | |
| Centerra Gold, Inc. | | | 5,000 | | | | 88 | | |
| Eldorado Gold Corp. | | | 15,700 | | | | 216 | | |
| Franco-Nevada Corp. | | | 3,800 | | | | 145 | | |
| Goldcorp, Inc. | | | 22,400 | | | | 994 | | |
| IAMGOLD Corp. | | | 10,600 | | | | 169 | | |
| Kinross Gold Corp. | | | 32,000 | | | | 365 | | |
| New Gold, Inc. (b) | | | 12,700 | | | | 128 | | |
| Osisko Mining Corp. (b) | | | 9,900 | | | | 96 | | |
| Yamana Gold, Inc. (a) | | | 21,700 | | | | 320 | | |
| | | | 3,972 | | |
| China (0.0%) | |
| China Merchants Holdings International Co., Ltd. (e) | | | 29 | | | | — | @ | |
| Skyworth Digital Holdings Ltd. (a)(e) | | | 114 | | | | — | @ | |
| | | | — | @ | |
The accompanying notes are an integral part of the financial statements.
14
2011 Annual Report
December 31, 2011
Portfolio of Investments (cont'd)
Active International Allocation Portfolio
| | | Shares | | Value
(000) | |
| Denmark (1.2%) | |
| AP Moller - Maersk A/S Series B | | | 80 | | | $ | 528 | | |
| DSV A/S | | | 13,027 | | | | 234 | | |
| Novo Nordisk A/S Series B | | | 21,308 | | | | 2,449 | | |
| Novozymes A/S Series B | | | 13,415 | | | | 414 | | |
| TDC A/S | | | 1,320 | | | | 11 | | |
| Vestas Wind Systems A/S (b) | | | 9,396 | | | | 101 | | |
| | | | 3,737 | | |
| Finland (0.8%) | |
| Elisa Oyj (a) | | | 268 | | | | 6 | | |
| Fortum Oyj | | | 18,201 | | | | 388 | | |
| Kesko Oyj, Class B | | | 10,179 | | | | 342 | | |
| Kone Oyj, Class B | | | 5,707 | | | | 296 | | |
| Metso Oyj | | | 6,139 | | | | 228 | | |
| Neste Oil Oyj | | | 3,925 | | | | 40 | | |
| Nokia Oyj | | | 72,648 | | | | 355 | | |
| Sampo Oyj, Class A | | | 10,536 | | | | 261 | | |
| Stora Enso Oyj, Class R | | | 27,433 | | | | 164 | | |
| UPM-Kymmene Oyj | | | 23,485 | | | | 259 | | |
| Wartsila Oyj | | | 5,505 | | | | 159 | | |
| | | | 2,498 | | |
| France (4.3%) | |
| Accor SA | | | 3,759 | | | | 95 | | |
| Air Liquide SA | | | 4,261 | | | | 527 | | |
| Alcatel-Lucent (a)(b) | | | 10,323 | | | | 16 | | |
| Alstom SA | | | 11,339 | | | | 344 | | |
| ArcelorMittal | | | 13,431 | | | | 246 | | |
| AtoS | | | 497 | | | | 22 | | |
| AXA SA | | | 19,570 | | | | 254 | | |
| BNP Paribas SA | | | 9,067 | | | | 356 | | |
| Bouygues SA (a) | | | 10,509 | | | | 331 | | |
| Cap Gemini SA | | | 3,035 | | | | 95 | | |
| Carrefour SA | | | 19,578 | | | | 446 | | |
| Casino Guichard Perrachon SA | | | 2,469 | | | | 208 | | |
| Cie de St-Gobain | | | 4,086 | | | | 157 | | |
| Cie Generale d'Optique Essilor International SA | | | 5,321 | | | | 376 | | |
| Cie Generale de Geophysique-Veritas (b) | | | 10,908 | | | | 256 | | |
| Cie Generale des Etablissements Michelin Series B | | | 995 | | | | 59 | | |
| CNP Assurances | | | 3,726 | | | | 46 | | |
| Credit Agricole SA | | | 5,762 | | | | 33 | | |
| Danone | | | 13,703 | | | | 861 | | |
| Dassault Systemes SA | | | 1,201 | | | | 96 | | |
| Edenred | | | 3,759 | | | | 93 | | |
| EDF SA | | | 109 | | | | 3 | | |
| Eurazeo | | | 539 | | | | 19 | | |
| European Aeronautic Defence and Space Co. N.V. | | | 2,580 | | | | 81 | | |
| Fonciere Des Regions REIT | | | 487 | | | | 31 | | |
| France Telecom SA | | | 29,891 | | | | 469 | | |
| GDF Suez | | | 6,735 | | | | 184 | | |
| Gecina SA REIT | | | 392 | | | | 33 | | |
| Hermes International (a) | | | 307 | | | | 92 | | |
| ICADE REIT (a) | | | 411 | | | | 32 | | |
| | | Shares | | Value
(000) | |
| Imerys SA | | | 465 | | | $ | 21 | | |
| Klepierre REIT | | | 1,814 | | | | 52 | | |
| L'Oreal SA | | | 1,106 | | | | 116 | | |
| Lafarge SA (a) | | | 7,873 | | | | 277 | | |
| Lagardere SCA | | | 3,184 | | | | 84 | | |
| Legrand SA | | | 424 | | | | 14 | | |
| LVMH Moet Hennessy Louis Vuitton SA | | | 1,187 | | | | 168 | | |
| Neopost SA (a) | | | 251 | | | | 17 | | |
| Pernod-Ricard SA | | | 671 | | | | 62 | | |
| Peugeot SA | | | 1,160 | | | | 18 | | |
| PPR | | | 907 | | | | 130 | | |
| Publicis Groupe SA | | | 1,545 | | | | 71 | | |
| Renault SA | | | 1,136 | | | | 39 | | |
| Safran SA | | | 1,108 | | | | 33 | | |
| Sanofi | | | 21,970 | | | | 1,614 | | |
| Schneider Electric SA | | | 8,728 | | | | 460 | | |
| SCOR SE | | | 2,725 | | | | 64 | | |
| Societe BIC SA | | | 586 | | | | 52 | | |
| Societe Generale SA | | | 5,183 | | | | 115 | | |
| Societe Television Francaise 1 | | | 3,828 | | | | 37 | | |
| Sodexo | | | 1,806 | | | | 130 | | |
| STMicroelectronics N.V. | | | 13,202 | | | | 78 | | |
| Suez Environnement Co. | | | 817 | | | | 9 | | |
| Technip SA | | | 4,733 | | | | 445 | | |
| Thales SA (a) | | | 1,159 | | | | 37 | | |
| Total SA | | | 45,255 | | | | 2,314 | | |
| Unibail-Rodamco SE REIT | | | 1,726 | | | | 310 | | |
| Vallourec SA | | | 1,220 | | | | 79 | | |
| Veolia Environnement SA | | | 6,388 | | | | 70 | | |
| Vinci SA | | | 7,207 | | | | 315 | | |
| Vivendi SA | | | 16,686 | | | | 365 | | |
| | | | 13,457 | | |
| Germany (6.5%) | |
| Adidas AG | | | 1,929 | | | | 125 | | |
| Allianz SE (Registered) | | | 9,957 | | | | 952 | | |
| Axel Springer AG (a) | | | 200 | | | | 9 | | |
| BASF SE | | | 25,309 | | | | 1,765 | | |
| Bayer AG (Registered) | | | 26,024 | | | | 1,664 | | |
| Bayerische Motoren Werke AG | | | 276 | | | | 19 | | |
| Beiersdorf AG | | | 2,162 | | | | 123 | | |
| Celesio AG | | | 3,968 | | | | 63 | | |
| Commerzbank AG (a)(b) | | | 10,234 | | | | 17 | | |
| Continental AG (b) | | | 731 | | | | 46 | | |
| Daimler AG (Registered) | | | 18,430 | | | | 809 | | |
| Deutsche Bank AG (Registered) | | | 16,744 | | | | 638 | | |
| Deutsche Boerse AG (b) | | | 1,776 | | | | 93 | | |
| Deutsche Lufthansa AG (Registered) | | | 9,297 | | | | 111 | | |
| Deutsche Post AG (Registered) | | | 31,565 | | | | 485 | | |
| Deutsche Telekom AG (Registered) | | | 110,382 | | | | 1,266 | | |
| E.ON AG | | | 74,947 | | | | 1,617 | | |
| Fresenius Medical Care AG & Co. KGaA | | | 9,132 | | | | 621 | | |
| GEA Group AG | | | 4,471 | | | | 126 | | |
The accompanying notes are an integral part of the financial statements.
15
2011 Annual Report
December 31, 2011
Portfolio of Investments (cont'd)
Active International Allocation Portfolio
| | | Shares | | Value
(000) | |
| Germany (cont'd) | |
| Hannover Rueckversicherung AG | | | 194 | | | $ | 10 | | |
| Henkel AG & Co. KGaA (Preference) | | | 3,203 | | | | 185 | | |
| Hochtief AG | | | 2,409 | | | | 139 | | |
| K&S AG (Registered) | | | 2,249 | | | | 102 | | |
| Lanxess AG | | | 1,805 | | | | 93 | | |
| Linde AG | | | 3,164 | | | | 471 | | |
| MAN SE | | | 236 | | | | 21 | | |
| Merck KGaA | | | 1,765 | | | | 176 | | |
| Metro AG | | | 12,088 | | | | 441 | | |
| Muenchener Rueckversicherungs AG (Registered) | | | 4,325 | | | | 531 | | |
| Porsche Automobil Holding SE (Preference) | | | 2,748 | | | | 147 | | |
| ProSiebenSat.1 Media AG | | | 355 | | | | 6 | | |
| Puma SE (a) | | | 90 | | | | 26 | | |
| RWE AG | | | 11,421 | | | | 401 | | |
| RWE AG (Preference) | | | 877 | | | | 29 | | |
| SAP AG | | | 40,422 | | | | 2,137 | | |
| Siemens AG (Registered) | | | 40,781 | | | | 3,903 | | |
| ThyssenKrupp AG | | | 7,875 | | | | 181 | | |
| Volkswagen AG | | | 2,553 | | | | 342 | | |
| Volkswagen AG (Preference) | | | 2,295 | | | | 344 | | |
| | | | 20,234 | | |
| Hong Kong (0.0%) | |
| Henderson Land Development Co., Ltd. (a) | | | 164 | | | | 1 | | |
| Hong Kong Exchanges and Clearing Ltd. (a) | | | 187 | | | | 3 | | |
| | | | 4 | | |
| Indonesia (0.3%) | |
| Adaro Energy Tbk PT | | | 98,000 | | | | 19 | | |
| Astra International Tbk PT | | | 18,500 | | | | 151 | | |
| Bank Central Asia Tbk PT | | | 112,500 | | | | 99 | | |
| Bank Danamon Indonesia Tbk PT | | | 28,500 | | | | 13 | | |
| Bank Mandiri Tbk PT | | | 86,000 | | | | 64 | | |
| Bank Negara Indonesia Persero Tbk PT | | | 73,500 | | | | 31 | | |
| Bank Rakyat Indonesia Persero Tbk PT | | | 103,500 | | | | 77 | | |
| Bumi Resources Tbk PT | | | 170,000 | | | | 41 | | |
| Charoen Pokphand Indonesia Tbk PT | | | 79,000 | | | | 19 | | |
| Golden Agri-Resources Ltd. | | | 184,315 | | | | 102 | | |
| Gudang Garam Tbk PT | | | 5,500 | | | | 38 | | |
| Indo Tambangraya Megah PT | | | 4,100 | | | | 18 | | |
| Indocement Tunggal Prakarsa Tbk PT | | | 13,500 | | | | 25 | | |
| Indofood Sukses Makmur Tbk PT | | | 42,500 | | | | 22 | | |
| Kalbe Farma Tbk PT | | | 48,500 | | | | 18 | | |
| Perusahaan Gas Negara PT | | | 100,500 | | | | 35 | | |
| Semen Gresik Persero Tbk PT | | | 33,500 | | | | 42 | | |
| Tambang Batubara Bukit Asam Tbk PT | | | 8,000 | | | | 15 | | |
| Telekomunikasi Indonesia Tbk PT | | | 90,500 | | | | 70 | | |
| Unilever Indonesia Tbk PT | | | 13,000 | | | | 27 | | |
| United Tractors Tbk PT | | | 15,984 | | | | 46 | | |
| | | | 972 | | |
| Ireland (0.0%) | |
| CRH PLC | | | 1,158 | | | | 23 | | |
| Italy (0.2%) | |
| Enel SpA | | | 15,011 | | | | 61 | | |
| | | Shares | | Value
(000) | |
| Eni SpA | | | 6,448 | | | $ | 134 | | |
| Exor SpA | | | 3,550 | | | | 71 | | |
| Saipem SpA | | | 9,857 | | | | 419 | | |
| | | | 685 | | |
| Japan (23.9%) | |
| Advantest Corp. | | | 8,290 | | | | 79 | | |
| Aeon Credit Service Co., Ltd. (a) | | | 2,300 | | | | 36 | | |
| Aeon Mall Co., Ltd. | | | 14,900 | | | | 316 | | |
| Aisin Seiki Co., Ltd. | | | 10,300 | | | | 294 | | |
| Amada Co., Ltd. | | | 9,000 | | | | 57 | | |
| Asahi Glass Co., Ltd. (a) | | | 37,800 | | | | 317 | | |
| Asahi Group Holdings Ltd. (a) | | | 17,200 | | | | 378 | | |
| Asahi Kasei Corp. | | | 50,000 | | | | 301 | | |
| Astellas Pharma, Inc. | | | 19,100 | | | | 777 | | |
| Bank of Kyoto Ltd. (The) (a) | | | 7,000 | | | | 60 | | |
| Bank of Yokohama Ltd. (The) | | | 46,000 | | | | 218 | | |
| Benesse Holdings, Inc. | | | 2,400 | | | | 116 | | |
| Bridgestone Corp. (a) | | | 56,700 | | | | 1,285 | | |
| Canon, Inc. (a) | | | 35,100 | | | | 1,555 | | |
| Casio Computer Co., Ltd. (a) | | | 14,600 | | | | 89 | | |
| Central Japan Railway Co. | | | 55 | | | | 464 | | |
| Chiba Bank Ltd. (The) (a) | | | 18,000 | | | | 116 | | |
| Chubu Electric Power Co., Inc. | | | 10,300 | | | | 192 | | |
| Chugai Pharmaceutical Co., Ltd. (a) | | | 9,500 | | | | 157 | | |
| Citizen Holdings Co., Ltd. | | | 16,800 | | | | 98 | | |
| Credit Saison Co., Ltd. | | | 3,100 | | | | 62 | | |
| Dai Nippon Printing Co., Ltd. (a) | | | 16,600 | | | | 160 | | |
| Daicel Corp | | | 8,000 | | | | 49 | | |
| Daiichi Sankyo Co., Ltd. | | | 51,100 | | | | 1,013 | | |
| Daikin Industries Ltd. | | | 13,300 | | | | 364 | | |
| Daito Trust Construction Co., Ltd. | | | 4,200 | | | | 360 | | |
| Daiwa House Industry Co., Ltd. | | | 26,600 | | | | 317 | | |
| Daiwa Securities Group, Inc. | | | 61,000 | | | | 190 | | |
| Denki Kagaku Kogyo KK | | | 21,000 | | | | 78 | | |
| Denso Corp. | | | 47,850 | | | | 1,322 | | |
| East Japan Railway Co. | | | 13,700 | | | | 872 | | |
| Eisai Co., Ltd. (a) | | | 9,100 | | | | 377 | | |
| FamilyMart Co., Ltd. | | | 7,096 | | | | 287 | | |
| Fanuc Corp. | | | 10,100 | | | | 1,546 | | |
| Fast Retailing Co., Ltd. | | | 6,400 | | | | 1,164 | | |
| Fuji Electric Co., Ltd. (a) | | | 8,000 | | | | 22 | | |
| FUJIFILM Holdings Corp. | | | 38,100 | | | | 902 | | |
| Fujitsu Ltd. | | | 147,200 | | | | 765 | | |
| Fukuoka Financial Group, Inc. | | | 26,000 | | | | 109 | | |
| Furukawa Electric Co., Ltd. | | | 18,800 | | | | 43 | | |
| GS Yuasa Corp. (a) | | | 28,000 | | | | 151 | | |
| Hirose Electric Co., Ltd. (a) | | | 1,200 | | | | 105 | | |
| Hisamitsu Pharmaceutical Co., Inc. (a) | | | 2,600 | | | | 110 | | |
| Hitachi Construction Machinery Co., Ltd. (a) | | | 13,600 | | | | 229 | | |
| Hitachi Ltd. | | | 142,000 | | | | 745 | | |
| Hokkaido Electric Power Co., Inc. | | | 2,200 | | | | 31 | | |
| Hokuhoku Financial Group, Inc. | | | 48,000 | | | | 94 | | |
The accompanying notes are an integral part of the financial statements.
16
2011 Annual Report
December 31, 2011
Portfolio of Investments (cont'd)
Active International Allocation Portfolio
| | | Shares | | Value
(000) | |
| Japan (cont'd) | |
| Honda Motor Co., Ltd. (a) | | | 76,104 | | | $ | 2,322 | | |
| Hoya Corp. | | | 17,500 | | | | 377 | | |
| Ibiden Co., Ltd. | | | 11,500 | | | | 227 | | |
| IHI Corp. (a) | | | 36,000 | | | | 87 | | |
| Inpex Corp. | | | 95 | | | | 599 | | |
| ITOCHU Corp. | | | 67,500 | | | | 686 | | |
| Itochu Techno-Solutions Corp. (a) | | | 1,800 | | | | 81 | | |
| Japan Real Estate Investment Corp. REIT | | | 26 | | | | 203 | | |
| Japan Retail Fund Investment Corp. REIT | | | 81 | | | | 120 | | |
| Japan Tobacco, Inc. | | | 171 | | | | 804 | | |
| JFE Holdings, Inc. | | | 24,300 | | | | 440 | | |
| JGC Corp. | | | 28,000 | | | | 672 | | |
| Joyo Bank Ltd. (The) (a) | | | 35,000 | | | | 155 | | |
| JS Group Corp. | | | 7,500 | | | | 144 | | |
| JSR Corp. | | | 6,200 | | | | 114 | | |
| JX Holdings, Inc. | | | 90,546 | | | | 547 | | |
| Kajima Corp. (a) | | | 39,400 | | | | 121 | | |
| Kaneka Corp. (a) | | | 10,000 | | | | 53 | | |
| Kansai Electric Power Co., Inc. (The) | | | 14,700 | | | | 226 | | |
| Kawasaki Heavy Industries Ltd. (a) | | | 34,000 | | | | 85 | | |
| Kawasaki Kisen Kaisha Ltd. (a) | | | 143,000 | | | | 258 | | |
| Keikyu Corp. (a) | | | 15,000 | | | | 135 | | |
| Keio Corp. (a) | | | 9,000 | | | | 63 | | |
| Keyence Corp. | | | 3,430 | | | | 827 | | |
| Kintetsu Corp. (a) | | | 64,200 | | | | 251 | | |
| Kirin Holdings Co., Ltd. (a) | | | 34,000 | | | | 413 | | |
| Kobe Steel Ltd. | | | 80,000 | | | | 124 | | |
| Komatsu Ltd. | | | 55,500 | | | | 1,297 | | |
| Konami Corp. (a) | | | 4,800 | | | | 144 | | |
| Konica Minolta Holdings, Inc. | | | 19,500 | | | | 145 | | |
| Kubota Corp. (a) | | | 77,000 | | | | 645 | | |
| Kuraray Co., Ltd. | | | 14,000 | | | | 199 | | |
| Kurita Water Industries Ltd. (a) | | | 2,200 | | | | 57 | | |
| Kyocera Corp. | | | 12,700 | | | | 1,021 | | |
| Kyushu Electric Power Co., Inc. | | | 6,400 | | | | 92 | | |
| Mabuchi Motor Co., Ltd. (a) | | | 5,100 | | | | 212 | | |
| Makita Corp. | | | 4,000 | | | | 129 | | |
| Marubeni Corp. | | | 63,000 | | | | 384 | | |
| Mitsubishi Chemical Holdings Corp. (a) | | | 54,000 | | | | 297 | | |
| Mitsubishi Corp. | | | 66,900 | | | | 1,352 | | |
| Mitsubishi Electric Corp. | | | 115,800 | | | | 1,110 | | |
| Mitsubishi Estate Co., Ltd. | | | 60,000 | | | | 896 | | |
| Mitsubishi Heavy Industries Ltd. | | | 109,000 | | | | 464 | | |
| Mitsubishi Logistics Corp. | | | 4,000 | | | | 44 | | |
| Mitsubishi Materials Corp. | | | 77,000 | | | | 209 | | |
| Mitsubishi Tanabe Pharma Corp. | | | 9,900 | | | | 157 | | |
| Mitsubishi UFJ Financial Group, Inc. (See Note G-2) | | | 239,546 | | | | 1,018 | | |
| Mitsui & Co., Ltd. | | | 54,500 | | | | 848 | | |
| Mitsui Chemicals, Inc. (a) | | | 21,000 | | | | 64 | | |
| Mitsui Fudosan Co., Ltd. | | | 42,400 | | | | 618 | | |
| Mitsui OSK Lines Ltd. | | | 55,000 | | | | 213 | | |
| Mizuho Financial Group, Inc. | | | 579,900 | | | | 784 | | |
| MS&AD Insurance Group Holdings | | | 12,160 | | | | 225 | | |
| Murata Manufacturing Co., Ltd. (a) | | | 8,500 | | | | 437 | | |
| | | Shares | | Value
(000) | |
| Nabtesco Corp. (a) | | | 7,500 | | | $ | 137 | | |
| NEC Corp. (b) | | | 100,400 | | | | 203 | | |
| NGK Insulators Ltd. | | | 22,600 | | | | 268 | | |
| NGK Spark Plug Co., Ltd. | | | 8,000 | | | | 99 | | |
| Nidec Corp. | | | 3,400 | | | | 296 | | |
| Nikon Corp. | | | 11,600 | | | | 258 | | |
| Nintendo Co., Ltd. | | | 5,200 | | | | 716 | | |
| Nippon Building Fund, Inc. REIT | | | 29 | | | | 237 | | |
| Nippon Electric Glass Co., Ltd. | | | 31,500 | | | | 312 | | |
| Nippon Express Co., Ltd. | | | 33,800 | | | | 132 | | |
| Nippon Paper Group, Inc. (a) | | | 3,700 | | | | 81 | | |
| Nippon Sheet Glass Co., Ltd. | | | 16,000 | | | | 30 | | |
| Nippon Steel Corp. (a) | | | 355,000 | | | | 886 | | |
| Nippon Telegraph & Telephone Corp. | | | 10,600 | | | | 542 | | |
| Nippon Yusen KK (a) | | | 43,000 | | | | 110 | | |
| Nishi-Nippon City Bank Ltd. (The) | | | 18,000 | | | | 52 | | |
| Nissan Motor Co., Ltd. (a) | | | 103,600 | | | | 931 | | |
| Nitto Denko Corp. (a) | | | 8,300 | | | | 297 | | |
| NKSJ Holdings, Inc. | | | 7,700 | | | | 151 | | |
| Nomura Holdings, Inc. | | | 86,400 | | | | 262 | | |
| Nomura Research Institute Ltd. | | | 5,900 | | | | 133 | | |
| NSK Ltd. | | | 22,000 | | | | 143 | | |
| NTN Corp. | | | 16,000 | | | | 64 | | |
| NTT Data Corp. | | | 64 | | | | 204 | | |
| NTT DoCoMo, Inc. | | | 144 | | | | 265 | | |
| Obayashi Corp. | | | 26,000 | | | | 116 | | |
| OJI Paper Co., Ltd. (a) | | | 102,400 | | | | 525 | | |
| Omron Corp. (a) | | | 19,000 | | | | 382 | | |
| Ono Pharmaceutical Co., Ltd. | | | 3,300 | | | | 185 | | |
| Oracle Corp. Japan | | | 1,900 | | | | 63 | | |
| Oriental Land Co., Ltd. (a) | | | 2,500 | | | | 264 | | |
| ORIX Corp. (a) | | | 470 | | | | 39 | | |
| Osaka Gas Co., Ltd. | | | 38,600 | | | | 152 | | |
| Otsuka Holdings Co. Ltd. | | | 10,000 | | | | 281 | | |
| Panasonic Corp. (a) | | | 118,800 | | | | 1,009 | | |
| Resona Holdings, Inc. | | | 12,400 | | | | 55 | | |
| Rohm Co., Ltd. | | | 6,000 | | | | 280 | | |
| Santen Pharmaceutical Co. Ltd. | | | 3,200 | | | | 132 | | |
| SBI Holdings, Inc. | | | 383 | | | | 28 | | |
| Secom Co., Ltd. | | | 6,400 | | | | 295 | | |
| Seiko Epson Corp. (a) | | | 19,400 | | | | 258 | | |
| Sekisui Chemical Co., Ltd. | | | 18,000 | | | | 148 | | |
| Sekisui House Ltd. | | | 38,600 | | | | 343 | | |
| Seven & I Holdings Co., Ltd. | | | 21,500 | | | | 599 | | |
| Sharp Corp. (a) | | | 31,200 | | | | 273 | | |
| Shimamura Co., Ltd. | | | 900 | | | | 92 | | |
| Shimano, Inc. (a) | | | 7,800 | | | | 379 | | |
| Shimizu Corp. (a) | | | 27,600 | | | | 116 | | |
| Shin-Etsu Chemical Co., Ltd. | | | 25,496 | | | | 1,255 | | |
| Shinsei Bank Ltd. | | | 43,000 | | | | 45 | | |
| Shionogi & Co., Ltd. | | | 12,300 | | | | 158 | | |
| Shiseido Co., Ltd. (a) | | | 15,600 | | | | 287 | | |
| Shizuoka Bank Ltd. (The) (a) | | | 16,000 | | | | 169 | | |
| Showa Denko KK (a) | | | 31,000 | | | | 63 | | |
The accompanying notes are an integral part of the financial statements.
17
2011 Annual Report
December 31, 2011
Portfolio of Investments (cont'd)
Active International Allocation Portfolio
| | | Shares | | Value
(000) | |
| Japan (cont'd) | |
| Showa Shell Sekiyu KK (a) | | | 7,500 | | | $ | 51 | | |
| SMC Corp. | | | 3,800 | | | | 613 | | |
| Softbank Corp. | | | 51,800 | | | | 1,526 | | |
| Sony Corp. | | | 40,497 | | | | 727 | | |
| Stanley Electric Co., Ltd. | | | 17,900 | | | | 263 | | |
| Sumitomo Chemical Co., Ltd. (a) | | | 55,600 | | | | 203 | | |
| Sumitomo Corp. | | | 32,700 | | | | 443 | | |
| Sumitomo Electric Industries Ltd. | | | 20,500 | | | | 223 | | |
| Sumitomo Heavy Industries Ltd. | | | 16,000 | | | | 93 | | |
| Sumitomo Metal Industries Ltd. | | | 284,000 | | | | 517 | | |
| Sumitomo Metal Mining Co., Ltd. | | | 62,800 | | | | 807 | | |
| Sumitomo Mitsui Financial Group, Inc. | | | 27,100 | | | | 755 | | |
| Sumitomo Mitsui Trust Holdings, Inc. | | | 148,544 | | | | 436 | | |
| Sumitomo Realty & Development Co., Ltd. | | | 18,000 | | | | 315 | | |
| Suzuki Motor Corp. | | | 17,500 | | | | 362 | | |
| Sysmex Corp. | | | 7,400 | | | | 241 | | |
| T&D Holdings, Inc. | | | 14,100 | | | | 131 | | |
| Taisei Corp. | | | 39,000 | | | | 99 | | |
| Takeda Pharmaceutical Co., Ltd. | | | 40,300 | | | | 1,770 | | |
| TDK Corp. | | | 5,200 | | | | 230 | | |
| Teijin Ltd. | | | 36,400 | | | | 112 | | |
| Terumo Corp. | | | 13,200 | | | | 622 | | |
| THK Co., Ltd. (a) | | | 1,600 | | | | 32 | | |
| Tobu Railway Co., Ltd. (a) | | | 33,400 | | | | 171 | | |
| Tohoku Electric Power Co., Inc. (a) | | | 8,700 | | | | 84 | | |
| Tokio Marine Holdings, Inc. | | | 32,252 | | | | 714 | | |
| Tokyo Electron Ltd. | | | 13,400 | | | | 682 | | |
| Tokyo Gas Co., Ltd. | | | 44,600 | | | | 205 | | |
| Tokyu Corp. (a) | | | 40,400 | | | | 199 | | |
| Tokyu Land Corp. | | | 31,000 | | | | 117 | | |
| TonenGeneral Sekiyu KK (a) | | | 14,000 | | | | 153 | | |
| Toppan Printing Co., Ltd. (a) | | | 16,600 | | | | 122 | | |
| Toray Industries, Inc. (a) | | | 49,100 | | | | 351 | | |
| Toshiba Corp. (a) | | | 170,000 | | | | 696 | | |
| Tosoh Corp. | | | 23,000 | | | | 62 | | |
| TOTO Ltd. | | | 15,600 | | | | 120 | | |
| Toyo Seikan Kaisha Ltd. | | | 8,000 | | | | 109 | | |
| Toyota Boshoku Corp. (a) | | | 9,700 | | | | 101 | | |
| Toyota Industries Corp. | | | 3,250 | | | | 88 | | |
| Toyota Motor Corp. | | | 52,800 | | | | 1,760 | | |
| Trend Micro, Inc. (a) | | | 4,800 | | | | 143 | | |
| Unicharm Corp. | | | 10,100 | | | | 498 | | |
| Ushio, Inc. | | | 1,600 | | | | 23 | | |
| USS Co., Ltd. | | | 1,250 | | | | 113 | | |
| West Japan Railway Co. | | | 1,900 | | | | 83 | | |
| Yahoo! Japan Corp. (a) | | | 763 | | | | 246 | | |
| Yakult Honsha Co., Ltd. (a) | | | 9,199 | | | | 290 | | |
| Yamada Denki Co., Ltd. (a) | | | 4,190 | | | | 285 | | |
| Yamaha Corp. | | | 5,100 | | | | 47 | | |
| Yamaha Motor Co., Ltd. | | | 1,800 | | | | 23 | | |
| Yamato Holdings Co., Ltd. | | | 10,600 | | | | 179 | | |
| Yokogawa Electric Corp. (a)(b) | | | 11,000 | | | | 99 | | |
| | | | 74,701 | | |
| | | Shares | | Value
(000) | |
| Korea, Republic of (1.2%) | |
| Amorepacific Corp. | | | 22 | | | $ | 20 | | |
| Cheil Industries, Inc. | | | 481 | | | | 42 | | |
| Daewoo Securities Co., Ltd. | | | 1,230 | | | | 11 | | |
Doosan Heavy Industries and
Construction Co., Ltd. | | | 646 | | | | 37 | | |
| E-Mart Co., Ltd. | | | 159 | | | | 38 | | |
| GS Engineering & Construction Corp. | | | 417 | | | | 34 | | |
| Hana Financial Group, Inc. | | | 1,290 | | | | 40 | | |
| Hynix Semiconductor, Inc. (b) | | | 3,060 | | | | 59 | | |
| Hyundai Engineering & Construction Co., Ltd. (b) | | | 500 | | | | 31 | | |
| Hyundai Heavy Industries Co., Ltd. | | | 284 | | | | 64 | | |
| Hyundai Mobis (b) | | | 397 | | | | 101 | | |
| Hyundai Motor Co. | | | 949 | | | | 176 | | |
| Hyundai Steel Co. (b) | | | 507 | | | | 42 | | |
| Industrial Bank of Korea (b) | | | 2,060 | | | | 22 | | |
| KB Financial Group, Inc. | | | 2,410 | | | | 76 | | |
| Kia Motors Corp. | | | 1,430 | | | | 83 | | |
| Korea Electric Power Corp. (b) | | | 1,710 | | | | 38 | | |
| Korea Exchange Bank | | | 3,450 | | | | 22 | | |
| Korean Air Lines Co., Ltd. (b) | | | 248 | | | | 9 | | |
| KT Corp. | | | 1,430 | | | | 44 | | |
| KT&G Corp. | | | 749 | | | | 53 | | |
| LG Chem Ltd. | | | 298 | | | | 83 | | |
| LG Corp. | | | 1,151 | | | | 62 | | |
| LG Display Co., Ltd. (b) | | | 1,520 | | | | 32 | | |
| LG Electronics, Inc. | | | 675 | | | | 44 | | |
| LG Household & Health Care Ltd. | | | 62 | | | | 26 | | |
| Lotte Shopping Co., Ltd. | | | 87 | | | | 26 | | |
| NCSoft Corp. | | | 104 | | | | 28 | | |
| NHN Corp. | | | 282 | | | | 52 | | |
| OCI Co., Ltd. (b) | | | 119 | | | | 23 | | |
| POSCO | | | 400 | | | | 132 | | |
| S-Oil Corp. | | | 490 | | | | 43 | | |
| Samsung C&T Corp. | | | 985 | | | | 59 | | |
| Samsung Electro-Mechanics Co., Ltd. | | | 391 | | | | 27 | | |
| Samsung Electronics Co., Ltd. | | | 1,696 | | | | 1,561 | | |
| Samsung Electronics Co., Ltd. (Preference) | | | 124 | | | | 72 | | |
| Samsung Engineering Co., Ltd. | | | 238 | | | | 42 | | |
| Samsung Fire & Marine Insurance Co., Ltd. | | | 256 | | | | 47 | | |
| Samsung Heavy Industries Co., Ltd. | | | 1,520 | | | | 37 | | |
| Samsung SDI Co., Ltd. | | | 244 | | | | 29 | | |
| Samsung Securities Co., Ltd. | | | 482 | | | | 21 | | |
| Samsung Techwin Co., Ltd. | | | 263 | | | | 12 | | |
| Shinhan Financial Group Co., Ltd. | | | 2,670 | | | | 93 | | |
| Shinsegae Co., Ltd. | | | 56 | | | | 12 | | |
| SK Innovation Co., Ltd. | | | 427 | | | | 53 | | |
| SK Telecom Co., Ltd. | | | 333 | | | | 41 | | |
| Woori Finance Holdings Co., Ltd. (b) | | | 1,590 | | | | 13 | | |
| | | | 3,712 | | |
| Malta (0.0%) | |
| BGP Holdings PLC (b)(f) | | | 72,261 | | | | — | | |
The accompanying notes are an integral part of the financial statements.
18
2011 Annual Report
December 31, 2011
Portfolio of Investments (cont'd)
Active International Allocation Portfolio
| | | Shares | | Value
(000) | |
| Mexico (0.6%) | |
| Alfa SAB de CV | | | 3,900 | | | $ | 42 | | |
| America Movil SAB de CV | | | 511,400 | | | | 578 | | |
| Cemex SAB de CV (Units) (b)(d) | | | 125,300 | | | | 66 | | |
| Fomento Economico Mexicano SAB de CV (Units) (d) | | | 28,700 | | | | 201 | | |
| Fresnillo PLC | | | 1,167 | | | | 28 | | |
| Grupo Bimbo SAB de CV | | | 24,000 | | | | 49 | | |
| Grupo Elektra SA de CV | | | 995 | | | | 100 | | |
| Grupo Financiero Banorte SAB de CV Series O | | | 21,300 | | | | 64 | | |
| Grupo Financiero Inbursa SA | | | 23,200 | | | | 43 | | |
| Grupo Mexico SAB de CV Series B | | | 49,928 | | | | 131 | | |
| Grupo Modelo SAB de CV | | | 8,900 | | | | 56 | | |
| Grupo Televisa SAB | | | 34,100 | | | | 144 | | |
| Industrias Penoles SAB de CV | | | 1,405 | | | | 62 | | |
| Kimberly-Clark de Mexico SAB de CV, Class A | | | 8,000 | | | | 43 | | |
| Mexichem SAB de CV | | | 11,100 | | | | 35 | | |
| Minera Frisco SAB de CV (b) | | | 8,500 | | | | 31 | | |
| Wal-Mart de Mexico SAB de CV Series V | | | 92,802 | | | | 255 | | |
| | | | 1,928 | | |
| Netherlands (3.5%) | |
| Aegon N.V. (b) | | | 56,151 | | | | 225 | | |
| Akzo Nobel N.V. (a) | | | 15,704 | | | | 759 | | |
| ASML Holding N.V. | | | 22,764 | | | | 957 | | |
| Corio N.V. REIT | | | 2,333 | | | | 102 | | |
| Fugro N.V. CVA | | | 2,618 | | | | 152 | | |
| Heineken N.V. | | | 13,278 | | | | 615 | | |
| ING Groep N.V. CVA (b) | | | 119,831 | | | | 862 | | |
| Koninklijke Ahold N.V. | | | 1,806 | | | | 24 | | |
| Koninklijke Boskalis Westminster N.V. | | | 166 | | | | 6 | | |
| Koninklijke DSM N.V. | | | 6,104 | | | | 283 | | |
| Koninklijke KPN N.V. | | | 111,174 | | | | 1,330 | | |
| Koninklijke Philips Electronics N.V. | | | 46,957 | | | | 990 | | |
| Randstad Holding N.V. | | | 275 | | | | 8 | | |
| Reed Elsevier N.V. | | | 41,257 | | | | 481 | | |
| SBM Offshore N.V. | | | 6,287 | | | | 130 | | |
| TNT Express N.V. | | | 35,304 | | | | 264 | | |
| Unilever N.V. CVA | | | 94,647 | | | | 3,255 | | |
| Wolters Kluwer N.V. | | | 27,716 | | | | 479 | | |
| | | | 10,922 | | |
| Norway (1.4%) | |
| Aker Solutions ASA | | | 3,994 | | | | 42 | | |
| DnB NOR ASA | | | 25,134 | | | | 246 | | |
| Gjensidige Forsikring ASA | | | 798 | | | | 9 | | |
| Norsk Hydro ASA | | | 39,166 | | | | 182 | | |
| Orkla ASA | | | 31,161 | | | | 233 | | |
| Statoil ASA | | | 37,537 | | | | 963 | | |
| Subsea 7 SA (a)(b) | | | 6,763 | | | | 126 | | |
| Telenor ASA | | | 93,562 | | | | 1,535 | | |
| Yara International ASA | | | 26,152 | | | | 1,049 | | |
| | | | 4,385 | | |
| | | Shares | | Value
(000) | |
| Philippines (0.7%) | |
| Aboitiz Equity Ventures, Inc. | | | 231,000 | | | $ | 212 | | |
| Aboitiz Power Corp. | | | 198,700 | | | | 136 | | |
| Alliance Global Group, Inc. | | | 438,900 | | | | 104 | | |
| Ayala Corp. | | | 24,096 | | | | 171 | | |
| Ayala Land, Inc. | | | 578,500 | | | | 201 | | |
| Bank of the Philippine Islands | | | 195,500 | | | | 247 | | |
| Energy Development Corp. | | | 840,000 | | | | 121 | | |
| Manila Electric Co. | | | 31,000 | | | | 175 | | |
| Metropolitan Bank & Trust | | | 115,200 | | | | 179 | | |
| Philippine Long Distance Telephone Co. | | | 5,120 | | | | 298 | | |
| SM Investments Corp. | | | 20,140 | | | | 269 | | |
| SM Prime Holdings, Inc. | | | 581,000 | | | | 177 | | |
| | | | 2,290 | | |
| Poland (0.9%) | |
| Asseco Poland SA | | | 5,048 | | | | 71 | | |
| Bank Pekao SA | | | 8,927 | | | | 365 | | |
| BRE Bank SA (b) | | | 1,130 | | | | 81 | | |
| Getin Holding SA (b) | | | 28,702 | | | | 59 | | |
| KGHM Polska Miedz SA | | | 10,362 | | | | 332 | | |
| PGE SA | | | 51,351 | | | | 308 | | |
| Polski Koncern Naftowy Orlen SA (b) | | | 25,504 | | | | 251 | | |
| Polskie Gornictwo Naftowe i Gazownictwo SA | | | 138,995 | | | | 164 | | |
| Powszechna Kasa Oszczednosci Bank Polski SA | | | 50,802 | | | | 473 | | |
| Powszechny Zaklad Ubezpieczen SA | | | 3,700 | | | | 331 | | |
| Synthos SA | | | 1,374 | | | | 2 | | |
| Tauron Polska Energia SA | | | 80,800 | | | | 125 | | |
| Telekomunikacja Polska SA | | | 53,058 | | | | 265 | | |
| | | | 2,827 | | |
| Portugal (0.0%) | |
| Cimpor Cimentos de Portugal SGPS SA | | | 1,085 | | | | 8 | | |
| Russia (0.4%) | |
| Gazprom OAO ADR | | | 48,606 | | | | 518 | | |
| Lukoil OAO ADR | | | 4,934 | | | | 261 | | |
| MMC Norilsk Nickel OJSC ADR | | | 7,892 | | | | 121 | | |
| Mobile Telesystems OJSC ADR (a) | | | 5,100 | | | | 75 | | |
| NovaTek OAO (Registered GDR) | | | 585 | | | | 73 | | |
| Rosneft Oil Co. (Registered GDR) | | | 16,411 | | | | 108 | | |
| Surgutneftegas OJSC ADR | | | 8,300 | | | | 66 | | |
| Tatneft ADR | | | 2,878 | | | | 85 | | |
| VTB Bank OJSC (Registered GDR) | | | 15,972 | | | | 58 | | |
| | | | 1,365 | | |
| Singapore (1.9%) | |
| Ascendas Real Estate Investment Trust REIT (a) | | | 60,000 | | | | 85 | | |
| CapitaLand Ltd. | | | 100,000 | | | | 170 | | |
| CapitaMall Trust REIT | | | 85,514 | | | | 112 | | |
| City Developments Ltd. | | | 22,741 | | | | 156 | | |
| ComfortDelGro Corp. Ltd. | | | 64,538 | | | | 70 | | |
| DBS Group Holdings Ltd. | | | 85,678 | | | | 761 | | |
| Fraser and Neave Ltd. | | | 42,000 | | | | 201 | | |
| Genting Singapore PLC (a)(b) | | | 284,000 | | | | 331 | | |
| Jardine Cycle & Carriage Ltd. | | | 3,034 | | | | 113 | | |
The accompanying notes are an integral part of the financial statements.
19
2011 Annual Report
December 31, 2011
Portfolio of Investments (cont'd)
Active International Allocation Portfolio
| | | Shares | | Value
(000) | |
| Singapore (cont'd) | |
| Keppel Corp., Ltd. | | | 60,500 | | | $ | 434 | | |
| Noble Group Ltd. | | | 100,090 | | | | 87 | | |
| Olam International Ltd. (a) | | | 15,000 | | | | 25 | | |
| Oversea-Chinese Banking Corp., Ltd. | | | 157,758 | | | | 952 | | |
| SembCorp Industries Ltd. | | | 44,183 | | | | 138 | | |
| SembCorp Marine Ltd. (a) | | | 40,000 | | | | 118 | | |
| Singapore Airlines Ltd. | | | 29,010 | | | | 227 | | |
| Singapore Exchange Ltd. | | | 24,581 | | | | 116 | | |
| Singapore Press Holdings Ltd. (a) | | | 34,083 | | | | 97 | | |
| Singapore Technologies Engineering Ltd. | | | 52,000 | | | | 108 | | |
| Singapore Telecommunications Ltd. | | | 309,115 | | | | 736 | | |
| United Overseas Bank Ltd. | | | 72,448 | | | | 853 | | |
| Wilmar International Ltd. (a) | | | 45,000 | | | | 173 | | |
| | | | 6,063 | | |
| South Africa (0.5%) | |
| SABMiller PLC | | | 44,312 | | | | 1,560 | | |
| Spain (0.2%) | |
| Abertis Infraestructuras SA | | | 1,245 | | | | 20 | | |
| Amadeus IT Holding SA, Class A | | | 700 | | | | 11 | | |
| Distribuidora Internacional de Alimentacion SA (a)(b) | | | 33,138 | | | | 150 | | |
| Iberdrola SA | | | 9,459 | | | | 59 | | |
| Repsol YPF SA | | | 1,968 | | | | 61 | | |
| Telefonica SA | | | 17,154 | | | | 297 | | |
| | | | 598 | | |
| Sweden (2.5%) | |
| Alfa Laval AB | | | 8,833 | | | | 167 | | |
| Assa Abloy AB, Series B | | | 8,838 | | | | 222 | | |
| Atlas Copco AB, Class A | | | 20,848 | | | | 448 | | |
| Atlas Copco AB, Class B | | | 11,467 | | | | 218 | | |
| Electrolux AB Series B | | | 2,711 | | | | 43 | | |
| Getinge AB, Class B | | | 11,829 | | | | 300 | | |
| Hennes & Mauritz AB, Class B | | | 31,727 | | | | 1,020 | | |
| Holmen AB, Class B | | | 1,793 | | | | 52 | | |
| Husqvarna AB, Class B | | | 2,711 | | | | 12 | | |
| Investor AB, Class B | | | 19,540 | | | | 365 | | |
| Lundin Petroleum AB (b) | | | 5,580 | | | | 137 | | |
| Nordea Bank AB | | | 71,635 | | | | 554 | | |
| Oriflame Cosmetics SA SDR (a) | | | 9,373 | | | | 296 | | |
| Sandvik AB | | | 33,130 | | | | 407 | | |
| Scania AB, Class B | | | 1,295 | | | | 19 | | |
| Securitas AB, Class B | | | 800 | | | | 7 | | |
| Skanska AB, Class B | | | 19,316 | | | | 320 | | |
| SKF AB, Class B | | | 10,403 | | | | 220 | | |
| SSAB AB, Class A | | | 7,094 | | | | 63 | | |
| Svenska Cellulosa AB, Class B | | | 20,989 | | | | 311 | | |
| Svenska Handelsbanken AB, Class A | | | 15,836 | | | | 416 | | |
| Swedish Match AB | | | 11,240 | | | | 399 | | |
| Tele2 AB, Class B | | | 8,263 | | | | 161 | | |
| Telefonaktiebolaget LM Ericsson, Class B | | | 55,403 | | | | 567 | | |
| TeliaSonera AB | | | 83,532 | | | | 568 | | |
| Volvo AB, Class A | | | 12,907 | | | | 142 | | |
| Volvo AB, Class B | | | 34,479 | | | | 377 | | |
| | | | 7,811 | | |
| | | Shares | | Value
(000) | |
| Switzerland (8.6%) | |
| ABB Ltd. (Registered) (b) | | | 106,353 | | | $ | 2,002 | | |
| Baloise-Holding AG (Registered) | | | 1,454 | | | | 100 | | |
| Cie Financiere Richemont SA | | | 6,054 | | | | 306 | | |
| Credit Suisse Group AG (Registered) (b) | | | 19,066 | | | | 448 | | |
| GAM Holding AG (b) | | | 11,678 | | | | 127 | | |
| Geberit AG (Registered) (b) | | | 989 | | | | 190 | | |
| Givaudan SA (Registered) (b) | | | 198 | | | | 189 | | |
| Holcim Ltd. (Registered) (b) | | | 6,542 | | | | 350 | | |
| Julius Baer Group Ltd. (b) | | | 5,987 | | | | 234 | | |
| Logitech International SA (Registered) (a)(b) | | | 2,992 | | | | 23 | | |
| Lonza Group AG (Registered) (b) | | | 1,199 | | | | 71 | | |
| Nestle SA (Registered) | | | 152,403 | | | | 8,762 | | |
| Novartis AG (Registered) | | | 81,315 | | | | 4,649 | | |
| Pargesa Holding SA | | | 377 | | | | 25 | | |
| Roche Holding AG (Genusschein) | | | 23,918 | | | | 4,054 | | |
| Schindler Holding AG | | | 1,720 | | | | 200 | | |
| Straumann Holding AG (Registered) | | | 484 | | | | 83 | | |
| Swatch Group AG (The) | | | 359 | | | | 134 | | |
| Swatch Group AG (The) (Registered) | | | 689 | | | | 46 | | |
| Swiss Life Holding AG (Registered) (b) | | | 609 | | | | 56 | | |
| Swiss Re AG (b) | | | 10,178 | | | | 519 | | |
| Swisscom AG (Registered) | | | 1,038 | | | | 393 | | |
| Syngenta AG (Registered) (b) | | | 6,458 | | | | 1,891 | | |
| Synthes, Inc. (Registered) (g) | | | 3,733 | | | | 626 | | |
| Transocean Ltd. | | | 1,443 | | | | 56 | | |
| UBS AG (Registered) (b) | | | 63,558 | | | | 756 | | |
| Zurich Financial Services AG (b) | | | 3,178 | | | | 719 | | |
| | | | 27,009 | | |
| Thailand (0.3%) | |
| Bangkok Bank PCL | | | 17,800 | | | | 87 | | |
| Bangkok Bank PCL (Foreign Registered) | | | 32,100 | | | | 167 | | |
| Bank of Ayudhya PCL (Foreign) | | | 71,500 | | | | 50 | | |
| Kasikornbank PCL | | | 22,600 | | | | 87 | | |
| Kasikornbank PCL (Foreign) | | | 44,100 | | | | 174 | | |
| Krung Thai Bank PCL | | | 99,100 | | | | 47 | | |
| Siam Commercial Bank PCL (Foreign) | | | 57,700 | | | | 210 | | |
| | | | 822 | | |
| United Kingdom (21.8%) | |
| 3i Group PLC | | | 16,093 | | | | 45 | | |
| Admiral Group PLC | | | 3,982 | | | | 53 | | |
| Aggreko PLC | | | 35,863 | | | | 1,123 | | |
| AMEC PLC | | | 12,459 | | | | 176 | | |
| Anglo American PLC | | | 38,159 | | | | 1,410 | | |
| ARM Holdings PLC | | | 85,867 | | | | 789 | | |
| AstraZeneca PLC | | | 46,432 | | | | 2,145 | | |
| Aviva PLC | | | 61,572 | | | | 288 | | |
| BAE Systems PLC | | | 91,329 | | | | 404 | | |
| Balfour Beatty PLC | | | 28,670 | | | | 118 | | |
| Barclays PLC | | | 158,650 | | | | 434 | | |
| BG Group PLC | | | 117,962 | | | | 2,522 | | |
| BHP Billiton PLC | | | 31,582 | | | | 921 | | |
The accompanying notes are an integral part of the financial statements.
20
2011 Annual Report
December 31, 2011
Portfolio of Investments (cont'd)
Active International Allocation Portfolio
| | | Shares | | Value
(000) | |
| United Kingdom (cont'd) | |
| BP PLC | | | 425,737 | | | $ | 3,045 | | |
| British American Tobacco PLC | | | 65,519 | | | | 3,109 | | |
| British Land Co., PLC REIT | | | 30,701 | | | | 220 | | |
| British Sky Broadcasting Group PLC | | | 80,070 | | | | 911 | | |
| BT Group PLC | | | 393,519 | | | | 1,167 | | |
| Bunzl PLC | | | 11,071 | | | | 152 | | |
| Burberry Group PLC | | | 4,860 | | | | 89 | | |
| Capita Group PLC (The) | | | 6,717 | | | | 66 | | |
| Capital Shopping Centres Group PLC REIT | | | 17,037 | | | | 83 | | |
| Carnival PLC | | | 8,133 | | | | 268 | | |
| Centrica PLC | | | 100,817 | | | | 453 | | |
| Charter International PLC (a) | | | 20,687 | | | | 304 | | |
| Cobham PLC | | | 31,176 | | | | 89 | | |
| Compass Group PLC | | | 83,308 | | | | 790 | | |
| Diageo PLC | | | 91,133 | | | | 1,991 | | |
| Experian PLC | | | 26,369 | | | | 358 | | |
| Firstgroup PLC | | | 22,411 | | | | 118 | | |
| G4S PLC | | | 14,295 | | | | 60 | | |
| GlaxoSmithKline PLC | | | 175,121 | | | | 4,002 | | |
| Hammerson PLC REIT | | | 25,762 | | | | 144 | | |
| Home Retail Group PLC | | | 25,617 | | | | 33 | | |
| HSBC Holdings PLC | | | 447,113 | | | | 3,410 | | |
| ICAP PLC | | | 1,056 | | | | 6 | | |
| Imperial Tobacco Group PLC | | | 26,399 | | | | 998 | | |
| Intercontinental Hotels Group PLC | | | 13,994 | | | | 251 | | |
| International Power PLC | | | 13,555 | | | | 71 | | |
| Invensys PLC | | | 18,025 | | | | 59 | | |
| Investec PLC | | | 5,696 | | | | 30 | | |
| J Sainsbury PLC | | | 44,001 | | | | 207 | | |
| Johnson Matthey PLC | | | 5,343 | | | | 152 | | |
| Kingfisher PLC | | | 35,198 | | | | 137 | | |
| Land Securities Group PLC REIT | | | 28,746 | | | | 284 | | |
| Legal & General Group PLC | | | 162,231 | | | | 259 | | |
| Lloyds Banking Group PLC (b) | | | 234,312 | | | | 94 | | |
| Man Group PLC | | | 61,874 | | | | 121 | | |
| Marks & Spencer Group PLC | | | 48,963 | | | | 236 | | |
| National Grid PLC | | | 104,557 | | | | 1,015 | | |
| Next PLC | | | 7,151 | | | | 304 | | |
| Old Mutual PLC | | | 139,096 | | | | 293 | | |
| Pearson PLC | | | 36,307 | | | | 682 | | |
| Petrofac Ltd. | | | 10,323 | | | | 231 | | |
| Prudential PLC | | | 52,385 | | | | 519 | | |
| Randgold Resources Ltd. | | | 9,535 | | | | 975 | | |
| Reckitt Benckiser Group PLC | | | 22,412 | | | | 1,107 | | |
| Reed Elsevier PLC | | | 51,569 | | | | 416 | | |
| Resolution Ltd. | | | 2,240 | | | | 9 | | |
| Rexam PLC | | | 18,628 | | | | 102 | | |
| Rio Tinto PLC | | | 42,279 | | | | 2,052 | | |
| Rolls-Royce Holdings PLC (b) | | | 46,906 | | | | 544 | | |
| Royal Bank of Scotland Group PLC (b) | | | 404,465 | | | | 127 | | |
| Royal Dutch Shell PLC, Class A | | | 136,182 | | | | 5,014 | | |
| Royal Dutch Shell PLC, Class B | | | 96,049 | | | | 3,660 | | |
| | | Shares | | Value
(000) | |
| RSA Insurance Group PLC | | | 88,836 | | | $ | 145 | | |
| Sage Group PLC (The) | | | 60,492 | | | | 276 | | |
| Schroders PLC | | | 2,457 | | | | 50 | | |
| Segro PLC REIT | | | 25,562 | | | | 83 | | |
| Serco Group PLC | | | 5,810 | | | | 43 | | |
| Severn Trent PLC | | | 15,300 | | | | 355 | | |
| Smith & Nephew PLC | | | 102,037 | | | | 991 | | |
| Smiths Group PLC | | | 10,326 | | | | 147 | | |
| SSE PLC | | | 46,176 | | | | 926 | | |
| Standard Chartered PLC | | | 64,310 | | | | 1,407 | | |
| Standard Life PLC | | | 44,995 | | | | 144 | | |
| Tesco PLC | | | 260,101 | | | | 1,630 | | |
| Unilever PLC | | | 36,785 | | | | 1,236 | | |
| United Utilities Group PLC | | | 6,703 | | | | 63 | | |
| Vodafone Group PLC | | | 2,444,465 | | | | 6,791 | | |
| Whitbread PLC | | | 8,223 | | | | 200 | | |
| Wolseley PLC | | | 1,711 | | | | 57 | | |
| WPP PLC | | | 159,268 | | | | 1,671 | | |
| Xstrata PLC | | | 40,712 | | | | 618 | | |
| | | | 68,078 | | |
| United States (0.2%) | |
| Lend Lease Group REIT (Stapled Securities) (c)(d) | | | 5,983 | | | | 44 | | |
| Tenaris SA (a) | | | 27,737 | | | | 512 | | |
| | | | 556 | | |
| Total Common Stocks (Cost $309,062) | | | 276,798 | | |
| Short-Term Investments (18.8%) | |
| Securities held as Collateral on Loaned Securities (9.3%) | |
| Investment Company (6.8%) | |
Morgan Stanley Institutional Liquidity
Funds — Money Market Portfolio —
Institutional Class (See Note G-2) | | | 21,266,995 | | | | 21,267 | | |
| | | Face
Amount
(000) | | | |
| Repurchase Agreements (2.5%) | |
Barclays Capital, Inc., (0.02%, dated 12/30/11,
due 1/3/12; proceeds $913; fully
collateralized by a U.S. Government Obligation;
U.S. Treasury Bond 4.50% due 5/15/38;
valued at $932) | | $ | 913 | | | | 913 | | |
Merrill Lynch & Co., Inc., (0.07%,
dated 12/30/11, due 1/3/12; proceeds
$6,784; fully collateralized by a
U.S. Government Agency; Government National
Mortgage Association 3.50% due 11/20/41;
valued at $6,920) | | | 6,784 | | | | 6,784 | | |
| | | | 7,697 | | |
Total Securities held as Collateral on Loaned
Securities (Cost $28,964) | | | 28,964 | | |
The accompanying notes are an integral part of the financial statements.
21
2011 Annual Report
December 31, 2011
Portfolio of Investments (cont'd)
Active International Allocation Portfolio
| | Shares | | Value
(000) | |
| Investment Company (9.5%) | |
Morgan Stanley Institutional Liquidity
Funds — Money Market Portfolio —
Institutional Class (See Note G-2)
(Cost $29,780) | | | 29,780,274 | | | $ | 29,780 | | |
| Total Short-Term Investments (Cost $58,744) | | | 58,744 | | |
Total Investments (107.4%) (Cost $367,806)
including $28,149 of Securities Loaned (h) | | | 335,542 | | |
| Liabilities in Excess of Other Assets (-7.4%) | | | (23,107 | ) | |
| Net Assets (100.0%) | | $ | 312,435 | | |
(a) All or a portion of this security was on loan at December 31, 2011.
(b) Non-income producing security.
(c) Comprised of securities in separate entities that are traded as a single stapled security.
(d) Consists of one or more classes of securities traded together as a unit; stocks with attached warrants.
(e) Security trades on the Hong Kong exchange.
(f) At December 31, 2011, the Portfolio held a fair valued security valued at $0, representing 0.0% of net assets. This security has been fair valued as determined in good faith under procedures established by and under the general supervision of the Fund's Directors.
(g) 144A security — Certain conditions for public sale may exist. Unless otherwise noted, these securities are deemed to be liquid.
(h) Securities are available for collateral in connection with open foreign currency exchange and futures contracts.
@ Value is less than $500.
ADR American Depositary Receipt.
CDI CHESS Depositary Interest.
CVA Certificaten Van Aandelen.
GDR Global Depositary Receipt.
REIT Real Estate Investment Trust.
SDR Swedish Depositary Receipt.
VVPR Verminderde Voorheffing Précompte Réduit.
Foreign Currency Exchange Contracts Information:
The Portfolio had the following foreign currency exchange contracts open at period end:
| Counterparty | | Currency
to
Deliver
(000) | | Value
(000) | | Settlement
Date | | In
Exchange
For
(000) | | Value
(000) | | Unrealized
Appreciation
(Depreciation)
(000) | |
| Credit Suisse London Branch (GFX) | | | |
| | | USD | 1,689 | | | $ | 1,689 | | | 1/19/12 | | CHF | 1,571 | | | $ | 1,674 | | | $ | (15 | ) | |
| | | USD | 2,694 | | | | 2,694 | | | 1/19/12 | | EUR | 2,056 | | | | 2,662 | | | | (32 | ) | |
| Deutsche Bank AG London | |
| | | EUR | 2,637 | | | | 3,413 | | | 1/19/12 | | USD | 3,423 | | | | 3,423 | | | | 10 | | |
| | | GBP | 1,231 | | | | 1,911 | | | 1/19/12 | | USD | 1,912 | | | | 1,912 | | | | 1 | | |
| | | USD | 2,652 | | | | 2,652 | | | 1/19/12 | | EUR | 2,024 | | | | 2,621 | | | | (31 | ) | |
| | | USD | 2,831 | | | | 2,831 | | | 1/19/12 | | EUR | 2,164 | | | | 2,801 | | | | (30 | ) | |
| Goldman Sachs International | |
| | | USD | 1,767 | | | | 1,767 | | | 1/19/12 | | EUR | 1,350 | | | | 1,746 | | | | (21 | ) | |
| JPMorgan Chase Bank | |
| | | USD | 5,509 | | | | 5,509 | | | 1/19/12 | | EUR | 4,206 | | | | 5,445 | | | | (64 | ) | |
| Counterparty | | Currency
to
Deliver
(000) | | Value
(000) | | Settlement
Date | | In
Exchange
For
(000) | | Value
(000) | | Unrealized
Appreciation
(Depreciation)
(000) | |
| Mellon Bank | |
| | | AUD | 5,638 | | | $ | 5,756 | | | 1/19/12 | | USD | 5,601 | | | $ | 5,601 | | | $ | (155 | ) | |
| | | USD | 14,721 | | | | 14,721 | | | 1/19/12 | | AUD | 14,657 | | | | 14,966 | | | | 245 | | |
| | | USD | 4,529 | | | | 4,529 | | | 1/19/12 | | EUR | 3,458 | | | | 4,475 | | | | (54 | ) | |
| Royal Bank of Scotland | |
| | | JPY | 737,774 | | | | 9,587 | | | 1/19/12 | | USD | 9,459 | | | | 9,459 | | | | (128 | ) | |
| | | USD | 6,717 | | | | 6,717 | | | 1/19/12 | | JPY | 522,342 | | | | 6,788 | | | | 71 | | |
| State Street Bank and Trust Co. | |
| | | USD | 6,601 | | | | 6,601 | | | 1/19/12 | | GBP | 4,250 | | | | 6,599 | | | | (2 | ) | |
| UBS AG | |
| | | CHF | 1,450 | | | | 1,544 | | | 1/19/12 | | USD | 1,541 | | | | 1,541 | | | | (3 | ) | |
| | | CHF | 725 | | | | 772 | | | 1/19/12 | | USD | 775 | | | | 775 | | | | 3 | | |
| | | GBP | 6,932 | | | | 10,765 | | | 1/19/12 | | USD | 10,768 | | | | 10,768 | | | | 3 | | |
| | | USD | 5,335 | | | | 5,335 | | | 1/19/12 | | EUR | 4,073 | | | | 5,272 | | | | (63 | ) | |
| | | | | $ | 88,793 | | | | | | | $ | 88,528 | | | $ | (265 | ) | |
AUD — Australian Dollar
CHF — Swiss Franc
EUR — Euro
GBP — British Pound
JPY — Japanese Yen
USD — United States Dollar
Futures Contracts:
The Portfolio had the following futures contracts open at period end:
| | | Number
of
Contracts | | Value
(000) | | Expiration
Date | | Unrealized
Appreciation
(Depreciation)
(000) | |
| Long: | |
ASX Spi 200 Index
(Australia) | | | 19 | | | $ | 1,958 | | | Mar-12 | | $ | (86 | ) | |
DAX Index
(Germany) | | | 7 | | | | 1,338 | | | Mar-12 | | | 2 | | |
FTSE 100 Index
(United Kingdom) | | | 78 | | | | 6,697 | | | Mar-12 | | | 149 | | |
Hang Seng China
ENT Index
(Hong Kong) | | | 57 | | | | 6,772 | | | Jan-12 | | | (62 | ) | |
IBEX 35 Index
(Spain) | | | 27 | | | | 2,966 | | | Jan-12 | | | 29 | | |
TOPIX Index
(Japan) | | | 74 | | | | 6,998 | | | Mar-12 | | | (166 | ) | |
| Short: | |
Euro STOXX 50 Index
(Germany) | | | 8 | | | | (239 | ) | | Mar-12 | | | (10 | ) | |
| | | $ | (144 | ) | |
The accompanying notes are an integral part of the financial statements.
22
2011 Annual Report
December 31, 2011
Portfolio of Investments (cont'd)
Active International Allocation Portfolio
Fair Value Measurement Information:
The following is a summary of the inputs used to value the Portfolio's investments as of December 31, 2011. (See Note A-9 to the financial statements for further information regarding fair value measurement.)
| Investment Type | | Level 1
Unadjusted
quoted
prices
(000) | | Level 2
Other
significant
observable
inputs
(000) | | Level 3
Significant
unobservable
inputs
(000) | | Total
(000) | |
| Assets: | | | | | | | | | |
| Common Stocks | | | | | | | | | |
| Aerospace & Defense | | $ | 1,296 | | | $ | — | | | $ | — | | | $ | 1,296 | | |
| Air Freight & Logistics | | | 952 | | | | — | | | | — | | | | 952 | | |
| Airlines | | | 355 | | | | — | | | | — | | | | 355 | | |
| Auto Components | | | 3,658 | | | | — | | | | — | | | | 3,658 | | |
| Automobiles | | | 7,526 | | | | — | | | | — | | | | 7,526 | | |
| Beverages | | | 7,013 | | | | — | | | | — | | | | 7,013 | | |
| Biotechnology | | | 152 | | | | — | | | | — | | | | 152 | | |
| Building Products | | | 1,544 | | | | — | | | | — | | | | 1,544 | | |
| Capital Markets | | | 3,032 | | | | — | | | | — | | | | 3,032 | | |
| Chemicals | | | 12,363 | | | | — | | | | — | | | | 12,363 | | |
| Commercial Banks | | | 18,179 | | | | — | | | | — | | | | 18,179 | | |
Commercial Services &
Supplies | | | 2,047 | | | | — | | | | — | | | | 2,047 | | |
Communications
Equipment | | | 938 | | | | — | | | | — | | | | 938 | | |
| Computers & Peripherals | | | 1,945 | | | | — | | | | — | | | | 1,945 | | |
Construction &
Engineering | | | 2,534 | | | | — | | | | — | | | | 2,534 | | |
| Construction Materials | | | 1,015 | | | | — | | | | — | | | | 1,015 | | |
| Consumer Finance | | | 98 | | | | — | | | | — | | | | 98 | | |
| Containers & Packaging | | | 450 | | | | — | | | | — | | | | 450 | | |
| Distributors | | | 113 | | | | — | | | | — | | | | 113 | | |
Diversified Consumer
Services | | | 116 | | | | — | | | | — | | | | 116 | | |
Diversified Financial
Services | | | 2,039 | | | | — | | | | — | † | | | 2,039 | | |
Diversified
Telecommunication
Services | | | 9,950 | | | | — | | | | — | | | | 9,950 | | |
| Electric Utilities | | | 4,447 | | | | — | | | | — | | | | 4,447 | | |
| Electrical Equipment | | | 5,001 | | | | — | | | | — | | | | 5,001 | | |
Electronic Equipment,
Instruments &
Components | | | 5,850 | | | | — | | | | — | | | | 5,850 | | |
Energy Equipment &
Services | | | 2,569 | | | | — | | | | — | | | | 2,569 | | |
| Food & Staples Retailing | | | 5,219 | | | | — | | | | — | | | | 5,219 | | |
| Food Products | | | 15,059 | | | | — | | | | — | | | | 15,059 | | |
| Gas Utilities | | | 392 | | | | — | | | | — | | | | 392 | | |
Health Care Equipment &
Supplies | | | 3,259 | | | | — | | | | — | | | | 3,259 | | |
Health Care Providers &
Services | | | 714 | | | | — | | | | — | | | | 714 | | |
Hotels, Restaurants &
Leisure | | | 2,361 | | | | — | | | | — | | | | 2,361 | | |
| Household Durables | | | 2,688 | | | | — | | | | — | | | | 2,688 | | |
| Investment Type | | Level 1
Unadjusted
quoted
prices
(000) | | Level 2
Other
significant
observable
inputs
(000) | | Level 3
Significant
unobservable
inputs
(000) | | Total
(000) | |
| Household Products | | $ | 1,886 | | | $ | — | | | $ | — | | | $ | 1,886 | | |
Independent Power
Producers & Energy
Traders | | | 328 | | | | — | | | | — | | | | 328 | | |
| Industrial Conglomerates | | | 6,759 | | | | — | | | | — | | | | 6,759 | | |
Information Technology
Services | | | 569 | | | | — | | | | — | | | | 569 | | |
| Insurance | | | 7,494 | | | | — | | | | — | | | | 7,494 | | |
| Internet & Catalog Retail | | | 33 | | | | — | | | | — | | | | 33 | | |
Internet Software &
Services | | | 298 | | | | — | | | | — | | | | 298 | | |
Leisure Equipment &
Products | | | 684 | | | | — | | | | — | | | | 684 | | |
Life Sciences Tools &
Services | | | 71 | | | | — | | | | — | | | | 71 | | |
| Machinery | | | 9,681 | | | | — | | | | — | | | | 9,681 | | |
| Marine | | | 1,109 | | | | — | | | | — | | | | 1,109 | | |
| Media | | | 5,088 | | | | — | | | | — | | | | 5,088 | | |
| Metals & Mining | | | 22,348 | | | | — | | | | — | | | | 22,348 | | |
| Multi-Utilities | | | 2,232 | | | | — | | | | — | | | | 2,232 | | |
| Multiline Retail | | | 708 | | | | — | | | | — | | | | 708 | | |
| Office Electronics | | | 1,717 | | | | — | | | | — | | | | 1,717 | | |
Oil, Gas & Consumable
Fuels | | | 21,616 | | | | — | | | | — | | | | 21,616 | | |
| Paper & Forest Products | | | 1,392 | | | | — | | | | — | | | | 1,392 | | |
| Personal Products | | | 842 | | | | — | | | | — | | | | 842 | | |
| Pharmaceuticals | | | 26,090 | | | | — | | | | — | | | | 26,090 | | |
| Professional Services | | | 432 | | | | — | | | | — | | | | 432 | | |
Real Estate Investment
Trusts (REITs) | | | 2,295 | | | | — | | | | — | | | | 2,295 | | |
Real Estate Management &
Development | | | 3,688 | | | | — | | | | — | | | | 3,688 | | |
| Road & Rail | | | 2,843 | | | | — | | | | — | | | | 2,843 | | |
Semiconductors &
Semiconductor
Equipment | | | 4,557 | | | | — | | | | — | | | | 4,557 | | |
| Software | | | 3,674 | | | | — | | | | — | | | | 3,674 | | |
| Specialty Retail | | | 2,911 | | | | — | | | | — | | | | 2,911 | | |
Textiles, Apparel &
Luxury Goods | | | 986 | | | | — | | | | — | | | | 986 | | |
| Tobacco | | | 5,401 | | | | — | | | | — | | | | 5,401 | | |
Trading Companies &
Distributors | | | 4,068 | | | | — | | | | — | | | | 4,068 | | |
Transportation
Infrastructure | | | 127 | | | | — | | | | — | | | | 127 | | |
| Water Utilities | | | 418 | | | | — | | | | — | | | | 418 | | |
Wireless
Telecommunication
Services | | | 9,579 | | | | — | | | | — | | | | 9,579 | | |
| Total Common Stocks | | | 276,798 | | | | — | | | | — | † | | | 276,798 | | |
The accompanying notes are an integral part of the financial statements.
23
2011 Annual Report
December 31, 2011
Portfolio of Investments (cont'd)
Active International Allocation Portfolio
Fair Value Measurement Information: (cont'd)
| Investment Type | | Level 1
Unadjusted
quoted
prices
(000) | | Level 2
Other
significant
observable
inputs
(000) | | Level 3
Significant
unobservable
inputs
(000) | | Total
(000) | |
| Short-Term Investments | |
| Investment Company | | $ | 51,047 | | | $ | — | | | $ | — | | | $ | 51,047 | | |
| Repurchase Agreements | | | — | | | | 7,697 | | | | — | | | | 7,697 | | |
Total Short-Term
Investments | | | 51,047 | | | | 7,697 | | | | — | | | | 58,744 | | |
Foreign Currency
Exchange Contracts | | | — | | | | 333 | | | | — | | | | 333 | | |
| Futures Contracts | | | 180 | | | | — | | | | — | | | | 180 | | |
| Total Assets | | | 328,025 | | | | 8,030 | | | | — | † | | | 336,055 | | |
| Liabilities: | |
Foreign Currency
Exchange Contracts | | | — | | | | (598 | ) | | | — | | | | (598 | ) | |
| Futures Contracts | | | (324 | ) | | | — | | | | — | | | | (324 | ) | |
| Total Liabilities | | | (324 | ) | | | (598 | ) | | | — | | | | (922 | ) | |
| Total | | $ | 327,701 | | | $ | 7,432 | | | $ | — | † | | $ | 335,133 | | |
Transfers between investment levels may occur as the markets fluctuate and/or the availability of data used in an investment's valuation changes. The Portfolio recognizes transfers between the levels as of the end of the period. As of December 31, 2011, the Portfolio did not have any significant investments transfer between investment levels.
Following is a reconciliation of investments in which significant unobservable inputs (Level 3) were used in determining fair value.
| | | Common
Stocks
(000) | |
| Beginning Balance | | $ | — | † | |
| Purchases | | | — | | |
| Sales | | | — | ‡ | |
| Amortization of discount | | | — | | |
| Transfers in | | | — | | |
| Transfers out | | | — | | |
| Change in unrealized appreciation (depreciation) | | | — | | |
| Realized gains (losses) | | | — | | |
| Ending Balance | | $ | — | † | |
Net change in unrealized appreciation/depreciation
from investments still held as of December 31, 2011 | | $ | — | | |
† Includes one or more securities which are valued at zero.
‡ Includes one or more securities with proceeds from sales of zero.
The accompanying notes are an integral part of the financial statements.
24
2011 Annual Report
December 31, 2011
Investment Overview (unaudited)
Asian Equity Portfolio
The Asian Equity Portfolio (the "Portfolio") seeks long-term capital appreciation by investing primarily in equity securities of companies in the Asia-Pacific region, excluding Japan.
Performance
For the year ended December 31, 2011, the Portfolio had a total return based on net asset value and reinvestment of distributions per share of -16.88%, net of fees, for Class I shares. The Portfolio's Class I shares outperformed against its benchmark, the MSCI All Country Asia Ex-Japan Index (the "Index"), which returned -17.31%.
Factors Affecting Performance
• Markets within the Asia ex-Japan region posted mixed returns over the 12-month reporting period, with significant variation in performance. Markets in the emerging ASEAN (Association of Southeast Asian Nations) region (Indonesia, Malaysia, the Philippines, and Thailand) all outperformed the Index with Indonesia leading the region, rising 6% over the course of the year. Most markets, however, ended the year in the red. India's market saw a sharp correction in the fourth quarter of 2011 and ended the year down 37%. Other markets such as Taiwan, China, Singapore, and Hong Kong had each fallen between 16% and 21% over this period. The MSCI All Country Asia Ex-Japan Index underperformed developed markets (represented by the MSCI EAFE Index), which fell 12.1%, but outperformed global emerging markets (represented by MSCI Emerging Markets Index), which fell 18.4%.
• During the first quarter, the earthquake and tsunami in Japan led to an initial knee-jerk sell-off across the region, but the discounts were readjusted quickly. The increased political uncertainty in the Middle East and North Africa also had a limited impact on regional markets as the contagion effect waned. In the second quarter of 2011, concerns over slowing global growth, high levels of inflation, the expiration of the U.S. Federal Reserve's second round of quantitative easing (QE2), continued debt problems in the euro zone, and Chinese local government debt continued to weigh on investor sentiment. Inflation was a threat given that demand stayed strong in Asian economies through the crisis and the slowdown in capacity expansion during the crisis has kept capacity utilization high.
• In the latter part of third quarter, global markets experienced a sharp correction and increased volatility as concerns over G7 sovereign debt and banking sector crisis intensified compounding existing fears of a global economic slowdown. Although macro data in the U.S. was marginally better towards the end of the fourth quarter, it was not sufficient to reverse negative sentiment generated from news flow in October and November, when political concerns in Europe and the failure of the U.S. congressional "super committee" to agree on deficit cuts combined with concerns over slowing global growth, hurt investor confidence.
• Inflation is no longer a threat in most Asian economies, in our view. We believe that in the absence of concern over unemployment, China's policy makers will remain extremely vigilant on inflation, which seems to have peaked in the fourth quarter of 2011. We expect inflation to move to the lower end of the 3% to 5% range which is higher than pre-crisis levels but still acceptable. On a more positive note, one of our biggest concerns is margin pressure. Recent data suggest that margin pressure has peaked in China with raw material prices no longer increasing. Additionally, valuation remains at an extreme in China. It is currently trading near 2008 crisis levels in price-to-book value and price-to-earnings ratio terms.
• Overall, asset allocation contributed to relative performance, while stock selection was a detractor.
• At the country level, the Portfolio's overweight exposure to Korea and the Philippines contributed to relative returns, as did our underweight to India and Taiwan. Cash in the Portfolio was also a contributor, as the Index fell 17.3% during the period.
• At the stock level, active positions in Korea (overweight consumer discretionary and underweight information technology) and India (underweight financials and industrials) contributed to relative performance. On the other hand, stock selection in Hong Kong (overweight real estate and underweight utilities), China (overweight consumer staples and information technology, underweight energy and telecommunications) and Singapore (overweight consumer staples) hurt performance over this period.
25
2011 Annual Report
December 31, 2011
Investment Overview (unaudited) (cont'd)
Asian Equity Portfolio
Management Strategies
• The Portfolio seeks long-term capital appreciation and integrates top-down country allocation and bottom-up stock selection. The Portfolio will invest primarily in equity securities of companies in the Asia-Pacific region, excluding Japan.
• On a relative basis, we have an overweight exposure to specialty retail, internet software services, and insurers; underweight exposure to energy, commercial banks, and metals and mining. We have maintained our overweight exposure to Korea, the Philippines, and Indonesia, and kept our relative underweight exposure to Taiwan, Malaysia, Singapore, and India.
• In terms of the long-term position of the Portfolio, we do not envisage any change to the long-term positioning with the exception of potentially moving China to an overweight position. We believe that our long-term investment themes focusing on Asian consumers, Asian global competitiveness, and alternative energy continue to be themes that could potentially outperform in the long run.
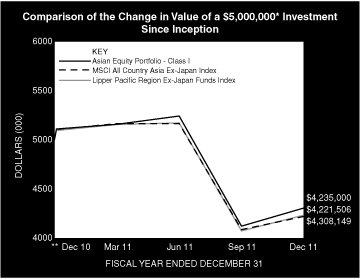
* Minimum Investment
** Commenced Operations on December 28, 2010.
In accordance with SEC regulations, Portfolio's performance shown assumes that all recurring fees (including management fees) were deducted and all dividends and distributions were reinvested. The performance of Class P, Class H, and Class L shares will vary from the Class I shares based upon it will be negatively impacted by additional fees assessed to these classes.
Performance Compared to the Morgan Stanley Capital International (MSCI) All Country Asia Ex-Japan Index(1) and the Lipper Pacific Region Ex-Japan Funds Index(2)
| | | Period Ended December 31, 2011 | |
| | | Total Returns(3) | |
| | | | | Average Annual | |
| | | One
Year | | Five
Years | | Ten
Years | | Since
Inception(5) | |
Portfolio — Class I Shares
w/o sales charges(4) | | | –16.88 | % | | | — | | | | — | | | | –15.19 | % | |
MSCI All Country
Asia Ex-Japan Index | | | –17.31 | | | | — | | | | — | | | | –15.45 | | |
Lipper Pacific Region Ex-Japan
Funds Index | | | –15.66 | | | | — | | | | — | | | | –13.73 | | |
Portfolio — Class H Shares
w/o sales charges(4) | | | –17.08 | | | | — | | | | — | | | | –15.38 | | |
Portfolio — Class H Shares
with maximum 4.75%
sales charges(4) | | | –21.03 | | | | — | | | | — | | | | –19.38 | | |
MSCI All Country
Asia Ex-Japan Index | | | –17.31 | | | | — | | | | — | | | | –15.45 | | |
Lipper Pacific Region Ex-Japan
Funds Index | | | –15.66 | | | | — | | | | — | | | | –13.73 | | |
Portfolio — Class L Shares
w/o sales charges(4) | | | –17.57 | | | | — | | | | — | | | | –15.88 | | |
MSCI All Country
Asia Ex-Japan Index | | | –17.31 | | | | — | | | | — | | | | –15.45 | | |
Lipper Pacific Region Ex-Japan
Funds Index | | | –15.66 | | | | — | | | | — | | | | –13.73 | | |
Portfolio — Class P Shares
w/o sales charges(4) | | | –17.08 | | | | — | | | | — | | | | –15.38 | | |
MSCI All Country
Asia Ex-Japan Index | | | –17.31 | | | | — | | | | — | | | | –15.45 | | |
Lipper Pacific Region Ex-Japan
Funds Index | | | –15.66 | | | | — | | | | — | | | | –13.73 | | |
Performance data quoted represents past performance, which is no guarantee of future results, and current performance may be lower or higher than the figures shown. Performance assumes that all dividends and distributions, if any, were reinvested. For the most recent month-end performance figures, please visit www.morganstanley.com/im. Investment return and principal value will fluctuate so that Portfolio shares, when redeemed, may be worth more or less than their original cost. Total returns do not reflect the deduction of taxes that a shareholder would pay on Portfolio distributions or the redemption of Portfolio shares. Performance of share classes will vary due to difference in expenses.
(1) The Morgan Stanley Capital International (MSCI) All Country Asia Ex-Japan Index is a free float-adjusted market capitalization weighted index that is designed to measure the equity market performance of Asia, excluding Japan. The performance of the Index is listed in U.S. dollars and assumes reinvestment of net dividends. The Index is unmanaged and its returns do not include any sales charges or fees. Such costs would lower performance. It is not possible to invest directly in an index.
(2) The Lipper Pacific Region Ex-Japan Funds Index is an equally weighted performance index of the largest qualifying funds (based on net assets) in the Lipper Pacific Region Ex-Japan Funds classification. The Index, which is adjusted for capital gains distributions and income dividends, is unmanaged and should not be considered an investment. There are currently 10 funds represented in
26
2011 Annual Report
December 31, 2011
Investment Overview (unaudited) (cont'd)
Asian Equity Portfolio
this Index. As of the date of this report, the Portfolio was in the Lipper Pacific Region Ex-Japan Funds classification.
(3) Total returns for the Portfolio reflect fees waived and expenses reimbursed, if applicable, by the Adviser. Without such waivers and reimbursements, total returns would have been lower. The fee waivers and/or expense reimbursements will continue for one year or until such time as the Board of Directors acts to discontinue all or a portion of such waivers and/or expense reimbursements when it deems that such action is appropriate.
(4) Commenced operations on December 28, 2010.
(5) For comparative purposes, average annual since inception returns listed for the Indexes refer to the inception date or initial offering of the respective share class of the Portfolio, not the inception of the Index.
Portfolio Composition
| Classification | | Percentage of
Total Investments | |
| Other* | | | 34.0 | % | |
| Short-Term Investments | | | 11.5 | | |
| Commercial Banks | | | 9.2 | | |
| Semiconductors & Semiconductor Equipment | | | 7.8 | | |
| Insurance | | | 7.2 | | |
| Real Estate Management & Development | | | 6.5 | | |
| Specialty Retail | | | 6.2 | | |
| Automobiles | | | 6.1 | | |
| Food Products | | | 6.0 | | |
| Internet Software & Services | | | 5.5 | | |
| Total Investments | | | 100.0 | % | |
* Industries representing less than 5% of total investments.
27
2011 Annual Report
December 31, 2011
Portfolio of Investments
Asian Equity Portfolio
| | | Shares | | Value
(000) | |
| Common Stocks (92.7%) | |
| China (28.3%) | |
| AIA Group Ltd. (a) | | | 5,400 | | | $ | 17 | | |
| Baidu, Inc. ADR (b) | | | 100 | | | | 12 | | |
| Belle International Holdings Ltd. (a) | | | 31,000 | | | | 54 | | |
| China Construction Bank Corp. H Shares (a) | | | 47,000 | | | | 33 | | |
| China Life Insurance Co., Ltd. H Shares (a) | | | 6,000 | | | | 15 | | |
| China Mengniu Dairy Co., Ltd. (a) | | | 11,000 | | | | 26 | | |
| China Pacific Insurance Group Co., Ltd. H Shares (a) | | | 11,800 | | | | 33 | | |
| China Resources Enterprise Ltd. (a) | | | 2,000 | | | | 7 | | |
| China Telecom Corp., Ltd. H Shares (a) | | | 14,000 | | | | 8 | | |
| Chow Tai Fook Jewellery Group Ltd. (a)(b)(c) | | | 23,000 | | | | 41 | | |
| GCL Poly Energy Holdings Ltd. (a) | | | 24,000 | | | | 7 | | |
| Hengan International Group Co., Ltd. (a) | | | 500 | | | | 5 | | |
| Ping An Insurance Group Co. H Shares (a) | | | 4,000 | | | | 26 | | |
Shanghai Pharmaceuticals Holding Co., Ltd.
H Shares (a)(b) | | | 4,000 | | | | 6 | | |
| Tencent Holdings Ltd. (a) | | | 3,600 | | | | 72 | | |
| Trinity Ltd. (a) | | | 26,000 | | | | 19 | | |
| Want Want China Holdings Ltd. (a) | | | 30,000 | | | | 30 | | |
| | | | 411 | | |
| Hong Kong (4.6%) | |
| BOC Hong Kong Holdings Ltd. | | | 5,000 | | | | 12 | | |
| Cathay Pacific Airways Ltd. | | | 4,000 | | | | 7 | | |
| Kerry Properties Ltd. | | | 5,500 | | | | 18 | | |
| Samsonite International SA (b) | | | 3,900 | | | | 6 | | |
| Wharf Holdings Ltd. | | | 5,400 | | | | 25 | | |
| | | | 68 | | |
| India (5.4%) | |
| HDFC Bank Ltd. ADR | | | 1,000 | | | | 26 | | |
| ITC Ltd. GDR | | | 7,383 | | | | 28 | | |
| Mahindra & Mahindra Ltd. GDR | | | 1,890 | | | | 25 | | |
| | | | 79 | | |
| Indonesia (6.5%) | |
| Delta Dunia Makmur Tbk PT (b) | | | 54,000 | | | | 4 | | |
| Kalbe Farma Tbk PT | | | 126,000 | | | | 47 | | |
| Lippo Karawaci Tbk PT | | | 588,000 | | | | 43 | | |
| | | | 94 | | |
| Korea, Republic of (25.7%) | |
| GS Retail Co., Ltd. | | | 130 | | | | 3 | | |
| Hynix Semiconductor, Inc. (b) | | | 550 | | | | 10 | | |
| Hyundai Engineering & Construction Co., Ltd. (b) | | | 320 | | | | 20 | | |
| Hyundai Heavy Industries Co., Ltd. | | | 73 | | | | 16 | | |
| Hyundai Mobis (b) | | | 7 | | | | 2 | | |
| Hyundai Motor Co. | | | 366 | | | | 68 | | |
| KB Financial Group, Inc. | | | 708 | | | | 22 | | |
| Korea Aerospace Industries Ltd. | | | 110 | | | | 4 | | |
| Korea Kumho Petrochemical (b) | | | 55 | | | | 8 | | |
| Korean Air Lines Co., Ltd. (b) | | | 105 | | | | 4 | | |
| LG Chem Ltd. | | | 97 | | | | 27 | | |
| Mando Corp. | | | 21 | | | | 4 | | |
| | | Shares | | Value
(000) | |
| NCSoft Corp. | | | 33 | | | $ | 9 | | |
| Nexon Co., Ltd. (b) | | | 900 | | | | 13 | | |
| Samsung Electronics Co., Ltd. | | | 104 | | | | 96 | | |
| Samsung Fire & Marine Insurance Co., Ltd. | | | 101 | | | | 19 | | |
| Shinhan Financial Group Co., Ltd. | | | 909 | | | | 31 | | |
| Woongjin Coway Co., Ltd. | | | 500 | | | | 16 | | |
| YG Entertainment, Inc. (b) | | | 21 | | | | 1 | | |
| | | | 373 | | |
| Malaysia (4.9%) | |
| Axiata Group Bhd | | | 11,500 | | | | 19 | | |
| CIMB Group Holdings Bhd | | | 6,700 | | | | 16 | | |
| IJM Corp. Bhd | | | 4,300 | | | | 8 | | |
| Sime Darby Bhd | | | 2,800 | | | | 8 | | |
| Top Glove Corp. Bhd | | | 4,800 | | | | 7 | | |
| UEM Land Holdings Bhd (b) | | | 17,700 | | | | 13 | | |
| | | | 71 | | |
| Philippines (3.8%) | |
| Cebu Air, Inc. | | | 7,240 | | | | 11 | | |
| Puregold Price Club, Inc. (b) | | | 14,400 | | | | 6 | | |
| SM Investments Corp. | | | 2,920 | | | | 39 | | |
| | | | 56 | | |
| Singapore (1.6%) | |
| Olam International Ltd. | | | 14,636 | | | | 24 | | |
| Taiwan (9.6%) | |
| Asustek Computer, Inc. | | | 4,880 | | | | 35 | | |
| Catcher Technology Co., Ltd. | | | 1,000 | | | | 5 | | |
| Foxconn Technology Co. Ltd. | | | 1,000 | | | | 3 | | |
| Hon Hai Precision Industry Co., Ltd. | | | 11,000 | | | | 30 | | |
| Lung Yen Life Service Corp. | | | 2,000 | | | | 6 | | |
| MStar Semiconductor, Inc. | | | 1,000 | | | | 5 | | |
| Uni-President Enterprises Corp. | | | 24,380 | | | | 36 | | |
| Yuanta Financial Holding Co., Ltd. (b) | | | 38,302 | | | | 19 | | |
| | | | 139 | | |
| Thailand (2.3%) | |
| PTT PCL (Foreign) | | | 3,300 | | | | 33 | | |
| Total Common Stocks (Cost $1,507) | | | 1,348 | | |
| Short-Term Investment (12.1%) | |
| Investment Company (12.1%) | |
Morgan Stanley Institutional Liquidity
Funds — Money Market Portfolio —
Institutional Class (See Note G-2) (Cost $175) | | | 175,281 | | | | 175 | | |
| Total Investments (104.8%) (Cost $1,682) | | | 1,523 | | |
| Liabilities in Excess of Other Assets (-4.8%) | | | (70 | ) | |
| Net Assets (100.0%) | | $ | 1,453 | | |
(a) Security trades on the Hong Kong exchange.
(b) Non-income producing security.
(c) 144A security — Certain conditions for public sale may exist. Unless otherwise noted, these securities are deemed to be liquid.
ADR American Depositary Receipt.
GDR Global Depositary Receipt.
The accompanying notes are an integral part of the financial statements.
28
2011 Annual Report
December 31, 2011
Portfolio of Investments (cont'd)
Asian Equity Portfolio
Fair Value Measurement Information:
The following is a summary of the inputs used to value the Portfolio's investments as of December 31, 2011. (See Note A-9 to the financial statements for further information regarding fair value measurement.)
| Investment Type | | Level 1
Unadjusted
quoted
prices
(000) | | Level 2
Other
significant
observable
inputs
(000) | | Level 3
Significant
unobservable
inputs
(000) | | Total
(000) | |
| Assets: | | | | | | | | | |
| Common Stocks | | | | | | | | | |
| Aerospace & Defense | | $ | 4 | | | $ | — | | | $ | — | | | $ | 4 | | |
| Airlines | | | 22 | | | | — | | | | — | | | | 22 | | |
| Auto Components | | | 6 | | | | — | | | | — | | | | 6 | | |
| Automobiles | | | 93 | | | | — | | | | — | | | | 93 | | |
| Capital Markets | | | 19 | | | | — | | | | — | | | | 19 | | |
| Chemicals | | | 35 | | | | — | | | | — | | | | 35 | | |
| Commercial Banks | | | 140 | | | | — | | | | — | | | | 140 | | |
| Computers & Peripherals | | | 43 | | | | — | | | | — | | | | 43 | | |
| Construction & Engineering | | | 34 | | | | — | | | | — | | | | 34 | | |
| Distributors | | | 3 | | | | — | | | | — | | | | 3 | | |
Diversified
Telecommunication
Services | | | 8 | | | | — | | | | — | | | | 8 | | |
Electronic Equipment,
Instruments &
Components | | | 30 | | | | — | | | | — | | | | 30 | | |
| Food & Staples Retailing | | | 37 | | | | — | | | | — | | | | 37 | | |
| Food Products | | | 92 | | | | — | | | | — | | | | 92 | | |
Health Care Equipment &
Supplies | | | 7 | | | | — | | | | — | | | | 7 | | |
Health Care Providers &
Services | | | 6 | | | | — | | | | — | | | | 6 | | |
| Household Durables | | | 16 | | | | — | | | | — | | | | 16 | | |
| Industrial Conglomerates | | | 47 | | | | — | | | | — | | | | 47 | | |
| Insurance | | | 110 | | | | — | | | | — | | | | 110 | | |
Internet Software &
Services | | | 84 | | | | — | | | | — | | | | 84 | | |
| Machinery | | | 16 | | | | — | | | | — | | | | 16 | | |
| Media | | | 1 | | | | — | | | | — | | | | 1 | | |
Oil, Gas & Consumable
Fuels | | | 37 | | | | — | | | | — | | | | 37 | | |
| Personal Products | | | 5 | | | | — | | | | — | | | | 5 | | |
| Pharmaceuticals | | | 47 | | | | — | | | | — | | | | 47 | | |
Real Estate Management &
Development | | | 99 | | | | — | | | | — | | | | 99 | | |
Semiconductors &
Semiconductor
Equipment | | | 118 | | | | — | | | | — | | | | 118 | | |
| Software | | | 22 | | | | — | | | | — | | | | 22 | | |
| Specialty Retail | | | 95 | | | | — | | | | — | | | | 95 | | |
Textiles, Apparel &
Luxury Goods | | | 25 | | | | — | | | | — | | | | 25 | | |
| Tobacco | | | 28 | | | | — | | | | — | | | | 28 | | |
| Investment Type | | Level 1
Unadjusted
quoted
prices
(000) | | Level 2
Other
significant
observable
inputs
(000) | | Level 3
Significant
unobservable
inputs
(000) | | Total
(000) | |
Wireless
Telecommunication
Services | | $ | 19 | | | $ | — | | | $ | — | | | $ | 19 | | |
| Total Common Stocks | | | 1,348 | | | | — | | | | — | | | | 1,348 | | |
| Short-Term Investment — | |
| Investment Company | | | 175 | | | | — | | | | — | | | | 175 | | |
| Total Assets | | $ | 1,523 | | | $ | — | | | $ | — | | | $ | 1,523 | | |
Transfers between investment levels may occur as the markets fluctuate and/or the availability of data used in an investment's valuation changes. The Portfolio recognizes transfers between the levels as of the end of the period. As of December 31, 2011, the Portfolio did not have any significant investments transfer between investment levels.
The accompanying notes are an integral part of the financial statements.
29
2011 Annual Report
December 31, 2011
Investment Overview (unaudited)
Emerging Markets Portfolio
The Emerging Markets Portfolio (the "Portfolio") seeks long-term capital appreciation by investing primarily in growth-oriented equity securities of issuers in emerging market countries.
Performance
For the year ended December 31, 2011, the Portfolio had a total return based on net asset value and reinvestment of distributions per share of -18.41%, net of fees, for Class I shares. The Portfolio's Class I shares performed in line with its benchmark, the MSCI Emerging Markets Net Index (the "Index"), which returned -18.42%.
Factors Affecting Performance
• Emerging market equities (as measured by the Index) declined 18.4% in 2011 owing to a combination of factors, including downward revisions to growth in both the developed and emerging economies, as well as acknowledgement of the large structural problems in the developed economies. Emerging market equities' poor performance was also consistent with the historic pattern of equities underperforming during the third year of secular bear markets.
• Emerging markets underperformed developed markets, as measured by the MSCI World Index, during the period. In Asia (-17.4%), Indonesia was the only largely positive performing market (6.0%) with Malaysia (+0.1%) and the Philippines (-0.9%) relatively flat. Indonesia and Philippines were some of our largest overweights this year. The worst-performing Asian market by far was India (-37.2%). Taiwan (-20.9%) and China (-18.4%) were also laggards, and both were underweights in the Portfolio. In Latin America (-19.4%), Colombia (-5.0%) was the relative best performer, followed by Mexico (-12.1%). Brazil (-21.9%) was the region's worst-performing market, and was an underweight position for us. In Emerging Europe, Middle East and Africa (EMEA) (-20.4%), the Czech Republic was the region's best performer by far, with a single-digit negative return (-6.0%), and it was one of our overweights for the year. Egypt (-46.9%) and Turkey (-14.4%), both of which were slight overweights during the year, were the worst-performing EMEA markets.
• The Portfolio's relative gains were driven by stock selection in Brazil, Korea, and Turkey, and overweight allocations to the Philippines and Indonesia.
• Positive contributions were primarily offset by stock selection in China, an overweight allocation to Egypt, and stock selection in and an allocation to Mexico, all of which detracted from relative returns.
Management Strategies
• With accommodative fiscal and monetary policies reaching their limits in the developed world, we believe that economic cycles — in developed and emerging economies alike — are likely to gradually become shorter and remain volatile. In addition, the high prices of energy and other commodities have continued to negatively impact demand. Until commodities prices correct — or at least remain sideways — equity markets will have difficulty recovering in a sustained manner.
• In addition, China's unique role as a driver of commodities prices remains vulnerable. The country has reached a mature level in its development and the rest of the world — both emerging and developed — is not capable of compensating for China's astounding share of commodities demand.
• In December, as throughout most of 2011, we remained focused on seeking sources of stable, somewhat defensive growth in the Portfolio. Emerging markets have not decoupled from the U.S. and are increasingly integrated with it and other developed countries due to globalization, trade and capital flows. We have been overweight the countries and companies in those sectors we assessed to be relatively most stable and least cyclical, as well as those countries with fairly resilient domestic demand and whose current account balances should benefit from an eventually declining cost of their energy import bills. We were overweight Indonesia, the Philippines, the Czech Republic, Turkey and Thailand.
• Among the criteria contributing to our overweight allocations is an assessment of which countries have undervalued currencies. The run-up in commodities over the last decade has led many emerging market currencies (primarily the heavy commodities exporters) to become less competitive. In recent months, there has been a notable change since the
30
2011 Annual Report
December 31, 2011
Investment Overview (unaudited) (cont'd)
Emerging Markets Portfolio
global financial crisis began in 2008: dispersion between different emerging markets — that is, differentials among equity market performance — has begun to show signs of rising off its all-time lows. We continue to believe dispersion should gradually continue to rise as investors begin to distinguish the wide range of fundamentals among individual countries.
• In addition to these country allocations, the Portfolio overall was overweight companies that we believe are capable of delivering relatively stable earnings despite domestic inflation and sluggish import demand in developed markets. We favored select stocks in the telecommunications sector and had an underweight to financial companies — we took both positions beginning in late 2010. We maintained our underweight to materials as additional disappointing macro data from China will likely put margin pressure on many materials producers globally. The Portfolio remains overweight consumer-related companies that, in our view, have quality management, strong balance sheets, and the ability to continue generating significant free cash flow.
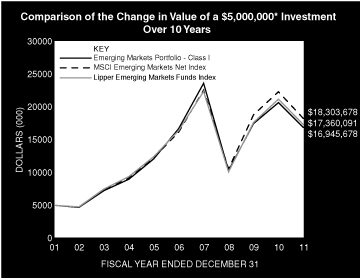
* Minimum Investment
In accordance with SEC regulations, Portfolio's performance shown assumes that all recurring fees (including management fees) were deducted and all dividends and distributions were reinvested. The performance of Class P shares will vary from the Class I shares based upon its different inception date and will be negatively impacted by additional fees assessed to that class.
Performance Compared to the Morgan Stanley Capital International (MSCI) Emerging Markets Net Index(1) and the Lipper Emerging Markets Funds Index(2)
| | | Period Ended December 31, 2011 | |
| | | Total Returns(3) | |
| | | | | Average Annual | |
| | | One
Year | | Five
Years | | Ten
Years | | Since
Inception(6) | |
Portfolio — Class I Shares
w/o sales charges(4) | | | –18.41 | % | | | 0.23 | % | | | 12.98 | % | | | 8.70 | % | |
MSCI Emerging Markets
Net Index | | | –18.42 | | | | 2.40 | | | | 13.86 | | | | 8.46 | | |
Lipper Emerging Markets
Funds Index | | | –18.37 | | | | 1.04 | | | | 13.26 | | | | N/A | | |
Portfolio — Class P Shares
w/o sales charges(5) | | | –18.63 | | | | –0.02 | | | | 12.69 | | | | 7.48 | | |
MSCI Emerging Markets
Net Index | | | –18.42 | | | | 2.40 | | | | 13.86 | | | | 6.79 | | |
Lipper Emerging Markets
Funds Index | | | –18.37 | | | | 1.04 | | | | 13.26 | | | | 6.29 | | |
Performance data quoted represents past performance, which is no guarantee of future results, and current performance may be lower or higher than the figures shown. Performance assumes that all dividends and distributions, if any, were reinvested. For the most recent month-end performance figures, please visit www.morganstanley.com/im. Investment return and principal value will fluctuate so that Portfolio shares, when redeemed, may be worth more or less than their original cost. Total returns do not reflect the deduction of taxes that a shareholder would pay on Portfolio distributions or the redemption of Portfolio shares. Performance of share classes will vary due to difference in expenses.
31
2011 Annual Report
December 31, 2011
Investment Overview (unaudited) (cont'd)
Emerging Markets Portfolio
(1) The Morgan Stanley Capital International (MSCI) Emerging Markets Net Index is a free float-adjusted market capitalization weighted index that is designed to measure equity market performance of emerging markets. The term "free float" represents the portion of shares outstanding that are deemed to be available for purchase in the public equity markets by investors. The MSCI Emerging Markets Net Index currently consists of 21 emerging market country indices. The performance of the Index is listed in U.S. dollars and assumes reinvestment of net dividends. The Index is unmanaged and its returns do not include any sales charges or fees. Such costs would lower performance. It is not possible to invest directly in an index.
(2) The Lipper Emerging Markets Funds Index is an equally weighted performance index of the largest qualifying funds (based on net assets) in the Lipper Emerging Markets Funds classification. The Index, which is adjusted for capital gains distributions and income dividends, is unmanaged and should not be considered an investment. There are currently 30 funds represented in this Index. As of the date of this report, the Portfolio is in the Lipper Emerging Markets Funds classification.
(3) Total returns for the Portfolio reflect fees waived and expenses reimbursed, if applicable, by the Adviser. Without such waivers and reimbursements, total returns would have been lower. The fee waivers and/or expense reimbursements will continue for one year or until such time as the Fund's Board of Directors acts to discontinue all or a portion of such waivers and/or expense reimbursements when it deems that such action is appropriate.
(4) Commenced operations on September 25, 1992.
(5) Commenced offering on January 2, 1996.
(6) For comparative purposes, average annual since inception returns listed for the Indexes refer to the inception date or initial offering of the respective share class of the Portfolio, not the inception of the Index.
Portfolio Composition*
| Classification | | Percentage of
Total Investments | |
| Other** | | | 57.2 | % | |
| Commercial Banks | | | 12.9 | | |
| Oil, Gas & Consumable Fuels | | | 8.0 | | |
| Beverages | | | 5.8 | | |
| Short-Term Investments | | | 5.4 | | |
| Food Products | | | 5.4 | | |
| Semiconductors & Semiconductor Equipment | | | 5.3 | | |
| Total Investments | | | 100.0 | % | |
* Percentages indicated are based upon total investments (excluding Securities held as Collateral on Loaned Securities) as of December 31, 2011.
** Industries representing less than 5% of total investments.
32
2011 Annual Report
December 31, 2011
Portfolio of Investments
Emerging Markets Portfolio
| | | Shares | | Value
(000) | |
| Common Stocks (97.9%) | |
| Argentina (0.2%) | |
| Banco Macro SA ADR120,750 | | $ | 2,355 | | |
| Brazil (10.3%) | |
| Banco do Brasil SA | | | 195,600 | | | | 2,485 | | |
| BRF - Brasil Foods SA | | | 899,652 | | | | 17,566 | | |
Cia de Bebidas das Americas
(Preference) ADR (a) | | | 524,400 | | | | 18,926 | | |
| Cielo SA | | | 285,300 | | | | 7,372 | | |
| Itau Unibanco Holding SA (Preference) | | | 222,500 | | | | 4,055 | | |
| Itau Unibanco Holding SA (Preference) ADR (a) | | | 775,974 | | | | 14,402 | | |
| MRV Engenharia e Participacoes SA | | | 556,800 | | | | 3,194 | | |
PDG Realty SA Empreendimentos e
Participacoes | | | 1,657,800 | | | | 5,244 | | |
| Petroleo Brasileiro SA (Preference) | | | 780,972 | | | | 8,998 | | |
| Petroleo Brasileiro SA ADR | | | 401,600 | | | | 9,980 | | |
| Petroleo Brasileiro SA Sponsored ADR (a) | | | 112,924 | | | | 2,653 | | |
| Telefonica Brasil SA ADR (a) | | | 339,300 | | | | 9,273 | | |
| Ultrapar Participacoes SA | | | 410,400 | | | | 7,043 | | |
| Vale SA (Preference) | | | 150,084 | | | | 3,043 | | |
| Vale SA (Preference) ADR (a) | | | 495,675 | | | | 10,211 | | |
| Vale SA ADR (a) | | | 162,400 | | | | 3,483 | | |
| | | | 127,928 | | |
| Chile (2.6%) | |
| Banco Santander Chile ADR | | | 83,400 | | | | 6,313 | | |
| Cencosud SA | | | 1,157,802 | | | | 6,664 | | |
| Empresa Nacional de Electricidad SA | | | 3,413,959 | | | | 5,027 | | |
| Empresa Nacional de Electricidad SA ADR | | | 6,600 | | | | 293 | | |
| Enersis SA | | | 383,166 | | | | 135 | | |
| Enersis SA ADR | | | 404,800 | | | | 7,137 | | |
| SACI Falabella | | | 898,925 | | | | 6,991 | | |
| | | | 32,560 | | |
| China (11.5%) | |
| Baidu, Inc. ADR (a)(b) | | | 69,300 | | | | 8,071 | | |
| Belle International Holdings Ltd. (c) | | | 5,088,000 | | | | 8,870 | | |
| China Construction Bank Corp. H Shares (a)(c) | | | 21,387,250 | | | | 14,925 | | |
| China Life Insurance Co., Ltd. H Shares (c) | | | 1,897,000 | | | | 4,690 | | |
| China Mengniu Dairy Co., Ltd. (c) | | | 2,956,000 | | | | 6,912 | | |
China Minsheng Banking Corp., Ltd.
H Shares (a)(c) | | | 3,532,500 | | | | 3,061 | | |
China Pacific Insurance Group Co., Ltd.
H Shares (a)(c) | | | 3,527,600 | | | | 10,038 | | |
| China Resources Enterprise Ltd. (c) | | | 514,000 | | | | 1,764 | | |
| China Resources Power Holdings Co., Ltd. (c) | | | 6,025,900 | | | | 11,623 | | |
| China Telecom Corp., Ltd. H Shares (c) | | | 16,670,000 | | | | 9,487 | | |
China ZhengTong Auto Services
Holdings Ltd. (a)(b)(c) | | | 4,147,000 | | | | 4,069 | | |
| Chow Tai Fook Jewellery Group Ltd. (b)(c)(d) | | | 3,246,800 | | | | 5,819 | | |
| GCL Poly Energy Holdings Ltd. (a)(c) | | | 14,199,000 | | | | 3,967 | | |
| Hengan International Group Co., Ltd. (a)(c) | | | 984,500 | | | | 9,209 | | |
| Ping An Insurance Group Co. H Shares (c) | | | 1,109,500 | | | | 7,314 | | |
Shanghai Pharmaceuticals
Holding Co., Ltd. H Shares (b)(c) | | | 2,175,700 | | | | 3,524 | | |
| | | Shares | | Value
(000) | |
| Tencent Holdings Ltd. (a)(c) | | | 754,000 | | | $ | 15,155 | | |
| Want Want China Holdings Ltd. (a)(c) | | | 7,383,000 | | | | 7,367 | | |
| Yanzhou Coal Mining Co., Ltd. H Shares (a)(c) | | | 3,350,000 | | | | 7,151 | | |
| | | | 143,016 | | |
| Czech Republic (1.3%) | |
| CEZ AS | | | 291,200 | | | | 11,585 | | |
| Telefonica Czech Republic AS | | | 260,500 | | | | 5,052 | | |
| | | | 16,637 | | |
| Egypt (1.1%) | |
| Commercial International Bank Egypt SAE | | | 1,732,351 | | | | 5,371 | | |
| Juhayna Food Industries (b) | | | 4,060,197 | | | | 2,626 | | |
| Telecom Egypt Co. | | | 2,471,552 | | | | 5,414 | | |
| | | | 13,411 | | |
| Hong Kong (0.6%) | |
| Samsonite International SA (b) | | | 4,844,100 | | | | 7,597 | | |
| Hungary (0.8%) | |
| Richter Gedeon Nyrt | | | 66,220 | | | | 9,301 | | |
| India (6.1%) | |
| Asian Paints Ltd. | | | 87,322 | | | | 4,263 | | |
| Dr. Reddy's Laboratories Ltd. | | | 239,072 | | | | 7,104 | | |
| GAIL India Ltd. | | | 436,670 | | | | 3,155 | | |
| Glenmark Pharmaceuticals Ltd. | | | 948,960 | | | | 5,245 | | |
| HDFC Bank Ltd. | | | 1,272,817 | | | | 10,231 | | |
| IndusInd Bank Ltd. | | | 1,028,214 | | | | 4,517 | | |
| ITC Ltd. | | | 2,334,109 | | | | 8,848 | | |
| Jindal Steel & Power Ltd. | | | 434,610 | | | | 3,708 | | |
| Larsen & Toubro Ltd. | | | 194,282 | | | | 3,639 | | |
| Mahindra & Mahindra Ltd. | | | 435,493 | | | | 5,591 | | |
| Reliance Industries Ltd. | | | 244,461 | | | | 3,190 | | |
| Tata Consultancy Services Ltd. | | | 508,763 | | | | 11,119 | | |
| Tata Steel Ltd. | | | 835,970 | | | | 5,279 | | |
| | | | 75,889 | | |
| Indonesia (5.9%) | |
| Astra International Tbk PT | | | 1,632,000 | | | | 13,319 | | |
| Bank Central Asia Tbk PT | | | 11,410,000 | | | | 10,067 | | |
| Bank Mandiri Tbk PT | | | 12,348,000 | | | | 9,192 | | |
| Indofood Sukses Makmur Tbk PT | | | 12,733,500 | | | | 6,460 | | |
| Indosat Tbk PT | | | 13,329,500 | | | | 8,306 | | |
| Kalbe Farma Tbk PT | | | 12,479,000 | | | | 4,679 | | |
| Lippo Karawaci Tbk PT | | | 136,938,000 | | | | 9,967 | | |
| Telekomunikasi Indonesia Tbk PT | | | 15,075,500 | | | | 11,721 | | |
| | | | 73,711 | | |
| Korea, Republic of (16.7%) | |
| Cheil Industries, Inc. | | | 72,278 | | | | 6,373 | | |
| Cheil Worldwide, Inc. | | | 192,495 | | | | 3,179 | | |
Doosan Heavy Industries and
Construction Co., Ltd. | | | 88,600 | | | | 5,034 | | |
| Hyundai Engineering & Construction Co., Ltd. (b) | | | 130,031 | | | | 8,000 | | |
| Hyundai Heavy Industries Co., Ltd. | | | 21,423 | | | | 4,825 | | |
| Hyundai Mobis (b) | | | 36,183 | | | | 9,219 | | |
| Hyundai Motor Co. | | | 104,166 | | | | 19,359 | | |
| Hyundai Steel Co. (b) | | | 79,791 | | | | 6,678 | | |
The accompanying notes are an integral part of the financial statements.
33
2011 Annual Report
December 31, 2011
Portfolio of Investments (cont'd)
Emerging Markets Portfolio
| | | Shares | | Value
(000) | |
| Korea, Republic of (cont'd) | |
| KB Financial Group, Inc. | | | 211,337 | | | $ | 6,708 | | |
| Korea Aerospace Industries Ltd. | | | 212,200 | | | | 7,314 | | |
| Korea Kumho Petrochemical (b) | | | 31,254 | | | | 4,582 | | |
| Korean Air Lines Co., Ltd. (b) | | | 152,009 | | | | 5,776 | | |
| LG Chem Ltd. | | | 40,386 | | | | 11,215 | | |
| LG Household & Health Care Ltd. | | | 8,228 | | | | 3,482 | | |
| Mando Corp. | | | 35,189 | | | | 6,323 | | |
| NCSoft Corp. | | | 24,488 | | | | 6,557 | | |
| Nexon Co., Ltd. (a)(b) | | | 427,800 | | | | 6,153 | | |
| NHN Corp. | | | 31,021 | | | | 5,691 | | |
| Samsung Electronics Co., Ltd. | | | 42,236 | | | | 38,870 | | |
| Samsung Electronics Co., Ltd. (Preference) | | | 14,554 | | | | 8,456 | | |
| Samsung Fire & Marine Insurance Co., Ltd. | | | 37,204 | | | | 6,835 | | |
| Samsung Heavy Industries Co., Ltd. | | | 124,710 | | | | 3,051 | | |
| Shinhan Financial Group Co., Ltd. | | | 278,952 | | | | 9,684 | | |
| SK C&C Co., Ltd. | | | 31,928 | | | | 3,249 | | |
| SK Innovation Co., Ltd. | | | 32,520 | | | | 4,037 | | |
| SSCP Co., Ltd. (b) | | | 254,760 | | | | 976 | | |
| Woongjin Coway Co., Ltd. | | | 214,792 | | | | 6,840 | | |
| | | | 208,466 | | |
| Lebanon (0.7%) | |
| Banque Audi sal-Audi Saradar Group GDR | | | 728,865 | | | | 4,519 | | |
| BLOM Bank SAL GDR | | | 588,210 | | | | 4,300 | | |
| | | | 8,819 | | |
| Malaysia (3.2%) | |
| AirAsia Bhd | | | 5,405,300 | | | | 6,428 | | |
| Axiata Group Bhd | | | 10,727,600 | | | | 17,394 | | |
| CIMB Group Holdings Bhd | | | 3,382,900 | | | | 7,940 | | |
| Sime Darby Bhd | | | 2,645,200 | | | | 7,677 | | |
| | | | 39,439 | | |
| Mexico (3.5%) | |
| America Movil SAB de CV, Class L ADR | | | 445,588 | | | | 10,070 | | |
Fomento Economico Mexicano SAB de CV
(Units) ADR (e) | | | 252,700 | | | | 17,616 | | |
| Grupo Televisa SAB ADR (a) | | | 314,600 | | | | 6,625 | | |
| Mexichem SAB de CV | | | 1,163,700 | | | | 3,644 | | |
| Wal-Mart de Mexico SAB de CV Series V | | | 1,985,200 | | | | 5,449 | | |
| | | | 43,404 | | |
| Peru (1.6%) | |
| Cia de Minas Buenaventura SA ADR | | | 237,490 | | | | 9,105 | | |
| Credicorp Ltd. | | | 95,815 | | | | 10,489 | | |
| | | | 19,594 | | |
| Philippines (4.3%) | |
| Ayala Corp. | | | 1,103,772 | | | | 7,846 | | |
| Metro Pacific Investments Corp. | | | 135,962,000 | | | | 11,378 | | |
| Metropolitan Bank & Trust | | | 8,065,121 | | | | 12,558 | | |
| Philippine Long Distance Telephone Co. | | | 194,580 | | | | 11,325 | | |
| SM Investments Corp. | | | 792,220 | | | | 10,576 | | |
| | | | 53,683 | | |
| | | Shares | | Value
(000) | |
| Poland (2.5%) | |
| Central European Distribution Corp. (a)(b) | | | 444,485 | | | $ | 1,944 | | |
| Jeronimo Martins SGPS SA (b) | | | 958,030 | | | | 15,859 | | |
| Telekomunikacja Polska SA | | | 2,631,633 | | | | 13,140 | | |
| | | | 30,943 | | |
| Qatar (0.5%) | |
| Industries Qatar QSC | | | 185,600 | | | | 6,779 | | |
| Russia (3.6%) | |
| Eurasia Drilling Co., Ltd. GDR | | | 181,591 | | | | 4,267 | | |
| Lukoil OAO ADR | | | 421,756 | | | | 22,332 | | |
| Protek (b) | | | 1,573,558 | | | | 884 | | |
| Rosneft Oil Co. (Registered GDR) | | | 1,776,275 | | | | 11,723 | | |
| Tatneft ADR | | | 179,500 | | | | 5,313 | | |
| | | | 44,519 | | |
| South Africa (5.3%) | |
| AVI Ltd. | | | 1,795,870 | | | | 8,837 | | |
| Clicks Group Ltd. | | | 1,532,103 | | | | 8,774 | | |
| Naspers Ltd., Class N (a) | | | 411,517 | | | | 18,005 | | |
| Pick n Pay Stores Ltd. (a) | | | 1,390,518 | | | | 8,027 | | |
| SABMiller PLC (a) | | | 461,282 | | | | 16,176 | | |
| Sasol Ltd. | | | 135,300 | | | | 6,461 | | |
| | | | 66,280 | | |
| Switzerland (0.5%) | |
| Swatch Group AG (The) | | | 15,933 | | | | 5,962 | | |
| Taiwan (6.1%) | |
| Asustek Computer, Inc. | | | 916,536 | | | | 6,523 | | |
| Catcher Technology Co., Ltd. | | | 666,000 | | | | 3,090 | | |
| China Steel Corp. | | | 99,921 | | | | 95 | | |
| Formosa Plastics Corp. | | | 1,801,000 | | | | 4,806 | | |
| Foxconn Technology Co. Ltd. | | | 8,000 | | | | 26 | | |
| Fubon Financial Holding Co., Ltd. | | | 4,360,795 | | | | 4,616 | | |
| Hon Hai Precision Industry Co., Ltd. | | | 4,472,911 | | | | 12,246 | | |
| HTC Corp. | | | 307,954 | | | | 5,055 | | |
| Largan Precision Co., Ltd. | | | 145,000 | | | | 2,710 | | |
| Lung Yen Life Service Corp. | | | 882,000 | | | | 2,590 | | |
| MStar Semiconductor, Inc. | | | 631,000 | | | | 3,293 | | |
| Taiwan Cement Corp. | | | 3,953,000 | | | | 4,569 | | |
| Taiwan Semiconductor Manufacturing Co., Ltd. | | | 5,632,205 | | | | 14,099 | | |
| Uni-President Enterprises Corp. | | | 5,877,730 | | | | 8,590 | | |
| Yuanta Financial Holding Co., Ltd. (b) | | | 6,278,000 | | | | 3,203 | | |
| | | | 75,511 | | |
| Thailand (3.8%) | |
| Banpu PCL NVDR | | | 451,000 | | | | 7,805 | | |
| Kasikornbank PCL (Foreign) | | | 423,500 | | | | 1,671 | | |
| Kasikornbank PCL NVDR | | | 2,409,900 | | | | 9,319 | | |
| Land and Houses PCL NVDR | | | 45,619,000 | | | | 8,892 | | |
| PTT PCL (Foreign) | | | 767,900 | | | | 7,740 | | |
| Siam Cement PCL NVDR | | | 795,900 | | | | 7,896 | | |
| Thai Airways International PCL | | | 6,977,600 | | | | 4,423 | | |
| | | | 47,746 | | |
The accompanying notes are an integral part of the financial statements.
34
2011 Annual Report
December 31, 2011
Portfolio of Investments (cont'd)
Emerging Markets Portfolio
| | | Shares | | Value
(000) | |
| Turkey (3.3%) | |
| Anadolu Efes Biracilik Ve Malt Sanayii AS | | | 1,275,909 | | | $ | 15,361 | | |
| Coca-Cola Icecek AS (Units) (e) | | | 444,025 | | | | 5,299 | | |
| Turk Telekomunikasyon AS | | | 1,933,589 | | | | 7,168 | | |
| Turkiye Garanti Bankasi AS (Units) (e) | | | 4,137,963 | | | | 12,892 | | |
| | | | 40,720 | | |
| United States (1.9%) | |
| Mead Johnson Nutrition Co. | | | 167,670 | | | | 11,524 | | |
| Yum! Brands, Inc. | | | 215,271 | | | | 12,703 | | |
| | | | 24,227 | | |
| Total Common Stocks (Cost $1,170,080) | | | 1,218,497 | | |
| Investment Company (0.6%) | |
| India (0.6%) | |
Morgan Stanley Growth Fund (See Note G-2) (b)
(Cost $1,667) | | | 8,475,378 | | | | 7,822 | | |
| Short-Term Investments (13.0%) | |
| Securities held as Collateral on Loaned Securities (7.4%) | |
| Investment Company (5.4%) | |
Morgan Stanley Institutional Liquidity
Funds — Money Market Portfolio —
Institutional Class (See Note G-2) | | | 67,559,646 | | | | 67,560 | | |
| | | Face
Amount
(000) | | | |
| Repurchase Agreements (2.0%) | |
Barclays Capital, Inc., (0.02%, dated
12/30/11, due 1/3/12; proceeds $2,901;
fully collateralized by a U.S. Government
Obligation; U.S. Treasury Bond 4.50%
due 5/15/38; valued at $2,959) | | $ | 2,901 | | | | 2,901 | | |
Merrill Lynch & Co., Inc., (0.07%, dated
12/30/11, due 1/3/12; proceeds $21,552;
fully collateralized by a U.S. Government
Agency; Government National Mortgage
Association 3.50% due 11/20/41; valued
at $21,983) | | | 21,552 | | | | 21,552 | | |
| | | | 24,453 | | |
Total Securities held as Collateral on Loaned
Securities (Cost $92,013) | | | 92,013 | | |
| | | Shares | | | |
| Investment Company (5.6%) | |
Morgan Stanley Institutional Liquidity
Funds — Money Market Portfolio —
Institutional Class (See Note G-2)
(Cost $70,052) | | | 70,052,113 | | | | 70,052 | | |
| Total Short-Term Investments (Cost $162,065) | | | 162,065 | | |
Total Investments (111.5%) (Cost $1,333,812)
including $89,322 of Securities Loaned | | | 1,388,384 | | |
| Liabilities in Excess of Other Assets (-11.5%) | | | (143,006 | ) | |
| Net Assets (100.0%) | | $ | 1,245,378 | | |
(a) All or a portion of this security was on loan at December 31, 2011.
(b) Non-income producing security.
(c) Security trades on the Hong Kong exchange.
(d) 144A security — Certain conditions for public sale may exist. Unless otherwise noted, these securities are deemed to be liquid.
(e) Consists of one or more classes of securities traded together as a unit; stocks with attached warrants.
ADR American Depositary Receipt.
GDR Global Depositary Receipt.
NVDR Non-Voting Depositary Receipt.
Fair Value Measurement Information:
The following is a summary of the inputs used to value the Portfolio's investments as of December 31, 2011. (See Note A-9 to the financial statements for further information regarding fair value measurement.)
| Investment Type | | Level 1
Unadjusted
quoted
prices
(000) | | Level 2
Other
significant
observable
inputs
(000) | | Level 3
Significant
unobservable
inputs
(000) | | Total
(000) | |
| Assets: | | | | | | | | | |
| Common Stocks | | | | | | | | | |
Aerospace &
Defense | | $ | 7,314 | | | $ | — | | | $ | — | | | $ | 7,314 | | |
| Airlines | | | 16,627 | | | | — | | | | — | | | | 16,627 | | |
| Auto Components | | | 15,542 | | | | — | | | | — | | | | 15,542 | | |
| Automobiles | | | 38,269 | | | | — | | | | — | | | | 38,269 | | |
| Beverages | | | 75,322 | | | | — | | | | — | | | | 75,322 | | |
| Capital Markets | | | 3,203 | | | | — | | | | — | | | | 3,203 | | |
| Chemicals | | | 35,859 | | | | — | | | | — | | | | 35,859 | | |
| Commercial Banks | | | 162,537 | | | | 4,517 | | | | — | | | | 167,054 | | |
Communications
Equipment | | | 5,055 | | | | — | | | | — | | | | 5,055 | | |
Computers &
Peripherals | | | 9,639 | | | | — | | | | — | | | | 9,639 | | |
Construction &
Engineering | | | 19,263 | | | | — | | | | — | | | | 19,263 | | |
Construction
Materials | | | 12,465 | | | | — | | | | — | | | | 12,465 | | |
Diversified Financial
Services | | | 23,840 | | | | — | | | | — | | | | 23,840 | | |
Diversified
Telecommunication
Services | | | 61,255 | | | | — | | | | — | | | | 61,255 | | |
| Electric Utilities | | | 18,857 | | | | — | | | | — | | | | 18,857 | | |
Electronic Equipment,
Instruments &
Components | | | 14,956 | | | | — | | | | — | | | | 14,956 | | |
Energy Equipment &
Services | | | 4,267 | | | | — | | | | — | | | | 4,267 | | |
Food & Staples
Retailing | | | 37,763 | | | | — | | | | — | | | | 37,763 | | |
| Food Products | | | 69,882 | | | | — | | | | — | | | | 69,882 | | |
| Gas Utilities | | | 3,155 | | | | — | | | | — | | | | 3,155 | | |
Health Care
Providers &
Services | | | 4,408 | | | | — | | | | — | | | | 4,408 | | |
The accompanying notes are an integral part of the financial statements.
35
2011 Annual Report
December 31, 2011
Portfolio of Investments (cont'd)
Emerging Markets Portfolio
Fair Value Measurement Information: (cont'd)
| Investment Type | | Level 1
Unadjusted
quoted
prices
(000) | | Level 2
Other
significant
observable
inputs
(000) | | Level 3
Significant
unobservable
inputs
(000) | | Total
(000) | |
| Common Stocks (cont'd) | | | | | | | | | |
Hotels, Restaurants &
Leisure | | $ | 12,703 | | | $ | — | | | $ | — | | | $ | 12,703 | | |
| Household Durables | | | 15,278 | | | | — | | | | — | | | | 15,278 | | |
| Household Products | | | 3,482 | | | | — | | | | — | | | | 3,482 | | |
Independent Power
Producers &
Energy Traders | | | 16,943 | | | | — | | | | — | | | | 16,943 | | |
Industrial
Conglomerates | | | 25,032 | | | | — | | | | — | | | | 25,032 | | |
Information
Technology
Services | | | 21,740 | | | | — | | | | — | | | | 21,740 | | |
| Insurance | | | 28,877 | | | | — | | | | — | | | | 28,877 | | |
Internet Software &
Services | | | 28,917 | | | | — | | | | — | | | | 28,917 | | |
| Machinery | | | 7,876 | | | | — | | | | — | | | | 7,876 | | |
| Media | | | 27,809 | | | | — | | | | — | | | | 27,809 | | |
| Metals & Mining | | | 41,602 | | | | — | | | | — | | | | 41,602 | | |
| Multiline Retail | | | 15,765 | | | | — | | | | — | | | | 15,765 | | |
Oil, Gas &
Consumable Fuels | | | 104,426 | | | | — | | | | — | | | | 104,426 | | |
| Personal Products | | | 9,209 | | | | — | | | | — | | | | 9,209 | | |
| Pharmaceuticals | | | 26,329 | | | | — | | | | — | | | | 26,329 | | |
Real Estate
Management &
Development | | | 18,859 | | | | — | | | | — | | | | 18,859 | | |
Semiconductors &
Semiconductor
Equipment | | | 68,685 | | | | — | | | | — | | | | 68,685 | | |
| Software | | | 12,710 | | | | — | | | | — | | | | 12,710 | | |
| Specialty Retail | | | 18,758 | | | | — | | | | — | | | | 18,758 | | |
Textiles, Apparel &
Luxury Goods | | | 13,559 | | | | — | | | | — | | | | 13,559 | | |
| Tobacco | | | 8,848 | | | | — | | | | — | | | | 8,848 | | |
Wireless
Telecommunication
Services | | | 47,095 | | | | — | | | | — | | | | 47,095 | | |
Total Common
Stocks | | | 1,213,980 | | | | 4,517 | | | | — | | | | 1,218,497 | | |
| Investment Company | | | 7,822 | | | | — | | | | — | | | | 7,822 | | |
Short-Term
Investments | |
| Investment Company | | | 137,612 | | | | — | | | | — | | | | 137,612 | | |
Repurchase
Agreements | | | — | | | | 24,453 | | | | — | | | | 24,453 | | |
Total Short-Term
Investments | | | 137,612 | | | | 24,453 | | | | — | | | | 162,065 | | |
| Total Assets | | $ | 1,359,414 | | | $ | 28,970 | | | $ | — | | | $ | 1,388,384 | | |
Transfers between investment levels may occur as the markets fluctuate and/or the availability of data used in an investment's valuation changes. The Portfolio recognizes transfers between the levels as of the end of the period. As of December 31, 2011, securities with a total value of approximately $884,000 transferred from Level 2 to Level 1. At December 31, 2010, the fair market value of certain securities were adjusted due to developments which occurred between the time of the close of the foreign markets on which they trade and the close of business on the NYSE which resulted in their Level 2 classification.
Following is a reconciliation of investments in which significant unobservable inputs (Level 3) were used in determining fair value.
| | | Common
Stocks
(000) | |
| Beginning Balance | | $ | — | † | |
| Purchases | | | — | | |
| Sales | | | — | ‡ | |
| Amortization of discount | | | — | | |
| Transfers in | | | — | | |
| Transfers out | | | — | | |
| Change in unrealized appreciation (depreciation) | | | 12,045 | | |
| Realized gains (losses) | | | (12,045 | ) | |
| Ending Balance | | $ | — | | |
Net change in unrealized appreciation/depreciation
from investments still held as of December 31, 2011 | | $ | — | | |
† Includes one or more securities which are valued at zero.
‡ Includes one or more securities with proceeds from sales of zero.
The accompanying notes are an integral part of the financial statements.
36
2011 Annual Report
December 31, 2011
Investment Overview (unaudited)
Global Advantage Portfolio
The Global Advantage Portfolio (the "Portfolio") seeks long-term capital appreciation by investing primarily in established companies located throughout the world, with capitalizations within the range of companies included in the MSCI All Country World Index.
Performance
For the year ended December 31, 2011, the Portfolio had a total return based on net asset value and reinvestment of distributions per share of 0.34%, net of fees, for Class I shares. The Portfolio's Class I shares outperformed against its benchmark, the MSCI All Country World Index (the "Index"), which returned -7.35%.
Factors Affecting Performance
• Global equity markets began 2011 on a relatively optimistic note but suffered a stream of disappointments as the year progressed, falling 7.35% for the year overall (as measured by the Index). Headwinds to the markets' progress included lackluster economic growth in the developed world, fears about a "hard landing" in China's economy, the worsening European debt crisis, political dysfunction in the U.S. and Europe, a tragic earthquake and tsunami in Japan, and social and political upheaval across the Middle East. Although corporate balance sheets and earnings in the U.S. and Europe remained strong throughout the year, waning investor confidence kept markets volatile. The U.S. market outperformed those of Europe, Japan, and Asia ex-Japan, and developed market equities bested emerging market equities. (The performance of regional markets and developed and emerging markets is measured by their respective MSCI indexes.)
• The consumer staples sector contributed most to outperformance versus the Index, although it was mainly driven by the Portfolio's overweight exposure to the sector. Stock selection also benefited relative results, primarily because of strong performance from holdings within the food, beverage, and tobacco industry.
• Stock selection in the industrials sector also aided returns. A position in a U.K. company that provides testing, inspection, and certification of goods was the top contributor.
• The financials sector also benefited relative performance, primarily because of the Portfolio's underweight exposure to the sector overall and especially its lack of exposure to bank stocks. Stock selection helped as well, with good performance from holdings in the insurance industry.
• The Portfolio's underweight exposure to health care, a sector which performed well during the period, and the negative performance of its sole holding in the sector, a supplier of scientific instruments and equipment used in diagnostics and analysis, were detractors from relative gains.
• An underweight and stock selection in energy hurt performance as well, largely due to a position in an oil and gas exploration and production company that lagged.
• Stock selection in the consumer discretionary sector was disadvantageous. A holding in a Hong Kong-based global consumer goods exporter was the largest detractor.
Management Strategies
• We look for high-quality growth companies that have these attributes: sustainable competitive advantages, business visibility, rising return on invested capital, free cash flow and a favorable risk/reward profile. In seeking these companies, we use intense fundamental research. Our emphasis is on secular growth, and as a result, short-term market events are not as meaningful in the stock selection process.
37
2011 Annual Report
December 31, 2011
Investment Overview (unaudited) (cont'd)
Global Advantage Portfolio
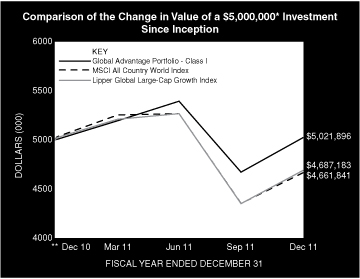
* Minimum Investment
** Commenced Operations on December 28, 2010.
In accordance with SEC regulations, Portfolio's performance shown assumes that all recurring fees (including management fees) were deducted and all dividends and distributions were reinvested. The performance of Class P, Class H, and Class L shares will vary from the Class I shares based upon it will be negatively impacted by additional fees assessed to these classes.
Performance Compared to the Morgan Stanley Capital International (MSCI) All Country World Index(1) and the Lipper Global Large-Cap Growth Funds Index(2)
| | | Period Ended December 31, 2011 | |
| | | Total Returns(3) | |
| | | | | Average Annual | |
| | | One
Year | | Five
Years | | Ten
Years | | Since
Inception(5) | |
Portfolio — Class I Shares
w/o sales charges(4) | | | 0.34 | % | | | — | | | | — | | | | 0.43 | % | |
| MSCI All Country World Index | | | –7.35 | | | | — | | | | — | | | | –6.71 | | |
Lipper Global Large-Cap
Growth Index | | | –6.68 | | | | — | | | | — | | | | –6.21 | | |
Portfolio — Class H Shares
w/o sales charges(4) | | | 0.08 | | | | — | | | | — | | | | 0.18 | | |
Portfolio — Class H Shares with
maximum 4.75% sales charges(4) | | | –4.68 | | | | — | | | | — | | | | –4.55 | | |
| MSCI All Country World Index | | | –7.35 | | | | — | | | | — | | | | –6.71 | | |
Lipper Global Large-Cap
Growth Index | | | –6.68 | | | | — | | | | — | | | | –6.21 | | |
Portfolio — Class L Shares
w/o sales charges(4) | | | –0.44 | | | | — | | | | — | | | | –0.34 | | |
| MSCI All Country World Index | | | –7.35 | | | | — | | | | — | | | | –6.71 | | |
Lipper Global Large-Cap
Growth Index | | | –6.68 | | | | — | | | | — | | | | –6.21 | | |
Portfolio — Class P Shares
w/o sales charges(4) | | | 0.07 | | | | — | | | | — | | | | 0.17 | | |
| MSCI All Country World Index | | | –7.35 | | | | — | | | | — | | | | –6.71 | | |
Lipper Global Large-Cap
Growth Index | | | –6.68 | | | | — | | | | — | | | | –6.21 | | |
Performance data quoted represents past performance, which is no guarantee of future results, and current performance may be lower or higher than the figures shown. Performance assumes that all dividends and distributions, if any, were reinvested. For the most recent month-end performance figures, please visit www.morganstanley.com/im. Investment return and principal value will fluctuate so that Portfolio shares, when redeemed, may be worth more or less than their original cost. Total returns do not reflect the deduction of taxes that a shareholder would pay on Portfolio distributions or the redemption of Portfolio shares. Performance of share classes will vary due to difference in expenses.
(1) The Morgan Stanley Capital International (MSCI) All Country World Index (ACWI) is a free float-adjusted market capitalization weighted index designed to measure the equity market performance of developed and emerging markets. The term "free float" represents the portion of shares outstanding that are deemed to be available for purchase in the public equity markets by investors. The performance of the Index is listed in U.S. dollars and assumes reinvestment of net dividends. The Index is unmanaged and its returns do not include any sales charges or fees. Such costs would lower performance. It is not possible to invest directly in an index.
(2) The Lipper Global Large-Cap Growth Funds Index is an equally weighted performance index of the largest qualifying funds (based on net assets) in the Lipper Global Large-Cap Growth Funds classification. The Index, which is adjusted for capital gains distributions and income dividends, is unmanaged and should not be considered an investment. There are currently 10 funds represented in this Index. As of the date of this Prospectus, the Portfolio is in the Lipper Global Large-Cap Growth Funds classification.
(3) Total returns for the Portfolio reflect fees waived and expenses reimbursed, if applicable, by the Adviser. Without such waivers and reimbursements, total returns would have been lower. The fee waivers and/or expense reimbursements will continue for one year or until such time as the Fund's Board of Directors acts to discontinue all or a portion of such waivers and/or expense reimbursements when it deems that such action is appropriate.
(4) Commenced operations on December 28, 2010.
(5) For comparative purposes, average annual since inception returns listed for the Indexes refer to the inception date or initial offering of the respective share class of the Portfolio, not the inception of the Index.
Portfolio Composition
| Classification | | Percentage of
Total Investments | |
| Other* | | | 51.6 | % | |
| Internet Software & Services | | | 9.7 | | |
| Beverages | | | 8.4 | | |
| Food Products | | | 8.0 | | |
| Commercial Services & Supplies | | | 6.1 | | |
| Hotels, Restaurants & Leisure | | | 5.8 | | |
| Computers & Peripherals | | | 5.3 | | |
| Professional Services | | | 5.1 | | |
| Total Investments | | | 100.0 | % | |
* Industries representing less than 5% of total investments.
38
2011 Annual Report
December 31, 2011
Portfolio of Investments
Global Advantage Portfolio
| | | Shares | | Value
(000) | |
| Common Stocks (95.0%) | |
| Australia (1.8%) | |
| QR National Ltd. | | | 13,942 | | | $ | 49 | | |
| Brazil (5.8%) | |
| LLX Logistica SA (a) | | | 18,753 | | | | 34 | | |
| Natura Cosmeticos SA | | | 3,991 | | | | 77 | | |
| OGX Petroleo e Gas Participacoes SA (a) | | | 6,138 | | | | 45 | | |
| | | | 156 | | |
| Canada (7.9%) | |
| Brookfield Asset Management, Inc., Class A | | | 3,568 | | | | 98 | | |
| Fairfax Financial Holdings Ltd. | | | 177 | | | | 76 | | |
| Groupe Aeroplan, Inc. | | | 3,230 | | | | 38 | | |
| | | | 212 | | |
| China (3.7%) | |
| China Merchants Holdings International Co., Ltd. (b) | | | 14,482 | | | | 42 | | |
| Tencent Holdings Ltd. (b) | | | 2,800 | | | | 56 | | |
| | | | 98 | | |
| Denmark (0.5%) | |
| Pandora A/S | | | 1,518 | | | | 14 | | |
| France (8.4%) | |
| Christian Dior SA | | | 435 | | | | 51 | | |
| Edenred | | | 4,987 | | | | 123 | | |
| Remy Cointreau SA | | | 656 | | | | 53 | | |
| | | | 227 | | |
| Greece (1.4%) | |
| Jumbo SA | | | 7,500 | | | | 37 | | |
| Hong Kong (3.8%) | |
| L'Occitane International SA | | | 31,500 | | | | 64 | | |
| Sun Art Retail Group Ltd. (a) | | | 30,500 | | | | 38 | | |
| | | | 102 | | |
| Singapore (2.8%) | |
| Jardine Matheson Holdings Ltd. | | | 1,621 | | | | 76 | | |
| Switzerland (8.7%) | |
| Nestle SA ADR | | | 2,012 | | | | 116 | | |
| Schindler Holding AG | | | 1,019 | | | | 119 | | |
| | | | 235 | | |
| United Kingdom (8.1%) | |
| Diageo PLC ADR | | | 938 | | | | 82 | | |
| Intertek Group PLC | | | 4,345 | | | | 137 | | |
| | | | 219 | | |
| United States (42.1%) | |
| Amazon.com, Inc. (a) | | | 504 | | | | 87 | | |
| Anheuser-Busch InBev N.V. ADR | | | 1,458 | | | | 89 | | |
| Apple, Inc. (a) | | | 348 | | | | 141 | | |
| Covanta Holding Corp. | | | 2,775 | | | | 38 | | |
| eBay, Inc. (a) | | | 2,968 | | | | 90 | | |
| Google, Inc., Class A (a) | | | 174 | | | | 112 | | |
| Li & Fung Ltd. (b) | | | 36,000 | | | | 67 | | |
| Mead Johnson Nutrition Co. | | | 1,393 | | | | 96 | | |
| Motorola Solutions, Inc. | | | 2,244 | | | | 104 | | |
| Philip Morris International, Inc. | | | 1,195 | | | | 94 | | |
| | | Shares | | Value
(000) | |
| Starbucks Corp. | | | 1,734 | | | $ | 80 | | |
| Weight Watchers International, Inc. | | | 1,155 | | | | 63 | | |
| Yum! Brands, Inc. | | | 1,279 | | | | 75 | | |
| | | | 1,136 | | |
| Total Common Stocks (Cost $2,543) | | | 2,561 | | |
| Short-Term Investment (3.7%) | |
| Investment Company (3.7%) | |
Morgan Stanley Institutional Liquidity
Funds — Money Market Portfolio —
Institutional Class (See Note G-2) (Cost $101) | | | 100,818 | | | | 101 | | |
| Total Investments (98.7%) (Cost $2,644) | | | 2,662 | | |
| Other Assets in Excess of Liabilities (1.3%) | | | 36 | | |
| Net Assets (100.0%) | | $ | 2,698 | | |
(a) Non-income producing security.
(b) Security trades on the Hong Kong exchange.
ADR American Depositary Receipt.
Fair Value Measurement Information:
The following is a summary of the inputs used to value the Portfolio's investments as of December 31, 2011. (See Note A-9 to the financial statements for further information regarding fair value measurement.)
| Investment Type | | Level 1
Unadjusted
quoted
prices
(000) | | Level 2
Other
significant
observable
inputs
(000) | | Level 3
Significant
unobservable
inputs
(000) | | Total
(000) | |
| Assets: | | | | | | | | | |
| Common Stocks | | | | | | | | | |
| Beverages | | $ | 224 | | | $ | — | | | $ | — | | | $ | 224 | | |
Commercial Services &
Supplies | | | 161 | | | | — | | | | — | | | | 161 | | |
| Communications Equipment | | | 104 | | | | — | | | | — | | | | 104 | | |
| Computers & Peripherals | | | 141 | | | | — | | | | — | | | | 141 | | |
| Distributors | | | 67 | | | | — | | | | — | | | | 67 | | |
Diversified Consumer
Services | | | 63 | | | | — | | | | — | | | | 63 | | |
| Food & Staples Retailing | | | 38 | | | | — | | | | — | | | | 38 | | |
| Food Products | | | 212 | | | | — | | | | — | | | | 212 | | |
Hotels, Restaurants &
Leisure | | | 155 | | | | — | | | | — | | | | 155 | | |
| Industrial Conglomerates | | | 76 | | | | — | | | | — | | | | 76 | | |
| Insurance | | | 76 | | | | — | | | | — | | | | 76 | | |
| Internet & Catalog Retail | | | 87 | | | | — | | | | — | | | | 87 | | |
| Internet Software & Services | | | 258 | | | | — | | | | — | | | | 258 | | |
| Machinery | | | 119 | | | | — | | | | — | | | | 119 | | |
| Media | | | 38 | | | | — | | | | — | | | | 38 | | |
| Oil, Gas & Consumable Fuels | | | 45 | | | | — | | | | — | | | | 45 | | |
| Personal Products | | | 77 | | | | — | | | | — | | | | 77 | | |
| Professional Services | | | 137 | | | | — | | | | — | | | | 137 | | |
Real Estate Management &
Development | | | 98 | | | | — | | | | — | | | | 98 | | |
| Road & Rail | | | 49 | | | | — | | | | — | | | | 49 | | |
| Specialty Retail | | | 101 | | | | — | | | | — | | | | 101 | | |
The accompanying notes are an integral part of the financial statements.
39
2011 Annual Report
December 31, 2011
Portfolio of Investments (cont'd)
Global Advantage Portfolio
Fair Value Measurement Information: (cont'd)
| Investment Type | | Level 1
Unadjusted
quoted
prices
(000) | | Level 2
Other
significant
observable
inputs
(000) | | Level 3
Significant
unobservable
inputs
(000) | | Total
(000) | |
| Common Stocks (cont'd) | | | | | | | | | |
Textiles, Apparel & Luxury
Goods | | $ | 65 | | | $ | — | | | $ | — | | | $ | 65 | | |
| Tobacco | | | 94 | | | | — | | | | — | | | | 94 | | |
| Transportation Infrastructure | | | 76 | | | | — | | | | — | | | | 76 | | |
| Total Common Stocks | | | 2,561 | | | | — | | | | — | | | | 2,561 | | |
Short-Term Investment —
Investment Company | | | 101 | | | | — | | | | — | | | | 101 | | |
| Total Assets | | $ | 2,662 | | | $ | — | | | $ | — | | | $ | 2,662 | | |
Transfers between investment levels may occur as the markets fluctuate and/or the availability of data used in an investment's valuation changes. The Portfolio recognizes transfers between the levels as of the end of the period. As of December 31, 2011, the Portfolio did not have any significant investments transfer between investment levels.
The accompanying notes are an integral part of the financial statements.
40
2011 Annual Report
December 31, 2011
Investment Overview (unaudited)
Global Discovery Portfolio
The Global Discovery Portfolio (the "Portfolio") seeks long-term capital appreciation by investing primarily in established and emerging franchise companies located throughout the world, with capitalizations within the range of companies included in the MSCI All Country World Index.
Performance
For the year ended December 31, 2011, the Portfolio had a total return based on net asset value and reinvestment of distributions per share of -7.72%, net of fees, for Class I shares. The Portfolio's Class I shares underperformed against its benchmark, the MSCI All Country World Index (the "Index"), which returned -7.35%.
Factors Affecting Performance
• Global equity markets began 2011 on a relatively optimistic note but suffered a stream of disappointments as the year progressed, falling 7.35% for the year overall (as measured by the Index). Headwinds to the markets' progress included lackluster economic growth in the developed world, fears about a "hard landing" in China's economy, the worsening European debt crisis, political dysfunction in the U.S. and Europe, a tragic earthquake and tsunami in Japan, and social and political upheaval across the Middle East. Although corporate balance sheets and earnings in the U.S. and Europe remained strong throughout the year, waning investor confidence kept markets volatile. The U.S. market outperformed those of Europe, Japan, and Asia ex-Japan, and developed market equities bested emerging market equities. (The performance of regional markets and developed and emerging markets is measured by their respective MSCI indexes.)
• The primary detractor from relative performance during the period was stock selection in the consumer discretionary sector. Holdings in a Danish jewelry designer and a Greek toy and baby product retailer were the largest drags on performance.
• The energy sector also dampened performance because of weak stock selection (largely due to the negative return of a position in a Brazilian oil and gas exploration and production company) and an underweight in the sector.
• An underweight allocation to the telecommunication services sector, in which the Portfolio had no exposure during the period, was disadvantageous to relative performance.
• Conversely, positive contributions came from stock selection and an overweight in the information technology sector. A position in a U.S. communications equipment maker was the most additive to returns.
• Stock selection in health care also bolstered relative performance, due to the strong performance of the Portfolio's two holdings in the sector.
• Stock selection in the industrials sector also aided returns. A position in a U.K. company that provides testing, inspection, and certification of goods was the top contributor.
Management Strategies
• We look for high-quality growth companies that have these attributes: sustainable competitive advantages, business visibility, rising return on invested capital, free cash flow and a favorable risk/reward profile. In seeking these companies, we use intense fundamental research. Our emphasis is on secular growth, and as a result, short-term market events are not as meaningful in the stock selection process.
41
2011 Annual Report
December 31, 2011
Investment Overview (unaudited) (cont'd)
Global Discovery Portfolio
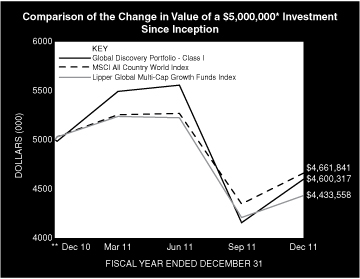
* Minimum Investment
** Commenced Operations on December 28, 2010.
In accordance with SEC regulations, Portfolio's performance shown assumes that all recurring fees (including management fees) were deducted and all dividends and distributions were reinvested. The performance of Class P, Class H, and Class L shares will vary from the Class I shares based upon it will be negatively impacted by additional fees assessed to these classes.
Performance Compared to the Morgan Stanley Capital International (MSCI) All Country World Index(1) and the Lipper Global Multi-Cap Growth Funds Index(2)
| | | Period Ended December 31, 2011 | |
| | | Total Returns(3) | |
| | | | | Average Annual | |
| | | One
Year | | Five
Years | | Ten
Years | | Since
Inception(5) | |
Portfolio — Class I Shares
w/o sales charges(4) | | | –7.72 | % | | | — | | | | — | | | | –7.93 | % | |
| MSCI All Country World Index | | | –7.35 | | | | — | | | | — | | | | –6.71 | | |
Lipper Global Multi-Cap Growth
Index | | | –11.85 | | | | — | | | | — | | | | –11.25 | | |
Portfolio — Class H Shares
w/o sales charges(4) | | | –7.96 | | | | — | | | | — | | | | –8.17 | | |
Portfolio — Class H Shares
with maximum 4.75%
sales charges(4) | | | –12.36 | | | | — | | | | — | | | | –12.51 | | |
| MSCI All Country World Index | | | –7.35 | | | | — | | | | — | | | | –6.71 | | |
Lipper Global Multi-Cap Growth
Index | | | –11.85 | | | | — | | | | — | | | | –11.25 | | |
Portfolio — Class L Shares
w/o sales charges(4) | | | –8.41 | | | | — | | | | — | | | | –8.62 | | |
| MSCI All Country World Index | | | –7.35 | | | | — | | | | — | | | | –6.71 | | |
Lipper Global Multi-Cap Growth
Index | | | –11.85 | | | | — | | | | — | | | | –11.25 | | |
Portfolio — Class P Shares
w/o sales charges(4) | | | –7.98 | | | | — | | | | — | | | | –8.19 | | |
| MSCI All Country World Index | | | –7.35 | | | | — | | | | — | | | | –6.71 | | |
Lipper Global Multi-Cap Growth
Index | | | –11.85 | | | | — | | | | — | | | | –11.25 | | |
Performance data quoted represents past performance, which is no guarantee of future results, and current performance may be lower or higher than the figures shown. Performance assumes that all dividends and distributions, if any, were reinvested. For the most recent month-end performance figures, please visit www.morganstanley.com/im. Investment return and principal value will fluctuate so that Portfolio shares, when redeemed, may be worth more or less than their original cost. Total returns do not reflect the deduction of taxes that a shareholder would pay on Portfolio distributions or the redemption of Portfolio shares. Performance of share classes will vary due to difference in expenses.
(1) The Morgan Stanley Capital International (MSCI) All Country World Index (ACWI) is a free float-adjusted market capitalization weighted index designed to measure the equity market performance of developed and emerging markets. The term "free float" represents the portion of shares outstanding that are deemed to be available for purchase in the public equity markets by investors. The performance of the Index is listed in U.S. dollars and assumes reinvestment of net dividends. The Index is unmanaged and its returns do not include any sales charges or fees. Such costs would lower performance. It is not possible to invest directly in an index.
(2) The Lipper Global Multi-Cap Growth Funds Index is an equally weighted performance index of the largest qualifying funds (based on net assets) in the Lipper Global Multi-Cap Growth Funds classification. The Index, which is adjusted for capital gains distributions and income dividends, is unmanaged and should not be considered an investment. There are currently 30 funds represented in this Index. As of the date of this Prospectus, the Portfolio is in the Lipper Global Multi-Cap Growth Funds classification.
(3) Total returns for the Portfolio reflect fees waived and expenses reimbursed, if applicable, by the Adviser. Without such waivers and reimbursements, total returns would have been lower. The fee waivers and/or expense reimbursements will continue for one year or until such time as the Fund's Board of Directors acts to discontinue all or a portion of such waivers and/or expense reimbursements when it deems that such action is appropriate.
(4) Commenced operations on December 28, 2010.
(5) For comparative purposes, average annual since inception returns listed for the Indexes refer to the inception date or initial offering of the respective share class of the Portfolio, not the inception of the Index.
Portfolio Composition
| Classification | | Percentage of
Total Investments | |
| Other* | | | 39.7 | % | |
| Communications Equipment | | | 14.4 | | |
| Food Products | | | 11.6 | | |
| Specialty Retail | | | 10.0 | | |
| Commercial Services & Supplies | | | 7.0 | | |
| Internet Software & Services | | | 6.9 | | |
| Diversified Financial Services | | | 5.3 | | |
| Textiles, Apparel & Luxury Goods | | | 5.1 | | |
| Total Investments | | | 100.0 | % | |
* Industries representing less than 5% of total investments.
42
2011 Annual Report
December 31, 2011
Portfolio of Investments
Global Discovery Portfolio
| | | Shares | | Value
(000) | |
| Common Stocks (94.6%) | |
| Australia (5.0%) | |
| DuluxGroup Ltd. | | | 49,500 | | | $ | 146 | | |
| Lynas Corp. Ltd. (a) | | | 40,064 | | | | 43 | | |
| | | | 189 | | |
| Brazil (9.1%) | |
| LLX Logistica SA (a) | | | 36,299 | | | | 66 | | |
| Natura Cosmeticos SA | | | 3,847 | | | | 75 | | |
| OGX Petroleo e Gas Participacoes SA (a) | | | 17,140 | | | | 125 | | |
| Raia Drogasil SA | | | 11,229 | | | | 78 | | |
| | | | 344 | | |
| Canada (2.0%) | |
| Valeant Pharmaceuticals International, Inc. (a) | | | 1,639 | | | | 76 | | |
| China (0.8%) | |
Country Style Cooking Restaurant
Chain Co., Ltd. ADR (a) | | | 4,387 | | | | 32 | | |
| Denmark (3.4%) | |
| Pandora A/S | | | 13,462 | | | | 127 | | |
| France (14.2%) | |
| Christian Dior SA | | | 558 | | | | 66 | | |
| Edenred | | | 10,683 | | | | 263 | | |
| Eurazeo | | | 3,647 | | | | 130 | | |
| Remy Cointreau SA | | | 966 | | | | 78 | | |
| | | | 537 | | |
| Greece (6.2%) | |
Hellenic Exchanges SA Holding Clearing
Settlement and Registry | | | 17,844 | | | | 67 | | |
| Jumbo SA (a) | | | 33,920 | | | | 167 | | |
| | | | 234 | | |
| Hong Kong (5.4%) | |
| L'Occitane International SA | | | 102,500 | | | | 206 | | |
| Marshall Islands (3.6%) | |
| Diana Containerships, Inc. | | | 25,293 | | | | 136 | | |
| Switzerland (8.1%) | |
| Nestle SA (Registered) | | | 5,345 | | | | 307 | | |
| United Kingdom (4.0%) | |
| Intertek Group PLC | | | 4,836 | | | | 153 | | |
| United States (32.8%) | |
| Akamai Technologies, Inc. (a) | | | 5,455 | | | | 176 | | |
| Dunkin' Brands Group, Inc. (a) | | | 46 | | | | 1 | | |
| First Solar, Inc. (a) | | | 2,186 | | | | 74 | | |
| Intuitive Surgical, Inc. (a) | | | 178 | | | | 82 | | |
| Motorola Solutions, Inc. | | | 11,675 | | | | 541 | | |
| OpenTable, Inc. (a) | | | 2,057 | | | | 81 | | |
| PF Chang's China Bistro, Inc. | | | 3,403 | | | | 105 | | |
| Sara Lee Corp. | | | 6,787 | | | | 128 | | |
| Zynga, Inc., Class A (a) | | | 5,626 | | | | 53 | | |
| | | | 1,241 | | |
| Total Common Stocks (Cost $3,840) | | | 3,582 | | |
| | | Shares | | Value
(000) | |
| Convertible Preferred Stocks (0.8%) | |
| United States (0.8%) | |
| Better Place, Inc. Series C (a)(b)(c) (Cost $29) | | | 6,429 | | | $ | 29 | | |
| Short-Term Investment (3.5%) | |
| Investment Company (3.5%) | |
Morgan Stanley Institutional Liquidity
Funds — Money Market Portfolio —
Institutional Class (See Note G-2) (Cost $134) | | | 134,177 | | | | 134 | | |
| Total Investments (98.9%) (Cost $4,003) | | | 3,745 | | |
| Other Assets in Excess of Liabilities (1.1%) | | | 40 | | |
| Net Assets (100.0%) | | $ | 3,785 | | |
(a) Non-income producing security.
(b) At December 31, 2011, the Portfolio held a fair valued security valued at approximately $29,000, representing 0.8% of net assets. This security has been fair valued as determined in good faith under procedures established by and under the general supervision of the Fund's Directors.
(c) Security has been deemed illiquid at December 31, 2011.
ADR American Depositary Receipt.
Fair Value Measurement Information:
The following is a summary of the inputs used to value the Portfolio's investments as of December 31, 2011. (See Note A-9 to the financial statements for further information regarding fair value measurement.)
| Investment Type | | Level 1
Unadjusted
quoted
prices
(000) | | Level 2
Other
significant
observable
inputs
(000) | | Level 3
Significant
unobservable
inputs
(000) | | Total
(000) | |
| Assets: | | | | | | | | | |
| Common Stocks | | | | | | | | | |
| Beverages | | $ | 78 | | | $ | — | | | $ | — | | | $ | 78 | | |
| Chemicals | | | 146 | | | | — | | | | — | | | | 146 | | |
Commercial Services &
Supplies | | | 263 | | | | — | | | | — | | | | 263 | | |
| Communications Equipment | | | 541 | | | | — | | | | — | | | | 541 | | |
Diversified Financial
Services | | | 197 | | | | — | | | | — | | | | 197 | | |
| Food & Staples Retailing | | | 78 | | | | — | | | | — | | | | 78 | | |
| Food Products | | | 435 | | | | — | | | | — | | | | 435 | | |
Health Care Equipment &
Supplies | | | 82 | | | | — | | | | — | | | | 82 | | |
Hotels, Restaurants &
Leisure | | | 138 | | | | — | | | | — | | | | 138 | | |
| Internet Software & Services | | | 257 | | | | — | | | | — | | | | 257 | | |
| Marine | | | 136 | | | | — | | | | — | | | | 136 | | |
| Metals & Mining | | | 43 | | | | — | | | | — | | | | 43 | | |
| Oil, Gas & Consumable Fuels | | | 125 | | | | — | | | | — | | | | 125 | | |
| Personal Products | | | 75 | | | | — | | | | — | | | | 75 | | |
| Pharmaceuticals | | | 76 | | | | — | | | | — | | | | 76 | | |
| Professional Services | | | 153 | | | | — | | | | — | | | | 153 | | |
Semiconductors &
Semiconductor Equipment | | | 74 | | | | — | | | | — | | | | 74 | | |
| Software | | | 53 | | | | — | | | | — | | | | 53 | | |
| Specialty Retail | | | 373 | | | | — | | | | — | | | | 373 | | |
The accompanying notes are an integral part of the financial statements.
43
2011 Annual Report
December 31, 2011
Portfolio of Investments (cont'd)
Global Discovery Portfolio
Fair Value Measurement Information: (cont'd)
| Investment Type | | Level 1
Unadjusted
quoted
prices
(000) | | Level 2
Other
significant
observable
inputs
(000) | | Level 3
Significant
unobservable
inputs
(000) | | Total
(000) | |
| Common Stocks (cont'd) | | | | | | | | | |
Textiles, Apparel & Luxury
Goods | | $ | 193 | | | $ | — | | | $ | — | | | $ | 193 | | |
| Transportation Infrastructure | | | 66 | | | | — | | | | — | | | | 66 | | |
| Total Common Stocks | | | 3,582 | | | | — | | | | — | | | | 3,582 | | |
Convertible Preferred
Stocks | | | — | | | | — | | | | 29 | | | | 29 | | |
Short-Term Investment —
Investment Company | | | 134 | | | | — | | | | — | | | | 134 | | |
| Total Assets | | $ | 3,716 | | | $ | — | | | $ | 29 | | | $ | 3,745 | | |
Transfers between investment levels may occur as the markets fluctuate and/or the availability of data used in an investment's valuation changes. The Portfolio recognizes transfers between the levels as of the end of the period. As of December 31, 2011, the Portfolio did not have any significant investments transfer between investment levels.
Following is a reconciliation of investments in which significant unobservable inputs (Level 3) were used in determining fair value.
| | | Convertible
Preferred
Stocks
(000) | |
| Beginning Balance | | $ | — | | |
| Purchases | | | 29 | | |
| Sales | | | — | | |
| Amortization of discount | | | — | | |
| Transfers in | | | — | | |
| Transfers out | | | — | | |
| Change in unrealized appreciation (depreciation) | | | — | | |
| Realized gains (losses) | | | — | | |
| Ending Balance | | $ | 29 | | |
Net change in unrealized appreciation/depreciation
from investments still held as of December 31, 2011 | | $ | — | | |
The accompanying notes are an integral part of the financial statements.
44
2011 Annual Report
December 31, 2011
Investment Overview (unaudited)
Global Franchise Portfolio
The Global Franchise Portfolio (the "Portfolio") seeks long-term capital appreciation by investing primarily in equity securities of issuers located throughout the world, that it believes have, among other things, resilient business franchises and growth potential.
Performance
For the year ended December 31, 2011, the Portfolio had a total return based on net asset value and reinvestment of distributions per share of 9.38%, net of fees, for Class I shares. The Portfolio's Class I shares outperformed against its benchmark, the MSCI World Index (the "Index"), which returned -5.54%.
Factors Affecting Performance
• Despite all the market volatility, 2011 ended with a whimper, with the Index essentially flat in December on low trading volumes. This resulted in a 7.6% return in the Index for the fourth quarter, and brought the return for the year to -5.5%.
• For the most part, it was a classic "cyclicals versus defensives" (or more economically sensitive versus less economically sensitive) year, with nearly all cyclical sectors faring poorly over 2011: materials fell 20%, the punch-drunk financial sector was down 19%, industrials declined 8% and consumer discretionary fell 5%. In terms of defensive sectors, both health care (up 9.5%) and consumer staples (up 8.6%) solidly outperformed for the year as their fortunes are less sensitive to macro-economics, which deteriorated as the eurozone crisis escalated from bank balance sheets to European government balance sheets, to affect credit creation worldwide.
• One rather surprising exception to the broad story of cyclical weakness was the oil price, partly due to continued political uncertainty in the Middle East, with the result that free cash flows and share prices have remained resilient in the energy sector.
• The Portfolio posted strong absolute and relative performance over the full year.
• Although underweight allocations to the health care, energy, and telecommunications sectors detracted from performance for the year, this was more than offset by strong stock selection in and the overweight allocation to consumer staples, and the underweight allocation to financials, one of the weakest performing sectors. The Portfolio's stock selection in information technology also added to performance for the year.
• Derivatives did not materially impact Portfolio's performance.
Management Strategies
• Even if there is no cataclysm in Europe this year, the world remains a dangerous place to invest. Much of the West is in the grip of massive balance sheet deleveraging; shedding assets, postponing spending decisions and hoarding cash in low-return investments. We know from the Japanese experience just how long a balance sheet recession can persist; the question for governments is how should or can they respond. Do they take the quasi-Keynesian approach adopted by the U.S. and U.K. and hope that foreigners remain holders or buyers of the rapidly expanding supply of government bonds? Or do they take the medicine the Austrian school (and a fragile bond market) demands and enforce fiscal discipline and austerity? The former risks sudden bond market or currency collapse, the latter ensures prolonged economic weakness.
• Clients know us for our disciplined focus on seeking what we consider high-quality companies — companies with resilient sources of profit, that can generate high returns on their capital, with managements that invest for the long term — and to seek the shares of these companies that are trading below our assessment of fair value. These sorts of companies are in short supply, and just as the highest-quality corporate debt has rerated upwards, we remain convinced that equity markets will continue to put very high-quality companies on a pedestal.
• We remain focused on the Global Franchise philosophy of investing. We look for what we believe are high-quality franchises, built on dominant and durable intangible assets, which possess pricing power and low capital intensity. This involves investing in well-run companies that capitalize on their intangible assets in an effort to compound shareholder wealth at a superior rate over the long-term. We follow a disciplined investment process based on fundamental analysis and bottom-up stock selection with sector, industry and stock weights driven by an assessment of each stock's quality and value characteristics. The end result is a portfolio aimed at earning attractive absolute returns with less volatility than the broader markets.
45
2011 Annual Report
December 31, 2011
Investment Overview (unaudited) (cont'd)
Global Franchise Portfolio
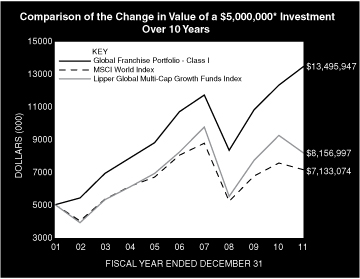
* Minimum Investment
In accordance with SEC regulations, Portfolio's performance shown assumes that all recurring fees (including management fees) were deducted and all dividends and distributions were reinvested. The performance of Class P shares will vary from the Class I shares based upon it will be negatively impacted by additional fees assessed to that class.
Performance Compared to the Morgan Stanley Capital International (MSCI) World Index(1) and the Lipper Global Multi-Cap Growth Funds Index(2)
| | | Period Ended December 31, 2011 | |
| | | Total Returns(3) | |
| | | | | Average Annual | |
| | | One
Year | | Five
Years | | Ten
Years | | Since
Inception(5) | |
Portfolio — Class I Shares
w/o sales charges(4) | | | 9.38 | % | | | 4.74 | % | | | 10.44 | % | | | 10.85 | % | |
| MSCI World Index | | | –5.54 | | | | –2.37 | | | | 3.62 | | | | 3.76 | | |
Lipper Global Multi-Cap Growth
Funds Index | | | –11.85 | | | | –0.18 | | | | 5.02 | | | | 5.19 | | |
Portfolio — Class P Shares
w/o sales charges(4) | | | 8.98 | | | | 4.46 | | | | 10.15 | | | | 10.55 | | |
| MSCI World Index | | | –5.54 | | | | –2.37 | | | | 3.62 | | | | 3.76 | | |
Lipper Global Multi-Cap Growth
Funds Index | | | –11.85 | | | | –0.18 | | | | 5.02 | | | | 5.19 | | |
Performance data quoted represents past performance, which is no guarantee of future results, and current performance may be lower or higher than the figures shown. Performance assumes that all dividends and distributions, if any, were reinvested. For the most recent month-end performance figures, please visit www.morganstanley.com/im. Investment return and principal value will fluctuate so that Portfolio shares, when redeemed, may be worth more or less than their original cost. Total returns do not reflect the deduction of taxes that a shareholder would pay on Portfolio distributions or the redemption of Portfolio shares. Performance of share classes will vary due to difference in expenses.
(1) The Morgan Stanley Capital International (MSCI) World Index is a free float-adjusted market capitalization weighted index that is designed to measure the global equity market performance of developed markets. The term "free float" represents the portion of shares outstanding that are deemed to be available for purchase in the public equity markets by investors. The MSCI World Index currently consists of 24 developed market country indices. The performance of the Index is listed in U.S. dollars and assumes reinvestment of net dividends. The Index is unmanaged and its returns do not include any sales charges or fees. Such costs would lower performance. It is not possible to invest directly in an index.
(2) The Lipper Global Multi-Cap Growth Funds Index is an equally weighted performance index of the largest qualifying funds (based on net assets) in the Lipper Global Multi-Cap Growth Funds classification. The Index, which is adjusted for capital gains distributions and income dividends, is unmanaged and should not be considered an investment. There are currently 30 funds represented in this Index. As of the date of this report, the Portfolio is in the Lipper Global Multi-Cap Growth Funds classification.
(3) Total returns for the Portfolio reflect fees waived and expenses reimbursed, if applicable, by the Adviser. Without such waivers and reimbursements, total returns would have been lower. The fee waivers and/or expense reimbursements will continue for one year or until such time as the Fund's Board of Directors acts to discontinue all or a portion of such waivers and/or expense reimbursements when it deems that such action is appropriate.
(4) Commenced operations on November 28, 2001.
(5) For comparative purposes, average annual since inception returns listed for the Indexes refer to the inception date or initial offering of the respective share class of the Portfolio, not the inception of the Index.
Portfolio Composition
| Classification | | Percentage of
Total Investments | |
| Tobacco | | | 24.8 | % | |
| Food Products | | | 24.7 | | |
| Other* | | | 19.1 | | |
| Household Products | | | 10.9 | | |
| Information Technology Services | | | 8.7 | | |
| Beverages | | | 6.5 | | |
| Software | | | 5.3 | | |
| Total Investments | | | 100.0 | % | |
* Industries representing less than 5% of total investments.
46
2011 Annual Report
December 31, 2011
Portfolio of Investments
Global Franchise Portfolio
| | | Shares | | Value
(000) | |
| Common Stocks (96.5%) | |
| Finland (2.4%) | |
| Kone Oyj, Class B | | | 104,508 | | | $ | 5,424 | | |
| France (3.6%) | |
| Legrand SA | | | 253,504 | | | | 8,153 | | |
| Germany (0.7%) | |
| SAP AG | | | 31,944 | | | | 1,689 | | |
| Italy (1.7%) | |
| Davide Campari-Milano SpA | | | 577,925 | | | | 3,848 | | |
| Sweden (3.6%) | |
| Swedish Match AB | | | 233,072 | | | | 8,274 | | |
| Switzerland (9.5%) | |
| Nestle SA (Registered) | | | 363,877 | | | | 20,919 | | |
| Novartis AG (Registered) | | | 11,989 | | | | 686 | | |
| | | | 21,605 | | |
| United Kingdom (29.5%) | |
| Admiral Group PLC | | | 349,628 | | | | 4,626 | | |
| British American Tobacco PLC | | | 446,083 | | | | 21,167 | | |
| Experian PLC | | | 208,131 | | | | 2,830 | | |
| Imperial Tobacco Group PLC | | | 360,451 | | | | 13,631 | | |
| Reckitt Benckiser Group PLC | | | 274,980 | | | | 13,580 | | |
| Unilever PLC | | | 329,411 | | | | 11,065 | | |
| | | | 66,899 | | |
| United States (45.5%) | |
| Accenture PLC, Class A | | | 186,022 | | | | 9,902 | | |
| Dr. Pepper Snapple Group, Inc. | | | 275,461 | | | | 10,875 | | |
| Herbalife Ltd. | | | 131,350 | | | | 6,787 | | |
| Kellogg Co. | | | 187,275 | | | | 9,471 | | |
| Kraft Foods, Inc., Class A | | | 88,113 | | | | 3,292 | | |
| Mead Johnson Nutrition Co. | | | 69,850 | | | | 4,801 | | |
| Microsoft Corp. | | | 395,935 | | | | 10,278 | | |
| Moody's Corp. | | | 93,530 | | | | 3,150 | | |
| Philip Morris International, Inc. | | | 167,528 | | | | 13,148 | | |
| Procter & Gamble Co. (The) | | | 166,904 | | | | 11,134 | | |
| Sara Lee Corp. | | | 343,424 | | | | 6,498 | | |
| Scotts Miracle-Gro Co. (The), Class A | | | 84,796 | | | | 3,959 | | |
| Visa, Inc., Class A | | | 97,365 | | | | 9,885 | | |
| | | | 103,180 | | |
| Total Common Stocks (Cost $199,287) | | | 219,072 | | |
| Short-Term Investment (3.4%) | |
| Investment Company (3.4%) | |
Morgan Stanley Institutional Liquidity
Funds — Government Portfolio —
Institutional Class (See Note G-2) (Cost $7,812) | | | 7,811,785 | | | | 7,812 | | |
| Total Investments (99.9%) (Cost $207,099) | | | 226,884 | | |
| Other Assets in Excess of Liabilities (0.1%) | | | 120 | | |
| Net Assets (100.0%) | | $ | 227,004 | | |
Fair Value Measurement Information:
The following is a summary of the inputs used to value the Portfolio's investments as of December 31, 2011. (See Note A-9 to the financial statements for further information regarding fair value measurement.)
| Investment Type | | Level 1
Unadjusted
quoted
prices
(000) | | Level 2
Other
significant
observable
inputs
(000) | | Level 3
Significant
unobservable
inputs
(000) | | Total
(000) | |
| Assets: | | | | | | | | | |
| Common Stocks | | | | | | | | | |
| Beverages | | $ | 14,723 | | | $ | — | | | $ | — | | | $ | 14,723 | | |
| Chemicals | | | 3,959 | | | | — | | | | — | | | | 3,959 | | |
Diversified Financial
Services | | | 3,150 | | | | — | | | | — | | | | 3,150 | | |
| Electrical Equipment | | | 8,153 | | | | — | | | | — | | | | 8,153 | | |
| Food Products | | | 56,046 | | | | — | | | | — | | | | 56,046 | | |
| Household Products | | | 24,714 | | | | — | | | | — | | | | 24,714 | | |
Information Technology
Services | | | 19,787 | | | | — | | | | — | | | | 19,787 | | |
| Insurance | | | 4,626 | | | | — | | | | — | | | | 4,626 | | |
| Machinery | | | 5,424 | | | | — | | | | — | | | | 5,424 | | |
| Personal Products | | | 6,787 | | | | — | | | | — | | | | 6,787 | | |
| Pharmaceuticals | | | 686 | | | | — | | | | — | | | | 686 | | |
| Professional Services | | | 2,830 | | | | — | | | | — | | | | 2,830 | | |
| Software | | | 11,967 | | | | — | | | | — | | | | 11,967 | | |
| Tobacco | | | 56,220 | | | | — | | | | — | | | | 56,220 | | |
| Total Common Stocks | | | 219,072 | | | | — | | | | — | | | | 219,072 | | |
Short-Term Investment —
Investment Company | | | 7,812 | | | | — | | | | — | | | | 7,812 | | |
| Total Assets | | $ | 226,884 | | | $ | — | | | $ | — | | | $ | 226,884 | | |
Transfers between investment levels may occur as the markets fluctuate and/or the availability of data used in an investment's valuation changes. The Portfolio recognizes transfers between the levels as of the end of the period. As of December 31, 2011, the Portfolio did not have any significant investments transfer between investment levels.
The accompanying notes are an integral part of the financial statements.
47
2011 Annual Report
December 31, 2011
Investment Overview (unaudited)
Global Insight Portfolio
The Global Insight Portfolio (the "Portfolio") seeks long-term capital appreciation.
Performance
For the period from inception on December 28, 2011 through December 31, 2011, the Portfolio had a total return based on net asset value per share of 0.70%, net of fees, for Class I shares. The Portfolio's Class I shares underperformed against its benchmark, the MSCI All Country World Index (the "Index"), which returned 1.15% for the same period.
Factors Affecting Performance
• The Portfolio launched a few days prior to the close of the reporting period. Such a short time frame would not provide a meaningful performance analysis as short-term returns may not be indicative of the Portfolio's long-term performance potential.
Management Strategies
• We seek to invest primarily in established and cyclical franchise companies located throughout the world that we believe have strong name recognition, sustainable competitive advantages, and ample growth prospects, and are trading at an attractive discount to future cash flow generation capacity or asset value. We typically favor companies with the ability to generate attractive free cash flow yields. We utilize a bottom-up stock selection process, seeking attractive investments on an individual company basis. The companies we consider have market capitalizations within the range of companies included in the MSCI All Country World Index.
• We continue to focus on assessing company prospects over a three- to five-year time horizon and on owning a portfolio of high-quality companies with diverse business drivers not tied to a particular market environment.
Performance Compared to the Morgan Stanley Capital International (MSCI) All Country World Index(1) and the Lipper Global Multi-Cap Value Funds Index(2)
| | | Period Ended December 31, 2011 | |
| | | Total Returns(3) | |
| | | One
Year | | Five
Years | | Ten
Years | | Cumulative
Since
Inception(5) | |
Portfolio — Class I Shares
w/o sales charges(4) | | | — | | | | — | | | | — | | | | 0.70 | % | |
| MSCI All Country World Index | | | — | | | | — | | | | — | | | | 1.15 | | |
Lipper Global Multi-Cap Value
Funds Index | | | — | | | | — | | | | — | | | | 1.16 | | |
Portfolio — Class H Shares
w/o sales charges(4) | | | — | | | | — | | | | — | | | | 0.70 | | |
Portfolio — Class H Shares with
maximum 4.75% sales charges(4) | | | — | | | | — | | | | — | | | | –4.10 | | |
| MSCI All Country World Index | | | — | | | | — | | | | — | | | | 1.15 | | |
Lipper Global Multi-Cap Value
Funds Index | | | — | | | | — | | | | — | | | | 1.16 | | |
Portfolio — Class L Shares
w/o sales charges(4) | | | — | | | | — | | | | — | | | | 0.70 | | |
| MSCI All Country World Index | | | — | | | | — | | | | — | | | | 1.15 | | |
Lipper Global Multi-Cap Value
Funds Index | | | — | | | | — | | | | — | | | | 1.16 | | |
Performance data quoted represents past performance, which is no guarantee of future results, and current performance may be lower or higher than the figures shown. Performance assumes that all dividends and distributions, if any, were reinvested. For the most recent month-end performance figures, please visit www.morganstanley.com/im. Investment return and principal value will fluctuate so that Portfolio shares, when redeemed, may be worth more or less than their original cost. Total returns do not reflect the deduction of taxes that a shareholder would pay on Portfolio distributions or the redemption of Portfolio shares. Performance of share classes will vary due to difference in expenses.
(1) The Morgan Stanley Capital International (MSCI) All Country World Index (ACWI) is a free float-adjusted market capitalization weighted index designed to measure the equity market performance of developed and emerging markets. The term "free float" represents the portion of shares outstanding that are deemed to be available for purchase in the public equity markets by investors. The performance of the Index is listed in U.S. dollars and assumes reinvestment of net dividends. The Index is unmanaged and its returns do not include any sales charges or fees. Such costs would lower performance. It is not possible to invest directly in an index.
(2) The Lipper Global Multi-Cap Value Funds Index is an equally weighted performance index of the largest qualifying funds (based on net assets) in the Lipper Global Multi-Cap Value Funds classification. The Index, which is adjusted for capital gains distributions and income dividends, is unmanaged and should not be considered an investment. There are currently 10 funds represented in this Index. As of the date of this report, the Portfolio is in the Lipper Global Multi-Cap Value Funds classification.
(3) Total returns for the Portfolio reflect fees waived and expenses reimbursed, if applicable, by the Adviser. Without such waivers and reimbursements, total returns would have been lower. The fee waivers and/or expense reimbursements will continue for one year or until such time as the Fund's Board of Directors acts to discontinue all or a portion of such waivers and/or expense reimbursements when it deems that such action is appropriate.
(4) Commenced operations on December 28, 2011.
(5) For comparative purposes, average annual since inception returns listed for the Indexes refer to the inception date or initial offering of the respective share class of the Portfolio, not the inception of the Index. Returns for periods less than one year are not annualized.
48
2011 Annual Report
December 31, 2011
Investment Overview (unaudited) (cont'd)
Global Insight Portfolio
Portfolio Composition
| Classification | | Percentage of
Total Investments | |
| Short-Term Investments | | | 41.8 | % | |
| Other* | | | 38.7 | | |
| Industrial Conglomerates | | | 7.2 | | |
| Food Products | | | 7.0 | | |
| Chemicals | | | 5.3 | | |
| Total Investments | | | 100.0 | % | |
* Industries representing less than 5% of total investments.
49
2011 Annual Report
December 31, 2011
Portfolio of Investments
Global Insight Portfolio
| | | Shares | | Value
(000) | |
| Common Stocks (83.7%) | |
| Australia (3.9%) | |
| DuluxGroup Ltd. | | | 5,556 | | | $ | 16 | | |
| Treasury Wine Estates Ltd. | | | 4,403 | | | | 17 | | |
| | | | 33 | | |
| Belgium (2.0%) | |
| Anheuser-Busch InBev N.V. | | | 273 | | | | 17 | | |
| Brazil (3.8%) | |
| Vale SA (Preference) | | | 1,588 | | | | 32 | | |
| Canada (12.0%) | |
| Brookfield Asset Management, Inc., Class A | | | 1,213 | | | | 33 | | |
| Fairfax Financial Holdings Ltd. | | | 39 | | | | 17 | | |
| Potash Corp. of Saskatchewan, Inc. | | | 789 | | | | 32 | | |
| Whistler Blackcomb Holdings, Inc. | | | 1,673 | | | | 18 | | |
| | | | 100 | | |
| France (12.0%) | |
| Christian Dior SA | | | 418 | | | | 49 | | |
| Etablissements Maurel et Prom | | | 1,093 | | | | 17 | | |
| Eurazeo | | | 945 | | | | 34 | | |
| | | | 100 | | |
| Germany (1.9%) | |
| Beiersdorf AG | | | 291 | | | | 16 | | |
| Greece (2.0%) | |
Hellenic Exchanges SA Holding Clearing
Settlement and Registry | | | 4,413 | | | | 16 | | |
| Hong Kong (6.3%) | |
| Shangri-La Asia Ltd. | | | 20,000 | | | | 35 | | |
| Swire Pacific Ltd. | | | 1,500 | | | | 18 | | |
| | | | 53 | | |
| Japan (2.3%) | |
| Universal Entertainment Corp. | | | 700 | | | | 19 | | |
| Marshall Islands (2.0%) | |
| Diana Containerships, Inc. | | | 3,150 | | | | 17 | | |
| Netherlands (6.1%) | |
| Koninklijke Philips Electronics N.V. | | | 2,405 | | | | 51 | | |
| Norway (2.0%) | |
| Orkla ASA | | | 2,228 | �� | | | 17 | | |
| Singapore (2.3%) | |
| Jardine Matheson Holdings Ltd. | | | 400 | | | | 19 | | |
| Spain (1.4%) | |
| Baron de Ley (a) | | | 207 | | | | 12 | | |
| Sweden (2.0%) | |
| Byggmax Group AB | | | 4,324 | | | | 17 | | |
| Switzerland (6.0%) | |
| Nestle SA (Registered) | | | 876 | | | | 50 | | |
| Turkey (4.0%) | |
| Is Gayrimenkul Yatirim Ortakligi REIT | | | 30,790 | | | | 16 | | |
| Ulker Biskuvi Sanayi | | | 6,016 | | | | 17 | | |
| | | | 33 | | |
| | | Shares | | Value
(000) | |
| United States (11.7%) | |
| CF Industries Holdings, Inc. | | | 114 | | | $ | 16 | | |
| Diana Shipping, Inc. (a) | | | 2,139 | | | | 16 | | |
| Motorola Solutions, Inc. | | | 1,053 | | | | 49 | | |
| Sara Lee Corp. | | | 878 | | | | 17 | | |
| | | | 98 | | |
| Total Common Stocks (Cost $694) | | | 700 | | |
| Short-Term Investment (60.2%) | |
| Investment Company (60.2%) | |
Morgan Stanley Institutional Liquidity
Funds — Money Market Portfolio —
Institutional Class (See Note G-2) (Cost $503) | | | 503,271 | | | | 503 | | |
| Total Investments (143.9%) (Cost $1,197) | | | 1,203 | | |
| Liabilities in Excess of Other Assets (-43.9%) | | | (367 | ) | |
| Net Assets (100.0%) | | $ | 836 | | |
(a) Non-income producing security.
REIT Real Estate Investment Trust.
Fair Value Measurement Information:
The following is a summary of the inputs used to value the Portfolio's investments as of December 31, 2011. (See Note A-9 to the financial statements for further information regarding fair value measurement.)
| Investment Type | | Level 1
Unadjusted
quoted
prices
(000) | | Level 2
Other
significant
observable
inputs
(000) | | Level 3
Significant
unobservable
inputs
(000) | | Total
(000) | |
| Assets: | | | | | | | | | |
| Common Stocks | | | | | | | | | |
| Beverages | | $ | 46 | | | $ | — | | | $ | — | | | $ | 46 | | |
| Chemicals | | | 64 | | | | — | | | | — | | | | 64 | | |
Communications
Equipment | | | 49 | | | | — | | | | — | | | | 49 | | |
Diversified Financial
Services | | | 50 | | | | — | | | | — | | | | 50 | | |
| Food Products | | | 84 | | | | — | | | | — | | | | 84 | | |
Hotels, Restaurants &
Leisure | | | 53 | | | | — | | | | — | | | | 53 | | |
| Industrial Conglomerates | | | 87 | | | | — | | | | — | | | | 87 | | |
| Insurance | | | 17 | | | | — | | | | — | | | | 17 | | |
Leisure Equipment &
Products | | | 19 | | | | — | | | | — | | | | 19 | | |
| Marine | | | 33 | | | | — | | | | — | | | | 33 | | |
| Metals & Mining | | | 32 | | | | — | | | | — | | | | 32 | | |
Oil, Gas &
Consumable Fuels | | | 17 | | | | — | | | | — | | | | 17 | | |
| Personal Products | | | 16 | | | | — | | | | — | | | | 16 | | |
Real Estate
Investment Trusts
(REITs) | | | 16 | | | | — | | | | — | | | | 16 | | |
The accompanying notes are an integral part of the financial statements.
50
2011 Annual Report
December 31, 2011
Portfolio of Investments (cont'd)
Global Insight Portfolio
Fair Value Measurement Information: (cont'd)
| Investment Type | | Level 1
Unadjusted
quoted
prices
(000) | | Level 2
Other
significant
observable
inputs
(000) | | Level 3
Significant
unobservable
inputs
(000) | | Total
(000) | |
| Common Stocks (cont'd) | | | | | | | | | |
Real Estate
Management &
Development | | $ | 51 | | | $ | — | | | $ | — | | | $ | 51 | | |
| Specialty Retail | | | 17 | | | | — | | | | — | | | | 17 | | |
Textiles, Apparel &
Luxury Goods | | | 49 | | | | — | | | | — | | | | 49 | | |
| Total Common Stocks | | | 700 | | | | — | | | | — | | | | 700 | | |
Short-Term Investment —
Investment Company | | | 503 | | | | — | | | | — | | | | 503 | | |
| Total Assets | | $ | 1,203 | | | $ | — | | | $ | — | | | $ | 1,203 | | |
Transfers between investment levels may occur as the markets fluctuate and/or the availability of data used in an investment's valuation changes. The Porfolio recognizes transfers between the levels as of the end of the period. As of December 31, 2011, the Portfolio did not have any significant investments transfer between investment levels.
The accompanying notes are an integral part of the financial statements.
51
2011 Annual Report
December 31, 2011
Investment Overview (unaudited)
Global Opportunity Portfolio
The Global Opportunity Portfolio (the "Portfolio") seeks long-term capital appreciation by investing primarily in established and emerging franchise companies located throughout the world, with capitalizations within the range of companies included in the MSCI All Country World Index.
Performance
For the year ended December 31, 2011, the Portfolio had a total return based on net asset value and reinvestment of distributions per share of -4.90%, net of fees, for Class I shares. The Portfolio's Class I shares outperformed against its benchmark, the MSCI All Country World Index (the "Index"), which returned -7.35%.
Factors Affecting Performance
• Global equity markets began 2011 on a relatively optimistic note but suffered a stream of disappointments as the year progressed, falling 7.35% for the year overall (as measured by the Index). Headwinds to the markets' progress included lackluster economic growth in the developed world, fears about a "hard landing" in China's economy, the worsening European debt crisis, political dysfunction in the U.S. and Europe, a tragic earthquake and tsunami in Japan, and social and political upheaval across the Middle East. Although corporate balance sheets and earnings in the U.S. and Europe remained strong throughout the year, waning investor confidence kept markets volatile. The U.S. market outperformed those of Europe, Japan, and Asia ex-Japan, and developed market equities bested emerging market equities. (The performance of regional markets and developed and emerging markets is measured by their respective MSCI indexes.)
• The information technology sector was the largest contributor to relative outperformance during the period, as both stock selection and an overweight in the sector were additive. A position in a global credit card company led performance.
• Stock selection and an underweight in the financials sector also aided relative performance due to strong performance from a holding in a clearinghouse for over-the-counter (OTC) securities in Brazil and the lack of exposure to bank stocks, a group which performed poorly over the period.
• Stock selection and an overweight in the consumer staples sector were advantageous, with a number of holdings in the food, beverage, and tobacco segment performing well.
• Conversely, stock selection in the consumer discretionary sector hampered relative returns. The largest detractors were holdings in a real estate developer in Brazil and a tutoring services provider in China.
• Stock selection in industrials diminished relative gains as well, mostly due to weak performance from holdings in the transportation industry.
• The Portfolio's underweight exposure to health care, a sector which performed well during the period, and the negative performance of its sole holding in the sector, a generic drug maker, were detractors from relative gains.
Management Strategies
• We look for high-quality growth companies that have these attributes: sustainable competitive advantages, business visibility, rising return on invested capital, free cash flow and a favorable risk/reward profile. In seeking these companies, we use intense fundamental research. Our emphasis is on secular growth, and as a result, short-term market events are not as meaningful in the stock selection process.
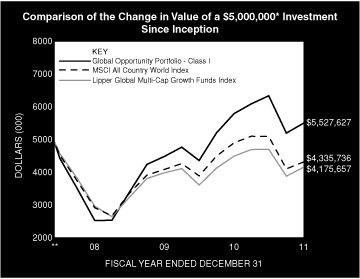
* Minimum Investment
** Commenced Operations on May 30, 2008.
In accordance with SEC regulations, Portfolio's performance shown assumes that all recurring fees (including management fees) were deducted and all dividends and distributions were reinvested. The performance of Class P, Class H, and Class L shares will vary from the Class I shares based upon different inception dates and will be negatively impacted by additional fees assessed to these classes.
52
2011 Annual Report
December 31, 2011
Investment Overview (unaudited) (cont'd)
Global Opportunity Portfolio
Performance Compared to the Morgan Stanley Capital International (MSCI) All Country World Index(1) and the Lipper Global Multi-Cap Growth Index(2)
| | | Period Ended December 31, 2011 | |
| | | Total Returns(3) | |
| | | | | Average Annual | |
| | | One
Year | | Five
Years | | Ten
Years | | Since
Inception(5) | |
Portfolio — Class I Shares
w/o sales charges(4) | | | –4.90 | % | | | — | | | | — | | | | 2.83 | % | |
| MSCI All Country World Index | | | –7.35 | | | | — | | | | — | | | | –4.90 | | |
Lipper Global Multi-Cap Growth
Funds Index | | | –11.85 | | | | — | | | | — | | | | –3.90 | | |
Portfolio — Class H Shares
w/o sales charges(4) | | | –5.18 | | | | — | | | | — | | | | 2.60 | | |
Portfolio — Class H Shares
with maximum 4.75%
sales charges(4) | | | –9.64 | | | | — | | | | — | | | | 1.22 | | |
| MSCI All Country World Index | | | –7.35 | | | | — | | | | — | | | | –4.90 | | |
Lipper Global Multi-Cap Growth
Funds Index | | | –11.85 | | | | — | | | | — | | | | –3.90 | | |
Portfolio — Class L Shares
w/o sales charges(4) | | | –5.19 | | | | — | | | | — | | | | 2.51 | | |
| MSCI All Country World Index | | | –7.35 | | | | — | | | | — | | | | –4.90 | | |
Lipper Global Multi-Cap Growth
Funds Index | | | –11.85 | | | | — | | | | — | | | | –3.90 | | |
Portfolio — Class P Shares
w/o sales charges(4) | | | –5.16 | | | | — | | | | — | | | | 16.07 | | |
| MSCI All Country World Index | | | –7.35 | | | | — | | | | — | | | | 7.82 | | |
Lipper Global Multi-Cap Growth
Funds Index | | | –11.85 | | | | — | | | | — | | | | 6.69 | | |
Performance data quoted represents past performance, which is no guarantee of future results, and current performance may be lower or higher than the figures shown. Performance assumes that all dividends and distributions, if any, were reinvested. For the most recent month-end performance figures, please visit www.morganstanley.com/im. Investment return and principal value will fluctuate so that Portfolio shares, when redeemed, may be worth more or less than their original cost. Total returns do not reflect the deduction of taxes that a shareholder would pay on Portfolio distributions or the redemption of Portfolio shares. Performance of share classes will vary due to difference in sales charges and expenses.
(1) The Morgan Stanley Capital International (MSCI) All Country World Index (ACWI) is a free float-adjusted market capitalization weighted index designed to measure the equity market performance of developed and emerging markets. The term "free float" represents the portion of shares outstanding that are deemed to be available for purchase in the public equity markets by investors. The performance of the Index is listed in U.S. dollars and assumes reinvestment of net dividends. The Index is unmanaged and its returns do not include any sales charges or fees. Such costs would lower performance. It is not possible to invest directly in an index.
(2) The Lipper Global Multi-Cap Growth Funds Index is an equally weighted performance index of the largest qualifying funds (based on net assets) in the Lipper Global Multi-Cap Growth Funds classification. The Index, which is adjusted for capital gains distributions and income dividends, is unmanaged and should not be considered an investment. There are currently 30 funds represented in this Index. As of the date of this report, the Portfolio is in the Lipper Global Multi-Cap Growth Funds classification.
(3) Total returns for the Portfolio reflect fees waived and expenses reimbursed, if applicable, by the Adviser. Without such waivers and reimbursements, total returns would have been lower. The fee waivers and/or expense reimbursements will continue for one year or until such time as the Board of Directors acts to discontinue all or a portion of such waivers and/or expense reimbursements when it deems that such action is appropriate. The Distributor has agreed to waive for at least one year the 12b-1 fee on Class L shares of the Portfolio to the extent it exceeds 0.30% of the average daily net assets of such shares on an annualized basis.
(4) On May 21, 2010 Class A, Class B, Class C, and Class I shares of Van Kampen Global Growth Fund ("the Predecessor Fund") were reorganized into Class H, Class H, Class L, and Class I shares of Morgan Stanley Global Growth Portfolio ("the Portfolio"), respectively. Class H, Class L, and Class I shares' returns of the Portfolio will differ from the Predecessor Fund as they have different expenses. Performance shown for the Portfolio's Class I, Class H, and Class L shares reflects the performance of the shares of the Predecessor Fund for periods prior to May 21, 2010. The Class A, C, and I shares of the Predecessor Fund commenced operations on May 30, 2008. Class P shares commenced offering on May 21, 2010. Performance for Class H shares has been restated to reflect the Portfolio's applicable sales charge. In October 2010, the Morgan Stanley Global Growth Portfolio changed its name to the Morgan Stanley Global Opportunity Portfolio.
(5) For comparative purposes, average annual since inception returns listed for the Indexes refer to the inception date or initial offering of the respective share class of the Portfolio, not the inception of the Index.
Portfolio Composition
| Classification | | Percentage of
Total Investments | |
| Other* | | | 55.3 | % | |
| Internet Software & Services | | | 14.0 | | |
| Beverages | | | 10.4 | | |
| Diversified Consumer Services | | | 7.8 | | |
| Internet & Catalog Retail | | | 7.5 | | |
| Computers & Peripherals | | | 5.0 | | |
| Total Investments | | | 100.0 | % | |
* Industries representing less than 5% of total investments.
53
2011 Annual Report
December 31, 2011
Portfolio of Investments
Global Opportunity Portfolio
| | | Shares | | Value
(000) | |
| Common Stocks (91.6%) | |
| Australia (1.1%) | |
| AET&D Holdings No 1 Ltd. (a)(b)(c) | | | 36,846 | | | $ | — | | |
| Lynas Corp. Ltd. (a) | | | 142,229 | | | | 152 | | |
| | | | 152 | | |
| Belgium (2.1%) | |
| Anheuser-Busch InBev N.V. | | | 4,771 | | | | 292 | | |
| Brazil (6.3%) | |
| BM&F Bovespa SA | | | 28,285 | | | | 149 | | |
| Brookfield Incorporacoes SA | | | 87,844 | | | | 233 | | |
CETIP SA - Balcao Organizado de Ativos e
Derivativos | | | 32,953 | | | | 476 | | |
| | | | 858 | | |
| Canada (4.5%) | |
| Brookfield Asset Management, Inc., Class A | | | 13,094 | | | | 360 | | |
| Brookfield Infrastructure Partners LP | | | 9,153 | | | | 253 | | |
| | | | 613 | | |
| China (23.3%) | |
| Baidu, Inc. ADR (a) | | | 5,617 | | | | 654 | | |
| China Merchants Holdings International Co., Ltd. (d) | | | 115,084 | | | | 334 | | |
| Golden Eagle Retail Group Ltd. (d) | | | 206,000 | | | | 436 | | |
New Oriental Education & Technology Group,
Inc. ADR (a) | | | 26,141 | | | | 629 | | |
| Tencent Holdings Ltd. (d) | | | 10,000 | | | | 201 | | |
| Wynn Macau Ltd. (d) | | | 146,800 | | | | 369 | | |
| Xueda Education Group ADR (a) | | | 122,434 | | | | 427 | | |
| Youku.com, Inc. ADR (a) | | | 7,677 | | | | 120 | | |
| | | | 3,170 | | |
| Denmark (3.8%) | |
| DSV A/S | | | 28,709 | | | | 515 | | |
| France (1.5%) | |
| Pernod-Ricard SA | | | 2,133 | | | | 198 | | |
| Germany (1.0%) | |
| BASF SE | | | 2,027 | | | | 141 | | |
| Hong Kong (4.5%) | |
| Minth Group Ltd. | | | 141,800 | | | | 133 | | |
| Sun Art Retail Group Ltd. (a) | | | 378,500 | | | | 473 | | |
| | | | 606 | | |
| India (3.1%) | |
| MakeMyTrip Ltd. (a) | | | 7,711 | | | | 186 | | |
| Mundra Port and Special Economic Zone Ltd. | | | 103,215 | | | | 233 | | |
| | | | 419 | | |
| Israel (1.0%) | |
| Teva Pharmaceutical Industries Ltd. ADR | | | 3,377 | | | | 136 | | |
| Italy (2.3%) | |
| Prada SpA (a)(d) | | | 70,000 | | | | 317 | | |
| Japan (3.9%) | |
| Universal Entertainment Corp. | | | 19,300 | | | | 534 | | |
| Russia (0.6%) | |
| Yandex N.V., Class A (a) | | | 4,051 | | | | 80 | | |
| | | Shares | | Value
(000) | |
| Switzerland (2.5%) | |
| Kuehne & Nagel International AG (Registered) | | | 1,520 | | | $ | 171 | | |
| Panalpina Welttransport Holding AG (Registered) (a) | | | 1,632 | | | | 167 | | |
| | | | 338 | | |
| United Kingdom (1.6%) | |
| Diageo PLC ADR | | | 2,511 | | | | 219 | | |
| United States (28.5%) | |
| Amazon.com, Inc. (a) | | | 3,666 | | | | 635 | | |
| Apple, Inc. (a) | | | 1,684 | | | | 682 | | |
| CME Group, Inc. | | | 748 | | | | 182 | | |
| Google, Inc., Class A (a) | | | 1,274 | | | | 823 | | |
| Greenlight Capital Re Ltd., Class A (a) | | | 15,334 | | | | 363 | | |
| LinkedIn Corp., Class A (a) | | | 383 | | | | 24 | | |
| Mastercard, Inc., Class A | | | 930 | | | | 347 | | |
| Monsanto Co. | | | 2,934 | | | | 206 | | |
| Priceline.com, Inc. (a) | | | 432 | | | | 202 | | |
| Ultra Petroleum Corp. (a) | | | 4,630 | | | | 137 | | |
| Visa, Inc., Class A | | | 2,712 | | | | 275 | | |
| | | | 3,876 | | |
| Total Common Stocks (Cost $10,603) | | | 12,464 | | |
| Convertible Preferred Stocks (1.1%) | |
| China (0.0%) | |
| Youku.com, Inc., Class A (a)(b)(c) | | | 9 | | | | — | @ | |
| United States (1.1%) | |
| Better Place, Inc. (a)(b)(c) | | | 31,331 | | | | 142 | | |
| Total Convertible Preferred Stocks (Cost $78) | | | 142 | | |
| Participation Notes (5.2%) | |
| China (5.2%) | |
Deutsche Bank AG, Kweichow Moutai Co.,
Ltd., Class A, Equity Linked Notes,
Zero Coupon, 3/4/21 | | | 9,050 | | | | 278 | | |
UBS AG, Kweichow Moutai Co., Ltd., Class A,
Equity Linked Notes, Zero Coupon, 2/25/13 | | | 14,080 | | | | 433 | | |
| Total Participation Notes (Cost $564) | | | 711 | | |
| Short-Term Investment (2.1%) | |
| Investment Company (2.1%) | |
Morgan Stanley Institutional Liquidity
Funds — Money Market Portfolio —
Institutional Class (See Note G-2) (Cost $288) | | | 287,959 | | | | 288 | | |
| Total Investments (100.0%) (Cost $11,533) | | | 13,605 | | |
| Other Assets in Excess of Liabilities (-@@%) | | | 6 | | |
| Net Assets (100.0%) | | $ | 13,611 | | |
(a) Non-income producing security.
(b) At December 31, 2011, the Portfolio held fair valued securities valued at approximately $142,000, representing 1.0% of net assets. These securities have been fair valued as determined in good faith under procedures established by and under the general supervision of the Fund's Directors.
(c) Security has been deemed illiquid at December 31, 2011.
(d) Security trades on the Hong Kong exchange.
ADR American Depositary Receipt.
@ Value is less than $500.
@@ Amount is less than 0.05%.
The accompanying notes are an integral part of the financial statements.
54
2011 Annual Report
December 31, 2011
Portfolio of Investments (cont'd)
Global Opportunity Portfolio
Fair Value Measurement Information:
The following is a summary of the inputs used to value the Portfolio's investments as of December 31, 2011. (See Note A-9 to the financial statements for further information regarding fair value measurement.)
| Investment Type | | Level 1
Unadjusted
quoted
prices
(000) | | Level 2
Other
significant
observable
inputs
(000) | | Level 3
Significant
unobservable
inputs
(000) | | Total
(000) | |
| Assets: | | | | | | | | | |
| Common Stocks | | | | | | | | | |
Air Freight &
Logistics | | $ | 167 | | | $ | — | | | $ | — | | | $ | 167 | | |
| Auto Components | | | 133 | | | | — | | | | — | | | | 133 | | |
| Beverages | | | 709 | | | | — | | | | — | | | | 709 | | |
| Capital Markets | | | 476 | | | | — | | | | — | | | | 476 | | |
| Chemicals | | | 347 | | | | — | | | | — | | | | 347 | | |
Computers &
Peripherals | | | 682 | | | | — | | | | — | | | | 682 | | |
Diversified Consumer
Services | | | 1,056 | | | | — | | | | — | | | | 1,056 | | |
Diversified Financial
Services | | | 331 | | | | — | | | | — | | | | 331 | | |
| Electric Utilities | | | 253 | | | | — | | | | — | † | | | 253 | | |
Food & Staples
Retailing | | | 473 | | | | — | | | | — | | | | 473 | | |
Hotels, Restaurants &
Leisure | | | 369 | | | | — | | | | — | | | | 369 | | |
| Household Durables | | | 233 | | | | — | | | | — | | | | 233 | | |
Information
Technology
Services | | | 622 | | | | — | | | | — | | | | 622 | | |
| Insurance | | | 363 | | | | — | | | | — | | | | 363 | | |
Internet & Catalog
Retail | | | 1,023 | | | | — | | | | — | | | | 1,023 | | |
Internet Software &
Services | | | 1,902 | | | | — | | | | — | | | | 1,902 | | |
Leisure Equipment &
Products | | | 534 | | | | — | | | | — | | | | 534 | | |
| Marine | | | 171 | | | | — | | | | — | | | | 171 | | |
| Metals & Mining | | | 152 | | | | — | | | | — | | | | 152 | | |
| Multiline Retail | | | 436 | | | | — | | | | — | | | | 436 | | |
Oil, Gas &
Consumable Fuels | | | 137 | | | | — | | | | — | | | | 137 | | |
| Pharmaceuticals | | | 136 | | | | — | | | | — | | | | 136 | | |
Real Estate
Management &
Development | | | 360 | | | | — | | | | — | | | | 360 | | |
| Road & Rail | | | 515 | | | | — | | | | — | | | | 515 | | |
Textiles, Apparel &
Luxury Goods | | | 317 | | | | — | | | | — | | | | 317 | | |
Transportation
Infrastructure | | | 567 | | | | — | | | | — | | | | 567 | | |
| Total Common Stocks | | | 12,464 | | | | — | | | | — | † | | | 12,464 | | |
| Investment Type | | Level 1
Unadjusted
quoted
prices
(000) | | Level 2
Other
significant
observable
inputs
(000) | | Level 3
Significant
unobservable
inputs
(000) | | Total
(000) | |
Convertible
Preferred Stocks | | $ | — | | | $ | — | | | $ | 142 | | | $ | 142 | | |
| Participation Notes | | | — | | | | 711 | | | | — | | | | 711 | | |
Short-Term
Investment —
Investment Company | | | 288 | | | | — | | | | — | | | | 288 | | |
| Total Assets | | $ | 12,752 | | | $ | 711 | | | $ | 142 | | | $ | 13,605 | | |
Transfers between investment levels may occur as the markets fluctuate and/or the availability of data used in an investment's valuation changes. The Portfolio recognizes transfers between the levels as of the end of the period. As of December 31, 2011, securities with a total value of approximately $432,000 transferred from Level 1 to Level 2. At December 31, 2011, the fair market value of certain securities were adjusted due to developments which occurred between the time of the close of the foreign markets on which they trade and the close of business on the NYSE which resulted in their Level 2 classification.
Following is a reconciliation of investments in which significant unobservable inputs (Level 3) were used in determining fair value.
| | | Common
Stocks
(000) | | Convertible
Preferred
Stocks
(000) | |
| Beginning Balance | | $ | — | † | | $ | 278 | | |
| Purchases | | | — | | | | — | | |
| Sales | | | — | | | | (57 | ) | |
| Amortization of discount | | | — | | | | — | | |
| Transfers in | | | — | | | | — | | |
| Transfers out | | | — | | | | — | | |
| Change in unrealized appreciation (depreciation) | | | — | | | | (79 | ) | |
| Realized gains (losses) | | | — | | | | — | | |
| Ending Balance | | $ | — | † | | $ | 142 | | |
Net change in unrealized appreciation/depreciation
from investments still held as of December 31, 2011 | | $ | — | | | $ | (79 | ) | |
† Includes one or more securities which are valued at zero.
The accompanying notes are an integral part of the financial statements.
55
2011 Annual Report
December 31, 2011
Investment Overview (unaudited)
Global Real Estate Portfolio
The Global Real Estate Portfolio (the "Portfolio") seeks to provide current income and capital appreciation by investing primarily in equity securities of companies in the real estate industry located throughout the world, including real estate operating companies, real estate investment trusts and similar entities established outside the U.S. (foreign real estate companies).
Performance
For the year ended December 31, 2011, the Portfolio had a total return based on net asset value and reinvestment of distributions per share of -9.67%, net of fees, for Class I shares. The Portfolio's Class I shares underperformed against its benchmark, the FTSE EPRA/NAREIT Developed Real Estate Index — Net Total Return to U.S. Investors (the "Index"), which returned -6.00%, and underperformed the Morgan Stanley Capital International (MSCI) World Index, which returned -5.54%.
Factors Affecting Performance
• The global real estate securities market declined 6.00% during the 12-month period ending December 31, 2011, as measured by the Index. Global real estate securities posted gains in the first half of the year, but significantly declined in the third quarter on investor concerns about the prospects for a double-dip recession in the U.S., the European sovereign debt crisis and the risk of a hard landing scenario in China. Subsequently, real estate securities rallied in the fourth quarter, particularly in October as concerns about these factors eased.
• Performance within the European regional portfolio contributed to performance, while the Asian and U.S. portfolios detracted. Top-down global allocation detracted due to the underweight to the U.S. and overweight to Asia. In Asia, the Portfolio benefited from the underweight to Singapore; this was offset by the negative impact of the underweight to Australia, the overweight to Hong Kong, and stock selection in Singapore. In Europe, the Portfolio benefited from the overweight to the U.K. and stock selection within and the underweight to Germany; this was partially offset by relative losses from stock selection in the U.K. In the U.S., the Portfolio benefited from the underweight to the industrial sector and the overweight to the mall sector; this was offset by negative performance from stock selection in the diversified and health care sectors and the overweight to the hotel sector.
Management Strategies
• The global portfolio is comprised of three regional portfolios with a global allocation, which weights each of the three major regions (U.S., Europe, and Asia) based on our view of the relative attractiveness of each region in terms of underlying real estate fundamentals and public market valuations. Moreover, each of the regional portfolios reflects our core investment philosophy as a real estate value investor, which results in the ownership of stocks that we believe provide the best valuation relative to their underlying real estate values, while maintaining portfolio diversification. Our company-specific research leads us to specific preferences for sub-segments within each of the property sectors and countries. For the period ending December 31, 2011, the Portfolio was overweight the Asian listed property sector, modestly underweight the European listed property sector, and underweight the U.S. listed property sector.
• The overweight to the Asian region was predominated by the real estate operating companies (REOCs) in Hong Kong and Japan, as we believe these markets represent attractive valuation opportunities. The Hong Kong REOCs continued to trade at wide discounts to their net asset value (NAV), even after NAVs were modestly revised downward to reflect weakness in residential values and declines in rents/capital values for investment assets. The Japanese REOCs also continued to trade at wide discounts to NAV on continued uncertainty over prospects for underlying property fundamentals. We continue to maintain a preference for the major REOCs with predominant exposure to prime assets given relatively more stable property fundamentals, the ability to engage in value-added opportunities such as development and redevelopment, well-positioned balance sheets, and continued access to financing. This contrasts widely to the Asian REITs, which are passive, externally managed vehicles limited to property ownership, many of which maintain predominant exposure to secondary assets, which have weaker underlying property fundamentals. The Portfolio was underweight the Australian REIT sector on relative valuation.
• In Europe, the Portfolio was overweight the U.K. and underweight the Continent. Valuations on the
56
2011 Annual Report
December 31, 2011
Investment Overview (unaudited) (cont'd)
Global Real Estate Portfolio
Continent ended the period trading at a meaningful discount to NAV based on reported NAVs, which only reflect marginal capital value declines since the start of the credit crisis. Valuations in the U.K. ended the period trading at a significant discount to reported NAVs, which have partially recovered after experiencing significant declines in the two years to June 2009.
• The Portfolio was underweight the U.S., which traded at a premium to NAVs, assuming asset values for high-quality assets are approximately 10% below their all-time peak levels achieved in mid-2007. Some observers noted that the current premium to NAV is comparable to the historical average premium for the U.S. REIT market. Within the U.S., the Portfolio was overweight to a group of companies that are focused in the ownership of upscale urban hotels and a number of out-of-favor companies and underweight to companies concentrated in the ownership of suburban office, health care, and industrial assets.
• Key Asian markets (in particular Hong Kong and Singapore) had witnessed improvements in rents due to strong economies and tenant demand as well as low vacancy levels and limited new supply, but rents experienced some pullback in the second half of 2011 primarily due to uncertainty over global economic conditions. However, the lack of new supply (particularly in Hong Kong) is a key differentiating factor as compared to prior economic slowdowns in this region. Most Western markets (and Japan) have been slowly recovering (or bottoming) from significant declines in rents and occupancies but there are concerns regarding the pace of recovery due to economic weakness and risk of recession (particularly in Europe). Unlike previous real estate cycles, the key risk in these markets is not oversupply. Rather, the key issue is that many markets are close to cyclically high vacancy rates and prospects for a meaningful recovery of tenant demand remain lackluster, particularly as prospects for the global economy have become more uncertain. The expectation for an absence of material job growth also remains a significant concern, although this has been somewhat mitigated by limited new supply.
• We continue to maintain strong conviction in our value-oriented, bottom-up driven investment strategy, which is focused on investing in stocks that offer exposure to the direct property markets at the best relative valuations. In certain market segments, there is a very wide discrepancy between private and public valuations, and relative to other public listed property markets, largely driven by negative sentiment. With regard to current portfolio positioning, we recognize that negative investor sentiment may persist and may impact portfolio performance in the short term, but our strong conviction is based on our fundamental analysis, and we remain committed to our long-term, value-oriented, bottom-up driven investment strategy.
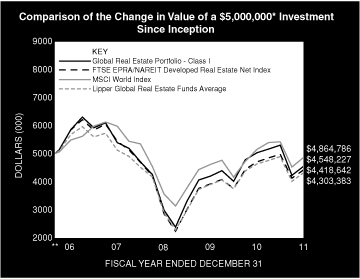
* Minimum Investment
** Commenced Operations on August 30, 2006.
In accordance with SEC regulations, Portfolio's performance shown assumes that all recurring fees (including management fees) were deducted and all dividends and distributions were reinvested. The performance of Class P, Class H, and Class L shares will vary from the Class I shares based upon different inception dates and will be negatively impacted by additional fees assessed to these classes.
57
2011 Annual Report
December 31, 2011
Investment Overview (unaudited) (cont'd)
Global Real Estate Portfolio
Performance Compared to the FTSE EPRA/NAREIT Developed Real Estate Index — Net Total Return to US Investors(1), the Morgan Stanley Capital International (MSCI) World Index(2) and the Lipper Global Real Estate Funds Average(3)
| | | Period Ended December 31, 2011 | |
| | | Total Returns(4) | |
| | | | | Average Annual | |
| | | One
Year | | Five
Years | | Ten
Years | | Since
Inception(8) | |
Portfolio — Class I Shares
w/o sales charges(5) | | | –9.67 | % | | | –4.94 | % | | | — | | | | –1.76 | % | |
FTSE EPRA/NAREIT Developed
Real Estate Index — Net Total
Return to US Investors | | | –6.00 | | | | –5.46 | | | | — | | | | –2.29 | | |
| MSCI World Index | | | –5.54 | | | | –2.37 | | | | — | | | | –0.51 | | |
Lipper Global Real Estate
Funds Average | | | –6.90 | | | | –6.13 | | | | — | | | | –3.46 | | |
Portfolio — Class P Shares
w/o sales charges(5) | | | –9.91 | | | | –5.21 | | | | — | | | | –2.03 | | |
FTSE EPRA/NAREIT Developed
Real Estate Index — Net Total
Return to US Investors | | | –6.00 | | | | –5.46 | | | | — | | | | –2.29 | | |
| MSCI World Index | | | –5.54 | | | | –2.37 | | | | — | | | | –0.51 | | |
Lipper Global Real Estate
Funds Average | | | –6.90 | | | | –6.13 | | | | — | | | | –3.46 | | |
Portfolio — Class H Shares
w/o sales charges(6) | | | –9.90 | | | | — | | | | — | | | | –4.34 | | |
Portfolio — Class H Shares
with maximum | | | –14.13 | | | | — | | | | — | | | | –5.50 | | |
| 4.75% sales charges | | | | | | | | | |
FTSE EPRA/NAREIT Developed
Real Estate Index — Net Total
Return to US Investors | | | –6.00 | | | | — | | | | — | | | | –4.99 | | |
| MSCI World Index | | | –5.54 | | | | — | | | | — | | | | –4.88 | | |
Lipper Global Real Estate
Funds Average | | | –6.90 | | | | — | | | | — | | | | –4.04 | | |
Portfolio — Class L Shares
w/o sales charges(7) | | | –10.33 | | | | — | | | | — | | | | –4.13 | | |
FTSE EPRA/NAREIT Developed
Real Estate Index — Net Total
Return to US Investors | | | –6.00 | | | | — | | | | — | | | | –3.76 | | |
| MSCI World Index | | | –5.54 | | | | — | | | | — | | | | –3.87 | | |
Lipper Global Real Estate
Funds Average | | | –6.90 | | | | — | | | | — | | | | –1.60 | | |
Performance data quoted represents past performance, which is no guarantee of future results, and current performance may be lower or higher than the figures shown. Performance assumes that all dividends and distributions, if any, were reinvested. For the most recent month-end performance figures, please visit www.morganstanley.com/im. Investment return and principal value will fluctuate so that Portfolio shares, when redeemed, may be worth more or less than their original cost. Total returns do not reflect the deduction of taxes that a shareholder would pay on Portfolio distributions or the redemption of Portfolio shares. Performance of share classes will vary due to difference in expenses.
(1) The FTSE EPRA/NAREIT Developed Real Estate Index — Net Total Return to US Investors is a market capitalization weighted index designed to reflect the stock performance of companies engaged in the North American, European and Asian real estate markets. The performance of the Index is listed in U.S. dollars and assumes reinvestment of dividends. "Net Total Return to US investors" reflects a reduction in total returns after taking into account the withholding tax on dividends by certain foreign countries represented in the Index for periods after 1/31/05 (gross returns used prior to 1/31/05). The Index is unmanaged and its returns do not include any sales charges or fees. Such costs would lower performance. It is not possible to invest directly in an index.
(1) The Morgan Stanley Capital International (MSCI) World Index is a free float-adjusted market capitalization weighted index that is designed to measure the global equity market performance of developed markets. The term "free float" represents the portion of shares outstanding that are deemed to be available for purchase in the public equity markets by investors. The MSCI World Index currently consists of 24 developed market country indices. The performance of the Index is listed in U.S. dollars and assumes reinvestment of net dividends. The Index is unmanaged and its returns do not include any sales charges or fees. Such costs would lower performance. It is not possible to invest directly in an index.
(3) The Lipper Global Real Estate Funds Average tracks the performance of all funds in the Lipper Global Real Estate Funds classification. The Average, which is adjusted for capital gains distributions and income dividends, is unmanaged and should not be considered an investment. As of the date of this report, the Portfolio was in the Lipper Global Real Estate Funds classification.
(4) Total returns for the Portfolio reflect fees waived and expenses reimbursed, if applicable, by the Adviser. Without such waivers and reimbursements, total returns would have been lower. The fee waivers and/or expense reimbursements will continue for one year or until such time as the Fund's Board of Directors acts to discontinue all or a portion of such waivers and/or expense reimbursements when it deems that such action is appropriate.
(5) Commenced operations on August 30, 2006.
(6) Commenced offering on January 2. 2008.
(7) Commenced offering on June 16, 2008.
(8) For comparative purposes, average annual since inception returns listed for the Indexes refer to the inception date or initial offering of the respective share class of the Portfolio, not the inception of the Index.
Portfolio Composition
| Classification | | Percentage of
Total Investments | |
| Diversified | | | 35.5 | % | |
| Retail | | | 20.8 | | |
| Residential | | | 12.6 | | |
| Office | | | 11.0 | | |
| Other* | | | 9.4 | | |
| Lodging/Resorts | | | 5.4 | | |
| Health Care | | | 5.3 | | |
| Total Investments | | | 100.0 | % | |
* Industries representing less than 5% of total investments.
58
2011 Annual Report
December 31, 2011
Portfolio of Investments
Global Real Estate Portfolio
| | | Shares | | Value
(000) | |
| Common Stocks (96.4%) | |
| Australia (7.9%) | |
| CFS Retail Property Trust REIT | | | 4,621,900 | | | $ | 7,966 | | |
| Commonwealth Property Office Fund REIT | | | 789,340 | | | | 771 | | |
Dexus Property Group REIT (Stapled
Securities) (a) | | | 9,041,036 | | | | 7,675 | | |
| Goodman Group REIT (Stapled Securities) (a) | | | 14,290,566 | | | | 8,331 | | |
| GPT Group REIT (Stapled Securities) (a) | | | 5,065,383 | | | | 15,905 | | |
| Mirvac Group REIT (Stapled Securities) (a)(b) | | | 4,713,829 | | | | 5,689 | | |
| Stockland REIT (Stapled Securities) (a)(b) | | | 3,643,722 | | | | 11,889 | | |
| Westfield Group REIT (Stapled Securities) (a)(b) | | | 5,144,967 | | | | 41,098 | | |
| Westfield Retail Trust REIT | | | 7,208,707 | | | | 18,359 | | |
| | | | 117,683 | | |
| Austria (0.1%) | |
| Atrium European Real Estate Ltd. | | | 306,973 | | | | 1,396 | | |
| Conwert Immobilien Invest SE | | | 34,318 | | | | 381 | | |
| | | | 1,777 | | |
| Belgium (0.1%) | |
| Befimmo SCA Sicafi REIT | | | 10,056 | | | | 654 | | |
| Cofinimmo REIT | | | 1,702 | | | | 200 | | |
| | | | 854 | | |
| Brazil (0.3%) | |
| BR Malls Participacoes SA | | | 10,680 | | | | 104 | | |
| BR Properties SA | | | 184,900 | | | | 1,834 | | |
| Iguatemi Empresa de Shopping Centers SA | | | 114,000 | | | | 2,118 | | |
| | | | 4,056 | | |
| Canada (1.6%) | |
| Boardwalk REIT | | | 135,390 | | | | 6,704 | | |
| Brookfield Office Properties Canada REIT | | | 39,451 | | | | 942 | | |
| Calloway REIT | | | 42,287 | | | | 1,111 | | |
| Extendicare REIT | | | 193,240 | | | | 1,612 | | |
| RioCan REIT | | | 526,565 | | | | 13,661 | | |
| | | | 24,030 | | |
| China (4.3%) | |
| China Overseas Land & Investment Ltd. (c) | | | 17,073,240 | | | | 28,534 | | |
| China Resources Land Ltd. (c) | | | 15,709,000 | | | | 25,242 | | |
Guangzhou R&F Properties Co., Ltd.,
H Shares (c) | | | 13,002,300 | | | | 10,279 | | |
| | | | 64,055 | | |
| Finland (0.3%) | |
| Citycon Oyj | | | 476,353 | | | | 1,424 | | |
| Sponda Oyj | | | 683,379 | | | | 2,760 | | |
| | | | 4,184 | | |
| France (3.6%) | |
| Fonciere Des Regions REIT | | | 60,184 | | | | 3,864 | | |
| Gecina SA REIT | | | 39,071 | | | | 3,287 | | |
| ICADE REIT | | | 52,143 | | | | 4,103 | | |
| Klepierre REIT | | | 318,073 | | | | 9,073 | | |
| Mercialys SA REIT | | | 38,108 | | | | 1,228 | | |
| Societe de la Tour Eiffel REIT | | | 14,182 | | | | 705 | | |
| | | Shares | | Value
(000) | |
Societe Immobiliere de Location pour
l'Industrie et le Commerce REIT | | | 20,297 | | | $ | 1,968 | | |
| Unibail-Rodamco SE REIT | | | 166,318 | | | | 29,899 | | |
| | | | 54,127 | | |
| Germany (0.5%) | |
| Alstria Office AG REIT | | | 366,575 | | | | 4,363 | | |
| Deutsche Euroshop AG | | | 28,053 | | | | 901 | | |
| Prime Office AG REIT (d) | | | 367,999 | | | | 2,070 | | |
| | | | 7,334 | | |
| Hong Kong (14.9%) | |
| Hang Lung Properties Ltd. | | | 4,515,000 | | | | 12,848 | | |
| Henderson Land Development Co., Ltd. | | | 2,201,440 | | | | 10,941 | | |
| Hongkong Land Holdings Ltd. | | | 8,896,000 | | | | 40,388 | | |
| Hysan Development Co., Ltd. | | | 4,466,231 | | | | 14,664 | | |
| Kerry Properties Ltd. | | | 5,744,720 | | | | 19,010 | | |
| Link REIT (The) | | | 897,000 | | | | 3,303 | | |
| New World Development , Ltd. | | | 5,307,825 | | | | 4,278 | | |
| Sino Land Co., Ltd. | | | 2,790,202 | | | | 3,973 | | |
| Sun Hung Kai Properties Ltd. | | | 7,294,712 | | | | 91,435 | | |
| Swire Pacific Ltd. | | | 145,000 | | | | 1,750 | | |
| Wharf Holdings Ltd. | | | 4,080,763 | | | | 18,443 | | |
| | | | 221,033 | | |
| Italy (0.2%) | |
| Beni Stabili SpA | | | 8,202,184 | | | | 3,671 | | |
| Japan (8.3%) | |
| Japan Real Estate Investment Corp. REIT | | | 738 | | | | 5,753 | | |
| Mitsubishi Estate Co., Ltd. | | | 2,954,000 | | | | 44,135 | | |
| Mitsui Fudosan Co., Ltd. | | | 2,642,000 | | | | 38,513 | | |
| Nippon Building Fund, Inc. REIT | | | 623 | | | | 5,099 | | |
| NTT Urban Development Corp. | | | 1,171 | | | | 799 | | |
| Sumitomo Realty & Development Co., Ltd. | | | 1,632,000 | | | | 28,582 | | |
| | | | 122,881 | | |
| Malta (0.0%) | |
| BGP Holdings PLC (d)(e) | | | 12,867,024 | | | | — | | |
| Netherlands (1.1%) | |
| Corio N.V. REIT | | | 183,603 | | | | 7,986 | | |
| Eurocommercial Properties N.V. CVA REIT | | | 191,929 | | | | 6,093 | | |
| Vastned Retail N.V. REIT | | | 3,303 | | | | 148 | | |
| Wereldhave N.V. REIT | | | 34,175 | | | | 2,269 | | |
| | | | 16,496 | | |
| Norway (0.0%) | |
| Norwegian Property ASA | | | 595,231 | | | | 732 | | |
| Singapore (1.7%) | |
| CapitaCommercial Trust REIT | | | 1,714,000 | | | | 1,394 | | |
| CapitaLand Ltd. | | | 8,120,000 | | | | 13,835 | | |
| CapitaMall Trust REIT | | | 416,000 | | | | 545 | | |
| CapitaMalls Asia Ltd. | | | 1,028,000 | | | | 896 | | |
| City Developments Ltd. | | | 723,000 | | | | 4,961 | | |
| Keppel Land Ltd. | | | 938,705 | | | | 1,607 | | |
| Suntec REIT | | | 1,612,000 | | | | 1,336 | | |
| | | | 24,574 | | |
The accompanying notes are an integral part of the financial statements.
59
2011 Annual Report
December 31, 2011
Portfolio of Investments (cont'd)
Global Real Estate Portfolio
| | | Shares | | Value
(000) | |
| Sweden (0.6%) | |
| Atrium Ljungberg AB, Class B | | | 164,980 | | | $ | 1,756 | | |
| Castellum AB | | | 46,751 | | | | 579 | | |
| Fabege AB | | | 101,669 | | | | 796 | | |
| Hufvudstaden AB, Class A | | | 521,843 | | | | 5,312 | | |
| | | | 8,443 | | |
| Switzerland (0.8%) | |
| PSP Swiss Property AG (Registered) (d) | | | 118,666 | | | | 9,930 | | |
| Swiss Prime Site AG (Registered) (d) | | | 27,173 | | | | 2,041 | | |
| | | | 11,971 | | |
| United Kingdom (6.2%) | |
| Big Yellow Group PLC REIT | | | 1,160,813 | | | | 4,422 | | |
| British Land Co., PLC REIT | | | 1,623,298 | | | | 11,660 | | |
| Capital & Counties Properties PLC | | | 529,552 | | | | 1,518 | | |
| Capital & Regional PLC (d) | | | 3,736,945 | | | | 1,843 | | |
| Capital Shopping Centres Group PLC REIT | | | 978,019 | | | | 4,744 | | |
| Derwent London PLC REIT | | | 156,247 | | | | 3,785 | | |
| Development Securities PLC | | | 338,808 | | | | 789 | | |
| Grainger PLC | | | 1,915,024 | | | | 3,182 | | |
| Great Portland Estates PLC REIT | | | 468,516 | | | | 2,350 | | |
| Hammerson PLC REIT | | | 2,264,836 | | | | 12,662 | | |
| Land Securities Group PLC REIT | | | 1,807,175 | | | | 17,836 | | |
| London & Stamford Property PLC | | | 367,200 | | | | 616 | | |
| LXB Retail Properties PLC (d) | | | 2,895,819 | | | | 4,688 | | |
| Metric Property Investments PLC REIT | | | 1,343,883 | | | | 1,774 | | |
| Quintain Estates & Development PLC (d) | | | 3,282,302 | | | | 1,924 | | |
| Safestore Holdings PLC | | | 2,590,902 | | | | 4,024 | | |
| Segro PLC REIT | | | 1,365,886 | | | | 4,423 | | |
| Shaftesbury PLC REIT | | | 178,399 | | | | 1,294 | | |
| ST Modwen Properties PLC | | | 2,027,392 | | | | 3,558 | | |
| Unite Group PLC | | | 1,924,373 | | | | 5,021 | | |
| | | | 92,113 | | |
| United States (43.9%) | |
| Acadia Realty Trust REIT | | | 264,481 | | | | 5,327 | | |
Apartment Investment & Management Co.,
Class A REIT | | | 941,068 | | | | 21,560 | | |
| Ashford Hospitality Trust, Inc. REIT | | | 327,820 | | | | 2,623 | | |
| Assisted Living Concepts, Inc., Class A | | | 238,038 | | | | 3,544 | | |
| AvalonBay Communities, Inc. REIT | | | 145,670 | | | | 19,025 | | |
| BioMed Realty Trust, Inc. REIT | | | 67,400 | | | | 1,219 | | |
| Boston Properties, Inc. REIT | | | 290,735 | | | | 28,957 | | |
| BRE Properties, Inc. REIT | | | 119,020 | | | | 6,008 | | |
| Brookfield Office Properties, Inc. | | | 1,327,226 | | | | 20,758 | | |
| Cabot Industrial Value Fund III, LP REIT (d)(e)(f)(g) | | | 6,512 | | | | 3,377 | | |
| Camden Property Trust REIT | | | 148,850 | | | | 9,264 | | |
| Capital Senior Living Corp. (d) | | | 70,600 | | | | 561 | | |
| CommonWealth REIT | | | 148,560 | | | | 2,472 | | |
| Coresite Realty Corp. REIT | | | 87,330 | | | | 1,556 | | |
| Cousins Properties, Inc. REIT | | | 1,100,345 | | | | 7,053 | | |
| CreXus Investment Corp. REIT | | | 65,150 | | | | 676 | | |
| DCT Industrial Trust, Inc. REIT | | | 1,020,670 | | | | 5,226 | | |
| Digital Realty Trust, Inc. REIT | | | 38,980 | | | | 2,599 | | |
| | | Shares | | Value
(000) | |
| Douglas Emmett, Inc. REIT | | | 61,590 | | | $ | 1,123 | | |
| Equity Lifestyle Properties, Inc. REIT | | | 179,821 | | | | 11,992 | | |
| Equity Residential REIT | | | 958,941 | | | | 54,688 | | |
| Exeter Industrial Value Fund, LP REIT (d)(e)(f)(g) | | | 1,860,000 | | | | 1,644 | | |
| Federal Realty Investment Trust REIT | | | 84,364 | | | | 7,656 | | |
| Forest City Enterprises, Inc., Class A (d) | | | 1,806,042 | | | | 21,347 | | |
| General Growth Properties, Inc. REIT | | | 2,294,918 | | | | 34,470 | | |
| HCP, Inc. REIT | | | 697,406 | | | | 28,894 | | |
| Health Care, Inc. REIT | | | 108,790 | | | | 5,932 | | |
| Healthcare Realty Trust, Inc. REIT | | | 963,177 | | | | 17,905 | | |
| Host Hotels & Resorts, Inc. REIT | | | 2,775,662 | | | | 40,997 | | |
| Hudson Pacific Properties, Inc. REIT | | | 219,970 | | | | 3,115 | | |
| KTR Industrial Fund II LP REIT (d)(e)(f)(g) | | | 4,268,750 | | | | 4,986 | | |
| Kite Realty Group Trust REIT | | | 66,590 | | | | 300 | | |
| Lexington Realty Trust REIT | | | 27,020 | | | | 202 | | |
| Liberty Property Trust REIT | | | 50,859 | | | | 1,571 | | |
| Mack-Cali Realty Corp. REIT | | | 419,418 | | | | 11,194 | | |
| Omega Healthcare Investors, Inc. REIT | | | 169,750 | | | | 3,285 | | |
| Parkway Properties, Inc. REIT | | | 57,798 | | | | 570 | | |
| ProLogis, Inc. REIT | | | 577,581 | | | | 16,513 | | |
| PS Business Parks, Inc. REIT | | | 49,153 | | | | 2,724 | | |
| Public Storage REIT | | | 186,765 | | | | 25,112 | | |
| Regency Centers Corp. REIT | | | 855,711 | | | | 32,192 | | |
| Retail Opportunity Investments Corp. REIT | | | 336,883 | | | | 3,989 | | |
| Senior Housing Properties Trust REIT | | | 705,762 | | | | 15,837 | | |
| Simon Property Group, Inc. REIT | | | 602,884 | | | | 77,736 | | |
| SL Green Realty Corp. REIT | | | 10,670 | | | | 711 | | |
| Sovran Self Storage, Inc. REIT | | | 22,459 | | | | 958 | | |
| STAG Industrial, Inc. REIT | | | 93,080 | | | | 1,068 | | |
| Starwood Hotels & Resorts Worldwide, Inc. | | | 754,175 | | | | 36,178 | | |
| Starwood Property Trust, Inc. REIT | | | 343,820 | | | | 6,364 | | |
| Vornado Realty Trust REIT | | | 463,101 | | | | 35,594 | | |
| Winthrop Realty Trust REIT | | | 205,450 | | | | 2,089 | | |
| | | | 650,741 | | |
| Total Common Stocks (Cost $1,609,865) | | | 1,430,755 | | |
| Short-Term Investment (3.1%) | |
| Investment Company (3.1%) | |
Morgan Stanley Institutional Liquidity
Funds — Money Market Portfolio —
Institutional Class (See Note G-2)
(Cost $45,225) | | | 45,224,627 | | | | 45,225 | | |
| Total Investments (99.5%) (Cost $1,655,090) | | | 1,475,980 | | |
| Other Assets in Excess of Liabilities (0.5%) | | | 7,790 | | |
| Net Assets (100.0%) | | $ | 1,483,770 | | |
(a) Comprised of securities in separate entities that are traded as a single stapled security.
(b) Consists of one or more classes of securities traded together as a unit; stocks with attached warrants.
(c) Security trades on the Hong Kong exchange.
(d) Non-income producing security.
The accompanying notes are an integral part of the financial statements.
60
2011 Annual Report
December 31, 2011
Portfolio of Investments (cont'd)
Global Real Estate Portfolio
(e) At December 31, 2011, the Portfolio held fair valued securities valued at approximately $10,007,000, representing 0.7% of net assets. These securities have been fair valued as determined in good faith under procedures established by and under the general supervision of the Fund's Directors.
(f) Security has been deemed illiquid at December 31, 2011.
(g) Restricted security valued at fair value and not registered under the Securities Act of 1933, Cabot Industrial Value Fund III, LP was acquired between 12/08 - 12/11 and has a current cost basis of approximately $3,256,000. Exeter Industrial Value Fund, LP was acquired between 11/07 - 4/11 and has a current cost basis of approximately $1,860,000. KTR Industrial Fund II LP was acquired between 1/09 - 11/11 and has a current cost basis of $4,269,000. At December 31, 2011, these securities had an aggregate market value of approximately $10,007,000 representing 0.7% of net assets.
CVA Certificaten Van Aandelen.
REIT Real Estate Investment Trust.
Fair Value Measurement Information:
The following is a summary of the inputs used to value the Portfolio's investments as of December 31, 2011. (See Note A-9 to the financial statements for further information regarding fair value measurement.)
| Investment Type | | Level 1
Unadjusted
quoted
prices
(000) | | Level 2
Other
significant
observable
inputs
(000) | | Level 3
Significant
unobservable
inputs
(000) | | Total
(000) | |
| Assets: | | | | | | | | | |
| Common Stocks | | | | | | | | | |
Commercial
Financing | | $ | 7,040 | | | $ | — | | | $ | — | | | $ | 7,040 | | |
| Diversified | | | 523,519 | | | | — | | | | — | † | | | 523,519 | | |
| Health Care | | | 77,570 | | | | — | | | | — | | | | 77,570 | | |
| Industrial | | | 35,561 | | | | — | | | | 10,007 | | | | 45,568 | | |
| Lodging/Resorts | | | 79,798 | | | | — | | | | — | | | | 79,798 | | |
Mixed Industrial/
Office | | | 6,129 | | | | — | | | | — | | | | 6,129 | | |
| Office | | | 162,937 | | | | — | | | | — | | | | 162,937 | | |
| Residential | | | 186,580 | | | | — | | | | — | | | | 186,580 | | |
| Retail | | | 307,098 | | | | — | | | | — | | | | 307,098 | | |
| Self Storage | | | 34,516 | | | | — | | | | — | | | | 34,516 | | |
| Total Common Stocks | | | 1,420,748 | | | | — | | | | 10,007 | | | | 1,430,755 | | |
Short-Term
Investment —
Investment Company | | | 45,225 | | | | — | | | | — | | | | 45,225 | | |
| Total Assets | | $ | 1,465,973 | | | $ | — | | | $ | 10,007 | | | $ | 1,475,980 | | |
Transfers between investment levels may occur as the markets fluctuate and/or the availability of data used in an investment's valuation changes. The Portfolio recognizes transfers between the levels as of the end of the period. As of December 31, 2011, the Portfolio did not have any significant investments transfer between investment levels.
Following is a reconciliation of investments in which significant unobservable inputs (Level 3) were used in determining fair value.
| | | Common
Stocks
(000) | |
| Beginning Balance | | $ | 4,343 | † | |
| Purchases | | | 4,876 | | |
| Sales | | | — | | |
| Amortization of discount | | | — | | |
| Transfers in | | | — | | |
| Transfers out | | | — | | |
| Change in unrealized appreciation (depreciation) | | | 788 | | |
| Realized gains (losses) | | | — | | |
| Ending Balance | | $ | 10,007 | † | |
Net change in unrealized appreciation/depreciation
from investments still held as of December 31, 2011 | | $ | 788 | | |
† Includes one or more securities which are valued at zero.
The accompanying notes are an integral part of the financial statements.
61
2011 Annual Report
December 31, 2011
Investment Overview (unaudited)
International Advantage Portfolio
The International Advantage Portfolio (the "Portfolio") seeks long-term capital appreciation by investing primarily in established companies on an international basis, with capitalizations within the range of companies included in the MSCI All Country World Ex-U.S. Index.
Performance
For the year ended December 31, 2011, the Portfolio had a total return based on net asset value and reinvestment of distributions per share of -1.31%, net of fees, for Class I shares. The Portfolio's Class I shares outperformed against its benchmark, the MSCI All Country World Ex-U.S. Index (the "Index"), which returned -13.71%.
Factors Affecting Performance
• International equities declined 13.71% for the year (as measured by the Index). Headwinds to the markets' progress included lackluster economic growth in the developed world, fears about a "hard landing" in China's economy, the worsening European debt crisis, political dysfunction in the U.S. and Europe, a tragic earthquake and tsunami in Japan, and social and political upheaval across the Middle East. Although corporate balance sheets and earnings in the U.S. and Europe remained strong throughout the year, waning investor confidence kept markets volatile. The U.S. market (which is not represented in the Index) outperformed those of Europe, Japan, and Asia ex-Japan, and developed market equities bested emerging market equities. (The performance of regional markets and developed and emerging markets is measured by their respective MSCI indexes.)
• The largest contributor to relative performance by far was exposure to the consumer staples sector, where the Portfolio had a significant overweight. Stock selection was also beneficial primarily because of strong performance from holdings within the food, beverage, and tobacco industry.
• Stock selection in the utilities sector added value. The Portfolio's sole holding in the sector performed well.
• A lack of exposure to the materials sector, which was the weakest-performing sector in the Index during the period, helped the Portfolio sidestep losses in the sector.
• However, relative gains were somewhat offset by the health care sector, where stock selection and an underweight were negative influences. The Portfolio held only one stock, a generic drug maker based in Israel, and its performance was disappointing during the period.
• The Portfolio's zero exposure to the energy sector and underweight in the telecommunication services sector also dampened relative results.
Management Strategies
• We look for high-quality growth companies that have these attributes: sustainable competitive advantages, business visibility, rising return on invested capital, free cash flow and a favorable risk/reward profile. In seeking these companies, we use intense fundamental research. Our emphasis is on secular growth, and as a result short-term market events are not as meaningful in the stock selection process.
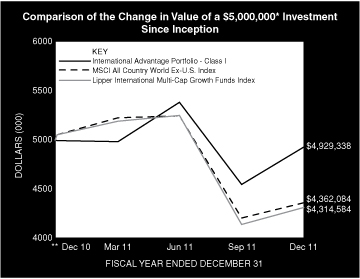
* Minimum Investment
** Commenced Operations on December 28, 2010.
In accordance with SEC regulations, Portfolio's performance shown assumes that all recurring fees (including management fees) were deducted and all dividends and distributions were reinvested. The performance of Class P, Class H, and Class L shares will vary from the Class I shares based upon it will be negatively impacted by additional fees assessed to these classes.
62
2011 Annual Report
December 31, 2011
Investment Overview (unaudited) (cont'd)
International Advantage Portfolio
Performance Compared to the Morgan Stanley Capital International (MSCI) All Country World Ex-U.S. Index(1) and the Lipper International Multi-Cap Growth Funds Index(2)
| | | Period Ended December 31, 2011 | |
| | | Total Returns(3) | |
| | | | | Average Annual | |
| | | One
Year | | Five
Years | | Ten
Years | | Since
Inception(5) | |
Portfolio — Class I Shares
w/o sales charges(4) | | | –1.31 | % | | | — | | | | — | | | | –1.40 | % | |
MSCI All Country World
Ex-U.S. Index | | | –13.71 | | | | — | | | | — | | | | –12.66 | | |
Lipper International Multi-Cap
Growth Funds Index | | | –14.65 | | | | — | | | | — | | | | –13.61 | | |
Portfolio — Class H Shares
w/o sales charges(4) | | | –1.57 | | | | — | | | | — | | | | –1.65 | | |
Portfolio — Class H Shares
with maximum 4.75%
sales charges(4) | | | –6.26 | | | | — | | | | — | | | | –6.30 | | |
MSCI All Country World
Ex-U.S. Index | | | –13.71 | | | | — | | | | — | | | | –12.66 | | |
Lipper International Multi-Cap
Growth Funds Index | | | –14.65 | | | | — | | | | — | | | | –13.61 | | |
Portfolio — Class L Shares
w/o sales charges(4) | | | –2.09 | | | | — | | | | — | | | | –2.17 | | |
MSCI All Country World
Ex-U.S. Index | | | –13.71 | | | | — | | | | — | | | | –12.66 | | |
Lipper International Multi-Cap
Growth Funds Index | | | –14.65 | | | | — | | | | — | | | | –13.61 | | |
Portfolio — Class P Shares
w/o sales charges(4) | | | –1.57 | | | | — | | | | — | | | | –1.66 | | |
MSCI All Country World
Ex-U.S. Index | | | –13.71 | | | | — | | | | — | | | | –12.66 | | |
Lipper International Multi-Cap
Growth Funds Index | | | –14.65 | | | | — | | | | — | | | | –13.61 | | |
Performance data quoted represents past performance, which is no guarantee of future results, and current performance may be lower or higher than the figures shown. Performance assumes that all dividends and distributions, if any, were reinvested. For the most recent month-end performance figures, please visit www.morganstanley.com/im. Investment return and principal value will fluctuate so that Portfolio shares, when redeemed, may be worth more or less than their original cost. Total returns do not reflect the deduction of taxes that a shareholder would pay on Portfolio distributions or the redemption of Portfolio shares. Performance of share classes will vary due to difference in expenses.
(1) The Morgan Stanley Capital International (MSCI) All Country World Ex-U.S. Index is a free float-adjusted market capitalization weighted index designed to measure the equity market performance of developed and emerging markets, excluding the U.S. The term "free float" represents the portion of shares outstanding that are deemed to be available for purchase in the public equity markets by investors. The performance of the Index is listed in U.S. dollars and assumes reinvestment of net dividends.The Index is unmanaged and its returns do not include any sales charges or fees. Such costs would lower performance. It is not possible to invest directly in an index.
(2) The Lipper International Multi-Cap Growth Funds Index is an equally weighted performance index of the largest qualifying funds (based on net assets) in the Lipper International Multi-Cap Growth Funds classification. The Index, which is adjusted for capital gains distributions and income dividends, is unmanaged and should not be considered an investment. There are currently 30 funds represented in this Index. As of the date of this report, the Portfolio was in the Lipper International Multi-Cap Growth Funds classification.
(3) Total returns for the Portfolio reflect fees waived and expenses reimbursed, if applicable, by the Adviser. Without such waivers and reimbursements, total returns would have been lower. The fee waivers and/or expense reimbursements will continue for one year or until such time as the Fund's Board of Directors acts to discontinue all or a portion of such waivers and/or expense reimbursements when it deems that such action is appropriate.
(4) Commenced operations on December 28, 2010.
(5) For comparative purposes, average annual since inception returns listed for the Indexes refer to the inception date or initial offering of the respective share class of the Portfolio, not the inception of the Index.
Portfolio Composition
| Classification | | Percentage of
Total Investments | |
| Other* | | | 43.1 | % | |
| Beverages | | | 22.7 | | |
| Food Products | | | 13.0 | | |
| Textiles, Apparel & Luxury Goods | | | 7.8 | | |
| Food & Staples Retailing | | | 6.7 | | |
| Road & Rail | | | 6.7 | | |
| Total Investments | | | 100.0 | % | |
* Industries representing less than 5% of total investments.
63
2011 Annual Report
December 31, 2011
Portfolio of Investments
International Advantage Portfolio
| | | Shares | | Value
(000) | |
| Common Stocks (91.8%) | |
| Australia (2.8%) | |
| QR National Ltd. | | | 17,008 | | | $ | 59 | | |
| Belgium (6.0%) | |
| Anheuser-Busch InBev N.V. | | | 2,076 | | | | 127 | | |
| Brazil (3.6%) | |
| BM&F Bovespa SA | | | 9,494 | | | | 50 | | |
| Natura Cosmeticos SA | | | 1,418 | | | | 27 | | |
| | | | 77 | | |
| Canada (7.0%) | |
| Brookfield Asset Management, Inc., Class A | | | 2,548 | | | | 70 | | |
| Brookfield Infrastructure Partners LP | | | 2,887 | | | | 80 | | |
| | | | 150 | | |
| China (15.8%) | |
| China Merchants Holdings International Co., Ltd. (a) | | | 26,991 | | | | 78 | | |
| Golden Eagle Retail Group Ltd. (a) | | | 30,000 | | | | 63 | | |
| Hengan International Group Co., Ltd. (a) | | | 5,500 | | | | 52 | | |
New Oriental Education & Technology Group,
Inc. ADR (b) | | | 3,009 | | | | 72 | | |
| Tingyi Cayman Islands Holding Corp. (a) | | | 12,000 | | | | 37 | | |
| Want Want China Holdings Ltd. (a) | | | 35,000 | | | | 35 | | |
| | | | 337 | | |
| Denmark (3.8%) | |
| DSV A/S | | | 4,444 | | | | 80 | | |
| Finland (2.1%) | |
| Kone Oyj, Class B | | | 860 | | | | 45 | | |
| France (10.0%) | |
| Christian Dior SA | | | 442 | | | | 52 | | |
| Danone | | | 947 | | | | 60 | | |
| Pernod-Ricard SA | | | 1,104 | | | | 102 | | |
| | | | 214 | | |
| Germany (2.2%) | |
| Adidas AG | | | 732 | | | | 48 | | |
| Hong Kong (3.9%) | |
| Sun Art Retail Group Ltd. (b) | | | 66,500 | | | | 83 | | |
| Israel (2.5%) | |
| Teva Pharmaceutical Industries Ltd. ADR | | | 1,315 | | | | 53 | | |
| Italy (3.0%) | |
| Prada SpA (a)(b) | | | 13,900 | | | | 63 | | |
| Norway (2.3%) | |
| Telenor ASA | | | 2,995 | | | | 49 | | |
| Switzerland (9.3%) | |
| Kuehne & Nagel International AG (Registered) | | | 520 | | | | 58 | | |
| Nestle SA (Registered) | | | 2,425 | | | | 140 | | |
| | | | 198 | | |
| United Kingdom (14.9%) | |
| British American Tobacco PLC | | | 1,027 | | | | 49 | | |
| Diageo PLC | | | 5,306 | | | | 116 | | |
| Imperial Tobacco Group PLC | | | 1,128 | | | | 42 | | |
| Reckitt Benckiser Group PLC | | | 1,092 | | | | 54 | | |
| Tesco PLC | | | 8,971 | | | | 56 | | |
| | | | 317 | | |
| | | Shares | | Value
(000) | |
| United States (2.6%) | |
| Li & Fung Ltd. (a) | | | 30,000 | | | $ | 56 | | |
| Total Common Stocks (Cost $2,061) | | | 1,956 | | |
| Participation Notes (6.0%) | |
| China (6.0%) | |
Deutsche Bank AG, Kweichow Moutai Co.,
Ltd., Class A, Equity Linked Notes,
Zero Coupon, 3/4/21 (Cost $103) | | | 4,180 | | | | 129 | | |
| Total Investments (97.8%) (Cost $2,164) | | | 2,085 | | |
| Other Assets in Excess of Liabilities (2.2%) | | | 47 | | |
| Net Assets (100.0%) | | $ | 2,132 | | |
(a) Security trades on the Hong Kong exchange.
(b) Non-income producing security.
ADR American Depositary Receipt.
Fair Value Measurement Information:
The following is a summary of the inputs used to value the Portfolio's investments as of December 31, 2011. (See Note A-9 to the financial statements for further information regarding fair value measurement.)
| Investment Type | | Level 1
Unadjusted
quoted
prices
(000) | | Level 2
Other
significant
observable
inputs
(000) | | Level 3
Significant
unobservable
inputs
(000) | | Total
(000) | |
| Assets: | | | | | | | | | |
| Common Stocks | | | | | | | | | |
| Beverages | | $ | 345 | | | $ | — | | | $ | — | | | $ | 345 | | |
| Distributors | | | 56 | | | | — | | | | — | | | | 56 | | |
Diversified Consumer
Services | | | 72 | | | | — | | | | — | | | | 72 | | |
Diversified Financial
Services | | | 50 | | | | — | | | | — | | | | 50 | | |
Diversified
Telecommunication
Services | | | 49 | | | | — | | | | — | | | | 49 | | |
| Electric Utilities | | | 80 | | | | — | | | | — | | | | 80 | | |
| Food & Staples Retailing | | | 139 | | | | — | | | | — | | | | 139 | | |
| Food Products | | | 272 | | | | — | | | | — | | | | 272 | | |
| Household Products | | | 54 | | | | — | | | | — | | | | 54 | | |
| Machinery | | | 45 | | | | — | | | | — | | | | 45 | | |
| Marine | | | 58 | | | | — | | | | — | | | | 58 | | |
| Multiline Retail | | | 63 | | | | — | | | | — | | | | 63 | | |
| Personal Products | | | 79 | | | | — | | | | — | | | | 79 | | |
| Pharmaceuticals | | | 53 | | | | — | | | | — | | | | 53 | | |
Real Estate
Management &
Development | | | 70 | | | | — | | | | — | | | | 70 | | |
| Road & Rail | | | 139 | | | | — | | | | — | | | | 139 | | |
Textiles, Apparel &
Luxury Goods | | | 163 | | | | — | | | | — | | | | 163 | | |
| Tobacco | | | 91 | | | | — | | | | — | | | | 91 | | |
The accompanying notes are an integral part of the financial statements.
64
2011 Annual Report
December 31, 2011
Portfolio of Investments (cont'd)
International Advantage Portfolio
Fair Value Measurement Information: (cont'd)
| Investment Type | | Level 1
Unadjusted
quoted
prices
(000) | | Level 2
Other
significant
observable
inputs
(000) | | Level 3
Significant
unobservable
inputs
(000) | | Total
(000) | |
| Common Stocks (cont'd) | |
Transportation
Infrastructure | | $ | 78 | | | $ | — | | | $ | — | | | $ | 78 | | |
| Total Common Stocks | | | 1,956 | | | | — | | | | — | | | | 1,956 | | |
| Participation Notes | | | — | | | | 129 | | | | — | | | | 129 | | |
| Total Assets | | $ | 1,956 | | | $ | 129 | | | $ | — | | | $ | 2,085 | | |
Transfers between investment levels may occur as the markets fluctuate and/or the availability of data used in an investment's valuation changes. The Portfolio recognizes transfers between the levels as of the end of the period. As of December 31, 2011, the Portfolio did not have any significant investments transfer between investment levels.
The accompanying notes are an integral part of the financial statements.
65
2011 Annual Report
December 31, 2011
Investment Overview (unaudited)
International Equity Portfolio
The International Equity Portfolio (the "Portfolio") seeks long-term capital appreciation by investing primarily in equity securities of non-U.S. issuers.
Performance
For the year ended December 31, 2011, the Portfolio had a total return based on net asset value and reinvestment of distributions per share of -7.63%, net of fees, for Class I shares. The Portfolio's Class I shares outperformed against its benchmark, the MSCI EAFE Index (the "Index"), which returned -12.14%.
Factors Affecting Performance
• 2011 ended with a whimper, with the Index falling 1.0% in December on low trading volumes, mainly due to local currency weakness against the dollar. This resulted in a +3.3% return in the Index for the quarter and brought the return for the year to -12.1%.
• For the year, all cyclical sectors fared poorly: materials fell 23%, information technology declined 18%, industrials dropped 15% and consumer discretionary lost 14%. Both the health care (+5.7%) and consumer staples (+4.1%) sectors scraped out marginal gains for the year as their fortunes are less sensitive to macro-economics, which deteriorated as the euro zone crisis escalated from bank balance sheets to European government balance sheets, to affect credit creation worldwide. One rather surprising exception to the broad story of cyclical weakness was the oil price, partly due to continued political uncertainty in the Middle East, with the result that free cash flows and share prices have remained resilient in the energy sector.
• For the year as a whole, the Portfolio solidly outperformed the Index, mainly due to strong performance from stock selection in consumer staples as well as from the Portfolio's bias to higher-quality, more resilient companies overall. Stock selection in utilities and materials also added value. In contrast, stock selection in industrials was the largest detractor from relative performance over the period.
Management Strategies
• Even if there is no cataclysm in Europe, this year the world remains a dangerous place to invest. Much of the West is in the grip of massive balance sheet deleveraging, and is shedding assets, postponing spending decisions and hoarding cash in low-return investments. We know from the Japanese experience just how long a balance sheet recession can persist. The question for governments is how should or can they respond. Do they take the quasi-Keynesian approach adopted by the U.S. and U.K. and hope that foreigners remain holders or buyers of the rapidly expanding supply of government bonds? Or do they take the medicine the Austrian school demands and enforce fiscal discipline and austerity? The former risks sudden bond market or currency collapse, the latter ensures prolonged economic weakness. For now, the better route certainly seems the former as the U.S. and British bond markets show no sign of fragility.
• The problem is that in a globalized world European financial retrenchment is impacting credit everywhere, not just in Europe. Global growth is already suffering and will continue to do so, including in China. At the same time Basel III regulations demand larger capital buffers for banks, stimulating deleveraging further. Ultimately, we worry that politicians will just find it preferable to agree that free-market finance does not work, and that they can do it better.
• Finally, with all these uncertainties, we continue to believe that it is essential to focus on finding what we consider to be high-quality companies — companies with resilient sources of profit, that can generate high returns on their capital, with managements that invest for the long term — and to find the shares of these companies that are trading well below our assessment of fair value. These sorts of companies are in short supply, and just as the highest-quality corporate debt has rerated upwards we remain convinced that equity markets will put these sorts of companies on a pedestal. That the Portfolio remains at a very similar valuation to the broader Index despite the Portfolio's much superior quality suggests to us that there is much to look forward to, at least in terms of relative performance, even if the broader macroeconomic outlook is stormy.
66
2011 Annual Report
December 31, 2011
Investment Overview (unaudited) (cont'd)
International Equity Portfolio
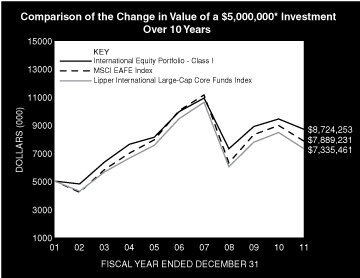
* Minimum Investment
In accordance with SEC regulations, Portfolio's performance shown assumes that all recurring fees (including management fees) were deducted and all dividends and distributions were reinvested. The performance of Class P shares will vary from the Class I shares based upon its different inception date and will be negatively impacted by additional fees assessed to that class.
Performance Compared to the Morgan Stanley Capital International (MSCI) EAFE Index(1) and the Lipper International Large-Cap Core Funds Index(2)
| | | Period Ended December 31, 2011 | |
| | | Total Returns(3) | |
| | | | | Average Annual | |
| | | One
Year | | Five
Years | | Ten
Years | | Since
Inception(6) | |
Portfolio — Class I Shares
w/o sales charges(4) | | | –7.63 | % | | | –2.63 | % | | | 5.72 | % | | | 8.53 | % | |
| MSCI EAFE Index | | | –12.14 | | | | –4.72 | | | | 4.67 | | | | 3.63 | | |
Lipper International Large-Cap
Core Funds Index | | | –13.56 | | | | –4.96 | | | | 3.91 | | | | 5.76 | | |
Portfolio — Class P Shares
w/o sales charges(5) | | | –7.83 | | | | –2.88 | | | | 5.47 | | | | 7.34 | | |
| MSCI EAFE Index | | | –12.14 | | | | –4.72 | | | | 4.67 | | | | 3.55 | | |
Lipper International Large-Cap
Core Funds Index | | | –13.56 | | | | –4.96 | | | | 3.91 | | | | 4.65 | | |
Performance data quoted represents past performance, which is no guarantee of future results, and current performance may be lower or higher than the figures shown. Performance assumes that all dividends and distributions, if any, were reinvested. For the most recent month-end performance figures, please visit www.morganstanley.com/im. Investment return and principal value will fluctuate so that Portfolio shares, when redeemed, may be worth more or less than their original cost. Total returns do not reflect the deduction of taxes that a shareholder would pay on Portfolio distributions or the redemption of Portfolio shares. Performance of share classes will vary due to difference in expenses.
(1) The Morgan Stanley Capital International (MSCI) EAFE Index (Europe, Australasia, Far East) is a free float-adjusted market capitalization index that is designed to measure the international equity market performance of developed markets, excluding the US & Canada. The term "free float" represents the portion of shares outstanding that are deemed to be available for purchase in the public equity markets by investors. The MSCI EAFE Index curently consists of 22 developed market country indices. The performance of the Index is listed in U.S. dollars and assumes reinvestment of net dividends. The Index is unmanaged and its returns do not include any sales charges or fees. Such costs would lower performance. It is not possible to invest directly in an index.
(2) The Lipper International Large-Cap Core Funds Index is an equally weighted performance index of the largest qualifying funds (based on net assets) in the Lipper International Large-Cap Core Funds classification. The Index, which is adjusted for capital gains distributions and income dividends, is unmanaged and should not be considered an investment. There are currently 30 funds represented in this Index. As of the date of this report, the Portfolio is in the Lipper International Large-Cap Core Funds classification.
(3) Total returns for the Portfolio reflect fees waived and expenses reimbursed, if applicable, by the Adviser. Without such waivers and reimbursements, total returns would have been lower. The fee waivers and/or expense reimbursements will continue for one year or until such time as the Fund's Board of Directors acts to discontinue all or a portion of such waivers and/or expense reimbursements when it deems that such action is appropriate.
(4) Commenced operations on August 4, 1989.
(5) Commenced offering on January 2, 1996.
(6) For comparative purposes, average annual since inception returns listed for the Indexes refer to the inception date or initial offering of the respective share class of the Portfolio, not the inception of the Index.
Portfolio Composition*
| Classification | | Percentage of
Total Investments | |
| Other** | | | 44.7 | % | |
| Pharmaceuticals | | | 10.5 | | |
| Tobacco | | | 8.8 | | |
| Food Products | | | 8.6 | | |
| Insurance | | | 7.9 | | |
| Oil, Gas & Consumable Fuels | | | 7.3 | | |
| Commercial Banks | | | 7.0 | | |
| Electronic Equipment, Instruments & Components | | | 5.2 | | |
| Total Investments | | | 100.0 | % | |
* Percentages indicated are based upon total investments (excluding Securities held as Collateral on Loaned Securities) as of December 31, 2011.
** Industries representing less than 5% of total investments.
67
2011 Annual Report
December 31, 2011
Portfolio of Investments
International Equity Portfolio
| | | Shares | | Value
(000) | |
| Common Stocks (97.8%) | |
| Australia (3.3%) | |
| AMP Ltd. | | | 8,865,258 | | | $ | 36,904 | | |
| Orica Ltd. | | | 283,556 | | | | 7,030 | | |
| Santos Ltd. | | | 4,570,816 | | | | 57,223 | | |
| WorleyParsons Ltd. | | | 1,044,786 | | | | 27,431 | | |
| | | | 128,588 | | |
| Canada (0.2%) | |
| Encana Corp. (a) | | | 463,338 | | | | 8,591 | | |
| China (0.2%) | |
| AIA Group Ltd. (b) | | | 2,748,100 | | | | 8,580 | | |
| France (8.1%) | |
| ArcelorMittal | | | 955,514 | | | | 17,474 | | |
| BNP Paribas SA | | | 767,994 | | | | 30,167 | | |
| France Telecom SA | | | 2,023,116 | | | | 31,775 | | |
| Legrand SA (a) | | | 2,399,510 | | | | 77,173 | | |
| Sanofi | | | 1,258,656 | | | | 92,447 | | |
| Societe Generale SA | | | 683,722 | | | | 15,225 | | |
| Vallourec SA | | | 784,957 | | | | 50,959 | | |
| | | | 315,220 | | |
| Germany (5.7%) | |
| BASF SE | | | 545,385 | | | | 38,039 | | |
| Bayer AG (Registered) | | | 1,625,408 | | | | 103,922 | | |
| Continental AG (c) | | | 331,320 | | | | 20,624 | | |
| SAP AG | | | 367,774 | | | | 19,444 | | |
| Volkswagen AG (Preference) | | | 253,383 | | | | 37,959 | | |
| | | | 219,988 | | |
| Ireland (1.6%) | |
| CRH PLC | | | 3,133,299 | | | | 62,289 | | |
| Italy (1.3%) | |
| Eni SpA | | | 2,414,222 | | | | 50,025 | | |
| Japan (23.5%) | |
| Asatsu-DK, Inc. (a) | | | 587,185 | | | | 15,433 | | |
| Astellas Pharma, Inc. | | | 1,200,200 | | | | 48,806 | | |
| Hitachi Ltd. (a) | | | 10,668,000 | | | | 55,994 | | |
| Hoya Corp. | | | 3,314,100 | | | | 71,389 | | |
| Inpex Corp. | | | 8,585 | | | | 54,095 | | |
| Keyence Corp. | | | 167,010 | | | | 40,272 | | |
| Kyocera Corp. | | | 442,500 | | | | 35,586 | | |
| Lawson, Inc. (a) | | | 436,200 | | | | 27,231 | | |
| Mitsubishi Corp. | | | 3,146,000 | | | | 63,558 | | |
| Mitsubishi Electric Corp. | | | 5,093,000 | | | | 48,832 | | |
| Mitsubishi Estate Co., Ltd. | | | 4,223,000 | | | | 63,095 | | |
| Mitsui OSK Lines Ltd. | | | 2,015,391 | | | | 7,803 | | |
| MS&AD Insurance Group Holdings | | | 1,148,800 | | | | 21,284 | | |
| NGK Spark Plug Co., Ltd. | | | 4,147,000 | | | | 51,454 | | |
| Nitto Denko Corp. | | | 398,900 | | | | 14,273 | | |
| NTT DoCoMo, Inc. | | | 26,704 | | | | 49,092 | | |
| Sekisui House Ltd. | | | 5,551,000 | | | | 49,257 | | |
| Sumitomo Mitsui Financial Group, Inc. | | | 1,016,132 | | | | 28,304 | | |
| Sumitomo Mitsui Trust Holdings, Inc. | | | 9,593,999 | | | | 28,170 | | |
| | | Shares | | Value
(000) | |
| Taiyo Nippon Sanso Corp. | | | 1,279,000 | | | $ | 8,923 | | |
| Tokyo Electron Ltd. | | | 1,162,100 | | | | 59,109 | | |
| Toyota Motor Corp. | | | 2,112,300 | | | | 70,392 | | |
| | | | 912,352 | | |
| Netherlands (5.8%) | |
| Akzo Nobel N.V. (a) | | | 1,195,031 | | | | 57,783 | | |
| Unilever N.V. CVA (a) | | | 4,809,579 | | | | 165,393 | | |
| | | | 223,176 | | |
| Singapore (0.3%) | |
| Singapore Telecommunications Ltd. | | | 3,971,000 | | | | 9,460 | | |
| Switzerland (11.8%) | |
| Holcim Ltd. (Registered) (c) | | | 633,523 | | | | 33,892 | | |
| Nestle SA (Registered) | | | 2,941,560 | | | | 169,109 | | |
| Novartis AG (Registered) | | | 1,584,343 | | | | 90,577 | | |
| Roche Holding AG (Genusschein) | | | 419,515 | | | | 71,103 | | |
| UBS AG (Registered) (c) | | | 3,742,646 | | | | 44,547 | | |
| Zurich Financial Services AG (c) | | | 207,082 | | | | 46,848 | | |
| | | | 456,076 | | |
| United Kingdom (34.4%) | |
| Admiral Group PLC | | | 2,927,419 | | | | 38,734 | | |
| Barclays PLC | | | 12,006,832 | | | | 32,827 | | |
| BG Group PLC | | | 2,152,513 | | | | 46,014 | | |
| BHP Billiton PLC | | | 1,340,627 | | | | 39,090 | | |
| BP PLC | | | 9,202,210 | | | | 65,810 | | |
| British American Tobacco PLC | | | 3,693,699 | | | | 175,273 | | |
| Bunzl PLC | | | 3,046,636 | | | | 41,826 | | |
| HSBC Holdings PLC | | | 11,861,132 | | | | 90,453 | | |
| Imperial Tobacco Group PLC | | | 4,376,251 | | | | 165,490 | | |
| Legal & General Group PLC | | | 22,831,495 | | | | 36,450 | | |
| Lloyds Banking Group PLC (c) | | | 115,225,790 | | | | 46,356 | | |
| Prudential PLC | | | 8,504,785 | | | | 84,333 | | |
| Reckitt Benckiser Group PLC | | | 2,777,257 | | | | 137,156 | | |
| Resolution Ltd. | | | 9,042,212 | | | | 35,303 | | |
| Smiths Group PLC | | | 3,290,048 | | | | 46,752 | | |
| SSE PLC | | | 2,941,317 | | | | 58,971 | | |
| Travis Perkins PLC | | | 2,761,904 | | | | 34,121 | | |
| Vodafone Group PLC | | | 32,830,284 | | | | 91,213 | | |
| WM Morrison Supermarkets PLC | | | 3,208,960 | | | | 16,256 | | |
| Xstrata PLC | | | 3,398,366 | | | | 51,616 | | |
| | | | 1,334,044 | | |
| United States (1.6%) | |
| Dr. Pepper Snapple Group, Inc. (a) | | | 1,538,371 | | | | 60,735 | | |
| Total Common Stocks (Cost $3,818,622) | | | 3,789,124 | | |
| Short-Term Investments (5.0%) | |
| Securities held as Collateral on Loaned Securities (2.6%) | |
| Investment Company (1.9%) | |
Morgan Stanley Institutional Liquidity
Funds — Money Market Portfolio —
Institutional Class (See Note G-2) | | | 75,901,428 | | | | 75,901 | | |
The accompanying notes are an integral part of the financial statements.
68
2011 Annual Report
December 31, 2011
Portfolio of Investments (cont'd)
International Equity Portfolio
| | | Face
Amount
(000) | | Value
(000) | |
| Repurchase Agreements (0.7%) | |
Barclays Capital, Inc., (0.02%,
dated 12/30/11, due 1/3/12; proceeds
$3,260; fully collateralized by a
U.S. Government Obligation; U.S. Treasury
Bond 4.50% due 5/15/38;
valued at $3,325) | | $ | 3,260 | | | $ | 3,260 | | |
Merrill Lynch & Co., Inc., (0.07%,
dated 12/30/11, due 1/3/12; proceeds
$24,213; fully collateralized by a
U.S. Government Agency; Government
National Mortgage Association 3.50%
due 11/20/41; valued at $24,697) | | | 24,213 | | | | 24,213 | | |
| | | | 27,473 | | |
Total Securities held as Collateral on
Loaned Securities (Cost $103,374) | | | 103,374 | | |
| | | Shares | | | |
| Investment Company (2.4%) | |
Morgan Stanley Institutional Liquidity
Funds — Money Market Portfolio —
Institutional Class (See Note G-2)
(Cost $93,090) | | | 93,089,502 | | | | 93,090 | | |
| Total Short-Term Investments (Cost $196,464) | | | 196,464 | | |
Total Investments (102.8%) (Cost $4,015,086)
Including $100,073 of Securities Loaned | | | 3,985,588 | | |
| Liabilities in Excess of Other Assets (-2.8%) | | | (110,183 | ) | |
| Net Assets (100.0%) | | $ | 3,875,405 | | |
(a) All or a portion of this security was on loan at December 31, 2011.
(b) Security trades on the Hong Kong exchange.
(c) Non-income producing security.
CVA Certificaten Van Aandelen.
Fair Value Measurement Information:
The following is a summary of the inputs used to value the Portfolio's investments as of December 31, 2011. (See Note A-9 to the financial statements for further information regarding fair value measurement.)
| Investment Type | | Level 1
Unadjusted
quoted
prices
(000) | | Level 2
Other
significant
observable
inputs
(000) | | Level 3
Significant
unobservable
inputs
(000) | | Total
(000) | |
| Assets: | | | | | | | | | |
| Common Stocks | | | | | | | | | |
| Auto Components | | $ | 72,078 | | | $ | — | | | $ | — | | | $ | 72,078 | | |
| Automobiles | | | 108,351 | | | | — | | | | — | | | | 108,351 | | |
| Beverages | | | 60,735 | | | | — | | | | — | | | | 60,735 | | |
| Capital Markets | | | 44,547 | | | | — | | | | — | | | | 44,547 | | |
| Chemicals | | | 126,048 | | | | — | | | | — | | | | 126,048 | | |
| Commercial Banks | | | 271,502 | | | | — | | | | — | | | | 271,502 | | |
| Construction Materials | | | 96,181 | | | | — | | | | — | | | | 96,181 | | |
Diversified
Telecommunication
Services | | | 41,235 | | | | — | | | | — | | | | 41,235 | | |
| Electric Utilities | | | 58,971 | | | | — | | | | — | | | | 58,971 | | |
| Electrical Equipment | | | 126,005 | | | | — | | | | — | | | | 126,005 | | |
| Investment Type | | Level 1
Unadjusted
quoted
prices
(000) | | Level 2
Other
significant
observable
inputs
(000) | | Level 3
Significant
unobservable
inputs
(000) | | Total
(000) | |
Electronic Equipment,
Instruments &
Components | | $ | 203,241 | | | $ | — | | | $ | — | | | $ | 203,241 | | |
Energy Equipment &
Services | | | 27,431 | | | | — | | | | — | | | | 27,431 | | |
Food & Staples
Retailing | | | 43,487 | | | | — | | | | — | | | | 43,487 | | |
| Food Products | | | 334,502 | | | | — | | | | — | | | | 334,502 | | |
| Household Durables | | | 49,257 | | | | — | | | | — | | | | 49,257 | | |
| Household Products | | | 137,156 | | | | — | | | | — | | | | 137,156 | | |
Industrial
Conglomerates | | | 46,752 | | | | — | | | | — | | | | 46,752 | | |
| Insurance | | | 308,436 | | | | — | | | | — | | | | 308,436 | | |
| Machinery | | | 50,959 | | | | — | | | | — | | | | 50,959 | | |
| Marine | | | 7,803 | | | | — | | | | — | | | | 7,803 | | |
| Media | | | 15,433 | | | | — | | | | — | | | | 15,433 | | |
| Metals & Mining | | | 108,180 | | | | — | | | | — | | | | 108,180 | | |
Oil, Gas &
Consumable Fuels | | | 281,758 | | | | — | | | | — | | | | 281,758 | | |
| Pharmaceuticals | | | 406,855 | | | | — | | | | — | | | | 406,855 | | |
Real Estate
Management &
Development | | | 63,095 | | | | — | | | | — | | | | 63,095 | | |
Semiconductors &
Semiconductor
Equipment | | | 59,109 | | | | — | | | | — | | | | 59,109 | | |
| Software | | | 19,444 | | | | — | | | | — | | | | 19,444 | | |
| Tobacco | | | 340,763 | | | | — | | | | — | | | | 340,763 | | |
Trading Companies &
Distributors | | | 139,505 | | | | — | | | | — | | | | 139,505 | | |
Wireless
Telecommunication
Services | | | 140,305 | | | | — | | | | — | | | | 140,305 | | |
| Total Common Stocks | | | 3,789,124 | | | | — | | | | — | | | | 3,789,124 | | |
Short-Term
Investments | |
| Investment Company | | | 168,991 | | | | — | | | | — | | | | 168,991 | | |
Repurchase
Agreements | | | — | | | | 27,473 | | | | — | | | | 27,473 | | |
Total Short-Term
Investments | | | 168,991 | | | | 27,473 | | | | — | | | | 196,464 | | |
| Total Assets | | $ | 3,958,115 | | | $ | 27,473 | | | $ | — | | | $ | 3,985,588 | | |
Transfers between investment levels may occur as the markets fluctuate and/or the availability of data used in an investment's valuation changes. The Portfolio recognizes transfers between the levels as of the end of the period. As of December 31, 2011, the Portfolio did not have any significant investments transfer between investment levels.
The accompanying notes are an integral part of the financial statements.
69
2011 Annual Report
December 31, 2011
Investment Overview (unaudited)
International Opportunity Portfolio
The International Opportunity Portfolio (the "Portfolio") seeks long-term capital appreciation by investing primarily in established and emerging franchise companies on an international basis with capitalization within the range of companies included in the MSCI All Country World Ex-U.S. Index.
Performance
For the year ended December 31, 2011, the Portfolio had a total return based on net asset value and reinvestment of distributions per share of -10.16%, net of fees, for Class I shares. The Portfolio's Class I shares outperformed against its benchmark, the MSCI All Country World Ex-U.S. Index (the "Index"), which returned -13.71%.
Factors Affecting Performance
• International equities declined 13.71% for the year (as measured by the Index). Headwinds to the markets' progress included lackluster economic growth in the developed world, fears about a "hard landing" in China's economy, the worsening European debt crisis, political dysfunction in the U.S. and Europe, a tragic earthquake and tsunami in Japan, and social and political upheaval across the Middle East. Although corporate balance sheets and earnings in the U.S. and Europe remained strong throughout the year, waning investor confidence kept markets volatile. The U.S. market (which is not represented in the Index) outperformed those of Europe, Japan, and Asia ex-Japan, and developed market equities bested emerging market equities. (The performance of regional markets and developed and emerging markets is measured by their respective MSCI indexes.)
• The largest contributor to relative performance was the consumer staples sector, as both an overweight and stock selection in the sector were favorable during the period. Holdings within the food, beverage, and tobacco industry contributed most to relative gains.
• Stock selection and an underweight in the financials sector also aided relative performance. The Portfolio benefited from strong performance from a holding in a clearinghouse for over-the-counter (OTC) securities in Brazil and the lack of exposure to bank stocks, a group which performed poorly over the period.
• Stock selection and an underweight in the utilities sector added value. The Portfolio's sole holding in the sector performed well.
• Conversely, stock selection and an overweight in the consumer discretionary sector hampered relative returns. The largest detractors were holdings in a real estate developer in Brazil and a tutoring services provider in China.
• Further dampening relative performance were stock selection and an underweight in the health care sector. The Portfolio held only one stock in this sector, a generic drug maker based in Israel, and its performance was disappointing during the period.
• The Portfolio's underweight exposure to the energy sector also detracted from relative performance.
Management Strategies
• We look for high-quality growth companies that have these attributes: sustainable competitive advantages, business visibility, rising return on invested capital, free cash flow and a favorable risk/reward profile. In seeking these companies, we use intense fundamental research. Our emphasis is on secular growth, and as a result, short-term market events are not as meaningful in the stock selection process.
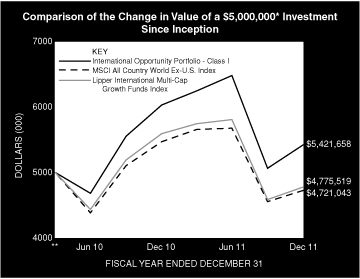
* Minimum Investment
** Commenced Operations on March 31, 2010.
In accordance with SEC regulations, Portfolio's performance shown assumes that all recurring fees (including management fees) were deducted and all dividends and distributions were reinvested. The performance of Class P, Class H, and Class L shares will vary from the Class I shares based upon it will be negatively impacted by additional fees assessed to these classes.
70
2011 Annual Report
December 31, 2011
Investment Overview (unaudited) (cont'd)
International Opportunity Portfolio
Performance Compared to the Morgan Stanley Capital International (MSCI) All Country World Ex-U.S. Index(1) and the Lipper International Multi-Cap Growth Funds Index(2)
| | | Period Ended December 31, 2011 | |
| | | Total Returns(3) | |
| | | | | Average Annual | |
| | | One
Year | | Five
Years | | Ten
Years | | Since
Inception(5) | |
Portfolio — Class I Shares
w/o sales charges(4) | | | –10.16 | % | | | — | | | | — | | | | 4.73 | % | |
MSCI All Country World
Ex-U.S. Index | | | –13.71 | | | | — | | | | — | | | | –3.22 | | |
Lipper International Multi-Cap
Growth Index | | | –14.65 | | | | — | | | | — | | | | –2.59 | | |
Portfolio — Class H Shares
w/o sales charges(4) | | | –10.30 | | | | — | | | | — | | | | 4.49 | | |
Portfolio — Class H Shares
with maximum 4.75%
sales charges(4) | | | –14.56 | | | | — | | | | — | | | | 1.62 | | |
MSCI All Country World
Ex-U.S. Index | | | –13.71 | | | | — | | | | — | | | | –3.22 | | |
Lipper International Multi-Cap
Growth Index | | | –14.65 | | | | — | | | | — | | | | –2.59 | | |
Portfolio — Class L Shares
w/o sales charges(4) | | | –10.81 | | | | — | | | | — | | | | 3.95 | | |
MSCI All Country World
Ex-U.S. Index | | | –13.71 | | | | — | | | | — | | | | –3.22 | | |
Lipper International Multi-Cap
Growth Index | | | –14.65 | | | | — | | | | — | | | | –2.59 | | |
Portfolio — Class P Shares
w/o sales charges(4) | | | –10.33 | | | | — | | | | — | | | | 4.47 | | |
MSCI All Country World
Ex-U.S. Index | | | –13.71 | | | | — | | | | — | | | | –3.22 | | |
Lipper International Multi-Cap
Growth Index | | | –14.65 | | | | — | | | | — | | | | –2.59 | | |
Performance data quoted represents past performance, which is no guarantee of future results, and current performance may be lower or higher than the figures shown. Performance assumes that all dividends and distributions, if any, were reinvested. For the most recent month-end performance figures, please visit www.morganstanley.com/im. Investment return and principal value will fluctuate so that Portfolio shares, when redeemed, may be worth more or less than their original cost. Total returns do not reflect the deduction of taxes that a shareholder would pay on Portfolio distributions or the redemption of Portfolio shares. Performance of share classes will vary due to difference in sales charges and expenses.
(1) The Morgan Stanley Capital International (MSCI) All Country World Ex-U.S. Index is a free float-adjusted market capitalization weighted index designed to measure the equity market performance of developed and emerging markets, excluding the U.S. The term "free float" represents the portion of shares outstanding that are deemed to be available for purchase in the public equity markets by investors. The performance of the Index is listed in U.S. dollars and assumes reinvestment of net dividends. The Index is unmanaged and its returns do not include any sales charges or fees. Such costs would lower performance. It is not possible to invest directly in an index.
(2) The Lipper International Multi-Cap Growth Funds Index is an equally weighted performance index of the largest qualifying funds (based on net assets) in the Lipper International Multi-Cap Growth Funds classification. The Index, which is adjusted for capital gains distributions and income dividends, is unmanaged and should not be considered an investment. There are currently 30 funds represented in this Index. As of the date of this report, the Portfolio was in the Lipper International Multi-Cap Growth Funds classification.
(3) Total returns for the Portfolio reflect fees waived and expenses reimbursed, if applicable, by the Adviser. Without such waivers and reimbursements, total returns would have been lower. The fee waivers and/or expense reimbursements will continue for one year or until such time as the Fund's Board of Directors acts to discontinue all or a portion of such waivers and/or expense reimbursements when it deems that such action is appropriate.
(4) Commenced operations on March 31, 2010.
(5) For comparative purposes, average annual since inception returns listed for the Indexes refer to the inception date or initial offering of the respective share class of the Portfolio, not the inception of the Index.
Portfolio Composition
| Classification | | Percentage of
Total Investments | |
| Other* | | | 45.4 | % | |
| Beverages | | | 14.6 | | |
| Internet Software & Services | | | 8.9 | | |
| Diversified Consumer Services | | | 8.7 | | |
| Road & Rail | | | 6.0 | | |
| Textiles, Apparel & Luxury Goods | | | 5.7 | | |
| Food & Staples Retailing | | | 5.4 | | |
| Leisure Equipment & Products | | | 5.3 | | |
| Total Investments | | | 100.0 | % | |
* Industries representing less than 5% of total investments.
71
2011 Annual Report
December 31, 2011
Portfolio of Investments
International Opportunity Portfolio
| | | Shares | | Value
(000) | |
| Common Stocks (91.8%) | |
| Australia (3.3%) | |
| AET&D Holdings No. 1 Ltd. (a)(b)(c) | | | 16,699 | | | $ | — | | |
| Lynas Corp. Ltd. (a) | | | 85,730 | | | | 92 | | |
| QR National Ltd. | | | 29,226 | | | | 102 | | |
| | | | 194 | | |
| Belgium (3.4%) | |
| Anheuser-Busch InBev N.V. | | | 3,232 | | | | 198 | | |
| Brazil (7.1%) | |
| BM&FBovespa SA | | | 16,528 | | | | 87 | | |
| Brookfield Incorporacoes SA | | | 42,967 | | | | 114 | | |
| CETIP SA - Balcao Organizado de Ativos e Derivativos | | | 14,478 | | | | 209 | | |
| | | | 410 | | |
| Canada (6.3%) | |
| Brookfield Asset Management, Inc., Class A | | | 7,482 | | | | 206 | | |
| Brookfield Infrastructure Partners LP | | | 5,635 | | | | 156 | | |
| | | | 362 | | |
| China (25.6%) | |
| Baidu, Inc. ADR (a) | | | 2,414 | | | | 281 | | |
| China Merchants Holdings International Co., Ltd. (d) | | | 51,649 | | | | 150 | | |
| Golden Eagle Retail Group Ltd. (d) | | | 97,000 | | | | 205 | | |
| Hengan International Group Co., Ltd. (d) | | | 9,500 | | | | 89 | | |
New Oriental Education & Technology
Group, Inc. ADR (a) | | | 11,240 | | | | 270 | | |
| Tencent Holdings Ltd. (d) | | | 4,700 | | | | 95 | | |
| Wynn Macau Ltd. (d) | | | 63,200 | | | | 159 | | |
| Xueda Education Group ADR (a) | | | 51,295 | | | | 179 | | |
| Youku.com, Inc. ADR (a) | | | 3,639 | | | | 57 | | |
| | | | 1,485 | | |
| Denmark (4.2%) | |
| DSV A/S | | | 13,619 | | | | 244 | | |
| France (4.0%) | |
| Christian Dior SA | | | 735 | | | | 87 | | |
| Pernod-Ricard SA | | | 1,577 | | | | 146 | | |
| | | | 233 | | |
| Germany (3.7%) | |
| Adidas AG | | | 1,402 | | | | 91 | | |
| BASF SE | | | 1,764 | | | | 123 | | |
| | | | 214 | | |
| Hong Kong (4.9%) | |
| Minth Group Ltd. | | | 68,000 | | | | 64 | | |
| Sun Art Retail Group Ltd. (a) | | | 175,500 | | | | 219 | | |
| | | | 283 | | |
| India (1.6%) | |
| MakeMyTrip Ltd. (a) | | | 3,781 | | | | 91 | | |
| Israel (1.8%) | |
| Teva Pharmaceutical Industries Ltd. ADR | | | 2,564 | | | | 104 | | |
| Italy (2.6%) | |
| Prada SpA (a)(d) | | | 33,300 | | | | 151 | | |
| Japan (5.3%) | |
| Universal Entertainment Corp. | | | 11,100 | | | | 307 | | |
| | | Shares | | Value
(000) | |
| Korea, Republic of (0.9%) | |
| MegaStudy Co., Ltd. | | | 543 | | | $ | 52 | | |
| Russia (1.4%) | |
| Yandex N.V., Class A (a) | | | 4,032 | | | | 79 | | |
| Switzerland (6.8%) | |
| Kuehne & Nagel International AG (Registered) | | | 1,228 | | | | 138 | | |
| Nestle SA (Registered) | | | 2,139 | | | | 123 | | |
| Panalpina Welttransport Holding AG (Registered) (a) | | | 1,320 | | | | 135 | | |
| | | | 396 | | |
| United Kingdom (4.5%) | |
| Diageo PLC ADR | | | 1,855 | | | | 162 | | |
| Tesco PLC | | | 15,355 | | | | 96 | | |
| | | | 258 | | |
| United States (4.4%) | |
| Greenlight Capital Re Ltd., Class A (a) | | | 7,555 | | | | 179 | | |
| Li & Fung Ltd. (d) | | | 42,000 | | | | 78 | | |
| | | | 257 | | |
| Total Common Stocks (Cost $5,181) | | | 5,318 | | |
| Convertible Preferred Stocks (0.8%) | |
| China (0.0%) | |
| Youku.com, Inc., Class A (a)(b)(c) | | | 6 | | | | — | @ | |
| United States (0.8%) | |
| Better Place, Inc. Series C (a)(b)(c) | | | 10,721 | | | | 49 | | |
| Total Convertible Preferred Stocks (Cost $49) | | | 49 | | |
| Participation Notes (5.8%) | |
| China (5.8%) | |
Deutsche Bank AG, Kweichow Moutai Co.,
Ltd., Class A, Equity Linked Notes,
Zero Coupon, 3/4/21 | | | 3,060 | | | | 94 | | |
UBS AG, Kweichow Moutai Co., Ltd., Class A,
Equity Linked Notes, Zero Coupon, 2/25/13 | | | 7,810 | | | | 240 | | |
| Total Participation Notes (Cost $242) | | | 334 | | |
| Short-Term Investment (1.3%) | |
| Investment Company (1.3%) | |
Morgan Stanley Institutional Liquidity
Funds — Money Market Portfolio —
Institutional Class (See Note G-2) (Cost $72) | | | 72,468 | | | | 72 | | |
| Total Investments (99.7%) (Cost $5,544) | | | 5,773 | | |
| Other Assets in Excess of Liabilities (0.3%) | | | 19 | | |
| Net Assets (100.0%) | | $ | 5,792 | | |
(a) Non-income producing security.
(b) At December 31, 2011, the Portfolio held fair valued securities valued at approximately $49,000, representing 0.8% of net assets. These securities have been fair valued as determined in good faith under procedures established by and under the general supervision of the Fund's Directors.
(c) Security has been deemed illiquid at December 31, 2011.
(d) Security trades on the Hong Kong exchange.
@ Value is less than $500.
ADR American Depositary Receipt.
The accompanying notes are an integral part of the financial statements.
72
2011 Annual Report
December 31, 2011
Portfolio of Investments (cont'd)
International Opportunity Portfolio
Fair Value Measurement Information:
The following is a summary of the inputs used to value the Portfolio's investments as of December 31, 2011. (See Note A-9 to the financial statements for further information regarding fair value measurement.)
| Investment Type | | Level 1
Unadjusted
quoted
prices
(000) | | Level 2
Other
significant
observable
inputs
(000) | | Level 3
Significant
unobservable
inputs
(000) | | Total
(000) | |
| Assets: | | | | | | | | | |
| Common Stocks | | | | | | | | | |
| Air Freight & Logistics | | $ | 135 | | | $ | — | | | $ | — | | | $ | 135 | | |
| Auto Components | | | 64 | | | | — | | | | — | | | | 64 | | |
| Beverages | | | 506 | | | | — | | | | — | | | | 506 | | |
| Capital Markets | | | 209 | | | | — | | | | — | | | | 209 | | |
| Chemicals | | | 123 | | | | — | | | | — | | | | 123 | | |
| Distributors | | | 78 | | | | — | | | | — | | | | 78 | | |
Diversified Consumer
Services | | | 501 | | | | — | | | | — | | | | 501 | | |
Diversified Financial
Services | | | 87 | | | | — | | | | — | | | | 87 | | |
| Electric Utilities | | | 156 | | | | — | | | | — | † | | | 156 | | |
Food & Staples
Retailing | | | 315 | | | | — | | | | — | | | | 315 | | |
| Food Products | | | 123 | | | | — | | | | — | | | | 123 | | |
Hotels, Restaurants &
Leisure | | | 159 | | | | — | | | | — | | | | 159 | | |
| Household Durables | | | 114 | | | | — | | | | — | | | | 114 | | |
| Insurance | | | 179 | | | | — | | | | — | | | | 179 | | |
| Internet & Catalog Retail | | | 91 | | | | — | | | | — | | | | 91 | | |
Internet Software &
Services | | | 512 | | | | — | | | | — | | | | 512 | | |
Leisure Equipment &
Products | | | 307 | | | | — | | | | — | | | | 307 | | |
| Marine | | | 138 | | | | — | | | | — | | | | 138 | | |
| Metals & Mining | | | 92 | | | | — | | | | — | | | | 92 | | |
| Multiline Retail | | | 205 | | | | — | | | | — | | | | 205 | | |
| Personal Products | | | 89 | | | | — | | | | — | | | | 89 | | |
| Pharmaceuticals | | | 104 | | | | — | | | | — | | | | 104 | | |
Real Estate
Management &
Development | | | 206 | | | | — | | | | — | | | | 206 | | |
| Road & Rail | | | 346 | | | | — | | | | — | | | | 346 | | |
Textiles, Apparel &
Luxury Goods | | | 329 | | | | — | | | | — | | | | 329 | | |
Transportation
Infrastructure | | | 150 | | | | — | | | | — | | | | 150 | | |
| Total Common Stocks | | | 5,318 | | | | — | | | | — | † | | | 5,318 | | |
Convertible
Preferred Stocks | | | — | | | | — | | | | 49 | | | | 49 | | |
| Participation Notes | | | — | | | | 334 | | | | — | | | | 334 | | |
| Short-Term Investment — | |
| Investment Company | | | 72 | | | | — | | | | — | | | | 72 | | |
| Total Assets | | $ | 5,390 | | | $ | 334 | | | $ | 49 | † | | $ | 5,773 | | |
Transfers between investment levels may occur as the markets fluctuate and/or the availability of data used in an investment's valuation changes. The Portfolio recognizes transfers between the levels as of the end of the period. As of December 31, 2011, securities with a total value of approximately $240,000 transferred from Level 1 to Level 2. At December 31, 2011, the fair market value of certain securities were adjusted due to developments which occurred between the time of the close of the foreign markets on which they trade and the close of business on the NYSE which resulted in their Level 2 classification.
Following is a reconciliation of investments in which significant unobservable inputs (Level 3) were used in determining fair value.
| | | Common
Stock
(000) | | Convertible
Preferred
Stock
(000) | |
| Beginning Balance | | $ | — | † | | $ | 106 | | |
| Purchases | | | — | | | | 49 | | |
| Sales | | | — | | | | (30 | ) | |
| Amortization of discount | | | — | | | | — | | |
| Transfers in | | | — | | | | — | | |
| Transfers out | | | — | | | | — | | |
| Change in unrealized appreciation (depreciation) | | | — | | | | (76 | ) | |
| Realized gains (losses) | | | — | | | | — | | |
| Ending Balance | | $ | — | † | | $ | 49 | | |
Net change in unrealized appreciation/depreciation
from investments still held as of
December 31, 2011 | | $ | — | | | $ | (76 | ) | |
† Includes one or more securities which are valued at zero.
The accompanying notes are an integral part of the financial statements.
73
2011 Annual Report
December 31, 2011
Investment Overview (unaudited)
International Real Estate Portfolio
The International Real Estate Portfolio (the "Portfolio") seeks to provide current income and long-term capital appreciation by investing primarily in equity securities of companies in the real estate industry located throughout the world (excluding the United States and Canada).
Performance
For the year ended December 31, 2011, the Portfolio had a total return based on net asset value and reinvestment of distributions per share of -19.92%, net of fees, for Class I shares. The Portfolio's Class I shares underperformed against its benchmark, the FTSE EPRA/NAREIT Developed Ex-North America Real Estate — Net Total Return Index (the "Index"), which returned -17.81%, and underperformed the MSCI EAFE Index, which returned -12.14%.
Factors Affecting Performance
• The international real estate securities market declined 17.81% during the 12-month period ending December 31, 2011, as measured by the Index. International real estate securities posted modest gains in the first half of the year, but significantly declined in the third quarter on investor concerns about the European sovereign debt crisis and the risk of a hard landing scenario in China. Subsequently, real estate securities rallied significantly in October as concerns about these factors eased, but posted further declines in November and December.
• Stock selection within the European regional portfolio contributed to performance, while the Asian portfolio detracted. Top-down global allocation was neutral. In Asia, the Portfolio benefited from the underweight to Singapore; this was offset by the negative impact of the underweight to Australia, the overweight to Hong Kong, and stock selection in Singapore. In Europe, the Portfolio benefited from the overweight to the U.K., stock selection within and the underweight to Germany, and the underweight to Austria; this was partially offset by relative losses from stock selection in the U.K.
Management Strategies
• The MSIF International Real Estate Portfolio is comprised of two regional portfolios with a global allocation which weights the European and Asian regions based on our view of the relative attractiveness of each region in terms of underlying real estate fundamentals and public market valuations. Moreover, both of the regional portfolios reflect our core investment philosophy as a real estate value investor, which results in the ownership of stocks that we believe provide the best valuation relative to their underlying real estate values, while maintaining portfolio diversification. Our company specific research leads us to specific preferences for sub-segments within each of the property sectors and countries. For the period ended December 31, 2011, the Portfolio was overweight the Asian listed property sector and underweight the European listed property sector.
• The overweight to the Asian region was predominated by the real estate operating companies (REOCs) in Hong Kong and Japan, as we believe these markets represent attractive valuation opportunities. The Hong Kong REOCs continued to trade at wide discounts to their net asset value (NAV), even after NAVs were modestly revised downward to reflect weakness in residential values and declines in rents/capital values for investment assets. The Japanese REOCs also continued to trade at wide discounts to NAV on continued uncertainty over prospects for underlying property fundamentals. We continue to maintain a preference for the major REOCs with predominant exposure to prime assets given relatively more stable property fundamentals, the ability to engage in value-added opportunities such as development and redevelopment, well-positioned balance sheets, and continued access to financing. This contrasts widely to the Asian REITs, which are passive, externally managed vehicles limited to property ownership, many of which maintain predominant exposure to secondary assets, which have weaker underlying property fundamentals. The Portfolio was underweight the Australian REIT sector on relative valuation.
• In Europe, the Portfolio was overweight the U.K. and underweight the Continent. Valuations on the Continent ended the period trading at a meaningful discount to NAV based on reported NAVs, which only reflect marginal capital value declines since the start of the credit crisis. Valuations in the U.K. ended the period trading at a significant discount to
74
2011 Annual Report
December 31, 2011
Investment Overview (unaudited) (cont'd)
International Real Estate Portfolio
reported NAVs, which have partially recovered after experiencing significant declines in the two years to June 2009.
• Key Asian markets (in particular Hong Kong and Singapore) had witnessed improvements in rents due to strong economies and tenant demand as well as low vacancy levels and limited new supply, but rents experienced some pullback in the second half of 2011 primarily due to uncertainty over global economic conditions. However, the lack of new supply (particularly in Hong Kong) is a key differentiating factor as compared to prior economic slowdowns in this region. Most Western markets (and Japan) have been slowly recovering (or bottoming) from significant declines in rents and occupancies but there are concerns regarding the pace of recovery due to economic weakness and risk of recession (particularly in Europe). Unlike previous real estate cycles, the key risk in these markets is not oversupply. Rather, the key issue is that many markets are close to cyclically high vacancy rates and prospects for a meaningful recovery of tenant demand remain lackluster, particularly as prospects for the global economy have become more uncertain. The expectation for an absence of material job growth also remains a significant concern, although this has been somewhat mitigated by limited new supply.
• We continue to maintain strong conviction in our value-oriented, bottom-up driven investment strategy, which is focused on investing in stocks that offer exposure to the direct property markets at the best relative valuations. In certain market segments, there is a very wide discrepancy between private and public valuations, and relative to other public listed property markets, largely driven by negative sentiment. With regard to current portfolio positioning, we recognize that negative investor sentiment may persist and may impact portfolio performance in the short term, but our strong conviction is based on our fundamental analysis, and we remain committed to our long-term, value-oriented, bottom-up driven investment strategy.
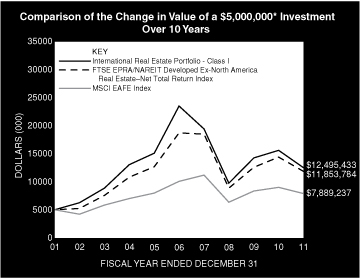
* Minimum Investment
In accordance with SEC regulations, Portfolio's performance shown assumes that all recurring fees (including management fees) were deducted and all dividends and distributions were reinvested. The performance of Class P shares will vary from the Class I shares based upon it will be negatively impacted by additional fees assessed to that class.
Performance Compared to the FTSE EPRA/NAREIT Developed Ex-North America Real Estate — Net Total Return Index(1) and the MSCI EAFE Index(2)
| | | Period Ended December 31, 2011 | |
| | | Total Returns(4) | |
| | | | | Average Annual | |
| | | One
Year | | Five
Years | | Ten
Years | | Since
Inception(5) | |
Portfolio — Class I Shares
w/o sales charges(5) | | | –19.92 | % | | | –11.92 | % | | | 9.59 | % | | | 6.87 | % | |
FTSE EPRA/NAREIT Developed
Ex-North America Real Estate —
Net Total Return Index | | | –17.81 | | | | –8.75 | | | | 9.02 | | | | 4.45 | | |
| MSCI EAFE Index | | | –12.14 | | | | –4.72 | | | | 4.67 | | | | 2.83 | | |
Portfolio — Class P Shares
w/o sales charges(5) | | | –20.16 | | | | –12.14 | | | | 9.31 | | | | 6.61 | | |
FTSE EPRA/NAREIT Developed
Ex-North America Real Estate —
Net Total Return Index | | | –17.81 | | | | –8.75 | | | | 9.02 | | | | 4.45 | | |
| MSCI EAFE Index | | | –12.14 | | | | –4.72 | | | | 4.67 | | | | 2.83 | | |
Performance data quoted represents past performance, which is no guarantee of future results, and current performance may be lower or higher than the figures shown. Performance assumes that all dividends and distributions, if any, were reinvested. For the most recent month-end performance figures, please visit www.morganstanley.com/im. Investment return and principal value will fluctuate so that Portfolio shares, when redeemed, may be worth more or less than their original cost. Total returns do not reflect the deduction of taxes that a shareholder would pay on Portfolio distributions or the redemption of Portfolio shares. Performance of share classes will vary due to difference in expenses.
75
2011 Annual Report
December 31, 2011
Investment Overview (unaudited) (cont'd)
International Real Estate Portfolio
(1) The FTSE EPRA/NAREIT Developed Ex-North America Real Estate — Net Total Return Index The FTSE EPRA/NAREIT Developed Ex-North America Real Estate — Net Total Return Index is a free float-adjusted market capitalization weighted index designed to reflect the stock performance of companies engaged in the European and Asian real estate markets. The performance of the Index is listed in U.S. dollars and assumes reinvestment of dividends. "Net Total Return to U.S. investors" reflects a reduction in total returns after taking into account the withholding tax on dividends by certain foreign countries represented in the Index for periods after 1/31/05 (gross returns used prior to 1/31/05). The Index is unmanaged and its returns do not include any sales charges or fees. Such costs would lower performance. It is not possible to invest directly in an index.
(2) The Morgan Stanley Capital International (MSCI) EAFE Index (Europe, Australasia, Far East) is a free float-adjusted market capitalization index that is designed to measure the international equity market performance of developed markets, excluding the US & Canada. The term "free float" represents the portion of shares outstanding that are deemed to be available for purchase in the public equity markets by investors. The MSCI EAFE Index currently consists of 22 developed market country indices. The performance of the Index is listed in U.S. dollars and assumes reinvestment of net dividends. The Index is unmanaged and its returns do not include any sales charges or fees. Such costs would lower performance. It is not possible to invest directly in an index.
(3) Total returns for the Portfolio reflect fees waived and expenses reimbursed, if applicable, by the Adviser. Without such waivers and reimbursements, total returns would have been lower. The fee waivers and/or expense reimbursements will continue for one year or until such time as the Fund's Board of Directors acts to discontinue all or a portion of such waivers and/or expense reimbursements when it deems that such action is appropriate.
(4) Commenced operations on October 1, 1997.
(5) For comparative purposes, average annual since inception returns listed for the Indexes refer to the inception date or initial offering of the respective share class of the Portfolio, not the inception of the Index.
Portfolio Composition
| Classification | | Percentage of
Total Investments | |
| Diversified | | | 60.6 | % | |
| Retail | | | 17.2 | | |
| Office | | | 12.9 | | |
| Residential | | | 6.6 | | |
| Other* | | | 2.7 | | |
| Total Investments | | | 100.0 | % | |
* Industries representing less than 5% of total investments.
76
2011 Annual Report
December 31, 2011
Portfolio of Investments
International Real Estate Portfolio
| | | Shares | | Value
(000) | |
| Common Stocks (99.8%) | |
| Australia (15.0%) | |
| CFS Retail Property Trust REIT | | | 1,266,914 | | | $ | 2,184 | | |
| Commonwealth Property Office Fund REIT | | | 475,540 | | | | 465 | | |
| Dexus Property Group REIT (Stapled Securities) (a) | | | 1,998,155 | | | | 1,696 | | |
| Goodman Group REIT (Stapled Securities) (a) | | | 3,221,987 | | | | 1,878 | | |
| GPT Group REIT (Stapled Securities) (a) | | | 1,284,804 | | | | 4,034 | | |
| Mirvac Group REIT (Stapled Securities) (a)(b) | | | 1,376,493 | | | | 1,661 | | |
| Stockland REIT (Stapled Securities) (a)(b) | | | 1,053,578 | | | | 3,438 | | |
| Westfield Group REIT (Stapled Securities) (a)(b) | | | 1,412,379 | | | | 11,282 | | |
| Westfield Retail Trust REIT | | | 1,951,743 | | | | 4,971 | | |
| | | | 31,609 | | |
| Austria (0.2%) | |
| Atrium European Real Estate Ltd. | | | 84,777 | | | | 386 | | |
| Conwert Immobilien Invest SE | | | 10,483 | | | | 116 | | |
| | | | 502 | | |
| Belgium (0.1%) | |
| Befimmo SCA Sicafi REIT | | | 3,727 | | | | 243 | | |
| China (7.3%) | |
| China Overseas Land & Investment Ltd. (c) | | | 3,936,240 | | | | 6,579 | | |
| China Resources Land Ltd. (c) | | | 3,907,000 | | | | 6,278 | | |
| Guangzhou R&F Properties Co., Ltd., H Shares (c) | | | 3,192,800 | | | | 2,524 | | |
| | | | 15,381 | | |
| Finland (0.6%) | |
| Citycon Oyj | | | 145,384 | | | | 435 | | |
| Sponda Oyj | | | 207,133 | | | | 836 | | |
| | | | 1,271 | | |
| France (7.6%) | |
| Fonciere Des Regions REIT | | | 17,503 | | | | 1,124 | | |
| Gecina SA REIT | | | 10,903 | | | | 917 | | |
| ICADE REIT | | | 15,956 | | | | 1,255 | | |
| Klepierre REIT | | | 91,589 | | | | 2,613 | | |
| Mercialys SA REIT | | | 11,546 | | | | 372 | | |
| Societe de la Tour Eiffel REIT | | | 5,952 | | | | 296 | | |
Societe Immobiliere de Location pour l'Industrie
et le Commerce REIT | | | 5,777 | | | | 560 | | |
| Unibail-Rodamco SE REIT | | | 49,538 | | | | 8,906 | | |
| | | | 16,043 | | |
| Germany (1.0%) | |
| Alstria Office AG REIT | | | 108,697 | | | | 1,294 | | |
| Deutsche Euroshop AG | | | 9,093 | | | | 292 | | |
| Prime Office AG REIT (d) | | | 100,504 | | | | 565 | | |
| | | | 2,151 | | |
| Hong Kong (27.6%) | |
| Hang Lung Properties Ltd. | | | 1,235,000 | | | | 3,514 | | |
| Henderson Land Development Co., Ltd. | | | 739,882 | | | | 3,677 | | |
| Hongkong Land Holdings Ltd. | | | 2,398,000 | | | | 10,887 | | |
| Hysan Development Co., Ltd. | | | 1,126,432 | | | | 3,698 | | |
| Kerry Properties Ltd. | | | 1,315,271 | | | | 4,352 | | |
| Link REIT (The) | | | 184,000 | | | | 678 | | |
| New World Development , Ltd. | | | 1,373,715 | | | | 1,107 | | |
| Sino Land Co., Ltd. | | | 581,866 | | | | 829 | | |
| Sun Hung Kai Properties Ltd. | | | 1,960,174 | | | | 24,570 | | |
| | | Shares | | Value
(000) | |
| Swire Pacific Ltd. | | | 27,500 | | | $ | 332 | | |
| Wharf Holdings Ltd. | | | 1,008,117 | | | | 4,556 | | |
| | | | 58,200 | | |
| Italy (0.6%) | |
| Beni Stabili SpA | | | 2,566,643 | | | | 1,149 | | |
| Japan (18.1%) | |
| Japan Real Estate Investment Corp. REIT | | | 248 | | | | 1,933 | | |
| Mitsubishi Estate Co., Ltd. | | | 944,000 | | | | 14,104 | | |
| Mitsui Fudosan Co., Ltd. | | | 852,000 | | | | 12,420 | | |
| Nippon Building Fund, Inc. REIT | | | 235 | | | | 1,923 | | |
| NTT Urban Development Corp. | | | 187 | | | | 128 | | |
| Sumitomo Realty & Development Co., Ltd. | | | 435,000 | | | | 7,618 | | |
| | | | 38,126 | | |
| Malta (0.0%) | |
| BGP Holdings PLC (d)(e) | | | 4,769,371 | | | | — | | |
| Netherlands (2.2%) | |
| Corio N.V. REIT | | | 52,286 | | | | 2,274 | | |
| Eurocommercial Properties N.V. CVA REIT | | | 54,564 | | | | 1,732 | | |
| Wereldhave N.V. REIT | | | 10,692 | | | | 710 | | |
| | | | 4,716 | | |
| Norway (0.1%) | |
| Norwegian Property ASA | | | 154,397 | | | | 190 | | |
| Singapore (3.3%) | |
| CapitaCommercial Trust REIT | | | 462,000 | | | | 376 | | |
| CapitaLand Ltd. | | | 2,198,000 | | | | 3,745 | | |
| CapitaMall Trust REIT | | | 143,000 | | | | 187 | | |
| CapitaMalls Asia Ltd. | | | 319,000 | | | | 278 | | |
| City Developments Ltd. | | | 227,000 | | | | 1,557 | | |
| Keppel Land Ltd. | | | 258,247 | | | | 442 | | |
| Suntec REIT | | | 516,000 | | | | 428 | | |
| | | | 7,013 | | |
| Sweden (1.2%) | |
| Atrium Ljungberg AB, Class B | | | 51,400 | | | | 547 | | |
| Castellum AB | | | 15,468 | | | | 192 | | |
| Fabege AB | | | 32,682 | | | | 256 | | |
| Hufvudstaden AB, Class A | | | 151,829 | | | | 1,545 | | |
| | | | 2,540 | | |
| Switzerland (1.8%) | |
| PSP Swiss Property AG (Registered) (d) | | | 36,914 | | | | 3,089 | | |
| Swiss Prime Site AG (Registered) (d) | | | 9,449 | | | | 710 | | |
| | | | 3,799 | | |
| United Kingdom (13.1%) | |
| Big Yellow Group PLC REIT | | | 354,374 | | | | 1,350 | | |
| British Land Co., PLC REIT | | | 482,107 | | | | 3,463 | | |
| Capital & Counties Properties PLC | | | 127,018 | | | | 364 | | |
| Capital & Regional PLC (d) | | | 1,183,866 | | | | 584 | | |
| Capital Shopping Centres Group PLC REIT | | | 287,906 | | | | 1,396 | | |
| Derwent London PLC REIT | | | 47,090 | | | | 1,141 | | |
| Development Securities PLC | | | 100,763 | | | | 235 | | |
| Grainger PLC | | | 535,056 | | | | 889 | | |
| Great Portland Estates PLC REIT | | | 149,269 | | | | 749 | | |
| Hammerson PLC REIT | | | 667,748 | | | | 3,733 | | |
| Land Securities Group PLC REIT | | | 541,273 | | | | 5,342 | | |
The accompanying notes are an integral part of the financial statements.
77
2011 Annual Report
December 31, 2011
Portfolio of Investments (cont'd)
International Real Estate Portfolio
| | | Shares | | Value
(000) | |
| United Kingdom (cont'd) | |
| London & Stamford Property PLC | | | 111,300 | | | $ | 187 | | |
| LXB Retail Properties PLC (d) | | | 980,638 | | | | 1,587 | | |
| Metric Property Investments PLC REIT | | | 413,082 | | | | 545 | | |
| Quintain Estates & Development PLC (d) | | | 1,011,041 | | | | 593 | | |
| Safestore Holdings PLC | | | 799,703 | | | | 1,242 | | |
| Segro PLC REIT | | | 417,400 | | | | 1,351 | | |
| Shaftesbury PLC REIT | | | 52,858 | | | | 383 | | |
| ST Modwen Properties PLC | | | 614,687 | | | | 1,079 | | |
| Unite Group PLC | | | 543,765 | | | | 1,419 | | |
| | | | 27,632 | | |
| Total Common Stocks (Cost $404,077) | | | 210,565 | | |
| Short-Term Investment (0.0%) | |
| Investment Company (0.0%) | |
Morgan Stanley Institutional Liquidity
Funds — Money Market Portfolio —
Institutional Class (See Note G-2) (Cost $83) | | | 82,920 | | | | 83 | | |
| Total Investments (99.8%) (Cost $404,160) | | | 210,648 | | |
| Other Assets in Excess of Liabilities (0.2%) | | | 447 | | |
| Net Assets (100.0%) | | $ | 211,095 | | |
(a) Comprised of securities in separate entities that are traded as a single stapled security.
(b) Consists of one or more classes of securities traded together as a unit; stocks with attached warrants.
(c) Security trades on the Hong Kong exchange.
(d) Non-income producing security.
(e) At December 31, 2011, the Portfolio held a fair valued security valued at $0, representing 0.0% of net assets. This security has been fair valued as determined in good faith under procedures established by and under the general supervision of the Fund's Directors.
CVA Certificaten Van Aandelen.
REIT Real Estate Investment Trust.
Fair Value Measurement Information:
The following is a summary of the inputs used to value the Portfolio's investments as of December 31, 2011. (See Note A-9 to the financial statements for further information regarding fair value measurement.)
| Investment Type | | Level 1
Unadjusted
quoted
prices
(000) | | Level 2
Other
significant
observable
inputs
(000) | | Level 3
Significant
unobservable
inputs
(000) | | Total
(000) | |
| Assets: | | | | | | | | | |
| Common Stocks | | | | | | | | | |
| Diversified | | $ | 127,551 | | | $ | — | | | $ | — | † | | $ | 127,551 | | |
| Industrial | | | 3,229 | | | | — | | | | — | | | | 3,229 | | |
| Office | | | 27,203 | | | | — | | | | — | | | | 27,203 | | |
| Residential | | | 13,862 | | | | — | | | | — | | | | 13,862 | | |
| Retail | | | 36,128 | | | | — | | | | — | | | | 36,128 | | |
| Self Storage | | | 2,592 | | | | — | | | | — | | | | 2,592 | | |
| Total Common Stocks | | | 210,565 | | | | — | | | | — | † | | | 210,565 | | |
| Investment Type | | Level 1
Unadjusted
quoted
prices
(000) | | Level 2
Other
significant
observable
inputs
(000) | | Level 3
Significant
unobservable
inputs
(000) | | Total
(000) | |
Short-Term Investment —
Investment Company | | $ | 83 | | | $ | — | | | $ | — | | | $ | 83 | | |
| Total Assets | | $ | 210,648 | | | $ | — | | | $ | — | † | | $ | 210,648 | | |
Transfers between investment levels may occur as the markets fluctuate and/or the availability of data used in an investment's valuation changes. The Portfolio recognizes transfers between the levels as of the end of the period. As of December 31, 2011, the Portfolio did not have any significant investments transfer between investment levels.
Following is a reconciliation of investments in which significant unobservable inputs (Level 3) were used in determining fair value.
| | | Common
Stocks
(000) | |
| Beginning Balance | | $ | — | † | |
| Purchases | | | — | | |
| Sales | | | — | | |
| Amortization of discount | | | — | | |
| Transfers in | | | — | | |
| Transfers out | | | — | | |
| Change in unrealized appreciation (depreciation) | | | — | | |
| Realized gains (losses) | | | — | | |
| Ending Balance | | $ | — | † | |
Net change in unrealized appreciation/depreciation from
investment still held as of December 31, 2011 | | $ | — | | |
† Includes one or more securities which are valued at zero.
The accompanying notes are an integral part of the financial statements.
78
2011 Annual Report
December 31, 2011
Investment Overview (unaudited)
International Small Cap Portfolio
The International Small Cap Portfolio (the "Portfolio") seeks long-term capital appreciation by investing primarily in equity securities of small non-U.S. companies.
Performance
For the year ended December 31, 2011, the Portfolio had a total return based on net asset value and reinvestment of distributions per share of -18.33%, net of fees, for Class I shares. The Portfolio's Class I shares underperformed against its benchmark, the MSCI EAFE Small Cap Total Return Index (the "Index"), which returned -15.94%.
Factors Affecting Performance
• 2011 was an extraordinary year, punctuated by uprisings in the Middle East and North Africa, a tsunami in Japan and floods in Australia and Thailand. Besides the tragic human cost, these events added to the volatility of the macro data and uncertainty for investors. Most equity markets peaked in April or May and thereafter lost ground, as the focus on the euro zone debt crisis intensified and investors were whipsawed by concerns about European politics, together with increasing uncertainty over the Chinese economy and falling commodity prices. A brief respite in October saw markets rebounding on the back of better economic data in the U.S. and some tentative progress on the European debt crisis. A surprise proposal by the Greek prime minister to call a referendum, however, and political crisis in Italy duly sent the markets back into sharply negative territory. The year ended on a modestly more positive note but, despite some solidly good corporate earnings, 2011 was characterized by political dysfunction and uncertainty.
• For the year as a whole, international small cap equities underperformed their large cap counterparts, with the MSCI EAFE Small Cap Index declining 15.9% compared with a 12.1% fall in the MSCI EAFE Index. Currencies continued to influence returns. The U.S. dollar rose against the euro over the year (+3.4%) whilst concerns about China's economy and commodity prices drove a 5.2% decline in the Australian dollar over the quarter but left it flat for the year. The reverse was true for the Japanese yen, which was flat on the quarter but appreciated 5.1% against the U.S. dollar over the year. In local currency terms, the MSCI EAFE Small Cap Index fell 16.5% compared with a 15.9% decline in U.S. dollars terms.
• The Asia Pacific region closed the year strongly but this did not stop Hong Kong and Australia underperforming for the full year (-26.2% and -17.3%, respectively). In contrast, Japan, the best-performing country over the full year (-3.9%), lagged in the final quarter (-4.8%) as it failed to fully participate in the October rally. Europe saw a huge dispersion of returns in both the fourth quarter and over the year. The Nordic countries led the way in the final quarter (+7.8%), driven by Sweden (+13.0%), but declined 22.7% for the full year, dragged down by Finland (-33.9%) and Norway (-28.0%). The U.K. proved to be one of the more resilient markets for the full year (-12.4%). Of the "core" euro zone markets, all underperformed sharply for the full year, outdone only by the "peripheral" euro zone markets. Greece and Portugal, the main laggards, fell 57.8% and 39.1%, for the year, respectively.
• At a sector level, defensives outperformed (utilities +2.3%, consumer staples -4.0%, and health care -11.0%). Energy and materials fell hardest (-24.9% and -20.2%, respectively), followed by information technology (-19.8%) and financials (-16.9%).
• The Portfolio's performance fluctuated with the market's sharp moves during the year. For the year as a whole, the Portfolio's country and sector positioning worked well — namely its overweight to Japan and underweight to Europe, as well as its defensive sector bias, with an overweight to consumer staples and underweights to materials, energy, and IT. Strong stock selection from energy, materials, and financials, however, was offset by the sharp sell-off in the Portfolio's holding in a U.K. food manufacturer, together with weak stock selection in the industrials, IT and consumer discretionary sectors.
Management Strategies
• We have opportunistically been using the market weakness to gingerly start to build positions in a number of high-quality cyclicals. We believe these stocks are typically discounting recessionary conditions. A number of the new stocks are back at
79
2011 Annual Report
December 31, 2011
Investment Overview (unaudited) (cont'd)
International Small Cap Portfolio
or below the prices that we were last able to purchase them in 2009. A lot is discounted in our view. We are still, on balance, slightly overweight defensives in the Portfolio but this is likely to slowly reverse over coming weeks and months, subject to market conditions and, of course, valuations. To fund these new purchases, we have continued to take profits on some of the Japanese financials and consumer discretionary names that have performed strongly, and on some of our U.K., Italian and Spanish consumer staples and health care names.
• What is priced into international small caps? Simply put, a lot of bad news. Risk aversion is high, as evident by the speed and sharpness of the response to any modicum of positive news. Our investment universe has swelled to unprecedented levels and many high-quality, large-cap names that typically only appear in our screens in extreme conditions are back. They last visited us in the first quarter of 2009. It was right to buy them then. It feels right to buy them now, especially when we believe some of these companies are demonstrably stronger than in 2009.
• It has been disappointing that we have not preserved capital in the Portfolio in 2011. This is at odds with our long-term performance history but does not reflect any change in our value philosophy or process. What was different in 2011 was that stocks did not get expensive before they got cheap and value did not prove a support. This differs from 2000 and 2008. Then our value discipline took us out of the expensive stocks/sectors into the cheapest/least in favor names and these preserved capital. In 2011, we took significant profits from stronger-performing cyclicals during the first quarter but we believed there was still a solid amount of value left in other quality cyclicals. In most instances, these companies went on to deliver or exceed our expectations for profit growth. Market anxiety, however, driven primarily by uncertainty over the European political environment, simply de-rated these stocks. Defensives were starting to nudge into attractive territory in March and April last year and we went modestly overweight. The Portfolio mainly owned attractively valued, high-quality consumer staples and health care companies in Europe, as the Japanese equivalents were expensive. Yet it was the Japanese that helped preserve capital relative to the market and the European 'defensive' sectors barely lived up to their label.
• There is a lot for the market to contend with in the coming months and there will be no quick fixes. With expectations and valuations so low, however, only a modicum of a plan and a sticking plaster of cohesion are required to allow equities to rise. With international small cap valuations at such depressed levels, some 52% below their average price-to-book, we believe any sustained rally will see small caps take the lead. Their strong cyclical bias should see to that. The Portfolio is currently valued at just 0.9 times price-to-book for companies that have historically delivered an average return on equity of 17%. If history is our guide, valuations do not stay here for long. The Chinese Year of the Dragon is considered a year of prosperity. We will do our best to seek that outcome.
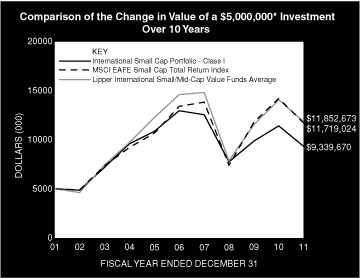
* Minimum Investment
In accordance with SEC regulations, Portfolio's performance shown assumes that all recurring fees (including management fees) were deducted and all dividends and distributions were reinvested. The performance of Class P shares will vary from the Class I shares based upon its different inception date and will be negatively impacted by additional fees assessed to that class.
80
2011 Annual Report
December 31, 2011
Investment Overview (unaudited) (cont'd)
International Small Cap Portfolio
Performance Compared to the Morgan Stanley Capital International (MSCI) EAFE Small Cap Total Return Index(1) and the Lipper International Small/Mid-Cap Value Funds Average(2)
| | | Period Ended December 31, 2011 | |
| | | Total Returns(3) | |
| | | | | Average Annual | |
| | | One
Year | | Five
Years | | Ten
Years | | Since
Inception(6) | |
Portfolio — Class I Shares
w/o sales charges(4) | | | –18.33 | % | | | –6.39 | % | | | 6.45 | % | | | 8.29 | % | |
MSCI EAFE Small Cap Total
Return Index | | | –15.94 | | | | –4.14 | | | | 9.01 | | | | 4.93 | | |
Lipper International Small/Mid-Cap
Value Funds Average | | | –17.73 | | | | –3.11 | | | | 8.43 | | | | 7.95 | | |
Portfolio — Class P Shares
w/o sales charges(5) | | | –18.56 | | | | — | | | | — | | | | 6.25 | | |
MSCI EAFE Small Cap Total
Return Index | | | –15.94 | | | | — | | | | — | | | | 12.11 | | |
Lipper International Small/Mid-Cap
Value Funds Average | | | –17.73 | | | | — | | | | — | | | | 15.48 | | |
Performance data quoted represents past performance, which is no guarantee of future results, and current performance may be lower or higher than the figures shown. Performance assumes that all dividends and distributions, if any, were reinvested. For the most recent month-end performance figures, please visit www.morganstanley.com/im. Investment return and principal value will fluctuate so that Portfolio shares, when redeemed, may be worth more or less than their original cost. Total returns do not reflect the deduction of taxes that a shareholder would pay on Portfolio distributions or the redemption of Portfolio shares. Performance of share classes will vary due to difference in expenses.
(1) The Morgan Stanley Capital International (MSCI) EAFE Small Cap Total Return Index is an unmanaged, market value weighted average of the performance of over 900 securities of companies listed on the stock exchanges of countries in Europe, Australasia and the Far East, including price performance and income from dividend payments. The MSCI EAFE Small Cap Total Return Index commenced as of January 31, 2002. Returns, including periods prior to January 31, 2002, are calculated using the return data of the MSCI EAFE Small Cap Index through January 30, 2002 and the return data of the MSCI EAFE Small Cap Total Return Index since January 31, 2002. The Index is unmanaged and its returns do not include any sales charges or fees. Such costs would lower performance. It is not possible to invest directly in an index.
(2) The Lipper International Small/Mid-Cap Value Funds Average tracks the performance of all funds in the Lipper International Small/Mid-Cap Value Funds classification. The Average, which is adjusted for capital gains distributions and income dividends, is unmanaged and should not be considered an investment. As of the date of this report, the Portfolio was in the Lipper International Small/Mid-Cap Value Funds classification.
(3) Total returns for the Portfolio reflect fees waived and expenses reimbursed, if applicable, by the Adviser. Without such waivers and reimbursements, total returns would have been lower. The fee waivers and/or expense reimbursements will continue for one year or until such time as the Fund's Board of Directors acts to discontinue all or a portion of such waivers and/or expense reimbursements when it deems that such action is appropriate.
(4) Commenced operations on December 15, 1992.
(5) Commenced offering on October 21, 2008.
(6) For comparative purposes, average annual since inception returns listed for the Indexes refer to the inception date or initial offering of the respective share class of the Portfolio, not the inception of the Index.
Portfolio Composition
| Classification | | Percentage of
Total Investments | |
| Other* | | | 74.1 | % | |
| Machinery | | | 11.1 | | |
| Commercial Banks | | | 7.8 | | |
| Media | | | 7.0 | | |
| Total Investments | | | 100.0 | %** | |
* Industries representing less than 5% of total investments.
** Does not include open foreign currency exchange contracts with net unrealized depreciation of approximately $38,000.
81
2011 Annual Report
December 31, 2011
Portfolio of Investments
International Small Cap Portfolio
| | | Shares | | Value
(000) | |
| Common Stocks (97.8%) | |
| Australia (5.2%) | |
| Alesco Corp. Ltd. | | | 918,224 | | | $ | 1,085 | | |
| Boart Longyear Ltd. | | | 942,066 | | | | 2,679 | | |
| Dart Energy Ltd. (a) | | | 848,074 | | | | 312 | | |
| Infomedia Ltd. | | | 5,151,856 | | | | 1,133 | | |
| Myer Holdings Ltd. | | | 1,435,161 | | | | 2,840 | | |
| Navitas Ltd. | | | 600,347 | | | | 2,149 | | |
| SAI Global Ltd. | | | 668,321 | | | | 3,076 | | |
| WHK Group Ltd. | | | 2,698,597 | | | | 2,277 | | |
| | | | 15,551 | | |
| Austria (1.2%) | |
| Atrium European Real Estate Ltd. | | | 788,077 | | | | 3,584 | | |
| China (1.2%) | |
| EVA Precision Industrial Holdings Ltd. (b) | | | 15,342,000 | | | | 3,714 | | |
| Denmark (4.1%) | |
| ALK-Abello A/S | | | 30,352 | | | | 1,696 | | |
| Jyske Bank A/S (Registered) (a) | | | 98,179 | | | | 2,410 | | |
| Royal Unibrew A/S | | | 31,990 | | | | 1,791 | | |
| SimCorp A/S | | | 15,105 | | | | 2,307 | | |
| Sydbank A/S | | | 249,485 | | | | 3,914 | | |
| | | | 12,118 | | |
| Finland (2.3%) | |
| Konecranes Oyj | | | 144,621 | | | | 2,721 | | |
| Ramirent Oyj | | | 106,505 | | | | 758 | | |
| Rautaruukki Oyj | | | 270,464 | | | | 2,491 | | |
| Stora Enso Oyj, Class R | | | 125,228 | | | | 750 | | |
| | | | 6,720 | | |
| France (3.7%) | |
| Alten Ltd. | | | 55,745 | | | | 1,312 | | |
| Euler Hermes SA | | | 74,210 | | | | 4,394 | | |
| Eurofins Scientific | | | 53,736 | | | | 3,918 | | |
| Sa des Ciments Vicat | | | 21,328 | | | | 1,220 | | |
| | | | 10,844 | | |
| Germany (4.7%) | |
| Draegerwerk AG & Co. KGaA (Preference) | | | 43,612 | | | | 3,539 | | |
| GEA Group AG | | | 68,755 | | | | 1,944 | | |
| Gerresheimer AG | | | 47,169 | | | | 1,966 | | |
| Kontron AG | | | 400,752 | | | | 2,626 | | |
| Rheinmetall AG | | | 86,324 | | | | 3,825 | | |
| | | | 13,900 | | |
| Hong Kong (5.3%) | |
| AMVIG Holdings Ltd. | | | 6,255,000 | | | | 3,318 | | |
| China High Precision Automation Group Ltd. | | | 7,461,000 | | | | 2,580 | | |
| Pacific Basin Shipping Ltd. | | | 7,050,000 | | | | 2,823 | | |
| Real Nutriceutical Group Ltd. | | | 5,333,000 | | | | 1,744 | | |
| Techtronic Industries Co. | | | 2,612,000 | | | | 2,687 | | |
| Xinyi Glass Holdings Ltd. | | | 4,228,000 | | | | 2,428 | | |
| | | | 15,580 | | |
| | | Shares | | Value
(000) | |
| Ireland (2.9%) | |
| FBD Holdings PLC | | | 206,940 | | | $ | 1,741 | | |
| Kerry Group PLC, Class A | | | 140,411 | | | | 5,140 | | |
| United Drug PLC | | | 629,634 | | | | 1,671 | | |
| | | | 8,552 | | |
| Italy (3.2%) | |
| Azimut Holding SpA | | | 300,791 | | | | 2,412 | | |
| Brembo SpA | | | 221,207 | | | | 1,895 | | |
| Prysmian SpA | | | 259,398 | | | | 3,221 | | |
| Recordati SpA | | | 253,772 | | | | 1,835 | | |
| | | | 9,363 | | |
| Japan (32.9%) | |
| Asahi Diamond Industrial Co., Ltd. | | | 263,800 | | | | 3,187 | | |
| Daibiru Corp. | | | 768,900 | | | | 4,835 | | |
| Disco Corp. | | | 42,700 | | | | 2,227 | | |
| Fuji Machine Manufacturing Co., Ltd. | | | 256,000 | | | | 4,570 | | |
| Fuji Media Holdings, Inc. | | | 3,088 | | | | 4,682 | | |
| Fuyo General Lease Co., Ltd. | | | 130,200 | | | | 4,476 | | |
| Jaccs Co., Ltd. | | | 1,455,000 | | | | 4,348 | | |
| Japan Securities Finance Co., Ltd. | | | 709,592 | | | | 3,208 | | |
| K's Holdings Corp. | | | 185,900 | | | | 7,366 | | |
| Maeda Corp. | | | 219,000 | | | | 802 | | |
| Miraial Co., Ltd. | | | 165,300 | | | | 2,208 | | |
| Mitsui Mining & Smelting Co., Ltd. | | | 889,000 | | | | 2,298 | | |
| Mitsui OSK Lines Ltd. | | | 671,000 | | | | 2,598 | | |
| Ohara, Inc. | | | 322,600 | | | | 3,328 | | |
| Sawada Holdings Co., Ltd. (a) | | | 424,100 | | | | 3,774 | | |
| Sumitomo Mitsui Trust Holdings, Inc. | | | 1,285,000 | | | | 3,773 | | |
| THK Co., Ltd. | | | 115,400 | | | | 2,274 | | |
| TOC Co., Ltd. | | | 911,500 | | | | 4,145 | | |
| Toei Animation Co., Ltd. | | | 207,800 | | | | 4,698 | | |
| Tokyo Tomin Bank Ltd. (The) | | | 583,881 | | | | 7,108 | | |
| Toyota Industries Corp. | | | 130,100 | | | | 3,541 | | |
| Tsutsumi Jewelry Co., Ltd. | | | 124,400 | | | | 2,942 | | |
| TV Asahi Corp. | | | 2,574 | | | | 4,244 | | |
| Yachiyo Bank Ltd. (The) | | | 256,100 | | | | 6,082 | | |
| Yamaha Motor Co., Ltd. | | | 362,300 | | | | 4,585 | | |
| | | | 97,299 | | |
| Netherlands (1.7%) | |
| Nutreco N.V. | | | 78,711 | | | | 5,179 | | |
| New Zealand (0.8%) | |
| Fisher & Paykel Healthcare Corp., Ltd. | | | 1,244,700 | | | | 2,441 | | |
| Norway (3.6%) | |
| Pronova BioPharma A/S (a) | | | 1,276,722 | | | | 1,673 | | |
| Schibsted ASA | | | 30,488 | | | | 759 | | |
| Storebrand ASA | | | 924,791 | | | | 4,809 | | |
| TGS Nopec Geophysical Co. ASA | | | 156,887 | | | | 3,476 | | |
| | | | 10,717 | | |
| Spain (1.9%) | |
| Antena 3 de Television SA | | | 364,751 | | | | 2,195 | | |
| Grifols SA (a) | | | 132,678 | | | | 2,232 | | |
The accompanying notes are an integral part of the financial statements.
82
2011 Annual Report
December 31, 2011
Portfolio of Investments (cont'd)
International Small Cap Portfolio
| | | Shares | | Value
(000) | |
| Spain (cont'd) | |
| Grifols SA, Class B (a) | | | 13,121 | | | $ | 143 | | |
| Miquel y Costas & Miquel SA | | | 43,696 | | | | 1,046 | | |
| | | | 5,616 | | |
| Sweden (1.2%) | |
| Clas Ohlson AB, Class B | | | 159,545 | | | | 1,866 | | |
| Trelleborg AB, Class B | | | 189,435 | | | | 1,645 | | |
| | | | 3,511 | | |
| Switzerland (4.0%) | |
| Bucher Industries AG (Registered) | | | 22,732 | | | | 3,974 | | |
| Kuoni Reisen Holding AG (Registered) (a) | | | 18,844 | | | | 4,514 | | |
| Rieter Holding AG (Registered) (a) | | | 22,414 | | | | 3,367 | | |
| | | | 11,855 | | |
| Thailand (2.0%) | |
| Miclyn Express Offshore Ltd. | | | 2,942,411 | | | | 5,959 | | |
| United Kingdom (15.0%) | |
| Aegis Group PLC | | | 675,588 | | | | 1,515 | | |
| Bodycote PLC | | | 717,276 | | | | 2,927 | | |
| Britvic PLC | | | 1,008,099 | | | | 5,036 | | |
| Bunzl PLC | | | 247,012 | | | | 3,391 | | |
| Chemring Group PLC | | | 384,108 | | | | 2,385 | | |
| Cookson Group PLC | | | 532,638 | | | | 4,210 | | |
| CVS Group PLC | | | 1,021,311 | | | | 1,634 | | |
| Dairy Crest Group PLC | | | 414,890 | | | | 2,165 | | |
| Hammerson PLC REIT | | | 251,597 | | | | 1,407 | | |
| Hiscox Ltd. | | | 276,392 | | | | 1,603 | | |
| Invensys PLC | | | 869,097 | | | | 2,848 | | |
| Keller Group PLC | | | 280,471 | | | | 1,161 | | |
| Premier Foods PLC (a) | | | 11,684,930 | | | | 1,054 | | |
| Premier Oil PLC (a) | | | 277,617 | | | | 1,565 | | |
| Rexam PLC | | | 451,862 | | | | 2,476 | | |
| SIG PLC | | | 2,338,415 | | | | 3,051 | | |
| Smurfit Kappa Group PLC (a) | | | 793,384 | | | | 4,798 | | |
| Wincanton PLC (a) | | | 1,221,861 | | | | 1,186 | | |
| | | | 44,412 | | |
| United States (0.9%) | |
| Informa PLC | | | 484,767 | | | | 2,720 | | |
| Total Common Stocks (Cost $359,137) | | | 289,635 | | |
| Short-Term Investment (3.1%) | |
| Investment Company (3.1%) | |
Morgan Stanley Institutional Liquidity
Funds — Money Market Portfolio —
Institutional Class (See Note G-2) (Cost $9,221) | | | 9,220,550 | | | | 9,221 | | |
| Total Investments (100.9%) (Cost $368,358) (c) | | | 298,856 | | |
| Liabilities in Excess of Other Assets (-0.9%) | | | (2,703 | ) | |
| Net Assets (100.0%) | | $ | 296,153 | | |
(a) Non-income producing security.
(b) Security trades on the Hong Kong exchange.
(c) Securities are available for collateral in connection with open foreign currency exchange contracts.
REIT Real Estate Investment Trust.
Foreign Currency Exchange Contracts Information:
The Portfolio had the following foreign currency exchange contracts open at period end:
| Counterparty | | Currency
to
Deliver
(000) | |
Value
(000) | |
Settlement
Date | | In
Exchange
For
(000) | |
Value
(000) | | Unrealized
Appreciation
(Depreciation)
(000) | |
| State Street Bank London | |
| | | JPY | 440,000 | | | $ | 5,716 | | | 1/4/12 | | USD | 5,685 | | | $ | 5,685 | | | $ | (31 | ) | |
| State Street Bank London | |
| | | JPY | 66,000 | | | | 858 | | | 2/3/12 | | USD | 851 | | | | 851 | | | | (7 | ) | |
| | | | | $ | 6,574 | | | | | | | | | | | $ | 6,536 | | | $ | (38 | ) | |
JPY — Japanese Yen
USD — United States Dollar
Fair Value Measurement Information:
The following is a summary of the inputs used to value the Portfolio's investments as of December 31, 2011. (See Note A-9 to the financial statements for further information regarding fair value measurement.)
| Investment Type | | Level 1
Unadjusted
quoted
prices
(000) | | Level 2
Other
significant
observable
inputs
(000) | | Level 3
Significant
unobservable
inputs
(000) | | Total
(000) | |
| Assets: | | | | | | | | | |
| Common Stocks | | | | | | | | | |
| Aerospace & Defense | | $ | 2,385 | | | $ | — | | | $ | — | | | $ | 2,385 | | |
| Air Freight & Logistics | | | 1,186 | | | | — | | | | — | | | | 1,186 | | |
| Auto Components | | | 7,864 | | | | — | | | | — | | | | 7,864 | | |
| Automobiles | | | 4,585 | | | | — | | | | — | | | | 4,585 | | |
| Beverages | | | 6,827 | | | | — | | | | — | | | | 6,827 | | |
| Biotechnology | | | 2,375 | | | | — | | | | — | | | | 2,375 | | |
| Capital Markets | | | 6,186 | | | | — | | | | — | | | | 6,186 | | |
| Chemicals | | | 3,328 | | | | — | | | | — | | | | 3,328 | | |
| Commercial Banks | | | 23,287 | | | | — | | | | — | | | | 23,287 | | |
Commercial Services &
Supplies | | | 2,277 | | | | — | | | | — | | | | 2,277 | | |
Construction &
Engineering | | | 4,642 | | | | — | | | | — | | | | 4,642 | | |
| Construction Materials | | | 1,220 | | | | — | | | | — | | | | 1,220 | | |
| Consumer Finance | | | 4,348 | | | | — | | | | — | | | | 4,348 | | |
| Containers & Packaging | | | 10,592 | | | | — | | | | — | | | | 10,592 | | |
Diversified Consumer
Services | | | 2,149 | | | | — | | | | — | | | | 2,149 | | |
Diversified Financial
Services | | | 7,684 | | | | — | | | | — | | | | 7,684 | | |
| Electrical Equipment | | | 3,221 | | | | — | | | | — | | | | 3,221 | | |
The accompanying notes are an integral part of the financial statements.
83
2011 Annual Report
December 31, 2011
Portfolio of Investments (cont'd)
International Small Cap Portfolio
Fair Value Measurement Information: (cont'd)
| Investment Type | | Level 1
Unadjusted
quoted
prices
(000) | | Level 2
Other
significant
observable
inputs
(000) | | Level 3
Significant
unobservable
inputs
(000) | | Total
(000) | |
| Common Stocks (cont'd) | | | | | | | | | |
Electronic Equipment,
Instruments &
Components | | $ | — | | | $ | 2,580 | | | $ | — | | | $ | 2,580 | | |
Energy Equipment &
Services | | | 9,435 | | | | — | | | | — | | | | 9,435 | | |
| Food Products | | | 13,538 | | | | — | | | | — | | | | 13,538 | | |
Health Care
Equipment &
Supplies | | | 5,980 | | | | — | | | | — | | | | 5,980 | | |
Health Care
Providers &
Services | | | 3,305 | | | | — | | | | — | | | | 3,305 | | |
Hotels, Restaurants &
Leisure | | | 4,514 | | | | — | | | | — | | | | 4,514 | | |
| Household Durables | | | 2,687 | | | | — | | | | — | | | | 2,687 | | |
Industrial
Conglomerates | | | 8,035 | | | | — | | | | — | | | | 8,035 | | |
Information Technology
Services | | | 1,312 | | | | — | | | | — | | | | 1,312 | | |
| Insurance | | | 12,547 | | | | — | | | | — | | | | 12,547 | | |
Life Sciences Tools &
Services | | | 5,884 | | | | — | | | | — | | | | 5,884 | | |
| Machinery | | | 33,171 | | | | — | | | | — | | | | 33,171 | | |
| Marine | | | 5,421 | | | | — | | | | — | | | | 5,421 | | |
| Media | | | 20,813 | | | | — | | | | — | | | | 20,813 | | |
| Metals & Mining | | | 4,789 | | | | — | | | | — | | | | 4,789 | | |
| Multiline Retail | | | 2,840 | | | | — | | | | — | | | | 2,840 | | |
Oil, Gas & Consumable
Fuels | | | 1,877 | | | | — | | | | — | | | | 1,877 | | |
Paper & Forest
Products | | | 1,796 | | | | — | | | | — | | | | 1,796 | | |
| Personal Products | | | 1,744 | | | | — | | | | — | | | | 1,744 | | |
| Pharmaceuticals | | | 5,204 | | | | — | | | | — | | | | 5,204 | | |
| Professional Services | | | 3,076 | | | | — | | | | — | | | | 3,076 | | |
Real Estate
Investment Trusts
(REITs) | | | 1,407 | | | | — | | | | — | | | | 1,407 | | |
Real Estate
Management &
Development | | | 12,564 | | | | — | | | | — | | | | 12,564 | | |
Semiconductors &
Semiconductor
Equipment | | | 7,061 | | | | — | | | | — | | | | 7,061 | | |
| Software | | | 3,440 | | | | — | | | | — | | | | 3,440 | | |
| Specialty Retail | | | 12,174 | | | | — | | | | — | | | | 12,174 | | |
Trading Companies &
Distributors | | | 8,285 | | | | — | | | | — | | | | 8,285 | | |
| Total Common Stocks | | | 287,055 | | | | 2,580 | | | | — | | | | 289,635 | | |
| Investment Type | | Level 1
Unadjusted
quoted
prices
(000) | | Level 2
Other
significant
observable
inputs
(000) | | Level 3
Significant
unobservable
inputs
(000) | | Total
(000) | |
Short-Term
Investment —
Investment
Company | | $ | 9,221 | | | $ | — | | | $ | — | | | $ | 9,221 | | |
| Total Assets | | | 296,276 | | | | 2,580 | | | | — | | | | 298,856 | | |
| Liabilities: | |
Foreign Currency
Exchange Contracts | | | — | | | | (38 | ) | | | — | | | | (38 | ) | |
| Total | | $ | 296,276 | | | $ | 2,542 | | | $ | — | | | $ | 298,818 | | |
Transfers between investment levels may occur as the markets fluctuate and/or the availability of data used in an investment's valuation changes. The Portfolio recognizes transfers between the levels as of the end of the period. As of December 31, 2011, a security with a total value of approximately $2,580,000 transferred from Level 1 to Level 2. This security was valued using other significant observable inputs at December 31, 2011 and was valued using an unadjusted quoted price at December 31, 2010.
Following is a reconciliation of investments in which significant unobservable inputs (Level 3) were used in determining fair value.
| | | Common
Stocks
(000) | |
| Beginning Balance | | $ | — | † | |
| Purchases | | | — | | |
| Sales | | | (12 | ) | |
| Amortization of discount | | | — | | |
| Transfers in | | | — | | |
| Transfers out | | | — | | |
| Change in unrealized appreciation (depreciation) | | | — | | |
| Realized gains (losses) | | | 12 | | |
| Ending Balance | | $ | — | | |
Net change in unrealized appreciation/depreciation
from investments still held as of December 31, 2011 | | $ | — | | |
† Includes one or more securities which are valued at zero.
The accompanying notes are an integral part of the financial statements.
84
2011 Annual Report
December 31, 2011
Investment Overview (unaudited)
Select Global Infrastructure Portfolio
The Select Global Infrastructure Portfolio (the "Portfolio") seeks to provide both capital appreciation and income by investing primarily in equity securities issued by companies located throughout the world that are engaged in the infrastructure business.
Performance
For the year ended December 31, 2011, the Portfolio had a total return based on net asset value and reinvestment of distributions per share of 15.95%, net of fees, for Class I shares. The Portfolio's Class I shares outperformed against its benchmark, the Dow Jones Brookfield Global Infrastructure IndexSM (the "Index"), which returned 13.75%, and outperformed the S&P Global BMI Index, which returned -7.72%.
Factors Affecting Performance
• Infrastructure shares appreciated 13.75% during the period, as measured by the Index. Among the major infrastructure sectors, the gas midstream, pipeline companies, and transmission and distribution sectors exhibited relative outperformance, while the toll road, European regulated utilities, and communications sectors underperformed the Index. Gas distribution utilities performed in line with the Index for the year. Among the smaller sectors, the water sector exhibited modest relative underperformance, and the ports and airport sectors exhibited meaningful relative underperformance.
• For full-year 2011, the Portfolio realized favorable performance from both bottom-up stock selection and top-down allocation, with bottom-up stock selection being the more significant driver of outperformance. From a bottom-up perspective, stock selection was particularly favorable in the toll roads, European regulated utilities and gas distribution utilities sectors, and indeed stock selection in all sectors was favorable or neutral aside from slight underperformance in the communications sector. From a top-down perspective, our positioning was favorable in all sectors except for underweights to the gas midstream and transmission and distribution sectors.
• Concerning the broader equity markets, 2011 was characterized by significant equity market (and credit market outside North America) volatility brought on by investor uncertainty over the health of credit/lending markets, national banking systems, and government fiscal balance sheets across the globe, and the potential for credit market and balance sheet weakness to put significant pressure on various national economies. While no region was spared entirely, the U.S. equity markets outperformed their regional counterparts, with meaningful declines in European and the Asia Pacific stock markets.
• Despite broader macroeconomic uncertainty, operating trends within infrastructure remained quite resilient in 2011 and were the primary cause for infrastructure stock outperformance relative to the broader global equity markets, as measured by the MSCI World Index. Favorable operating fundamentals spanned most infrastructure sectors in 2011 but were most readily apparent in the energy infrastructure category in North America, where the buildout of new long-haul pipelines for crude oil transportation and gathering and processing networks associated with natural gas and natural gas liquids (NGLs) continues to be robust. Backlog for projects associated with this area of infrastructure extends out for the next several years, and the medium- to longer-term attractiveness of this sector was underscored by a number of merger and acquisition (M&A) transactions that occurred within the sector in 2011. Another area of robust growth in 2011 was communications, where wireless phone providers struggled to keep up with the ever-increasing demand brought on by incremental smartphone usage. While this increased demand did not translate into stock outperformance for our wireless tower companies in the past year, this incremental demand has only reinforced what is already a multi-year backlog of equipment enhancements and new tower builds needed to meet wireless carrier needs. It is worth pointing out that despite significant share price underperformance in 2011 of companies in the ports and airport infrastructure sectors, operating trends even for these companies were favorable, with most companies reporting year over year volume growth and price/tariff increases.
Management Strategies
• We remain committed to our core investment philosophy as an infrastructure value investor. As value-oriented, bottom-up driven investors, our investment perspective is that over the medium and
85
2011 Annual Report
December 31, 2011
Investment Overview (unaudited) (cont'd)
Select Global Infrastructure Portfolio
long-term, the key factor in determining the performance of infrastructure securities will be underlying infrastructure asset values. Given the large and growing private infrastructure market, we believe that there are limits as to the level of premium or discount at which the public sector should trade relative to its underlying private infrastructure value. These limits can be viewed as the point at which the arbitrage opportunity between owning infrastructure in the private versus public markets becomes compelling. In aiming to achieve core infrastructure exposure in a cost effective manner, we invest in equity securities of publicly listed infrastructure companies we believe offer the best value relative to their underlying infrastructure value and Net Asset Value growth prospects. Our research currently leads us to an overweighting in the Portfolio (amongst the largest sectors) to a group of companies in the communications, gas distribution, toll roads, and pipeline companies sectors, and an underweighting to companies in the transmission and distribution, gas midstream, and European regulated utilities sectors.
• Looking toward 2012, we are most positive regarding our positions in Asia in the utility (particularly gas distribution) and toll road sectors, which we believe have the most favorable risk-return characteristics in our investment universe and possess a compelling combination of meaningful discounts to intrinsic value and strong growth outlooks. We believe operating results for companies in these two sectors should remain favorable despite the potential for a more moderate growth trajectory in China. We are also favorable on companies within the communications sector, which while trading at more modest discounts than our overweight positions in Asia, in our view, continue to possess very resilient secular fundamental trends and may produce sustainable cash flow growth that is not currently fully reflected in share prices. For energy infrastructure, while we believe fundamental trends will remain strong in the coming year, we are more cautious on valuations, in particular in the midstream sector, where we believe near-term valuation levels are stretched relative to historical levels. Due to these stretched near-term valuation levels and operating fundamentals that are more sensitive to volume and end-product pricing relative to the pipeline sector, our preference is to favor pipelines. For electricity transmission and distribution and gas distribution utilities in North America, we find current valuations less favorable, but acknowledge the appeal of these companies among certain investors looking for safety in an uncertain macroeconomic environment. Finally, we expect to remain selective in the European regulated utility sector due to ongoing regulatory risk, in particular for those utilities in continental Europe.
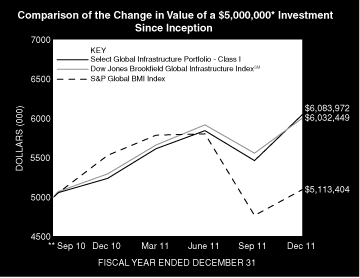
* Minimum Investment
** Commenced Operations on September 20, 2010.
In accordance with SEC regulations, Portfolio's performance shown assumes that all recurring fees (including management fees) were deducted and all dividends and distributions were reinvested. The performance of Class P, Class H, and Class L shares will vary from the Class I shares based upon it will be negatively impacted by additional fees assessed to these classes.
Performance Compared to the Dow Jones Brookfield Global Infrastructure IndexSM(1) and the S&P Global BMI Index(2)
| | | Period Ended December 31, 2011 | |
| | | Total Returns(3) | |
| | | | | Average Annual | |
| | | One
Year | | Five
Years | | Ten
Years | | Since
Inception(5) | |
Portfolio — Class I Shares
w/o sales charges(4) | | | 15.95 | % | | | — | | | | — | | | | 16.57 | % | |
Dow Jones Brookfield Global
Infrastructure IndexSM | | | 13.75 | | | | — | | | | — | | | | 15.80 | | |
| S&P Global BMI Index | | | –7.72 | | | | — | | | | — | | | | 1.77 | | |
86
2011 Annual Report
December 31, 2011
Investment Overview (unaudited) (cont'd)
Select Global Infrastructure Portfolio
| | | Period Ended December 31, 2011 | |
| | | Total Returns(3) | |
| | | | | Average Annual | |
| | | One
Year | | Five
Years | | Ten
Years | | Since
Inception(5) | |
Portfolio — Class H Shares
w/o sales charges(4) | | | 15.67 | % | | | — | | | | — | | | | 16.29 | % | |
Portfolio — Class H Shares
with maximum 4.75%
sales charges(4) | | | 10.17 | | | | — | | | | — | | | | 11.94 | | |
Dow Jones Brookfield Global
Infrastructure IndexSM | | | 13.75 | | | | — | | | | — | | | | 15.80 | | |
| S&P Global BMI Index | | | –7.72 | | | | — | | | | — | | | | 1.77 | | |
Portfolio — Class L Shares
w/o sales charges(4) | | | 15.12 | | | | — | | | | — | | | | 15.73 | | |
Dow Jones Brookfield Global
Infrastructure IndexSM | | | 13.75 | | | | — | | | | — | | | | 15.80 | | |
| S&P Global BMI Index | | | –7.72 | | | | — | | | | — | | | | 1.77 | | |
Portfolio — Class P Shares
w/o sales charges(4) | | | 15.67 | | | | — | | | | — | | | | 16.29 | | |
Dow Jones Brookfield
Global Infrastructure IndexSM | | | 13.75 | | | | — | | | | — | | | | 15.80 | | |
| S&P Global BMI Index | | | –7.72 | | | | — | | | | — | | | | 1.77 | | |
Performance data quoted represents past performance, which is no guarantee of future results, and current performance may be lower or higher than the figures shown. Performance assumes that all dividends and distributions, if any, were reinvested. For the most recent month-end performance figures, please visit www.morganstanley.com/im. Investment return and principal value will fluctuate so that Portfolio shares, when redeemed, may be worth more or less than their original cost. Total returns do not reflect the deduction of taxes that a shareholder would pay on Portfolio distributions or the redemption of Portfolio shares. Performance of share classes will vary due to difference in sales charges and expenses.
(1) The Dow Jones Brookfield Global Infrastructure IndexSM is a float-adjusted market capitalization weighted index that measures the stock performance of companies that exhibit strong infrastructure characteristics. The Index intends to measure all sectors of the infrastructure market. The Index is unmanaged and its returns do not include any sales charges or fees. Such costs would lower performance. It is not possible to invest directly in an index.
(2) The Standard & Poor's Global BMI Index (S&P Global BMI Index) is a broad market index designed to capture exposure to equities in all countries in the world that meet minimum size and liquidity requirements. As of the date of this Report, there are approximately 11,000 index members representing 26 developed and 20 emerging market countries. The Index is unmanaged and its returns do not include any sales charges or fees. Such costs would lower performance. It is not possible to invest directly in an index.
(3) Total returns for the Portfolio reflect fees waived and expenses reimbursed, if applicable, by the Adviser. Without such waivers and reimbursements, total returns would have been lower. The fee waivers and/or expense reimbursements will continue for one year or until such time as the Fund's Board of Directors acts to discontinue all or a portion of such waivers and/or expense reimbursements when it deems that such action is appropriate.
(4) Commenced operations on September 20, 2010.
(5) For comparative purposes, average annual since inception returns listed for the Indexes refer to the inception date or initial offering of the respective share class of the Portfolio, not the inception of the Index.
Portfolio Composition
| Classification | | Percentage of
Total Investments | |
| Oil & Gas Storage & Transportation | | | 49.0 | % | |
| Transmission & Distribution | | | 16.1 | | |
| Communications | | | 14.7 | | |
| Other* | | | 13.6 | | |
| Toll Roads | | | 6.6 | | |
| Total Investments | | | 100.0 | % | |
* Industries representing less than 5% of total investments.
87
2011 Annual Report
December 31, 2011
Portfolio of Investments
Select Global Infrastructure Portfolio
| | | Shares | | Value
(000) | |
| Common Stocks (96.6%) | |
| Australia (4.6%) | |
| APA Group (Stapled Securities) (a)(b) | | | 17,400 | | | $ | 80 | | |
Australian Infrastructure Fund
(Stapled Securities) (a)(b) | | | 6,500 | | | | 13 | | |
| DUET Group (Stapled Securities) (a)(b) | | | 38,860 | | | | 70 | | |
Macquarie Atlas Roads Group
(Stapled Securities) (a)(c) | | | 13,400 | | | | 18 | | |
| Spark Infrastructure Group | | | 44,914 | | | | 63 | | |
| Sydney Airport (Stapled Securities) (a) | | | 50,700 | | | | 138 | | |
| Transurban Group (Stapled Securities) (a) | | | 37,200 | | | | 214 | | |
| | | | 596 | | |
| Brazil (0.7%) | |
Cia de Saneamento Basico do
Estado de Sao Paulo ADR (c) | | | 1,600 | | | | 89 | | |
| Canada (13.5%) | |
| Enbridge, Inc. | | | 19,569 | | | | 731 | | |
| TransCanada Corp. | | | 23,100 | | | | 1,010 | | |
| | | | 1,741 | | |
| China (13.5%) | |
| Beijing Enterprises Holdings Ltd. (d) | | | 126,000 | | | | 756 | | |
| China Gas Holdings Ltd. (d) | | | 1,030,000 | | | | 474 | | |
| China Merchants Holdings International Co., Ltd. (d) | | | 28,601 | | | | 83 | | |
| ENN Energy Holdings Ltd. (d) | | | 44,000 | | | | 141 | | |
| Jiangsu Expressway Co., Ltd. H Shares (d) | | | 188,000 | | | | 173 | | |
| Sichuan Expressway Co. Ltd. H Shares (d) | | | 281,000 | | | | 113 | | |
| | | | 1,740 | | |
| France (3.5%) | |
| Eutelsat Communications SA | | | 735 | | | | 29 | | |
| SES SA | | | 17,815 | | | | 427 | | |
| | | | 456 | | |
| Hong Kong (2.4%) | |
| Hong Kong & China Gas Co., Ltd. | | | 133,100 | | | | 309 | | |
| Italy (3.8%) | |
| Atlantia SpA | | | 4,888 | | | | 78 | | |
| Snam Rete Gas SpA | | | 50,099 | | | | 221 | | |
| Societa Iniziative Autostradali e Servizi SpA | | | 25,890 | | | | 195 | | |
| | | | 494 | | |
| Japan (0.4%) | |
| Tokyo Gas Co., Ltd. | | | 12,000 | | | | 55 | | |
| Netherlands (1.1%) | |
| Koninklijke Vopak N.V. | | | 2,595 | | | | 137 | | |
| Spain (3.5%) | |
| Abertis Infraestructuras SA | | | 11,022 | | | | 176 | | |
| Enagas SA | | | 4,647 | | | | 86 | | |
| Ferrovial SA | | | 9,160 | | | | 111 | | |
| Red Electrica Corp. SA | | | 1,726 | | | | 74 | | |
| | | | 447 | | |
| Switzerland (0.4%) | |
| Flughafen Zuerich AG (Registered) | | | 168 | | | | 58 | | |
| | | Shares | | Value
(000) | |
| United Kingdom (11.5%) | |
| National Grid PLC | | | 121,294 | | | $ | 1,177 | | |
| Pennon Group PLC | | | 5,300 | | | | 59 | | |
| Severn Trent PLC | | | 5,900 | | | | 137 | | |
| United Utilities Group PLC | | | 12,700 | | | | 120 | | |
| | | | 1,493 | | |
| United States (37.7%) | |
| AGL Resources, Inc. | | | 1,680 | | | | 71 | | |
| American Tower Corp., Class A | | | 12,640 | | | | 758 | | |
| American Water Works Co., Inc. | | | 6,300 | | | | 201 | | |
| CenterPoint Energy, Inc. | | | 15,620 | | | | 314 | | |
| Crown Castle International Corp. (c) | | | 9,690 | | | | 434 | | |
| Enbridge Energy Management LLC (c) | | | 7,155 | | | | 249 | | |
| ITC Holdings Corp. | | | 4,280 | | | | 325 | | |
| Kinder Morgan Management LLC (c) | | | 2,608 | | | | 205 | | |
| NiSource, Inc. | | | 8,680 | | | | 207 | | |
| Northeast Utilities | | | 7,600 | | | | 274 | | |
| Northwest Natural Gas Co. | | | 570 | | | | 27 | | |
| NSTAR | | | 1,780 | | | | 84 | | |
| Oneok, Inc. | | | 2,330 | | | | 202 | | |
| Pepco Holdings, Inc. | | | 3,280 | | | | 67 | | |
| PG&E Corp. | | | 3,310 | | | | 136 | | |
| SBA Communications Corp., Class A (c) | | | 5,540 | | | | 238 | | |
| Sempra Energy | | | 8,180 | | | | 450 | | |
| Southwest Gas Corp. | | | 1,660 | | | | 70 | | |
| Spectra Energy Corp. | | | 18,390 | | | | 565 | | |
| | | | 4,877 | | |
| Total Common Stocks (Cost $11,025) | | | 12,492 | | |
| Short-Term Investment (2.8%) | |
| Investment Company (2.8%) | |
Morgan Stanley Institutional Liquidity
Funds — Money Market Portfolio —
Institutional Class (See Note G-2) (Cost $361) | | | 361,322 | | | | 361 | | |
| Total Investments (99.4%) (Cost $11,386) | | | 12,853 | | |
| Other Assets in Excess of Liabilities (0.6%) | | | 81 | | |
| Net Assets (100.0%) | | $ | 12,934 | | |
(a) Comprised of securities in separate entities that are traded as a single stapled security.
(b) Consists of one or more classes of securities traded together as a unit; stocks with attached warrants.
(c) Non-income producing security.
(d) Security trades on the Hong Kong exchange.
ADR American Depositary Receipt.
The accompanying notes are an integral part of the financial statements.
88
2011 Annual Report
December 31, 2011
Portfolio of Investments (cont'd)
Select Global Infrastructure Portfolio
Fair Value Measurement Information:
The following is a summary of the inputs used to value the Portfolio's investments as of December 31, 2011. (See Note A-9 to the financial statements for further information regarding fair value measurement.)
| Investment Type | | Level 1
Unadjusted
quoted
prices
(000) | | Level 2
Other
significant
observable
inputs
(000) | | Level 3
Significant
unobservable
inputs
(000) | | Total
(000) | |
| Assets: | | | | | | | | | |
| Common Stocks | | | | | | | | | |
| Airports | | $ | 209 | | | $ | — | | | $ | — | | | $ | 209 | | |
| Communications | | | 1,886 | | | | — | | | | — | | | | 1,886 | | |
| Diversified | | | 495 | | | | — | | | | — | | | | 495 | | |
Oil & Gas Storage &
Transportation | | | 6,295 | | | | — | | | | — | | | | 6,295 | | |
| Ports | | | 83 | | | | — | | | | — | | | | 83 | | |
| Toll Roads | | | 854 | | | | — | | | | — | | | | 854 | | |
Transmission &
Distribution | | | 2,064 | | | | — | | | | — | | | | 2,064 | | |
| Water | | | 606 | | | | — | | | | — | | | | 606 | | |
| Total Common Stocks | | | 12,492 | | | | — | | | | — | | | | 12,492 | | |
Short-Term
Investment —
Investment Company | | | 361 | | | | — | | | | — | | | | 361 | | |
| Total Assets | | $ | 12,853 | | | $ | — | | | $ | — | | | $ | 12,853 | | |
Transfers between investment levels may occur as the markets fluctuate and/or the availability of data used in an investment's valuation changes. The Portfolio recognizes transfers between the levels as of the end of the period. As of December 31, 2011, the Portfolio did not have any significant investments transfer between investment levels.
The accompanying notes are an integral part of the financial statements.
89
2011 Annual Report
December 31, 2011
Investment Overview (unaudited)
Advantage Portfolio
The Advantage Portfolio (the "Portfolio") seeks long-term capital appreciation by investing primarily in established companies with capitalizations within the range of companies included in the Russell 1000® Growth Index.
Performance
For the year ended December 31, 2011, the Portfolio had a total return based on net asset value and reinvestment of distributions per share of 5.33%, net of fees, for Class I shares. The Portfolio's Class I shares outperformed against its benchmark, the Russell 1000® Growth Index (the "Index"), which returned 2.64%.
Factors Affecting Performance
• Equity markets began 2011 on a relatively optimistic note but suffered a stream of disappointments as the year progressed. The broad market's relatively flat return (as measured by the S&P 500® Index) for the year overall masked its more significant gyrations, as investors reacted to the worsening debt crisis in Europe, political strife in the Middle East, the natural disasters and nuclear crisis in Japan, political infighting in the U.S. and the downgrade of the U.S.'s credit rating by Standard & Poor's. Developed world economies also looked weaker than expected — the U.S. economy was nearing its stall speed in the first half of 2011, while European economies were expected to fall into recession in 2012. Despite the barrage of negative news, the strength of U.S. corporate earnings remained a bright spot for investors during the year.
• Against this backdrop, investors' appetite for risk was diminished. This helped large-cap stocks outperform mid- and small-cap stocks (as measured by their respective Russell indexes) for the year ended December 31, 2011.
• Stock selection and an overweight in the consumer discretionary sector were the most additive to relative returns. Leading contributors in the sector were a coffee retailer, a cosmetics company, and a restaurant company that owns several global fast food brands.
• Stock selection and an underweight technology were beneficial to performance. Holdings in a personal computer, mobile communications, and media devices manufacturer, a communications equipment maker, and an Internet search and online services provider bolstered relative performance.
• An overweight in the consumer staples sector also aided relative performance, although stock selection in the sector slightly detracted.
• Stock selection in the financial services sector diminished relative gains. Holdings in a global property, power, and infrastructure asset management company based in Canada (not represented in the Index) and a holding company with subsidiaries in a variety of industries including financial services were among the largest detractors in the sector.
• Stock selection in the producer durables sector was also unfavorable, due to lagging returns from a Hong Kong-based global consumer goods exporter and an energy and waste services company.
• Additionally, stock selection in the health care sector detracted from relative performance. The Portfolio held only two stocks in the sector and both declined during the period.
Management Strategies
• We look for high-quality growth companies that have these attributes: sustainable competitive advantages, business visibility, rising return on invested capital, free cash flow and a favorable risk/reward profile. In seeking these companies, we use intense fundamental research. Our emphasis is on secular growth, and as a result, short-term market events are not as meaningful in the stock selection process.
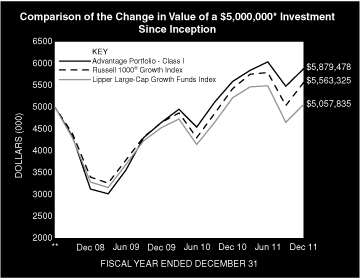
* Minimum Investment
** Commenced Operations on June 30, 2008.
In accordance with SEC regulations, Portfolio's performance shown assumes that all recurring fees (including management fees) were deducted and all dividends and distributions were reinvested. The performance of Class P, Class H, and Class L shares will vary from the Class I shares based upon different inception dates and will be negatively impacted by additional fees assessed to these classes.
90
2011 Annual Report
December 31, 2011
Investment Overview (unaudited) (cont'd)
Advantage Portfolio
Performance Compared to the Russell 1000® Growth Index(1) and the Lipper Large-Cap Growth Funds Index(2)
| | | Period Ended December 31, 2011 | |
| | | Total Returns(3) | |
| | | | | Average Annual | |
| | | One
Year | | Five
Years | | Ten
Years | | Since
Inception(5) | |
Portfolio — Class I Shares
w/o sales charges(4) | | | 5.33 | % | | | — | | | | — | | | | 4.73 | % | |
| Russell 1000® Growth Index | | | 2.64 | | | | — | | | | — | | | | 3.09 | | |
Lipper Large-Cap Growth
Funds Index | | | –2.90 | | | | — | | | | — | | | | 0.33 | | |
Portfolio — Class H Shares
w/o sales charges(4) | | | 5.06 | | | | — | | | | — | | | | 4.49 | | |
Portfolio — Class H Shares
with maximum 4.75%
sales charges(4) | | | 0.08 | | | | — | | | | — | | | | 3.04 | | |
| Russell 1000® Growth Index | | | 2.64 | | | | — | | | | — | | | | 3.09 | | |
Lipper Large-Cap Growth
Funds Index | | | –2.90 | | | | — | | | | — | | | | 0.33 | | |
Portfolio — Class L Shares
w/o sales charges(4) | | | 5.19 | | | | — | | | | — | | | | 4.53 | | |
| Russell 1000® Growth Index | | | 2.64 | | | | — | | | | — | | | | 3.09 | | |
Lipper Large-Cap Growth
Funds Index | | | –2.90 | | | | — | | | | — | | | | 0.33 | | |
Portfolio — Class P Shares
w/o sales charges(4) | | | 5.07 | | | | — | | | | — | | | | 16.05 | | |
| Russell 1000® Growth Index | | | 2.64 | | | | — | | | | — | | | | 13.66 | | |
Lipper Large-Cap Growth
Funds Index | | | –2.90 | | | | — | | | | — | | | | 9.90 | | |
Performance data quoted represents past performance, which is no guarantee of future results, and current performance may be lower or higher than the figures shown. Performance assumes that all dividends and distributions, if any, were reinvested. For the most recent month-end performance figures, please visit www.morganstanley.com/im. Investment return and principal value will fluctuate so that Portfolio shares, when redeemed, may be worth more or less than their original cost. Total returns do not reflect the deduction of taxes that a shareholder would pay on Portfolio distributions or the redemption of Portfolio shares. Performance of share classes will vary due to difference in sales charges and expenses.
(1) The Russell 1000® Growth Index measures the performance of the large-cap growth segment of the U.S. equity universe. It includes those Russell 1000® Index companies with higher price-to-book ratios and higher forecasted growth values. The Russell 1000® Index is an index of approximately 1,000 of the largest U.S. companies based on a combination of market capitalization and current index membership. The Index is unmanaged and its returns do not include any sales charges or fees. Such costs would lower performance. It is not possible to invest directly in an index.
(2) The Lipper Large-Cap Growth Funds Index is an equally weighted performance index of the largest qualifying funds (based on net assets) in the Lipper Large-Cap Growth Funds Funds classification. The Index, which is adjusted for capital gains distributions and income dividends, is unmanaged and should not be considered an investment. There are currently 30 funds represented in this Index. As of the date of this report, the Portfolio was in the Lipper Large-Cap Growth Funds classification.
(3) Total returns for the Portfolio reflect fees waived and expenses reimbursed, if applicable, by the Adviser. Without such waivers and reimbursements, total returns would have been lower. The fee waivers and/or expense reimbursements will continue for one year or until such time as the Fund's Board of Directors acts to discontinue all or a portion of such waivers and/or expense reimbursements when it deems that such action is appropriate. The Distributor has agreed to waive for at least one year the 12b-1 fee on Class L shares of the Portfolio to the extent it exceeds 0.04% of the average daily net assets of such shares on an annualized basis.
(4) On May 21, 2010 Class A, Class B, Class C, and Class I shares of Van Kampen Core Growth Fund ("the Predecessor Fund") were reorganized into Class H, Class H, Class L, and Class I shares of Morgan Stanley Advantage Portfolio ("the Portfolio"), respectively. Class H, Class L, and Class I shares' returns of the Portfolio will differ from the Predecessor Fund as they have different expenses. Performance shown for the Portfolio's Class I, Class H, and Class L shares reflects the performance of the shares of the Predecessor Fund for periods prior to May 21, 2010. The Class A, C, and I shares of the Predecessor Fund commenced operations on June 30, 2008. Class P shares commenced offering on May 21, 2010. Performance for Class H shares has been restated to reflect the Portfolio's applicable sales charge.
(5) For comparative purposes, average annual since inception returns listed for the Indexes refer to the inception date or initial offering of the respective share class of the Portfolio, not the inception of the Index.
Portfolio Composition
| Classification | | Percentage of
Total Investments | |
| Other* | | | 53.1 | % | |
| Commercial Services | | | 11.2 | | |
| Diversified Retail | | | 9.5 | | |
| Restaurants | | | 8.8 | | |
| Computer Technology | | | 6.2 | | |
| Beverage: Soft Drinks | | | 6.0 | | |
| Foods | | | 5.2 | | |
| Total Investments | | | 100.0 | % | |
* Industries representing less than 5% of total investments.
91
2011 Annual Report
December 31, 2011
Portfolio of Investments
Advantage Portfolio
| | | Shares | | Value
(000) | |
| Common Stocks (94.4%) | |
| Alternative Energy (1.6%) | |
| OGX Petroleo e Gas Participacoes SA (Brazil) (a) | | | 18,506 | | | $ | 135 | | |
| Beverage: Brewers & Distillers (2.5%) | |
| Anheuser-Busch InBev N.V. ADR | | | 3,539 | | | | 216 | | |
| Beverage: Soft Drinks (5.9%) | |
| Coca-Cola Co. (The) | | | 1,776 | | | | 124 | | |
| Dr. Pepper Snapple Group, Inc. | | | 4,759 | | | | 188 | | |
| PepsiCo, Inc. | | | 2,863 | | | | 190 | | |
| | | | 502 | | |
| Commercial Services (11.2%) | |
| eBay, Inc. (a) | | | 10,873 | | | | 330 | | |
| Intertek Group PLC (United Kingdom) | | | 7,283 | | | | 230 | | |
| Leucadia National Corp. | | | 4,761 | | | | 108 | | |
| Weight Watchers International, Inc. | | | 5,044 | | | | 278 | | |
| | | | 946 | | |
| Communications Technology (4.6%) | |
| Motorola Solutions, Inc. | | | 8,335 | | | | 386 | | |
| Computer Services, Software & Systems (4.9%) | |
| Google, Inc., Class A (a) | | | 644 | | | | 416 | | |
| Computer Technology (6.2%) | |
| Apple, Inc. (a) | | | 1,291 | | | | 523 | | |
| Consumer Lending (3.8%) | |
| Berkshire Hathaway, Inc., Class B (a) | | | 2,720 | | | | 207 | | |
| CME Group, Inc. | | | 484 | | | | 118 | | |
| | | | 325 | | |
| Cosmetics (1.8%) | |
| Natura Cosmeticos SA (Brazil) | | | 8,022 | | | | 156 | | |
| Diversified Manufacturing Operations (1.4%) | |
| Danaher Corp. | | | 2,547 | | | | 120 | | |
| Diversified Materials & Processing (2.7%) | |
| Schindler Holding AG (Switzerland) | | | 1,969 | | | | 229 | | |
| Diversified Media (1.5%) | |
| McGraw-Hill Cos., Inc. (The) | | | 2,750 | | | | 124 | | |
| Diversified Retail (9.5%) | |
| Amazon.com, Inc. (a) | | | 1,870 | | | | 324 | | |
| Costco Wholesale Corp. | | | 2,443 | | | | 203 | | |
| Fastenal Co. | | | 3,247 | | | | 142 | | |
| McDonald's Corp. | | | 1,307 | | | | 131 | | |
| | | | 800 | | |
| Financial Data & Systems (1.4%) | |
| MSCI, Inc., Class A (a) | | | 3,595 | | | | 118 | | |
| Foods (5.2%) | |
| Nestle SA ADR (Switzerland) | | | 3,924 | | | | 226 | | |
| Sara Lee Corp. | | | 11,262 | | | | 213 | | |
| | | | 439 | | |
| Pharmaceuticals (4.4%) | |
| Mead Johnson Nutrition Co. | | | 5,356 | | | | 368 | | |
| Real Estate Investment Trusts (REIT) (3.5%) | |
| Brookfield Asset Management, Inc., Class A (Canada) | | | 10,668 | | | | 293 | | |
| | | Shares | | Value
(000) | |
| Recreational Vehicles & Boats (3.0%) | |
| Edenred (France) | | | 10,448 | | | $ | 257 | | |
| Restaurants (8.8%) | |
| Dunkin' Brands Group, Inc. (a) | | | 4,683 | | | | 117 | | |
| Starbucks Corp. | | | 7,043 | | | | 324 | | |
| Yum! Brands, Inc. | | | 5,097 | | | | 301 | | |
| | | | 742 | | |
| Scientific Instruments: Gauges & Meters (1.2%) | |
| Thermo Fisher Scientific, Inc. (a) | | | 2,258 | | | | 102 | | |
| Scientific Instruments: Pollution Control (1.3%) | |
| Covanta Holding Corp. | | | 7,794 | | | | 107 | | |
| Textiles Apparel & Shoes (3.0%) | |
| Coach, Inc. | | | 2,252 | | | | 138 | | |
| NIKE, Inc., Class B | | | 1,236 | | | | 119 | | |
| | | | 257 | | |
| Tobacco (3.2%) | |
| Philip Morris International, Inc. | | | 3,402 | | | | 267 | | |
| Wholesale & International Trade (1.8%) | |
| Li & Fung Ltd. (b) | | | 84,000 | | | | 155 | | |
| Total Common Stocks (Cost $6,856) | | | 7,983 | | |
| Convertible Preferred Stocks (0.7%) | |
| Alternative Energy (0.7%) | |
| Better Place, Inc. (a)(c)(d) (Cost $32) | | | 12,982 | | | | 59 | | |
| Short-Term Investment (4.6%) | |
| Investment Company (4.6%) | |
Morgan Stanley Institutional Liquidity
Funds — Money Market Portfolio —
Institutional Class (See Note G-2) (Cost $386) | | | 386,241 | | | | 386 | | |
| Total Investments (99.7%) (Cost $7,274) | | | 8,428 | | |
| Other Assets in Excess of Liabilities (0.3%) | | | 26 | | |
| Net Assets (100.0%) | | $ | 8,454 | | |
(a) Non-income producing security.
(b) Security trades on the Hong Kong exchange.
(c) Security has been deemed illiquid at December 31, 2011.
(d) At December 31, 2011, the Portfolio held a fair valued security valued at approximately $59,000, representing 0.7% of net assets. This security has been fair valued as determined in good faith under procedures established by and under the general supervision of the Fund's Directors.
ADR American Depositary Receipt.
The accompanying notes are an integral part of the financial statements.
92
2011 Annual Report
December 31, 2011
Portfolio of Investments (cont'd)
Advantage Portfolio
Fair Value Measurement Information:
The following is a summary of the inputs used to value the Portfolio's investments as of December 31, 2011. (See Note A-9 to the financial statements for further information regarding fair value measurement.)
| Investment Type | | Level 1
Unadjusted
quoted
prices
(000) | | Level 2
Other
significant
observable
inputs
(000) | | Level 3
Significant
unobservable
inputs
(000) | | Total
(000) | |
| Assets: | | | | | | | | | |
| Common Stocks | | | | | | | | | |
| Alternative Energy | | $ | 135 | | | $ | — | | | $ | — | | | $ | 135 | | |
Beverage: Brewers &
Distillers | | | 216 | | | | — | | | | — | | | | 216 | | |
| Beverage: Soft Drinks | | | 502 | | | | — | | | | — | | | | 502 | | |
| Commercial Services | | | 946 | | | | — | | | | — | | | | 946 | | |
Communications
Technology | | | 386 | | | | — | | | | — | | | | 386 | | |
Computer Services,
Software & Systems | | | 416 | | | | — | | | | — | | | | 416 | | |
| Computer Technology | | | 523 | | | | — | | | | — | | | | 523 | | |
| Consumer Lending | | | 325 | | | | — | | | | — | | | | 325 | | |
| Cosmetics | | | 156 | | | | — | | | | — | | | | 156 | | |
Diversified Manufacturing
Operations | | | 120 | | | | — | | | | — | | | | 120 | | |
Diversified Materials &
Processing | | | 229 | | | | — | | | | — | | | | 229 | | |
| Diversified Media | | | 124 | | | | — | | | | — | | | | 124 | | |
| Diversified Retail | | | 800 | | | | — | | | | — | | | | 800 | | |
| Financial Data & Systems | | | 118 | | | | — | | | | — | | | | 118 | | |
| Foods | | | 439 | | | | — | | | | — | | | | 439 | | |
| Pharmaceuticals | | | 368 | | | | — | | | | — | | | | 368 | | |
Real Estate Investment
Trusts (REIT) | | | 293 | | | | — | | | | — | | | | 293 | | |
Recreational Vehicles &
Boats | | | 257 | | | | — | | | | — | | | | 257 | | |
| Restaurants | | | 742 | | | | — | | | | — | | | | 742 | | |
Scientific Instruments:
Gauges & Meters | | | 102 | | | | — | | | | — | | | | 102 | | |
Scientific Instruments:
Pollution Control | | | 107 | | | | — | | | | — | | | | 107 | | |
| Textiles Apparel & Shoes | | | 257 | | | | — | | | | — | | | | 257 | | |
| Tobacco | | | 267 | | | | — | | | | — | | | | 267 | | |
Wholesale & International
Trade | | | 155 | | | | — | | | | — | | | | 155 | | |
| Total Common Stocks | | | 7,983 | | | | — | | | | — | | | | 7,983 | | |
Convertible Preferred
Stocks | | | — | | | | — | | | | 59 | | | | 59 | | |
Short-Term Investment —
Investment Company | | | 386 | | | | — | | | | — | | | | 386 | | |
| Total Assets | | $ | 8,369 | | | $ | — | | | $ | 59 | | | $ | 8,428 | | |
Transfers between investment levels may occur as the markets fluctuate and/or the availability of data used in an investment's valuation changes. The Portfolio recognizes transfers between the levels as of the end of the period. As of December 31, 2011, the Portfolio did not have any significant investments transfer between investment levels.
Following is a reconciliation of investments in which significant unobservable inputs (Level 3) were used in determining fair value.
| | | Convertible
Preferred
Stocks
(000) | |
| Beginning Balance | | $ | 32 | | |
| Purchases | | | — | | |
| Sales | | | — | | |
| Amortization of discount | �� | | — | | |
| Transfers in | | | — | | |
| Transfers out | | | — | | |
| Change in unrealized appreciation (depreciation) | | | 27 | | |
| Realized gains (losses) | | | — | | |
| Ending Balance | | $ | 59 | | |
Net change in unrealized appreciation/depreciation from
investments still held as of December 31, 2011 | | $ | 27 | | |
The accompanying notes are an integral part of the financial statements.
93
2011 Annual Report
December 31, 2011
Investment Overview (unaudited)
Focus Growth Portfolio
The Focus Growth Portfolio (the "Portfolio") seeks capital appreciation by investing primarily in growth-oriented equity securities of large capitalization companies.
Performance
For the year ended December 31, 2011, the Portfolio had a total return based on net asset value and reinvestment of distributions per share of -7.30%, net of fees, for Class I shares. The Portfolio's Class I shares underperformed against its benchmark, the Russell 1000® Growth Index (the "Index"), which returned 2.64%.
Factors Affecting Performance
• Equity markets began 2011 on a relatively optimistic note but suffered a stream of disappointments as the year progressed. The broad market's relatively flat return (as measured by the S&P 500® Index) for the year overall masked its more significant gyrations, as investors reacted to the worsening debt crisis in Europe, political strife in the Middle East, the natural disasters and nuclear crisis in Japan, political infighting in the U.S. and the downgrade of the U.S.'s credit rating by Standard & Poor's. Developed world economies also looked weaker than expected — the U.S. economy was nearing its stall speed in the first half of 2011, while European economies were expected to fall into recession in 2012. Despite the barrage of negative news, the strength of U.S. corporate earnings remained a bright spot for investors during the year.
• Against this backdrop, investors' appetite for risk was diminished. This helped large-cap stocks outperform mid- and small-cap stocks (as measured by their respective Russell indexes) for the year ended December 31, 2011.
• Stock selection in the consumer discretionary sector detracted the most from relative performance, led lower by a video streaming service, an online retailer, and a South African diversified media company (not represented in the Index).
• Stock selection in the energy sector further dampened performance, with weakness from positions in an oil and gas production company and a solar power systems manufacturer. The Portfolio's lack of exposure to integrated oil companies, a group which performed well during the period, also hurt performance on a relative basis.
• Underperformance was also driven by stock selection in the financial services sector. Within the sector, out-of-benchmark exposures to a Brazilian securities exchange operator and a global property, power, and infrastructure asset management company based in Canada, were among the weakest-performing holdings, as was a holding company engaged in a variety of businesses.
• The technology sector was the main positive contributor to performance, due to favorable stock selection. The sector was led by a personal computer, mobile communications, and media devices manufacturer, a Chinese internet search provider (which is not represented in the Index), and a communications equipment maker.
Management Strategies
• We look for high-quality growth companies that have these attributes: sustainable competitive advantages, business visibility, rising return on invested capital, free cash flow and a favorable risk/reward profile. In seeking these companies, we use intense fundamental research. Our emphasis is on secular growth, and as a result, short-term market events are not as meaningful in the stock selection process.
94
2011 Annual Report
December 31, 2011
Investment Overview (unaudited) (cont'd)
Focus Growth Portfolio
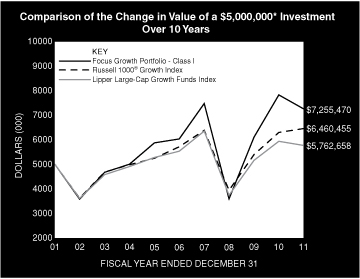
* Minimum Investment
In accordance with SEC regulations, Portfolio's performance shown assumes that all recurring fees (including management fees) were deducted and all dividends and distributions were reinvested. The performance of Class P shares will vary from the Class I shares based upon its different inception date and will be negatively impacted by additional fees assessed to that class.
Performance Compared to the Russell 1000® Growth Index(1) and the Lipper Large-Cap Growth Funds Index(2)
| | | Period Ended December 31, 2011 | |
| | | Total Returns(3) | |
| | | | | Average Annual | |
| | | One
Year | | Five
Years | | Ten
Years | | Since
Inception(6) | |
Portfolio — Class I Shares
w/o sales charges(4) | | | –7.30 | % | | | 3.76 | % | | | 3.79 | % | | | 9.87 | % | |
| Russell 1000® Growth Index | | | 2.64 | | | | 2.50 | | | | 2.60 | | | | 6.88 | | |
Lipper Large-Cap Growth
Funds Index | | | –2.90 | | | | 0.85 | | | | 1.43 | | | | 5.83 | | |
Portfolio — Class P Shares
w/o sales charges(5) | | | –7.53 | | | | 3.49 | | | | 3.53 | | | | 7.73 | | |
| Russell 1000® Growth Index | | | 2.64 | | | | 2.50 | | | | 2.60 | | | | 5.48 | | |
Lipper Large-Cap Growth
Funds Index | | | –2.90 | | | | 0.85 | | | | 1.43 | | | | 4.40 | | |
Performance data quoted represents past performance, which is no guarantee of future results, and current performance may be lower or higher than the figures shown. Performance assumes that all dividends and distributions, if any, were reinvested. For the most recent month-end performance figures, please visit www.morganstanley.com/im. Investment return and principal value will fluctuate so that Portfolio shares, when redeemed, may be worth more or less than their original cost. Total returns do not reflect the deduction of taxes that a shareholder would pay on Portfolio distributions or the redemption of Portfolio shares. Performance of share classes will vary due to difference in expenses.
(1) The Russell 1000® Growth Index measures the performance of the large-cap growth segment of the U.S. equity universe. It includes those Russell 1000® Index companies with higher price-to-book ratios and higher forecasted growth values. The Russell 1000® Index is an index of approximately 1,000 of the largest U.S. companies based on a combination of market capitalization and current index membership. The Index is unmanaged and its returns do not include any sales charges or fees. Such costs would lower performance. It is not possible to invest directly in an index.
(2) The Lipper Large-Cap Growth Funds Index is an equally weighted performance index of the largest qualifying funds (based on net assets) in the Lipper Large-Cap Growth Funds classification. The Index, which is adjusted for capital gains distributions and income dividends, is unmanaged and should not be considered an investment. There are currently 30 funds represented in this Index. As of the date of this report, the Portfolio is in the Lipper Large-Cap Growth Funds classification.
(3) Total returns for the Portfolio reflect fees waived and expenses reimbursed, if applicable, by the Adviser. Without such waivers and reimbursements, total returns would have been lower. The fee waivers and/or expense reimbursements will continue for one year or until such time as the Fund's Board of Directors acts to discontinue all or a portion of such waivers and/or expense reimbursements when it deems that such action is appropriate.
(4) Commenced operations on March 8, 1995.
(5) Commenced offering on January 2, 1996.
(6) For comparative purposes, average annual since inception returns listed for the Indexes refer to the inception date or initial offering of the respective share class of the Portfolio, not the inception of the Index.
Portfolio Composition
| Classification | | Percentage of
Total Investments | |
| Other* | | | 40.6 | % | |
| Computer Services, Software & Systems | | | 19.4 | | |
| Diversified Retail | | | 15.3 | | |
| Computer Technology | | | 12.5 | | |
| Short-Term Investments | | | 7.2 | | |
| Communications Technology | | | 5.0 | | |
| Total Investments | | | 100.0 | % | |
* Industries representing less than 5% of total investments.
95
2011 Annual Report
December 31, 2011
Portfolio of Investments
Focus Growth Portfolio
| | | Shares | | Value
(000) | |
| Common Stocks (92.2%) | |
| Air Transport (2.3%) | |
| Expeditors International of Washington, Inc. | | | 13,386 | | | $ | 548 | | |
| Alternative Energy (2.8%) | |
| Ultra Petroleum Corp. (a) | | | 22,396 | | | | 663 | | |
| Biotechnology (1.6%) | |
| Illumina, Inc. (a) | | | 12,883 | | | | 393 | | |
| Chemicals: Diversified (3.7%) | |
| Monsanto Co. | | | 12,743 | | | | 893 | | |
| Commercial Finance & Mortgage Companies (2.0%) | |
| BM&F Bovespa SA (Brazil) | | | 90,750 | | | | 477 | | |
| Commercial Services (1.9%) | |
| Leucadia National Corp. | | | 19,647 | | | | 447 | | |
| Communications Technology (5.1%) | |
| Motorola Solutions, Inc. | | | 26,207 | | | | 1,213 | | |
| Computer Services, Software & Systems (19.4%) | |
| Baidu, Inc. ADR (China) (a) | | | 7,539 | | | | 878 | | |
| Facebook, Inc., Class B (a)(b)(c) | | | 23,263 | | | | 628 | | |
| Google, Inc., Class A (a) | | | 3,219 | | | | 2,079 | | |
| LinkedIn Corp., Class A (a) | | | 4,374 | | | | 276 | | |
| Salesforce.com, Inc. (a) | | | 5,772 | | | | 586 | | |
| Zynga, Inc., Class A (a) | | | 21,372 | | | | 201 | | |
| | | | 4,648 | | |
| Computer Technology (12.5%) | |
| Apple, Inc. (a) | | | 6,602 | | | | 2,674 | | |
| Yandex N.V., Class A (Russia) (a) | | | 16,398 | | | | 323 | | |
| | | | 2,997 | | |
| Diversified Media (1.7%) | |
| Naspers Ltd., Class N (South Africa) | | | 9,489 | | | | 415 | | |
| Diversified Retail (15.4%) | |
| Amazon.com, Inc. (a) | | | 12,048 | | | | 2,085 | | |
| Fastenal Co. | | | 11,870 | | | | 518 | | |
| Groupon, Inc. (a) | | | 19,513 | | | | 403 | | |
| NetFlix, Inc. (a) | | | 3,389 | | | | 235 | | |
| Priceline.com, Inc. (a) | | | 931 | | | | 435 | | |
| | | | 3,676 | | |
| Financial Data & Systems (1.8%) | |
| MSCI, Inc., Class A (a) | | | 13,159 | | | | 433 | | |
| Medical Equipment (4.3%) | |
| Intuitive Surgical, Inc. (a) | | | 2,240 | | | | 1,037 | | |
| Metals & Minerals: Diversified (1.3%) | |
| Molycorp, Inc. (a) | | | 13,114 | | | | 314 | | |
| Pharmaceuticals (3.5%) | |
| Mead Johnson Nutrition Co. | | | 12,106 | | | | 832 | | |
| Real Estate Investment Trusts (REIT) (3.9%) | |
Brookfield Asset Management, Inc.,
Class A (Canada) | | | 34,011 | | | | 935 | | |
| Recreational Vehicles & Boats (4.0%) | |
| Edenred (France) | | | 39,301 | | | | 967 | | |
| | | Shares | | Value
(000) | |
| Semiconductors & Components (2.7%) | |
| ARM Holdings PLC ADR (United Kingdom) | | | 17,719 | | | $ | 490 | | |
| First Solar, Inc. (a) | | | 4,898 | | | | 166 | | |
| | | | 656 | | |
| Wholesale & International Trade (2.3%) | |
| Li & Fung Ltd. (d) | | | 292,200 | | | | 541 | | |
| Total Common Stocks (Cost $22,193) | | | 22,085 | | |
| Convertible Preferred Stocks (0.8%) | |
| Alternative Energy (0.8%) | |
| Better Place, Inc. Series B (a)(b)(c) | | | 21,064 | | | | 96 | | |
| Better Place, Inc. Series C (a)(b)(c) | | | 23,437 | | | | 106 | | |
| Total Convertible Preferred Stocks (Cost $159) | | | 202 | | |
| Short-Term Investment (7.2%) | |
| Investment Company (7.2%) | |
Morgan Stanley Institutional Liquidity
Funds — Money Market Portfolio —
Institutional Class (See Note G-2)
(Cost $1,727) | | | 1,726,533 | | | | 1,727 | | |
| Total Investments (100.2%) (Cost $24,079) | | | 24,014 | | |
| Liabilities in Excess of Other Assets (-0.2%) | | | (49 | ) | |
| Net Assets (100.0%) | | $ | 23,965 | | |
(a) Non-income producing security.
(b) At December 31, 2011, the Portfolio held fair valued securities valued at approximately $830,000, representing 3.5% of net assets. These securities have been fair valued as determined in good faith under procedures established by and under the general supervision of the Fund's Directors.
(c) Security has been deemed illiquid at December 31, 2011.
(d) Security trades on the Hong Kong exchange.
ADR American Depositary Receipt.
The accompanying notes are an integral part of the financial statements.
96
2011 Annual Report
December 31, 2011
Portfolio of Investments (cont'd)
Focus Growth Portfolio
Fair Value Measurement Information:
The following is a summary of the inputs used to value the Portfolio's investments as of December 31, 2011. (See Note A-9 to the financial statements for further information regarding fair value measurement.)
| Investment Type | | Level 1
Unadjusted
quoted
prices
(000) | | Level 2
Other
significant
observable
inputs
(000) | | Level 3
Significant
unobservable
inputs
(000) | | Total
(000) | |
| Assets: | | | | | | | | | |
| Common Stocks | | | | | | | | | |
| Air Transport | | $ | 548 | | | $ | — | | | $ | — | | | $ | 548 | | |
| Alternative Energy | | | 663 | | | | — | | | | — | | | | 663 | | |
| Biotechnology | | | 393 | | | | — | | | | — | | | | 393 | | |
| Chemicals: Diversified | | | 893 | | | | — | | | | — | | | | 893 | | |
Commercial Finance &
Mortgage Companies | | | 477 | | | | — | | | | — | | | | 477 | | |
| Commercial Services | | | 447 | | | | — | | | | — | | | | 447 | | |
Communications
Technology | | | 1,213 | | | | — | | | | — | | | | 1,213 | | |
Computer Services,
Software & Systems | | | 4,020 | | | | — | | | | 628 | | | | 4,648 | | |
| Computer Technology | | | 2,997 | | | | — | | | | — | | | | 2,997 | | |
| Diversified Media | | | 415 | | | | — | | | | — | | | | 415 | | |
| Diversified Retail | | | 3,676 | | | | — | | | | — | | | | 3,676 | | |
| Financial Data & Systems | | | 433 | | | | — | | | | — | | | | 433 | | |
| Medical Equipment | | | 1,037 | | | | — | | | | — | | | | 1,037 | | |
Metals & Minerals:
Diversified | | | 314 | | | | — | | | | — | | | | 314 | | |
| Pharmaceuticals | | | 832 | | | | — | | | | — | | | | 832 | | |
Real Estate Investment
Trusts (REIT) | | | 935 | | | | — | | | | — | | | | 935 | | |
Recreational Vehicles &
Boats | | | 967 | | | | — | | | | — | | | | 967 | | |
Semiconductors &
Components | | | 656 | | | | — | | | | — | | | | 656 | | |
Wholesale & International
Trade | | | 541 | | | | — | | | | — | | | | 541 | | |
| Total Common Stocks | | | 21,457 | | | | — | | | | 628 | | | | 22,085 | | |
Convertible Preferred
Stocks | | | — | | | | — | | | | 202 | | | | 202 | | |
| Short-Term Investment — | |
| Investment Company | | | 1,727 | | | | — | | | | — | | | | 1,727 | | |
| Total Assets | | $ | 23,184 | | | $ | — | | | $ | 830 | | | $ | 24,014 | | |
Transfers between investment levels may occur as the markets fluctuate and/or the availability of data used in an investment's valuation changes. The Portfolio recognizes transfers between the levels as of the end of the period. As of December 31, 2011, the Portfolio did not have any significant investments transfer between investment levels.
Following is a reconciliation of investments in which significant unobservable inputs (Level 3) were used in determining fair value.
| | | Common
Stocks
(000) | | Convertible
Preferred
Stocks
(000) | |
| Beginning Balance | | $ | — | | | $ | 53 | | |
| Purchases | | | 512 | | | | 106 | | |
| Sales | | | — | | | | — | | |
| Amortization of discount | | | — | | | | — | | |
| Transfers in | | | — | | | | — | | |
| Transfers out | | | — | | | | — | | |
| Change in unrealized appreciation (depreciation) | | | 116 | | | | 43 | | |
| Realized gains (losses) | | | — | | | | — | | |
| Ending Balance | | $ | 628 | | | $ | 202 | | |
Net change in unrealized appreciation/
depreciation from investments still held
as of December 31, 2011 | | $ | 116 | | | $ | 43 | | |
The accompanying notes are an integral part of the financial statements.
97
2011 Annual Report
December 31, 2011
Investment Overview (unaudited)
Growth Portfolio
The Growth Portfolio (the "Portfolio") seeks long-term capital appreciation by investing primarily in growth-oriented equity securities of large capitalization companies.
Performance
For the year ended December 31, 2011, the Portfolio had a total return based on net asset value and reinvestment of distributions per share of -3.01%, net of fees, for Class I shares. The Portfolio's Class I shares underperformed against its benchmark, the Russell 1000® Growth Index (the "Index"), which returned 2.64%.
Factors Affecting Performance
• Equity markets began 2011 on a relatively optimistic note but suffered a stream of disappointments as the year progressed. The broad market's relatively flat return (as measured by the S&P 500® Index) for the year overall masked its more significant gyrations, as investors reacted to the worsening debt crisis in Europe, political strife in the Middle East, the natural disasters and nuclear crisis in Japan, political infighting in the U.S. and the downgrade of the U.S.'s credit rating by Standard & Poor's. Developed world economies also looked weaker than expected — the U.S. economy was nearing its stall speed in the first half of 2011, while European economies were expected to fall into recession in 2012. Despite the barrage of negative news, the strength of U.S. corporate earnings remained a bright spot for investors during the year.
• Against this backdrop, investors' appetite for risk was diminished. This helped large-cap stocks outperform mid- and small-cap stocks (as measured by their respective Russell indexes) for the year ended December 31, 2011.
• The Portfolio's relative underperformance was led by stock selection in the financial services sector. Within the sector, out-of-benchmark exposures to a Brazilian securities exchange operator and a global property, power, and infrastructure asset management company based in Canada, were among the weakest-performing holdings, as was a discount securities brokerage firm.
• Stock selection in the energy sector further dampened performance, with weakness from positions in an oil and gas production company and a solar power systems manufacturer. The Portfolio's lack of exposure to integrated oil companies, a group which performed well during the period, also hurt performance on a relative basis.
• Despite the relative gains of an overweight in the sector, stock selection in consumer discretionary detracted from relative performance, led lower by a video streaming service, an online retailer, and a South African diversified media company (not represented in the Index).
• The technology sector was the main positive contributor to performance. The sector was led by a personal computer, mobile communications, and media devices manufacturer and a Chinese internet search provider (which is not represented in the Index).
• The health care sector also added to relative gains, mostly due to favorable stock selection. Within the sector, holdings in a surgical systems manufacturer and specialty pharmaceuticals stock were the top contributors to performance.
Management Strategies
• We look for high-quality growth companies that have these attributes: sustainable competitive advantages, business visibility, rising return on invested capital, free cash flow and a favorable risk/reward profile. In seeking these companies, we use intense fundamental research. Our emphasis is on secular growth, and as a result, short-term market events are not as meaningful in the stock selection process.
98
2011 Annual Report
December 31, 2011
Investment Overview (unaudited) (cont'd)
Growth Portfolio
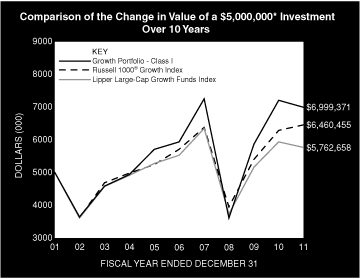
* Minimum Investment
In accordance with SEC regulations, Portfolio's performance shown assumes that all recurring fees (including management fees) were deducted and all dividends and distributions were reinvested. The performance of Class P shares will vary from the Class I shares based upon its different inception date and will be negatively impacted by additional fees assessed to that class.
Performance Compared to the Russell 1000® Growth Index(1) and the Lipper Large-Cap Growth Funds Index(2)
| | | Period Ended December 31, 2011 | |
| | | Total Returns(3) | |
| | | | | Average Annual | |
| | | One
Year | | Five
Years | | Ten
Years | | Since
Inception(6) | |
Portfolio — Class I Shares
w/o sales charges(4) | | | –3.01 | % | | | 3.34 | % | | | 3.42 | % | | | 8.73 | % | |
| Russell 1000® Growth Index | | | 2.64 | | | | 2.50 | | | | 2.60 | | | | 7.20 | | |
Lipper Large-Cap Growth
Funds Index | | | –2.90 | | | | 0.85 | | | | 1.43 | | | | 6.49 | | |
Portfolio — Class P Shares
w/o sales charges(5) | | | –3.27 | | | | 3.09 | | | | 3.17 | | | | 6.83 | | |
| Russell 1000® Growth Index | | | 2.64 | | | | 2.50 | | | | 2.60 | | | | 5.48 | | |
Lipper Large-Cap Growth
Funds Index | | | –2.90 | | | | 0.85 | | | | 1.43 | | | | 4.40 | | |
Performance data quoted represents past performance, which is no guarantee of future results, and current performance may be lower or higher than the figures shown. Performance assumes that all dividends and distributions, if any, were reinvested. For the most recent month-end performance figures, please visit www.morganstanley.com/im. Investment return and principal value will fluctuate so that Portfolio shares, when redeemed, may be worth more or less than their original cost. Total returns do not reflect the deduction of taxes that a shareholder would pay on Portfolio distributions or the redemption of Portfolio shares. Performance of share classes will vary due to difference in expenses.
(1) The Russell 1000® Growth Index measures the performance of the large-cap growth segment of the U.S. equity universe. It includes those Russell 1000® Index companies with higher price-to-book ratios and higher forecasted growth values. The Russell 1000® Index is an index of approximately 1,000 of the largest U.S. companies based on a combination of market capitalization and current index membership. The Index is unmanaged and its returns do not include any sales charges or fees. Such costs would lower performance. It is not possible to invest directly in an index.
(2) The Lipper Large-Cap Growth Funds Index is an equally weighted performance index of the largest qualifying funds (based on net assets) in the Lipper Large-Cap Growth Funds classification. The Index, which is adjusted for capital gains distributions and income dividends, is unmanaged and should not be considered an investment. There are currently 30 funds represented in this Index. As of the date of this report, the Portfolio is in the Lipper Large-Cap Growth Funds classification.
(3) Total returns for the Portfolio reflect fees waived and expenses reimbursed, if applicable, by the Adviser. Without such waivers and reimbursements, total returns would have been lower. The fee waivers and/or expense reimbursements will continue for one year or until such time as the Fund's Board of Directors acts to discontinue all or a portion of such waivers and/or expense reimbursements when it deems that such action is appropriate.
(4) Commenced operations on April 2, 1991.
(5) Commenced offering on January 2, 1996.
(6) For comparative purposes, average annual since inception returns listed for the Indexes refer to the inception date or initial offering of the respective share class of the Portfolio, not the inception of the Index.
Portfolio Composition
| Classification | | Percentage of
Total Investments | |
| Other* | | | 56.7 | % | |
| Computer Services, Software & Systems | | | 18.6 | | |
| Diversified Retail | | | 13.6 | | |
| Computer Technology | | | 11.1 | | |
| Total Investments | | | 100.0 | % | |
* Industries representing less than 5% of total investments.
99
2011 Annual Report
December 31, 2011
Portfolio of Investments
Growth Portfolio
| | | Shares | | Value
(000) | |
| Common Stocks (100.0%) | |
| Air Transport (2.0%) | |
| Expeditors International of Washington, Inc. | | | 363,588 | | | $ | 14,893 | | |
| Alternative Energy (3.3%) | |
| Range Resources Corp. | | | 168,834 | | | | 10,457 | | |
| Ultra Petroleum Corp. (a) | | | 498,344 | | | | 14,766 | | |
| | | | 25,223 | | |
| Asset Management & Custodian (0.5%) | |
| Citigroup, Inc. (See Note G-2) | | | 79,854 | | | | 2,101 | | |
| Goldman Sachs Group, Inc. (The) | | | 20,958 | | | | 1,895 | | |
| | | | 3,996 | | |
| Biotechnology (1.5%) | |
| Illumina, Inc. (a) | | | 372,445 | | | | 11,352 | | |
| Casinos & Gambling (1.5%) | |
| Las Vegas Sands Corp. (a) | | | 270,651 | | | | 11,565 | | |
| Chemicals: Diversified (3.1%) | |
| Monsanto Co. | | | 335,875 | | | | 23,535 | | |
| Commercial Finance & Mortgage Companies (1.8%) | |
| BM&F Bovespa SA (Brazil) | | | 2,575,066 | | | | 13,529 | | |
| Commercial Services (4.0%) | |
| eBay, Inc. (a) | | | 564,709 | | | | 17,128 | | |
| Leucadia National Corp. | | | 567,507 | | | | 12,905 | | |
| | | | 30,033 | | |
| Communications Technology (4.3%) | |
| Motorola Solutions, Inc. | | | 707,841 | | | | 32,766 | | |
| Computer Services, Software & Systems (19.1%) | |
| Baidu, Inc. ADR (China) (a) | | | 217,824 | | | | 25,370 | | |
| Facebook, Inc., Class B (a)(b)(c) | | | 1,000,782 | | | | 27,021 | | |
| Google, Inc., Class A (a) | | | 84,598 | | | | 54,642 | | |
| LinkedIn Corp., Class A (a) | | | 122,719 | | | | 7,732 | | |
| Salesforce.com, Inc. (a) | | | 163,511 | | | | 16,590 | | |
| VMware, Inc., Class A (a) | | | 87,422 | | | | 7,273 | | |
| Zynga, Inc., Class A (a) | | | 630,208 | | | | 5,930 | | |
| | | | 144,558 | | |
| Computer Technology (11.4%) | |
| Apple, Inc. (a) | | | 186,880 | | | | 75,687 | | |
| NVIDIA Corp. (a) | | | 175,975 | | | | 2,439 | | |
| Yandex N.V., Class A (Russia) (a) | | | 438,686 | | | | 8,642 | | |
| | | | 86,768 | | |
| Consumer Lending (1.5%) | |
| CME Group, Inc. | | | 47,714 | | | | 11,626 | | |
| Diversified Financial Services (0.2%) | |
| Bank of America Corp. | | | 316,126 | | | | 1,758 | | |
| Diversified Media (3.4%) | |
| McGraw-Hill Cos., Inc. (The) | | | 298,533 | | | | 13,425 | | |
| Naspers Ltd., Class N (South Africa) | | | 282,001 | | | | 12,338 | | |
| | | | 25,763 | | |
| Diversified Retail (14.0%) | |
| Amazon.com, Inc. (a) | | | 346,609 | | | | 59,998 | | |
| Fastenal Co. | | | 354,805 | | | | 15,473 | | |
| | | Shares | | Value
(000) | |
| Groupon, Inc. (a) | | | 530,764 | | | $ | 10,950 | | |
| NetFlix, Inc. (a) | | | 96,496 | | | | 6,686 | | |
| Priceline.com, Inc. (a) | | | 27,896 | | | | 13,047 | | |
| | | | 106,154 | | |
| Financial Data & Systems (1.7%) | |
| MSCI, Inc., Class A (a) | | | 393,296 | | | | 12,951 | | |
| Insurance: Multi-Line (0.3%) | |
| American International Group, Inc. (a) | | | 89,894 | | | | 2,086 | | |
| Medical Equipment (3.9%) | |
| Intuitive Surgical, Inc. (a) | | | 64,434 | | | | 29,834 | | |
| Metals & Minerals: Diversified (1.2%) | |
| Molycorp, Inc. (a) | | | 365,766 | | | | 8,771 | | |
| Pharmaceuticals (5.1%) | |
| Mead Johnson Nutrition Co. | | | 348,587 | | | | 23,959 | | |
Valeant Pharmaceuticals International, Inc.
(Canada) (a) | | | 311,072 | | | | 14,524 | | |
| | | | 38,483 | | |
| Real Estate Investment Trusts (REIT) (3.6%) | |
Brookfield Asset Management, Inc.,
Class A (Canada) | | | 1,001,623 | | | | 27,525 | | |
| Recreational Vehicles & Boats (3.5%) | |
| Edenred (France) | | | 1,071,672 | | | | 26,381 | | |
| Restaurants (3.4%) | |
| Starbucks Corp. | | | 277,791 | | | | 12,781 | | |
| Yum! Brands, Inc. | | | 215,070 | | | | 12,691 | | |
| | | | 25,472 | | |
| Securities Brokerage & Services (1.2%) | |
| Charles Schwab Corp. (The) | | | 777,943 | | | | 8,760 | | |
| Semiconductors & Components (2.5%) | |
| ARM Holdings PLC ADR (United Kingdom) | | | 499,397 | | | | 13,818 | | |
| First Solar, Inc. (a) | | | 147,250 | | | | 4,971 | | |
| | | | 18,789 | | |
| Wholesale & International Trade (2.0%) | |
| Li & Fung Ltd. (d) | | | 8,339,202 | | | | 15,440 | | |
| Total Common Stocks (Cost $623,496) | | | 758,011 | | |
| Convertible Preferred Stocks (1.1%) | |
| Alternative Energy (1.1%) | |
| Better Place, Inc. (a)(b)(c) (Cost $4,355) | | | 1,741,925 | | | | 7,908 | | |
| Short-Term Investment (1.7%) | |
| Investment Company (1.7%) | |
Morgan Stanley Institutional Liquidity
Funds — Money Market Portfolio —
Institutional Class (See Note G-2)
(Cost $12,909) | | | 12,909,028 | | | | 12,909 | | |
| Total Investments (102.8%) (Cost $640,760) | | | 778,828 | | |
| Liabilities in Excess of Other Assets (-2.8%) | | | (20,858 | ) | |
| Net Assets (100.0%) | | $ | 757,970 | | |
The accompanying notes are an integral part of the financial statements.
100
2011 Annual Report
December 31, 2011
Portfolio of Investments (cont'd)
Growth Portfolio
(a) Non-income producing security.
(b) At December 31, 2011, the Portfolio held fair valued securities valued at approximately $34,929,000, representing 4.6% of net assets. These securities have been fair valued as determined in good faith under procedures established by and under the general supervision of the Fund's Directors.
(c) Security has been deemed illiquid at December 31, 2011.
(d) Security trades on the Hong Kong exchange.
ADR American Depositary Receipt.
Fair Value Measurement Information:
The following is a summary of the inputs used to value the Portfolio's investments as of December 31, 2011. (See Note A-9 to the financial statements for further information regarding fair value measurement.)
| Investment Type | | Level 1
Unadjusted
quoted
prices
(000) | | Level 2
Other
significant
observable
inputs
(000) | | Level 3
Significant
unobservable
inputs
(000) | | Total
(000) | |
| Assets: | | | | | | | | | |
| Common Stocks | | | | | | | | | |
| Air Transport | | $ | 14,893 | | | $ | — | | | $ | — | | | $ | 14,893 | | |
| Alternative Energy | | | 25,223 | | | | — | | | | — | | | | 25,223 | | |
Asset Management &
Custodian | | | 3,996 | | | | — | | | | — | | | | 3,996 | | |
| Biotechnology | | | 11,352 | | | | — | | | | — | | | | 11,352 | | |
| Casinos & Gambling | | | 11,565 | | | | — | | | | — | | | | 11,565 | | |
| Chemicals: Diversified | | | 23,535 | | | | — | | | | — | | | | 23,535 | | |
Commercial Finance &
Mortgage Companies | | | 13,529 | | | | — | | | | — | | | | 13,529 | | |
| Commercial Services | | | 30,033 | | | | — | | | | — | | | | 30,033 | | |
Communications
Technology | | | 32,766 | | | | — | | | | — | | | | 32,766 | | |
Computer Services,
Software & Systems | | | 117,537 | | | | — | | | | 27,021 | | | | 144,558 | | |
| Computer Technology | | | 86,768 | | | | — | | | | — | | | | 86,768 | | |
| Consumer Lending | | | 11,626 | | | | — | | | | — | | | | 11,626 | | |
Diversified Financial
Services | | | 1,758 | | | | — | | | | — | | | | 1,758 | | |
| Diversified Media | | | 25,763 | | | | — | | | | — | | | | 25,763 | | |
| Diversified Retail | | | 106,154 | | | | — | | | | — | | | | 106,154 | | |
| Financial Data & Systems | | | 12,951 | | | | — | | | | — | | | | 12,951 | | |
| Insurance: Multi-Line | | | 2,086 | | | | — | | | | — | | | | 2,086 | | |
| Medical Equipment | | | 29,834 | | | | — | | | | — | | | | 29,834 | | |
Metals & Minerals:
Diversified | | | 8,771 | | | | — | | | | — | | | | 8,771 | | |
| Pharmaceuticals | | | 38,483 | | | | — | | | | — | | | | 38,483 | | |
Real Estate Investment
Trusts (REIT) | | | 27,525 | | | | — | | | | — | | | | 27,525 | | |
Recreational Vehicles &
Boats | | | 26,381 | | | | — | | | | — | | | | 26,381 | | |
| Restaurants | | | 25,472 | | | | — | | | | — | | | | 25,472 | | |
Securities Brokerage &
Services | | | 8,760 | | | | — | | | | — | | | | 8,760 | | |
| Investment Type | | Level 1
Unadjusted
quoted
prices
(000) | | Level 2
Other
significant
observable
inputs
(000) | | Level 3
Significant
unobservable
inputs
(000) | | Total
(000) | |
Semiconductors &
Components | | $ | 18,789 | | | $ | — | | | $ | — | | | $ | 18,789 | | |
Wholesale & International
Trade | | | 15,440 | | | | — | | | | — | | | | 15,440 | | |
| Total Common Stocks | | | 730,990 | | | | — | | | | 27,021 | | | | 758,011 | | |
Convertible Preferred
Stocks | | | — | | | | — | | | | 7,908 | | | | 7,908 | | |
| Short-Term Investment — | |
| Investment Company | | | 12,909 | | | | — | | | | — | | | | 12,909 | | |
| Total Assets | | $ | 743,899 | | | $ | — | | | $ | 34,929 | | | $ | 778,828 | | |
Transfers between investment levels may occur as the markets fluctuate and/or the availability of data used in an investment's valuation changes. The Portfolio recognizes transfers between the levels as of the end of the period. As of December 31, 2011, the Portfolio did not have any significant investments transfer between investment levels.
Following is a reconciliation of investments in which significant unobservable inputs (Level 3) were used in determining fair value.
| | | Common
Stocks
(000) | | Convertible
Preferred
Stocks
(000) | |
| Beginning Balance | | $ | 15,096 | | | $ | 4,355 | | |
| Purchases | | | 5,052 | | | | — | | |
| Sales | | | — | | | | — | | |
| Amortization of discount | | | — | | | | — | | |
| Transfers in | | | — | | | | — | | |
| Transfers out | | | — | | | | — | | |
| Change in unrealized appreciation (depreciation) | | | 6,873 | | | | 3,553 | | |
| Realized gains (losses) | | | — | | | | — | | |
| Ending Balance | | $ | 27,021 | | | $ | 7,908 | | |
Net change in unrealized appreciation/
depreciation from investments still held
as of December 31, 2011 | | $ | 6,873 | | | $ | 3,553 | | |
The accompanying notes are an integral part of the financial statements.
101
2011 Annual Report
December 31, 2011
Investment Overview (unaudited)
Insight Portfolio
The Insight Portfolio (the "Portfolio") seeks long-term capital appreciation.
Performance
For the period from inception on December 28, 2011 through December 31, 2011, the Portfolio had a total return based on net asset value per share of 0.60%, net of fees, for Class I shares. The Portfolio's Class I shares underperformed against its benchmark, the Russell 3000® Value Index (the "Index"), which returned 0.72% for the same period.
Factors Affecting Performance
• The Portfolio launched a few days prior to the close of the reporting period. Such a short time frame would not provide a meaningful performance analysis as short-term returns may not be indicative of the Portfolio's long-term performance potential.
Management Strategies
• We seek to invest primarily in established and cyclical franchise companies that we believe have strong name recognition, sustainable competitive advantages, and ample growth prospects, and are trading at an attractive discount to future cash flow generation capacity or asset value. We typically favor companies with the ability to generate attractive free cash flow yields. We utilize a bottom-up stock selection process, seeking attractive investments on an individual company basis. The companies we consider have market capitalizations within the range of companies included in the Russell 3000® Value Index (approximately $37 million to $386 billion as of November 30, 2011).
• We continue to focus on assessing company prospects over a three- to five-year time horizon and on owning a portfolio of high-quality companies with diverse business drivers not tied to a particular market environment.
Performance Compared to the Russell 3000® Value Index(1) and the Lipper Multi-Cap Value Funds Index(2)
| | | Period Ended December 31, 2011 | |
| | | Total Returns(3) | |
| | | One
Year | | Five
Years | | Ten
Years | | Cumulative
Since
Inception(5) | |
Portfolio — Class I Shares
w/o sales charges(4) | | | — | | | | — | | | | — | | | | 0.60 | % | |
| Russell 3000® Value Index | | | — | | | | — | | | | — | | | | 0.72 | | |
Lipper Multi-Cap Value
Funds Index | | | — | | | | — | | | | — | | | | 0.78 | | |
Portfolio — Class H Shares
w/o sales charges(4) | | | — | | | | — | | | | — | | | | 0.60 | | |
Portfolio — Class H Shares with
maximum 4.75% sales charges(4) | | | — | | | | — | | | | — | | | | –4.19 | | |
| Russell 3000® Value Index | | | — | | | | — | | | | — | | | | | | |
Lipper Multi-Cap Value
Funds Index | | | — | | | | — | | | | — | | | | 0.78 | | |
Portfolio — Class L Shares
w/o sales charges(4) | | | — | | | | — | | | | — | | | | 0.60 | | |
| Russell 3000® Value Index | | | — | | | | — | | | | — | | | | 0.72 | | |
Lipper Multi-Cap Value
Funds Index | | | — | | | | — | | | | — | | | | 0.78 | | |
Performance data quoted represents past performance, which is no guarantee of future results, and current performance may be lower or higher than the figures shown. Performance assumes that all dividends and distributions, if any, were reinvested. For the most recent month-end performance figures, please visit www.morganstanley.com/im. Investment return and principal value will fluctuate so that Portfolio shares, when redeemed, may be worth more or less than their original cost. Total returns do not reflect the deduction of taxes that a shareholder would pay on Portfolio distributions or the redemption of Portfolio shares. Performance of share classes will vary due to difference in expenses.
(1) The Russell 3000® Value Index measures the performance of those companies in the Russell 3000® Index with lower price-to-book ratios and lower forecasted growth values. The Russell 3000® Index measures the performance of the largest 3000 U.S. companies representing approximately 98% of the investable U.S. equity market. The Index is unmanaged and its returns do not include any sales charges or fees. Such costs would lower performance. It is not possible to invest directly in an index.
(2) The Lipper Multi-Cap Value Funds Index is an equally weighted performance index of the largest qualifying funds (based on net assets) in the Lipper Multi-Cap Value Funds classification. The Index, which is adjusted for capital gains distributions and income dividends, is unmanaged and should not be considered an investment. There are currently 30 funds represented in this Index. As of the date of this report, the Portfolio is in the Lipper Multi-Cap Value Funds classification.
(3) Total returns for the Portfolio reflect fees waived and expenses reimbursed, if applicable, by the Adviser. Without such waivers and reimbursements, total returns would have been lower. The fee waivers and/or expense reimbursements will continue for one year or until such time as the Fund's Board of Directors acts to discontinue all or a portion of such waivers and/or expense reimbursements when it deems that such action is appropriate.
(4) Commenced operations on December 28, 2011.
(5) For comparative purposes, average annual since inception returns listed for the Indexes refer to the inception date or initial offering of the respective share class of the Portfolio, not the inception of the Index. Returns for periods less than one year are not annualized.
102
2011 Annual Report
December 31, 2011
Investment Overview (unaudited) (cont'd)
Insight Portfolio
Portfolio Composition
| Classification | | Percentage of
Total Investments | |
| Short-Term Investments | | | 55.6 | % | |
| Other* | | | 37.7 | | |
| Insurance: Property-Casualty | | | 6.7 | | |
| Total Investments | | | 100.0 | % | |
* Industries representing less than 5% of total investments.
103
2011 Annual Report
December 31, 2011
Portfolio of Investments
Insight Portfolio
| | | Shares | | Value
(000) | |
| Common Stocks (79.3%) | |
| Beverage: Brewers & Distillers (6.0%) | |
| Anheuser-Busch InBev N.V. ADR | | | 273 | | | $ | 17 | | |
| Molson Coors Brewing Co. | | | 754 | | | | 33 | | |
| | | | 50 | | |
| Beverage: Soft Drinks (2.0%) | |
| PepsiCo, Inc. | | | 250 | | | | 17 | | |
| Chemicals: Diversified (7.8%) | |
| CF Industries Holdings, Inc. | | | 228 | | | | 33 | | |
| Mosaic Co. (The) | | | 634 | | | | 32 | | |
| | | | 65 | | |
| Commercial Services (2.0%) | |
| Leucadia National Corp. | | | 724 | | | | 17 | | |
| Communications Technology (7.8%) | |
| Motorola Solutions, Inc. | | | 1,404 | | | | 65 | | |
| Consumer Lending (6.0%) | |
| Berkshire Hathaway, Inc., Class B (a) | | | 430 | | | | 33 | | |
| Brown & Brown, Inc. | | | 741 | | | | 17 | | |
| | | | 50 | | |
| Diversified Materials & Processing (4.1%) | |
| Diana Containerships, Inc. (Marshall Islands) | | | 3,150 | | | | 17 | | |
| Fortune Brands Home & Security, Inc. (a) | | | 997 | | | | 17 | | |
| | | | 34 | | |
| Foods (6.0%) | |
| Nestle SA ADR (Switzerland) | | | 581 | | | | 33 | | |
| Sara Lee Corp. | | | 878 | | | | 17 | | |
| | | | 50 | | |
| Home Building (4.1%) | |
| Brookfield Residential Properties, Inc. (Canada) (a) | | | 2,205 | | | | 17 | | |
| NVR, Inc. (a) | | | 25 | | | | 17 | | |
| | | | 34 | | |
| Insurance: Property-Casualty (11.9%) | |
| Arch Capital Group Ltd. (a) | | | 441 | | | | 16 | | |
| Markel Corp. (a) | | | 80 | | | | 33 | | |
| Progressive Corp. (The) | | | 2,556 | | | | 50 | | |
| | | | 99 | | |
| Real Estate (3.8%) | |
| Howard Hughes Corp. (The) (a) | | | 369 | | | | 16 | | |
| Tejon Ranch Co. (a) | | | 657 | | | | 16 | | |
| | | | 32 | | |
| Real Estate Investment Trusts (REIT) (3.9%) | |
Brookfield Asset Management, Inc.,
Class A (Canada) | | | 1,213 | | | | 33 | | |
| Restaurants (7.8%) | |
| Carrols Restaurant Group, Inc. (a) | | | 1,436 | | | | 16 | | |
| PF Chang's China Bistro, Inc. | | | 1,578 | | | | 49 | | |
| | | | 65 | | |
| | | Shares | | Value
(000) | |
| Semiconductors & Components (6.1%) | |
| First Solar, Inc. (a) | | | 1,008 | | | $ | 34 | | |
| Koninklijke Philips Electronics N.V. (Netherlands) | | | 801 | | | | 17 | | |
| | | | 51 | | |
| Total Common Stocks (Cost $657) | | | 662 | | |
| Short-Term Investment (99.4%) | |
| Investment Company (99.4%) | |
Morgan Stanley Institutional Liquidity
Funds — Money Market Portfolio —
Institutional Class (See Note G-2)
(Cost $830) | | | 830,000 | | | | 830 | | |
| Total Investments (178.7%) (Cost $1,487) | | | 1,492 | | |
| Liabilities in Excess of Other Assets (-78.7%) | | | (657 | ) | |
| Net Assets (100.0%) | | $ | 835 | | |
(a) Non-income producing security.
ADR American Depositary Receipt.
Fair Value Measurement Information:
The following is a summary of the inputs used to value the Portfolio's investments as of December 31, 2011. (See Note A-9 to the financial statements for further information regarding fair value measurement.)
| Investment Type | | Level 1
Unadjusted
quoted
prices
(000) | | Level 2
Other
significant
observable
inputs
(000) | | Level 3
Significant
unobservable
inputs
(000) | | Total
(000) | |
| Assets: | | | | | | | | | |
| Common Stocks | | | | | | | | | |
Beverage: Brewers &
Distillers | | $ | 50 | | | $ | — | | | $ | — | | | $ | 50 | | |
| Beverage: Soft Drinks | | | 17 | | | | — | | | | — | | | | 17 | | |
| Chemicals: Diversified | | | 65 | | | | — | | | | — | | | | 65 | | |
| Commercial Services | | | 17 | | | | — | | | | — | | | | 17 | | |
Communications
Technology | | | 65 | | | | — | | | | — | | | | 65 | | |
| Consumer Lending | | | 50 | | | | — | | | | — | | | | 50 | | |
Diversified Materials &
Processing | | | 34 | | | | — | | | | — | | | | 34 | | |
| Foods | | | 50 | | | | — | | | | — | | | | 50 | | |
| Home Building | | | 34 | | | | — | | | | — | | | | 34 | | |
Insurance:
Property-Casualty | | | 99 | | | | — | | | | — | | | | 99 | | |
| Real Estate | | | 32 | | | | — | | | | — | | | | 32 | | |
Real Estate Investment
Trusts (REIT) | | | 33 | | | | — | | | | — | | | | 33 | | |
| Restaurants | | | 65 | | | | — | | | | — | | | | 65 | | |
Semiconductors &
Components | | | 51 | | | | — | | | | — | | | | 51 | | |
| Total Common Stocks | | | 662 | | | | — | | | | — | | | | 662 | | |
The accompanying notes are an integral part of the financial statements.
104
2011 Annual Report
December 31, 2011
Portfolio of Investments (cont'd)
Insight Portfolio
Fair Value Measurement Information: (cont'd)
| Investment Type | | Level 1
Unadjusted
quoted
prices
(000) | | Level 2
Other
significant
observable
inputs
(000) | | Level 3
Significant
unobservable
inputs
(000) | | Total
(000) | |
| Short-Term Investment — | |
| Investment Company | | $ | 830 | | | $ | — | | | $ | — | | | $ | 830 | | |
| Total Assets | | $ | 1,492 | | | $ | — | | | $ | — | | | $ | 1,492 | | |
Transfers between investment levels may occur as the markets fluctuate and/or the availability of data used in an investment's valuation changes. The Portfolio recognizes transfers between the levels as of the end of the period. As of December 31, 2011, the Portfolio did not have any significant investments transfer between investment levels.
The accompanying notes are an integral part of the financial statements.
105
2011 Annual Report
December 31, 2011
Investment Overview (unaudited)
Opportunity Portfolio
The Opportunity Portfolio (the "Portfolio") seeks long-term capital appreciation by investing primarily in established and emerging franchise companies with capitalizations within the range of companies included in the Russell 1000® Growth Index.
Performance
For the year ended December 31, 2011, the Portfolio had a total return based on net asset value and reinvestment of distributions per share of -0.46%, net of fees, for Class I shares. The Portfolio's Class I shares underperformed against its benchmark, the Russell 1000® Growth Index (the "Index"), which returned 2.64%.
Factors Affecting Performance
• Equity markets began 2011 on a relatively optimistic note but suffered a stream of disappointments as the year progressed. The broad market's relatively flat return (as measured by the S&P 500® Index) for the year overall masked its more significant gyrations, as investors reacted to the worsening debt crisis in Europe, political strife in the Middle East, the natural disasters and nuclear crisis in Japan, political infighting in the U.S. and the downgrade of the U.S.'s credit rating by Standard & Poor's. Developed world economies also looked weaker than expected — the U.S. economy was nearing its stall speed in the first half of 2011, while European economies were expected to fall into recession in 2012. Despite the barrage of negative news, the strength of U.S. corporate earnings remained a bright spot for investors during the year.
• Against this backdrop, investors' appetite for risk was diminished. This helped large-cap stocks outperform mid- and small-cap stocks (as measured by their respective Russell indexes) for the year ended December 31, 2011.
• Stock selection in the consumer discretionary sector was the largest detractor from relative performance during the period, primarily due to holdings in a Brazilian real estate developer, an online retailer, and a Chinese department store operator. Stock selection in producer durables also hurt relative performance, with weakness from several holdings in the transport and logistics industry. Stock selection in energy was unfavorable as well. A holding in an oil and gas production company was the main cause of relative losses within the sector.
• Stock selection in technology was a source of relative gains. Performance was led by positions in a personal computer, mobile communications, and media devices maker and a Chinese internet search provider (not represented in the Index). Stock selection and an overweight in financial services also added to relative returns, as holdings in several credit card companies performed well.
Management Strategies
• We look for high-quality growth companies that have these attributes: sustainable competitive advantages, business visibility, rising return on invested capital, free cash flow and a favorable risk/reward profile. In seeking these companies, we use intense fundamental research. Our emphasis is on secular growth, and as a result short-term market events are not as meaningful in the stock selection process.
106
2011 Annual Report
December 31, 2011
Investment Overview (unaudited) (cont'd)
Opportunity Portfolio

* Minimum Investment = $25,000
** Performance shown for the Portfolio's Class H shares reflects the performance of the Class A shares of the Predecessor Fund for periods prior to May 21, 2010 and has been restated to reflect the Portfolio's applicable sales charge.
In accordance with SEC regulations, Portfolio's performance shown assumes that all recurring fees (including management fees) were deducted and all dividends and distributions were reinvested. The performance of Class H shares will vary from the Class I, Class P and Class L shares based upon its different inception date and will be impacted by fees assessed to that class.
Performance Compared to the Russell 1000® Growth Index(1) and the Lipper Multi-Cap Growth Funds Index(2)
| | | Period Ended December 31, 2011 | |
| | | Total Returns(3) | |
| | | | | Average Annual | |
| | | One
Year | | Five
Years | | Ten
Years | | Since
Inception(5) | |
Portfolio — Class I Shares
w/o sales charges(4) | | | –0.46 | % | | | 5.16 | % | | | — | | | | 6.58 | % | |
| Russell 1000® Growth Index | | | 2.64 | | | | 2.50 | | | | — | | | | 3.79 | | |
Lipper Multi-Cap Growth
Funds Index | | | –4.02 | | | | 0.87 | | | | — | | | | 2.93 | | |
Portfolio — Class H Shares
w/o sales charges(4) | | | –0.73 | | | | 4.86 | | | | 3.85 | | | | 3.68 | | |
Portfolio — Class H Shares with
maximum 4.75% sales charges(4) | | | –5.45 | | | | 3.84 | | | | 3.34 | | | | 3.30 | | |
| Russell 1000® Growth Index | | | 2.64 | | | | 2.50 | | | | 2.60 | | | | 1.89 | | |
Lipper Multi-Cap Growth
Funds Index | | | –4.02 | | | | 0.87 | | | | 2.78 | | | | 2.60 | | |
Portfolio — Class L Shares
w/o sales charges(4) | | | –1.17 | | | | 4.18 | | | | 3.17 | | | | 2.97 | | |
| Russell 1000® Growth Index | | | 2.64 | | | | 2.50 | | | | 2.60 | | | | 1.89 | | |
Lipper Multi-Cap Growth
Funds Index | | | –4.02 | | | | 0.87 | | | | 2.78 | | | | 2.60 | | |
| | | Period Ended December 31, 2011 | |
| | | Total Returns(3) | |
| | | | | Average Annual | |
| | | One
Year | | Five
Years | | Ten
Years | | Since
Inception(5) | |
Portfolio — Class P Shares
w/o sales charges(4) | | | –0.72 | % | | | — | | | | — | | | | 14.44 | % | |
| Russell 1000® Growth Index | | | 2.64 | | | | — | | | | — | | | | 13.66 | | |
Lipper Multi-Cap Growth
Funds Index | | | –4.02 | | | | — | | | | — | | | | 10.47 | | |
Performance data quoted represents past performance, which is no guarantee of future results, and current performance may be lower or higher than the figures shown. Performance assumes that all dividends and distributions, if any, were reinvested. For the most recent month-end performance figures, please visit www.morganstanley.com/im. Investment return and principal value will fluctuate so that Portfolio shares, when redeemed, may be worth more or less than their original cost. Total returns do not reflect the deduction of taxes that a shareholder would pay on Portfolio distributions or the redemption of Portfolio shares. Performance of share classes will vary due to difference in sales charges and expenses.
(1) The Russell 1000® Growth Index measures the performance of the large-cap growth segment of the U.S. equity universe. It includes those Russell 1000® Index companies with higher price-to-book ratios and higher forecasted growth values. The Russell 1000® Growth Index is an index of approximately 1,000 of the largest U.S. companies based on a combination of market capitalization and current index membership. The Index is unmanaged and its returns do not include any sales charges or fees. Such costs would lower performance. It is not possible to invest directly in an index.
(2) The Lipper Multi-Cap Growth Funds Index is an equally weighted performance index of the largest qualifying funds (based on net assets) in the Lipper Multi-Cap Growth Funds Funds classification. The Index, which is adjusted for capital gains distributions and income dividends, is unmanaged and should not be considered an investment. There are currently 30 funds represented in this Index. As of the date of this report, the Portfolio was in the Lipper Multi-Cap Growth Funds classification.
(3) Total returns for the Portfolio reflect fees waived and expenses reimbursed, if applicable, by the Adviser. Without such waivers and reimbursements, total returns would have been lower. The fee waivers and/or expense reimbursements will continue for one year or until such time as the Board of Directors acts to discontinue all or a portion of such waivers and/or expense reimbursements when it deems that such action is appropriate.
(4) On May 21, 2010 Class A, Class B, Class C, and Class I shares of Van Kampen Equity Growth Fund ("the Predecessor Fund") were reorganized into Class H, Class H, Class L, and Class I shares of Morgan Stanley Equity Growth Portfolio ("the Portfolio"), respectively. Class H, Class L, and Class I shares' returns of the Portfolio will differ from the Predecessor Fund as they have different expenses. Performance shown for the Portfolio's Class I, Class H, and Class L shares reflects the performance of the shares of the Predecessor Fund for periods prior to May 21, 2010. The Class I shares of the Predecessor Fund commenced offering on August 12, 2005. Each of the Class A and Class C shares of the Predecessor Fund commenced operations on May 28, 1998. Class P shares commenced offering on May 21, 2010. Performance for Class H shares has been restated to reflect the Fund's applicable sales charge. In October 2010, the Morgan Stanley Equity Growth Portfolio changed its name to the Morgan Stanley Opportunity Portfolio.
(5) For comparative purposes, average annual since inception returns listed for the Indexes refer to the inception date or initial offering of the respective share class of the Portfolio, not the inception of the Index.
107
2011 Annual Report
December 31, 2011
Investment Overview (unaudited) (cont'd)
Opportunity Portfolio
Portfolio Composition
| Classification | | Percentage of
Total Investments | |
| Other* | | | 45.2 | % | |
| Computer Services, Software & Systems | | | 17.3 | | |
| Diversified Retail | | | 15.7 | | |
| Consumer Lending | | | 11.1 | | |
| Computer Technology | | | 10.7 | | |
| Total Investments | | | 100.0 | % | |
* Industries representing less than 5% of total investments.
108
2011 Annual Report
December 31, 2011
Portfolio of Investments
Opportunity Portfolio
| | | Shares | | Value
(000) | |
| Common Stocks (95.2%) | |
| Advertising Agencies (2.6%) | |
| Omnicom Group, Inc. | | | 141,329 | | | $ | 6,300 | | |
| Air Transport (1.4%) | |
| Expeditors International of Washington, Inc. | | | 81,941 | | | | 3,356 | | |
| Alternative Energy (2.1%) | |
| Ultra Petroleum Corp. (a) | | | 176,297 | | | | 5,224 | | |
| Asset Management & Custodian (1.7%) | |
CETIP SA - Balcao Organizado de
Ativos e Derivativos (Brazil) | | | 290,627 | | | | 4,199 | | |
| Casinos & Gambling (4.7%) | |
| Universal Entertainment Corp. (Japan) | | | 246,500 | | | | 6,818 | | |
| Wynn Resorts Ltd. | | | 42,168 | | | | 4,659 | | |
| | | | 11,477 | | |
| Chemicals: Diversified (2.8%) | |
| Monsanto Co. | | | 98,380 | | | | 6,893 | | |
| Commercial Services (0.4%) | |
China Merchants Holdings International
Co., Ltd. (China) (b) | | | 357,030 | | | | 1,037 | | |
| Communications Technology (1.8%) | |
| Corning, Inc. | | | 333,272 | | | | 4,326 | | |
| Computer Services, Software & Systems (17.5%) | |
| Baidu, Inc. ADR (China) (a) | | | 91,253 | | | | 10,628 | | |
| Facebook, Inc., Class B (a)(c)(d) | | | 338,054 | | | | 9,128 | | |
| Google, Inc., Class A (a) | | | 34,591 | | | | 22,342 | | |
| LinkedIn Corp., Class A (a) | | | 9,352 | | | | 589 | | |
| | | | 42,687 | | |
| Computer Technology (10.8%) | |
| Apple, Inc. (a) | | | 64,853 | | | | 26,265 | | |
| Consumer Lending (11.2%) | |
| CME Group, Inc. | | | 27,960 | | | | 6,813 | | |
| Mastercard, Inc., Class A | | | 30,458 | | | | 11,355 | | |
| Visa, Inc., Class A | | | 90,378 | | | | 9,176 | | |
| | | | 27,344 | | |
| Consumer Services: Miscellaneous (1.6%) | |
| Sun Art Retail Group Ltd. (Hong Kong) (a) | | | 3,106,500 | | | | 3,884 | | |
| Diversified Retail (15.8%) | |
| Abercrombie & Fitch Co., Class A | | | 75,566 | | | | 3,691 | | |
| Amazon.com, Inc. (a) | | | 129,464 | | | | 22,410 | | |
| Golden Eagle Retail Group Ltd. (China) (b) | | | 2,495,000 | | | | 5,275 | | |
| Priceline.com, Inc. (a) | | | 15,375 | | | | 7,191 | | |
| | | | 38,567 | | |
| Education Services (4.2%) | |
New Oriental Education & Technology
Group, Inc. ADR (China) (a) | | | 424,725 | | | | 10,215 | | |
| Home Building (1.8%) | |
| Brookfield Incorporacoes SA (Brazil) | | | 1,627,787 | | | | 4,320 | | |
| Insurance: Multi-Line (4.4%) | |
| Greenlight Capital Re Ltd., Class A (a) | | | 452,957 | | | | 10,721 | | |
| Metals & Minerals: Diversified (1.1%) | |
| Molycorp, Inc. (a) | | | 113,991 | | | | 2,734 | | |
| | | Shares | | Value
(000) | |
| Personal Care (1.4%) | |
| Procter & Gamble Co. (The) | | | 52,953 | | | $ | 3,533 | | |
| Real Estate Investment Trusts (REIT) (2.6%) | |
Brookfield Asset Management, Inc.,
Class A (Canada) | | | 229,060 | | | | 6,295 | | |
| Semiconductors & Components (1.2%) | |
| Marvell Technology Group Ltd. (a) | | | 217,843 | | | | 3,017 | | |
| Textiles Apparel & Shoes (1.4%) | |
| Prada SpA (Italy) (a) | | | 751,700 | | | | 3,402 | | |
| Truckers (2.7%) | |
| DSV A/S (Denmark) | | | 367,778 | | | | 6,596 | | |
| Total Common Stocks (Cost $199,323) | | | 232,392 | | |
| Convertible Preferred Stocks (1.7%) | |
| Alternative Energy (1.7%) | |
| Better Place, Inc. (a)(c)(d) (Cost $2,339) | | | 935,447 | | | | 4,247 | | |
| Participation Notes (3.3%) | |
| Beverage: Brewers & Distillers (3.3%) | |
Deutsche Bank AG, Kweichow Moutai Co.,
Ltd., Class A, Equity Linked Notes,
Zero Coupon, 3/4/21 (Cost $6,514) | | | 258,170 | | | | 7,929 | | |
| Short-Term Investment (0.7%) | |
| Investment Company (0.7%) | |
Morgan Stanley Institutional Liquidity
Funds — Money Market Portfolio —
Institutional Class (See Note G-2)
(Cost $1,625) | | | 1,624,829 | | | | 1,625 | | |
| Total Investments (100.9%) (Cost $209,801) | | | 246,193 | | |
| Liabilities in Excess of Other Assets (-0.9%) | | | (2,143 | ) | |
| Net Assets (100.0%) | | $ | 244,050 | | |
(a) Non-income producing security.
(b) Security trades on the Hong Kong exchange.
(c) At December 31, 2011, the Portfolio held fair valued securities valued at approximately $13,375,000, representing 5.5% of net assets. These securities have been fair valued as determined in good faith under procedures established by and under the general supervision of the Fund's Directors.
(d) Security has been deemed illiquid at December 31, 2011.
ADR American Depositary Receipt.
The accompanying notes are an integral part of the financial statements.
109
2011 Annual Report
December 31, 2011
Portfolio of Investments (cont'd)
Opportunity Portfolio
Fair Value Measurement Information:
The following is a summary of the inputs used to value the Portfolio's investments as of December 31, 2011. (See Note A-9 to the financial statements for further information regarding fair value measurement.)
| Investment Type | | Level 1
Unadjusted
quoted
prices
(000) | | Level 2
Other
significant
observable
inputs
(000) | | Level 3
Significant
unobservable
inputs
(000) | | Total
(000) | |
| Assets: | | | | | | | | | |
| Common Stocks | | | | | | | | | |
| Advertising Agencies | | $ | 6,300 | | | $ | — | | | $ | — | | | $ | 6,300 | | |
| Air Transport | | | 3,356 | | | | — | | | | — | | | | 3,356 | | |
| Alternative Energy | | | 5,224 | | | | — | | | | — | | | | 5,224 | | |
Asset Management &
Custodian | | | 4,199 | | | | — | | | | — | | | | 4,199 | | |
| Casinos & Gambling | | | 11,477 | | | | — | | | | — | | | | 11,477 | | |
| Chemicals: Diversified | | | 6,893 | | | | — | | | | — | | | | 6,893 | | |
| Commercial Services | | | 1,037 | | | | — | | | | — | | | | 1,037 | | |
Communications
Technology | | | 4,326 | | | | — | | | | — | | | | 4,326 | | |
Computer Services,
Software & Systems | | | 33,559 | | | | — | | | | 9,128 | | | | 42,687 | | |
| Computer Technology | | | 26,265 | | | | — | | | | — | | | | 26,265 | | |
| Consumer Lending | | | 27,344 | | | | — | | | | — | | | | 27,344 | | |
Consumer Services:
Miscellaneous | | | 3,884 | | | | — | | | | — | | | | 3,884 | | |
| Diversified Retail | | | 38,567 | | | | — | | | | — | | | | 38,567 | | |
| Education Services | | | 10,215 | | | | — | | | | — | | | | 10,215 | | |
| Home Building | | | 4,320 | | | | — | | | | — | | | | 4,320 | | |
| Insurance: Multi-Line | | | 10,721 | | | | — | | | | — | | | | 10,721 | | |
Metals & Minerals:
Diversified | | | 2,734 | | | | — | | | | — | | | | 2,734 | | |
| Personal Care | | | 3,533 | | | | — | | | | — | | | | 3,533 | | |
Real Estate Investment
Trusts (REIT) | | | 6,295 | | | | — | | | | — | | | | 6,295 | | |
Semiconductors &
Components | | | 3,017 | | | | — | | | | — | | | | 3,017 | | |
| Textiles Apparel & Shoes | | | 3,402 | | | | — | | | | — | | | | 3,402 | | |
| Truckers | | | 6,596 | | | | — | | | | — | | | | 6,596 | | |
| Total Common Stocks | | | 223,264 | | | | — | | | | 9,128 | | | | 232,392 | | |
Convertible Preferred
Stocks | | | — | | | | — | | | | 4,247 | | | | 4,247 | | |
| Participation Notes | | | — | | | | 7,929 | | | | — | | | | 7,929 | | |
| Short-Term Investment — | |
| Investment Company | | | 1,625 | | | | — | | | | — | | | | 1,625 | | |
| Total Assets | | $ | 224,889 | | | $ | 7,929 | | | $ | 13,375 | | | $ | 246,193 | | |
Transfers between investment levels may occur as the markets fluctuate and/or the availability of data used in an investment's valuation changes. The Portfolio recognizes transfers between the levels as of the end of the period. As of December 31, 2011, the Portfolio did not have any significant investments transfer between investment levels.
Following is a reconciliation of investments in which significant unobservable inputs (Level 3) were used in determining fair value.
| | | Common
Stocks
(000) | | Convertible
Preferred
Stocks
(000) | |
| Beginning Balance | | $ | — | | | $ | 2,339 | | |
| Purchases | | | 7,438 | | | | — | | |
| Sales | | | — | | | | — | | |
| Amortization of discount | | | — | | | | — | | |
| Transfers in | | | — | | | | — | | |
| Transfers out | | | — | | | | — | | |
| Change in unrealized appreciation (depreciation) | | | 1,690 | | | | 1,908 | | |
| Realized gains (losses) | | | — | | | | — | | |
| Ending Balance | | $ | 9,128 | | | $ | 4,247 | | |
Net change in unrealized appreciation/
depreciation from investments still held
as of December 31, 2011 | | $ | 1,690 | | | $ | 1,908 | | |
The accompanying notes are an integral part of the financial statements.
110
2011 Annual Report
December 31, 2011
Investment Overview (unaudited)
Small Company Growth Portfolio
The Small Company Growth Portfolio (the "Portfolio") seeks long-term capital appreciation by investing primarily in growth-oriented equity securities of small capitalization companies.
Performance
For the year ended December 31, 2011, the Portfolio had a total return based on net asset value and reinvestment of distributions per share of -9.12%, net of fees, for Class I shares. The Portfolio's Class I shares underperformed against its benchmark, the Russell 2000® Growth Index (the "Index"), which returned -2.91%.
Factors Affecting Performance
• Equity markets began 2011 on a relatively optimistic note but suffered a stream of disappointments as the year progressed. The broad market's relatively flat return (as measured by the S&P 500® Index) for the year overall masked its more significant gyrations, as investors reacted to the worsening debt crisis in Europe, political strife in the Middle East, the natural disasters and nuclear crisis in Japan, political infighting in the U.S. and the downgrade of the U.S.'s credit rating by Standard & Poor's. Developed world economies also looked weaker than expected — the U.S. economy was nearing its stall speed in the first half of 2011, while European economies were expected to fall into recession in 2012. Despite the barrage of negative news, the strength of U.S. corporate earnings remained a bright spot for investors during the year.
• Against this backdrop, investors' appetite for risk was diminished. As such, mid- and small-cap stocks underperformed large-cap stocks (as measured by their respective Russell indexes) for the year ended December 31, 2011.
• Within the Portfolio, the consumer discretionary sector was the largest detractor from relative performance, due to the negative impact of stock selection and an overweight in the sector. Stocks in the sector faced a challenging environment during the period, given the erosion of investor confidence in the economy's prospects. Positions in diversified retail, specialty retail, home building, and restaurants were among the main detractors in the sector.
• Stock selection in the materials and processing sector was disadvantageous to relative performance, as was an overweight in the sector. A position in a rare earths producer was the largest drag on returns.
• The financial services sector was another area of weakness. Holdings in an independent investment bank, a financial data provider, and a portfolio management services provider diminished relative returns.
• In contrast, the utilities sector was a positive contributor to relative returns during the period. Within the sector, the Portfolio held only two stocks and both posted gains during the period.
• Positive relative performance also came from the energy sector, with good results from an oil and gas exploration and production company. An underweight in the sector was beneficial to relative results as well.
Management Strategies
• We look for high-quality growth companies that have these attributes: sustainable competitive advantages, business visibility, rising return on invested capital, free cash flow and a favorable risk/reward profile. In seeking these companies, we use intense fundamental research. Our emphasis is on secular growth, and as a result, short-term market events are not as meaningful in the stock selection process.
111
2011 Annual Report
December 31, 2011
Investment Overview (unaudited) (cont'd)
Small Company Growth Portfolio
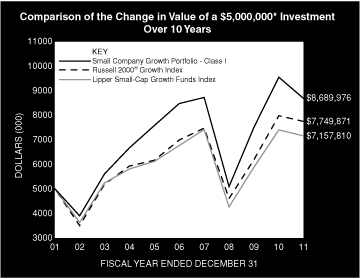
* Minimum Investment
In accordance with SEC regulations, Portfolio's performance shown assumes that all recurring fees (including management fees) were deducted and all dividends and distributions were reinvested. The performance of Class P, Class H, and Class L shares will vary from the Class I shares based upon different inception dates and will be negatively impacted by additional fees assessed to these classes.
Performance Compared to the Russell 2000® Growth Index(1) and the Lipper Small-Cap Growth Funds Index(2)
| | | Period Ended December 31, 2011 | |
| | | Total Returns(3) | |
| | | | | Average Annual | |
| | | One
Year | | Five
Years | | Ten
Years | | Since
Inception(7) | |
Portfolio — Class I Shares
w/o sales charges(4) | | | –9.12 | % | | | 0.49 | % | | | 5.68 | % | | | 10.39 | % | |
| Russell 2000® Growth Index | | | –2.91 | | | | 2.09 | | | | 4.48 | | | | 6.40 | | |
Lipper Small-Cap Growth
Funds Index | | | –3.40 | | | | 1.14 | | | | 3.65 | | | | 8.30 | | |
Portfolio — Class P Shares
w/o sales charges(5) | | | –9.28 | | | | 0.24 | | | | 5.42 | | | | 8.99 | | |
| Russell 2000® Growth Index | | | –2.91 | | | | 2.09 | | | | 4.48 | | | | 4.38 | | |
Lipper Small-Cap Growth
Funds Index | | | –3.40 | | | | 1.14 | | | | 3.65 | | | | 5.74 | | |
Portfolio — Class H Shares
w/o sales charges(6) | | | — | | | | — | | | | — | | | | –3.46 | | |
Portfolio — Class H Shares
with maximum 4.75%
sales charges(6) | | | — | | | | — | | | | — | | | | –8.04 | | |
| Russell 2000® Growth Index | | | — | | | | — | | | | — | | | | –1.26 | | |
Lipper Small-Cap Growth
Funds Index | | | — | | | | — | | | | — | | | | –1.71 | | |
Portfolio — Class L Shares
w/o sales charges(6) | | | — | | | | — | | | | — | | | | –3.54 | | |
| Russell 2000® Growth Index | | | — | | | | — | | | | — | | | | –1.26 | | |
Lipper Small-Cap Growth
Funds Index | | | — | | | | — | | | | — | | | | –1.71 | | |
Performance data quoted represents past performance, which is no guarantee of future results, and current performance may be lower or higher than the figures shown. Performance assumes that all dividends and distributions, if any, were reinvested. For the most recent month-end performance figures, please visit www.morganstanley.com/im. Investment return and principal value will fluctuate so that Portfolio shares, when redeemed, may be worth more or less than their original cost. Total returns do not reflect the deduction of taxes that a shareholder would pay on Portfolio distributions or the redemption of Portfolio shares. Performance of share classes will vary due to difference in expenses.
(1) The Russell 2000® Growth Index measures the performance of the small-cap growth segment of the U.S. equity universe. It includes those Russell 2000® Index companies with higher price-to-book ratios and higher forecasted growth values. The Russell 2000® Index is a subset of the Russell 3000® Index representing approximately 10% of the total market capitalization of that index. It includes approximately 2,000 of the smallest securities based on a combination of their market capitalization and current index membership. The Index is unmanaged and its returns do not include any sales charges or fees. Such costs would lower performance. It is not possible to invest directly in an index.
(2) The Lipper Small-Cap Growth Funds Index is an equally weighted performance index of the largest qualifying funds (based on net assets) in the Lipper Small-Cap Growth Funds classification. The Index, which is adjusted for capital gains distributions and income dividends, is unmanaged and should not be considered an investment. There are currently 30 funds represented in this Index. As of the date of this report, the Portfolio is in the Lipper Small-Cap Growth Funds classification.
(3) Total returns for the Portfolio reflect fees waived and expenses reimbursed, if applicable, by the Adviser. Without such waivers and reimbursements, total returns would have been lower. The fee waivers and/or expense reimbursements will continue for one year or until such time as the Fund's Board of Directors acts to discontinue all or a portion of such waivers and/or expense reimbursements when it deems that such action is appropriate.
(4) Commenced operations on November 1, 1989.
(5) Commenced offering on January 2, 1996.
(6) Commenced offering on November 11, 2011.
(7) For comparative purposes, average annual since inception returns listed for the Indexes refer to the inception date or initial offering of the respective share class of the Portfolio, not the inception of the Index. Returns for periods less than one year are not annualized.
Portfolio Composition
| Classification | | Percentage of
Total Investments | |
| Other* | | | 71.7 | % | |
| Commercial Services | | | 14.1 | | |
| Computer Services, Software & Systems | | | 8.9 | | |
| Utilities: Electrical | | | 5.3 | | |
| Total Investments | | | 100.0 | % | |
* Industries representing less than 5% of total investments.
112
2011 Annual Report
December 31, 2011
Portfolio of Investments
Small Company Growth Portfolio
| | | Shares | | Value
(000) | |
| Common Stocks (93.4%) | |
| Advertising Agencies (2.2%) | |
| Lamar Advertising Co., Class A (a) | | | 1,110,961 | | | $ | 30,551 | | |
| Asset Management & Custodian (2.5%) | |
CETIP SA - Balcao Organizado de
Ativos e Derivativos (Brazil) | | | 779,119 | | | | 11,257 | | |
| Greenhill & Co., Inc. | | | 630,516 | | | | 22,932 | | |
| | | | 34,189 | | |
| Banks: Diversified (1.6%) | |
| Financial Engines, Inc. (a) | | | 1,009,168 | | | | 22,535 | | |
| Biotechnology (1.0%) | |
| Abcam PLC (United Kingdom) | | | 2,366,278 | | | | 13,413 | | |
| Casinos & Gambling (1.5%) | |
| Lakes Entertainment, Inc. (a) | | | 628,322 | | | | 1,181 | | |
| Universal Entertainment Corp. (Japan) | | | 724,800 | | | | 20,048 | | |
| | | | 21,229 | | |
| Cement (1.6%) | |
| Eagle Materials, Inc. | | | 872,333 | | | | 22,384 | | |
| Chemicals: Diversified (3.7%) | |
| Intrepid Potash, Inc. (a) | | | 752,868 | | | | 17,038 | | |
| Rockwood Holdings, Inc. (a) | | | 883,059 | | | | 34,766 | | |
| | | | 51,804 | | |
| Commercial Services (14.2%) | |
| Advisory Board Co. (The) (a) | | | 909,986 | | | | 67,530 | | |
| Corporate Executive Board Co. (The) | | | 1,142,695 | | | | 43,537 | | |
| CoStar Group, Inc. (a) | | | 781,559 | | | | 52,153 | | |
| MercadoLibre, Inc. (Brazil) | | | 428,541 | | | | 34,086 | | |
| | | | 197,306 | | |
| Computer Services, Software & Systems (8.9%) | |
| MakeMyTrip Ltd. (India) (a) | | | 1,005,771 | | | | 24,179 | | |
| NetSuite, Inc. (a) | | | 1,104,253 | | | | 44,777 | | |
| OpenTable, Inc. (a) | | | 734,959 | | | | 28,759 | | |
| Solera Holdings, Inc. | | | 596,714 | | | | 26,578 | | |
| | | | 124,293 | | |
| Computer Technology (3.2%) | |
| Bankrate, Inc. (a) | | | 1,331,969 | | | | 28,637 | | |
| Youku.com, Inc. ADR (China) (a) | | | 706,488 | | | | 11,071 | | |
| Zillow, Inc. (a) | | | 217,045 | | | | 4,879 | | |
| | | | 44,587 | | |
| Consumer Electronics (1.0%) | |
| Sohu.com, Inc. (China) (a) | | | 273,100 | | | | 13,655 | | |
| Diversified Retail (4.8%) | |
| Blue Nile, Inc. (a) | | | 875,361 | | | | 35,785 | | |
| Citi Trends, Inc. (a) | | | 707,845 | | | | 6,215 | | |
| Pricesmart, Inc. | | | 200,817 | | | | 13,975 | | |
| Shutterfly, Inc. (a) | | | 447,014 | | | | 10,174 | | |
| | | | 66,149 | | |
| Electronic Components (1.1%) | |
| Cogent Communications Group, Inc. (a) | | | 877,368 | | | | 14,819 | | |
| | | Shares | | Value
(000) | |
| Entertainment (2.6%) | |
| Vail Resorts, Inc. | | | 844,051 | | | $ | 35,754 | | |
| Foods (0.9%) | |
Country Style Cooking Restaurant
Chain Co., Ltd. ADR (China) (a) | | | 765,590 | | | | 5,642 | | |
| Ocado Group PLC (United Kingdom) (a) | | | 8,345,355 | | | | 7,051 | | |
| | | | 12,693 | | |
| Health Care Facilities (0.1%) | |
| LCA-Vision, Inc. (a) | | | 698,269 | | | | 2,025 | | |
| Health Care Management Services (2.8%) | |
| HMS Holdings Corp. (a) | | | 1,208,455 | | | | 38,646 | | |
| Health Care Services (3.1%) | |
| athenahealth, Inc. (a) | | | 870,927 | | | | 42,780 | | |
| Home Building (0.8%) | |
| Brookfield Incorporacoes SA (Brazil) | | | 4,440,810 | | | | 11,785 | | |
| Insurance: Multi-Line (2.5%) | |
| Greenlight Capital Re Ltd., Class A (a) | | | 1,269,160 | | | | 30,041 | | |
| Pico Holdings, Inc. (a) | | | 257,534 | | | | 5,300 | | |
| | | | 35,341 | | |
| Medical & Dental Instruments & Supplies (3.7%) | |
| Techne Corp. | | | 764,633 | | | | 52,194 | | |
| Medical Services (1.8%) | |
| Accretive Health, Inc. (a) | | | 860,651 | | | | 19,778 | | |
| Zeltiq Aesthetics, Inc. (a) | | | 494,201 | | | | 5,614 | | |
| | | | 25,392 | | |
| Metals & Minerals: Diversified (2.9%) | |
| Lynas Corp. Ltd. (Australia) (a) | | | 37,612,956 | | | | 40,202 | | |
| Oil Well Equipment & Services (1.5%) | |
| Oasis Petroleum, Inc. (a) | | | 704,486 | | | | 20,494 | | |
| Pharmaceuticals (2.7%) | |
| Gen-Probe, Inc. (a) | | | 349,349 | | | | 20,654 | | |
| Ironwood Pharmaceuticals, Inc. (a) | | | 1,372,605 | | | | 16,430 | | |
| | | | 37,084 | | |
| Printing and Copying Services (1.1%) | |
| VistaPrint N.V. (a) | | | 479,589 | | | | 14,675 | | |
| Publishing (2.0%) | |
| Morningstar, Inc. | | | 473,458 | | | | 28,147 | | |
| Restaurants (4.4%) | |
| Dunkin' Brands Group, Inc. (a) | | | 735,951 | | | | 18,384 | | |
| PF Chang's China Bistro, Inc. | | | 1,396,466 | | | | 43,165 | | |
| | | | 61,549 | | |
| Scientific Instruments: Pollution Control (1.4%) | |
| Covanta Holding Corp. | | | 1,420,915 | | | | 19,452 | | |
| Semiconductors & Components (1.7%) | |
| Tessera Technologies, Inc. (a) | | | 1,380,539 | | | | 23,124 | | |
| Technology: Miscellaneous (1.2%) | |
| iRobot Corp. (a) | | | 572,862 | | | | 17,100 | | |
The accompanying notes are an integral part of the financial statements.
113
2011 Annual Report
December 31, 2011
Portfolio of Investments (cont'd)
Small Company Growth Portfolio
| | | Shares | | Value
(000) | |
| Telecommunications Equipment (2.3%) | |
| Angie's List, Inc. (a) | | | 1,357,431 | | | $ | 21,854 | | |
| Pandora Media, Inc. (a) | | | 1,027,246 | | | | 10,283 | | |
| | | | 32,137 | | |
| Truckers (1.3%) | |
| LLX Logistica SA (Brazil) (a) | | | 10,010,019 | | | | 18,085 | | |
| Utilities: Electrical (5.3%) | |
| AET&D Holdings No 1 Ltd. (Australia) (a)(b)(c) | | | 6,682,555 | | | | — | | |
| Brookfield Infrastructure Partners LP (Canada) | | | 2,662,170 | | | | 73,742 | | |
| | | | 73,742 | | |
| Total Common Stocks (Cost $1,135,958) | | | 1,299,315 | | |
| Preferred Stocks (0.6%) | |
| Health Care Services (0.5%) | |
| Castlight Health, Inc. (a)(b)(c) | | | 1,796,926 | | | | 7,387 | | |
| Technology: Miscellaneous (0.1%) | |
| Glam Media, Inc. Series M-1 (a)(b)(c) | | | 361,920 | | | | 1,875 | | |
| Glam Media, Inc. Escrow Series M-1 (a)(b)(c) | | | 51,703 | | | | 174 | | |
| | | | 2,049 | | |
| Total Preferred Stocks (Cost $13,342) | | | 9,436 | | |
| Convertible Preferred Stocks (4.3%) | |
| Alternative Energy (1.1%) | |
| Better Place, Inc. (a)(b)(c) | | | 3,465,201 | | | | 15,732 | | |
| Computer Services, Software & Systems (2.8%) | |
| Twitter, Inc. Series E (a)(b)(c) | | | 2,259,658 | | | | 36,358 | | |
| Workday, Inc. (a)(b)(c) | | | 159,335 | | | | 2,113 | | |
| | | | 38,471 | | |
| Computer Technology (0.0%) | |
| Youku.com, Inc., Class A (China) (a)(b)(c) | | | 1 | | | | — | @ | |
| Consumer Services: Miscellaneous (0.4%) | |
| Xoom Corp. Series F (a)(b)(c) | | | 2,610,922 | | | | 6,005 | | |
| Total Convertible Preferred Stocks (Cost $24,268) | | | 60,208 | | |
| | | Face
Amount
(000) | | | |
| Promissory Notes (0.1%) | |
| Technology: Miscellaneous (0.1%) | |
Glam Media, Inc.
9.00%, 12/3/13 (a)(b)(c) | | $ | 793 | | | | 792 | | |
Glam Media, Inc. Escrow
9.00%, 12/3/13 (a)(b)(c) | | | 113 | | | | 73 | | |
| Total Promissory Notes (Cost $2,515) | | | 865 | | |
| | | Shares | | | |
| Short-Term Investment (2.3%) | |
| Investment Company (2.3%) | |
Morgan Stanley Institutional Liquidity
Funds — Money Market Portfolio —
Institutional Class (See Note G-2)
(Cost $31,544) | | | 31,543,629 | | | | 31,544 | | |
| Total Investments (100.7%) (Cost $1,207,627) | | | 1,401,368 | | |
| Liabilities in Excess of Other Assets (-0.7%) | | | (10,325 | ) | |
| Net Assets (100.0%) | | $ | 1,391,043 | | |
(a) Non-income producing security.
(b) At December 31, 2011, the Portfolio held fair valued securities valued at approximately $70,509,000, representing 5.1% of net assets. These securities have been fair valued as determined in good faith under procedures established by and under the general supervision of the Fund's Directors.
(c) Security has been deemed illiquid at December 31, 2011.
@ Value is less than $500.
ADR American Depositary Receipt.
Fair Value Measurement Information:
The following is a summary of the inputs used to value the Portfolio's investments as of December 31, 2011. (See Note A-9 to the financial statements for further information regarding fair value measurement.)
| Investment Type | | Level 1
Unadjusted
quoted
prices
(000) | | Level 2
Other
significant
observable
inputs
(000) | | Level 3
Significant
unobservable
inputs
(000) | | Total
(000) | |
| Assets: | | | | | | | | | |
| Common Stocks | | | | | | | | | |
| Advertising Agencies | | $ | 30,551 | | | $ | — | | | $ | — | | | $ | 30,551 | | |
Asset Management &
Custodian | | | 34,189 | | | | — | | | | — | | | | 34,189 | | |
| Banks: Diversified | | | 22,535 | | | | — | | | | — | | | | 22,535 | | |
| Biotechnology | | | 13,413 | | | | — | | | | — | | | | 13,413 | | |
| Casinos & Gambling | | | 21,229 | | | | — | | | | — | | | | 21,229 | | |
| Cement | | | 22,384 | | | | — | | | | — | | | | 22,384 | | |
| Chemicals: Diversified | | | 51,804 | | | | — | | | | — | | | | 51,804 | | |
| Commercial Services | | | 197,306 | | | | — | | | | — | | | | 197,306 | | |
Computer Services,
Software & Systems | | | 124,293 | | | | — | | | | — | | | | 124,293 | | |
| Computer Technology | | | 44,587 | | | | — | | | | — | | | | 44,587 | | |
| Consumer Electronics | | | 13,655 | | | | — | | | | — | | | | 13,655 | | |
| Diversified Retail | | | 66,149 | | | | — | | | | — | | | | 66,149 | | |
| Electronic Components | | | 14,819 | | | | — | | | | — | | | | 14,819 | | |
| Entertainment | | | 35,754 | | | | — | | | | — | | | | 35,754 | | |
| Foods | | | 12,693 | | | | — | | | | — | | | | 12,693 | | |
| Health Care Facilities | | | 2,025 | | | | — | | | | — | | | | 2,025 | | |
Health Care Management
Services | | | 38,646 | | | | — | | | | — | | | | 38,646 | | |
| Health Care Services | | | 42,780 | | | | — | | | | — | | | | 42,780 | | |
| Home Building | | | 11,785 | | | | — | | | | — | | | | 11,785 | | |
| Insurance: Multi-Line | | | 35,341 | | | | — | | | | — | | | | 35,341 | | |
Medical & Dental
Instruments & Supplies | | | 52,194 | | | | — | | | | — | | | | 52,194 | | |
| Medical Services | | | 25,392 | | | | — | | | | — | | | | 25,392 | | |
Metals & Minerals:
Diversified | | | 40,202 | | | | — | | | | — | | | | 40,202 | | |
Oil Well Equipment &
Services | | | 20,494 | | | | — | | | | — | | | | 20,494 | | |
| Pharmaceuticals | | | 37,084 | | | | — | | | | — | | | | 37,084 | | |
Printing and Copying
Services | | | 14,675 | | | | — | | | | — | | | | 14,675 | | |
| Publishing | | | 28,147 | | | | — | | | | — | | | | 28,147 | | |
| Restaurants | | | 61,549 | | | | — | | | | — | | | | 61,549 | | |
The accompanying notes are an integral part of the financial statements.
114
2011 Annual Report
December 31, 2011
Portfolio of Investments (cont'd)
Small Company Growth Portfolio
Fair Value Measurement Information: (cont'd)
| Investment Type | | Level 1
Unadjusted
quoted
prices
(000) | | Level 2
Other
significant
observable
inputs
(000) | | Level 3
Significant
unobservable
inputs
(000) | | Total
(000) | |
| Common Stocks (cont'd) | | | | | | | | | |
Scientific Instruments:
Pollution Control | | $ | 19,452 | | | $ | — | | | $ | — | | | $ | 19,452 | | |
Semiconductors &
Components | | | 23,124 | | | | — | | | | — | | | | 23,124 | | |
Technology:
Miscellaneous | | | 17,100 | | | | — | | | | — | | | | 17,100 | | |
Telecommunications
Equipment | | | 32,137 | | | | — | | | | — | | | | 32,137 | | |
| Truckers | | | 18,085 | | | | — | | | | — | | | | 18,085 | | |
| Utilities: Electrical | | | 73,742 | | | | — | | | | — | † | | | 73,742 | | |
| Total Common Stocks | | | 1,299,315 | | | | — | | | | — | † | | | 1,299,315 | | |
| Preferred Stocks | | | — | | | | — | | | | 9,436 | | | | 9,436 | | |
Convertible Preferred
Stocks | | | — | | | | — | | | | 60,208 | | | | 60,208 | | |
| Promissory Notes | | | — | | | | — | | | | 865 | | | | 865 | | |
| Short-Term Investment — | |
| Investment Company | | | 31,544 | | | | — | | | | — | | | | 31,544 | | |
| Total Assets | | $ | 1,330,859 | | | $ | — | | | $ | 70,509 | † | | $ | 1,401,368 | | |
Transfers between investment levels may occur as the markets fluctuate and/or the availability of data used in an investment's valuation changes. The Portfolio recognizes transfers between the levels as of the end of the period. As of December 31, 2011, the Portfolio did not have any significant investments transfer between investment levels.
Following is a reconciliation of investments in which significant unobservable inputs (Level 3) were used in determining fair value.
| | | Common
Stocks
(000) | | Preferred
Stocks
(000) | | Convertible
Preferred
Stocks
(000) | | Promissory
Notes
(000) | |
| Beginning Balance | | $ | — | † | | $ | 21,745 | | | $ | 61,345 | | | $ | — | | |
| Purchases | | | — | | | | 6,325 | | | | 2,297 | | | | 2,515 | | |
| Sales | | | — | | | | (15,795 | ) | | | (16,234 | ) | | | — | | |
| Amortization of discount | | | — | | | | — | | | | — | | | | — | | |
| Transfers in | | | — | | | | — | | | | — | | | | — | | |
| Transfers out | | | — | | | | — | | | | — | | | | — | | |
Change in unrealized
appreciation
(depreciation) | | | — | | | | (2,839 | ) | | | 5,534 | | | | (1,650 | ) | |
| Realized gains (losses) | | | — | | | | — | | | | 7,266 | | | | — | | |
| Ending Balance | | $ | — | † | | $ | 9,436 | | | $ | 60,208 | | | $ | 865 | | |
Net change in unrealized
appreciation/depreciation
from investments still held
as of December 31, 2011 | | $ | — | | | $ | (3,906 | ) | | $ | 5,534 | | | $ | (1,650 | ) | |
† Includes one or more securities which are valued at zero.
The accompanying notes are an integral part of the financial statements.
115
2011 Annual Report
December 31, 2011
Investment Overview (unaudited)
U.S. Real Estate Portfolio
The U.S. Real Estate Portfolio (the "Portfolio") seeks to provide above average current income and long-term capital appreciation by investing primarily in equity securities of companies in the U.S. real estate industry, including real estate investment trusts ("REITs").
Performance
For the year ended December 31, 2011, the Portfolio had a total return based on net asset value and reinvestment of distributions per share of 5.57%, net of fees, for Class I shares. The Portfolio's Class I shares underperformed against its benchmark, the FTSE NAREIT Equity REITs Index (the "Index"), which returned 8.29%, and outperformed the S&P 500® Index, which returned 2.11%.
Factors Affecting Performance
• The real estate investment trust (REIT) market gained 8.29% in the 12-month period ending December 31, 2011, as measured by the Index. Movements in REIT share prices appeared to be most influenced by the equity market. REITs rallied in the first half of the year, but meaningfully declined in the third quarter on investor concerns with regard to prospects for a double-dip recession in the U.S. as well as a number of global concerns, particularly the European sovereign debt crisis and the risk of a hard landing scenario in China. Subsequently, REITs rallied in the fourth quarter, particularly in October as concerns about these factors eased.
• Among the major U.S. REIT sectors, the apartment and retail sectors outperformed and the office sector underperformed the Index. The office sector was the weakest performer in 2011 among the major sectors. The companies with exposure to suburban office assets were significant laggards. Apartment companies posted the best returns among the major sectors for the full year, as the companies provided a strong outlook for multifamily operating fundamentals even in the face of a slow U.S. economy and sluggish job growth. The retail sector outperformed, with the malls significantly outperforming the shopping centers, as a result of continued strong performance by owners of high-end malls. Among the smaller sectors, the storage sector posted the best performance for the full year. The health care sector also outperformed despite being traditionally viewed as a more defensive sector due to its long-term net lease structure. The weakest performer was the hotel sector, which was negatively impacted by concerns with regard to a weakening economy, despite the companies continuing to post attractive operating results. The industrial sector also underperformed due to concerns about weaker tenant demand.
• The Portfolio underperformed the Index for the period. Bottom-up stock selection detracted from the Portfolio's relative performance while top-down sector allocation performed in line with the Index. Stock selection was especially strong in the mall and office sectors; this was offset by the negative impact of stock selection in the diversified and health care sectors. From a top-down perspective, the Portfolio benefited from the underweight to the industrial sector, while the overweight to the hotel sector detracted.
Management Strategies
• We have maintained our core investment philosophy as a real estate value investor. This results in the ownership of stocks whose share prices we believe provide real estate exposure at the best valuation relative to their underlying asset values. We continue to focus on relative implied valuations as a key metric. Our company-specific research leads us to an overweighting in the Portfolio to a group of companies that are focused in the ownership of upscale urban hotels and to a number of out-of-favor companies, as well as an underweighting to companies concentrated in the ownership of suburban office, health care and industrial assets.
• Our outlook for the REIT market is based on two key factors: private market pricing for underlying real estate assets and public market pricing for the securities. Assuming asset values for high-quality assets are approximately 10% below their all-time peak levels achieved in early 2007, which represents a 50% improvement from trough levels, the REIT market ended the period at an approximate 10% premium to net asset value (NAV). This valuation is comparable to the historical average premium for the REIT market.
116
2011 Annual Report
December 31, 2011
Investment Overview (unaudited) (cont'd)
U.S. Real Estate Portfolio
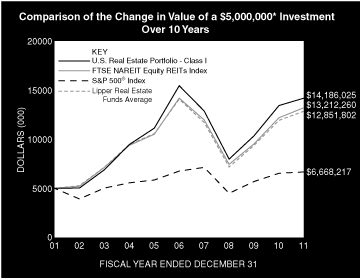
* Minimum Investment
In accordance with SEC regulations, Portfolio's performance shown assumes that all recurring fees (including management fees) were deducted and all dividends and distributions were reinvested. The performance of Class P, Class H, and Class L shares will vary from the Class I shares based upon different inception dates and will be negatively impacted by additional fees assessed to these classes.
Performance Compared to the FTSE NAREIT Equity REITs Index(1), the S&P 500® Index(2), and the Lipper Real Estate Funds Average(3)
| | | Period Ended December 31, 2011 | |
| | | Total Returns(4) | |
| | | | | Average Annual | |
| | | One
Year | | Five
Years | | Ten
Years | | Since
Inception(8) | |
Portfolio — Class I Shares
w/o sales charges(5) | | | 5.57 | % | | | –1.70 | % | | | 10.99 | % | | | 12.69 | % | |
| FTSE NAREIT Equity REITs Index | | | 8.29 | | | | –1.42 | | | | 10.20 | | | | 10.77 | | |
| S&P 500® Index | | | 2.11 | | | | –0.25 | | | | 2.92 | | | | 7.75 | | |
Lipper Real Estate
Funds Average | | | 7.64 | | | | –1.81 | | | | 9.69 | | | | 10.92 | | |
Portfolio — Class P Shares
w/o sales charges(6) | | | 5.26 | | | | –1.97 | | | | 10.70 | | | | 11.71 | | |
| FTSE NAREIT Equity REITs Index | | | 8.29 | | | | –1.42 | | | | 10.20 | | | | 10.40 | | |
| S&P 500® Index | | | 2.11 | | | | –0.25 | | | | 2.92 | | | | 6.42 | | |
Lipper Real Estate
Funds Average | | | 7.64 | | | | –1.81 | | | | 9.69 | | | | 10.36 | | |
Portfolio — Class H Shares
w/o sales charges(7) | | | — | | | | — | | | | — | | | | 1.24 | | |
Portfolio — Class H Shares
with maximum 4.75%
sales charges(7) | | | — | | | | — | | | | — | | | | –3.54 | | |
| FTSE NAREIT Equity REITs Index | | | — | | | | — | | | | — | | | | 2.25 | | |
| S&P 500® Index | | | — | | | | — | | | | — | | | | –0.16 | | |
| Lipper Real Estate Funds Average | | | — | | | | — | | | | — | | | | 1.99 | | |
Portfolio — Class L Shares
w/o sales charges(7) | | | — | | | | — | | | | — | | | | 1.17 | | |
| FTSE NAREIT Equity REITs Index | | | — | | | | — | | | | — | | | | 2.25 | | |
| S&P 500® Index | | | — | | | | — | | | | — | | | | –0.16 | | |
| Lipper Real Estate Funds Average | | | — | | | | — | | | | — | | | | 1.99 | | |
Performance data quoted represents past performance, which is no guarantee of future results, and current performance may be lower or higher than the figures shown. Performance assumes that all dividends and distributions, if any, were reinvested. For the most recent month-end performance figures, please visit www.morganstanley.com/im. Investment return and principal value will fluctuate so that Portfolio shares, when redeemed, may be worth more or less than their original cost. Total returns do not reflect the deduction of taxes that a shareholder would pay on Portfolio distributions or the redemption of Portfolio shares. Performance of share classes will vary due to difference in expenses.
(1) The FTSE NAREIT (National Association of Real Estate Investment Trusts) Equity REITs Index is free float-adjusted market capitalization weighted index of tax-qualified REITs listed on the New York Stock Exchange, NYSE Amex and the NASDAQ National Market Systems. Effective December 20, 2010, the FTSE NAREIT Equity REITs Index will not include "Timber REITs" The Index is unmanaged and its returns do not include any sales charges or fees. Such costs would lower performance. It is not possible to invest directly in an index.
(2) The Standard & Poor's 500® Index (S&P 500®) measures the performance of the large cap segment of the U.S. equities market, covering approximately 75% of the U.S. equities market. The Index includes 500 leading companies in leading industries of the U.S. economy. The Index is unmanaged and its returns do not include any sales charges or fees. Such costs would lower performance. It is not possible to invest directly in an index.
(3) The Lipper Real Estate Funds Average tracks the performance of all funds in the Lipper Real Estate Funds classification. The Average, which is adjusted for capital gains distributions and income dividends, is unmanaged and should not be considered an investment. As of the date of this report, the Portfolio is in the Lipper Real Estate Funds classification.
(4) Total returns for the Portfolio reflect fees waived and expenses reimbursed, if applicable, by the Adviser. Without such waivers and reimbursements, total returns would have been lower. The fee waivers and/or expense reimbursements will continue for one year or until such time as the Fund's Board of Directors acts to discontinue all or a portion of such waivers and/or expense reimbursements when it deems that such action is appropriate.
(5) Commenced operations on February 24, 1995.
(6) Commenced offering on January 2, 1996.
(7) Commenced offering on November 11, 2011.
(8) For comparative purposes, average annual since inception returns listed for the Indexes refer to the inception date or initial offering of the respective share class of the Portfolio, not the inception of the Index. Returns for periods less than one year are not annualized.
Portfolio Composition
| Classification | | Percentage of
Total Investments | |
| Regional Malls | | | 18.6 | % | |
| Apartments | | | 17.2 | | |
| Health Care | | | 12.1 | | |
| Lodging/Resorts | | | 10.6 | | |
| Diversified | | | 9.9 | | |
| Office | | | 9.5 | | |
| Other* | | | 8.2 | | |
| Shopping Centers | | | 7.3 | | |
| Industrial | | | 6.6 | | |
| Total Investments | | | 100.0 | % | |
* Industries representing less than 5% of total investments.
117
2011 Annual Report
December 31, 2011
Portfolio of Investments
U.S. Real Estate Portfolio
| | | Shares | | Value
(000) | |
| Common Stocks (99.6%) | |
| Apartments (17.3%) | |
Apartment Investment & Management Co.,
Class A REIT | | | 921,736 | | | $ | 21,117 | | |
| AvalonBay Communities, Inc. REIT | | | 227,526 | | | | 29,715 | | |
| BRE Properties, Inc. REIT | | | 162,280 | | | | 8,192 | | |
| Camden Property Trust REIT | | | 202,946 | | | | 12,631 | | |
| Equity Residential REIT | | | 1,461,429 | | | | 83,345 | | |
| | | | 155,000 | | |
| Commercial Financing (1.0%) | |
| CreXus Investment Corp. REIT | | | 138,210 | | | | 1,435 | | |
| Starwood Property Trust, Inc. REIT | | | 385,841 | | | | 7,142 | | |
| | | | 8,577 | | |
| Diversified (9.9%) | |
| Coresite Realty Corp. REIT | | | 108,564 | | | | 1,935 | | |
| Cousins Properties, Inc. REIT | | | 1,868,851 | | | | 11,979 | | |
| Digital Realty Trust, Inc. REIT | | | 1,210 | | | | 81 | | |
| Forest City Enterprises, Inc., Class A (a) | | | 1,773,612 | | | | 20,964 | | |
| Lexington Realty Trust REIT | | | 52,850 | | | | 396 | | |
| Vornado Realty Trust REIT | | | 654,104 | | | | 50,274 | | |
| Winthrop Realty Trust REIT | | | 362,320 | | | | 3,685 | | |
| | | | 89,314 | | |
| Health Care (12.1%) | |
| Assisted Living Concepts, Inc., Class A | | | 636,538 | | | | 9,478 | | |
| Capital Senior Living Corp. (a) | | | 160,890 | | | | 1,277 | | |
| HCP, Inc. REIT | | | 1,108,851 | | | | 45,940 | | |
| Health Care, Inc. REIT | | | 200,606 | | | | 10,939 | | |
| Healthcare Realty Trust, Inc. REIT | | | 1,146,905 | | | | 21,321 | | |
| Omega Healthcare Investors, Inc. REIT | | | 51,160 | | | | 990 | | |
| Senior Housing Properties Trust REIT | | | 822,897 | | | | 18,466 | | |
| | | | 108,411 | | |
| Industrial (6.6%) | |
| Cabot Industrial Value Fund II, LP REIT (a)(b)(c)(d) | | | 14,000 | | | | 4,920 | | |
| Cabot Industrial Value Fund III, LP REIT (a)(b)(c)(d) | | | 6,512 | | | | 3,377 | | |
| DCT Industrial Trust, Inc. REIT | | | 920,173 | | | | 4,711 | | |
| Exeter Industrial Value Fund, LP REIT (a)(b)(c)(d) | | | 7,905,000 | | | | 6,988 | | |
| KTR Industrial Fund II LP REIT (a)(b)(c)(d) | | | 8,537,500 | | | | 9,972 | | |
| Keystone Industrial Fund, LP REIT (a)(b)(c)(d) | | | 7,574,257 | | | | 7,036 | | |
| ProLogis, Inc. REIT | | | 711,416 | | | | 20,339 | | |
| STAG Industrial, Inc. REIT | | | 159,270 | | | | 1,827 | | |
| | | | 59,170 | | |
| Lodging/Resorts (10.6%) | |
| Ashford Hospitality Trust, Inc. REIT | | | 471,542 | | | | 3,772 | | |
| Host Hotels & Resorts, Inc. REIT | | | 3,953,249 | | | | 58,390 | | |
| Starwood Hotels & Resorts Worldwide, Inc. | | | 684,536 | | | | 32,837 | | |
| | | | 94,999 | | |
| Manufactured Homes (1.8%) | |
| Equity Lifestyle Properties, Inc. REIT | | | 237,372 | | | | 15,830 | | |
| Mixed Industrial/Office (0.4%) | |
| Liberty Property Trust REIT | | | 9,400 | | | | 290 | | |
| PS Business Parks, Inc. REIT | | | 67,235 | | | | 3,727 | | |
| | | | 4,017 | | |
| | | Shares | | Value
(000) | |
| Office (9.5%) | |
| BioMed Realty Trust, Inc. REIT | | | 139,765 | | | $ | 2,527 | | |
| Boston Properties, Inc. REIT | | | 401,489 | | | | 39,988 | | |
| BRCP REIT I, LP (a)(b)(c)(d) | | | 6,101,396 | | | | 1,690 | | |
| BRCP REIT II, LP (a)(b)(c)(d) | | | 8,363,574 | | | | 4,065 | | |
| Brookfield Office Properties, Inc. | | | 670,336 | | | | 10,484 | | |
| CommonWealth REIT | | | 205,613 | | | | 3,422 | | |
| Douglas Emmett, Inc. REIT | | | 101,930 | | | | 1,859 | | |
| Hudson Pacific Properties, Inc. REIT | | | 401,910 | | | | 5,691 | | |
| Mack-Cali Realty Corp. REIT | | | 546,277 | | | | 14,580 | | |
| Parkway Properties, Inc. REIT | | | 38,374 | | | | 378 | | |
| SL Green Realty Corp. REIT | | | 14,520 | | | | 968 | | |
| | | | 85,652 | | |
| Regional Malls (18.7%) | |
| General Growth Properties, Inc. REIT | | | 2,803,741 | | | | 42,112 | | |
| Simon Property Group, Inc. REIT | | | 971,983 | | | | 125,328 | | |
| | | | 167,440 | | |
| Self Storage (4.3%) | |
| Public Storage REIT | | | 264,462 | | | | 35,560 | | |
| Sovran Self Storage, Inc. REIT | | | 82,119 | | | | 3,504 | | |
| | | | 39,064 | | |
| Shopping Centers (7.3%) | |
| Acadia Realty Trust REIT | | | 338,665 | | | | 6,821 | | |
| Federal Realty Investment Trust REIT | | | 109,541 | | | | 9,941 | | |
| Kite Realty Group Trust REIT | | | 122,700 | | | | 553 | | |
| Regency Centers Corp. REIT | | | 1,019,750 | | | | 38,363 | | |
| Retail Opportunity Investments Corp. REIT | | | 841,941 | | | | 9,968 | | |
| | | | 65,646 | | |
| Timber (0.1%) | |
| Plum Creek Timber Co., Inc. REIT | | | 27,988 | | | | 1,023 | | |
| Total Common Stocks (Cost $815,928) | | | 894,143 | | |
| Short-Term Investment (0.5%) | |
| Investment Company (0.5%) | |
Morgan Stanley Institutional Liquidity
Funds — Money Market Portfolio —
Institutional Class (See Note G-2)
(Cost $4,679) | | | 4,678,958 | | | | 4,679 | | |
| Total Investments (100.1%) (Cost $820,607) | | | 898,822 | | |
| Liabilities in Excess of Other Assets (-0.1%) | | | (1,114 | ) | |
| Net Assets (100.0%) | | $ | 897,708 | | |
(a) Non-income producing security.
(b) Security has been deemed illiquid at December 31, 2011.
(c) At December 31, 2011, the Portfolio held fair valued securities valued at approximately $38,048,000, representing 4.2% of net assets. These securities have been fair valued as determined in good faith under procedures established by and under the general supervision of the Fund's Directors.
The accompanying notes are an integral part of the financial statements.
118
2011 Annual Report
December 31, 2011
Portfolio of Investments (cont'd)
U.S. Real Estate Portfolio
(d) Restricted security valued at fair value and not registered under the Securities Act of 1933. BRCP REIT I, LP was acquired between 5/03 - 5/08 and has a cost basis of approximately $1,774,000. BRCP REIT II, LP was acquired between 10/06 - 4/11 and has a current cost basis of approximately $8,364,000. Cabot Industrial Value Fund II, LP was acquired between 11/05 - 2/10 and has a current cost basis of approximately $7,000,000. Cabot Industrial Value Fund III, LP was acquired between 12/08 - 12/11 and has a current cost basis of approximately $3,256,000. Exeter Industrial Value Fund, LP was acquired between 11/07 - 4/11 and has a current cost basis of approximately $7,905,000. Keystone Industrial Fund, LP was acquired between 3/06 - 6/11 and has a current cost basis of approximately $6,097,000. KTR Industrial Fund II LP was acquired between 1/09 - 11/11 and has a current cost basis of approximately $8,538,000. At December 31, 2011, these securities had an aggregate market value of approximately $38,048,000 representing 4.2% of net assets.
REIT Real Estate Investment Trust.
Fair Value Measurement Information:
The following is a summary of the inputs used to value the Portfolio's investments as of December 31, 2011. (See Note A-9 to the financial statements for further information regarding fair value measurement.)
| Investment Type | | Level 1
Unadjusted
quoted
prices
(000) | | Level 2
Other
significant
observable
inputs
(000) | | Level 3
Significant
unobservable
inputs
(000) | | Total
(000) | |
| Assets: | | | | | | | | | |
| Common Stocks | | | | | | | | | |
| Apartments | | $ | 155,000 | | | $ | — | | | $ | — | | | $ | 155,000 | | |
| Commercial Financing | | | 8,577 | | | | — | | | | — | | | | 8,577 | | |
| Diversified | | | 89,314 | | | | — | | | | — | | | | 89,314 | | |
| Health Care | | | 108,411 | | | | — | | | | — | | | | 108,411 | | |
| Industrial | | | 26,877 | | | | — | | | | 32,293 | | | | 59,170 | | |
| Lodging/Resorts | | | 94,999 | | | | — | | | | — | | | | 94,999 | | |
| Manufactured Homes | | | 15,830 | | | | — | | | | — | | | | 15,830 | | |
| Mixed Industrial/Office | | | 4,017 | | | | — | | | | — | | | | 4,017 | | |
| Office | | | 79,897 | | | | — | | | | 5,755 | | | | 85,652 | | |
| Regional Malls | | | 167,440 | | | | — | | | | — | | | | 167,440 | | |
| Self Storage | | | 39,064 | | | | — | | | | — | | | | 39,064 | | |
| Shopping Centers | | | 65,646 | | | | — | | | | — | | | | 65,646 | | |
| Timber | | | 1,023 | | | | — | | | | — | | | | 1,023 | | |
| Total Common Stocks | | | 856,095 | | | | — | | | | 38,048 | | | | 894,143 | | |
| Short-Term Investment— | |
| Investment Company | | | 4,679 | | | | — | | | | — | | | | 4,679 | | |
| Total Assets | | $ | 860,774 | | | $ | — | | | $ | 38,048 | | | $ | 898,822 | | |
Transfers between investment levels may occur as the markets fluctuate and/or the availability of data used in an investment's valuation changes. The Portfolio recognizes transfers between the levels as of the end of the period. As of December 31, 2011, the Portfolio did not have any significant investments transfer between investment levels.
Following is a reconciliation of investments in which significant unobservable inputs (Level 3) were used in determining fair value.
| | | Common
Stocks
(000) | |
| Beginning Balance | | $ | 26,725 | | |
| Purchases | | | 9,315 | | |
| Sales | | | — | | |
| Amortization of discount | | | — | | |
| Transfers in | | | — | | |
| Transfers out | | | — | | |
| Change in unrealized appreciation (depreciation) | | | 2,008 | | |
| Realized gains (losses) | | | — | | |
| Ending Balance | | $ | 38,048 | | |
Net change in unrealized appreciation/depreciation
from investments still held as of December 31, 2011 | | $ | 2,008 | | |
The accompanying notes are an integral part of the financial statements.
119
2011 Annual Report
December 31, 2011
Investment Overview (unaudited)
Emerging Markets Debt Portfolio
The Emerging Markets Debt Portfolio (the "Portfolio") seeks high total return by investing primarily in fixed income securities of government and government-related issuers and, to a lesser extent, of corporate issuers in emerging market countries.
Performance
For the year ended December 31, 2011, the Portfolio had a total return based on net asset value and reinvestment of distributions per share of -3.66%, net of fees, for Class I shares. The Portfolio's Class I shares underperformed against its benchmark, the JP Morgan EMBI Global Bond Index/JP Morgan GBI-EM Diversified Bond Index (the "Index"), which returned -1.75%.
Factors Affecting Performance
• The first three months of 2011 were volatile, with a number of unexpected global events from political turmoil in the Middle East and Africa, to the Japan earthquake, to the precarious fiscal situation in Europe. During the period, emerging market central banks adopted divergent tightening strategies. The central banks of some countries, such as Chile and Israel, surprised the market by stepping up the pace of rate hikes; others such as Brazil and Turkey tightened regulations in lieu of rate hikes.
• In the second quarter of 2011, developed market worries began to take center stage as European officials lacked a clear resolution to Greece's sovereign-debt crisis and U.S. economic data disappointed. In addition to Greece, other peripheral Europe countries showed significant signs of stress, including Portugal, Italy and Spain. Despite this, emerging market (EM) asset classes performed well with EM external debt slightly outpacing EM local currency debt. Inflation continued to be an important concern in the emerging markets as rising food and energy prices prompted emerging market central banks to remain vigilant. Against this backdrop, many emerging market central banks resumed monetary tightening policies to combat inflationary pressures.
• Global risk sentiment further weakened in the third quarter due to increased concerns about significant economic slowing in the developed world and the European sovereign debt crisis despite signs of economic progress in the U.S. EM assets in general came under immense pressure in September as investors shed all risk assets in favor of traditional "safe havens," the U.S. dollar and U.S. Treasuries. Volatility in the emerging markets was high as the markets experienced bouts of disappointment, highlighting the need for stronger leadership and policies from the G-10 countries to lift investor confidence.
• Risk sentiment rebounded in October due to signs that U.S. recession risks were receding and improved sentiment towards steps taken by European policymakers to put Europe on the path to resolving its credit crisis. Emerging market currencies retraced some of the previous month's declines versus the U.S. dollar after September's currency sell-off had battered risky assets. November and December re-introduced market pessimism about the likelihood of a comprehensive European debt solution and the related rising downside risks to global growth. Emerging market currencies, notably those that move with the euro, fell against the U.S. dollar due to concerns about the impact of Europe's troubles on the rest of the world.
• Over the course of the year, the risk premium on the Index widened 137 basis points to 426 basis points above U.S. Treasuries. The JP Morgan EMBI Global Bond Index (which tracks the performance of U.S.-dollar denominated debt instruments issued by emerging markets) generated a total return of 8.46%. The JP Morgan GBI-EM Global Diversified Index (which tracks local currency government bonds issued by emerging markets) returned -1.75%. Index returns attributable to foreign currency exposure were -939 basis points. EM corporate debt, as measured by the JP Morgan CEMBI Broad Diversified Index, was up 2.32%.
• Underweight exposure to Indonesia detracted from relative returns. Indonesia's resilient economic growth, low government debt, and prudent fiscal management led to ratings upgrades by the big three credit rating agencies. Security selection in Brazil also hurt relative performance.
• The Portfolio benefited from overweight exposure to Chile, Colombia, Mexico, and Venezuela, as well as underweight exposure to Poland and Turkey. Chile, the world's top copper producer, benefited from supportive copper prices, while Colombia
120
2011 Annual Report
December 31, 2011
Investment Overview (unaudited) (cont'd)
Emerging Markets Debt Portfolio
benefited from economic resilience and progress fighting guerilla factions, which eased security concerns. Mexico benefited from dissipating inflationary concerns, while Venezuela benefited from supportive oil prices and a positive record of servicing debt. The Polish zloty and Turkish forint faced downward pressure from the euro-zone debt crisis as they continued to be punished for their economic ties to Western Europe.
Management Strategies
• We expect growth in the developed world to remain well below potential in 2012. Furthermore, the risk of a recession in the developed world has increased significantly, reflecting increased policy uncertainty in the U.S. and Europe. The unresolved fiscal troubles in the U.S. and in Europe, and the apparent lack of political consensus to resolve them, are likely to result in bouts of high volatility and risk aversion in the near future, while depressing growth in the next couple of quarters.
• We expect developed market central banks to continue to provide liquidity as needed, supporting commodity prices and capital inflows into EM countries, somewhat offsetting the negative impact of heightened risk aversion and sub-par growth in the developed world. We expect EM countries to show resilient, albeit lower growth in the next couple of quarters, aided by robust domestic policies and supportive terms of trade and capital inflows. Subsiding inflationary pressures and balanced growth will likely allow EM central banks to continue to adopt looser monetary policies in coming months.
• In general, sovereign risk premiums remain too high relative to the fundamental macroeconomic strength of most emerging economies. In addition, we believe there are pockets of undervaluation in certain Asian and commodity currencies.
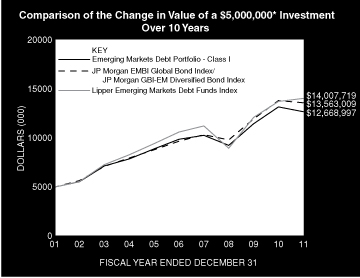
* Minimum Investment
In accordance with SEC regulations, Portfolio's performance shown assumes that all recurring fees (including management fees) were deducted and all dividends and distributions were reinvested. The performance of Class P, Class H and Class L shares will vary from the Class I shares based upon different inception dates and will be negatively impacted by additional fees assessed to that class.
Performance Compared to the JP Morgan EMBI Global Bond Index/JP Morgan GBI-EM Global Diversified Bond Index(1) and the Lipper Emerging Markets Debt Funds Index(2)
| | | Period Ended December 31, 2011 | |
| | | Total Returns(3) | |
| | | | | Average Annual | |
| | | One
Year | | Five
Years | | Ten
Years | | Since
Inception(8) | |
Portfolio — Class I Shares
w/o sales charges(4) | | | –3.66 | % | | | 5.15 | % | | | 9.74 | % | | | 9.58 | % | |
JP Morgan EMBI Global Bond
Index/JP Morgan GBI-EM
Global Diversified Bond Index | | | –1.75 | | | | 7.02 | | | | 10.49 | | | | 9.82 | | |
Lipper Emerging Markets Debt
Funds Index | | | 2.19 | | | | 5.76 | | | | 10.85 | | | | — | | |
Portfolio — Class P Shares
w/o sales charges(5) | | | –3.90 | | | | 4.86 | | | | 9.46 | | | | 9.78 | | |
JP Morgan EMBI Global
Bond Index/JP Morgan GBI-EM
Global Diversified Bond Index | | | –1.75 | | | | 7.02 | | | | 10.49 | | | | 10.81 | | |
Lipper Emerging Markets Debt
Funds Index | | | 2.19 | | | | 5.76 | | | | 10.85 | | | | 10.39 | | |
121
2011 Annual Report
December 31, 2011
Investment Overview (unaudited) (cont'd)
Emerging Markets Debt Portfolio
| | | Period Ended December 31, 2011 | |
| | | Total Returns(3) | |
| | | | | Average Annual | |
| | | One
Year | | Five
Years | | Ten
Years | | Since
Inception(8) | |
Portfolio — Class H Shares
w/o sales charges(6) | | | –3.88 | % | | | — | | | | — | | | | 5.03 | % | |
Portfolio — Class H Shares
with maximum 3.50% sales | | | –7.22 | | | | — | | | | — | | | | 4.09 | | |
| charges | | | 10.84 | | | | — | | | | — | | | | 6.89 | | |
JP Morgan EMBI Global Bond
Index/JP Morgan GBI-EM
Global Diversified Bond Index | | | –1.75 | | | | — | | | | — | | | | 6.96 | | |
Lipper Emerging Markets Debt
Funds Index | | | 2.19 | | | | — | | | | — | | | | 5.68 | | |
Portfolio — Class L Shares
w/o sales charges(7) | | | –4.34 | | | | — | | | | — | | | | 4.84 | | |
JP Morgan EMBI Global Bond
Index/JP Morgan GBI-EM
Global Diversified Bond Index | | | –1.75 | | | | — | | | | — | | | | 7.67 | | |
Lipper Emerging Markets Debt
Funds Index | | | 2.19 | | | | — | | | | — | | | | 6.69 | | |
Performance data quoted represents past performance, which is no guarantee of future results, and current performance may be lower or higher than the figures shown. Performance assumes that all dividends and distributions, if any, were reinvested. For the most recent month-end performance figures, please visit www.morganstanley.com/im. Investment return and principal value will fluctuate so that Portfolio shares, when redeemed, may be worth more or less than their original cost. Total returns do not reflect the deduction of taxes that a shareholder would pay on Portfolio distributions or the redemption of Portfolio shares. Performance of share classes will vary due to difference in expenses.
(1) JP Morgan EMBI Global Bond Index/JP Morgan GBI-EM Diversified Bond Index is a custom index represented by performance of the JP Morgan EMBI Global Bond Index (which tracks the performance U.S. dollar — denominated debt instruments issued by emerging markets) for periods from the Portfolio's inception to September 30, 2007 and the JP Morgan GBI-EM Global Diversified Bond Index (which tracks local currency government bonds issued by emerging markets) for periods thereafter. The Index is unmanaged and its returns do not include any sales charges or fees. Such costs would lower performance. It is not possible to invest directly in an index.
(2) The Lipper Emerging Markets Debt Funds Index is an equally weighted performance index of the largest qualifying funds (based on net assets) in the Lipper Emerging Markets Debt Funds classification. The Index, which is adjusted for capital gains distributions and income dividends, is unmanaged and should not be considered an investment. There are currently 10 funds represented in this Index. As of the date of this report, the Portfolio is in the Lipper Emerging Markets Debt Funds classification.
(3) Total returns for the Portfolio reflect fees waived and expenses reimbursed, if applicable, by the Adviser. Without such waivers and reimbursements, total returns would have been lower. The fee waivers and/or expense reimbursements will continue for one year or until such time as the Fund's Board of Directors acts to discontinue all or a portion of such waivers and/or expense reimbursements when it deems that such action is appropriate.
(4) Commenced operations on February 1, 1994
(5) Commenced offering on January 2, 1996
(6) Commenced offering on January 2, 2008
(7) Commenced offering on June 16, 2008
(8) For comparative purposes, average annual since inception returns listed for the Indexes refer to the inception date or initial offering of the respective share class of the Portfolio, not the inception of the Index.
Portfolio Composition*
| Classification | | Percentage of
Total Investments | |
| Sovereign | | | 85.0 | % | |
| Short-Term Investments | | | 14.7 | | |
| Other** | | | 0.3 | | |
| Total Investments | | | 100.0 | %*** | |
* Percentages indicated are based upon total investments (excluding Securities held as Collateral on Loaned Securities) as of December 31, 2011.
** Investments representing less than 5% of total investments.
*** Does not include open foreign currency exchange contracts with net unrealized depreciation of approximately $99,000.
122
2011 Annual Report
December 31, 2011
Portfolio of Investments
Emerging Markets Debt Portfolio
| | | Face
Amount
(000) | | Value
(000) | |
| Fixed Income Securities (82.4%) | |
| Brazil (11.8%) | |
| Sovereign (11.8%) | |
| Brazil Notas do Tesouro Nacional, Series F, | |
| 10.00%, 1/1/14 | | BRL | 8,141 | | | $ | 4,250 | | |
| Brazilian Government International Bond, | |
| 12.50%, 1/5/16 (a) | | | 8,925 | | | | 5,670 | | |
| | | | 9,920 | | |
| Chile (1.3%) | |
| Corporate Bond (0.3%) | |
| Banco Santander Chile, | |
| 6.50%, 9/22/20 | | CLP | 131,000 | | | | 249 | | |
| Sovereign (1.0%) | |
| Chile Government International Bond, | |
| 5.50%, 8/5/20 | | | 432,500 | | | | 872 | | |
| | | | 1,121 | | |
| Colombia (4.7%) | |
| Sovereign (4.7%) | |
| Colombia Government International Bond, | |
| 7.75%, 4/14/21 | | COP | 1,200,000 | | | | 743 | | |
| 12.00%, 10/22/15 | | | 2,051,000 | | | | 1,363 | | |
| Republic of Colombia, | |
| 9.85%, 6/28/27 | | | 2,612,000 | | | | 1,907 | | |
| | | | 4,013 | | |
| Hungary (3.6%) | |
| Sovereign (3.6%) | |
| Hungary Government Bond, | |
| 6.75%, 8/22/14 - 2/24/17 | | HUF | 805,270 | | | | 3,008 | | |
| Indonesia (6.9%) | |
| Sovereign (6.9%) | |
Barclays Bank PLC, Republic of Indonesia
Government Bond, Credit Linked Notes, | |
| 9.00%, 9/19/18 (b) | | IDR | 10,000,000 | | | | 1,294 | | |
Deutsche Bank AG, Republic of Indonesia
Government Bond, Credit Linked Notes, | |
| 11.00%, 12/15/20 (b)(c) | | | 12,000,000 | | | | 1,769 | | |
JPMorgan Chase & Co., Republic of Indonesia
Government Bond, Credit Linked Notes, | |
| 9.00%, 9/18/18 (b) | | | 1,000,000 | | | | 129 | | |
| 11.00%, 11/17/20 | | | 17,890,000 | | | | 2,638 | | |
| | | | 5,830 | | |
| Malaysia (8.2%) | |
| Sovereign (8.2%) | |
| Malaysia Government Bond, | |
| 2.51%, 8/27/12 | | MYR | 9,440 | | | $ | 2,970 | | |
| 3.21%, 5/31/13 | | | 12,425 | | | | 3,936 | | |
| | | | 6,906 | | |
| Mexico (12.6%) | |
| Sovereign (12.6%) | |
| Mexican Bonos, | |
| 7.50%, 6/3/27 | | MXN | 12,200 | | | | 906 | | |
| 8.00%, 6/11/20 | | | 101,164 | | | | 8,072 | | |
| | | Face
Amount
(000) | | Value
(000) | |
| Petroleos Mexicanos, | |
| 7.65%, 11/24/21 (b) | | | 23,000 | | | $ | 1,640 | | |
| | | | 10,618 | | |
| Peru (1.8%) | |
| Sovereign (1.8%) | |
| Peru Government Bond, | |
| 8.60%, 8/12/17 | | PEN | 1,390 | | | | 611 | | |
| Peruvian Government International Bond, | |
| 8.20%, 8/12/26 | | | 2,090 | | | | 927 | | |
| | | | 1,538 | | |
| Poland (7.7%) | |
| Sovereign (7.7%) | |
| Poland Government Bond, | |
| 5.50%, 10/25/19 | | PLN | 16,069 | | | | 4,610 | | |
| 6.25%, 10/24/15 | | | 6,200 | | | | 1,866 | | |
| | | | 6,476 | | |
| Russia (2.1%) | |
| Sovereign (2.1%) | |
| Russian Foreign Bond - Eurobond, | |
| 7.85%, 3/10/18 (b) | | RUB | 45,000 | | | | 1,425 | | |
| 7.85%, 3/10/18 | | | 10,000 | | | | 317 | | |
| | | | 1,742 | | |
| South Africa (9.9%) | |
| Sovereign (9.9%) | |
| South Africa Government Bond, | |
| 7.25%, 1/15/20 | | ZAR | 69,862 | | | | 8,333 | | |
| Thailand (2.2%) | |
| Sovereign (2.2%) | |
| Thailand Government Bond, | |
| 4.25%, 3/13/13 | | THB | 28,400 | | | | 912 | | |
| 5.25%, 7/13/13 - 5/12/14 | | | 29,403 | | | | 974 | | |
| | | | 1,886 | | |
| Turkey (7.5%) | |
| Sovereign (7.5%) | |
| Turkey Government Bond, | |
| Zero Coupon, 2/20/13 - 5/15/13 | | TRY | 6,884 | | | | 3,197 | | |
| 9.00%, 1/27/16 | | | 920 | | | | 468 | | |
| 10.00%, 6/17/15 | | | 2,640 | | | | 1,379 | | |
| 16.00%, 3/7/12 | | | 2,366 | | | | 1,262 | | |
| | | | 6,306 | | |
| Venezuela (2.1%) | |
| Sovereign (2.1%) | |
| Petroleos de Venezuela SA, | |
| 8.50%, 11/2/17 | | $ | 2,270 | | | | 1,717 | | |
| Venezuela Government International Bond, | |
| 9.25%, 9/15/27 (a) | | | 66 | | | | 48 | | |
| | | | 1,765 | | |
| Total Fixed Income Securities (Cost $74,393) | | | 69,462 | | |
The accompanying notes are an integral part of the financial statements.
123
2011 Annual Report
December 31, 2011
Portfolio of Investments (cont'd)
Emerging Markets Debt Portfolio
| | | No. of
Warrants | | Value
(000) | |
| Warrants (0.0%) | |
| Venezuela (0.0%) | |
Venezuela Government International Bond,
Oil-Linked Payment Obligation,
expires 4/15/20 (c)(d) (Cost $—) | | | 495 | | | $ | 14 | | |
| | | Shares | | | |
| Short-Term Investments (15.4%) | |
| Securities held as Collateral on Loaned Securities (1.2%) | |
| Investment Company (0.9%) | |
Morgan Stanley Institutional Liquidity
Funds — Money Market Portfolio —
Institutional Class (See Note G-2) | | | 723,603 | | | | 724 | | |
| | | Face
Amount
(000) | | | |
| Repurchase Agreements (0.3%) | |
Barclays Capital, Inc., (0.02%, dated
12/30/11, due 1/3/12; proceeds $31;
fully collateralized by a U.S. Government
Obligation; U.S. Treasury Bond 4.50%
due 5/15/38; valued at $32) | | $ | 31 | | | | 31 | | |
Merrill Lynch & Co., Inc., (0.07%, dated
12/30/11, due 1/3/12; proceeds $231;
fully collateralized by a U.S. Government
Agency; Government National Mortgage
Association 3.50% due 11/20/41; valued
at $235) | | | 231 | | | | 231 | | |
| | | | 262 | | |
Total Securities held as Collateral on Loaned
Securities (Cost $986) | | | 986 | | |
| | | Shares | | | |
| Investment Company (14.2%) | |
Morgan Stanley Institutional Liquidity
Funds — Money Market Portfolio —
Institutional Class (See Note G-2)
(Cost $11,946) | | | 11,946,233 | | | | 11,946 | | |
| Total Short-Term Investments (Cost $12,932) | | | 12,932 | | |
Total Investments (97.8%) (Cost $87,325)
Including $841 of Securities Loaned (e) | | | 82,408 | | |
| Other Assets in Excess of Liabilities (2.2%) | | | 1,853 | | |
| Net Assets (100.0%) | | $ | 84,261 | | |
(a) All or a portion of this security was on loan at December 31, 2011.
(b) 144A security — Certain conditions for public sale may exist. Unless otherwise noted, these securities are deemed to be liquid.
(c) Variable/Floating Rate Security — Interest rate changes on these instruments are based on changes in a designated base rate. The rates shown are those in effect on December 31, 2011.
(d) Security has been deemed illiquid at December 31, 2011.
(e) Securities are available for collateral in connection with open foreign currency exchange contracts.
Foreign Currency Exchange Contracts Information:
The Portfolio had the following foreign currency exchange contracts open at period end:
| Counterparty | | Currency
to
Deliver
(000) | | Value
(000) | | Settlement
Date | | In
Exchange
For
(000) | | Value
(000) | | Unrealized
Appreciation
(Depreciation)
(000) | |
| JPMorgan Chase Bank | |
| | | USD | 4,118 | | | $ | 4,118 | | | 1/17/12 | | RUB | 130,926 | | | $ | 4,062 | | | $ | (56 | ) | |
| JPMorgan Chase Bank | |
| | | USD | 144 | | | | 144 | | | 1/20/12 | | CLP | 74,761 | | | | 144 | | | | (— | @) | |
| JPMorgan Chase Bank | |
| | | USD | 1,296 | | | | 1,296 | | | 1/25/12 | | MYR | 4,120 | | | | 1,298 | | | | 2 | | |
| JPMorgan Chase Bank | |
| | | USD | 5,114 | | | | 5,114 | | | 1/27/12 | | THB | 160,200 | | | | 5,069 | | | | (45 | ) | |
| | | | | $ | 10,672 | | | | | | | | | | | $ | 10,573 | | | $ | (99 | ) | |
@ Value is less than $500.
BRL — Brazilian Real
CLP — Chilean Peso
COP — Colombian Peso
HUF — Hungarian Forint
IDR — Indonesian Rupiah
MXN — Mexican New Peso
MYR — Malaysian Ringgit
PEN — Peruvian Nuevo Sol
PLN — Polish Zloty
RUB — Russian Ruble
THB — Thai Baht
TRY — Turkish Lira
USD — United States Dollar
ZAR — South African Rand
The accompanying notes are an integral part of the financial statements.
124
2011 Annual Report
December 31, 2011
Portfolio of Investments (cont'd)
Emerging Markets Debt Portfolio
Fair Value Measurement Information:
The following is a summary of the inputs used to value the Portfolio's investments as of December 31, 2011. (See Note A-9 to the financial statements for further information regarding fair value measurement.)
| Investment Type | | Level 1
Unadjusted
quoted
prices
(000) | | Level 2
Other
significant
observable
inputs
(000) | | Level 3
Significant
unobservable
inputs
(000) | | Total
(000) | |
| Assets: | | | | | | | | | |
| Fixed Income Securities | | | | | | | | | |
| Corporate Bond | | $ | — | | | $ | 249 | | | $ | — | | | $ | 249 | | |
| Sovereign | | | — | | | | 69,213 | | | | — | | | | 69,213 | | |
Total Fixed
Income Securities | | | — | | | | 69,462 | | | | — | | | | 69,462 | | |
| Warrant | | | — | | | | 14 | | | | — | | | | 14 | | |
| Short-Term Investments | |
| Investment Company | | | 12,670 | | | | — | | | | — | | | | 12,670 | | |
| Repurchase Agreements | | | — | | | | 262 | | | | — | | | | 262 | | |
Total Short-Term
Investments | | | 12,670 | | | | 262 | | | | — | | | | 12,932 | | |
Foreign Currency Exchange
Contracts | | | — | | | | 2 | | | | — | | | | 2 | | |
| Total Assets | | | 12,670 | | | | 69,740 | | | | — | | | | 82,410 | | |
| Liabilities: | |
Foreign Currency Exchange
Contracts | | | — | | | | (101 | ) | | | — | | | | (101 | ) | |
| Total | | $ | 12,670 | | | $ | 69,639 | | | $ | — | | | $ | 82,309 | | |
Transfers between investment levels may occur as the markets fluctuate and/or the availability of data used in an investment's valuation changes. The Portfolio recognizes transfers between the levels as of the end of the period. As of December 31, 2011, the Portfolio did not have any significant investments transfer between investment levels.
The accompanying notes are an integral part of the financial statements.
125
2011 Annual Report
December 31, 2011
Statements of Assets and Liabilities
| | | Active
International
Allocation
Portfolio
(000) | | Asian Equity
Portfolio
(000) | | Emerging
Markets
Portfolio
(000) | | Global
Advantage
Portfolio
(000) | |
| Assets: | |
| Investments in Securities of Unaffiliated Issuers, at Cost | | $ | 314,111 | | | $ | 1,507 | | | $ | 1,194,533 | | | $ | 2,543 | | |
| Investments in Securities of Affiliated Issuers, at Cost | | | 53,695 | | | | 175 | | | | 139,279 | | | | 101 | | |
| Total Investments in Securities, at Cost | | | 367,806 | | | | 1,682 | | | | 1,333,812 | | | | 2,644 | | |
| Foreign Currency, at Cost | | | 5,008 | | | | — | @ | | | 9,776 | | | | — | @ | |
| Investments in Securities of Unaffiliated Issuers, at Value(1) | | | 283,477 | | | | 1,348 | | | | 1,242,950 | | | | 2,561 | | |
| Investments in Securities of Affiliated Issuers, at Value | | | 52,065 | | | | 175 | | | | 145,434 | | | | 101 | | |
| Total Investments in Securities, at Value(1) | | | 335,542 | | | | 1,523 | | | | 1,388,384 | | | | 2,662 | | |
| Cash | | | 210 | | | | — | | | | 667 | | | | — | | |
| Foreign Currency, at Value | | | 4,957 | | | | — | @ | | | 9,765 | | | | — | @ | |
| Receivable for Investments Sold | | | 5 | | | | — | @ | | | 50,656 | | | | — | | |
| Variation Margin | | | 2,151 | | | | — | | | | — | | | | — | | |
| Dividends Receivable | | | 548 | | | | — | @ | | | 675 | | | | 4 | | |
| Receivable for Portfolio Shares Sold | | | 12 | | | | — | | | | 620 | | | | — | | |
| Unrealized Appreciation on Foreign Currency Exchange Contracts | | | 333 | | | | — | | | | — | | | | — | | |
| Tax Reclaim Receivable | | | 203 | | | | — | | | | 13 | | | | 2 | | |
| Due from Adviser | | | — | | | | 46 | | | | — | | | | 43 | | |
| Receivable from Affiliate | | | 3 | | | | — | @ | | | 2 | | | | — | @ | |
| Other Assets | | | 1 | | | | 12 | | | | 24 | | | | 12 | | |
| Total Assets | | | 343,965 | | | | 1,581 | | | | 1,450,806 | | | | 2,723 | | |
| Liabilities: | |
| Collateral on Securities Loaned, at Value | | | 29,174 | | | | — | | | | 92,680 | | | | — | | |
| Payable for Portfolio Shares Redeemed | | | 811 | | | | — | | | | 105,358 | | | | — | | |
| Payable for Investment Advisory Fees | | | 499 | | | | — | | | | 4,299 | | | | — | | |
| Payable for Investments Purchased | | | — | | | | 103 | | | | 1,093 | | | | — | | |
| Payable for Sub Transfer Agency Fees | | | 286 | | | | — | | | | 751 | | | | — | | |
| Deferred Capital Gain Country Tax | | | 1 | | | | — | @ | | | 655 | | | | — | | |
| Unrealized Depreciation on Foreign Currency Exchange Contracts | | | 598 | | | | — | | | | — | | | | — | | |
| Payable for Custodian Fees | | | 45 | | | | 3 | | | | 246 | | | | 2 | | |
| Payable for Professional Fees | | | 21 | | | | 20 | | | | 63 | | | | 21 | | |
| Payable for Administration Fees | | | 22 | | | | — | @ | | | 94 | | | | — | @ | |
| Payable for Directors' Fees and Expenses | | | 20 | | | | — | | | | 84 | | | | — | | |
| Payable for Transfer Agent Fees | | | 2 | | | | 1 | | | | 3 | | | | 1 | | |
| Payable for Distribution and Shareholder Servicing Fees — Class P | | | 2 | | | | — | @ | | | 10 | | | | — | @ | |
| Payable for Distribution and Shareholder Servicing Fees — Class H | | | — | | | | — | @ | | | — | | | | — | @ | |
| Payable for Distribution and Shareholder Servicing Fees — Class L | | | — | | | | — | @ | | | — | | | | — | @ | |
| Other Liabilities | | | 49 | | | | 1 | | | | 92 | | | | 1 | | |
| Total Liabilities | | | 31,530 | | | | 128 | | | | 205,428 | | | | 25 | | |
| Net Assets | | $ | 312,435 | | | $ | 1,453 | | | $ | 1,245,378 | | | $ | 2,698 | | |
| Net Assets Consist Of: | |
| Paid-in-Capital | | $ | 414,180 | | | $ | 1,681 | | | $ | 1,215,106 | | | $ | 2,688 | | |
| Undistributed (Distributions in Excess of) Net Investment Income | | | (1,888 | ) | | | (— | @) | | | (9,486 | ) | | | (8 | ) | |
| Accumulated Net Realized Loss | | | (67,020 | ) | | | (69 | ) | | | (14,110 | ) | | | (— | @) | |
| Unrealized Appreciation (Depreciation) on: | |
| Investments | | | (30,635 | )* | | | (159 | )* | | | 47,764 | * | | | 18 | | |
| Investments in Affiliates | | | (1,630 | ) | | | — | | | | 6,155 | | | | — | | |
| Futures Contracts | | | (144 | ) | | | — | | | | — | | | | — | | |
| Foreign Currency Exchange Contracts | | | (265 | ) | | | — | | | | — | | | | — | | |
| Foreign Currency Translations | | | (163 | ) | | | (— | @) | | | (51 | ) | | | (— | @) | |
| Net Assets | | $ | 312,435 | | | $ | 1,453 | | | $ | 1,245,378 | | | $ | 2,698 | | |
The accompanying notes are an integral part of the financial statements.
126
2011 Annual Report
December 31, 2011
Statements of Assets and Liabilities (cont'd)
| | | Active
International
Allocation
Portfolio
(000) | | Asian Equity
Portfolio
(000) | | Emerging
Markets
Portfolio
(000) | | Global
Advantage
Portfolio
(000) | |
| CLASS I: | |
| Net Assets | | $ | 302,048 | | | $ | 1,201 | | | $ | 1,198,857 | | | $ | 1,603 | | |
Shares Outstanding $0.001 par value shares of beneficial interest
(500,000,000 shares authorized) (not in 000's) | | | 30,000,363 | | | | 141,781 | | | | 55,172,292 | | | | 160,769 | | |
| Net Asset Value, Offering and Redemption Price Per Share | | $ | 10.07 | | | $ | 8.47 | | | $ | 21.73 | | | $ | 9.97 | | |
| CLASS P: | |
| Net Assets | | $ | 10,387 | | | $ | 84 | | | $ | 46,521 | | | $ | 100 | | |
Shares Outstanding $0.001 par value shares of beneficial interest
(500,000,000 shares authorized) (not in 000's) | | | 1,011,858 | | | | 10,000 | | | | 2,194,560 | | | | 10,000 | | |
| Net Asset Value, Offering and Redemption Price Per Share | | $ | 10.27 | | | $ | 8.45 | | | $ | 21.20 | | | $ | 9.97 | | |
| CLASS H: | |
| Net Assets | | $ | — | | | $ | 84 | | | $ | — | | | $ | 895 | | |
Shares Outstanding $0.001 par value shares of beneficial interest
500,000,000 shares authorized) (not in 000's) | | | — | | | | 10,000 | | | | — | | | | 89,720 | | |
| Net Asset Value, Redemption Price Per Share | | $ | — | | | $ | 8.45 | | | $ | — | | | $ | 9.97 | | |
| Maximum Sales Load | | | — | | | | 4.75 | % | | | — | | | | 4.75 | % | |
| Maximum Sales Charge | | $ | — | | | $ | 0.42 | | | $ | — | | | $ | 0.50 | | |
| Maximum Offering Price Per Share | | $ | — | | | $ | 8.87 | | | $ | — | | | $ | 10.47 | | |
| CLASS L: | |
| Net Assets | | $ | — | | | $ | 84 | | | $ | — | | | $ | 100 | | |
Shares Outstanding $0.001 par value shares of beneficial interest
(500,000,000 shares authorized) (not in 000's) | | | — | | | | 10,000 | | | | — | | | | 10,000 | | |
| Net Asset Value, Offering and Redemption Price Per Share | | $ | — | | | $ | 8.40 | | | $ | — | | | $ | 9.96 | | |
(1) Including:
Securities on Loan, at Value: | | $ | 28,149 | | | $ | — | | | $ | 89,322 | | | $ | — | | |
@ Amount is less than $500.
* Net of approximately $1,000, $—@, and $655,000 Deferred Capital Gain Country Tax in Active International Allocation Portfolio, Asian Equity Portfolio, and Emerging Markets Portfolio, respectively.
The accompanying notes are an integral part of the financial statements.
127
2011 Annual Report
December 31, 2011
Statements of Assets and Liabilities
| | | Global
Discovery
Portfolio
(000) | | Global
Franchise
Portfolio
(000) | | Global Insight
Portfolio
(000) | | Global
Opportunity
Portfolio
(000) | |
| Assets: | |
| Investments in Securities of Unaffiliated Issuers, at Cost | | $ | 3,869 | | | $ | 199,287 | | | $ | 694 | | | $ | 11,245 | | |
| Investments in Securities of Affiliated Issuers, at Cost | | | 134 | | | | 7,812 | | | | 503 | | | | 288 | | |
| Total Investments in Securities, at Cost | | | 4,003 | | | | 207,099 | | | | 1,197 | | | | 11,533 | | |
| Foreign Currency, at Cost | | | — | | | | — | | | | 225 | | | | — | | |
| Investments in Securities of Unaffiliated Issuers, at Value | | | 3,611 | | | | 219,072 | | | | 700 | | | | 13,317 | | |
| Investments in Securities of Affiliated Issuers, at Value | | | 134 | | | | 7,812 | | | | 503 | | | | 288 | | |
| Total Investments in Securities, at Value | | | 3,745 | | | | 226,884 | | | | 1,203 | | | | 13,605 | | |
| Foreign Currency, at Value | | | — | | | | — | | | | 225 | | | | — | | |
| Receivable for Portfolio Shares Sold | | | — | | | | 556 | | | | — | | | | — | | |
| Dividends Receivable | | | 13 | | | | 316 | | | | — | | | | 4 | | |
| Tax Reclaim Receivable | | | 2 | | | | 196 | | | | — | | | | 1 | | |
| Due from Adviser | | | 29 | | | | — | | | | 26 | | | | 27 | | |
| Receivable for Investments Sold | | | — | | | | — | | | | 1 | | | | 7 | | |
| Receivable from Affiliate | | | — | @ | | | — | @ | | | — | @ | | | — | @ | |
| Other Assets | | | 24 | | | | 19 | | | | — | | | | 7 | | |
| Total Assets | | | 3,813 | | | | 227,971 | | | | 1,455 | | | | 13,651 | | |
| Liabilities: | |
| Payable for Investments Purchased | | | — | | | | — | | | | 593 | | | | — | @ | |
| Payable for Portfolio Shares Redeemed | | | — | | | | 457 | | | | — | | | | 3 | | |
| Payable for Investment Advisory Fees | | | — | | | | 419 | | | | — | | | | — | | |
| Payable for Professional Fees | | | 19 | | | | 17 | | | | 25 | | | | 19 | | |
| Payable for Administration Fees | | | — | @ | | | 15 | | | | — | @ | | | 1 | | |
| Payable for Custodian Fees | | | 1 | | | | 10 | | | | — | | | | 1 | | |
| Payable for Directors' Fees and Expenses | | | — | | | | 8 | | | | — | | | | 1 | | |
| Payable for Sub Transfer Agency Fees | | | — | | | | 8 | | | | — | | | | — | @ | |
| Payable for Transfer Agent Fees | | | 1 | | | | 1 | | | | 1 | | | | 4 | | |
| Payable for Distribution and Shareholder Servicing Fees — Class P | | | — | @ | | | 3 | | | | — | | | | — | @ | |
| Payable for Distribution and Shareholder Servicing Fees — Class H | | | — | @ | | | — | | | | — | @ | | | 1 | | |
| Payable for Distribution and Shareholder Servicing Fees — Class L | | | — | @ | | | — | | | | — | @ | | | — | @ | |
| Other Liabilities | | | 7 | | | | 29 | | | | — | @ | | | 10 | | |
| Total Liabilities | | | 28 | | | | 967 | | | | 619 | | | | 40 | | |
| Net Assets | | $ | 3,785 | | | $ | 227,004 | | | $ | 836 | | | $ | 13,611 | | |
| Net Assets Consist Of: | |
| Paid-in-Capital | | $ | 4,030 | | | $ | 211,872 | | | $ | 830 | | | $ | 11,686 | | |
| Distributions in Excess of Net Investment Income | | | (3 | ) | | | (— | @) | | | (— | @) | | | 1 | | |
| Accumulated Net Realized Gain (Loss) | | | 16 | | | | (4,658 | ) | | | — | | | | (148 | ) | |
| Unrealized Appreciation (Depreciation) on: | |
| Investments | | | (258 | ) | | | 19,785 | | | | 6 | | | | 2,072 | | |
| Foreign Currency Translations | | | (— | @) | | | 5 | | | | (— | @) | | | (— | @) | |
| Net Assets | | $ | 3,785 | | �� | $ | 227,004 | | | $ | 836 | | | $ | 13,611 | | |
The accompanying notes are an integral part of the financial statements.
128
2011 Annual Report
December 31, 2011
Statements of Assets and Liabilities (cont'd)
| | | Global
Discovery
Portfolio
(000) | | Global
Franchise
Portfolio
(000) | | Global Insight
Portfolio
(000) | | Global
Opportunity
Portfolio
(000) | |
| CLASS I: | |
| Net Assets | | $ | 2,446 | | | $ | 211,677 | | | $ | 10 | | | $ | 8,386 | | |
Shares Outstanding $0.001 par value shares of beneficial interest
(500,000,000 shares authorized) (not in 000's) | | | 269,977 | | | | 13,038,255 | | | | 1,000 | | | | 817,219 | | |
| Net Asset Value, Offering and Redemption Price Per Share | | $ | 9.06 | | | $ | 16.24 | | | $ | 10.07 | | | $ | 10.26 | | |
| CLASS P: | |
| Net Assets | | $ | 91 | | | $ | 15,327 | | | $ | — | | | $ | 10 | | |
Shares Outstanding $0.001 par value shares of beneficial interest
(500,000,000 shares authorized) (not in 000's) | | | 10,000 | | | | 957,303 | | | | — | | | | 937 | | |
| Net Asset Value, Offering and Redemption Price Per Share | | $ | 9.07 | | | $ | 16.01 | | | $ | — | | | $ | 10.21 | | |
| CLASS H: | |
| Net Assets | | $ | 1,157 | | | $ | — | | | $ | 816 | | | $ | 4,710 | | |
Shares Outstanding $0.001 par value shares of beneficial interest
500,000,000 shares authorized) (not in 000's) | | | 127,615 | | | | — | | | | 81,000 | | | | 462,623 | | |
| Net Asset Value, Redemption Price Per Share | | $ | 9.07 | | | $ | — | | | $ | 10.07 | | | $ | 10.18 | | |
| Maximum Sales Load | | | 4.75 | % | | | — | | | | 4.75 | % | | | 4.75 | % | |
| Maximum Sales Charge | | $ | 0.45 | | | $ | — | | | $ | 0.50 | | | $ | 0.51 | | |
| Maximum Offering Price Per Share | | $ | 9.52 | | | $ | — | | | $ | 10.57 | | | $ | 10.69 | | |
| CLASS L: | |
| Net Assets | | $ | 91 | | | $ | — | | | $ | 10 | | | $ | 505 | | |
Shares Outstanding $0.001 par value shares of beneficial interest
(500,000,000 shares authorized) (not in 000's) | | | 10,000 | | | | — | | | | 1,000 | | | | 49,780 | | |
| Net Asset Value, Offering and Redemption Price Per Share | | $ | 9.07 | | | $ | — | | | $ | 10.07 | | | $ | 10.15 | | |
@ Amount is less than $500.
The accompanying notes are an integral part of the financial statements.
129
2011 Annual Report
December 31, 2011
Statements of Assets and Liabilities
| | | Global Real
Estate
Portfolio
(000) | | International
Advantage
Portfolio
(000) | | International
Equity
Portfolio
(000) | | International
Opportunity
Portfolio
(000) | |
| Assets: | |
| Investments in Securities of Unaffiliated Issuers, at Cost | | $ | 1,609,865 | | | $ | 2,164 | | | $ | 3,846,095 | | | $ | 5,472 | | |
| Investments in Securities of Affiliated Issuers, at Cost | | | 45,225 | | | | — | | | | 168,991 | | | | 72 | | |
| Total Investments in Securities, at Cost | | | 1,655,090 | | | | 2,164 | | | | 4,015,086 | | | | 5,544 | �� | |
| Foreign Currency, at Cost | | | 7,166 | | | | — | @ | | | 1,179 | | | | — | | |
| Investments in Securities of Unaffiliated Issuers, at Value(1) | | | 1,430,755 | | | | 2,085 | | | | 3,816,597 | | | | 5,701 | | |
| Investments in Securities of Affiliated Issuers, at Value | | | 45,225 | | | | — | | | | 168,991 | | | | 72 | | |
| Total Investments in Securities, at Value(1) | | | 1,475,980 | | | | 2,085 | | | | 3,985,588 | | | | 5,773 | | |
| Foreign Currency, at Value | | | 7,059 | | | | — | @ | | | 1,184 | | | | — | | |
| Cash | | | 117 | | | | — | | | | 749 | | | | — | | |
| Dividends Receivable | | | 5,384 | | | | 1 | | | | 5,888 | | | | 3 | | |
| Receivable for Portfolio Shares Sold | | | 4,692 | | | | — | | | | 3,810 | | | | — | | |
| Tax Reclaim Receivable | | | 100 | | | | 2 | | | | 5,237 | | | | 5 | | |
| Receivable for Investments Sold | | | 1,763 | | | | 22 | | | | — | | | | — | | |
| Due from Adviser | | | — | | | | 38 | | | | — | | | | 51 | | |
| Receivable from Affiliate | | | 4 | | | | — | @ | | | 6 | | | | — | @ | |
| Other Assets | | | 11 | | | | 12 | | | | 46 | | | | 8 | | |
| Total Assets | | | 1,495,110 | | | | 2,160 | | | | 4,002,508 | | | | 5,840 | | |
| Liabilities: | |
| Collateral on Securities Loaned, at Value | | | — | | | | — | | | | 104,123 | | | | — | | |
| Payable for Portfolio Shares Redeemed | | | 6,012 | | | | — | | | | 12,800 | | | | — | | |
| Payable for Investment Advisory Fees | | | 3,059 | | | | — | | | | 7,845 | | | | — | | |
| Payable for Sub Transfer Agency Fees | | | 367 | | | | — | | | | 1,287 | | | | — | | |
| Payable for Investments Purchased | | | 1,619 | | | | — | @ | | | — | | | | — | | |
| Payable for Administration Fees | | | 98 | | | | — | @ | | | 261 | | | | — | @ | |
| Payable for Directors' Fees and Expenses | | | 13 | | | | — | | | | 216 | | | | — | @ | |
| Payable for Custodian Fees | | | 45 | | | | 1 | | | | 93 | | | | 2 | | |
| Payable for Professional Fees | | | 18 | | | | 18 | | | | 33 | | | | 23 | | |
| Payable for Transfer Agent Fees | | | 5 | | | | 1 | | | | 5 | | | | 1 | | |
| Bank Overdraft | | | — | | | | 7 | | | | — | | | | — | | |
| Payable for Distribution and Shareholder Servicing Fees — Class P | | | 28 | | | | — | @ | | | 194 | | | | — | @ | |
| Payable for Distribution and Shareholder Servicing Fees — Class L | | | 4 | | | | — | @ | | | — | | | | — | @ | |
| Payable for Distribution and Shareholder Servicing Fees — Class H | | | 2 | | | | — | @ | | | — | | | | — | @ | |
| Other Liabilities | | | 70 | | | | 1 | | | | 246 | | | | 22 | | |
| Total Liabilities | | | 11,340 | | | | 28 | | | | 127,103 | | | | 48 | | |
| Net Assets | | $ | 1,483,770 | | | $ | 2,132 | | | $ | 3,875,405 | | | $ | 5,792 | | |
| Net Assets Consist Of: | |
| Paid-in-Capital | | $ | 1,884,808 | | | $ | 2,218 | | | $ | 4,350,833 | | | $ | 5,632 | | |
| Undistributed (Distributions in Excess of) Net Investment Income | | | (5,172 | ) | | | — | | | | 667 | | | | (— | @) | |
| Accumulated Net Realized Loss | | | (216,659 | ) | | | (7 | ) | | | (446,698 | ) | | | (69 | ) | |
| Unrealized Appreciation (Depreciation) on: | |
| Investments | | | (179,110 | ) | | | (79 | ) | | | (29,498 | ) | | | 229 | | |
| Foreign Currency Translations | | | (97 | ) | | | (— | @) | | | 101 | | | | (— | @) | |
| Net Assets | | $ | 1,483,770 | | | $ | 2,132 | | | $ | 3,875,405 | | | $ | 5,792 | | |
The accompanying notes are an integral part of the financial statements.
130
2011 Annual Report
December 31, 2011
Statements of Assets and Liabilities (cont'd)
| | | Global Real
Estate
Portfolio
(000) | | International
Advantage
Portfolio
(000) | | International
Equity
Portfolio
(000) | | International
Opportunity
Portfolio
(000) | |
| CLASS I: | |
| Net Assets | | $ | 1,337,853 | | | $ | 1,255 | | | $ | 2,959,403 | | | $ | 4,822 | | |
Shares Outstanding $0.001 par value shares of beneficial interest
(500,000,000 shares authorized) (not in 000's) | | | 172,222,661 | | | | 130,120 | | | | 241,669,215 | | | | 470,000 | | |
| Net Asset Value, Offering and Redemption Price Per Share | | $ | 7.77 | | | $ | 9.65 | | | $ | 12.25 | | | $ | 10.26 | | |
| CLASS P: | |
| Net Assets | | $ | 130,244 | | | $ | 96 | | | $ | 916,002 | | | $ | 103 | | |
Shares Outstanding $0.001 par value shares of beneficial interest
(500,000,000 shares authorized) (not in 000's) | | | 16,842,829 | | | | 10,000 | | | | 75,652,051 | | | | 10,000 | | |
| Net Asset Value, Offering and Redemption Price Per Share | | $ | 7.73 | | | $ | 9.65 | | | $ | 12.11 | | | $ | 10.26 | | |
| CLASS H: | |
| Net Assets | | $ | 9,255 | | | $ | 684 | | | $ | — | | | $ | 765 | | |
Shares Outstanding $0.001 par value shares of beneficial interest
500,000,000 shares authorized) (not in 000's) | | | 1,199,459 | | | | 70,855 | | | | — | | | | 74,551 | | |
| Net Asset Value, Redemption Price Per Share | | $ | 7.72 | | | $ | 9.65 | | | $ | — | | | $ | 10.26 | | |
| Maximum Sales Load | | | 4.75 | % | | | 4.75 | % | | | — | | | | 4.75 | % | |
| Maximum Sales Charge | | $ | 0.39 | | | $ | 0.48 | | | $ | — | | | $ | 0.51 | | |
| Maximum Offering Price Per Share | | $ | 8.11 | | | $ | 10.13 | | | $ | — | | | $ | 10.77 | | |
| CLASS L: | |
| Net Assets | | $ | 6,418 | | | $ | 97 | | | $ | — | | | $ | 102 | | |
Shares Outstanding $0.001 par value shares of beneficial interest
(500,000,000 shares authorized) (not in 000's) | | | 841,173 | | | | 10,000 | | | | — | | | | 10,000 | | |
| Net Asset Value, Offering and Redemption Price Per Share | | $ | 7.63 | | | $ | 9.65 | | | $ | — | | | $ | 10.22 | | |
(1) Including:
Securities on Loan, at Value: | | $ | — | | | $ | — | | | $ | 100,073 | | | $ | — | | |
@ Amount is less than $500.
The accompanying notes are an integral part of the financial statements.
131
2011 Annual Report
December 31, 2011
Statements of Assets and Liabilities
| | | International
Real Estate
Portfolio
(000) | | International
Small Cap
Portfolio
(000) | | Select Global
Infrastructure
Portfolio
(000) | | Advantage
Portfolio
(000) | |
| Assets: | |
| Investments in Securities of Unaffiliated Issuers, at Cost | | $ | 404,077 | | | $ | 359,137 | | | $ | 11,025 | | | $ | 6,888 | | |
| Investments in Securities of Affiliated Issuers, at Cost | | | 83 | | | | 9,221 | | | | 361 | | | | 386 | | |
| Total Investments in Securities, at Cost | | | 404,160 | | | | 368,358 | | | | 11,386 | | | | 7,274 | | |
| Foreign Currency, at Cost | | | 10 | | | | 312 | | | | 4 | | | | — | | |
| Investments in Securities of Unaffiliated Issuers, at Value | | | 210,565 | | | | 289,635 | | | | 12,492 | | | | 8,042 | | |
| Investments in Securities of Affiliated Issuers, at Value | | | 83 | | | | 9,221 | | | | 361 | | | | 386 | | |
| Total Investments in Securities, at Value | | | 210,648 | | | | 298,856 | | | | 12,853 | | | | 8,428 | | |
| Foreign Currency, at Value | | | 6 | | | | 311 | | | | 4 | | | | — | | |
| Dividends Receivable | | | 967 | | | | 450 | | | | 57 | | | | 13 | | |
| Tax Reclaim Receivable | | | 67 | | | | 861 | | | | 1 | | | | 1 | | |
| Receivable for Investments Sold | | | 162 | | | | 174 | | | | — | | | | — | | |
| Receivable for Portfolio Shares Sold | | | 59 | | | | 169 | | | | — | | | | — | | |
| Due from Adviser | | | — | | | | — | | | | 44 | | | | 20 | | |
| Receivable from Affiliate | | | — | @ | | | 1 | | | | — | @ | | | — | @ | |
| Other Assets | | | 8 | | | | 6 | | | | 8 | | | | 14 | | |
| Total Assets | | | 211,917 | | | | 300,828 | | | | 12,967 | | | | 8,476 | | |
| Liabilities: | |
| Payable for Investments Purchased | | | 20 | | | | 2,751 | | | | — | | | | — | | |
| Payable for Investment Advisory Fees | | | 483 | | | | 685 | | | | — | | | | — | | |
| Payable for Portfolio Shares Redeemed | | | 206 | | | | 935 | | | | — | | | | — | | |
| Payable for Sub Transfer Agency Fees | | | 27 | | | | 130 | | | | — | | | | — | @ | |
| Payable for Professional Fees | | | 18 | | | | 20 | | | | 17 | | | | 16 | | |
| Payable for Custodian Fees | | | 23 | | | | 32 | | | | 7 | | | | 1 | | |
| Unrealized Depreciation on Foreign Currency Exchange Contracts | | | — | | | | 38 | | | | — | | | | — | | |
| Payable for Administration Fees | | | 15 | | | | 20 | | | | 1 | | | | 1 | | |
| Payable for Directors' Fees and Expenses | | | 7 | | | | 19 | | | | — | | | | 1 | | |
| Payable for Transfer Agent Fees | | | 2 | | | | 2 | | | | 1 | | | | 1 | | |
| Payable for Distribution and Shareholder Servicing Fees — Class P | | | 1 | | | | 17 | | | | — | @ | | | — | @ | |
| Payable for Distribution and Shareholder Servicing Fees — Class H | | | — | | | | — | | | | — | @ | | | — | @ | |
| Payable for Distribution and Shareholder Servicing Fees — Class L | | | — | | | | — | | | | — | @ | | | — | @ | |
| Other Liabilities | | | 20 | | | | 26 | | | | 7 | | | | 2 | | |
| Total Liabilities | | | 822 | | | | 4,675 | | | | 33 | | | | 22 | | |
| Net Assets | | $ | 211,095 | | | $ | 296,153 | | | $ | 12,934 | | | $ | 8,454 | | |
| Net Assets Consist Of: | |
| Paid-in-Capital | | $ | 881,830 | | | $ | 440,183 | | | $ | 11,442 | | | $ | 7,371 | | |
| Undistributed (Distributions in Excess of) Net Investment Income | | | 4,965 | | | | 2,489 | | | | (— | @) | | | (22 | ) | |
| Accumulated Net Realized Gain (Loss) | | | (482,188 | ) | | | (77,154 | ) | | | 25 | | | | (49 | ) | |
| Unrealized Appreciation (Depreciation) on: | |
| Investments | | | (193,512 | ) | | | (69,502 | ) | | | 1,467 | | | | 1,154 | | |
| Foreign Currency Exchange Contracts | | | — | | | | (38 | ) | | | — | | | | — | | |
| Foreign Currency Translations | | | (— | @) | | | 175 | | | | (— | @) | | | (— | @) | |
| Net Assets | | $ | 211,095 | | | $ | 296,153 | | | $ | 12,934 | | | $ | 8,454 | | |
The accompanying notes are an integral part of the financial statements.
132
2011 Annual Report
December 31, 2011
Statements of Assets and Liabilities (cont'd)
| | | International
Real Estate
Portfolio
(000) | | International
Small Cap
Portfolio
(000) | | Select Global
Infrastructure
Portfolio
(000) | | Advantage
Portfolio
(000) | |
| CLASS I: | |
| Net Assets | | $ | 207,695 | | | $ | 213,983 | | | $ | 12,589 | | | $ | 7,239 | | |
Shares Outstanding $0.001 par value shares of beneficial interest
(500,000,000 shares authorized) (not in 000's) | | | 14,168,840 | | | | 18,991,278 | | | | 1,094,867 | | | | 636,315 | | |
| Net Asset Value, Offering and Redemption Price Per Share | | $ | 14.66 | | | $ | 11.27 | | | $ | 11.50 | | | $ | 11.38 | | |
| CLASS P: | |
| Net Assets | | $ | 3,400 | | | $ | 82,170 | | | $ | 115 | | | $ | 11 | | |
Shares Outstanding $0.001 par value shares of beneficial interest
(500,000,000 shares authorized) (not in 000's) | | | 232,037 | | | | 7,340,375 | | | | 10,000 | | | | 967 | | |
| Net Asset Value, Offering and Redemption Price Per Share | | $ | 14.65 | | | $ | 11.19 | | | $ | 11.50 | | | $ | 11.37 | | |
| CLASS H: | |
| Net Assets | | $ | — | | | $ | — | | | $ | 115 | | | $ | 996 | | |
Shares Outstanding $0.001 par value shares of beneficial interest
500,000,000 shares authorized) (not in 000's) | | | — | | | | — | | | | 10,000 | | | | 87,674 | | |
| Net Asset Value, Redemption Price Per Share | | $ | — | | | $ | — | | | $ | 11.50 | | | $ | 11.37 | | |
| Maximum Sales Load | | | — | | | | — | | | | 4.75 | % | | | 4.75 | % | |
| Maximum Sales Charge | | $ | — | | | $ | — | | | $ | 0.57 | | | $ | 0.57 | | |
| Maximum Offering Price Per Share | | $ | — | | | $ | — | | | $ | 12.07 | | | $ | 11.94 | | |
| CLASS L: | |
| Net Assets | | $ | — | | | $ | — | | | $ | 115 | | | $ | 208 | | |
Shares Outstanding $0.001 par value shares of beneficial interest
(500,000,000 shares authorized) (not in 000's) | | | — | | | | — | | | | 10,000 | | | | 18,234 | | |
| Net Asset Value, Offering and Redemption Price Per Share | | $ | — | | | $ | — | | | $ | 11.50 | | | $ | 11.39 | | |
@ Amount is less than $500.
The accompanying notes are an integral part of the financial statements.
133
2011 Annual Report
December 31, 2011
Statements of Assets and Liabilities
| | | Focus Growth
Portfolio
(000) | | Growth
Portfolio
(000) | | Insight
Portfolio
(000) | | Opportunity
Portfolio
(000) | |
| Assets: | |
| Investments in Securities of Unaffiliated Issuers, at Cost | | $ | 22,352 | | | $ | 625,784 | | | $ | 657 | | | $ | 208,176 | | |
| Investments in Securities of Affiliated Issuers, at Cost | | | 1,727 | | | | 14,976 | | | | 830 | | | | 1,625 | | |
| Total Investments in Securities, at Cost | | | 24,079 | | | | 640,760 | | | | 1,487 | | | | 209,801 | | |
| Investments in Securities of Unaffiliated Issuers, at Value | | | 22,287 | | | | 763,818 | | | | 662 | | | | 244,568 | | |
| Investments in Securities of Affiliated Issuers, at Value | | | 1,727 | | | | 15,010 | | | | 830 | | | | 1,625 | | |
| Total Investments in Securities, at Value | | | 24,014 | | | | 778,828 | | | | 1,492 | | | | 246,193 | | |
| Receivable for Investments Sold | | | — | | | | — | | | | — | | | | 2,956 | | |
| Receivable for Portfolio Shares Sold | | | — | @ | | | 767 | | | | — | | | | 77 | | |
| Dividends Receivable | | | 15 | | | | 414 | | | | — | | | | 74 | | |
| Tax Reclaim Receivable | | | 1 | | | | 220 | | | | — | | | | — | | |
| Due from Adviser | | | — | | | | — | | | | 26 | | | | — | | |
| Receivable from Affiliate | | | — | @ | | | 1 | | | | — | @ | | | — | @ | |
| Other Assets | | | — | @ | | | 14 | | | | — | | | | 7 | | |
| Total Assets | | | 24,030 | | | | 780,244 | | | | 1,518 | | | | 249,307 | | |
| Liabilities: | |
| Payable for Portfolio Shares Redeemed | | | 4 | | | | 20,325 | | | | — | | | | 159 | | |
| Payable for Investments Purchased | | | 11 | | | | 259 | | | | 657 | | | | 4,589 | | |
| Payable for Investment Advisory Fees | | | 14 | | | | 1,008 | | | | — | | | | 189 | | |
| Payable for Sub Transfer Agency Fees | | | 2 | | | | 486 | | | | — | | | | 138 | | |
| Payable for Professional Fees | | | 19 | | | | 23 | | | | 25 | | | | 22 | | |
| Payable for Administration Fees | | | 2 | | | | 53 | | | | — | @ | | | 17 | | |
| Payable for Transfer Agent Fees | | | 1 | | | | 1 | | | | 1 | | | | 52 | | |
| Payable for Directors' Fees and Expenses | | | 6 | | | | 47 | | | | — | | | | 2 | | |
| Payable for Custodian Fees | | | 3 | | | | 9 | | | | — | @ | | | 8 | | |
| Payable for Distribution and Shareholder Servicing Fees — Class P | | | — | @ | | | 29 | | | | — | | | | — | @ | |
| Payable for Distribution and Shareholder Servicing Fees — Class H | | | — | | | | — | | | | — | @ | | | 39 | | |
| Payable for Distribution and Shareholder Servicing Fees — Class L | | | — | | | | — | | | | — | @ | | | 19 | | |
| Other Liabilities | | | 3 | | | | 34 | | | | — | @ | | | 23 | | |
| Total Liabilities | | | 65 | | | | 22,274 | | | | 683 | | | | 5,257 | | |
| Net Assets | | $ | 23,965 | | | $ | 757,970 | | | $ | 835 | | | $ | 244,050 | | |
| Net Assets Consist Of: | |
| Paid-in-Capital | | $ | 24,316 | | | $ | 712,038 | | | $ | 830 | | | $ | 218,709 | | |
| Undistributed (Distributions in Excess of) Net Investment Income | | | 2 | | | | 24 | | | | — | | | | (13 | ) | |
| Accumulated Net Realized Gain (Loss) | | | (288 | ) | | | (92,160 | ) | | | — | | | | (11,037 | ) | |
| Unrealized Appreciation (Depreciation) on: | |
| Investments | | | (65 | ) | | | 138,034 | | | | 5 | | | | 36,392 | | |
| Investments in Affiliates | | | — | | | | 34 | | | | — | | | | — | | |
| Foreign Currency Translations | | | (— | @) | | | — | @ | | | — | | | | (1 | ) | |
| Net Assets | | $ | 23,965 | | | $ | 757,970 | | | $ | 835 | | | $ | 244,050 | | |
The accompanying notes are an integral part of the financial statements.
134
2011 Annual Report
December 31, 2011
Statements of Assets and Liabilities (cont'd)
| | | Focus Growth
Portfolio
(000) | | Growth
Portfolio
(000) | | Insight
Portfolio
(000) | | Opportunity
Portfolio
(000) | |
| CLASS I: | |
| Net Assets | | $ | 22,377 | | | $ | 622,193 | | | $ | 10 | | | $ | 13,183 | | |
Shares Outstanding $0.001 par value shares of beneficial interest
(500,000,000 shares authorized) (not in 000's) | | | 1,232,994 | | | | 26,520,577 | | | | 1,000 | | | | 869,590 | | |
| Net Asset Value, Offering and Redemption Price Per Share | | $ | 18.15 | | | $ | 23.46 | | | $ | 10.06 | | | $ | 15.16 | | |
| CLASS P: | |
| Net Assets | | $ | 1,588 | | | $ | 135,777 | | | $ | — | | | $ | 2,098 | | |
Shares Outstanding $0.001 par value shares of beneficial interest
(500,000,000 shares authorized) (not in 000's) | | | 90,406 | | | | 5,895,774 | | | | — | | | | 139,109 | | |
| Net Asset Value, Offering and Redemption Price Per Share | | $ | 17.57 | | | $ | 23.03 | | | $ | — | | | $ | 15.08 | | |
| CLASS H: | |
| Net Assets | | $ | — | | | $ | — | | | $ | 815 | | | $ | 198,010 | | |
Shares Outstanding $0.001 par value shares of beneficial interest
500,000,000 shares authorized) (not in 000's) | | | — | | | | — | | | | 81,000 | | | | 13,277,867 | | |
| Net Asset Value, Redemption Price Per Share | | $ | — | | | $ | — | | | $ | 10.06 | | | $ | 14.91 | | |
| Maximum Sales Load | | | — | | | | — | | | | 4.75 | % | | | 4.75 | % | |
| Maximum Sales Charge | | $ | — | | | $ | — | | | $ | 0.50 | | | $ | 0.74 | | |
| Maximum Offering Price Per Share | | $ | — | | | $ | — | | | $ | 10.56 | | | $ | 15.65 | | |
| CLASS L: | |
| Net Assets | | $ | — | | | $ | — | | | $ | 10 | | | $ | 30,759 | | |
Shares Outstanding $0.001 par value shares of beneficial interest
(500,000,000 shares authorized) (not in 000's) | | | — | | | | — | | | | 1,000 | | | | 2,266,710 | | |
| Net Asset Value, Offering and Redemption Price Per Share | | $ | — | | | $ | — | | | $ | 10.06 | | | $ | 13.57 | | |
@ Amount is less than $500.
The accompanying notes are an integral part of the financial statements.
135
2011 Annual Report
December 31, 2011
Statements of Assets and Liabilities
| | | Small
Company
Growth
Portfolio
(000) | | U.S. Real
Estate
Portfolio
(000) | | Emerging
Markets Debt
Portfolio
(000) | |
| Assets: | |
| Investments in Securities of Unaffiliated Issuers, at Cost | | $ | 1,176,083 | | | $ | 815,928 | | | $ | 74,655 | | |
| Investments in Securities of Affiliated Issuers, at Cost | | | 31,544 | | | | 4,679 | | | | 12,670 | | |
| Total Investments in Securities, at Cost | | | 1,207,627 | | | | 820,607 | | | | 87,325 | | |
| Foreign Currency, at Cost | | | — | | | | — | | | | 628 | | |
| Investments in Securities of Unaffiliated Issuers, at Value(1) | | | 1,369,824 | | | | 894,143 | | | | 69,738 | | |
| Investments in Securities of Affiliated Issuers, at Value | | | 31,544 | | | | 4,679 | | | | 12,670 | | |
| Total Investments in Securities, at Value(1) | | | 1,401,368 | | | | 898,822 | | | | 82,408 | | |
| Foreign Currency, at Value | | | — | | | | — | | | | 595 | | |
| Cash | | | — | | | | 197 | | | | 7 | | |
| Receivable for Investments Sold | | | 6 | | | | 10,427 | | | | — | | |
| Dividends Receivable | | | 695 | | | | 2,594 | | | | — | | |
| Receivable for Portfolio Shares Sold | | | 854 | | | | 788 | | | | 1,226 | | |
| Interest Receivable | | | — | | | | — | | | | 1,625 | | |
| Receivable from Affiliate | | | 2 | | | | — | @ | | | 1 | | |
| Unrealized Appreciation on Foreign Currency Exchange Contracts | | | — | | | | — | | | | 2 | | |
| Other Assets | | | 23 | | | | 21 | | | | 8 | | |
| Total Assets | | | 1,402,948 | | | | 912,849 | | | | 85,872 | | |
| Liabilities: | |
| Collateral on Securities Loaned, at Value | | | — | | | | — | | | | 993 | | |
| Payable for Portfolio Shares Redeemed | | | 7,905 | | | | 11,470 | | | | 358 | | |
| Payable for Investment Advisory Fees | | | 2,936 | | | | 1,559 | | | | 86 | | |
| Payable for Sub Transfer Agency Fees | | | 668 | | | | 562 | | | | 9 | | |
| Payable for Investments Purchased | | | — | | | | 1,200 | | | | — | | |
| Payable for Administration Fees | | | 95 | | | | 60 | | | | 6 | | |
| Unrealized Depreciation on Foreign Currency Exchange Contracts | | | — | | | | — | | | | 101 | | |
| Payable for Professional Fees | | | 16 | | | | 28 | | | | 28 | | |
| Payable for Directors' Fees and Expenses | | | 32 | | | | 31 | | | | 6 | | |
| Payable for Custodian Fees | | | 16 | | | | 8 | | | | 10 | | |
| Payable for Transfer Agent Fees | | | — | @ | | | 23 | | | | 1 | | |
| Payable for Distribution and Shareholder Servicing Fees — Class P | | | 61 | | | | 19 | | | | 1 | | |
| Payable for Distribution and Shareholder Servicing Fees — Class H | | | 7 | | | | 6 | | | | 1 | | |
| Payable for Distribution and Shareholder Servicing Fees — Class L | | | 1 | | | | 4 | | | | 3 | | |
| Payable for Reorganization Expense | | | 71 | | | | 74 | | | | — | | |
| Other Liabilities | | | 97 | | | | 97 | | | | 8 | | |
| Total Liabilities | | | 11,905 | | | | 15,141 | | | | 1,611 | | |
| Net Assets | | $ | 1,391,043 | | | $ | 897,708 | | | $ | 84,261 | | |
| Net Assets Consist Of: | |
| Paid-in-Capital | | $ | 1,201,953 | | | $ | 825,730 | | | $ | 90,155 | | |
| Undistributed (Distributions in Excess of) Net Investment Income | | | (832 | ) | | | 1,239 | | | | (9 | ) | |
| Accumulated Net Realized Loss | | | (3,819 | ) | | | (7,476 | ) | | | (754 | ) | |
| Unrealized Appreciation (Depreciation) on: | |
| Investments | | | 193,741 | | | | 78,215 | | | | (4,917 | ) | |
| Foreign Currency Exchange Contracts | | | — | | | | — | | | | (99 | ) | |
| Foreign Currency Translations | | | (— | @) | | | — | | | | (115 | ) | |
| Net Assets | | $ | 1,391,043 | | | $ | 897,708 | | | $ | 84,261 | | |
The accompanying notes are an integral part of the financial statements.
136
2011 Annual Report
December 31, 2011
Statements of Assets and Liabilities (cont'd)
| | | Small
Company
Growth
Portfolio
(000) | | U.S. Real
Estate
Portfolio
(000) | | Emerging
Markets Debt
Portfolio
(000) | |
| CLASS I: | |
| Net Assets | | $ | 1,074,392 | | | $ | 773,138 | | | $ | 69,557 | | |
Shares Outstanding $0.001 par value shares of beneficial interest (500,000,000 shares authorized)
(not in 000's) | | | 84,996,018 | | | | 51,585,058 | | | | 6,191,763 | | |
| Net Asset Value, Offering and Redemption Price Per Share | | $ | 12.64 | | | $ | 14.99 | | | $ | 11.23 | | |
| CLASS P: | |
| Net Assets | | $ | 282,988 | | | $ | 92,047 | | | $ | 6,784 | | |
Shares Outstanding $0.001 par value shares of beneficial interest (500,000,000 shares authorized)
(not in 000's) | | | 23,989,389 | | | | 6,259,573 | | | | 587,893 | | |
| Net Asset Value, Offering and Redemption Price Per Share | | $ | 11.80 | | | $ | 14.70 | | | $ | 11.54 | | |
| CLASS H: | |
| Net Assets | | $ | 32,006 | | | $ | 26,644 | | | $ | 2,955 | | |
Shares Outstanding $0.001 par value shares of beneficial interest 500,000,000 shares authorized)
(not in 000's) | | | 2,712,708 | | | | 1,812,119 | | | | 256,052 | | |
| Net Asset Value, Redemption Price Per Share | | $ | 11.80 | | | $ | 14.70 | | | $ | 11.54 | | |
| Maximum Sales Load | | | 4.75 | % | | | 4.75 | % | | | 3.50 | % | |
| Maximum Sales Charge | | $ | 0.59 | | | $ | 0.73 | | | $ | 0.42 | | |
| Maximum Offering Price Per Share | | $ | 12.39 | | | $ | 15.43 | | | $ | 11.96 | | |
| CLASS L: | |
| Net Assets | | $ | 1,657 | | | $ | 5,879 | | | $ | 4,965 | | |
Shares Outstanding $0.001 par value shares of beneficial interest (500,000,000 shares authorized)
(not in 000's) | | | 140,550 | | | | 400,121 | | | | 438,257 | | |
| Net Asset Value, Offering and Redemption Price Per Share | | $ | 11.79 | | | $ | 14.69 | | | $ | 11.33 | | |
(1) Including:
Securities on Loan, at Value: | | $ | — | | | $ | — | | | $ | 841 | | |
@ Amount is less than $500.
The accompanying notes are an integral part of the financial statements.
137
2011 Annual Report
December 31, 2011
Statements of Operations
| | | Active
International
Allocation
Portfolio
(000) | | Asian Equity
Portfolio
(000) | | Emerging
Markets
Portfolio
(000) | | Global
Advantage
Portfolio
(000) | | Global
Discovery
Portfolio
(000) | |
| Investment Income: | |
| Dividends from Securities of Unaffiliated Issuers | | $ | 13,415 | | | $ | 24 | | | $ | 44,154 | | | $ | 43 | | | $ | 82 | | |
| Income from Securities Loaned — Net | | | 540 | | | | — | | | | 372 | | | | — | | | | — | | |
| Dividends from Securities of Affiliated Issuers | | | 60 | | | | — | @ | | | 48 | | | | — | @ | | | — | @ | |
| Interest from Securities of Unaffiliated Issuers | | | 10 | | | | — | @ | | | 3 | | | | — | | | | — | | |
| Less: Foreign Taxes Withheld | | | (1,164 | )* | | | (3 | ) | | | (4,376 | ) | | | (3 | ) | | | (7 | ) | |
| Total Investment Income | | | 12,861 | | | | 21 | | | | 40,201 | | | | 40 | | | | 75 | | |
| Expenses: | |
| Investment Advisory Fees (Note B) | | | 2,635 | | | | 14 | | | | 20,512 | | | | 19 | | | | 25 | | |
| Custodian Fees (Note F) | | | 283 | | | | 19 | | | | 1,522 | | | | 10 | | | | 11 | | |
| Sub Transfer Agency Fees | | | 271 | | | | — | | | | 1,522 | | | | — | | | | — | | |
| Administration Fees (Note C) | | | 324 | | | | 1 | | | | 1,375 | | | | 2 | | | | 2 | | |
| Professional Fees | | | 75 | | | | 66 | | | | 133 | | | | 62 | | | | 60 | | |
| Shareholder Reporting Fees | | | 82 | | | | 15 | | | | 191 | | | | 8 | | | | 10 | | |
| Registration Fees | | | 40 | | | | 28 | | | | 50 | | | | 27 | | | | 17 | | |
| Pricing Fees | | | 64 | | | | 7 | | | | 16 | | | | 6 | | | | 5 | | |
| Transfer Agency Fees (Note E) | | | 19 | | | | 12 | | | | 31 | | | | 13 | | | | 13 | | |
| Directors' Fees and Expenses | | | 14 | | | | — | @ | | | 55 | | | | — | @ | | | — | @ | |
| Distribution and Shareholder Servicing Fees — Class P (Note D) | | | 34 | | | | — | @ | | | 202 | | | | — | @ | | | — | @ | |
| Distribution and Shareholder Servicing Fees — Class H (Note D) | | | — | | | | — | @ | | | — | | | | 2 | | | | 3 | | |
| Distribution and Shareholder Servicing Fees — Class L (Note D) | | | — | | | | 1 | | | | — | | | | 1 | | | | 1 | | |
| Other Expenses | | | 24 | | | | 11 | | | | 130 | | | | 11 | | | | 8 | | |
| Total Expenses | | | 3,865 | | | | 174 | | | | 25,739 | | | | 161 | | | | 155 | | |
| Waiver of Investment Advisory Fees (Note B) | | | (407 | ) | | | (14 | ) | | | — | | | | (19 | ) | | | (25 | ) | |
| Expenses Reimbursed by Advisor (Note B) | | | — | | | | (138 | ) | | | — | | | | (111 | ) | | | (90 | ) | |
| Rebate from Morgan Stanley Affiliate (Note G-2) | | | (26 | ) | | | (— | @) | | | (225 | ) | | | (— | @) | | | (— | @) | |
| Net Expenses | | | 3,432 | | | | 22 | | | | 25,514 | | | | 31 | | | | 40 | | |
| Net Investment Income (Loss) | | | 9,429 | | | | (1 | ) | | | 14,687 | | | | 9 | | | | 35 | | |
| Realized Gain (Loss): | |
| Investments Sold | | | 30,565 | ** | | | (69 | ) | | | 105,110 | ** | | | — | @ | | | 18 | | |
| Investments in Affiliates | | | (81 | ) | | | — | | | | 5,322 | | | | — | | | | — | | |
| Foreign Currency Exchange Contracts | | | (2,377 | ) | | | — | | | | (4,951 | ) | | | — | | | | 12 | | |
| Foreign Currency Transactions | | | (814 | ) | | | (1 | ) | | | (3,286 | ) | | | (1 | ) | | | (4 | ) | |
| Futures Contracts | | | (6,806 | ) | | | — | | | | — | | | | — | | | | — | | |
| Net Realized Gain (Loss) | | | 20,487 | | | | (70 | ) | | | 102,195 | | | | (1 | ) | | | 26 | | |
| Change in Unrealized Appreciation (Depreciation): | |
| Investments | | | (88,128 | )*** | | | (190 | )*** | | | (443,008 | )*** | | | 16 | | | | (256 | ) | |
| Investments in Affiliates | | | (199 | ) | | | — | | | | (12,879 | ) | | | — | | | | — | | |
| Foreign Currency Exchange Contracts | | | (47 | ) | | | — | | | | — | | | | — | | | | — | | |
| Foreign Currency Translations | | | (316 | ) | | | — | @ | | | (63 | ) | | | 1 | | | | 1 | | |
| Futures Contracts | | | (232 | ) | | | — | | | | — | | | | — | | | | — | | |
| Net Change in Unrealized Appreciation (Depreciation) | | | (88,922 | ) | | | (190 | ) | | | (455,950 | ) | | | 17 | | | | (255 | ) | |
Total Net Realized Gain (Loss) and Change in Unrealized
Appreciation (Depreciation) | | | (68,435 | ) | | | (260 | ) | | | (353,755 | ) | | | 16 | | | | (229 | ) | |
| Net Increase (Decrease) in Net Assets Resulting from Operations | | $ | (59,006 | ) | | $ | (261 | ) | | $ | (339,068 | ) | | $ | 25 | | | $ | (194 | ) | |
* Including Foreign Taxes Withheld from Securities of Affiliated Issuers of approximately $3,000 for Active International Allocation Portfolio.
** Net of Capital Gain Country Tax of approximately $6,000 and $1,732,000 for Active International Allocation Portfolio and Emerging Markets Portfolio, respectively.
*** Net of Increase (Decrease) in Deferred Capital Gain Country Tax Accrual of approximately $1,000, $—@, and $(3,070,000) for Active International Allocation Portfolio, Asian Equity Portfolio, and Emerging Markets Portfolio, respectively.
@ Amount is less than $500.
The accompanying notes are an integral part of the financial statements.
138
2011 Annual Report
December 31, 2011
Statements of Operations
| | | Global
Franchise
Portfolio
(000) | | Global
Insight*
Portfolio
(000) | | Global
Opportunity
Portfolio
(000) | | Global Real
Estate
Portfolio
(000) | | International
Advantage
Portfolio
(000) | |
| Investment Income: | |
| Dividends from Securities of Unaffiliated Issuers | | $ | 5,216 | | | $ | — | | | $ | 174 | | | $ | 41,914 | | | $ | 55 | | |
| Dividends from Securities of Affiliated Issuers | | | 2 | | | | — | @ | | | — | @ | | | 63 | | | | — | @ | |
| Interest from Securities of Unaffiliated Issuers | | | — | | | | — | | | | 5 | | | | 10 | | | | — | | |
| Less: Foreign Taxes Withheld | | | (172 | ) | | | — | | | | (7 | ) | | | (2,001 | ) | | | (4 | ) | |
| Total Investment Income | | | 5,046 | | | | — | @ | | | 172 | | | | 39,986 | | | | 51 | | |
| Expenses: | |
| Investment Advisory Fees (Note B) | | | 1,408 | | | | — | @ | | | 112 | | | | 12,782 | | | | 19 | | |
| Administration Fees (Note C) | | | 141 | | | | — | @ | | | 10 | | | | 1,203 | | | | 2 | | |
| Sub Transfer Agency Fees | | | 9 | | | | — | | | | 2 | | | | 811 | | | | — | | |
| Custodian Fees (Note F) | | | 49 | | | | — | @ | | | 18 | | | | 275 | | | | 7 | | |
| Professional Fees | | | 63 | | | | 25 | | | | 55 | | | | 74 | | | | 58 | | |
| Shareholder Reporting Fees | | | 11 | | | | — | @ | | | 8 | | | | 205 | | | | 10 | | |
| Registration Fees | | | 51 | | | | — | | | | 47 | | | | 109 | | | | 27 | | |
| Transfer Agency Fees (Note E) | | | 21 | | | | 1 | | | | 34 | | | | 56 | | | | 12 | | |
| Offering Costs | | | — | | | | — | | | | 52 | | | | — | | | | — | | |
| Directors' Fees and Expenses | | | 5 | | | | — | | | | 1 | | | | 44 | | | | — | @ | |
| Pricing Fees | | | 5 | | | | — | @ | | | 4 | | | | 14 | | | | 6 | | |
| Distribution and Shareholder Servicing Fees — Class P (Note D) | | | 33 | | | | — | | | | — | @ | | | 277 | | | | — | @ | |
| Distribution and Shareholder Servicing Fees — Class H (Note D) | | | — | | | | — | @ | | | 14 | | | | 28 | | | | 2 | | |
| Distribution and Shareholder Servicing Fees — Class L (Note D) | | | — | | | | — | @ | | | 4 | | | | 54 | | | | 1 | | |
| Other Expenses | | | 13 | | | | — | | | | 20 | | | | 46 | | | | 10 | | |
| Total Expenses | | | 1,809 | | | | 26 | | | | 381 | | | | 15,978 | | | | 154 | | |
| Waiver of Investment Advisory Fees (Note B) | | | (16 | ) | | | (— | @) | | | (112 | ) | | | (2 | ) | | | (19 | ) | |
| Distribution Fees- Class L Shares Waived (Note D) | | | — | | | | — | | | | (3 | ) | | | — | | | | — | | |
| Expenses Reimbursed by Advisor (Note B) | | | — | | | | (26 | ) | | | (96 | ) | | | — | | | | (107 | ) | |
| Rebate from Morgan Stanley Affiliate (Note G-2) | | | (9 | ) | | | — | | | | (— | @) | | | (58 | ) | | | (— | @) | |
| Net Expenses | | | 1,784 | | | | — | @ | | | 170 | | | | 15,918 | | | | 28 | | |
| Net Investment Income (Loss) | | | 3,262 | | | | (— | @) | | | 2 | | | | 24,068 | | | | 23 | | |
| Realized Gain (Loss): | |
| Investments Sold | | | 5,691 | | | | — | | | | 855 | | | | 101,663 | | | | 12 | | |
| Foreign Currency Transactions | | | 24 | | | | (— | @) | | | (1 | ) | | | 123 | | | | 1 | | |
| Net Realized Gain (Loss) | | | 5,715 | | | | (— | @) | | | 854 | | | | 101,786 | | | | 13 | | |
| Change in Unrealized Appreciation (Depreciation): | |
| Investments | | | 4,046 | | | | 6 | | | | (1,351 | ) | | | (268,175 | ) | | | (77 | ) | |
| Foreign Currency Translations | | | (11 | ) | | | — | | | | — | | | | (176 | ) | | | (1 | ) | |
| Net Change in Unrealized Appreciation (Depreciation) | | | 4,035 | | | | 6 | | | | (1,351 | ) | | | (268,351 | ) | | | (78 | ) | |
Total Net Realized Gain (Loss) and Change in Unrealized
Appreciation (Depreciation) | | | 9,750 | | | | 6 | | | | (497 | ) | | | (166,565 | ) | | | (65 | ) | |
| Net Increase (Decrease) in Net Assets Resulting from Operations | | $ | 13,012 | | | $ | 6 | | | $ | (495 | ) | | $ | (142,497 | ) | | $ | (42 | ) | |
* Commencement of Operations December 28, 2011.
@ Amount is less than $500.
The accompanying notes are an integral part of the financial statements.
139
2011 Annual Report
December 31, 2011
Statements of Operations
| | | International
Equity
Portfolio
(000) | | International
Opportunity
Portfolio
(000) | | International
Real Estate
Portfolio
(000) | | International
Small Cap
Portfolio
(000) | | Select Global
Infrastructure
Portfolio
(000) | |
| Investment Income: | |
| Dividends from Securities of Unaffiliated Issuers | | $ | 145,945 | | | $ | 127 | | | $ | 11,001 | | | $ | 10,033 | | | $ | 409 | | |
| Income from Securities Loaned — Net | | | 2,781 | | | | — | | | | — | | | | — | | | | — | | |
| Dividends from Securities of Affiliated Issuers | | | 127 | | | | — | @ | | | 3 | | | | 7 | | | | — | @ | |
| Interest from Securities of Unaffiliated Issuers | | | 5 | | | | 3 | | | | — | @ | | | — | @ | | | — | | |
| Less: Foreign Taxes Withheld | | | (8,995 | ) | | | (7 | ) | | | (575 | ) | | | (637 | ) | | | (26 | ) | |
| Total Investment Income | | | 139,863 | | | | 123 | | | | 10,429 | | | | 9,403 | | | | 383 | | |
| Expenses: | |
| Investment Advisory Fees (Note B) | | | 33,841 | | | | 61 | | | | 2,629 | | | | 3,596 | | | | 100 | | |
| Administration Fees (Note C) | | | 3,384 | | | | 5 | | | | 263 | | | | 303 | | | | 9 | | |
| Sub Transfer Agency Fees | | | 2,852 | | | | — | | | | 64 | | | | 231 | | | | — | | |
| Custodian Fees (Note F) | | | 585 | | | | 12 | | | | 146 | | | | 163 | | | | 37 | | |
| Shareholder Reporting Fees | | | 315 | | | | 16 | | | | 26 | | | | 46 | | | | 7 | | |
| Professional Fees | | | 115 | | | | 66 | | | | 63 | | | | 71 | | | | 55 | | |
| Registration Fees | | | 110 | | | | 47 | | | | 34 | | | | 37 | | | | 49 | | |
| Directors' Fees and Expenses | | | 126 | | | | 1 | | | | 11 | | | | 12 | | | | 1 | | |
| Transfer Agency Fees (Note E) | | | 51 | | | | 12 | | | | 17 | | | | 13 | | | | 12 | | |
| Offering Costs | | | — | | | | 19 | | | | — | | | | — | | | | 59 | | |
| Pricing Fees | | | 9 | | | | 7 | | | | 10 | | | | 11 | | | | 7 | | |
| Distribution and Shareholder Servicing Fees — Class P (Note D) | | | 2,456 | | | | — | @ | | | 12 | | | | 243 | | | | — | @ | |
| Distribution and Shareholder Servicing Fees — Class H (Note D) | | | — | | | | 2 | | | | — | | | | — | | | | — | @ | |
| Distribution and Shareholder Servicing Fees — Class L (Note D) | | | — | | | | 1 | | | | — | | | | — | | | | 1 | | |
| Other Expenses | | | 154 | | | | 12 | | | | 22 | | | | 22 | | | | 10 | | |
| Total Expenses | | | 43,998 | | | | 261 | | | | 3,297 | | | | 4,748 | | | | 347 | | |
| Waiver of Investment Advisory Fees (Note B) | | | (1,356 | ) | | | (61 | ) | | | — | | | | (153 | ) | | | (100 | ) | |
| Expenses Reimbursed by Advisor (Note B) | | | — | | | | (119 | ) | | | — | | | | — | | | | (110 | ) | |
| Rebate from Morgan Stanley Affiliate (Note G-2) | | | (131 | ) | | | (— | @) | | | (3 | ) | | | (7 | ) | | | (— | @) | |
| Net Expenses | | | 42,511 | | | | 81 | | | | 3,294 | | | | 4,588 | | | | 137 | | |
| Net Investment Income | | | 97,352 | | | | 42 | | | | 7,135 | | | | 4,815 | | | | 246 | | |
| Realized Gain (Loss): | |
| Investments Sold | | | 135,813 | | | | 283 | | | | (44,620 | ) | | | 32,955 | | | | 375 | | |
| Foreign Currency Exchange Contracts | | | — | | | | — | | | | — | | | | (2,119 | ) | | | — | | |
| Foreign Currency Transactions | | | (3,139 | ) | | | (— | @) | | | 7 | | | | (78 | ) | | | (6 | ) | |
| Net Realized Gain (Loss) | | | 132,674 | | | | 283 | | | | (44,613 | ) | | | 30,758 | | | | 369 | | |
| Change in Unrealized Appreciation (Depreciation): | |
| Investments | | | (553,819 | ) | | | (1,012 | ) | | | (23,795 | ) | | | (106,116 | ) | | | 1,091 | | |
| Foreign Currency Exchange Contracts | | | — | | | | — | | | | — | | | | 1,108 | | | | — | | |
| Foreign Currency Translations | | | (159 | ) | | | — | @ | | | (20 | ) | | | 35 | | | | — | @ | |
| Net Change in Unrealized Appreciation (Depreciation) | | | (553,978 | ) | | | (1,012 | ) | | | (23,815 | ) | | | (104,973 | ) | | | 1,091 | | |
Total Net Realized Gain (Loss) and Change in Unrealized
Appreciation (Depreciation) | | | (421,304 | ) | | | (729 | ) | | | (68,428 | ) | | | (74,215 | ) | | | 1,460 | | |
| Net Increase (Decrease) in Net Assets Resulting from Operations | | $ | (323,952 | ) | | $ | (687 | ) | | $ | (61,293 | ) | | $ | (69,400 | ) | | $ | 1,706 | | |
@ Amount is less than $500.
The accompanying notes are an integral part of the financial statements.
140
2011 Annual Report
December 31, 2011
Statements of Operations
| | | Advantage
Portfolio
(000) | | Focus Growth
Portfolio
(000) | | Growth
Portfolio
(000) | | Insight*
Portfolio
(000) | | Opportunity
Portfolio
(000) | |
| Investment Income: | |
| Dividends from Securities of Unaffiliated Issuers | | $ | 105 | | | $ | 171 | | | $ | 6,820 | | | $ | — | | | $ | 2,532 | | |
| Dividends from Securities of Affiliated Issuers | | | — | @ | | | 2 | | | | 25 | | | | — | @ | | | 3 | | |
| Interest from Securities of Unaffiliated Issuers | | | — | | | | — | @ | | | 5 | | | | — | | | | — | | |
| Less: Foreign Taxes Withheld | | | (7 | ) | | | (8 | ) | | | (328 | ) | | | — | | | | (62 | ) | |
| Total Investment Income | | | 98 | | | | 165 | | | | 6,522 | | | | — | @ | | | 2,473 | | |
| Expenses: | |
| Investment Advisory Fees (Note B) | | | 51 | | | | 118 | | | | 4,304 | | | | — | @ | | | 1,384 | | |
| Sub Transfer Agency Fees | | | — | @ | | | 4 | | | | 787 | | | | — | | | | 311 | | |
| Administration Fees (Note C) | | | 5 | | | | 19 | | | | 689 | | | | — | @ | | | 222 | | |
| Transfer Agency Fees (Note E) | | | 11 | | | | 7 | | | | 16 | | | | 1 | | | | 350 | | |
| Professional Fees | | | 46 | | | | 56 | | | | 66 | | | | 25 | | | | 51 | | |
| Shareholder Reporting Fees | | | 9 | | | | 3 | | | | 92 | | | | — | @ | | | 119 | | |
| Registration Fees | | | 39 | | | | 33 | | | | 74 | | | | — | | | | 51 | | |
| Custodian Fees (Note F) | | | 5 | | | | 4 | | | | 57 | | | | — | @ | | | 49 | | |
| Offering Costs | | | 52 | | | | — | | | | — | | | | — | | | | 52 | | |
| Directors' Fees and Expenses | | | — | @ | | | 1 | | | | 25 | | | | — | | | | 8 | | |
| Pricing Fees | | | 3 | | | | 3 | | | | 6 | | | | — | @ | | | 3 | | |
| Distribution and Shareholder Servicing Fees — Class P (Note D) | | | — | @ | | | 4 | | | | 364 | | | | — | | | | 7 | | |
| Distribution and Shareholder Servicing Fees — Class H (Note D) | | | 3 | | | | — | | | | — | | | | — | @ | | | 564 | | |
| Distribution and Shareholder Servicing Fees — Class L (Note D) | | | 1 | | | | — | | | | — | | | | — | @ | | | 273 | | |
| Other Expenses | | | 12 | | | | 9 | | | | 38 | | | | — | | | | 20 | | |
| Total Expenses | | | 237 | | | | 261 | | | | 6,518 | | | | 26 | | | | 3,464 | | |
| Waiver of Investment Advisory Fees (Note B) | | | (51 | ) | | | (22 | ) | | | — | | | | (— | @) | | | (184 | ) | |
| Distribution Fees — Class L Shares Waived (Note D) | | | (1 | ) | | | — | | | | — | | | | — | | | | — | | |
| Expenses Reimbursed by Advisor (Note B) | | | (111 | ) | | | — | | | | — | | | | (26 | ) | | | — | | |
| Rebate from Morgan Stanley Affiliate (Note G-2) | | | (— | @) | | | (2 | ) | | | (26 | ) | | | — | | �� | | (3 | ) | |
| Net Expenses | | | 74 | | | | 237 | | | | 6,492 | | | | — | @ | | | 3,277 | | |
| Net Investment Income (Loss) | | | 24 | | | | (72 | ) | | | 30 | | | | (— | @) | | | (804 | ) | |
| Realized Gain (Loss): | |
| Investments Sold | | | 214 | | | | 1,222 | | | | 77,748 | | | | — | | | | 22,617 | | |
| Foreign Currency Transactions | | | (— | @) | | | 1 | | | | 1 | | | | — | | | | (47 | ) | |
| Net Realized Gain | | | 214 | | | | 1,223 | | | | 77,749 | | | | — | | | | 22,570 | | |
| Change in Unrealized Appreciation (Depreciation): | |
| Investments | | | 106 | | | | (3,087 | ) | | | (100,452 | ) | | | 5 | | | | (21,761 | ) | |
| Investments in Affiliates | | | — | | | | — | | | | 34 | | | | — | | | | — | | |
| Foreign Currency Translations | | | — | | | | — | @ | | | (14 | ) | | | — | | | | (1 | ) | |
| Net Change in Unrealized Appreciation (Depreciation) | | | 106 | | | | (3,087 | ) | | | (100,432 | ) | | | 5 | | | | (21,762 | ) | |
Total Net Realized Gain (Loss) and Change in Unrealized
Appreciation (Depreciation) | | | 320 | | | | (1,864 | ) | | | (22,683 | ) | | | 5 | | | | 808 | | |
| Net Increase (Decrease) in Net Assets Resulting from Operations | | $ | 344 | | | $ | (1,936 | ) | | $ | (22,653 | ) | | $ | 5 | | | $ | 4 | | |
* Commencement of Operations December 28, 2011.
@ Amount is less than $500.
The accompanying notes are an integral part of the financial statements.
141
2011 Annual Report
December 31, 2011
Statements of Operations
| | | Small
Company
Growth
Portfolio
(000) | | U.S. Real
Estate
Portfolio
(000) | | Emerging
Markets Debt
Portfolio
(000) | |
| Investment Income: | |
| Dividends from Securities of Unaffiliated Issuers | | $ | 12,379 | | | $ | 16,912 | | | $ | 3 | | |
| Interest from Securities of Unaffiliated Issuers | | | — | | | | — | | | | 4,196 | | |
| Dividends from Securities of Affiliated Issuers | | | 51 | | | | 30 | | | | 13 | | |
| Income from Securities Loaned — Net | | | — | | | | — | | | | 1 | | |
| Less: Foreign Taxes Withheld | | | (96 | ) | | | (58 | ) | | | (8 | ) | |
| Total Investment Income | | | 12,334 | | | | 16,884 | | | | 4,205 | | |
| Expenses: | |
| Investment Advisory Fees (Note B) | | | 14,377 | | | | 7,332 | | | | 522 | | |
| Sub Transfer Agency Fees | | | 1,466 | | | | 930 | | | | 15 | | |
| Administration Fees (Note C) | | | 1,295 | | | | 756 | | | | 56 | | |
| Shareholder Reporting Fees | | | 304 | | | | 220 | | | | 10 | | |
| Professional Fees | | | 70 | | | | 101 | | | | 76 | | |
| Custodian Fees (Note F) | | | 126 | | | | 39 | | | | 62 | | |
| Registration Fees | | | 85 | | | | 75 | | | | 56 | | |
| Directors' Fees and Expenses | | | 49 | | | | 29 | | | | 2 | | |
| Transfer Agency Fees (Note E) | | | 8 | | | | 32 | | | | 14 | | |
| Pricing Fees | | | 7 | | | | 4 | | | | 5 | | |
| Distribution and Shareholder Servicing Fees — Class P (Note D) | | | 1,008 | | | | 239 | | | | 21 | | |
| Distribution and Shareholder Servicing Fees — Class H (Note D) | | | 11 | | | | 8 | | | | 5 | | |
| Distribution and Shareholder Servicing Fees — Class L (Note D) | | | 2 | | | | 6 | | | | 37 | | |
| Other Expenses | | | 62 | | | | 71 | | | | 13 | | |
| Expenses Before Non Operating Expenses | | | 18,870 | | | | 9,842 | | | | 894 | | |
| Investment Related Expenses | | | — | | | | 109 | | | | — | | |
| Bank Overdraft Expense | | | 1 | | | | — | | | | — | | |
| Total Expenses | | | 18,871 | | | | 9,951 | | | | 894 | | |
| Waiver of Investment Advisory Fees (Note B) | | | (855 | ) | | | (140 | ) | | | (238 | ) | |
| Rebate from Morgan Stanley Affiliate (Note G-2) | | | (51 | ) | | | (27 | ) | | | (13 | ) | |
| Net Expenses | | | 17,965 | | | | 9,784 | | | | 643 | | |
| Net Investment Income (Loss) | | | (5,631 | ) | | | 7,100 | | | | 3,562 | | |
| Realized Gain (Loss): | |
| Investments Sold | | | 47,105 | | | | 93,333 | | | | 114 | | |
| Foreign Currency Exchange Contracts | | | — | | | | — | | | | (667 | ) | |
| Foreign Currency Transactions | | | (37 | ) | | | 4 | | | | (94 | ) | |
| Net Realized Gain (Loss) | | | 47,068 | | | | 93,337 | | | | (647 | ) | |
| Change in Unrealized Appreciation (Depreciation): | |
| Investments | | | (193,849 | ) | | | (49,796 | ) | | | (7,262 | ) | |
| Foreign Currency Exchange Contracts | | | — | | | | — | | | | (170 | ) | |
| Foreign Currency Translations | | | (1 | ) | | | (4 | ) | | | (120 | ) | |
| Net Change in Unrealized Appreciation (Depreciation) | | | (193,850 | ) | | | (49,800 | ) | | | (7,552 | ) | |
| Total Net Realized Gain (Loss) and Change in Unrealized Appreciation (Depreciation) | | | (146,782 | ) | | | 43,537 | | | | (8,199 | ) | |
| Net Increase (Decrease) in Net Assets Resulting from Operations | | $ | (152,413 | ) | | $ | 50,637 | | | $ | (4,637 | ) | |
The accompanying notes are an integral part of the financial statements.
142
2011 Annual Report
December 31, 2011
Statements of Changes in Net Assets
| | | Active International Allocation
Portfolio | | Asian Equity Portfolio | |
| | | Year Ended
December 31,
2011
(000) | | Year Ended
December 31,
2010
(000) | | Year Ended
December 31,
2011
(000) | | Period from
December 28,
2010^ to
December 31,
2010
(000) | |
| Increase (Decrease) in Net Assets: | |
| Operations: | |
| Net Investment Income (Loss) | | $ | 9,429 | | | $ | 8,719 | | | $ | (1 | ) | �� | $ | (— | @) | |
| Net Realized Gain (Loss) | | | 20,487 | | | | 12,002 | | | | (70 | ) | | | (2 | ) | |
| Net Change in Unrealized Appreciation (Depreciation) | | | (88,922 | ) | | | 13,445 | | | | (190 | ) | | | 31 | | |
| Net Increase (Decrease) in Net Assets Resulting from Operations | | | (59,006 | ) | | | 34,166 | | | | (261 | ) | | | 29 | | |
| Distributions from and/or in Excess of: | |
| Class I: | |
| Net Investment Income | | | (6,740 | ) | | | (8,900 | ) | | | — | | | | — | | |
| Class P: | |
| Net Investment Income | | | (195 | ) | | | (251 | ) | | | — | | | | — | | |
| Total Distributions | | | (6,935 | ) | | | (9,151 | ) | | | — | | | | — | | |
| Capital Share Transactions:(1) | |
| Class I: | |
| Subscribed | | | 16,620 | | | | 17,789 | | | | 185 | | | | 1,200 | | |
| Distributions Reinvested | | | 6,595 | | | | 8,573 | | | | — | | | | — | | |
| Redeemed | | | (98,789 | ) | | | (142,063 | ) | | | — | | | | — | | |
| Class P: | |
| Subscribed | | | 2,040 | | | | 2,703 | | | | — | | | | 100 | | |
| Distributions Reinvested | | | 193 | | | | 250 | | | | — | | | | — | | |
| Redeemed | | | (4,111 | ) | | | (5,510 | ) | | | — | | | | — | | |
| Class H: | |
| Subscribed | | | — | | | | — | | | | — | | | | 100 | | |
| Class L: | |
| Subscribed | | | — | | | | — | | | | — | | | | 100 | | |
| Net Increase (Decrease) in Net Assets Resulting from Capital Share Transactions | | | (77,452 | ) | | | (118,258 | ) | | | 185 | | | | 1,500 | | |
| Redemption Fees | | | 1 | | | | 7 | | | | — | | | | — | | |
| Total Increase (Decrease) in Net Assets | | | (143,392 | ) | | | (93,236 | ) | | | (76 | ) | | | 1,529 | | |
| Net Assets: | |
| Beginning of Period | | | 455,827 | | | | 549,063 | | | | 1,529 | | | | — | | |
| End of Period | | $ | 312,435 | | | $ | 455,827 | | | $ | 1,453 | | | $ | 1,529 | | |
Undistributed (Distributions in Excess of) Net Investment Income Included in
End of Period Net Assets | | $ | (1,888 | ) | | $ | (1,349 | ) | | $ | (— | @) | | $ | — | | |
| (1) Capital Share Transactions: | |
| Class I: | |
| Shares Subscribed | | | 1,394 | | | | 1,638 | | | | 22 | | | | 120 | | |
| Shares Issued on Distributions Reinvested | | | 673 | | | | 729 | | | | — | | | | — | | |
| Shares Redeemed | | | (8,669 | ) | | | (12,896 | ) | | | — | | | | — | | |
| Net Increase (Decrease) in Class I Shares Outstanding | | | (6,602 | ) | | | (10,529 | ) | | | 22 | | | | 120 | | |
| Class P: | |
| Shares Subscribed | | | 166 | | | | 239 | | | | — | | | | 10 | | |
| Shares Issued on Distributions Reinvested | | | 19 | | | | 21 | | | | — | | | | — | | |
| Shares Redeemed | | | (352 | ) | | | (514 | ) | | | — | | | | — | | |
| Net Increase (Decrease) in Class P Shares Outstanding | | | (167 | ) | | | (254 | ) | | | — | | | | 10 | | |
| Class H: | |
| Shares Subscribed | | | — | | | | — | | | | — | | | | 10 | | |
| Class L: | |
| Shares Subscribed | | | — | | | | — | | | | — | | | | 10 | | |
^ Commencement of Operations.
@ Amount is less than $500.
The accompanying notes are an integral part of the financial statements.
143
2011 Annual Report
December 31, 2011
Statements of Changes in Net Assets
| | | Emerging Markets Portfolio | | Global Advantage Portfolio | |
| | | Year Ended
December 31,
2011
(000) | | Year Ended
December 31,
2010
(000) | | Year Ended
December 31,
2011
(000) | | Period from
December 28,
2010^ to
December 31,
2010
(000) | |
| Increase (Decrease) in Net Assets: | |
| Operations: | |
| Net Investment Income (Loss) | | $ | 14,687 | | | $ | 8,341 | | | $ | 9 | | | $ | (— | @) | |
| Net Realized Gain (Loss) | | | 102,195 | | | | 354,824 | | | | (1 | ) | | | (— | @) | |
| Net Change in Unrealized Appreciation (Depreciation) | | | (455,950 | ) | | | (15,398 | ) | | | 17 | | | | 1 | | |
| Net Increase (Decrease) in Net Assets Resulting from Operations | | | (339,068 | ) | | | 347,767 | | | | 25 | | | | 1 | | |
| Distributions from and/or in Excess of: | |
| Class I: | |
| Net Investment Income | | | — | | | | (15,877 | ) | | | (11 | ) | | | — | | |
| Net Realized Gain | | | (24,410 | ) | | | — | | | | — | | | | — | | |
| Class P: | |
| Net Investment Income | | | — | | | | (637 | ) | | | (1 | ) | | | — | | |
| Net Realized Gain | | | (867 | ) | | | — | | | | — | | | | — | | |
| Class H: | |
| Net Investment Income | | | — | | | | — | | | | (4 | ) | | | — | | |
| Class L: | |
| Net Investment Income | | | — | | | | — | | | | (— | @) | | | — | | |
| Total Distributions | | | (25,277 | ) | | | (16,514 | ) | | | (16 | ) | | | — | | |
| Capital Share Transactions:(1) | |
| Class I: | |
| Subscribed | | | 150,629 | | | | 281,040 | | | | 940 | | | | 700 | | |
| Distributions Reinvested | | | 24,390 | | | | 15,473 | | | | 6 | | | | — | | |
| Redeemed | | | (659,627 | ) | | | (778,895 | ) | | | (61 | ) | | | — | | |
| Class P: | |
| Subscribed | | | 7,123 | | | | 18,354 | | | | — | | | | 100 | | |
| Distributions Reinvested | | | 857 | | | | 633 | | | | — | | | | — | | |
| Redeemed | | | (59,019 | ) | | | (48,150 | ) | | | — | | | | — | | |
| Class H: | |
| Subscribed | | | — | | | | — | | | | 700 | | | | 200 | | |
| Distributions Reinvested | | | — | | | | — | | | | 3 | | | | — | | |
| Class L: | |
| Subscribed | | | — | | | | — | | | | — | | | | 100 | | |
| Net Increase (Decrease) in Net Assets Resulting from Capital Share Transactions | | | (535,647 | ) | | | (511,545 | ) | | | 1,588 | | | | 1,100 | | |
| Redemption Fees | | | 158 | | | | 224 | | | | — | | | | — | | |
| Total Increase (Decrease) in Net Assets | | | (899,834 | ) | | | (180,068 | ) | | | 1,597 | | | | 1,101 | | |
| Net Assets: | |
| Beginning of Period | | | 2,145,212 | | | | 2,325,280 | | | | 1,101 | | | | — | | |
| End of Period | | $ | 1,245,378 | | | $ | 2,145,212 | | | $ | 2,698 | | | $ | 1,101 | | |
Distributions in Excess of Net Investment Income Included in End of Period
Net Assets | | $ | (9,486 | ) | | $ | (20,221 | ) | | $ | (8 | ) | | $ | (— | @) | |
The accompanying notes are an integral part of the financial statements.
144
2011 Annual Report
December 31, 2011
Statements of Changes in Net Assets (cont'd)
| | | Emerging Markets Portfolio | | Global Advantage Portfolio | |
| | | Year Ended
December 31,
2011
(000) | | Year Ended
December 31,
2010
(000) | | Year Ended
December 31,
2011
(000) | | Period from
December 28,
2010^ to
December 31,
2010
(000) | |
| (1) Capital Share Transactions: | |
| Class I: | |
| Shares Subscribed | | | 5,906 | | | | 11,677 | | | | 96 | | | | 70 | | |
| Shares Issued on Distributions Reinvested | | | 1,132 | | | | 588 | | | | 1 | | | | — | | |
| Shares Redeemed | | | (26,716 | ) | | | (32,609 | ) | | | (6 | ) | | | — | | |
| Net Increase (Decrease) in Class I Shares Outstanding | | | (19,678 | ) | | | (20,344 | ) | | | 91 | | | | 70 | | |
| Class P: | |
| Shares Subscribed | | | 295 | | | | 782 | | | | — | | | | 10 | | |
| Shares Issued on Distributions Reinvested | | | 41 | | | | 25 | | | | — | | | | — | | |
| Shares Redeemed | | | (2,412 | ) | | | (2,131 | ) | | | — | | | | — | | |
| Net Increase (Decrease) in Class P Shares Outstanding | | | (2,076 | ) | | | (1,324 | ) | | | — | | | | 10 | | |
| Class H: | |
| Shares Subscribed | | | — | | | | — | | | | 70 | | | | 20 | | |
| Shares Issued on Distributions Reinvested | | | — | | | | — | | | | — | @ | | | — | | |
| Net Increase in Class H Shares Outstanding | | | — | | | | — | | | | 70 | | | | 20 | | |
| Class L: | |
| Shares Subscribed | | | — | | | | — | | | | — | | | | 10 | | |
^ Commencement of Operations.
@ Amount is less than $500.
The accompanying notes are an integral part of the financial statements.
145
2011 Annual Report
December 31, 2011
Statements of Changes in Net Assets
| | | Global Discovery Portfolio | | Global Franchise Portfolio | |
| | | Year Ended
December 31,
2011
(000) | | Period from
December 28,
2010^ to
December 31,
2010
(000) | | Year Ended
December 31,
2011
(000) | | Year Ended
December 31,
2010
(000) | |
| Increase (Decrease) in Net Assets: | |
| Operations: | |
| Net Investment Income (Loss) | | $ | 35 | | | $ | (— | @) | | $ | 3,262 | | | $ | 1,980 | | |
| Net Realized Gain (Loss) | | | 26 | | | | (1 | ) | | | 5,715 | | | | 17,660 | | |
| Net Change in Unrealized Appreciation (Depreciation) | | | (255 | ) | | | (3 | ) | | | 4,035 | | | | (4,820 | ) | |
| Net Increase (Decrease) in Net Assets Resulting from Operations | | | (194 | ) | | | (4 | ) | | | 13,012 | | | | 14,820 | | |
| Distributions from and/or in Excess of: | |
| Class I: | |
| Net Investment Income | | | (31 | ) | | | — | | | | (3,602 | ) | | | (2,672 | ) | |
| Net Realized Gain | | | (1 | ) | | | — | | | | (2,015 | ) | | | — | | |
| Class P: | |
| Net Investment Income | | | (1 | ) | | | — | | | | (240 | ) | | | (264 | ) | |
| Net Realized Gain | | | (— | @) | | | — | | | | (154 | ) | | | — | | |
| Class H: | |
| Net Investment Income | | | (13 | ) | | | — | | | | — | | | | — | | |
| Net Realized Gain | | | (1 | ) | | | — | | | | — | | | | — | | |
| Class L: | |
| Net Investment Income | | | (— | @) | | | — | | | | — | | | | — | | |
| Net Realized Gain | | | (— | @) | | | — | | | | — | | | | — | | |
| Total Distributions | | | (47 | ) | | | — | | | | (6,011 | ) | | | (2,936 | ) | |
| Capital Share Transactions:(1) | |
| Class I: | |
| Subscribed | | | 1,897 | | | | 700 | | | | 140,007 | | | | 34,361 | | |
| Distributions Reinvested | | | 23 | | | | — | | | | 4,060 | | | | 2,566 | | |
| Redeemed | | | (87 | ) | | | — | | | | (28,592 | ) | | | (70,062 | ) | |
| Class P: | |
| Subscribed | | | — | | | | 100 | | | | 9,450 | | | | 857 | | |
| Distributions Reinvested | | | — | | | | — | | | | 368 | | | | 248 | | |
| Redeemed | | | — | | | | — | | | | (4,609 | ) | | | (1,719 | ) | |
| Class H: | |
| Subscribed | | | 937 | | | | 350 | | | | — | | | | — | | |
| Distributions Reinvested | | | 10 | | | | — | | | | — | | | | — | | |
| Class L: | |
| Subscribed | | | — | | | | 100 | | | | — | | | | — | | |
| Net Increase (Decrease) in Net Assets Resulting from Capital Share Transactions | | | 2,780 | | | | 1,250 | | | | 120,684 | | | | (33,749 | ) | |
| Total Increase (Decrease) in Net Assets | | | 2,539 | | | | 1,246 | | | | 127,685 | | | | (21,865 | ) | |
| Net Assets: | |
| Beginning of Period | | | 1,246 | | | | — | | | | 99,319 | | | | 121,184 | | |
| End of Period | | $ | 3,785 | | | $ | 1,246 | | | $ | 227,004 | | | $ | 99,319 | | |
Undistributed (Distributions in Excess of) Net Investment Income Included in
End of Period Net Assets | | $ | (3 | ) | | $ | (1 | ) | | $ | (— | @) | | $ | 328 | | |
The accompanying notes are an integral part of the financial statements.
146
2011 Annual Report
December 31, 2011
Statements of Changes in Net Assets (cont'd)
| | | Global Discovery Portfolio | | Global Franchise Portfolio | |
| | | Year Ended
December 31,
2011
(000) | | Period from
December 28,
2010^ to
December 31,
2010
(000) | | Year Ended
December 31,
2011
(000) | | Year Ended
December 31,
2010
(000) | |
| (1) Capital Share Transactions: | |
| Class I: | |
| Shares Subscribed | | | 207 | | | | 70 | | | | 8,718 | | | | 2,390 | | |
| Shares Issued on Distributions Reinvested | | | 3 | | | | — | | | | 254 | | | | 169 | | |
| Shares Redeemed | | | (10 | ) | | | — | | | | (1,797 | ) | | | (4,794 | ) | |
| Net Increase (Decrease) in Class I Shares Outstanding | | | 200 | | | | 70 | | | | 7,175 | | | | (2,235 | ) | |
| Class P: | |
| Shares Subscribed | | | — | | | | 10 | | | | 578 | | | | 59 | | |
| Shares Issued on Distributions Reinvested | | | — | | | | — | | | | 23 | | | | 17 | | |
| Shares Redeemed | | | — | | | | — | | | | (283 | ) | | | (121 | ) | |
| Net Increase (Decrease) in Class P Shares Outstanding | | | — | | | | 10 | | | | 318 | | | | (45 | ) | |
| Class H: | |
| Shares Subscribed | | | 92 | | | | 35 | | | | — | | | | — | | |
| Shares Issued on Distributions Reinvested | | | 1 | | | | — | | | | — | | | | — | | |
| Net Increase in Class H Shares Outstanding | | | 93 | | | | 35 | | | | — | | | | — | | |
| Class L: | |
| Shares Subscribed | | | — | | | | 10 | | | | — | | | | — | | |
^ Commencement of Operations.
@ Amount is less than $500.
The accompanying notes are an integral part of the financial statements.
147
2011 Annual Report
December 31, 2011
Statements of Changes in Net Assets
| | | Global Insight Portfolio | |
| | | Period from
December 28,
2011^ to
December 31,
2011
(000) | |
| Increase (Decrease) in Net Assets: | |
| Operations: | |
| Net Investment Loss | | $ | (— | @) | |
| Net Realized Loss | | | (— | @) | |
| Net Change in Unrealized Appreciation (Depreciation) | | | 6 | | |
| Net Increase in Net Assets Resulting from Operations | | | 6 | | |
| Capital Share Transactions:(1) | |
| Class I: | |
| Subscribed | | | 10 | | |
| Class H: | |
| Subscribed | | | 810 | | |
| Class L: | |
| Subscribed | | | 10 | | |
| Net Increase in Net Assets Resulting from Capital Share Transactions | | | 830 | | |
| Total Increase in Net Assets | | | 836 | | |
| Net Assets: | |
| Beginning of Period | | | — | | |
| End of Period | | $ | 836 | | |
| Distributions in Excess of Net Investment Income Included in End of Period Net Assets | | $ | (— | @) | |
| (1) Capital Share Transactions: | |
| Class I: | |
| Shares Subscribed | | | 1 | | |
| Class H: | |
| Shares Subscribed | | | 81 | | |
| Class L: | |
| Shares Subscribed | | | 1 | | |
^ Commencement of operations.
@ Amount is less than $500.
The accompanying notes are an integral part of the financial statements.
148
2011 Annual Report
December 31, 2011
Statements of Changes in Net Assets
| | | Global Opportunity Portfolio | |
| | | Year Ended
December 31,
2011
(000) | | Period from
April 1,
2010 to
December 31,
2010
(000) | | Year Ended
March 31,
2010
(000) | |
| Increase (Decrease) in Net Assets: | |
| Operations: | |
| Net Investment Income (Loss) | | $ | 2 | | | $ | (18 | ) | | $ | (24 | ) | |
| Net Realized Gain | | | 854 | | | | 309 | | | | 67 | | |
| Net Change in Unrealized Appreciation (Depreciation) | | | (1,351 | ) | | | 1,576 | | | | 4,041 | | |
| Net Increase (Decrease) in Net Assets Resulting from Operations | | | (495 | ) | | | 1,867 | | | | 4,084 | | |
| Distributions from and/or in Excess of: | |
| Class A: | |
| Net Realized Gain | | | — | | | | — | | | | (17 | ) | |
| Class C: | |
| Net Realized Gain | | | — | | | | — | | | | (3 | ) | |
| Class I: | |
| Net Realized Gain | | | (570 | ) | | | — | | | | (17 | ) | |
| Class P: | |
| Net Realized Gain | | | (1 | ) | | | — | | | | — | | |
| Class H: | |
| Net Realized Gain | | | (341 | ) | | | — | | | | — | | |
| Class L: | |
| Net Realized Gain | | | (37 | ) | | | — | | | | — | | |
| Class R:** | |
| Net Realized Gain | | | — | | | | — | | | | (— | @) | |
| Total Distributions | | | (949 | ) | | | — | | | | (37 | ) | |
| Capital Share Transactions:(1) | |
| Class A: | |
| Subscribed | | | — | | | | — | | | | 6,696 | | |
| Distributions Reinvested | | | — | | | | — | | | | 16 | | |
| Conversion to Class H in connection with Reorganization | | | — | | | | (5,407 | ) | | | — | | |
| Redeemed | | | — | | | | — | | | | (1,432 | ) | |
| Class B: | |
| Subscribed | | | — | | | | 115 | | | | 804 | | |
| Conversion to Class H in connection with Reorganization | | | — | | | | (892 | ) | | | — | | |
| Redeemed | | | — | | | | (68 | ) | | | (174 | ) | |
| Class C: | |
| Subscribed | | | — | | | | — | | | | 1,329 | | |
| Distributions Reinvested | | | — | | | | — | | | | 3 | | |
| Conversion to Class L in connection with Reorganization | | | — | | | | (682 | ) | | | — | | |
| Redeemed | | | — | | | | — | | | | (186 | ) | |
| Class I: | |
| Subscribed | | | 3,743 | | | | 12 | | | | 2,220 | | |
| Distributions Reinvested | | | 215 | | | | — | | | | 1 | | |
| Conversion to Class I in connection with Reorganization | | | — | | | | (4,786 | ) | | | — | | |
| Conversion from Class I in connection with Reorganization | | | — | | | | 4,786 | | | | — | | |
| Redeemed | | | (121 | ) | | | (1,087 | ) | | | (1,085 | ) | |
| Class P: | |
| Subscribed | | | — | | | | 10 | * | | | — | | |
| Class H: | |
| Subscribed | | | 251 | | | | 830 | | | | — | | |
| Distributions Reinvested | | | 333 | | | | — | | | | — | | |
| Conversion from Class A in connection with Reorganization | | | — | | | | 5,407 | | | | — | | |
| Conversion from Class B in connection with Reorganization | | | — | | | | 892 | | | | — | | |
| Redeemed | | | (1,114 | ) | | | (4,130 | ) | | | — | | |
| Class L: | |
| Subscribed | | | 120 | | | | 29 | | | | — | | |
| Distributions Reinvested | | | 29 | | | | — | | | | — | | |
| Conversion from Class C in connection with Reorganization | | | — | | | | 682 | | | | — | | |
| Redeemed | | | (255 | ) | | | (823 | ) | | | — | | |
| Class R:** | |
| Subscribed | | | — | | | | — | | | | 35 | | |
| Distributions Reinvested | | | — | | | | — | | | | — | @ | |
| Redeemed | | | — | | | | (96 | ) | | | (39 | ) | |
| Net Increase (Decrease) in Net Assets Resulting from Capital Share Transactions | | | 3,201 | | | | (5,208 | ) | | | 8,188 | | |
| Redemption Fees | | | 1 | | | | — | | | | — | | |
| Total Increase (Decrease) in Net Assets | | | 1,758 | | | | (3,341 | ) | | | 12,235 | | |
| Net Assets: | |
| Beginning of Period | | | 11,853 | | | | 15,194 | | | | 2,959 | | |
| End of Period | | $ | 13,611 | | | $ | 11,853 | | | $ | 15,194 | | |
| Distributions in Excess of Net Investment Income Included in End of Period Net Assets | | $ | 1 | | | $ | (38 | ) | | $ | (22 | ) | |
The accompanying notes are an integral part of the financial statements.
149
2011 Annual Report
December 31, 2011
Statements of Changes in Net Assets (cont'd)
| | | Global Opportunity Portfolio | |
| | | Year Ended
December 31,
2011
(000) | | Period from
April 1,
2010 to
December 31,
2010
(000) | | Year Ended
March 31,
2010
(000) | |
| (1) Capital Share Transactions: | |
| Class A: | |
| Shares Subscribed | | | — | | | | — | | | | 835 | | |
| Shares Issued on Distributions Reinvested | | | — | | | | — | | | | 2 | | |
| Conversion to Class H in connection with Reorganization | | | — | | | | (630 | ) | | | — | | |
| Shares Redeemed | | | — | | | | — | | | | (171 | ) | |
| Net Increase (Decrease) in Class A Shares Outstanding | | | — | | | | (630 | ) | | | 666 | | |
| Class B: | |
| Shares Subscribed | | | — | | | | 13 | | | | 105 | | |
| Conversion to Class H in connection with Reorganization | | | — | | | | (104 | ) | | | — | | |
| Shares Redeemed | | | — | | | | (9 | ) | | | (21 | ) | |
| Net Increase (Decrease) in Class B Shares Outstanding | | | — | | | | (100 | ) | | | 84 | | |
| Class C: | |
| Shares Subscribed | | | — | | | | — | | | | 160 | | |
| Shares Issued on Distributions Reinvested | | | — | | | | — | | | | — | @@ | |
| Conversion to Class L in connection with Reorganization | | | — | | | | (80 | ) | | | — | | |
| Shares Redeemed | | | — | | | | — | | | | (22 | ) | |
| Net Increase (Decrease) in Class A Shares Outstanding | | | — | | | | (80 | ) | | | 138 | | |
| Class I: | |
| Shares Subscribed | | | 345 | | | | 1 | | | | 256 | | |
| Shares Issued on Distributions Reinvested | | | 21 | | | | — | | | | — | @@ | |
| Conversion to Class I in connection with Reorganization | | | — | | | | 555 | | | | — | | |
| Conversion from Class I in connection with Reorganization | | | — | | | | (555 | ) | | | — | | |
| Shares Redeemed | | | (11 | ) | | | (127 | ) | | | (128 | ) | |
| Net Increase (Decrease) in Class I Shares Outstanding | | | 355 | | | | (126 | ) | | | 128 | | |
| Class P: | |
| Shares Subscribed | | | — | | | | 1 | * | | | — | | |
| Class H: | |
| Shares Subscribed | | | 22 | | | | 84 | | | | — | | |
| Shares Issued on Distributions Reinvested | | | 32 | | | | — | | | | — | | |
| Conversion from Class A in connection with Reorganization | | | — | | | | 630 | | | | — | | |
| Conversion from Class B in connection with Reorganization | | | — | | | | 104 | | | | — | | |
| Shares Redeemed | | | (95 | ) | | | (435 | ) | | | — | | |
| Net Increase (Decrease) in Class H Shares Outstanding | | | (41 | ) | | | 383 | | | | — | | |
| Class L: | |
| Shares Subscribed | | | 10 | | | | 2 | | | | — | | |
| Shares Issued on Distributions Reinvested | | | 3 | | | | — | | | | — | | |
| Conversion from Class C in connection with Reorganization | | | — | | | | 80 | | | | — | | |
| Shares Redeemed | | | (22 | ) | | | (93 | ) | | | — | | |
| Net Decrease in Class L Shares Outstanding | | | (9 | ) | | | (11 | ) | | | — | | |
| Class R:** | |
| Shares Subscribed | | | — | | | | — | | | | 4 | | |
| Shares Issued on Distributions Reinvested | | | — | | | | — | | | | — | @@ | |
| Shares Redeemed | | | — | | | | (10 | ) | | | (4 | ) | |
| Net Increase (Decrease) in Class R Shares Outstanding | | | — | | | | (10 | ) | | | — | @@ | |
* For the period May 21, 2010 (commencement of operations) through December 31, 2010.
** Class R Shares liquidated prior to the Reorganization on May 21, 2010.
@ Amount is less than $500.
@@ Shares are less than 500.
The accompanying notes are an integral part of the financial statements.
150
2011 Annual Report
December 31, 2011
Statements of Changes in Net Assets
| | | Global Real Estate
Portfolio | | International Advantage
Portfolio | |
| | | Year Ended
December 31,
2011
(000) | | Year Ended
December 31,
2010
(000) | | Year Ended
December 31,
2011
(000) | | Period from
December 28,
2010^ to
December 31,
2010
(000) | |
| Increase (Decrease) in Net Assets: | |
| Operations: | |
| Net Investment Income (Loss) | | $ | 24,068 | | | $ | 18,233 | | | $ | 23 | | | $ | (— | @) | |
| Net Realized Gain (Loss) | | | 101,786 | | | | (7,577 | ) | | | 13 | | | | (1 | ) | |
| Net Change in Unrealized Appreciation (Depreciation) | | | (268,351 | ) | | | 153,231 | | | | (78 | ) | | | (1 | ) | |
| Net Increase (Decrease) in Net Assets Resulting from Operations | | | (142,497 | ) | | | 163,887 | | | | (42 | ) | | | (2 | ) | |
| Distributions from and/or in Excess of: | |
| Class I: | |
| Net Investment Income | | | (26,117 | ) | | | (22,289 | ) | | | (15 | ) | | | — | | |
| Net Realized Gain | | | — | | | | — | | | | (12 | ) | | | — | | |
| Class P: | |
| Net Investment Income | | | (2,381 | ) | | | (1,296 | ) | | | (1 | ) | | | — | | |
| Net Realized Gain | | | — | | | | — | | | | (1 | ) | | | — | | |
| Class H: | |
| Net Investment Income | | | (167 | ) | | | (203 | ) | | | (6 | ) | | | — | | |
| Net Realized Gain | | | — | | | | — | | | | (6 | ) | | | — | | |
| Class L: | |
| Net Investment Income | | | (91 | ) | | | (74 | ) | | | (— | @) | | | — | | |
| Net Realized Gain | | | — | | | | — | | | | (1 | ) | | | — | | |
| Total Distributions | | | (28,756 | ) | | | (23,862 | ) | | | (42 | ) | | | — | | |
| Capital Share Transactions:(1) | |
| Class I: | |
| Subscribed | | | 733,537 | | | | 539,544 | | | | 113 | | | | 1,200 | | |
| Distributions Reinvested | | | 23,292 | | | | 19,144 | | | | 2 | | | | — | | |
| Redeemed | | | (484,561 | ) | | | (110,386 | ) | | | (8 | ) | | | — | | |
| Class P: | |
| Subscribed | | | 108,062 | | | | 17,980 | | | | — | | | | 100 | | |
| Distributions Reinvested | | | 2,379 | | | | 1,295 | | | | — | | | | — | | |
| Redeemed | | | (29,195 | ) | | | (13,883 | ) | | | — | | | | — | | |
| Class H: | |
| Subscribed | | | 3,323 | | | | 10,880 | | | | 600 | | | | 100 | | |
| Distributions Reinvested | | | 165 | | | | 199 | | | | 11 | | | | — | | |
| Redeemed | | | (4,559 | ) | | | (1,047 | ) | | | — | | | | — | | |
| Class L: | |
| Subscribed | | | 3,627 | | | | 2,979 | | | | — | | | | 100 | | |
| Distributions Reinvested | | | 83 | | | | 74 | | | | — | | | | — | | |
| Redeemed | | | (1,247 | ) | | | (304 | ) | | | — | | | | — | | |
| Net Increase in Net Assets Resulting from Capital Share Transactions | | | 354,906 | | | | 466,475 | | | | 718 | | | | 1,500 | | |
| Total Increase in Net Assets | | | 183,653 | | | | 606,500 | | | | 634 | | | | 1,498 | | |
| Net Assets: | |
| Beginning of Period | | | 1,300,117 | | | | 693,617 | | | | 1,498 | | | | — | | |
| End of Period | | $ | 1,483,770 | | | $ | 1,300,117 | | | $ | 2,132 | | | $ | 1,498 | | |
Distributions in Excess of Net Investment Income Included in
End of Period Net Assets | | $ | (5,172 | ) | | $ | (9,201 | ) | | $ | — | | | $ | (1 | ) | |
The accompanying notes are an integral part of the financial statements.
151
2011 Annual Report
December 31, 2011
Statements of Changes in Net Assets (cont'd)
| | | Global Real Estate
Portfolio | | International Advantage
Portfolio | |
| | | Year Ended
December 31,
2011
(000) | | Year Ended
December 31,
2010
(000) | | Year Ended
December 31,
2011
(000) | | Period from
December 28,
2010^ to
December 31,
2010
(000) | |
| (1) Capital Share Transactions: | |
| Class I: | |
| Shares Subscribed | | | 86,151 | | | | 64,397 | | | | 11 | | | | 120 | | |
| Shares Issued on Distributions Reinvested | | | 2,992 | | | | 2,295 | | | | — | @@ | | | — | | |
| Shares Redeemed | | | (55,407 | ) | | | (13,717 | ) | | | (1 | ) | | | — | | |
| Net Increase in Class I Shares Outstanding | | | 33,736 | | | | 52,975 | | | | 10 | | | | 120 | | |
| Class P: | |
| Shares Subscribed | | | 12,360 | | | | 2,273 | | | | — | | | | 10 | | |
| Shares Issued on Distributions Reinvested | | | 306 | | | | 157 | | | | — | | | | — | | |
| Shares Redeemed | | | (3,577 | ) | | | (1,750 | ) | | | — | | | | — | | |
| Net Increase in Class P Shares Outstanding | | | 9,089 | | | | 680 | | | | — | | | | 10 | | |
| Class H: | |
| Shares Subscribed | | | 385 | | | | 1,323 | | | | 60 | | | | 10 | | |
| Shares Issued on Distributions Reinvested | | | 21 | | | | 24 | | | | 1 | | | | — | | |
| Shares Redeemed | | | (512 | ) | | | (123 | ) | | | — | | | | — | | |
| Net Increase (Decrease) in Class H Shares Outstanding | | | (106 | ) | | | 1,224 | | | | 61 | | | | 10 | | |
| Class L: | |
| Shares Subscribed | | | 408 | | | | 398 | | | | — | | | | 10 | | |
| Shares Issued on Distributions Reinvested | | | 11 | | | | 9 | | | | — | | | | — | | |
| Shares Redeemed | | | (163 | ) | | | (40 | ) | | | — | | | | — | | |
| Net Increase in Class L Shares Outstanding | | | 256 | | | | 367 | | | | — | | | | 10 | | |
^ Commencement of operations.
@ Amount is less than $500.
@@ Shares are less than 500.
The accompanying notes are an integral part of the financial statements.
152
2011 Annual Report
December 31, 2011
Statements of Changes in Net Assets
| | | International Equity
Portfolio | | International Opportunity
Portfolio | |
| | | Year Ended
December 31,
2011
(000) | | Year Ended
December 31,
2010
(000) | | Year Ended
December 31,
2011
(000) | | Period from
March 31,
2010^ to
December 31,
2010
(000) | |
| Increase (Decrease) in Net Assets: | |
| Operations: | |
| Net Investment Income | | $ | 97,352 | | | $ | 83,394 | | | $ | 42 | | | $ | 13 | | |
| Net Realized Gain (Loss) | | | 132,674 | | | | (137,837 | ) | | | 283 | | | | (84 | ) | |
| Net Change in Unrealized Appreciation (Depreciation) | | | (553,978 | ) | | | 302,525 | | | | (1,012 | ) | | | 1,241 | | |
| Net Increase (Decrease) in Net Assets Resulting from Operations | | | (323,952 | ) | | | 248,082 | | | | (687 | ) | | | 1,170 | | |
| Distributions from and/or in Excess of: | |
| Class I: | |
| Net Investment Income | | | (73,415 | ) | | | (48,950 | ) | | | (49 | ) | | | — | | |
| Net Realized Gain | | | — | | | | — | | | | (226 | ) | | | — | | |
| Class P: | |
| Net Investment Income | | | (20,616 | ) | | | (11,050 | ) | | | (1 | ) | | | — | | |
| Net Realized Gain | | | — | | | | — | | | | (5 | ) | | | — | | |
| Class H: | |
| Net Investment Income | | | — | | | | — | | | | (4 | ) | | | — | | |
| Net Realized Gain | | | — | | | | — | | | | (34 | ) | | | — | | |
| Class L: | |
| Net Realized Gain | | | — | | | | — | | | | (5 | ) | | | — | | |
| Total Distributions | | | (94,031 | ) | | | (60,000 | ) | | | (324 | ) | | | — | | |
| Capital Share Transactions:(1) | |
| Class I: | |
| Subscribed | | | 496,856 | | | | 703,889 | | | | — | | | | 4,700 | | |
| Distributions Reinvested | | | 68,142 | | | | 44,431 | | | | — | | | | — | | |
| Redeemed | | | (664,126 | ) | | | (673,827 | ) | | | — | | | | — | | |
| Class P: | |
| Subscribed | | | 197,736 | | | | 458,705 | | | | — | | | | 100 | | |
| Distributions Reinvested | | | 20,608 | | | | 11,047 | | | | — | | | | — | | |
| Redeemed | | | (126,932 | ) | | | (712,539 | ) | | | — | | | | — | | |
| Class H: | |
| Subscribed | | | — | | | | — | | | | 50 | | | | 650 | | |
| Distributions Reinvested | | | — | | | | — | | | | 33 | | | | — | | |
| Class L: | |
| Subscribed | | | — | | | | — | | | | — | | | | 100 | | |
| Net Increase (Decrease) in Net Assets Resulting from Capital Share Transactions | | | (7,716 | ) | | | (168,294 | ) | | | 83 | | | | 5,550 | | |
| Redemption Fees | | | 109 | | | | 308 | | | | — | | | | — | | |
| Total Increase (Decrease) in Net Assets | | | (425,590 | ) | | | 20,096 | | | | (928 | ) | | | 6,720 | | |
| Net Assets: | |
| Beginning of Period | | | 4,300,995 | | | | 4,280,899 | | | | 6,720 | | | | — | | |
| End of Period | | $ | 3,875,405 | | | $ | 4,300,995 | | | $ | 5,792 | | | $ | 6,720 | | |
| Undistributed Net Investment Income Included in End of Period Net Assets | | $ | 667 | | | $ | 486 | | | $ | (— | @) | | $ | 13 | | |
The accompanying notes are an integral part of the financial statements.
153
2011 Annual Report
December 31, 2011
Statements of Changes in Net Assets (cont'd)
| | | International Equity
Portfolio | | International Opportunity
Portfolio | |
| | | Year Ended
December 31,
2011
(000) | | Year Ended
December 31,
2010
(000) | | Year Ended
December 31,
2011
(000) | | Period from
March 31,
2010^ to
December 31,
2010
(000) | |
| (1) Capital Share Transactions: | |
| Class I: | |
| Shares Subscribed | | | 36,905 | | | | 55,259 | | | | — | | | | 470 | | |
| Shares Issued on Distributions Reinvested | | | 5,740 | | | | 3,311 | | | | — | | | | — | | |
| Shares Redeemed | | | (48,810 | ) | | | (52,665 | ) | | | — | | | | — | | |
| Net Increase (Decrease) in Class I Shares Outstanding | | | (6,165 | ) | | | 5,905 | | | | — | | | | 470 | | |
| Class P: | |
| Shares Subscribed | | | 14,358 | | | | 36,653 | | | | — | | | | 10 | | |
| Shares Issued on Distributions Reinvested | | | 1,755 | | | | 833 | | | | — | | | | — | | |
| Shares Redeemed | | | (9,513 | ) | | | (56,399 | ) | | | — | | | | — | | |
| Net Increase (Decrease) in Class P Shares Outstanding | | | 6,600 | | | | (18,913 | ) | | | — | | | | 10 | | |
| Class H: | |
| Shares Subscribed | | | — | | | | — | | | | 5 | | | | 67 | | |
| Shares Issued on Distributions Reinvested | | | — | | | | — | | | | 3 | | | | — | | |
| Net Increase in Class H Shares Outstanding | | | — | | | | — | | | | 8 | | | | 67 | | |
| Class L: | |
| Shares Subscribed | | | — | | | | — | | | | — | | | | 10 | | |
^ Commencement of operations.
The accompanying notes are an integral part of the financial statements.
154
2011 Annual Report
December 31, 2011
Statements of Changes in Net Assets
| | | International Real Estate
Portfolio | | International Small Cap
Portfolio | |
| | | Year Ended
December 31,
2011
(000) | | Year Ended
December 31,
2010
(000) | | Year Ended
December 31,
2011
(000) | | Year Ended
December 31,
2010
(000) | |
| Increase (Decrease) in Net Assets: | |
| Operations: | |
| Net Investment Income | | $ | 7,135 | | | $ | 16,694 | | | $ | 4,815 | | | $ | 3,247 | | |
| Net Realized Gain (Loss) | | | (44,613 | ) | | | (102,047 | ) | | | 30,758 | | | | 21,594 | | |
| Net Change in Unrealized Appreciation (Depreciation) | | | (23,815 | ) | | | 119,410 | | | | (104,973 | ) | | | 34,562 | | |
| Net Increase (Decrease) in Net Assets Resulting from Operations | | | (61,293 | ) | | | 34,057 | | | | (69,400 | ) | | | 59,403 | | |
| Distributions from and/or in Excess of: | |
| Class I: | |
| Net Investment Income | | | (9,300 | ) | | | (12,992 | ) | | | — | | | | (1,110 | ) | |
| Class P: | |
| Net Investment Income | | | (125 | ) | | | (168 | ) | | | — | | | | (308 | ) | |
| Total Distributions | | | (9,425 | ) | | | (13,160 | ) | | | — | | | | (1,418 | ) | |
| Capital Share Transactions:(1) | |
| Class I: | |
| Subscribed | | | 25,214 | | | | 43,527 | | | | 29,291 | | | | 32,961 | | |
| Distributions Reinvested | | | 5,799 | | | | 7,210 | | | | — | | | | 918 | | |
| Redeemed | | | (151,178 | ) | | | (137,521 | ) | | | (84,991 | ) | | | (107,894 | ) | |
| Class P: | |
| Subscribed | | | 56 | | | | 26 | | | | 700 | | | | 26,252 | | |
| Distributions Reinvested | | | 112 | | | | 153 | | | | — | | | | 308 | | |
| Redeemed | | | (1,252 | ) | | | (3,315 | ) | | | (891 | ) | | | (2,011 | ) | |
| Net Decrease in Net Assets Resulting from Capital Share Transactions | | | (121,249 | ) | | | (89,920 | ) | | | (55,891 | ) | | | (49,466 | ) | |
| Redemption Fees | | | 1 | | | | 6 | | | | 8 | | | | 2 | | |
| Total Increase (Decrease) in Net Assets | | | (191,966 | ) | | | (69,017 | ) | | | (125,283 | ) | | | 8,521 | | |
| Net Assets: | |
| Beginning of Period | | | 403,061 | | | | 472,078 | | | | 421,436 | | | | 412,915 | | |
| End of Period | | $ | 211,095 | | | $ | 403,061 | | | $ | 296,153 | | | $ | 421,436 | | |
Undistributed (Distributions in Excess of) Net Investment Income Included in
End of Period Net Assets | | $ | 4,965 | | | $ | 5,613 | | | $ | 2,489 | | | $ | (203 | ) | |
| (1) Capital Share Transactions: | |
| Class I: | |
| Shares Subscribed | | | 1,453 | | | | 2,584 | | | | 2,153 | | | | 2,771 | | |
| Shares Issued on Distributions Reinvested | | | 317 | | | | 397 | | | | — | | | | 82 | | |
| Shares Redeemed | | | (8,685 | ) | | | (7,948 | ) | | | (6,381 | ) | | | (8,848 | ) | |
| Net Decrease in Class I Shares Outstanding | | | (6,915 | ) | | | (4,967 | ) | | | (4,228 | ) | | | (5,995 | ) | |
| Class P: | |
| Shares Subscribed | | | 3 | | | | 1 | | | | 53 | | | | 2,196 | | |
| Shares Issued on Distributions Reinvested | | | 6 | | | | 8 | | | | — | | | | 28 | | |
| Shares Redeemed | | | (71 | ) | | | (190 | ) | | | (68 | ) | | | (169 | ) | |
| Net Increase (Decrease) in Class P Shares Outstanding | | | (62 | ) | | | (181 | ) | | | (15 | ) | | | 2,055 | | |
The accompanying notes are an integral part of the financial statements.
155
2011 Annual Report
December 31, 2011
Statements of Changes in Net Assets
| | | Select Global Infrastructure
Portfolio | |
| | | Year Ended
December 31,
2011
(000) | | Period from
September 20,
2010^ to
December 31,
2010
(000) | |
| Increase (Decrease) in Net Assets: | |
| Operations: | |
| Net Investment Income | | $ | 246 | | | $ | 79 | | |
| Net Realized Gain | | | 369 | | | | 25 | | |
| Net Change in Unrealized Appreciation (Depreciation) | | | 1,091 | | | | 376 | | |
| Net Increase in Net Assets Resulting from Operations | | | 1,706 | | | | 480 | | |
| Distributions from and/or in Excess of: | |
| Class I: | |
| Net Investment Income | | | (240 | ) | | | (80 | ) | |
| Net Realized Gain | | | (358 | ) | | | — | | |
| Class P: | |
| Net Investment Income | | | (2 | ) | | | (1 | ) | |
| Net Realized Gain | | | (3 | ) | | | — | | |
| Class H: | |
| Net Investment Income | | | (2 | ) | | | (1 | ) | |
| Net Realized Gain | | | (3 | ) | | | — | | |
| Class L: | |
| Net Investment Income | | | (1 | ) | | | (— | @) | |
| Net Realized Gain | | | (3 | ) | | | — | | |
| Total Distributions | | | (612 | ) | | | (82 | ) | |
| Capital Share Transactions:(1) | |
| Class I: | |
| Subscribed | | | 1,469 | | | | 9,700 | | |
| Distributions Reinvested | | | 65 | | | | — | | |
| Redeemed | | | (92 | ) | | | — | | |
| Class P: | |
| Subscribed | | | — | | | | 100 | | |
| Class H: | |
| Subscribed | | | — | | | | 100 | | |
| Class L: | |
| Subscribed | | | — | | | | 100 | | |
| Net Increase in Net Assets Resulting from Capital Share Transactions | | | 1,442 | | | | 10,000 | | |
| Total Increase in Net Assets | | | 2,536 | | | | 10,398 | | |
| Net Assets: | |
| Beginning of Period | | | 10,398 | | | | — | | |
| End of Period | | $ | 12,934 | | | $ | 10,398 | | |
| Undistributed (Distributions in Excess of) Net Investment Income Included in End of Period Net Assets | | $ | (— | @) | | $ | (1 | ) | |
| (1) Capital Share Transactions: | |
| Class I: | |
| Shares Subscribed | | | 127 | | | | 970 | | |
| Shares Issued on Distributions Reinvested | | | 6 | | | | — | | |
| Shares Redeemed | | | (8 | ) | | | — | | |
| Net Increase in Class I Shares Outstanding | | | 125 | | | | 970 | | |
| Class P: | |
| Shares Subscribed | | | — | | | | 10 | | |
| Class H: | |
| Shares Subscribed | | | — | | | | 10 | | |
| Class L: | |
| Shares Subscribed | | | — | | | | 10 | | |
^ Commencement of operations.
@ Amount is less than $500.
The accompanying notes are an integral part of the financial statements.
156
2011 Annual Report
December 31, 2011
Statements of Changes in Net Assets
| | | Advantage Portfolio | |
| | | Year Ended
December 31,
2011
(000) | | Period from
September 1 to
December 31,
2010
(000) | | Year Ended
August 31,
2010
(000) | |
| Increase (Decrease) in Net Assets: | |
| Operations: | |
| Net Investment Income | | $ | 24 | | | $ | 7 | | | $ | 23 | | |
| Net Realized Gain (Loss) | | | 214 | | | | 175 | | | | (172 | ) | |
| Net Change in Unrealized Appreciation (Depreciation) | | | 106 | | | | 850 | | | | 889 | | |
| Net Increase in Net Assets Resulting from Operations | | | 344 | | | | 1,032 | | | | 740 | | |
| Distributions from and/or in Excess of: | |
| Class I: | |
| Net Investment Income | | | (43 | ) | | | (16 | ) | | | (23 | ) | |
| Class P: | |
| Net Investment Income | | | (— | @) | | | (— | @) | | | — | | |
| Class H: | |
| Net Investment Income | | | (3 | ) | | | (2 | ) | | | (4 | ) | |
| Class L: | |
| Net Investment Income | | | (1 | ) | | | (— | @) | | | (1 | ) | |
| Class R:*** | |
| Net Investment Income | | | — | | | | — | | | | (— | @) | |
| Total Distributions | | | (47 | ) | | | (18 | ) | | | (28 | ) | |
| Capital Share Transactions:(1) | |
| Class A: | |
| Subscribed | | | — | | | | — | | | | — | | |
| Distributions Reinvested | | | — | | | | — | | | | — | | |
| Conversion to Class H in connection with Reorganization | | | — | | | | — | | | | (1,088 | ) | |
| Redeemed | | | — | | | | — | | | | — | | |
| Class B: | |
| Subscribed | | | — | | | | — | | | | 4 | * | |
| Distributions Reinvested | | | — | | | | — | | | | — | | |
| Conversion to Class H in connection with Reorganization | | | — | | | | — | | | | (212 | ) | |
| Redeemed | | | — | | | | — | | | | (43 | )* | |
| Class C: | |
| Subscribed | | | — | | | | — | | | | — | | |
| Distributions Reinvested | | | — | | | | — | | | | — | | |
| Conversion to Class L in connection with Reorganization | | | — | | | | — | | | | (154 | ) | |
| Redeemed | | | — | | | | — | | | | — | | |
| Class I: | |
| Subscribed | | | 1,997 | | | | — | | | | 11 | | |
| Distributions Reinvested | | | 12 | | | | — | @ | | | — | | |
| Conversion to Class I in connection with Reorganization | | | — | | | | — | | | | (4,141 | ) | |
| Conversion from Class I in connection with Reorganization | | | — | | | | — | | | | 4,141 | | |
| Redeemed | | | (22 | ) | | | — | @ | | | — | | |
| Class P: | |
| Subscribed | | | — | | | | 9 | | | | 1 | ** | |
| Class H: | |
| Subscribed | | | 25 | | | | — | | | | 331 | | |
| Distributions Reinvested | | | 3 | | | | 2 | | | | 4 | | |
| Conversion from Class A in connection with Reorganization | | | — | | | | — | | | | 1,088 | | |
| Conversion from Class B in connection with Reorganization | | | — | | | | — | | | | 212 | | |
| Redeemed | | | (187 | ) | | | (139 | ) | | | (420 | ) | |
| Class L: | |
| Subscribed | | | 50 | | | | — | | | | 1 | | |
| Distributions Reinvested | | | — | @ | | | — | @ | | | — | @ | |
| Conversion to Class C in connection with Reorganization | | | — | | | | — | | | | 154 | | |
| Redeemed | | | (4 | ) | | | (31 | ) | | | (25 | ) | |
| Class R:*** | |
| Redeemed | | | — | | | | — | | | | (97 | ) | |
| Net Increase (Decrease) in Net Assets Resulting from Capital Share Transactions | | | 1,874 | | | | (159 | ) | | | (233 | ) | |
| Total Increase in Net Assets | | | 2,171 | | | | 855 | | | | 479 | | |
| Net Assets: | |
| Beginning of Period | | | 6,283 | | | | 5,428 | | | | 4,949 | | |
| End of Period | | $ | 8,454 | | | $ | 6,283 | | | $ | 5,428 | | |
Undistributed (Distributions in excess of) Net Investment Income Included in
End of Period Net Assets | | $ | (22 | ) | | $ | 1 | | | $ | 12 | | |
The accompanying notes are an integral part of the financial statements.
157
2011 Annual Report
December 31, 2011
Statements of Changes in Net Assets (cont'd)
| | | Advantage Portfolio | |
| | | Year Ended
December 31,
2011
(000) | | Period from
September 1 to
December 31,
2010
(000) | | Year Ended
August 31,
2010
(000) | |
| (1) Capital Share Transactions: | |
| Class A: | |
| Shares Subscribed | | | — | | | | — | | | | — | | |
| Shares Issued on Distributions Reinvested | | | — | | | | — | | | | — | | |
| Conversion to Class H in connection with Reorganization | | | — | | | | — | | | | (121 | ) | |
| Shares Redeemed | | | — | | | | — | | | | — | | |
| Net Decrease in Class A Shares Outstanding | | | — | | | | — | | | | (121 | ) | |
| Class B: | |
| Shares Subscribed | | | — | | | | — | | | | — | @@* | |
| Shares Issued on Distributions Reinvested | | | — | | | | — | | | | — | | |
| Conversion to Class H in connection with Reorganization | | | — | | | | — | | | | (24 | ) | |
| Shares Redeemed | | | — | | | | — | | | | (4 | )* | |
| Net Decrease in Class B Shares Outstanding | | | — | | | | — | | | | (28 | ) | |
| Class C: | |
| Shares Subscribed | | | — | | | | — | | | | — | | |
| Shares Issued on Distributions Reinvested | | | — | | | | — | | | | — | | |
| Conversion to Class L in connection with Reorganization | | | — | | | | — | | | | (17 | ) | |
| Shares Redeemed | | | — | | | | — | | | | — | | |
| Net Decrease in Class C Shares Outstanding | | | — | | | | — | | | | (17 | ) | |
| Class I: | |
| Shares Subscribed | | | 176 | | | | — | | | | 1 | | |
| Shares Issued on Distributions Reinvested | | | 1 | | | | — | @@ | | | — | | |
| Conversion to Class I in connection with Reorganization | | | — | | | | — | | | | (460 | ) | |
| Conversion from Class I in connection with Reorganization | | | — | | | | — | | | | 460 | | |
| Shares Redeemed | | | (2 | ) | | | (— | @@) | | | — | | |
| Net Increase in Class I Shares Outstanding | | | 175 | | | | — | @@ | | | 1 | | |
| Class P: | |
| Shares Subscribed | | | — | | | | 1 | | | | — | @@** | |
| Class H: | |
| Shares Subscribed | | | 2 | | | | — | | | | 35 | | |
| Shares Issued on Distributions Reinvested | | | — | @@ | | | — | @@ | | | — | @@ | |
| Conversion from Class A in connection with Reorganization | | | — | | | | — | | | | 121 | | |
| Conversion from Class B in connection with Reorganization | | | — | | | | — | | | | 24 | | |
| Shares Redeemed | | | (16 | ) | | | (13 | ) | | | (47 | ) | |
| Net Decrease in Class H Shares Outstanding | | | (14 | ) | | | (13 | ) | | | (133 | ) | |
| Class L: | |
| Shares Subscribed | | | 4 | | | | — | | | | — | @@ | |
| Shares Issued on Distributions Reinvested | | | — | @@ | | | — | @@ | | | — | @@ | |
| Conversion from Class C in connection with Reorganization | | | — | | | | — | | | | 17 | | |
| Shares Redeemed | | | (— | @@) | | | (3 | ) | | | (3 | ) | |
| Net Increase (Decrease) in Class L Shares Outstanding | | | 4 | | | | (3 | ) | | | 14 | | |
| Class R:*** | |
| Shares Redeemed | | | — | | | | — | | | | (10 | ) | |
* For the period September 1, 2009 through May 21, 2010.
** For the period May 21, 2010 through August 31, 2010.
*** Class R shares liquidated on April 30, 2010.
@ Amount is less than $500.
@@ Amount is less than 500 shares.
The accompanying notes are an integral part of the financial statements.
158
2011 Annual Report
December 31, 2011
Statements of Changes in Net Assets
| | | Focus Growth Portfolio | | Growth Portfolio | |
| | | Year Ended
December 31,
2011
(000) | | Year Ended
December 31,
2010
(000) | | Year Ended
December 31,
2011
(000) | | Year Ended
December 31,
2010
(000) | |
| Increase (Decrease) in Net Assets: | |
| Operations: | |
| Net Investment Income (Loss) | | $ | (72 | ) | | $ | (34 | ) | | $ | 30 | | | $ | 1,770 | | |
| Net Realized Gain | | | 1,223 | | | | 1,193 | | | | 77,749 | | | | 29,690 | | |
| Net Change in Unrealized Appreciation (Depreciation) | | | (3,087 | ) | | | 2,402 | | | | (100,432 | ) | | | 126,809 | | |
| Net Increase (Decrease) in Net Assets Resulting from Operations | | | (1,936 | ) | | | 3,561 | | | | (22,653 | ) | | | 158,269 | | |
| Distributions from and/or in Excess of: | |
| Class I: | |
| Net Investment Income | | | — | | | | — | | | | (1,649 | ) | | | (13 | ) | |
| Class P: | |
| Net Investment Income | | | — | | | | — | | | | (79 | ) | | | (2 | ) | |
| Total Distributions | | | — | | | | — | | | | (1,728 | ) | | | (15 | ) | |
| Capital Share Transactions:(1) | |
| Class I: | |
| Subscribed | | | 15,239 | | | | 11,367 | | | | 95,503 | | | | 60,077 | | |
| Distributions Reinvested | | | — | | | | — | | | | 1,646 | | | | 13 | | |
| Redeemed | | | (8,677 | ) | | | (4,851 | ) | | | (159,435 | ) | | | (165,796 | ) | |
| Class P: | |
| Subscribed | | | 126 | | | | 281 | | | | 33,841 | | | | 38,853 | | |
| Distributions Reinvested | | | — | | | | — | | | | 79 | | | | 2 | | |
| Redeemed | | | (109 | ) | | | (374 | ) | | | (30,278 | ) | | | (23,953 | ) | |
| Net Increase (Decrease) in Net Assets Resulting from Capital Share Transactions | | | 6,579 | | | | 6,423 | | | | (58,644 | ) | | | (90,804 | ) | |
| Total Increase (Decrease) in Net Assets | | | 4,643 | | | | 9,984 | | | | (83,025 | ) | | | 67,450 | | |
| Net Assets: | |
| Beginning of Period | | | 19,322 | | | | 9,338 | | | | 840,995 | | | | 773,545 | | |
| End of Period | | $ | 23,965 | | | $ | 19,322 | | | $ | 757,970 | | | $ | 840,995 | | |
Undistributed (Distributions in Excess of) Net Investment Income Included in
End of Period Net Assets | | $ | 2 | | | $ | — | | | $ | 24 | | | $ | 1,721 | | |
| (1) Capital Share Transactions: | |
| Class I: | |
| Shares Subscribed | | | 773 | | | | 673 | | | | 3,775 | | | | 2,868 | | |
| Shares Issued on Distributions Reinvested | | | — | | | | — | | | | 60 | | | | 1 | | |
| Shares Redeemed | | | (440 | ) | | | (289 | ) | | | (6,374 | ) | | | (8,037 | ) | |
| Net Increase (Decrease) in Class I Shares Outstanding | | | 333 | | | | 384 | | | | (2,539 | ) | | | (5,168 | ) | |
| Class P: | |
| Shares Subscribed | | | 6 | | | | 17 | | | | 1,380 | | | | 1,744 | | |
| Shares Issued on Distributions Reinvested | | | — | | | | — | | | | 3 | | | | — | @@ | |
| Shares Redeemed | | | (6 | ) | | | (25 | ) | | | (1,222 | ) | | | (1,137 | ) | |
| Net Increase (Decrease) in Class P Shares Outstanding | | | — | @@ | | | (8 | ) | | | 161 | | | | 607 | | |
@@ Amount is less than 500 shares.
The accompanying notes are an integral part of the financial statements.
159
2011 Annual Report
December 31, 2011
Statements of Changes in Net Assets
| | | Insight Portfolio | |
| | | Period from
December 28,
2011^ to
December 31,
2011
(000) | |
| Increase (Decrease) in Net Assets: | |
| Operations: | |
| Net Investment Loss | | $ | (— | @) | |
| Net Change in Unrealized Appreciation (Depreciation) | | | 5 | | |
| Net Increase in Net Assets Resulting from Operations | | | 5 | | |
| Capital Share Transactions:(1) | |
| Class I: | |
| Subscribed | | | 10 | | |
| Class H: | |
| Subscribed | | | 810 | | |
| Class L: | |
| Subscribed | | | 10 | | |
| Net Increase in Net Assets Resulting from Capital Share Transactions | | | 830 | | |
| Total Increase in Net Assets | | | 835 | | |
| Net Assets: | |
| Beginning of Period | | | — | | |
| End of Period | | $ | 835 | | |
| Distributions in Excess of Net Investment Income Included in End of Period Net Assets | | $ | — | | |
| (1) Capital Share Transactions: | |
| Class I: | |
| Shares Subscribed | | | 1 | | |
| Class H: | |
| Shares Subscribed | | | 81 | | |
| Class L: | |
| Shares Subscribed | | | 1 | | |
^ Commencement of operation.
@ Amount is less than $500.
The accompanying notes are an integral part of the financial statements.
160
2011 Annual Report
December 31, 2011
Statements of Changes in Net Assets
| | | Opportunity Portfolio | |
| | | Year Ended
December 31,
2011
(000) | | Period from
July 1 to
December 31,
2010
(000) | | Year Ended
June 30,
2010
(000) | |
| Increase (Decrease) in Net Assets: | |
| Operations: | |
| Net Investment Loss | | $ | (804 | ) | | $ | (69 | ) | | $ | (1,862 | ) | |
| Net Realized Gain | | | 22,570 | | | | 17,322 | | | | 36,391 | | |
| Net Change in Unrealized Appreciation (Depreciation) | | | (21,762 | ) | | | 51,253 | | | | 35,289 | | |
| Net Increase in Net Assets Resulting from Operations | | | 4 | | | | 68,506 | | | | 69,818 | | |
| Capital Share Transactions:(1) | |
| Class A: | |
| Subscribed | | | — | | | | — | | | | — | | |
| Conversion to Class H in connection with Reorganization | | | — | | | | — | | | | (228,193 | ) | |
| Redeemed | | | — | | | | — | | | | — | | |
| Class B: | |
| Subscribed | | | — | | | | — | | | | 7,121 | * | |
| Conversion to Class H in connection with Reorganization | | | — | | | | — | | | | (30,342 | ) | |
| Redeemed | | | — | | | | — | | | | (17,901 | )* | |
| Class C: | |
| Subscribed | | | — | | | | — | | | | — | | |
| Conversion to Class L in connection with Reorganization | | | — | | | | — | | | | (39,143 | ) | |
| Redeemed | | | — | | | | — | | | | — | | |
| Class I: | |
| Subscribed | | | 6,663 | | | | 1,356 | | | | 19,262 | | |
| Conversion to Class I in connection with Reorganization | | | — | | | | — | | | | (7,430 | ) | |
| Conversion from Class I in connection with Reorganization | | | — | | | | — | | | | 7,430 | | |
| Redeemed | | | (6,311 | ) | | | (2,412 | ) | | | (17,891 | ) | |
| Class P: | |
| Subscribed | | | 2,502 | | | | 2,009 | | | | 1 | ** | |
| Redeemed | | | (2,407 | ) | | | — | | | | — | | |
| Class H: | |
| Subscribed | | | 7,548 | | | | 1,877 | | | | 85,104 | | |
| Conversion from Class A in connection with Reorganization | | | — | | | | — | | | | 228,193 | | |
| Conversion from Class B in connection with Reorganization | | | — | | | | — | | | | 30,342 | | |
| Redeemed | | | (50,831 | ) | | | (37,580 | ) | | | (155,308 | ) | |
| Class L: | |
| Subscribed | | | 500 | | | | 362 | | | | 10,142 | | |
| Conversion from Class C in connection with Reorganization | | | — | | | | — | | | | 39,143 | | |
| Redeemed | | | (9,104 | ) | | | (4,780 | ) | | | (10,734 | ) | |
| Net Decrease in Net Assets Resulting from Capital Share Transactions | | | (51,440 | ) | | | (39,168 | ) | | | (80,204 | ) | |
| Total Increase (Decrease) in Net Assets | | | (51,436 | ) | | | 29,338 | | | | (10,386 | ) | |
| Net Assets: | |
| Beginning of Period | | | 295,486 | | | | 266,148 | | | | 276,534 | | |
| End of Period | | $ | 244,050 | | | $ | 295,486 | | | $ | 266,148 | | |
| Accumulated Net Investment Loss Included in End of Period Net Assets | | $ | (13 | ) | | $ | (112 | ) | | $ | (28 | ) | |
The accompanying notes are an integral part of the financial statements.
161
2011 Annual Report
December 31, 2011
Statements of Changes in Net Assets (cont'd)
| | | Opportunity Portfolio | |
| | | Year Ended
December 31,
2011
(000) | | Period from
July 1 to
December 31,
2010
(000) | | Year Ended
June 30,
2010
(000) | |
| (1) Capital Share Transactions: | |
| Class A: | |
| Shares Subscribed | | | — | | | | — | | | | — | | |
| Conversion to Class H in connection with Reorganization | | | — | | | | — | | | | (19,044 | ) | |
| Shares Redeemed | | | — | | | | — | | | | — | | |
| Net Decrease in Class A Shares Outstanding | | | — | | | | — | | | | (19,044 | ) | |
| Class B: | |
| Shares Subscribed | | | — | | | | — | | | | 649 | * | |
| Conversion to Class H in connection with Reorganization | | | — | | | | — | | | | (2,713 | ) | |
| Shares Redeemed | | | — | | | | — | | | | (1,595 | )* | |
| Net Decrease in Class B Shares Outstanding | | | — | | | | — | | | | (3,659 | ) | |
| Class C: | |
| Shares Subscribed | | | — | | | | — | | | | — | | |
| Conversion to Class L in connection with Reorganization | | | — | | | | — | | | | (3,562 | ) | |
| Shares Redeemed | | | — | | | | — | | | | — | | |
| Net Decrease in Class A Shares Outstanding | | | — | | | | — | | | | (3,562 | ) | |
| Class I: | |
| Shares Subscribed | | | 429 | | | | 97 | | | | 1,579 | | |
| Conversion to Class I in connection with Reorganization | | | — | | | | — | | | | (613 | ) | |
| Conversion from Class I in connection with Reorganization | | | — | | | | — | | | | 613 | | |
| Shares Redeemed | | | (399 | ) | | | (178 | ) | | | (1,443 | ) | |
| Net Increase (Decrease) in Class I Shares Outstanding | | | 30 | | | | (81 | ) | | | 136 | | |
| Class P: | |
| Shares Subscribed | | | 154 | | | | 139 | | | | — | @@** | |
| Shares Redeemed | | | (154 | ) | | | — | | | | — | | |
| Net Increase in Class I Shares Outstanding | | | — | @@ | | | 139 | | | | — | @@** | |
| Class H: | |
| Shares Subscribed | | | 486 | | | | 135 | | | | 7,209 | | |
| Conversion from Class A in connection with Reorganization | | | — | | | | — | | | | 19,044 | | |
| Conversion from Class B in connection with Reorganization | | | — | | | | — | | | | 2,532 | | |
| Shares Redeemed | | | (3,265 | ) | | | (2,815 | ) | | | (12,894 | ) | |
| Net Increase (Decrease) in Class H Shares Outstanding | | | (2,779 | ) | | | (2,680 | ) | | | 15,891 | | |
| Class L: | |
| Shares Subscribed | | | 36 | | | | 28 | | | | 931 | | |
| Conversion from Class C in connection with Reorganization | | | — | | | | — | | | | 3,562 | | |
| Shares Redeemed | | | (643 | ) | | | (383 | ) | | | (966 | ) | |
| Net Increase (Decrease) in Class L Shares Outstanding | | | (607 | ) | | | (355 | ) | | | 3,527 | | |
* For the period July 1, 2009 through May 21, 2010.
** For the period May 21, 2010 through June 30, 2010.
@@ Amount is less than 500 shares.
The accompanying notes are an integral part of the financial statements.
162
2011 Annual Report
December 31, 2011
Statements of Changes in Net Assets
| | | Small Company Growth
Portfolio | | U.S. Real Estate
Portfolio | |
| | | Year Ended
December 31,
2011
(000) | | Year Ended
December 31,
2010
(000) | | Year Ended
December 31,
2011
(000) | | Year Ended
December 31,
2010
(000) | |
| Increase (Decrease) in Net Assets: | |
| Operations: | |
| Net Investment Income (Loss) | | $ | (5,631 | ) | | $ | 237 | | | $ | 7,100 | | | $ | 12,536 | | |
| Net Realized Gain (Loss) | | | 47,068 | | | | (19,991 | ) | | | 93,337 | | | | 110,425 | | |
| Net Change in Unrealized Appreciation (Depreciation) | | | (193,850 | ) | | | 404,906 | | | | (49,800 | ) | | | 117,403 | | |
| Net Increase (Decrease) in Net Assets Resulting from Operations | | | (152,413 | ) | | | 385,152 | | | | 50,637 | | | | 240,364 | | |
| Distributions from and/or in Excess of: | |
| Class I: | |
| Net Investment Income | | | — | | | | — | | | | (7,696 | ) | | | (10,759 | ) | |
| Net Realized Gain | | | (19,649 | ) | | | — | | | | — | | | | — | | |
| Class P: | |
| Net Investment Income | | | — | | | | — | | | | (714 | ) | | | (1,535 | ) | |
| Net Realized Gain | | | (5,558 | ) | | | — | | | | — | | | | — | | |
| Class H: | |
| Net Realized Gain | | | (630 | ) | | | — | | | | — | | | | — | | |
| Class L: | |
| Net Realized Gain | | | (33 | ) | | | — | | | | — | | | | — | | |
| Total Distributions | | | (25,870 | ) | | | — | | | | (8,410 | ) | | | (12,294 | ) | |
| Capital Share Transactions:(1) | |
| Class I: | |
| Subscribed | | | 262,046 | | | | 200,631 | | | | 189,073 | | | | 509,963 | | |
| Issued due to a tax-free reorganization | | | 56 | | | | — | | | | 635 | | | | — | | |
| Distributions Reinvested | | | 17,686 | | | | — | | | | 6,787 | | | | 10,349 | | |
| Redeemed | | | (300,632 | ) | | | (215,682 | ) | | | (316,556 | ) | | | (449,135 | ) | |
| Class P: | |
| Subscribed | | | 61,496 | | | | 78,528 | | | | 31,619 | | | | 52,948 | | |
| Distributions Reinvested | | | 5,556 | | | | — | | | | 697 | | | | 875 | | |
| Redeemed | | | (270,497 | ) | | | (204,668 | ) | | | (33,714 | ) | | | (109,259 | ) | |
| Class H:* | |
| Subscribed | | | 29 | | | | — | | | | 156 | | | | — | | |
| Issued due to a tax-free reorganization | | | 34,449 | | | | — | | | | 27,271 | | | | — | | |
| Distributions Reinvested | | | 612 | | | | — | | | | — | | | | — | | |
| Redeemed | | | (1,272 | ) | | | — | | | | (1,095 | ) | | | — | | |
| Class L:* | |
| Subscribed | | | 1 | | | | — | | | | 15 | | | | — | | |
| Issued due to a tax-free reorganization | | | 1,783 | | | | — | | | | 6,074 | | | | — | | |
| Distributions Reinvested | | | 32 | | | | — | | | | — | | | | — | | |
| Redeemed | | | (63 | ) | | | — | | | | (276 | ) | | | — | | |
| Net Increase (Decrease) in Net Assets Resulting from Capital Share Transactions | | | (188,718 | ) | | | (141,191 | ) | | | (89,314 | ) | | | 15,741 | | |
| Redemption Fees | | | 139 | | | | 100 | | | | — | | | | — | | |
| Total Increase (Decrease) in Net Assets | | | (366,862 | ) | | | 244,061 | | | | (47,087 | ) | | | 243,811 | | |
| Net Assets: | |
| Beginning of Period | | | 1,757,905 | | | | 1,513,844 | | | | 944,795 | | | | 700,984 | | |
| End of Period | | $ | 1,391,043 | | | $ | 1,757,905 | | | $ | 897,708 | | | $ | 944,795 | | |
Undistributed (Distributions in Excess of) Net Investment Income Included in
End of Period Net Assets | | $ | (832 | ) | | $ | 147 | | | $ | 1,239 | | | $ | 340 | | |
The accompanying notes are an integral part of the financial statements.
163
2011 Annual Report
December 31, 2011
Statements of Changes in Net Assets (cont'd)
| | | Small Company Growth
Portfolio | | U.S. Real Estate
Portfolio | |
| | | Year Ended
December 31,
2011
(000) | | Year Ended
December 31,
2010
(000) | | Year Ended
December 31,
2011
(000) | | Year Ended
December 31,
2010
(000) | |
| (1) Capital Share Transactions: | |
| Class I: | |
| Shares Subscribed | | | 18,817 | | | | 17,409 | | | | 12,757 | | | | 40,569 | | |
| Shares Issued due to tax-free reorganization | | | 4 | | | | — | | | | 43 | | | | — | | |
| Shares Issued on Distributions Reinvested | | | 1,416 | | | | — | | | | 462 | | | | 821 | | |
| Shares Redeemed | | | (21,915 | ) | | | (18,495 | ) | | | (21,365 | ) | | | (34,016 | ) | |
| Net Increase (Decrease) in Class I Shares Outstanding | | | (1,678 | ) | | | (1,086 | ) | | | (8,103 | ) | | | 7,374 | | |
| Class P: | |
| Shares Subscribed | | | 4,662 | | | | 7,233 | | | | 2,176 | | | | 4,243 | | |
| Shares Issued on Distributions Reinvested | | | 477 | | | | — | | | | 48 | | | | 71 | | |
| Shares Redeemed | | | (21,097 | ) | | | (18,553 | ) | | | (2,312 | ) | | | (8,540 | ) | |
| Net Decrease in Class P Shares Outstanding | | | (15,958 | ) | | | (11,320 | ) | | | (88 | ) | | | (4,226 | ) | |
| Class H:* | |
| Shares Subscribed | | | 3 | | | | — | | | | 11 | | | | — | | |
| Shares Issued due to tax-free reorganization | | | 2,763 | | | | — | | | | 1,878 | | | | — | | |
| Shares Issued on Distributions Reinvested | | | 52 | | | | — | | | | — | | | | — | | |
| Shares Redeemed | | | (105 | ) | | | — | | | | (77 | ) | | | — | | |
| Net Increase in Class H Shares Outstanding | | | 2,713 | | | | — | | | | 1,812 | | | | — | | |
| Class L:* | |
| Shares Subscribed | | | — | @@ | | | — | | | | 1 | | | | — | | |
| Shares Issued due to tax-free reorganization | | | 143 | | | | — | | | | 418 | | | | — | | |
| Shares Issued on Distributions Reinvested | | | 3 | | | | — | | | | — | | | | — | | |
| Shares Redeemed | | | (5 | ) | | | — | | | | (19 | ) | | | — | | |
| Net Increase in Class L Shares Outstanding | | | 141 | | | | — | | | | 400 | | | | — | | |
* For the period November 11, 2011 (commencement of operations) through December 31, 2011.
@@ Amount is less than 500 shares.
The accompanying notes are an integral part of the financial statements.
164
2011 Annual Report
December 31, 2011
Statements of Changes in Net Assets
| | | Emerging Markets Debt
Portfolio | |
| | | Year Ended
December 31,
2011
(000) | | Year Ended
December 31,
2010
(000) | |
| Increase (Decrease) in Net Assets: | |
| Operations: | |
| Net Investment Income | | $ | 3,562 | | | $ | 3,316 | | |
| Net Realized Gain (Loss) | | | (647 | ) | | | 3,430 | | |
| Net Change in Unrealized Appreciation (Depreciation) | | | (7,552 | ) | | | 41 | | |
| Net Increase (Decrease) in Net Assets Resulting from Operations | | | (4,637 | ) | | | 6,787 | | |
| Distributions from and/or in Excess of: | |
| Class I: | |
| Net Investment Income | | | (3,114 | ) | | | (2,318 | ) | |
| Net Realized Gain | | | (764 | ) | | | (1,180 | ) | |
| Class P: | |
| Net Investment Income | | | (397 | ) | | | (438 | ) | |
| Net Realized Gain | | | (96 | ) | | | (279 | ) | |
| Class H: | |
| Net Investment Income | | | (114 | ) | | | (142 | ) | |
| Net Realized Gain | | | (26 | ) | | | (87 | ) | |
| Class L: | |
| Net Investment Income | | | (227 | ) | | | (251 | ) | |
| Net Realized Gain | | | (63 | ) | | | (197 | ) | |
| Total Distributions | | | (4,801 | ) | | | (4,892 | ) | |
| Capital Share Transactions:(1) | |
| Class I: | |
| Subscribed | | | 72,085 | | | | 22,346 | | |
| Distributions Reinvested | | | 1,766 | | | | 2,966 | | |
| Redeemed | | | (25,667 | ) | | | (36,261 | ) | |
| Class P: | |
| Subscribed | | | 3,753 | | | | 2,343 | | |
| Distributions Reinvested | | | 493 | | | | 717 | | |
| Redeemed | | | (3,289 | ) | | | (794 | ) | |
| Class H: | |
| Subscribed | | | 2,128 | | | | 491 | | |
| Distributions Reinvested | | | 140 | | | | 229 | | |
| Redeemed | | | (960 | ) | | | (1,095 | ) | |
| Class L: | |
| Subscribed | | | 1,819 | | | | 3,837 | | |
| Distributions Reinvested | | | 290 | | | | 448 | | |
| Redeemed | | | (1,205 | ) | | | (819 | ) | |
| Net Increase (Decrease) in Net Assets Resulting from Capital Share Transactions | | | 51,353 | | | | (5,592 | ) | |
| Redemption Fees | | | 1 | | | | 1 | | |
| Total Increase (Decrease) in Net Assets | | | 41,916 | | | | (3,696 | ) | |
| Net Assets: | |
| Beginning of Period | | | 42,345 | | | | 46,041 | | |
| End of Period | | $ | 84,261 | | | $ | 42,345 | | |
| Undistributed Net Investment Income Included in End of Period Net Assets | | $ | (9 | ) | | $ | 950 | | |
The accompanying notes are an integral part of the financial statements.
165
2011 Annual Report
December 31, 2011
Statements of Changes in Net Assets (cont'd)
| | | Emerging Markets Debt
Portfolio | |
| | | Year Ended
December 31,
2011
(000) | | Year Ended
December 31,
2010
(000) | |
| (1) Capital Share Transactions: | |
| Class I: | |
| Shares Subscribed | | | 5,856 | | | | 1,740 | | |
| Shares Issued on Distributions Reinvested | | | 149 | | | | 237 | | |
| Shares Redeemed | | | (2,133 | ) | | | (2,788 | ) | |
| Net Increase (Decrease) in Class I Shares Outstanding | | | 3,872 | | | | (811 | ) | |
| Class P: | |
| Shares Subscribed | | | 292 | | | | 183 | | |
| Shares Issued on Distributions Reinvested | | | 40 | | | | 56 | | |
| Shares Redeemed | | | (277 | ) | | | (60 | ) | |
| Net Increase in Class P Shares Outstanding | | | 55 | | | | 179 | | |
| Class H: | |
| Shares Subscribed | | | 163 | | | | 39 | | |
| Shares Issued on Distributions Reinvested | | | 12 | | | | 18 | | |
| Shares Redeemed | | | (77 | ) | | | (85 | ) | |
| Net Increase (Decrease) in Class H Shares Outstanding | | | 98 | | | | (28 | ) | |
| Class L: | |
| Shares Subscribed | | | 142 | | | | 293 | | |
| Shares Issued on Distributions Reinvested | | | 24 | | | | 36 | | |
| Shares Redeemed | | | (100 | ) | | | (63 | ) | |
| Net Increase in Class L Shares Outstanding | | | 66 | | | | 266 | | |
The accompanying notes are an integral part of the financial statements.
166
2011 Annual Report
December 31, 2011
Financial Highlights
Active International Allocation Portfolio
| | | Class I | |
| | | Year Ended December 31, | |
| Selected Per Share Data and Ratios | | 2011 | | 2010 | | 2009 | | 2008 | | 2007 | |
| Net Asset Value, Beginning of Period | | $ | 12.06 | | | $ | 11.30 | | | $ | 9.11 | | | $ | 15.92 | | | $ | 15.10 | | |
| Income (Loss) from Investment Operations: | |
| Net Investment Income† | | | 0.27 | | | | 0.20 | | | | 0.21 | | | | 0.35 | | | | 0.30 | | |
| Net Realized and Unrealized Gain (Loss) | | | (2.03 | ) | | | 0.81 | | | | 2.26 | | | | (6.41 | ) | | | 1.96 | | |
| Total from Investment Operations | | | (1.76 | ) | | | 1.01 | | | | 2.47 | | | | (6.06 | ) | | | 2.26 | | |
| Distributions from and/or in Excess of: | |
| Net Investment Income | | | (0.23 | ) | | | (0.25 | ) | | | (0.28 | ) | | | (0.14 | ) | | | (0.54 | ) | |
| Net Realized Gain | | | — | | | | — | | | | — | | | | (0.61 | ) | | | (0.90 | ) | |
| Total Distributions | | | (0.23 | ) | | | (0.25 | ) | | | (0.28 | ) | | | (0.75 | ) | | | (1.44 | ) | |
| Redemption Fees | | | 0.00 | ‡ | | | 0.00 | ‡ | | | 0.00 | ‡ | | | 0.00 | ‡ | | | 0.00 | ‡ | |
| Net Asset Value, End of Period | | $ | 10.07 | | | $ | 12.06 | | | $ | 11.30 | | | $ | 9.11 | | | $ | 15.92 | | |
| Total Return++ | | | (14.56 | )% | | | 8.95 | % | | | 27.26 | % | | | (39.25 | )% | | | 15.30 | % | |
| Ratios and Supplemental Data: | |
| Net Assets, End of Period (Thousands) | | $ | 302,048 | | | $ | 441,350 | | | $ | 532,584 | | | $ | 565,313 | | | $ | 1,093,735 | | |
| Ratio of Expenses to Average Net Assets (1) | | | 0.84 | %+††^ | | | 0.79 | %+†† | | | 0.79 | %+ | | | 0.79 | %+ | | | 0.80 | %+ | |
| Ratio of Expenses to Average Net Assets Excluding Non Operating Expenses | | | 0.84 | %+††^ | | | 0.79 | %+†† | | | 0.79 | %+ | | | 0.79 | %+ | | | 0.80 | %+ | |
| Ratio of Net Investment Income to Average Net Assets (1) | | | 2.33 | %+†† | | | 1.82 | %+†† | | | 2.23 | %+ | | | 2.70 | %+ | | | 1.93 | %+ | |
| Ratio of Rebate from Morgan Stanley Affiliates to Average Net Assets | | | 0.01 | %†† | | | 0.01 | %†† | | | 0.01 | % | | | 0.01 | % | | | 0.00 | %§ | |
| Portfolio Turnover Rate | | | 26 | % | | | 19 | % | | | 33 | % | | | 34 | % | | | 28 | % | |
| (1) Supplemental Information on the Ratios to Average Net Assets: | |
| Ratios Before Expense Limitation: | |
| Expenses to Average Net Assets | | | 0.95 | %†† | | | 0.92 | %+†† | | | 0.85 | %+ | | | 0.82 | %+ | | | 0.81 | %+ | |
| Net Investment Income to Average Net Assets | | | 2.22 | %†† | | | 1.69 | %+†† | | | 2.17 | %+ | | | 2.67 | %+ | | | 1.92 | %+ | |
† Per share amount is based on average shares outstanding.
‡ Amount is less than $0.005 per share.
++ Calculated based on the net asset value as of the last business day of the period.
+ The Ratios of Expenses and Net Investment Income reflect the rebate of certain Portfolio expenses in connection with the investments in Morgan Stanley affiliates during the period. The effect of the rebate on the ratios is disclosed in the above table as "Ratio of Rebate from Morgan Stanley Affiliates to Average Net Assets."
†† Reflects overall Portfolio ratios for investment income and non-class specific expenses.
§ Amount is less than 0.005%.
^ Effective July 1, 2011, the Adviser has agreed to limit the ratio of expenses to average net assets to the maximum ratio of 0.90% for Class I shares. Prior to July 1, 2011, the maximum ratio was 0.80% for Class I shares.
The accompanying notes are an integral part of the financial statements.
167
2011 Annual Report
December 31, 2011
Financial Highlights
Active International Allocation Portfolio
| | | Class P | |
| | | Year Ended December 31, | |
| Selected Per Share Data and Ratios | | 2011 | | 2010 | | 2009 | | 2008 | | 2007 | |
| Net Asset Value, Beginning of Period | | $ | 12.28 | | | $ | 11.50 | | | $ | 9.27 | | | $ | 16.20 | | | $ | 15.36 | | |
| Income (Loss) from Investment Operations: | |
| Net Investment Income† | | | 0.25 | | | | 0.18 | | | | 0.18 | | | | 0.29 | | | | 0.24 | | |
| Net Realized and Unrealized Gain (Loss) | | | (2.07 | ) | | | 0.81 | | | | 2.31 | | | | (6.48 | ) | | | 2.01 | | |
| Total from Investment Operations | | | (1.82 | ) | | | 0.99 | | | | 2.49 | | | | (6.19 | ) | | | 2.25 | | |
| Distributions from and/or in Excess of: | |
| Net Investment Income | | | (0.19 | ) | | | (0.21 | ) | | | (0.26 | ) | | | (0.13 | ) | | | (0.51 | ) | |
| Net Realized Gain | | | — | | | | — | | | | — | | | | (0.61 | ) | | | (0.90 | ) | |
| Total Distributions | | | (0.19 | ) | | | (0.21 | ) | | | (0.26 | ) | | | (0.74 | ) | | | (1.41 | ) | |
| Redemption Fees | | | 0.00 | ‡ | | | 0.00 | ‡ | | | 0.00 | ‡ | | | 0.00 | ‡ | | | 0.00 | ‡ | |
| Net Asset Value, End of Period | | $ | 10.27 | | | $ | 12.28 | | | $ | 11.50 | | | $ | 9.27 | | | $ | 16.20 | | |
| Total Return++ | | | (14.75 | )% | | | 8.69 | % | | | 26.99 | % | | | (39.41 | )% | | | 14.95 | % | |
| Ratios and Supplemental Data: | |
| Net Assets, End of Period (Thousands) | | $ | 10,387 | | | $ | 14,477 | | | $ | 16,479 | | | $ | 7,614 | | | $ | 5,285 | | |
| Ratio of Expenses to Average Net Assets (1) | | | 1.09 | %+††^ | | | 1.04 | %+†† | | | 1.04 | %+ | | | 1.04 | %+ | | | 1.05 | %+ | |
| Ratio of Expenses to Average Net Assets Excluding Non Operating Expenses | | | 1.09 | %+††^ | | | 1.04 | %+†† | | | 1.04 | %+ | | | 1.04 | %+ | | | 1.05 | %+ | |
| Ratio of Net Investment Income to Average Net Assets (1) | | | 2.08 | %+†† | | | 1.57 | %+†† | | | 1.80 | %+ | | | 2.32 | %+ | | | 1.52 | %+ | |
| Ratio of Rebate from Morgan Stanley Affiliates to Average Net Assets | | | 0.01 | %†† | | | 0.01 | %†† | | | 0.01 | % | | | 0.01 | % | | | 0.00 | %§ | |
| Portfolio Turnover Rate | | | 26 | % | | | 19 | % | | | 33 | % | | | 34 | % | | | 28 | % | |
| (1) Supplemental Information on the Ratios to Average Net Assets: | |
| Ratios Before Expense Limitation: | |
| Expenses to Average Net Assets | | | 1.20 | %†† | | | 1.17 | %+†† | | | 1.10 | %+ | | | 1.07 | %+ | | | 1.06 | %+ | |
| Net Investment Income to Average Net Assets | | | 1.97 | %†† | | | 1.44 | %+†† | | | 1.74 | %+ | | | 2.29 | %+ | | | 1.51 | %+ | |
† Per share amount is based on average shares outstanding.
‡ Amount is less than $0.005 per share.
++ Calculated based on the net asset value as of the last business day of the period.
+ The Ratios of Expenses and Net Investment Income reflect the rebate of certain Portfolio expenses in connection with the investments in Morgan Stanley affiliates during the period. The effect of the rebate on the ratios is disclosed in the above table as "Ratio of Rebate from Morgan Stanley Affiliates to Average Net Assets."
†† Reflects overall Portfolio ratios for investment income and non-class specific expenses.
§ Amount is less than 0.005%.
^ Effective July 1, 2011, the Adviser has agreed to limit the ratio of expenses to average net assets to the maximum ratio of 1.15% for Class P shares. Prior to July 1, 2011, the maximum ratio was 1.05% for Class P shares.
The accompanying notes are an integral part of the financial statements.
168
2011 Annual Report
December 31, 2011
Financial Highlights
Asian Equity Portfolio
| | | Class I | |
| Selected Per Share Data and Ratios | | Year Ended
December 31,
2011 | | Period from
December 28,
2010^ to
December 31,
2010 | |
| Net Asset Value, Beginning of Period | | $ | 10.19 | | | $ | 10.00 | | |
| Income (Loss) from Investment Operations: | |
| Net Investment Income (Loss)† | | | 0.00 | ‡ | | | (0.00 | )‡ | |
| Net Realized and Unrealized Gain (Loss) | | | (1.72 | ) | | | 0.19 | | |
| Total from Investment Operations | | | (1.72 | ) | | | 0.19 | | |
| Net Asset Value, End of Period | | $ | 8.47 | | | $ | 10.19 | | |
| Total Return++ | | | (16.88 | )% | | | 1.90 | %# | |
| Ratios and Supplemental Data:†† | |
| Net Assets, End of Period (Thousands) | | $ | 1,201 | | | $ | 1,223 | | |
| Ratio of Expenses to Average Net Assets (1) | | | 1.45 | %+ | | | 1.45 | %* | |
| Ratio of Net Investment Income (Loss) to Average Net Assets (1) | | | 0.01 | %+ | | | (1.34 | )%* | |
| Ratio of Rebate from Morgan Stanley Affiliates to Average Net Assets | | | 0.00 | %§ | | | N/A | | |
| Portfolio Turnover Rate | | | 38 | % | | | 0.00 | %# | |
| (1) Supplemental Information on the Ratios to Average Net Assets:†† | |
| Ratios Before Expense Limitation: | |
| Expenses to Average Net Assets | | | 11.86 | % | | | 176.73 | %* | |
| Net Investment Loss to Average Net Assets | | | (10.40 | )% | | | (176.62 | )%* | |
^ Commencement of Operations.
† Per share amount is based on average shares outstanding.
‡ Amount is less than $0.005 per share.
++ Calculated based on the net asset value as of the last business day of the period.
+ The Ratios of Expenses and Net Investment Income (Loss) reflect the rebate of certain Portfolio expenses in connection with the investments in Morgan Stanley affiliates during the period. The effect of the rebate on the ratios is disclosed in the above table as "Ratio of Rebate from Morgan Stanley Affiliates to Average Net Assets."
†† Reflects overall Portfolio ratios for investment income and non-class specific expenses.
§ Amount is less than 0.005%.
# Not Annualized.
* Annualized.
The accompanying notes are an integral part of the financial statements.
169
2011 Annual Report
December 31, 2011
Financial Highlights
Asian Equity Portfolio
| | | Class P | |
| Selected Per Share Data and Ratios | | Year Ended
December 31,
2011 | | Period from
December 28,
2010^ to
December 31,
2010 | |
| Net Asset Value, Beginning of Period | | $ | 10.19 | | | $ | 10.00 | | |
| Income (Loss) from Investment Operations: | |
| Net Investment Loss† | | | (0.02 | ) | | | (0.00 | )‡ | |
| Net Realized and Unrealized Gain (Loss) | | | (1.72 | ) | | | 0.19 | | |
| Total from Investment Operations | | | (1.74 | ) | | | 0.19 | | |
| Net Asset Value, End of Period | | $ | 8.45 | | | $ | 10.19 | | |
| Total Return++ | | | (17.08 | )% | | | 1.90 | %# | |
| Ratios and Supplemental Data:†† | |
| Net Assets, End of Period (Thousands) | | $ | 84 | | | $ | 102 | | |
| Ratio of Expenses to Average Net Assets (1) | | | 1.70 | %+ | | | 1.70 | %* | |
| Ratio of Net Investment Loss to Average Net Assets (1) | | | (0.24 | )%+ | | | (1.59 | )%* | |
| Ratio of Rebate from Morgan Stanley Affiliates to Average Net Assets | | | 0.00 | %§ | | | N/A | | |
| Portfolio Turnover Rate | | | 38 | % | | | 0.00 | %# | |
| (1) Supplemental Information on the Ratios to Average Net Assets:†† | |
| Ratios Before Expense Limitation: | |
| Expenses to Average Net Assets | | | 12.11 | % | | | 176.98 | %* | |
| Net Investment Loss to Average Net Assets | | | (10.65 | )% | | | (176.87 | )%* | |
^ Commencement of Operations.
† Per share amount is based on average shares outstanding.
‡ Amount is less than $0.005 per share.
++ Calculated based on the net asset value as of the last business day of the period.
+ The Ratios of Expenses and Net Investment Loss reflect the rebate of certain Portfolio expenses in connection with the investments in Morgan Stanley affiliates during the period. The effect of the rebate on the ratios is disclosed in the above table as "Ratio of Rebate from Morgan Stanley Affiliates to Average Net Assets."
†† Reflects overall Portfolio ratios for investment income and non-class specific expenses.
§ Amount is less than 0.005%.
# Not Annualized.
* Annualized.
The accompanying notes are an integral part of the financial statements.
170
2011 Annual Report
December 31, 2011
Financial Highlights
Asian Equity Portfolio
| | | Class H | |
| Selected Per Share Data and Ratios | | Year Ended
December 31,
2011 | | Period from
December 28,
2010^ to
December 31,
2010 | |
| Net Asset Value, Beginning of Period | | $ | 10.19 | | | $ | 10.00 | | |
| Income (Loss) from Investment Operations: | |
| Net Investment Loss† | | | (0.02 | ) | | | (0.00 | )‡ | |
| Net Realized and Unrealized Gain (Loss) | | | (1.72 | ) | | | 0.19 | | |
| Total from Investment Operations | | | (1.74 | ) | | | 0.19 | | |
| Net Asset Value, End of Period | | $ | 8.45 | | | $ | 10.19 | | |
| Total Return++ | | | (17.08 | )% | | | 1.90 | %# | |
| Ratios and Supplemental Data:†† | |
| Net Assets, End of Period (Thousands) | | $ | 84 | | | $ | 102 | | |
| Ratio of Expenses to Average Net Assets (1) | | | 1.70 | %+ | | | 1.70 | %* | |
| Ratio of Net Investment Loss to Average Net Assets (1) | | | (0.24 | )%+ | | | (1.59 | )%* | |
| Ratio of Rebate from Morgan Stanley Affiliates to Average Net Assets | | | 0.00 | %§ | | | N/A | | |
| Portfolio Turnover Rate | | | 38 | % | | | 0.00 | %# | |
| (1) Supplemental Information on the Ratios to Average Net Assets:†† | |
| Ratios Before Expense Limitation: | |
| Expense to Average Net Assets | | | 12.11 | % | | | 176.98 | %* | |
| Net Investment Loss to Average Net Assets | | | (10.65 | )% | | | (176.87 | )%* | |
^ Commencement of Operations.
† Per share amount is based on average shares outstanding.
‡ Amount is less than $0.005 per share.
++ Calculated based on the net asset value which does not reflect sales charges, if applicable, as of the last business day of the period.
+ The Ratios of Expenses and Net Investment Loss reflect the rebate of certain Portfolio expenses in connection with the investments in Morgan Stanley affiliates during the period. The effect of the rebate on the ratios is disclosed in the above table as "Ratio of Rebate from Morgan Stanley Affiliates to Average Net Assets."
†† Reflects overall Portfolio ratios for investment income and non-class specific expenses.
§ Amount is less than 0.005%.
# Not Annualized.
* Annualized.
The accompanying notes are an integral part of the financial statements.
171
2011 Annual Report
December 31, 2011
Financial Highlights
Asian Equity Portfolio
| | | Class L | |
| Selected Per Share Data and Ratios | | Year Ended
December 31,
2011 | | Period from
December 28,
2010^ to
December 31,
2010 | |
| Net Asset Value, Beginning of Period | | $ | 10.19 | | | $ | 10.00 | | |
| Income (Loss) from Investment Operations: | |
| Net Investment Loss† | | | (0.07 | ) | | | (0.00 | )‡ | |
| Net Realized and Unrealized Gain (Loss) | | | (1.72 | ) | | | 0.19 | | |
| Total from Investment Operations | | | (1.79 | ) | | | 0.19 | | |
| Net Asset Value, End of Period | | $ | 8.40 | | | $ | 10.19 | | |
| Total Return++ | | | (17.57 | )% | | | 1.90 | %# | |
| Ratios and Supplemental Data:†† | |
| Net Assets, End of Period (Thousands) | | $ | 84 | | | $ | 102 | | |
| Ratio of Expenses to Average Net Assets (1) | | | 2.20 | %+ | | | 2.20 | %* | |
| Ratio of Net Investment Loss to Average Net Assets (1) | | | (0.74 | )%+ | | | (2.09 | )%* | |
| Ratio of Rebate from Morgan Stanley Affiliates to Average Net Assets | | | 0.00 | %§ | | | N/A | | |
| Portfolio Turnover Rate | | | 38 | % | | | 0.00 | %# | |
| (1) Supplemental Information on the Ratios to Average Net Assets:†† | |
| Ratios Before Expense Limitation: | |
| Expenses to Average Net Assets | | | 12.61 | % | | | 177.48 | %* | |
| Net Investment Loss to Average Net Assets | | | (11.15 | )% | | | (177.37 | )%* | |
^ Commencement of Operations.
† Per share amount is based on average shares outstanding.
‡ Amount is less than $0.005 per share.
++ Calculated based on the net asset value as of the last business day of the period.
+ The Ratios of Expenses and Net Investment Loss reflect the rebate of certain Portfolio expenses in connection with the investments in Morgan Stanley affiliates during the period. The effect of the rebate on the ratios is disclosed in the above table as "Ratio of Rebate from Morgan Stanley Affiliates to Average Net Assets."
†† Reflects overall Portfolio ratios for investment income and non-class specific expenses.
§ Amount is less than 0.005%.
# Not Annualized.
* Annualized.
The accompanying notes are an integral part of the financial statements.
172
2011 Annual Report
December 31, 2011
Financial Highlights
Emerging Markets Portfolio
| | | Class I | |
| | | Year Ended December 31, | |
| Selected Per Share Data and Ratios | | 2011 | | 2010 | | 2009 | | 2008 | | 2007 | |
| Net Asset Value, Beginning of Period | | $ | 27.14 | | | $ | 23.10 | | | $ | 13.79 | | | $ | 34.02 | | | $ | 29.29 | | |
| Income (Loss) from Investment Operations: | |
| Net Investment Income† | | | 0.22 | | | | 0.10 | | | | 0.10 | | | | 0.19 | | | | 0.10 | | |
| Net Realized and Unrealized Gain (Loss) | | | (5.22 | ) | | | 4.15 | | | | 9.49 | | | | (18.78 | ) | | | 11.76 | | |
| Total from Investment Operations | | | (5.00 | ) | | | 4.25 | | | | 9.59 | | | | (18.59 | ) | | | 11.86 | | |
| Distributions from and/or in Excess of: | |
| Net Investment Income | | | — | | | | (0.21 | ) | | | (0.28 | ) | | | — | | | | (0.13 | ) | |
| Net Realized Gain | | | (0.41 | ) | | | — | | | | — | | | | (1.64 | ) | | | (7.01 | ) | |
| Total Distributions | | | (0.41 | ) | | | (0.21 | ) | | | (0.28 | ) | | | (1.64 | ) | | | (7.14 | ) | |
| Redemption Fees | | | 0.00 | ‡ | | | 0.00 | ‡ | | | 0.00 | ‡ | | | 0.00 | ‡ | | | 0.01 | | |
| Net Asset Value, End of Period | | $ | 21.73 | | | $ | 27.14 | | | $ | 23.10 | | | $ | 13.79 | | | $ | 34.02 | | |
| Total Return++ | | | (18.41 | )% | | | 18.49 | % | | | 69.54 | % | | | (56.39 | )% | | | 41.56 | % | |
| Ratios and Supplemental Data: | |
| Net Assets, End of Period (Thousands) | | $ | 1,198,857 | | | $ | 2,031,778 | | | $ | 2,198,793 | | | $ | 1,191,199 | | | $ | 3,323,130 | | |
| Ratio of Expenses to Average Net Assets | | | 1.48 | %+†† | | | 1.47 | %+†† | | | 1.40 | %+ | | | 1.43 | %+ | | | 1.35 | %+ | |
| Ratio of Expenses to Average Net Assets Excluding Non Operating Expenses | | | N/A | | | | 1.47 | %+†† | | | 1.40 | %+ | | | 1.43 | %+ | | | 1.35 | %+ | |
| Ratio of Net Investment Income to Average Net Assets | | | 0.86 | %+†† | | | 0.40 | %+†† | | | 0.56 | %+ | | | 0.78 | %+ | | | 0.28 | %+ | |
| Ratio of Rebate from Morgan Stanley Affiliates to Average Net Assets | | | 0.01 | %†† | | | 0.01 | %†† | | | 0.01 | % | | | 0.00 | %§ | | | 0.00 | %§ | |
| Portfolio Turnover Rate | | | 60 | % | | | 59 | % | | | 64 | % | | | 96 | % | | | 101 | % | |
† Per share amount is based on average shares outstanding.
‡ Amount is less than $0.005 per share.
++ Calculated based on the net asset value as of the last business day of the period.
+ The Ratios of Expenses and Net Investment Income reflect the rebate of certain Portfolio expenses in connection with the investments in Morgan Stanley affiliates during the period. The effect of the rebate on the ratios is disclosed in the above table as "Ratio of Rebate from Morgan Stanley Affiliates to Average Net Assets."
†† Reflects overall Portfolio ratios for investment income and non-class specific expenses.
§ Amount is less than 0.005%.
The accompanying notes are an integral part of the financial statements.
173
2011 Annual Report
December 31, 2011
Financial Highlights
Emerging Markets Portfolio
| | | Class P | |
| | | Year Ended December 31, | |
| Selected Per Share Data and Ratios | | 2011 | | 2010 | | 2009 | | 2008 | | 2007 | |
| Net Asset Value, Beginning of Period | | $ | 26.56 | | | $ | 22.61 | | | $ | 13.51 | | | $ | 33.46 | | | $ | 28.91 | | |
| Income (Loss) from Investment Operations: | |
| Net Investment Income† | | | 0.15 | | | | 0.04 | | | | 0.06 | | | | 0.13 | | | | 0.01 | | |
| Net Realized and Unrealized Gain (Loss) | | | (5.10 | ) | | | 4.06 | | | | 9.28 | | | | (18.44 | ) | | | 11.60 | | |
| Total from Investment Operations | | | (4.95 | ) | | | 4.10 | | | | 9.34 | | | | (18.31 | ) | | | 11.61 | | |
| Distributions from and/or in Excess of: | |
| Net Investment Income | | | — | | | | (0.15 | ) | | | (0.24 | ) | | | — | | | | (0.05 | ) | |
| Net Realized Gain | | | (0.41 | ) | | | — | | | | — | | | | (1.64 | ) | | | (7.01 | ) | |
| Total Distributions | | | (0.41 | ) | | | (0.15 | ) | | | (0.24 | ) | | | (1.64 | ) | | | (7.06 | ) | |
| Redemption Fees | | | 0.00 | ‡ | | | 0.00 | ‡ | | | 0.00 | ‡ | | | 0.00 | ‡ | | | 0.00 | ‡ | |
| Net Asset Value, End of Period | | $ | 21.20 | | | $ | 26.56 | | | $ | 22.61 | | | $ | 13.51 | | | $ | 33.46 | | |
| Total Return++ | | | (18.63 | )% | | | 18.20 | % | | | 69.11 | % | | | (56.50 | )% | | | 41.20 | % | |
| Ratios and Supplemental Data: | |
| Net Assets, End of Period (Thousands) | | $ | 46,521 | | | $ | 113,434 | | | $ | 126,487 | | | $ | 67,559 | | | $ | 179,834 | | |
| Ratio of Expenses to Average Net Assets | | | 1.73 | %+†† | | | 1.72 | %+†† | | | 1.65 | %+ | | | 1.68 | %+ | | | 1.60 | %+ | |
| Ratio of Expenses to Average Net Assets Excluding Non Operating Expenses | | | N/A | | | | 1.72 | %+†† | | | 1.65 | %+ | | | 1.68 | %+ | | | 1.60 | %+ | |
| Ratio of Net Investment Income to Average Net Assets | | | 0.61 | %+†† | | | 0.15 | %+†† | | | 0.32 | %+ | | | 0.52 | %+ | | | 0.02 | %+ | |
| Ratio of Rebate from Morgan Stanley Affiliates to Average Net Assets | | | 0.01 | %†† | | | 0.01 | %†† | | | 0.01 | % | | | 0.00 | %§ | | | 0.00 | %§ | |
| Portfolio Turnover Rate | | | 60 | % | | | 59 | % | | | 64 | % | | | 96 | % | | | 101 | % | |
† Per share amount is based on average shares outstanding.
‡ Amount is less than $0.005 per share.
++ Calculated based on the net asset value as of the last business day of the period.
+ The Ratios of Expenses and Net Investment Income reflect the rebate of certain Portfolio expenses in connection with the investments in Morgan Stanley affiliates during the period. The effect of the rebate on the ratios is disclosed in the above table as "Ratio of Rebate from Morgan Stanley Affiliates to Average Net Assets."
†† Reflects overall Portfolio ratios for investment income and non-class specific expenses.
§ Amount is less than 0.005%.
The accompanying notes are an integral part of the financial statements.
174
2011 Annual Report
December 31, 2011
Financial Highlights
Global Advantage Portfolio
| | | Class I | |
| Selected Per Share Data and Ratios | | Year Ended
December 31,
2011 | | Period from
December 28,
2010^ to
December 31,
2010 | |
| Net Asset Value, Beginning of Period | | $ | 10.01 | | | $ | 10.00 | | |
| Income from Investment Operations: | |
| Net Investment Income (Loss)† | | | 0.06 | | | | (0.00 | )‡ | |
| Net Realized and Unrealized Gain (Loss) | | | (0.03 | ) | | | 0.01 | | |
| Total from Investment Operations | | | 0.03 | | | | 0.01 | | |
| Distributions from and/or in Excess of: | |
| Net Investment Income | | | (0.07 | ) | | | — | | |
| Net Asset Value, End of Period | | $ | 9.97 | | | $ | 10.01 | | |
| Total Return++ | | | 0.34 | % | | | 0.10 | %# | |
| Ratios and Supplemental Data:†† | |
| Net Assets, End of Period (Thousands) | | $ | 1,603 | | | $ | 701 | | |
| Ratio of Expenses to Average Net Assets (1) | | | 1.30 | %+ | | | 1.30 | %* | |
| Ratio of Net Investment Income to Average Net Assets (1) | | | 0.57 | %+ | | | (1.10 | )%* | |
| Ratio of Rebate from Morgan Stanley Affiliates to Average Net Assets | | | 0.00 | %§ | | | N/A | | |
| Portfolio Turnover Rate | | | 42 | % | | | 0.00 | %# | |
| (1) Supplemental Information on the Ratios to Average Net Assets:†† | |
| Ratios Before Expense Limitation: | |
| Expenses to Average Net Assets | | | 7.31 | % | | | 245.42 | %* | |
| Net Investment Loss to Average Net Assets | | | (5.44 | )% | | | (245.22 | )%* | |
^ Commencement of Operations.
† Per share amount is based on average shares outstanding.
‡ Amount is less than $0.005 per share.
++ Calculated based on the net asset value as of the last business day of the period.
†† Reflects overall Portfolio ratios for investment income and non-class specific expenses.
+ The Ratios of Expenses and Net Investment Income reflect the rebate of certain Portfolio expenses in connection with the investments in Morgan Stanley affiliates during the period. The effect of the rebate on the ratios is disclosed in the above table as "Ratio of Rebate from Morgan Stanley Affiliates to Average Net Assets."
§ Amount is less than 0.005%.
# Not Annualized.
* Annualized.
The accompanying notes are an integral part of the financial statements.
175
2011 Annual Report
December 31, 2011
Financial Highlights
Global Advantage Portfolio
| | | Class P | |
| Selected Per Share Data and Ratios | | Year Ended
December 31,
2011 | | Period from
December 28,
2010^ to
December 31,
2010 | |
| Net Asset Value, Beginning of Period | | $ | 10.01 | | | $ | 10.00 | | |
| Income from Investment Operations: | |
| Net Investment Income (Loss)† | | | 0.03 | | | | (0.00 | )‡ | |
| Net Realized and Unrealized Gain (Loss) | | | (0.02 | ) | | | 0.01 | | |
| Total from Investment Operations | | | 0.01 | | | | 0.01 | | |
| Distributions from and/or in Excess of: | |
| Net Investment Income | | | (0.05 | ) | | | — | | |
| Net Asset Value, End of Period | | $ | 9.97 | | | $ | 10.01 | | |
| Total Return++ | | | 0.07 | % | | | 0.10 | %# | |
| Ratios and Supplemental Data:†† | |
| Net Assets, End of Period (Thousands) | | $ | 100 | | | $ | 100 | | |
| Ratio of Expenses to Average Net Assets (1) | | | 1.55 | %+ | | | 1.55 | %* | |
| Ratio of Net Investment Income to Average Net Assets (1) | | | 0.32 | %+ | | | (1.35 | )%* | |
| Ratio of Rebate from Morgan Stanley Affiliates to Average Net Assets | | | 0.00 | %§ | | | N/A | | |
| Portfolio Turnover Rate | | | 42 | % | | | 0.00 | %# | |
| (1) Supplemental Information on the Ratios to Average Net Assets:†† | |
| Ratios Before Expense Limitation: | |
| Expenses to Average Net Assets | | | 7.56 | % | | | 245.67 | %* | |
| Net Investment Loss to Average Net Assets | | | (5.69 | )% | | | (245.47 | )%* | |
^ Commencement of Operations.
† Per share amount is based on average shares outstanding.
‡ Amount is less than $0.005 per share.
++ Calculated based on the net asset value as of the last business day of the period.
†† Reflects overall Portfolio ratios for investment income and non-class specific expenses.
+ The Ratios of Expenses and Net Investment Income reflect the rebate of certain Portfolio expenses in connection with the investments in Morgan Stanley affiliates during the period. The effect of the rebate on the ratios is disclosed in the above table as "Ratio of Rebate from Morgan Stanley Affiliates to Average Net Assets."
§ Amount is less than 0.005%.
# Not Annualized.
* Annualized.
The accompanying notes are an integral part of the financial statements.
176
2011 Annual Report
December 31, 2011
Financial Highlights
Global Advantage Portfolio
| | | Class H | |
| Selected Per Share Data and Ratios | | Year Ended
December 31,
2011 | | Period from
December 28,
2010^ to
December 31,
2010 | |
| Net Asset Value, Beginning of Period | | $ | 10.01 | | | $ | 10.00 | | |
| Income from Investment Operations: | |
| Net Investment Income (Loss)† | | | 0.03 | | | | (0.00 | )‡ | |
| Net Realized and Unrealized Gain (Loss) | | | (0.02 | ) | | | 0.01 | | |
| Total from Investment Operations | | | 0.01 | | | | 0.01 | | |
| Distributions from and/or in Excess of: | |
| Net Investment Income | | | (0.05 | ) | | | — | | |
| Net Asset Value, End of Period | | $ | 9.97 | | | $ | 10.01 | | |
| Total Return++ | | | 0.08 | % | | | 0.10 | %# | |
| Ratios and Supplemental Data:†† | |
| Net Assets, End of Period (Thousands) | | $ | 895 | | | $ | 200 | | |
| Ratio of Expenses to Average Net Assets (1) | | | 1.55 | %+ | | | 1.55 | %* | |
| Ratio of Net Investment Income (Loss) to Average Net Assets (1) | | | 0.32 | %+ | | | (1.35 | )%* | |
| Ratio of Rebate from Morgan Stanley Affiliates to Average Net Assets | | | 0.00 | %§ | | | N/A | | |
| Portfolio Turnover Rate | | | 42 | % | | | 0.00 | %# | |
| (1) Supplemental Information on the Ratios to Average Net Assets:†† | |
| Ratios Before Expense Limitation: | |
| Expense to Average Net Assets | | | 7.56 | % | | | 245.67 | %* | |
| Net Investment Loss to Average Net Assets | | | (5.69 | )% | | | (245.47 | )%* | |
^ Commencement of Operations.
† Per share amount is based on average shares outstanding.
‡ Amount is less than $0.005 per share.
++ Calculated based on the net asset value as of the last business day of the period.
†† Reflects overall Portfolio ratios for investment income and non-class specific expenses.
+ The Ratios of Expenses and Net Investment Income reflect the rebate of certain Portfolio expenses in connection with the investments in Morgan Stanley affiliates during the period. The effect of the rebate on the ratios is disclosed in the above table as "Ratio of Rebate from Morgan Stanley Affiliates to Average Net Assets."
§ Amount is less than 0.005%.
# Not Annualized.
* Annualized.
The accompanying notes are an integral part of the financial statements.
177
2011 Annual Report
December 31, 2011
Financial Highlights
Global Advantage Portfolio
| | | Class L | |
| Selected Per Share Data and Ratios | | Year Ended
December 31,
2011 | | Period from
December 28,
2010^ to
December 31,
2010 | |
| Net Asset Value, Beginning of Period | | $ | 10.01 | | | $ | 10.00 | | |
| Income (Loss) from Investment Operations: | |
| Net Investment Loss† | | | (0.02 | ) | | | (0.00 | )‡ | |
| Net Realized and Unrealized Gain (Loss) | | | (0.02 | ) | | | 0.01 | | |
| Total from Investment Operations | | | (0.04 | ) | | | 0.01 | | |
| Distributions from and/or in Excess of: | |
| Net Investment Income | | | (0.01 | ) | | | — | | |
| Net Asset Value, End of Period | | $ | 9.96 | | | $ | 10.01 | | |
| Total Return++ | | | (0.44 | )% | | | 0.10 | %# | |
| Ratios and Supplemental Data:†† | |
| Net Assets, End of Period (Thousands) | | $ | 100 | | | $ | 100 | | |
| Ratio of Expenses to Average Net Assets (1) | | | 2.05 | %+ | | | 2.05 | %* | |
| Ratio of Net Investment Loss to Average Net Assets (1) | | | (0.18 | )%+ | | | (1.85 | )%* | |
| Ratio of Rebate from Morgan Stanley Affiliates to Average Net Assets | | | 0.00 | %§ | | | N/A | | |
| Portfolio Turnover Rate | | | 42 | % | | | 0.00 | %# | |
| (1) Supplemental Information on the Ratios to Average Net Assets:†† | |
| Ratios Before Expense Limitation: | |
| Expenses to Average Net Assets | | | 8.06 | % | | | 246.17 | %* | |
| Net Investment Loss to Average Net Assets | | | (6.19 | )% | | | (245.97 | )%* | |
^ Commencement of Operations.
† Per share amount is based on average shares outstanding.
‡ Amount is less than $0.005 per share.
++ Calculated based on the net asset value as of the last business day of the period.
†† Reflects overall Portfolio ratios for investment income and non-class specific expenses.
+ The Ratios of Expenses and Net Investment Loss reflect the rebate of certain Portfolio expenses in connection with the investments in Morgan Stanley affiliates during the period. The effect of the rebate on the ratios is disclosed in the above table as "Ratio of Rebate from Morgan Stanley Affiliates to Average Net Assets."
§ Amount is less than 0.005%.
# Not Annualized.
* Annualized.
The accompanying notes are an integral part of the financial statements.
178
2011 Annual Report
December 31, 2011
Financial Highlights
Global Discovery Portfolio
| | | Class I | |
| Selected Per Share Data and Ratios | | Year Ended
December 31,
2011 | | Period from
December 28,
2010^ to
December 31,
2010 | |
| Net Asset Value, Beginning of Period | | $ | 9.97 | | | $ | 10.00 | | |
| Income (Loss) from Investment Operations: | |
| Net Investment Income (Loss)† | | | 0.13 | | | | (0.00 | )‡ | |
| Net Realized and Unrealized Loss | | | (0.92 | ) | | | (0.03 | ) | |
| Total from Investment Operations | | | (0.79 | ) | | | (0.03 | ) | |
| Distributions from and/or in Excess of: | |
| Net Investment Income | | | (0.12 | ) | | | — | | |
| Net Realized Gain | | | (0.00 | )‡ | | | — | | |
| Total Distributions | | | (0.12 | ) | | | — | | |
| Net Asset Value, End of Period | | $ | 9.06 | | | $ | 9.97 | | |
| Total Return++ | | | (7.72 | )% | | | (0.30 | )%# | |
| Ratios and Supplemental Data:†† | |
| Net Assets, End of Period (Thousands) | | $ | 2,446 | | | $ | 697 | | |
| Ratio of Expenses to Average Net Assets (1) | | | 1.35 | %+ | | | 1.35 | %* | |
| Ratio of Net Investment Income (Loss) to Average Net Assets (1) | | | 1.39 | %+ | | | (1.14 | )%* | |
| Ratio of Rebate from Morgan Stanley Affiliates to Average Net Assets | | | 0.00 | %§ | | | N/A | | |
| Portfolio Turnover Rate | | | 83 | % | | | 0.00 | %# | |
| (1) Supplemental Information on the Ratios to Average Net Assets:†† | |
| Ratios Before Expense Limitation: | |
| Expenses to Average Net Assets | | | 5.52 | % | | | 238.14 | %* | |
| Net Investment Loss to Average Net Assets | | | (2.78 | )% | | | (237.93 | )%* | |
^ Commencement of Operations.
† Per share amount is based on average shares outstanding.
‡ Amount is less than $0.005 per share.
++ Calculated based on the net asset value as of the last business day of the period.
†† Reflects overall Portfolio ratios for investment income and non-class specific expenses.
+ The Ratios of Expenses and Net Investment Income (Loss) reflect the rebate of certain Portfolio expenses in connection with the investments in Morgan Stanley affiliates during the period. The effect of the rebate on the ratios is disclosed in the above table as "Ratio of Rebate from Morgan Stanley Affiliates to Average Net Assets."
§ Amount is less than 0.005%.
# Not Annualized.
* Annualized.
The accompanying notes are an integral part of the financial statements.
179
2011 Annual Report
December 31, 2011
Financial Highlights
Global Discovery Portfolio
| | | Class P | |
| Selected Per Share Data and Ratios | | Year Ended
December 31,
2011 | | Period from
December 28,
2010^ to
December 31,
2010 | |
| Net Asset Value, Beginning of Period | | $ | 9.97 | | | $ | 10.00 | | |
| Income (Loss) from Investment Operations: | |
| Net Investment Income (Loss)† | | | 0.12 | | | | (0.00 | )‡ | |
| Net Realized and Unrealized Loss | | | (0.92 | ) | | | (0.03 | ) | |
| Total from Investment Operations | | | (0.80 | ) | | | (0.03 | ) | |
| Distributions from and/or in Excess of: | |
| Net Investment Income | | | (0.10 | ) | | | — | | |
| Net Realized Gain | | | (0.00 | )‡ | | | — | | |
| Total Distributions | | | (0.10 | ) | | | — | | |
| Net Asset Value, End of Period | | $ | 9.07 | | | $ | 9.97 | | |
| Total Return++ | | | (7.98 | )% | | | (0.30 | )%# | |
| Ratios and Supplemental Data:†† | |
| Net Assets, End of Period (Thousands) | | $ | 91 | | | $ | 100 | | |
| Ratio of Expenses to Average Net Assets (1) | | | 1.60 | %+ | | | 1.60 | %* | |
| Ratio of Net Investment Income (Loss) to Average Net Assets (1) | | | 1.14 | %+ | | | (1.39 | )%* | |
| Ratio of Rebate from Morgan Stanley Affiliates to Average Net Assets | | | 0.00 | %§ | | | N/A | | |
| Portfolio Turnover Rate | | | 83 | % | | | 0.00 | %# | |
| (1) Supplemental Information on the Ratios to Average Net Assets:†† | |
| Ratios Before Expense Limitation: | |
| Expenses to Average Net Assets | | | 5.77 | % | | | 238.39 | %* | |
| Net Investment Loss to Average Net Assets | | | (3.03 | )% | | | (238.18 | )%* | |
^ Commencement of Operations.
† Per share amount is based on average shares outstanding.
‡ Amount is less than $0.005 per share.
++ Calculated based on the net asset value as of the last business day of the period.
†† Reflects overall Portfolio ratios for investment income and non-class specific expenses.
+ The Ratios of Expenses and Net Investment Income (Loss) reflect the rebate of certain Portfolio expenses in connection with the investments in Morgan Stanley affiliates during the period. The effect of the rebate on the ratios is disclosed in the above table as "Ratio of Rebate from Morgan Stanley Affiliates to Average Net Assets."
§ Amount is less than 0.005%.
# Not Annualized.
* Annualized.
The accompanying notes are an integral part of the financial statements.
180
2011 Annual Report
December 31, 2011
Financial Highlights
Global Discovery Portfolio
| | | Class H | |
| Selected Per Share Data and Ratios | | Year Ended
December 31,
2011 | | Period from
December 28,
2010^ to
December 31,
2010 | |
| Net Asset Value, Beginning of Period | | $ | 9.97 | | | $ | 10.00 | | |
| Income (Loss) from Investment Operations: | |
| Net Investment Income (Loss)† | | | 0.11 | | | | (0.00 | )‡ | |
| Net Realized and Unrealized Loss | | | (0.91 | ) | | | (0.03 | ) | |
| Total from Investment Operations | | | (0.80 | ) | | | (0.03 | ) | |
| Distributions from and/or in Excess of: | |
| Net Investment Income | | | (0.10 | ) | | | — | | |
| Net Realized Gain | | | (0.00 | )‡ | | | �� | | |
| Total Distributions | | | (0.10 | ) | | | — | | |
| Net Asset Value, End of Period | | $ | 9.07 | | | $ | 9.97 | | |
| Total Return++ | | | (7.96 | )% | | | (0.30 | )%# | |
| Ratios and Supplemental Data:†† | |
| Net Assets, End of Period (Thousands) | | $ | 1,157 | | | $ | 349 | | |
| Ratio of Expenses to Average Net Assets (1) | | | 1.60 | %+ | | | 1.60 | %* | |
| Ratio of Net Investment Income (Loss) to Average Net Assets (1) | | | 1.14 | %+ | | | (1.39 | )%* | |
| Rebate from Morgan Stanley Affiliates to Average Net Assets | | | 0.00 | %§ | | | N/A | | |
| Portfolio Turnover Rate | | | 83 | % | | | 0.00 | %# | |
| (1) Supplemental Information on the Ratios to Average Net Assets:†† | |
| Ratios Before Expense Limitation: | |
| Expense to Average Net Assets | | | 5.77 | % | | | 238.39 | %* | |
| Net Investment Loss to Average Net Assets | | | (3.03 | )% | | | (238.18 | )%* | |
^ Commencement of Operations.
† Per share amount is based on average shares outstanding.
‡ Amount is less than $0.005 per share.
++ Calculated based on the net asset value which does not reflect sales charges, if applicable, as of the last business day of the period.
†† Reflects overall Portfolio ratios for investment income and non-class specific expenses.
+ The Ratios of Expenses and Net Investment Income (Loss) reflect the rebate of certain Portfolio expenses in connection with the investments in Morgan Stanley affiliates during the period. The effect of the rebate on the ratios is disclosed in the above table as "Ratio of Rebate from Morgan Stanley Affiliates to Average Net Assets."
§ Amount is less than 0.005%.
# Not Annualized.
* Annualized.
The accompanying notes are an integral part of the financial statements.
181
2011 Annual Report
December 31, 2011
Financial Highlights
Global Discovery Portfolio
| | | Class L | |
| Selected Per Share Data and Ratios | | Year Ended
December 31,
2011 | | Period from
December 28,
2010^ to
December 31,
2010 | |
| Net Asset Value, Beginning of Period | | $ | 9.97 | | | $ | 10.00 | | |
| Income (Loss) from Investment Operations: | |
| Net Investment Income (Loss)† | | | 0.06 | | | | (0.00 | )‡ | |
| Net Realized and Unrealized Loss | | | (0.91 | ) | | | (0.03 | ) | |
| Total from Investment Operations | | | (0.85 | ) | | | (0.03 | ) | |
| Distributions from and/or in Excess of: | |
| Net Investment Income | | | (0.05 | ) | | | — | | |
| Net Realized Gain | | | (0.00 | )‡ | | | — | | |
| Total Distributions | | | (0.05 | ) | | | — | | |
| Net Asset Value, End of Period | | $ | 9.07 | | | $ | 9.97 | | |
| Total Return++ | | | (8.41 | )% | | | (0.30 | )%# | |
| Ratios and Supplemental Data:†† | |
| Net Assets, End of Period (Thousands) | | $ | 91 | | | $ | 100 | | |
| Ratio of Expenses to Average Net Assets (1) | | | 2.10 | %+ | | | 2.10 | %* | |
| Ratio of Net Investment Income (Loss) to Average Net Assets (1) | | | 0.64 | %+ | | | (1.89 | )%* | |
| Ratio of Rebate from Morgan Stanley Affiliates to Average Net Assets | | | 0.00 | %§ | | | N/A | | |
| Portfolio Turnover Rate | | | 83 | % | | | 0.00 | %# | |
| (1) Supplemental Information on the Ratios to Average Net Assets:†† | |
| Ratios Before Expense Limitation: | |
| Expenses to Average Net Assets | | | 6.27 | % | | | 238.89 | %* | |
| Net Investment Loss to Average Net Assets | | | (3.53 | )% | | | (238.68 | )%* | |
^ Commencement of Operations.
† Per share amount is based on average shares outstanding.
‡ Amount is less than $0.005 per share.
++ Calculated based on the net asset value as of the last business day of the period.
†† Reflects overall Portfolio ratios for investment income and non-class specific expenses.
+ The Ratios of Expenses and Net Investment Income (Loss) reflect the rebate of certain Portfolio expenses in connection with the investments in Morgan Stanley affiliates during the period. The effect of the rebate on the ratios is disclosed in the above table as "Ratio of Rebate from Morgan Stanley Affiliates to Average Net Assets."
§ Amount is less than 0.005%.
# Not Annualized.
* Annualized.
The accompanying notes are an integral part of the financial statements.
182
2011 Annual Report
December 31, 2011
Financial Highlights
Global Franchise Portfolio
| | | Class I | |
| | | Year Ended December 31, | |
| Selected Per Share Data and Ratios | | 2011 | | 2010 | | 2009 | | 2008 | | 2007 | |
| Net Asset Value, Beginning of Period | | $ | 15.29 | | | $ | 13.81 | | | $ | 10.82 | | | $ | 16.62 | | | $ | 17.98 | | |
| Income (Loss) from Investment Operations: | |
| Net Investment Income† | | | 0.31 | | | | 0.32 | | | | 0.19 | | | | 0.35 | | | | 0.40 | | |
| Net Realized and Unrealized Gain (Loss) | | | 1.11 | | | | 1.62 | | | | 2.98 | | | | (5.11 | ) | | | 1.30 | | |
| Total from Investment Operations | | | 1.42 | | | | 1.94 | | | | 3.17 | | | | (4.76 | ) | | | 1.70 | | |
| Distributions from and/or in Excess of: | |
| Net Investment Income | | | (0.30 | ) | | | (0.46 | ) | | | (0.18 | ) | | | (0.84 | ) | | | (0.15 | ) | |
| Net Realized Gain | | | (0.17 | ) | | | — | | | | — | | | | (0.20 | ) | | | (2.91 | ) | |
| Total Distributions | | | (0.47 | ) | | | (0.46 | ) | | | (0.18 | ) | | | (1.04 | ) | | | (3.06 | ) | |
| Net Asset Value, End of Period | | $ | 16.24 | | | $ | 15.29 | | | $ | 13.81 | | | $ | 10.82 | | | $ | 16.62 | | |
| Total Return++ | | | 9.38 | % | | | 14.07 | % | | | 29.65 | % | | | (28.88 | )% | | | 9.58 | % | |
| Ratios and Supplemental Data: | |
| Net Assets, End of Period (Thousands) | | $ | 211,677 | | | $ | 89,666 | | | $ | 111,852 | | | $ | 78,029 | | | $ | 110,135 | | |
| Ratio of Expenses to Average Net Assets (1) | | | 1.00 | %+†† | | | 1.00 | %+†† | | | 1.00 | %+ | | | 1.00 | %+ | | | 0.99 | %+ | |
| Ratio of Expenses to Average Net Assets Excluding Non Operating Expenses | | | N/A | | | | 1.00 | %+†† | | | 1.00 | %+ | | | 1.00 | %+ | | | 0.98 | %+ | |
| Ratio of Net Investment Income to Average Net Assets (1) | | | 1.87 | %+†† | | | 2.19 | %+†† | | | 1.62 | %+ | | | 2.49 | %+ | | | 2.10 | %+ | |
| Ratio of Rebate from Morgan Stanley Affiliates to Average Net Assets | | | 0.00 | %††§ | | | 0.00 | %††§ | | | 0.00 | %§ | | | 0.01 | % | | | 0.00 | %§ | |
| Portfolio Turnover Rate | | | 30 | % | | | 74 | % | | | 18 | % | | | 31 | % | | | 22 | % | |
| (1) Supplemental Information on the Ratios to Average Net Assets: | |
| Ratios Before Expense Limitation: | |
| Expenses to Average Net Assets | | | 1.01 | %†† | | | 1.08 | %+†† | | | 1.01 | %+ | | | 1.01 | %+ | | | N/A | | |
| Net Investment Income to Average Net Assets | | | 1.86 | %†† | | | 2.11 | %+†† | | | 1.61 | %+ | | | 2.48 | %+ | | | N/A | | |
† Per share amount is based on average shares outstanding.
++ Calculated based on the net asset value as of the last business day of the period.
+ The Ratios of Expenses and Net Investment Income reflect the rebate of certain Portfolio expenses in connection with the investments in Morgan Stanley affiliates during the period. The effect of the rebate on the ratios is disclosed in the above table as "Ratio of Rebate from Morgan Stanley Affiliates to Average Net Assets."
†† Reflects overall Portfolio ratios for investment income and non-class specific expenses.
§ Amount is less than 0.005%.
The accompanying notes are an integral part of the financial statements.
183
2011 Annual Report
December 31, 2011
Financial Highlights
Global Franchise Portfolio
| | | Class P | |
| | | Year Ended December 31, | |
| Selected Per Share Data and Ratios | | 2011 | | 2010 | | 2009 | | 2008 | | 2007 | |
| Net Asset Value, Beginning of Period | | $ | 15.10 | | | $ | 13.65 | | | $ | 10.71 | | | $ | 16.44 | | | $ | 17.82 | | |
| Income (Loss) from Investment Operations: | |
| Net Investment Income† | | | 0.26 | | | | 0.28 | | | | 0.11 | | | | 0.34 | | | | 0.30 | | |
| Net Realized and Unrealized Gain (Loss) | | | 1.09 | | | | 1.59 | | | | 2.99 | | | | (5.07 | ) | | | 1.34 | | |
| Total from Investment Operations | | | 1.35 | | | | 1.87 | | | | 3.10 | | | | (4.73 | ) | | | 1.64 | | |
| Distributions from and/or in Excess of: | |
| Net Investment Income | | | (0.27 | ) | | | (0.42 | ) | | | (0.16 | ) | | | (0.80 | ) | | | (0.11 | ) | |
| Net Realized Gain | | | (0.17 | ) | | | — | | | | — | | | | (0.20 | ) | | | (2.91 | ) | |
| Total Distributions | | | (0.44 | ) | | | (0.42 | ) | | | (0.16 | ) | | | (1.00 | ) | | | (3.02 | ) | |
| Net Asset Value, End of Period | | $ | 16.01 | | | $ | 15.10 | | | $ | 13.65 | | | $ | 10.71 | | | $ | 16.44 | | |
| Total Return++ | | | 8.98 | % | | | 13.83 | % | | | 29.24 | % | | | (29.00 | )% | | | 9.26 | % | |
| Ratios and Supplemental Data: | |
| Net Assets, End of Period (Thousands) | | $ | 15,327 | | | $ | 9,653 | | | $ | 9,332 | | | $ | 2,892 | | | $ | 6,327 | | |
| Ratio of Expenses to Average Net Assets (1) | | | 1.25 | %+†† | | | 1.25 | %+†† | | | 1.25 | %+ | | | 1.25 | %+ | | | 1.24 | %+ | |
| Ratio of Expenses to Average Net Assets Excluding Non Operating Expenses | | | N/A | | | | 1.25 | %+†† | | | 1.25 | %+ | | | 1.25 | %+ | | | 1.23 | %+ | |
| Ratio of Net Investment Income to Average Net Assets (1) | | | 1.62 | %+†† | | | 1.94 | %+†† | | | 0.92 | %+ | | | 2.43 | %+ | | | 1.62 | %+ | |
| Ratio of Rebate from Morgan Stanley Affiliates to Average Net Assets | | | 0.00 | %††§ | | | 0.00 | %††§ | | | 0.00 | %§ | | | 0.01 | % | | | 0.00 | %§ | |
| Portfolio Turnover Rate | | | 30 | % | | | 74 | % | | | 18 | % | | | 31 | % | | | 22 | % | |
| (1) Supplemental Information on the Ratios to Average Net Assets: | |
| Ratios Before Expense Limitation: | |
| Expenses to Average Net Assets | | | 1.26 | %†† | | | 1.33 | %+†† | | | 1.26 | %+ | | | 1.26 | %+ | | | N/A | | |
| Net Investment Income to Average Net Assets | | | 1.61 | %†† | | | 1.86 | %+†† | | | 0.91 | %+ | | | 2.42 | %+ | | | N/A | | |
† Per share amount is based on average shares outstanding.
++ Calculated based on the net asset value as of the last business day of the period.
+ The Ratios of Expenses and Net Investment Income reflect the rebate of certain Portfolio expenses in connection with the investments in Morgan Stanley affiliates during the period. The effect of the rebate on the ratios is disclosed in the above table as "Ratio of Rebate from Morgan Stanley Affiliates to Average Net Assets."
†† Reflects overall Portfolio ratios for investment income and non-class specific expenses.
§ Amount is less than 0.005%.
The accompanying notes are an integral part of the financial statements.
184
2011 Annual Report
December 31, 2011
Financial Highlights
Global Insight Portfolio
| | | Class I | |
| Selected Per Share Data and Ratios | | Period from
December 28,
2011^ to
December 31,
2011 | |
| Net Asset Value, Beginning of Period | | $ | 10.00 | | |
| Income from Investment Operations: | |
| Net Investment Loss† | | | (0.00 | )‡ | |
| Net Realized and Unrealized Gain | | | 0.07 | | |
| Total from Investment Operations | | | 0.07 | | |
| Net Asset Value, End of Period | | $ | 10.07 | | |
| Total Return++ | | | 0.70 | %# | |
| Ratios and Supplemental Data:†† | |
| Net Assets, End of Period (Thousands) | | $ | 10 | | |
| Ratio of Expenses to Average Net Assets (1) | | | 1.35 | %+* | |
| Ratio of Net Investment Loss to Average Net Assets (1) | | | (1.27 | )%+* | |
| Portfolio Turnover Rate | | | 0.00 | %# | |
| (1) Supplemental Information on the Ratios to Average Net Assets:†† | |
| Ratios Before Expense Limitation: | |
| Expenses to Average Net Assets | | | 381.10 | %* | |
| Net Investment Loss to Average Net Assets | | | (381.02 | )%* | |
^ Commencement of Operations.
† Per share amount is based on average shares outstanding.
‡ Amount is less than $0.005 per share.
++ Calculated based on the net asset value as of the last business day of the period.
†† Reflects overall Portfolio ratios for investment income and non-class specific expenses.
+ The Ratios of Expenses and Net Investment Loss reflect the rebate of certain Portfolio expenses in connection with the investments in Morgan Stanley affiliates during the period. The effect of the rebate on the ratios is disclosed in the above table as "Ratio of Rebate from Morgan Stanley Affiliates to Average Net Assets."
# Not Annualized.
* Annualized.
The accompanying notes are an integral part of the financial statements.
185
2011 Annual Report
December 31, 2011
Financial Highlights
Global Insight Portfolio
| | | Class H | |
| Selected Per Share Data and Ratios | | Period from
December 28,
2011^ to
December 31,
2011 | |
| Net Asset Value, Beginning of Period | | $ | 10.00 | | |
| Income from Investment Operations: | |
| Net Investment Loss† | | | (0.00 | )‡ | |
| Net Realized and Unrealized Gain | | | 0.07 | | |
| Total from Investment Operations | | | 0.07 | | |
| Net Asset Value, End of Period | | $ | 10.07 | | |
| Total Return++ | | | 0.70 | %# | |
| Ratios and Supplemental Data:†† | |
| Net Assets, End of Period (Thousands) | | $ | 816 | | |
| Ratio of Expenses to Average Net Assets (1) | | | 1.60 | %+* | |
| Ratio of Net Investment Loss to Average Net Assets (1) | | | (1.52 | )%+* | |
| Portfolio Turnover Rate | | | 0.00 | %# | |
| (1) Supplemental Information on the Ratios to Average Net Assets:†† | |
| Ratios Before Expense Limitation: | |
| Expenses to Average Net Assets | | | 381.35 | %* | |
| Net Investment Loss to Average Net Assets | | | (381.27 | )%* | |
^ Commencement of Operations.
† Per share amount is based on average shares outstanding.
‡ Amount is less than $0.005 per share.
++ Calculated based on the net asset value which does not reflect sales charges, if applicable, as of the last business day of the period.
†† Reflects overall Portfolio ratios for investment income and non-class specific expenses.
+ The Ratios of Expenses and Net Investment Loss reflect the rebate of certain Portfolio expenses in connection with the investments in Morgan Stanley affiliates during the period. The effect of the rebate on the ratios is disclosed in the above table as "Ratio of Rebate from Morgan Stanley Affiliates to Average Net Assets."
# Not Annualized.
* Annualized.
The accompanying notes are an integral part of the financial statements.
186
2011 Annual Report
December 31, 2011
Financial Highlights
Global Insight Portfolio
| | | Class L | |
| Selected Per Share Data and Ratios | | Period from
December 28,
2011^ to
December 31,
2011 | |
| Net Asset Value, Beginning of Period | | $ | 10.00 | | |
| Income from Investment Operations: | |
| Net Investment Loss† | | | (0.00 | )‡ | |
| Net Realized and Unrealized Gain | | | 0.07 | | |
| Total from Investment Operations | | | 0.07 | | |
| Net Asset Value, End of Period | | $ | 10.07 | | |
| Total Return++ | | | 0.70 | %# | |
| Ratios and Supplemental Data:†† | |
| Net Assets, End of Period (Thousands) | | $ | 10 | | |
| Ratio of Expenses to Average Net Assets (1) | | | 2.10 | %+* | |
| Ratio of Net Investment Loss to Average Net Assets (1) | | | (2.01 | )%+* | |
| Portfolio Turnover Rate | | | 0.00 | %# | |
| (1) Supplemental Information on the Ratios to Average Net Assets:†† | |
| Ratios Before Expense Limitation: | |
| Expenses to Average Net Assets | | | 381.85 | %* | |
| Net Investment Loss to Average Net Assets | | | (381.76 | )%* | |
^ Commencement of Operations.
† Per share amount is based on average shares outstanding.
‡ Amount is less than $0.005 per share.
++ Calculated based on the net asset value as of the last business day of the period.
†† Reflects overall Portfolio ratios for investment income and non-class specific expenses.
+ The Ratios of Expenses and Net Investment Loss reflect the rebate of certain Portfolio expenses in connection with the investments in Morgan Stanley affiliates during the period. The effect of the rebate on the ratios is disclosed in the above table as "Ratio of Rebate from Morgan Stanley Affiliates to Average Net Assets."
# Not Annualized.
* Annualized.
The accompanying notes are an integral part of the financial statements.
187
2011 Annual Report
December 31, 2011
Financial Highlights
Global Opportunity Portfolio
| | | Class I** | |
| Selected Per Share Data and Ratios | | Year Ended
December 31,
2011 | | Period from
April 1,
2010 to
December 31,
2010 | | Year Ended
March 31,
2010 | | Period from
May 30,
2008^ to
March 31,
2009 | |
| Net Asset Value, Beginning of Period | | $ | 11.58 | | | $ | 9.53 | | | $ | 5.08 | | | $ | 10.00 | | |
| Income (Loss) from Investment Operations: | |
| Net Investment Income (Loss)† | | | 0.02 | | | | (0.00 | )‡ | | | 0.01 | | | | (0.02 | ) | |
| Net Realized and Unrealized Gain (Loss) | | | (0.57 | ) | | | 2.05 | | | | 4.47 | | | | (4.90 | ) | |
| Total from Investment Operations | | | (0.55 | ) | | | 2.05 | | | | 4.48 | | | | (4.92 | ) | |
| Distributions from and/or in Excess of: | |
| Net Investment Income | | | — | | | | — | | | | (0.03 | ) | | | — | | |
| Net Realized Gain | | | (0.77 | ) | | | — | | | | — | | | | — | | |
| Total Distributions | | | (0.77 | ) | | | — | | | | (0.03 | ) | | | — | | |
| Redemption Fees | | | 0.00 | ‡ | | | — | | | | — | | | | — | | |
| Net Asset Value, End of Period | | $ | 10.26 | | | $ | 11.58 | | | $ | 9.53 | | | $ | 5.08 | | |
| Total Return++ | | | (4.90 | )% | | | 21.51 | %# | | | 88.32 | % | | | (49.20 | )%# | |
| Ratios and Supplemental Data: | |
| Net Assets, End of Period (Millions) | | $ | 8.4 | | | $ | 5.4 | | | $ | 5.6 | | | $ | 2.3 | | |
| Ratio of Expenses to Average Net Assets (1) | | | 1.25 | %+†† | | | 1.25 | %+††* | | | 1.25 | % | | | 1.25 | %* | |
| Ratio of Expenses to Average Net Assets Excluding Non Operating Expenses | | | N/A | | | | 1.07 | %+††* | | | N/A | | | | N/A | | |
| Ratio of Net Investment Income (Loss) to Average Net Assets (1) | | | 0.13 | %+†† | | | (0.01 | )%+††* | | | 0.09 | % | | | (0.34 | )%* | |
| Ratio of Rebate from Morgan Stanley Affiliates to Average Net Assets | | | 0.00 | %††§ | | | 0.01 | %††* | | | N/A | | | | N/A | | |
| Portfolio Turnover Rate | | | 39 | % | | | 19 | %# | | | 17 | % | | | 32 | %# | |
| (1) Supplemental Information on the Ratios to Average Net Assets: | |
| Ratios Before Expense Limitation: | |
| Expenses to Average Net Assets | | | 2.92 | %†† | | | 2.77 | %+††* | | | 4.51 | % | | | 12.66 | %* | |
| Net Investment Loss to Average Net Assets | | | (1.54 | )%†† | | | (1.53 | )%+††* | | | (3.17 | )% | | | (11.75 | )%* | |
** On May 21, 2010, the Portfolio acquired substantially all of the assets and liabilities of the Van Kampen Global Growth Fund ("the Predecessor Fund"). Therefore, the per share data and ratios of Class I shares for the period ended December 31, 2010 and prior years reflect the historical per share data of Class I shares of the Predecessor Fund.
^ Commencement of Operations.
† Per share amount is based on average shares outstanding.
‡ Amount is less than $0.005 per share.
++ Calculated based on the net asset value as of the last business day of the period.
+ The Ratios of Expenses and Net Investment Income (Loss) reflect the rebate of certain Portfolio expenses in connection with the investments in Morgan Stanley affiliates during the period. The effect of the rebate on the ratios is disclosed in the above table as "Ratio of Rebate from Morgan Stanley Affiliates to Average Net Assets."
†† Reflects overall Portfolio ratios for investment income and non-class specific expenses.
§ Amount is less than 0.005%.
# Not Annualized.
* Annualized.
The accompanying notes are an integral part of the financial statements.
188
2011 Annual Report
December 31, 2011
Financial Highlights
Global Opportunity Portfolio
| | | Class P | |
| Selected Per Share Data and Ratios | |
Year Ended
December 31,
2011 | | Period from
May 21,
2010^ to
December 31,
2010 | |
| Net Asset Value, Beginning of Period | | $ | 11.56 | | | $ | 8.62 | | |
| Income (Loss) from Investment Operations: | |
| Net Investment Loss† | | | (0.01 | ) | | | (0.06 | ) | |
| Net Realized and Unrealized Gain (Loss) | | | (0.57 | ) | | | 3.00 | | |
| Total from Investment Operations | | | (0.58 | ) | | | 2.94 | | |
| Distributions from and/or in Excess of: | |
| Net Realized Gain | | | (0.77 | ) | | | — | | |
| Redemption Fees | | | 0.00 | ‡ | | | — | | |
| Net Asset Value, End of Period | | $ | 10.21 | | | $ | 11.56 | | |
| Total Return++ | | | (5.16 | )% | | | 34.11 | %# | |
| Ratios and Supplemental Data: | |
| Net Assets, End of Period (Thousands) | | $ | 10 | | | $ | 11 | | |
| Ratio of Expenses to Average Net Assets (1) | | | 1.50 | %+†† | | | 1.53 | %+* | |
| Ratio of Expenses to Average Net Assets Excluding Non Operating Expenses | | | N/A | | | | 0.87 | %+* | |
| Ratio of Net Investment Loss to Average Net Assets (1) | | | (0.12 | )%+†† | | | (0.89 | )%+* | |
| Ratio of Rebate from Morgan Stanley Affiliates to Average Net Assets | | | 0.00 | %††§ | | | 0.01 | %* | |
| Portfolio Turnover Rate | | | 39 | % | | | 19 | %# | |
| (1) Supplemental Information on the Ratios to Average Net Assets: | |
| Ratios Before Expense Limitation: | |
| Expenses to Average Net Assets | | | 3.17 | %†† | | | 4.52 | %+* | |
| Net Investment Loss to Average Net Assets | | | (1.79 | )%†† | | | (3.88 | )%+* | |
^ Commencement of Operations.
† Per share amount is based on average shares outstanding.
‡ Amount is less than $0.005 per share.
++ Calculated based on the net asset value as of the last business day of the period.
+ The Ratios of Expenses and Net Investment Loss reflect the rebate of certain Portfolio expenses in connection with the investments in Morgan Stanley affiliates during the period. The effect of the rebate on the ratios is disclosed in the above table as "Ratio of Rebate from Morgan Stanley Affiliates to Average Net Assets."
†† Reflects overall Portfolio ratios for investment income and non-class specific expenses.
§ Amount is less than 0.005%.
# Not Annualized.
* Annualized.
The accompanying notes are an integral part of the financial statements.
189
2011 Annual Report
December 31, 2011
Financial Highlights
Global Opportunity Portfolio
| | | Class H** | |
| Selected Per Share Data and Ratios | | Year Ended
December 31,
2011 | | Period from
April 1,
2010 to
December 31,
2010 | | Year Ended
March 31,
2010 | | Period from
May 30,
2008^ to
March 31,
2009 | |
| Net Asset Value, Beginning of Period | | $ | 11.53 | | | $ | 9.50 | | | $ | 5.07 | | | $ | 10.00 | | |
| Income (Loss) from Investment Operations: | |
| Net Investment Loss† | | | (0.01 | ) | | | (0.01 | ) | | | (0.03 | ) | | | (0.03 | ) | |
| Net Realized and Unrealized Gain (Loss) | | | (0.57 | ) | | | 2.04 | | | | 4.49 | | | | (4.90 | ) | |
| Total from Investment Operations | | | (0.58 | ) | | | 2.03 | | | | 4.46 | | | | (4.93 | ) | |
| Distributions from and/or in Excess of: | |
| Net Investment Income | | | — | | | | — | | | | (0.03 | ) | | | — | | |
| Net Realized Gain | | | (0.77 | ) | | | — | | | | — | | | | — | | |
| Total Distributions | | | (0.77 | ) | | | — | | | | (0.03 | ) | | | — | | |
| Redemption Fees | | | 0.00 | ‡ | | | — | | | | — | | | | — | | |
| Net Asset Value, End of Period | | $ | 10.18 | | | $ | 11.53 | | | $ | 9.50 | | | $ | 5.07 | | |
| Total Return++ | | | (5.18 | )% | | | 21.37 | %# | | | 87.93 | % | | | (49.30 | )%# | |
| Ratios and Supplemental Data: | |
| Net Assets, End of Period (Millions) | | $ | 4.7 | | | $ | 5.8 | | | $ | 7.1 | | | $ | 0.4 | | |
| Ratio of Expenses to Average Net Assets (1) | | | 1.50 | %+†† | | | 1.51 | %+††* | | | 1.50 | % | | | 1.50 | %* | |
| Ratio of Expenses to Average Net Assets Excluding Non Operating Expenses | | | N/A | | | | 1.33 | %+††* | | | N/A | | | | N/A | | |
| Ratio of Net Investment Loss to Average Net Assets (1) | | | (0.12 | )%+†† | | | (0.21 | )%+††* | | | (0.36 | )% | | | (0.57 | )%* | |
| Rebate from Morgan Stanley Affiliates to Average Net Assets | | | 0.00 | %††§ | | | 0.01 | %††* | | | N/A | | | | N/A | | |
| Portfolio Turnover Rate | | | 39 | % | | | 19 | %# | | | 17 | % | | | 32 | %# | |
| (1) Supplemental Information on the Ratios to Average Net Assets: | |
| Ratios Before Expense Limitation: | |
| Expense to Average Net Assets | | | 3.17 | %†† | | | 3.03 | %+††* | | | 4.76 | % | | | 13.43 | %* | |
| Net Investment Loss to Average Net Assets | | | (1.79 | )%†† | | | (1.79 | )%+††* | | | (3.62 | )% | | | (12.50 | )%* | |
** On May 21, 2010, the Portfolio acquired substantially all of the assets and liabilities of the Van Kampen Global Growth Fund ("the Predecessor Fund"). Therefore, the per share data and ratios of Class H shares for the period ended December 31, 2010 and prior years reflect the historical per share data of Class A shares of the Predecessor Fund.
^ Commencement of Operations.
† Per share amount is based on average shares outstanding.
‡ Amount is less than $0.005 per share.
++ Calculated based on the net asset value which does not reflect sales charges, if applicable, as of the last business day of the period.
+ The Ratios of Expenses and Net Investment Loss reflect the rebate of certain Portfolio expenses in connection with the investments in Morgan Stanley affiliates during the period. The effect of the rebate on the ratios is disclosed in the above table as "Ratio of Rebate from Morgan Stanley Affiliates to Average Net Assets."
†† Reflects overall Portfolio ratios for investment income and non-class specific expenses.
§ Amount is less than 0.005%.
# Not Annualized.
* Annualized
The accompanying notes are an integral part of the financial statements.
190
2011 Annual Report
December 31, 2011
Financial Highlights
Global Opportunity Portfolio
| | | Class L** | |
| Selected Per Share Data and Ratios | | Year Ended
December 31,
2011 | | Period from
April 1,
2010 to
December 31,
2010 | | Year Ended
March 31,
2010 | | Period from
May 30,
2008^ to
March 31,
2009 | |
| Net Asset Value, Beginning of Period | | $ | 11.50 | | | $ | 9.48 | | | $ | 5.08 | | | $ | 10.00 | | |
| Income (Loss) from Investment Operations: | |
| Net Investment Loss† | | | (0.02 | ) | | | (0.04 | ) | | | (0.09 | ) | | | (0.02 | ) | |
| Net Realized and Unrealized Gain (Loss) | | | (0.56 | ) | | | 2.06 | | | | 4.51 | | | | (4.90 | ) | |
| Total from Investment Operations | | | (0.58 | ) | | | 2.02 | | | | 4.42 | | | | (4.92 | ) | |
| Distributions from and/or in Excess of: | |
| Net Investment Income | | | — | | | | — | | | | (0.02 | ) | | | — | | |
| Net Realized Gain | | | (0.77 | ) | | | — | | | | — | | | | — | | |
| Total Distributions | | | (0.77 | ) | | | — | | | | (0.02 | ) | | | — | | |
| Redemption Fees | | | 0.00 | ‡ | | | — | | | | — | | | | — | | |
| Net Asset Value, End of Period | | $ | 10.15 | | | $ | 11.50 | | | $ | 9.48 | | | $ | 5.08 | | |
| Total Return++ | | | (5.19 | )% | | | 21.31 | %# | | | 87.08 | % | | | (49.20 | )%# | |
| Ratios and Supplemental Data: | |
| Net Assets, End of Period (Millions) | | $ | 0.5 | | | $ | 0.7 | | | $ | 1.4 | | | $ | 0.1 | | |
| Ratio of Expenses to Average Net Assets (1) | | | 1.55 | %+†† | | | 2.09 | %+††* | | | 2.11 | % | | | 1.31 | %* | |
| Ratio of Expenses to Average Net Assets Excluding Non Operating Expenses | | | N/A | | | | 1.91 | %+††* | | | N/A | | | | N/A | | |
| Ratio of Net Investment Loss to Average Net Assets (1) | | | (0.17 | )%+†† | | | (0.85 | )%+††* | | | (1.03 | )% | | | (0.39 | )%* | |
| Ratio of Rebate from Morgan Stanley Affiliates to Average Net Assets | | | 0.00 | %††§ | | | 0.01 | %††* | | | N/A | | | | N/A | | |
| Portfolio Turnover Rate | | | 39 | % | | | 19 | %# | | | 17 | % | | | 32 | %# | |
| (1) Supplemental Information on the Ratios to Average Net Assets: | |
| Ratios Before Expense Limitation: | |
| Expenses to Average Net Assets | | | 3.67 | %†† | | | 3.61 | %+††* | | | 5.37 | % | | | 12.85 | %* | |
| Net Investment Loss to Average Net Assets | | | (2.29 | )%†† | | | (2.37 | )%+††* | | | (4.29 | )% | | | (11.93 | )%* | |
** On May 21, 2010, the Portfolio acquired substantially all of the assets and liabilities of the Van Kampen Global Growth Fund ("the Predecessor Fund"). Therefore, the per share data and ratios of Class L shares for the period ended December 31, 2010 and prior years reflect the historical per share data of Class C shares of the Predecessor Fund.
^ Commencement of Operations.
† Per share amount is based on average shares outstanding.
‡ Amount is less than $0.005 per share.
++ Calculated based on the net asset value as of the last business day of the period.
+ The Ratios of Expenses and Net Investment Loss reflect the rebate of certain Portfolio expenses in connection with the investments in Morgan Stanley affiliates during the period. The effect of the rebate on the ratios is disclosed in the above table as "Ratio of Rebate from Morgan Stanley Affiliates to Average Net Assets."
†† Reflects overall Portfolio ratios for investment income and non-class specific expenses.
§ Amount is less than 0.005%.
# Not Annualized.
* Annualized.
The accompanying notes are an integral part of the financial statements.
191
2011 Annual Report
December 31, 2011
Financial Highlights
Global Real Estate Portfolio
| | | Class I | |
| | | Year Ended December 31, | |
| Selected Per Share Data and Ratios | | 2011 | | 2010 | | 2009 | | 2008 | | 2007 | |
| Net Asset Value, Beginning of Period | | $ | 8.78 | | | $ | 7.47 | | | $ | 5.49 | | | $ | 10.04 | | | $ | 11.56 | | |
| Income (Loss) from Investment Operations: | |
| Net Investment Income† | | | 0.14 | | | | 0.19 | | | | 0.14 | | | | 0.16 | | | | 0.18 | | |
| Net Realized and Unrealized Gain (Loss) | | | (0.99 | ) | | | 1.31 | | | | 2.11 | | | | (4.67 | ) | | | (1.09 | ) | |
| Total from Investment Operations | | | (0.85 | ) | | | 1.50 | | | | 2.25 | | | | (4.51 | ) | | | (0.91 | ) | |
| Distributions from and/or in Excess of: | |
| Net Investment Income | | | (0.16 | ) | | | (0.19 | ) | | | (0.27 | ) | | | (0.02 | ) | | | (0.40 | ) | |
| Net Realized Gain | | | — | | | | — | | | | — | | | | (0.02 | ) | | | (0.21 | ) | |
| Total Distributions | | | (0.16 | ) | | | (0.19 | ) | | | (0.27 | ) | | | (0.04 | ) | | | (0.61 | ) | |
| Redemption Fees | | | — | | | | — | | | | 0.00 | ‡ | | | 0.00 | ‡ | | | 0.00 | ‡ | |
| Net Asset Value, End of Period | | $ | 7.77 | | | $ | 8.78 | | | $ | 7.47 | | | $ | 5.49 | | | $ | 10.04 | | |
| Total Return++ | | | (9.67 | )% | | | 20.22 | % | | | 41.04 | % | | | (45.00 | )% | | | (7.87 | )% | |
| Ratios and Supplemental Data: | |
| Net Assets, End of Period (Thousands) | | $ | 1,337,853 | | | $ | 1,215,881 | | | $ | 638,744 | | | $ | 473,459 | | | $ | 632,737 | | |
| Ratio of Expenses to Average Net Assets(1) | | | 1.04 | %+†† | | | 1.01 | %+†† | | | 1.01 | %+ | | | 1.05 | %+ | | | 1.02 | %+ | |
| Ratio of Expenses to Average Net Assets Excluding Non Operating Expenses | | | N/A | | | | 1.01 | %+†† | | | 1.01 | %+ | | | 1.04 | %+ | | | 1.02 | %+ | |
| Ratio of Net Investment Income to Average Net Assets(1) | | | 2.12 | %+†† | | | 2.43 | %+†† | | | 2.31 | %+ | | | 1.92 | %+ | | | 1.55 | %+ | |
| Ratio of Rebate from Morgan Stanley Affiliates to Average Net Assets | | | 0.00 | %††§ | | | 0.00 | %††§ | | | 0.00 | %§ | | | 0.00 | %§ | | | 0.00 | %§ | |
| Portfolio Turnover Rate | | | 28 | % | | | 18 | % | | | 59 | % | | | 40 | % | | | 39 | % | |
| (1) Supplemental Information on the Ratios to Average Net Assets: | |
| Ratios Before Expense Limitation: | |
| Expenses to Average Net Assets | | | 1.04 | % | | | N/A | | | | N/A | | | | N/A | | | | N/A | | |
| Net Investment Income to Average Net Assets | | | 2.12 | % | | | N/A | | | | N/A | | | | N/A | | | | N/A | | |
† Per share amount is based on average shares outstanding.
‡ Amount is less than $0.005 per share.
++ Calculated based on the net asset value as of the last business day of the period.
+ The Ratios of Expenses and Net Investment Income reflect the rebate of certain Portfolio expenses in connection with the investments in Morgan Stanley affiliates during the period. The effect of the rebate on the ratios is disclosed in the above table as "Ratio of Rebate from Morgan Stanley Affiliates to Average Net Assets."
†† Reflects overall Portfolio ratios for investment income and non-class specific expenses.
§ Amount is less than 0.005%.
The accompanying notes are an integral part of the financial statements.
192
2011 Annual Report
December 31, 2011
Financial Highlights
Global Real Estate Portfolio
| | | Class P | |
| | | Year Ended December 31, | |
| Selected Per Share Data and Ratios | | 2011 | | 2010 | | 2009 | | 2008 | | 2007 | |
| Net Asset Value, Beginning of Period | | $ | 8.74 | | | $ | 7.44 | | | $ | 5.47 | | | $ | 10.02 | | | $ | 11.56 | | |
| Income (Loss) from Investment Operations: | |
| Net Investment Income† | | | 0.12 | | | | 0.17 | | | | 0.13 | | | | 0.16 | | | | 0.16 | | |
| Net Realized and Unrealized Gain (Loss) | | | (0.98 | ) | | | 1.30 | | | | 2.09 | | | | (4.68 | ) | | | (1.11 | ) | |
| Total from Investment Operations | | | (0.86 | ) | | | 1.47 | | | | 2.22 | | | | (4.52 | ) | | | (0.95 | ) | |
| Distributions from and/or in Excess of: | |
| Net Investment Income | | | (0.15 | ) | | | (0.17 | ) | | | (0.25 | ) | | | (0.01 | ) | | | (0.38 | ) | |
| Net Realized Gain | | | — | | | | — | | | | — | | | | (0.02 | ) | | | (0.21 | ) | |
| Total Distributions | | | (0.15 | ) | | | (0.17 | ) | | | (0.25 | ) | | | (0.03 | ) | | | (0.59 | ) | |
| Redemption Fees | | | — | | | | — | | | | 0.00 | ‡ | | | 0.00 | ‡ | | | 0.00 | ‡ | |
| Net Asset Value, End of Period | | $ | 7.73 | | | $ | 8.74 | | | $ | 7.44 | | | $ | 5.47 | | | $ | 10.02 | | |
| Total Return++ | | | (9.91 | )% | | | 19.90 | % | | | 40.66 | % | | | (45.15 | )% | | | (8.15 | )% | |
| Ratios and Supplemental Data: | |
| Net Assets, End of Period (Thousands) | | $ | 130,244 | | | $ | 67,812 | | | $ | 52,663 | | | $ | 44,555 | | | $ | 13,187 | | |
| Ratio of Expenses to Average Net Assets (1) | | | 1.29 | %+†† | | | 1.26 | %+†† | | | 1.26 | %+ | | | 1.30 | %+ | | | 1.27 | %+ | |
| Ratio of Expenses to Average Net Assets Excluding Non Operating Expenses | | | N/A | | | | 1.26 | %+†† | | | 1.26 | %+ | | | 1.29 | %+ | | | 1.27 | %+ | |
| Ratio of Net Investment Income to Average Net Assets (1) | | | 1.87 | %+†† | | | 2.18 | %+†† | | | 2.08 | %+ | | | 2.32 | %+ | | | 1.39 | %+ | |
| Ratio of Rebate from Morgan Stanley Affiliates to Average Net Assets | | | 0.00 | %††§ | | | 0.00 | %††§ | | | 0.00 | %§ | | | 0.00 | %§ | | | 0.00 | %§ | |
| Portfolio Turnover Rate | | | 28 | % | | | 18 | % | | | 59 | % | | | 40 | % | | | 39 | % | |
| (1) Supplemental Information on the Ratios to Average Net Assets: | |
| Ratios Before Expense Limitation: | |
| Expenses to Average Net Assets | | | 1.29 | % | | | N/A | | | | N/A | | | | 1.32 | %+ | | | N/A | | |
| Net Investment Income to Average Net Assets | | | 1.87 | % | | | N/A | | | | N/A | | | | 2.30 | %+ | | | N/A | | |
† Per share amount is based on average shares outstanding.
‡ Amount is less than $0.005 per share.
++ Calculated based on the net asset value as of the last business day of the period.
+ The Ratios of Expenses and Net Investment Income reflect the rebate of certain Portfolio expenses in connection with the investments in Morgan Stanley affiliates during the period. The effect of the rebate on the ratios is disclosed in the above table as "Ratio of Rebate from Morgan Stanley Affiliates to Average Net Assets."
†† Reflects overall Portfolio ratios for investment income and non-class specific expenses.
§ Amount is less than 0.005%.
The accompanying notes are an integral part of the financial statements.
193
2011 Annual Report
December 31, 2011
Financial Highlights
Global Real Estate Portfolio
| | | Class H | |
| | | Year Ended December 31, | | Period from
January 2,
2008^ to
December 31, | |
| Selected Per Share Data and Ratios | | 2011 | | 2010 | | 2009 | | 2008 | |
| Net Asset Value, Beginning of Period | | $ | 8.72 | | | $ | 7.43 | | | $ | 5.47 | | | $ | 9.95 | | |
| Income (Loss) from Investment Operations: | |
| Net Investment Income† | | | 0.12 | | | | 0.18 | | | | 0.13 | | | | 0.11 | | |
| Net Realized and Unrealized Gain (Loss) | | | (0.98 | ) | | | 1.29 | | | | 2.08 | | | | (4.57 | ) | |
| Total from Investment Operations | | | (0.86 | ) | | | 1.47 | | | | 2.21 | | | | (4.46 | ) | |
| Distributions from and/or in Excess of: | |
| Net Investment Income | | | (0.14 | ) | | | (0.18 | ) | | | (0.25 | ) | | | — | | |
| Net Realized Gain | | | — | | | | — | | | | — | | | | (0.02 | ) | |
| Total Distributions | | | (0.14 | ) | | | (0.18 | ) | | | (0.25 | ) | | | (0.02 | ) | |
| Redemption Fees | | | — | | | | — | | | | 0.00 | ‡ | | | — | | |
| Net Asset Value, End of Period | | $ | 7.72 | | | $ | 8.72 | | | $ | 7.43 | | | $ | 5.47 | | |
| Total Return++ | | | (9.90 | )% | | | 19.96 | % | | | 40.59 | % | | | (44.88 | )%# | |
| Ratios and Supplemental Data: | |
| Net Assets, End of Period (Thousands) | | $ | 9,255 | | | $ | 11,381 | | | $ | 607 | | | $ | 391 | | |
| Ratio of Expenses to Average Net Assets (1) | | | 1.29 | %+†† | | | 1.26 | %+†† | | | 1.26 | %+ | | | 1.70 | %+* | |
| Ratio of Expenses to Average Net Assets Excluding Non Operating Expenses | | | N/A | | | | 1.26 | %+†† | | | 1.26 | %+ | | | 1.29 | %+* | |
| Ratio of Net Investment Income (Loss) to Average Net Assets (1) | | | 1.87 | %+†† | | | 2.18 | %+†† | | | 2.03 | %+ | | | 1.42 | %+* | |
| Rebate from Morgan Stanley Affiliates to Average Net Assets | | | 0.00 | %††§ | | | 0.00 | %††§ | | | 0.00 | %§ | | | 0.00 | %*§ | |
| Portfolio Turnover Rate | | | 28 | % | | | 18 | % | | | 59 | % | | | 40 | %# | |
| (1) Supplemental Information on the Ratios to Average Net Assets: | |
| Ratios Before Expense Limitation: | |
| Expense to Average Net Assets | | | 1.29 | % | | | N/A | | | | N/A | | | | 1.70 | %+* | |
| Net Investment Income to Average Net Assets | | | 1.87 | % | | | N/A | | | | N/A | | | | 1.42 | %+* | |
^ Commencement of Operations.
† Per share amount is based on average shares outstanding.
‡ Amount is less than $0.005 per share.
++ Calculated based on the net asset value which does not reflect sales charges, if applicable, as of the last business day of the period.
+ The Ratios of Expenses and Net Investment Income reflect the rebate of certain Portfolio expenses in connection with the investments in Morgan Stanley affiliates during the period. The effect of the rebate on the ratios is disclosed in the above table as "Ratio of Rebate from Morgan Stanley Affiliates to Average Net Assets."
†† Reflects overall Portfolio ratios for investment income and non-class specific expenses.
§ Amount is less than 0.005%.
# Not Annualized.
* Annualized.
The accompanying notes are an integral part of the financial statements.
194
2011 Annual Report
December 31, 2011
Financial Highlights
Global Real Estate Portfolio
| | | Class L | |
| | | Year Ended December 31, | | Period from
June 16,
2008^ to
December 31, | |
| Selected Per Share Data and Ratios | | 2011 | | 2010 | | 2009 | | 2008 | |
| Net Asset Value, Beginning of Period | | $ | 8.62 | | | $ | 7.35 | | | $ | 5.43 | | | $ | 9.46 | | |
| Income (Loss) from Investment Operations: | |
| Net Investment Income† | | | 0.07 | | | | 0.13 | | | | 0.08 | | | | 0.04 | | |
| Net Realized and Unrealized Gain (Loss) | | | (0.96 | ) | | | 1.28 | | | | 2.08 | | | | (4.05 | ) | |
| Total from Investment Operations | | | (0.89 | ) | | | 1.41 | | | | 2.16 | | | | (4.01 | ) | |
| Distributions from and/or in Excess of: | |
| Net Investment Income | | | (0.10 | ) | | | (0.14 | ) | | | (0.24 | ) | | | — | | |
| Net Realized Gain | | | — | | | | — | | | | — | | | | (0.02 | ) | |
| Total Distributions | | | (0.10 | ) | | | (0.14 | ) | | | (0.24 | ) | | | (0.02 | ) | |
| Redemption Fees | | | — | | | | — | | | | 0.00 | ‡ | | | — | | |
| Net Asset Value, End of Period | | $ | 7.63 | | | $ | 8.62 | | | $ | 7.35 | | | $ | 5.43 | | |
| Total Return++ | | | (10.33 | )% | | | 19.26 | % | | | 39.91 | % | | | (42.45 | )%# | |
| Ratios and Supplemental Data: | |
| Net Assets, End of Period (Thousands) | | $ | 6,418 | | | $ | 5,043 | | | $ | 1,603 | | | $ | 261 | | |
| Ratio of Expenses to Average Net Assets (1) | | | 1.79 | %+†† | | | 1.76 | %+†† | | | 1.76 | %+ | | | 1.81 | %+* | |
| Ratio of Expenses to Average Net Assets Excluding Non Operating Expenses | | | N/A | | | | 1.76 | %+†† | | | 1.76 | %+ | | | 1.80 | %+* | |
| Ratio of Net Investment Income (Loss) to Average Net Assets (1) | | | 1.37 | %+†† | | | 1.68 | %+†† | | | 1.23 | %+ | | | 1.20 | %+* | |
| Ratio of Rebate from Morgan Stanley Affiliates to Average Net Assets | | | 0.00 | %††§ | | | 0.00 | %††§ | | | 0.00 | %§ | | | 0.00 | %*§ | |
| Portfolio Turnover Rate | | | 28 | % | | | 18 | % | | | 59 | % | | | 40 | %# | |
| (1) Supplemental Information on the Ratios to Average Net Assets: | |
| Ratios Before Expense Limitation: | |
| Expenses to Average Net Assets | | | 1.79 | % | | | N/A | | | | N/A | | | | 1.84 | %+* | |
| Net Investment Income to Average Net Assets | | | 1.37 | % | | | N/A | | | | N/A | | | | 1.17 | %+* | |
^ Commencement of Operations.
† Per share amount is based on average shares outstanding.
‡ Amount is less than $0.005 per share.
++ Calculated based on the net asset value as of the last business day of the period.
+ The Ratios of Expenses and Net Investment Income reflect the rebate of certain Portfolio expenses in connection with the investments in Morgan Stanley affiliates during the period. The effect of the rebate on the ratios is disclosed in the above table as "Ratio of Rebate from Morgan Stanley Affiliates to Average Net Assets."
†† Reflects overall Portfolio ratios for investment income and non-class specific expenses.
§ Amount is less than 0.005%.
# Not Annualized.
* Annualized.
The accompanying notes are an integral part of the financial statements.
195
2011 Annual Report
December 31, 2011
Financial Highlights
International Advantage Portfolio
| | | Class I | |
| Selected Per Share Data and Ratios | | Year Ended
December 31,
2011 | | Period from
December 28,
2010^ to
December 31,
2010 | |
| Net Asset Value, Beginning of Period | | $ | 9.99 | | | $ | 10.00 | | |
| Income (Loss) from Investment Operations: | |
| Net Investment Income (Loss)† | | | 0.12 | | | | (0.00 | )‡ | |
| Net Realized and Unrealized Loss | | | (0.26 | ) | | | (0.01 | ) | |
| Total from Investment Operations | | | (0.14 | ) | | | (0.01 | ) | |
| Distributions from and/or in Excess of: | |
| Net Investment Income | | | (0.11 | ) | | | — | | |
| Net Realized Gain | | | (0.09 | ) | | | — | | |
| Total Distributions | | | (0.20 | ) | | | — | | |
| Net Asset Value, End of Period | | $ | 9.65 | | | $ | 9.99 | | |
| Total Return++ | | | (1.31 | )% | | | (0.10 | )%# | |
| Ratios and Supplemental Data:†† | |
| Net Assets, End of Period (Thousands) | | $ | 1,255 | | | $ | 1,198 | | |
| Ratio of Expenses to Average Net Assets (1) | | | 1.24 | %+ | | | 1.25 | %* | |
| Ratio of Net Investment Income (Loss) to Average Net Assets (1) | | | 1.17 | %+ | | | (1.09 | )%* | |
| Ratio of Rebate from Morgan Stanley Affiliates to Average Net Assets | | | 0.01 | % | | | N/A | | |
| Portfolio Turnover Rate | | | 27 | % | | | 0.00 | %# | |
| (1) Supplemental Information on the Ratios to Average Net Assets:†† | |
| Ratios Before Expense Limitation: | |
| Expenses to Average Net Assets | | | 7.08 | %+ | | | 176.40 | %* | |
| Net Investment Loss to Average Net Assets | | | (4.67 | )%+ | | | (176.24 | )%* | |
^ Commencement of Operations.
† Per share amount is based on average shares outstanding.
‡ Amount is less than $0.005 per share.
++ Calculated based on the net asset value as of the last business day of the period.
†† Reflects overall Portfolio ratios for investment income and non-class specific expenses.
+ The Ratios of Expenses and Net Investment Income (Loss) reflect the rebate of certain Portfolio expenses in connection with the investments in Morgan Stanley affiliates during the period. The effect of the rebate on the ratios is disclosed in the above table as "Ratio of Rebate from Morgan Stanley Affiliates to Average Net Assets."
# Not Annualized.
* Annualized.
The accompanying notes are an integral part of the financial statements.
196
2011 Annual Report
December 31, 2011
Financial Highlights
International Advantage Portfolio
| | | Class P | |
| Selected Per Share Data and Ratios | | Year Ended
December 31,
2011 | | Period from
December 28,
2010^ to
December 31,
2010 | |
| Net Asset Value, Beginning of Period | | $ | 9.99 | | | $ | 10.00 | | |
| Income (Loss) from Investment Operations: | |
| Net Investment Income (Loss)† | | | 0.09 | | | | (0.00 | )‡ | |
| Net Realized and Unrealized Loss | | | (0.25 | ) | | | (0.01 | ) | |
| Total from Investment Operations | | | (0.16 | ) | | | (0.01 | ) | |
| Distributions from and/or in Excess of: | |
| Net Investment Income | | | (0.09 | ) | | | — | | |
| Net Realized Gain | | | (0.09 | ) | | | — | | |
| Total Distributions | | | (0.18 | ) | | | — | | |
| Net Asset Value, End of Period | | $ | 9.65 | | | $ | 9.99 | | |
| Total Return++ | | | (1.57 | )% | | | (0.10 | )%# | |
| Ratios and Supplemental Data:†† | |
| Net Assets, End of Period (Thousands) | | $ | 96 | | | $ | 100 | | |
| Ratio of Expenses to Average Net Assets (1) | | | 1.49 | %+ | | | 1.50 | %* | |
| Ratio of Net Investment Income (Loss) to Average Net Assets (1) | | | 0.92 | %+ | | | (1.34 | )%* | |
| Ratio of Rebate from Morgan Stanley Affiliates to Average Net Assets | | | 0.01 | % | | | N/A | | |
| Portfolio Turnover Rate | | | 27 | % | | | 0.00 | %# | |
| (1) Supplemental Information on the Ratios to Average Net Assets:†† | |
| Ratios Before Expense Limitation: | |
| Expenses to Average Net Assets | | | 7.33 | %+ | | | 176.65 | %* | |
| Net Investment Loss to Average Net Assets | | | (4.92 | )%+ | | | (176.49 | )%* | |
^ Commencement of Operations.
† Per share amount is based on average shares outstanding.
‡ Amount is less than $0.005 per share.
++ Calculated based on the net asset value as of the last business day of the period.
†† Reflects overall Portfolio ratios for investment income and non-class specific expenses.
+ The Ratios of Expenses and Net Investment Income (Loss) reflect the rebate of certain Portfolio expenses in connection with the investments in Morgan Stanley affiliates during the period. The effect of the rebate on the ratios is disclosed in the above table as "Ratio of Rebate from Morgan Stanley Affiliates to Average Net Assets."
# Not Annualized.
* Annualized.
The accompanying notes are an integral part of the financial statements.
197
2011 Annual Report
December 31, 2011
Financial Highlights
International Advantage Portfolio
| | | Class H | |
| Selected Per Share Data and Ratios | | Year Ended
December 31,
2011 | | Period from
December 28,
2010^ to
December 31,
2010 | |
| Net Asset Value, Beginning of Period | | $ | 9.99 | | | $ | 10.00 | | |
| Income (Loss) from Investment Operations: | |
| Net Investment Income (Loss)† | | | 0.09 | | | | (0.00 | )‡ | |
| Net Realized and Unrealized Loss | | | (0.25 | ) | | | (0.01 | ) | |
| Total from Investment Operations | | | (0.16 | ) | | | (0.01 | ) | |
| Distributions from and/or in Excess of: | |
| Net Investment Income | | | (0.09 | ) | | | — | | |
| Net Realized Gain | | | (0.09 | ) | | | — | | |
| Total Distributions | | | (0.18 | ) | | | — | | |
| Net Asset Value, End of Period | | $ | 9.65 | | | $ | 9.99 | | |
| Total Return++ | | | (1.57 | )% | | | (0.10 | )%# | |
| Ratios and Supplemental Data:†† | |
| Net Assets, End of Period (Thousands) | | $ | 684 | | | $ | 100 | | |
| Ratio of Expenses to Average Net Assets (1) | | | 1.49 | %+ | | | 1.50 | %* | |
| Ratio of Net Investment Income (Loss) to Average Net Assets (1) | | | 0.92 | %+ | | | (1.34 | )%* | |
| Rebate from Morgan Stanley Affiliates to Average Net Assets | | | 0.01 | % | | | N/A | | |
| Portfolio Turnover Rate | | | 27 | % | | | 0.00 | %# | |
| (1) Supplemental Information on the Ratios to Average Net Assets:†† | |
| Ratios Before Expense Limitation: | |
| Expense to Average Net Assets | | | 7.33 | %+ | | | 176.65 | %* | |
| Net Investment Loss to Average Net Assets | | | (4.92 | )%+ | | | (176.49 | )%* | |
^ Commencement of Operations.
† Per share amount is based on average shares outstanding.
‡ Amount is less than $0.005 per share.
++ Calculated based on the net asset value which does not reflect sales charges, if applicable, as of the last business day of the period.
†† Reflects overall Portfolio ratios for investment income and non-class specific expenses.
+ The Ratios of Expenses and Net Investment Income (Loss) reflect the rebate of certain Portfolio expenses in connection with the investments in Morgan Stanley affiliates during the period. The effect of the rebate on the ratios is disclosed in the above table as "Ratio of Rebate from Morgan Stanley Affiliates to Average Net Assets."
# Not Annualized.
* Annualized.
The accompanying notes are an integral part of the financial statements.
198
2011 Annual Report
December 31, 2011
Financial Highlights
International Advantage Portfolio
| | | Class L | |
| Selected Per Share Data and Ratios | | Year Ended
December 31,
2011 | | Period from
December 28,
2010^ to
December 31,
2010 | |
| Net Asset Value, Beginning of Period | | $ | 9.99 | | | $ | 10.00 | | |
| Income (Loss) from Investment Operations: | |
| Net Investment Income (Loss)† | | | 0.04 | | | | (0.00 | )‡ | |
| Net Realized and Unrealized Loss | | | (0.25 | ) | | | (0.01 | ) | |
| Total from Investment Operations | | | (0.21 | ) | | | (0.01 | ) | |
| Distributions from and/or in Excess of: | |
| Net Investment Income | | | (0.04 | ) | | | — | | |
| Net Realized Gain | | | (0.09 | ) | | | — | | |
| Total Distributions | | | (0.13 | ) | | | — | | |
| Net Asset Value, End of Period | | $ | 9.65 | | | $ | 9.99 | | |
| Total Return++ | | | (2.09 | )% | | | (0.10 | )%# | |
| Ratios and Supplemental Data:†† | |
| Net Assets, End of Period (Thousands) | | $ | 97 | | | $ | 100 | | |
| Ratio of Expenses to Average Net Assets (1) | | | 1.99 | %+ | | | 2.00 | %* | |
| Ratio of Net Investment Income (Loss) to Average Net Assets (1) | | | 0.42 | %+ | | | (1.84 | )%* | |
| Ratio of Rebate from Morgan Stanley Affiliates to Average Net Assets | | | 0.01 | % | | | N/A | | |
| Portfolio Turnover Rate | | | 27 | % | | | 0.00 | %# | |
| (1) Supplemental Information on the Ratios to Average Net Assets:†† | |
| Ratios Before Expense Limitation: | |
| Expenses to Average Net Assets | | | 7.83 | %+ | | | 177.15 | %* | |
| Net Investment Loss to Average Net Assets | | | (5.42 | )%+ | | | (176.99 | )%* | |
^ Commencement of Operations.
† Per share amount is based on average shares outstanding.
‡ Amount is less than $0.005 per share.
++ Calculated based on the net asset value as of the last business day of the period.
†† Reflects overall Portfolio ratios for investment income and non-class specific expenses.
+ The Ratios of Expenses and Net Investment Income (Loss) reflect the rebate of certain Portfolio expenses in connection with the investments in Morgan Stanley affiliates during the period. The effect of the rebate on the ratios is disclosed in the above table as "Ratio of Rebate from Morgan Stanley Affiliates to Average Net Assets."
# Not Annualized.
* Annualized.
The accompanying notes are an integral part of the financial statements.
199
2011 Annual Report
December 31, 2011
Financial Highlights
International Equity Portfolio
| | | Class I | |
| | | Year Ended December 31, | |
| Selected Per Share Data and Ratios | | 2011 | | 2010 | | 2009 | | 2008 | | 2007 | |
| Net Asset Value, Beginning of Period | | $ | 13.61 | | | $ | 13.02 | | | $ | 11.01 | | | $ | 18.92 | | | $ | 20.58 | | |
| Income (Loss) from Investment Operations: | |
| Net Investment Income† | | | 0.32 | | | | 0.26 | | | | 0.27 | | | | 0.44 | | | | 0.43 | | |
| Net Realized and Unrealized Gain (Loss) | | | (1.37 | ) | | | 0.53 | | | | 2.10 | | | | (6.76 | ) | | | 1.53 | | |
| Total from Investment Operations | | | (1.05 | ) | | | 0.79 | | | | 2.37 | | | | (6.32 | ) | | | 1.96 | | |
| Distributions from and/or in Excess of: | |
| Net Investment Income | | | (0.31 | ) | | | (0.20 | ) | | | (0.36 | ) | | | (0.41 | ) | | | (0.46 | ) | |
| Net Realized Gain | | | — | | | | — | | | | — | | | | (1.18 | ) | | | (3.16 | ) | |
| Total Distributions | | | (0.31 | ) | | | (0.20 | ) | | | (0.36 | ) | | | (1.59 | ) | | | (3.62 | ) | |
| Redemption Fees | | | 0.00 | ‡ | | | 0.00 | ‡ | | | 0.00 | ‡ | | | 0.00 | ‡ | | | 0.00 | ‡ | |
| Net Asset Value, End of Period | | $ | 12.25 | | | $ | 13.61 | | | $ | 13.02 | | | $ | 11.01 | | | $ | 18.92 | | |
| Total Return++ | | | (7.63 | )% | | | 6.08 | % | | | 21.56 | % | | | (33.12 | )% | | | 9.84 | % | |
| Ratios and Supplemental Data: | |
| Net Assets, End of Period (Thousands) | | $ | 2,959,403 | | | $ | 3,372,029 | | | $ | 3,148,980 | | | $ | 2,606,704 | | | $ | 5,105,807 | | |
| Ratio of Expenses to Average Net Assets (1) | | | 0.95 | %+†† | | | 0.95 | %+†† | | | 0.94 | %+ | | | 0.95 | %+ | | | 0.93 | %+ | |
| Ratio of Expenses to Average Net Assets Excluding Non Operating Expenses | | | 0.95 | %+†† | | | 0.95 | %+†† | | | 0.94 | %+ | | | 0.95 | %+ | | | 0.93 | %+ | |
| Ratio of Net Investment Income to Average Net Assets (1) | | | 2.36 | %+†† | | | 2.05 | %+†† | | | 2.35 | %+ | | | 2.73 | %+ | | | 1.97 | %+ | |
| Ratio of Rebate from Morgan Stanley Affiliates to Average Net Assets | | | 0.00 | %††§ | | | 0.00 | %††§ | | | 0.01 | % | | | 0.00 | %§ | | | 0.00 | %§ | |
| Portfolio Turnover Rate | | | 34 | % | | | 40 | % | | | 38 | % | | | 34 | % | | | 31 | % | |
| (1) Supplemental Information on the Ratios to Average Net Assets: | |
| Ratios Before Expense Limitation: | |
| Expenses to Average Net Assets | | | 0.98 | %†† | | | 0.98 | %+†† | | | 0.95 | %+ | | | N/A | | | | N/A | | |
| Net Investment Income to Average Net Assets | | | 2.33 | %†† | | | 2.02 | %+†† | | | 2.34 | %+ | | | N/A | | | | N/A | | |
† Per share amount is based on average shares outstanding.
‡ Amount is less than $0.005 per share.
++ Calculated based on the net asset value as of the last business day of the period.
+ The Ratios of Expenses and Net Investment Income reflect the rebate of certain Portfolio expenses in connection with the investments in Morgan Stanley affiliates during the period. The effect of the rebate on the ratios is disclosed in the above table as "Ratio of Rebate from Morgan Stanley Affiliates to Average Net Assets."
†† Reflects overall Portfolio ratios for investment income and non-class specific expenses.
§ Amount is less than 0.005%.
The accompanying notes are an integral part of the financial statements.
200
2011 Annual Report
December 31, 2011
Financial Highlights
International Equity Portfolio
| | | Class P | |
| | | Year Ended December 31, | |
| Selected Per Share Data and Ratios | | 2011 | | 2010 | | 2009 | | 2008 | | 2007 | |
| Net Asset Value, Beginning of Period | | $ | 13.45 | | | $ | 12.87 | | | $ | 10.90 | | | $ | 18.73 | | | $ | 20.40 | | |
| Income (Loss) from Investment Operations: | |
| Net Investment Income† | | | 0.28 | | | | 0.23 | | | | 0.23 | | | | 0.38 | | | | 0.37 | | |
| Net Realized and Unrealized Gain (Loss) | | | (1.34 | ) | | | 0.51 | | | | 2.07 | | | | (6.66 | ) | | | 1.52 | | |
| Total from Investment Operations | | | (1.06 | ) | | | 0.74 | | | | 2.30 | | | | (6.28 | ) | | | 1.89 | | |
| Distributions from and/or in Excess of: | |
| Net Investment Income | | | (0.28 | ) | | | (0.16 | ) | | | (0.33 | ) | | | (0.37 | ) | | | (0.40 | ) | |
| Net Realized Gain | | | — | | | | — | | | | — | | | | (1.18 | ) | | | (3.16 | ) | |
| Total Distributions | | | (0.28 | ) | | | (0.16 | ) | | | (0.33 | ) | | | (1.55 | ) | | | (3.56 | ) | |
| Redemption Fees | | | 0.00 | ‡ | | | 0.00 | ‡ | | | 0.00 | ‡ | | | 0.00 | ‡ | | | 0.00 | ‡ | |
| Net Asset Value, End of Period | | $ | 12.11 | | | $ | 13.45 | | | $ | 12.87 | | | $ | 10.90 | | | $ | 18.73 | | |
| Total Return++ | | | (7.83 | )% | | | 5.78 | % | | | 21.18 | % | | | (33.21 | )% | | | 9.52 | % | |
| Ratios and Supplemental Data: | |
| Net Assets, End of Period (Thousands) | | $ | 916,002 | | | $ | 928,966 | | | $ | 1,131,919 | | | $ | 687,196 | | | $ | 1,019,595 | | |
| Ratio of Expenses to Average Net Assets (1) | | | 1.20 | %+†† | | | 1.20 | %+†† | | | 1.19 | %+ | | | 1.20 | %+ | | | 1.18 | %+ | |
| Ratio of Expenses to Average Net Assets Excluding Non Operating Expenses | | | 1.20 | %+†† | | | 1.20 | %+†† | | | 1.19 | %+ | | | 1.20 | %+ | | | 1.18 | %+ | |
| Ratio of Net Investment Income to Average Net Assets (1) | | | 2.11 | %+†† | | | 1.80 | %+†† | | | 2.02 | %+ | | | 2.43 | %+ | | | 1.71 | %+ | |
| Ratio of Rebate from Morgan Stanley Affiliates to Average Net Assets | | | 0.00 | %††§ | | | 0.00 | %††§ | | | 0.01 | % | | | 0.00 | %§ | | | 0.00 | %§ | |
| Portfolio Turnover Rate | | | 34 | % | | | 40 | % | | | 38 | % | | | 34 | % | | | 31 | % | |
| (1) Supplemental Information on the Ratios to Average Net Assets: | |
| Ratios Before Expense Limitation: | |
| Expenses to Average Net Assets | | | 1.23 | %†† | | | 1.23 | %+†† | | | 1.20 | %+ | | | N/A | | | | N/A | | |
| Net Investment Income to Average Net Assets | | | 2.08 | %†† | | | 1.77 | %+†† | | | 2.01 | %+ | | | N/A | | | | N/A | | |
† Per share amount is based on average shares outstanding.
‡ Amount is less than $0.005 per share.
++ Calculated based on the net asset value as of the last business day of the period.
+ The Ratios of Expenses and Net Investment Income reflect the rebate of certain Portfolio expenses in connection with the investments in Morgan Stanley affiliates during the period. The effect of the rebate on the ratios is disclosed in the above table as "Ratio of Rebate from Morgan Stanley Affiliates to Average Net Assets."
†† Reflects overall Portfolio ratios for investment income and non-class specific expenses.
§ Amount is less than 0.005%.
The accompanying notes are an integral part of the financial statements.
201
2011 Annual Report
December 31, 2011
Financial Highlights
International Opportunity Portfolio
| | | Class I | |
| Selected Per Share Data and Ratios | | Year Ended
December 31,
2011 | | Period from
March 31,
2010^ to
December 31,
2010 | |
| Net Asset Value, Beginning of Period | | $ | 12.07 | | | $ | 10.00 | | |
| Income (Loss) from Investment Operations: | |
| Net Investment Income† | | | 0.08 | | | | 0.03 | | |
| Net Realized and Unrealized Gain (Loss) | | | (1.31 | ) | | | 2.04 | | |
| Total from Investment Operations | | | (1.23 | ) | | | 2.07 | | |
| Distributions from and/or in Excess of: | |
| Net Investment Income | | | (0.10 | ) | | | — | | |
| Net Realized Gain | | | (0.48 | ) | | | — | | |
| Total Distributions | | | (0.58 | ) | | | — | | |
| Net Asset Value, End of Period | | $ | 10.26 | | | $ | 12.07 | | |
| Total Return++ | | | (10.16 | )% | | | 20.70 | %# | |
| Ratios and Supplemental Data:†† | |
| Net Assets, End of Period (Thousands) | | $ | 4,822 | | | $ | 5,672 | | |
| Ratio of Expenses to Average Net Assets (1) | | | 1.15 | %+ | | | 1.15 | %+* | |
| Ratio of Net Investment Income to Average Net Assets (1) | | | 0.67 | %+ | | | 0.33 | %+* | |
| Ratio of Rebate from Morgan Stanley Affiliates to Average Net Assets | | | 0.00 | %§ | | | 0.00 | %§* | |
| Portfolio Turnover Rate | | | 37 | % | | | 18 | %# | |
| (1) Supplemental Information on the Ratios to Average Net Assets:†† | |
| Ratios Before Expense Limitation: | |
| Expenses to Average Net Assets | | | 3.82 | % | | | 4.79 | %+* | |
| Net Investment Loss to Average Net Assets | | | (2.00 | )% | | | (3.31 | )%+* | |
^ Commencement of Operations.
† Per share amount is based on average shares outstanding.
++ Calculated based on the net asset value as of the last business day of the period.
†† Reflects overall Portfolio ratios for investment income and non-class specific expenses.
+ The Ratios of Expenses and Net Investment Income reflect the rebate of certain Portfolio expenses in connection with the investments in Morgan Stanley affiliates during the period. The effect of the rebate on the ratios is disclosed in the above table as "Ratio of Rebate from Morgan Stanley Affiliates to Average Net Assets."
§ Amount is less than 0.005%.
# Not Annualized.
* Annualized.
The accompanying notes are an integral part of the financial statements.
202
2011 Annual Report
December 31, 2011
Financial Highlights
International Opportunity Portfolio
| | | Class P | |
| Selected Per Share Data and Ratios | | Year Ended
December 31,
2011 | | Period from
March 31,
2010^ to
December 31,
2010 | |
| Net Asset Value, Beginning of Period | | $ | 12.04 | | | $ | 10.00 | | |
| Income (Loss) from Investment Operations: | |
| Net Investment Income† | | | 0.05 | | | | 0.01 | | |
| Net Realized and Unrealized Gain (Loss) | | | (1.30 | ) | | | 2.03 | | |
| Total from Investment Operations | | | (1.25 | ) | | | 2.04 | | |
| Distributions from and/or in Excess of: | |
| Net Investment Income | | | (0.05 | ) | | | — | | |
| Net Realized Gain | | | (0.48 | ) | | | — | | |
| Total Distributions | | | (0.53 | ) | | | — | | |
| Net Asset Value, End of Period | | $ | 10.26 | | | $ | 12.04 | | |
| Total Return++ | | | (10.33 | )% | | | 20.40 | %# | |
| Ratios and Supplemental Data:†† | |
| Net Assets, End of Period (Thousands) | | $ | 103 | | | $ | 120 | | |
| Ratio of Expenses to Average Net Assets (1) | | | 1.40 | %+ | | | 1.40 | %+* | |
| Ratio of Net Investment Income to Average Net Assets (1) | | | 0.42 | %+ | | | 0.08 | %+* | |
| Ratio of Rebate from Morgan Stanley Affiliates to Average Net Assets | | | 0.00 | %§ | | | 0.00 | %§* | |
| Portfolio Turnover Rate | | | 37 | % | | | 18 | %# | |
| (1) Supplemental Information on the Ratios to Average Net Assets:†† | |
| Ratios Before Expense Limitation: | |
| Expenses to Average Net Assets | | | 4.07 | % | | | 5.04 | %+* | |
| Net Investment Loss to Average Net Assets | | | (2.25 | )% | | | (3.56 | )%+* | |
^ Commencement of Operations.
† Per share amount is based on average shares outstanding.
++ Calculated based on the net asset value as of the last business day of the period.
†† Reflects overall Portfolio ratios for investment income and non-class specific expenses.
+ The Ratios of Expenses and Net Investment Income reflect the rebate of certain Portfolio expenses in connection with the investments in Morgan Stanley affiliates during the period. The effect of the rebate on the ratios is disclosed in the above table as "Ratio of Rebate from Morgan Stanley Affiliates to Average Net Assets."
§ Amount is less than 0.005%.
# Not Annualized.
* Annualized.
The accompanying notes are an integral part of the financial statements.
203
2011 Annual Report
December 31, 2011
Financial Highlights
International Opportunity Portfolio
| | | Class H | |
| Selected Per Share Data and Ratios | | Year Ended
December 31,
2011 | | Period from
March 31,
2010^ to
December 31,
2010 | |
| Net Asset Value, Beginning of Period | | $ | 12.04 | | | $ | 10.00 | | |
| Income (Loss) from Investment Operations: | |
| Net Investment Income† | | | 0.05 | | | | 0.01 | | |
| Net Realized and Unrealized Gain (Loss) | | | (1.29 | ) | | | 2.03 | | |
| Total from Investment Operations | | | (1.24 | ) | | | 2.04 | | |
| Distributions from and/or in Excess of: | |
| Net Investment Income | | | (0.06 | ) | | | — | | |
| Net Realized Gain | | | (0.48 | ) | | | — | | |
| Total Distributions | | | (0.54 | ) | | | — | | |
| Net Asset Value, End of Period | | $ | 10.26 | | | $ | 12.04 | | |
| Total Return++ | | | (10.30 | )% | | | 20.40 | %# | |
| Ratios and Supplemental Data:†† | |
| Net Assets, End of Period (Thousands) | | $ | 765 | | | $ | 808 | | |
| Ratio of Expenses to Average Net Assets (1) | | | 1.40 | %+ | | | 1.40 | %+* | |
| Ratio of Net Investment Income to Average Net Assets (1) | | | 0.42 | %+ | | | 0.08 | %+* | |
| Rebate from Morgan Stanley Affiliates to Average Net Assets | | | 0.00 | %§ | | | 0.00 | %§* | |
| Portfolio Turnover Rate | | | 37 | % | | | 18 | %# | |
| (1) Supplemental Information on the Ratios to Average Net Assets:†† | |
| Ratios Before Expense Limitation: | |
| Expense to Average Net Assets | | | 4.07 | % | | | 5.04 | %+* | |
| Net Investment Loss to Average Net Assets | | | (2.25 | )% | | | (3.56 | )%+* | |
^ Commencement of Operations.
† Per share amount is based on average shares outstanding.
++ Calculated based on the net asset value which does not reflect sales charges, if applicable, as of the last business day of the period.
†† Reflects overall Portfolio ratios for investment income and non-class specific expenses.
+ The Ratios of Expenses and Net Investment Income reflect the rebate of certain Portfolio expenses in connection with the investments in Morgan Stanley affiliates during the period. The effect of the rebate on the ratios is disclosed in the above table as "Ratio of Rebate from Morgan Stanley Affiliates to Average Net Assets."
§ Amount is less than 0.005%.
# Not Annualized.
* Annualized.
The accompanying notes are an integral part of the financial statements.
204
2011 Annual Report
December 31, 2011
Financial Highlights
International Opportunity Portfolio
| | | Class L | |
| Selected Per Share Data and Ratios | | Year Ended
December 31,
2011 | | Period from
March 31,
2010^ to
December 31,
2010 | |
| Net Asset Value, Beginning of Period | | $ | 12.00 | | | $ | 10.00 | | |
| Income (Loss) from Investment Operations: | |
| Net Investment Loss† | | | (0.01 | ) | | | (0.03 | ) | |
| Net Realized and Unrealized Gain (Loss) | | | (1.29 | ) | | | 2.03 | | |
| Total from Investment Operations | | | (1.30 | ) | | | 2.00 | | |
| Distributions from and/or in Excess of: | |
| Net Realized Gain | | | (0.48 | ) | | | — | | |
| Net Asset Value, End of Period | | $ | 10.22 | | | $ | 12.00 | | |
| Total Return++ | | | (10.81 | )% | | | 20.00 | %# | |
| Ratios and Supplemental Data:†† | |
| Net Assets, End of Period (Thousands) | | $ | 102 | | | $ | 120 | | |
| Ratio of Expenses to Average Net Assets (1) | | | 1.90 | %+ | | | 1.90 | %+* | |
| Ratio of Net Investment Loss to Average Net Assets (1) | | | (0.08 | )%+ | | | (0.42 | )%+* | |
| Ratio of Rebate from Morgan Stanley Affiliates to Average Net Assets | | | 0.00 | %§ | | | 0.00 | %§* | |
| Portfolio Turnover Rate | | | 37 | % | | | 18 | %# | |
| (1) Supplemental Information on the Ratios to Average Net Assets:†† | |
| Ratios Before Expense Limitation: | |
| Expenses to Average Net Assets | | | 4.57 | % | | | 5.54 | %+* | |
| Net Investment Loss to Average Net Assets | | | (2.75 | )% | | | (4.06 | )%+* | |
^ Commencement of Operations.
† Per share amount is based on average shares outstanding.
++ Calculated based on the net asset value as of the last business day of the period.
†† Reflects overall Portfolio ratios for investment income and non-class specific expenses.
+ The Ratios of Expenses and Net Investment Loss reflect the rebate of certain Portfolio expenses in connection with the investments in Morgan Stanley affiliates during the period. The effect of the rebate on the ratios is disclosed in the above table as "Ratio of Rebate from Morgan Stanley Affiliates to Average Net Assets."
§ Amount is less than 0.005%.
# Not Annualized.
* Annualized.
The accompanying notes are an integral part of the financial statements.
205
2011 Annual Report
December 31, 2011
Financial Highlights
International Real Estate Portfolio
| | | Class I | |
| | | Year Ended December 31, | |
| Selected Per Share Data and Ratios | | 2011 | | 2010 | | 2009 | | 2008 | | 2007 | |
| Net Asset Value, Beginning of Period | | $ | 18.85 | | | $ | 17.80 | | | $ | 12.59 | | | $ | 25.30 | | | $ | 34.82 | | |
| Income (Loss) from Investment Operations: | |
| Net Investment Income† | | | 0.39 | | | | 0.69 | | | | 0.44 | | | | 0.56 | | | | 0.69 | | |
| Net Realized and Unrealized Gain (Loss) | | | (4.04 | ) | | | 0.98 | | | | 5.40 | | | | (13.15 | ) | | | (6.79 | ) | |
| Total from Investment Operations | | | (3.65 | ) | | | 1.67 | | | | 5.84 | | | | (12.59 | ) | | | (6.10 | ) | |
| Distributions from and/or in Excess of: | |
| Net Investment Income | | | (0.54 | ) | | | (0.62 | ) | | | (0.63 | ) | | | — | | | | (1.77 | ) | |
| Net Realized Gain | | | — | | | | — | | | | — | | | | (0.12 | ) | | | (1.65 | ) | |
| Total Distributions | | | (0.54 | ) | | | (0.62 | ) | | | (0.63 | ) | | | (0.12 | ) | | | (3.42 | ) | |
| Redemption Fees | | | 0.00 | ‡ | | | 0.00 | ‡ | | | 0.00 | ‡ | | | 0.00 | ‡ | | | 0.00 | ‡ | |
| Net Asset Value, End of Period | | $ | 14.66 | | | $ | 18.85 | | | $ | 17.80 | | | $ | 12.59 | | | $ | 25.30 | | |
| Total Return++ | | | (19.92 | )% | | | 9.51 | % | | | 46.54 | % | | | (49.95 | )% | | | (17.59 | )% | |
| Ratios and Supplemental Data: | |
| Net Assets, End of Period (Thousands) | | $ | 207,695 | | | $ | 397,514 | | | $ | 463,649 | | | $ | 427,148 | | | $ | 1,053,018 | | |
| Ratio of Expenses to Average Net Assets (1) | | | 1.00 | %+†† | | | 0.98 | %+†† | | | 0.93 | %+ | | | 0.95 | %+ | | | 0.94 | %+ | |
| Ratio of Expenses to Average Net Assets Excluding Non Operating Expenses | | | N/A | | | | 0.98 | %+†† | | | 0.93 | %+ | | | 0.94 | %+ | | | 0.94 | %+ | |
| Ratio of Net Investment Income to Average Net Assets (1) | | | 2.17 | %+†† | | | 3.97 | %+†† | | | 3.04 | %+ | | | 2.68 | %+ | | | 2.10 | %+ | |
| Ratio of Rebate from Morgan Stanley Affiliates to Average Net Assets | | | 0.00 | %††§ | | | 0.00 | %††§ | | | 0.00 | %§ | | | 0.00 | %§ | | | 0.00 | %§ | |
| Portfolio Turnover Rate | | | 18 | % | | | 64 | % | | | 56 | % | | | 54 | % | | | 55 | % | |
| (1) Supplemental Information on the Ratios to Average Net Assets: | |
| Ratios Before Expense Limitation: | |
| Expenses to Average Net Assets | | | N/A | | | | N/A | | | | N/A | | | | 0.97 | %+ | | | N/A | | |
| Net Investment Income to Average Net Assets | | | N/A | | | | N/A | | | | N/A | | | | 2.66 | %+ | | | N/A | | |
† Per share amount is based on average shares outstanding.
‡ Amount is less than $0.005 per share.
++ Calculated based on the net asset value as of the last business day of the period.
+ The Ratios of Expenses and Net Investment Income reflect the rebate of certain Portfolio expenses in connection with the investments in Morgan Stanley affiliates during the period. The effect of the rebate on the ratios is disclosed in the above table as "Ratio of Rebate from Morgan Stanley Affiliates to Average Net Assets."
†† Reflects overall Portfolio ratios for investment income and non-class specific expenses.
§ Amount is less than 0.005%.
The accompanying notes are an integral part of the financial statements.
206
2011 Annual Report
December 31, 2011
Financial Highlights
International Real Estate Portfolio
| | | Class P | |
| | | Year Ended December 31, | |
| Selected Per Share Data and Ratios | | 2011 | | 2010 | | 2009 | | 2008 | | 2007 | |
| Net Asset Value, Beginning of Period | | $ | 18.83 | | | $ | 17.77 | | | $ | 12.58 | | | $ | 25.33 | | | $ | 34.83 | | |
| Income (Loss) from Investment Operations: | |
| Net Investment Income† | | | 0.34 | | | | 0.64 | | | | 0.39 | | | | 0.63 | | | | 0.58 | | |
| Net Realized and Unrealized Gain (Loss) | | | (4.04 | ) | | | 0.98 | | | | 5.39 | | | | (13.26 | ) | | | (6.74 | ) | |
| Total from Investment Operations | | | (3.70 | ) | | | 1.62 | | | | 5.78 | | | | (12.63 | ) | | | (6.16 | ) | |
| Distributions from and/or in Excess of: | |
| Net Investment Income | | | (0.48 | ) | | | (0.56 | ) | | | (0.59 | ) | | | — | | | | (1.69 | ) | |
| Net Realized Gain | | | — | | | | — | | | | — | | | | (0.12 | ) | | | (1.65 | ) | |
| Total Distributions | | | (0.48 | ) | | | (0.56 | ) | | | (0.59 | ) | | | (0.12 | ) | | | (3.34 | ) | |
| Redemption Fees | | | 0.00 | ‡ | | | 0.00 | ‡ | | | 0.00 | ‡ | | | 0.00 | ‡ | | | 0.00 | ‡ | |
| Net Asset Value, End of Period | | $ | 14.65 | | | $ | 18.83 | | | $ | 17.77 | | | $ | 12.58 | | | $ | 25.33 | | |
| Total Return++ | | | (20.16 | )% | | | 9.26 | % | | | 46.08 | % | | | (50.05 | )% | | | (17.76 | )% | |
| Ratios and Supplemental Data: | |
| Net Assets, End of Period (Thousands) | | $ | 3,400 | | | $ | 5,547 | | | $ | 8,429 | | | $ | 9,141 | | | $ | 97,800 | | |
| Ratio of Expenses to Average Net Assets (1) | | | 1.25 | %+†† | | | 1.23 | %+†† | | | 1.18 | %+ | | | 1.19 | %+ | | | 1.19 | %+ | |
| Ratio of Expenses to Average Net Assets Excluding Non Operating Expenses | | | N/A | | | | 1.23 | %+†† | | | 1.18 | %+ | | | 1.19 | %+ | | | 1.19 | %+ | |
| Ratio of Net Investment Income to Average Net Assets (1) | | | 1.92 | %+†† | | | 3.72 | %+†† | | | 2.74 | %+ | | | 2.66 | %+ | | | 1.76 | %+ | |
| Ratio of Rebate from Morgan Stanley Affiliates to Average Net Assets | | | 0.00 | %††§ | | | 0.00 | %††§ | | | 0.00 | %§ | | | 0.00 | %§ | | | 0.00 | %§ | |
| Portfolio Turnover Rate | | | 18 | % | | | 64 | % | | | 56 | % | | | 54 | % | | | 55 | % | |
| (1) Supplemental Information on the Ratios to Average Net Assets: | |
| Ratios Before Expense Limitation: | |
| Expenses to Average Net Assets | | | N/A | | | | N/A | | | | N/A | | | | 1.22 | %+ | | | N/A | | |
| Net Investment Income to Average Net Assets | | | N/A | | | | N/A | | | | N/A | | | | 2.64 | %+ | | | N/A | | |
† Per share amount is based on average shares outstanding.
‡ Amount is less than $0.005 per share.
++ Calculated based on the net asset value as of the last business day of the period.
+ The Ratios of Expenses and Net Investment Income reflect the rebate of certain Portfolio expenses in connection with the investments in Morgan Stanley affiliates during the period. The effect of the rebate on the ratios is disclosed in the above table as "Ratio of Rebate from Morgan Stanley Affiliates to Average Net Assets."
†† Reflects overall Portfolio ratios for investment income and non-class specific expenses.
§ Amount is less than 0.005%.
The accompanying notes are an integral part of the financial statements.
207
2011 Annual Report
December 31, 2011
Financial Highlights
International Small Cap Portfolio
| | | Class I | |
| | | Year Ended December 31, | |
| Selected Per Share Data and Ratios | | 2011 | | 2010 | | 2009 | | 2008 | | 2007 | |
| Net Asset Value, Beginning of Period | | $ | 13.80 | | | $ | 11.97 | | | $ | 9.53 | | | $ | 17.08 | | | $ | 23.72 | | |
| Income (Loss) from Investment Operations: | |
| Net Investment Income† | | | 0.18 | | | | 0.11 | | | | 0.14 | | | | 0.34 | | | | 0.27 | | |
| Net Realized and Unrealized Gain (Loss) | | | (2.71 | ) | | | 1.76 | | | | 2.47 | | | | (6.66 | ) | | | (1.11 | ) | |
| Total from Investment Operations | | | (2.53 | ) | | | 1.87 | | | | 2.61 | | | | (6.32 | ) | | | (0.84 | ) | |
| Distributions from and/or in Excess of: | |
| Net Investment Income | | | — | | | | (0.04 | ) | | | (0.17 | ) | | | (0.41 | ) | | | (0.27 | ) | |
| Net Realized Gain | | | — | | | | — | | | | — | | | | (0.82 | ) | | | (5.53 | ) | |
| Total Distributions | | | — | | | | (0.04 | ) | | | (0.17 | ) | | | (1.23 | ) | | | (5.80 | ) | |
| Redemption Fees | | | 0.00 | ‡ | | | 0.00 | ‡ | | | 0.00 | ‡ | | | 0.00 | ‡ | | | 0.00 | ‡ | |
| Net Asset Value, End of Period | | $ | 11.27 | | | $ | 13.80 | | | $ | 11.97 | | | $ | 9.53 | | | $ | 17.08 | | |
| Total Return++ | | | (18.33 | )% | | | 15.72 | % | | | 27.45 | % | | | (38.33 | )% | | | (3.22 | )% | |
| Ratios and Supplemental Data: | |
| Net Assets, End of Period (Thousands) | | $ | 213,983 | | | $ | 320,362 | | | $ | 349,589 | | | $ | 316,526 | | | $ | 796,050 | | |
| Ratio of Expenses to Average Net Assets (1) | | | 1.15 | %+†† | | | 1.15 | %+†† | | | 1.14 | %+ | | | 1.13 | %+ | | | 1.09 | %+ | |
| Ratio of Expenses to Average Net Assets Excluding Non Operating Expenses | | | N/A | | | | 1.15 | %+†† | | | 1.14 | %+ | | | 1.12 | %+ | | | 1.09 | %+ | |
| Ratio of Net Investment Income to Average Net Assets (1) | | | 1.33 | %+†† | | | 0.87 | %+†† | | | 1.31 | %+ | | | 2.47 | %+ | | | 1.10 | %+ | |
| Ratio of Rebate from Morgan Stanley Affiliates to Average Net Assets | | | 0.00 | %††§ | | | 0.00 | %††§ | | | 0.00 | %§ | | | 0.00 | %§ | | | 0.00 | %§ | |
| Portfolio Turnover Rate | | | 64 | % | | | 66 | % | | | 127 | % | | | 49 | % | | | 53 | % | |
| (1) Supplemental Information on the Ratios to Average Net Assets: | |
| Ratios Before Expense Limitation: | |
| Expenses to Average Net Assets | | | 1.19 | %†† | | | 1.18 | %+†† | | | N/A | | | | 1.15 | %+ | | | N/A | | |
| Net Investment Income to Average Net Assets | | | 1.29 | %†† | | | 0.84 | %+†† | | | N/A | | | | 2.44 | %+ | | | N/A | | |
† Per share amount is based on average shares outstanding.
‡ Amount is less than $0.005 per share.
++ Calculated based on the net asset value as of the last business day of the period.
+ The Ratios of Expenses and Net Investment Income reflect the rebate of certain Portfolio expenses in connection with the investments in Morgan Stanley affiliates during the period. The effect of the rebate on the ratios is disclosed in the above table as "Ratio of Rebate from Morgan Stanley Affiliates to Average Net Assets."
†† Reflects overall Portfolio ratios for investment income and non-class specific expenses.
§ Amount is less than 0.005%.
The accompanying notes are an integral part of the financial statements.
208
2011 Annual Report
December 31, 2011
Financial Highlights
International Small Cap Portfolio
| | | Class P | |
| | | Year Ended December 31, | | Period from
October 21,
2008^ to
December 31, | |
| Selected Per Share Data and Ratios | | 2011 | | 2010 | | 2009 | | 2008 | |
| Net Asset Value, Beginning of Period | | $ | 13.74 | | | $ | 11.95 | | | $ | 9.53 | | | $ | 9.80 | | |
| Income (Loss) from Investment Operations: | |
| Net Investment Income† | | | 0.14 | | | | 0.07 | | | | 0.01 | | | | 0.00 | ‡ | |
| Net Realized and Unrealized Gain (Loss) | | | (2.69 | ) | | | 1.76 | | | | 2.57 | | | | 0.14 | | |
| Total from Investment Operations | | | (2.55 | ) | | | 1.83 | | | | 2.58 | | | | 0.14 | | |
| Distributions from and/or in Excess of: | |
| Net Investment Income | | | — | | | | (0.04 | ) | | | (0.16 | ) | | | (0.41 | ) | |
| Redemption Fees | | | 0.00 | ‡ | | | 0.00 | ‡ | | | 0.00 | ‡ | | | — | | |
| Net Asset Value, End of Period | | $ | 11.19 | | | $ | 13.74 | | | $ | 11.95 | | | $ | 9.53 | | |
| Total Return++ | | | (18.56 | )% | | | 15.41 | % | | | 27.14 | % | | | 1.56 | %# | |
| Ratios and Supplemental Data: | |
| Net Assets, End of Period (Thousands) | | $ | 82,170 | | | $ | 101,074 | | | $ | 63,326 | | | $ | 119 | | |
| Ratio of Expenses to Average Net Assets (1) | | | 1.40 | %+††** | | | 1.40 | %+††** | | | 1.37 | %+** | | | 1.39 | %+* | |
| Ratio of Expenses to Average Net Assets Excluding Non Operating Expenses | | | N/A | | | | 1.40 | %+††** | | | 1.37 | %+** | | | 1.39 | %+* | |
| Ratio of Net Investment Income to Average Net Assets (1) | | | 1.08 | %+†† | | | 0.62 | %+†† | | | 0.12 | %+ | | | 0.09 | %+* | |
| Ratio of Rebate from Morgan Stanley Affiliates to Average Net Assets | | | 0.00 | %††§ | | | 0.00 | %††§ | | | 0.00 | %§ | | | 0.00 | %§* | |
| Portfolio Turnover Rate | | | 64 | % | | | 66 | % | | | 127 | % | | | 49 | %# | |
| (1) Supplemental Information on the Ratios to Average Net Assets: | |
| Ratios Before Expense Limitation: | |
| Expenses to Average Net Assets | | | 1.44 | %†† | | | 1.43 | %+†† | | | N/A | | | | 1.86 | %+* | |
| Net Investment Income (Loss) to Average Net Assets | | | 1.04 | %†† | | | 0.59 | %+†† | | | N/A | | | | (0.38 | )%+* | |
^ Commencement of Operations.
† Per share amount is based on average shares outstanding.
‡ Amount is less than $0.005 per share.
++ Calculated based on the net asset value as of the last business day of the period.
+ The Ratios of Expenses and Net Investment Income reflect the rebate of certain Portfolio expenses in connection with the investments in Morgan Stanley affiliates during the period. The effect of the rebate on the ratios is disclosed in the above table as "Ratio of Rebate from Morgan Stanley Affiliates to Average Net Assets."
†† Reflects overall Portfolio ratios for investment income and non-class specific expenses.
** Ratios of Expenses to Average Net Assets for Class P may vary by more than the shareholder servicing fees due to fluctuations in daily net asset amounts.
§ Amount is less than 0.005%.
# Not Annualized.
* Annualized.
The accompanying notes are an integral part of the financial statements.
209
2011 Annual Report
December 31, 2011
Financial Highlights
Select Global Infrastructure Portfolio
| | | Class I | |
| Selected Per Share Data and Ratios | | Year Ended
December 31,
2011 | | Period from
September 20,
2010^ to
December 31,
2010 | |
| Net Asset Value, Beginning of Period | | $ | 10.40 | | | $ | 10.00 | | |
| Income from Investment Operations: | |
| Net Investment Income† | | | 0.23 | | | | 0.08 | | |
| Net Realized and Unrealized Gain | | | 1.42 | | | | 0.40 | | |
| Total from Investment Operations | | | 1.65 | | | | 0.48 | | |
| Distributions from and/or in Excess of: | |
| Net Investment Income | | | (0.22 | ) | | | (0.08 | ) | |
| Net Realized Gain | | | (0.33 | ) | | | — | | |
| Total Distributions | | | (0.55 | ) | | | (0.08 | ) | |
| Net Asset Value, End of Period | | $ | 11.50 | | | $ | 10.40 | | |
| Total Return++ | | | 15.95 | % | | | 4.94 | %# | |
| Ratios and Supplemental Data:†† | |
| Net Assets, End of Period (Thousands) | | $ | 12,589 | | | $ | 10,086 | | |
| Ratio of Expenses to Average Net Assets (1) | | | 1.15 | %+ | | | 1.14 | %+* | |
| Ratio of Net Investment Income to Average Net Assets (1) | | | 2.09 | %+ | | | 2.71 | %+* | |
| Ratio of Rebate from Morgan Stanley Affiliates to Average Net Assets | | | 0.00 | %§ | | | 0.01 | %* | |
| Portfolio Turnover Rate | | | 51 | % | | | 6 | %# | |
| (1) Supplemental Information on the Ratios to Average Net Assets:†† | |
| Ratios Before Expense Limitation: | |
| Expenses to Average Net Assets | | | 2.93 | % | | | 3.61 | %+* | |
| Net Investment Income to Average Net Assets | | | 0.31 | % | | | 0.24 | %+* | |
^ Commencement of Operations.
† Per share amount is based on average shares outstanding.
++ Calculated based on the net asset value as of the last business day of the period.
†† Reflects overall Portfolio ratios for investment income and non-class specific expenses.
+ The Ratios of Expenses and Net Investment Income reflect the rebate of certain Portfolio expenses in connection with the investments in Morgan Stanley affiliates during the period. The effect of the rebate on the ratios is disclosed in the above table as "Ratio of Rebate from Morgan Stanley Affiliates to Average Net Assets."
§ Amount is less than 0.005%.
# Not Annualized.
* Annualized.
The accompanying notes are an integral part of the financial statements.
210
2011 Annual Report
December 31, 2011
Financial Highlights
Select Global Infrastructure Portfolio
| | | Class P | |
| Selected Per Share Data and Ratios | | Year Ended
December 31,
2011 | | Period from
September 20,
2010^ to
December 31,
2010 | |
| Net Asset Value, Beginning of Period | | $ | 10.40 | | | $ | 10.00 | | |
| Income from Investment Operations: | |
| Net Investment Income† | | | 0.21 | | | | 0.07 | | |
| Net Realized and Unrealized Gain | | | 1.41 | | | | 0.41 | | |
| Total from Investment Operations | | | 1.62 | | | | 0.48 | | |
| Distributions from and/or in Excess of: | |
| Net Investment Income | | | (0.19 | ) | | | (0.08 | ) | |
| Net Realized Gain | | | (0.33 | ) | | | — | | |
| Total Distributions | | | (0.52 | ) | | | (0.08 | ) | |
| Net Asset Value, End of Period | | $ | 11.50 | | | $ | 10.40 | | |
| Total Return++ | | | 15.67 | % | | | 4.86 | %# | |
| Ratios and Supplemental Data:†† | |
| Net Assets, End of Period (Thousands) | | $ | 115 | | | $ | 104 | | |
| Ratio of Expenses to Average Net Assets (1) | | | 1.40 | %+ | | | 1.39 | %+* | |
| Ratio of Net Investment Income to Average Net Assets (1) | | | 1.84 | %+ | | | 2.46 | %+* | |
| Ratio of Rebate from Morgan Stanley Affiliates to Average Net Assets | | | 0.00 | %§ | | | 0.01 | %* | |
| Portfolio Turnover Rate | | | 51 | % | | | 6 | %# | |
| (1) Supplemental Information on the Ratios to Average Net Assets:†† | |
| Ratios Before Expense Limitation: | |
| Expenses to Average Net Assets | | | 3.18 | % | | | 3.86 | %+* | |
| Net Investment Income (Loss) to Average Net Assets | | | 0.06 | % | | | (0.01 | )%+* | |
^ Commencement of Operations.
† Per share amount is based on average shares outstanding.
++ Calculated based on the net asset value as of the last business day of the period.
†† Reflects overall Portfolio ratios for investment income and non-class specific expenses.
+ The Ratios of Expenses and Net Investment Income reflect the rebate of certain Portfolio expenses in connection with the investments in Morgan Stanley affiliates during the period. The effect of the rebate on the ratios is disclosed in the above table as "Ratio of Rebate from Morgan Stanley Affiliates to Average Net Assets."
§ Amount is less than 0.005%.
# Not Annualized.
* Annualized.
The accompanying notes are an integral part of the financial statements.
211
2011 Annual Report
December 31, 2011
Financial Highlights
Select Global Infrastructure Portfolio
| | | Class H | |
| Selected Per Share Data and Ratios | | Year Ended
December 31,
2011 | | Period from
September 20,
2010^ to
December 31,
2010 | |
| Net Asset Value, Beginning of Period | | $ | 10.40 | | | $ | 10.00 | | |
| Income from Investment Operations: | |
| Net Investment Income† | | | 0.21 | | | | 0.07 | | |
| Net Realized and Unrealized Gain | | | 1.41 | | | | 0.41 | | |
| Total from Investment Operations | | | 1.62 | | | | 0.48 | | |
| Distributions from and/or in Excess of: | |
| Net Investment Income | | | (0.19 | ) | | | (0.08 | ) | |
| Net Realized Gain | | | (0.33 | ) | | | — | | |
| Total Distributions | | | (0.52 | ) | | | (0.08 | ) | |
| Net Asset Value, End of Period | | $ | 11.50 | | | $ | 10.40 | | |
| Total Return++ | | | 15.67 | % | | | 4.86 | %# | |
| Ratios and Supplemental Data:†† | |
| Net Assets, End of Period (Thousands) | | $ | 115 | | | $ | 104 | | |
| Ratio of Expenses to Average Net Assets (1) | | | 1.40 | %+ | | | 1.39 | %+* | |
| Ratio of Net Investment Income to Average Net Assets (1) | | | 1.84 | %+ | | | 2.46 | %+* | |
| Rebate from Morgan Stanley Affiliates to Average Net Assets | | | 0.00 | %§ | | | 0.01 | %* | |
| Portfolio Turnover Rate | | | 51 | % | | | 6 | %# | |
| (1) Supplemental Information on the Ratios to Average Net Assets:†† | |
| Ratios Before Expense Limitation: | |
| Expense to Average Net Assets | | | 3.18 | % | | | 3.86 | %+* | |
| Net Investment Income (Loss) to Average Net Assets | | | 0.06 | % | | | (0.01 | )%+* | |
^ Commencement of Operations.
† Per share amount is based on average shares outstanding.
++ Calculated based on the net asset value which does not reflect sales charges, if applicable, as of the last business day of the period.
†† Reflects overall Portfolio ratios for investment income and non-class specific expenses.
+ The Ratios of Expenses and Net Investment Income reflect the rebate of certain Portfolio expenses in connection with the investments in Morgan Stanley affiliates during the period. The effect of the rebate on the ratios is disclosed in the above table as "Ratio of Rebate from Morgan Stanley Affiliates to Average Net Assets."
§ Amount is less than 0.005%.
# Not Annualized.
* Annualized.
The accompanying notes are an integral part of the financial statements.
212
2011 Annual Report
December 31, 2011
Financial Highlights
Select Global Infrastructure Portfolio
| | | Class L | |
| Selected Per Share Data and Ratios | | Year Ended
December 31,
2011 | | Period from
September 20,
2010^ to
December 31,
2010 | |
| Net Asset Value, Beginning of Period | | $ | 10.40 | | | $ | 10.00 | | |
| Income from Investment Operations: | |
| Net Investment Income† | | | 0.15 | | | | 0.06 | | |
| Net Realized and Unrealized Gain | | | 1.42 | | | | 0.40 | | |
| Total from Investment Operations | | | 1.57 | | | | 0.46 | | |
| Distributions from and/or in Excess of: | |
| Net Investment Income | | | (0.14 | ) | | | (0.06 | ) | |
| Net Realized Gain | | | (0.33 | ) | | | — | | |
| Total Distributions | | | (0.47 | ) | | | (0.06 | ) | |
| Net Asset Value, End of Period | | $ | 11.50 | | | $ | 10.40 | | |
| Total Return++ | | | 15.12 | % | | | 4.72 | %# | |
| Ratios and Supplemental Data:†† | |
| Net Assets, End of Period (Thousands) | | $ | 115 | | | $ | 104 | | |
| Ratio of Expenses to Average Net Assets (1) | | | 1.90 | %+ | | | 1.89 | %+* | |
| Ratio of Net Investment Income to Average Net Assets (1) | | | 1.34 | %+ | | | 1.96 | %+* | |
| Ratio of Rebate from Morgan Stanley Affiliates to Average Net Assets | | | 0.00 | %§ | | | 0.01 | %* | |
| Portfolio Turnover Rate | | | 51 | % | | | 6 | %# | |
| (1) Supplemental Information on the Ratios to Average Net Assets:†† | |
| Ratios Before Expense Limitation: | |
| Expenses to Average Net Assets | | | 3.68 | % | | | 4.36 | %+* | |
| Net Investment Loss to Average Net Assets | | | (0.44 | )% | | | (0.51 | )%+* | |
^ Commencement of Operations.
† Per share amount is based on average shares outstanding.
++ Calculated based on the net asset value as of the last business day of the period.
†† Reflects overall Portfolio ratios for investment income and non-class specific expenses.
+ The Ratios of Expenses and Net Investment Income reflect the rebate of certain Portfolio expenses in connection with the investments in Morgan Stanley affiliates during the period. The effect of the rebate on the ratios is disclosed in the above table as "Ratio of Rebate from Morgan Stanley Affiliates to Average Net Assets."
§ Amount is less than 0.005%.
# Not Annualized.
* Annualized.
The accompanying notes are an integral part of the financial statements.
213
2011 Annual Report
December 31, 2011
Financial Highlights
Advantage Portfolio
| | | Class I** | |
| | | Year Ended
December 31, | | Period from
September 1,
2010 to
December 31, | | Year Ended
August 31, | | Period from
June 30,
2008^ to
August 31, | |
| Selected Per Share Data and Ratios | | 2011 | | 2010 | | 2010 | | 2009 | | 2008 | |
| Net Asset Value, Beginning of Period | | $ | 10.87 | | | $ | 9.15 | | | $ | 7.97 | | | $ | 9.55 | | | $ | 10.00 | | |
| Income (Loss) from Investment Operations: | |
| Net Investment Income† | | | 0.04 | | | | 0.01 | | | | 0.04 | | | | 0.03 | | | | 0.00 | ‡ | |
| Net Realized and Unrealized Gain (Loss) | | | 0.54 | | | | 1.74 | | | | 1.19 | | | | (1.50 | ) | | | (0.45 | ) | |
| Total from Investment Operations | | | 0.58 | | | | 1.75 | | | | 1.23 | | | | (1.47 | ) | | | (0.45 | ) | |
| Distributions from and/or in Excess of: | |
| Net Investment Income | | | (0.07 | ) | | | (0.03 | ) | | | (0.05 | ) | | | (0.11 | ) | | | — | | |
| Net Asset Value, End of Period | | $ | 11.38 | | | $ | 10.87 | | | $ | 9.15 | | | $ | 7.97 | | | $ | 9.55 | | |
| Total Return++ | | | 5.33 | % | | | 19.30 | %# | | | 15.34 | % | | | (15.05 | )% | | | (4.50 | )%# | |
| Ratios and Supplemental Data: | |
| Net Assets, End of Period (Thousands) | | $ | 7,239 | | | $ | 5,015 | | | $ | 4,223 | | | $ | 3,667 | | | $ | 4,392 | | |
| Ratio of Expenses to Average Net Assets (1) | | | 1.05 | %+†† | | | 1.02 | %+††* | | | 1.05 | % | | | 1.05 | % | | | 1.05 | %* | |
| Ratio of Expenses to Average Net Assets Excluding Non Operating Expenses | | | N/A | | | | 0.25 | %+††* | | | N/A | | | | N/A | | | | N/A | | |
| Ratio of Net Investment Income to Average Net Assets (1) | | | 0.39 | %+†† | | | 0.42 | %+††* | | | 0.49 | % | | | 0.49 | % | | | 0.20 | %* | |
| Ratio of Rebate from Morgan Stanley Affiliates to Average Net Assets | | | 0.00 | %††§ | | | 0.03 | %††* | | | N/A | | | | N/A | | | | N/A | | |
| Portfolio Turnover Rate | | | 28 | % | | | 33 | %# | | | 32 | % | | | 14 | % | | | 2 | %# | |
| (1) Supplemental Information on the Ratios to Average Net Assets: | |
| Ratios Before Expense Limitation: | |
| Expenses to Average Net Assets | | | 3.43 | %†† | | | 3.49 | %+††* | | | 4.49 | % | | | 11.78 | % | | | 14.97 | %* | |
| Net Investment Loss to Average Net Assets | | | (1.99 | )%†† | | | (2.05 | )%+††* | | | (2.95 | )% | | | (10.24 | )% | | | (13.72 | )%* | |
** On May 21, 2010, the Portfolio acquired substantially all of the assets and liabilities of the Van Kampen Core Growth Fund ("the Predecessor Fund"). Therefore, the per share data and ratios of Class I shares for the 12-month period ended August 31, 2010 and prior years reflect the historical per share data of Class I shares of the Predecessor Fund.
^ Commencement of Operations.
† Per share amount is based on average shares outstanding.
‡ Amount is less than $0.005 per share.
++ Calculated based on the net asset value as of the last business day of the period.
+ The Ratios of Expenses and Net Investment Income reflect the rebate of certain Portfolio expenses in connection with the investments in Morgan Stanley affiliates during the period. The effect of the rebate on the ratios is disclosed in the above table as "Ratio of Rebate from Morgan Stanley Affiliates to Average Net Assets."
†† Reflects overall Portfolio ratios for investment income and non-class specific expenses.
§ Amount is less than 0.005%.
# Not Annualized.
* Annualized.
The accompanying notes are an integral part of the financial statements.
214
2011 Annual Report
December 31, 2011
Financial Highlights
Advantage Portfolio
| | | Class P | |
| Selected Per Share Data and Ratios | | Year Ended
December 31,
2011 | | Period from
September 1,
2010 to
December 31,
2010 | | Period from
May 21,
2010^ to
August 31,
2010 | |
| Net Asset Value, Beginning of Period | | $ | 10.86 | | | $ | 9.15 | | | $ | 9.00 | | |
| Income (Loss) from Investment Operations: | |
| Net Investment Income† | | | 0.02 | | | | 0.01 | | | | 0.01 | | |
| Net Realized and Unrealized Gain | | | 0.53 | | | | 1.73 | | | | 0.14 | | |
| Total from Investment Operations | | | 0.55 | | | | 1.74 | | | | 0.15 | | |
| Distributions from and/or in Excess of: | |
| Net Investment Income | | | (0.04 | ) | | | (0.03 | ) | | | — | | |
| Net Asset Value, End of Period | | $ | 11.37 | | | $ | 10.86 | | | $ | 9.15 | | |
| Total Return++ | | | 5.07 | % | | | 19.16 | %# | | | 1.56 | %# | |
| Ratios and Supplemental Data:†† | |
| Net Assets, End of Period (Thousands) | | $ | 11 | | | $ | 10 | | | $ | 1 | | |
| Ratio of Expenses to Average Net Assets (1) | | | 1.30 | %+ | | | 1.29 | %+* | | | 1.30 | %* | |
| Ratio of Expenses to Average Net Assets Excluding Non Operating Expenses | | | N/A | | | | 0.52 | %+* | | | N/A | | |
| Ratio of Net Investment Income to Average Net Assets (1) | | | 0.14 | %+ | | | 0.15 | %+* | | | 0.27 | %* | |
| Ratio of Rebate from Morgan Stanley Affiliates to Average Net Assets | | | 0.00 | %§ | | | 0.03 | %* | | | N/A | | |
| Portfolio Turnover Rate | | | 28 | % | | | 33 | %# | | | 32 | %# | |
| (1) Supplemental Information on the Ratios to Average Net Assets:†† | |
| Ratios Before Expense Limitation: | |
| Expenses to Average Net Assets | | | 3.68 | % | | | 3.76 | %+ | | | 2.59 | %* | |
| Net Investment Loss to Average Net Assets | | | (2.24 | )% | | | (2.32 | )%+ | | | (1.02 | )%* | |
^ Commencement of Operations.
† Per share amount is based on average shares outstanding.
++ Calculated based on the net asset value as of the last business day of the period.
†† Reflects overall Portfolio ratios for investment income and non-class specific expenses.
+ The Ratios of Expenses and Net Investment Income reflect the rebate of certain Portfolio expenses in connection with the investments in Morgan Stanley affiliates during the period. The effect of the rebate on the ratios is disclosed in the above table as "Ratio of Rebate from Morgan Stanley Affiliates to Average Net Assets."
§ Amount is less than 0.005%.
# Not Annualized.
* Annualized.
The accompanying notes are an integral part of the financial statements.
215
2011 Annual Report
December 31, 2011
Financial Highlights
Advantage Portfolio
| | | Class H** | |
| | | Year Ended
December 31, | | Period from
September 1,
2010 to
December 31, | | Year Ended
August 31, | | Period from
June 30,
2008^ to
August 31, | |
| Selected Per Share Data and Ratios | | 2011 | | 2010 | | 2010 | | 2009 | | 2008 | |
| Net Asset Value, Beginning of Period | | $ | 10.86 | | | $ | 9.14 | | | $ | 7.96 | | | $ | 9.54 | | | $ | 10.00 | | |
| Income (Loss) from Investment Operations: | |
| Net Investment Income† | | | 0.02 | | | | 0.01 | | | | 0.02 | | | | 0.02 | | | | 0.00 | ‡ | |
| Net Realized and Unrealized Gain (Loss) | | | 0.53 | | | | 1.73 | | | | 1.19 | | | | (1.50 | ) | | | (0.46 | ) | |
| Total from Investment Operations | | | 0.55 | | | | 1.74 | | | | 1.21 | | | | (1.48 | ) | | | (0.46 | ) | |
| Distributions from and/or in Excess of: | |
| Net Investment Income | | | (0.04 | ) | | | (0.02 | ) | | | (0.03 | ) | | | (0.10 | ) | | | — | | |
| Net Asset Value, End of Period | | $ | 11.37 | | | $ | 10.86 | | | $ | 9.14 | | | $ | 7.96 | | | $ | 9.54 | | |
| Total Return++ | | | 5.06 | % | | | 19.13 | %# | | | 15.14 | % | | | (15.16 | )% | | | (4.60 | )%# | |
| Ratios and Supplemental Data: | |
| Net Assets, End of Period (Thousands) | | $ | 996 | | | $ | 1,103 | | | $ | 1,048 | | | $ | 821 | | | $ | 363 | | |
| Ratio of Expenses to Average Net Assets (1) | | | 1.30 | %+†† | | | 1.27 | %+††* | | | 1.30 | % | | | 1.30 | % | | | 1.30 | %* | |
| Ratio of Expenses to Average Net Assets Excluding Non Operating Expenses | | | N/A | | | | 0.50 | %+††* | | | N/A | | | | N/A | | | | N/A | | |
| Ratio of Net Investment Income to Average Net Assets (1) | | | 0.14 | %+†† | | | 0.17 | %+††* | | | 0.14 | % | | | 0.27 | % | | | (0.06 | )%* | |
| Rebate from Morgan Stanley Affiliates to Average Net Assets | | | 0.00 | %††§ | | | 0.03 | %††* | | | N/A | | | | N/A | | | | N/A | | |
| Portfolio Turnover Rate | | | 28 | % | | | 33 | %# | | | 32 | % | | | 14 | % | | | 2 | %# | |
| (1) Supplemental Information on the Ratios to Average Net Assets: | |
| Ratios Before Expense Limitation: | |
| Expense to Average Net Assets | | | 3.68 | %†† | | | 3.74 | %+†† | | | 4.62 | % | | | 11.97 | % | | | 15.46 | %* | |
| Net Investment Loss to Average Net Assets | | | (2.24 | )%†† | | | (2.30 | )%+†† | | | (3.18 | )% | | | (10.40 | )% | | | (14.22 | )%* | |
** On May 21, 2010, the Portfolio acquired substantially all of the assets and liabilities of the Van Kampen Core Growth Fund ("the Predecessor Fund"). Therefore, the per share data and ratios of Class H shares for the 12-month period ended August 31, 2010 and prior years reflect the historical per share data of Class A shares of the Predecessor Fund.
^ Commencement of Operations.
† Per share amount is based on average shares outstanding.
‡ Amount is less than $0.005 per share.
++ Calculated based on the net asset value which does not reflect sales charges, if applicable, as of the last business day of the period.
+ The Ratios of Expenses and Net Investment Income reflect the rebate of certain Portfolio expenses in connection with the investments in Morgan Stanley affiliates during the period. The effect of the rebate on the ratios is disclosed in the above table as "Ratio of Rebate from Morgan Stanley Affiliates to Average Net Assets."
†† Reflects overall Portfolio ratios for investment income and non-class specific expenses.
§ Amount is less than 0.005%.
# Not Annualized.
* Annualized.
The accompanying notes are an integral part of the financial statements.
216
2011 Annual Report
December 31, 2011
Financial Highlights
Advantage Portfolio
| | | Class L** | |
| | | Year Ended
December 31, | | Period from
September 1,
2010 to
December 31, | | Year Ended
August 31, | | Period from
June 30,
2008^ to
August 31, | |
| Selected Per Share Data and Ratios | | 2011 | | 2010 | | 2010 | | 2009 | | 2008 | |
| Net Asset Value, Beginning of Period | | $ | 10.89 | | | $ | 9.16 | | | $ | 7.96 | | | $ | 9.54 | | | $ | 10.00 | | |
| Income (Loss) from Investment Operations: | |
| Net Investment Income† | | | 0.04 | | | | 0.01 | | | | 0.04 | | | | 0.00 | ‡ | | | 0.00 | ‡ | |
| Net Realized and Unrealized Gain (Loss) | | | 0.52 | | | | 1.75 | | | | 1.19 | | | | (1.50 | ) | | | (0.46 | ) | |
| Total from Investment Operations | | | 0.56 | | | | 1.76 | | | | 1.23 | | | | (1.50 | ) | | | (0.46 | ) | |
| Distributions from and/or in Excess of: | |
| Net Investment Income | | | (0.06 | ) | | | (0.03 | ) | | | (0.03 | ) | | | (0.08 | ) | | | — | | |
| Net Asset Value, End of Period | | $ | 11.39 | | | $ | 10.89 | | | $ | 9.16 | | | $ | 7.96 | | | $ | 9.54 | | |
| Total Return++ | | | 5.19 | % | | | 19.20 | %# | | | 15.43 | % | | | (15.40 | )% | | | (4.60 | )%# | |
| Ratios and Supplemental Data: | |
| Net Assets, End of Period (Thousands) | | $ | 208 | | | $ | 155 | | | $ | 156 | | | $ | 160 | | | $ | 147 | | |
| Ratio of Expenses to Average Net Assets (1) | | | 1.09 | %+†† | | | 1.06 | %+††* | | | 1.08 | % | | | 1.48 | % | | | 1.05 | %* | |
| Ratio of Expenses to Average Net Assets Excluding Non Operating Expenses | | | N/A | | | | 0.29 | %+††* | | | N/A | | | | N/A | | | | N/A | | |
| Ratio of Net Investment Income to Average Net Assets (1) | | | 0.35 | %+†† | | | 0.38 | %+††* | | | 0.45 | % | | | (0.01 | )% | | | (0.20 | )%* | |
| Ratio of Rebate from Morgan Stanley Affiliates to Average Net Assets | | | 0.00 | %††§ | | | 0.03 | %††* | | | N/A | | | | N/A | | | | N/A | | |
| Portfolio Turnover Rate | | | 28 | % | | | 33 | %# | | | 32 | % | | | 14 | % | | | 2 | %# | |
| (1) Supplemental Information on the Ratios to Average Net Assets: | |
| Ratios Before Expense Limitation: | |
| Expenses to Average Net Assets | | | 4.18 | %†† | | | 3.53 | %+††* | | | 4.53 | % | | | 12.27 | % | | | 15.79 | %* | |
| Net Investment Loss to Average Net Assets | | | (2.74 | )%†† | | | (2.09 | )%+††* | | | (3.00 | )% | | | (10.80 | )% | | | (14.49 | )%* | |
** On May 21, 2010, the Portfolio acquired substantially all of the assets and liabilities of the Van Kampen Core Growth Fund ("the Predecessor Fund"). Therefore, the per share data and ratios of Class L shares for the 12-month period ended August 31, 2010 and prior years reflect the historical per share data of Class C shares of the Predecessor Fund.
^ Commencement of Operations.
† Per share amount is based on average shares outstanding.
‡ Amount is less than $0.005 per share.
++ Calculated based on the net asset value as of the last business day of the period.
+ The Ratios of Expenses and Net Investment Income reflect the rebate of certain Portfolio expenses in connection with the investments in Morgan Stanley affiliates during the period. The effect of the rebate on the ratios is disclosed in the above table as "Ratio of Rebate from Morgan Stanley Affiliates to Average Net Assets."
†† Reflects overall Portfolio ratios for investment income and non-class specific expenses.
§ Amount is less than 0.005%.
# Not Annualized.
* Annualized.
The accompanying notes are an integral part of the financial statements.
217
2011 Annual Report
December 31, 2011
Financial Highlights
Focus Growth Portfolio
| | | Class I | |
| | | Year Ended December 31, | |
| Selected Per Share Data and Ratios | | 2011 | | 2010 | | 2009 | | 2008 | | 2007 | |
| Net Asset Value, Beginning of Period | | $ | 19.58 | | | $ | 15.27 | | | $ | 8.95 | | | $ | 18.81 | | | $ | 15.19 | | |
| Income (Loss) from Investment Operations: | |
| Net Investment Income (Loss)† | | | (0.06 | ) | | | (0.05 | ) | | | (0.01 | ) | | | 0.00 | ‡ | | | 0.03 | | |
| Net Realized and Unrealized Gain (Loss) | | | (1.37 | ) | | | 4.36 | | | | 6.33 | | | | (9.82 | ) | | | 3.62 | | |
| Total from Investment Operations | | | (1.43 | ) | | | 4.31 | | | | 6.32 | | | | (9.82 | ) | | | 3.65 | | |
| Distributions from and/or in Excess of: | |
| Net Investment Income | | | — | | | | — | | | | — | | | | (0.04 | ) | | | (0.03 | ) | |
| Redemption Fees | | | — | | | | — | | | | — | | | | 0.00 | ‡ | | | 0.00 | ‡ | |
| Net Asset Value, End of Period | | $ | 18.15 | | | $ | 19.58 | | | $ | 15.27 | | | $ | 8.95 | | | $ | 18.81 | | |
| Total Return++ | | | (7.30 | )% | | | 28.23 | % | | | 70.61 | %** | | | (52.19 | )% | | | 24.02 | % | |
| Ratios and Supplemental Data: | |
| Net Assets, End of Period (Thousands) | | $ | 22,377 | | | $ | 17,618 | | | $ | 7,878 | | | $ | 4,879 | | | $ | 13,852 | | |
| Ratio of Expenses to Average Net Assets (1) | | | 0.99 | %+†† | | | 1.00 | %+†† | | | 0.99 | %+ | | | 1.00 | %+ | | | 1.00 | %+ | |
| Ratio of Expenses to Average Net Assets Excluding Non Operating Expenses | | | N/A | | | | 1.00 | %+†† | | | 0.99 | %+ | | | 1.00 | %+ | | | 1.00 | %+ | |
| Ratio of Net Investment Income (Loss) to Average Net Assets (1) | | | (0.29 | )%+†† | | | (0.28 | )%+†† | | | (0.12 | )%+ | | | 0.02 | %+ | | | 0.16 | %+ | |
| Ratio of Rebate from Morgan Stanley Affiliates to Average Net Assets | | | 0.01 | %†† | | | 0.00 | %††§ | | | 0.01 | % | | | 0.00 | %§ | | | 0.00 | %§ | |
| Portfolio Turnover Rate | | | 37 | % | | | 79 | % | | | 11 | % | | | 36 | % | | | 57 | % | |
| (1) Supplemental Information on the Ratios to Average Net Assets: | |
| Ratios Before Expense Limitation: | |
| Expenses to Average Net Assets | | | 1.09 | %†† | | | 1.51 | %+†† | | | 1.88 | %+ | | | 1.29 | %+ | | | 1.13 | %+ | |
| Net Investment Income (Loss) to Average Net Assets | | | (0.39 | )%†† | | | (0.79 | )%+†† | | | (1.01 | )%+ | | | (0.27 | )%+ | | | 0.03 | %+ | |
† Per share amount is based on average shares outstanding.
‡ Amount is less than $0.005 per share.
++ Calculated based on the net asset value as of the last business day of the period.
** Performance was positively impacted by approximately 2.12% due to the receipt of proceeds from the settlements of class action suits involving primarily one of the Portfolio's past holdings. This was a one-time settlement, and as a result, the impact on the NAV and consequently the performance will not likely be repeated in the future. Had these settlements not occurred, the total return for Class I would have been approximately 68.49%.
+ The Ratios of Expenses and Net Investment Income (Loss) reflect the rebate of certain Portfolio expenses in connection with the investments in Morgan Stanley affiliates during the period. The effect of the rebate on the ratios is disclosed in the above table as "Ratio of Rebate from Morgan Stanley Affiliates to Average Net Assets."
†† Reflects overall Portfolio ratios for investment income and non-class specific expenses.
§ Amount is less than 0.005%.
The accompanying notes are an integral part of the financial statements.
218
2011 Annual Report
December 31, 2011
Financial Highlights
Focus Growth Portfolio
| | | Class P | |
| | | Year Ended December 31, | |
| Selected Per Share Data and Ratios | | 2011 | | 2010 | | 2009 | | 2008 | | 2007 | |
| Net Asset Value, Beginning of Period | | $ | 19.00 | | | $ | 14.86 | | | $ | 8.73 | | | $ | 18.32 | | | $ | 14.81 | | |
| Income (Loss) from Investment Operations: | |
| Net Investment Loss† | | | (0.11 | ) | | | (0.08 | ) | | | (0.04 | ) | | | (0.04 | ) | | | (0.01 | ) | |
| Net Realized and Unrealized Gain (Loss) | | | (1.32 | ) | | | 4.22 | | | | 6.17 | | | | (9.55 | ) | | | 3.52 | | |
| Total from Investment Operations | | | (1.43 | ) | | | 4.14 | | | | 6.13 | | | | (9.59 | ) | | | 3.51 | | |
| Distributions from and/or in Excess of: | |
| Net Investment Income | | | — | | | | — | | | | — | | | | (0.00 | )‡ | | | — | | |
| Redemption Fees | | | — | | | | — | | | | — | | | | 0.00 | ‡ | | | 0.00 | ‡ | |
| Net Asset Value, End of Period | | $ | 17.57 | | | $ | 19.00 | | | $ | 14.86 | | | $ | 8.73 | | | $ | 18.32 | | |
| Total Return++ | | | (7.53 | )% | | | 27.86 | % | | | 70.02 | %** | | | (52.27 | )% | | | 23.70 | % | |
| Ratios and Supplemental Data: | |
| Net Assets, End of Period (Thousands) | | $ | 1,588 | | | $ | 1,704 | | | $ | 1,460 | | | $ | 1,069 | | | $ | 2,913 | | |
| Ratio of Expenses to Average Net Assets (1) | | | 1.24 | %+†† | | | 1.25 | %+†† | | | 1.24 | %+ | | | 1.25 | %+ | | | 1.25 | %+ | |
| Ratio of Expenses to Average Net Assets Excluding Non Operating Expenses | | | N/A | | | | 1.25 | %+†† | | | 1.24 | %+ | | | 1.25 | %+ | | | 1.25 | %+ | |
| Ratio of Net Investment Loss to Average Net Assets (1) | | | (0.54 | )%+†† | | | (0.53 | )%+†† | | | (0.38 | )%+ | | | (0.24 | )%+ | | | (0.07 | )%+ | |
| Ratio of Rebate from Morgan Stanley Affiliates to Average Net Assets | | | 0.01 | %†† | | | 0.00 | %††§ | | | 0.01 | % | | | 0.00 | %§ | | | 0.00 | %§ | |
| Portfolio Turnover Rate | | | 37 | % | | | 79 | % | | | 11 | % | | | 36 | % | | | 57 | % | |
| (1) Supplemental Information on the Ratios to Average Net Assets: | |
| Ratios Before Expense Limitation: | |
| Expenses to Average Net Assets | | | 1.34 | %†† | | | 1.76 | %+†† | | | 2.16 | %+ | | | 1.54 | %+ | | | 1.38 | %+ | |
| Net Investment Loss to Average Net Assets | | | (0.64 | )%†† | | | (1.04 | )%+†† | | | (1.30 | )%+ | | | (0.53 | )%+ | | | (0.20 | )%+ | |
† Per share amount is based on average shares outstanding.
‡ Amount is less than $0.005 per share.
++ Calculated based on the net asset value as of the last business day of the period.
** Performance was positively impacted by approximately 2.17% due to the receipt of proceeds from the settlements of class action suits involving primarily one of the Portfolio's past holdings. This was a one-time settlement, and as a result, the impact on the NAV and consequently the performance will not likely be repeated in the future. Had these settlements not occurred, the total return for Class P would have been approximately 67.85%.
+ The Ratios of Expenses and Net Investment Loss reflect the rebate of certain Portfolio expenses in connection with the investments in Morgan Stanley affiliates during the period. The effect of the rebate on the ratios is disclosed in the above table as "Ratio of Rebate from Morgan Stanley Affiliates to Average Net Assets."
†† Reflects overall Portfolio ratios for investment income and non-class specific expenses.
§ Amount is less than 0.005%.
The accompanying notes are an integral part of the financial statements.
219
2011 Annual Report
December 31, 2011
Financial Highlights
Growth Portfolio
| | | Class I | |
| | | Year Ended December 31, | |
| Selected Per Share Data and Ratios | | 2011 | | 2010 | | 2009 | | 2008 | | 2007 | |
| Net Asset Value, Beginning of Period | | $ | 24.24 | | | $ | 19.69 | | | $ | 12.12 | | | $ | 24.69 | | | $ | 20.28 | | |
| Income (Loss) from Investment Operations: | |
| Net Investment Income† | | | 0.01 | | | | 0.06 | | | | 0.05 | | | | 0.05 | | | | 0.10 | | |
| Net Realized and Unrealized Gain (Loss) | | | (0.73 | ) | | | 4.49 | | | | 7.58 | | | | (12.50 | ) | | | 4.41 | | |
| Total from Investment Operations | | | (0.72 | ) | | | 4.55 | | | | 7.63 | | | | (12.45 | ) | | | 4.51 | | |
| Distributions from and/or in Excess of: | |
| Net Investment Income | | | (0.06 | ) | | | (0.00 | )‡ | | | (0.06 | ) | | | (0.10 | ) | | | (0.10 | ) | |
| Net Realized Gain | | | — | | | | — | | | | — | | | | (0.02 | ) | | | — | | |
| Total Distributions | | | (0.06 | ) | | | (0.00 | )‡ | | | (0.06 | ) | | | (0.12 | ) | | | (0.10 | ) | |
| Redemption Fees | | | — | | | | — | | | | 0.00 | ‡ | | | 0.00 | ‡ | | | 0.00 | ‡ | |
| Net Asset Value, End of Period | | $ | 23.46 | | | $ | 24.24 | | | $ | 19.69 | | | $ | 12.12 | | | $ | 24.69 | | |
| Total Return++ | | | (3.01 | )% | | | 23.11 | % | | | 62.97 | %** | | | (50.47 | )% | | | 22.29 | % | |
| Ratios and Supplemental Data: | |
| Net Assets, End of Period (Thousands) | | $ | 622,193 | | | $ | 704,410 | | | $ | 674,070 | | | $ | 543,841 | | | $ | 1,406,866 | | |
| Ratio of Expenses to Average Net Assets | | | 0.71 | %+†† | | | 0.73 | %+†† | | | 0.65 | %+ | | | 0.62 | %+ | | | 0.62 | %+ | |
| Ratio of Expenses to Average Net Assets Excluding Non Operating Expenses | | | N/A | | | | 0.73 | %+†† | | | 0.65 | %+ | | | 0.62 | %+ | | | 0.62 | %+ | |
| Ratio of Net Investment Income to Average Net Assets | | | 0.05 | %+†† | | | 0.27 | %+†† | | | 0.35 | %+ | | | 0.24 | %+ | | | 0.46 | %+ | |
| Ratio of Rebate from Morgan Stanley Affiliates to Average Net Assets | | | 0.00 | %††§ | | | 0.00 | %††§ | | | 0.00 | %§ | | | 0.00 | %§ | | | 0.00 | %§ | |
| Portfolio Turnover Rate | | | 26 | % | | | 35 | % | | | 19 | % | | | 42 | % | | | 50 | % | |
† Per share amount is based on average shares outstanding.
‡ Amount is less than $0.005 per share.
++ Calculated based on the net asset value as of the last business day of the period.
** Performance was positively impacted by approximately 0.25% due to the receipt of proceeds from the settlements of class action suits involving primarily two of the Portfolio's past holdings. This was a one-time settlement, and as a result, the impact on the NAV and consequently the performance will not likely be repeated in the future. Had these settlements not occurred, the total return for Class I shares would have been approximately 62.72%.
+ The Ratios of Expenses and Net Investment Income reflect the rebate of certain Portfolio expenses in connection with the investments in Morgan Stanley affiliates during the period. The effect of the rebate on the ratios is disclosed in the above table as "Ratio of Rebate from Morgan Stanley Affiliates to Average Net Assets."
†† Reflects overall Portfolio ratios for investment income and non-class specific expenses.
§ Amount is less than 0.005%.
The accompanying notes are an integral part of the financial statements.
220
2011 Annual Report
December 31, 2011
Financial Highlights
Growth Portfolio
| | | Class P | |
| | | Year Ended December 31, | |
| Selected Per Share Data and Ratios | | 2011 | | 2010 | | 2009 | | 2008 | | 2007 | |
| Net Asset Value, Beginning of Period | | $ | 23.82 | | | $ | 19.40 | | | $ | 11.94 | | | $ | 24.27 | | | $ | 19.95 | | |
| Income (Loss) from Investment Operations: | |
| Net Investment Income (Loss)† | | | (0.05 | ) | | | 0.00 | ‡ | | | 0.02 | | | | 0.00 | ‡ | | | 0.05 | | |
| Net Realized and Unrealized Gain (Loss) | | | (0.73 | ) | | | 4.42 | | | | 7.46 | | | | (12.27 | ) | | | 4.33 | | |
| Total from Investment Operations | | | (0.78 | ) | | | 4.42 | | | | 7.48 | | | | (12.27 | ) | | | 4.38 | | |
| Distributions from and/or in Excess of: | |
| Net Investment Income | | | (0.01 | ) | | | (0.00 | )‡ | | | (0.02 | ) | | | (0.04 | ) | | | (0.06 | ) | |
| Net Realized Gain | | | — | | | | — | | | | — | | | | (0.02 | ) | | | — | | |
| Total Distributions | | | (0.01 | ) | | | (0.00 | )‡ | | | (0.02 | ) | | | (0.06 | ) | | | (0.06 | ) | |
| Redemption Fees | | | — | | | | — | | | | 0.00 | ‡ | | | 0.00 | ‡ | | | 0.00 | ‡ | |
| Net Asset Value, End of Period | | $ | 23.03 | | | $ | 23.82 | | | $ | 19.40 | | | $ | 11.94 | | | $ | 24.27 | | |
| Total Return++ | | | (3.27 | )% | | | 22.79 | % | | | 62.66 | %** | | | (50.57 | )% | | | 21.93 | % | |
| Ratios and Supplemental Data: | |
| Net Assets, End of Period (Thousands) | | $ | 135,777 | | | $ | 136,585 | | | $ | 99,475 | | | $ | 59,883 | | | $ | 166,717 | | |
| Ratio of Expenses to Average Net Assets | | | 0.96 | %+†† | | | 0.98 | %+†† | | | 0.90 | %+ | | | 0.87 | %+ | | | 0.87 | %+ | |
| Ratio of Expenses to Average Net Assets Excluding Non Operating Expenses | | | N/A | | | | 0.98 | %+†† | | | 0.90 | %+ | | | 0.87 | %+ | | | 0.87 | %+ | |
| Ratio of Net Investment Income (Loss) to Average Net Assets | | | (0.20 | )%+†† | | | 0.02 | %+†† | | | 0.10 | %+ | | | (0.01 | )%+ | | | 0.24 | %+ | |
| Ratio of Rebate from Morgan Stanley Affiliates to Average Net Assets | | | 0.00 | %††§ | | | 0.00 | %††§ | | | 0.00 | %§ | | | 0.00 | %§ | | | 0.00 | %§ | |
| Portfolio Turnover Rate | | | 26 | % | | | 35 | % | | | 19 | % | | | 42 | % | | | 50 | % | |
† Per share amount is based on average shares outstanding.
‡ Amount is less than $0.005 per share.
++ Calculated based on the net asset value as of the last business day of the period.
** Performance was positively impacted by approximately 0.25% due to the receipt of proceeds from the settlements of class action suits involving primarily two of the Portfolio's past holdings. This was a one-time settlement, and as a result, the impact on the NAV and consequently the performance will not likely be repeated in the future. Had these settlements not occurred, the total return for Class P shares would have been approximately 62.41%.
+ The Ratios of Expenses and Net Investment Income (Loss) reflect the rebate of certain Portfolio expenses in connection with the investments in Morgan Stanley affiliates during the period. The effect of the rebate on the ratios is disclosed in the above table as "Ratio of Rebate from Morgan Stanley Affiliates to Average Net Assets."
†† Reflects overall Portfolio ratios for investment income and non-class specific expenses.
§ Amount is less than 0.005%.
The accompanying notes are an integral part of the financial statements.
221
2011 Annual Report
December 31, 2011
Financial Highlights
Insight Portfolio
| | | Class I | |
| Selected Per Share Data and Ratios | | Period from
December 28,
2011^ to
December 31,
2011 | |
| Net Asset Value, Beginning of Period | | $ | 10.00 | | |
| Income (Loss) from Investment Operations: | |
| Net Investment Loss† | | | (0.00 | )‡ | |
| Net Realized and Unrealized Gain | | | 0.06 | | |
| Total from Investment Operations | | | 0.06 | | |
| Net Asset Value, End of Period | | $ | 10.06 | | |
| Total Return++ | | | 0.60 | %# | |
| Ratios and Supplemental Data:†† | |
| Net Assets, End of Period (Thousands) | | $ | 10 | | |
| Ratio of Expenses to Average Net Assets (1) | | | 1.05 | %* | |
| Ratio of Net Investment Loss to Average Net Assets (1) | | | (0.94 | )%* | |
| Portfolio Turnover Rate | | | 0.00 | %# | |
| (1) Supplemental Information on the Ratios to Average Net Assets:†† | |
| Ratios Before Expense Limitation: | |
| Expenses to Average Net Assets | | | 380.17 | %* | |
| Net Investment Loss to Average Net Assets | | | (380.06 | )%* | |
^ Commencement of Operations.
† Per share amount is based on average shares outstanding.
‡ Amount is less than $0.005 per share.
++ Calculated based on the net asset value as of the last business day of the period.
†† Reflects overall Portfolio ratios for investment income and non-class specific expenses.
# Not Annualized.
* Annualized.
The accompanying notes are an integral part of the financial statements.
222
2011 Annual Report
December 31, 2011
Financial Highlights
Insight Portfolio
| | | Class H | |
| Selected Per Share Data and Ratios | | Period from
December 28,
2011^ to
December 31,
2011 | |
| Net Asset Value, Beginning of Period | | $ | 10.00 | | |
| Income (Loss) from Investment Operations: | |
| Net Investment Loss† | | | (0.00 | )‡ | |
| Net Realized and Unrealized Gain | | | 0.06 | | |
| Total from Investment Operations | | | 0.06 | | |
| Net Asset Value, End of Period | | $ | 10.06 | | |
| Total Return++ | | | 0.60 | %# | |
| Ratios and Supplemental Data:†† | |
| Net Assets, End of Period (Thousands) | | $ | 815 | | |
| Ratio of Expenses to Average Net Assets (1) | | | 1.30 | %* | |
| Ratio of Net Investment Loss to Average Net Assets (1) | | | (1.19 | )%* | |
| Portfolio Turnover Rate | | | 0.00 | %# | |
| (1) Supplemental Information on the Ratios to Average Net Assets:†† | |
| Ratios Before Expense Limitation: | |
| Expense to Average Net Assets | | | 380.42 | %* | |
| Net Investment Loss to Average Net Assets | | | (380.31 | )%* | |
^ Commencement of Operations.
† Per share amount is based on average shares outstanding.
‡ Amount is less than $0.005 per share.
++ Calculated based on the net asset value which does not reflect sales charges, if applicable, as of the last business day of the period.
†† Reflects overall Portfolio ratios for investment income and non-class specific expenses.
# Not Annualized.
* Annualized.
The accompanying notes are an integral part of the financial statements.
223
2011 Annual Report
December 31, 2011
Financial Highlights
Insight Portfolio
| | | Class L | |
| Selected Per Share Data and Ratios | | Period from
December 28,
2011^ to
December 31,
2011 | |
| Net Asset Value, Beginning of Period | | $ | 10.00 | | |
| Income (Loss) from Investment Operations: | |
| Net Investment Loss† | | | (0.00 | )‡ | |
| Net Realized and Unrealized Gain | | | 0.06 | | |
| Total from Investment Operations | | | 0.06 | | |
| Net Asset Value, End of Period | | $ | 10.06 | | |
| Total Return++ | | | 0.60 | %# | |
| Ratios and Supplemental Data:†† | |
| Net Assets, End of Period (Thousands) | | $ | 10 | | |
| Ratio of Expenses to Average Net Assets (1) | | | 1.80 | %* | |
| Ratio of Net Investment Loss to Average Net Assets (1) | | | (1.70 | )%* | |
| Portfolio Turnover Rate | | | 0.00 | %# | |
| (1) Supplemental Information on the Ratios to Average Net Assets:†† | |
| Ratios Before Expense Limitation: | |
| Expenses to Average Net Assets | | | 380.92 | %* | |
| Net Investment Loss to Average Net Assets | | | (380.82 | )%* | |
^ Commencement of Operations.
† Per share amount is based on average shares outstanding.
‡ Amount is less than $0.005 per share.
++ Calculated based on the net asset value as of the last business day of the period.
†† Reflects overall Portfolio ratios for investment income and non-class specific expenses.
# Not Annualized.
* Annualized.
The accompanying notes are an integral part of the financial statements.
224
2011 Annual Report
December 31, 2011
Financial Highlights
Opportunity Portfolio
| | | Class I* | |
| | | Year Ended
December 31, | | Period from
July 1,
2010 to
December 31, | | Year Ended June 30, | |
| Selected Per Share Data and Ratios | | 2011 | | 2010 | | 2010 | | 2009^^ | | 2008^^ | | 2007^^ | |
| Net Asset Value, Beginning of Period | | $ | 15.23 | | | $ | 11.91 | | | $ | 9.59 | | | $ | 12.21 | | | $ | 13.05 | | | $ | 10.77 | | |
| Income (Loss) from Investment Operations: | |
| Net Investment Income (Loss)† | | | 0.00 | ‡ | | | 0.02 | | | | (0.02 | ) | | | 0.02 | | | | 0.01 | | | | (0.02 | ) | |
| Net Realized and Unrealized Gain (Loss) | | | (0.07 | ) | | | 3.30 | | | | 2.34 | | | | (2.64 | ) | | | (0.85 | ) | | | 2.30 | | |
| Total from Investment Operations | | | (0.07 | ) | | | 3.32 | | | | 2.32 | | | | (2.62 | ) | | | (0.84 | ) | | | 2.28 | | |
| Net Asset Value, End of Period | | $ | 15.16 | | | $ | 15.23 | | | $ | 11.91 | | | $ | 9.59 | | | $ | 12.21 | | | $ | 13.05 | | |
| Total Return++ | | | (0.46 | )% | | | 27.88 | %# | | | 24.19 | % | | | (21.52 | )% | | | (6.36 | )% | | | 21.17 | % | |
| Ratios and Supplemental Data: | |
| Net Assets, End of Period (Millions) | | $ | 13.2 | | | $ | 13.0 | | | $ | 11.0 | | | $ | 7.5 | | | $ | 1.6 | | | $ | 1.3 | | |
| Ratio of Expenses to Average Net Assets (1) | | | 0.88 | %+†† | | | 0.72 | %+††@ | | | 1.14 | % | | | 0.91 | % | | | 0.87 | % | | | 0.98 | % | |
| Ratio of Expenses to Average Net Assets Excluding Non Operating Expenses | | | N/A | | | | 0.90 | %+††@ | | | 0.96 | % | | | N/A | | | | N/A | | | | N/A | | |
| Ratio of Net Investment Income (Loss) to Average Net Assets (1) | | | 0.01 | %+†† | | | 0.25 | %+††@ | | | (0.14 | )% | | | 0.21 | % | | | 0.10 | % | | | (0.14 | )% | |
| Ratio of Rebate from Morgan Stanley Affiliates to Average Net Assets | | | 0.00 | %††§ | | | 0.00 | %††§@ | | | N/A | | | | N/A | | | | N/A | | | | N/A | | |
| Portfolio Turnover Rate | | | 21 | % | | | 6 | %# | | | 12 | % | | | 33 | % | | | 45 | % | | | 46 | % | |
| (1) Supplemental Information on the Ratios to Average Net Assets: | |
| Ratios Before Expense Limitation: | |
| Expenses to Average Net Assets | | | 0.95 | %†† | | | N/A | | | | N/A | | | | 1.41 | % | | | N/A | | | | N/A | | |
| Net Investment Loss to Average Net Assets | | | (0.06 | )%†† | | | N/A | | | | N/A | | | | (0.29 | )% | | | N/A | | | | N/A | | |
* On May 21, 2010, the Portfolio acquired substantially all of the assets and liabilities of the Van Kampen Equity Growth Fund ("the Predecessor Fund"). Therefore, the per share data and ratios of Class I shares for the 12-month period ended June 30, 2010 and prior years reflect the historical per share data of Class I shares of the Predecessor Fund.
^^ Beginning the year ended June 30, 2010, the Portfolio was audited by Ernst & Young LLP. The previous years were audited by another independent registered public accounting firm.
† Per share amount is based on average shares outstanding.
‡ Amount is less than $0.005 per share.
++ Calculated based on the net asset value as of the last business day of the period.
+ The Ratios of Expenses and Net Investment Income (Loss) reflect the rebate of certain Portfolio expenses in connection with the investments in Morgan Stanley affiliates during the period. The effect of the rebate on the ratios is disclosed in the above table as "Ratio of Rebate from Morgan Stanley Affiliates to Average Net Assets."
†† Reflects overall Portfolio ratios for investment income and non-class specific expenses.
§ Amount is less than 0.005%.
# Not Annualized.
@ Annualized.
The accompanying notes are an integral part of the financial statements.
225
2011 Annual Report
December 31, 2011
Financial Highlights
Opportunity Portfolio
| | | Class P | |
| Selected Per Share Data and Ratios | | Year Ended
December 31,
2011 | | Period from
July 1,
2010 to
December 31,
2010 | | Period from
May 21,
2010^ to
June 30,
2010 | |
| Net Asset Value, Beginning of Period | | $ | 15.19 | | | $ | 11.89 | | | $ | 12.13 | | |
| Income (Loss) from Investment Operations: | |
| Net Investment Income (Loss)† | | | (0.04 | ) | | | 0.00 | ‡ | | | (0.01 | ) | |
| Net Realized and Unrealized Gain (Loss) | | | (0.07 | ) | | | 3.30 | | | | (0.23 | ) | |
| Total from Investment Operations | | | (0.11 | ) | | | 3.30 | | | | (0.24 | ) | |
| Net Asset Value, End of Period | | $ | 15.08 | | | $ | 15.19 | | | $ | 11.89 | | |
| Total Return++ | | | (0.72 | )% | | | 27.75 | %# | | | (1.98 | )%# | |
| Ratios and Supplemental Data:†† | |
| Net Assets, End of Period (Thousands) | | $ | 2,098 | | | $ | 2,113 | | | $ | 1 | | |
| Ratio of Expenses to Average Net Assets (1) | | | 1.13 | %+ | | | 0.97 | %+* | | | 1.39 | %* | |
| Ratio of Expenses to Average Net Assets Excluding Non Operating Expenses | | | N/A | | | | 1.15 | %+* | | | N/A | | |
| Ratio of Net Investment Income (Loss) to Average Net Assets (1) | | | (0.24 | )%+ | | | 0.00 | %§+* | | | (0.71 | )%* | |
| Ratio of Rebate from Morgan Stanley Affiliates to Average Net Assets | | | 0.00 | %§ | | | 0.00 | %§* | | | N/A | | |
| Portfolio Turnover Rate | | | 21 | % | | | 6 | %# | | | 12 | %# | |
| (1) Supplemental Information on the Ratios to Average Net Assets: | |
| Ratios Before Expense Limitation: | |
| Expenses to Average Net Assets | | | 1.20 | %†† | | | N/A | | | | N/A | | |
| Net Investment Loss to Average Net Assets | | | (0.31 | )%†† | | | N/A | | | | N/A | | |
^ Commencement of Operations.
† Per share amount is based on average shares outstanding.
‡ Amount is less than $0.005 per share.
++ Calculated based on the net asset value as of the last business day of the period.
†† Reflects overall Portfolio ratios for investment income and non-class specific expenses.
+ The Ratios of Expenses and Net Investment Income (Loss) reflect the rebate of certain Portfolio expenses in connection with the investments in Morgan Stanley affiliates during the period. The effect of the rebate on the ratios is disclosed in the above table as "Ratio of Rebate from Morgan Stanley Affiliates to Average Net Assets."
§ Amount is less than 0.005%.
# Not Annualized.
* Annualized.
The accompanying notes are an integral part of the financial statements.
226
2011 Annual Report
December 31, 2011
Financial Highlights
Opportunity Portfolio
| | | Class H* | |
| | | Year Ended
December 31, | | Period from
July 1,
2010 to
December 31, | | Year Ended June 30, | |
| Selected Per Share Data and Ratios | | 2011 | | 2010 | | 2010 | | 2009^^ | | 2008^^ | | 2007^^ | |
| Net Asset Value, Beginning of Period | | $ | 15.02 | | | $ | 11.76 | | | $ | 9.49 | | | $ | 12.13 | | | $ | 12.99 | | | $ | 10.75 | | |
| Income (Loss) from Investment Operations: | |
| Net Investment Income (Loss)† | | | (0.04 | ) | | | 0.00 | ‡ | | | (0.06 | ) | | | (0.01 | ) | | | (0.02 | ) | | | (0.05 | ) | |
| Net Realized and Unrealized Gain (Loss) | | | (0.07 | ) | | | 3.26 | | | | 2.33 | | | | (2.63 | ) | | | (0.84 | ) | | | 2.29 | | |
| Total from Investment Operations | | | (0.11 | ) | | | 3.26 | | | | 2.27 | | | | (2.64 | ) | | | (0.86 | ) | | | 2.24 | | |
| Net Asset Value, End of Period | | $ | 14.91 | | | $ | 15.02 | | | $ | 11.76 | | | $ | 9.49 | | | $ | 12.13 | | | $ | 12.99 | | |
| Total Return++ | | | (0.73 | )% | | | 27.72 | %# | | | 23.92 | % | | | (21.83 | )% | | | (6.54 | )% | | | 20.84 | % | |
| Ratios and Supplemental Data: | |
| Net Assets, End of Period (Millions) | | $ | 198.0 | | | $ | 241.0 | | | $ | 220.3 | | | $ | 207.8 | | | $ | 245.5 | | | $ | 194.4 | | |
| Ratio of Expenses to Average Net Assets (1) | | | 1.13 | %+†† | | | 0.97 | %+††@ | | | 1.40 | % | | | 1.14 | % | | | 1.13 | % | | | 1.23 | % | |
| Ratio of Expenses to Average Net Assets Excluding Non Operating Expenses | | | N/A | | | | 1.15 | %+††@ | | | 1.22 | % | | | N/A | | | | N/A | | | | N/A | | |
| Ratio of Net Investment Income (Loss) to Average Net Assets (1) | | | (0.24 | )%+†† | | | 0.00 | %+††§@ | | | (0.46 | )% | | | (0.13 | )% | | | (0.17 | )% | | | (0.43 | )% | |
| Rebate from Morgan Stanley Affiliates to Average Net Assets | | | 0.00 | %††§ | | | 0.00 | %††§@ | | | N/A | | | | N/A | | | | N/A | | | | N/A | | |
| Portfolio Turnover Rate | | | 21 | % | | | 6 | %# | | | 12 | % | | | 33 | % | | | 45 | % | | | 46 | % | |
| (1) Supplemental Information on the Ratios to Average Net Assets: | |
| Ratios Before Expense Limitation: | |
| Expense to Average Net Assets | | | 1.20 | %†† | | | N/A | | | | N/A | | | | 1.49 | % | | | N/A | | | | N/A | | |
| Net Investment Loss to Average Net Assets | | | (0.31 | )%†† | | | N/A | | | | N/A | | | | (0.48 | )% | | | N/A | | | | N/A | | |
* On May 21, 2010, the Portfolio acquired substantially all of the assets and liabilities of the Van Kampen Equity Growth Fund ("the Predecessor Fund"). Therefore, the per share data and ratios of Class H shares for the 12-month period ended June 30, 2010 and prior years reflect the historical per share data of Class A shares of the Predecessor Fund.
^^ Beginning the year ended June 30, 2010, the Portfolio was audited by Ernst & Young LLP. The previous years were audited by another independent registered public accounting firm.
† Per share amount is based on average shares outstanding.
‡ Amount is less than $0.005 per share.
++ Calculated based on the net asset value which does not reflect sales charges, if applicable, as of the last business day of the period.
+ The Ratios of Expenses and Net Investment Income (Loss) reflect the rebate of certain Portfolio expenses in connection with the investments in Morgan Stanley affiliates during the period. The effect of the rebate on the ratios is disclosed in the above table as "Ratio of Rebate from Morgan Stanley Affiliates to Average Net Assets."
†† Reflects overall Portfolio ratios for investment income and non-class specific expenses.
§ Amount is less than 0.005%.
# Not Annualized.
@ Annualized.
The accompanying notes are an integral part of the financial statements.
227
2011 Annual Report
December 31, 2011
Financial Highlights
Opportunity Portfolio
| | | Class L* | |
| | | Year Ended
December 31, | | Period from
July 1,
2010 to
December 31, | | Year Ended June 30, | |
| Selected Per Share Data and Ratios | | 2011 | | 2010 | | 2010 | | 2009^^ | | 2008^^ | | 2007^^ | |
| Net Asset Value, Beginning of Period | | $ | 13.73 | | | $ | 10.78 | | | $ | 8.77 | | | $ | 11.28 | | | $ | 12.18 | | | $ | 10.15 | | |
| Income (Loss) from Investment Operations: | |
| Net Investment Loss† | | | (0.10 | ) | | | (0.03 | ) | | | (0.13 | ) | | | (0.07 | ) | | | (0.12 | ) | | | (0.13 | ) | |
| Net Realized and Unrealized Gain (Loss) | | | (0.06 | ) | | | 2.98 | | | | 2.14 | | | | (2.44 | ) | | | (0.78 | ) | | | 2.16 | | |
| Total from Investment Operations | | | (0.16 | ) | | | 2.95 | | | | 2.01 | | | | (2.51 | ) | | | (0.90 | ) | | | 2.03 | | |
| Net Asset Value, End of Period | | $ | 13.57 | | | $ | 13.73 | | | $ | 10.78 | | | $ | 8.77 | | | $ | 11.28 | | | $ | 12.18 | | |
| Total Return++ | | | (1.17 | )% | | | 27.37 | %# | | | 22.92 | % | | | (22.32 | )% | | | (7.31 | )% | | | 20.00 | % | |
| Ratios and Supplemental Data: | |
| Net Assets, End of Period (Millions) | | $ | 30.8 | | | $ | 39.0 | | | $ | 34.8 | | | $ | 28.6 | | | $ | 41.8 | | | $ | 28.4 | | |
| Ratio of Expenses to Average Net Assets (1) | | | 1.63 | %+†† | | | 1.47 | %+††@ | | | 2.12 | % | | | 1.89 | % | | | 1.89 | % | | | 1.99 | % | |
| Ratio of Expenses to Average Net Assets Excluding Non Operating Expenses | | | N/A | | | | 1.65 | %+††@ | | | 1.94 | % | | | N/A | | | | N/A | | | | N/A | | |
| Ratio of Net Investment Loss to Average Net Assets (1) | | | (0.74 | )%+†† | | | (0.50 | )%+††@ | | | (1.16 | )% | | | (0.90 | )% | | | (0.94 | )% | | | (1.19 | )% | |
| Ratio of Rebate from Morgan Stanley Affiliates to Average Net Assets | | | 0.00 | %††§ | | | 0.00 | %††§@ | | | N/A | | | | N/A | | | | N/A | | | | N/A | | |
| Portfolio Turnover Rate | | | 21 | % | | | 6 | %# | | | 12 | % | | | 33 | % | | | 45 | % | | | 46 | % | |
| (1) Supplemental Information on the Ratios to Average Net Assets: | |
| Ratios Before Expense Limitation: | |
| Expenses to Average Net Assets | | | 1.70 | %†† | | | N/A | | | | N/A | | | | 2.24 | % | | | N/A | | | | N/A | | |
| Net Investment Loss to Average Net Assets | | | (0.81 | )%†† | | | N/A | | | | N/A | | | | (1.25 | )% | | | N/A | | | | N/A | | |
* On May 21, 2010, the Portfolio acquired substantially all of the assets and liabilities of the Van Kampen Equity Growth Fund ("the Predecessor Fund"). Therefore, the per share data and ratios of Class L shares for the 12-month period ended June 30, 2010 and prior years reflect the historical per share data of Class C shares of the Predecessor Fund.
^^ Beginning the year ended June 30, 2010, the Portfolio was audited by Ernst & Young LLP. The previous years were audited by another independent registered public accounting firm.
† Per share amount is based on average shares outstanding.
++ Calculated based on the net asset value as of the last business day of the period.
+ The Ratios of Expenses and Net Investment Loss reflect the rebate of certain Portfolio expenses in connection with the investments in Morgan Stanley affiliates during the period. The effect of the rebate on the ratios is disclosed in the above table as "Ratio of Rebate from Morgan Stanley Affiliates to Average Net Assets."
†† Reflects overall Portfolio ratios for investment income and non-class specific expenses.
§ Amount is less than 0.005%.
# Not Annualized.
@ Annualized.
The accompanying notes are an integral part of the financial statements.
228
2011 Annual Report
December 31, 2011
Financial Highlights
Small Company Growth Portfolio
| | | Class I | |
| | | Year Ended December 31, | |
| Selected Per Share Data and Ratios | | 2011 | | 2010 | | 2009 | | 2008 | | 2007 | |
| Net Asset Value, Beginning of Period | | $ | 14.17 | | | $ | 11.14 | | | $ | 7.64 | | | $ | 13.12 | | | $ | 13.31 | | |
| Income (Loss) from Investment Operations: | |
| Net Investment Income (Loss)† | | | (0.04 | ) | | | 0.01 | | | | (0.03 | ) | | | (0.01 | ) | | | (0.05 | ) | |
| Net Realized and Unrealized Gain (Loss) | | | (1.25 | ) | | | 3.02 | | | | 3.68 | | | | (5.47 | ) | | | 0.45 | | |
| Total from Investment Operations | | | (1.29 | ) | | | 3.03 | | | | 3.65 | | | | (5.48 | ) | | | 0.40 | | |
| Distributions from and/or in Excess of: | |
| Net Investment Income | | | — | | | | — | | | | (0.01 | ) | | | — | | | | — | | |
| Net Realized Gain | | | (0.24 | ) | | | — | | | | (0.14 | ) | | | — | | | | (0.59 | ) | |
| Total Distributions | | | (0.24 | ) | | | — | | | | (0.15 | ) | | | — | | | | (0.59 | ) | |
| Redemption Fees | | | 0.00 | ‡ | | | 0.00 | ‡ | | | 0.00 | ‡ | | | 0.00 | ‡ | | | 0.00 | ‡ | |
| Net Asset Value, End of Period | | $ | 12.64 | | | $ | 14.17 | | | $ | 11.14 | | | $ | 7.64 | | | $ | 13.12 | | |
| Total Return++ | | | (9.12 | )% | | | 27.20 | % | | | 47.92 | % | | | (41.84 | )% | | | 3.04 | % | |
| Ratios and Supplemental Data: | |
| Net Assets, End of Period (Thousands) | | $ | 1,074,392 | | | $ | 1,227,782 | | | $ | 977,515 | | | $ | 638,559 | | | $ | 1,137,839 | | |
| Ratio of Expenses to Average Net Assets (1) | | | 1.05 | %+ | | | 1.05 | %+†† | | | 1.05 | %+ | | | 1.02 | %+ | | | 1.01 | %+ | |
| Ratio of Expenses to Average Net Assets Excluding Non Operating Expenses | | | 1.05 | %+ | | | 1.05 | %+†† | | | 1.05 | %+ | | | 1.02 | %+ | | | 1.01 | %+ | |
| Ratio of Net Investment Income (Loss) to Average Net Assets (1) | | | (0.29 | )%+ | | | 0.10 | %+†† | | | (0.28 | )%+ | | | (0.08 | )%+ | | | (0.35 | )%+ | |
| Ratio of Rebate from Morgan Stanley Affiliates to Average Net Assets | | | 0.00 | %§ | | | 0.00 | %††§ | | | 0.00 | %§ | | | 0.00 | %§ | | | 0.00 | %§ | |
| Portfolio Turnover Rate | | | 26 | % | | | 26 | % | | | 27 | % | | | 34 | % | | | 50 | % | |
| (1) Supplemental Information on the Ratios to Average Net Assets: | |
| Ratios Before Expense Limitation: | |
| Expenses to Average Net Assets | | | 1.10 | % | | | 1.12 | %+†† | | | 1.07 | %+ | | | 1.05 | %+ | | | N/A | | |
| Net Investment Income (Loss) to Average Net Assets | | | (0.34 | )% | | | 0.03 | %+†† | | | (0.30 | )%+ | | | (0.11 | )%+ | | | N/A | | |
† Per share amount is based on average shares outstanding.
‡ Amount is less than $0.005 per share.
++ Calculated based on the net asset value as of the last business day of the period.
+ The Ratios of Expenses and Net Investment Income (Loss) reflect the rebate of certain Portfolio expenses in connection with the investments in Morgan Stanley affiliates during the period. The effect of the rebate on the ratios is disclosed in the above table as "Ratio of Rebate from Morgan Stanley Affiliates to Average Net Assets."
†† Reflects overall Portfolio ratios for investment income and non-class specific expenses.
§ Amount is less than 0.005%.
The accompanying notes are an integral part of the financial statements.
229
2011 Annual Report
December 31, 2011
Financial Highlights
Small Company Growth Portfolio
| | | Class P | |
| | | Year Ended December 31, | |
| Selected Per Share Data and Ratios | | 2011 | | 2010 | | 2009 | | 2008 | | 2007 | |
| Net Asset Value, Beginning of Period | | $ | 13.27 | | | $ | 10.46 | | | $ | 7.19 | | | $ | 12.39 | | | $ | 12.63 | | |
| Income (Loss) from Investment Operations: | |
| Net Investment Loss† | | | (0.07 | ) | | | (0.02 | ) | | | (0.05 | ) | | | (0.03 | ) | | | (0.08 | ) | |
| Net Realized and Unrealized Gain (Loss) | | | (1.16 | ) | | | 2.83 | | | | 3.46 | | | | (5.17 | ) | | | 0.43 | | |
| Total from Investment Operations | | | (1.23 | ) | | | 2.81 | | | | 3.41 | | | | (5.20 | ) | | | 0.35 | | |
| Distributions from and/or in Excess of: | |
| Net Realized Gain | | | (0.24 | ) | | | — | | | | (0.14 | ) | | | — | | | | (0.59 | ) | |
| Redemption Fees | | | 0.00 | ‡ | | | 0.00 | ‡ | | | 0.00 | ‡ | | | 0.00 | ‡ | | | 0.00 | ‡ | |
| Net Asset Value, End of Period | | $ | 11.80 | | | $ | 13.27 | | | $ | 10.46 | | | $ | 7.19 | | | $ | 12.39 | | |
| Total Return++ | | | (9.28 | )% | | | 26.86 | % | | | 47.41 | % | | | (41.97 | )% | | | 2.81 | % | |
| Ratios and Supplemental Data: | |
| Net Assets, End of Period (Thousands) | | $ | 282,988 | | | $ | 530,123 | | | $ | 536,329 | | | $ | 345,302 | | | $ | 698,183 | | |
| Ratio of Expenses to Average Net Assets (1) | | | 1.30 | %+ | | | 1.30 | %+†† | | | 1.30 | %+ | | | 1.27 | %+ | | | 1.26 | %+ | |
| Ratio of Expenses to Average Net Assets Excluding Non Operating Expenses | | | 1.30 | %+ | | | 1.30 | %+†† | | | 1.30 | %+ | | | 1.27 | %+ | | | 1.26 | %+ | |
| Ratio of Net Investment Loss to Average Net Assets (1) | | | (0.54 | )%+ | | | (0.15 | )%+†† | | | (0.53 | )%+ | | | (0.34 | )%+ | | | (0.61 | )%+ | |
| Ratio of Rebate from Morgan Stanley Affiliates to Average Net Assets | | | 0.00 | %§ | | | 0.00 | %††§ | | | 0.00 | %§ | | | 0.00 | %§ | | | 0.00 | %§ | |
| Portfolio Turnover Rate | | | 26 | % | | | 26 | % | | | 27 | % | | | 34 | % | | | 50 | % | |
| (1) Supplemental Information on the Ratios to Average Net Assets: | |
| Ratios Before Expense Limitation: | |
| Expenses to Average Net Assets | | | 1.35 | % | | | 1.37 | %+†† | | | 1.32 | %+ | | | 1.30 | %+ | | | N/A | | |
| Net Investment Loss to Average Net Assets | | | (0.59 | )% | | | (0.22 | )%+†† | | | (0.55 | )%+ | | | (0.37 | )%+ | | | N/A | | |
† Per share amount is based on average shares outstanding.
‡ Amount is less than $0.005 per share.
++ Calculated based on the net asset value as of the last business day of the period.
+ The Ratios of Expenses and Net Investment Loss reflect the rebate of certain Portfolio expenses in connection with the investments in Morgan Stanley affiliates during the period. The effect of the rebate on the ratios is disclosed in the above table as "Ratio of Rebate from Morgan Stanley Affiliates to Average Net Assets."
†† Reflects overall Portfolio ratios for investment income and non-class specific expenses.
§ Amount is less than 0.005%.
The accompanying notes are an integral part of the financial statements.
230
2011 Annual Report
December 31, 2011
Financial Highlights
Small Company Growth Portfolio
| | | Class H | |
| Selected Per Share Data and Ratios | | Period from
November 11,
2011^ to
December 31,
2011 | |
| Net Asset Value, Beginning of Period | | $ | 12.47 | | |
| Loss from Investment Operations: | |
| Net Investment Loss† | | | (0.00 | )‡ | |
| Net Realized and Unrealized Loss | | | (0.43 | ) | |
| Total from Investment Operations | | | (0.43 | ) | |
| Distributions from and/or in Excess of: | |
| Net Realized Gain | | | (0.24 | ) | |
| Redemption Fees | | | 0.00 | ‡ | |
| Net Asset Value, End of Period | | $ | 11.80 | | |
| Total Return++ | | | (3.46 | )%# | |
| Ratios and Supplemental Data: | |
| Net Assets, End of Period (Thousands) | | $ | 32,006 | | |
| Ratio of Expenses to Average Net Assets (1) | | | 1.30 | %+* | |
| Ratio of Net Investment Loss to Average Net Assets (1) | | | (0.26 | )%+* | |
| Ratio of Rebate from Morgan Stanley Affiliates to Average Net Assets | | | 0.00 | %§* | |
| Portfolio Turnover Rate | | | 26 | %* | |
| (1) Supplemental Information on the Ratios to Average Net Assets: | |
| Ratios Before Expense Limitation: | |
| Expenses to Average Net Assets | | | 1.35 | %* | |
| Net Investment Loss to Average Net Assets | | | (0.31 | )%* | |
^ Commencement of Operations
† Per share amount is based on average shares outstanding.
‡ Amount is less than $0.005 per share.
++ Calculated based on the net asset value which does not reflect sales charges, if applicable, as of the last business day of the period.
+ The Ratios of Expenses and Net Investment Loss reflect the rebate of certain Portfolio expenses in connection with the investments in Morgan Stanley affiliates during the period. The effect of the rebate on the ratios is disclosed in the above table as "Ratio of Rebate from Morgan Stanley Affiliates to Average Net Assets."
§ Amount is less than 0.005%.
# Not Annualized.
* Annualized.
The accompanying notes are an integral part of the financial statements.
231
2011 Annual Report
December 31, 2011
Financial Highlights
Small Company Growth Portfolio
| | | Class L | |
| Selected Per Share Data and Ratios | | Period from
November 11,
2011^ to
December 31,
2011 | |
| Net Asset Value, Beginning of Period | | $ | 12.47 | | |
| Loss from Investment Operations: | |
| Net Investment Loss† | | | (0.01 | ) | |
| Net Realized and Unrealized Loss | | | (0.43 | ) | |
| Total from Investment Operations | | | (0.44 | ) | |
| Distributions from and/or in Excess of: | |
| Net Realized Gain | | | (0.24 | ) | |
| Redemption Fees | | | 0.00 | ‡ | |
| Net Asset Value, End of Period | | $ | 11.79 | | |
| Total Return++ | | | (3.54 | )%# | |
| Ratios and Supplemental Data: | |
| Net Assets, End of Period (Thousands) | | $ | 1,657 | | |
| Ratio of Expenses to Average Net Assets (1) | | | 1.80 | %+* | |
| Ratio of Net Investment Loss to Average Net Assets (1) | | | (0.77 | )%+* | |
| Ratio of Rebate from Morgan Stanley Affiliates to Average Net Assets | | | 0.00 | %§* | |
| Portfolio Turnover Rate | | | 26 | %* | |
| (1) Supplemental Information on the Ratios to Average Net Assets: | |
| Ratios Before Expense Limitation: | |
| Expenses to Average Net Assets | | | 1.85 | %* | |
| Net Investment Loss to Average Net Assets | | | (0.82 | )%* | |
^ Commencement of Operations
† Per share amount is based on average shares outstanding.
‡ Amount is less than $0.005 per share.
++ Calculated based on the net asset value as of the last business day of the period.
+ The Ratios of Expenses and Net Investment Loss reflect the rebate of certain Portfolio expenses in connection with the investments in Morgan Stanley affiliates during the period. The effect of the rebate on the ratios is disclosed in the above table as "Ratio of Rebate from Morgan Stanley Affiliates to Average Net Assets."
§ Amount is less than 0.005%.
# Not Annualized.
* Annualized.
The accompanying notes are an integral part of the financial statements.
232
2011 Annual Report
December 31, 2011
Financial Highlights
U.S. Real Estate Portfolio
| | | Class I | |
| | | Year Ended December 31, | |
| Selected Per Share Data and Ratios | | 2011 | | 2010 | | 2009 | | 2008 | | 2007 | |
| Net Asset Value, Beginning of Period | | $ | 14.33 | | | $ | 11.18 | | | $ | 8.87 | | | $ | 15.75 | | | $ | 28.24 | | |
| Income (Loss) from Investment Operations: | |
| Net Investment Income† | | | 0.11 | | | | 0.30 | | | | 0.23 | | | | 0.31 | | | | 0.33 | | |
| Net Realized and Unrealized Gain (Loss) | | | 0.69 | | | | 3.02 | | | | 2.30 | | | | (5.84 | ) | | | (4.87 | ) | |
| Total from Investment Operations | | | 0.80 | | | | 3.32 | | | | 2.53 | | | | (5.53 | ) | | | (4.54 | ) | |
| Distributions from and/or in Excess of: | |
| Net Investment Income | | | (0.14 | ) | | | (0.17 | ) | | | (0.22 | ) | | | (0.31 | ) | | | (0.50 | ) | |
| Net Realized Gain | | | — | | | | — | | | | — | | | | (1.04 | ) | | | (7.45 | ) | |
| Total Distributions | | | (0.14 | ) | | | (0.17 | ) | | | (0.22 | ) | | | (1.35 | ) | | | (7.95 | ) | |
| Redemption Fees | | | — | | | | — | | | | 0.00 | ‡ | | | 0.00 | ‡ | | | 0.00 | ‡ | |
| Net Asset Value, End of Period | | $ | 14.99 | | | $ | 14.33 | | | $ | 11.18 | | | $ | 8.87 | | | $ | 15.75 | | |
| Total Return++ | | | 5.57 | % | | | 29.86 | % | | | 29.65 | % | | | (38.07 | )% | | | (16.63 | )% | |
| Ratios and Supplemental Data: | |
| Net Assets, End of Period (Thousands) | | $ | 773,138 | | | $ | 855,474 | | | $ | 584,820 | | | $ | 448,897 | | | $ | 911,819 | | |
| Ratio of Expenses to Average Net Assets (1) | | | 1.01 | %+ | | | 0.99 | %+†† | | | 0.99 | %+ | | | 0.95 | %+ | | | 0.90 | %+ | |
| Ratio of Expenses to Average Net Assets Excluding Non Operating Expenses | | | 1.00 | %+ | | | 0.98 | %+†† | | | 0.96 | %+ | | | 0.91 | %+ | | | 0.88 | %+ | |
| Ratio of Net Investment Income to Average Net Assets (1) | | | 0.76 | %+ | | | 2.34 | %+†† | | | 2.70 | %+ | | | 2.19 | %+ | | | 1.23 | %+ | |
| Ratio of Rebate from Morgan Stanley Affiliates to Average Net Assets | | | 0.00 | %§ | | | 0.00 | %††§ | | | 0.00 | %§ | | | 0.00 | %§ | | | 0.00 | %§ | |
| Portfolio Turnover Rate | | | 21 | % | | | 41 | % | | | 30 | % | | | 38 | % | | | 38 | % | |
| (1) Supplemental Information on the Ratios to Average Net Assets: | |
| Ratios Before Expense Limitation: | |
| Expenses to Average Net Assets | | | 1.03 | % | | | N/A | | | | 1.00 | %+ | | | 0.96 | %+ | | | N/A | | |
| Net Investment Income to Average Net Assets | | | 0.74 | % | | | N/A | | | | 2.69 | %+ | | | 2.18 | %+ | | | N/A | | |
† Per share amount is based on average shares outstanding.
‡ Amount is less than $0.005 per share.
++ Calculated based on the net asset value as of the last business day of the period.
+ The Ratios of Expenses and Net Investment Income reflect the rebate of certain Portfolio expenses in connection with the investments in Morgan Stanley affiliates during the period. The effect of the rebate on the ratios is disclosed in the above table as "Ratio of Rebate from Morgan Stanley Affiliates to Average Net Assets."
†† Reflects overall Portfolio ratios for investment income and non-class specific expenses.
§ Amount is less than 0.005%.
The accompanying notes are an integral part of the financial statements.
233
2011 Annual Report
December 31, 2011
Financial Highlights
U.S. Real Estate Portfolio
| | | Class P | |
| | | Year Ended December 31, | |
| Selected Per Share Data and Ratios | | 2011 | | 2010 | | 2009 | | 2008 | | 2007 | |
| Net Asset Value, Beginning of Period | | $ | 14.07 | | | $ | 10.99 | | | $ | 8.73 | | | $ | 15.53 | | | $ | 27.96 | | |
| Income (Loss) from Investment Operations: | |
| Net Investment Income† | | | 0.08 | | | | 0.26 | | | | 0.21 | | | | 0.28 | | | | 0.27 | | |
| Net Realized and Unrealized Gain (Loss) | | | 0.66 | | | | 2.96 | | | | 2.25 | | | | (5.77 | ) | | | (4.82 | ) | |
| Total from Investment Operations | | | 0.74 | | | | 3.22 | | | | 2.46 | | | | (5.49 | ) | | | (4.55 | ) | |
| Distributions from and/or in Excess of: | |
| Net Investment Income | | | (0.11 | ) | | | (0.14 | ) | | | (0.20 | ) | | | (0.27 | ) | | | (0.43 | ) | |
| Net Realized Gain | | | — | | | | — | | | | — | | | | (1.04 | ) | | | (7.45 | ) | |
| Total Distributions | | | (0.11 | ) | | | (0.14 | ) | | | (0.20 | ) | | | (1.31 | ) | | | (7.88 | ) | |
| Redemption Fees | | | — | | | | — | | | | 0.00 | ‡ | | | 0.00 | ‡ | | | 0.00 | ‡ | |
| Net Asset Value, End of Period | | $ | 14.70 | | | $ | 14.07 | | | $ | 10.99 | | | $ | 8.73 | | | $ | 15.53 | | |
| Total Return++ | | | 5.26 | % | | | 29.51 | % | | | 29.31 | % | | | (38.26 | )% | | | (16.80 | )% | |
| Ratios and Supplemental Data: | |
| Net Assets, End of Period (Thousands) | | $ | 92,047 | | | $ | 89,321 | | | $ | 116,164 | | | $ | 95,828 | | | $ | 171,578 | | |
| Ratio of Expenses to Average Net Assets (1) | | | 1.26 | %+ | | | 1.24 | %+†† | | | 1.24 | %+ | | | 1.20 | %+ | | | 1.15 | %+ | |
| Ratio of Expenses to Average Net Assets Excluding Non Operating Expenses | | | 1.25 | %+ | | | 1.23 | %+†† | | | 1.21 | %+ | | | 1.16 | %+ | | | 1.13 | %+ | |
| Ratio of Net Investment Income to Average Net Assets (1) | | | 0.54 | %+ | | | 2.09 | %+†† | | | 2.45 | %+ | | | 2.05 | %+ | | | 1.02 | %+ | |
| Ratio of Rebate from Morgan Stanley Affiliates to Average Net Assets | | | 0.00 | %§ | | | 0.00 | %††§ | | | 0.00 | %§ | | | 0.00 | %§ | | | 0.00 | %§ | |
| Portfolio Turnover Rate | | | 21 | % | | | 41 | % | | | 30 | % | | | 38 | % | | | 38 | % | |
| (1) Supplemental Information on the Ratios to Average Net Assets: | |
| Ratios Before Expense Limitation: | |
| Expenses to Average Net Assets | | | 1.28 | % | | | N/A | | | | 1.25 | %+ | | | 1.21 | %+ | | | N/A | | |
| Net Investment Income to Average Net Assets | | | 0.52 | % | | | N/A | | | | 2.44 | %+ | | | 2.04 | %+ | | | N/A | | |
† Per share amount is based on average shares outstanding.
‡ Amount is less than $0.005 per share.
++ Calculated based on the net asset value as of the last business day of the period.
+ The Ratios of Expenses and Net Investment Income reflect the rebate of certain Portfolio expenses in connection with the investments in Morgan Stanley affiliates during the period. The effect of the rebate on the ratios is disclosed in the above table as "Ratio of Rebate from Morgan Stanley Affiliates to Average Net Assets."
†† Reflects overall Portfolio ratios for investment income and non-class specific expenses.
§ Amount is less than 0.005%.
The accompanying notes are an integral part of the financial statements.
234
2011 Annual Report
December 31, 2011
Financial Highlights
U.S. Real Estate Portfolio
| | | Class H | |
| Selected Per Share Data and Ratios | | Period from
November 11,
2011^ to
December 31,
2011 | |
| Net Asset Value, Beginning of Period | | $ | 14.52 | | |
| Income (Loss) from Investment Operations: | |
| Net Investment Income† | | | 0.07 | | |
| Net Realized and Unrealized Loss | | | 0.11 | | |
| Total from Investment Operations | | | 0.18 | | |
| Net Asset Value, End of Period | | $ | 14.70 | | |
| Total Return++ | | | 1.24 | %# | |
| Ratios and Supplemental Data: | |
| Net Assets, End of Period (Thousands) | | $ | 26,644 | | |
| Ratio of Expenses to Average Net Assets (1) | | | 1.25 | %+* | |
| Ratio of Net Investment Income to Average Net Assets (1) | | | 3.81 | %+* | |
| Ratio of Rebate from Morgan Stanley Affiliates to Average Net Assets | | | 0.00 | %§* | |
| Portfolio Turnover Rate | | | 21 | %* | |
| (1) Supplemental Information on the Ratios to Average Net Assets: | |
| Ratios Before Expense Limitation: | |
| Expense to Average Net Assets | | | 1.41 | %* | |
| Net Investment Income to Average Net Assets | | | 3.65 | %* | |
^ Commencement of Operations.
† Per share amount is based on average shares outstanding.
++ Calculated based on the net asset value which does not reflect sales charges, if applicable, as of the last business day of the period.
+ The Ratios of Expenses and Net Investment Income reflect the rebate of certain Portfolio expenses in connection with the investments in Morgan Stanley affiliates during the period. The effect of the rebate on the ratios is disclosed in the above table as "Ratio of Rebate from Morgan Stanley Affiliates to Average Net Assets."
# Not Annualized.
* Annualized.
The accompanying notes are an integral part of the financial statements.
235
2011 Annual Report
December 31, 2011
Financial Highlights
U.S. Real Estate Portfolio
| | | Class L | |
| Selected Per Share Data and Ratios | | Period from
November 11,
2011^ to
December 31,
2011 | |
| Net Asset Value, Beginning of Period | | $ | 14.52 | | |
| Income (Loss) from Investment Operations: | |
| Net Investment Income† | | | 0.06 | | |
| Net Realized and Unrealized Loss | | | 0.11 | | |
| Total from Investment Operations | | | 0.17 | | |
| Net Asset Value, End of Period | | $ | 14.69 | | |
| Total Return++ | | | 1.17 | %# | |
| Ratios and Supplemental Data: | |
| Net Assets, End of Period (Thousands) | | $ | 5,879 | | |
| Ratio of Expenses to Average Net Assets (1) | | | 1.75 | %+* | |
| Ratio of Net Investment Income to Average Net Assets (1) | | | 3.33 | %+* | |
| Ratio of Rebate from Morgan Stanley Affiliates to Average Net Assets | | | 0.00 | %§* | |
| Portfolio Turnover Rate | | | 21 | %* | |
| (1) Supplemental Information on the Ratios to Average Net Assets: | |
| Ratios Before Expense Limitation: | |
| Expenses to Average Net Assets | | | 1.91 | %+* | |
| Net Investment Income to Average Net Assets | | | 3.17 | %+* | |
^ Commencement of Operations.
† Per share amount is based on average shares outstanding.
++ Calculated based on the net asset value as of the last business day of the period.
+ The Ratios of Expenses and Net Investment Income reflect the rebate of certain Portfolio expenses in connection with the investments in Morgan Stanley affiliates during the period. The effect of the rebate on the ratios is disclosed in the above table as "Ratio of Rebate from Morgan Stanley Affiliates to Average Net Assets."
# Not Annualized.
* Annualized.
The accompanying notes are an integral part of the financial statements.
236
2011 Annual Report
December 31, 2011
Financial Highlights
Emerging Markets Debt Portfolio
| | | Class I | |
| | | Year Ended December 31, | |
| Selected Per Share Data and Ratios | | 2011 | | 2010 | | 2009 | | 2008 | | 2007 | |
| Net Asset Value, Beginning of Period | | $ | 12.44 | | | $ | 12.15 | | | $ | 9.94 | | | $ | 11.47 | | | $ | 11.99 | | |
| Income (Loss) from Investment Operations: | |
| Net Investment Income† | | | 0.64 | | | | 0.87 | | | | 0.71 | | | | 1.03 | | | | 0.71 | | |
| Net Realized and Unrealized Gain (Loss) | | | (1.07 | ) | | | 0.92 | | | | 1.64 | | | | (2.15 | ) | | | (0.23 | ) | |
| Total from Investment Operations | | | (0.43 | ) | | | 1.79 | | | | 2.35 | | | | (1.12 | ) | | | 0.48 | | |
| Distributions from and/or in Excess of: | |
| Net Investment Income | | | (0.64 | ) | | | (0.93 | ) | | | (0.09 | ) | | | (0.41 | ) | | | (1.00 | ) | |
| Net Realized Gain | | | (0.14 | ) | | | (0.57 | ) | | | (0.05 | ) | | | — | | | | — | | |
| Total Distributions | | | (0.78 | ) | | | (1.50 | ) | | | (0.14 | ) | | | (0.41 | ) | | | (1.00 | ) | |
| Redemption Fees | | | 0.00 | ‡ | | | 0.00 | ‡ | | | 0.00 | ‡ | | | — | | | | 0.00 | ‡ | |
| Net Asset Value, End of Period | | $ | 11.23 | | | $ | 12.44 | | | $ | 12.15 | | | $ | 9.94 | | | $ | 11.47 | | |
| Total Return++ | | | (3.66 | )% | | | 15.07 | % | | | 23.75 | % | | | (10.07 | )% | | | 4.68 | % | |
| Ratios and Supplemental Data: | |
| Net Assets, End of Period (Thousands) | | $ | 69,557 | | | $ | 28,864 | | | $ | 38,041 | | | $ | 21,887 | | | $ | 52,686 | | |
| Ratio of Expenses to Average Net Assets (1) | | | 0.83 | %+†† | | | 0.84 | %+†† | | | 0.84 | %+ | | | 0.83 | %+ | | | 0.93 | %+^ | |
| Ratio of Expenses to Average Net Assets Excluding Non Operating Expenses | | | N/A | | | | 0.84 | %+†† | | | 0.84 | %+ | | | 0.81 | %+ | | | 0.85 | %+ | |
| Ratio of Net Investment Income to Average Net Assets (1) | | | 5.21 | %+†† | | | 7.12 | %+†† | | | 6.44 | %+ | | | 9.16 | %+ | | | 6.28 | %+ | |
| Ratio of Rebate from Morgan Stanley Affiliates to Average Net Assets | | | 0.02 | %†† | | | 0.01 | %†† | | | 0.01 | % | | | 0.01 | % | | | 0.00 | %§ | |
| Portfolio Turnover Rate | | | 85 | % | | | 109 | % | | | 138 | % | | | 248 | % | | | 155 | % | |
| (1) Supplemental Information on the Ratios to Average Net Assets: | |
| Ratios Before Expense Limitation: | |
| Expenses to Average Net Assets | | | 1.19 | %†† | | | 1.29 | %+†† | | | 1.35 | %+ | | | 1.61 | %+ | | | 1.21 | %+ | |
| Net Investment Income to Average Net Assets | | | 4.85 | %†† | | | 6.67 | %+†† | | | 5.93 | %+ | | | 8.38 | %+ | | | 6.00 | %+ | |
† Per share amount is based on average shares outstanding.
‡ Amount is less than $0.005 per share.
++ Calculated based on the net asset value as of the last business day of the period.
+ The Ratios of Expenses and Net Investment Income reflect the rebate of certain Portfolio expenses in connection with the investments in Morgan Stanley affiliates during the period. The effect of the rebate on the ratios is disclosed in the above table as "Ratio of Rebate from Morgan Stanley Affiliates to Average Net Assets."
†† Reflects overall Portfolio ratios for investment income and non-class specific expenses.
^ Effective June 1, 2006, the Adviser has agreed to limit the ratio of expenses to average net assets to the maximum ratio of 0.85% for Class I shares. Prior to June 1, 2006, the maximum ratio was 1.00% for Class I shares. Prior to May 1, 2004, the maximum ratio was 1.75% for Class I shares.
§ Amount is less than 0.005%.
The accompanying notes are an integral part of the financial statements.
237
2011 Annual Report
December 31, 2011
Financial Highlights
Emerging Markets Debt Portfolio
| | | Class P | |
| | | Year Ended December 31, | |
| Selected Per Share Data and Ratios | | 2011 | | 2010 | | 2009 | | 2008 | | 2007 | |
| Net Asset Value, Beginning of Period | | $ | 12.76 | | | $ | 12.42 | | | $ | 10.18 | | | $ | 11.77 | | | $ | 12.29 | | |
| Income (Loss) from Investment Operations: | |
| Net Investment Income† | | | 0.63 | | | | 0.86 | | | | 0.84 | | | | 0.94 | | | | 0.69 | | |
| Net Realized and Unrealized Gain (Loss) | | | (1.10 | ) | | | 0.94 | | | | 1.53 | | | | (2.13 | ) | | | (0.23 | ) | |
| Total from Investment Operations | | | (0.47 | ) | | | 1.80 | | | | 2.37 | | | | (1.19 | ) | | | 0.46 | | |
| Distributions from and/or in Excess of: | |
| Net Investment Income | | | (0.61 | ) | | | (0.89 | ) | | | (0.08 | ) | | | (0.40 | ) | | | (0.98 | ) | |
| Net Realized Gain | | | (0.14 | ) | | | (0.57 | ) | | | (0.05 | ) | | | — | | | | — | | |
| Total Distributions | | | (0.75 | ) | | | (1.46 | ) | | | (0.13 | ) | | | (0.40 | ) | | | (0.98 | ) | |
| Redemption Fees | | | 0.00 | ‡ | | | 0.00 | ‡ | | | 0.00 | ‡ | | | — | | | | 0.00 | ‡ | |
| Net Asset Value, End of Period | | $ | 11.54 | | | $ | 12.76 | | | $ | 12.42 | | | $ | 10.18 | | | $ | 11.77 | | |
| Total Return++ | | | (3.90 | )% | | | 14.88 | % | | | 23.43 | % | | | (10.34 | )% | | | 4.29 | % | |
| Ratios and Supplemental Data: | |
| Net Assets, End of Period (Thousands) | | $ | 6,784 | | | $ | 6,792 | | | $ | 4,379 | | | $ | 3,640 | | | $ | 870 | | |
| Ratio of Expenses to Average Net Assets (1) | | | 1.08 | %+†† | | | 1.09 | %+†† | | | 1.09 | %+ | | | 1.12 | %+ | | | 1.20 | %+^ | |
| Ratio of Expenses to Average Net Assets Excluding Non Operating Expenses | | | N/A | | | | 1.09 | %+†† | | | 1.09 | %+ | | | 1.10 | %+ | | | 1.10 | %+ | |
| Ratio of Net Investment Income to Average Net Assets (1) | | | 4.96 | %+†† | | | 6.87 | %+†† | | | 7.52 | %+ | | | 8.56 | %+ | | | 5.99 | %+ | |
| Ratio of Rebate from Morgan Stanley Affiliates to Average Net Assets | | | 0.02 | %†† | | | 0.01 | %†† | | | 0.01 | % | | | 0.01 | % | | | 0.00 | %§ | |
| Portfolio Turnover Rate | | | 85 | % | | | 109 | % | | | 138 | % | | | 248 | % | | | 155 | % | |
| (1) Supplemental Information on the Ratios to Average Net Assets: | |
| Ratios Before Expense Limitation: | |
| Expenses to Average Net Assets | | | 1.44 | %†† | | | 1.54 | %+†† | | | 1.62 | %+ | | | 2.31 | %+ | | | 1.49 | %+ | |
| Net Investment Income to Average Net Assets | | | 4.60 | %†† | | | 6.42 | %+†† | | | 6.99 | %+ | | | 7.37 | %+ | | | 5.71 | %+ | |
† Per share amount is based on average shares outstanding.
‡ Amount is less than $0.005 per share.
++ Calculated based on the net asset value as of the last business day of the period.
+ The Ratios of Expenses and Net Investment Income reflect the rebate of certain Portfolio expenses in connection with the investments in Morgan Stanley affiliates during the period. The effect of the rebate on the ratios is disclosed in the above table as "Ratio of Rebate from Morgan Stanley Affiliates to Average Net Assets."
†† Reflects overall Portfolio ratios for investment income and non-class specific expenses.
^ Effective June 1, 2006, the Adviser has agreed to limit the ratio of expenses to average net assets to the maximum ratio of 1.10% for Class P shares. Prior to June 1, 2006, the maximum ratio was 1.25% for Class P shares. Prior to May 1, 2004, the maximum ratio was 2.00% for Class P shares.
§ Amount is less than 0.005%.
The accompanying notes are an integral part of the financial statements.
238
2011 Annual Report
December 31, 2011
Financial Highlights
Emerging Markets Debt Portfolio
| | | Class H | |
| | | Year Ended December 31, | | Period from
January 2,
2008^ to
December 31, | |
| Selected Per Share Data and Ratios | | 2011 | | 2010 | | 2009 | | 2008 | |
| Net Asset Value, Beginning of Period | | $ | 12.76 | | | $ | 12.42 | | | $ | 10.18 | | | $ | 11.86 | | |
| Income (Loss) from Investment Operations: | |
| Net Investment Income† | | | 0.62 | | | | 0.86 | | | | 0.71 | | | | 0.88 | | |
| Net Realized and Unrealized Gain (Loss) | | | (1.09 | ) | | | 0.94 | | | | 1.66 | | | | (2.17 | ) | |
| Total from Investment Operations | | | (0.47 | ) | | | 1.80 | | | | 2.37 | | | | (1.29 | ) | |
| Distributions from and/or in Excess of: | |
| Net Investment Income | | | (0.61 | ) | | | (0.89 | ) | | | (0.08 | ) | | | (0.39 | ) | |
| Net Realized Gain | | | (0.14 | ) | | | (0.57 | ) | | | (0.05 | ) | | | — | | |
| Total Distributions | | | (0.75 | ) | | | (1.46 | ) | | | (0.13 | ) | | | (0.39 | ) | |
| Redemption Fees | | | 0.00 | ‡ | | | 0.00 | ‡ | | | 0.00 | ‡ | | | — | | |
| Net Asset Value, End of Period | | $ | 11.54 | | | $ | 12.76 | | | $ | 12.42 | | | $ | 10.18 | | |
| Total Return++ | | | (3.88 | )% | | | 14.86 | % | | | 23.40 | % | | | (10.70 | )%# | |
| Ratios and Supplemental Data: | |
| Net Assets, End of Period (Thousands) | | $ | 2,955 | | | $ | 2,021 | | | $ | 2,316 | | | $ | 1,758 | | |
| Ratio of Expenses to Average Net Assets (1) | | | 1.08 | %+†† | | | 1.09 | %+†† | | | 1.09 | %+ | | | 1.18 | %+* | |
| Ratio of Expenses to Average Net Assets Excluding Non Operating Expenses | | | N/A | | | | 1.09 | %+†† | | | 1.09 | %+ | | | 1.10 | %+* | |
| Ratio of Net Investment Income to Average Net Assets (1) | | | 4.96 | %+†† | | | 6.87 | %+†† | | | 6.37 | %+ | | | 7.66 | %+* | |
| Rebate from Morgan Stanley Affiliates to Average Net Assets | | | 0.02 | %†† | | | 0.01 | %†† | | | 0.01 | % | | | 0.01 | %* | |
| Portfolio Turnover Rate | | | 85 | % | | | 109 | % | | | 138 | % | | | 248 | %# | |
| (1) Supplemental Information on the Ratios to Average Net Assets: | |
| Ratios Before Expense Limitation: | |
| Expense to Average Net Assets | | | 1.44 | %†† | | | 1.54 | %+†† | | | 1.57 | %+ | | | 2.11 | %+* | |
| Net Investment Income to Average Net Assets | | | 4.60 | %†† | | | 6.42 | %+†† | | | 5.89 | %+ | | | 6.73 | %+* | |
^ Commencement of Operations.
† Per share amount is based on average shares outstanding.
‡ Amount is less than $0.005 per share.
++ Calculated based on the net asset value which does not reflect sales charges, if applicable, as of the last business day of the period.
+ The Ratios of Expenses and Net Investment Income reflect the rebate of certain Portfolio expenses in connection with the investments in Morgan Stanley affiliates during the period. The effect of the rebate on the ratios is disclosed in the above table as "Ratio of Rebate from Morgan Stanley Affiliates to Average Net Assets."
†† Reflects overall Portfolio ratios for investment income and non-class specific expenses.
# Not Annualized.
* Annualized.
The accompanying notes are an integral part of the financial statements.
239
2011 Annual Report
December 31, 2011
Financial Highlights
Emerging Markets Debt Portfolio
| | | Class L | |
| | | Year Ended December 31, | | Period from
January 2,
2008^ to
December 31, | |
| Selected Per Share Data and Ratios | | 2011 | | 2010 | | 2009 | | 2008 | |
| Net Asset Value, Beginning of Period | | $ | 12.54 | | | $ | 12.24 | | | $ | 10.09 | | | $ | 11.84 | | |
| Income (Loss) from Investment Operations: | |
| Net Investment Income† | | | 0.55 | | | | 0.79 | | | | 0.92 | | | | 0.50 | | |
| Net Realized and Unrealized Gain (Loss) | | | (1.07 | ) | | | 0.92 | | | | 1.36 | | | | (1.87 | ) | |
| Total from Investment Operations | | | (0.52 | ) | | | 1.71 | | | | 2.28 | | | | (1.37 | ) | |
| Distributions from and/or in Excess of: | |
| Net Investment Income | | | (0.55 | ) | | | (0.84 | ) | | | (0.08 | ) | | | (0.38 | ) | |
| Net Realized Gain | | | (0.14 | ) | | | (0.57 | ) | | | (0.05 | ) | | | — | | |
| Total Distributions | | | (0.69 | ) | | | (1.41 | ) | | | (0.13 | ) | | | (0.38 | ) | |
| Redemption Fees | | | 0.00 | ‡ | | | 0.00 | ‡ | | | 0.00 | ‡ | | | — | | |
| Net Asset Value, End of Period | | $ | 11.33 | | | $ | 12.54 | | | $ | 12.24 | | | $ | 10.09 | | |
| Total Return++ | | | (4.34 | )% | | | 14.18 | % | | | 22.80 | % | | | (11.85 | )%# | |
| Ratios and Supplemental Data: | |
| Net Assets, End of Period (Thousands) | | $ | 4,965 | | | $ | 4,668 | | | $ | 1,305 | | | $ | 342 | | |
| Ratio of Expenses to Average Net Assets (1) | | | 1.58 | %+†† | | | 1.59 | %+†† | | | 1.59 | %+ | | | 1.72 | %+* | |
| Ratio of Expenses to Average Net Assets Excluding Non Operating Expenses | | | N/A | | | | 1.59 | %+†† | | | 1.59 | %+ | | | 1.60 | %+* | |
| Ratio of Net Investment Income to Average Net Assets (1) | | | 4.46 | %+†† | | | 6.37 | %+†† | | | 8.21 | %+ | | | 8.78 | %+* | |
| Ratio of Rebate from Morgan Stanley Affiliates to Average Net Assets | | | 0.02 | %†† | | | 0.01 | %†† | | | 0.01 | % | | | 0.01 | %* | |
| Portfolio Turnover Rate | | | 85 | % | | | 109 | % | | | 138 | % | | | 248 | %# | |
| (1) Supplemental Information on the Ratios to Average Net Assets: | |
| Ratios Before Expense Limitation: | |
| Expenses to Average Net Assets | | | 1.94 | %†† | | | 2.04 | %+†† | | | 2.02 | %+ | | | 3.03 | %+* | |
| Net Investment Income to Average Net Assets | | | 4.10 | %†† | | | 5.92 | %+†† | | | 7.78 | %+ | | | 7.47 | %+* | |
^ Commencement of Operations.
† Per share amount is based on average shares outstanding.
‡ Amount is less than $0.005 per share.
++ Calculated based on the net asset value as of the last business day of the period.
+ The Ratios of Expenses and Net Investment Income reflect the rebate of certain Portfolio expenses in connection with the investments in Morgan Stanley affiliates during the period. The effect of the rebate on the ratios is disclosed in the above table as "Ratio of Rebate from Morgan Stanley Affiliates to Average Net Assets."
†† Reflects overall Portfolio ratios for investment income and non-class specific expenses.
# Not Annualized.
* Annualized.
The accompanying notes are an integral part of the financial statements.
240
2011 Annual Report
December 31, 2011
Notes to Financial Statements
Morgan Stanley Institutional Fund, Inc. (the "Fund") is registered under the Investment Company Act of 1940, as amended (the "Act"), as an open-end management investment company. The Fund is comprised of twenty-three separate, active, diversified and non-diversified portfolios (individually referred to as a "Portfolio", collectively as the "Portfolios"). The Fund offers up to four different classes of shares for certain Portfolios — Class I shares, Class P shares, Class H shares and Class L shares. Each Portfolio (with the exception of the Asian Equity, Global Advantage, Global Discovery, Global Insight, Global Opportunity, Global Real Estate, International Advantage, International Opportunity, Select Global Infrastructure, Advantage, Insight, Opportunity, Small Company Growth, U.S. Real Estate, and Emerging Markets Debt Portfolios), offers two classes of shares — Class I and Class P. Global Insight and Insight Portfolios offer Class I shares, Class H shares and Class L shares. Asian Equity, Global Advantage, Global Discovery, Global Opportunity, Global Real Estate, International Advantage, International Opportunity, Select Global Infrastructure, Advantage, Opportunity, Small Company Growth, U.S. Real Estate, and Emerging Markets Debt Portfolios offer Class I shares, Class P shares, Class H shares and Class L shares. Each class of shares has identical voting rights (except shareholders of each Class have exclusive voting rights regarding any matter relating solely to that particular Class of shares), dividend, liquidation and other rights. Effective April 29, 2011, Capital Growth Portfolio was renamed Growth Portfolio.
For detailed descriptions of the investment objectives of each of the Portfolios and other related information, please refer to the Prospectuses of the Fund.
The Fund has suspended offering shares of the Small Company Growth Portfolio to new investors. The Fund will continue to offer shares of the Portfolio to existing shareholders. The Fund may recommence offering shares of the Portfolio to new investors in the future.
On November 11, 2011, Small Company Growth Portfolio acquired the net assets of Morgan Stanley Special Growth Fund ("Special Growth Fund"), an open-end investment company. Based on the respective valuations as of the close of business on November 11, 2011, pursuant to a Plan of Reorganization approved by the shareholders of Special Growth Fund on October 27, 2011 ("Reorganization"). The purpose of the transaction was to combine two portfolios managed by Morgan Stanley Investment Management Inc. with comparable investment objectives and strategies. The acquisition was accomplished by a tax-free exchange of 4,225 Class I shares of Small Company Growth Portfolio at a net asset value of $13.34 per share for 2,477 Class I shares of Special Growth Fund; 2,762,585 Class H shares of Small Company Growth Portfolio at a net asset value of $12.47 for 1,463,083 Class A shares and 109,160 Class B shares of Special Growth Fund; 142,996 Class L shares of Small Company Growth Portfolio at a net asset value of $12.47 for 89,674 Class C shares of Special Growth Fund. The net assets of Special Growth Fund before the Reorganization were approximately $36,289,000, including unrealized appreciation of approximately $2,423,000 at November 11, 2011. The investment portfolio of Special Growth Fund, with a fair value of approximately $36,424,000 and identified cost of approximately $34,001,000 on November 11, 2011, was the principal asset acquired by Small Company Growth Portfolio. For financial reporting purposes, assets received and shares issued by Small Company Growth Portfolio were recorded at fair value; however, the cost basis of the investments received from Special Growth Fund was carried forward to align ongoing reporting of Small Company Growth Portfolio's realized and unrealized gains and losses with amounts distributable to shareholders for tax purposes. Immediately prior to the Reorganization, the net assets of Small Company Growth Portfolio were approximately $1,412,832,000. Immediately after the merger, the net assets of Small Company Growth Portfolio were approximately $1,449,121,000.
Upon closing of the Reorganization, shareholders of Special Growth Fund received shares of Small Company Growth Portfolio as follows:
Special Growth
Fund | | Small Company
Growth Portfolio | |
| Class A | | Class H | |
|
| Class B | | Class H | |
|
| Class C | | Class L | |
|
| Class I | | Class I | |
|
Assuming the acquisition had been completed on January 1, 2011, the beginning of the annual reporting period of Small Company Growth Portfolio, Small Company Growth Portfolio's pro forma results of operations for the year ended December 31, 2011, are as follows:
| Net investment loss(1) | | $ | (4,536,000 | ) | |
| Net gain realized and unrealized gain (loss)(2) | | $ | (146,370,000 | ) | |
Net increase (decrease) in net assets resulting
from operations | | $ | (150,906,000 | ) | |
(1) Approximately $(5,631,000) as reported, plus approximately $209,000 Special Growth Fund premerger, plus approximately $886,000 of estimated pro-forma eliminated expenses.
(2) Approximately $(146,782,000) as reported, plus approximately $412,000 Special Growth Fund premerger.
Because the combined investment portfolios have been managed as a single integrated portfolio since the acquisition was completed, it is not practicable to separate the amounts of revenue and earnings of Special Growth Fund that have been included in Small Company Growth Portfolio's Statement of Operations since December 31, 2011.
On November 11, 2011, U.S. Real Estate Portfolio acquired the net assets of Morgan Stanley Real Estate Fund ("Real Estate
241
2011 Annual Report
December 31, 2011
Notes to Financial Statements (cont'd)
Fund"), an open-end investment company. Based on the respective valuations as of the close of business on November 11, 2011, pursuant to a Plan of Reorganization approved by the shareholders of Real Estate Fund on October 27, 2011 ("Reorganization"). The purpose of the transaction was to combine two portfolios managed by Morgan Stanley Investment Management Inc. with comparable investment objectives and strategies. The acquisition was accomplished by a tax-free exchange of 42,903 Class I shares of U.S. Real Estate Portfolio at a net asset value of $14.80 per share for 102,854 Class I shares of Real Estate Fund; 1,878,193 Class H shares of U.S. Real Estate Portfolio at a net asset value of $14.52 for 3,927,044 Class A shares and 528,039 Class B shares of Real Estate Fund; 418,343 Class L shares of U.S. Real Estate Portfolio at a net asset value of $14.52 for 1,005,298 Class C shares of Real Estate Fund. The net assets of Real Estate Fund before the Reorganization were approximately $33,981,000, including unrealized appreciation of approximately $12,071,000 at November 11, 2011. The investment portfolio of Real Estate Fund, with a fair value of approximately $34,585,000 and identified cost of approximately $22,514,000 on November 11, 2011, was the principal asset acquired by U.S. Real Estate Portfolio. For financial reporting purposes, assets received and shares issued by U.S. Real Estate Portfolio were recorded at fair value; however, the cost basis of the investments received from Real Estate Fund was carried forward to align ongoing reporting of U.S. Real Estate Portfolio's realized and unrealized gains and losses with amounts distributable to shareholders for tax purposes. Immediately prior to the Reorganization, the net assets of U.S. Real Estate Portfolio were approximately $882,125,000. Immediately after the merger, the net assets of U.S. Real Estate Portfolio were approximately $916,106,000.
Upon closing of the Reorganization, shareholders of Real Estate Fund received shares of U.S. Real Estate Portfolio as follows:
Real Estate
Fund | | U.S. Real
Estate Portfolio | |
| Class A | | Class H | |
|
| Class B | | Class H | |
|
| Class C | | Class L | |
|
| Class I | | Class I | |
|
Assuming the acquisition had been completed on January 1, 2011, the beginning of the annual reporting period of U.S. Real Estate Portfolio, U.S. Real Estate Portfolio's pro forma results of operations for the year ended December 31, 2011, are as follows:
| Net investment income(1) | | $ | 9,128,000 | | |
| Net realized and unrealized gain (loss)(2) | | $ | 48,748,000 | | |
Net increase (decrease) in net assets resulting
from operations | | $ | 57,876,000 | | |
(1) Approximately $7,100,000 as reported, plus approximately $1,099,000 Real Estate Fund premerger, plus approximately $929,000 of estimated pro-forma eliminated expenses.
(2) Approximately $43,537,000 as reported, plus approximately $5,211,000 Real Estate Fund premerger.
Because the combined investment portfolios have been managed as a single integrated portfolio since the acquisition was completed, it is not practicable to separate the amounts of revenue and earnings of Real Estate Fund that have been included in U.S. Real Estate Portfolio's Statement of Operations since December 31, 2011.
A. Significant Accounting Policies: The following significant accounting policies are in conformity with U.S. generally accepted accounting principles ("GAAP"). Such policies are consistently followed by the Fund in the preparation of its financial statements. GAAP may require management to make estimates and assumptions that affect the reported amounts and disclosures in the financial statements. Actual results may differ from those estimates.
1. Security Valuation: Securities listed on a foreign exchange are valued at their closing price. Unlisted securities and listed securities not traded on the valuation date for which market quotations are readily available are valued at the mean between the current bid and ask prices. Equity securities listed on a U.S. exchange are valued at the latest quoted sales price on the valuation date. Equity securities listed or traded on NASDAQ, for which market quotations are available, are valued at the NASDAQ Official Closing Price. Bonds and other fixed income securities may be valued according to the broadest and most representative market. In addition, bonds and other fixed income securities may be valued on the basis of prices provided by a pricing service. The prices provided by a pricing service take into account broker dealer market price quotations for institutional size trading in similar groups of securities, security quality, maturity, coupon and other security characteristics as well as any developments related to the specific securities. Short-term debt securities purchased with remaining maturities of 60 days or less are valued at amortized cost, unless the Board of Directors (the "Directors") determines such valuation does not reflect the securities' fair value, in which case these securities will be valued at their fair value as determined in good faith under procedures adopted by the Directors.
All other securities and investments for which market values are not readily available, including restricted securities, and those securities for which it is inappropriate to determine prices in accordance with the aforementioned procedures, are valued at fair value as determined in good faith under procedures adopted by the Directors, although the actual calculations may be done by others. Factors considered in making this determination may include, but are not limited to, information obtained by contacting the issuer, analysts, or the appropriate stock exchange (for
242
2011 Annual Report
December 31, 2011
Notes to Financial Statements (cont'd)
exchange-traded securities), analysis of the issuer's financial statements or other available documents and, if necessary, available information concerning other securities in similar circumstances.
Most foreign markets close before the New York Stock Exchange ("NYSE"). Occasionally, developments that could affect the closing prices of securities and other assets may occur between the times at which valuations of such securities are determined (that is, close of the foreign market on which the securities trade) and the close of business on the NYSE. If these developments are expected to materially affect the value of the securities, the valuations may be adjusted to reflect the estimated fair value as of the close of the NYSE, as determined in good faith under procedures established by the Directors.
2. Foreign Currency Translation and Foreign Investments: The books and records of the Fund are maintained in U.S. dollars. Foreign currency amounts are translated into U.S. dollars at the mean of the bid and ask prices of such currencies against U.S. dollars last quoted by a major bank as follows:
• investments, other assets and liabilities at the prevailing rate of exchange on the valuation date;
• investment transactions and investment income at the prevailing rates of exchange on the dates of such transactions.
Although the net assets of the Fund are presented at the foreign exchange rates and market values at the close of the period, the Fund does not isolate that portion of the results of operations arising as a result of changes in the foreign exchange rates from the fluctuations arising from changes in the market prices of securities held at period end. Similarly, the Fund does not isolate the effect of changes in foreign exchange rates from the fluctuations arising from changes in the market prices of securities sold during the period. Accordingly, realized and unrealized foreign currency gains (losses) on investments in securities are included in the reported net realized and unrealized gains (losses) on investment transactions and balances. However, pursuant to U.S. Federal income tax regulations, gains and losses from certain foreign currency transactions and the foreign currency portion of gains and losses realized on sales and maturities of foreign denominated debt securities are treated as ordinary income for U.S. Federal income tax purposes.
Net realized gains (losses) on foreign currency transactions represent net foreign exchange gains (losses) from foreign currency exchange contracts, disposition of foreign currencies, currency gains (losses) realized between the trade and settlement dates on securities transactions, and the difference between the amount of investment income and foreign withholding taxes recorded on the Fund's books and the U.S. dollar equivalent amounts actually received or paid. Net unrealized currency gains (losses) from valuing foreign currency denominated assets and liabilities at period end exchange rates are reflected as a component of unrealized appreciation (depreciation) on the Statements of Assets and Liabilities. The change in unrealized currency gains (losses) on foreign currency translations for the period is reflected in the Statements of Operations.
Foreign security and currency transactions may involve certain considerations and risks not typically associated with those of U.S. dollar denominated transactions as a result of, among other factors, fluctuations of exchange rates in relation to the U.S. dollar, the possibility of lower levels of governmental supervision and regulation of foreign securities markets and the possibility of political or economic instability.
Governmental approval for foreign investments may be required in advance of making an investment under certain circumstances in some countries, and the extent of foreign investments in domestic companies may be subject to limitation in other countries. Foreign ownership limitations also may be imposed by the charters of individual companies to prevent, among other concerns, violations of foreign investment limitations. As a result, an additional class of shares (identified as "Foreign" in the Portfolio of Investments) may be created and offered for investment. The "local" and "foreign shares" market values may differ. In the absence of trading of the foreign shares in such markets, the Fund values the foreign shares at the closing exchange price of the local shares. Such securities, if any, are identified as fair valued in the Portfolio of Investments.
3. Derivatives: Certain Portfolios use derivative instruments for a variety of purposes, including hedging, risk management, portfolio management or to earn income. Derivatives are financial instruments whose value is based on the value of another underlying asset, interest rate, index or financial instrument. A derivative instrument often has risks similar to its underlying instrument and may have additional risks, including imperfect correlation between the value of the derivative and the underlying instrument, risks of default by the other party to certain transactions, magnification of losses incurred due to changes in the market value of the securities, instruments, indices or interest rates to which they relate, and risks that the transactions may not be liquid. The use of derivatives involves risks that are different from, and possibly greater than, the risks associated with other portfolio investments.
243
2011 Annual Report
December 31, 2011
Notes to Financial Statements (cont'd)
Derivatives may involve the use of highly specialized instruments that require investment techniques and risk analyses different from those associated with other portfolio investments. All of a Portfolio's holdings, including derivative instruments, are marked to market each day with the change in value reflected in unrealized appreciation (depreciation). Upon disposition, a realized gain or loss is recognized.
Certain derivative transactions may give rise to a form of leverage. Leverage associated with derivative transactions may cause the Portfolios to liquidate portfolio positions when it may not be advantageous to do so to satisfy its obligations or to meet earmarking or segregation requirements, pursuant to applicable Securities and Exchange Commission rules and regulations, or may cause the Portfolios to be more volatile than if the Portfolios had not been leveraged. Although the Adviser and/or Sub-Adviser seek to use derivatives to further the Portfolios' investment objectives, there is no assurance that the use of derivatives will achieve this result.
Following is a description of the derivative instruments and techniques that certain Portfolio used during the period and their associated risks:
Futures: A futures contract is a standardized agreement between two parties to buy or sell a specific quantity of an underlying instrument at a specific price at a specific future time. The value of a futures contract tends to increase and decrease in tandem with the value of the underlying instrument. Futures contracts are bilateral agreements, with both the purchaser and the seller equally obligated to complete the transaction. Depending on the terms of the particular contract, futures contracts are settled through either physical delivery of the underlying instrument on the settlement date or by payment of a cash settlement amount on the settlement date. During the period the futures contract is open, payments are received from or made to the broker based upon changes in the value of the contract (the variation margin). The risk of loss associated with a futures contract is in excess of the variation margin reflected as part of "Due from (to) Brokers" in the Statements of Assets and Liabilities. A decision as to whether, when and how to use futures involves the exercise of skill and judgment and even a well conceived futures transaction may be unsuccessful because of market behavior or unexpected events. In addition to the derivatives risks discussed above, the prices of futures can be highly volatile, using futures can lower total return, and the potential loss from futures can exceed a Portfolio's initial investment in such contracts.
Foreign Currency Exchange Contracts: In connection with their investments in foreign securities, certain Portfolios also entered into contracts with banks, brokers or dealers to purchase or sell securities or foreign currencies at a future date. A foreign currency exchange contract ("currency contracts") is a negotiated agreement between the contracting parties to exchange a specified amount of currency at a specified future time at a specified rate. The rate can be higher or lower than the spot rate between the currencies that are the subject of the currency contract. Currency contracts are used to protect against uncertainty in the level of future foreign currency exchange rates or to gain or modify exposure to a particular currency. Hedging the Portfolio's currency risks involves the risk of mismatching the Portfolio's objectives under a currency contract with the value of securities denominated in a particular currency. Furthermore, such transactions reduce or preclude the opportunity for gain if the value of the currency should move in the direction opposite to the position taken. There is an additional risk to the effect that currency contracts create exposure to currencies in which a Portfolio's securities are not denominated. Unanticipated changes in currency prices may result in poorer overall performance for a Portfolio than if it had not entered into such currency contracts. A currency contract is marked-to-market daily and the change in market value is recorded by the Portfolio as unrealized gain or loss. The Portfolio records realized gains (losses) when the currency contract is closed equal to the difference between the value of the currency contract at the time it was opened and the value at the time it was closed.
Financial Accounting Standards Board ("FASB") Accounting Standards CodificationTM ("ASC") 815, "Derivatives and Hedging: Overall" ("ASC 815"), is intended to improve financial reporting about derivative instruments by requiring enhanced disclosures to enable investors to better understand how and why the Portfolios use derivative instruments, how these derivative instruments are accounted for and their effects on the Portfolio's financial position and results of operations.
244
2011 Annual Report
December 31, 2011
Notes to Financial Statements (cont'd)
The following table sets forth the fair value of each Portfolio's derivative contracts by primary risk exposure as of December 31, 2011.
| Primary Risk Exposure | | Statements of
Assets and
Liabilities | | Foreign
Currency
Exchange
Contracts
(000) | | Futures
Contracts
(000)(a) | |
| Active International Allocation: | |
| Currency Risk | | Receivables | | $ | 333 | | | $ | — | | |
| Equity Risk | | Receivables | | | — | | | | 180 | | |
| Total Receivables | | | | $ | 333 | | | $ | 180 | | |
| Currency Risk | | Payables | | $ | (598 | ) | | $ | — | | |
| Equity Risk | | Payables | | | — | | | | (324 | ) | |
| Total Payables | | | | $ | (598 | ) | | $ | (324 | ) | |
| International Small Cap: | |
| Currency Risk | | Payables | | $ | (38 | ) | | $ | — | | |
| Emerging Markets Debt: | |
| Currency Risk | | Receivables | | $ | 2 | | | $ | — | | |
| Currency Risk | | Payables | | $ | (101 | ) | | $ | — | | |
(a) This amount represents the cumulative appreciation (depreciation) of futures contracts as reported in the Portfolio of Investments. The Statements of Assets and Liabilities only reflect the current day variation margin.
The following tables set forth by primary risk exposure the Portfolio's realized gains (losses) and change in unrealized appreciation (depreciation) by type of derivative contract for the year ended December 31, 2011 in accordance with ASC 815.
| Realized Gain (Loss) | |
| Portfolio | | Primary Risk
Exposure | | Derivative
Type | | Value
(000) | |
| Active International | | Currency Risk | | Foreign Currency | |
| |
| Allocation | | | | | | Exchange Contracts | | $ | (2,377 | ) | |
| | | | | Equity Risk | | Futures Contracts | | | (6,806 | ) | |
| Total | | | | | | | | | | $ | (9,183 | ) | |
| Change in Unrealized Appreciation (Depreciation) | |
| Portfolio | | Primary Risk
Exposure | | Derivative
Type | | Value
(000) | |
| Active International | | Currency Risk | | Foreign Currency | |
| |
| Allocation | | | | | | Exchange Contracts | | $ | (47 | ) | |
| | | Equity Risk | | Futures Contracts | | | (232 | ) | |
| Total | | | | | | | | | | $ | (279 | ) | |
| Realized Gain (Loss) | |
| Portfolio | | Primary Risk
Exposure | | Derivative
Type | | Value
(000) | |
Emerging Markets
| | Currency Risk
| | Foreign Currency
Exchange Contracts | | $ | (4,951 | ) | |
| Realized Gain (Loss) | |
| Portfolio | | Primary Risk
Exposure | | Derivative
Type | | Value
(000) | |
Global Discovery
| | Currency Risk
| | Foreign Currency
Exchange Contracts | | $ | 12 | | |
| Realized Gain (Loss) | |
| Portfolio | | Primary Risk
Exposure | | Derivative
Type | | Value
(000) | |
International Small Cap
| | Currency Risk
| | Foreign Currency
Exchange Contracts | | $ | (2,119 | ) | |
| Change in Unrealized Appreciation (Depreciation) | |
| Portfolio | | Primary Risk
Exposure | | Derivative
Type | | Value
(000) | |
International Small Cap
| | Currency Risk
| | Foreign Currency
Exchange Contracts | | $ | 1,108 | | |
| Realized Gain (Loss) | |
| Portfolio | | Primary Risk
Exposure | | Derivative
Type | | Value
(000) | |
Emerging Markets Debt
| | Currency Risk
| | Foreign Currency
Exchange Contracts | | $ | (667 | ) | |
| Change in Unrealized Appreciation (Depreciation) | |
| Portfolio | | Primary Risk
Exposure | | Derivative
Type | | Value
(000) | |
Emerging Markets Debt
| | Currency Risk
| | Foreign Currency
Exchange Contracts | | $ | (170 | ) | |
For the year ended December 31, 2011, Active International Allocation Portfolio's average monthly principal amount of foreign currency exchange contracts was approximately $96,340,000 and the average monthly original value of futures contracts was approximately $22,940,000. Emerging Markets, Global Discovery, International Small Cap and Emerging Markets Debt Portfolios' average monthly principal amount of foreign currency exchange contracts were approximately $39,769,000, $58,000, $35,602,000 and $15,884,000, respectively.
4. Structured Investments: Certain Portfolios invested a portion of their assets in structured investments. A structured investment is a derivative security designed to offer a return linked to a particular underlying security, currency or market. Structured investments may come in various forms including notes, warrants and options to purchase securities. The Portfolio will typically use structured investments to gain exposure to a permitted underlying security, currency or market when direct access to a market is limited or inefficient from a tax or cost standpoint. Investments in structured investments involve risks including counterparty risk and market risk. Holders of structured investments bear risks of the underlying investment and are subject to counterparty risk because the Portfolio is relying on the creditworthiness of such counterparty and has no rights with respect to the underlying investment. Certain structured investments may be thinly traded or have a limited trading market and may have the effect of increasing the Portfolio's illiquidity to the extent that the Portfolio, at a particular time, may be unable to find qualified buyers for these securities.
5. Securities Lending: Certain Portfolios lend securities to qualified financial institutions, such as broker-dealers, to earn additional income. Any increase or decrease in the fair value of the securities loaned that might occur and any interest earned or dividends declared on those securities during the term of the loan would remain in the Portfolio. Portfolios that lend securities receive cash or securities as
245
2011 Annual Report
December 31, 2011
Notes to Financial Statements (cont'd)
collateral in an amount equal to or exceeding 100% of the current fair value of the loaned securities. The collateral is marked-to-market daily, by the securities lending agent, to ensure that a minimum of 100% collateral coverage is maintained.
Based on pre-established guidelines, the securities lending agent invests any cash collateral that is received in an affiliated money market portfolio and repurchase agreements backed by the U.S. Treasury and Agency securities. Securities lending income is generated from the earnings on the invested collateral and borrowing fees, less any rebates owed to the borrowers and compensation to the lending agent, and is recorded as "Income from Securities Loaned-Net" in the Portfolios' Statements of Operations. Risks in securities lending transactions are that a borrower may not provide additional collateral when required or return the securities when due, and that the value of the short-term investments will be less than the amount of cash collateral plus any rebate that is required to be returned to the borrower.
The value of the loaned securities and related collateral outstanding at December 31, 2011 were as follows:
| Portfolio | | Value of
Loaned
Securities
(000) | | Value of
Collateral
Outstanding
(000) | | Invested
Cash
Collateral*
(000) | | Uninvested
Cash
Collateral
(000) | | Value of
Non-Cash
Collateral**
(000) | |
Active International
Allocation | | $ | 28,149 | | | $ | 29,350 | | | $ | 28,964 | | | $ | 210 | | | $ | 176 | | |
| Emerging Markets | | | 89,322 | | | | 92,680 | | | | 92,013 | | | | 667 | | | | — | | |
| International Equity | | | 100,073 | | | | 104,123 | | | | 103,374 | | | | 749 | | | | — | | |
Emerging Markets
Debt | | | 841 | | | | 993 | | | | 986 | | | | 7 | | | | — | | |
* The Portfolios invest cash collateral received in Repurchase Agreements and the Morgan Stanley Institutional Liquidity Funds as reported in the Portfolios of Investments.
** The Portfolio received non-cash collateral in the form of U.S. Government Obligations, which the Portfolio cannot sell or repledge and, accordingly, are not reflected in the Portfolio of Investments.
6. Unfunded Commitments: Subject to the terms of a Subscription Agreement between the U.S. Real Estate Portfolio and BRCP REIT I, LLC, the Portfolio has made a subscription commitment of $7,000,000 for which it will receive 7,000,000 shares of common stock. As of December 31, 2011, BRCP REIT I, LLC has drawn down approximately $6,101,000 which represents 87.2% of the commitment.
Subject to the terms of a Subscription Agreement between the U.S. Real Estate Portfolio and BRCP REIT II, LLC, the Portfolio has made a subscription commitment of $9,000,000 for which it will receive 9,000,000 shares of common stock. As of December 31, 2011, BRCP REIT II, LLC has drawn down approximately $8,364,000 which represents 92.9% of the commitment.
Subject to the terms of a Subscription Agreement between the Global Real Estate Portfolio and Exeter Industrial Value Fund LP, the Portfolio has made a subscription commitment of $2,000,000 for which it will receive 2,000,000 shares of common stock. As of December 31, 2011, Exeter Industrial Value Fund LP has drawn down approximately $1,860,000 which represents 93.0% of the commitment.
Subject to the terms of a Subscription Agreement between the U.S. Real Estate Portfolio and Exeter Industrial Value Fund LP, the Portfolio has made a subscription commitment of $8,500,000 for which it will receive 8,500,000 shares of common stock. As of December 31, 2011, Exeter Industrial Value Fund LP has drawn down approximately $7,905,000 which represents 93.0% of the commitment.
Subject to the terms of a Subscription Agreement between the U.S. Real Estate Portfolio and Keystone Industrial Fund, LP, the Portfolio has made a subscription commitment of $7,946,000 for which it will receive 7,946,000 shares of common stock. As of December 31, 2011, Keystone Industrial Fund, LP has drawn down approximately $7,574,000 which represents 95.3% of the commitment.
Subject to the terms of a Subscription Agreement between the Global Real Estate Portfolio and KTR Industrial Fund II LP, the Portfolio has made a subscription commitment of $5,000,000 for which it will receive 5,000,000 shares of common stock. As of December 31, 2011, KTR Industrial Fund II LP has drawn down approximately $4,269,000 which represents 85.4% of the commitment.
Subject to the terms of a Subscription Agreement between the U.S. Real Estate Portfolio and KTR Industrial Fund II LP, the Portfolio has made a subscription commitment of $10,000,000 for which it will receive 10,000,000 shares of common stock. As of December 31, 2011, KTR Industrial Fund II LP has drawn down approximately $8,538,000 which represents 85.4% of the commitment.
Subject to the terms of a Subscription Agreement between the U.S. Real Estate Portfolio and Cabot Industrial Value Fund II, LP, the Portfolio has made a subscription commitment of $7,500,000 for which it will receive 15,000 shares of common stock. As of December 31, 2011, Cabot Industrial Value Fund II, LP has drawn down approximately $7,000,000 which represents 93.3% of the commitment.
Subject to the terms of a Subscription Agreement between the U.S. Real Estate Portfolio and Cabot Industrial Value Fund III, LP, the Portfolio has made a subscription commitment of $7,500,000 for which it will receive 15,000 shares of common stock. As of December 31, 2011, Cabot Industrial
246
2011 Annual Report
December 31, 2011
Notes to Financial Statements (cont'd)
Value Fund III, LP has drawn down approximately $3,256,000 which represents 43.4% of the commitment.
Subject to the terms of a Subscription Agreement between the Global Real Estate Portfolio and Cabot Industrial Value Fund III, LP, the Portfolio has made a subscription commitment of $7,500,000 for which it will receive 15,000 shares of common stock. As of December 31, 2011, Cabot Industrial Value Fund III, LP has drawn down approximately $3,256,000 which represents 43.4% of the commitment.
7. Redemption Fees: The following redemption fees are designed to protect each Portfolio and its shareholders from the effects of short-term trading. Shares of the Active International Allocation, Asian Equity, Emerging Markets, International Advantage, International Equity, International Opportunity, International Real Estate, International Small Cap, Small Company Growth and Emerging Markets Debt Portfolios redeemed within 30 days of purchase may be subject to a 2% redemption fee. These fees, if any, are included on the Statements of Changes in Net Assets.
8. Restricted Securities: Certain Portfolios invest in unregistered or otherwise restricted securities. The term "restricted securities" refers to securities that are unregistered or are held by control persons of the issuer and securities that are subject to contractual restrictions on their resale. As a result, restricted securities may be more difficult to value and the Portfolio may have difficulty disposing of such assets either in a timely manner or for a reasonable price. In order to dispose of an unregistered security, the Portfolio, where it has contractual rights to do so, may have to cause such security to be registered. A considerable period may elapse between the time the decision is made to sell the security and the time the security is registered so that the Portfolio could sell it. Contractual restrictions on the resale of securities vary in length and scope and are generally the result of a negotiation between the issuer and acquirer of the securities. The Portfolio would, in either case, bear market risks during that period. Restricted Securities are identified in the Portfolio of Investments.
9. Fair Value Measurement: FASB ASC 820, "Fair Value Measurements and Disclosures" ("ASC 820"), defines fair value as the value that the Fund would receive to sell an investment or pay to transfer a liability in a timely transaction with an independent buyer in the principal market, or in the absence of a principal market the most advantageous market for the investment or liability. ASC 820 establishes a three-tier hierarchy to distinguish between (1) inputs that reflect the assumptions market participants would use in valuing an asset or liability developed based on market data obtained from sources independent of the reporting entity (observable inputs) and (2) inputs that reflect the reporting entity's own assumptions about the assumptions market participants would use in valuing an asset or liability developed based on the best information available in the circumstances (unobservable inputs) and to establish classification of fair value measurements for disclosure purposes. Various inputs are used in determining the value of the Fund's investments. The inputs are summarized in the three broad levels listed below.
• Level 1 – unadjusted quoted prices in active markets for identical investments
• Level 2 – other significant observable inputs (including quoted prices for similar investments, interest rates, prepayment speeds, credit risk, etc.)
• Level 3 – significant unobservable inputs including the Fund's own assumptions in determining the fair value of investments. Factors considered in making this determination may include, but are not limited to, information obtained by contacting the issuer, analysts, or the appropriate stock exchange (for exchange-traded securities), analysis of the issuer's financial statements or other available documents and, if necessary, available information concerning other securities in similar circumstances
The inputs or methodology used for valuing securities are not necessarily an indication of the risk associated with investing in those securities and the determination of the significance of a particular input to the fair value measurement in its entirety requires judgment and considers factors specific to each security.
In May 2011, FASB issued Accounting Standards Update ("ASU") 2011-04. The amendments in this update are the results of the work of FASB and the International Accounting Standards Board to develop common requirements for measuring fair value and for disclosing information about fair value measurements, which are effective during interim and annual periods beginning after December 15, 2011. Consequently, these amendments improve the comparability of fair value measurements presented and disclosed in the financial statements prepared in accordance with GAAP and International Financial Reporting Standards. At this time, the Fund's management is evaluating the implications of ASU 2011-04.
247
2011 Annual Report
December 31, 2011
Notes to Financial Statements (cont'd)
10. Indemnifications: The Fund enters into contracts that contain a variety of indemnifications. The Fund's maximum exposure under these arrangements is unknown. However, the Fund has not had prior claims or losses pursuant to these contracts and expects the risk of loss to be remote.
11. Other: Security transactions are accounted for on the date the securities are purchased or sold. Realized gains (losses) on the sale of investment securities are determined on the specific identified cost basis. Dividend income and distributions are recorded on the ex-dividend date (except for certain foreign dividends which may be recorded as soon as the Fund is informed of such dividends) net of applicable withholding taxes. Interest income is recognized on the accrual basis except where collection is in doubt. Discounts and premiums on securities purchased are amortized according to the effective yield method over their respective lives. Most expenses of the Fund can be directly attributed to a particular Portfolio. Expenses which cannot be directly attributed are apportioned among the Portfolios based upon relative net assets or other appropriate measures. Income, expenses (other than class specific expenses) and realized and unrealized gains or losses are allocated to each class of shares based upon their relative net assets
Certain Portfolios own shares of real estate investment trusts ("REITs") which report information on the source of their distributions annually. A portion of distributions received from REITs during the year is estimated to be a return of capital and is recorded as a reduction of their cost.
B. Investment Advisory/Sub-Advisory Fees: Morgan Stanley Investment Management Inc. (the "Adviser" or "MS Investment Management"), a wholly-owned subsidiary of Morgan Stanley, provides the Fund with investment advisory services under the terms of an Investment Advisory Agreement (the "Agreement") at the annual rates of the average daily net assets indicated below.
| Portfolio | | Average Daily
Net Assets | | Advisory
Fee | |
| Active International Allocation | | first $1.0 billion | | | 0.65 | % | |
| | | over $1.0 billion | | | 0.60 | | |
| Asian Equity | | first $1.0 billion | | | 0.95 | | |
| | | over $1.0 billion | | | 0.90 | | |
| Emerging Markets | | first $500 million | | | 1.25 | | |
| | | next $500 million | | | 1.20 | | |
| | | next $1.5 billion | | | 1.15 | | |
| | | over $2.5 billion | | | 1.00 | | |
| Global Advantage | | first $1.0 billion | | | 0.90 | | |
| | | over $1.0 billion | | | 0.85 | | |
| Portfolio | | Average Daily
Net Assets | | Advisory
Fee | |
| Global Discovery | | first $1.0 billion | | | 0.90 | % | |
| | | over $1.0 billion | | | 0.85 | | |
| Global Franchise | | first $500 million | | | 0.80 | | |
| | | next $500 million | | | 0.75 | | |
| | | over $1.0 billion | | | 0.70 | | |
| Global Insight | | first $1.0 billion | | | 1.00 | | |
| | | over $1.0 billion | | | 0.95 | | |
| Global Opportunity | | first $750 million | | | 0.90 | | |
| | | next $750 million | | | 0.85 | | |
| | | over $1.5 billion | | | 0.80 | | |
| Global Real Estate* | | | | | | | 0.85 | | |
| International Advantage | | first $1.0 billion | | | 0.90 | | |
| | | over $1.0 billion | | | 0.85 | | |
| International Equity | | first $10 billion | | | 0.80 | | |
| | | over $10 billion | | | 0.75 | | |
| International Opportunity | | first $1.0 billion | | | 0.90 | | |
| | | over $1.0 billion | | | 0.85 | | |
| International Real Estate | | | | | | | 0.80 | | |
| International Small Cap | | first $1.5 billion | | | 0.95 | | |
| | | over $1.5 billion | | | 0.90 | | |
| Select Global Infrastructure | | | | | | | 0.85 | | |
| Advantage | | first $750 million | | | 0.75 | | |
| | | next $750 million | | | 0.70 | | |
| | | over $1.5 billion | | | 0.65 | | |
| Focus Growth | | first $1.0 billion | | | 0.50 | | |
| | | next $1.0 billion | | | 0.45 | | |
| | | next $1.0 billion | | | 0.40 | | |
| | | over $3.0 billion | | | 0.35 | | |
| Growth | | first $1.0 billion | | | 0.50 | | |
| | | next $1.0 billion | | | 0.45 | | |
| | | next $1.0 billion | | | 0.40 | | |
| | | over $3.0 billion | | | 0.35 | | |
| Insight | | first $750 million | | | 0.80 | | |
| | | next $750 million | | | 0.75 | | |
| | | over $1.5 billion | | | 0.70 | | |
| Opportunity | | first $1.0 billion | | | 0.50 | | |
| | | next $1.0 billion | | | 0.45 | | |
| | | next $1.0 billion | | | 0.40 | | |
| | | over $ 3.0 billion | | | 0.35 | | |
| Small Company Growth | | first $1.0 billion | | | 0.92 | | |
| | | next $500 million | | | 0.85 | | |
| | | over $1.5 billion | | | 0.80 | | |
| U.S. Real Estate | | first $500 million | | | 0.80 | | |
| | | next $500 million | | | 0.75 | | |
| | | over $1.0 billion | | | 0.70 | | |
| Emerging Markets Debt | | first $500 million | | | 0.75 | | |
| | | next $500 million | | | 0.70 | | |
| | | over $1.0 billion | | | 0.65 | | |
* Effective July 1, 2011 the investment advisory service fees were reduced to the annual rate based on average daily net assets as follows:
| Global Real Estate | | first $2.5 billion | | | 0.85 | % | |
| | | over $2.5 billion | | | 0.80 | | |
MS Investment Management has agreed to waive fees payable to it and to reimburse the Portfolios for certain expenses, after giving effect to custody fee offsets, if necessary, if the total annual operating expenses, excluding certain investment related
248
2011 Annual Report
December 31, 2011
Notes to Financial Statements (cont'd)
expenses, expressed as a percentage of average daily net assets, exceed the maximum ratios indicated as follows:
| | | Maximum Expense Ratio | |
| | | Class I | | Class P | | Class H | | Class L | |
| Active International Allocation* | | | 0.80 | % | | | 1.05 | % | | | N/A | | | | N/A | | |
| Asian Equity | | | 1.45 | | | | 1.70 | | | | 1.70 | % | | | 2.20 | % | |
| Emerging Markets | | | 1.65 | | | | 1.90 | | | | N/A | | | | N/A | | |
| Global Advantage | | | 1.30 | | | | 1.55 | | | | 1.55 | | | | 2.05 | | |
| Global Discovery | | | 1.35 | | | | 1.60 | | | | 1.60 | | | | 2.10 | | |
| Global Franchise | | | 1.00 | | | | 1.25 | | | | N/A | | | | N/A | | |
| Global Insight | | | 1.35 | | | | N/A | | | | 1.60 | | | | 2.10 | | |
| Global Opportunity | | | 1.25 | | | | 1.50 | | | | 1.50 | | | | 1.55 | | |
| Global Real Estate | | | 1.05 | | | | 1.30 | | | | 1.30 | | | | 1.80 | | |
| International Advantage | | | 1.25 | | | | 1.50 | | | | 1.50 | | | | 2.00 | | |
| International Equity | | | 0.95 | | | | 1.20 | | | | N/A | | | | N/A | | |
| International Opportunity | | | 1.15 | | | | 1.40 | | | | 1.40 | | | | 1.90 | | |
| International Real Estate | | | 1.00 | | | | 1.25 | | | | N/A | | | | N/A | | |
| International Small Cap | | | 1.15 | | | | 1.40 | | | | N/A | | | | N/A | | |
| Select Global Infrastructure | | | 1.15 | | | | 1.40 | | | | 1.40 | | | | 1.90 | | |
| Advantage | | | 1.05 | | | | 1.30 | | | | 1.30 | | | | 1.09 | | |
| Focus Growth | | | 1.00 | | | | 1.25 | | | | N/A | | | | N/A | | |
| Growth | | | 0.80 | | | | 1.05 | | | | N/A | | | | N/A | | |
| Insight | | | 1.05 | | | | N/A | | | | 1.30 | | | | 1.80 | | |
| Opportunity | | | 0.88 | | | | 1.13 | | | | 1.13 | | | | 1.63 | | |
| Small Company Growth | | | 1.05 | | | | 1.30 | | | | 1.30 | | | | 1.80 | | |
| U.S. Real Estate | | | 1.00 | | | | 1.25 | | | | 1.25 | | | | 1.75 | | |
| Emerging Markets Debt | | | 0.85 | | | | 1.10 | | | | 1.10 | | | | 1.60 | | |
* Effective July 1, 2011 the maximum expense ratio was increased to the annual rate expressed as a percentage of average daily net assets as follows:
| | | Class I | | Class P | | Class H | | Class L | |
| Active International Allocation | | | 0.90 | % | | | 1.15 | % | | | N/A | | | | N/A | | |
The fee waivers and/or expense reimbursements will continue for one year or until such time as the Fund's Board of Directors acts to discontinue all or a portion of such waivers and/or expense reimbursements when it deems that such action is appropriate. For the year ended December 31, 2011, the following Portfolios had advisory fees waived and/or certain expenses reimbursed as follows:
| Portfolio | | Advisory Fees
Waived and/or
Reimbursed
(000) | |
| Active International Allocation | | $ | 407 | | |
| Asian Equity | | | 152 | | |
| Global Advantage | | | 130 | | |
| Global Discovery | | | 115 | | |
| Global Franchise | | | 16 | | |
| Global Insight | | | 26 | | |
| Global Opportunity | | | 208 | | |
| Global Real Estate | | | 2 | | |
| International Advantage | | | 126 | | |
| International Equity | | | 1,356 | | |
| International Opportunity | | | 180 | | |
| International Small Cap | | | 153 | | |
| Select Global Infrastructure | | | 210 | | |
| Advantage | | | 162 | | |
| Focus Growth | | | 22 | | |
| Insight | | | 26 | | |
| Portfolio | | Advisory Fees
Waived and/or
Reimbursed
(000) | |
| Opportunity | | $ | 184 | | |
| Small Company Growth | | | 855 | | |
| U.S. Real Estate | | | 140 | | |
| Emerging Markets Debt | | | 238 | | |
The Adviser has entered into Sub-Advisory Agreements with Morgan Stanley Investment Management Limited and Morgan Stanley Investment Management Company (together, the "Sub-Advisers"), each a wholly-owned subsidiary of Morgan Stanley. The Sub-Advisers, subject to the control and supervision of the Fund, its Officers, Directors and the Adviser, and in accordance with the investment objectives, policies and restrictions of the Portfolios, make certain day-to-day investment decisions for certain Portfolios and place certain of the Portfolios' purchase and sales orders. The Adviser pays the Sub-Advisers on a monthly basis a portion of the net advisory fees the Adviser receives from the Portfolios which receive these services.
C. Administration Fees: MS Investment Management (the "Administrator") also provides the Fund with administrative services pursuant to an Administration Agreement for a monthly fee, which on an annual basis equals 0.08% of the average daily net assets of each Portfolio. Under a Sub-Administration Agreement between the Administrator and State Street Bank and Trust Company ("State Street"), State Street provides certain administrative services to the Fund. For such services, the Administrator pays State Street a portion of the fee the Administrator receives from the Fund.
D. Distribution and Shareholder Servicing Fees: Morgan Stanley Distribution, Inc. ("MSDI" or the "Distributor"), a wholly-owned subsidiary of the Adviser, and an indirect subsidiary of Morgan Stanley, serves as the Fund's Distributor of Portfolio shares pursuant to a Distribution agreement. The Fund had adopted Shareholder Service Plans with respect to Class P and Class H shares pursuant to Rule 12b-1 under the Act. Under the Shareholder Service Plans, each applicable Portfolio pays the Distributor a shareholder servicing fee, accrued daily and paid monthly, at an annual rate of 0.25% of the Portfolio's average daily net assets attributable to Class P and Class H shares.
The Fund has adopted a Distribution and Shareholder Services Plan with respect to Class L shares pursuant to Rule 12b-1 under the Act. Under the Distribution and Shareholder Services Plan, each applicable Portfolio pays the Distributor a distribution fee, accrued daily and paid monthly, at an annual rate of 0.50% and a shareholder service fee, accrued daily and paid monthly, at an annual rate of 0.25% of the Portfolio's average daily net assets attributable to Class L shares. The Distributor has agreed to waive for at least one year the 12b-1 fees on Class L shares of the Advantage Portfolio and the Global
249
2011 Annual Report
December 31, 2011
Notes to Financial Statements (cont'd)
Opportunity Portfolio to the extent it exceeds 0.04% and 0.30%, respectively, of the average daily net assets of such shares on an annualized basis. For the year ended December 31, 2011, the Advantage Portfolio waived approximately $1,000 and Global Opportunity Portfolio waived approximately $3,000.
The distribution and shareholder servicing fees are used to support the expenses associated with servicing and maintaining accounts. The Distributor may compensate other parties for providing shareholder support services to investors who purchase Class P, Class H and Class L shares.
E. Dividend Disbursing and Transfer Agent: The Fund's dividend disbursing and transfer agent is Morgan Stanley Services Company Inc. ("Morgan Stanley Services"). Pursuant to a transfer agency agreement, the Fund pays Morgan Stanley Services a fee based on the number of classes, accounts and transactions relating to the Portfolios of the Fund.
F. Custodian Fees: State Street (the "Custodian") serves as Custodian for the Fund in accordance with a custodian agreement. The Custodian holds cash, securities, and other assets of the Fund as required by the Act. Custody fees are payable monthly based on assets held in custody, investment purchases and sales activity and account maintenance fees, plus reimbursement for certain out-of-pocket expenses.
The Fund has entered into an arrangement with its Custodian whereby credits realized on uninvested cash balances were used to offset a portion of each Portfolio's expenses. If applicable, these custodian credits are shown as "Expense Offset" in the Statements of Operations.
G. Portfolio Investment Activity:
1. Security Transactions: For the year ended December 31, 2011, purchases and sales of investment securities, other than long-term U.S. Government securities and short-term investments, were:
| Portfolio | | Purchases
(000) | | Sales
(000) | |
| Active International Allocation | | $ | 97,894 | | | $ | 203,201 | | |
| Asian Equity | | | 639 | | | | 548 | | |
| Emerging Markets | | | 1,004,688 | | | | 1,529,106 | | |
| Global Advantage | | | 2,342 | | | | 889 | | |
| Global Discovery | | | 4,965 | | | | 2,260 | | |
| Global Franchise | | | 163,256 | | | | 50,308 | | |
| Global Insight* | | | 694 | | | | — | | |
| Global Opportunity | | | 6,984 | | | | 4,824 | | |
| Global Real Estate | | | 813,148 | | | | 407,817 | | |
| International Advantage | | | 1,206 | | | | 548 | | |
| International Equity | | | 1,417,070 | | | | 1,425,970 | | |
| International Opportunity | | | 2,427 | | | | 2,498 | | |
| International Real Estate | | | 58,175 | | | | 181,887 | | |
| International Small Cap | | | 239,644 | | | | 289,787 | | |
| Select Global Infrastructure | | | 6,878 | | | | 5,869 | | |
| Advantage | | | 3,467 | | | | 1,894 | | |
| Focus Growth | | | 13,877 | | | | 8,286 | | |
| Growth | | | 221,051 | | | | 225,852 | | |
| Portfolio | | Purchases
(000) | | Sales
(000) | |
| Insight* | | $ | 657 | | | $ | — | | |
| Opportunity | | | 59,105 | | | | 108,398 | | |
| Small Company Growth | | | 411,247 | | | | 701,379 | | |
| U.S. Real Estate | | | 193,358 | | | | 292,505 | | |
| Emerging Markets Debt | | | 87,587 | | | | 48,304 | | |
* For the period December 28, 2011 to December 31, 2011.
There were no purchases and sales of long-term U.S. Government securities for the year ended December 31, 2011.
2. Transactions with Affiliates: The Portfolios invest in the Institutional Class of the Morgan Stanley Institutional Liquidity Funds — (the "Liquidity Funds"), an open-end management investment company managed by the Adviser, both directly, and as a portion of the securities held as collateral on loaned securities. A summary of the Portfolio's transactions in shares of the Liquidity Funds during the year ended December 31, 2011 is as follows:
| Portfolio | | Value
December 31,
2010
(000) | | Purchases
at Cost
(000) | | Sales
(000) | | Dividend
Income
(000) | | Value
December 31,
2011
(000) | |
Active International
Allocation | | $ | 21,765 | | | $ | 184,692 | | | $ | 155,410 | | | $ | 27 | | | $ | 51,047 | | |
| Asian Equity | | | 128 | | | | 547 | | | | 500 | | | | — | @ | | | 175 | | |
| Emerging Markets | | | 107,751 | | | | 649,916 | | | | 620,055 | | | | 48 | | | | 137,612 | | |
| Global Advantage | | | 911 | | | | 1,700 | | | | 2,510 | | | | — | @ | | | 101 | | |
| Global Discovery | | | 960 | | | | 3,093 | | | | 3,919 | | | | — | @ | | | 134 | | |
| Global Franchise | | | 2,873 | | | | 135,451 | | | | 130,512 | | | | 2 | | | | 7,812 | | |
| Global Insight* | | | — | | | | 830 | | | | 327 | | | | — | @ | | | 503 | | |
| Global Opportunity | | | 101 | | | | 5,989 | | | | 5,802 | | | | — | @ | | | 288 | | |
| Global Real Estate | | | 35,380 | | | | 610,946 | | | | 601,101 | | | | 63 | | | | 45,225 | | |
International
Advantage | | | 503 | | | | 779 | | | | 1,282 | | | | — | @ | | | — | | |
| International Equity | | | 155,321 | | | | 1,208,635 | | | | 1,194,965 | | | | 127 | | | | 168,991 | | |
International
Opportunity | | | 65 | | | | 2,051 | | | | 2,044 | | | | — | @ | | | 72 | | |
International Real
Estate | | | 583 | | | | 90,601 | | | | 91,101 | | | | 3 | | | | 83 | | |
International
Small Cap | | | 9,956 | | | | 125,743 | | | | 126,478 | | | | 7 | | | | 9,221 | | |
Select Global
Infrastructure | | | 271 | | | | 4,775 | | | | 4,685 | | | | — | @ | | | 361 | | |
| Advantage | | | 95 | | | | 3,440 | | | | 3,149 | | | | — | @ | | | 386 | | |
| Focus Growth | | | 793 | | | | 17,503 | | | | 16,569 | | | | 2 | | | | 1,727 | | |
| Growth | | | 48,692 | | | | 164,612 | | | | 200,395 | | | | 25 | | | | 12,909 | | |
| Insight* | | | — | | | | 830 | | | | — | | | | — | @ | | | 830 | | |
| Opportunity | | | 3,180 | | | | 79,005 | | | | 80,560 | | | | 3 | | | | 1,625 | | |
Small Company
Growth | | | 44,047 | | | | 562,249 | | | | 574,752 | | | | 51 | | | | 31,544 | | |
| U.S. Real Estate | | | 35,795 | | | | 158,883 | | | | 189,999 | | | | 30 | | | | 4,679 | | |
Emerging Markets
Debt | | | 4,671 | | | | 71,492 | | | | 63,493 | | | | 13 | | | | 12,670 | | |
@ Amount is less than $500.
* For the period December 28, 2011 to December 31, 2011.
Investment Advisory fees paid by each Portfolio are reduced by an amount equal to its pro-rata share of the advisory and administration fees paid by the Portfolios due to its investment in the Liquidity Funds ("Rebate"). For the
250
2011 Annual Report
December 31, 2011
Notes to Financial Statements (cont'd)
year ended December 31, 2011, advisory fees paid were reduced as follows:
| Portfolio | | Rebate
(000) | |
| Active International Allocation | | $ | 26 | | |
| Asian Equity | | | — | @ | |
| Emerging Markets | | | 69 | | |
| Global Advantage | | | — | @ | |
| Global Discovery | | | — | @ | |
| Global Franchise | | | 9 | | |
| Global Opportunity | | | — | @ | |
| Global Real Estate | | | 58 | | |
| International Advantage | | | — | @ | |
| International Equity | | | 131 | | |
| International Opportunity | | | — | @ | |
| International Real Estate | | | 3 | | |
| International Small Cap | | | 7 | | |
| Select Global Infrastructure | | | — | @ | |
| Advantage | | | — | @ | |
| Focus Growth | | | 2 | | |
| Growth | | | 26 | | |
| Opportunity | | | 3 | | |
| Small Company Growth | | | 51 | | |
| U.S. Real Estate | | | 27 | | |
| Emerging Markets Debt | | | 13 | | |
@ Amount is less than $500
The Emerging Markets Portfolio invests in Morgan Stanley Growth Fund, an open-end management investment company advised by an affiliate of the Adviser. The Morgan Stanley Growth Fund has a cost basis of approximately $1,667,000 at December 31, 2011. Advisory fees paid by the Portfolio are reduced by an amount equal to its pro-rata share of the advisory and administration fees paid by the Morgan Stanley Growth Fund. For the year ended December 31, 2011, advisory fees paid were reduced by approximately $156,000 relating to the Portfolio's investment in the Morgan Stanley Growth Fund.
A summary of the Portfolio's transactions in shares of the Morgan Stanley Growth Fund during the year ended December 31, 2011 is as follows:
Value
December 31,
2010
(000) | | Purchases
at Cost
(000) | | Sales
(000) | | Realized
Gain/Loss
(000) | | Dividend
Income
(000) | | Value
December 31,
2011
(000) | |
| $ | 21,813 | | | $ | — | | | $ | 6,434 | | | $ | 5,322 | | | $ | — | | | $ | 7,822 | | |
The Active International Allocation Portfolio invests in Mitsubishi UFJ Financial Group, Inc., an affiliate of the Adviser, Sub-Advisers, Administrator and Distributor. Mitsubishi UFJ Financial Group, Inc. was acquired at a cost of approximately $2,647,000.
A summary of the Portfolio's transactions in shares of the Mitsubishi UFJ Financial Group, Inc. during the year ended December 31, 2011 is as follows:
Value
December 31,
2010
(000) | | Purchases
at Cost
(000) | | Sales
(000) | | Realized
Gain/Loss
(000) | | Dividend
Income
(000) | | Value
December 31,
2011
(000) | |
| $ | 1,371 | | | $ | — | | | $ | 74 | | | $ | (81 | ) | | $ | 33 | | | $ | 1,018 | | |
During the year ended December 31, 2011, the following Portfolios incurred brokerage commissions with Morgan Stanley & Co., LLC, an affiliate of the Adviser, Sub-Advisers, Administrator and Distributor, for portfolio transactions executed on behalf of each Portfolio:
| Portfolio | | Broker
Commissions
(000) | |
| Asian Equity | | $ | — | @ | |
| Emerging Markets | | | 69 | | |
| Global Advantage | | | — | @ | |
| Global Discovery | | | — | @ | |
| Global Franchise | | | — | @ | |
| Global Opportunity | | | — | @ | |
| Global Real Estate | | | 37 | | |
| International Advantage | | | — | @ | |
| International Opportunity | | | — | @ | |
| Select Global Infrastructure | | | — | @ | |
| Advantage | | | — | @ | |
| Focus Growth | | | 1 | | |
| Opportunity Portfolio | | | 14 | | |
| Small Company Growth | | | 7 | | |
| U.S. Real Estate | | | 28 | | |
@ Amount is less than $500
During the year ended December 31, 2011, the following Portfolios incurred brokerage commissions with Citigroup, Inc. and its affiliated broker/dealers, which may be deemed affiliates of the Adviser, Sub-Advisers, Administrator and Distributor under Section 17 of the Act, for portfolio transactions executed on behalf of each Portfolio:
| Portfolio | | Broker
Commissions
(000) | |
| Active International Allocation | | $ | 3 | | |
| Asian Equity | | | — | @ | |
| Emerging Markets | | | 268 | | |
| Global Franchise | | | 5 | | |
| Global Real Estate | | | 23 | | |
| International Equity | | | 120 | | |
| International Real Estate | | | 9 | | |
| International Small Cap | | | 3 | | |
| Select Global Infrastructure | | | 2 | | |
| Focus Growth | | | — | @ | |
| Growth | | | — | @ | |
| Small Company Growth | | | 10 | | |
| U.S. Real Estate | | | 2 | | |
@ Amount is less than $500.
251
2011 Annual Report
December 31, 2011
Notes to Financial Statements (cont'd)
H. Federal Income Taxes: It is each Portfolio's intention to continue to qualify as a regulated investment company and distribute all of its taxable and tax-exempt income. Accordingly, no provision for Federal income taxes is required in the financial statements. Dividend income and distributions to shareholders are recorded on the ex-dividend date.
A Portfolio may be subject to taxes imposed by countries in which it invests. Such taxes are generally based on income and/or capital gains earned or repatriated. Taxes are accrued based on net investment income, net realized gains and net unrealized appreciation as such income and/or gains are earned. Taxes may also be based on transactions in foreign currency and are accrued based on the value of investments denominated in such currency.
FASB ASC 740-10 "Income Taxes — Overall" sets forth a minimum threshold for financial statement recognition of the benefit of a tax position taken or expected to be taken in a tax return. Management has concluded there are no significant uncertain tax positions that would require recognition in the financial statements. If applicable, the Portfolios recognize interest accrued related to unrecognized tax benefits in "Interest Expense" and penalties in "Other Expenses" in the Statements of Operations. The Portfolios file tax returns with the U.S. Internal Revenue Service, New York and various states. Each of the tax years in the four-year period ended December 31, 2011, remains subject to examination by taxing authorities.
The tax character of distributions paid may differ from the character of distributions shown in the Statements of Changes in Net Assets due to short-term capital gains being treated as ordinary income for tax purposes. The tax character of distributions paid during fiscal 2011 and 2010 was as follows:
| | | 2011
Distributions
Paid From: | | 2010
Distributions
Paid From: | |
| Portfolio | | Ordinary
Income
(000) | | Long-term
Capital Gain
(000) | | Ordinary
Income
(000) | | Long-term
Capital Gain
(000) | |
| Active International Allocation | | $ | 6,935 | | | $ | — | | | $ | 9,151 | | | $ | — | | |
| Emerging Markets | | | — | | | | 25,277 | | | | 16,513 | | | | — | | |
| Global Advantage | | | 16 | | | | — | | | | — | | | | — | | |
| Global Discovery | | | 47 | | | | — | | | | — | | | | — | | |
| Global Franchise | | | 3,615 | | | | 2,396 | | | | 2,936 | | | | — | | |
| Global Opportunity | | | 211 | | | | 738 | | | | — | | | | — | | |
| Global Real Estate | | | 28,756 | | | | — | | | | 23,862 | | | | — | | |
| International Advantage | | | 42 | | | | — | | | | — | | | | — | | |
| International Equity | | | 94,031 | | | | — | | | | 60,000 | | | | — | | |
| International Opportunity | | | 106 | | | | 218 | | | | — | | | | — | | |
| International Real Estate | | | 9,425 | | | | — | | | | 13,160 | | | | — | | |
| International Small Cap | | | — | | | | — | | | | 1,418 | | | | — | | |
| Select Global Infrastructure | | | 612 | | | | — | | | | 82 | | | | — | | |
| Advantage | | | 47 | | | | — | | | | 18 | | | | — | | |
| Growth | | | 1,728 | | | | — | | | | 15 | | | | — | | |
| Small Company Growth | | | — | | | | 25,870 | | | | — | | | | — | | |
| U.S. Real Estate | | | 8,410 | | | | — | | | | 12,294 | | | | — | | |
| Emerging Markets Debt | | | 3,852 | | | | 949 | | | | 4,823 | | | | 68 | | |
The amount and character of income and gains to be distributed are determined in accordance with income tax regulations which may differ from GAAP. These book/tax differences are either considered temporary or permanent in nature.
Temporary differences are attributable to differing book and tax treatments for the timing of the recognition of gains (losses) on certain investment transactions and the timing of the deductibility of certain expenses.
Permanent differences, primarily due to differing treatments of gains (losses) related to REIT adjustments, foreign currency transactions, defaulted bonds, paydown adjustments, return of capital from certain securities, expiring capital losses, distribution redesignations, foreign taxes paid on capital gains, net operating losses, nondeductible expenses, merger adjustments, certain equity securities designated as issued by "passive foreign investment companies" and excess distributions, resulted in the following reclassifications among the Portfolios' components of net assets at December 31, 2011:
| Portfolio | | Accumulated
Undistributed
(Distributions
in Excess of) Net
Investment
Income (Loss)
(000) | | Accumulated
Net Realized
Gain (Loss)
(000) | | Paid-in
Capital
(000) | |
| Active International Allocation | | $ | (3,033 | ) | | $ | 3,034 | | | $ | (1 | ) | |
| Asian Equity | | | 1 | | | | 1 | | | | (2 | ) | |
| Emerging Markets | | | (3,952 | ) | | | 4,370 | | | | (418 | ) | |
| Global Advantage | | | (1 | ) | | | 1 | | | | — | | |
| Global Discovery | | | 8 | | | | (8 | ) | | | — | @ | |
| Global Franchise | | | 252 | | | | (251 | ) | | | (1 | ) | |
| Global Insight | | | (— | @) | | | — | @ | | | — | | |
| Global Opportunity | | | 37 | | | | 1 | | | | (38 | ) | |
| Global Real Estate | | | 8,717 | | | | (8,479 | ) | | | (238 | ) | |
| International Advantage | | | — | @ | | | (— | @) | | | — | | |
| International Equity | | | (3,140 | ) | | | 3,140 | | | | — | | |
| International Opportunity | | | (1 | ) | | | 2 | | | | (1 | ) | |
| International Real Estate | | | 1,642 | | | | (1,642 | ) | | | — | | |
| International Small Cap | | | (2,123 | ) | | | 2,123 | | | | — | @ | |
| Select Global Infrastructure | | | (— | @) | | | — | @ | | | — | | |
| Advantage | | | (— | @) | | | — | @ | | | (— | @) | |
| Focus Growth | | | 74 | | | | (1 | ) | | | (73 | ) | |
| Growth | | | 1 | | | | (1 | ) | | | — | | |
| Insight | | | (— | @) | | | — | | | | — | @ | |
| Opportunity | | | 903 | | | | 47 | | | | (950 | ) | |
| Small Company Growth | | | 4,652 | | | | 722 | | | | (5,374 | ) | |
| U.S. Real Estate | | | 2,209 | | | | 902 | | | | (3,111 | ) | |
| Emerging Markets Debt | | | (669 | ) | | | 669 | | | | — | @ | |
@ Amount is less than $500
252
2011 Annual Report
December 31, 2011
Notes to Financial Statements (cont'd)
At December 31, 2011, the components of distributable earnings on a tax basis were as follows:
| Portfolio | | Undistributed
Ordinary
Income
(000) | | Undistributed
Long-term
Capital Gain
(000) | |
| Global Discovery | | $ | 16 | | | $ | — | | |
| Global Insight | | | 1 | | | | — | | |
| Global Opportunity | | | — | | | | 44 | | |
| International Equity | | | 729 | | | | — | | |
| International Real Estate | | | 5,344 | | | | — | | |
| International Small Cap | | | 2,527 | | | | — | | |
| Select Global Infrastructure | | | — | | | | 91 | | |
| Growth | | | 35 | | | | — | | |
| Small Company Growth | | | — | | | | 3,808 | | |
| U.S. Real Estate | | | 335 | | | | — | | |
| Emerging Markets Debt | | | — | | | | 15 | | |
Any Portfolios not shown above had no distributable earnings on a tax basis at December 31, 2011.
At December 31, 2011, cost, unrealized appreciation, unrealized depreciation, and net unrealized appreciation (depreciation) for U.S. Federal income tax purposes of the investments of each of the Portfolios were:
| Portfolio | | Cost
(000) | | Appreciation
(000) | | Depreciation
(000) | | Net
Appreciation
(Depreciation)
(000) | |
Active International
Allocation | | $ | 375,913 | | | $ | 26,271 | | | $ | (66,642 | ) | | $ | (40,371 | ) | |
| Asian Equity | | | 1,682 | | | | 49 | | | | (208 | ) | | | (159 | ) | |
| Emerging Markets | | | 1,353,511 | | | | 152,234 | | | | (117,361 | ) | | | 34,873 | | |
| Global Advantage | | | 2,647 | | | | 156 | | | | (141 | ) | | | 15 | | |
| Global Discovery | | | 4,006 | | | | 201 | | | | (462 | ) | | | (261 | ) | |
| Global Franchise | | | 207,498 | | | | 25,035 | | | | (5,649 | ) | | | 19,386 | | |
| Global Insight | | | 1,198 | | | | 7 | | | | (2 | ) | | | 5 | | |
| Global Opportunity | | | 11,609 | | | | 2,526 | | | | (530 | ) | | | 1,996 | | |
| Global Real Estate | | | 1,703,013 | | | | 73,531 | | | | (300,564 | ) | | | (227,033 | ) | |
| International Advantage | | | 2,164 | | | | 106 | | | | (185 | ) | | | (79 | ) | |
| International Equity | | | 4,058,834 | | | | 363,435 | | | | (436,681 | ) | | | (73,246 | ) | |
| International Opportunity | | | 5,549 | | | | 748 | | | | (524 | ) | | | 224 | | |
| International Real Estate | | | 405,765 | | | | 1,015 | | | | (196,132 | ) | | | (195,117 | ) | |
| International Small Cap | | | 378,009 | | | | 10,071 | | | | (89,224 | ) | | | (79,153 | ) | |
| Select Global Infrastructure | | | 11,449 | | | | 1,595 | | | | (191 | ) | | | 1,404 | | |
| Advantage | | | 7,298 | | | | 1,387 | | | | (257 | ) | | | 1,130 | | |
| Focus Growth | | | 24,079 | | | | 2,912 | | | | (2,977 | ) | | | (65 | ) | |
| Growth | | | 642,208 | | | | 228,712 | | | | (92,092 | ) | | | 136,620 | | |
| Insight | | | 1,487 | | | | 7 | | | | (2 | ) | | | 5 | | |
| Opportunity | | | 210,206 | | | | 62,341 | | | | (26,354 | ) | | | 35,987 | | |
| Small Company Growth | | | 1,213,395 | | | | 326,810 | | | | (138,837 | ) | | | 187,973 | | |
| U.S. Real Estate | | | 824,573 | | | | 126,913 | | | | (52,664 | ) | | | 74,249 | | |
| Emerging Markets Debt | | | 88,095 | | | | 1,863 | | | | (7,550 | ) | | | (5,687 | ) | |
On December 22, 2010, the Regulated Investment Company Modernization Act of 2010 (the "Modernization Act") was signed into law. The Modernization Act modernizes several tax provisions related to Regulated Investment Companies ("RICs") and their shareholders. One key change made by the Modernization Act is that capital losses will generally retain their character as short-term or long-term and may be carried forward indefinitely to offset future gains. These losses are utilized before other capital loss carryforwards that expire. Generally, the Modernization Act is effective for taxable years beginning after December 22, 2010.
At December 31, 2011, the following Portfolios had available for Federal income tax purposes unused short term and long term capital losses that will not expire:
| Portfolio | | Short-term Losses
(No Expiration)
(000) | | Long-term Losses
(No Expiration)
(000) | |
| Asian Equity | | $ | 55 | | | $ | — | | |
| Global Advantage | | | 1 | | | | — | | |
| International Real Estate | | | 3,549 | | | | 88,205 | | |
In addition, at December 31, 2011, the following Portfolios had available capital loss carryforwards to offset future net capital gains, to the extent provided by regulations, through the indicated expiration dates:
| | | Expiration Date December 31, | |
| Portfolio | | 2012
(000) | | 2016
(000) | | 2017
(000) | | 2018
(000) | | Total
(000) | |
| Active International Allocation | | $ | — | | | $ | — | | | $ | 55,336 | | | $ | — | | | $ | 55,336 | | |
| Global Franchise* | | | — | | | | — | | | | 3,809 | | | | — | | | | 3,809 | | |
| Global Real Estate | | | — | | | | — | | | | 130,652 | | | | 41,571 | | | | 172,223 | | |
| International Equity | | | — | | | | 392,794 | | | | 10,156 | | | | — | | | | 402,950 | | |
| International Real Estate | | | — | | | | 98,798 | | | | 217,627 | | | | 66,872 | | | | 383,297 | | |
| International Small Cap | | | — | | | | — | | | | 66,323 | | | | — | | | | 66,323 | | |
| Advantage | | | — | | | | — | | | | 32 | | | | — | | | | 32 | | |
| Focus Growth | | | — | | | | — | | | | 88 | | | | — | | | | 88 | | |
| Growth | | | — | | | | — | | | | 90,712 | | | | — | | | | 90,712 | | |
| Opportunity | | | — | | | | 8,138 | | | | — | | | | — | | | | 8,138 | | |
| Small Company Growth* | | | — | | | | 2,198 | | | | 452 | | | | — | | | | 2,650 | | |
| U.S. Real Estate | | | — | | | | — | | | | 3,508 | | | | — | | | | 3,508 | | |
* Capital loss carryforward from target fund.
The amounts reflected in the capital loss carryforward table for Global Franchise Portfolio includes approximately $7,795,000 capital loss carryforward brought forward as a result of the Portfolio's merger with the Global Value Equity Portfolio in October 2009. Based on certain provisions in the Internal Revenue Code, various limitations regarding the future utilization of these carryforwards may apply. This acquired capital loss carryforward is expected to expire in 2017. During the year ended December 31, 2011, Global Franchise utilized approximately $3,986,000 of its capital loss carryforward.
The amounts reflected in the capital loss carryforward table for Small Company Growth Portfolio includes approximately $2,650,000 capital loss carryforward brought forward as a result of the Portfolio's merger with the Morgan Stanley Special
253
2011 Annual Report
December 31, 2011
Notes to Financial Statements (cont'd)
Growth Fund in November 2011. Based on certain provisions in the Internal Revenue Code, various limitations regarding the future utilization of these carryforwards may apply. The acquired capital loss carryforward is expected to expire in 2016 and 2017.
During the year ended December 31, 2011, the following Portfolios utilized capital loss carryforwards for U.S. Federal income tax purposes as follows:
| Portfolio | | Utilized Capital
Loss Carryforwards
(000) | |
| Active International Allocation | | $ | 15,840 | | |
| Emerging Markets | | | 68,600 | | |
| Global Franchise | | | 3,986 | | |
| Global Real Estate | | | 79,396 | | |
| International Equity | | | 68,754 | | |
| International Opportunity | | | 23 | | |
| International Small Cap | | | 24,747 | | |
| Advantage | | | 122 | | |
| Focus Growth | | | 1,400 | | |
| Growth | | | 76,743 | | |
| Opportunity | | | 24,742 | | |
| Small Company Growth | | | 20,205 | | |
| U.S. Real Estate | | | 87,445 | | |
To the extent that capital loss carryovers are used to offset any future capital gains realized during the carryover period as provided by U.S. Federal income tax regulations, no capital gains tax liability will be incurred by a Portfolio for gains realized and not distributed. To the extent that capital gains are offset, such gains will not be distributed to the shareholders.
Capital losses and specified ordinary losses, including currency losses, incurred after October 31 but within the taxable year are deemed to arise on the first day of the Portfolio's next taxable year. For the year ended December 31, 2011, the Portfolio deferred to January 1, 2012 for U.S. Federal income tax purposes the following losses:
| Portfolio | | Specified Ordinary
Losses
(000) | | Capital
Losses
(000) | |
| Active International Allocation | | $ | 2,015 | | | $ | 3,937 | | |
| Asian Equity | | | — | @ | | | 13 | | |
| Emerging Markets | | | 3,378 | | | | 563 | | |
| Global Advantage | | | 5 | | | | — | | |
| Global Franchise | | | — | | | | 448 | | |
| Global Opportunity | | | — | | | | 114 | | |
| Global Real Estate | | | 2,221 | | | | — | | |
| International Advantage | | | — | | | | 6 | | |
| International Opportunity | | | — | | | | 64 | | |
| International Real Estate | | | — | | | | 5,904 | | |
| International Small Cap | | | — | | | | 1,205 | | |
| Select Global Infrastructure | | | — | | | | 2 | | |
| Advantage | | | 16 | | | | — | | |
| Focus Growth | | | — | | | | 196 | | |
| Opportunity | | | 12 | | | | 2,494 | | |
| Small Company Growth | | | 15 | | | | — | | |
| Emerging Markets Debt | | | 28 | | | | — | | |
@ Amount is less than $500.
I. Other (unaudited): The net assets of certain Portfolios include foreign denominated securities and currency. Changes in currency exchange rates will affect the U.S. dollar value of and investment income from such securities. Further, at times certain of the Portfolios' investments are concentrated in a limited number of countries and regions. This concentration may further increase the risk of the Portfolio.
Global Real Estate, International Real Estate and U.S. Real Estate Portfolios invest a significant portion of their assets in securities of real estate investment trusts (REITs). The market's perception of prospective declines in private real estate values and other financial assets may result in increased volatility of market prices that can negatively impact the valuation of certain issuers held by the Portfolios.
The Emerging Markets Debt Portfolio holds a significant portion of its investments in securities which are traded by a small number of market makers who may also be utilized by the Portfolio to provide pricing information used to value such investments. The amounts realized upon disposition of these securities may differ from the value reflected on the Statements of Assets and Liabilities.
Settlement and registration of foreign securities transactions may be subject to significant risks not normally associated with investments in the United States. In certain markets, including Russia, ownership of shares is defined according to entries in the issuer's share register. In Russia, currently no central registration system exists and the share registrars may not be subject to effective state supervision. It is possible that a Portfolio could lose its share registration through fraud, negligence or even mere oversight. In addition, shares being delivered for sales and cash being paid for purchases may be delivered before the exchange is complete. This may subject the Portfolio to further risk of loss in the event of counterparty's failure to complete the transaction.
254
2011 Annual Report
December 31, 2011
Notes to Financial Statements (cont'd)
At December 31, 2011, certain Portfolios had otherwise unaffiliated record owners of 10% or greater. Investment activities of these shareholders could have a material impact on these Portfolios.
These Portfolios and the aggregate percentage of such owners were as follows:
| | | Percentage of Ownership | |
| Portfolio | | Class I | | Class P | | Class H | | Class L | |
| Active International Allocation | | | — | % | | | 15.2 | % | | | — | % | | | — | % | |
| Emerging Markets | | | 62.2 | | | | 66.8 | | | | — | | | | — | | |
| Global Advantage | | | — | | | | — | | | | 22.5 | | | | — | | |
| Global Discovery | | | — | | | | — | | | | 30.2 | | | | — | | |
| Global Franchise | | | 55.0 | | | | 51.2 | | | | — | | | | — | | |
| Global Insight | | | — | | | | — | | | | 98.8 | | | | — | | |
| Global Opportunity | | | 43.7 | | | | — | | | | — | | | | 33.3 | | |
| Global Real Estate | | | — | | | | 85.4 | | | | 52.8 | | | | — | | |
| International Equity | | | 35.1 | | | | 86.4 | | | | — | | | | — | | |
| International Real Estate | | | 83.9 | | | | — | | | | — | | | | — | | |
| International Small Cap | | | 74.5 | | | | 98.0 | | | | — | | | | — | | |
| Advantage | | | 27.7 | | | | — | | | | — | | | | 24.0 | | |
| Focus Growth | | | 65.7 | | | | 70.8 | | | | — | | | | — | | |
| Growth | | | 45.4 | | | | 69.9 | | | | — | | | | — | | |
| Insight | | | — | | | | — | | | | 98.8 | | | | — | | |
| Opportunity | | | 67.8 | | | | 99.5 | | | | — | | | | 10.7 | | |
| Small Company Growth | | | 37.3 | | | | 64.2 | | | | — | | | | — | | |
| U.S. Real Estate | | | 32.7 | | | | 66.9 | | | | — | | | | — | | |
| Emerging Markets Debt | | | 76.5 | | | | 61.0 | | | | — | | | | — | | |
255
2011 Annual Report
December 31, 2011
Report of Independent Registered Public Accounting Firm
To the Shareholders and Board of Directors of
Morgan Stanley Institutional Fund, Inc.
We have audited the accompanying statements of assets and liabilities of Active International Allocation Portfolio, Asian Equity Portfolio, Emerging Markets Portfolio, Global Advantage Portfolio, Global Discovery Portfolio, Global Franchise Portfolio, Global Opportunity Portfolio, Global Real Estate Portfolio, International Advantage Portfolio, International Equity Portfolio, International Opportunity Portfolio, International Real Estate Portfolio, International Small Cap Portfolio, Select Global Infrastructure Portfolio, Advantage Portfolio, Focus Growth Portfolio, Growth Portfolio (formerly Capital Growth Portfolio), Opportunity Portfolio, Small Company Growth Portfolio, U.S. Real Estate Portfolio, and Emerging Markets Debt Portfolio, including the portfolios of investments, as of December 31, 2011, and the related statements of operations for the year then ended, the statements of changes in net assets and the financial highlights for each of the periods indicated therein. We have also audited the accompanying statements of assets and liabilities, including the portfolios of investments as of December 31, 2011 and the related statements of operations and changes in net assets, and the financial highlights for the period from December 28, 2011 (commencement of operations) to December 31, 2011 for Global Insight Portfolio and Insight Portfolio. The aforementioned twenty-three portfolios of the Morgan Stanley Institutional Fund, Inc. are hereafter referred to as the Portfolios. These financial statements and financial highlights are the responsibility of the Portfolios' management. Our responsibility is to express an opinion on these financial statements and financial highlights based on our audits. The financial highlights for years ended June 30, 2009, 2008 and 2007 for Opportunity Portfolio were audited by another independent registered public accounting firm whose report, dated August 21, 2009, expressed an unqualified opinion on those financial highlights.
We conducted our audits in accordance with the standards of the Public Company Accounting Oversight Board (United States). Those standards require that we plan and perform the audit to obtain reasonable assurance about whether the financial statements and financial highlights are free of material misstatement. We were not engaged to perform an audit of the Portfolios' internal control over financial reporting. Our audits included consideration of internal control over financial reporting as a basis for designing audit procedures that are appropriate in the circumstances, but not for the purpose of expressing an opinion on the effectiveness of the Portfolios' internal control over financial reporting. Accordingly, we express no such opinion. An audit also includes examining, on a test basis, evidence supporting the amounts and disclosures in the financial statements and financial highlights, assessing the accounting principles used and significant estimates made by management, and evaluating the overall financial statement presentation. Our procedures included confirmation of securities owned as of December 31, 2011, by correspondence with the custodian and others or by other appropriate auditing procedures where replies from others were not received. We believe that our audits provide a reasonable basis for our opinion.
In our opinion, the financial statements and financial highlights referred to above present fairly, in all material respects, the financial position of the aforementioned twenty-three portfolios comprising Morgan Stanley Institutional Fund, Inc. at December 31, 2011, the results of their operations, the changes in their net assets and the financial highlights for each of the periods indicated therein, in conformity with U.S. generally accepted accounting principles.

Boston, Massachusetts
February 24, 2012
256
2011 Annual Report
December 31, 2011
Federal Income Tax Information (unaudited)
For Federal income tax purposes, the following information is furnished with respect to the distributions paid by each applicable Portfolio during the taxable year ended December 31, 2011. For corporate shareholders, the following percentages of dividends paid by each Portfolio qualified for the dividends received deduction. Additionally, the following percentages of each Portfolio's dividends was attributable to qualifying U.S. Government obligations. (Please consult your tax advisor to determine if any portion of the dividends you received is exempt from state income tax.)
| Portfolio | | Dividends Received
Deduction % | | Qualifying U.S.
Govt. Income % | |
| Global Advantage | | | 45.6 | % | | | — | % | |
| Global Discovery | | | 15.8 | | | | — | | |
| Global Franchise | | | 44.0 | | | | — | | |
| Global Opportunity | | | 4.9 | | | | — | | |
| Select Global Infrastructure | | | 16.7 | | | | — | | |
| Advantage | | | 100.0 | | | | — | | |
| Growth | | | 100.0 | | | | — | | |
Each of the applicable Portfolios designated and paid the following amounts as a long-term capital gain distribution:
| Portfolio | | Amount
(000) | |
| Emerging Markets | | $ | 25,277 | | |
| Global Franchise | | | 2,396 | | |
| Global Opportunity | | | 738 | | |
| International Opportunity | | | 218 | | |
| Small Company Growth | | | 25,870 | | |
| Emerging Markets Debt | | | 949 | | |
For Federal income tax purposes, the following information is furnished with respect to the earnings of each applicable Portfolio for the taxable year ended December 31, 2011.
When distributed, certain earnings may be subject to a maximum rate of 15% as provided for the Jobs and Growth Tax Relief Reconciliation Act of 2004. Each of the applicable Portfolios designated up to the following maximum amounts as taxable at this lower rate:
| Portfolio | | Amount
(000) | |
| Active International Allocation | | $ | 6,774 | | |
| Global Advantage | | | 17 | | |
| Global Discovery | | | 50 | | |
| Global Franchise | | | 3,864 | | |
| Global Opportunity | | | 81 | | |
| Global Real Estate | | | 4,663 | | |
| International Equity | | | 92,860 | | |
| International Opportunity | | | 80 | | |
| International Real Estate | | | 5,191 | | |
| Select Global Infrastructure | | | 356 | | |
| Advantage | | | 48 | | |
| Growth | | | 1,730 | | |
| U.S. Real Estate | | | 532 | | |
257
2011 Annual Report
December 31, 2011
Federal Income Tax Information (unaudited) (cont'd)
The following Portfolios intend to pass through foreign tax credits and have derived net income from sources within foreign countries amounting to:
| Portfolio | | Foreign Tax
Credits
(000) | | Net Foreign
Source Income
(000) | |
| Active International Allocation | | $ | 423 | | | $ | 13,474 | | |
| Emerging Markets | | | 4,260 | | | | 43,666 | | |
| Global Franchise | | | 146 | | | | 3,442 | | |
| Global Real Estate | | | 1,594 | | | | 31,087 | | |
| International Equity | | | 3,807 | | | | 143,813 | | |
| International Real Estate | | | 411 | | | | 11,003 | | |
| International Small Cap | | | 607 | | | | 9,926 | | |
| Select Global Infrastructure | | | 26 | | | | 303 | | |
In January, each applicable Portfolio provides tax information to shareholders for the preceding calendar year.
258
2011 Annual Report
December 31, 2011
U.S. Privacy Policy (unaudited)
AN IMPORTANT NOTICE CONCERNING OUR U.S. PRIVACY POLICY
This privacy notice describes the U.S. privacy policy of Morgan Stanley Distribution, Inc., and the Morgan Stanley family of mutual funds ("us", "our", "we").
We are required by federal law to provide you with notice of our U.S. privacy policy ("Policy"). This Policy applies to both our current and former clients unless we state otherwise and is intended for individual clients who purchase products or receive services from us for personal, family or household purposes. This Policy is not applicable to partnerships, corporations, trusts or other non-individual clients or account holders, nor is this Policy applicable to individuals who are either beneficiaries of a trust for which we serve as trustee or participants in an employee benefit plan administered or advised by us. This Policy is, however, applicable to individuals who select us to be a custodian of securities or assets in individual retirement accounts, 401(k) accounts, or accounts subject to the Uniform Gifts to Minors Act.
This notice sets out our business practices to protect your privacy; how we collect and share personal information about you; and how you can limit our sharing or certain uses by others of this information. We may amend this Policy at any time, and will inform you of any changes to our Policy as required by law.
WE RESPECT YOUR PRIVACY
We appreciate that you have provided us with your personal financial information and understand your concerns about your information. We strive to safeguard the information our clients entrust to us. Protecting the confidentiality and security of client information is an important part of how we conduct our business.
This notice describes what personal information we collect about you, how we collect it, when we may share it with others, and how certain others may use it. It discusses the steps you may take to limit our sharing of certain information about you with our affiliated companies, including, but not limited to our affiliated banking businesses, brokerage firms and credit service affiliates. It also discloses how you may limit our affiliates' use of shared information for marketing purposes.
Throughout this Policy, we refer to the nonpublic information that personally identifies you as "personal information." We also use the term "affiliated company" in this notice. An affiliated company is a company in our family of companies and includes companies with the Morgan Stanley name. These affiliated companies are financial institutions such as broker-dealers, banks, investment advisers and credit card issuers. We refer to any company that is not an affiliated company as a nonaffiliated third party. For purposes of Section 5 of this notice, and your ability to limit certain uses of personal information by our affiliates, this notice applies to the use of personal information by our affiliated companies.
1. WHAT PERSONAL INFORMATION DO WE COLLECT FROM YOU?
We may collect the following types of information about you: (i) information provided by you, including information from applications and other forms we receive from you, (ii) information about your transactions with us or our affiliates, (iii) information about your transactions with nonaffiliated third parties, (iv) information from consumer reporting agencies, (v) information obtained from our websites, and (vi) information obtained from other sources. For example:
• We collect information such as your name, address, e-mail address, telephone/fax numbers, assets, income and investment objectives through applications and other forms you submit to us.
• We may obtain information about account balances, your use of account(s) and the types of products and services you prefer to receive from us through your dealings and transactions with us and other sources.
• We may obtain information about your creditworthiness and credit history from consumer reporting agencies.
• We may collect background information from and through third-party vendors to verify representations you have made and to comply with various regulatory requirements.
259
2011 Annual Report
December 31, 2011
U.S. Privacy Policy (unaudited) (cont'd)
2. WHEN DO WE DISCLOSE PERSONAL INFORMATION WE COLLECT ABOUT YOU?
We may disclose personal information we collect about you in each of the categories listed above to affiliated and nonaffiliated third parties.
a. Information we disclose to affiliated companies.
We may disclose personal information that we collect about you to our affiliated companies to manage your account(s) effectively, to service and process your transactions, and to let you know about products and services offered by us and affiliated companies, to manage our business, and as otherwise required or permitted by law. Offers for products and services from affiliated companies are developed under conditions designed to safeguard your personal information.
b. Information we disclose to third parties.
We may disclose personal information that we collect about you to nonaffiliated third parties to provide marketing services on our behalf or to other financial institutions with whom we have joint marketing agreements. We may also disclose all of the information we collect to other nonaffiliated third parties for our everyday business purposes, such as to process transactions, maintain account(s), respond to court orders and legal investigations, report to credit bureaus, offer our own products and services, protect against fraud, for institutional risk control, to perform services on our behalf, and as otherwise required or permitted by law.
When we share personal information about you with a nonaffiliated third party, they are required to limit their use of personal information about you to the particular purpose for which it was shared and they are not allowed to share personal information about you with others except to fulfill that limited purpose or as may be permitted or required by law.
3. HOW DO WE PROTECT THE SECURITY AND CONFIDENTIALITY OF PERSONAL INFORMATION WE COLLECT ABOUT YOU?
We maintain physical, electronic and procedural security measures that comply with applicable law and regulations to help safeguard the personal information we collect about you. We have internal policies governing the proper handling of client information by employees. Third parties that provide support or marketing services on our behalf may also receive personal information about you, and we require them to adhere to appropriate security standards with respect to such information.
4. HOW CAN YOU LIMIT OUR SHARING CERTAIN PERSONAL INFORMATION ABOUT YOU WITH OUR AFFILIATED COMPANIES FOR ELIGIBILITY DETERMINATION?
By following the opt-out procedures in Section 6, below, you may limit the extent to which we share with our affiliated companies, personal information that was collected to determine your eligibility for products and services such as your credit reports and other information that you have provided to us or that we may obtain from third parties ("eligibility information"). Eligibility information does not include your identification information or personal information pertaining to our transactions or experiences with you. Please note that, even if you direct us not to share eligibility information with our affiliated companies, we may still share your personal information, including eligibility information, with our affiliated companies under circumstances that are permitted under applicable law, such as to process transactions or to service your account.
5. HOW CAN YOU LIMIT THE USE OF CERTAIN PERSONAL INFORMATION ABOUT YOU BY OUR AFFILIATED COMPANIES FOR MARKETING?
By following the opt-out instructions in Section 6, below, you may limit our affiliated companies from marketing their products or services to you based on personal information we disclose to them. This information may include, for example, your income and account history with us. Please note that, even if you choose to limit our affiliated companies from using personal information about you that we may share with them for marketing their products and services to you, our affiliated companies may use your personal information that they obtain from us to market to you in circumstances permitted by law, such as if the affiliated party has its own relationship with you.
260
2011 Annual Report
December 31, 2011
U.S. Privacy Policy (unaudited) (cont'd)
6. HOW CAN YOU SEND US AN OPT-OUT INSTRUCTION?
If you wish to limit our sharing of eligibility information about you with our affiliated companies, or our affiliated companies' use of personal information for marketing purposes, as described in this notice, you may do so by:
• Calling us at (800) 548-7786
Monday–Friday between 8a.m. and 5p.m. (EST)
• Writing to us at the following address:
Morgan Stanley Services Company Inc.
c/o Privacy Coordinator
201 Plaza Two, 3rd Floor
Jersey City, New Jersey 07311
If you choose to write to us, your request should include: your name, address, telephone number and account number(s) to which the opt-out applies and whether you are opting out with respect to sharing of eligibility information (Section 4 above), or information used for marketing (Section 5 above), or both. Written opt-out requests should not be sent with any other correspondence. In order to process your request, we require that the request be provided by you directly and not through a third party. Once you have informed us about your privacy preferences, your opt-out preference will remain in effect with respect to this Policy (as it may be amended) until you notify us otherwise. If you are a joint account owner, we will accept instructions from any one of you and apply those instructions to the entire account.
Please understand that if you limit our sharing or our affiliated companies' use of personal information, you and any joint account holder(s) may not receive information about our affiliated companies' products and services, including products or services that could help you manage your financial resources and achieve your investment objectives.
If you have more than one account or relationship with us, please specify the accounts to which you would like us to apply your privacy choices. If you have accounts or relationships with our affiliates, you may receive multiple privacy policies from them, and will need to separately notify those companies of your privacy choices for those accounts or relationships.
7. WHAT IF AN AFFILIATED COMPANY BECOMES A NONAFFILIATED THIRD PARTY?
If, at any time in the future, an affiliated company becomes a nonaffiliated third party, further disclosures of personal information made to the former affiliated company will be limited to those described in Section 2(b) above relating to nonaffiliated third parties. If you elected under Section 6 to limit disclosures we make to affiliated companies, or use of personal information by affiliated companies, your election will not apply to use by any former affiliated company of your personal information in their possession once it becomes a nonaffiliated third party.
SPECIAL NOTICE TO RESIDENTS OF VERMONT
The following section supplements our Policy with respect to our individual clients who have a Vermont address and supersedes anything to the contrary in the above Policy with respect to those clients only.
The State of Vermont requires financial institutions to obtain your consent prior to sharing personal information that they collect about you with nonaffiliated third parties, or eligibility information with affiliated companies, other than in certain limited circumstances. Except as permitted by law, we will not share personal information we collect about you with nonaffiliated third parties or eligibility information with affiliated companies, unless you provide us with your written consent to share such information.
SPECIAL NOTICE TO RESIDENTS OF CALIFORNIA
The following section supplements our Policy with respect to our individual clients who have a California address and supersedes anything to the contrary in the above Policy with respect to those clients only.
In response to a California law, if your account has a California home address, your personal information will not be disclosed to nonaffiliated third parties except as permitted by applicable California law, and we will limit sharing such personal information with our affiliates to comply with California privacy laws that apply to us.
261
2011 Annual Report
December 31, 2011
Director and Officer Information (unaudited)
Independent Directors:
Name, Age and Address of
Independent Director | | Position(s)
Held with
Registrant | | Length of Time
Served* | | Principal Occupation(s) During Past 5 Years | | Number of
Portfolios in
Fund Complex
Overseen by
Independent
Director** | | Other Directorships
Held by Independent
Directors†† | |
Frank L. Bowman (67)
c/o Kramer Levin Naftalis &
Frankel LLP
Counsel to the Independent Directors
1177 Avenue of the Americas
New York, NY 10036 | | Director | | Since
August
2006 | | President, Strategic Decisions, LLC (consulting) (since February 2009); Director or Trustee of various Morgan Stanley Funds (since August 2006); Chairperson of the Insurance Sub-Committee of the Compliance and Insurance Committee (since February 2007); served as President and Chief Executive Officer of the Nuclear Energy Institute (policy organization) (February 2005-November 2008); retired as Admiral, U.S. Navy after serving over 38 years on active duty including 8 years as Director of the Naval Nuclear Propulsion Program in the Department of the Navy and the U.S. Department of Energy (1996-2004); served as Chief of Naval Personnel (July 1994-September 1996); and on the Joint Staff as Director of Political Military Affairs (June 1992-July 1994); Knighted as Honorary Knight Commander of the Most Excellent Order of the British Empire; Awarded the Officer de l'Orde National du Mérite by the French Government; elected to the National Academy of Engineering (2009). | | | 102 | | | Director of BP p.l.c.; Director of Naval and Nuclear Technologies LLP; Director of the Armed Services YMCA of the USA and the Naval Submarine League; Director of the American Shipbuilding Suppliers Association; Member of the National Security Advisory Council of the Center for U.S. Global Engagement and a member of the CNA Military Advisory Board; Member of the American Lung Association's President's Council. | |
|
Michael Bozic (71)
c/o Kramer Levin Naftalis & Frankel LLP
Counsel to the Independent Directors
1177 Avenue of the Americas
New York, NY 10036 | | Director | | Since
April
1994 | | Private investor; Chairperson of the Compliance and Insurance Committee (since October 2006); Director or Trustee of various Morgan Stanley Funds (since April 1994); formerly, Chairperson of the Insurance Committee (July 2006-September 2006); Vice Chairman of Kmart Corporation (December 1998-October 2000), Chairman and Chief Executive Officer of Levitz Furniture Corporation (November 1995-November 1998) and President and Chief Executive Officer of Hills Department Stores (May 1991-July 1995); variously Chairman, Chief Executive Officer, President and Chief Operating Officer (1987-1991) of the Sears Merchandise Group of Sears, Roebuck & Co. | | | 104 | | | Director of various business organizations. | |
|
Kathleen A. Dennis (58)
c/o Kramer Levin Naftalis & Frankel LLP
Counsel to the Independent Directors
1177 Avenue of the Americas
New York, NY 10036 | | Director | | Since
August
2006 | | President, Cedarwood Associates (mutual fund and investment management consulting) (since July 2006); Chairperson of the Money Market and Alternatives Sub-Committee of the Investment Committee (since October 2006) and Director or Trustee of various Morgan Stanley Funds (since August 2006); formerly, Senior Managing Director of Victory Capital Management (1993-2006). | | | 102 | | | Director of various non-profit organizations. | |
|
Dr. Manuel H. Johnson (63)
c/o Johnson Smick
Group, Inc.
888 16th Street, N.W.
Suite 740
Washington, D.C. 20006 | | Director | | Since
July
1991 | | Senior Partner, Johnson Smick International, Inc. (consulting firm); Chairperson of the Investment Committee (since October 2006) and Director or Trustee of various Morgan Stanley Funds (since July 1991); Co-Chairman and a founder of the Group of Seven Council (G7C) (international economic commission); formerly, Chairperson of the Audit Committee (July 1991-September 2006); Vice Chairman of the Board of Governors of the Federal Reserve System and Assistant Secretary of the U.S. Treasury. | | | 104 | | | Director of NVR, Inc. (home construction). | |
|
Joseph J. Kearns (69)
c/o Kearns & Associates LLC PMB754
22631 Pacific Coast Highway
Malibu, CA 90265 | | Director | | Since
August
1994 | | President, Kearns & Associates LLC (investment consulting); Chairperson of the Audit Committee (since October 2006) and Director or Trustee of various Morgan Stanley Funds (since August 1994); formerly Deputy Chairperson of the Audit Committee (July 2003-September 2006) and Chairperson of the Audit Committee of various Morgan Stanley Funds (since August 1994); CFO of the J. Paul Getty Trust. | | | 105 | | | Director of Electro Rent Corporation (equipment leasing) and The Ford Family Foundation. | |
|
262
2011 Annual Report
December 31, 2011
Director and Officer Information (unaudited) (cont'd)
Independent Directors: (cont'd)
Name, Age and Address of
Independent Director | | Position(s)
Held with
Registrant | | Length of Time
Served* | | Principal Occupation(s) During Past 5 Years | | Number of
Portfolios in
Fund Complex
Overseen by
Independent
Director** | | Other Directorships
Held by Independent
Directors†† | |
Michael F. Klein (53)
c/o Kramer Levin Naftalis & Frankel LLP
Counsel to the
Independent Directors
1177 Avenue of the Americas
New York, NY 10036 | | Director | | Since
August
2006 | | Managing Director, Aetos Capital, LLC (since March 2000) and Co-President, Aetos Alternatives Management, LLC (since January 2004); Chairperson of the Fixed Income Sub-Committee of the Investment Committee (since October 2006) and Director or Trustee of various Morgan Stanley Funds (since August 2006); formerly, Managing Director, Morgan Stanley & Co., Inc. and Morgan Stanley Dean Witter Investment Management, President, various Morgan Stanley Funds (June 1998-March 2000) and Principal, Morgan Stanley & Co., Inc. and Morgan Stanley Dean Witter Investment Management (August 1997-December 1999). | | | 102 | | | Director of certain investment funds managed or sponsored by Aetos Capital LLC. Director of Sanitized AG and Sanitized Marketing AG (specialty chemicals). | |
|
Michael E. Nugent (75)
c/o Triumph Capital, L.P.
445 Park Avenue
New York, NY 10022 | | Chairperson of the
Board and Director | | Chairperson of the Boards since July 2006 and Director since July 1991 | | General Partner, Triumph Capital, L.P. (private investment partnership); Chairperson of the Boards of various Morgan Stanley Funds (since July 2006); Director or Trustee of various Morgan Stanley Funds (since July 1991); formerly, Chairperson of the Insurance Committee (until July 2006). | | | 104 | | | None. | |
|
W. Allen Reed (64)
c/o Kramer Levin Naftalis & Frankel LLP
Counsel to the
Independent Directors
1177 Avenue of the Americas
New York, NY 10036 | | Director | | Since
August
2006 | | Chairperson of the Equity Sub-Committee of the Investment Committee (since October 2006) and Director or Trustee of various Morgan Stanley Funds (since August 2006); formerly, President and CEO of General Motors Asset Management; Chairman and Chief Executive Officer of the GM Trust Bank and Corporate Vice President of General Motors Corporation (August 1994-December 2005). | | | 102 | | | Director of Temple-Inland Industries (packaging and forest products), Director of Legg Mason, Inc. and Director of the Auburn University Foundation. | |
|
Fergus Reid (79)
c/o Joe Pietryka, Inc.
85 Charles Colman Blvd.
Pawling, NY 12564 | | Director | | Since
June
1992 | | Chairman, Joe Pietryka, Inc.; Chairperson of the Governance Committee and Director or Trustee of various Morgan Stanley Funds (since June 1992). | | | 105 | | | Trustee and Director of certain investment companies in the JPMorgan Funds complex managed by JP Morgan Investment Management Inc. | |
|
263
2011 Annual Report
December 31, 2011
Director and Officer Information (unaudited) (cont'd)
Interested Director:
Name, Age and Address of
Interested Director | | Position(s) Held
with Registrant | | Term of Office
and Length of
Time Served* | | Principal Occupation(s) During Past 5 Years | | Number of
Portfolios in
Fund Complex
Overseen by
Interested
Director** | | Other Directorships
Held by Interested
Director†† | |
James F. Higgins (64)
c/o Morgan Stanley Services
Company Inc.
Harborside Financial Center
201 Plaza Two
Jersey City, NJ 07311 | | Director | | Since
June
2000 | | Director or Trustee of various Morgan Stanley Funds (since June 2000); Senior Advisor of Morgan Stanley (since August 2000). | | | 103 | | | Director of AXA Financial, Inc. and The Equitable Life Assurance Society of the United States (financial services). | |
|
* Each Director serves an indefinite term, until his or her successor is elected.
** The Fund Complex includes (as of December 31, 2011) all open-end and closed-end funds (including all of their portfolios) advised by Morgan Stanley Investment Management Inc. (the "Adviser") and any funds that have an adviser that is an affiliated person of the Adviser (including, but not limited to, Morgan Stanley AIP GP LP).
†† This includes any directorships at public companies and registered investment companies held by the Director at any time during the past five years.
264
2011 Annual Report
December 31, 2011
Director and Officer Information (unaudited) (cont'd)
Executive Officers:
| Name, Age and Address of Executive Officer | | Position(s) Held
with
Registrant | | Term of Office
and Length of
Time Served* | | Principal Occupation(s) During Past 5 Years | |
Arthur Lev (50)
522 Fifth Avenue
New York, NY 10036 | | President and Principal Executive Officer — Equity and Fixed Income Funds | | Since June 2011 | | President and Principal Executive Officer (since June 2011) of the Equity and Fixed Income Funds in the Fund Complex; Head of the Long Only Business of Morgan Stanley Investment Management (since February 2011); Managing Director of the Adviser and various entities affiliated with the Adviser (since December 2006). Formerly, Chief Strategy Officer of Morgan Stanley Investment Management's Traditional Asset Management business (November 2010-February 2011); General Counsel of Morgan Stanley Investment Management (December 2006-October 2010); Partner and General Counsel of FrontPoint Partners LLC (July 2002-December 2006); Managing Director and General Counsel of Morgan Stanley Investment Management (May 2000-June 2002). | |
|
Mary Ann Picciotto (38)
c/o Morgan Stanley Services Company Inc.
Harborside Financial Center
201 Plaza Two
Jersey City, NJ 07311 | | Chief Compliance Officer | | Since
May
2010 | | Managing Director of the Adviser and various entities affiliated with the Adviser; Chief Compliance Officer of various Morgan Stanley Funds (since May 2010); Chief Compliance Officer of the Adviser (since April 2007). | |
|
Stefanie V. Chang Yu (45)
522 Fifth Avenue
New York, NY 10036 | | Vice President | | Since
December
1997 | | Managing Director of the Adviser and various entities affiliated with the Adviser; Vice President of various Morgan Stanley Funds (since December 1997). | |
|
Mary E. Mullin (44)
522 Fifth Avenue
New York, NY 10036 | | Secretary | | Since
June
1999 | | Executive Director of the Adviser and various entities affiliated with the Adviser; Secretary of various Morgan Stanley Funds (since June 1999). | |
|
Francis J. Smith (46)
c/o Morgan Stanley Services Company Inc.
Harborside Financial Center
201 Plaza Two
Jersey City, NJ 07311 | | Treasurer and Principal Financial Officer | | Treasurer since July 2003 and Principal Financial Officer since September 2002 | | Executive Director of the Adviser and various entities affiliated with the Adviser; Treasurer and Principal Financial Officer of various Morgan Stanley Funds (since July 2003). | |
|
* Each Officer serves an indefinite term, until his or her successor is elected.
265
Investment Adviser and Administrator
Morgan Stanley Investment Management Inc.
522 Fifth Avenue
New York, New York 10036
Distributor
Morgan Stanley Distribution, Inc.
100 Front Street, Suite 400
West Conshohocken, Pennsylvania 19428
Dividend Disbursing and Transfer Agent
Morgan Stanley Services Company Inc.
P.O. Box 219804
Kansas City, Missouri 64121
Custodian
State Street Bank and Trust Company
One Lincoln Street
Boston, Massachusetts 02111
Legal Counsel
Dechert LLP
1095 Avenue of the Americas
New York, New York 10036
Independent Registered Public Accounting Firm
Ernst & Young LLP
200 Clarendon Street
Boston, Massachusetts 02116
Reporting to Shareholders
Each Morgan Stanley Fund provides a complete schedule of portfolio holdings in its semi-annual and annual reports within 60 days of the end of the Fund's second and fourth fiscal quarters. The semi-annual reports and the annual reports are filed electronically with the Securities and Exchange Commission (SEC) on Form N-CSRS and Form N-CSR, respectively. Morgan Stanley also delivers the semi-annual and annual reports to Fund shareholders and makes these reports available on its public website, www.morganstanley.com/im. Each Morgan Stanley Fund also files a complete schedule of portfolio holdings with the SEC for the Fund's first and third fiscal quarters on Form N-Q. Morgan Stanley does not deliver the reports for the first and third fiscal quarters to shareholders, nor are the reports posted to the Morgan Stanley public website. You may, however, obtain the Form N-Q filings (as well as the Form N-CSR and N-CSRS filings) by accessing the SEC's website, www.sec.gov. You may also review and copy them at the SEC's public reference room in Washington, DC. Information on the operation of the SEC's Public Reference Room may be obtained by calling the SEC toll free at 1-(800) SEC-0330. You can also request copies of these materials, upon payment of a duplicating fee, by electronic request at the SEC's email address (publicinfo@sec.gov) or by writing the Public Reference section of the SEC, Washington, DC 20549-0102.
Proxy Voting Policies and Procedures and Proxy Voting Record
You may obtain a copy of the Fund's Proxy Voting Policy and Procedures and information regarding how the Fund voted proxies relating to portfolio securities during the most recent twelve-month period ended June 30, without charge, upon request, by calling toll free 1-(800) 548-7786 or by visiting our website at www.morganstanley.com/im. This information is also available on the SEC's website at www.sec.gov.
This report is authorized for distribution only when preceded or accompanied by a prospectus of the Morgan Stanley Institutional Fund, Inc. which describes in detail each Investment Portfolio's investment policies, risks, fees and expenses. Please read the prospectus carefully before you invest or send money. For additional information, including information regarding the investments comprising the Portfolio, please visit our website at www.morganstanley.com/im or call toll free 1-(800) 548-7786.
266
(This Page has been left blank intentionally.)
(This Page has been left blank intentionally.)
Printed in U.S.A.
This Report has been prepared for shareholders and may be distributed
to others only if preceded or accompanied by a current prospectus.
Morgan Stanley Investment Management Inc.
522 Fifth Avenue
New York, New York 10036
© 2012 Morgan Stanley

MSIFIANN
IU12-00334P-Y12/11

June 29, 2012
Supplement
SUPPLEMENT DATED JUNE 29, 2012 TO THE PROSPECTUS OF
MORGAN STANLEY INTERNATIONAL VALUE EQUITY FUND
Dated December 30, 2011
The first paragraph of the section of the Prospectus entitled "Shareholder Information—How to Exchange Shares—Permissible Fund Exchanges." is hereby deleted and replaced with the following:
You may exchange shares of any Class of the Fund for the same Class of: Morgan Stanley European Equity Fund Inc., Morgan Stanley Focus Growth Fund, Morgan Stanley Global Fixed Income Opportunities Fund, Morgan Stanley Global Infrastructure Fund, Morgan Stanley Global Strategist Fund, Morgan Stanley International Fund, Morgan Stanley Mid Cap Growth Fund, Morgan Stanley Mortgage Securities Trust, Morgan Stanley Multi Cap Growth Trust and Morgan Stanley U.S. Government Securities Trust (each, a "Morgan Stanley Multi-Class Fund"), if available, or for shares of Morgan Stanley California Tax-Free Daily Income Trust, Morgan Stanley Liquid Asset Fund Inc., Morgan Stanley New York Municipal Money Market Trust, Morgan Stanley Tax-Free Daily Income Trust and Morgan Stanley U.S. Government Money Market Trust (each, a "Morgan Stanley Money Market Fund") or the Morgan Stanley Limited Duration U.S. Government Trust, if available, without the imposition of an exchange fee. In addition, Class Q shares of Morgan Stanley Global Infrastructure Fund may be exchanged for Class A shares of the Fund without payment of sales charges (including contingent deferred sales charges ("CDSCs")) or the imposition of an exchange fee. Front-end sales charges are not imposed on exchanges of Class A shares.
PLEASE RETAIN THIS SUPPLEMENT FOR FUTURE REFERENCE.
IVQSPT3 6/12

June 12, 2012
Supplement
SUPPLEMENT DATED JUNE 12, 2012 TO THE PROSPECTUS OF
MORGAN STANLEY INTERNATIONAL VALUE EQUITY FUND
Dated December 30, 2011
Effective as of the close of business on June 12, 2012, Class A, Class C and Class I shares of the Fund will be closed for purchases by new investors.
PLEASE RETAIN THIS SUPPLEMENT FOR FUTURE REFERENCE.
IVQSPT2 6/12

May 14, 2012
Supplement
SUPPLEMENT DATED MAY 14, 2012 TO THE PROSPECTUS OF
MORGAN STANLEY INTERNATIONAL VALUE EQUITY FUND
Dated December 30, 2011
Effective as of the close of business on May 16, 2012, the Fund is suspending the continuous offering of its Class R shares and Class W shares and thus, no further purchases of Class R shares or Class W shares of the Fund may be made by investors. In addition, Class B shares of the Fund will be closed for purchases by new investors as of the close of business on May 16, 2012.
PLEASE RETAIN THIS SUPPLEMENT FOR FUTURE REFERENCE.
IVQSPT1 5/12

May 2, 2012
Supplement
SUPPLEMENT DATED MAY 2, 2012 TO THE PROSPECTUS OF
MORGAN STANLEY INTERNATIONAL VALUE EQUITY FUND
Dated December 30, 2011
The Board of Trustees (the "Board") of Morgan Stanley International Value Equity Fund (the "Fund") approved an Agreement and Plan of Reorganization by and between the Fund and Morgan Stanley Institutional Fund, Inc., on behalf of its series International Equity Portfolio ("International Equity"), pursuant to which substantially all of the assets of the Fund would be combined with those of International Equity and shareholders of the Fund would become shareholders of International Equity, receiving shares of International Equity equal to the value of their holdings in the Fund (the "Reorganization"). Each shareholder of the Fund would receive the Class of shares of International Equity that corresponds to the Class of shares of the Fund currently held by that shareholder. The Reorganization is subject to the approval of shareholders of the Fund at a special meeting of shareholders scheduled to be held during the third quarter of 2012. A proxy statement formally detailing the proposal, the reasons for the Reorganization and information concerning International Equity is expected to be distributed to shareholders of the Fund during the third quarter of 2012.
PLEASE RETAIN THIS SUPPLEMENT FOR FUTURE REFERENCE.
IVQSPT 5/12
INVESTMENT MANAGEMENT


Morgan Stanley
International Value
Equity Fund
A mutual fund that seeks long-term capital appreciation.
| Share Class | | Ticker
Symbol | |
| Class A | | IVQAX | |
|
| Class B | | IVQBX | |
|
| Class C | | IVQCX | |
|
| Class I | | IVQDX | |
|
| Class R | | IVQRX | |
|
| Class W | | IVQWX | |
|
Prospectus
December 30, 2011
The Securities and Exchange Commission ("SEC") has not approved or disapproved these securities or passed upon the adequacy of this Prospectus. Any representation to the contrary is a criminal offense.
Contents
| Fund Summary | |
|
| Investment Objective | | | 1 | | |
|
| Fees and Expenses | | | 1 | | |
|
| Portfolio Turnover | | | 2 | | |
|
| Principal Investment Strategies | | | 2 | | |
|
| Principal Risks | | | 2 | | |
|
| Past Performance | | | 3 | | |
|
| Adviser and Sub-Advisers | | | 4 | | |
|
| Purchase and Sale of Fund Shares | | | 4 | | |
|
| Tax Information | | | 5 | | |
|
| Payments to Broker-Dealers and Other Financial Intermediaries | | | 5 | | |
|
| Fund Details | |
|
| Additional Information about the Fund's Investment Objective, Strategies and Risks | | | 6 | | |
|
| Portfolio Holdings | | | 10 | | |
|
| Fund Management | | | 10 | | |
|
| Shareholder Information | |
|
| Pricing Fund Shares | | | 12 | | |
|
| How to Buy Shares | | | 13 | | |
|
| How to Exchange Shares | | | 15 | | |
|
| How to Sell Shares | | | 16 | | |
|
| Distributions | | | 20 | | |
|
| Frequent Purchases and Redemptions of Fund Shares | | | 20 | | |
|
| Tax Consequences | | | 21 | | |
|
| Share Class Arrangements | | | 22 | | |
|
| Additional Information | | | 30 | | |
|
| Financial Highlights | | | 31 | | |
|
| Morgan Stanley Funds | | Inside Back Cover | |
|
This Prospectus contains important information about the Fund. Please read it carefully and keep it for future reference.
Fund Summary
Investment Objective
Morgan Stanley International Value Equity Fund seeks long-term capital appreciation.
Fees and Expenses
The table below describes the fees and expenses that you may pay if you buy and hold shares of the Fund. You may qualify for sales charge discounts if you and your family invest, or agree to invest in the future, at least $25,000 in the Morgan Stanley Funds. More information about these and other discounts is available from your financial adviser and in the "Share Class Arrangements" section beginning on page 22 of this Prospectus and in the "Purchase, Redemption and Pricing of Shares" section beginning on page 50 of the Fund's Statement of Additional Information ("SAI").
Shareholder Fees (fees paid directly from your investment)
| | | Class A | | Class B | | Class C | | Class I | | Class R | | Class W | |
Maximum sales
charge (load)
imposed on
purchases
(as a
percentage of
offering price) | | 5.25%1 | | None | | None | | None | | None | | None | |
Maximum deferred
sales charge (load)
(as a percentage
based on the
lesser of the
offering price
or net asset value
at redemption) | | None2 | | 5.00%3 | | 1.00%3 | | None | | None | | None | |
| Redemption fee4 | | | 2.00 | % | | | 2.00 | % | | | 2.00 | % | | | 2.00 | % | | | 2.00 | % | | | 2.00 | % | |
Annual Fund Operating Expenses
(expenses that you pay each year as a percentage of the value of your investment)
| | | Class A | | Class B | | Class C | | Class I | | Class R | | Class W | |
| Advisory fee | | | 0.80 | % | | | 0.80 | % | | | 0.80 | % | | | 0.80 | % | | | 0.80 | % | | | 0.80 | % | |
Distribution and
service (12b-1)
fees | | 0.25% | | 0.24% | | 0.99% | | None | | 0.50% | | 0.35% | |
Other
expenses | | 0.42% | | 0.42% | | 0.42% | | 0.42% | | 0.42% | | 0.42% | |
Total annual
Fund operating
expenses | | 1.47% | | 1.46% | | 2.21% | | 1.22% | | 1.72% | | 1.57% | |
Example
The example below is intended to help you compare the cost of investing in the Fund with the cost of investing in other mutual funds.
The example assumes that you invest $10,000 in the Fund, your investment has a 5% return each year, and the Fund's operating expenses remain the same (except for the ten-year amounts for Class B shares which reflect the conversion to Class A shares eight years after the end of the calendar month in which shares were purchased). Although your actual costs may be higher or lower, based on these assumptions your costs would be:
If You SOLD Your Shares:
| | | 1 Year | | 3 Years | | 5 Years | | 10 Years | |
| Class A | | $ | 667 | | | $ | 965 | | | $ | 1,286 | | | $ | 2,190 | | |
| Class B | | $ | 649 | | | $ | 762 | | | $ | 997 | | | $ | 1,746 | * | |
| Class C | | $ | 324 | | | $ | 691 | | | $ | 1,185 | | | $ | 2,544 | | |
| Class I | | $ | 124 | | | $ | 387 | | | $ | 670 | | | $ | 1,477 | | |
| Class R | | $ | 175 | | | $ | 542 | | | $ | 933 | | | $ | 2,030 | | |
| Class W | | $ | 160 | | | $ | 496 | | | $ | 855 | | | $ | 1,867 | | |
morganstanley.com/im
1
If You HELD Your Shares:
| | | 1 Year | | 3 Years | | 5 Years | | 10 Years | |
| Class A | | $ | 667 | | | $ | 965 | | | $ | 1,286 | | | $ | 2,190 | | |
| Class B | | $ | 149 | | | $ | 462 | | | $ | 797 | | | $ | 1,746 | * | |
| Class C | | $ | 224 | | | $ | 691 | | | $ | 1,185 | | | $ | 2,544 | | |
| Class I | | $ | 124 | | | $ | 387 | | | $ | 670 | | | $ | 1,477 | | |
| Class R | | $ | 175 | | | $ | 542 | | | $ | 933 | | | $ | 2,030 | | |
| Class W | | $ | 160 | | | $ | 496 | | | $ | 855 | | | $ | 1,867 | | |
* Does not reflect conversion to Class A shares eight years after the end of the calendar month in which shares were purchased. The conversion feature is currently suspended because the total annual operating expense ratio of Class B is currently lower than that of Class A. See "Conversion Feature" for Class B shares in "Share Class Arrangements" for more information.
(1) Reduced for purchases of $25,000 and over.
(2) Investments that are not subject to any sales charges at the time of purchase are subject to a contingent deferred sales charge ("CDSC") of 1.00% that will be imposed if you sell your shares within 18 months after purchase, except for certain specific circumstances.
(3) The Class B CDSC is scaled down to 1.00% during the sixth year, reaching zero thereafter, and the Class C CDSC is only applicable if you sell your shares within one year after purchase. See "Share Class Arrangements" for a complete discussion of the CDSC.
(4) Payable to the Fund on shares redeemed or exchanged within 30 days of purchase. The redemption fee is based on the redemption proceeds. See "Shareholder Information—How to Sell Shares" for more information on redemption fees.
Portfolio Turnover
The Fund pays transaction costs, such as commissions, when it buys and sells securities (or "turns over" its portfolio). A higher portfolio turnover rate may indicate higher transaction costs and may result in higher taxes when Fund shares are held in a taxable account. These costs, which are not reflected in Total annual Fund operating expenses or in the Example, affect the Fund's performance. During the most recent fiscal year, the Fund's portfolio turnover rate was 29% of the average value of its portfolio.
Principal Investment Strategies
The Fund will normally invest at least 80% of its assets in a diversified portfolio of common stocks and other equity securities, including depositary receipts and securities convertible into common stock, of companies located outside of the United States. These companies may be of any asset size, including small and medium capitalization companies, and may be located in developed or emerging market countries. The Fund may also use derivative instruments as discussed below. These derivative instruments will be counted toward the 80% policy discussed above to the extent they have economic characteristics similar to the securities included within that policy.
The Fund's "Sub-Advisers," Morgan Stanley Investment Management Limited and Morgan Stanley Investment Management Company, utilize a bottom-up investment process that seeks to identify undervalued companies. In selecting portfolio investments, the Sub-Advisers first screen more than 1,000 issuers seeking to identify companies whose equity appears to be undervalued based on its analysis of price/cash flow, price/book value and/or price/earnings ratios, as well as other value-based quantitative criteria. Then, the Sub-Advisers perform an in-depth fundamental analysis of, among other things: (i) the company's balance sheet and income statements; (ii) the quality of the company's management; and (iii) the company's business competitiveness and market positioning (including the applicable industry's structure).
The remaining 20% of the Fund's assets may be invested in equity securities of companies located in the United States.
The Fund may also use forward foreign currency exchange contracts, which are derivative instruments, in connection with its investments in foreign securities.
Principal Risks
There is no assurance that the Fund will achieve its investment objective and you can lose money investing in this Fund. The principal risks of investing in the Fund include:
• Common Stock and Other Equity Securities. In general, stock and other equity security values fluctuate, and sometimes widely fluctuate, in response to activities specific to the company as well as general market, economic and political conditions. Investments in convertible securities subject the Fund to the risks associated with both fixed-income securities, including credit risk and interest rate risk, and common stocks. A portion of the Fund's convertible investments may be rated below investment grade.
2
• Foreign and Emerging Market Securities. Investments in foreign markets entail special risks such as currency, political, economic and market risks. There also may be greater market volatility, less reliable financial information, higher transaction and custody costs, decreased market liquidity and less government and exchange regulation associated with investments in foreign markets. The risks of investing in emerging market countries are greater than risks associated with investments in foreign developed countries. Hedging the Fund's currency risks through forward foreign currency exchange contracts involves the risk of mismatching the Fund's objectives under a forward foreign currency exchange contract with the value of securities denominated in a particular currency. There is additional risk that such transactions reduce or preclude the opportunity for gain and that currency contracts create exposure to currencies in which the Fund's securities are not denominated.
• Small and Medium Capitalization Companies. Investments in small and medium capitalization companies entail greater risks than those associated with larger, more established companies. Often the stock of these companies may be more volatile and less liquid than the stock of more established companies. These stocks may have returns that vary, sometimes significantly, from the overall stock market.
Shares of the Fund are not bank deposits and are not guaranteed or insured by the FDIC or any other government agency.
Past Performance
The bar chart and table below provide some indication of the risks of investing in the Fund by showing changes in the Fund's Class B shares' performance from year to year and by showing how the Fund's average annual returns for the one and five year periods and for life of Fund compared with those of a broad measure of market performance, as well as an index that represents a group of similar mutual funds, over time. The performance of other Classes will differ because the Classes have different ongoing fees. The performance information in the bar chart does not reflect the deduction of sales charges; if these amounts were reflected, returns would be less than shown. The Fund's returns in the table include the maximum applicable sales charge for each Class and assume you sold your shares at the end of each period (unless otherwise noted). The Fund's past performance (before and after taxes) does not indicate how the Fund will perform in the future. Updated performance information is available online at www.morganstanley.com/im or by calling toll-free (800) 869-NEWS.
Annual Total Returns—Calendar Years
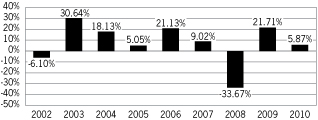
The year-to-date total return as of September 30, 2011 was –12.46%.
Best Quarter (ended June 30, 2009): 19.09%
Worst Quarter (ended September 30, 2002): –15.86%
Average Annual Total Returns For Periods Ended December 31, 2010
| | | Past 1
Year | | Past 5
Years | | Life of
Fund | |
| Class A1: Return Before Taxes | | | 0.37 | % | | | 1.50 | % | | | 5.05 | % | |
| Class B1: Return Before Taxes | | | 0.87 | % | | | 2.20 | % | | | 5.16 | %* | |
Return After Taxes
on Distributions2 | | | 0.19 | % | | | 0.79 | % | | | 4.21 | %* | |
Return After Taxes
on Distributions and
Sale of Fund Shares | | | 0.56 | % | | | 1.94 | % | | | 4.54 | %* | |
| Class C1: Return Before Taxes | | | 4.14 | % | | | 1.87 | % | | | 4.86 | % | |
| Class I1: Return Before Taxes | | | 6.18 | % | | | 2.86 | % | | | 5.89 | % | |
MSCI EAFE Index
(reflects no deduction
for fees, expenses
or taxes)3 | | | 7.75 | % | | | 2.46 | % | | | 4.55 | % | |
Lipper International
Large-Cap Core Funds
Index (reflects no
deduction for taxes)4 | | | 8.82 | % | | | 2.33 | % | | | 4.11 | % | |
| | | Past 1
Year | | Past 5
Years | | Life of
Fund | |
| Class R1: Return Before Taxes | | | 5.61 | % | | | — | | | | –3.49 | % | |
morganstanley.com/im
3
| | | Past 1
Year | | Past 5
Years | | Life of
Fund | |
| Class W1: Return Before Taxes | | | 5.75 | % | | | — | | | | –3.33 | % | |
MSCI EAFE Index
(reflects no deduction
for fees, expenses
or taxes)3 | | | 7.75 | % | | | — | | | | –4.44 | % | |
Lipper International
Large-Cap Core Funds
Index (reflects no
deduction for taxes)4 | | | 8.82 | % | | | — | | | | –4.84 | % | |
* Does not reflect conversion to Class A shares eight years after the end of the calendar month in which shares were purchased. The conversion feature is currently suspended because the total annual operating expense ratio of Class B is currently lower than that of Class A. See "Conversion Feature" for Class B shares in "Share Class Arrangements" for more information.
(1) Classes A, B, C and I commenced operations on April 26, 2001. Class R and Class W commenced operations on March 31, 2008.
(2) These returns do not reflect any tax consequences from a sale of your shares at the end of each period, but they do reflect any applicable sales charges on such a sale.
(3) The Morgan Stanley Capital International (MSCI) EAFE Index (Europe, Australasia, Far East) is a free float-adjusted market capitalization index that is designed to measure the international equity market performance of developed markets, excluding the United States and Canada. The term "free float" represents the portion of shares outstanding that are deemed to be available for purchase in the public equity markets by investors. The MSCI EAFE Index currently consists of 22 developed market country indices. The performance of the Index is listed in U.S. dollars and assumes reinvestment of net dividends. It is not possible to invest directly in an index.
(4) The Lipper International Large-Cap Core Funds Index is an equally weighted performance index of the largest qualifying funds (based on net assets) in the Lipper International Large-Cap Core Funds classification. There are currently 30 funds represented in this Index.
The after-tax returns shown in the table above are calculated using the historical highest individual federal marginal income tax rates during the period shown and do not reflect the impact of state and local taxes. After-tax returns for the Fund's other Classes will vary from the Class B shares' returns. Actual after-tax returns depend on an investor's tax situation and may differ from those shown, and after-tax returns are not relevant to investors who hold their Fund shares through tax-deferred arrangements, such as 401(k) plans or individual retirement accounts. After-tax returns may be higher than before-tax returns due to foreign tax credits and/or an assumed benefit from capital losses that would have been realized had Fund shares been sold at the end of the relevant periods, as applicable.
Adviser and Sub-Advisers
Adviser. Morgan Stanley Investment Management Inc.
Sub-Advisers. Morgan Stanley Investment Management Limited and Morgan Stanley Investment Management Company.
Portfolio Managers. The Fund is managed by members of the International Equity team. Information about the members jointly and primarily responsible for the day-to-day management of the Fund's portfolio is shown below:
| Name | | Title with
Morgan Stanley
Investment
Management Limited | | Date Began
Managing Fund | |
| William D. Lock | | Managing Director | | April 2001 | |
|
| Walter B. Riddell | | Managing Director | | October 2003 | |
|
| Vladimir A. Demine | | Executive Director | | June 2009 | |
|
| John S. Goodacre | | Executive Director | | February 2006 | |
|
| Bruno Paulson | | Executive Director | | June 2009 | |
|
| Name | | Title with
Morgan Stanley
Investment
Management
Company | | Date Began
Managing Fund | |
| Peter J. Wright | | Managing Director | | April 2001 | |
|
| Christian Derold | | Executive Director | | May 2006 | |
|
Purchase and Sale of Fund Shares
The Fund offers investors six Classes of shares: Classes A, B, C, I, R and W. Class I, R and W shares are only offered to a limited group of investors.
4
Minimum Investment Amounts
| | | Minimum Investment | |
| Investment Options | | Initial | | Additional | |
| Regular Account | | $ | 1,000 | | | $ | 100 | | |
| Individual Retirement Account | | $ | 1,000 | | | $ | 100 | | |
| Coverdell Education Savings Account | | $ | 500 | | | $ | 100 | | |
EasyInvest®
(Automatically from your checking or
savings account or Money Market Fund) | | $ | 100 | * | | $ | 100 | * | |
* Provided your schedule of investments totals $1,000 in 12 months.
You may not be subject to the minimum investment requirements under certain circumstances. For more information, please refer to the "How to Buy Shares—Minimum Investment Amounts" section beginning on page 14 of this Prospectus.
You can purchase or sell Fund shares by contacting your Morgan Stanley Smith Barney Financial Advisor or other authorized financial representative. You can also sell Fund shares at any time by telephonic request to the Fund or by enrolling in a systematic withdrawal plan. In addition, you can purchase additional Fund shares or sell Fund shares by written request to the Fund.
Your shares will be sold at the next price calculated after we receive your order to redeem. If you redeem Class A, Class B or Class C shares, your net sale proceeds are reduced by the amount of any applicable CDSC.
To contact a Morgan Stanley Smith Barney Financial Advisor, call toll-free 1-866-MORGAN8 for the telephone number of the Morgan Stanley Smith Barney office nearest you or access our office locator at www.morganstanley.com. To sell shares by telephone, call (800) 869-NEWS. To purchase additional Fund shares or sell Fund shares by mail, contact the Fund's transfer agent, Morgan Stanley Services Company Inc. (the "Transfer Agent"), at: Morgan Stanley Services Company Inc., P.O. Box 219885, Kansas City, MO 64121-9885 (for purchases) or Morgan Stanley Services Company Inc., P.O. Box 219886, Kansas City, MO 64121-9886 (for sales). For more information, please refer to the "How to Buy Shares" and "How to Sell Shares" sections beginning on page 13 and page 16, respectively, of this Prospectus.
Tax Information
The Fund intends to make distributions that may be taxed as ordinary income or capital gains, unless you are investing through a tax-deferred arrangement, such as a 401(k) plan or an individual retirement account.
Payments to Broker-Dealers and Other Financial Intermediaries
If you purchase the Fund through a broker-dealer or other financial intermediary (such as a bank), the Adviser and/or the Fund's distributor may pay the intermediary for the sale of Fund shares and related services. These payments, which may be significant in amount, may create a conflict of interest by influencing the broker-dealer or other intermediary and your salesperson to recommend the Fund over another investment. Ask your salesperson or visit your financial intermediary's web site for more information.
www.morganstanley.com/im
5
Fund Details
Additional Information about the Fund's Investment Objective, Strategies and Risks
Investment Objective
Morgan Stanley International Value Equity Fund seeks long-term capital appreciation.
Capital Appreciation
An investment objective having the goal of selecting securities with the potential to rise in price rather than pay out dividend income.
Principal Investment Strategies
The Fund will normally invest at least 80% of its assets in a diversified portfolio of common stocks and other equity securities, including depositary receipts and securities convertible into common stock, of companies located outside of the United States. These companies may be of any asset size, including small and medium capitalization companies, and may be located in developed or emerging market countries. The Fund invests in at least three different countries located outside of the United States. The Fund's Sub-Advisers may consider an issuer to be from a particular country or geographic region if (i) its principal securities trading market is in that country or geographic region; (ii) alone or on a consolidated basis it derives 50% or more of its annual revenue from goods produced, sales made or services performed in that country or geographic region; or (iii) it is organized under the laws of, or has a principal office in, that country or geographic region. By applying this test, it is possible that a particular issuer could be deemed to be from more than one country or geographic region. In accordance with the Fund's investment strategy, companies within a capitalization range of $1 billion to $10 billion at the time of purchase are considered to be small and medium capitalization companies by the Sub-Advisers. The Fund may also use derivative instruments as discussed below. These derivative instruments will be counted toward the 80% policy discussed above to the extent they have economic characteristics similar to the securities included within that policy.
The Fund's Sub-Advisers utilize a bottom-up investment process that seeks to identify undervalued companies. In selecting portfolio investments, the Sub-Advisers first screen more than 1,000 issuers seeking to identify companies whose equity appears to be undervalued based on its analysis of price/cash flow, price/book value and/or price/earnings ratios, as well as other value-based quantitative criteria. Then, the Sub-Advisers perform an in-depth fundamental analysis of, among other things: (i) the company's balance sheet and income statements; (ii) the quality of the company's management; and (iii) the company's business competitiveness and market positioning (including the applicable industry's structure). This analysis typically involves meetings with the company's senior
6
management. In deciding whether to sell a particular security, the Sub-Advisers will consider a number of factors, including changes in the company's prospects, financial condition or industry position, as well as general economic and market conditions.
Common stock is a share ownership or equity interest in a corporation. It may or may not pay dividends, as some companies reinvest all of their profits back into their businesses, while others pay out some of their profits to shareholders as dividends. A depositary receipt is generally issued by a bank or financial institution and represents an ownership interest in the common stock or other equity securities of a foreign company.
The remaining 20% of the Fund's assets may be invested in equity securities of companies located in the United States.
The Fund may also use forward foreign currency exchange contracts, which are derivative instruments, in connection with its investments in foreign securities.
In pursuing the Fund's investment objective, the Adviser and/or Sub-Advisers have considerable leeway in deciding which investments they buy, hold or sell on a day-to-day basis and which trading strategies they use. For example, the Adviser and/or Sub-Advisers in their discretion may determine to use some permitted trading strategies while not using others.
Additional Investment Strategy Information
This section provides additional information relating to the Fund's investment strategies.
Defensive Investing. The Fund may take temporary "defensive" positions in attempting to respond to adverse market conditions. The Fund may invest up to 20% of its assets in investment grade debt securities or comparable non-rated securities, and any amount of its assets in cash or money market instruments, in a defensive posture that may be inconsistent with the Fund's principal investment strategies when the Adviser and/or Sub-Advisers believe it is advisable to do so.
Although taking a defensive posture is designed to protect the Fund from an anticipated market downturn, it could have the effect of reducing the benefit from any upswing in the market. When the Fund takes a defensive position, it may not achieve its investment objective.
***
The percentage limitations relating to the composition of the Fund's portfolio apply at the time the Fund acquires an investment. Subsequent percentage changes that result from market fluctuations generally will not require the Fund to sell any portfolio security. However, the Fund may be required to sell its illiquid securities holdings, or reduce its borrowings, if any, in response to fluctuations in the value of such holdings. The Fund may change its principal investment strategies without shareholder approval; however, you would be notified of any changes.
7
Principal Risks
There is no assurance that the Fund will achieve its investment objective. The Fund's share price and return will fluctuate with changes in the market value of the Fund's portfolio securities. When you sell Fund shares, they may be worth less than what you paid for them and, accordingly, you can lose money investing in this Fund.
Common Stock and Other Equity Securities. A principal risk of investing in the Fund is associated with its common stock and other equity investments. In general, stock and other equity security values fluctuate in response to activities specific to the company as well as general market, economic and political conditions. These prices can fluctuate widely in response to these factors.
The Fund's investments in convertible securities subject the Fund to the risks associated with both fixed-income securities and common stocks. Fixed-income securities are subject to two types of risk: credit risk and interest rate risk. Credit risk refers to the possibility that the issuer of a security will be unable to make interest payments and/or repay the principal on its debt. Interest rate risk refers to fluctuations in the value of a fixed-income security resulting from changes in the general level of interest rates. To the extent that a convertible security's investment value is greater than its conversion value, its price will be likely to increase when interest rates fall and decrease when interest rates rise, as with a fixed-income security. If the conversion value exceeds the investment value, the price of the convertible security will tend to fluctuate directly with the price of the underlying equity security.
Foreign and Emerging Market Securities. Foreign securities involve risks that are in addition to the risks associated with domestic securities. One additional risk is currency risk. While the price of Fund shares is quoted in U.S. dollars, the Fund may convert U.S. dollars to a foreign market's local currency to purchase a security in that market. If the value of that local currency falls relative to the U.S. dollar, the U.S. dollar value of the foreign security will decrease. This is true even if the foreign security's local price remains unchanged.
Foreign securities also have risks related to economic and political developments abroad, including expropriations, confiscatory taxation, exchange control regulation, limitations on the use or transfer of Fund assets and any effects of foreign social, economic or political instability. In particular, adverse political or economic developments in a geographic region or a particular country in which the Fund invests could cause a substantial decline in the value of the Fund. Foreign companies, in general, are not subject to the regulatory requirements of U.S. companies and, as such, there may be less publicly available information about these companies. Moreover, foreign accounting, auditing and financial reporting standards generally are different from those applicable to U.S. companies. Finally, in the event of a default of any foreign debt obligations, it may be more difficult for the Fund to obtain or enforce a judgment against the issuers of the securities.
Securities of foreign issuers may be less liquid than comparable securities of U.S. issuers and, as such, their price changes may be more volatile. Furthermore, foreign exchanges and broker-dealers are generally subject to less government and exchange scrutiny and regulation than their U.S. counterparts. In addition, differences in clearance and settlement procedures in foreign markets may cause delays in settlement of the Fund's trades effected in those markets and could result in losses to the Fund due to subsequent declines in the value of the securities subject to the trades.
8
The foreign securities in which the Fund may invest may be issued by issuers located in emerging market or developing countries. Compared to the United States and other developed countries, emerging market or developing countries may have relatively unstable governments, economies based on only a few industries and securities markets that trade a small number of securities. Securities issued by companies located in these countries tend to be especially volatile and may be less liquid than securities traded in developed countries. In the past, securities in these countries have been characterized by greater potential loss than securities of companies located in developed countries.
Depositary receipts involve many of the same risks as those associated with direct investment in foreign securities. In addition, the underlying issuers of certain depositary receipts, particularly unsponsored or unregistered depositary receipts, are under no obligation to distribute shareholder communications to the holders of such receipts, or to pass through to them any voting rights with respect to the deposited securities.
In connection with its investments in foreign securities, the Fund also may enter into contracts with banks, brokers or dealers to purchase or sell securities or foreign currencies at a future date ("forward contracts"). A foreign currency forward contract is a negotiated agreement between the contracting parties to exchange a specified amount of currency at a specified future time at a specified rate. The rate can be higher or lower than the spot rate between the currencies that are the subject of the contract. Forward foreign currency exchange contracts may be used to protect against uncertainty in the level of future foreign currency exchange rates or to gain or modify exposure to a particular currency. In addition, the Fund may use cross currency hedging or proxy hedging with respect to currencies in which the Fund has or expects to have portfolio or currency exposure. Cross currency hedges involve the sale of one currency against the positive exposure to a different currency and may be used for hedging purposes or to establish an active exposure to the exchange rate between any two currencies. Hedging the Fund's currency risks involves the risk of mismatching the Fund's objectives under a forward or futures contract with the value of securities denominated in a particular currency. Furthermore, such transactions reduce or preclude the opportunity for gain if the value of the currency should move in the direction opposite to the position taken. There is an additional risk to the effect that currency contracts create exposure to currencies in which the Fund's securities are not denominated. Unanticipated changes in currency prices may result in poorer overall performance for the Fund than if it had not entered into such contracts. The use of forward foreign currency exchange contracts involves the risk of loss from the insolvency or bankruptcy of the counterparty to the contract or the failure of the counterparty to make payments or otherwise comply with the terms of the contract.
Small and Medium Capitalization Companies. The Fund may invest in stocks of small and medium capitalization companies. Investing in securities of these companies involves greater risk than is customarily associated with investing in more established companies. These companies' stocks may be more volatile and less liquid than the stocks of more established companies. These stocks may have returns that vary, sometimes significantly, from the overall stock market. Often smaller and medium capitalization companies and the industries in which they are focused are still evolving and, while this may offer better growth potential than larger, more established companies, it also may make them more sensitive to changing market conditions.
Other Risks. The performance of the Fund also will depend on whether or not the Adviser and/or the Sub-Advisers are successful in applying the Fund's investment strategies. The Fund is also subject to other risks from its permissible investments, including the risks associated with its investments in fixed-income securities. For more information about these risks, see the "Additional Risk Information" section.
9
Additional Risk Information
This section provides additional information relating to the risks of investing in the Fund.
Fixed-Income Securities. All fixed-income securities are subject to two types of risk: credit risk and interest rate risk. Credit risk refers to the possibility that the issuer of a security will be unable to make interest payments and/or repay the principal on its debt. Interest rate risk refers to fluctuations in the value of a fixed-income security resulting from changes in the general level of interest rates. When the general level of interest rates goes up, the prices of most fixed-income securities go down. When the general level of interest rates goes down, the prices of most fixed-income securities go up. (Zero coupon securities are typically subject to greater price fluctuations than comparable securities that pay interest.)
Portfolio Holdings
A description of the Fund's policies and procedures with respect to the disclosure of the Fund's portfolio securities is available in the Fund's SAI.
Morgan Stanley Investment Management Inc.
The Adviser, together with its affiliated asset management companies, had approximately $268.2 billion in assets under management or supervision as of September 30, 2011.
Fund Management
The Fund has retained the Adviser—Morgan Stanley Investment Management Inc.—to provide investment advisory services. The Adviser is a wholly-owned subsidiary of Morgan Stanley, a preeminent global financial services firm engaged in securities trading and brokerage activities, as well as providing investment banking, research and analysis, financing and financial advisory services. The Adviser's address is 522 Fifth Avenue, New York, NY 10036.
The Adviser has entered into sub-advisory agreements with Morgan Stanley Investment Management Limited ("MSIM Limited"), located at 25 Cabot Square, Canary Wharf, London, E14 4QA, England and Morgan Stanley Investment Management Company ("MSIM Company"), located at 23 Church Street, 16-01 Capital Square, Singapore 049481. Both MSIM Limited and MSIM Company are wholly-owned subsidiaries of Morgan Stanley. MSIM Limited and MSIM Company provide the Fund with investment advisory services subject to the overall supervision of the Adviser and the Fund's Officers and Trustees. The Adviser pays each of MSIM Limited and MSIM Company on a monthly basis a portion of the net advisory fees the Adviser receives from the Fund.
The Fund is managed by members of the International Equity team. The team consists of portfolio managers and analysts. Current members of the team jointly and primarily responsible for the day-to-day management of the Fund's portfolio are William D. Lock, Walter B. Riddell, Peter J. Wright, Vladimir A. Demine, Christian Derold, John S. Goodacre and Bruno Paulson.
Mr. Lock has been associated with MSIM Limited in an investment management capacity since 1994. Mr. Riddell has been associated with MSIM Limited in an investment management capacity since 1995. Mr. Wright has been associated with MSIM Company in an investment management
10
capacity since 1996. Mr. Demine has been associated with MSIM Limited in an investment management capacity since May 2009. Prior to May 2009, Mr. Demine was associated in an investment management capacity with UBS Global Asset Management. Mr. Derold has been associated with MSIM Company in an investment management capacity since August 2010. Prior to August 2010, Mr. Derold was associated with MSIM Limited in an investment management capacity since May 2006. Mr. Goodacre has been associated with MSIM Limited in an investment management capacity since 2003. Mr. Paulson has been associated with MSIM Limited in an investment management capacity since June 2009. Prior to June 2009, Mr. Paulson was associated in an investment management capacity with Sanford Bernstein.
Messrs. Lock and Wright are co-lead managers of the Fund. Each member of the team has both global sector research responsibilities and makes investment management decisions for the Fund. All current members are responsible for the execution of the overall strategy of the Fund.
The Fund's SAI provides additional information about the portfolio managers' compensation structure, other accounts managed by the portfolio managers and the portfolio managers' ownership of securities in the Fund.
The composition of the team may change from time to time.
The Fund pays the Adviser a monthly advisory fee as full compensation for the services and facilities furnished to the Fund, and for Fund expenses assumed by the Adviser. The fee is based on the Fund's average daily net assets. For the fiscal year ended August 31, 2011, the Fund paid total investment advisory compensation amounting to 0.80% of the Fund's average daily net assets.
A discussion regarding the Board of Trustees' approval of the investment advisory and sub-advisory agreements is available in the Fund's annual report to shareholders for the period ended August 31, 2011.
11
Shareholder Information
Pricing Fund Shares
The price of Fund shares (excluding sales charges), called "net asset value," is based on the value of the Fund's portfolio securities. While the assets of each Class are invested in a single portfolio of securities, the net asset value of each Class will differ because the Classes have different ongoing distribution fees.
The net asset value per share of the Fund is determined once daily at the New York Stock Exchange ("NYSE") close (normally 4:00 pm Eastern time) on each day that the NYSE is open. Shares will not be priced on days that the NYSE is closed.
The value of the Fund's portfolio securities is based on the securities' market price when available. When a market price is not readily available, including circumstances under which the Adviser and/or Sub-Advisers determine that a security's market price is not accurate, a portfolio security is valued at its fair value, as determined under procedures established by the Fund's Board of Trustees.
In addition, with respect to securities that primarily are listed on foreign exchanges, when an event occurs after the close of such exchanges that is likely to have changed the value of the securities (e.g., a percentage change in value of one or more U.S. securities indices in excess of specified thresholds), such securities will be valued at their fair value, as determined under procedures established by the Fund's Board of Trustees. Securities also may be fair valued in the event of a significant development affecting a country or region or an issuer-specific development which is likely to have changed the value of the security.
In these cases, the Fund's net asset value will reflect certain portfolio securities' fair value rather than their market price. Fair value pricing involves subjective judgment and it is possible that the fair value determined for a security is materially different than the value that could be realized upon the sale of that security. With respect to securities that are primarily listed on foreign exchanges, the value of the Fund's portfolio securities may change on days when you will not be able to purchase or sell your shares.
To the extent the Fund invests in open-end management companies that are registered under the Investment Company Act of 1940, as amended ("Investment Company Act"), the Fund's net asset value is calculated based upon the net asset value of such funds. The prospectuses for such funds explain the circumstances under which they will use fair value pricing and its effects.
An exception to the Fund's general policy of using market prices concerns its short-term debt portfolio securities. Debt securities with remaining maturities of 60 days or less at the time of purchase are valued at amortized cost. However, if the cost does not reflect the securities' market value, these securities will be valued at their fair value.
12
Contacting a Financial Advisor
If you are new to the Morgan Stanley Funds and would like to contact a Morgan Stanley Smith Barney Financial Advisor, call toll-free 1-866-MORGAN8 for the telephone number of the Morgan Stanley Smith Barney office nearest you. You may also access our office locator on our Internet site at: www.morganstanley.com
How to Buy Shares
You may open a new account to buy Fund shares or buy additional Fund shares for an existing account by contacting your Morgan Stanley Smith Barney Financial Advisor or other authorized financial representative. Your Financial Advisor will assist you, step-by-step, with the procedures to invest in the Fund. The Transfer Agent, in its sole discretion, may allow you to purchase shares directly by calling and requesting an application.
To help the U.S. Government fight the funding of terrorism and money laundering activities, federal law requires all financial institutions to obtain, verify and record information that identifies each person who opens an account. What this means to you: when you open an account, we will ask your name, address, date of birth and other information that will allow us to identify you. If we are unable to verify your identity, we reserve the right to restrict additional transactions and/or liquidate your account at the next calculated net asset value after your account is closed (less any applicable sales/account charges and/or tax penalties) or take any other action required by law. In accordance with federal law requirements, the Fund has implemented an anti-money laundering compliance program, which includes the designation of an anti-money laundering compliance officer.
Because every investor has different immediate financial needs and long-term investment goals, the Fund offers investors six Classes of shares: Classes A, B, C, I, R and W. Class I, R and W shares are only offered to a limited group of investors. Each Class of shares offers a distinct structure of sales charges, distribution and service fees, and other features that are designed to address a variety of needs. Your Morgan Stanley Smith Barney Financial Advisor or other authorized financial representative can help you decide which Class may be most appropriate for you. When purchasing Fund shares, you must specify which Class of shares you wish to purchase.
When you buy Fund shares, the shares are purchased at the next share price calculated (plus any applicable front-end sales charge for Class A shares) after we receive your purchase order. Your payment is due on the third business day after you place your purchase order. We reserve the right to reject any order for the purchase of Fund shares for any reason.
The Fund will suspend offering its shares to new investors when Fund assets reach $1 billion, except as follows. Following the general suspension of the offering of Fund shares to new investors, the Fund will continue to offer its shares (1) through certain retirement plan accounts, (2) to clients of registered investment advisors who currently offer shares of the Fund in their discretionary asset allocation programs, (3) through certain endowments and foundations, (4) to clients of family office practices where shares of the Fund are held by family members of such clients, (5) to directors and trustees of the Morgan Stanley Funds, (6) to Morgan Stanley and its affiliates and their employees, and (7) to benefit plans sponsored by Morgan Stanley and its affiliates. Also following the general suspension of the offering of Fund shares to new investors, the Fund will continue to offer its shares to existing shareholders and may recommence offering its shares to other new investors in the future.
13
EasyInvest®
A purchase plan that allows you to transfer money automatically from your checking or savings account or from a Money Market Fund on a semi-monthly, monthly or quarterly basis. Contact your Morgan Stanley Smith Barney Financial Advisor for further information about this service.
Order Processing Fees. Your financial intermediary may charge processing or other fees in connection with the purchase or sale of the Fund's shares. Please consult your financial representative for more information regarding any such fees.
Minimum Investment Amounts
| | | Minimum Investment | |
| Investment Options | | Initial | | Additional | |
| Regular Account | | $ | 1,000 | | | $ | 100 | | |
| Individual Retirement Account | | $ | 1,000 | | | $ | 100 | | |
| Coverdell Education Savings Account | | $ | 500 | | | $ | 100 | | |
EasyInvest®
(Automatically from your checking or savings account or Money Market Fund) | | | $100* | | | | $100* | | |
* Provided your schedule of investments totals $1,000 in 12 months.
There is no minimum investment amount if you purchase Fund shares through: (1) the Adviser's mutual fund asset allocation program; (2) a program, approved by the Fund's distributor, in which you pay an asset-based fee for advisory, administrative and/or brokerage services; (3) the following programs approved by the Fund's distributor: (i) qualified state tuition plans described in Section 529 of the Internal Revenue Code or (ii) certain other investment programs that do not charge an asset-based fee; (4) employer-sponsored employee benefit plan accounts; (5) certain deferred compensation programs established by the Adviser or its affiliates for their employees or the Fund's Trustees; or (6) the reinvestment of dividends in additional Fund shares.
Investment Options for Certain Institutional and Other Investors/Class I, Class R and Class W Shares. To be eligible to purchase Class I, Class R or Class W shares, you must qualify under one of the investor categories specified in the "Share Class Arrangements" section of this Prospectus.
Subsequent Investments Sent Directly to the Fund. In addition to buying additional Fund shares for an existing account by contacting your Morgan Stanley Smith Barney Financial Advisor, you may send a check directly to the Fund. To buy additional shares in this manner:
n Write a "letter of instruction" to the Fund specifying the name(s) on the account, the account number, the social security or tax identification number, the Class of shares you wish to purchase and the investment amount (which would include any applicable front-end sales charge). The letter must be signed by the account owner(s).
n Make out a check for the total amount payable to: Morgan Stanley International Value Equity Fund.
n Mail the letter and check to Morgan Stanley Services Company Inc. at P.O. Box 219885, Kansas City, MO 64121-9885.
14
How to Exchange Shares
Permissible Fund Exchanges. You may exchange shares of any Class of the Fund for the same Class of any other continuously offered Multi-Class Fund, or for shares of a Money Market Fund or the Limited Duration U.S. Government Trust, without the imposition of an exchange fee. In addition, Class Q shares of Morgan Stanley Global Infrastructure Fund may be exchanged for Class A shares of the Fund without payment of sales charges (including contingent deferred sales charges ("CDSCs")) or the imposition of an exchange fee. Front-end sales charges are not imposed on exchanges of Class A shares. See the inside back cover of this Prospectus for each Morgan Stanley Fund's designation as a Multi-Class Fund or Money Market Fund. If a Morgan Stanley Fund is not listed, consult the inside back cover of that fund's current prospectus for its designation.
The current prospectus for each Morgan Stanley Fund describes its investment objective(s), policies and investment minimums, and should be read before investment. Since exchanges are available only into continuously offered Morgan Stanley Funds, exchanges are not available into Morgan Stanley Funds, or classes of Morgan Stanley Funds that are not currently being offered for purchase. An exchange of Fund shares held for less than 30 days from the date of purchase will be subject to the 2% redemption fee described under the section "How to Sell Shares."
Exchange Procedures. You can process an exchange by contacting your Morgan Stanley Smith Barney Financial Advisor or other authorized financial representative. You may also write the Transfer Agent or call toll-free (800) 869-NEWS, our automated telephone system (which is generally accessible 24 hours a day, seven days a week), to place an exchange order. You automatically have the telephone exchange privilege unless you indicate otherwise by checking the applicable box on the new account application form. If you hold share certificates, no exchanges may be processed until we have received all applicable share certificates.
Exchange requests received on a business day prior to the time shares of the funds involved in the request are priced will be processed on the date of receipt. "Processing" a request means that shares of the fund which you are exchanging will be redeemed at the net asset value per share next determined on the date of receipt. Shares of the fund that you are purchasing will also normally be purchased at the net asset value per share, plus any applicable sales charge, next determined on the date of receipt. Exchange requests received on a business day after the time that shares of the funds involved in the request are priced will be processed on the next business day in the manner described herein.
The Fund may terminate or revise the exchange privilege upon required notice or in certain cases without notice. See "Limitations on Exchanges." The check writing privilege is not available for Money Market Fund shares you acquire in an exchange.
Telephone Exchanges. Morgan Stanley and its subsidiaries, including the Transfer Agent, and the Fund employ procedures considered by them to be reasonable to confirm that instructions communicated by telephone are genuine. Such procedures may include requiring certain personal identification information prior to acting upon telephone instructions, tape-recording telephone communications and providing written confirmation of instructions communicated by telephone. If reasonable procedures are employed, none of Morgan Stanley, the Transfer Agent or the Fund will be liable for following telephone instructions which it reasonably believes to be genuine. Telephone exchanges may not be available if you cannot reach the Transfer Agent by telephone, whether because all telephone lines are busy or
15
for any other reason; in such case a shareholder would have to use the Fund's other exchange procedures described in this section.
Telephone instructions will be accepted if received by the Transfer Agent between 9:00 a.m. and 4:00 p.m. Eastern time on any day the NYSE is open for business. During periods of drastic economic or market changes, it is possible that the telephone exchange procedures may be difficult to implement, although this has not been the case with the Fund in the past.
Margin Accounts. If you have pledged your Fund shares in a margin account, contact your Morgan Stanley Smith Barney Financial Advisor or other authorized financial representative regarding restrictions on the exchange of such shares.
Tax Considerations of Exchanges. If you exchange shares of the Fund for shares of another Morgan Stanley Fund, there are important tax considerations. For tax purposes, the exchange out of the Fund is considered a sale of Fund shares and the exchange into the other fund is considered a purchase. As a result, you may realize a capital gain or loss.
You should review the "Tax Consequences" section and consult your own tax professional about the tax consequences of an exchange.
Limitations on Exchanges. Certain patterns of past exchanges and/or purchase or sale transactions involving the Fund or other Morgan Stanley Funds may result in the Fund rejecting, limiting or prohibiting, at its sole discretion, and without prior notice, additional purchases and/or exchanges and may result in a shareholder's account being closed. Determinations in this regard may be made based on the frequency or dollar amount of previous exchanges or purchase or sale transactions. The Fund reserves the right to reject an exchange request for any reason.
CDSC Calculations on Exchanges. See the "Share Class Arrangements" section of this Prospectus for a discussion of how applicable CDSCs are calculated for shares of one Morgan Stanley Fund that are exchanged for shares of another.
For further information regarding exchange privileges, you should contact your Morgan Stanley Smith Barney Financial Advisor or call toll-free (800) 869-NEWS.
How to Sell Shares
You can sell some or all of your Fund shares at any time. If you sell Class A, Class B or Class C shares, your net sale proceeds are reduced by the amount of any applicable CDSC. Your shares will be sold at the next price calculated after we receive your order to sell as described below.
| Options | | Procedures | |
| Contact Your Financial Advisor | | To sell your shares, simply call your Morgan Stanley Smith Barney Financial Advisor or other authorized financial representative. Payment will be sent to the address to which the account is registered or deposited in your brokerage account. | |
|
16
| Options | | Procedures | |
| By Telephone | | You can sell your shares by telephone and have the proceeds sent to the address of record or your bank account on record. You automatically have the telephone redemption privilege unless you indicate otherwise by checking the applicable box on the new account application form.
Before processing a telephone redemption, keep the following information in mind:
n You can establish this option at the time you open the account by completing the Morgan Stanley Funds New Account Application or subsequently by calling toll-free (800) 869-NEWS.
n Call toll-free (800) 869-NEWS to process a telephone redemption using our automated telephone system which is generally accessible 24 hours a day, seven days a week.
n Your request must be received prior to market close, generally 4:00 p.m. Eastern time.
n If your account has multiple owners, the Transfer Agent may rely on the instructions of any one owner.
n Proceeds must be made payable to the name(s) and address in which the account is registered.
n You may redeem amounts of $50,000 or less daily if the proceeds are to be paid by check or by Automated Clearing House.
n This privilege is not available if the address on your account has changed within 15 calendar days prior to your telephone redemption request.
n Telephone redemption is available for most accounts other than accounts with shares represented by certificates.
If you request to sell shares that were recently purchased by check, the proceeds of that sale may not be sent to you until it has been verified that the check has cleared, which may take up to 15 calendar days from the date of purchase.
Morgan Stanley and its subsidiaries, including the Transfer Agent, employ procedures considered by them to be reasonable to confirm that instructions communicated by telephone are genuine. Such procedures may include requiring certain personal identification information prior to acting upon telephone instructions, tape-recording telephone communications and providing written confirmation of instructions communicated by telephone. If reasonable procedures are employed, neither Morgan Stanley nor the Transfer Agent will be liable for following telephone instructions which it reasonably believes to be genuine. Telephone redemptions may not be available if a shareholder cannot reach the Transfer Agent by telephone, whether because all telephone lines are busy or for any other reason; in such case, a shareholder would have to use the Fund's other redemption procedures described in this section. | |
|
| By Letter | | You can also sell your shares by writing a "letter of instruction" that includes:
n your account number;
n the name of the Fund;
n the dollar amount or the number of shares you wish to sell;
n the Class of shares you wish to sell; and
n the signature of each owner as it appears on the account. | |
|
17
| Options | | Procedures | |
| By Letter (continued) | | If you are requesting payment to anyone other than the registered owner(s) or that payment be sent to any address other than the address of the registered owner(s) or pre-designated bank account, you will need a signature guarantee. You can obtain a signature guarantee from an eligible guarantor acceptable to the Transfer Agent. (You should contact the Transfer Agent toll-free at (800) 869-NEWS for a determination as to whether a particular institution is an eligible guarantor.) A notary public cannot provide a signature guarantee. Additional documentation may be required for shares held by a corporation, partnership, trustee or executor.
Mail the letter to Morgan Stanley Services Company Inc. at P.O. Box 219886, Kansas City, MO 64121-9886. If you hold share certificates, you must return the certificates, along with the letter and any required additional documentation.
A check will be mailed to the name(s) and address in which the account is registered, or otherwise according to your instructions. | |
|
| Systematic Withdrawal Plan | | If your investment in all of the Morgan Stanley Funds has a total market value of at least $10,000, you may elect to withdraw amounts of $25 or more, or in any whole percentage of a fund's balance (provided the amount is at least $25), on a monthly, quarterly, semi-annual or annual basis, from any fund with a balance of at least $1,000. Each time you add a fund to the plan, you must meet the plan requirements.
Amounts withdrawn are subject to any applicable CDSC. A CDSC may be waived under certain circumstances. See the Class B waiver categories listed in the "Share Class Arrangements" section of this Prospectus.
To sign up for the systematic withdrawal plan, contact your Morgan Stanley Smith Barney Financial Advisor or call toll-free (800) 869-NEWS. You may terminate or suspend your plan at any time. Please remember that withdrawals from the plan are sales of shares, not Fund "distributions," and ultimately may exhaust your account balance. The Fund may terminate or revise the plan at any time. | |
|
Payment for Sold Shares. After we receive your complete instructions to sell as described above, a check will be mailed to you within seven days, although we will attempt to make payment within one business day. Payment may also be sent to your brokerage account.
Payment may be postponed or the right to sell your shares suspended under unusual circumstances. If you request to sell shares that were recently purchased by check, the proceeds of that sale may not be sent to you until it has been verified that the check has cleared, which may take up to 15 calendar days from the date of purchase.
Payments-in-Kind. If we determine that it is in the best interest of the Fund not to pay redemption proceeds in cash, we may pay you partly or entirely by distributing to you securities held by the Fund. Such in-kind securities may be illiquid and difficult or impossible for a shareholder to sell at a time and at a price that a shareholder would like. Redemptions paid in such securities generally will give rise to income, gain or loss for income tax purposes in the same
18
manner as redemptions paid in cash. In addition, you may incur brokerage costs and a further gain or loss for income tax purposes when you ultimately sell the securities.
Order Processing Fees. Your financial intermediary may charge processing or other fees in connection with the purchase or sale of the Fund's shares. Please consult your financial representative for more information regarding any such fees.
Tax Considerations. Normally, your sale of Fund shares is subject to federal and state income tax. You should review the "Tax Consequences" section of this Prospectus and consult your own tax professional about the tax consequences of a sale.
Reinstatement Privilege. If you sell Fund shares and have not previously exercised the reinstatement privilege, you may, within 35 days after the date of sale, invest any portion of the proceeds in the same Class of Fund shares at their net asset value and receive a pro rata credit for any CDSC paid in connection with the sale.
Involuntary Sales. The Fund reserves the right, on 60 days' notice, to sell the shares of any shareholder (other than shares held in an individual retirement account ("IRA") or 403(b) Custodial Account) whose shares, due to sales by the shareholder, have a value below $100, or in the case of an account opened through EasyInvest®, if after 12 months the shareholder has invested less than $1,000 in the account.
However, before the Fund sells your shares in this manner, we will notify you and allow you 60 days to make an additional investment in an amount that will increase the value of your account to at least the required amount before the sale is processed. No CDSC will be imposed on any involuntary sale.
Margin Accounts. If you have pledged your Fund shares in a margin account, contact your Morgan Stanley Smith Barney Financial Advisor or other authorized financial representative regarding restrictions on the sale of such shares.
Redemption Fee. Fund shares redeemed within 30 days of purchase will be subject to a 2% redemption fee, payable to the Fund. The redemption fee is designed to protect the Fund and its remaining shareholders from the effects of short-term trading. The redemption fee is not imposed on redemptions made: (i) through systematic withdrawal/exchange plans, (ii) through pre-approved asset allocation programs, (iii) of shares received by reinvesting income dividends or capital gain distributions, (iv) through certain collective trust funds or other pooled vehicles and (v) on behalf of advisory accounts where client allocations are solely at the discretion of the Morgan Stanley Investment Management investment team. The redemption fee is based on, and deducted from, the redemption proceeds. Each time you redeem or exchange shares, the shares held the longest will be redeemed or exchanged first.
The redemption fee may not be imposed on transactions that occur through certain omnibus accounts at financial intermediaries. Certain financial intermediaries may not have the ability to assess a redemption fee. Certain financial intermediaries may apply different methodologies than those described above in assessing redemption fees, may impose their own redemption fee that may differ from the Fund's redemption fee or may impose certain trading restrictions to deter market-timing and frequent trading. If you invest in the Fund through a financial intermediary, please read that financial intermediary's materials carefully to learn about any other restrictions or fees that may apply.
19
Targeted
Dividends®
You may select to have your Fund distributions automatically invested in other Classes of Fund shares or Classes of another Morgan Stanley Fund that you own. Contact your Morgan Stanley Smith Barney Financial Advisor for further information about this service.
Distributions
The Fund passes substantially all of its earnings from income and capital gains along to its investors as "distributions." The Fund earns income from stocks and interest from fixed-income investments. These amounts are passed along to Fund shareholders as "income dividend distributions." The Fund realizes capital gains whenever it sells securities for a higher price than it paid for them. These amounts may be passed along as "capital gain distributions."
The Fund declares income dividends separately for each Class. Distributions paid on Class A, Class I, Class R and Class W shares usually will be higher than for Class B and Class C shares because distribution fees that Class B and Class C shares pay are higher. Normally, income dividends are distributed to shareholders annually. Capital gains, if any, are usually distributed in December. The Fund, however, may retain and reinvest any long-term capital gains. The Fund may at times make payments from sources other than income or capital gains that represent a return of a portion of your investment. These payments would not be taxable to you as a shareholder, but would have the effect of reducing your basis in the Fund.
Distributions are reinvested automatically in additional shares of the same Class and automatically credited to your account, unless you request in writing that all distributions be paid in cash. If you elect the cash option, the Fund will mail a check to you no later than seven business days after the distribution is declared. However, if you purchase Fund shares through a Morgan Stanley Smith Barney Financial Advisor or other authorized financial representative within three business days prior to the record date for the distribution, the distribution will automatically be paid to you in cash, even if you did not request to receive all distributions in cash. No interest will accrue on uncashed checks. If you wish to change how your distributions are paid, your request should be received by the Transfer Agent at least five business days prior to the record date of the distributions.
Frequent Purchases and Redemptions of Fund Shares
Frequent purchases and redemptions of Fund shares by Fund shareholders are referred to as "market-timing" or "short-term trading" and may present risks for other shareholders of the Fund, which may include, among other things, dilution in the value of Fund shares held by long-term shareholders, interference with the efficient management of the Fund's portfolio, increased brokerage and administrative costs, incurring unwanted taxable gains and forcing the Fund to hold excess levels of cash.
In addition, the Fund is subject to the risk that market-timers and/or short-term traders may take advantage of time zone differences between the foreign markets on which the Fund's portfolio securities trade and the time as of which the Fund's net asset value is calculated ("time-zone arbitrage"). For example, a market-timer may purchase shares of the Fund based on events occurring after foreign market closing prices are established, but before the Fund's net asset value calculation, that are likely to result in higher prices in foreign markets the following day. The market-timer would redeem the Fund's shares the next day when the Fund's share price would reflect the increased prices in foreign markets, for a quick profit at the expense of long-term Fund shareholders.
20
The Fund's policies with respect to valuing portfolio securities are described in "Shareholder Information—Pricing Fund Shares."
The Fund discourages and does not accommodate frequent purchases and redemptions of Fund shares by Fund shareholders and the Fund's Board of Trustees has adopted policies and procedures with respect to such frequent purchases and redemptions. The Fund's policies with respect to purchases, redemptions and exchanges of Fund shares are described in the "How to Buy Shares," "How to Exchange Shares" and "How to Sell Shares" sections of this Prospectus. Except as described in each of these sections, and with respect to trades that occur through omnibus accounts at intermediaries, as described below, the Fund's policies regarding frequent trading of Fund shares are applied uniformly to all shareholders. With respect to trades that occur through omnibus accounts at intermediaries, such as investment managers, broker-dealers, transfer agents and third party administrators, the Fund (i) requests assurance that such intermediaries currently selling Fund shares have in place internal policies and procedures reasonably designed to address market-timing concerns and has instructed such intermediaries to notify the Fund immediately if they are unable to comply with such policies and procedures and (ii) requires all prospective intermediaries to agree to cooperate in enforcing the Fund's policies (or, upon prior written approval only, on intermediary's own policies) with respect to frequent purchases, redemptions and exchanges of Fund shares.
Omnibus accounts generally do not identify customers' trading activity to the Fund on an individual ongoing basis. Therefore, with respect to trades that occur through omnibus accounts at financial intermediaries, to some extent, the Fund relies on the financial intermediary to monitor frequent short-term trading within the Fund by the financial intermediary's customers. However, the Fund or the distributor has entered into agreements with financial intermediaries whereby intermediaries are required to provide certain customer identification and transaction information upon the Fund's request. The Fund may use this information to help identify and prevent market-timing activity in the Fund. There can be no assurance that the Fund will be able to identify or prevent all market-timing activities.
Tax Consequences
As with any investment, you should consider how your Fund investment will be taxed. The tax information in this Prospectus is provided as general information. You should consult your own tax professional about the tax consequences of an investment in the Fund.
Unless your investment in the Fund is through a tax-deferred retirement account, such as a 401(k) plan or IRA, you need to be aware of the possible tax consequences when:
n The Fund makes distributions; and
n You sell Fund shares, including an exchange to another Morgan Stanley Fund.
Taxes on Distributions. Your distributions are normally subject to federal and state income tax when they are paid, whether you take them in cash or reinvest them in Fund shares. A distribution also may be subject to local income tax. Any income dividend distributions and any short-term capital gain distributions are taxable to you as ordinary income. Any long-term capital gain distributions are taxable as long-term capital gains, no matter how long you have owned shares in the Fund.
Under current law (through 2012), if certain holding period requirements are met with respect to your shares, a portion of the income dividends you receive may be taxed at the same rate as long-term capital gains. However, even if income
21
received in the form of income dividends is taxed at the same rates as long-term capital gains, such income will not be considered long-term capital gains for other federal income tax purposes. For example, you generally will not be permitted to offset income dividends with capital losses. Short-term capital gain distributions will continue to be taxed at ordinary income rates.
If more than 50% of the Fund's assets are invested in foreign securities at the end of any fiscal year, the Fund may elect to permit shareholders to generally take a credit or deduction on their federal income tax return for foreign taxes paid by the Fund.
You will be sent a statement (IRS Form 1099-DIV) by February of each year showing the taxable distributions paid to you in the previous year. The statement provides information on your dividends and any capital gains for tax purposes.
Taxes on Sales. Your sale of Fund shares normally is subject to federal and state income tax and may result in a taxable gain or loss to you. A sale also may be subject to local income tax. Your exchange of Fund shares for shares of another Morgan Stanley Fund is treated for tax purposes like a sale of your original shares and a purchase of your new shares. Thus, the exchange may, like a sale, result in a taxable gain or loss to you and will give you a new tax basis for your new shares.
Due to recent legislation, the Fund (or its administrative agent) is required to report to the IRS and furnish to Fund shareholders the cost basis information for sale transactions of shares purchased on or after January 1, 2012. Shareholders may elect to have one of several cost basis methods applied to their account when calculating the cost basis of shares sold, including average cost, FIFO ("first-in, first-out"), or some other specific identification method. Unless you instruct otherwise, the Fund will use average cost as its default cost basis method, and will treat sales as first coming from shares purchased prior to January 1, 2012. If average cost is used for the first sale of Fund shares covered by these new rules, the shareholder may only use an alternative cost basis method for shares purchased prospectively. Fund shareholders should consult with their tax advisors to determine the best cost basis method for their tax situation.
When you open your Fund account, you should provide your social security or tax identification number on your investment application. By providing this information, you will avoid being subject to federal backup withholding tax on taxable distributions and redemption proceeds (as of the date of this Prospectus this rate is 28% and is scheduled to increase to 31% after 2012). Any withheld amount would be sent to the IRS as an advance payment of your taxes due on your income.
Share Class Arrangements
The Fund offers several Classes of shares having different distribution arrangements designed to provide you with different purchase options according to your investment needs. Your Morgan Stanley Smith Barney Financial Advisor or other authorized financial representative can help you decide which Class may be appropriate for you.
The general public is offered three Classes: Class A shares, Class B shares and Class C shares, which differ principally in terms of sales charges and ongoing expenses. Class I, Class R and Class W shares are offered only to limited categories of investors. Shares that you acquire through reinvested distributions will not be subject to any front-end sales charge or CDSC.
Sales personnel may receive different compensation for selling each Class of shares. The sales charges applicable to each Class provide for the distribution financing of shares of that Class.
22
The chart below compares the sales charge and the annual 12b-1 fee applicable to each Class:
| Class | | Sales Charge | | Maximum Annual 12b-1 Fee | |
| | A | | | Maximum 5.25% initial sales charge reduced for purchases of $25,000 or more; shares
purchased without an initial sales charge are generally subject to a 1.00% CDSC if sold
during the first 18 months | | | 0.25 | % | |
| | B | | | Maximum 5.00% CDSC during the first year decreasing to 0% after six years | | | 1.00 | % | |
| | C | | | 1.00% CDSC during the first year | | | 1.00 | % | |
| | I | | | None | | | None | | |
| | R | | | None | | | 0.50 | % | |
| | W | | | None | | | 0.35 | % | |
While Class B, Class C, Class R and Class W shares do not have any front-end sales charges, their higher ongoing annual expenses (due to higher 12b-1 fees) mean that over time you could end up paying more for these shares than if you were to pay front-end sales charges for Class A shares.
Certain shareholders may be eligible for reduced sales charges (i.e., breakpoint discounts), CDSC waivers and eligibility minimums. Please see the information for each Class set forth below for specific eligibility requirements. You must notify your Morgan Stanley Smith Barney Financial Advisor or other authorized financial representative (or the Transfer Agent if you purchase shares directly through the Fund) at the time a purchase order (or in the case of Class B or Class C shares, a redemption order) is placed, that the purchase (or redemption) qualifies for a reduced sales charge (i.e., breakpoint discount), CDSC waiver or eligibility minimum. Similar notification must be made in writing when an order is placed by mail. The reduced sales charge, CDSC waiver or eligibility minimum will not be granted if: (i) notification is not furnished at the time of order; or (ii) a review of the records of Morgan Stanley Smith Barney, Morgan Stanley & Co. LLC ("Morgan Stanley & Co.") or other authorized dealer of Fund shares, or the Transfer Agent does not confirm your represented holdings.
In order to obtain a reduced sales charge (i.e., breakpoint discount) or to meet an eligibility minimum, it may be necessary at the time of purchase for you to inform your Morgan Stanley Smith Barney Financial Advisor or other authorized financial representative (or the Transfer Agent if you purchase shares directly through the Fund) of the existence of other accounts in which there are holdings eligible to be aggregated to meet the sales load breakpoints or eligibility minimums. In order to verify your eligibility, you may be required to provide account statements and/or confirmations regarding shares of the Fund or other Morgan Stanley Funds held in all related accounts described below at Morgan Stanley Smith Barney, Morgan Stanley & Co. or by other authorized dealers, as well as shares held by related parties, such as members of the same family or household, in order to determine whether you have met a sales load breakpoint or eligibility minimum. The Fund makes available, in a clear and prominent format, free of charge, on its web site, www.morganstanley.com, information regarding applicable sales loads, reduced sales charges (i.e., breakpoint discounts), sales load waivers and eligibility minimums. The web site includes hyperlinks that facilitate access to the information.
CLASS A SHARES Class A shares are sold at net asset value plus an initial sales charge of up to 5.25% of the public offering price. The initial sales charge is reduced for purchases of $25,000 or more according to the schedule
23
Front-End Sales Charge or FSC
An initial sales charge you pay when purchasing Class A shares that is based on a percentage of the offering price. The percentage declines based upon the dollar value of Class A shares you purchase. We offer three ways to reduce your Class A sales charges—the Combined Purchase Privilege, Right of Accumulation and Letter of Intent.
below. Investments of $1 million or more are not subject to an initial sales charge, but are generally subject to a CDSC of 1.00% on sales made within 18 months after the last day of the month of purchase. The CDSC will be assessed in the same manner and with the same CDSC waivers as with Class B shares. In addition, the CDSC on Class A shares will be waived in connection with sales of Class A shares for which no commission or transaction fee was paid by the distributor to authorized dealers at the time of purchase of such shares. Class A shares are also subject to a distribution and shareholder services (12b-1) fee of up to 0.25% of the average daily net assets of the Class. The maximum annual 12b-1 fee payable by Class A shares is lower than the maximum annual 12b-1 fee payable by Class B, Class C, Class R or Class W shares.
The offering price of Class A shares includes a sales charge (expressed as a percentage of the public offering price) on a single transaction as shown in the following table:
| | | Front-End Sales Charge | |
| Amount of Single Transaction | | Percentage of
Public Offering Price | | Approximate Percentage
of Net Amount Invested | |
| Less than $25,000 | | | 5.25 | % | | | 5.54 | % | |
| $25,000 but less than $50,000 | | | 4.75 | % | | | 4.99 | % | |
| $50,000 but less than $100,000 | | | 4.00 | % | | | 4.17 | % | |
| $100,000 but less than $250,000 | | | 3.00 | % | | | 3.09 | % | |
| $250,000 but less than $500,000 | | | 2.50 | % | | | 2.56 | % | |
| $500,000 but less than $1 million | | | 2.00 | % | | | 2.04 | % | |
| $1 million and over | | | 0.00 | % | | | 0.00 | % | |
You may benefit from a reduced sales charge schedule (i.e., breakpoint discount) for purchases of Class A shares of the Fund, by combining, in a single transaction, your purchase with purchases of Class A shares of the Fund by the following related accounts:
n A single account (including an individual, trust or fiduciary account).
n A family member account (limited to spouse, and children under the age of 21).
n Pension, profit sharing or other employee benefit plans of companies and their affiliates.
n Employer sponsored and individual retirement accounts (including IRAs, Keogh, 401(k), 403(b), 408(k) and 457(b) Plans).
n Tax-exempt organizations.
n Groups organized for a purpose other than to buy mutual fund shares.
Combined Purchase Privilege. You will have the benefit of reduced sales charges by combining purchases of Class A shares of the Fund for any related account in a single transaction with purchases of any class of shares of other Morgan Stanley Multi-Class Funds for the related account or any other related account. For the purpose of this combined purchase privilege, a "related account" is:
n A single account (including an individual account, a joint account and a trust account established solely for the benefit of the individual).
n A family member account (limited to spouse, and children under the age of 21, but including trust accounts established solely for the benefit of a spouse, or children under the age of 21).
24
n An IRA and single participant retirement account (such as a Keogh).
n An UGMA/UTMA account.
Right of Accumulation. You may benefit from a reduced sales charge if the cumulative net asset value of Class A shares of the Fund purchased in a single transaction, together with the net asset value of all classes of shares of Morgan Stanley Multi-Class Funds (including shares of Morgan Stanley Non-Multi-Class Funds which resulted from an exchange from Morgan Stanley Multi-Class Funds) held in related accounts, amounts to $25,000 or more. For the purposes of the right of accumulation privilege, a related account is any one of the accounts listed under "Combined Purchase Privilege" above.
Notification. You must notify your Morgan Stanley Smith Barney Financial Advisor or other authorized financial representative (or the Transfer Agent if you purchase shares directly through the Fund) at the time a purchase order is placed that the purchase qualifies for a reduced sales charge under any of the privileges discussed above. Similar notification must be made in writing when an order is placed by mail. The reduced sales charge will not be granted if: (i) notification is not furnished at the time of the order; or (ii) a review of the records of Morgan Stanley Smith Barney or other authorized dealer of Fund shares or the Transfer Agent does not confirm your represented holdings.
In order to obtain a reduced sales charge under any of the privileges discussed above, it may be necessary at the time of purchase for you to inform your Morgan Stanley Smith Barney Financial Advisor or other authorized financial representative (or the Transfer Agent if you purchase shares directly through the Fund) of the existence of other accounts in which there are holdings eligible to be aggregated to meet the sales load breakpoint and/or right of accumulation threshold. In order to verify your eligibility, you may be required to provide account statements and/or confirmations regarding shares of the Fund or other Morgan Stanley Funds held in all related accounts described above at Morgan Stanley Smith Barney or by other authorized dealers, as well as shares held by related parties, such as members of the same family or household, in order to determine whether you have met the sales load breakpoint and/or right of accumulation threshold. The Fund makes available, in a clear and prominent format, free of charge, on its web site, www.morganstanley.com, information regarding applicable sales loads and reduced sales charges (i.e., breakpoint discounts). The web site includes hyperlinks that facilitate access to the information.
Letter of Intent. The above schedule of reduced sales charges for larger purchases also will be available to you if you enter into a written "Letter of Intent." A Letter of Intent provides for the purchase of Class A shares of the Fund or other Multi-Class Funds within a 13-month period. The initial purchase under a Letter of Intent must be at least 5% of the stated investment goal. The Letter of Intent does not preclude the Fund (or any other Multi-Class Fund) from discontinuing sales of its shares. To determine the applicable sales charge reduction, you may also include: (1) the cost of shares of other Morgan Stanley Funds which were previously purchased at a price including a front-end sales charge during the 90-day period prior to the distributor receiving the Letter of Intent, and (2) the historical cost of shares of other funds you currently own acquired in exchange for shares of funds purchased during that period at a price including a front-end sales charge. You may combine purchases and exchanges by family members (limited to spouse, and children under the age of 21) during the periods referenced in (1) and (2) above. You should retain any records necessary to substantiate historical costs because the Fund, the Transfer Agent and any financial intermediaries may not maintain this information. You can obtain a Letter of Intent by contacting your Morgan Stanley Smith Barney Financial Advisor or other authorized financial representative, or by calling toll-free (800) 869-NEWS. If you do not achieve the stated investment goal within the 13-month period, you are required to pay the difference between the sales charges otherwise applicable and sales charges
25
Contingent Deferred Sales Charge or CDSC
A fee you pay when you sell shares of certain Morgan Stanley Funds purchased without an initial sales charge. This fee declines the longer you hold your shares as set forth in the table.
actually paid, which may be deducted from your investment. Shares acquired through reinvestment of distributions are not aggregated to achieve the stated investment goal.
Other Sales Charge Waivers. In addition to investments of $1 million or more, your purchase of Class A shares is not subject to a front-end sales charge (or a CDSC upon sale) if your account qualifies under one of the following categories:
n A trust for which a banking affiliate of the Adviser provides discretionary trustee services.
n Persons participating in a fee-based investment program (subject to all of its terms and conditions, including termination fees, and mandatory sale or transfer restrictions on termination) approved by the Fund's distributor, pursuant to which they pay an asset-based fee for investment advisory, administrative and/or brokerage services.
n Qualified state tuition plans described in Section 529 of the Internal Revenue Code and donor-advised charitable gift funds (subject to all applicable terms and conditions) and certain other investment programs that do not charge an asset-based fee and have been approved by the Fund's distributor.
n Employer-sponsored employee benefit plans, whether or not qualified under the Internal Revenue Code, for which an entity independent from Morgan Stanley serves as recordkeeper under an alliance or similar agreement with Morgan Stanley's Retirement Plan Solutions ("Morgan Stanley Eligible Plans").
n A Morgan Stanley Eligible Plan whose Class B shares have converted to Class A shares, regardless of the plan's asset size or number of eligible employees.
n Insurance company separate accounts that have been approved by the Fund's distributor.
n Current or retired Directors or Trustees of the Morgan Stanley Funds, such persons' spouses, and children under the age of 21, and trust accounts for which any of such persons is a beneficiary.
n Current or retired directors, officers and employees of Morgan Stanley and any of its subsidiaries, such persons' spouses, and children under the age of 21, and trust accounts for which any of such persons is a beneficiary.
CLASS B SHARES Class B shares are offered at net asset value with no initial sales charge but are subject to a CDSC, as set forth in the table below. For the purpose of calculating the CDSC, shares are deemed to have been purchased on the last day of the month during which they were purchased.
| Year Since Purchase Payment Made | | CDSC as a Percentage of Amount Redeemed | |
| First | | | 5.0 | % | |
| Second | | | 4.0 | % | |
| Third | | | 3.0 | % | |
| Fourth | | | 2.0 | % | |
| Fifth | | | 2.0 | % | |
| Sixth | | | 1.0 | % | |
| Seventh and thereafter | | | None | | |
26
The CDSC is assessed on an amount equal to the lesser of the then market value of the shares or the historical cost of the shares (which is the amount actually paid for the shares at the time of original purchase) being redeemed. Accordingly, no sales charge is imposed on increases in net asset value above the initial purchase price. In determining whether a CDSC applies to a redemption, it is assumed that the shares being redeemed first are any shares in the shareholder's Fund account that are not subject to a CDSC, followed by shares held the longest in the shareholder's account.
Broker-dealers or other financial intermediaries may impose a limit on the dollar value of a Class B share purchase order that they will accept. You should discuss with your financial advisor which share class is most appropriate for you, based on the size of your investment, your expected time horizon for holding the shares and other factors, bearing in mind the availability of reduced sales loads on Class A share purchases of $25,000 or more and for existing shareholders who hold over $25,000 in Morgan Stanley Funds.
CDSC Waivers. A CDSC, if otherwise applicable, will be waived in the case of:
n Sales of shares held at the time you die or become disabled (within the definition in Section 72(m)(7) of the Internal Revenue Code which relates to the ability to engage in gainful employment), if the shares are: (i) registered either in your individual name or in the names of you and your spouse as joint tenants with right of survivorship; (ii) registered in the name of a trust of which (a) you are the settlor and that is revocable by you (i.e., a "living trust") or (b) you and your spouse are the settlors and that is revocable by you or your spouse (i.e., a "joint living trust"); or (iii) held in a qualified corporate or self-employed retirement plan, IRA or 403(b) Custodial Account; provided in each case that the sale is requested within one year after your death or initial determination of disability.
n Sales in connection with the following retirement plan "distributions": (i) lump-sum or other distributions from a qualified corporate or self-employed retirement plan following retirement (or, in the case of a "key employee" of a "top heavy" plan, following attainment of age 59 1/2); (ii) required minimum distributions and certain other distributions (such as those following attainment of age 59 1/2) from an IRA or 403(b) Custodial Account; or (iii) a tax-free return of an excess IRA contribution (a "distribution" does not include a direct transfer of IRA, 403(b) Custodial Account or retirement plan assets to a successor custodian or trustee).
n Sales of shares in connection with the systematic withdrawal plan of up to 12% annually of the value of each fund from which plan sales are made. The percentage is determined on the date you establish the systematic withdrawal plan and based on the next calculated share price. You may have this CDSC waiver applied in amounts up to 1% per month, 3% per quarter, 6% semi-annually or 12% annually. Shares with no CDSC will be sold first, followed by those with the lowest CDSC. As such, the waiver benefit will be reduced by the amount of your shares that are not subject to a CDSC. If you suspend your participation in the plan, you may later resume plan payments without requiring a new determination of the account value for the 12% CDSC waiver.
The Fund's distributor may require confirmation of your entitlement before granting a CDSC waiver. If you believe you are eligible for a CDSC waiver, please contact your Morgan Stanley Smith Barney Financial Advisor or other authorized financial representative or call toll-free (800) 869-NEWS.
Distribution Fee. Class B shares are subject to an annual distribution and shareholder services (12b-1) fee of up to 1.00% of the average daily net assets of Class B shares. The maximum annual 12b-1 fee payable by Class B shares is higher than the maximum annual 12b-1 fee payable by Class A, Class R and Class W shares. Currently, the Distributor
27
has agreed to reduce the 12b-1 fee on Class B shares to the extent it exceeds 0.24% of the average daily net assets of such shares on an annualized basis. This waiver will continue for at least one year or until such time as the Fund's Board of Trustees acts to discontinue all or a portion of such waiver when it deems that such action is appropriate.
Conversion Feature. After eight years, Class B shares generally will convert automatically to Class A shares of the Fund with no initial sales charge. The eight-year period runs from the last day of the month in which the shares were purchased or, in the case of Class B shares acquired through an exchange, from the last day of the month in which the original Class B shares were purchased; the shares will convert to Class A shares based on their relative net asset values in the month following the eight-year period. At the same time, an equal proportion of Class B shares acquired through automatically reinvested distributions will convert to Class A shares on the same basis. This conversion will be suspended during any period in which the expense ratio of the Class B shares of the Fund is lower than the expense ratio of the Class A shares of the Fund.
In the case of Class B shares held in a Morgan Stanley Eligible Plan, the plan is treated as a single investor and all Class B shares will convert to Class A shares on the conversion date of the Class B shares of a Morgan Stanley Fund purchased by that plan.
If you exchange your Class B shares for shares of a Money Market Fund or the Limited Duration U.S. Government Trust, the holding period for conversion is frozen as of the last day of the month of the exchange and resumes on the last day of the month you exchange back into Class B shares.
Exchanging Shares Subject to a CDSC. There are special considerations when you exchange Fund shares that are subject to a CDSC. When determining the length of time you held the shares and the corresponding CDSC rate, any period (starting at the end of the month) during which you held shares of a fund that does not charge a CDSC will not be counted. Thus, in effect the "holding period" for purposes of calculating the CDSC is frozen upon exchanging into a fund that does not charge a CDSC.
For example, if you held Class B shares of the Fund for one year, exchanged to Class B of another Morgan Stanley Multi-Class Fund for another year, then sold your shares, a CDSC rate of 4% would be imposed on the shares based on a two-year holding period—one year for each fund. However, if you had exchanged the shares of the Fund for a Money Market Fund (which does not charge a CDSC) instead of the Multi-Class Fund, then sold your shares, a CDSC rate of 5% would be imposed on the shares based on a one-year holding period. The one year in the Money Market Fund would not be counted. Nevertheless, if shares subject to a CDSC are exchanged for a fund that does not charge a CDSC, you will receive a credit when you sell the shares equal to the 12b-1 fees, if any, you paid on those shares while in that fund up to the amount of any applicable CDSC.
CLASS C SHARES Class C shares are sold at net asset value with no initial sales charge, but are subject to a CDSC of 1.00% on sales made within one year after the last day of the month of purchase. The CDSC will be assessed in the same manner and with the same CDSC waivers as with Class B shares.
Brokers, dealers or other financial intermediaries may impose a limit on the dollar value of a Class C share purchase order that they will accept. For example, a Morgan Stanley Smith Barney Financial Advisor generally will not accept purchase orders for Class C shares that in the aggregate amount to $250,000 or more. You should discuss with your financial advisor which share class is most appropriate for you based on the size of your investment, your expected time
28
horizon for holding the shares and other factors, bearing in mind the availability of reduced sales loads on Class A share purchases of $25,000 or more and for existing shareholders who hold over $25,000 in Morgan Stanley Funds.
Distribution Fee. Class C shares are subject to an annual distribution and shareholder services (12b-1) fee of up to 1.00% of the average daily net assets of that Class. The maximum annual 12b-1 fee payable by Class C shares is higher than the maximum annual 12b-1 fee payable by Class A shares. Unlike Class B shares, Class C shares have no conversion feature and, accordingly, an investor that purchases Class C shares may be subject to distribution and shareholder services (12b-1) fees applicable to Class C shares for as long as the investor owns such shares.
CLASS I SHARES Class I shares are offered without any sales charge on purchases or sales and without any distribution and shareholder services (12b-1) fee. Class I shares are offered only to investors meeting an initial investment minimum of $5 million ($25 million for Morgan Stanley Eligible Plans) and the following investor categories:
n Investors participating in the Adviser's or an affiliate's mutual fund asset allocation program (subject to all of its terms and conditions, including termination fees, and mandatory sale or transfer restrictions on termination) pursuant to which they pay an asset-based fee.
n Persons participating in a fee-based investment program (subject to all of its terms and conditions, including termination fees and mandatory sale or transfer restrictions on termination) approved by the Fund's distributor pursuant to which they pay an asset-based fee for investment advisory, administrative and/or brokerage services.
n Certain investment programs that do not charge an asset-based fee and have been approved by the Fund's distributor.
n Employee benefit plans maintained by Morgan Stanley or any of its subsidiaries for the benefit of certain employees of Morgan Stanley and its subsidiaries.
n Certain unit investment trusts sponsored by Morgan Stanley & Co. or its affiliates.
n Certain other open-end investment companies whose shares are distributed by the Fund's distributor.
n Investors who were shareholders of the Dean Witter Retirement Series on September 11, 1998 for additional purchases for their former Dean Witter Retirement Series accounts.
n The Adviser and its affiliates with respect to shares held in connection with certain deferred compensation programs established for their employees or the Fund's Trustees.
A purchase order that meets the requirements for investment in Class I shares can be made only in Class I shares.
Class I shares are not offered for investments made through Section 529 plans, donor-advised charitable gift funds and insurance company separate accounts (regardless of the size of the investment).
Meeting Class I Eligibility Minimums. To meet the $5 million ($25 million for Morgan Stanley Eligible Plans) initial investment to qualify to purchase Class I shares you may combine: (1) purchases in a single transaction of Class I shares of the Fund and other Morgan Stanley Multi-Class Funds; and/or (2) previous purchases of Class A and Class I shares of Multi-Class Funds you currently own, along with shares of Morgan Stanley Funds you currently own that you acquired in exchange for those shares. Shareholders cannot combine purchases made by family members or a shareholder's other related accounts in a single transaction for purposes of meeting the $5 million initial investment minimum requirement to qualify to purchase Class I shares.
29
CLASS R SHARES Class R shares are offered without any sales charge on purchases or sales. Class R shares are subject to an annual distribution and shareholder services (12b-1) fee of up to 0.50% of the average daily net assets of Class R shares. Class R shares are offered only to certain tax-exempt retirement plans (including 401(k) plans, 457 plans, employees-sponsored 403(b) plans, profit-sharing and money purchase pension plans, defined benefit plans and non-qualified deferred compensation plans) held in plan level or omnibus accounts. Individual retirement plans, such as IRAs, are not eligible to purchase Class R shares.
CLASS W SHARES Class W shares are offered without any sales charge on purchases or sales. Class W shares are subject to an annual distribution and shareholder services (12b-1) fee of up to 0.35% of the average daily net assets of Class W shares. Class W shares are offered only to investors purchasing through investment programs managed by investment professionals, including discretionary managed account programs approved by the Fund's distributor.
NO SALES CHARGES FOR REINVESTED CASH DISTRIBUTIONS If you receive a cash payment representing an ordinary dividend or capital gain and you reinvest that amount in the applicable Class of shares by returning the check within 30 days of the payment date, the purchased shares would not be subject to an initial sales charge or CDSC.
PLAN OF DISTRIBUTION (RULE 12b-1 FEES) The Fund has adopted a Plan of Distribution in accordance with Rule 12b-1 under the Investment Company Act with respect to the Class A, Class B and Class C shares and has adopted a Plan of Distribution and a Shareholder Services Plan in accordance with Rule 12b-1 under the Investment Company Act with respect to the Class R and Class W shares. (Class I shares are offered without any 12b-1 fee.) The Plans allow the Fund to pay distribution and/or shareholder services fees for these shares. Because these fees are paid out of the Fund's assets on an ongoing basis, over time these fees will increase the cost of your investment and reduce your return in these Classes and may cost you more than paying other types of sales charges.
Additional Information
The Adviser and/or distributor may pay compensation (out of their own funds and not as an expense of the Fund) to certain affiliated or unaffiliated broker-dealers or other financial intermediaries or service providers in connection with the sale, distribution, marketing or retention of Fund shares and/or shareholder servicing. Such compensation may be significant in amount and the prospect of receiving any such additional compensation may provide such affiliated or unaffiliated entities with an incentive to favor sales of shares of the Fund over other investment options. Any such payments will not change the net asset value or the price of the Fund's shares. For more information, please see the Fund's SAI.
30
Financial Highlights
The financial highlights table is intended to help you understand the Fund's financial performance for the periods indicated. Certain information reflects financial results for a single Fund share throughout each period. The total returns in the table represent the rate an investor would have earned or lost on an investment in the Fund (assuming reinvestment of all dividends and distributions). The ratio of expenses to average net assets listed in the tables below for each class of shares of the Fund are based on the average net assets of the Fund for each of the periods listed in the tables. To the extent that the Fund's average net assets decrease over the Fund's next fiscal year, such expense ratios can be expected to increase, potentially significantly, because certain fixed costs will be spread over a smaller amount of assets.
The information for the year ended August 31, 2011 has been audited by Ernst & Young LLP, an independent registered public accounting firm, whose report, along with the Fund's financial statements, are incorporated by reference in the SAI from the Fund's annual report, which is available upon request. The financial highlights for each of the years in the four-year period ended August 31, 2010 have been audited by another independent registered public accounting firm.
CLASS A SHARES
| For the Year Ended August 31, | | 2011 | | 2010^ | | 2009^ | | 2008^ | | 2007^ | |
| Selected Per Share Data: | |
| Net asset value, beginning of period | | $ | 7.49 | | | $ | 7.86 | | | $ | 10.26 | | | $ | 14.09 | | | $ | 14.06 | | |
| Income (loss) from investment operations: | |
| Net investment income(1) | | | 0.15 | | | | 0.12 | | | | 0.14 | | | | 0.21 | | | | 0.21 | | |
| Net realized and unrealized gain (loss) | | | 0.65 | | | | (0.29 | ) | | | (1.55 | ) | | | (1.63 | ) | | | 1.88 | | |
| Total income (loss) from investment operations | | | 0.80 | | | | (0.17 | ) | | | (1.41 | ) | | | (1.42 | ) | | | 2.09 | | |
| Less dividends and distributions from: | |
| Net investment income | | | (0.15 | ) | | | (0.20 | ) | | | (0.26 | ) | | | (0.14 | ) | | | (0.22 | ) | |
| Net realized gain | | | — | | | | — | | | | (0.73 | ) | | | (2.27 | ) | | | (1.84 | ) | |
| Total dividends and distributions | | | (0.15 | ) | | | (0.20 | ) | | | (0.99 | ) | | | (2.41 | ) | | | (2.06 | ) | |
| Net asset value, end of period | | $ | 8.14 | | | $ | 7.49 | | | $ | 7.86 | | | $ | 10.26 | | | $ | 14.09 | | |
| Total Return(2) | | | 10.62 | % | | | (2.35 | )% | | | (11.70 | )% | | | (12.36 | )% | | | 15.93 | % | |
| Ratios to Average Net Assets(3): | |
| Total expenses | | | 1.47 | %(4) | | | 1.51 | %(4) | | | 1.50 | %(4) | | | 1.36 | %(4) | | | 1.36 | %(4) | |
| Net investment income | | | 1.72 | %(4) | | | 1.48 | %(4) | | | 1.99 | %(4) | | | 1.72 | %(4) | | | 1.51 | %(4) | |
| Rebate from Morgan Stanley affiliate | | | 0.00 | %(5) | | | 0.00 | %(5) | | | 0.00 | %(5) | | | 0.00 | %(5) | | | 0.00 | %(5) | |
| Supplemental Data: | |
| Net assets, end of period, in thousands | | $ | 39,757 | | | $ | 47,304 | | | $ | 57,939 | | | $ | 89,770 | | | $ | 125,527 | | |
| Portfolio turnover rate | | | 29 | % | | | 36 | % | | | 25 | % | | | 36 | % | | | 29 | % | |
^ Beginning with the year ended August 31, 2011, the Fund was audited by Ernst & Young LLP. The previous years were audited by another independent registered public accounting firm.
(1) The per share amounts were computed using an average number of shares outstanding during the period.
(2) Does not reflect the deduction of sales charge. Calculated based on the net asset value as of the last business day of the period.
(3) Reflects overall Fund ratios for investment income and non-class specific expenses.
(4) The ratios reflect the rebate of certain Fund expenses in connection with investments in a Morgan Stanley affiliate during the period. The effect of the rebate on the ratios is disclosed in the above table as "Rebate from Morgan Stanley affiliate."
(5) Amount is less than 0.005%.
31
Financial Highlights (Continued)
CLASS B SHARES
| For the Year Ended August 31, | | 2011 | | 2010^ | | 2009^ | | 2008^ | | 2007^ | |
| Selected Per Share Data: | |
| Net asset value, beginning of period | | $ | 7.45 | | | $ | 7.83 | | | $ | 10.24 | | | $ | 13.95 | | | $ | 13.89 | | |
| Income (loss) from investment operations: | |
| Net investment income(1) | | | 0.15 | | | | 0.12 | | | | 0.15 | | | | 0.22 | | | | 0.14 | | |
| Net realized and unrealized gain (loss) | | | 0.65 | | | | (0.29 | ) | | | (1.55 | ) | | | (1.61 | ) | | | 1.85 | | |
| Total income (loss) from investment operations | | | 0.80 | | | | (0.17 | ) | | | (1.40 | ) | | | (1.39 | ) | | | 1.99 | | |
| Less dividends and distributions from: | |
| Net investment income | | | (0.16 | ) | | | (0.21 | ) | | | (0.28 | ) | | | (0.05 | ) | | | (0.09 | ) | |
| Net realized gain | | | — | | | | — | | | | (0.73 | ) | | | (2.27 | ) | | | (1.84 | ) | |
| Total dividends and distributions | | | (0.16 | ) | | | (0.21 | ) | | | (1.01 | ) | | | (2.32 | ) | | | (1.93 | ) | |
| Net asset value, end of period | | $ | 8.09 | | | $ | 7.45 | | | $ | 7.83 | | | $ | 10.24 | | | $ | 13.95 | | |
| Total Return(2) | | | 10.60 | % | | | (2.33 | )% | | | (11.61 | )% | | | (12.18 | )% | | | 15.32 | % | |
| Ratios to Average Net Assets(3): | |
| Total expenses | | | 1.45 | %(4) | | | 1.45 | %(4) | | | 1.34 | %(4) | | | 1.25 | %(4) | | | 1.89 | %(4) | |
| Net investment income | | | 1.74 | %(4) | | | 1.54 | %(4) | | | 2.15 | %(4) | | | 1.83 | %(4) | | | 0.98 | %(4) | |
| Rebate from Morgan Stanley affiliate | | | 0.00 | %(5) | | | 0.00 | %(5) | | | 0.00 | %(5) | | | 0.00 | %(5) | | | 0.00 | %(5) | |
| Supplemental Data: | |
| Net assets, end of period, in thousands | | $ | 46,832 | | | $ | 56,906 | | | $ | 75,250 | | | $ | 122,494 | | | $ | 184,035 | | |
| Portfolio turnover rate | | | 29 | % | | | 36 | % | | | 25 | % | | | 36 | % | | | 29 | % | |
^ Beginning with the year ended August 31, 2011, the Fund was audited by Ernst & Young LLP. The previous years were audited by another independent registered public accounting firm.
(1) The per share amounts were computed using an average number of shares outstanding during the period.
(2) Does not reflect the deduction of sales charge. Calculated based on the net asset value as of the last business day of the period.
(3) Reflects overall Fund ratios for investment income and non-class specific expenses.
(4) The ratios reflect the rebate of certain Fund expenses in connection with investments in a Morgan Stanley affiliate during the period. The effect of the rebate on the ratios is disclosed in the above table as "Rebate from Morgan Stanley affiliate."
(5) Amount is less than 0.005%.
32
CLASS C SHARES
| For the Year Ended August 31, | | 2011 | | 2010^ | | 2009^ | | 2008^ | | 2007^ | |
| Selected Per Share Data: | |
| Net asset value, beginning of period | | $ | 7.39 | | | $ | 7.76 | | | $ | 10.06 | | | $ | 13.84 | | | $ | 13.83 | | |
| Income (loss) from investment operations: | |
| Net investment income(1) | | | 0.08 | | | | 0.06 | | | | 0.09 | | | | 0.12 | | | | 0.11 | | |
| Net realized and unrealized gain (loss) | | | 0.66 | | | | (0.29 | ) | | | (1.51 | ) | | | (1.60 | ) | | | 1.85 | | |
| Total income (loss) from investment operations | | | 0.74 | | | | (0.23 | ) | | | (1.42 | ) | | | (1.48 | ) | | | 1.96 | | |
| Less dividends and distributions from: | |
| Net investment income | | | (0.08 | ) | | | (0.14 | ) | | | (0.15 | ) | | | (0.03 | ) | | | (0.11 | ) | |
| Net realized gain | | | — | | | | — | | | | (0.73 | ) | | | (2.27 | ) | | | (1.84 | ) | |
| Total dividends and distributions | | | (0.08 | ) | | | (0.14 | ) | | | (0.88 | ) | | | (2.30 | ) | | | (1.95 | ) | |
| Net asset value, end of period | | $ | 8.05 | | | $ | 7.39 | | | $ | 7.76 | | | $ | 10.06 | | | $ | 13.84 | | |
| Total Return(2) | | | 9.91 | % | | | (3.15 | )% | | | (12.38 | )% | | | (12.97 | )% | | | 15.17 | % | |
| Ratios to Average Net Assets(3): | |
| Total expenses | | | 2.21 | %(4) | | | 2.26 | %(4) | | | 2.25 | %(4) | | | 2.08 | %(4) | | | 2.06 | %(4) | |
| Net investment income | | | 0.98 | %(4) | | | 0.73 | %(4) | | | 1.24 | %(4) | | | 1.00 | %(4) | | | 0.81 | %(4) | |
| Rebate from Morgan Stanley affiliate | | | 0.00 | %(5) | | | 0.00 | %(5) | | | 0.00 | %(5) | | | 0.00 | %(5) | | | 0.00 | %(5) | |
| Supplemental Data: | |
| Net assets, end of period, in thousands | | $ | 15,741 | | | $ | 19,328 | | | $ | 25,217 | | | $ | 41,975 | | | $ | 66,486 | | |
| Portfolio turnover rate | | | 29 | % | | | 36 | % | | | 25 | % | | | 36 | % | | | 29 | % | |
^ Beginning with the year ended August 31, 2011, the Fund was audited by Ernst & Young LLP. The previous years were audited by another independent registered public accounting firm.
(1) The per share amounts were computed using an average number of shares outstanding during the period.
(2) Does not reflect the deduction of sales charge. Calculated based on the net asset value as of the last business day of the period.
(3) Reflects overall Fund ratios for investment income and non-class specific expenses.
(4) The ratios reflect the rebate of certain Fund expenses in connection with investments in a Morgan Stanley affiliate during the period. The effect of the rebate on the ratios is disclosed in the above table as "Rebate from Morgan Stanley affiliate."
(5) Amount is less than 0.005%.
33
Financial Highlights (Continued)
CLASS I SHARES
| For the Year Ended August 31, | | 2011 | | 2010^ | | 2009^ | | 2008^ | | 2007^ | |
| Selected Per Share Data: | |
| Net asset value, beginning of period | | $ | 7.52 | | | $ | 7.89 | | | $ | 10.32 | | | $ | 14.16 | | | $ | 14.12 | | |
| Income (loss) from investment operations: | |
| Net investment income(1) | | | 0.17 | | | | 0.14 | | | | 0.16 | | | | 0.24 | | | | 0.25 | | |
| Net realized and unrealized gain (loss) | | | 0.65 | | | | (0.29 | ) | | | (1.56 | ) | | | (1.63 | ) | | | 1.88 | | |
| Total income (loss) from investment operations | | | 0.82 | | | | (0.15 | ) | | | (1.40 | ) | | | (1.39 | ) | | | 2.13 | | |
| Less dividends and distributions from: | |
| Net investment income | | | (0.17 | ) | | | (0.22 | ) | | | (0.30 | ) | | | (0.18 | ) | | | (0.25 | ) | |
| Net realized gain | | | — | | | | — | | | | (0.73 | ) | | | (2.27 | ) | | | (1.84 | ) | |
| Total dividends and distributions | | | (0.17 | ) | | | (0.22 | ) | | | (1.03 | ) | | | (2.45 | ) | | | (2.09 | ) | |
| Net asset value, end of period | | $ | 8.17 | | | $ | 7.52 | | | $ | 7.89 | | | $ | 10.32 | | | $ | 14.16 | | |
| Total Return(2) | | | 10.88 | % | | | (2.10 | )% | | | (11.44 | )% | | | (12.14 | )% | | | 16.20 | % | |
| Ratios to Average Net Assets(3): | |
| Total expenses | | | 1.22 | %(4) | | | 1.26 | %(4) | | | 1.25 | %(4) | | | 1.11 | %(4) | | | 1.12 | %(4) | |
| Net investment income | | | 1.97 | %(4) | | | 1.73 | %(4) | | | 2.24 | %(4) | | | 1.97 | %(4) | | | 1.75 | %(4) | |
| Rebate from Morgan Stanley affiliate | | | 0.00 | %(5) | | | 0.00 | %(5) | | | 0.00 | %(5) | | | 0.00 | %(5) | | | 0.00 | %(5) | |
| Supplemental Data: | |
| Net assets, end of period, in thousands | | $ | 96,576 | | | $ | 110,313 | | | $ | 144,113 | | | $ | 283,181 | | | $ | 436,827 | | |
| Portfolio turnover rate | | | 29 | % | | | 36 | % | | | 25 | % | | | 36 | % | | | 29 | % | |
^ Beginning with the year ended August 31, 2011, the Fund was audited by Ernst & Young LLP. The previous years were audited by another independent registered public accounting firm.
(1) The per share amounts were computed using an average number of shares outstanding during the period.
(2) Calculated based on the net asset value as of the last business day of the period.
(3) Reflects overall Fund ratios for investment income and non-class specific expenses.
(4) The ratios reflect the rebate of certain Fund expenses in connection with investments in a Morgan Stanley affiliate during the period. The effect of the rebate on the ratios is disclosed in the above table as "Rebate from Morgan Stanley affiliate."
(5) Amount is less than 0.005%.
34
CLASS R SHARES
| For the Year Ended August 31, | | 2011 | | 2010^ | | 2009^ | | For the Period
March 31, 2008(1)
through
August 31, 2008^ | |
| Selected Per Share Data: | |
| Net asset value, beginning of period | | $ | 7.44 | | | $ | 7.81 | | | $ | 10.25 | | | $ | 11.17 | | |
| Net income from investment operations: | |
| Net investment income(2) | | | 0.13 | | | | 0.10 | | | | 0.13 | | | | 0.10 | | |
| Net realized and unrealized gain (loss) | | | 0.65 | | | | (0.28 | ) | | | (1.56 | ) | | | (1.02 | ) | |
| Total income (loss) from investment operations | | | 0.78 | | | | (0.18 | ) | | | (1.43 | ) | | | (0.92 | ) | |
| Less dividends and distributions from: | |
| Net investment income | | | (0.14 | ) | | | (0.19 | ) | | | (0.28 | ) | | | — | | |
| Net realized gain | | | — | | | | — | | | | (0.73 | ) | | | — | | |
| Total dividends and distributions | | | (0.14 | ) | | | (0.19 | ) | | | (1.01 | ) | | | — | | |
| Net asset value, end of period | | $ | 8.08 | | | $ | 7.44 | | | $ | 7.81 | | | $ | 10.25 | | |
| Total Return(3) | | | 10.34 | % | | | (2.52 | )% | | | (11.94 | )% | | | (8.24 | )%(7) | |
| Ratios to Average Net Assets(4): | |
| Total expenses | | | 1.72 | %(5) | | | 1.76 | %(5) | | | 1.75 | %(5) | | | 1.61 | %(5)(8) | |
| Net investment income | | | 1.47 | %(5) | | | 1.23 | %(5) | | | 1.74 | %(5) | | | 2.18 | %(5)(8) | |
| Rebate from Morgan Stanley affiliate | | | 0.00 | %(6) | | | 0.00 | %(6) | | | 0.00 | %(6) | | | 0.00 | %(6)(8) | |
| Supplemental Data: | |
| Net assets, end of period, in thousands | | $ | 84 | | | $ | 77 | | | $ | 81 | | | $ | 92 | | |
| Portfolio turnover rate | | | 29 | % | | | 36 | % | | | 25 | % | | | 36 | % | |
^ Beginning with the year ended August 31, 2011, the Fund was audited by Ernst & Young LLP. The previous years were audited by another independent registered public accounting firm.
(1) The date shares were first issued.
(2) The per share amounts were computed using an average number of shares outstanding during the period.
(3) Calculated based on the net asset value as of the last business day of the period.
(4) Reflects overall Fund ratios for investment income and non-class specific expenses.
(5) The ratios reflect the rebate of certain Fund expenses in connection with investments in a Morgan Stanley affiliate during the period. The effect of the rebate on the ratios is disclosed in the above table as "Rebate from Morgan Stanley affiliate."
(6) Amount is less than 0.005%.
(7) Not annualized.
(8) Annualized.
35
Financial Highlights (Continued)
CLASS W SHARES
| For the Year Ended August 31, | | 2011 | | 2010^ | | 2009^ | | For the Period
March 31, 2008(1)
through
August 31, 2008^ | |
| Selected Per Share Data: | |
| Net asset value, beginning of period | | $ | 7.45 | | | $ | 7.82 | | | $ | 10.26 | | | $ | 11.17 | | |
| Income (loss) from investment operations: | |
| Net investment income(2) | | | 0.14 | | | | 0.11 | | | | 0.14 | | | | 0.11 | | |
| Net realized and unrealized gain (loss) | | | 0.65 | | | | (0.28 | ) | | | (1.56 | ) | | | (1.02 | ) | |
| Total income (loss) from investment operations | | | 0.79 | | | | (0.17 | ) | | | (1.42 | ) | | | (0.91 | ) | |
| Less dividends and distributions from: | |
| Net investment income | | | (0.15 | ) | | | (0.20 | ) | | | (0.29 | ) | | | — | | |
| Net realized gain | | | — | | | | — | | | | (0.73 | ) | | | — | | |
| Total dividends and distributions | | | (0.15 | ) | | | (0.20 | ) | | | (1.02 | ) | | | — | | |
| Net asset value, end of period | | $ | 8.09 | | | $ | 7.45 | | | $ | 7.82 | | | $ | 10.26 | | |
| Total Return(3) | | | 10.49 | % | | | (2.40 | )% | | | (11.83 | )% | | | (8.15 | )%(7) | |
| Ratios to Average Net Assets(4): | |
| Total expenses | | | 1.57 | %(5) | | | 1.61 | %(5) | | | 1.60 | %(5) | | | 1.46 | %(5)(8) | |
| Net investment income | | | 1.62 | %(5) | | | 1.38 | %(5) | | | 1.89 | %(5) | | | 2.33 | %(5)(8) | |
| Rebate from Morgan Stanley affiliate | | | 0.00 | %(6) | | | 0.00 | %(6) | | | 0.00 | %(6) | | | 0.00 | %(6)(8) | |
| Supplemental Data: | |
| Net assets, end of period, in thousands | | $ | 85 | | | $ | 77 | | | $ | 81 | | | $ | 92 | | |
| Portfolio turnover rate | | | 29 | % | | | 36 | % | | | 25 | % | | | 36 | % | |
^ Beginning with the year ended August 31, 2011, the Fund was audited by Ernst & Young LLP. The previous years were audited by another independent registered public accounting firm.
(1) The date shares were first issued.
(2) The per share amounts were computed using an average number of shares outstanding during the period.
(3) Calculated based on the net asset value as of the last business day of the period.
(4) Reflects overall Fund ratios for investment income and non-class specific expenses.
(5) The ratios reflect the rebate of certain Fund expenses in connection with investments in a Morgan Stanley affiliate during the period. The effect of the rebate on the ratios is disclosed in the above table as "Rebate from Morgan Stanley affiliate."
(6) Amount is less than 0.005%.
(7) Not annualized.
(8) Annualized.
36
Morgan Stanley Funds
EQUITY
ASSET ALLOCATION
Global Strategist Fund
INTERNATIONAL
European Equity Fund
International Fund
International Value Equity Fund
GROWTH
Focus Growth Fund
Mid Cap Growth Fund
Multi Cap Growth Trust
SPECIALTY
Global Infrastructure Fund
FIXED INCOME
TAXABLE SHORT TERM
Limited Duration U.S. Government Trust*
TAXABLE INTERMEDIATE TERM
Fixed Income Opportunities Fund
Mortgage Securities Trust
U.S. Government Securities Trust
MONEY MARKET
TAXABLE
Liquid Asset Fund*
U.S. Government Money Market Trust*
TAX-EXEMPT
California Tax-Free Daily Income Trust*
New York Municipal Money Market Trust
Tax-Free Daily Income Trust*
There may be funds created or terminated after this Prospectus was published. Please consult the inside back cover of a new fund's prospectus for its designations, e.g., Multi-Class Fund or Money Market Fund.
Unless otherwise noted, each listed Morgan Stanley Fund is a Multi-Class Fund. A Multi-Class Fund is a mutual fund offering multiple classes of shares.
* Single-Class Fund(s)
37
Additional information about the Fund's investments is available in the Fund's Annual and Semiannual Reports to Shareholders. In the Fund's Annual Report, you will find a discussion of the market conditions and investment strategies that significantly affected the Fund's performance during its last fiscal year.
The Fund's Statement of Additional Information also provides additional information about the Fund. The Statement of Additional Information is incorporated herein by reference (legally is part of this Prospectus). For a free copy of the Fund's Annual Report, Semiannual Report or Statement of Additional Information, to request other information about the Fund, or to make shareholder inquiries, please call toll-free (800) 869 NEWS. Free copies of these documents are also available from our Internet site at: www.morganstanley.com/im.
You also may obtain information about the Fund by calling your Morgan Stanley Smith Barney Financial Advisor or by visiting our Internet site.
Information about the Fund (including the Statement of Additional Information) can be reviewed and copied at the SEC Public Reference Room in Washington, DC. Information about the Reference Room's operations may be obtained by calling the SEC at (202) 551-8090. Reports and other information about the Fund are available on the EDGAR Database on the SEC's Internet site at: www.sec.gov and copies of this information may be obtained, after paying a duplicating fee, by electronic request at the following E-mail address: publicinfo@sec.gov, or by writing to the Public Reference Section of the SEC, Washington, DC 20549-1520.
(THE FUND'S INVESTMENT COMPANY ACT FILE NO. IS 811-10273)
Morgan Stanley Distribution, Inc., member FINRA.
© 2011 Morgan Stanley


INVESTMENT MANAGEMENT
Morgan Stanley
International Value
Equity Fund

Prospectus
December 30, 2011
IVQPRO-00
INVESTMENT MANAGEMENT

Welcome, Shareholder:
In this report, you'll learn about how your investment in Morgan Stanley International Value Equity Fund performed during the annual period. We will provide an overview of the market conditions, and discuss some of the factors that affected performance during the reporting period. In addition, this report includes the Fund's financial statements and a list of Fund investments.
This material must be preceded or accompanied by a prospectus for the fund being offered.
Market forecasts provided in this report may not necessarily come to pass. There is no assurance that the Fund will achieve its investment objective. The Fund is subject to market risk, which is the possibility that market values of securities owned by the Fund will decline and, therefore, the value of the Fund's shares may be less than what you paid for them. Accordingly, you can lose money investing in this Fund. Please see the prospectus for more complete information on investment risks.
Fund Report (unaudited)
For the year ended August 31, 2011
| Total Return for the 12 Months Ended August 31, 2011 | |
| Class A | | Class B | | Class C | | Class I | | Class R | | Class W | | MSCI
EAFE
Index1 | | Lipper
International
Large Cap
Core
Funds
Index2 | |
| | 10.62 | % | | | 10.60 | % | | | 9.91 | % | | | 10.88 | % | | | 10.34 | % | | | 10.49 | % | | | 10.01 | % | | | 10.25 | % | |
The performance of the Fund's six share classes varies because each has different expenses. The Fund's total returns assume the reinvestment of all distributions but do not reflect the deduction of any applicable sales charges. Such costs would lower performance. See Performance Summary for standardized performance and benchmark information.
The Fund's Distributor has agreed to reduce the 12b-1 fee on Class B shares of the Fund to the extent it exceeds 0.24% of the average daily net assets of such shares on an annualized basis. This waiver is expected to continue for one year or until such time as the Fund's Board of Trustees acts to discontinue all or a portion of such waiver when it deems that such action is appropriate.
Market Conditions
Over the past year, markets remained highly volatile and flipped between the "risk on" and "risk off" trade. Despite the volatility, the markets remained in positive territory in the last half of 2010 and several months into the new year. However, as sovereign debt issues resurfaced, coupled with "gloom and doom" on global economic growth, markets have traded in negative territory since May 2011. For the one-year period ending August 31, 2011, the international markets, as represented by the MSCI EAFE Index (the "Index"), rose 10 percent. However, virtually all of this gain was due to the weak U.S. dollar, as the underlying return in local currencies declined 2 percent.
Strong performance was seen across a number of countries, particularly New Zealand, Norway and Australia, which rose 43 percent, 25 percent and 21 percent, respectively, also driven in part by the weak U.S. dollar. In contrast, the euro bloc markets underperformed given the highly uncertain macro outlook concerning the euro sovereign debt crisis.
On a sector basis, seven out of 10 sectors outperformed the Index over the one-year period. Materials, energy and consumer staples, in particular, were the best performing sectors. In contrast, utilities and financials were the worst performing sectors.
Performance Analysis
Morgan Stanley International Value Equity Fund Class A, B, I, R, and W shares outperformed the Index and the Lipper International Large-Cap Core Funds Index and Class C shares underperformed both indexes for the 12 months ended August 31, 2011, assuming no deduction of applicable sales charges.
The portfolio's overweight to, and stock selection in, consumer staples were the biggest contributors to relative performance. Also adding value were stock selection in, and the underweight allocation to, utilities. In contrast, stock selection in, and the underweight allocation to, consumer discretionary and materials were the most significant detractors from relative performance over the 12-month period.
2
With various economic indicators in both the U.S. and Europe signaling stalling growth, an increasing likelihood of a double-dip recession in the developed world, and with consumer, business and investor confidence returning to levels not seen since the depth of the 2008 credit crisis, equity markets have been quick to discount a significant fall in corporate earnings, particularly for cyclical stocks (those that are more economically sensitive). Bond markets also seem to be confirming the dire economic outlook with the yields on the 10-year U.S. Treasury note once again hovering within the 2 percent level.
Despite the pervasive "doom and gloom", some economic indicators appear to disagree with the rapidly building consensus outlook for a recession and are not signaling an imminent collapse in industrial production and global economic growth. It wouldn't be the first time that the leading economic indicators have given the wrong signal and we believe it's just possible that equity markets are overreacting about the extent of the slowdown. This is not to suggest that we are optimistic about economic growth in the developed world. Rather, we have believed for a long time that the reduction of debt in the developed world after the credit bubble would result in fragile, sub-par economic growth for years to come.
In these turbulent times, we remain defensively positioned with a strong bias towards what we would consider quality companies with sustainable organic top-line growth, demonstrable pricing power, high-quality management and lower financial and operational leverage. We remain convinced that finding companies whose fortunes, in our opinion, are relatively free from such market disturbance and possessing these characteristics are important and vastly undervalued attributes in today's hyper-competitive and unpredictable world.
There is no guarantee that any sectors mentioned will continue to perform as discussed herein or that securities in such sectors will be held by the Fund in the future.
| TOP 10 HOLDINGS as of 08/31/11 | |
| Imperial Tobacco Group PLC | | | 4.3 | % | |
| Unilever N.V., CVA | | | 4.0 | | |
| British American Tobacco PLC | | | 3.9 | | |
| Nestle SA, (Registered) | | | 3.9 | | |
| Reckitt Benckiser Group PLC | | | 3.5 | | |
| Prudential PLC | | | 2.7 | | |
| HSBC Holdings PLC | | | 2.6 | | |
| Novartis AG, (Registered) | | | 2.3 | | |
| Vodafone Group PLC | | | 2.2 | | |
| Bayer AG, (Registered) | | | 2.0 | | |
| TOP FIVE COUNTRIES as of 08/31/11 | |
| United Kingdom | | | 35.9 | % | |
| Japan | | | 23.8 | | |
| Switzerland | | | 12.4 | | |
| France | | | 8.1 | | |
| Netherlands | | | 5.5 | | |
Subject to change daily. Provided for informational purposes only and should not be deemed as a recommendation to buy or sell the securities mentioned above. Top 10 holdings and top five countries are as a percentage of net assets. Morgan Stanley is a full-service securities firm engaged in securities trading and brokerage activities, investment banking, research and analysis, financing and financial advisory services.
3
Investment Strategy
The Fund will normally invest at least 80 percent of its assets in a diversified portfolio of common stocks and other equity securities, including depositary receipts and securities convertible into common stock, of companies located outside of the United States. These companies may be of any asset size, including small and medium capitalization companies, and may be located in developed or emerging market countries. The Fund may also use derivative instruments as discussed in the Fund's prospectus. These derivative instruments will be counted toward the 80 percent policy discussed above to the extent they have economic characteristics similar to the securities included within that policy.
For More Information About Portfolio Holdings
Each Morgan Stanley fund provides a complete schedule of portfolio holdings in its semiannual and annual reports within 60 days of the end of the fund's second and fourth fiscal quarters. The semiannual reports and the annual reports are filed electronically with the Securities and Exchange Commission (SEC) on Form N-CSRS and Form N-CSR, respectively. Morgan Stanley also delivers the semiannual and annual reports to fund shareholders and makes these reports available on its public web site, www.morganstanley.com. Each Morgan Stanley fund also files a complete schedule of portfolio holdings with the SEC for the fund's first and third fiscal quarters on Form N-Q. Morgan Stanley does not deliver the reports for the first and third fiscal quarters to shareholders, nor are the reports posted to the Morgan Stanley public web site. You may, however, obtain the Form N-Q filings (as well as the Form N-CSR and N-CSRS filings) by accessing the SEC's web site, http://www.sec.gov. You may also review and copy them at the SEC's public reference room in Washington, DC. Information on the operation of the SEC's public reference room may be obtained by calling the SEC at (800) SEC-0330. You can also request copies of these materials, upon payment of a duplicating fee, by electronic request at the SEC's e-mail address (publicinfo@sec.gov) or by writing the public reference section of the SEC, Washington, DC 20549-1520.
4
Proxy Voting Policy and Procedures and Proxy Voting Record
You may obtain a copy of the Fund's Proxy Voting Policy and Procedures without charge, upon request, by calling toll free (800) 869-NEWS or by visiting the Mutual Fund Center on our web site at www.morganstanley.com. It is also available on the SEC's web site at http://www.sec.gov.
You may obtain information regarding how the Fund voted proxies relating to portfolio securities during the most recent twelve-month period ended June 30 without charge by visiting the Mutual Fund Center on our web site at www.morganstanley.com. This information is also available on the SEC's web site at http://www.sec.gov.
Householding Notice
To reduce printing and mailing costs, the Fund attempts to eliminate duplicate mailings to the same address. The Fund delivers a single copy of certain shareholder documents, including shareholder reports, prospectuses and proxy materials, to investors with the same last name who reside at the same address. Your participation in this program will continue for an unlimited period of time unless you instruct us otherwise. You can request multiple copies of these documents by calling (800) 869-NEWS, 8:00 a.m. to 8:00 p.m., ET. Once our Customer Service Center has received your instructions, we will begin sending individual copies for each account within 30 days.
5
Performance Summary (unaudited)
Performance of $10,000 Investment
Over 10 Years
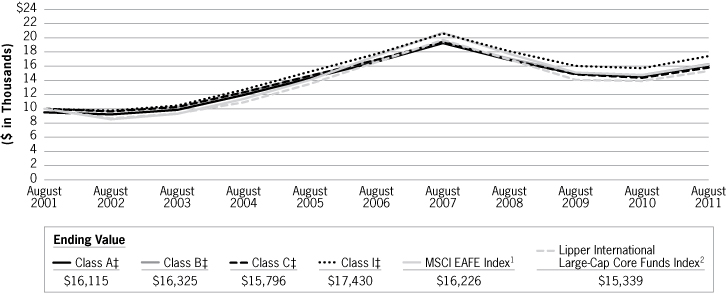
6
| Average Annual Total Returns—Period Ended August 31, 2011 (unaudited) | |
| Symbol | | Class A Shares*
(since 04/26/01)
IVQAX | | Class B Shares**
(since 04/26/01)
IVQBX | | Class C Shares†
(since 04/26/01)
IVQCX | | Class I Shares††
(since 04/26/01)
IVQDX | | Class R Shares#
(since 03/31/08)
IVQRX | | Class W Shares##
(since 03/31/08)
IVQWX | |
1 Year
| | | 10.62
4.75 4 | %3 | | | 10.60
5.60 4 | %3 | | | 9.91
8.91 4 | %3 | | | 10.88
— | %3 | | | 10.34
— | %3 | | | 10.49
— | %3 | |
5 Years
| | | –0.62 3
–1.69 4 | | | | –0.67 3
–0.91 4 | | | | –1.34 3
–1.34 4 | | | | –0.37 3
— | | | | —
— | | | | —
— | | |
10 Years
| | | 5.45 3
4.89 4 | | | | 5.02 3
5.02 4 | | | | 4.68 3
4.68 4 | | | | 5.71 3
— | | | | —
— | | | | —
— | | |
Since
Inception | | | 4.85 3
4.31 4 | | | | 4.41 3
4.41 4 | | | | 4.07 3
4.07 4 | | | | 5.10 3
— | | | | –4.02 3
— | | | | –3.88 3
— | | |
Performance data quoted represents past performance, which is no guarantee of future results and current performance may be lower or higher than the figures shown. For most recent month-end performance figures, please visit www.morganstanley.com/im or speak with your Financial Advisor. Investment returns and principal value will fluctuate and fund shares, when redeemed, may be worth more or less than their original cost. The graph and table do not reflect the deduction of taxes that a shareholder would pay on fund distributions or the redemption of fund shares. Performance for Class A, Class B, Class C, Class I, Class R, and Class W shares will vary due to differences in sales charges and expenses. See the Fund's current prospectus for complete details on fees and sales charges.
* The maximum front-end sales charge for Class A is 5.25%.
** The maximum contingent deferred sales charge (CDSC) for Class B is 5.0%. The CDSC declines to 0% after six years. For periods greater than eight years, returns do not reflect conversion to Class A shares eight years after the end of the calendar month in which shares were purchased. The conversion feature is currently suspended because the total annual operating expense ratio of Class B is currently lower than that of Class A. See "Conversion Feature" for Class B shares in "Share Class Arrangements" of the Prospectus for more information.
† The maximum contingent deferred sales charge for Class C is 1.0% for shares redeemed within one year of purchase.
†† Class I has no sales charge.
# Class R has no sales charge.
## Class W has no sales charge.
(1) The Morgan Stanley Capital International (MSCI) EAFE Index (Europe, Australasia, Far East) is a free float-adjusted market capitalization index that is designed to measure the international equity market performance of developed markets, excluding the U.S. & Canada. The term "free float" represents the portion of shares outstanding that are deemed to be available for purchase in the public equity markets by investors. The MSCI EAFE Index currently consists of 22 developed market country indices. The performance of the Index is listed in U.S. dollars and assumes reinvestment of net dividends. The Index is unmanaged and its returns do not include any sales charges or fees. Such costs would lower performance. It is not possible to invest directly in an index.
(2) The Lipper International Large-Cap Core Funds Index is an equally weighted performance index of the largest qualifying funds (based on net assets) in the Lipper International Large-Cap Core Funds classification. The Index, which is adjusted for capital gains distributions and income dividends, is unmanaged and should not be considered an investment. There are currently 30 funds represented in this Index. The Fund was in the Lipper International Large-Cap Core Funds classification as of the date of this report.
(3) Figure shown assumes reinvestment of all distributions and does not reflect the deduction of any sales charges.
(4) Figure shown assumes reinvestment of all distributions and the deduction of the maximum applicable sales charge. See the Fund's current prospectus for complete details on fees and sales charges.
‡ Ending value assuming a complete redemption on August 31, 2011.
7
Expense Example (unaudited)
As a shareholder of the Fund, you incur two types of costs: (1) transaction costs, including sales charges (loads) on purchase payments and redemption fees; (2) ongoing costs, including advisory fees; distribution and service (12b-1) fees; and other Fund expenses. This example is intended to help you understand your ongoing costs (in dollars) of investing in the Fund and to compare these costs with the ongoing costs of investing in other mutual funds.
The example is based on an investment of $1,000 invested at the beginning of the period and held for the entire period 03/01/11 – 08/31/11.
Actual Expenses
The first line of the table below provides information about actual account values and actual expenses. You may use the information in this line, together with the amount you invested, to estimate the expenses that you paid over the period. Simply divide your account value by $1,000 (for example, an $8,600 account value divided by $1,000 = 8.6), then multiply the result by the number in the first line under the heading entitled "Expenses Paid During Period" to estimate the expenses you paid on your account during this period.
Hypothetical Example for Comparison Purposes
The second line of the table below provides information about hypothetical expenses based on the Fund's actual expense ratio and an assumed rate of return of 5% per year before expenses, which is not the Fund's actual return. The hypothetical account values and expenses may not be used to estimate the actual ending account balance or expenses you paid for the period. You may use this information to compare the ongoing cost of investing in the Fund and other funds. To do so, compare this 5% hypothetical example with the 5% hypothetical examples that appear in the shareholder reports of the other funds.
Please note that the expenses shown in the table are meant to highlight your ongoing costs only and do not reflect any transactional costs, such as sales charges (loads) and redemption fees. Therefore, the second line of the table is useful in comparing ongoing costs, and will not help you determine the relative total cost of owning different funds. In addition, if these transactional costs were included, your costs would have been higher.
| | | Beginning
Account Value | | Ending
Account Value | | Expenses Paid
During Period@ | |
| | | 03/01/11 | | 08/31/11 | | 03/01/11 –
08/31/11 | |
| Class A | |
| Actual (–9.45% return) | | $ | 1,000.00 | | | $ | 905.50 | | | $ | 7.06 | | |
| Hypothetical (5% annual return before expenses) | | $ | 1,000.00 | | | $ | 1,017.80 | | | $ | 7.48 | | |
| Class B | |
| Actual (–9.61% return) | | $ | 1,000.00 | | | $ | 903.90 | | | $ | 7.25 | | |
| Hypothetical (5% annual return before expenses) | | $ | 1,000.00 | | | $ | 1,017.59 | | | $ | 7.68 | | |
| Class C | |
| Actual (–9.85% return) | | $ | 1,000.00 | | | $ | 901.50 | | | $ | 10.64 | | |
| Hypothetical (5% annual return before expenses) | | $ | 1,000.00 | | | $ | 1,014.01 | | | $ | 11.27 | | |
| Class I | |
| Actual (–9.32% return) | | $ | 1,000.00 | | | $ | 906.80 | | | $ | 5.86 | | |
| Hypothetical (5% annual return before expenses) | | $ | 1,000.00 | | | $ | 1,019.06 | | | $ | 6.21 | | |
8
Expense Example (unaudited) continued
| | | Beginning
Account Value | | Ending
Account Value | | Expenses Paid
During Period@ | |
| | | 03/01/11 | | 08/31/11 | | 03/01/11 –
08/31/11 | |
| Class R | |
| Actual (–9.62% return) | | $ | 1,000.00 | | | $ | 903.80 | | | $ | 8.25 | | |
| Hypothetical (5% annual return before expenses) | | $ | 1,000.00 | | | $ | 1,016.53 | | | $ | 8.74 | | |
| Class W | |
| Actual (–9.51% return) | | $ | 1,000.00 | | | $ | 904.90 | | | $ | 7.54 | | |
| Hypothetical (5% annual return before expenses) | | $ | 1,000.00 | | | $ | 1,017.29 | | | $ | 7.98 | | |
@ Expenses are equal to the Fund's annualized expense ratios of 1.47%, 1.51%, 2.22%, 1.22%, 1.72%, and 1.57% for Class A, Class B, Class C, Class I, Class R, and Class W shares, respectively, multiplied by the average account value over the period, multiplied by 184/365 (to reflect the one-half year period).
The Fund's Distributor has agreed to reduce the 12b-1 fee on Class B shares of the Fund to the extent it exceeds 0.24% of the average daily net assets of such shares on an annualized basis. This waiver is expected to continue for one year or until such time that the Fund's Board of Trustees acts to discontinue all or a portion of such waiver when it deems that such action is appropriate.
9
Investment Advisory Agreement Approval (unaudited)
Nature, Extent and Quality of Services
The Board reviewed and considered the nature and extent of the investment advisory services provided by the Investment Adviser (as defined herein) under the advisory agreement, including portfolio management, investment research and equity and fixed income securities trading. The Board reviewed similar information and factors regarding the Sub-Advisers (as defined herein), to the extent applicable. The Board also reviewed and considered the nature and extent of the non-advisory, administrative services provided by the Fund's Administrator (as defined herein) under the administration agreement, including accounting, clerical, bookkeeping, compliance, business management and planning, and the provision of supplies, office space and utilities at the Investment Adviser's expense. (The Investment Adviser, Sub-Advisers and Administrator together are referred to as the "Adviser" and the advisory, sub-advisory and administration agreements together are referred to as the "Management Agreement.") The Board also compared the nature of the services provided by the Adviser with similar services provided by non-affiliated advisers as reported to the Board by Lipper, Inc. ("Lipper").
The Board reviewed and considered the qualifications of the portfolio managers, the senior administrative managers and other key personnel of the Adviser who provide the administrative and advisory services to the Fund. The Board determined that the Adviser's portfolio managers and key personnel are well qualified by education and/or training and experience to perform the services in an efficient and professional manner. The Board concluded that the nature and extent of the advisory and administrative services provided were necessary and appropriate for the conduct of the business and investment activities of the Fund and supported its decision to approve the Management Agreement.
Performance, Fees and Expenses of the Fund
The Board reviewed the performance, fees and expenses of the Fund compared to its peers, as determined by Lipper, and to appropriate benchmarks where applicable. The Board discussed with the Adviser the performance goals and the actual results achieved in managing the Fund. When considering a fund's performance, the Board and the Adviser place emphasis on trends and longer-term returns (focusing on one-year, three-year and five-year performance, as of December 31, 2010, or since inception, as applicable). When a fund underperforms its benchmark and/or its peer group average, the Board and the Adviser discuss the causes of such underperformance and, where necessary, they discuss specific changes to investment strategy or investment personnel. The Board noted that the Fund's performance was better than its peer group average for the three- and five-year periods but below its peer group average for the one-year period. The Board discussed with the Adviser the level of the advisory and administration fees (together, the "management fee") for this Fund relative to comparable funds and/or other accounts advised by the Adviser and/or compared to its peers as determined by Lipper. In addition to the management fee, the Board also reviewed the Fund's total expense ratio. The Board noted that the Fund's management fee and total expense ratio were lower than its peer group average. After discussion, the Board concluded that the Fund's management fee, total expense ratio and performance were competitive with its peer group average.
10
Economies of Scale
The Board considered the size and growth prospects of the Fund and how that relates to the Fund's total expense ratio and particularly the Fund's management fee rate, which does not include breakpoints. In conjunction with its review of the Adviser's profitability, the Board discussed with the Adviser how a change in assets can affect the efficiency or effectiveness of managing the Fund and whether the management fee level is appropriate relative to current and projected asset levels and/or whether the management fee structure reflects economies of scale as asset levels change. The Board has determined that its review of the actual and potential economies of scale of the Fund supports its decision to approve the Management Agreement.
Profitability of the Adviser and Affiliates
The Board considered information concerning the costs incurred and profits realized by the Adviser and its affiliates during the last year from their relationship with the Fund and during the last two years from their relationship with the Morgan Stanley Fund Complex and reviewed with the Adviser the cost allocation methodology used to determine the profitability of the Adviser and affiliates. The Board has determined that its review of the analysis of the Adviser's expenses and profitability supports its decision to approve the Management Agreement.
Other Benefits of the Relationship
The Board considered other benefits to the Adviser and its affiliates derived from their relationship with the Fund and other funds advised by the Adviser. These benefits may include, among other things, "float" benefits derived from handling of checks for purchases and sales, research received by the Adviser generated from commission dollars spent on funds' portfolio trading and fees for distribution and/or shareholder servicing. The Board reviewed with the Adviser each of these arrangements and the reasonableness of the Adviser's costs relative to the services performed. The Board has determined that its review of the other benefits received by the Adviser or its affiliates supports its decision to approve the Management Agreement.
Resources of the Adviser and Historical Relationship Between the Fund and the Adviser
The Board considered whether the Adviser is financially sound and has the resources necessary to perform its obligations under the Management Agreement. The Board also reviewed and considered the historical relationship between the Fund and the Adviser, including the organizational structure of the Adviser, the policies and procedures formulated and adopted by the Adviser for managing the Fund's operations and the Board's confidence in the competence and integrity of the senior managers and key personnel of the Adviser. The Board concluded that the Adviser has the financial resources necessary to fulfill its obligations under the Management Agreement and that it is beneficial for the Fund to continue its relationship with the Adviser.
11
Other Factors and Current Trends
The Board considered the controls and procedures adopted and implemented by the Adviser and monitored by the Fund's Chief Compliance Officer and concluded that the conduct of business by the Adviser indicates a good faith effort on its part to adhere to high ethical standards in the conduct of the Fund's business.
General Conclusion
After considering and weighing all of the above factors, the Board concluded that it would be in the best interest of the Fund and its shareholders to approve renewal of the Management Agreement for another year. In reaching this conclusion the Board did not give particular weight to any single factor referenced above. The Board considered these factors over the course of numerous meetings, some of which were in executive session with only the independent Board members and their counsel present. It is possible that individual Board members may have weighed these factors differently in reaching their individual decisions to approve the Management Agreement.
12
Morgan Stanley International Value Equity Fund
Portfolio of Investments n August 31, 2011
NUMBER OF
SHARES | |
| | VALUE | |
| | | Common Stocks (98.6%) | |
| | | Australia (3.4%) | |
| | | Chemicals | |
| | 15,559 | | | Orica Ltd. | | $ | 390,348 | | |
| | | Energy Equipment &
Services | |
| | 54,543 | | | WorleyParsons Ltd. | | | 1,585,863 | | |
| | | Insurance | |
| | 432,189 | | | AMP Ltd. | | | 2,092,809 | | |
| | | Oil, Gas & Consumable
Fuels | |
| | 220,602 | | | Santos Ltd. | | | 2,770,798 | | |
| | | | | Total Australia | | | 6,839,818 | | |
| | | Canada (0.9%) | |
| | | Oil, Gas & Consumable
Fuels | |
| | 35,379 | | | Cenovus Energy, Inc. | | | 1,278,890 | | |
| | 21,863 | | | Encana Corp. | | | 555,226 | | |
| | | | | Total Canada | | | 1,834,116 | | |
| | | France (8.1%) | |
| | | Commercial Banks | |
| | 38,059 | | | BNP Paribas SA | | | 1,961,077 | | |
| | 34,508 | | | Societe Generale SA | | | 1,157,973 | | |
| | | | 3,119,050 | | |
| | | Diversified
Telecommunication Services | |
| | 70,174 | | | France Telecom SA | | | 1,340,707 | | |
| | | Electrical Equipment | |
| | 95,142 | | | Legrand SA | | | 3,778,286 | | |
| | | Machinery | |
| | 37,034 | | | Vallourec SA | | | 3,332,941 | | |
| | | Metals & Mining | |
| | 37,937 | | | ArcelorMittal | | | 837,884 | | |
NUMBER OF
SHARES | |
| | VALUE | |
| | | Pharmaceuticals | |
| | 50,324 | | | Sanofi | | $ | 3,662,235 | | |
| | | | | Total France | | | 16,071,103 | | |
| | | Germany (4.7%) | |
| | | Auto Components | |
| | 16,406 | | | Continental AG (a) | | | 1,210,649 | | |
| | | Automobiles | |
| | 12,557 | | | Volkswagen AG
(Preference) | | | 2,091,522 | | |
| | | Chemicals | |
| | 27,307 | | | BASF SE | | | 1,948,382 | | |
| | | Pharmaceuticals | |
| | 62,988 | | | Bayer AG (Registered) | | | 4,061,751 | | |
| | | | | Total Germany | | | 9,312,304 | | |
| | | Ireland (1.4%) | |
| | | Construction Materials | |
| | 155,473 | | | CRH PLC | | | 2,776,080 | | |
| | | Italy (1.1%) | |
| | | Oil, Gas & Consumable
Fuels | |
| | 106,409 | | | Eni SpA | | | 2,139,993 | | |
| | | Japan (23.8%) | |
| | | Auto Components | |
| | 209,000 | | | NGK Spark Plug Co., Ltd. | | | 2,696,774 | | |
| | | Automobiles | |
| | 105,400 | | | Toyota Motor Corp. | | | 3,763,401 | | |
| | | Chemicals | |
| | 91,000 | | | Taiyo Nippon Sanso
Corp. (b) | | | 673,854 | | |
| | | Commercial Banks | |
| | 67,919 | | | Sumitomo Mitsui Financial
Group, Inc. | | | 2,000,226 | | |
See Notes to Financial Statements
13
Morgan Stanley International Value Equity Fund
Portfolio of Investments n August 31, 2011 continued
NUMBER OF
SHARES | |
| | VALUE | |
| | 628,000 | | | Sumitomo Mitsui Trust
Holdings, Inc. | | $ | 2,116,025 | | |
| | | | 4,116,251 | | |
| | | Electrical Equipment | |
| | 255,000 | | | Mitsubishi Electric Corp. | | | 2,531,017 | | |
| | | Electronic Equipment,
Instruments & Components | |
| | 606,000 | | | Hitachi Ltd. (b) | | | 3,268,617 | | |
| | 141,800 | | | Hoya Corp. | | | 3,105,637 | | |
| | 11,200 | | | Keyence Corp. | | | 2,988,324 | | |
| | 12,200 | | | Kyocera Corp. | | | 1,115,319 | | |
| | | | 10,477,897 | | |
| | | Food & Staples Retailing | |
| | 21,900 | | | Lawson, Inc. (b) | | | 1,191,243 | | |
| | | Gas Utilities | |
| | 287,000 | | | Tokyo Gas Co., Ltd. | | | 1,315,620 | | |
| | | Household Durables | |
| | 275,000 | | | Sekisui House Ltd. | | | 2,463,759 | | |
| | | Insurance | |
| | 84,700 | | | MS&AD Insurance
Group Holdings | | | 1,971,208 | | |
| | | Marine | |
| | 141,147 | | | Mitsui O.S.K. Lines Ltd. | | | 593,566 | | |
| | | Media | |
| | 19,200 | | | Asatsu-DK, Inc. (b) | | | 521,060 | | |
| | | Oil, Gas & Consumable
Fuels | |
| | 433 | | | INPEX Corp. | | | 2,912,303 | | |
| | | Pharmaceuticals | |
| | 33,200 | | | Astellas Pharma, Inc. | | | 1,247,873 | | |
| | | Real Estate Management &
Development | |
| | 185,000 | | | Mitsubishi Estate Co., Ltd. | | | 3,029,777 | | |
| | | Semiconductors &
Semiconductor Equipment | |
| | 57,100 | | | Tokyo Electron Ltd. | | | 2,725,617 | | |
NUMBER OF
SHARES | |
| | VALUE | |
| | | Trading Companies &
Distributors | |
| | 154,100 | | | Mitsubishi Corp. | | $ | 3,676,906 | | |
| | | Wireless Telecommunication
Services | |
| | 878 | | | NTT DoCoMo, Inc. | | | 1,589,275 | | |
| | | | | Total Japan | | | 47,497,401 | | |
| | | Netherlands (5.5%) | |
| | | Chemicals | |
| | 59,292 | | | Akzo Nobel N.V. | | | 3,018,532 | | |
| | | Food Products | |
| | 235,831 | | | Unilever N.V. CVA | | | 7,983,149 | | |
| | | | | Total Netherlands | | | 11,001,681 | | |
| | | Switzerland (12.4%) | |
| | | Capital Markets | |
| | 187,293 | | | UBS AG (Registered) (a) | | | 2,712,303 | | |
| | | Construction Materials | |
| | 57,889 | | | Holcim Ltd. (Registered) (a) | | | 3,660,041 | | |
| | | Food Products | |
| | 124,121 | | | Nestle SA (Registered) | | | 7,687,385 | | |
| | | Insurance | |
| | 10,341 | | | Zurich Financial
Services AG (a) | | | 2,332,933 | | |
| | | Pharmaceuticals | |
| | 78,450 | | | Novartis AG (Registered) | | | 4,574,506 | | |
| | 20,990 | | | Roche Holding AG
(Genusschein) | | | 3,675,236 | | |
| | | | 8,249,742 | | |
| | | | | Total Switzerland | | | 24,642,404 | | |
| | | United Kingdom (35.9%) | |
| | | Commercial Banks | |
| | 978,604 | | | Barclays PLC | | | 2,712,480 | | |
| | 592,521 | | | HSBC Holdings PLC | | | 5,161,231 | | |
See Notes to Financial Statements
14
Morgan Stanley International Value Equity Fund
Portfolio of Investments n August 31, 2011 continued
NUMBER OF
SHARES | |
| | VALUE | |
| | 4,843,151 | | | Lloyds Banking
Group PLC (a) | | $ | 2,641,201 | | |
| | | | 10,514,912 | | |
| | | Electric Utilities | |
| | 140,526 | | | Scottish & Southern
Energy PLC | | | 2,965,506 | | |
| | | Food & Staples Retailing | |
| | 341,483 | | | WM Morrison
Supermarkets PLC | | | 1,602,012 | | |
| | | Household Products | |
| | 132,596 | | | Reckitt Benckiser
Group PLC | | | 7,049,212 | | |
| | | Industrial Conglomerates | |
| | 130,396 | | | Smiths Group PLC | | | 2,109,310 | | |
| | | Insurance | |
| | 73,249 | | | Admiral Group PLC | | | 1,623,055 | | |
| | 1,572,885 | | | Legal & General Group PLC | | | 2,680,928 | | |
| | 527,734 | | | Prudential PLC | | | 5,315,642 | | |
| | 453,064 | | | Resolution Ltd. | | | 1,959,262 | | |
| | | | 11,578,887 | | |
| | | Metals & Mining | |
| | 66,900 | | | BHP Billiton PLC | | | 2,287,090 | | |
| | 156,415 | | | Xstrata PLC | | | 2,739,673 | | |
| | | | 5,026,763 | | |
| | | Oil, Gas & Consumable
Fuels | |
| | 108,703 | | | BG Group PLC | | | 2,350,415 | | |
| | 342,165 | �� | | BP PLC | | | 2,235,354 | | |
| | | | 4,585,769 | | |
| | | Professional Services | |
| | 901,883 | | | Hays PLC | | | 1,105,340 | | |
| | | Tobacco | |
| | 173,670 | | | British American
Tobacco PLC | | | 7,734,436 | | |
| | 257,130 | | | Imperial Tobacco
Group PLC | | | 8,523,291 | | |
| | | | 16,257,727 | | |
NUMBER OF
SHARES | |
| | VALUE | |
| | | Trading Companies &
Distributors | |
| | 189,596 | | | Bunzl PLC | | $ | 2,462,170 | | |
| | 139,623 | | | Travis Perkins PLC | | | 1,870,996 | | |
| | | | 4,333,166 | | |
| | | Wireless Telecommunication
Services | |
| | 1,639,426 | | | Vodafone Group PLC | | | 4,284,662 | | |
| | | | | Total United Kingdom | | | 71,413,266 | | |
| | | United States (1.4%) | |
| | | Beverages | |
| | 74,657 | | | Dr. Pepper Snapple
Group, Inc. | | | 2,872,801 | | |
| | | | | Total Common Stocks
(Cost $203,929,017) | | | 196,400,967 | | |
PRINCIPAL
AMOUNT IN
THOUSANDS | |
| |
| |
| | | Short-Term Investments (3.1%)
Securities held as Collateral
on Loaned Securities (1.7%) | |
| | | Repurchase
Agreements (0.2%) | |
| $ | 181 | | | Barclays Capital, Inc.
(0.04%, dated 08/31/11,
due 09/01/11; proceeds
$180,500; fully
collateralized by a U.S.
Government Obligation;
U.S. Treasury Bond
3.50% due 02/15/39;
valued at $184,111) | | | 180,500 | | |
See Notes to Financial Statements
15
Morgan Stanley International Value Equity Fund
Portfolio of Investments n August 31, 2011 continued
PRINCIPAL
AMOUNT IN
THOUSANDS | |
| |
VALUE | |
| $ | 112 | | | Nomura Holdings, Inc.
(0.08%, dated 08/31/11,
due 09/01/11; proceeds
$111,573; fully
collateralized by a U.S.
Government Agency;
Federal National Mortgage
Association 4.50% due
08/01/41; valued at
$113,804) | | $ | 111,573 | | |
| | | Total Repurchase
Agreements
(Cost $292,073) | | | 292,073 | | |
NUMBER OF
SHARES (000) | |
| |
| |
| | | Investment Company (1.5%) | |
| | 3,029 | | | Morgan Stanley Institutional
Liquidity Funds - Money
Market Portfolio - Institutional
Class (See Note 5)
(Cost $3,028,523) | | | 3,028,523 | | |
| | | Total Securities held as
Collateral on Loaned
Securities
(Cost $3,320,596) | | | 3,320,596 | | |
NUMBER OF
SHARES (000) | |
| | VALUE | |
| | | Investment Company (1.4%) | | | |
| | 2,791 | | | Morgan Stanley Institutional
Liquidity Funds - Money
Market Portfolio - Institutional
Class (See Note 5)
(Cost $2,791,289) | | $ | 2,791,289 | | |
| | | | | Total Short-Term
Investments
(Cost $6,111,885) | | | 6,111,885 | | |
Total Investments
(Cost $210,040,902) (c) | | | 101.7 | % | | | 202,512,852 | | |
Liabilities in Excess of
Other Assets | | | (1.7 | ) | | | (3,438,353 | ) | |
| Net Assets | | | 100.0 | % | | $ | 199,074,499 | | |
CVA Certificaten Van Aandelen.
(a) Non-income producing security.
(b) All or a portion of this security was on loan at August 31, 2011.
(c) The aggregate cost for federal income tax purposes is $211,855,517. The aggregate gross unrealized appreciation is $16,282,287 and the aggregate gross unrealized depreciation is $25,624,952 resulting in net unrealized depreciation of $9,342,665.
See Notes to Financial Statements
16
Morgan Stanley International Value Equity Fund
Summary of Investments n August 31, 2011
| INDUSTRY | | VALUE | | PERCENT OF
TOTAL
INVESTMENTS | |
| Insurance | | $ | 17,975,837 | | | | 9.0 | % | |
| Commercial Banks | | | 17,750,213 | | | | 8.9 | | |
| Pharmaceuticals | | | 17,221,601 | | | | 8.6 | | |
| Tobacco | | | 16,257,727 | | | | 8.2 | | |
| Food Products | | | 15,670,534 | | | | 7.9 | | |
| Oil, Gas & Consumable Fuels | | | 14,242,979 | | | | 7.1 | | |
Electronic Equipment,
Instruments & Components | | | 10,477,897 | | | | 5.3 | | |
Trading Companies &
Distributors | | | 8,010,072 | | | | 4.0 | | |
| Household Products | | | 7,049,212 | | | | 3.5 | | |
| Construction Materials | | | 6,436,121 | | | | 3.2 | | |
| Electrical Equipment | | | 6,309,303 | | | | 3.2 | | |
| Chemicals | | | 6,031,116 | | | | 3.0 | | |
Wireless Telecommunication
Services | | | 5,873,937 | | | | 2.9 | | |
| Metals & Mining | | | 5,864,647 | | | | 2.9 | | |
| Automobiles | | | 5,854,923 | | | | 2.9 | | |
| Auto Components | | | 3,907,423 | | | | 2.0 | | |
| Machinery | | | 3,332,941 | | | | 1.7 | | |
Real Estate Management &
Development | | | 3,029,777 | | | | 1.5 | | |
| Electric Utilities | | | 2,965,506 | | | | 1.5 | | |
| Beverages | | | 2,872,801 | | | | 1.4 | | |
| Food & Staples Retailing | | | 2,793,255 | | | | 1.4 | | |
| Investment Company | | | 2,791,289 | | | | 1.4 | | |
Semiconductors &
Semiconductor Equipment | | | 2,725,617 | | | | 1.4 | | |
| Capital Markets | | | 2,712,303 | | | | 1.4 | | |
| Household Durables | | | 2,463,759 | | | | 1.2 | | |
| Industrial Conglomerates | | | 2,109,310 | | | | 1.1 | | |
Energy Equipment &
Services | | | 1,585,863 | | | | 0.8 | | |
Diversified Telecommunication
Services | | | 1,340,707 | | | | 0.7 | | |
| INDUSTRY | | VALUE | | PERCENT OF
TOTAL
INVESTMENTS | |
| Gas Utilities | | $ | 1,315,620 | | | | 0.7 | % | |
| Professional Services | | | 1,105,340 | | | | 0.6 | | |
| Marine | | | 593,566 | | | | 0.3 | | |
| Media | | | 521,060 | | | | 0.3 | | |
| | | $ | 199,192,256 | + | | | 100.0 | % | |
+ Does not reflect the value of securities held as collateral on loaned securities.
See Notes to Financial Statements
17
Morgan Stanley International Value Equity Fund
Financial Statements
Statement of Assets and Liabilities
August 31, 2011
| Assets: | |
| Investments in securities, at value (cost $204,221,090) (including $3,167,747 for securities loaned) | | $ | 196,693,040 | | |
| Investment in affiliate, at value (cost $5,819,812) | | | 5,819,812 | | |
| Total investments in securities, at value (cost $210,040,902) | | | 202,512,852 | | |
| Cash (foreign currency with a cost of $172,094) | | | 172,018 | | |
| Receivable for: | |
| Dividends | | | 790,688 | | |
| Investments sold | | | 418,359 | | |
| Foreign withholding taxes reclaimed | | | 239,547 | | |
| Shares of beneficial interest sold | | | 27,106 | | |
| Dividends from affiliate | | | 227 | | |
| Receivable from Distributor | | | 64,260 | | |
| Prepaid expenses and other assets | | | 12,702 | | |
| Total Assets | | | 204,237,759 | | |
| Liabilities: | |
| Collateral on securities loaned, at value | | | 3,320,596 | | |
| Payable for: | |
| Investments purchased | | | 656,512 | | |
| Shares of beneficial interest redeemed | | | 636,704 | | |
| Transfer agent fee | | | 208,761 | | |
| Investment advisory fee | | | 144,669 | | |
| Distribution fee | | | 65,936 | | |
| Administration fee | | | 14,467 | | |
| Accrued expenses and other payables | | | 115,615 | | |
| Total Liabilities | | | 5,163,260 | | |
| Net Assets | | $ | 199,074,499 | | |
| Composition of Net Assets: | |
| Paid-in-capital | | $ | 300,118,820 | | |
| Net unrealized depreciation | | | (7,504,785 | ) | |
| Accumulated undistributed net investment income | | | 2,844,719 | | |
| Accumulated net realized loss | | | (96,384,255 | ) | |
| Net Assets | | $ | 199,074,499 | | |
| Class A Shares: | |
| Net Assets | | $ | 39,756,827 | | |
| Shares Outstanding (unlimited shares authorized, $.01 par value) | | | 4,886,028 | | |
| Net Asset Value Per Share | | $ | 8.14 | | |
Maximum Offering Price Per Share,
(net asset value plus 5.54% of net asset value) | | $ | 8.59 | | |
| Class B Shares: | |
| Net Assets | | $ | 46,832,382 | | |
| Shares Outstanding (unlimited shares authorized, $.01 par value) | | | 5,786,929 | | |
| Net Asset Value Per Share | | $ | 8.09 | | |
| Class C Shares: | |
| Net Assets | | $ | 15,740,591 | | |
| Shares Outstanding (unlimited shares authorized, $.01 par value) | | | 1,956,313 | | |
| Net Asset Value Per Share | | $ | 8.05 | | |
| Class I Shares: | |
| Net Assets | | $ | 96,576,426 | | |
| Shares Outstanding (unlimited shares authorized, $.01 par value) | | | 11,826,472 | | |
| Net Asset Value Per Share | | $ | 8.17 | | |
| Class R Shares: | |
| Net Assets | | $ | 83,553 | | |
| Shares Outstanding (unlimited shares authorized, $.01 par value) | | | 10,347 | | |
| Net Asset Value Per Share | | $ | 8.08 | | |
| Class W Shares: | |
| Net Assets | | $ | 84,720 | | |
| Shares Outstanding (unlimited shares authorized, $.01 par value) | | | 10,474 | | |
| Net Asset Value Per Share | | $ | 8.09 | | |
See Notes to Financial Statements
18
Morgan Stanley International Value Equity Fund
Financial Statements continued
Statement of Operations
For the year ended August 31, 2011
Net Investment Income:
Income | |
| Dividends (net of $478,785 foreign withholding tax) | | $ | 7,456,074 | | |
| Income from securities loaned - net | | | 153,759 | | |
| Dividends from affiliate (Note 5) | | | 6,442 | | |
| Interest (net of $5 interest withholding tax) | | | 275 | | |
| Total Income | | | 7,616,550 | | |
| Expenses | |
| Investment advisory fee (Note 3) | | | 1,911,203 | | |
| Distribution fee (Class A shares) (Note 4) | | | 119,112 | | |
| Distribution fee (Class B shares) (Note 4) | | | 134,995 | | |
| Distribution fee (Class C shares) (Note 4) | | | 187,418 | | |
| Distribution fee (Class R shares) (Note 4) | | | 442 | | |
| Distribution fee (Class W shares) (Note 4) | | | 312 | | |
| Transfer agent fees and expenses | | | 395,595 | | |
| Administration fee (Note 3) | | | 191,120 | | |
| Custodian fees | | | 98,305 | | |
| Professional fees | | | 96,400 | | |
| Shareholder reports and notices | | | 94,126 | | |
| Registration fees | | | 74,730 | | |
| Trustees' fees and expenses | | | 8,931 | | |
| Other | | | 33,590 | | |
| Total Expenses | | | 3,346,279 | | |
| Less: rebate from Morgan Stanley affiliated cash sweep (Note 5) | | | (4,420 | ) | |
| Net Expenses | | | 3,341,859 | | |
| Net Investment Income | | | 4,274,691 | | |
Realized and Unrealized Gain (Loss):
Realized Gain (Loss) on: | |
| Investments | | | 11,292,390 | | |
| Foreign currency translation | | | 90,313 | | |
| Net Realized Gain | | | 11,382,703 | | |
| Change in Unrealized Appreciation/Depreciation on: | |
| Investments | | | 12,471,923 | | |
| Foreign currency translation | | | 27,884 | | |
| Net Change in Unrealized Appreciation/Depreciation | | | 12,499,807 | | |
| Net Gain | | | 23,882,510 | | |
| Net Increase | | $ | 28,157,201 | | |
See Notes to Financial Statements
19
Morgan Stanley International Value Equity Fund
Financial Statements continued
Statements of Changes in Net Assets
| | | FOR THE
YEAR ENDED
AUGUST 31, 2011 | | FOR THE
YEAR ENDED
AUGUST 31, 2010^ | |
Increase (Decrease) in Net Assets:
Operations: | |
| Net investment income | | $ | 4,274,691 | | | $ | 4,354,021 | | |
| Net realized gain (loss) | | | 11,382,703 | | | | (11,227,189 | ) | |
| Net change in unrealized appreciation/depreciation | | | 12,499,807 | | | | 3,778,577 | | |
| Net Increase (Decrease) | | | 28,157,201 | | | | (3,094,591 | ) | |
| Dividends to Shareholders from Net Investment Income: | |
| Class A shares | | | (896,377 | ) | | | (1,409,147 | ) | |
| Class B shares | | | (1,082,844 | ) | | | (1,914,479 | ) | |
| Class C shares | | | (177,069 | ) | | | (419,041 | ) | |
| Class I shares | | | (2,396,152 | ) | | | (3,788,295 | ) | |
| Class R shares | | | (1,399 | ) | | | (1,943 | ) | |
| Class W shares | | | (1,523 | ) | | | (2,050 | ) | |
| Total Dividends | | | (4,555,364 | ) | | | (7,534,955 | ) | |
| Net decrease from transactions in shares of beneficial interest | | | (58,531,840 | ) | | | (58,046,530 | ) | |
| Net Decrease | | | (34,930,003 | ) | | | (68,676,076 | ) | |
| Net Assets: | |
| Beginning of period | | | 234,004,502 | | | | 302,680,578 | | |
End of Period
(Including accumulated undistributed net investment income
of $2,844,719 and $3,035,235, respectively) | | $ | 199,074,499 | | | $ | 234,004,502 | | |
^ Beginning with the year ended August 31, 2011, the Fund was audited by Ernst & Young LLP. The previous year was audited by another independent registered public accounting firm.
See Notes to Financial Statements
20
Morgan Stanley International Value Equity Fund
Notes to Financial Statements n August 31, 2011
1. Organization and Accounting Policies
Morgan Stanley International Value Equity Fund (the "Fund"), is registered under the Investment Company Act of 1940, as amended (the "Act"), as a diversified, open-end management investment company. The Fund's investment objective is to seek long-term capital appreciation. The Fund was organized as a Massachusetts business trust on January 11, 2001 and commenced operations on April 26, 2001.
The Fund offers Class A shares, Class B shares, Class C shares, Class I shares, Class R shares and Class W shares. The six classes are substantially the same except that most Class A shares are subject to a sales charge imposed at the time of purchase and some Class A shares, and most Class B shares and Class C shares are subject to a contingent deferred sales charge imposed on shares redeemed within eighteen months, six years and one year, respectively. Class I shares, Class R shares, and Class W shares are not subject to a sales charge. Additionally, Class A shares, Class B shares, Class C shares, Class R shares and Class W shares incur distribution expenses.
The Fund will assess a 2% redemption fee, on Class A shares, Class B shares, Class C shares, Class I shares, Class R shares and Class W shares, which is paid directly to the Fund, for shares redeemed or exchanged within thirty days of purchase, subject to certain exceptions. The redemption fee is designed to protect the Fund and its remaining shareholders from the effects of short-term trading. These fees, if any, are included on the Statement of Changes in Net Assets.
The following is a summary of significant accounting policies:
A. Valuation of Investments — (1) For equity securities traded on foreign exchanges, the last reported sale price or the latest bid price may be used if there were no sales on a particular day; (2) an equity portfolio security listed or traded on the New York Stock Exchange ("NYSE") or American Stock Exchange or other domestic exchange is valued at its latest sale price prior to the time when assets are valued; if there were no sales that day, the security is valued at the mean between the last reported bid and ask price; (3) an equity portfolio security listed or traded on the Nasdaq is valued at the Nasdaq Official Closing Price; if there were no sales that day, the security is valued at the mean between the last reported bid and ask price; (4) all other portfolio securities for which over-the-counter market quotations are readily available are valued at the mean between the last reported bid and ask price. In cases where a security is traded on more than one exchange, the security is valued on the exchange designated as the primary market; (5) when market quotations are not readily available, including circumstances under which Morgan Stanley Investment Management Inc. (the "Adviser") or Morgan Stanley Investment Management Limited or Morgan Stanley Investment Management Company (each, a "Sub-Adviser"), each a wholly owned subsidiary of Morgan Stanley, determines that the latest sale price, the bid price or the mean between the last reported bid and ask price do not reflect a security's market
21
Morgan Stanley International Value Equity Fund
Notes to Financial Statements n August 31, 2011 continued
value, portfolio securities are valued at their fair value as determined in good faith under procedures established by and under the general supervision of the Fund's Trustees. Occasionally, developments affecting the closing prices of securities and other assets may occur between the times at which valuations of such securities are determined (that is, close of the foreign market on which the securities trade) and the close of business on the NYSE. If developments occur during such periods that are expected to materially affect the value of such securities, such valuations may be adjusted to reflect the estimated fair value of such securities as of the close of the NYSE, as determined in good faith by the Fund's Trustees or by the Adviser using a pricing service and/or procedures approved by the Trustees of the Fund; (6) certain portfolio securities may be valued by an outside pricing service approved by the Fund's Trustees; (7) investments in mutual funds, including the Morgan Stanley Institutional Liquidity Funds, are valued at the net asset value as of the close of each business day; and (8) short-term debt securities having a maturity date of more than sixty days at time of purchase are valued on a mark-to-market basis until sixty days prior to maturity and thereafter at amortized cost based on their value on the 61st day. Short-term debt securities having a maturity date of sixty days or less at the time of purchase are valued at amortized cost, which approximates fair value.
B. Accounting for Investments — Security transactions are accounted for on the trade date (date the order to buy or sell is executed). Realized gains and losses on security transactions are determined by the identified cost method. Dividend income and other distributions are recorded on the ex-dividend date except for certain dividends on foreign securities which are recorded as soon as the Fund is informed after the ex-dividend date. Discounts are accreted and premiums are amortized over the life of the respective securities and are included in interest income. Interest income is accrued daily as earned.
C. Multiple Class Allocations — Investment income, expenses (other than distribution fees), and realized and unrealized gains and losses are allocated to each class of shares based upon the relative net asset value on the date such items are recognized. Distribution fees are charged directly to the respective class.
D. Foreign Currency Translation — The books and records of the Fund are maintained in U.S. dollars as follows: (1) the foreign currency market value of investment securities, other assets and liabilities and foreign currency exchange contracts are translated at the exchange rates prevailing at the end of the period; and (2) purchases, sales, income and expenses are translated at the exchange rates prevailing on the respective dates of such transactions. The resultant exchange gains and losses are recorded as realized and unrealized gains/losses on foreign currency exchange contracts and foreign currency translations. Pursuant to U.S. federal income tax regulations, certain foreign exchange gains/losses included in realized and unrealized gains/losses are included in or are a reduction of ordinary income for federal income tax purposes. The Fund does not isolate that portion of the results of operations arising as a result of changes in the foreign exchange rates from the changes in the
22
Morgan Stanley International Value Equity Fund
Notes to Financial Statements n August 31, 2011 continued
market prices of the securities held.
E. Federal Income Tax Policy — It is the Fund's policy to comply with the requirements of Subchapter M of the Internal Revenue Code applicable to regulated investment companies and to distribute substantially all of its taxable income to its shareholders. Therefore, no federal income tax provision is required. The Fund files tax returns with the U.S. Internal Revenue Service, New York State and New York City. The Fund recognizes the tax effects of a tax position taken or expected to be taken in a tax return only if it is more likely than not to be sustained based solely on its technical merits as of the reporting date. The more-likely-than-not threshold must continue to be met in each reporting period to support continued recognition of the benefit. The difference between the tax benefit recognized in the financial statements for a tax position taken and the tax benefit claimed in the income tax return is referred to as an unrecognized tax benefit. There are no unrecognized tax benefits in the accompanying financial statements. If applicable, the Fund recognizes interest accrued related to unrecognized tax benefits in interest expense and penalties in "other expenses" in the Statement of Operations. Each of the tax years in the four-year period ended August 31, 2011 remains subject to examination by taxing authorities.
F. Securities Lending — The Fund may lend securities to qualified financial institutions, such as broker-dealers, to earn additional income. Any increase or decrease in the fair value of the securities loaned that might occur and any interest earned or dividends declared on those securities during the term of the loan would remain in the Fund. The Fund receives cash or securities as collateral in an amount equal to or exceeding 100% of the current fair value of the loaned securities. The collateral is marked-to-market daily, by the securities lending agent, to ensure that a minimum of 100% collateral coverage is maintained.
Based on pre-established guidelines, the securities lending agent invests any cash collateral that is received in high-quality short-term investments. Securities lending income is generated from the earnings on the invested collateral and borrowing fees, less any rebates owed to the borrowers and compensation to the lending agent.
The value of loaned securities and related collateral outstanding at August 31, 2011 were $3,167,747 and $3,320,596, respectively. The Fund received cash collateral of which $3,320,596 was subsequently invested in Repurchase Agreements and Morgan Stanley Institutional Liquidity Funds as reported in the Portfolio of Investments. The Fund has the right under the lending agreement to recover the securities from the borrower on demand.
G. Dividends and Distributions to Shareholders — Dividends and distributions to shareholders are recorded on the ex-dividend date.
23
Morgan Stanley International Value Equity Fund
Notes to Financial Statements n August 31, 2011 continued
H. Use of Estimates — The preparation of financial statements in accordance with generally accepted accounting principles in the United States ("GAAP") requires management to make estimates and assumptions that affect the reported amounts and disclosures. Actual results could differ from those estimates.
I. Indemnifications — The Fund enters into contracts that contain a variety of indemnifications. The Fund's maximum exposure under these arrangements is unknown. However, the Fund has not had prior claims or losses pursuant to these contracts and expects the risk of loss to be remote.
2. Fair Valuation Measurements
Financial Accounting Standards Board ("FASB") Accounting Standards Codification ("ASC") 820, Fair Value Measurements and Disclosures ("ASC 820"), defines fair value as the value that the Fund would receive to sell an investment or pay to transfer a liability in a timely transaction with an independent buyer in the principal market, or in the absence of a principal market the most advantageous market for the investment or liability. ASC 820 establishes a three-tier hierarchy to distinguish between (1) inputs that reflect the assumptions market participants would use in valuing an asset or liability developed based on market data obtained from sources independent of the reporting entity (observable inputs); and (2) inputs that reflect the reporting entity's own assumptions about the assumptions market participants would use in valuing an asset or liability developed based on the best information available in the circumstances (unobservable inputs) and to establish classification of fair value measurements for disclosure purposes. Various inputs are used in determining the value of the Fund's investments. The inputs are summarized in the three broad levels listed below.
• Level 1 — unadjusted quoted prices in active markets for identical investments
• Level 2 — other significant observable inputs (including quoted prices for similar investments, interest rates, prepayment speeds, credit risk, etc.)
• Level 3 — significant unobservable inputs including the Fund's own assumptions in determining the fair value of investments. Factors considered in making this determination may include, but are not limited to, information obtained by contacting the issuer, analysts, or the appropriate stock exchange (for exchange-traded securities), analysis of the issuer's financial statements or other available documents and, if necessary, available information concerning other securities in similar circumstances
The inputs or methodology used for valuing securities are not necessarily an indication of the risk associated with investing in those securities and the determination of the significance of a particular input to the fair value measurement in its entirety requires judgment and considers factors specific to each security.
24
Morgan Stanley International Value Equity Fund
Notes to Financial Statements n August 31, 2011 continued
The following is a summary of the inputs used as of August 31, 2011 in valuing the Fund's investments carried at fair value:
| | | | | FAIR VALUE MEASUREMENTS AT AUGUST 31, 2011 USING | |
| INVESTMENT TYPE | | TOTAL | | UNADJUSTED
QUOTED PRICES IN
ACTIVE MARKETS FOR
IDENTICAL INVESTMENTS
(LEVEL 1) | | OTHER
SIGNIFICANT
OBSERVABLE
INPUTS
(LEVEL 2) | | SIGNIFICANT
UNOBSERVABLE
INPUTS
(LEVEL 3) | |
| Assets: | |
| Common Stocks | |
| Auto Components | | $ | 3,907,423 | | | $ | 3,907,423 | | | | — | | | | — | | |
| Automobiles | | | 5,854,923 | | | | 5,854,923 | | | | — | | | | — | | |
| Beverages | | | 2,872,801 | | | | 2,872,801 | | | | — | | | | — | | |
| Capital Markets | | | 2,712,303 | | | | 2,712,303 | | | | — | | | | — | | |
| Chemicals | | | 6,031,116 | | | | 6,031,116 | | | | — | | | | — | | |
| Commercial Banks | | | 17,750,213 | | | | 17,750,213 | | | | — | | | | — | | |
| Construction Materials | | | 6,436,121 | | | | 6,436,121 | | | | — | | | | — | | |
| Diversified Telecommunication Services | | | 1,340,707 | | | | 1,340,707 | | | | — | | | | — | | |
| Electric Utilities | | | 2,965,506 | | | | 2,965,506 | | | | — | | | | — | | |
| Electrical Equipment | | | 6,309,303 | | | | 6,309,303 | | | | — | | | | — | | |
Electronic Equipment, Instruments &
Components | | | 10,477,897 | | | | 10,477,897 | | | | — | | | | — | | |
| Energy Equipment & Services | | | 1,585,863 | | | | 1,585,863 | | | | — | | | | — | | |
| Food & Staples Retailing | | | 2,793,255 | | | | 2,793,255 | | | | — | | | | — | | |
| Food Products | | | 15,670,534 | | | | 15,670,534 | | | | — | | | | — | | |
| Gas Utilities | | | 1,315,620 | | | | 1,315,620 | | | | — | | | | — | | |
| Household Durables | | | 2,463,759 | | | | 2,463,759 | | | | — | | | | — | | |
| Household Products | | | 7,049,212 | | | | 7,049,212 | | | | — | | | | — | | |
| Industrial Conglomerates | | | 2,109,310 | | | | 2,109,310 | | | | — | | | | — | | |
| Insurance | | | 17,975,837 | | | | 17,975,837 | | | | — | | | | — | | |
| Machinery | | | 3,332,941 | | | | 3,332,941 | | | | — | | | | — | | |
| Marine | | | 593,566 | | | | 593,566 | | | | — | | | | — | | |
| Media | | | 521,060 | | | | 521,060 | | | | — | | | | — | | |
| Metals & Mining | | | 5,864,647 | | | | 5,864,647 | | | | — | | | | — | | |
| Oil, Gas & Consumable Fuels | | | 14,242,979 | | | | 14,242,979 | | | | — | | | | — | | |
| Pharmaceuticals | | | 17,221,601 | | | | 17,221,601 | | | | — | | | | — | | |
| Professional Services | | | 1,105,340 | | | | 1,105,340 | | | | — | | | | — | | |
| Real Estate Management & Development | | | 3,029,777 | | | | 3,029,777 | | | | — | | | | — | | |
| Semiconductors & Semiconductor Equipment | | | 2,725,617 | | | | 2,725,617 | | | | — | | | | — | | |
| Tobacco | | | 16,257,727 | | | | 16,257,727 | | | | — | | | | — | | |
| Trading Companies & Distributors | | | 8,010,072 | | | | 8,010,072 | | | | — | | | | — | | |
| Wireless Telecommunication Services | | | 5,873,937 | | | | 5,873,937 | | | | — | | | | — | | |
| Total Common Stocks | | | 196,400,967 | | | | 196,400,967 | | | | — | | | | — | | |
25
Morgan Stanley International Value Equity Fund
Notes to Financial Statements n August 31, 2011 continued
| | | | | FAIR VALUE MEASUREMENTS AT AUGUST 31, 2011 USING | |
| INVESTMENT TYPE | | TOTAL | | UNADJUSTED
QUOTED PRICES IN
ACTIVE MARKETS FOR
IDENTICAL INVESTMENTS
(LEVEL 1) | | OTHER
SIGNIFICANT
OBSERVABLE
INPUTS
(LEVEL 2) | | SIGNIFICANT
UNOBSERVABLE
INPUTS
(LEVEL 3) | |
| Short-Term Investments | |
| Repurchase Agreements | | $ | 292,073 | | | | — | | | $ | 292,073 | | | | — | | |
| Investment Company | | | 5,819,812 | | | $ | 5,819,812 | | | | — | | | | — | | |
| Total Short-Term Investments | | | 6,111,885 | | | | 5,819,812 | | | | 292,073 | | | | — | | |
| Total Assets | | $ | 202,512,852 | | | $ | 202,220,779 | | | $ | 292,073 | | | | — | | |
Transfers between investment levels may occur as the markets fluctuate and/or the availability of data used in an investment's valuation changes. The Fund recognizes transfers between the levels as of the end of the period. As of August 31, 2011, the Fund did not have any investments transfer between investment levels.
3. Investment Advisory/Administration and Sub-Advisory Agreements
Pursuant to an Investment Advisory Agreement with the Adviser, the Fund pays an advisory fee, accrued daily and payable monthly, by applying the annual rate of 0.80% to the net assets of the Fund determined as of the close of each business day.
Pursuant to an Administration Agreement with Morgan Stanley Services Company Inc. (the "Administrator"), an affiliate of the Adviser and Sub-Advisers, the Fund pays an administration fee, accrued daily and payable monthly, by applying the annual rate of 0.08% to the Fund's daily net assets.
Under the Sub-Advisory Agreement between the Adviser and the Sub-Advisers, the Sub-Advisers provide the Fund with investment advisory services, subject to the overall supervision of the Adviser and the Fund's Officers and Trustees. The Adviser pays the Sub-Advisers on a monthly basis a portion of the net advisory fees the Adviser receives from the Fund.
Under a Sub-Administration Agreement between the Administrator and State Street Bank and Trust Company ("State Street"), State Street provides certain administrative services to the Fund. For such services, the Administrator pays State Street a portion of the fee the Administrator receives from the Fund.
4. Plan of Distribution
Shares of the Fund are distributed by Morgan Stanley Distribution, Inc. (the "Distributor"), an affiliate of the Adviser, Administrator and Sub-Advisers. The Fund has adopted a Plan of Distribution (the "Plan")
26
Morgan Stanley International Value Equity Fund
Notes to Financial Statements n August 31, 2011 continued
pursuant to Rule 12b-1 under the Act. The Plan provides that the Fund will pay the Distributor a fee which is accrued daily and paid monthly at the following annual rates: (i) Class A — up to 0.25% of the average daily net assets of Class A shares; (ii) Class B — up to 1.00% of the average daily net assets of Class B shares; (iii) Class C — up to 1.00% of the average daily net assets of Class C shares; (iv) Class R — up to 0.50% of the average daily net assets of Class R shares; and (v) Class W — up to 0.35% of the average daily net assets of Class W shares.
In the case of Class B shares, provided that the Plan continues in effect, any cumulative expenses incurred by the Distributor but not yet recovered may be recovered through the payment of future distribution fees from the Fund pursuant to the Plan and contingent deferred sales charges paid by investors upon redemption of Class B shares. Although there is no legal obligation for the Fund to pay expenses incurred in excess of payments made to the Distributor under the Plan and the proceeds of contingent deferred sales charges paid by investors upon redemption of shares, if for any reason the Plan is terminated, the Trustees will consider at that time the manner in which to treat such expenses. The Distributor has advised the Fund that there were no excess expenses at August 31, 2011.
The Fund's Distributor has agreed to reduce the 12b-1 fee on Class B shares of the Fund to the extent it exceeds 0.24% of the average daily net assets of such shares on an annualized basis. This waiver is expected to continue for one year or until such time that the Fund's Board of Trustees acts to discontinue all or a portion of such waiver when it deems that such action is appropriate. For the year ended August 31, 2011, the distribution fee was accrued for Class B at an annual rate of 0.24%.
At August 31, 2011, included in the Statement of Assets and Liabilities, is a receivable from the Fund's Distributor which represents payments due to be reimbursed to the Fund under the Plan. Because the Plan is what is referred to as a "reimbursement plan", the Distributor reimburses to the Fund any 12b-1 fees collected in excess of the actual distribution expenses incurred. This receivable represents this excess amount as of August 31, 2011.
In the case of Class A, Class C, Class R and Class W shares, expenses incurred pursuant to the Plan in any calendar year in excess of 0.25%, 1.00%, 0.50% or 0.35% of the average daily net assets of Class A, Class C, Class R or Class W shares, respectively, will not be reimbursed by the Fund through payments in any subsequent year, except that expenses representing a gross sales credit to Morgan Stanley Smith Barney Financial Advisors and other authorized financial representatives at the time of sale may be reimbursed in the subsequent calendar year. For the year ended August 31, 2011, the distribution fee was accrued for Class A, Class C, Class R and Class W shares at the annual rate of 0.25%, 0.99%, 0.50% and 0.35%, respectively.
The Distributor has informed the Fund that for the year ended August 31, 2011, it received contingent deferred sales charges from certain redemptions of the Fund's Class B shares and Class C shares of
27
Morgan Stanley International Value Equity Fund
Notes to Financial Statements n August 31, 2011 continued
$25,077 and $747, respectively, and received $2,142 in front-end sales charges from sales of the Fund's Class A shares. The respective shareholders pay such charges, which are not an expense of the Fund.
5. Security Transactions and Transactions with Affiliates
The cost of purchases and proceeds from sales of investment securities, excluding short-term investments, for the year ended August 31, 2011 aggregated $66,494,883 and $124,125,701, respectively.
The Fund invests in the Institutional Class of the Morgan Stanley Institutional Liquidity Funds—Money Market Portfolio (the "Liquidity Funds"), an open-end management investment company managed by the Adviser, both directly, and as a portion of the securities held as collateral on loaned securities. Investment advisory fees paid by the Fund are reduced by an amount equal to its pro-rata share of the advisory and administration fees paid by the Fund due to its investment in the Liquidity Funds. For the year ended August 31, 2011, advisory fees paid were reduced by $4,420 relating to the Fund's investment in the Liquidity Funds.
A summary of the Fund's transactions in shares of the Liquidity Funds during the year ended August 31, 2011 is as follows:
VALUE
AUGUST 31, 2010 | | PURCHASES
AT COST | | SALES
PROCEEDS | | DIVIDEND
INCOME | | VALUE
AUGUST 31, 2011 | |
| $ | 10,745,391 | | | $ | 67,340,945 | | | $ | 72,266,524 | | | $ | 6,442 | | | $ | 5,819,812 | | |
For the year ended August 31, 2011, the Fund incurred brokerage commissions of $4,956 with Citigroup, Inc., and its affiliated broker-dealers, which may be deemed affiliates of the Adviser, Sub-Advisers, Administrator and Distributor under Section 17 of the Act, for portfolio transactions executed on behalf of the Fund.
Morgan Stanley Services Company Inc., an affiliate of the Adviser, Sub-Advisers and Distributor, is the Fund's transfer agent.
The Fund has an unfunded Deferred Compensation Plan (the "Compensation Plan"), which allows each independent Trustee to defer payment of all, or a portion, of the fees he or she receives for serving on the Board of Trustees. Each eligible Trustee generally may elect to have the deferred amounts credited with a return equal to the total return on one or more of the Morgan Stanley funds that are offered as investment options under the Compensation Plan. Appreciation/depreciation and distributions received from these investments are recorded with an offsetting increase/decrease in the deferred compensation obligation and do not affect the net asset value of the Fund.
28
Morgan Stanley International Value Equity Fund
Notes to Financial Statements n August 31, 2011 continued
6. Shares of Beneficial Interest@@
Transactions in shares of beneficial interest were as follows:
| | | FOR THE YEAR
ENDED
AUGUST 31, 2011 | | FOR THE YEAR
ENDED
AUGUST 31, 2010 | |
| | | SHARES | | AMOUNT | | SHARES | | AMOUNT | |
| CLASS A SHARES | |
| Sold | | | 429,153 | | | $ | 3,626,067 | | | | 551,451 | | | $ | 4,302,269 | | |
| Reinvestment of dividends | | | 103,988 | | | | 881,820 | | | | 169,612 | | | | 1,378,944 | | |
| Redeemed | | | (1,965,245 | ) | | | (16,969,631 | ) | | | (1,777,046 | ) | | | (14,216,556 | ) | |
| Net decrease — Class A | | | (1,432,104 | ) | | | (12,461,744 | ) | | | (1,055,983 | ) | | | (8,535,343 | ) | |
| CLASS B SHARES | |
| Sold | | | 60,845 | | | | 525,360 | | | | 125,051 | | | | 994,385 | | |
| Reinvestment of dividends | | | 123,751 | | | | 1,043,224 | | | | 228,081 | | | | 1,842,896 | | |
| Redeemed | | | (2,036,711 | ) | | | (17,411,437 | ) | | | (2,328,546 | ) | | | (18,514,721 | ) | |
| Net decrease — Class B | | | (1,852,115 | ) | | | (15,842,853 | ) | | | (1,975,414 | ) | | | (15,677,440 | ) | |
| CLASS C SHARES | |
| Sold | | | 31,037 | | | | 264,787 | | | | 36,471 | | | | 290,797 | | |
| Reinvestment of dividends | | | 20,409 | | | | 171,845 | | | | 50,467 | | | | 407,269 | | |
| Redeemed | | | (709,518 | ) | | | (5,996,536 | ) | | | (723,256 | ) | | | (5,734,640 | ) | |
| Net decrease — Class C | | | (658,072 | ) | | | (5,559,904 | ) | | | (636,318 | ) | | | (5,036,574 | ) | |
| CLASS I SHARES | |
| Sold | | | 420,132 | | | | 3,643,885 | | | | 493,871 | | | | 3,977,450 | | |
| Reinvestment of dividends | | | 279,570 | | | | 2,373,549 | | | | 461,453 | | | | 3,756,231 | | |
| Redeemed | | | (3,552,113 | ) | | | (30,685,773 | ) | | | (4,550,956 | ) | | | (36,530,854 | ) | |
| Net decrease — Class I | | | (2,852,411 | ) | | | (24,668,339 | ) | | | (3,595,632 | ) | | | (28,797,173 | ) | |
| CLASS W SHARES | |
| Sold | | | 118 | | | | 1,000 | | | | — | | | | — | | |
| Net increase — Class W | | | 118 | | | | 1,000 | | | | — | | | | — | | |
| Net decrease in Fund | | | (6,794,584 | ) | | $ | (58,531,840 | ) | | | (7,263,347 | ) | | $ | (58,046,530 | ) | |
@@ The Fund will suspend offering its shares to new investors when the Fund's assets reach $1 billion. Following the general suspension of the offering of the Fund's shares to new investors, the Fund will continue to offer its shares to existing shareholders and may recommence offering its shares to other new investors in the future.
7. Expense Offset
The Fund has entered into an arrangement with State Street ("Custodian"), whereby credits realized on uninvested cash balances were used to offset a portion of the Fund's expenses. If applicable, these custodian credits are shown as "expense offset" in the Statement of Operations.
29
Morgan Stanley International Value Equity Fund
Notes to Financial Statements n August 31, 2011 continued
8. Purposes of and Risks Relating to Certain Financial Instruments
The Fund may lend securities to qualified financial institutions, such as broker-dealers, to earn additional income. Risks in securities lending transactions are that a borrower may not provide additional collateral when required or return the securities when due, and that the value of the short-term investments will be less than the amount of cash collateral plus any rebate that is required to be returned to the borrower.
At August 31, 2011, investments in securities of issuers in the United Kingdom and Japan were 35.9% and 23.8%, respectively, of the Fund's net assets. These investments, as well as other non-U.S. securities, may be affected by economic or political developments in these countries.
At August 31, 2011, the Fund's cash balance consisted of interest bearing deposits with the Fund's Custodian.
9. Federal Income Tax Status
The amount of dividends and distributions from net investment income and net realized capital gains are determined in accordance with federal income tax regulations which may differ from GAAP. These "book/tax" differences are either considered temporary or permanent in nature. To the extent these differences are permanent in nature, such amounts are reclassified within the capital accounts based on their federal tax-basis treatment; temporary differences do not require reclassification. Dividends and distributions which exceed net investment income and net realized capital gains for tax purposes are reported as distributions of paid-in-capital.
The tax character of distributions paid was as follows:
| | | FOR THE YEAR
ENDED
AUGUST 31, 2011 | | FOR THE YEAR
ENDED
AUGUST 31, 2010 | |
| Ordinary income | | $ | 4,555,364 | | | $ | 7,534,955 | | |
| As of August 31, 2011, the tax-basis components of accumulated losses were as follows: | |
| Undistributed ordinary income | | $ | 2,865,241 | | | | | | |
| Undistributed long-term gains | | | — | | | | | | |
| Net accumulated earnings | | | 2,865,241 | | | | | | |
| Capital loss carryforward | | | (94,569,641 | ) | | | | | |
| Temporary differences | | | (20,521 | ) | | | | | |
| Net unrealized depreciation | | | (9,319,400 | ) | | | | | |
| Total accumulated losses | | $ | (101,044,321 | ) | | | | | |
30
Morgan Stanley International Value Equity Fund
Notes to Financial Statements n August 31, 2011 continued
As of August 31, 2011, the Fund had a net capital loss carryforward of $94,569,641, to offset future capital gains to the extent provided by regulations, which will expire according to the following schedule.
| AMOUNT | | EXPIRATION | |
| $ | 10,993,096 | | | August 31, 2017 | |
| | 80,509,345 | | | August 31, 2018 | |
| | 3,067,200 | | | August 31, 2019 | |
As of August 31, 2011, the Fund had temporary book/tax differences primarily attributable to capital loss deferrals on wash sales and nondeductible expenses.
Permanent differences, primarily due to foreign currency gains, resulted in the following reclassifications among the Fund's components of net assets at August 31, 2011:
ACCUMULATED
UNDISTRIBUTED
NET INVESTMENT
INCOME | | ACCUMULATED
NET REALIZED
LOSS | | PAID-IN-CAPITAL | |
| $ | 90,157 | | | $ | (90,157 | ) | | | — | | |
10. Accounting Pronouncement
In May 2011, FASB issued Accounting Standards Update ("ASU") 2011-04. The amendments in this update are the results of the work of FASB and the International Accounting Standards Board to develop common requirements for measuring fair value and for disclosing information about fair value measurements, which are effective during interim and annual periods beginning after December 15, 2011. Consequently, these amendments improve the comparability of fair value measurements presented and disclosed in the financial statements prepared in accordance with U.S. GAAP and International Financial Reporting Standards. At this time, the Fund's management is evaluating the implications of ASU 2011-04.
31
Morgan Stanley International Value Equity Fund
Financial Highlights
Selected ratios and per share data for a share of beneficial interest outstanding throughout each period:
| | | FOR THE YEAR ENDED AUGUST 31, | |
| | | 2011 | | 2010^ | | 2009^ | | 2008^ | | 2007^ | |
| Class A Shares | |
| Selected Per Share Data: | |
| Net asset value, beginning of period | | $ | 7.49 | | | $ | 7.86 | | | $ | 10.26 | | | $ | 14.09 | | | $ | 14.06 | | |
| Income (loss) from investment operations: | |
| Net investment income(1) | | | 0.15 | | | | 0.12 | | | | 0.14 | | | | 0.21 | | | | 0.21 | | |
| Net realized and unrealized gain (loss) | | | 0.65 | | | | (0.29 | ) | | | (1.55 | ) | | | (1.63 | ) | | | 1.88 | | |
Total income (loss) from investment
operations | | | 0.80 | | | | (0.17 | ) | | | (1.41 | ) | | | (1.42 | ) | | | 2.09 | | |
| Less dividends and distributions from: | |
| Net investment income | | | (0.15 | ) | | | (0.20 | ) | | | (0.26 | ) | | | (0.14 | ) | | | (0.22 | ) | |
| Net realized gain | | | – | | | | – | | | | (0.73 | ) | | | (2.27 | ) | | | (1.84 | ) | |
| Total dividends and distributions | | | (0.15 | ) | | | (0.20 | ) | | | (0.99 | ) | | | (2.41 | ) | | | (2.06 | ) | |
| Net asset value, end of period | | $ | 8.14 | | | $ | 7.49 | | | $ | 7.86 | | | $ | 10.26 | | | $ | 14.09 | | |
| Total Return(2) | | | 10.62 | % | | | (2.35 | )% | | | (11.70 | )% | | | (12.36 | )% | | | 15.93 | % | |
| Ratios to Average Net Assets(3): | |
| Total expenses | | | 1.47 | %(4) | | | 1.51 | %(4) | | | 1.50 | %(4) | | | 1.36 | %(4) | | | 1.36 | %(4) | |
| Net investment income | | | 1.72 | %(4) | | | 1.48 | %(4) | | | 1.99 | %(4) | | | 1.72 | %(4) | | | 1.51 | %(4) | |
| Rebate from Morgan Stanley affiliate | | | 0.00 | %(5) | | | 0.00 | %(5) | | | 0.00 | %(5) | | | 0.00 | %(5) | | | 0.00 | %(5) | |
| Supplemental Data: | |
| Net assets, end of period, in thousands | | $ | 39,757 | | | $ | 47,304 | | | $ | 57,939 | | | $ | 89,770 | | | $ | 125,527 | | |
| Portfolio turnover rate | | | 29 | % | | | 36 | % | | | 25 | % | | | 36 | % | | | 29 | % | |
^ Beginning with the year ended August 31, 2011, the Fund was audited by Ernst & Young LLP. The previous years were audited by another independent registered public accounting firm.
(1) The per share amounts were computed using an average number of shares outstanding during the period.
(2) Does not reflect the deduction of sales charge. Calculated based on the net asset value as of the last business day of the period.
(3) Reflects overall Fund ratios for investment income and non-class specific expenses.
(4) The ratios reflect the rebate of certain Fund expenses in connection with investments in a Morgan Stanley affiliate during the period. The effect of the rebate on the ratios is disclosed in the above table as "Rebate from Morgan Stanley affiliate."
(5) Amount is less than 0.005%.
See Notes to Financial Statements
32
Morgan Stanley International Value Equity Fund
Financial Highlights continued
| | | FOR THE YEAR ENDED AUGUST 31, | |
| | | 2011 | | 2010^ | | 2009^ | | 2008^ | | 2007^ | |
| Class B Shares | |
| Selected Per Share Data: | |
| Net asset value, beginning of period | | $ | 7.45 | | | $ | 7.83 | | | $ | 10.24 | | | $ | 13.95 | | | $ | 13.89 | | |
| Income (loss) from investment operations: | |
| Net investment income(1) | | | 0.15 | | | | 0.12 | | | | 0.15 | | | | 0.22 | | | | 0.14 | | |
| Net realized and unrealized gain (loss) | | | 0.65 | | | | (0.29 | ) | | | (1.55 | ) | | | (1.61 | ) | | | 1.85 | | |
| Total income (loss) from investment operations | | | 0.80 | | | | (0.17 | ) | | | (1.40 | ) | | | (1.39 | ) | | | 1.99 | | |
| Less dividends and distributions from: | |
| Net investment income | | | (0.16 | ) | | | (0.21 | ) | | | (0.28 | ) | | | (0.05 | ) | | | (0.09 | ) | |
| Net realized gain | | | – | | | | – | | | | (0.73 | ) | | | (2.27 | ) | | | (1.84 | ) | |
| Total dividends and distributions | | | (0.16 | ) | | | (0.21 | ) | | | (1.01 | ) | | | (2.32 | ) | | | (1.93 | ) | |
| Net asset value, end of period | | $ | 8.09 | | | $ | 7.45 | | | $ | 7.83 | | | $ | 10.24 | | | $ | 13.95 | | |
| Total Return(2) | | | 10.60 | % | | | (2.33 | )% | | | (11.61 | )% | | | (12.18 | )% | | | 15.32 | % | |
| Ratios to Average Net Assets(3): | |
| Total expenses | | | 1.45 | %(4) | | | 1.45 | %(4) | | | 1.34 | %(4) | | | 1.25 | %(4) | | | 1.89 | %(4) | |
| Net investment income | | | 1.74 | %(4) | | | 1.54 | %(4) | | | 2.15 | %(4) | | | 1.83 | %(4) | | | 0.98 | %(4) | |
| Rebate from Morgan Stanley affiliate | | | 0.00 | %(5) | | | 0.00 | %(5) | | | 0.00 | %(5) | | | 0.00 | %(5) | | | 0.00 | %(5) | |
| Supplemental Data: | |
| Net assets, end of period, in thousands | | $ | 46,832 | | | $ | 56,906 | | | $ | 75,250 | | | $ | 122,494 | | | $ | 184,035 | | |
| Portfolio turnover rate | | | 29 | % | | | 36 | % | | | 25 | % | | | 36 | % | | | 29 | % | |
^ Beginning with the year ended August 31, 2011, the Fund was audited by Ernst & Young LLP. The previous years were audited by another independent registered public accounting firm.
(1) The per share amounts were computed using an average number of shares outstanding during the period.
(2) Does not reflect the deduction of sales charge. Calculated based on the net asset value as of the last business day of the period.
(3) Reflects overall Fund ratios for investment income and non-class specific expenses.
(4) The ratios reflect the rebate of certain Fund expenses in connection with investments in a Morgan Stanley affiliate during the period. The effect of the rebate on the ratios is disclosed in the above table as "Rebate from Morgan Stanley affiliate."
(5) Amount is less than 0.005%.
See Notes to Financial Statements
33
Morgan Stanley International Value Equity Fund
Financial Highlights continued
| | | FOR THE YEAR ENDED AUGUST 31, | |
| | | 2011 | | 2010^ | | 2009^ | | 2008^ | | 2007^ | |
| Class C Shares | |
| Selected Per Share Data: | |
| Net asset value, beginning of period | | $ | 7.39 | | | $ | 7.76 | | | $ | 10.06 | | | $ | 13.84 | | | $ | 13.83 | | |
| Income (loss) from investment operations: | |
| Net investment income(1) | | | 0.08 | | | | 0.06 | | | | 0.09 | | | | 0.12 | | | | 0.11 | | |
| Net realized and unrealized gain (loss) | | | 0.66 | | | | (0.29 | ) | | | (1.51 | ) | | | (1.60 | ) | | | 1.85 | | |
| Total income (loss) from investment operations | | | 0.74 | | | | (0.23 | ) | | | (1.42 | ) | | | (1.48 | ) | | | 1.96 | | |
| Less dividends and distributions from: | |
| Net investment income | | | (0.08 | ) | | | (0.14 | ) | | | (0.15 | ) | | | (0.03 | ) | | | (0.11 | ) | |
| Net realized gain | | | – | | | | – | | | | (0.73 | ) | | | (2.27 | ) | | | (1.84 | ) | |
| Total dividends and distributions | | | (0.08 | ) | | | (0.14 | ) | | | (0.88 | ) | | | (2.30 | ) | | | (1.95 | ) | |
| Net asset value, end of period | | $ | 8.05 | | | $ | 7.39 | | | $ | 7.76 | | | $ | 10.06 | | | $ | 13.84 | | |
| Total Return(2) | | | 9.91 | % | | | (3.15 | )% | | | (12.38 | )% | | | (12.97 | )% | | | 15.17 | % | |
| Ratios to Average Net Assets(3): | |
| Total expenses | | | 2.21 | %(4) | | | 2.26 | %(4) | | | 2.25 | %(4) | | | 2.08 | %(4) | | | 2.06 | %(4) | |
| Net investment income | | | 0.98 | %(4) | | | 0.73 | %(4) | | | 1.24 | %(4) | | | 1.00 | %(4) | | | 0.81 | %(4) | |
| Rebate from Morgan Stanley affiliate | | | 0.00 | %(5) | | | 0.00 | %(5) | | | 0.00 | %(4) | | | 0.00 | %(5) | | | 0.00 | %(5) | |
| Supplemental Data: | |
| Net assets, end of period, in thousands | | $ | 15,741 | | | $ | 19,328 | | | $ | 25,217 | | | $ | 41,975 | | | $ | 66,486 | | |
| Portfolio turnover rate | | | 29 | % | | | 36 | % | | | 25 | % | | | 36 | % | | | 29 | % | |
^ Beginning with the year ended August 31, 2011, the Fund was audited by Ernst & Young LLP. The previous years were audited by another independent registered public accounting firm.
(1) The per share amounts were computed using an average number of shares outstanding during the period.
(2) Does not reflect the deduction of sales charge. Calculated based on the net asset value as of the last business day of the period.
(3) Reflects overall Fund ratios for investment income and non-class specific expenses.
(4) The ratios reflect the rebate of certain Fund expenses in connection with investments in a Morgan Stanley affiliate during the period. The effect of the rebate on the ratios is disclosed in the above table as "Rebate from Morgan Stanley affiliate."
(5) Amount is less than 0.005%.
See Notes to Financial Statements
34
Morgan Stanley International Value Equity Fund
Financial Highlights continued
| | | FOR THE YEAR ENDED AUGUST 31, | |
| | | 2011 | | 2010^ | | 2009^ | | 2008^ | | 2007^ | |
| Class I Shares | |
| Selected Per Share Data: | |
| Net asset value, beginning of period | | $ | 7.52 | | | $ | 7.89 | | | $ | 10.32 | | | $ | 14.16 | | | $ | 14.12 | | |
| Income (loss) from investment operations: | |
| Net investment income(1) | | | 0.17 | | | | 0.14 | | | | 0.16 | | | | 0.24 | | | | 0.25 | | |
| Net realized and unrealized gain (loss) | | | 0.65 | | | | (0.29 | ) | | | (1.56 | ) | | | (1.63 | ) | | | 1.88 | | |
| Total income (loss) from investment operations | | | 0.82 | | | | (0.15 | ) | | | (1.40 | ) | | | (1.39 | ) | | | 2.13 | | |
| Less dividends and distributions from: | |
| Net investment income | | | (0.17 | ) | | | (0.22 | ) | | | (0.30 | ) | | | (0.18 | ) | | | (0.25 | ) | |
| Net realized gain | | | – | | | | – | | | | (0.73 | ) | | | (2.27 | ) | | | (1.84 | ) | |
| Total dividends and distributions | | | (0.17 | ) | | | (0.22 | ) | | | (1.03 | ) | | | (2.45 | ) | | | (2.09 | ) | |
| Net asset value, end of period | | $ | 8.17 | | | $ | 7.52 | | | $ | 7.89 | | | $ | 10.32 | | | $ | 14.16 | | |
| Total Return(2) | | | 10.88 | % | | | (2.10 | )% | | | (11.44 | )% | | | (12.14 | )% | | | 16.20 | % | |
| Ratios to Average Net Assets(3): | |
| Total expenses | | | 1.22 | %(4) | | | 1.26 | %(4) | | | 1.25 | %(4) | | | 1.11 | %(4) | | | 1.12 | %(4) | |
| Net investment income | | | 1.97 | %(4) | | | 1.73 | %(4) | | | 2.24 | %(4) | | | 1.97 | %(4) | | | 1.75 | %(4) | |
| Rebate from Morgan Stanley affiliate | | | 0.00 | %(5) | | | 0.00 | %(5) | | | 0.00 | %(5) | | | 0.00 | %(5) | | | 0.00 | %(5) | |
| Supplemental Data: | |
| Net assets, end of period, in thousands | | $ | 96,576 | | | $ | 110,313 | | | $ | 144,113 | | | $ | 283,181 | | | $ | 436,827 | | |
| Portfolio turnover rate | | | 29 | % | | | 36 | % | | | 25 | % | | | 36 | % | | | 29 | % | |
^ Beginning with the year ended August 31, 2011, the Fund was audited by Ernst & Young LLP. The previous years were audited by another independent registered public accounting firm.
(1) The per share amounts were computed using an average number of shares outstanding during the period.
(2) Calculated based on the net asset value as of the last business day of the period.
(3) Reflects overall Fund ratios for investment income and non-class specific expenses.
(4) The ratios reflect the rebate of certain Fund expenses in connection with investments in a Morgan Stanley affiliate during the period. The effect of the rebate on the ratios is disclosed in the above table as "Rebate from Morgan Stanley affiliate."
(5) Amount is less than 0.005%.
See Notes to Financial Statements
35
Morgan Stanley International Value Equity Fund
Financial Highlights continued
| | | FOR THE YEAR ENDED AUGUST 31, | | FOR THE PERIOD
MARCH 31, 2008(1) | |
| | | | | THROUGH | |
| | | 2011 | | 2010^ | | 2009^ | | AUGUST 31, 2008^ | |
| Class R Shares | |
| Selected Per Share Data: | |
| Net asset value, beginning of period | | $ | 7.44 | | | $ | 7.81 | | | $ | 10.25 | | | $ | 11.17 | | |
| Net income from investment operations: | |
| Net investment income(2) | | | 0.13 | | | | 0.10 | | | | 0.13 | | | | 0.10 | | |
| Net realized and unrealized gain (loss) | | | 0.65 | | | | (0.28 | ) | | | (1.56 | ) | | | (1.02 | ) | |
| Total income (loss) from investment operations | | | 0.78 | | | | (0.18 | ) | | | (1.43 | ) | | | (0.92 | ) | |
| Less dividends and distributions from: | |
| Net investment income | | | (0.14 | ) | | | (0.19 | ) | | | (0.28 | ) | | | – | | |
| Net realized gain | | | – | | | | – | | | | (0.73 | ) | | | – | | |
| Total dividends and distributions | | | (0.14 | ) | | | (0.19 | ) | | | (1.01 | ) | | | – | | |
| Net asset value, end of period | | $ | 8.08 | | | $ | 7.44 | | | $ | 7.81 | | | $ | 10.25 | | |
| Total Return(3) | | | 10.34 | % | | | (2.52 | )% | | | (11.94 | )% | | | (8.24 | )%(7) | |
| Ratios to Average Net Assets(4): | |
| Total expenses | | | 1.72 | %(5) | | | 1.76 | %(5) | | | 1.75 | %(5) | | | 1.61 | %(5)(8) | |
| Net investment income | | | 1.47 | %(5) | | | 1.23 | %(5) | | | 1.74 | %(5) | | | 2.18 | %(5)(8) | |
| Rebate from Morgan Stanley affiliate | | | 0.00 | %(6) | | | 0.00 | %(6) | | | 0.00 | %(6) | | | 0.00 | %(6)(8) | |
| Supplemental Data: | |
| Net assets, end of period, in thousands | | $ | 84 | | | $ | 77 | | | $ | 81 | | | $ | 92 | | |
| Portfolio turnover rate | | | 29 | % | | | 36 | % | | | 25 | % | | | 36 | % | |
^ Beginning with the year ended August 31, 2011, the Fund was audited by Ernst & Young LLP. The previous years were audited by another independent registered public accounting firm.
(1) The date shares were first issued.
(2) The per share amounts were computed using an average number of shares outstanding during the period.
(3) Calculated based on the net asset value as of the last business day of the period.
(4) Reflects overall Fund ratios for investment income and non-class specific expenses.
(5) The ratios reflect the rebate of certain Fund expenses in connection with investments in a Morgan Stanley affiliate during the period. The effect of the rebate on the ratios is disclosed in the above table as "Rebate from Morgan Stanley affiliate."
(6) Amount is less than 0.005%.
(7) Not annualized.
(8) Annualized.
See Notes to Financial Statements
36
Morgan Stanley International Value Equity Fund
Financial Highlights continued
| | | FOR THE YEAR ENDED AUGUST 31, | | FOR THE PERIOD
MARCH 31, 2008(1) | |
| | | | | THROUGH | |
| | | 2011 | | 2010^ | | 2009^ | | AUGUST 31, 2008^ | |
| Class W Shares | |
| Selected Per Share Data: | |
| Net asset value, beginning of period | | $ | 7.45 | | | $ | 7.82 | | | $ | 10.26 | | | $ | 11.17 | | |
| Income (loss) from investment operations: | |
| Net investment income(2) | | | 0.14 | | | | 0.11 | | | | 0.14 | | | | 0.11 | | |
| Net realized and unrealized gain (loss) | | | 0.65 | | | | (0.28 | ) | | | (1.56 | ) | | | (1.02 | ) | |
| Total income (loss) from investment operations | | | 0.79 | | | | (0.17 | ) | | | (1.42 | ) | | | (0.91 | ) | |
| Less dividends and distributions from: | |
| Net investment income | | | (0.15 | ) | | | (0.20 | ) | | | (0.29 | ) | | | – | | |
| Net realized gain | | | – | | | | – | | | | (0.73 | ) | | | – | | |
| Total dividends and distributions | | | (0.15 | ) | | | (0.20 | ) | | | (1.02 | ) | | | – | | |
| Net asset value, end of period | | $ | 8.09 | | | $ | 7.45 | | | $ | 7.82 | | | $ | 10.26 | | |
| Total Return(3) | | | 10.49 | % | | | (2.40 | )% | | | (11.83 | )% | | | (8.15 | )%(7) | |
| Ratios to Average Net Assets(4): | |
| Total expenses | | | 1.57 | %(5) | | | 1.61 | %(5) | | | 1.60 | %(5) | | | 1.46 | %(5)(8) | |
| Net investment income | | | 1.62 | %(5) | | | 1.38 | %(5) | | | 1.89 | %(5) | | | 2.33 | %(5)(8) | |
| Rebate from Morgan Stanley affiliate | | | 0.00 | %(6) | | | 0.00 | %(6) | | | 0.00 | %(6) | | | 0.00 | %(6)(8) | |
| Supplemental Data: | |
| Net assets, end of period, in thousands | | $ | 85 | | | $ | 77 | | | $ | 81 | | | $ | 92 | | |
| Portfolio turnover rate | | | 29 | % | | | 36 | % | | | 25 | % | | | 36 | % | |
^ Beginning with the year ended August 31, 2011, the Fund was audited by Ernst & Young LLP. The previous years were audited by another independent registered public accounting firm.
(1) The date shares were first issued.
(2) The per share amounts were computed using an average number of shares outstanding during the period.
(3) Calculated based on the net asset value as of the last business day of the period.
(4) Reflects overall Fund ratios for investment income and non-class specific expenses.
(5) The ratios reflect the rebate of certain Fund expenses in connection with investments in a Morgan Stanley affiliate during the period. The effect of the rebate on the ratios is disclosed in the above table as "Rebate from Morgan Stanley affiliate."
(6) Amount is less than 0.005%.
(7) Not annualized.
(8) Annualized.
See Notes to Financial Statements
37
Morgan Stanley International Value Equity Fund
Report of Independent Registered Public Accounting Firm
To the Shareholders and Board of Trustees of
Morgan Stanley International Value Equity Fund:
We have audited the accompanying statement of assets and liabilities of Morgan Stanley International Value Equity Fund (the "Fund"), including the portfolio of investments, as of August 31, 2011, and the related statement of operations and changes in net assets, and financial highlights for the year then ended. These financial statements and financial highlights are the responsibility of the Fund's management. Our responsibility is to express an opinion on these financial statements and financial highlights based on our audit. The statement of changes in net assets for the year ended August 31, 2010 and the financial highlights for periods ended prior to September 1, 2010 were audited by another independent registered public accounting firm whose report, dated October 26, 2010, expressed an unqualified opinion on that statement of changes in net assets and those financial highlights.
We conducted our audit in accordance with the standards of the Public Company Accounting Oversight Board (United States). Those standards require that we plan and perform the audit to obtain reasonable assurance about whether the financial statements and financial highlights are free of material misstatement. The Fund was not required to have, nor were we engaged to perform, an audit of its internal control over financial reporting. Our audit included consideration of internal control over financial reporting as a basis for designing audit procedures that are appropriate in the circumstances, but not for the purpose of expressing an opinion on the effectiveness of the Fund's internal control over financial reporting. Accordingly, we express no such opinion. An audit also includes examining, on a test basis, evidence supporting the amounts and disclosures in the financial statements, assessing the accounting principles used and significant estimates made by management, as well as evaluating the overall financial statement presentation. Our procedures included confirmation of securities owned as of August 31, 2011, by correspondence with the custodian and others or by other appropriate auditing procedures where replies from others were not received. We believe that our audit provides a reasonable basis for our opinion.
In our opinion, the financial statements and financial highlights referred to above present fairly, in all material respects, the financial position of Morgan Stanley International Value Equity Fund as of August 31, 2011, the results of its operations, the changes in its net assets, and the financial highlights for the year then ended, in conformity with U.S. generally accepted accounting principles.

Boston, Massachusetts
October 24, 2011
38
Morgan Stanley International Value Equity Fund
Change in Independent Registered Public Accounting Firm (unaudited)
On June 7, 2011, Deloitte & Touche LLP were dismissed as the independent Registered Public Accounting Firm of the Fund.
The reports of Deloitte & Touche LLP on the financial statements of the Fund for the past two fiscal years contained no adverse opinion or disclaimer of opinion and were not qualified or modified as to uncertainty, audit scope or accounting principle.
In connection with its audits for the two most recent fiscal years, there have been no disagreements with Deloitte & Touche LLP on any matter of accounting principles or practices, financial statement disclosure, or auditing scope or procedure, which disagreements, if not resolved to the satisfaction of Deloitte & Touche LLP, would have caused them to make reference thereto in their reports on the financial statements for such years.
On June 7, 2011, the Fund, with the approval of its Board of Trustees and its Audit Committee, engaged Ernst & Young LLP as its new independent Registered Public Accounting Firm.
39
Morgan Stanley International Value Equity Fund
An Important Notice Concerning Our U.S. Privacy Policy (unaudited)
We are required by federal law to provide you with a copy of our privacy policy ("Policy") annually.
This Policy applies to current and former individual clients of Morgan Stanley Distribution, Inc., as well as current and former individual investors in Morgan Stanley mutual funds and related companies.
This Policy is not applicable to partnerships, corporations, trusts or other non-individual clients or account holders, nor is this Policy applicable to individuals who are either beneficiaries of a trust for which we serve as trustee or participants in an employee benefit plan administered or advised by us. This Policy is, however, applicable to individuals who select us to be a custodian of securities or assets in individual retirement accounts, 401(k) accounts, 529 Educational Savings Accounts, accounts subject to the Uniform Gifts to Minors Act, or similar accounts. We may amend this Policy at any time, and will inform you of any changes to this Policy as required by law.
We Respect Your Privacy
We appreciate that you have provided us with your personal financial information and understand your concerns about safeguarding such information. We strive to maintain the privacy of such information while we help you achieve your financial objectives. This Policy describes what nonpublic personal information we collect about you, how we collect it, when we may share it with others, and how others may use it. It discusses the steps you may take to limit our sharing of information about you with affiliated Morgan Stanley companies ("affiliated companies"). It also discloses how you may limit our affiliates' use of shared information for marketing purposes. Throughout this Policy, we refer to the nonpublic information that personally identifies you or your accounts as "personal information."
1. What Personal Information Do We Collect About You?
To better serve you and manage our business, it is important that we collect and maintain accurate information about you. We obtain this information from applications and other forms you submit to us, from your dealings with us, from consumer reporting agencies, from our websites and from third parties and other sources.
For example:
• We collect information such as your name, address, e-mail address, telephone/fax numbers, assets, income and investment objectives through application forms you submit to us.
• We may obtain information about account balances, your use of account(s) and the types of products and services you prefer to receive from us through your dealings and transactions with us and other sources.
• We may obtain information about your creditworthiness and credit history from consumer reporting agencies.
• We may collect background information from and through third-party vendors to verify representations you have made and to comply with various regulatory requirements.
40
Morgan Stanley International Value Equity Fund
An Important Notice Concerning Our U.S. Privacy Policy (unaudited) continued
• If you interact with us through our public and private Web sites, we may collect information that you provide directly through online communications (such as an e-mail address). We may also collect information about your Internet service provider, your domain name, your computer's operating system and Web browser, your use of our Web sites and your product and service preferences, through the use of ''cookies.'' ''Cookies'' recognize your computer each time you return to one of our sites, and help to improve our sites' content and personalize your experience on our sites by, for example, suggesting offerings that may interest you. Please consult the Terms of Use of these sites for more details on our use of cookies.
2. When Do We Disclose Personal Information We Collect About You?
To provide you with the products and services you request, to better serve you, to manage our business and as otherwise required or permitted by law, we may disclose personal information we collect about you to other affiliated companies and to nonaffiliated third parties.
a. Information We Disclose to Our Affiliated Companies. In order to manage your account(s) effectively, including servicing and processing your transactions, to let you know about products and services offered by us and affiliated companies, to manage our business, and as otherwise required or permitted by law, we may disclose personal information about you to other affiliated companies. Offers for products and services from affiliated companies are developed under conditions designed to safeguard your personal information.
b. Information We Disclose to Third Parties. We do not disclose personal information that we collect about you to nonaffiliated third parties except to enable them to provide marketing services on our behalf, to perform joint marketing agreements with other financial institutions, and as otherwise required or permitted by law. For example, some instances where we may disclose information about you to third parties include: for servicing and processing transactions, to offer our own products and services, to protect against fraud, for institutional risk control, to respond to judicial process or to perform services on our behalf. When we share personal information with a nonaffiliated third party, they are required to limit their use of personal information about you to the particular purpose for which it was shared and they are not allowed to share personal information about you with others except to fulfill that limited purpose or as may be required by law.
3. How Do We Protect The Security and Confidentiality Of Personal Information We Collect About You?
We maintain physical, electronic and procedural security measures to help safeguard the personal information we collect about you. We have internal policies governing the proper handling of client information. Third parties that provide support or marketing services on our behalf may also receive personal information about you, and we require them to adhere to confidentiality standards with respect to such information.
41
Morgan Stanley International Value Equity Fund
An Important Notice Concerning Our U.S. Privacy Policy (unaudited) continued
4. How Can You Limit Our Sharing Of Certain Personal Information About You With Our Affiliated Companies For Eligibility Determination?
We respect your privacy and offer you choices as to whether we share with our affiliated companies personal information that was collected to determine your eligibility for products and services such as credit reports and other information that you have provided to us or that we may obtain from third parties ("eligibility information"). Please note that, even if you direct us not to share certain eligibility information with our affiliated companies, we may still share your personal information, including eligibility information, with those companies under circumstances that are permitted under applicable law, such as to process transactions or to service your account. We may also share certain other types of personal information with affiliated companies — such as your name, address, telephone number, e-mail address and account number(s), and information about your transactions and experiences with us.
5. How Can You Limit the Use of Certain Personal Information About You by our Affiliated Companies for Marketing?
You may limit our affiliated companies from using certain personal information about you that we may share with them for marketing their products or services to you. This information includes our transactions and other experiences with you such as your assets and account history. Please note that, even if you choose to limit our affiliated companies from using certain personal information about you that we may share with them for marketing their products and services to you, we may still share such personal information about you with them, including our transactions and experiences with you, for other purposes as permitted under applicable law.
6. How Can You Send Us an Opt-Out Instruction?
If you wish to limit our sharing of certain personal information about you with our affiliated companies for "eligibility purposes" and for our affiliated companies' use in marketing products and services to you as described in this notice, you may do so by:
• Calling us at (800) 869-6397
Monday – Friday between 8a.m. and 6p.m. (EST)
• Writing to us at the following address:
Morgan Stanley Privacy Department
Harborside Financial Center
201 Plaza Two, 3rd Floor
Jersey City, NJ 07311
42
Morgan Stanley International Value Equity Fund
An Important Notice Concerning Our U.S. Privacy Policy (unaudited) continued
If you choose to write to us, your written request should include: your name, address, telephone number and account number(s) to which the opt-out applies and should not be sent with any other correspondence. In order to process your request, we require that the request be provided by you directly and not through a third party. Once you have informed us about your privacy preferences, your opt-out preference will remain in effect with respect to this Policy (as it may be amended) until you notify us otherwise. If you are a joint account owner, we will accept instructions from any one of you and apply those instructions to the entire account. Please allow approximately 30 days from our receipt of your opt-out for your instructions to become effective.
Please understand that if you opt-out, you and any joint account holders may not receive certain Morgan Stanley or our affiliated companies' products and services that could help you manage your financial resources and achieve your investment objectives.
If you have more than one account with us or our affiliates, you may receive multiple privacy policies from us, and would need to follow the directions stated in each particular policy for each account you have with us.
7. What if an affiliated company becomes a nonaffiliated third party?
If, at any time in the future, an affiliated company becomes a nonaffiliated third party, further disclosures of personal information made to the former affiliated company will be limited to those described in Section 2(b) above relating to nonaffiliated third parties. If you elected under Section 6 to limit disclosures we make to affiliated companies, or use of personal information by affiliated companies, your election will not apply to use by any former affiliated company of your personal information in their possession once it becomes a nonaffiliated third party.
Special Notice to Residents of Vermont
This section supplements our Policy with respect to our individual clients who have a Vermont address and supersedes anything to the contrary in the above Policy with respect to those clients only.
The State of Vermont requires financial institutions to obtain your consent prior to sharing personal information that they collect about you with affiliated companies and nonaffiliated third parties other than in certain limited circumstances. Except as permitted by law, we will not share personal information we collect about you with nonaffiliated third parties or other affiliated companies unless you provide us with your written consent to share such information ("opt-in").
43
Morgan Stanley International Value Equity Fund
An Important Notice Concerning Our U.S. Privacy Policy (unaudited) continued
If you wish to receive offers for investment products and services offered by or through other affiliated companies, please notify us in writing at the following address:
Morgan Stanley Privacy Department
Harborside Financial Center
201 Plaza Two, 3rd Floor
Jersey City, NJ 07311
Your authorization should include: your name, address, telephone number and account number(s) to which the opt-in applies and should not be sent with any other correspondence. In order to process your authorization, we require that the authorization be provided by you directly and not through a third-party.
Special Notice to Residents of California
The following section supplements our Policy with respect to our individual clients who have a California address and supersedes anything to the contrary in the above Policy with respect to those clients only.
In response to a California law, if your account has a California home address, your personal information will not be disclosed to nonaffiliated third parties except as permitted by applicable California law, and we will limit sharing such personal information with our affiliates to comply with California privacy laws that apply to us.
44
Morgan Stanley International Value Equity Fund
Trustee and Officer Information (unaudited)
Independent Trustees:
Name, Age and Address of
Independent Trustee | | Position(s)
Held with
Registrant | | Term of
Office and
Length of
Time Served* | | Principal Occupation(s)
During Past 5 Years | | Number of
Portfolios
in Fund
Complex
Overseen by
Independent
Trustee** | | Other Directorships
Held by Independent Trustee*** | |
Frank L. Bowman (66)
c/o Kramer Levin Naftalis & Frankel LLP
Counsel to the Independent Trustees
1177 Avenue of the Americas
New York, NY 10036 | | Trustee | | Since
August 2006 | | President, Strategic Decisions, LLC (consulting) (since February 2009); Director or Trustee of various Morgan Stanley Funds (since August 2006); Chairperson of the Insurance Sub-Committee of the Compliance and Insurance Committee (since February 2007); served as President and Chief Executive Officer of the Nuclear Energy Institute (policy organization) (February 2005 through November 2008); retired as Admiral, U.S. Navy after serving over 38 years on active duty including 8 years as Director of the Naval Nuclear Propulsion Program in the Department of the Navy and the U.S. Department of Energy (1996-2004); served as Chief of Naval Personnel (July 1994-September 1996) and on the joint staff as Director of Political-Military Affairs (June 1992 to July 1994); Knighted as Honorary Knight Commander of the Most Excellent Order of the British Empire; Awarded the Officer de l'Orde National du Mérite by the French Government; elected to the National Academy of Engineering (2009). | | | 102 | | | Director of BP p.l.c.; Director of Naval and Nuclear Technologies LLP; Director of the Armed Services YMCA of the USA and the Naval Submarine League; Director of the American Shipbuilding Suppliers Association; Member of the National Security Advisory Council of the Center for U.S. Global Engagement and a member of the CNA military Advisory Board. | |
|
Michael Bozic (70)
c/o Kramer Levin Naftalis & Frankel LLP
Counsel to the Independent Trustees
1177 Avenue of the Americas
New York, NY 10036 | | Trustee | | Since
April 1994 | | Private investor; Chairperson of the Compliance and Insurance Committee (since October 2006); Director or Trustee of various Morgan Stanley Funds (since April 1994); formerly, Chairperson of the Insurance Committee (July 2006-September 2006); Vice Chairman of Kmart Corporation (December 1998-October 2000), Chairman and Chief Executive Officer of Levitz Furniture Corporation (November 1995-November 1998) and President and Chief Executive Officer of Hills Department Stores (May 1991-July 1995); variously Chairman, Chief Executive Officer, President and Chief Operating Officer (1987-1991) of the Sears Merchandise Group of Sears, Roebuck & Co. | | | 104 | | | Director of various business
organizations. | |
|
45
Morgan Stanley International Value Equity Fund
Trustee and Officer Information (unaudited) continued
Name, Age and Address of
Independent Trustee | | Position(s)
Held with
Registrant | | Term of
Office and
Length of
Time Served* | | Principal Occupation(s)
During Past 5 Years | | Number of
Portfolios
in Fund
Complex
Overseen by
Independent
Trustee** | | Other Directorships
Held by Independent Trustee*** | |
Kathleen A. Dennis (58)
c/o Kramer Levin Naftalis & Frankel LLP
Counsel to the Independent Trustees
1177 Avenue of the Americas
New York, NY 10036 | | Trustee | | Since
August 2006 | | President, Cedarwood Associates (mutual fund and investment management consulting) (since July 2006); Chairperson of the Money Market and Alternatives Sub-Committee of the Investment Committee (since October 2006) and Director or Trustee of various Morgan Stanley Funds (since August 2006); formerly, Senior Managing Director of Victory Capital Management (1993-2006). | | | 102 | | | Director of various non-profit organizations. | |
|
Dr. Manuel H. Johnson (62)
c/o Johnson Smick Group, Inc.
888 16th Street, N.W.
Suite 740
Washington, D.C. 20006 | | Trustee | | Since
July 1991 | | Senior Partner, Johnson Smick International, Inc. (consulting firm); Chairperson of the Investment Committee (since October 2006) and Director or Trustee of various Morgan Stanley Funds (since July 1991); Co-Chairman and a founder of the Group of Seven Council (G7C) (international economic commission); formerly, Chairperson of the Audit Committee (July 1991-September 2006), Vice Chairman of the Board of Governors of the Federal Reserve System and Assistant Secretary of the U.S. Treasury. | | | 104 | | | Director of NVR, Inc. (home construction); Director of Evergreen Energy; Director of Greenwich Capital Holdings. | |
|
Joseph J. Kearns (69)
c/o Kearns & Associates LLC
PMB754
22631 Pacific Coast Highway
Malibu, CA 90265 | | Trustee | | Since
August 1994 | | President, Kearns & Associates LLC (investment consulting); Chairperson of the Audit Committee (since October 2006) and Director or Trustee of various Morgan Stanley Funds (since August 1994); formerly, Deputy Chairperson of the Audit Committee (July 2003-September 2006) and Chairperson of the Audit Committee of various Morgan Stanley Funds (since August 1994); CFO of the J. Paul Getty Trust. | | | 105 | | | Director of Electro Rent Corporation (equipment leasing) and The Ford Family Foundation. | |
|
46
Morgan Stanley International Value Equity Fund
Trustee and Officer Information (unaudited) continued
Name, Age and Address of
Independent Trustee | | Position(s)
Held with
Registrant | | Term of
Office and
Length of
Time Served* | | Principal Occupation(s)
During Past 5 Years | | Number of
Portfolios
in Fund
Complex
Overseen by
Independent
Trustee** | | Other Directorships
Held by Independent Trustee*** | |
Michael F. Klein (52)
c/o Kramer Levin Naftalis & Frankel LLP
Counsel to the Independent Trustees
1177 Avenue of the Americas
New York, NY 10036 | | Trustee | | Since
August 2006 | | Managing Director, Aetos Capital, LLC (since March 2000) and Co-President, Aetos Alternatives Management, LLC (since January 2004); Chairperson of the Fixed Income Sub-Committee of the Investment Committee (since October 2006) and Director or Trustee of various Morgan Stanley Funds (since August 2006); formerly, Managing Director, Morgan Stanley & Co. LLC. and Morgan Stanley Dean Witter Investment Management, President, various Morgan Stanley Funds (June 1998-March 2000) and Principal, Morgan Stanley & Co. LLC. and Morgan Stanley Dean Witter Investment Management (August 1997-December 1999). | | | 102 | | | Director of certain investment funds managed or sponsored by Aetos Capital, LLC. Director of Sanitized AG and Sanitized Marketing AG (specialty chemicals). | |
|
Michael E. Nugent (75)
c/o Triumph Capital, L.P.
445 Park Avenue
New York, NY 10022 | | Chairperson of the Board and Trustee | | Chairperson of the Boards since July 2006 and Trustee since July 1991 | | General Partner, Triumph Capital, L.P. (private investment partnership); Chairperson of the Boards of various Morgan Stanley Funds (since July 2006); Director or Trustee of the various Morgan Stanley Funds (since July 1991); formerly, Chairperson of the Insurance Committee (until July 2006). | | | 104 | | | None. | |
|
47
Morgan Stanley International Value Equity Fund
Trustee and Officer Information (unaudited) continued
Name, Age and Address of
Independent Trustee | | Position(s)
Held with
Registrant | | Term of
Office and
Length of
Time Served* | | Principal Occupation(s)
During Past 5 Years | | Number of
Portfolios
in Fund
Complex
Overseen by
Independent
Trustee** | | Other Directorships
Held by Independent Trustee*** | |
W. Allen Reed (64)
c/o Kramer Levin Naftalis & Frankel LLP
Counsel to the Independent Trustees
1177 Avenue of the Americas
New York, NY 10036 | | Trustee | | Since
August 2006 | | Chairperson of the Equity Sub-Committee of the Investment Committee (since October 2006) and Director or Trustee of various Morgan Stanley Funds (since August 2006); formerly, President and CEO of General Motors Asset Management; Chairman and Chief Executive Officer of the GM Trust Bank and Corporate Vice President of General Motors Corporation (August 1994-December 2005). | | | 102 | | | Director of Temple-Inland Industries (packaging and forest products); Director of Legg Mason, Inc. and Director of the Auburn University Foundation; formerly, Director of iShares, Inc. (2001-2006). | |
|
Fergus Reid (79)
c/o Joe Pietryka, Inc.
85 Charles Colman Blvd.
Pawling, NY 12564 | | Trustee | | Since
June 1992 | | Chairman, Joe Pietryka, Inc.; Chairperson of the Governance Committee and Director or Trustee of various Morgan Stanley Funds (since June 1992). | | | 105 | | | Trustee and Director of certain investment companies in the JPMorgan Funds complex managed by JP Morgan Investment Management Inc. | |
|
Interested Trustee:
Name, Age and Address of
Interested Trustee | | Position(s)
Held with
Registrant | | Length of
Time Served* | | Principal Occupation(s)
During Past 5 Years | | Number of
Portfolios
in Fund
Complex
Overseen by
Interested
Trustee** | | Other Directorships
Held by Interested Trustee*** | |
James F. Higgins (63)
c/o Morgan Stanley Services Company Inc.
Harborside Financial Center
201 Plaza Two
Jersey City, NJ 07311 | | Trustee | | Since
June 2000 | | Director or Trustee of various Morgan Stanley Funds (since June 2000); Senior Advisor of Morgan Stanley (since August 2000). | | | 103 | | | Director of AXA Financial, Inc. and The Equitable Life Assurance Society of the United States (financial services). | |
|
* Each Trustee serves an indefinite term, until his or her successor is elected.
** The Fund Complex includes all open-end and closed-end funds (including all of their portfolios) advised by Morgan Stanley Investment Management Inc. (the "Adviser") (as of December 31, 2010) and any funds that have an adviser that is an affiliated person of the Adviser (including but not limited to Morgan Stanley AIP GP LP).
��*** This includes any directorships at public companies and registered investment companies held by the Trustee at any time during the past five years.
48
Morgan Stanley International Value Equity Fund
Trustee and Officer Information (unaudited) continued
Executive Officers:
Name, Age and Address of
Executive Officer | | Position(s)
Held with
Registrant | | Length of
Time Served* | | Principal Occupation(s) During Past 5 Years | |
Arthur Lev (50)
522 Fifth Avenue
New York, NY 10036 | | President and Principal Executive Officer – Equity and Fixed Income Funds | | Since June 2011 | | President and Principal Executive Officer (since June 2011) of the Equity and Fixed Income Funds in the Fund Complex; Head of the Long Only Business of Morgan Stanley Investment Management (since February 2011); Managing Director of the Adviser and various entities affiliated with the Adviser (since December 2006). Formerly, Chief Strategy Officer of Morgan Stanley Investment Management's Traditional Asset Management business (November 2010-February 2011); General Counsel of Morgan Stanley Investment Management (December 2006-October 2010); Partner and General Counsel of FrontPoint Partners LLC (July 2002 to December 2006); Managing Director and General Counsel of Morgan Stanley Investment Management (May 2000 to June 2002). | |
|
Mary Ann Picciotto (38)
c/o Morgan Stanley Services
Company Inc.
Harborside Financial Center
201 Plaza Two
Jersey City, NJ 07311 | | Chief Compliance Officer | | Since May 2010 | | Executive Director of the Adviser and various entities affiliated with the Adviser; Chief Compliance Officer of various Morgan Stanley Funds (since May 2010); Chief Compliance Officer of the Adviser (since April 2007). | |
|
Stefanie V. Chang Yu (44)
522 Fifth Avenue
New York, NY 10036 | | Vice President | | Since December 1997 | | Managing Director of the Adviser and various entities affiliated with the Adviser; Vice President of various Morgan Stanley Funds (since December 1997). Formerly, Secretary of the Adviser and various entities affiliated with the Adviser. | |
|
Francis J. Smith (46)
c/o Morgan Stanley Services Company Inc.
Harborside Financial Center
201 Plaza Two
Jersey City, NJ 07311 | | Treasurer and Principal Financial
Officer | | Treasurer since July 2003 and Principal Financial Officer since September 2002 | | Executive Director of the Adviser and various entities affiliated with the Adviser; Treasurer and Principal Financial Officer of various Morgan Stanley Funds (since July 2003). | |
|
Mary E. Mullin (44)
522 Fifth Avenue
New York, NY 10036 | | Secretary | | Since June 1999 | | Executive Director of the Adviser and various entities affiliated with the Adviser; Secretary of various Morgan Stanley Funds (since June 1999). | |
|
* Each Officer serves an indefinite term, until his or her successor is elected.
49
Morgan Stanley International Value Equity Fund
2011 Federal Tax Notice (unaudited)
2011 Federal Tax Notice (unaudited)
For Federal income tax purposes, the following information is furnished with respect to the distributions paid by the Fund during its taxable year ended August 31, 2011. For corporate shareholders, 1.85% of the dividends qualified for the dividend received deduction.
For Federal income tax purposes, the following information is furnished with respect to the Fund's earnings for its taxable year ended August 31, 2011. When distributed, certain earnings may be subject to a maximum tax rate of 15% as provided for by the Jobs and Growth Tax Relief Reconciliation Act of 2003. The Fund designated up to a maximum of $7,834,190 as taxable at this lower rate.
For the taxable year ended August 31, 2011, the Fund intends to pass through foreign tax credits of $371,337, and has derived income from sources within foreign countries of $7,838,375.
In January, the Fund provides tax information to shareholders for the preceding calendar year.
50
(This page has been left blank intentionally.)
Trustees
Frank L. Bowman
Michael Bozic
Kathleen A. Dennis
James F. Higgins
Dr. Manuel H. Johnson
Joseph J. Kearns
Michael F. Klein
Michael E. Nugent
W. Allen Reed
Fergus Reid
Officers
Michael E. Nugent
Chairperson of the Board
Arthur Lev
President and Principal Executive Officer
Mary Ann Picciotto
Chief Compliance Officer
Stefanie V. Chang Yu
Vice President
Francis J. Smith
Treasurer and Principal Financial Officer
Mary E. Mullin
Secretary
Transfer Agent
Morgan Stanley Services Company Inc.
P.O. Box 219886
Kansas City, Missouri 64121
Custodian
State Street Bank and Trust Company
One Lincoln Street
Boston, Massachusetts 02111
Independent Registered Public Accounting Firm
Ernst & Young LLP
200 Clarendon Street
Boston, Massachusetts 02116
Legal Counsel
Dechert LLP
1095 Avenue of the Americas
New York, New York 10036
Counsel to the Independent Trustees
Kramer Levin Naftalis & Frankel LLP
1177 Avenue of the Americas
New York, New York 10036
Investment Adviser
Morgan Stanley Investment Management Inc.
522 Fifth Avenue
New York, New York 10036
Sub-Advisers
Morgan Stanley Investment Management Limited
25 Cabot Square, Canary Wharf
London, E14 4QA, England
Morgan Stanley Investment Management Company
23 Church Street
16-01 Capital Square, Singapore 049481

INVESTMENT MANAGEMENT
Morgan Stanley
International Value Equity Fund
This report is submitted for the general information of the shareholders of the Fund. For more detailed information about the Fund, its fees and expenses and other pertinent information, please read its Prospectus. The Fund's Statement of Additional Information contains additional information about the Fund, including its trustees. It is available, without charge, by calling (800) 869-NEWS.
This report is not authorized for distribution to prospective investors in the Fund unless preceded or accompanied by an effective Prospectus. Read the Prospectus carefully before investing.
Morgan Stanley Distribution, Inc., member FINRA.
© 2011 Morgan Stanley

Annual Report
August 31, 2011

IVQANN
IU11-02092P-Y08/11
Trustees
Frank L. Bowman
Michael Bozic
Kathleen A. Dennis
James F. Higgins
Dr. Manuel H. Johnson
Joseph J. Kearns
Michael F. Klein
Michael E. Nugent
W. Allen Reed
Fergus Reid
Officers
Michael E. Nugent
Chairperson of the Board
Arthur Lev
President and Principal Executive Officer
Mary Ann Picciotto
Chief Compliance Officer
Stefanie V. Chang Yu
Vice President
Francis J. Smith
Treasurer and Principal Financial Officer
Mary E. Mullin
Secretary
Transfer Agent
Morgan Stanley Services Company Inc.
P.O. Box 219886
Kansas City, Missouri 64121
Custodian
State Street Bank and Trust Company
One Lincoln Street
Boston, Massachusetts 02111
Independent Registered Public Accounting Firm
Ernst & Young LLP
200 Clarendon Street
Boston, Massachusetts 02116
Legal Counsel
Dechert LLP
1095 Avenue of the Americas
New York, New York 10036
Counsel to the Independent Trustees
Kramer Levin Naftalis & Frankel LLP
1177 Avenue of the Americas
New York, New York 10036
Investment Adviser
Morgan Stanley Investment Management Inc.
522 Fifth Avenue
New York, New York 10036
Sub-Advisers
Morgan Stanley Investment Management Limited
25 Cabot Square Canary Wharf
London, E14 4QA, England
Morgan Stanley Investment Management Company
23 Church Street
16-01 Capital Square, Singapore 049481

INVESTMENT MANAGEMENT
Morgan Stanley
International Value
Equity Fund
The financial statements included herein have been taken from the records of the Fund without examination by the independent auditors and accordingly they do not express an opinion thereon.
This report is submitted for the general information of the shareholders of the Fund. For more detailed information about the Fund, its fees and expenses and other pertinent information, please read its Prospectus. The Fund's Statement of Additional Information contains additional information about the Fund, including its trustees. It is available, without charge, by calling (800) 869-NEWS.
This report is not authorized for distribution to prospective investors in the Fund unless preceded or accompanied by an effective Prospectus. Read the Prospectus carefully before investing.
Morgan Stanley Distribution, Inc., member FINRA.
© 2012 Morgan Stanley

Semiannual Report
February 29, 2012

IVQSAN
IU12-00726P-Y02/12

Morgan Stanley International Value Equity Fund
Table of Contents
| Welcome Shareholder | | | 3 | | |
|
| Fund Report | | | 4 | | |
|
| Performance Summary | | | 8 | | |
|
| Expense Example | | | 9 | | |
|
| Portfolio of Investments | | | 11 | | |
|
| Statement of Assets and Liabilities | | | 16 | | |
|
| Statement of Operations | | | 17 | | |
|
| Statements of Changes in Net Assets | | | 18 | | |
|
| Notes to Financial Statements | | | 19 | | |
|
| Financial Highlights | | | 31 | | |
|
| U.S. Privacy Policy | | | 37 | | |
|
2
Welcome Shareholder,
We are pleased to provide this semiannual report, in which you will learn how your investment in Morgan Stanley International Value Equity Fund performed during the latest six-month period. It includes an overview of the market conditions and discusses some of the factors that affected performance during the reporting period. In addition, the report contains financial statements and a list of portfolio holdings.
Morgan Stanley Investment Management is a client-centric, investor-led organization. Our global presence, intellectual capital, and breadth of products and services enable us to partner with investors to meet the evolving challenges of today's financial markets. We aim to deliver superior investment service and to empower our clients to make the informed decisions that help them reach their investment goals.
As always, we thank you for selecting Morgan Stanley Investment Management, and look forward to working with you in the months and years ahead.
This material must be preceded or accompanied by a prospectus for the fund being offered.
Market forecasts provided in this report may not necessarily come to pass. There is no assurance that the Fund will achieve its investment objective. The Fund is subject to market risk, which is the possibility that market values of securities owned by the Fund will decline and, therefore, the value of the Fund's shares may be less than what you paid for them. Accordingly, you can lose money investing in this Fund. Please see the prospectus for more complete information on investment risks.
3
Fund Report (unaudited)
For the six months ended February 29, 2012
| Total Return for the 6 Months Ended February 29, 2012 | |
| Class A | | Class B | | Class C | | Class I | | Class R | | Class W | | MSCI
EAFE
Index1 | | Lipper
International
Large-
Cap Core
Funds Index2 | |
| | 6.18 | % | | | 6.23 | % | | | 5.77 | % | | | 6.27 | % | | | 5.99 | % | | | 6.16 | % | | | 4.13 | % | | | 3.32 | % | |
The performance of the Fund's six share classes varies because each has different expenses. The Fund's total returns assume the reinvestment of all distributions but do not reflect the deduction of any applicable sales charges. Such costs would lower performance. See Performance Summary for standardized performance and benchmark information.
Because Class B shares incurred lower expenses under the 12b-1 Plan than did Class A shares for the six months ended February 29, 2012, the total operating expense ratio for Class B shares was lower and, as a result, the performance of Class B shares was higher than that of the Class A shares. There can be no assurance that this will continue to occur in the future as the maximum fees payable by Class B shares under the 12b-1 Plan are higher than those payable by Class A shares.
The Fund's Distributor has agreed to reduce the 12b-1 fee on Class B shares of the Fund to the extent it exceeds 0.24% of the average daily net assets of such shares on an annualized basis. This waiver will continue for one year or until such time as the Fund's Board of Trustees acts to discontinue all or a portion of such waiver when it deems that such action is appropriate.
Market Conditions
The international markets, as represented by the MSCI EAFE Index (the "Index"), rose 4.13 percent for the six months ended February 29, 2012. The Nordic countries outperformed the Index, particularly Norway and Sweden, which rose 11.18 percent and 10.54 percent, respectively. The U.K. also performed strongly over the period, rising 8.39 percent, while Japan and the euro bloc underperformed, rising 3.82 and 2.41 percent respectively.
On a sector basis, energy was the best performing sector in the Index during the period, helped by the remarkable strength of oil prices. Consumer discretionary and industrials also performed well, while health care, information technology, materials and telecommunications lagged. The utilities sector was the worst performing sector for the six-month period.
Performance Analysis
All share classes of Morgan Stanley International Value Equity Fund outperformed the Index and the Lipper International Large-Cap Core Funds Index for the six months ended February 29, 2012, assuming no deduction of applicable sales charges.
The portfolio outperformed for the six-month period almost entirely due to favorable stock selection in materials. The portfolio also benefited from positive stock selection in consumer staples, financials and information technology. The underweight to utilities, the worst performing sector for the period, also added value. The most significant detractor from relative performance over the period was stock selection in
4
industrials. Another negative influence was the underweight to consumer discretionary.
The simultaneous outperformance of the highly cyclical (or economically sensitive) auto sector (+9.6 percent) and the ultra defensive (or less economically sensitive) food, beverages and tobacco sector (+7 percent) — two sectors that typically perform out of sync with each other — tells us something about the current "risk on" rally. We believe this contradictory sector performance together with lower trading volumes in the market to be a clear sign that there is not a great deal of fundamental conviction in the most recent market rally. Rather, we believe the rally seems to reflect the "fear" of missing out and hints at investors seeking to benefit whether the market moves up or down. The lack of movement in the 10-year U.S. Treasury note or the German Bund also signals bond investors' lack of belief in any significant change to the deflationary, balance sheet deleveraging story. The clear value argument that could be made in October and November 2011 has also diminished particularly amongst the financials and cyclicals, which have rallied significantly. Given this, together with the substantial risks that we continue to see in the economy and the ongoing political risks in Europe (e.g., French presidential election, Greek elections, Irish referendum), we reduced the portfolio's exposure to higher beta (more volatile), cyclical stocks by around 300 basis points towards the end of February.
While the European Central Bank's (ECB) long-term refinancing operation (LTRO) has been an unequivocal positive in terms of removing the real risk of a liquidity event in the European banking system, it is not at all clear that it will have any positive impact on the economy. The record deposits with the ECB also show that most of the funds issued under the LTRO have simply found their way back to the ECB as deposits. There is little evidence of an end to the deleveraging of the European bank system as banks continue to shrink their balance sheets in order to meet the more stringent capital ratios.
The unexpected move by the Bank of Japan (BoJ) on February 14, 2012, to increase its asset purchase program by 10 trillion Yen and to implement an official inflation "goal" (as opposed to a "target") was welcomed warmly by equity markets and sparked a 6 percent fall in the yen against the U.S. dollar. Many commentators have interpreted this as a fundamental change in BoJ policy, which could result in further, significant depreciation of the yen. We are therefore not inclined to hedge the portfolio's yen exposure, which remains at 23 percent, slightly greater than the Index's weight of 21.4 percent.
We continue to prefer the relative safety of high quality stocks with what we believe are steady and predictable cash flows, secure dividends and solid balance sheets.
5
There is no guarantee that any sectors mentioned will continue to perform as discussed herein or that securities in such sectors will be held by the Fund in the future.
| TOP 10 HOLDINGS as of 02/29/12 | |
| British American Tobacco PLC | | | 4.4 | % | |
| Nestle SA, (Registered) | | | 4.3 | | |
| Imperial Tobacco Group PLC | | | 4.0 | | |
| Reckitt Benckiser Group PLC | | | 3.8 | | |
| Unilever N.V., CVA | | | 3.7 | | |
| HSBC Holdings PLC | | | 2.5 | | |
| Bayer AG, (Registered) | | | 2.5 | | |
| Novartis AG, (Registered) | | | 2.4 | | |
| Prudential PLC | | | 2.3 | | |
| Sanofi | | | 2.2 | | |
| TOP FIVE COUNTRIES as of 02/29/12 | |
| United Kingdom | | | 35.1 | % | |
| Japan | | | 23.4 | | |
| Switzerland | | | 11.9 | | |
| France | | | 7.3 | | |
| Germany | | | 6.2 | | |
Subject to change daily. Provided for informational purposes only and should not be deemed as a recommendation to buy or sell the securities mentioned above. Top 10 holdings and top five countries are as a percentage of net assets. Morgan Stanley is a full-service securities firm engaged in securities trading and brokerage activities, investment banking, research and analysis, financing and financial advisory services.
Investment Strategy
The Fund will normally invest at least 80 percent of its assets in a diversified portfolio of common stocks and other equity securities, including depositary receipts and securities convertible into common stock, of companies located outside of the United States. These companies may be of any asset size, including small and medium capitalization companies, and may be located in developed or emerging market countries. The Fund may also use derivative instruments as discussed in the Fund's prospectus. These derivative instruments will be counted toward the 80 percent policy discussed above to the extent they have economic characteristics similar to the securities included within that policy.
For More Information About Portfolio Holdings
Each Morgan Stanley fund provides a complete schedule of portfolio holdings in its semiannual and annual reports within 60 days of the end of the fund's second and fourth fiscal quarters. The semiannual reports and the annual reports are filed electronically with the Securities and Exchange Commission (SEC) on Form N-CSRS and Form N-CSR, respectively. Morgan Stanley also delivers the semiannual and annual reports to fund shareholders and makes these reports available on its public web site, www.morganstanley.com. Each Morgan Stanley fund also files a complete schedule of portfolio holdings with the SEC for the fund's first and third fiscal quarters on Form N-Q. Morgan Stanley does not deliver the reports for the first and third fiscal quarters to shareholders, nor are the reports posted to the Morgan Stanley public web site. You may, however, obtain the Form N-Q filings (as well as the Form N-CSR and N-CSRS filings) by accessing the SEC's web site,
6
http://www.sec.gov. You may also review and copy them at the SEC's public reference room in Washington, DC. Information on the operation of the SEC's public reference room may be obtained by calling the SEC at (800) SEC-0330. You can also request copies of these materials, upon payment of a duplicating fee, by electronic request at the SEC's e-mail address (publicinfo@sec.gov) or by writing the public reference section of the SEC, Washington, DC 20549-1520.
Proxy Voting Policy and Procedures and Proxy Voting Record
You may obtain a copy of the Fund's Proxy Voting Policy and Procedures without charge, upon request, by calling toll free (800) 869-NEWS or by visiting the Mutual Fund Center on our web site at www.morganstanley.com. It is also available on the SEC's web site at http://www.sec.gov.
You may obtain information regarding how the Fund voted proxies relating to portfolio securities during the most recent twelve-month period ended June 30 without charge by visiting the Mutual Fund Center on our web site at www.morganstanley.com. This information is also available on the SEC's web site at http://www.sec.gov.
Householding Notice
To reduce printing and mailing costs, the Fund attempts to eliminate duplicate mailings to the same address. The Fund delivers a single copy of certain shareholder documents, including shareholder reports, prospectuses and proxy materials, to investors with the same last name who reside at the same address. Your participation in this program will continue for an unlimited period of time unless you instruct us otherwise. You can request multiple copies of these documents by calling (800) 869-NEWS, 8:00 a.m. to 8:00 p.m., ET. Once our Customer Service Center has received your instructions, we will begin sending individual copies for each account within 30 days.
7
Performance Summary (unaudited)
| Average Annual Total Returns—Period Ended February 29, 2012 | |
| Symbol | | Class A Shares*
(since 04/26/01)
IVQAX | | Class B Shares**
(since 04/26/01)
IVQBX | | Class C Shares†
(since 04/26/01)
IVQCX | | Class I Shares††
(since 04/26/01)
IVQDX | | Class R Shares#
(since 03/31/08)
IVQRX | | Class W Shares##
(since 03/31/08)
IVQWX | |
| 1 Year | | | –3.86
–8.92 4 | %3 | | | –3.98
–8.71 4 | %3 | | | –4.66
–5.61 4 | %3 | | | –3.64
— | %3 | | | –4.21
— | %3 | | | –3.93
— | %3 | |
| 5 Years | | | –1.13 3
–2.19 4 | | | | –1.11 3
–1.38 4 | | | | –1.87 3
–1.87 4 | | | | –0.90 3
— | | | | —
— | | | | —
— | | |
| 10 Years | | | 6.38 3
5.81 4 | | | | 5.99 3
5.99 4 | | | | 5.60 3
5.60 4 | | | | 6.64 3
— | | | | —
— | | | | —
— | | |
Since
Inception | | | 5.20 3
4.69 4 | | | | 4.78 3
4.78 4 | | | | 4.42 3
4.42 4 | | | | 5.45 3
— | | | | –2.07 3
— | | | | –1.91 3
— | | |
Gross
Expense Ratio | | |
1.47 | | | |
1.46 | | | |
2.21 | | | |
1.22 | | | |
1.72 | | | |
1.57 | | |
Performance data quoted represents past performance, which is no guarantee of future results and current performance may be lower or higher than the figures shown. For most recent month-end performance figures, please visit www.morganstanley.com/im or speak with your Financial Advisor. Investment returns and principal value will fluctuate and fund shares, when redeemed, may be worth more or less than their original cost. The table does not reflect the deduction of taxes that a shareholder would pay on fund distributions or the redemption of fund shares. Performance for Class A, Class B, Class C, Class I, Class R, and Class W shares will vary due to differences in sales charges and expenses. See the Fund's current prospectus for complete details on fees and sales charges. Expense ratios are as of the Fund's fiscal year-end as outlined in the Fund's current prospectus.
* The maximum front-end sales charge for Class A is 5.25%.
** The maximum contingent deferred sales charge (CDSC) for Class B is 5.0%. The CDSC declines to 0% after six years. For periods greater than eight years, returns do not reflect conversion to Class A shares eight years after the end of the calendar month in which shares were purchased. The conversion feature is currently suspended because the total annual operating expense ratio of Class B is currently lower than that of Class A. See "Conversion Feature" for Class B shares in "Share Class Arrangements" of the Prospectus for more information.
† The maximum contingent deferred sales charge for Class C is 1.0% for shares redeemed within one year of purchase.
†† Class I has no sales charge.
# Class R has no sales charge.
## Class W has no sales charge.
(1) The Morgan Stanley Capital International (MSCI) EAFE Index (Europe, Australasia, Far East) is a free float-adjusted market capitalization index that is designed to measure the international equity market performance of developed markets, excluding the U.S. & Canada. The term "free float" represents the portion of shares outstanding that are deemed to be available for purchase in the public equity markets by investors. The MSCI EAFE Index currently consists of 22 developed market country indices. The performance of the Index is listed in U.S. dollars and assumes reinvestment of net dividends. "Net dividends" reflects a reduction in dividends after taking into account withholding of taxes by certain foreign countries represented in the Index. The Index is unmanaged and its returns do not include any sales charges or fees. Such costs would lower performance. It is not possible to invest directly in an index.
(2) The Lipper International Large-Cap Core Funds Index is an equally weighted performance index of the largest qualifying funds (based on net assets) in the Lipper International Large-Cap Core Funds classification. The Index, which is adjusted for capital gains distributions and income dividends, is unmanaged and should not be considered an investment. There are currently 30 funds represented in this Index. The Fund was in the Lipper International Large-Cap Core Funds classification as of the date of this report.
(3) Figure shown assumes reinvestment of all distributions and does not reflect the deduction of any sales charges.
(4) Figure shown assumes reinvestment of all distributions and the deduction of the maximum applicable sales charge. See the Fund's current prospectus for complete details on fees and sales charges.
8
Expense Example (unaudited)
As a shareholder of the Fund, you incur two types of costs: (1) transaction costs, including sales charges (loads) on purchase payments and redemption fees; (2) ongoing costs, including advisory fees; distribution and service (12b-1) fees; and other Fund expenses. This example is intended to help you understand your ongoing costs (in dollars) of investing in the Fund and to compare these costs with the ongoing costs of investing in other mutual funds.
The example is based on an investment of $1,000 invested at the beginning of the period and held for the entire period 09/01/11 – 02/29/12.
Actual Expenses
The first line of the table below provides information about actual account values and actual expenses. You may use the information in this line, together with the amount you invested, to estimate the expenses that you paid over the period. Simply divide your account value by $1,000 (for example, an $8,600 account value divided by $1,000 = 8.6), then multiply the result by the number in the first line under the heading entitled "Expenses Paid During Period" to estimate the expenses you paid on your account during this period.
Hypothetical Example for Comparison Purposes
The second line of the table below provides information about hypothetical expenses based on the Fund's actual expense ratio and an assumed rate of return of 5% per year before expenses, which is not the Fund's actual return. The hypothetical account values and expenses may not be used to estimate the actual ending account balance or expenses you paid for the period. You may use this information to compare the ongoing cost of investing in the Fund and other funds. To do so, compare this 5% hypothetical example with the 5% hypothetical examples that appear in the shareholder reports of the other funds.
Please note that the expenses shown in the table are meant to highlight your ongoing costs only and do not reflect any transactional costs, such as sales charges (loads) and redemption fees. Therefore, the second line of the table is useful in comparing ongoing costs, and will not help you determine the relative total cost of owning different funds. In addition, if these transactional costs were included, your costs would have been higher.
| | | Beginning
Account Value | | Ending
Account Value | | Expenses Paid
During Period@ | |
| | | 09/01/11 | | 02/29/12 | | 09/01/11 –
02/29/12 | |
| Class A | |
| Actual (6.18% return) | | $ | 1,000.00 | | | $ | 1,061.80 | | | $ | 7.59 | | |
| Hypothetical (5% annual return before expenses) | | $ | 1,000.00 | | | $ | 1,017.50 | | | $ | 7.42 | | |
| Class B | |
| Actual (6.23% return) | | $ | 1,000.00 | | | $ | 1,062.30 | | | $ | 7.54 | | |
| Hypothetical (5% annual return before expenses) | | $ | 1,000.00 | | | $ | 1,017.55 | | | $ | 7.37 | | |
| Class C | |
| Actual (5.77% return) | | $ | 1,000.00 | | | $ | 1,057.70 | | | $ | 11.36 | | |
| Hypothetical (5% annual return before expenses) | | $ | 1,000.00 | | | $ | 1,013.82 | | | $ | 11.12 | | |
| Class I | |
| Actual (6.27% return) | | $ | 1,000.00 | | | $ | 1,062.70 | | | $ | 6.31 | | |
| Hypothetical (5% annual return before expenses) | | $ | 1,000.00 | | | $ | 1,018.75 | | | $ | 6.17 | | |
9
Expense Example (unaudited) continued
| | | Beginning
Account Value | | Ending
Account Value | | Expenses Paid
During Period@ | |
| | | 09/01/11 | | 02/29/12 | | 09/01/11 –
02/29/12 | |
| Class R | |
| Actual (5.99% return) | | $ | 1,000.00 | | | $ | 1,059.90 | | | $ | 8.86 | | |
| Hypothetical (5% annual return before expenses) | | $ | 1,000.00 | | | $ | 1,016.26 | | | $ | 8.67 | | |
| Class W | |
| Actual (6.16% return) | | $ | 1,000.00 | | | $ | 1,061.60 | | | $ | 8.10 | | |
| Hypothetical (5% annual return before expenses) | | $ | 1,000.00 | | | $ | 1,017.01 | | | $ | 7.92 | | |
@ Expenses are equal to the Fund's annualized expense ratios of 1.48%, 1.47%, 2.22%, 1.23%, 1.73%, and 1.58% for Class A, Class B, Class C, Class I, Class R, and Class W shares, respectively, multiplied by the average account value over the period, multiplied by 182/366 (to reflect the one-half year period).
Because Class B shares incurred lower expenses under the 12b-1 Plan than did Class A shares for the six months ended February 29, 2012, the total operating expense ratio for Class B shares was lower and as a result, the performance of Class B shares was higher than that of the Class A shares. There can be no assurance that this will continue to occur in the future as the maximum fees payable by Class B shares under the 12b-1 Plan are higher than those payable by Class A shares.
The Fund's Distributor has agreed to reduce the 12b-1 fee on Class B shares of the Fund to the extent it exceeds 0.24% of the average daily net assets of such shares on an annualized basis. This waiver will continue for one year or until such time that the Fund's Board of Trustees acts to discontinue all or a portion of such waiver when it deems that such action is appropriate.
10
Morgan Stanley International Value Equity Fund
Portfolio of Investments n February 29, 2012 (unaudited)
NUMBER OF
SHARES | |
| | VALUE | |
| | | Common Stocks (97.9%) | |
| | | Australia (3.5%) | |
| | | Chemicals | |
| | 13,775 | | | Orica Ltd. | | $ | 401,826 | | |
| | | Energy Equipment &
Services | |
| | 48,293 | | | WorleyParsons Ltd. | | | 1,521,126 | | |
| | | Insurance | |
| | 382,661 | | | AMP Ltd. (a) | | | 1,645,644 | | |
| | | Oil, Gas & Consumable Fuels | |
| | 195,320 | | | Santos Ltd. (a) | | | 3,020,572 | | |
| | | | | Total Australia | | | 6,589,168 | | |
| | | Canada (0.2%) | |
| | | Oil, Gas & Consumable Fuels | |
| | 19,357 | | | Encana Corp. (a) | | | 394,398 | | |
| | | China (0.5%) | |
| | | Insurance | |
| | 256,800 | | | AIA Group Ltd. (b) | | | 973,405 | | |
| | | France (7.3%) | |
| | | Commercial Banks | |
| | 24,299 | | | BNP Paribas SA | | | 1,186,004 | | |
| | 17,196 | | | Societe Generale SA | | | 555,573 | | |
| | | | 1,741,577 | | |
| | | Diversified Telecommunication
Services | |
| | 86,033 | | | France Telecom SA | | | 1,312,992 | | |
| | | Electrical Equipment | |
| | 105,750 | | | Legrand SA | | | 3,839,271 | | |
| | | Machinery | |
| | 27,700 | | | Vallourec SA | | | 1,950,413 | | |
| | | Metals & Mining | |
| | 41,776 | | | ArcelorMittal | | | 880,790 | | |
| | | Pharmaceuticals | |
| | 55,662 | | | Sanofi | | | 4,116,536 | | |
| | | | | Total France | | | 13,841,579 | | |
NUMBER OF
SHARES | |
| | VALUE | |
| | | Germany (6.2%) | |
| | | Auto Components | |
| | 10,357 | | | Continental AG (c) | | $ | 942,860 | | |
| | | Automobiles | |
| | 11,117 | | | Volkswagen AG (Preference) | | | 2,078,748 | | |
| | | Chemicals | |
| | 24,177 | | | BASF SE | | | 2,122,705 | | |
| | | Pharmaceuticals | |
| | 63,033 | | | Bayer AG (Registered) | | | 4,660,826 | | |
| | | Software | |
| | 28,351 | | | SAP AG | | | 1,913,153 | | |
| | | | | Total Germany | | | 11,718,292 | | |
| | | Ireland (1.2%) | |
| | | Construction Materials | |
| | 109,968 | | | CRH PLC | | | 2,350,025 | | |
| | | Italy (1.3%) | |
| | | Oil, Gas & Consumable Fuels | |
| | 105,447 | | | Eni SpA | | | 2,431,830 | | |
| | | Japan (23.4%) | |
| | | Auto Components | |
| | 186,000 | | | NGK Spark Plug Co., Ltd. | | | 2,507,762 | | |
| | | Automobiles | |
| | 81,500 | | | Toyota Motor Corp. | | | 3,363,667 | | |
| | | Chemicals | |
| | 18,200 | | | Nitto Denko Corp. | | | 747,792 | | |
| | | Commercial Banks | |
| | 45,419 | | | Sumitomo Mitsui
Financial Group, Inc. (a) | | | 1,540,413 | | |
| | 425,000 | | | Sumitomo Mitsui Trust
Holdings, Inc. | | | 1,474,351 | | |
| | | | 3,014,764 | | |
| | | Electrical Equipment | |
| | 265,000 | | | Mitsubishi Electric Corp. | | | 2,376,492 | | |
See Notes to Financial Statements
11
Morgan Stanley International Value Equity Fund
Portfolio of Investments n February 29, 2012 (unaudited) continued
NUMBER OF
SHARES | |
| | VALUE | |
| | | Electronic Equipment,
Instruments & Components | |
| | 474,000 | | | Hitachi Ltd. | | $ | 2,758,051 | | |
| | 149,100 | | | Hoya Corp. | | | 3,470,257 | | |
| | 8,300 | | | Keyence Corp. | | | 2,176,848 | | |
| | 19,700 | | | Kyocera Corp. | | | 1,742,441 | | |
| | | | 10,147,597 | | |
| | | Food & Staples Retailing | |
| | 36,900 | | | Lawson, Inc. (a) | | | 2,169,787 | | |
| | | Household Durables | |
| | 200,000 | | | Sekisui House Ltd. | | | 1,894,452 | | |
| | | Insurance | |
| | 51,500 | | | MS&AD Insurance
Group Holdings | | | 1,104,250 | | |
| | | Media | |
| | 17,300 | | | Asatsu-DK, Inc. (a) | | | 495,867 | | |
| | | Oil, Gas & Consumable Fuels | |
| | 383 | | | INPEX Corp. | | | 2,718,551 | | |
| | | Pharmaceuticals | |
| | 52,800 | | | Astellas Pharma, Inc. (a) | | | 2,169,418 | | |
| | | Real Estate Management &
Development | |
| | 183,000 | | | Mitsubishi Estate Co., Ltd. | | | 3,309,263 | | |
| | | Semiconductors &
Semiconductor Equipment | |
| | 52,700 | | | Tokyo Electron Ltd. | | | 2,923,816 | | |
| | | Trading Companies &
Distributors | |
| | 118,300 | | | Mitsubishi Corp. | | | 2,897,470 | | |
| | | Wireless Telecommunication
Services | |
| | 1,442 | | | NTT DoCoMo, Inc. (a) | | | 2,462,168 | | |
| | | | | Total Japan | | | 44,303,116 | | |
| | | Netherlands (5.1%) | |
| | | Chemicals | |
| | 48,828 | | | Akzo Nobel N.V. (a) | | | 2,769,654 | | |
NUMBER OF
SHARES | |
| | VALUE | |
| | | Food Products | |
| | 208,804 | | | Unilever N.V. CVA | | $ | 6,935,263 | | |
| | | | | Total Netherlands | | | 9,704,917 | | |
| | | Singapore (0.8%) | |
| | | Diversified Telecommunication
Services | |
| | 572,000 | | | Singapore Telecommunications
Ltd. | | | 1,449,838 | | |
| | | Switzerland (11.9%) | |
| | | Capital Markets | |
| | 165,828 | | | UBS AG (Registered) (c) | | | 2,318,696 | | |
| | | Construction Materials | |
| | 28,966 | | | Holcim Ltd. (Registered) (c) | | | 1,889,017 | | |
| | | Food Products | |
| | 133,065 | | | Nestle SA (Registered) | | | 8,133,629 | | |
| | | Insurance | |
| | 9,156 | | | Zurich Financial Services AG (c) | | | 2,305,446 | | |
| | | Pharmaceuticals | |
| | 84,248 | | | Novartis AG (Registered) | | | 4,590,012 | | |
| | 18,583 | | | Roche Holding AG
(Genusschein) | | | 3,235,131 | | |
| | | | 7,825,143 | | |
| | | | | Total Switzerland | | | 22,471,931 | | |
| | | United Kingdom (35.1%) | |
| | | Commercial Banks | |
| | 361,103 | | | Barclays PLC | | | 1,407,473 | | |
| | 529,263 | | | HSBC Holdings PLC | | | 4,675,651 | | |
| | 4,389,896 | | | Lloyds Banking Group PLC (c) | | | 2,439,821 | | |
| | | | 8,522,945 | | |
| | | Electric Utilities | |
| | 125,167 | | | SSE PLC | | | 2,568,754 | | |
| | | Food & Staples Retailing | |
| | 299,649 | | | WM Morrison Supermarkets
PLC | | | 1,382,464 | | |
See Notes to Financial Statements
12
Morgan Stanley International Value Equity Fund
Portfolio of Investments n February 29, 2012 (unaudited) continued
NUMBER OF
SHARES | |
| | VALUE | |
| | | Household Products | |
| | 130,814 | | | Reckitt Benckiser Group PLC | | $ | 7,242,297 | | |
| | | Industrial Conglomerates | |
| | 145,187 | | | Smiths Group PLC | | | 2,513,041 | | |
| | | Insurance | |
| | 129,035 | | | Admiral Group PLC | | | 2,210,885 | | |
| | 1,026,636 | | | Legal & General Group PLC | | | 1,972,996 | | |
| | 382,831 | | | Prudential PLC | | | 4,339,452 | | |
| | 403,358 | | | Resolution Ltd. | | | 1,726,179 | | |
| | | | 10,249,512 | | |
| | | Metals & Mining | |
| | 77,595 | | | BHP Billiton PLC | | | 2,515,210 | | |
| | 131,829 | | | Xstrata PLC | | | 2,516,721 | | |
| | | | 5,031,931 | | |
| | | Oil, Gas & Consumable Fuels | |
| | 96,247 | | | BG Group PLC | | | 2,323,586 | | |
| | 401,918 | | | BP PLC | | | 3,148,462 | | |
| | | | 5,472,048 | | |
| | | Tobacco | |
| | 164,796 | | | British American
Tobacco PLC | | | 8,329,267 | | |
| | 189,446 | | | Imperial Tobacco
Group PLC | | | 7,507,616 | | |
| | | | 15,836,883 | | |
| | | Trading Companies &
Distributors | |
| | 101,988 | | | Bunzl PLC | | | 1,560,871 | | |
| | 123,622 | | | Travis Perkins PLC | | | 2,112,238 | | |
| | | | 3,673,109 | | |
| | | Wireless Telecommunication
Services | |
| | 1,451,550 | | | Vodafone Group PLC | | | 3,910,750 | | |
| | | | | Total United Kingdom | | | 66,403,734 | | |
| | | United States (1.4%) | |
| | | Beverages | |
| | 66,944 | | | Dr. Pepper Snapple
Group, Inc. | | | 2,547,219 | | |
| | | | | Total Common Stocks
(Cost $182,071,960) | | | 185,179,452 | | |
PRINCIPAL
AMOUNT IN
THOUSANDS | |
| | VALUE | |
| | | Short-Term Investments (10.8%) | |
| | | Securities held as Collateral on
Loaned Securities (8.4%) | |
| | | Repurchase Agreements (1.6%) | |
| $ | 32 | | | Barclays Capital, Inc. (0.19%,
dated 02/29/12, due
03/01/12; proceeds
$32,324; fully collateralized
by a U.S. Government
Obligation; U.S. Treasury
Note 2.13% due 11/30/14;
valued at $32,972) | | $ | 32,324 | | |
| | 1,984 | | | Deutsche Bank Securities, Inc.
(0.20%, dated 02/29/12,
due 03/01/12; proceeds
$1,983,868; fully
collateralized by U.S.
Government Agencies;
Federal National Mortgage
Association 4.00% - 4.50%
due 04/01/39 - 01/01/41;
valued at $2,023,534) | | | 1,983,857 | | |
| | 1,058 | | | Merrill Lynch & Co., Inc. (0.19%,
dated 02/29/12, due
03/01/12; proceeds
$1,058,063; fully
collateralized by a U.S.
Government Agency;
Federal Home Loan
Mortgage Corporation
4.50% due 06/01/39;
valued at $1,079,218) | | | 1,058,057 | | |
| | | | | Total Repurchase
Agreements
(Cost $3,074,238) | | | 3,074,238 | | |
See Notes to Financial Statements
13
Morgan Stanley International Value Equity Fund
Portfolio of Investments n February 29, 2012 (unaudited) continued
NUMBER OF
SHARES (000) | |
| | VALUE | |
| | | Investment Company (6.8%) | | | |
| | 12,856 | | | Morgan Stanley Institutional
Liquidity Funds - Money Market
Portfolio - Institutional Class
(See Note 5)
(Cost $12,855,818) | | $ | 12,855,818 | | |
| | | Total Securities held as
Collateral on
Loaned Securities
(Cost $15,930,056) | | | 15,930,056 | | |
| | | Investment Company (2.4%) | | | |
| | 4,614 | | | Morgan Stanley Institutional
Liquidity Funds - Money Market
Portfolio - Institutional Class
(See Note 5)
(Cost $4,614,333) | | | 4,614,333 | | |
| | | Total Short-Term
Investments
(Cost $20,544,389) | | | 20,544,389 | | |
Total Investments
(Cost $202,616,349) | | | 108.7 | % | | | 205,723,841 | | |
Liabilities in Excess of
Other Assets | | | (8.7 | ) | | | (16,540,091 | ) | |
| Net Assets | | | 100.0 | % | | $ | 189,183,750 | | |
CVA Certificaten Van Aandelen.
(a) All or a portion of this security was on loan at February 29, 2012.
(b) Security trades on the Hong Kong exchange.
(c) Non-income producing security.
See Notes to Financial Statements
14
Morgan Stanley International Value Equity Fund
Summary of Investments n February 29, 2012 (unaudited) continued
| INDUSTRY | | VALUE | | PERCENT OF
TOTAL
INVESTMENTS | |
| Pharmaceuticals | | $ | 18,771,923 | | | | 9.9 | % | |
| Insurance | | | 16,278,257 | | | | 8.6 | | |
| Tobacco | | | 15,836,883 | | | | 8.3 | | |
| Food Products | | | 15,068,892 | | | | 7.9 | | |
| Oil, Gas & Consumable Fuels | | | 14,037,399 | | | | 7.4 | | |
| Commercial Banks | | | 13,279,286 | | | | 7.0 | | |
Electronic Equipment,
Instruments & Components | | | 10,147,597 | | | | 5.4 | | |
| Household Products | | | 7,242,297 | | | | 3.8 | | |
Trading Companies &
Distributors | | | 6,570,579 | | | | 3.5 | | |
Wireless Telecommunication
Services | | | 6,372,918 | | | | 3.4 | | |
| Electrical Equipment | | | 6,215,763 | | | | 3.3 | | |
| Chemicals | | | 6,041,977 | | | | 3.2 | | |
| Metals & Mining | | | 5,912,721 | | | | 3.1 | | |
| Automobiles | | | 5,442,415 | | | | 2.9 | | |
| Investment Company | | | 4,614,333 | | | | 2.4 | | |
| Construction Materials | | | 4,239,042 | | | | 2.2 | | |
| Food & Staples Retailing | | | 3,552,251 | | | | 1.9 | | |
| INDUSTRY | | VALUE | | PERCENT OF
TOTAL
INVESTMENTS | |
| Auto Components | | $ | 3,450,622 | | | | 1.8 | % | |
Real Estate Management &
Development | | | 3,309,263 | | | | 1.7 | | |
Semiconductors &
Semiconductor
Equipment | | | 2,923,816 | | | | 1.5 | | |
Diversified
Telecommunication
Services | | | 2,762,830 | | | | 1.5 | | |
| Electric Utilities | | | 2,568,754 | | | | 1.4 | | |
| Beverages | | | 2,547,219 | | | | 1.3 | | |
| Industrial Conglomerates | | | 2,513,041 | | | | 1.3 | | |
| Capital Markets | | | 2,318,696 | | | | 1.2 | | |
| Machinery | | | 1,950,413 | | | | 1.0 | | |
| Software | | | 1,913,153 | | | | 1.0 | | |
| Household Durables | | | 1,894,452 | | | | 1.0 | | |
Energy Equipment &
Services | | | 1,521,126 | | | | 0.8 | | |
| Media | | | 495,867 | | | | 0.3 | | |
| | | $ | 189,793,785 | + | | | 100.0 | % | |
+ Does not reflect the value of securities held as collateral on loaned securities.
See Notes to Financial Statements
15
Morgan Stanley International Value Equity Fund
Financial Statements
Statement of Assets and Liabilities
February 29, 2012 (unaudited)
| Assets: | |
| Investments in securities, at value (cost $185,146,198) (including $15,072,160 for securities loaned) | | $ | 188,253,690 | | |
| Investment in affiliate, at value (cost $17,470,151) | | | 17,470,151 | | |
| Total investments in securities, at value (cost $202,616,349) | | | 205,723,841 | | |
| Cash (including foreign currency valued at $230,993 with a cost of $229,294) | | | 240,965 | | |
| Receivable for: | |
| Dividends | | | 630,370 | | |
| Foreign withholding taxes reclaimed | | | 261,560 | | |
| Shares of beneficial interest sold | | | 88,211 | | |
| Dividends from affiliate | | | 506 | | |
| Receivable from Distributor | | | 54,669 | | |
| Prepaid expenses and other assets | | | 29,231 | | |
| Total Assets | | | 207,029,353 | | |
| Liabilities: | |
| Collateral on securities loaned, at value | | | 15,940,028 | | |
| Payable for: | |
| Investments purchased | | | 1,194,052 | | |
| Shares of beneficial interest redeemed | | | 378,520 | | |
| Investment advisory fee | | | 118,558 | | |
| Transfer agent fee | | | 74,778 | | |
| Distribution fee | | | 53,195 | | |
| Administration fee | | | 11,891 | | |
| Accrued expenses and other payables | | | 74,581 | | |
| Total Liabilities | | | 17,845,603 | | |
| Net Assets | | $ | 189,183,750 | | |
| Composition of Net Assets: | |
| Paid-in-capital | | $ | 282,647,917 | | |
| Net unrealized appreciation | | | 3,112,917 | | |
| Accumulated undistributed net investment income | | | 975,230 | | |
| Accumulated net realized loss | | | (97,552,314 | ) | |
| Net Assets | | $ | 189,183,750 | | |
| Class A Shares: | |
| Net Assets | | $ | 38,402,444 | | |
| Shares Outstanding (unlimited shares authorized, $0.01 par value) | | | 4,513,872 | | |
| Net Asset Value Per Share | | $ | 8.51 | | |
Maximum Offering Price Per Share,
(net asset value plus 5.54% of net asset value) | | $ | 8.98 | | |
| Class B Shares: | |
| Net Assets | | $ | 43,553,566 | | |
| Shares Outstanding (unlimited shares authorized, $0.01 par value) | | | 5,148,015 | | |
| Net Asset Value Per Share | | $ | 8.46 | | |
| Class C Shares: | |
| Net Assets | | $ | 14,470,876 | | |
| Shares Outstanding (unlimited shares authorized, $0.01 par value) | | | 1,708,721 | | |
| Net Asset Value Per Share | | $ | 8.47 | | |
| Class I Shares: | |
| Net Assets | | $ | 92,580,832 | | |
| Shares Outstanding (unlimited shares authorized, $0.01 par value) | | | 10,865,388 | | |
| Net Asset Value Per Share | | $ | 8.52 | | |
| Class R Shares: | |
| Net Assets | | $ | 87,439 | | |
| Shares Outstanding (unlimited shares authorized, $0.01 par value) | | | 10,347 | | |
| Net Asset Value Per Share | | $ | 8.45 | | |
| Class W Shares: | |
| Net Assets | | $ | 88,593 | | |
| Shares Outstanding (unlimited shares authorized, $0.01 par value) | | | 10,476 | | |
| Net Asset Value Per Share | | $ | 8.46 | | |
See Notes to Financial Statements
16
Morgan Stanley International Value Equity Fund
Financial Statements continued
Statement of Operations
For the six months ended February 29, 2012 (unaudited)
| Net Investment Income: | |
| Income | |
| Dividends (net of $121,014 foreign withholding tax) | | $ | 2,247,663 | | |
| Income from securities loaned - net | | | 30,160 | | |
| Dividends from affiliate (Note 5) | | | 1,746 | | |
| Interest | | | 32 | | |
| Total Income | | | 2,279,601 | | |
| Expenses | |
| Investment advisory fee (Note 3) | | | 728,252 | | |
| Distribution fee (Class A shares) (Note 4) | | | 45,938 | | |
| Distribution fee (Class B shares) (Note 4) | | | 52,508 | | |
| Distribution fee (Class C shares) (Note 4) | | | 69,801 | | |
| Distribution fee (Class R shares) (Note 4) | | | 201 | | |
| Distribution fee (Class W shares) (Note 4) | | | 142 | | |
| Transfer agent fees and expenses | | | 121,747 | | |
| Administration fee (Note 3) | | | 72,825 | | |
| Shareholder reports and notices | | | 54,563 | | |
| Custodian fees | | | 47,542 | | |
| Professional fees | | | 38,533 | | |
| Registration fees | | | 36,858 | | |
| Trustees' fees and expenses | | | 1,753 | | |
| Other | | | 17,126 | | |
| Total Expenses | | | 1,287,789 | | |
| Less: plan of distribution fee rebate (Class B shares) (Note 4) | | | (1,713 | ) | |
| Less: rebate from Morgan Stanley affiliated cash sweep (Note 5) | | | (2,238 | ) | |
| Net Expenses | | | 1,283,838 | | |
| Net Investment Income | | | 995,763 | | |
Realized and Unrealized Gain (Loss):
Realized Loss on: | |
| Investments | | | (1,075,982 | ) | |
| Foreign currency translation | | | (92,077 | ) | |
| Net Realized Loss | | | (1,168,059 | ) | |
| Change in Unrealized Appreciation/Depreciation on: | |
| Investments | | | 10,635,542 | | |
| Foreign currency translation | | | (17,840 | ) | |
| Net Change in Unrealized Appreciation/Depreciation | | | 10,617,702 | | |
| Net Gain | | | 9,449,643 | | |
| Net Increase | | $ | 10,445,406 | | |
See Notes to Financial Statements
17
Morgan Stanley International Value Equity Fund
Financial Statements continued
Statements of Changes in Net Assets
| | | FOR THE SIX
MONTHS ENDED
FEBRUARY 29, 2012 | | FOR THE YEAR
ENDED
AUGUST 31, 2011 | |
| | | (unaudited) | | | |
Increase (Decrease) in Net Assets:
Operations: | |
| Net investment income | | $ | 995,763 | | | $ | 4,274,691 | | |
| Net realized gain (loss) | | | (1,168,059 | ) | | | 11,382,703 | | |
| Net change in unrealized appreciation/depreciation | | | 10,617,702 | | | | 12,499,807 | | |
| Net Increase | | | 10,445,406 | | | | 28,157,201 | | |
| Dividends to Shareholders from Net Investment Income: | |
| Class A shares | | | (555,156 | ) | | | (896,377 | ) | |
| Class B shares | | | (638,563 | ) | | | (1,082,844 | ) | |
| Class C shares | | | (70,315 | ) | | | (177,069 | ) | |
| Class I shares | | | (1,598,968 | ) | | | (2,396,152 | ) | |
| Class R shares | | | (1,051 | ) | | | (1,399 | ) | |
| Class W shares | | | (1,199 | ) | | | (1,523 | ) | |
| Total Dividends | | | (2,865,252 | ) | | | (4,555,364 | ) | |
| Net decrease from transactions in shares of beneficial interest | | | (17,470,903 | ) | | | (58,531,840 | ) | |
| Net Decrease | | | (9,890,749 | ) | | | (34,930,003 | ) | |
| Net Assets: | |
| Beginning of period | | | 199,074,499 | | | | 234,004,502 | | |
End of Period
(Including accumulated undistributed net investment income of $975,230
and $2,844,719, respectively) | | $ | 189,183,750 | | | $ | 199,074,499 | | |
See Notes to Financial Statements
18
Morgan Stanley International Value Equity Fund
Notes to Financial Statements n February 29, 2012 (unaudited)
1. Organization and Accounting Policies
Morgan Stanley International Value Equity Fund (the "Fund"), is registered under the Investment Company Act of 1940, as amended (the "Act"), as a diversified, open-end management investment company. The Fund's investment objective is to seek long-term capital appreciation. The Fund was organized as a Massachusetts business trust on January 11, 2001 and commenced operations on April 26, 2001.
The Fund offers Class A shares, Class B shares, Class C shares, Class I shares, Class R shares and Class W shares. The six classes are substantially the same except that most Class A shares are subject to a sales charge imposed at the time of purchase and some Class A shares, and most Class B shares and Class C shares are subject to a contingent deferred sales charge imposed on shares redeemed within eighteen months, six years and one year, respectively. Class I shares, Class R shares, and Class W shares are not subject to a sales charge. Additionally, Class A shares, Class B shares, Class C shares, Class R shares and Class W shares incur distribution expenses.
The Fund will assess a 2% redemption fee, on Class A shares, Class B shares, Class C shares, Class I shares, Class R shares and Class W shares, which is paid directly to the Fund, for shares redeemed or exchanged within thirty days of purchase, subject to certain exceptions. The redemption fee is designed to protect the Fund and its remaining shareholders from the effects of short-term trading. These fees, if any, are included in the Statements of Changes in Net Assets.
The following is a summary of significant accounting policies:
A. Valuation of Investments — (1) For equity securities traded on foreign exchanges, the last reported sale price or the latest bid price may be used if there were no sales on a particular day; (2) an equity portfolio security listed or traded on the New York Stock Exchange ("NYSE") or American Stock Exchange or other domestic exchange is valued at its latest sale price prior to the time when assets are valued; if there were no sales that day, the security is valued at the mean between the last reported bid and ask price; (3) an equity portfolio security listed or traded on the Nasdaq is valued at the Nasdaq Official Closing Price; if there were no sales that day, the security is valued at the mean between the last reported bid and ask price; (4) all other domestic securities for which over-the-counter market quotations are readily available are valued at the mean between the last reported bid and ask price. In cases where a security is traded on more than one domestic exchange, the security is valued on the exchange designated as the primary market; (5) when market quotations are not readily available, including circumstances under which Morgan Stanley Investment Management Inc. (the "Adviser") or Morgan Stanley Investment Management Limited or Morgan Stanley Investment Management Company (each, a "Sub-Adviser"), each a wholly owned subsidiary of Morgan Stanley, determines that the latest sale price, the bid price or the mean between the last reported bid and ask price do not reflect a security's fair value, portfolio securities are valued at their fair value as determined in good faith under
19
Morgan Stanley International Value Equity Fund
Notes to Financial Statements n February 29, 2012 (unaudited) continued
procedures established by and under the general supervision of the Fund's Trustees. Occasionally, developments affecting the closing prices of securities and other assets may occur between the times at which valuations of such securities are determined (that is, close of the foreign market on which the securities trade) and the close of business on the NYSE. If developments occur during such periods that are expected to materially affect the value of such securities, such valuations may be adjusted to reflect the estimated fair value of such securities as of the close of the NYSE, as determined in good faith by the Fund's Trustees or by the Adviser using a pricing service and/or procedures approved by the Trustees of the Fund; (6) certain portfolio securities may be valued by an outside pricing service approved by the Fund's Trustees; (7) investments in mutual funds, including the Morgan Stanley Institutional Liquidity Funds, are valued at the net asset value as of the close of each business day; and (8) short-term debt securities having a maturity date of more than sixty days at time of purchase are valued on a mark-to-market basis until sixty days prior to maturity and thereafter at amortized cost based on their value on the 61st day. Short-term debt securities having a maturity date of sixty days or less at the time of purchase are valued at amortized cost, which approximates fair value.
B. Accounting for Investments — Security transactions are accounted for on the trade date (date the order to buy or sell is executed). Realized gains and losses on security transactions are determined by the identified cost method. Dividend income and other distributions are recorded on the ex-dividend date except for certain dividends on foreign securities which are recorded as soon as the Fund is informed after the ex-dividend date. Discounts are accreted and premiums are amortized over the life of the respective securities and are included in interest income. Interest income is accrued daily as earned.
C. Multiple Class Allocations — Investment income, expenses (other than distribution fees), and realized and unrealized gains and losses are allocated to each class of shares based upon the relative net asset value on the date such items are recognized. Distribution fees are charged directly to the respective class.
D. Foreign Currency Translation — The books and records of the Fund are maintained in U.S. dollars as follows: (1) the foreign currency market value of investment securities, other assets and liabilities and foreign currency exchange contracts are translated at the exchange rates prevailing at the end of the period; and (2) purchases, sales, income and expenses are translated at the exchange rates prevailing on the respective dates of such transactions. The resultant exchange gains and losses are recorded as realized and unrealized gains/losses on foreign currency exchange contracts and foreign currency translations. Pursuant to U.S. federal income tax regulations, certain foreign exchange gains/losses included in realized and unrealized gains/losses are included in or are a reduction of ordinary income for federal income tax purposes. The Fund does not isolate that portion of the results of operations arising as a result of changes in the foreign exchange rates from the changes in the market prices of the securities held.
20
Morgan Stanley International Value Equity Fund
Notes to Financial Statements n February 29, 2012 (unaudited) continued
E. Securities Lending — The Fund may lend securities to qualified financial institutions, such as broker-dealers, to earn additional income. Any increase or decrease in the fair value of the securities loaned that might occur and any interest earned or dividends declared on those securities during the term of the loan would remain in the Fund. The Fund receives cash or securities as collateral in an amount equal to or exceeding 100% of the current fair value of the loaned securities. The collateral is marked-to-market daily, by the securities lending agent, to ensure that a minimum of 100% collateral coverage is maintained.
Based on pre-established guidelines, the securities lending agent invests any cash collateral that is received in high-quality short-term investments. Securities lending income is generated from the earnings on the invested collateral and borrowing fees, less any rebates owed to the borrowers and compensation to the lending agent. The Fund has the right under the lending agreement to recover the securities from the borrower on demand.
The value of loaned securities and related collateral outstanding at February 29, 2012 were $15,072,160 and $15,940,028, respectively. The Fund received cash collateral of $15,930,056 which was subsequently invested in Repurchase Agreements and Morgan Stanley Institutional Liquidity Funds as reported in the Portfolio of Investments. At February 29, 2012, there was uninvested cash collateral of $9,972 which is not reflected in the Portfolio of Investments. The Fund has the right under the lending agreement to recover the securities from the borrower on demand.
F. Dividends and Distributions to Shareholders — Dividends and distributions to shareholders are recorded on the ex-dividend date.
G. Use of Estimates — The preparation of financial statements in accordance with generally accepted accounting principles in the United States ("GAAP") requires management to make estimates and assumptions that affect the reported amounts and disclosures. Actual results could differ from those estimates.
H. Indemnifications — The Fund enters into contracts that contain a variety of indemnifications. The Fund's maximum exposure under these arrangements is unknown. However, the Fund has not had prior claims or losses pursuant to these contracts and expects the risk of loss to be remote.
2. Fair Valuation Measurements
Financial Accounting Standards Board ("FASB") Accounting Standards Codification ("ASC") 820, Fair Value Measurements and Disclosures ("ASC 820"), defines fair value as the value that the Fund would receive to sell an investment or pay to transfer a liability in a timely transaction with an independent buyer in the principal market, or in the absence of a principal market the most advantageous market for the investment or liability. ASC 820 establishes a three-tier hierarchy to distinguish between (1) inputs
21
Morgan Stanley International Value Equity Fund
Notes to Financial Statements n February 29, 2012 (unaudited) continued
that reflect the assumptions market participants would use in valuing an asset or liability developed based on market data obtained from sources independent of the reporting entity (observable inputs); and (2) inputs that reflect the reporting entity's own assumptions about the assumptions market participants would use in valuing an asset or liability developed based on the best information available in the circumstances (unobservable inputs) and to establish classification of fair value measurements for disclosure purposes. Various inputs are used in determining the value of the Fund's investments. The inputs are summarized in the three broad levels listed below.
• Level 1 — unadjusted quoted prices in active markets for identical investments
• Level 2 — other significant observable inputs (including quoted prices for similar investments, interest rates, prepayment speeds, credit risk, etc.)
• Level 3 — significant unobservable inputs including the Fund's own assumptions in determining the fair value of investments. Factors considered in making this determination may include, but are not limited to, information obtained by contacting the issuer, analysts, or the appropriate stock exchange (for exchange-traded securities), analysis of the issuer's financial statements or other available documents and, if necessary, available information concerning other securities in similar circumstances
The inputs or methodology used for valuing securities are not necessarily an indication of the risk associated with investing in those securities and the determination of the significance of a particular input to the fair value measurement in its entirety requires judgment and considers factors specific to each security.
The following is a summary of the inputs used to value the Fund's investments as of February 29, 2012.
| INVESTMENT TYPE | | LEVEL 1
UNADJUSTED
QUOTED
PRICES | | LEVEL 2
OTHER
SIGNIFICANT
OBSERVABLE
INPUTS | | LEVEL 3
SIGNIFICANT
UNOBSERVABLE
INPUTS | | TOTAL | |
| Assets: | |
| Common Stocks | |
| Auto Components | | $ | 3,450,622 | | | $ | — | | | $ | — | | | $ | 3,450,622 | | |
| Automobiles | | | 5,442,415 | | | | — | | | | — | | | | 5,442,415 | | |
| Beverages | | | 2,547,219 | | | | — | | | | — | | | | 2,547,219 | | |
| Capital Markets | | | 2,318,696 | | | | — | | | | — | | | | 2,318,696 | | |
| Chemicals | | | 6,041,977 | | | | — | | | | — | | | | 6,041,977 | | |
| Commercial Banks | | | 13,279,286 | | | | — | | | | — | | | | 13,279,286 | | |
| Construction Materials | | | 4,239,042 | | | | — | | | | — | | | | 4,239,042 | | |
| Diversified Telecommunication Services | | | 2,762,830 | | | | — | | | | — | | | | 2,762,830 | | |
22
Morgan Stanley International Value Equity Fund
Notes to Financial Statements n February 29, 2012 (unaudited) continued
| INVESTMENT TYPE | | LEVEL 1
UNADJUSTED
QUOTED
PRICES | | LEVEL 2
OTHER
SIGNIFICANT
OBSERVABLE
INPUTS | | LEVEL 3
SIGNIFICANT
UNOBSERVABLE
INPUTS | | TOTAL | |
| Electric Utilities | | $ | 2,568,754 | | | $ | — | | | $ | — | | | $ | 2,568,754 | | |
| Electrical Equipment | | | 6,215,763 | | | | — | | | | — | | | | 6,215,763 | | |
| Electronic Equipment, Instruments & Components | | | 10,147,597 | | | | — | | | | — | | | | 10,147,597 | | |
| Energy Equipment & Services | | | 1,521,126 | | | | — | | | | — | | | | 1,521,126 | | |
| Food & Staples Retailing | | | 3,552,251 | | | | — | | | | — | | | | 3,552,251 | | |
| Food Products | | | 15,068,892 | | | | — | | | | — | | | | 15,068,892 | | |
| Household Durables | | | 1,894,452 | | | | — | | | | — | | | | 1,894,452 | | |
| Household Products | | | 7,242,297 | | | | — | | | | — | | | | 7,242,297 | | |
| Industrial Conglomerates | | | 2,513,041 | | | | — | | | | — | | | | 2,513,041 | | |
| Insurance | | | 16,278,257 | | | | — | | | | — | | | | 16,278,257 | | |
| Machinery | | | 1,950,413 | | | | — | | | | — | | | | 1,950,413 | | |
| Media | | | 495,867 | | | | — | | | | — | | | | 495,867 | | |
| Metals & Mining | | | 5,912,721 | | | | — | | | | — | | | | 5,912,721 | | |
| Oil, Gas & Consumable Fuels | | | 14,037,399 | | | | — | | | | — | | | | 14,037,399 | | |
| Pharmaceuticals | | | 18,771,923 | | | | — | | | | — | | | | 18,771,923 | | |
| Real Estate Management & Development | | | 3,309,263 | | | | — | | | | — | | | | 3,309,263 | | |
| Semiconductors & Semiconductor Equipment | | | 2,923,816 | | | | — | | | | — | | | | 2,923,816 | | |
| Software | | | 1,913,153 | | | | — | | | | — | | | | 1,913,153 | | |
| Tobacco | | | 15,836,883 | | | | — | | | | — | | | | 15,836,883 | | |
| Trading Companies & Distributors | | | 6,570,579 | | | | — | | | | — | | | | 6,570,579 | | |
| Wireless Telecommunication Services | | | 6,372,918 | | | | — | | | | — | | | | 6,372,918 | | |
| Total Common Stocks | | | 185,179,452 | | | | — | | | | — | | | | 185,179,452 | | |
| Short-Term Investments | |
| Repurchase Agreements | | | — | | | | 3,074,238 | | | | — | | | | 3,074,238 | | |
| Investment Company | | | 17,470,151 | | | | — | | | | — | | | | 17,470,151 | | |
| Total Short-Term Investments | | | 17,470,151 | | | | 3,074,238 | | | | — | | | | 20,544,389 | | |
| Total Assets | | $ | 202,649,603 | | | $ | 3,074,238 | | | $ | — | | | $ | 205,723,841 | | |
Transfers between investment levels may occur as the markets fluctuate and/or the availability of data used in an investment's valuation changes. The Fund recognizes transfers between the levels as of the end of the period. As of February 29, 2012, the Fund did not have any investments transfer between investment levels.
3. Investment Advisory/Administration and Sub-Advisory Agreements
Pursuant to an Investment Advisory Agreement with the Adviser, the Fund pays an advisory fee, accrued daily and payable monthly, by applying the annual rate of 0.80% to the net assets of the Fund determined as of the close of each business day.
23
Morgan Stanley International Value Equity Fund
Notes to Financial Statements n February 29, 2012 (unaudited) continued
Pursuant to an Administration Agreement with Morgan Stanley Services Company Inc. (the "Administrator"), an affiliate of the Adviser and Sub-Advisers, the Fund pays an administration fee, accrued daily and payable monthly, by applying the annual rate of 0.08% to the Fund's daily net assets.
Under the Sub-Advisory Agreement between the Adviser and the Sub-Advisers, the Sub-Advisers provide the Fund with investment advisory services, subject to the overall supervision of the Adviser and the Fund's Officers and Trustees. The Adviser pays the Sub-Advisers on a monthly basis a portion of the net advisory fees the Adviser receives from the Fund.
Under a Sub-Administration Agreement between the Administrator and State Street Bank and Trust Company ("State Street"), State Street provides certain administrative services to the Fund. For such services, the Administrator pays State Street a portion of the fee the Administrator receives from the Fund.
4. Plan of Distribution
Shares of the Fund are distributed by Morgan Stanley Distribution, Inc. (the "Distributor"), an affiliate of the Adviser, Administrator and Sub-Advisers. The Fund has adopted a Plan of Distribution (the "Plan") pursuant to Rule 12b-1 under the Act. The Plan provides that the Fund will pay the Distributor a fee which is accrued daily and paid monthly at the following annual rates: (i) Class A — up to 0.25% of the average daily net assets of Class A shares; (ii) Class B — up to 1.00% of the average daily net assets of Class B shares; (iii) Class C — up to 1.00% of the average daily net assets of Class C shares; (iv) Class R — up to 0.50% of the average daily net assets of Class R shares; and (v) Class W — up to 0.35% of the average daily net assets of Class W shares.
In the case of Class B shares, provided that the Plan continues in effect, any cumulative expenses incurred by the Distributor but not yet recovered may be recovered through the payment of future distribution fees from the Fund pursuant to the Plan and contingent deferred sales charges paid by investors upon redemption of Class B shares. Although there is no legal obligation for the Fund to pay expenses incurred in excess of payments made to the Distributor under the Plan and the proceeds of contingent deferred sales charges paid by investors upon redemption of shares, if for any reason the Plan is terminated, the Trustees will consider at that time the manner in which to treat such expenses. The Distributor has advised the Fund that there were no excess expenses at February 29, 2012.
The Fund's Distributor has agreed to reduce the 12b-1 fee on Class B shares of the Fund to the extent it exceeds 0.24% of the average daily net assets of such shares on an annualized basis. This waiver will continue for one year or until such time that the Board of Trustees acts to discontinue all or a portion of such waiver when it deems that such action is appropriate. For the six months ended February 29, 2012, the distribution fee was accrued for Class B at an annual rate of 0.24%.
24
Morgan Stanley International Value Equity Fund
Notes to Financial Statements n February 29, 2012 (unaudited) continued
At February 29, 2012, included in the Statement of Assets and Liabilities, is a receivable from the Fund's Distributor which represents payments due to be reimbursed to the Fund under the Plan. Because the Plan is what is referred to as a "reimbursement plan", the Distributor reimburses to the Fund any 12b-1 fees collected in excess of the actual distribution expenses incurred. This receivable represents this excess amount as of February 29, 2012.
In the case of Class A, Class C, Class R and Class W shares, expenses incurred pursuant to the Plan in any calendar year in excess of 0.25%, 1.00%, 0.50% or 0.35% of the average daily net assets of Class A, Class C, Class R or Class W shares, respectively, will not be reimbursed by the Fund through payments in any subsequent year, except that expenses representing a gross sales credit to Morgan Stanley Smith Barney Financial Advisors and other authorized financial representatives at the time of sale may be reimbursed in the subsequent calendar year. For the six months ended February 29, 2012, the distribution fee was accrued for Class A, Class C, Class R and Class W shares at the annual rate of 0.25%, 0.99%, 0.50% and 0.35%, respectively.
The Distributor has informed the Fund that for the six months ended February 29, 2012, it received contingent deferred sales charges from certain redemptions of the Fund's Class A shares, Class B shares and Class C shares of $178, $3,531 and $339, respectively, and received $459 in front-end sales charges from sales of the Fund's Class A shares. The respective shareholders pay such charges, which are not an expense of the Fund.
5. Security Transactions and Transactions with Affiliates
The cost of purchases and proceeds from sales of investment securities, excluding short-term investments, for the six months ended February 29, 2012 aggregated $24,556,171 and $45,337,249, respectively.
The Fund invests in the Institutional Class of the Morgan Stanley Institutional Liquidity Funds – Money Market Portfolio (the "Liquidity Funds"), an open-end management investment company managed by the Adviser, both directly, and as a portion of the securities held as collateral on loaned securities. Investment advisory fees paid by the Fund are reduced by an amount equal to its pro-rata share of the advisory and administration fees paid by the Fund due to its investment in the Liquidity Funds. For the six months ended February 29, 2012, advisory fees paid were reduced by $2,238 relating to the Fund's investment in the Liquidity Funds.
25
Morgan Stanley International Value Equity Fund
Notes to Financial Statements n February 29, 2012 (unaudited) continued
A summary of the Fund's transactions in shares of the Liquidity Funds during the six months ended February 29, 2012 is as follows:
VALUE
AUGUST 31, 2011 | | PURCHASES
AT COST | | SALES | | DIVIDEND
INCOME | | VALUE
FEBRUARY 29, 2012 | |
| $ | 5,819,812 | | | $ | 34,227,467 | | | $ | 22,577,128 | | | $ | 1,746 | | | $ | 17,470,151 | | |
For the six months ended February 29, 2012, the Fund incurred brokerage commissions of $1,433 with Citigroup, Inc., and its affiliated broker/dealers, which may be deemed affiliates of the Adviser, Sub-Advisers, Administrator and Distributor under Section 17 of the Act, for portfolio transactions executed on behalf of the Fund.
Morgan Stanley Services Company Inc., an affiliate of the Adviser, Sub-Advisers and Distributor, is the Fund's transfer agent.
The Fund has an unfunded Deferred Compensation Plan (the "Compensation Plan"), which allows each independent Trustee to defer payment of all, or a portion, of the fees he or she receives for serving on the Board of Trustees. Each eligible Trustee generally may elect to have the deferred amounts credited with a return equal to the total return on one or more of the Morgan Stanley funds that are offered as investment options under the Compensation Plan. Appreciation/depreciation and distributions received from these investments are recorded with an offsetting increase/decrease in the deferred compensation obligation and do not affect the net asset value of the Fund.
6. Expense Offset
The Fund has entered into an arrangement with State Street (the "Custodian"), whereby credits realized on uninvested cash balances were used to offset a portion of the Fund's expenses. If applicable, these custodian credits are shown as "expense offset" in the Statement of Operations.
7. Purposes of and Risks Relating to Certain Financial Instruments
The Fund may lend securities to qualified financial institutions, such as broker-dealers, to earn additional income. Risks in securities lending transactions are that a borrower may not provide additional collateral when required or return the securities when due, and that the value of the short-term investments will be less than the amount of cash collateral plus any rebate that is required to be returned to the borrower.
At February 29, 2012, investments in securities of issuers in the United Kingdom and Japan were 35.1% and 23.4%, respectively, of the Fund's net assets. These investments, as well as other non-U.S. securities, may be affected by economic or political developments in these countries.
26
Morgan Stanley International Value Equity Fund
Notes to Financial Statements n February 29, 2012 (unaudited) continued
At February 29, 2012, the Fund's cash balance consisted of interest bearing deposits with State Street, the Fund's Custodian.
8. Shares of Beneficial Interest@@
Transactions in shares of beneficial interest were as follows:
| | | FOR THE SIX
MONTHS ENDED
FEBRUARY 29, 2012 | | FOR THE YEAR
ENDED
AUGUST 31, 2011 | |
| | | (unaudited) | | | |
| | | SHARES | | AMOUNT | | SHARES | | AMOUNT | |
| CLASS A SHARES | |
| Sold | | | 203,731 | | | $ | 1,617,790 | | | | 429,153 | | | $ | 3,626,067 | | |
| Reinvestment of dividends | | | 71,593 | | | | 543,388 | | | | 103,988 | | | | 881,820 | | |
| Redeemed | | | (647,480 | ) | | | (5,074,449 | ) | | | (1,965,245 | ) | | | (16,969,631 | ) | |
| Net decrease — Class A | | | (372,156 | ) | | | (2,913,271 | ) | | | (1,432,104 | ) | | | (12,461,744 | ) | |
| B SHARES | |
| Sold | | | 33,156 | | | | 256,438 | | | | 60,845 | | | | 525,360 | | |
| Reinvestment of dividends | | | 81,585 | | | | 615,150 | | | | 123,751 | | | | 1,043,224 | | |
| Redeemed | | | (753,655 | ) | | | (5,890,527 | ) | | | (2,036,711 | ) | | | (17,411,437 | ) | |
| Net decrease — Class B | | | (638,914 | ) | | | (5,018,939 | ) | | | (1,852,115 | ) | | | (15,842,853 | ) | |
| CLASS C SHARES | |
| Sold | | | 9,738 | | | | 74,940 | | | | 31,037 | | | | 264,787 | | |
| Reinvestment of dividends | | | 9,030 | | | | 68,268 | | | | 20,409 | | | | 171,845 | | |
| Redeemed | | | (266,360 | ) | | | (2,050,582 | ) | | | (709,518 | ) | | | (5,996,536 | ) | |
| Net decrease — Class C | | | (247,592 | ) | | | (1,907,374 | ) | | | (658,072 | ) | | | (5,559,904 | ) | |
| CLASS I SHARES | |
| Sold | | | 117,464 | | | | 932,621 | | | | 420,132 | | | | 3,643,885 | | |
| Reinvestment of dividends | | | 208,485 | | | | 1,582,404 | | | | 279,570 | | | | 2,373,549 | | |
| Redeemed | | | (1,287,033 | ) | | | (10,146,358 | ) | | | (3,552,113 | ) | | | (30,685,773 | ) | |
| Net decrease — Class I | | | (961,084 | ) | | | (7,631,333 | ) | | | (2,852,411 | ) | | | (24,668,339 | ) | |
| CLASS W SHARES | |
| Sold | | | — | | | | — | | | | 118 | | | | 1,000 | | |
| Reinvestment of dividends | | | 2 | | | | 14 | | | | — | | | | — | | |
| Net increase — Class W | | | 2 | | | | 14 | | | | 118 | | | | 1,000 | | |
| Net decrease in Fund | | | (2,219,744 | ) | | $ | (17,470,903 | ) | | | (6,794,584 | ) | | $ | (58,531,840 | ) | |
@@ The Fund will suspend offering its shares to new investors when the Fund's assets reach $1 billion. Following the general suspension of the offering of the Fund's shares to new investors, the Fund will continue to offer its shares to existing shareholders and may recommence offering its shares to other new investors in the future.
27
Morgan Stanley International Value Equity Fund
Notes to Financial Statements n February 29, 2012 (unaudited) continued
9. Federal Income Tax Status
It is the Fund's intention to continue to qualify as a regulated investment company and distribute all of its taxable and tax-exempt income. Accordingly, no provision for Federal income taxes is required in the financial statements.
Dividends from net investment income, if any, are declared and paid annually. Net realized capital gains, if any, are distributed at least annually.
The Fund may be subject to taxes imposed by countries in which it invests. Such taxes are generally based on income and/or capital gains earned or repatriated. Taxes are accrued based on net investment income, net realized gains and net unrealized appreciation as such income and/or gains are earned. Taxes may also be based on transactions in foreign currency and are accrued based on the value of investments denominated in such currency.
FASB ASC 740-10, Income Taxes — Overall, sets forth a minimum threshold for financial statement recognition of the benefit of a tax position taken or expected to be taken in a tax return. Management has concluded there are no significant uncertain tax positions that would require recognition in the financial statements. If applicable, the Fund recognizes interest accrued related to unrecognized tax benefits in "Interest Expense" and penalties in ''Other Expenses" in the Statement of Operations. The Fund files tax returns with the U.S. Internal Revenue Service, New York and various states. Each of the tax years in the four-year period ended August 31, 2011, remains subject to examination by taxing authorities.
The tax character of distributions paid may differ from the character of distributions shown in the Statements of Changes in Net Assets due to short-term capital gains being treated as ordinary income for tax purposes. The tax character of distributions paid during fiscal 2011 and 2010 was as follows:
| 2011 DISTRIBUTIONS PAID FROM: | | 2010 DISTRIBUTIONS PAID FROM: | |
| ORDINARY INCOME | | ORDINARY INCOME | |
| $ | 4,555,364 | | | $ | 7,534,955 | | |
The amount and character of income and gains to be distributed are determined in accordance with income tax regulations which may differ from GAAP. These book/tax differences are either considered temporary or permanent in nature.
Temporary differences are primarily due to differing book and tax treatments in the timing of the recognition of gains (losses) on certain investment transactions and the timing of the deductibility of certain expenses.
28
Morgan Stanley International Value Equity Fund
Notes to Financial Statements n February 29, 2012 (unaudited) continued
Permanent differences, primarily due to foreign currency gains, resulted in the following reclassifications among the Fund's components of net assets at August 31, 2011:
ACCUMULATED
UNDISTRIBUTED NET
INVESTMENT INCOME | | ACCUMULATED
NET REALIZED
LOSS | | PAID-IN-CAPITAL | |
| $ | 90,157 | | | $ | (90,157 | ) | | | — | | |
At August 31, 2011, the components of distributable earnings for the Fund on a tax basis were as follows:
| UNDISTRIBUTED ORDINARY INCOME | | UNDISTRIBUTED LONG-TERM CAPITAL GAIN | |
| $ | 2,865,241 | | | $ | — | | |
At February 29, 2012, the aggregate cost for federal income tax purposes approximates the aggregate cost for book purposes. The aggregate gross unrealized appreciation is $17,892,375 and the aggregate gross unrealized depreciation is $14,784,883 resulting in net unrealized appreciation of $3,107,492.
On December 22, 2010, the Regulated Investment Company Modernization Act of 2010 (the "Modernization Act") was signed into law. The Modernization Act modernizes several tax provisions related to Regulated Investment Companies ("RICs") and their shareholders. One key change made by the Modernization Act is that capital losses will generally retain their character as short-term or long-term and may be carried forward indefinitely to offset future gains. These losses are utilized before other capital loss carryforwards that expire. Generally, the Modernization Act is effective for taxable years beginning after December 22, 2010.
At August 31, 2011, the Fund had available for Federal income tax purposes capital loss carryforwards which will expire on the indicated dates:
| AMOUNT | | EXPIRATION | |
| $ | 10,993,096 | | | August 31, 2017 | |
| | 80,509,345 | | | August 31, 2018 | |
| | 3,067,200 | | | August 31, 2019 | |
To the extent that capital loss carryforwards are used to offset any future capital gains realized during the carryover period as provided by U.S. Federal income tax regulations, no capital gains tax liability will be incurred by a Fund for gains realized and not distributed. To the extent that capital gains are offset, such gains will not be distributed to the shareholders.
29
Morgan Stanley International Value Equity Fund
Notes to Financial Statements n February 29, 2012 (unaudited) continued
10. Accounting Pronouncement
In May 2011, FASB issued Accounting Standards Update ("ASU") 2011-04. The amendments in this update are the results of the work of FASB and the International Accounting Standards Board to develop common requirements for measuring fair value and for disclosing information about fair value measurements, which are effective during interim and annual periods beginning after December 15, 2011. Consequently, these amendments improve the comparability of fair value measurements presented and disclosed in the financial statements prepared in accordance with GAAP and International Financial Reporting Standards. At this time, the Fund's management is evaluating the implications of ASU 2011-04.
30
Morgan Stanley International Value Equity Fund
Financial Highlights
Selected ratios and per share data for a share of beneficial interest outstanding throughout each period:
| | | FOR THE SIX | | FOR THE YEAR ENDED AUGUST 31, | |
| | | MONTHS ENDED | | | |
| | | FEBRUARY 29, 2012 | | 2011 | | 2010^ | | 2009^ | | 2008^ | | 2007^ | |
| | | (unaudited) | | | | | | | | | | | |
| Class A Shares | |
| Selected Per Share Data: | |
| Net asset value, beginning of period | | $ | 8.14 | | | $ | 7.49 | | | $ | 7.86 | | | $ | 10.26 | | | $ | 14.09 | | | $ | 14.06 | | |
| Income (loss) from investment operations: | |
| Net investment income(1) | | | 0.04 | | | | 0.15 | | | | 0.12 | | | | 0.14 | | | | 0.21 | | | | 0.21 | | |
| Net realized and unrealized gain (loss) | | | 0.45 | | | | 0.65 | | | | (0.29 | ) | | | (1.55 | ) | | | (1.63 | ) | | | 1.88 | | |
Total income (loss) from investment
operations | | | 0.49 | | | | 0.80 | | | | (0.17 | ) | | | (1.41 | ) | | | (1.42 | ) | | | 2.09 | | |
| Less dividends and distributions from: | |
| Net investment income | | | (0.12 | ) | | | (0.15 | ) | | | (0.20 | ) | | | (0.26 | ) | | | (0.14 | ) | | | (0.22 | ) | |
| Net realized gain | | | — | | | | — | | | | — | | | | (0.73 | ) | | | (2.27 | ) | | | (1.84 | ) | |
| Total dividends and distributions | | | (0.12 | ) | | | (0.15 | ) | | | (0.20 | ) | | | (0.99 | ) | | | (2.41 | ) | | | (2.06 | ) | |
| Net asset value, end of period | | $ | 8.51 | | | $ | 8.14 | | | $ | 7.49 | | | $ | 7.86 | | | $ | 10.26 | | | $ | 14.09 | | |
| Total Return(2) | | | 6.18 | %(6) | | | 10.62 | % | | | (2.35 | )% | | | (11.70 | )% | | | (12.36 | )% | | | 15.93 | % | |
| Ratios to Average Net Assets(3): | |
| Total expenses | | | 1.48 | %(4)(7) | | | 1.47 | %(4) | | | 1.51 | %(4) | | | 1.50 | %(4) | | | 1.36 | %(4) | | | 1.36 | %(4) | |
| Net investment income | | | 1.02 | %(4)(7) | | | 1.72 | %(4) | | | 1.48 | %(4) | | | 1.99 | %(4) | | | 1.72 | %(4) | | | 1.51 | %(4) | |
| Rebate from Morgan Stanley affiliate | | | 0.00 | %(5)(7) | | | 0.00 | %(5) | | | 0.00 | %(5) | | | 0.00 | %(5) | | | 0.00 | %(5) | | | 0.00 | %(5) | |
| Supplemental Data: | |
| Net assets, end of period, in thousands | | $ | 38,402 | | | $ | 39,757 | | | $ | 47,304 | | | $ | 57,939 | | | $ | 89,770 | | | $ | 125,527 | | |
| Portfolio turnover rate | | | 13 | %(6) | | | 29 | % | | | 36 | % | | | 25 | % | | | 36 | % | | | 29 | % | |
^ Beginning with the year ended August 31, 2011, the Fund was audited by Ernst & Young LLP. The previous years were audited by another independent registered public accounting firm.
(1) The per share amounts were computed using an average number of shares outstanding during the period.
(2) Does not reflect the deduction of sales charge. Calculated based on the net asset value as of the last business day of the period.
(3) Reflects overall Fund ratios for investment income and non-class specific expenses.
(4) The ratios reflect the rebate of certain Fund expenses in connection with investments in a Morgan Stanley affiliate during the period. The effect of the rebate on the ratios is disclosed in the above table as "Rebate from Morgan Stanley affiliate."
(5) Amount is less than 0.005%.
(6) Not annualized.
(7) Annualized.
See Notes to Financial Statements
31
Morgan Stanley International Value Equity Fund
Financial Highlights continued
| | | FOR THE SIX | | FOR THE YEAR ENDED AUGUST 31, | |
| | | MONTHS ENDED | | | |
| | | FEBRUARY 29, 2012 | | 2011 | | 2010^ | | 2009^ | | 2008^ | | 2007^ | |
| | | (unaudited) | | | | | | | | | | | |
| Class B Shares | |
| Selected Per Share Data: | |
| Net asset value, beginning of period | | $ | 8.09 | | | $ | 7.45 | | | $ | 7.83 | | | $ | 10.24 | | | $ | 13.95 | | | $ | 13.89 | | |
| Income (loss) from investment operations: | |
| Net investment income(1) | | | 0.04 | | | | 0.15 | | | | 0.12 | | | | 0.15 | | | | 0.22 | | | | 0.14 | | |
| Net realized and unrealized gain (loss) | | | 0.45 | | | | 0.65 | | | | (0.29 | ) | | | (1.55 | ) | | | (1.61 | ) | | | 1.85 | | |
Total income (loss) from investment
operations | | | 0.49 | | | | 0.80 | | | | (0.17 | ) | | | (1.40 | ) | | | (1.39 | ) | | | 1.99 | | |
| Less dividends and distributions from: | |
| Net investment income | | | (0.12 | ) | | | (0.16 | ) | | | (0.21 | ) | | | (0.28 | ) | | | (0.05 | ) | | | (0.09 | ) | |
| Net realized gain | | | — | | | | — | | | | — | | | | (0.73 | ) | | | (2.27 | ) | | | (1.84 | ) | |
| Total dividends and distributions | | | (0.12 | ) | | | (0.16 | ) | | | (0.21 | ) | | | (1.01 | ) | | | (2.32 | ) | | | (1.93 | ) | |
| Net asset value, end of period | | $ | 8.46 | | | $ | 8.09 | | | $ | 7.45 | | | $ | 7.83 | | | $ | 10.24 | | | $ | 13.95 | | |
| Total Return(2) | | | 6.23 | %(7) | | | 10.60 | % | | | (2.33 | )% | | | (11.61 | )% | | | (12.18 | )% | | | 15.32 | % | |
| Ratios to Average Net Assets(3): | |
| Total expenses | | | 1.47 | %(4)(5)(8) | | | 1.45 | %(4) | | | 1.45 | %(4) | | | 1.34 | %(4) | | | 1.25 | %(4) | | | 1.89 | %(4) | |
| Net investment income | | | 1.03 | %(4)(5)(8) | | | 1.74 | %(4) | | | 1.54 | %(4) | | | 2.15 | %(4) | | | 1.83 | %(4) | | | 0.98 | %(4) | |
| Rebate from Morgan Stanley affiliate | | | 0.00 | %(6)(8) | | | 0.00 | %(6) | | | 0.00 | %(6) | | | 0.00 | %(6) | | | 0.00 | %(6) | | | 0.00 | %(6) | |
| Supplemental Data: | |
| Net assets, end of period, in thousands | | $ | 43,554 | | | $ | 46,832 | | | $ | 56,906 | | | $ | 75,250 | | | $ | 122,494 | | | $ | 184,035 | | |
| Portfolio turnover rate | | | 13 | %(7) | | | 29 | % | | | 36 | % | | | 25 | % | | | 36 | % | | | 29 | % | |
^ Beginning with the year ended August 31, 2011, the Fund was audited by Ernst & Young LLP. The previous years were audited by another independent registered public accounting firm.
(1) The per share amounts were computed using an average number of shares outstanding during the period.
(2) Does not reflect the deduction of sales charge. Calculated based on the net asset value as of the last business day of the period.
(3) Reflects overall Fund ratios for investment income and non-class specific expenses.
(4) The ratios reflect the rebate of certain Fund expenses in connection with investments in a Morgan Stanley affiliate during the period. The effect of the rebate on the ratios is disclosed in the above table as "Rebate from Morgan Stanley affiliate."
(5) If the Distributor had not rebated a portion of its fee to the Fund, the expense and net investment income ratios would have been as follows:
| PERIOD ENDED | | EXPENSE
RATIO | | NET INVESTMENT
INCOME RATIO | |
| February 29, 2012 | | | 1.48 | % | | | 1.02 | % | |
(6) Amount is less than 0.005%.
(7) Not annualized.
(8) Annualized.
See Notes to Financial Statements
32
Morgan Stanley International Value Equity Fund
Financial Highlights continued
| | | FOR THE SIX | | FOR THE YEAR ENDED AUGUST 31, | |
| | | MONTHS ENDED | | | |
| | | FEBRUARY 29, 2012 | | 2011 | | 2010^ | | 2009^ | | 2008^ | | 2007^ | |
| | | (unaudited) | | | | | | | | | | | |
| Class C Shares | |
| Selected Per Share Data: | |
| Net asset value, beginning of period | | $ | 8.05 | | | $ | 7.39 | | | $ | 7.76 | | | $ | 10.06 | | | $ | 13.84 | | | $ | 13.83 | | |
| Income (loss) from investment operations: | |
| Net investment income(1) | | | 0.01 | | | | 0.08 | | | | 0.06 | | | | 0.09 | | | | 0.12 | | | | 0.11 | | |
| Net realized and unrealized gain (loss) | | | 0.45 | | | | 0.66 | | | | (0.29 | ) | | | (1.51 | ) | | | (1.60 | ) | | | 1.85 | | |
Total income (loss) from investment
operations | | | 0.46 | | | | 0.74 | | | | (0.23 | ) | | | (1.42 | ) | | | (1.48 | ) | | | 1.96 | | |
| Less dividends and distributions from: | |
| Net investment income | | | (0.04 | ) | | | (0.08 | ) | | | (0.14 | ) | | | (0.15 | ) | | | (0.03 | ) | | | (0.11 | ) | |
| Net realized gain | | | — | | | | — | | | | — | | | | (0.73 | ) | | | (2.27 | ) | | | (1.84 | ) | |
| Total dividends and distributions | | | (0.04 | ) | | | (0.08 | ) | | | (0.14 | ) | | | (0.88 | ) | | | (2.30 | ) | | | (1.95 | ) | |
| Net asset value, end of period | | $ | 8.47 | | | $ | 8.05 | | | $ | 7.39 | | | $ | 7.76 | | | $ | 10.06 | | | $ | 13.84 | | |
| Total Return(2) | | | 5.77 | %(6) | | | 9.91 | % | | | (3.15 | )% | | | (12.38 | )% | | | (12.97 | )% | | | 15.17 | % | |
| Ratios to Average Net Assets(3): | |
| Total expenses | | | 2.22 | %(4)(7) | | | 2.21 | %(4) | | | 2.26 | %(4) | | | 2.25 | %(4) | | | 2.08 | %(4) | | | 2.06 | %(4) | |
| Net investment income | | | 0.28 | %(4)(7) | | | 0.98 | %(4) | | | 0.73 | %(4) | | | 1.24 | %(4) | | | 1.00 | %(4) | | | 0.81 | %(4) | |
| Rebate from Morgan Stanley affiliate | | | 0.00 | %(5)(7) | | | 0.00 | %(5) | | | 0.00 | %(5) | | | 0.00 | %(5) | | | 0.00 | %(5) | | | 0.00 | %(5) | |
| Supplemental Data: | |
| Net assets, end of period, in thousands | | $ | 14,471 | | | $ | 15,741 | | | $ | 19,328 | | | $ | 25,217 | | | $ | 41,975 | | | $ | 66,486 | | |
| Portfolio turnover rate | | | 13 | %(6) | | | 29 | % | | | 36 | % | | | 25 | % | | | 36 | % | | | 29 | % | |
^ Beginning with the year ended August 31, 2011, the Fund was audited by Ernst & Young LLP. The previous years were audited by another independent registered public accounting firm.
(1) The per share amounts were computed using an average number of shares outstanding during the period.
(2) Does not reflect the deduction of sales charge. Calculated based on the net asset value as of the last business day of the period.
(3) Reflects overall Fund ratios for investment income and non-class specific expenses.
(4) The ratios reflect the rebate of certain Fund expenses in connection with investments in a Morgan Stanley affiliate during the period. The effect of the rebate on the ratios is disclosed in the above table as "Rebate from Morgan Stanley affiliate."
(5) Amount is less than 0.005%.
(6) Not annualized.
(7) Annualized.
See Notes to Financial Statements
33
Morgan Stanley International Value Equity Fund
Financial Highlights continued
| | | FOR THE SIX | | FOR THE YEAR ENDED AUGUST 31, | |
| | | MONTHS ENDED | | | |
| | | FEBRUARY 29, 2012 | | 2011 | | 2010^ | | 2009^ | | 2008^ | | 2007^ | |
| | | (unaudited) | | | | | | | | | | | |
| Class I Shares | |
| Selected Per Share Data: | |
| Net asset value, beginning of period | | $ | 8.17 | | | $ | 7.52 | | | $ | 7.89 | | | $ | 10.32 | | | $ | 14.16 | | | $ | 14.12 | | |
| Income (loss) from investment operations: | |
| Net investment income(1) | | | 0.05 | | | | 0.17 | | | | 0.14 | | | | 0.16 | | | | 0.24 | | | | 0.25 | | |
| Net realized and unrealized gain (loss) | | | 0.44 | | | | 0.65 | | | | (0.29 | ) | | | (1.56 | ) | | | (1.63 | ) | | | 1.88 | | |
Total income (loss) from investment
operations | | | 0.49 | | | | 0.82 | | | | (0.15 | ) | | | (1.40 | ) | | | (1.39 | ) | | | 2.13 | | |
| Less dividends and distributions from: | |
| Net investment income | | | (0.14 | ) | | | (0.17 | ) | | | (0.22 | ) | | | (0.30 | ) | | | (0.18 | ) | | | (0.25 | ) | |
| Net realized gain | | | — | | | | — | | | | — | | | | (0.73 | ) | | | (2.27 | ) | | | (1.84 | ) | |
| Total dividends and distributions | | | (0.14 | ) | | | (0.17 | ) | | | (0.22 | ) | | | (1.03 | ) | | | (2.45 | ) | | | (2.09 | ) | |
| Net asset value, end of period | | $ | 8.52 | | | $ | 8.17 | | | $ | 7.52 | | | $ | 7.89 | | | $ | 10.32 | | | $ | 14.16 | | |
| Total Return(2) | | | 6.27 | %(6) | | | 10.88 | % | | | (2.10 | )% | | | (11.44 | )% | | | (12.14 | )% | | | 16.20 | % | |
| Ratios to Average Net Assets(3): | |
| Total expenses | | | 1.23 | %(4)(7) | | | 1.22 | %(4) | | | 1.26 | %(4) | | | 1.25 | %(4) | | | 1.11 | %(4) | | | 1.12 | %(4) | |
| Net investment income | | | 1.27 | %(4)(7) | | | 1.97 | %(4) | | | 1.73 | %(4) | | | 2.24 | %(4) | | | 1.97 | %(4) | | | 1.75 | %(4) | |
| Rebate from Morgan Stanley affiliate | | | 0.00 | %(5)(7) | | | 0.00 | %(5) | | | 0.00 | %(5) | | | 0.00 | %(5) | | | 0.00 | %(5) | | | 0.00 | %(5) | |
| Supplemental Data: | |
| Net assets, end of period, in thousands | | $ | 92,581 | | | $ | 96,576 | | | $ | 110,313 | | | $ | 144,113 | | | $ | 283,181 | | | $ | 436,827 | | |
| Portfolio turnover rate | | | 13 | %(6) | | | 29 | % | | | 36 | % | | | 25 | % | | | 36 | % | | | 29 | % | |
^ Beginning with the year ended August 31, 2011, the Fund was audited by Ernst & Young LLP. The previous years were audited by another independent registered public accounting firm.
(1) The per share amounts were computed using an average number of shares outstanding during the period.
(2) Calculated based on the net asset value as of the last business day of the period.
(3) Reflects overall Fund ratios for investment income and non-class specific expenses.
(4) The ratios reflect the rebate of certain Fund expenses in connection with investments in a Morgan Stanley affiliate during the period. The effect of the rebate on the ratios is disclosed in the above table as "Rebate from Morgan Stanley affiliate."
(5) Amount is less than 0.005%.
(6) Not annualized.
(7) Annualized.
See Notes to Financial Statements
34
Morgan Stanley International Value Equity Fund
Financial Highlights continued
| | | FOR THE SIX
MONTHS ENDED | | FOR THE YEAR ENDED AUGUST 31, | | FOR THE PERIOD
MARCH 31, 2008(1)
THROUGH | |
| | | FEBRUARY 29, 2012 | | 2011 | | 2010^ | | 2009^ | | AUGUST 31, 2008^ | |
| | | (unaudited) | | | | | | | | | |
| Class R Shares | |
| Selected Per Share Data: | |
| Net asset value, beginning of period | | $ | 8.08 | | | $ | 7.44 | | | $ | 7.81 | | | $ | 10.25 | | | $ | 11.17 | | |
| Income (loss) from investment operations: | |
| Net investment income(2) | | | 0.03 | | | | 0.13 | | | | 0.10 | | | | 0.13 | | | | 0.10 | | |
| Net realized and unrealized gain | | | 0.44 | | | | 0.65 | | | | (0.28 | ) | | | (1.56 | ) | | | (1.02 | ) | |
Total income (loss) from investment
operations | | | 0.47 | | | | 0.78 | | | | (0.18 | ) | | | (1.43 | ) | | | (0.92 | ) | |
| Less dividends and distributions from: | |
| Net investment income | | | (0.10 | ) | | | (0.14 | ) | | | (0.19 | ) | | | (0.28 | ) | | | — | | |
| Net realized gain | | | — | | | | — | | | | — | | | | (0.73 | ) | | | — | | |
| Total dividends and distributions | | | (0.10 | ) | | | (0.14 | ) | | | (0.19 | ) | | | (1.01 | ) | | | — | | |
| Net asset value, end of period | | $ | 8.45 | | | $ | 8.08 | | | $ | 7.44 | | | $ | 7.81 | | | $ | 10.25 | | |
| Total Return(3) | | | 5.99 | %(7) | | | 10.34 | % | | | (2.52 | )% | | | (11.94 | )% | | | (8.24 | )%(7) | |
| Ratios to Average Net Assets(4): | |
| Total expenses | | | 1.73 | %(5)(8) | | | 1.72 | %(5) | | | 1.76 | %(5) | | | 1.75 | %(5) | | | 1.61 | %(5)(8) | |
| Net investment income | | | 0.77 | %(5)(8) | | | 1.47 | %(5) | | | 1.23 | %(5) | | | 1.74 | %(5) | | | 2.18 | %(5)(8) | |
| Rebate from Morgan Stanley affiliate | | | 0.00 | %(6)(8) | | | 0.00 | %(6) | | | 0.00 | %(6) | | | 0.00 | %(6) | | | 0.00 | %(6)(8) | |
| Supplemental Data: | |
| Net assets, end of period, in thousands | | $ | 87 | | | $ | 84 | | | $ | 77 | | | $ | 81 | | | $ | 92 | | |
| Portfolio turnover rate | | | 13 | %(7) | | | 29 | % | | | 36 | % | | | 25 | % | | | 36 | %(7) | |
^ Beginning with the year ended August 31, 2011, the Fund was audited by Ernst & Young LLP. The previous years were audited by another independent registered public accounting firm.
(1) The date shares were first issued.
(2) The per share amounts were computed using an average number of shares outstanding during the period.
(3) Calculated based on the net asset value as of the last business day of the period.
(4) Reflects overall Fund ratios for investment income and non-class specific expenses.
(5) The ratios reflect the rebate of certain Fund expenses in connection with investments in a Morgan Stanley affiliate during the period. The effect of the rebate on the ratios is disclosed in the above table as "Rebate from Morgan Stanley affiliate."
(6) Amount is less than 0.005%.
(7) Not annualized.
(8) Annualized.
See Notes to Financial Statements
35
Morgan Stanley International Value Equity Fund
Financial Highlights continued
| | | FOR THE SIX
MONTHS ENDED | | FOR THE YEAR ENDED AUGUST 31, | | FOR THE PERIOD
MARCH 31, 2008(1)
THROUGH | |
| | | FEBRUARY 29, 2012 | | 2011 | | 2010^ | | 2009^ | | AUGUST 31, 2008^ | |
| | | (unaudited) | | | | | | | | | |
| Class W Shares | |
| Selected Per Share Data: | |
| Net asset value, beginning of period | | $ | 8.09 | | | $ | 7.45 | | | $ | 7.82 | | | $ | 10.26 | | | $ | 11.17 | | |
| Income (loss) from investment operations: | |
| Net investment income(2) | | | 0.04 | | | | 0.14 | | | | 0.11 | | | | 0.14 | | | | 0.11 | | |
| Net realized and unrealized gain (loss) | | | 0.44 | | | | 0.65 | | | | (0.28 | ) | | | (1.56 | ) | | | (1.02 | ) | |
Total income (loss) from investment
operations | | | 0.48 | | | | 0.79 | | | | (0.17 | ) | | | (1.42 | ) | | | (0.91 | ) | |
| Less dividends and distributions from: | |
| Net investment income | | | (0.11 | ) | | | (0.15 | ) | | | (0.20 | ) | | | (0.29 | ) | | | — | | |
| Net realized gain | | | — | | | | — | | | | — | | | | (0.73 | ) | | | — | | |
| Total dividends and distributions | | | (0.11 | ) | | | (0.15 | ) | | | (0.20 | ) | | | (1.02 | ) | | | — | | |
| Net asset value, end of period | | $ | 8.46 | | | $ | 8.09 | | | $ | 7.45 | | | $ | 7.82 | | | $ | 10.26 | | |
| Total Return(3) | | | 6.16 | %(7) | | | 10.49 | % | | | (2.40 | )% | | | (11.83 | )% | | | (8.15 | )%(7) | |
| Ratios to Average Net Assets(4): | |
| Total expenses | | | 1.58 | %(5)(8) | | | 1.57 | %(5) | | | 1.61 | %(5) | | | 1.60 | %(5) | | | 1.46 | %(5)(8) | |
| Net investment income | | | 0.92 | %(5)(8) | | | 1.62 | %(5) | | | 1.38 | %(5) | | | 1.89 | %(5) | | | 2.33 | %(5)(8) | |
| Rebate from Morgan Stanley affiliate | | | 0.00 | %(6)(8) | | | 0.00 | %(6) | | | 0.00 | %(6) | | | 0.00 | %(6) | | | 0.00 | %(6)(8) | |
| Supplemental Data: | |
| Net assets, end of period, in thousands | | $ | 89 | | | $ | 85 | | | $ | 77 | | | $ | 81 | | | $ | 92 | | |
| Portfolio turnover rate | | | 13 | %(7) | | | 29 | % | | | 36 | % | | | 25 | % | | | 36 | %(7) | |
^ Beginning with the year ended August 31, 2011, the Fund was audited by Ernst & Young LLP. The previous years were audited by another independent registered public accounting firm.
(1) The date shares were first issued.
(2) The per share amounts were computed using an average number of shares outstanding during the period.
(3) Calculated based on the net asset value as of the last business day of the period.
(4) Reflects overall Fund ratios for investment income and non-class specific expenses.
(5) The ratios reflect the rebate of certain Fund expenses in connection with investments in a Morgan Stanley affiliate during the period. The effect of the rebate on the ratios is disclosed in the above table as "Rebate from Morgan Stanley affiliate."
(6) Amount is less than 0.005%.
(7) Not annualized.
(8) Annualized.
See Notes to Financial Statements
36
Morgan Stanley International Value Equity Fund
U.S. Privacy Policy (unaudited)
An Important Notice Concerning Our U.S. Privacy Policy
This privacy notice describes the U.S. privacy policy of Morgan Stanley Distribution, Inc., and the Morgan Stanley family of mutual funds ("us", "our", "we").
We are required by federal law to provide you with notice of our U.S. privacy policy ("Policy"). This Policy applies to both our current and former clients unless we state otherwise and is intended for individual clients who purchase products or receive services from us for personal, family or household purposes. This Policy is not applicable to partnerships, corporations, trusts or other non-individual clients or account holders, nor is this Policy applicable to individuals who are either beneficiaries of a trust for which we serve as trustee or participants in an employee benefit plan administered or advised by us. This Policy is, however, applicable to individuals who select us to be a custodian of securities or assets in individual retirement accounts, 401(k) accounts, or accounts subject to the Uniform Gifts to Minors Act.
This notice sets out our business practices to protect your privacy; how we collect and share personal information about you; and how you can limit our sharing or certain uses by others of this information. We may amend this Policy at any time, and will inform you of any changes to our Policy as required by law.
We Respect Your Privacy
We appreciate that you have provided us with your personal financial information and understand your concerns about your information. We strive to safeguard the information our clients entrust to us. Protecting the confidentiality and security of client information is an important part of how we conduct our business.
This notice describes what personal information we collect about you, how we collect it, when we may share it with others, and how certain others may use it. It discusses the steps you may take to limit our sharing of certain information about you with our affiliated companies, including, but not limited to our affiliated banking businesses, brokerage firms and credit service affiliates. It also discloses how you may limit our affiliates' use of shared information for marketing purposes.
Throughout this Policy, we refer to the nonpublic information that personally identifies you as "personal information." We also use the term "affiliated company" in this notice. An affiliated company is a company in our family of companies and includes companies with the Morgan Stanley name. These affiliated companies are financial institutions such as broker-dealers, banks, investment advisers and credit card issuers. We refer to any company that is not an affiliated company as a nonaffiliated third party. For purposes of Section 5 of this notice, and your ability to limit certain uses of personal information by our affiliates, this notice applies to the use of personal information by our affiliated companies.
37
Morgan Stanley International Value Equity Fund
U.S. Privacy Policy (unaudited) continued
1. What Personal Information Do We Collect From You?
We may collect the following types of information about you: (i) information provided by you, including information from applications and other forms we receive from you, (ii) information about your transactions with us or our affiliates, (iii) information about your transactions with nonaffiliated third parties, (iv) information from consumer reporting agencies, (v) information obtained from our websites, and (vi) information obtained from other sources. For example:
• We collect information such as your name, address, e-mail address, telephone/fax numbers, assets, income and investment objectives through applications and other forms you submit to us.
• We may obtain information about account balances, your use of account(s) and the types of products and services you prefer to receive from us through your dealings and transactions with us and other sources.
• We may obtain information about your creditworthiness and credit history from consumer reporting agencies.
• We may collect background information from and through third-party vendors to verify representations you have made and to comply with various regulatory requirements.
2. When Do We Disclose Personal Information We Collect About You?
We may disclose personal information we collect about you in each of the categories listed above to affiliated and nonaffiliated third parties.
a. Information We Disclose to Affiliated Companies. We may disclose personal information that we collect about you to our affiliated companies to manage your account(s) effectively, to service and process your transactions, and to let you know about products and services offered by us and affiliated companies, to manage our business, and as otherwise required or permitted by law. Offers for products and services from affiliated companies are developed under conditions designed to safeguard your personal information.
b. Information We Disclose to Third Parties. We may disclose personal information that we collect about you to nonaffiliated third parties to provide marketing services on our behalf or to other financial institutions with whom we have joint marketing agreements. We may also disclose all of the information we collect to other nonaffiliated third parties for our everyday business purposes, such as to process transactions, maintain account(s), respond to court orders and legal investigations, report to credit bureaus, offer our own products and services, protect against fraud, for institutional risk control, to perform services on our behalf, and as otherwise required or permitted by law.
38
Morgan Stanley International Value Equity Fund
U.S. Privacy Policy (unaudited) continued
When we share personal information about you with a nonaffiliated third party, they are required to limit their use of personal information about you to the particular purpose for which it was shared and they are not allowed to share personal information about you with others except to fulfill that limited purpose or as may be permitted or required by law.
3. How Do We Protect The Security and Confidentiality of Personal Information We Collect About You?
We maintain physical, electronic and procedural security measures that comply with applicable law and regulations to help safeguard the personal information we collect about you. We have internal policies governing the proper handling of client information by employees. Third parties that provide support or marketing services on our behalf may also receive personal information about you, and we require them to adhere to appropriate security standards with respect to such information.
4. How Can You Limit Our Sharing Certain Personal Information About You With Our Affiliated Companies For Eligibility Determination?
By following the opt-out procedures in Section 6, below, you may limit the extent to which we share with our affiliated companies, personal information that was collected to determine your eligibility for products and services such as your credit reports and other information that you have provided to us or that we may obtain from third parties ("eligibility information"). Eligibility information does not include your identification information or personal information pertaining to our transactions or experiences with you. Please note that, even if you direct us not to share eligibility information with our affiliated companies, we may still share your personal information, including eligibility information, with our affiliated companies under circumstances that are permitted under applicable law, such as to process transactions or to service your account.
5. How Can You Limit the Use of Certain Personal Information About You by Our Affiliated Companies for Marketing?
By following the opt-out instructions in Section 6, below, you may limit our affiliated companies from marketing their products or services to you based on personal information we disclose to them. This information may include, for example, your income and account history with us. Please note that, even if you choose to limit our affiliated companies from using personal information about you that we may share with them for marketing their products and services to you, our affiliated companies may use your personal information that they obtain from us to market to you in circumstances permitted by law, such as if the affiliated party has its own relationship with you.
39
Morgan Stanley International Value Equity Fund
U.S. Privacy Policy (unaudited) continued
6. How Can You Send Us an Opt-Out Instruction?
If you wish to limit our sharing of eligibility information about you with our affiliated companies, or our affiliated companies' use of personal information for marketing purposes, as described in this notice, you may do so by:
• Calling us at (800) 548-7786
Monday–Friday between 8a.m. and 5p.m. (EST)
• Writing to us at the following address:
Morgan Stanley Services Company Inc.
c/o Privacy Coordinator
201 Plaza Two, 3rd Floor
Jersey City, New Jersey 07311
If you choose to write to us, your request should include: your name, address, telephone number and account number(s) to which the opt-out applies and whether you are opting out with respect to sharing of eligibility information (Section 4 above), or information used for marketing (Section 5 above), or both. Written opt-out requests should not be sent with any other correspondence. In order to process your request, we require that the request be provided by you directly and not through a third party. Once you have informed us about your privacy preferences, your opt-out preference will remain in effect with respect to this Policy (as it may be amended) until you notify us otherwise. If you are a joint account owner, we will accept instructions from any one of you and apply those instructions to the entire account.
Please understand that if you limit our sharing or our affiliated companies' use of personal information, you and any joint account holder(s) may not receive information about our affiliated companies' products and services, including products or services that could help you manage your financial resources and achieve your investment objectives.
If you have more than one account or relationship with us, please specify the accounts to which you would like us to apply your privacy choices. If you have accounts or relationships with our affiliates, you may receive multiple privacy policies from them, and will need to separately notify those companies of your privacy choices for those accounts or relationships.
7. What if an affiliated company becomes a nonaffiliated third party?
If, at any time in the future, an affiliated company becomes a nonaffiliated third party, further disclosures of personal information made to the former affiliated company will be limited to those described in Section 2(b) above relating to nonaffiliated third parties. If you elected under Section 6 to limit disclosures we make to affiliated companies, or use of personal information by affiliated companies, your election will not apply to use by any former affiliated company of your personal information in their possession once it becomes a nonaffiliated third party.
40
Morgan Stanley International Value Equity Fund
U.S. Privacy Policy (unaudited) continued
Special Notice to Residents of Vermont
The following section supplements our Policy with respect to our individual clients who have a Vermont address and supersedes anything to the contrary in the above Policy with respect to those clients only.
The State of Vermont requires financial institutions to obtain your consent prior to sharing personal information that they collect about you with nonaffiliated third parties, or eligibility information with affiliated companies, other than in certain limited circumstances. Except as permitted by law, we will not share personal information we collect about you with nonaffiliated third parties or eligibility information with affiliated companies, unless you provide us with your written consent to share such information.
Special Notice to Residents of California
The following section supplements our Policy with respect to our individual clients who have a California address and supersedes anything to the contrary in the above Policy with respect to those clients only.
In response to a California law, if your account has a California home address, your personal information will not be disclosed to nonaffiliated third parties except as permitted by applicable California law, and we will limit sharing such personal information with our affiliates to comply with California privacy laws that apply to us.
41
(This page has been left blank intentionally.)
(This page has been left blank intentionally.)

June 29, 2012
Supplement
SUPPLEMENT DATED JUNE 29, 2012 TO THE PROSPECTUS OF
MORGAN STANLEY INTERNATIONAL FUND
Dated February 29, 2012
The first sentence of the first paragraph of the section of the Prospectus entitled "Shareholder Information—How to Exchange Shares—Permissible Fund Exchanges." is hereby deleted and replaced with the following:
You may exchange shares of any Class of the Fund for the same Class of: Morgan Stanley European Equity Fund Inc., Morgan Stanley Focus Growth Fund, Morgan Stanley Global Fixed Income Opportunities Fund, Morgan Stanley Global Infrastructure Fund, Morgan Stanley Global Strategist Fund, Morgan Stanley International Value Equity Fund, Morgan Stanley Mid Cap Growth Fund, Morgan Stanley Mortgage Securities Trust, Morgan Stanley Multi Cap Growth Trust and Morgan Stanley U.S. Government Securities Trust (each, a "Morgan Stanley Multi-Class Fund"), if available, or for shares of Morgan Stanley California Tax-Free Daily Income Trust, Morgan Stanley Liquid Asset Fund Inc., Morgan Stanley New York Municipal Money Market Trust, Morgan Stanley Tax-Free Daily Income Trust and Morgan Stanley U.S. Government Money Market Trust (each, a "Morgan Stanley Money Market Fund") or the Morgan Stanley Limited Duration U.S. Government Trust, if available, without the imposition of an exchange fee.
PLEASE RETAIN THIS SUPPLEMENT FOR FUTURE REFERENCE.
INLSPT3 6/12

June 12, 2012
Supplement
SUPPLEMENT DATED JUNE 12, 2012 TO THE PROSPECTUS OF
MORGAN STANLEY INTERNATIONAL FUND
Dated February 29, 2012
Effective as of the close of business on June 12, 2012, Class A, Class C and Class I shares of the Fund will be closed for purchases by new investors.
PLEASE RETAIN THIS SUPPLEMENT FOR FUTURE REFERENCE.
INLSPT2 6/12

May 14, 2012
Supplement
SUPPLEMENT DATED MAY 14, 2012 TO THE PROSPECTUS OF
MORGAN STANLEY INTERNATIONAL FUND
Dated February 29, 2012
Effective as of the close of business on May 16, 2012, the Fund is suspending the continuous offering of its Class R shares and Class W shares and thus, no further purchases of Class R shares or Class W shares of the Fund may be made by investors. In addition, Class B shares of the Fund will be closed for purchases by new investors as of the close of business on May 16, 2012.
PLEASE RETAIN THIS SUPPLEMENT FOR FUTURE REFERENCE.
INLSPT1 5/12

May 2, 2012
Supplement
SUPPLEMENT DATED MAY 2, 2012 TO THE PROSPECTUS OF
MORGAN STANLEY INTERNATIONAL FUND
Dated February 29, 2012
The Board of Trustees (the "Board") of Morgan Stanley International Fund (the "Fund") approved an Agreement and Plan of Reorganization by and between the Fund and Morgan Stanley Institutional Fund, Inc., on behalf of its series Active International Allocation Portfolio ("Active International Allocation"), pursuant to which substantially all of the assets of the Fund would be combined with those of Active International Allocation and shareholders of the Fund would become shareholders of Active International Allocation, receiving shares of Active International Allocation equal to the value of their holdings in the Fund (the "Reorganization"). Each shareholder of the Fund would receive the Class of shares of Active International Allocation that corresponds to the Class of shares of the Fund currently held by that shareholder. The Reorganization is subject to the approval of shareholders of the Fund at a special meeting of shareholders scheduled to be held during the third quarter of 2012. A proxy statement formally detailing the proposal, the reasons for the Reorganization and information concerning Active International Allocation is expected to be distributed to shareholders of the Fund during the third quarter of 2012.
PLEASE RETAIN THIS SUPPLEMENT FOR FUTURE REFERENCE.
INLSPT 5/12
INVESTMENT MANAGEMENT

Morgan Stanley
International Fund

A mutual fund that seeks long-term capital growth.
Prospectus
February 29, 2012
The Securities and Exchange Commission ("SEC") has not approved or disapproved these securities or passed upon the adequacy of this Prospectus. Any representation to the contrary is a criminal offense.
| Share Class | | Ticker
Symbol | |
| Class A | | INLAX | |
|
| Class B | | INLBX | |
|
| Class C | | INLCX | |
|
| Class I | | INLDX | |
|
| Class R | | INLRX | |
|
| Class W | | INLWX | |
|
Contents
Fund Summary
| Investment Objective | | | 1 | | |
|
| Fees and Expenses | | | 1 | | |
|
| Portfolio Turnover | | | 2 | | |
|
| Principal Investment Strategies | | | 2 | | |
|
| Principal Risks | | | 3 | | |
|
| Past Performance | | | 3 | | |
|
| Adviser | | | 5 | | |
|
| Purchase and Sale of Fund Shares | | | 5 | | |
|
| Tax Information | | | 5 | | |
|
| Payments to Broker-Dealers and Other Financial Intermediaries | | | 5 | | |
|
Fund Details
| Additional Information about the Fund's Investment Objective, Strategies and Risks | | | 6 | | |
|
| Portfolio Holdings | | | 12 | | |
|
| Fund Management | | | 12 | | |
|
Shareholder Information
| Pricing Fund Shares | | | 13 | | |
|
| How to Buy Shares | | | 14 | | |
|
| How to Exchange Shares | | | 15 | | |
|
| How to Sell Shares | | | 17 | | |
|
| Distributions | | | 21 | | |
|
| Frequent Purchases and Redemptions of Fund Shares | | | 21 | | |
|
| Tax Consequences | | | 22 | | |
|
| Share Class Arrangements | | | 24 | | |
|
| Additional Information | | | 32 | | |
|
| Financial Highlights | | | 33 | | |
|
This Prospectus contains important information about the Fund. Please read it carefully and keep it for future reference.
Fund Summary
Investment Objective
Morgan Stanley International Fund seeks long-term capital growth.
Fees and Expenses
The table below describes the fees and expenses that you may pay if you buy and hold shares of the Fund. You may qualify for sales charge discounts if you and your family invest, or agree to invest in the future, at least $25,000 in the Morgan Stanley Funds. More information about these and other discounts is available from your financial advisor and in the "Share Class Arrangements" section beginning on page 24 of this Prospectus and in the "Purchase, Redemption and Pricing of Shares" section beginning on page 50 of the Fund's Statement of Additional Information ("SAI").
Shareholder Fees (fees paid directly from your investment)
| | | Class A | | Class B | | Class C | | Class I | | Class R | | Class W | |
Maximum sales
charge (load)
imposed on
purchases (as
a percentage
of offering price) | | | 5.25 | %1 | | | None | | | | None | | | | None | | | | None | | | | None | | |
Maximum
deferred
sales charge
(load) (as a
percentage
based on the
lesser of the
offering price
or net asset
value at
redemption) | | | None2 | | | | 5.00 | %3 | | | 1.00 | %3 | | | None | | | | None | | | | None | | |
Redemption
fee4 | | | 2.00 | % | | | 2.00 | % | | | 2.00 | % | | | 2.00 | % | | | 2.00 | % | | | 2.00 | % | |
Annual Fund Operating Expenses (expenses that you pay each year as a percentage of the value of your investment)
| | | Class A | | Class B | | Class C | | Class I | | Class R | | Class W | |
| Advisory fee | | | 0.65 | % | | | 0.65 | % | | | 0.65 | % | | | 0.65 | % | | | 0.65 | % | | | 0.65 | % | |
Distribution and
service (12b-1)
fees | | | 0.25 | % | | | 1.00 | % | | | 0.99 | % | | | None | | | | 0.50 | % | | | 0.35 | % | |
Other
expenses | | | 0.68 | % | | | 0.68 | % | | | 0.68 | % | | | 0.68 | % | | | 0.68 | % | | | 0.68 | % | |
Total annual
Fund operating
expenses | | | 1.58 | % | | | 2.33 | % | | | 2.32 | % | | | 1.33 | % | | | 1.83 | % | | | 1.68 | % | |
Example
The example below is intended to help you compare the cost of investing in the Fund with the cost of investing in other mutual funds.
The example assumes that you invest $10,000 in the Fund, your investment has a 5% return each year, and the Fund's operating expenses remain the same (except for the ten-year amounts for Class B shares which reflect the conversion to Class A shares eight years after the end of the calendar month in which the shares were purchased). Although your actual costs may be higher or lower, based on these assumptions your costs would be:
If You SOLD Your Shares:
| | | 1 Year | | 3 Years | | 5 Years | | 10 Years | |
| Class A | | $ | 677 | | | $ | 998 | | | $ | 1,340 | | | $ | 2,305 | | |
| Class B | | $ | 736 | | | $ | 1,027 | | | $ | 1,445 | | | $ | 2,479 | | |
| Class C | | $ | 335 | | | $ | 724 | | | $ | 1,240 | | | $ | 2,656 | | |
| Class I | | $ | 135 | | | $ | 421 | | | $ | 729 | | | $ | 1,601 | | |
| Class R | | $ | 186 | | | $ | 576 | | | $ | 990 | | | $ | 2,148 | | |
| Class W | | $ | 171 | | | $ | 530 | | | $ | 913 | | | $ | 1,987 | | |
morganstanley.com/im
1
If You HELD Your Shares:
| | | 1 Year | | 3 Years | | 5 Years | | 10 Years | |
| Class A | | $ | 677 | | | $ | 998 | | | $ | 1,340 | | | $ | 2,305 | | |
| Class B | | $ | 236 | | | $ | 727 | | | $ | 1,245 | | | $ | 2,479 | | |
| Class C | | $ | 235 | | | $ | 724 | | | $ | 1,240 | | | $ | 2,656 | | |
| Class I | | $ | 135 | | | $ | 421 | | | $ | 729 | | | $ | 1,601 | | |
| Class R | | $ | 186 | | | $ | 576 | | | $ | 990 | | | $ | 2,148 | | |
| Class W | | $ | 171 | | | $ | 530 | | | $ | 913 | | | $ | 1,987 | | |
(1) Reduced for purchases of $25,000 and over.
(2) Investments that are not subject to any sales charges at the time of purchase are subject to a contingent deferred sales charge ("CDSC") of 1.00% that will be imposed if you sell your shares within 18 months after purchase, except for certain specific circumstances.
(3) The Class B CDSC is scaled down to 1.00% during the sixth year, reaching zero thereafter, and the Class C CDSC is only applicable if you sell your shares within one year after purchase. See "Share Class Arrangements" for a complete discussion of the CDSC.
(4) Payable to the Fund on shares redeemed or exchanged within 30 days of purchase. The redemption fee is based on the redemption proceeds. See "Shareholder Information—How to Sell Shares" for more information on redemption fees.
Portfolio Turnover
The Fund pays transaction costs, such as commissions, when it buys and sells securities (or "turns over" its portfolio). A higher portfolio turnover rate may indicate higher transaction costs and may result in higher taxes when Fund shares are held in a taxable account. These costs, which are not reflected in Total annual Fund operating expenses or in the Example, affect the Fund's performance. During the most recent fiscal year, the Fund's portfolio turnover rate was 33% of the average value of its portfolio.
Principal Investment Strategies
The Fund will normally invest at least 65% of its assets in a diversified portfolio of international common stocks and other equity securities. The Fund's "Adviser," Morgan Stanley Investment Management Inc., uses a "top-down" approach that emphasizes region, country, sector and industry selection and weightings over individual stock selection.
Region, Country, Sector and Industry Selection. The Adviser first considers the regions and countries (including emerging market or developing countries) and sectors and industries represented in the Morgan Stanley Capital International (MSCI) EAFE (Europe, Australasia and Far East) Index (the "Index"). The Adviser—on an ongoing basis—establishes the proportion or weighting for each country and/or sector (e.g., overweight, underweight or neutral) relative to the Index for investment by the Fund. The Adviser may choose to overweight or underweight particular sectors, such as telecommunications or banking, within each country or region. In making its determinations, the Adviser evaluates factors such as valuation, economic outlook, corporate earnings growth, inflation, liquidity and risk characteristics, investor sentiment, interest rates and currency outlook. The Fund invests in at least three separate countries.
Stock Selection. The Adviser invests the Fund's assets within each country and/or sector based on its assigned weighting. Within each country and/or sector, the Adviser tries to broadly replicate, in the aggregate, the performance of a broad local market index by investing in "baskets" of common stocks and other equity securities, which may include depositary receipts, preferred securities and convertible securities. The Fund may invest in emerging market or developing countries and, with regard to such investments, may make global, regional and sector allocations to specific emerging market or developing countries. In most cases, the local MSCI index for that country will be the broad local market index.
The Fund may also invest up to 10% of its net assets in real estate investment trusts ("REITs") and foreign real estate companies.
The Fund may, but it is not required to, use derivative instruments for a variety of purposes, including hedging, risk management, portfolio management or to earn income. The Fund's use of derivatives may involve the purchase and sale of derivative instruments such as futures, options, swaps, contracts for difference ("CFDs") and other related instruments and techniques. The Fund may utilize forward foreign currency exchange contracts, which are also derivatives, in connection with its investments in foreign securities. These derivative instruments will be counted toward the Fund's 65% policy discussed above to the extent they have economic characteristics similar to the securities included within that policy.
2
Principal Risks
There is no assurance that the Fund will achieve its investment objective and you can lose money investing in this Fund. The principal risks of investing in the Fund include:
• Common Stock and Other Equity Securities. In general, stock and other equity security values fluctuate, and sometimes widely fluctuate, in response to activities specific to the company as well as general market, economic and political conditions. To the extent that the Fund invests in convertible securities, and the convertible security's investment value is greater than its conversion value, its price will be likely to increase when interest rates fall and decrease when interest rates rise. If the conversion value exceeds the investment value, the price of the convertible security will tend to fluctuate directly with the price of the underlying equity security.
• Foreign and Emerging Market Securities. Investments in foreign markets entail special risks such as currency, political, economic and market risks. There also may be greater market volatility, less reliable financial information, higher transaction and custody costs, decreased market liquidity and less government and exchange regulation associated with investments in foreign markets. In addition, investments in certain foreign markets, which have historically been considered stable, may become more volatile and subject to increased risk due to ongoing developments and changing conditions in such markets. Moreover, the growing interconnectivity of global economies and financial markets has increased the probability that adverse developments and conditions in one country or region will affect the stability of economies and financial markets in other countries or regions. The risks of investing in emerging market countries are greater than risks associated with investments in foreign developed countries. In addition, the Fund's investments may be denominated in foreign currencies and therefore, changes in the value of a country's currency compared to the U.S. dollar may affect the value of the Fund's investments. Hedging the Fund's currency risks through forward foreign currency exchange contracts involves the risk of mismatching the Fund's objectives under a forward foreign currency exchange contract with the value of securities denominated in a particular currency. There is additional risk that such transactions reduce or preclude the opportunity for gain and that currency contracts create exposure to currencies in which the Fund's securities are not denominated. The use of forward foreign currency exchange contracts involves the risk of loss from the insolvency or bankruptcy of the counterparty to the contract or the failure of the counterparty to make payments or otherwise comply with the terms of the contract.
• REITs and Foreign Real Estate Companies. REITs and foreign real estate companies are susceptible to risks associated with the ownership of real estate and the real estate industry in general. In addition, REITs and foreign real estate companies depend on specialized management skills, may not be diversified, may have less trading volume and may be subject to more abrupt or erratic price movements than the overall securities market. Investments in REITs and foreign real estate companies may involve duplication of management fees and certain other expenses.
• Derivatives. A derivative instrument often has risks similar to its underlying instrument and may have additional risks, including imperfect correlation between the value of the derivative and the underlying instrument, risks of default by the other party to certain transactions, magnification of losses incurred due to changes in the market value of the securities, instruments, indices or interest rates to which they relate, and risks that the transactions may not be liquid. Certain derivative transactions may give rise to a form of leverage. Leverage magnifies the potential for gain and the risk of loss.
Shares of the Fund are not bank deposits and are not guaranteed or insured by the Federal Deposit Insurance Corporation or any other government agency.
Past Performance
The bar chart and table below provide some indication of the risks of investing in the Fund by showing changes in the Fund's Class B shares' performance from year to year and by showing how the Fund's average annual returns for the one, five and 10 year periods and life of Fund (where applicable) compared with those of a broad measure of market performance, as well as an index that represents a group of similar mutual funds, over time. The performance of other Classes will differ because the Classes have different ongoing fees. The performance information in the bar chart does not reflect the deduction of sales charges; if these amounts were reflected, returns would be less than shown. The Fund's
morganstanley.com/im
3
returns in the table include the maximum applicable sales charge for each Class and assume you sold your shares at the end of each period (unless otherwise noted). The Fund's past performance (before and after taxes) does not indicate how the Fund will perform in the future. Updated performance information is available online at www.morganstanley.com/im or by calling toll-free (800) 869-NEWS.
Annual Total Returns—Calendar Years
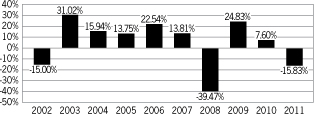
High Quarter 6/30/09: 23.42%
Low Quarter 9/30/11: –20.79%
Average Annual Total Returns For Periods Ended
December 31, 2011
| | | | | Past 1
Year | | Past 5
Years | | Past 10
Years | | Life of
Fund | |
| Class A1: | | Return Before Taxes | | | –19.63 | % | | | –5.16 | % | | | 3.66 | % | | | — | | |
| Class B1: | | Return Before Taxes | | | –20.04 | % | | | –5.25 | % | | | 3.59 | %* | | | — | | |
| | Return After Taxes
on Distributions2 | | | –19.80 | % | | | –5.19 | % | | | 3.61 | %* | | | — | | |
| | Return After Taxes
on Distributions and
Sale of Fund Shares | | | –12.79 | % | | | –4.25 | % | | | 3.26 | %* | | | — | | |
| Class C1: | | Return Before Taxes | | | –16.66 | % | | | –4.87 | % | | | 3.45 | % | | | — | | |
| Class I1: | | Return Before Taxes | | | –14.98 | % | | | –3.90 | % | | | 4.48 | % | | | — | | |
| | MSCI EAFE Index
(reflects no
deduction for fees,
expenses or taxes)3 | | | –12.14 | % | | | –4.72 | % | | | 4.67 | % | | | — | | |
| | Lipper International
Large-Cap Core
Funds Index (reflects
no deduction for
taxes)4 | | | –13.56 | % | | | –4.96 | % | | | 3.91 | % | | | — | | |
| | | | | Past 1
Year | | Past 5
Years | | Past 10
Years | | Life of
Fund | |
| Class R1: | | Return Before Taxes | | | –15.39 | % | | | — | | | | — | | | | –6.86 | % | |
| Class W1: | | Return Before Taxes | | | –15.29 | % | | | — | | | | — | | | | –6.73 | % | |
| | MSCI EAFE Index
(reflects no
deduction for fees,
expenses or taxes)3 | | | –12.14 | % | | | — | | | | — | | | | –6.55 | %5 | |
| | Lipper International
Large-Cap Core
Funds Index (reflects
no deduction for
taxes)4 | | | –13.56 | % | | | — | | | | — | | | | –7.24 | %5 | |
* Effective April 2005, Class B shares will generally convert to Class A shares approximately eight years after the end of the calendar month in which the shares were purchased. The "Past 10 Years" performance for Class B shares reflects this conversion.
(1) Classes A, B, C and I commenced operations on June 28, 1999. Class R and Class W commenced operations on March 31, 2008.
(2) These returns do not reflect any tax consequences from a sale of your shares at the end of each period, but they do reflect any applicable sales charges on such a sale.
(3) The Morgan Stanley Capital International (MSCI) EAFE Index (Europe, Australasia, Far East) is a free float-adjusted market capitalization index that is designed to measure the international equity market performance of developed markets, excluding the United States & Canada. The term "free float" represents the portion of shares outstanding that are deemed to be available for purchase in the public equity markets by investors. The MSCI EAFE Index currently consists of 22 developed market country indices. The performance of the Index is listed in U.S. dollars and assumes reinvestment of net dividends. It is not possible to invest directly in an index.
(4) The Lipper International Large-Cap Core Funds Index is an equally weighted performance index of the largest qualifying funds (based on net assets) in the Lipper International Large-Cap Core Funds classification. There are currently 30 funds represented in this Index.
(5) Life of Fund reflects inception date of March 31, 2008.
The after-tax returns shown in the table above are calculated using the historical highest individual federal marginal income tax rates during the period shown and do not reflect the impact of state and local taxes. After-tax returns for the Fund's other Classes will vary from the Class B shares' returns. Actual after-tax returns depend on an investor's tax situation and may differ from those shown, and after-tax returns are not relevant to investors who hold their Fund shares through tax-deferred arrangements, such as
4
401(k) plans or individual retirement accounts. After-tax returns may be higher than before-tax returns due to foreign tax credits and/or an assumed benefit from capital losses that would have been realized had Fund shares been sold at the end of the relevant periods, as applicable.
Adviser
Adviser. Morgan Stanley Investment Management Inc.
Portfolio Managers. The Fund is managed by members of the Active International Allocation team. Information about the member primarily responsible for the day-to-day management of the Fund's portfolio is shown below:
| Name | | Title with
Adviser | | Date Began
Managing
Fund | |
| Ann D. Thivierge | | Managing Director | | June 1999 | |
|
Purchase and Sale of Fund Shares
Minimum Investment Amounts
| | | Minimum Investment | |
| Investment Options | | Initial | | Additional | |
| Regular Account | | $ | 1,000 | | | $ | 100 | | |
| Individual Retirement Account | | $ | 1,000 | | | $ | 100 | | |
| Coverdell Education Savings Account | | $ | 500 | | | $ | 100 | | |
EasyInvest®
(Automatically from your checking or
savings account or Money Market Fund) | | $ | 100
| * | | $ | 100
| * | |
* Provided your schedule of investments totals $1,000 in 12 months.
You may not be subject to the minimum investment requirements under certain circumstances. For more information, please refer to the "How to Buy Shares—Minimum Investment Amounts" section beginning on page 15 of this Prospectus.
You can purchase or sell Fund shares by contacting your Morgan Stanley Smith Barney Financial Advisor or other authorized financial representative. You can also sell Fund shares at any time by telephonic request to the Fund or by enrolling in a systematic withdrawal plan. In addition, you can purchase additional Fund shares or sell Fund shares by written request to the Fund.
Your shares will be sold at the next price calculated after we receive your order to redeem. If you redeem Class A, Class B or Class C shares, your net sale proceeds are reduced by the amount of any applicable CDSC.
To contact a Morgan Stanley Smith Barney Financial Advisor, call toll-free 1-866-MORGAN8 for the telephone number of the Morgan Stanley Smith Barney office nearest you or access our office locator at www.morganstanley.com. To sell shares by telephone, call (800) 869-NEWS. To purchase additional Fund shares or sell Fund shares by mail, contact the Fund's transfer agent, Morgan Stanley Services Company Inc. (the "Transfer Agent"), at: Morgan Stanley Services Company Inc., P.O. Box 219885, Kansas City, MO 64121-9885 (for purchases) or Morgan Stanley Services Company Inc., P.O. Box 219886, Kansas City, MO 64121-9886 (for sales). For more information, please refer to the "How to Buy Shares" and "How to Sell Shares" sections, beginning on page 14 and page 17, respectively, of this Prospectus.
Tax Information
The Fund intends to make distributions that may be taxed as ordinary income or capital gains, unless you are investing through a tax-deferred arrangement, such as a 401(k) plan or an individual retirement account.
Payments to Broker-Dealers and Other Financial Intermediaries
If you purchase the Fund through a broker-dealer or other financial intermediary (such as a bank), the Adviser and/or the Fund's "Distributor," Morgan Stanley Distribution, Inc., may pay the intermediary for the sale of Fund shares and related services. These payments, which may be significant in amount, may create a conflict of interest by influencing the broker-dealer or other intermediary and your salesperson to recommend the Fund over another investment. Ask your salesperson or visit your financial intermediary's web site for more information.
morganstanley.com/im
5
Fund Details
Capital Growth
An investment objective having the goal of selecting securities with the potential to rise in price rather than pay out dividend income.
MSCI EAFE Countries
include Australia, Japan, New Zealand, most nations in Western Europe, Hong Kong and Singapore.
Additional Information about the Fund's Investment Objective, Strategies and Risks
Investment Objective
Morgan Stanley International Fund seeks long-term capital growth.
Principal Investment Strategies
The Fund will normally invest at least 65% of its assets in a diversified portfolio of international common stocks and other equity securities. The Adviser uses a "top-down" approach that emphasizes region, country, sector and industry selection and weightings over individual stock selection. The Fund may also use derivative instruments as discussed herein. These derivative instruments will be counted toward the 65% policy discussed above to the extent they have economic characteristics similar to the securities included within that policy.
Region, Country, Sector and Industry Selection. The Adviser first considers the countries (including emerging market or developing countries) and sectors represented in the Index. The Adviser—on an ongoing basis—establishes the proportion or weighting for each country and/or sector (e.g., overweight, underweight or neutral) relative to the Index for investment by the Fund. The Adviser may choose to overweight or underweight particular sectors or industries, such as telecommunications or banking, within each country or region. In making its determinations, the Adviser evaluates factors such as valuation, economic outlook, corporate earnings growth, inflation, liquidity and risk characteristics, investor sentiment, interest rates and currency outlook. The Fund invests in at least three separate countries.
Stock Selection. The Adviser invests the Fund's assets within each country and/or sector based on its assigned weighting. Within each country and/or sector, the Adviser tries to broadly replicate, in the aggregate, the performance of a broad local market index by investing in "baskets" of common stocks and other equity securities, which may include depositary receipts, preferred securities and convertible securities. The Fund may invest in emerging market or developing countries and, with regard to such investments, may make global, regional and sector allocations to specific emerging market or developing countries. In most cases, the local MSCI index for that country will be one of the broad local market indexes.
6
Common stock is a share ownership or equity interest in a corporation. It may or may not pay dividends, as some companies reinvest all of their profits back into their businesses, while others pay out some of their profits to shareholders as dividends. A depositary receipt is generally issued by a bank or financial institution and represents an ownership interest in the common stock or other equity securities of a foreign company.
In addition to the securities discussed above, the Fund may also invest in equity and/or fixed-income and convertible securities of issuers located anywhere in the world, including the United States, and securities of other investment companies. The Fund may also invest up to 10% of its net assets in REITs and foreign real estate companies, which are similar to entities organized and operated as REITs in the United States. REITs and foreign real estate companies pool investor funds for investments primarily in real estate properties or real estate-related loans. They may also include, among other businesses, real estate developers, brokers and operating companies whose products and services are significantly related to the real estate industry such as building suppliers and mortgage lenders.
The Fund may, but it is not required to, use derivative instruments for a variety of purposes, including hedging, risk management, portfolio management or to earn income. Derivatives are financial instruments whose value is based on the value of an underlying asset, interest rate, index or financial instrument. The Fund's use of derivatives may involve the purchase and sale of derivative instruments such as futures, options, swaps, CFDs and other related instruments and techniques. The Fund may also use forward foreign currency exchange contracts, which are also derivatives, in connection with its investments in foreign securities.
In pursuing the Fund's investment objective, the Adviser has considerable leeway in deciding which investments it buys, holds or sells on a day-to-day basis and which trading strategies it uses. For example, the Adviser in its discretion may determine to use some permitted trading strategies while not using others.
Additional Investment Strategy Information
This section provides additional information relating to the Fund's investment strategies.
Investment Companies. The Fund may invest up to 10% of its net assets in securities issued by other investment companies. The Adviser may view these investments as necessary to participate in certain foreign markets where direct investment by the Fund may be difficult or impracticable.
Other Global Securities. The Fund may invest up to 35% of its net assets in equity and/or fixed-income and convertible securities of issuers located anywhere in the world, including the United States.
Defensive Investing. The Fund may take temporary "defensive" positions in attempting to respond to adverse market conditions. The Fund may invest any amount of its assets in cash or money market instruments in a defensive posture that may be inconsistent with the Fund's principal investment strategies when the Adviser believes it is advisable to do so.
Although taking a defensive posture is designed to protect the Fund from an anticipated market downturn, it could have the effect of reducing the benefit from any upswing in the market. When the Fund takes a defensive position, it may not achieve its investment objective.
7
***
The percentage limitations relating to the composition of the Fund's portfolio apply at the time the Fund acquires an investment. Subsequent percentage changes that result from market fluctuations generally will not require the Fund to sell any portfolio security. However, the Fund may be required to sell its illiquid securities holdings, or reduce its borrowings, if any, in response to fluctuations in the value of such holdings. The Fund may change its principal investment strategies without shareholder approval; however, you would be notified of any changes.
Principal Risks
There is no assurance that the Fund will achieve its investment objective. The Fund's share price and return will fluctuate with changes in the market value of the Fund's portfolio securities. When you sell Fund shares, they may be worth less than what you paid for them and, accordingly, you can lose money investing in this Fund.
Common Stock and Other Equity Securities. A principal risk of investing in the Fund is associated with its common stock and other equity investments. In general, stock and other equity security values fluctuate, and sometimes widely fluctuate, in response to activities specific to the company as well as general market, economic and political conditions.
Investments in convertible securities subject the Fund to the risks associated with both fixed-income securities and common stocks. To the extent that a convertible security's investment value is greater than its conversion value, its price will be likely to increase when interest rates fall and decrease when interest rates rise, as with a fixed-income security. If the conversion value exceeds the investment value, the price of the convertible security will tend to fluctuate directly with the price of the underlying equity security. A portion of the Fund's convertible securities may be rated below investment grade.
Foreign and Emerging Market Securities. The Fund's investments in foreign securities involve risks that are in addition to the risks associated with domestic securities. One additional risk is currency risk. While the price of Fund shares is quoted in U.S. dollars, the Fund may convert U.S. dollars to a foreign market's local currency to purchase a security in that market. If the value of that local currency falls relative to the U.S. dollar, the U.S. dollar value of the foreign security will decrease. This is true even if the foreign security's local price remains unchanged.
Foreign securities also have risks related to economic and political developments abroad, including expropriations, confiscatory taxation, exchange control regulation, limitations on the use or transfer of Fund assets and any effects of foreign social, economic or political instability. Foreign companies, in general, are not subject to the regulatory requirements of U.S. companies and, as such, there may be less publicly available information about these companies. Moreover, foreign accounting, auditing and financial reporting standards generally are different from those applicable to U.S. companies. Finally, in the event of a default of any foreign debt obligations, it may be more difficult for the Fund to obtain or enforce a judgment against the issuers of the securities.
Securities of foreign issuers may be less liquid than comparable securities of U.S. issuers and, as such, their price changes may be more volatile. In addition, the prices of such securities may be susceptible to influence by large traders, due to the limited size of many foreign securities markets. Moreover, investments in certain foreign markets, which have
8
historically been considered stable, may become more volatile and subject to increased risk due to ongoing developments and changing conditions in such markets. Also, the growing interconnectivity of global economies and financial markets has increased the probability that adverse developments and conditions in one country or region will affect the stability of economies and financial markets in other countries or regions. Furthermore, foreign exchanges and broker-dealers are generally subject to less government and exchange scrutiny and regulation than their U.S. counterparts. In addition, differences in clearance and settlement procedures in foreign markets may cause delays in settlement of the Fund's trades effected in those markets and could result in losses to the Fund due to subsequent declines in the value of the securities subject to the trades.
The foreign securities in which the Fund may invest may be issued by issuers located in emerging market or developing countries. Compared to the United States and other developed countries, emerging market or developing countries may have relatively unstable governments, economies based on only a few industries and securities markets that trade a small number of securities. Securities issued by companies located in these countries tend to be especially volatile and may be less liquid than securities traded in developed countries. In the past, securities in these countries have been characterized by greater potential loss than securities of companies located in developed countries.
Depositary receipts involve many of the same risks as those associated with direct investment in foreign securities. In addition, the underlying issuers of certain depositary receipts, particularly unsponsored or unregistered depositary receipts, are under no obligation to distribute shareholder communications to the holders of such receipts, or to pass through to them any voting rights with respect to the deposited securities.
In connection with its investments in foreign securities, the Fund also may enter into contracts with banks, brokers or dealers to purchase or sell securities or foreign currencies at a future date ("forward contracts"). A foreign currency forward contract is a negotiated agreement between the contracting parties to exchange a specified amount of currency at a specified future time at a specified rate. The rate can be higher or lower than the spot rate between the currencies that are the subject of the contract. Forward foreign currency exchange contracts may be used to protect against uncertainty in the level of future foreign currency exchange rates or to gain or modify exposure to a particular currency. In addition, the Fund may use cross currency hedging or proxy hedging with respect to currencies in which the Fund has or expects to have portfolio or currency exposure. Cross currency hedges involve the sale of one currency against the positive exposure to a different currency and may be used for hedging purposes or to establish an active exposure to the exchange rate between any two currencies. Hedging the Fund's currency risks involves the risk of mismatching the Fund's objectives under a forward or futures contract with the value of securities denominated in a particular currency. Furthermore, such transactions reduce or preclude the opportunity for gain if the value of the currency should move in the direction opposite to the position taken. There is an additional risk to the effect that currency contracts create exposure to currencies in which the Fund's securities are not denominated. Unanticipated changes in currency prices may result in poorer overall performance for the Fund than if it had not entered into such contracts. The use of forward foreign currency exchange contracts involves the risk of loss from the insolvency or bankruptcy of the counterparty to the contract or the failure of the counterparty to make payments or otherwise comply with the terms of the contract.
REITs and Foreign Real Estate Companies. REITs and foreign real estate companies generally derive their income from rents on the underlying properties or interest on the underlying loans, and their value is impacted by changes in the value of the underlying property or changes in interest rates affecting the underlying loans owned by the
9
REITs and/or foreign real estate companies. REITs and foreign real estate companies are more susceptible to risks associated with the ownership of real estate and the real estate industry in general. These risks can include fluctuations in the value of underlying properties; defaults by borrowers or tenants; market saturation; changes in general and local economic conditions; decreases in market rates for rents; increases in competition, property taxes, capital expenditures or operating expenses; and other economic, political or regulatory occurrences affecting the real estate industry. In addition, REITs and foreign real estate companies depend upon specialized management skills, may not be diversified (which may increase the volatility of a REIT's and/or a foreign real estate company's value), may have less trading volume and may be subject to more abrupt or erratic price movements than the overall securities market. Foreign real estate companies may be subject to laws, rules and regulations governing those entities and their failure to comply with those laws, rules and regulations could negatively impact the performance of those entities. Operating REITs and foreign real estate companies requires specialized management skills and the Fund indirectly bears REIT and foreign real estate company management expenses along with the direct expenses of the Fund. REITs are not taxed on income distributed to shareholders provided they comply with several requirements of the Internal Revenue Code of 1986, as amended (the "Code"). REITs are subject to the risk of failing to qualify for tax-free pass-through of income under the Code.
Derivatives. A derivative instrument often has risks similar to its underlying instrument and may have additional risks, including imperfect correlation between the value of the derivative and the underlying instrument, risks of default by the counterparty to certain transactions, magnification of losses incurred due to changes in the market value of the securities, instruments, indices or interest rates to which they relate, and risks that the transactions may not be liquid. The use of derivatives involves risks that are different from, and possibly greater than, the risks associated with other portfolio investments. Derivatives may involve the use of highly specialized instruments that require investment techniques and risk analyses different from those associated with other portfolio investments.
Certain derivative transactions may give rise to a form of leverage. Leverage magnifies the potential for gain and the risk of loss. Leverage associated with derivative transactions may cause the Fund to liquidate portfolio positions when it may not be advantageous to do so to satisfy its obligations or to meet earmarking or segregation requirements, pursuant to applicable SEC rules and regulations, or may cause the Fund to be more volatile than if the Fund had not been leveraged. Although the Adviser seeks to use derivatives to further the Fund's investment objectives, there is no assurance that the use of derivatives will achieve this result.
The derivative instruments and techniques that the Fund may principally use include:
Futures. A futures contract is a standardized agreement to buy or sell a specific quantity of an underlying instrument at a specific price at a specific future time. The value of a futures contract tends to increase and decrease in tandem with the value of the underlying instrument. Depending on the terms of the particular contract, futures contracts are settled through either physical delivery of the underlying instrument on the settlement date or by payment of a cash settlement amount on the settlement date. A decision as to whether, when and how to use futures involves the exercise of skill and judgment and even a well-conceived futures transaction may be unsuccessful because of market behavior or unexpected events. In addition to the derivatives risks discussed above, the prices of futures can be highly volatile, using futures can lower total return, and the potential loss from futures can exceed the Fund's initial investment in such contracts.
10
Options. If a Fund buys an option, it buys a legal contract giving it the right to buy or sell a specific amount of the underlying instrument or futures contract on the underlying instrument at an agreed upon price typically in exchange for a premium paid by the Fund. If a Fund sells an option, it sells to another person the right to buy from or sell to the Fund a specific amount of the underlying instrument or futures contract on the underlying instrument at an agreed-upon price typically in exchange for a premium received by the Fund. A decision as to whether, when and how to use options involves the exercise of skill and judgment and even a well-conceived option transaction may be unsuccessful because of market behavior or unexpected events. The prices of options can be highly volatile and the use of options can lower total returns.
Swaps. A swap contract is an agreement between two parties pursuant to which the parties exchange payments at specified dates on the basis of a specified notional amount, with the payments calculated by reference to specified securities, indexes, reference rates, currencies or other instruments. Most swap agreements provide that when the period payment dates for both parties are the same, the payments are made on a net basis (i.e., the two payment streams are netted out, with only the net amount paid by one party to the other). The Fund's obligations or rights under a swap contract entered into on a net basis will generally be equal only to the net amount to be paid or received under the agreement, based on the relative values of the positions held by each counterparty. With limited exceptions, swap agreements are generally not entered into or traded on exchanges. For most swaps, there is no central clearing or guaranty function. Therefore, swaps are generally subject to credit risk or the risk of default or non-performance by the counterparty. Swaps could result in losses if interest rate or foreign currency exchange rates or credit quality changes are not correctly anticipated by the Fund or if the reference index, security or investments do not perform as expected.
CFDs. A CFD is a privately negotiated contract between two parties, buyer and seller, stipulating that the seller will pay to or receive from the buyer the difference between the nominal value of the underlying instrument at the opening of the contract and that instrument's value at the end of the contract. The underlying instrument may be a single security, stock basket or index. A CFD can be set up to take either a short or long position on the underlying instrument. The buyer and seller are both required to post margin, which is adjusted daily. The buyer will also pay to the seller a financing rate on the notional amount of the capital employed by the seller less the margin deposit. In addition to the general risks of derivatives, CFDs may be subject to liquidity risk and counterparty risk.
Other Risks. The performance of the Fund also will depend on whether or not the Adviser is successful in applying the Fund's investment strategies. The Fund is also subject to other risks from its permissible investments, including the risks associated with its investments in the securities of other investment companies and fixed-income securities. For more information about these risks, see the "Additional Risk Information" section.
Additional Risk Information
This section provides additional information relating to the risks of investing in the Fund.
Investment Companies. Any Fund investment in an investment company is subject to the underlying risk of that investment company's portfolio securities. For example, if the investment company held common stocks, the Fund also would be exposed to the risk of investing in common stocks. In addition to the Fund's fees and expenses, the Fund would bear its share of the investment company's fees and expenses.
11
Morgan Stanley Investment Management Inc.
The Adviser, together with its affiliated asset management companies, had approximately $287.4 billion in assets under management or supervision as of December 31, 2011.
Fixed-Income Securities. All fixed-income securities, such as debt securities issued by foreign governments, are subject to two types of risk: credit risk and interest rate risk. Credit risk refers to the possibility that the issuer of a security will be unable to make interest payments and/or repay the principal on its debt. Interest rate risk refers to fluctuations in the value of a fixed-income security resulting from changes in the general level of interest rates. When the general level of interest rates goes up, the prices of most fixed-income securities go down. When the general level of interest rates goes down, the prices of most fixed-income securities go up. (Zero coupon securities, which are purchased at a discount and generally accrue interest, but make no interest payments until maturity are typically subject to greater price fluctuations than comparable securities that pay interest.)
Portfolio Holdings
A description of the Fund's policies and procedures with respect to the disclosure of the Fund's portfolio securities is available in the Fund's SAI.
Fund Management
The Fund has retained the Adviser—Morgan Stanley Investment Management Inc.—to provide investment advisory services. The Adviser is a wholly-owned subsidiary of Morgan Stanley, a preeminent global financial services firm engaged in securities trading and brokerage activities, as well as providing investment banking, research and analysis, financing and financial advisory services. The Adviser's address is 522 Fifth Avenue, New York, NY 10036.
The Fund is managed by members of the Active International Allocation team. The team consists of portfolio managers and analysts. The current member of the team primarily responsible for the day-to-day management of the Fund and the execution of the overall strategy of the Fund is Ann D. Thivierge.
Ms. Thivierge has been associated with the Adviser in an investment management capacity since 1986.
The Fund's SAI provides additional information about the portfolio manager's compensation structure, other accounts managed by the portfolio manager and the portfolio manager's ownership of securities in the Fund.
The composition of the team may change from time to time.
The Fund pays the Adviser a monthly advisory fee as full compensation for the services and facilities furnished to the Fund, and for Fund expenses assumed by the Adviser. The fee is based on the Fund's average daily net assets. For the fiscal year ended October 31, 2011, the Fund paid total investment advisory compensation amounting to 0.64% of the Fund's average daily net assets.
A discussion regarding the Board of Trustees' approval of the investment advisory agreement is available in the Fund's annual report to shareholders for the period ended October 31, 2011.
12
Shareholder Information
Pricing Fund Shares
The price of Fund shares (excluding sales charges), called "net asset value," is based on the value of the Fund's portfolio securities. While the assets of each Class are invested in a single portfolio of securities, the net asset value of each Class will differ because the Classes have different ongoing distribution fees.
The net asset value per share of the Fund is determined once daily at the New York Stock Exchange ("NYSE") close (normally 4:00 p.m. Eastern time) on each day that the NYSE is open. Shares will not be priced on days that the NYSE is closed.
The value of the Fund's portfolio securities is based on the securities' market price when available. When a market price is not readily available, including circumstances under which the Adviser determines that a security's market price is not accurate, a portfolio security is valued at its fair value, as determined under procedures established by the Fund's Board of Trustees.
In addition, with respect to securities that primarily are listed on foreign exchanges, when an event occurs after the close of such exchanges that is likely to have changed the value of the securities (e.g., a percentage change in value of one or more U.S. securities indices in excess of specified thresholds), such securities will be valued at their fair value, as determined under procedures established by the Fund's Board of Trustees. Securities also may be fair valued in the event of a significant development affecting a country or region or an issuer-specific development which is likely to have changed the value of the security.
In these cases, the Fund's net asset value will reflect certain portfolio securities' fair value rather than their market price. Fair value pricing involves subjective judgment and it is possible that the fair value determined for a security is materially different than the value that could be realized upon the sale of that security. With respect to securities that are primarily listed on foreign exchanges, the value of the Fund's portfolio securities may change on days when you will not be able to purchase or sell your shares.
To the extent the Fund invests in open-end management companies that are registered under the Investment Company Act of 1940, as amended ("Investment Company Act"), the Fund's net asset value is calculated based upon the net asset value of such funds. The prospectuses for such funds explain the circumstances under which they will use fair value pricing and its effects.
An exception to the Fund's general policy of using market prices concerns its short-term debt portfolio securities. Debt securities with remaining maturities of 60 days or less at the time of purchase are valued at amortized cost. However, if the cost does not reflect the securities' market value, these securities will be valued at their fair value.
13
Contacting a Financial Advisor
If you are new to the Morgan Stanley Funds and would like to contact a Morgan Stanley Smith Barney Financial Advisor, call toll-free 1-866-MORGAN8 for the telephone number of the Morgan Stanley Smith Barney office nearest you. You may also access our office locator on our Internet site at: www.morganstanley.com
How to Buy Shares
You may open a new account to buy Fund shares or buy additional Fund shares for an existing account by contacting your Morgan Stanley Smith Barney Financial Advisor or other authorized financial representative. Your Financial Advisor will assist you, step-by-step, with the procedures to invest in the Fund. The Transfer Agent, in its sole discretion, may allow you to purchase shares directly by calling and requesting an application.
To help the U.S. Government fight the funding of terrorism and money laundering activities, federal law requires all financial institutions to obtain, verify and record information that identifies each person who opens an account. What this means to you: when you open an account, we will ask your name, address, date of birth and other information that will allow us to identify you. If we are unable to verify your identity, we reserve the right to restrict additional transactions and/or liquidate your account at the next calculated net asset value after your account is closed (less any applicable sales/account charges and/or tax penalties) or take any other action required by law. In accordance with federal law requirements, the Fund has implemented an anti-money laundering compliance program, which includes the designation of an anti-money laundering compliance officer.
Because every investor has different immediate financial needs and long-term investment goals, the Fund offers investors six Classes of shares: Classes A, B, C, I, R and W. Class I, Class R and Class W shares are only offered to a limited group of investors. Each Class of shares offers a distinct structure of sales charges, distribution and service fees, and other features that are designed to address a variety of needs. Your Morgan Stanley Smith Barney Financial Advisor or other authorized financial representative can help you decide which Class may be most appropriate for you. When purchasing Fund shares, you must specify which Class of shares you wish to purchase.
When you buy Fund shares, the shares are purchased at the next share price calculated (plus any applicable front-end sales charge for Class A shares) after we receive your purchase order. Your payment is due on the third business day after you place your purchase order. We reserve the right to reject any order for the purchase of Fund shares for any reason.
Order Processing Fees. Your financial intermediary may charge processing or other fees in connection with the purchase or sale of the Fund's shares. Please consult your financial representative for more information regarding any such fees.
14
Minimum Investment Amounts
EasyInvest®
A purchase plan that allows you to transfer money automatically from your checking or savings account or from a Money Market Fund on a semi-monthly, monthly or quarterly basis. Contact your Morgan Stanley Smith Barney Financial Advisor for further information about this service.
| | | Minimum Investment | |
| Investment Options | | Initial | | Additional | |
| Regular Account | | $ | 1,000 | | | $ | 100 | | |
| Individual Retirement Account | | $ | 1,000 | | | $ | 100 | | |
| Coverdell Education Savings Account | | $ | 500 | | | $ | 100 | | |
EasyInvest®
(Automatically from your checking or savings account or Money Market Fund) | | $ | 100 | * | | $ | 100 | * | |
* Provided your schedule of investments totals $1,000 in 12 months.
There is no minimum investment amount if you purchase Fund shares through: (1) the Adviser's mutual fund asset allocation program; (2) a program, approved by the Distributor, in which you pay an asset-based fee for advisory, administrative and/or brokerage services; (3) the following programs approved by the Distributor: (i) qualified state tuition plans described in Section 529 of the Code or (ii) certain other investment programs that do not charge an asset-based fee; (4) employer-sponsored employee benefit plan accounts; (5) certain deferred compensation programs established by the Adviser or its affiliates for their employees or the Fund's Trustees; or (6) the reinvestment of dividends in additional Fund shares.
Investment Options for Certain Institutional and Other Investors/Class I, Class R and Class W Shares. To be eligible to purchase Class I, Class R or Class W shares, you must qualify under one of the investor categories specified in the "Share Class Arrangements" section of this Prospectus.
Subsequent Investments Sent Directly to the Fund. In addition to buying additional Fund shares for an existing account by contacting your Morgan Stanley Smith Barney Financial Advisor, you may send a check directly to the Fund. To buy additional shares in this manner:
n Write a "letter of instruction" to the Fund specifying the name(s) on the account, the account number, the social security or tax identification number, the Class of shares you wish to purchase and the investment amount (which would include any applicable front-end sales charge). The letter must be signed by the account owner(s).
n Make out a check for the total amount payable to: Morgan Stanley International Fund.
n Mail the letter and check to Morgan Stanley Services Company Inc. at P.O. Box 219885, Kansas City, MO 64121-9885.
How to Exchange Shares
Permissible Fund Exchanges. You may exchange shares of any Class of the Fund for the same Class of any other continuously offered Morgan Stanley Multi-Class Fund, or for shares of a Morgan Stanley Money Market Fund or the Morgan Stanley Limited Duration U.S. Government Trust, without the imposition of an exchange fee. In addition, Class Q shares of the Morgan Stanley Global
15
Infrastructure Fund may be exchanged for Class A shares of the Fund without payment of sales charges (including contingent deferred sales charges ("CDSCs")) or the imposition of an exchange fee. Front-end sales charges are not imposed on exchanges of Class A shares.
The current prospectus for each Morgan Stanley Fund describes its investment objective(s), policies and investment minimums, and should be read before investment. Since exchanges are available only into continuously offered Morgan Stanley Funds, exchanges are not available into Morgan Stanley Funds or classes of Morgan Stanley Funds that are not currently being offered for purchase. An exchange of Fund shares held for less than 30 days from the date of purchase will be subject to the 2% redemption fee described under the section "How to Sell Shares."
Exchange Procedures. You can process an exchange by contacting your Morgan Stanley Smith Barney Financial Advisor or other authorized financial representative. You may also write the Transfer Agent or call toll-free (800) 869-NEWS, our automated telephone system (which is generally accessible 24 hours a day, seven days a week), to place an exchange order. You automatically have the telephone exchange privilege unless you indicate otherwise by checking the applicable box on the new account application form. If you hold share certificates, no exchanges may be processed until we have received all applicable share certificates.
Exchange requests received on a business day prior to the time shares of the funds involved in the request are priced will be processed on the date of receipt. "Processing" a request means that shares of the fund which you are exchanging will be redeemed at the net asset value per share next determined on the date of receipt. Shares of the fund that you are purchasing will also normally be purchased at the net asset value per share, plus any applicable sales charge, next determined on the date of receipt. Exchange requests received on a business day after the time that shares of the funds involved in the request are priced will be processed on the next business day in the manner described herein.
The Fund may terminate or revise the exchange privilege upon required notice or in certain cases without notice. See "Limitations on Exchanges." The check writing privilege is not available for Money Market Fund shares you acquire in an exchange.
Telephone Exchanges. Morgan Stanley and its subsidiaries, including the Transfer Agent, and the Fund employ procedures considered by them to be reasonable to confirm that instructions communicated by telephone are genuine. Such procedures may include requiring certain personal identification information prior to acting upon telephone instructions, tape-recording telephone communications and providing written confirmation of instructions communicated by telephone. If reasonable procedures are employed, none of Morgan Stanley, the Transfer Agent or the Fund will be liable for following telephone instructions which it reasonably believes to be genuine. Telephone exchanges may not be available if you cannot reach the Transfer Agent by telephone, whether because all telephone lines are busy or for any other reason; in such case, a shareholder would have to use the Fund's other exchange procedures described in this section.
Telephone instructions will be accepted if received by the Transfer Agent between 9:00 a.m. and 4:00 p.m. Eastern time on any day the NYSE is open for business. During periods of drastic economic or market changes, it is possible that the telephone exchange procedures may be difficult to implement, although this has not been the case with the Fund in the past.
16
Margin Accounts. If you have pledged your Fund shares in a margin account, contact your Morgan Stanley Smith Barney Financial Advisor or other authorized financial representative regarding restrictions on the exchange of such shares.
Tax Considerations of Exchanges. If you exchange shares of the Fund for shares of another Morgan Stanley Fund, there are important tax considerations. For tax purposes, the exchange out of the Fund is considered a sale of Fund shares and the exchange into the other fund is considered a purchase. As a result, you may realize a capital gain or loss.
You should review the "Tax Consequences" section and consult your own tax professional about the tax consequences of an exchange.
Limitations on Exchanges. Certain patterns of past exchanges and/or purchase or sale transactions involving the Fund or other Morgan Stanley Funds may result in the Fund rejecting, limiting or prohibiting, at its sole discretion, and without prior notice, additional purchases and/or exchanges and may result in a shareholder's account being closed. Determinations in this regard may be made based on the frequency or dollar amount of the previous exchanges or purchase or sale transactions. The Fund reserves the right to reject an exchange request for any reason.
CDSC Calculations on Exchanges. See the "Share Class Arrangements" section of this Prospectus for a discussion of how applicable CDSCs are calculated for shares of one Morgan Stanley Fund that are exchanged for shares of another.
For further information regarding exchange privileges, you should contact your Morgan Stanley Smith Barney Financial Advisor or call toll-free (800) 869-NEWS.
How to Sell Shares
You can sell some or all of your Fund shares at any time. If you sell Class A, Class B or Class C shares, your net sale proceeds are reduced by the amount of any applicable CDSC. Your shares will be sold at the next price calculated after we receive your order to sell as described below.
| Options | | Procedures | |
| Contact Your Financial Advisor | | To sell your shares, simply call your Morgan Stanley Smith Barney Financial Advisor or other authorized financial representative. Payment will be sent to the address to which the account is registered or deposited in your brokerage account. | |
|
| By Telephone | | You can sell your shares by telephone and have the proceeds sent to the address of record or your bank account on record. You automatically have the telephone redemption privilege unless you indicate otherwise by checking the applicable box on the new account application form.
Before processing a telephone redemption, keep the following information in mind:
n You can establish this option at the time you open the account by completing the Morgan Stanley Funds New Account Application or subsequently by calling toll-free (800) 869-NEWS.
n Call toll-free (800) 869-NEWS to process a telephone redemption using our automated telephone system which is generally accessible 24 hours a day, seven days a week. | |
|
17
| Options | | Procedures | |
By Telephone
(continued) | | n Your request must be received prior to market close, generally 4:00 p.m. Eastern time.
n If your account has multiple owners, the Transfer Agent may rely on the instructions of any one owner.
n Proceeds must be made payable to the name(s) and address in which the account is registered.
n You may redeem amounts of $50,000 or less daily if the proceeds are to be paid by check or by Automated Clearing House.
n This privilege is not available if the address on your account has changed within 15 calendar days prior to your telephone redemption request.
n Telephone redemption is available for most accounts other than accounts with shares represented by certificates.
If you request to sell shares that were recently purchased by check, the proceeds of that sale may not be sent to you until it has been verified that the check has cleared, which may take up to 15 calendar days from the date of purchase.
Morgan Stanley and its subsidiaries, including the Transfer Agent, employ procedures considered by them to be reasonable to confirm that instructions communicated by telephone are genuine. Such procedures may include requiring certain personal identification information prior to acting upon telephone instructions, tape-recording telephone communications and providing written confirmation of instructions communicated by telephone. If reasonable procedures are employed, neither Morgan Stanley nor the Transfer Agent will be liable for following telephone instructions which it reasonably believes to be genuine. Telephone redemptions may not be available if a shareholder cannot reach the Transfer Agent by telephone, whether because all telephone lines are busy or for any other reason; in such case, a shareholder would have to use the Fund's other redemption procedures described in this section. | |
|
| By Letter | | You can also sell your shares by writing a "letter of instruction" that includes:
n your account number;
n the name of the Fund;
n the dollar amount or the number of shares you wish to sell;
n the Class of shares you wish to sell; and
n the signature of each owner as it appears on the account.
If you are requesting payment to anyone other than the registered owner(s) or that payment be sent to any address other than the address of the registered owner(s) or pre-designated bank account, you will need a signature guarantee. You can obtain a signature guarantee from an eligible guarantor acceptable to the Transfer Agent. (You should contact the Transfer Agent toll-free at (800) 869-NEWS for a determination as to whether a particular institution is an eligible guarantor.) A notary public cannot provide a signature guarantee. Additional documentation may be required for shares held by a corporation, partnership, trustee or executor. | |
|
18
| Options | | Procedures | |
By Letter
(continued) | | Mail the letter to Morgan Stanley Services Company Inc. at P.O. Box 219886, Kansas City, MO 64121-9886. If you hold share certificates, you must return the certificates, along with the letter and any required additional documentation.
A check will be mailed to the name(s) and address in which the account is registered, or otherwise according to your instructions. | |
|
| Systematic Withdrawal Plan | | If your investment in all of the Morgan Stanley Funds has a total market value of at least $10,000, you may elect to withdraw amounts of $25 or more, or in any whole percentage of a fund's balance (provided the amount is at least $25), on a monthly, quarterly, semi-annual or annual basis, from any fund with a balance of at least $1,000. Each time you add a fund to the plan, you must meet the plan requirements.
Amounts withdrawn are subject to any applicable CDSC. A CDSC may be waived under certain circumstances. See the Class B waiver categories listed in the "Share Class Arrangements" section of this Prospectus.
To sign up for the systematic withdrawal plan, contact your Morgan Stanley Smith Barney Financial Advisor or call toll-free (800) 869-NEWS. You may terminate or suspend your plan at any time. Please remember that withdrawals from the plan are sales of shares, not Fund "distributions," and ultimately may exhaust your account balance. The Fund may terminate or revise the plan at any time. | |
|
Payment for Sold Shares. After we receive your complete instructions to sell as described above, a check will be mailed to you within seven days, although we will attempt to make payment within one business day. Payment may also be sent to your brokerage account.
Payment may be postponed or the right to sell your shares suspended under unusual circumstances. If you request to sell shares that were recently purchased by check, the proceeds of the sale may not be sent to you until it has been verified that the check has cleared, which may take up to 15 calendar days from the date of purchase.
Payments-in-Kind. If we determine that it is in the best interest of the Fund not to pay redemption proceeds in cash, we may pay you partly or entirely by distributing to you securities held by the Fund. Such in-kind securities may be illiquid and difficult or impossible for a shareholder to sell at a time and at a price that a shareholder would like. Redemptions paid in such securities generally will give rise to income, gain or loss for income tax purposes in the same manner as redemptions paid in cash. In addition, you may incur brokerage costs and a further gain or loss for income tax purposes when you ultimately sell the securities.
Order Processing Fees. Your financial intermediary may charge processing or other fees in connection with the purchase or sale of the Fund's shares. Please consult your financial representative for more information regarding any such fees.
19
Tax Considerations. Normally, your sale of Fund shares is subject to federal and state income tax. You should review the "Tax Consequences" section of this Prospectus and consult your own tax professional about the tax consequences of a sale.
Reinstatement Privilege. If you sell Fund shares and have not previously exercised the reinstatement privilege, you may, within 35 days after the date of sale, invest any portion of the proceeds in the same Class of Fund shares at their net asset value and receive a pro rata credit for any CDSC paid in connection with the sale.
Involuntary Sales. The Fund reserves the right, on 60 days' notice, to sell the shares of any shareholder (other than shares held in an individual retirement account ("IRA") or 403(b) Custodial Account) whose shares, due to sales by the shareholder, have a value below $100, or in the case of an account opened through EasyInvest®, if after 12 months the shareholder has invested less than $1,000 in the account.
However, before the Fund sells your shares in this manner, we will notify you and allow you 60 days to make an additional investment in an amount that will increase the value of your account to at least the required amount before the sale is processed. No CDSC will be imposed on any involuntary sale.
Margin Accounts. If you have pledged your Fund shares in a margin account, contact your Morgan Stanley Smith Barney Financial Advisor or other authorized financial representative regarding restrictions on the sale of such shares.
Redemption Fee. Fund shares redeemed within 30 days of purchase will be subject to a 2% redemption fee, payable to the Fund. The redemption fee is designed to protect the Fund and its remaining shareholders from the effects of short-term trading. The redemption fee is not imposed on redemptions made: (i) through systematic withdrawal/exchange plans, (ii) through pre-approved asset allocation programs, (iii) of shares received by reinvesting income dividends or capital gain distributions, (iv) through certain collective trust funds or other pooled vehicles and (v) on behalf of advisory accounts where client allocations are solely at the discretion of the Morgan Stanley Investment Management investment team. The redemption fee is based on, and deducted from, the redemption proceeds. Each time you redeem or exchange shares, the shares held the longest will be redeemed or exchanged first.
The redemption fee may not be imposed on transactions that occur through certain omnibus accounts at financial intermediaries. Certain financial intermediaries may not have the ability to assess a redemption fee. Certain financial intermediaries may apply different methodologies than those described above in assessing redemption fees, may impose their own redemption fee that may differ from the Fund's redemption fee or may impose certain trading restrictions to deter market-timing and frequent trading. If you invest in the Fund through a financial intermediary, please read that financial intermediary's materials carefully to learn about any other restrictions or fees that may apply.
20
Distributions
Targeted
DividendsSM
You may select to have your Fund distributions automatically invested in other Classes of Fund shares or Classes of another Morgan Stanley Fund that you own. Contact your Morgan Stanley Smith Barney Financial Advisor for further information about this service.
The Fund passes substantially all of its earnings from income and capital gains along to its investors as "distributions." The Fund earns income from stocks and interest from fixed-income investments. These amounts are passed along to Fund shareholders as "income dividend distributions." The Fund realizes capital gains whenever it sells securities for a higher price than it paid for them. These amounts may be passed along as "capital gain distributions."
The Fund declares income dividends separately for each Class. Distributions paid on Class A, Class I, Class R and Class W shares usually will be higher than for Class B and Class C shares because distribution fees that Class B and Class C shares pay are higher. Normally, income dividends are distributed to shareholders annually. Capital gains, if any, are usually distributed in December. The Fund, however, may retain and reinvest any long-term capital gains. The Fund may at times make payments from sources other than income or capital gains that represent a return of a portion of your investment. These payments would not be taxable to you as a shareholder, but would have the effect of reducing your basis in the Fund.
Distributions are reinvested automatically in additional shares of the same Class and automatically credited to your account, unless you request in writing that all distributions be paid in cash. If you elect the cash option, the Fund will mail a check to you no later than seven business days after the distribution is declared. However, if you purchase Fund shares through a Morgan Stanley Smith Barney Financial Advisor or other authorized financial representative within three business days prior to the record date for the distribution, the distribution will automatically be paid to you in cash, even if you did not request to receive all distributions in cash. No interest will accrue on uncashed checks. If you wish to change how your distributions are paid, your request should be received by the Transfer Agent at least five business days prior to the record date of the distributions.
Frequent Purchases and Redemptions of Fund Shares
Frequent purchases and redemptions of Fund shares by Fund shareholders are referred to as "market-timing" or "short-term trading" and may present risks for other shareholders of the Fund, which may include, among other things, dilution in the value of Fund shares held by long-term shareholders, interference with the efficient management of the Fund's portfolio, increased brokerage and administrative costs, incurring unwanted taxable gains and forcing the Fund to hold excess levels of cash.
In addition, the Fund is subject to the risk that market-timers and/or short-term traders may take advantage of time zone differences between the foreign markets on which the Fund's portfolio securities trade and the time the Fund's net asset value is calculated ("time-zone arbitrage"). For example, a market-timer may purchase shares of the Fund based on events occurring after foreign market closing prices are established, but before the Fund's net asset value calculation, that are likely to result in higher prices in foreign markets the following day. The market-timer would redeem the
21
Fund's shares the next day, when the Fund's share price would reflect the increased prices in foreign markets, for a quick profit at the expense of long-term Fund shareholders.
Investments in other types of securities also may be susceptible to short-term trading strategies. These investments include securities that are, among other things, thinly traded, traded infrequently or relatively illiquid, which have the risk that the current market price for the securities may not accurately reflect current market values. A shareholder may seek to engage in short-term trading to take advantage of these pricing differences (referred to as "price arbitrage"). Investments in fixed-income securities may be adversely affected by price arbitrage trading strategies.
The Fund's policies with respect to valuing portfolio securities are described in "Shareholder Information—Pricing Fund Shares."
The Fund discourages and does not accommodate frequent purchases and redemptions of Fund shares by Fund shareholders and the Fund's Board of Trustees has adopted policies and procedures with respect to such frequent purchases and redemptions. The Fund's policies with respect to purchases, redemptions and exchanges of Fund shares are described in the "How to Buy Shares," "How to Exchange Shares" and "How to Sell Shares" sections of this Prospectus. Except as described in each of these sections, and with respect to trades that occur through omnibus accounts at intermediaries, as described below, the Fund's policies regarding frequent trading of Fund shares are applied uniformly to all shareholders. With respect to trades that occur through omnibus accounts at intermediaries, such as investment managers, broker-dealers, transfer agents and third party administrators, the Fund (i) requests assurance that such intermediaries currently selling Fund shares have in place internal policies and procedures reasonably designed to address market-timing concerns and has instructed such intermediaries to notify the Fund immediately if they are unable to comply with such policies and procedures, and (ii) requires all prospective intermediaries to agree to cooperate in enforcing the Fund's policies (or, upon written approval only, an intermediary's own policies) with respect to frequent purchases, redemptions and exchanges of Fund shares.
Omnibus accounts generally do not identify customers' trading activity to the Fund on an individual ongoing basis. Therefore, with respect to trades that occur through omnibus accounts at financial intermediaries, to some extent, the Fund relies on the financial intermediary to monitor frequent short-term trading within the Fund by the financial intermediary's customers. However, the Fund or the Distributor has entered into agreements with financial intermediaries whereby intermediaries are required to provide certain customer identification and transaction information upon the Fund's request. The Fund may use this information to help identify and prevent market-timing activity in the Fund. There can be no assurance that the Fund will be able to identify or prevent all market-timing activities.
Tax Consequences
As with any investment, you should consider how your Fund investment will be taxed. The tax information in this Prospectus is provided as general information. You should consult your own tax professional about the tax consequences of an investment in the Fund.
Unless your investment in the Fund is through a tax-deferred retirement account, such as a 401(k) plan or IRA, you need to be aware of the possible tax consequences when:
n The Fund makes distributions; and
n You sell Fund shares, including an exchange to another Morgan Stanley Fund.
22
Taxes on Distributions. Your distributions are normally subject to federal and state income tax when they are paid, whether you take them in cash or reinvest them in Fund shares. A distribution also may be subject to local income tax. Any income dividend distributions and any short-term capital gain distributions are taxable to you as ordinary income. Any long-term capital gain distributions are taxable as long-term capital gains, no matter how long you have owned shares in the Fund.
Under current law (through 2012), if certain holding period requirements are met with respect to your shares, a portion of the income dividends you receive may be taxed at the same rate as long-term capital gains. However, even if income received in the form of income dividends is taxed at the same rates as long-term capital gains, such income will not be considered long-term capital gains for other federal income tax purposes. For example, you generally will not be permitted to offset income dividends with capital losses. Short-term capital gain distributions will continue to be taxed at ordinary income rates.
If more than 50% of the Fund's assets are invested in foreign securities at the end of any fiscal year, the Fund may elect to permit shareholders to take a credit or deduction on their federal income tax return for foreign taxes paid by the Fund. If the Fund makes such an election, the shareholders would also include the amount of such foreign taxes in their income.
You will be sent a statement (IRS Form 1099-DIV) by February of each year showing the taxable distributions paid to you in the previous year. The statement provides information on your dividends and any capital gains for tax purposes.
Taxes on Sales. Your sale of Fund shares normally is subject to federal and state income tax and may result in a taxable gain or loss to you. A sale also may be subject to local income tax. Your exchange of Fund shares for shares of another Morgan Stanley Fund is treated for tax purposes like a sale of your original shares and a purchase of your new shares. Thus, the exchange may, like a sale, result in a taxable gain or loss to you and will give you a new tax basis for your new shares.
Due to recent legislation, the Fund (or its administrative agent) is required to report to the U.S. Internal Revenue Service ("IRS") and furnish to Fund shareholders the cost basis information for sale transactions of shares purchased on or after January 1, 2012. Shareholders may elect to have one of several cost basis methods applied to their account when calculating the cost basis of shares sold, including average cost, FIFO ("first-in, first-out"), or some other specific identification method. Unless you instruct otherwise, the Fund will use average cost as its default cost basis method, and will treat sales as first coming from shares purchased prior to January 1, 2012. If average cost is used for the first sale of Fund shares covered by these new rules, the shareholder may only use an alternative cost basis method for shares purchased prospectively. Fund shareholders should consult with their tax advisors to determine the best cost basis method for their tax situation.
When you open your Fund account, you should provide your social security or tax identification number on your investment application. By providing this information, you will avoid being subject to federal backup withholding tax on taxable distributions and redemption proceeds (as of the date of this Prospectus this rate is 28% and is scheduled to increase to 31% after 2012). Any withheld amount would be sent to the IRS as an advance payment of your taxes due on your income.
23
Share Class Arrangements
The Fund offers several Classes of shares having different distribution arrangements designed to provide you with different purchase options according to your investment needs. Your Morgan Stanley Smith Barney Financial Advisor or other authorized financial representative can help you decide which Class may be appropriate for you.
The general public is offered three Classes: Class A shares, Class B shares and Class C shares, which differ principally in terms of sales charges and ongoing expenses. Class I, Class R and Class W shares are offered only to a limited category of investors. Shares that you acquire through reinvested distributions will not be subject to any front-end sales charge or CDSC.
Sales personnel may receive different compensation for selling each Class of shares. The sales charges applicable to each Class provide for the distribution financing of shares of that Class.
The chart below compares the sales charge and annual 12b-1 fee applicable to each Class:
| Class | | Sales Charge | | Maximum Annual 12b-1 Fee | |
| | A | | | Maximum 5.25% initial sales charge reduced for purchases of $25,000 or more; shares
purchased without an initial sales charge are generally subject to a 1.00% CDSC if sold
during the first 18 months | | | 0.25 | % | |
| | B | | | Maximum 5.00% CDSC during the first year decreasing to 0% after six years | | | 1.00 | % | |
| | C | | | 1.00% CDSC during the first year | | | 1.00 | % | |
| | I | | | | None | | | | None | | |
| | R | | | | None | | | | 0.50 | % | |
| | W | | | | None | | | | 0.35 | % | |
While Class B, Class C, Class R and Class W shares do not have any front-end sales charges, their higher ongoing annual expenses (due to higher 12b-1 fees) mean that over time you could end up paying more for these shares than if you were to pay front-end sales charges for Class A shares.
Certain shareholders may be eligible for reduced sales charges (i.e., breakpoint discounts), CDSC waivers and eligibility minimums. Please see the information for each Class set forth below for specific eligibility requirements. You must notify your Morgan Stanley Smith Barney Financial Advisor or other authorized financial representative (or the Transfer Agent if you purchase shares directly through the Fund) at the time a purchase order (or in the case of Class B or Class C shares, a redemption order) is placed, that the purchase (or redemption) qualifies for a reduced sales charge (i.e., breakpoint discount), CDSC waiver or eligibility minimum. Similar notification must be made in writing when an order is placed by mail. The reduced sales charge, CDSC waiver or eligibility minimum will not be granted if: (i) notification is not furnished at the time of order; or (ii) a review of the records of Morgan Stanley Smith Barney, Morgan Stanley & Co. LLC ("Morgan Stanley & Co.") or other authorized dealer of Fund shares, or the Transfer Agent does not confirm your represented holdings.
In order to obtain a reduced sales charge (i.e., breakpoint discount) or to meet an eligibility minimum, it may be necessary at the time of purchase for you to inform your Morgan Stanley Smith Barney Financial Advisor or other
24
authorized financial representative (or the Transfer Agent if you purchase shares directly through the Fund) of the existence of other accounts in which there are holdings eligible to be aggregated to meet the sales load breakpoints or eligibility minimums. In order to verify your eligibility, you may be required to provide account statements and/or confirmations regarding shares of the Fund or other Morgan Stanley Funds held in all related accounts described below at Morgan Stanley Smith Barney, Morgan Stanley & Co. or by other authorized dealers, as well as shares held by related parties, such as members of the same family or household, in order to determine whether you have met a sales load breakpoint or eligibility minimum. The Fund makes available, in a clear and prominent format, free of charge, on its web site, www.morganstanley.com, information regarding applicable sales loads, reduced sales charges (i.e., breakpoint discounts), sales load waivers and eligibility minimums. The web site includes hyperlinks that facilitate access to the information.
CLASS A SHARES Class A shares are sold at net asset value plus an initial sales charge of up to 5.25% of the public offering price. The initial sales charge is reduced for purchases of $25,000 or more according to the schedule below. Investments of $1 million or more are not subject to an initial sales charge, but are generally subject to a CDSC of 1.00% on sales made within 18 months after the last day of the month of purchase. The CDSC will be assessed in the same manner and with the same CDSC waivers as with Class B shares. In addition, the CDSC on Class A shares will be waived in connection with sales of Class A shares for which no commission or transaction fee was paid by the Distributor to authorized dealers at the time of purchase of such shares. Class A shares are also subject to a distribution and shareholder services (12b-1) fee of up to 0.25% of the average daily net assets of the Class. The maximum annual 12b-1 fee payable by Class A shares is lower than the maximum annual 12b-1 fee payable by Class B, Class C, Class R or Class W shares.
Front-End Sales Charge or FSC
An initial sales charge you pay when purchasing Class A shares that is based on a percentage of the offering price. The percentage declines based upon the dollar value of Class A shares you purchase. We offer three ways to reduce your Class A sales charges—the Combined Purchase Privilege, Right of Accumulation and Letter of Intent.
The offering price of Class A shares includes a sales charge (expressed as a percentage of the public offering price) on a single transaction as shown in the following table:
| | | Front-End Sales Charge | |
Amount of
Single Transaction | | Percentage of
Public Offering Price | | Approximate Percentage
of Net Amount Invested | |
| Less than $25,000 | | | 5.25 | % | | | 5.54 | % | |
| $25,000 but less than $50,000 | | | 4.75 | % | | | 4.99 | % | |
| $50,000 but less than $100,000 | | | 4.00 | % | | | 4.17 | % | |
| $100,000 but less than $250,000 | | | 3.00 | % | | | 3.09 | % | |
| $250,000 but less than $500,000 | | | 2.50 | % | | | 2.56 | % | |
| $500,000 but less than $1 million | | | 2.00 | % | | | 2.04 | % | |
| $1 million and over | | | 0.00 | % | | | 0.00 | % | |
You may benefit from a reduced sales charge schedule (i.e., breakpoint discount) for purchases of Class A shares of the Fund, by combining, in a single transaction, your purchase with purchases of Class A shares of the Fund by the following related accounts:
n A single account (including an individual, trust or fiduciary account).
25
n A family member account (limited to spouse, and children under the age of 21).
n Pension, profit sharing or other employee benefit plans of companies and their affiliates.
n Employer sponsored and individual retirement accounts (including IRAs, Keogh, 401(k), 403(b), 408(k), and 457(b) Plans).
n Tax-exempt organizations.
n Groups organized for a purpose other than to buy mutual fund shares.
Combined Purchase Privilege. You will have the benefit of reduced sales charges by combining purchases of Class A shares of the Fund for any related account in a single transaction with purchases of any class of shares of other Morgan Stanley Multi-Class Funds for the related account or any other related account. For the purpose of this combined purchase privilege, a "related account" is:
n A single account (including an individual account, a joint account and a trust account established solely for the benefit of the individual).
n A family member account (limited to spouse, and children under the age of 21, but including trust accounts established solely for the benefit of a spouse, or children under the age of 21).
n An IRA and single participant retirement account (such as a Keogh).
n An UGMA/UTMA account.
Right of Accumulation. You may benefit from a reduced sales charge if the cumulative net asset value of Class A shares of the Fund purchased in a single transaction, together with the net asset value of all classes of shares of Morgan Stanley Multi-Class Funds (including shares of Morgan Stanley Non-Multi-Class Funds which resulted from an exchange from Morgan Stanley Multi-Class Funds) held in related accounts, amounts to $25,000 or more. For the purposes of the right of accumulation privilege, a related account is any one of the accounts listed under "Combined Purchase Privilege" above.
Notification. You must notify your Morgan Stanley Smith Barney Financial Advisor or other authorized financial representative (or the Transfer Agent if you purchase shares directly through the Fund) at the time a purchase order is placed, that the purchase qualifies for a reduced sales charge under any of the privileges discussed above. Similar notification must be made in writing when an order is placed by mail. The reduced sales charge will not be granted if: (i) notification is not furnished at the time of the order; or (ii) a review of the records of Morgan Stanley Smith Barney or other authorized dealer of Fund shares or the Transfer Agent does not confirm your represented holdings.
In order to obtain a reduced sales charge under any of the privileges discussed above, it may be necessary at the time of purchase for you to inform your Morgan Stanley Smith Barney Financial Advisor or other authorized financial representative (or the Transfer Agent if you purchase shares directly through the Fund) of the existence of other accounts in which there are holdings eligible to be aggregated to meet the sales load breakpoint and/or right of accumulation threshold. In order to verify your eligibility, you may be required to provide account statements and/or confirmations regarding shares of the Fund or other Morgan Stanley Funds held in all related accounts described above at Morgan Stanley Smith Barney or by other authorized dealers, as well as shares held by related parties, such as members of the same family or household, in order to determine whether you have met the sales load breakpoint and/or right of accumulation threshold. The Fund makes available, in a clear and prominent format, free of charge, on its web site, www.morganstanley.com, information regarding applicable sales loads and reduced sales charges (i.e., breakpoint discounts). The web site includes hyperlinks that facilitate access to the information.
26
Letter of Intent. The above schedule of reduced sales charges for larger purchases also will be available to you if you enter into a written "Letter of Intent." A Letter of Intent provides for the purchase of Class A shares of the Fund or other Multi-Class Funds within a 13-month period. The initial purchase under a Letter of Intent must be at least 5% of the stated investment goal. The Letter of Intent does not preclude the Fund (or any other Multi-Class Fund) from discontinuing sales of its shares. To determine the applicable sales charge reduction, you may also include: (1) the cost of shares of other Morgan Stanley Funds which were previously purchased at a price including a front-end sales charge during the 90-day period prior to the Distributor receiving the Letter of Intent, and (2) the historical cost of shares of other funds you currently own acquired in exchange for shares of funds purchased during that period at a price including a front-end sales charge. You may combine purchases and exchanges by family members (limited to spouse, and children under the age of 21) during the periods referenced in (1) and (2) above. You should retain any records necessary to substantiate historical costs because the Fund, the Transfer Agent and any financial intermediaries may not maintain this information. You can obtain a Letter of Intent by contacting your Morgan Stanley Smith Barney Financial Advisor or other authorized financial representative, or by calling toll-free (800) 869-NEWS. If you do not achieve the stated investment goal within the 13-month period, you are required to pay the difference between the sales charges otherwise applicable and sales charges actually paid, which may be deducted from your investment. Shares acquired through reinvestment of distributions are not aggregated to achieve the stated investment goal.
Other Sales Charge Waivers. In addition to investments of $1 million or more, your purchase of Class A shares is not subject to a front-end sales charge (or CDSC upon sale) if your account qualifies under one of the following categories:
n A trust for which a banking affiliate of the Adviser provides discretionary trustee services.
n Persons participating in a fee-based investment program (subject to all of its terms and conditions, including termination fees, and mandatory sale or transfer restrictions on termination) approved by the Distributor, pursuant to which they pay an asset-based fee for investment advisory, administrative and/or brokerage services.
n Qualified state tuition plans described in Section 529 of the Code and donor-advised charitable gift funds (subject to all applicable terms and conditions) and certain other investment programs that do not charge an asset-based fee and have been approved by the Distributor.
n Employer-sponsored employee benefit plans, whether or not qualified under the Code, for which an entity independent from Morgan Stanley serves as recordkeeper under an alliance or similar agreement with Morgan Stanley's Retirement Plan Solutions ("Morgan Stanley Eligible Plans").
n A Morgan Stanley Eligible Plan whose Class B shares have converted to Class A shares, regardless of the plan's asset size or number of eligible employees.
n Insurance company separate accounts that have been approved by the Distributor.
n Current or retired Directors or Trustees of the Morgan Stanley Funds, such persons' spouses, and children under the age of 21, and trust accounts for which any of such persons is a beneficiary.
n Current or retired directors, officers and employees of Morgan Stanley and any of its subsidiaries, such persons' spouses, and children under the age of 21, and trust accounts for which any of such persons is a beneficiary.
27
CLASS B SHARES Class B shares are offered at net asset value with no initial sales charge but are subject to a CDSC, as set forth in the table below. For the purpose of calculating the CDSC, shares are deemed to have been purchased on the last day of the month during which they were purchased.
Contingent Deferred Sales Charge or CDSC
A fee you pay when you sell shares of certain Morgan Stanley Funds purchased without an initial sales charge. This fee declines the longer you hold your shares as set forth in the table.
| Year Since Purchase Payment Made | | CDSC as a Percentage of Amount Redeemed | |
| First | | | 5.0 | % | |
| Second | | | 4.0 | % | |
| Third | | | 3.0 | % | |
| Fourth | | | 2.0 | % | |
| Fifth | | | 2.0 | % | |
| Sixth | | | 1.0 | % | |
| Seventh and thereafter | | | None | | |
The CDSC is assessed on an amount equal to the lesser of the then market value of the shares or the historical cost of the shares (which is the amount actually paid for the shares at the time of original purchase) being redeemed. Accordingly, no sales charge is imposed on increases in net asset value above the initial purchase price. In determining whether a CDSC applies to a redemption, it is assumed that the shares being redeemed first are any shares in the shareholder's Fund account that are not subject to a CDSC, followed by shares held the longest in the shareholder's account.
Broker-dealers or other financial intermediaries may impose a limit on the dollar value of a Class B share purchase order that they will accept. You should discuss with your financial advisor which share class is most appropriate for you, based on the size of your investment, your expected time horizon for holding the shares and other factors, bearing in mind the availability of reduced sales loads on Class A share purchases of $25,000 or more and for existing shareholders who hold over $25,000 in Morgan Stanley Funds.
CDSC Waivers. A CDSC, if otherwise applicable, will be waived in the case of:
n Sales of shares held at the time you die or become disabled (within the definition in Section 72(m)(7) of the Code which relates to the ability to engage in gainful employment), if the shares are: (i) registered either in your individual name or in the names of you and your spouse as joint tenants with right of survivorship; (ii) registered in the name of a trust of which (a) you are the settlor and that is revocable by you (i.e., a "living trust") or (b) you and your spouse are the settlors and that is revocable by you or your spouse (i.e., a "joint living trust"); or (iii) held in a qualified corporate or self-employed retirement plan, IRA or 403(b) Custodial Account; provided in each case that the sale is requested within one year after your death or initial determination of disability.
n Sales in connection with the following retirement plan "distributions": (i) lump-sum or other distributions from a qualified corporate or self-employed retirement plan following retirement (or, in the case of a "key employee" of a "top heavy" plan, following attainment of age 59 1/2);
28
(ii) required minimum distributions and certain other distributions (such as those following attainment of age 59 1/2) from an IRA or 403(b) Custodial Account; or (iii) a tax-free return of an excess IRA contribution (a "distribution" does not include a direct transfer of IRA, 403(b) Custodial Account or retirement plan assets to a successor custodian or trustee).
n Sales of shares in connection with the systematic withdrawal plan of up to 12% annually of the value of each fund from which plan sales are made. The percentage is determined on the date you establish the systematic withdrawal plan and based on the next calculated share price. You may have this CDSC waiver applied in amounts up to 1% per month, 3% per quarter, 6% semi-annually or 12% annually. Shares with no CDSC will be sold first, followed by those with the lowest CDSC. As such, the waiver benefit will be reduced by the amount of your shares that are not subject to a CDSC. If you suspend your participation in the plan, you may later resume plan payments without requiring a new determination of the account value for the 12% CDSC waiver.
The Distributor may require confirmation of your entitlement before granting a CDSC waiver. If you believe you are eligible for a CDSC waiver, please contact your Morgan Stanley Smith Barney Financial Advisor or other authorized financial representative or call toll-free (800) 869-NEWS.
Distribution Fee. Class B shares are subject to an annual distribution and shareholder services (12b-1) fee of up to 1.00% of the average daily net assets of Class B shares. The maximum annual 12b-1 fee payable by Class B shares is higher than the maximum annual 12b-1 fee payable by Class A, Class R and Class W shares.
Conversion Feature. After eight years, Class B shares generally will convert automatically to Class A shares of the Fund with no initial sales charge. The eight-year period runs from the last day of the month in which the shares were purchased or, in the case of Class B shares acquired through an exchange, from the last day of the month in which the original Class B shares were purchased; the shares will convert to Class A shares based on their relative net asset values in the month following the eight-year period. At the same time, an equal proportion of Class B shares acquired through automatically reinvested distributions will convert to Class A shares on the same basis. This conversion will be suspended during any period in which the expense ratio of the Class B shares of the Fund is lower than the expense ratio of the Class A shares of the Fund.
In the case of Class B shares held in a Morgan Stanley Eligible Plan, the plan is treated as a single investor and all Class B shares will convert to Class A shares on the conversion date of the Class B shares of a Morgan Stanley Fund purchased by that plan.
If you exchange your Class B shares for shares of a Money Market Fund or the Limited Duration U.S. Government Trust, the holding period for conversion is frozen as of the last day of the month of the exchange and resumes on the last day of the month you exchange back into Class B shares.
Exchanging Shares Subject to a CDSC. There are special considerations when you exchange Fund shares that are subject to a CDSC. When determining the length of time you held the shares and the corresponding CDSC rate, any period (starting at the end of the month) during which you held shares of a fund that does not charge a CDSC will not be counted. Thus, in effect the "holding period" for purposes of calculating the CDSC is frozen upon exchanging into a fund that does not charge a CDSC.
29
For example, if you held Class B shares of the Fund for one year, exchanged to Class B of another Morgan Stanley Multi-Class Fund for another year, then sold your shares, a CDSC rate of 4% would be imposed on the shares based on a two-year holding period—one year for each fund. However, if you had exchanged the shares of the Fund for a Money Market Fund (which does not charge a CDSC) instead of the Multi-Class Fund, then sold your shares, a CDSC rate of 5% would be imposed on the shares based on a one-year holding period. The one year in the Money Market Fund would not be counted. Nevertheless, if shares subject to a CDSC are exchanged for a fund that does not charge a CDSC, you will receive a credit when you sell the shares equal to the 12b-1 fees, if any, you paid on those shares while in that fund up to the amount of any applicable CDSC.
CLASS C SHARES Class C shares are sold at net asset value with no initial sales charge, but are subject to a CDSC of 1.00% on sales made within one year after the last day of the month of purchase. The CDSC will be assessed in the same manner and with the same CDSC waivers as with Class B shares.
Broker-dealers or other financial intermediaries may impose a limit on the dollar value of a Class C share purchase order that they will accept. For example, a Morgan Stanley Smith Barney Financial Advisor generally will not accept purchase orders for Class C shares that in the aggregate amount to $250,000 or more. You should discuss with your financial advisor which share class is most appropriate for you based on the size of your investment, your expected time horizon for holding the shares and other factors, bearing in mind the availability of reduced sales loads on Class A share purchases of $25,000 or more and for existing shareholders who hold over $25,000 in Morgan Stanley Funds.
Distribution Fee. Class C shares are subject to an annual distribution and shareholder services (12b-1) fee of up to 1.00% of the average daily net assets of that Class. The maximum annual 12b-1 fee payable by Class C shares is higher than the maximum annual 12b-1 fee payable by Class A shares. Unlike Class B shares, Class C shares have no conversion feature and, accordingly, an investor that purchases Class C shares may be subject to distribution and shareholder services (12b-1) fees applicable to Class C shares for as long as the investor owns such shares.
CLASS I SHARES Class I shares are offered without any sales charge on purchases or sales and without any distribution and shareholder services (12b-1) fee. Class I shares are offered only to investors meeting an initial investment minimum of $5 million ($25 million for Morgan Stanley Eligible Plans) and the following investor categories:
n Investors participating in the Adviser's or an affiliate's mutual fund asset allocation program (subject to all of its terms and conditions, including termination fees, and mandatory sale or transfer restrictions on termination) pursuant to which they pay an asset-based fee.
n Persons participating in a fee-based investment program (subject to all of its terms and conditions, including termination fees, and mandatory sale or transfer restrictions on termination) approved by the Distributor pursuant to which they pay an asset-based fee for investment advisory, administrative and/or brokerage services.
n Certain investment programs that do not charge an asset-based fee and have been approved by the Distributor.
n Employee benefit plans maintained by Morgan Stanley or any of its subsidiaries for the benefit of certain employees of Morgan Stanley and its subsidiaries.
n Certain unit investment trusts sponsored by Morgan Stanley & Co. or its affiliates.
n Certain other open-end investment companies whose shares are distributed by the Distributor.
30
n Investors who were shareholders of the Dean Witter Retirement Series on September 11, 1998 for additional purchases for their former Dean Witter Retirement Series accounts.
n The Adviser and its affiliates with respect to shares held in connection with certain deferred compensation programs established for their employees or the Fund's Trustees.
A purchase order that meets the requirements for investment in Class I shares can be made only in Class I shares.
Class I shares are not offered for investments made through Section 529 plans, donor-advised charitable gift funds and insurance company separate accounts (regardless of the size of the investment).
Meeting Class I Eligibility Minimums. To meet the $5 million ($25 million for Morgan Stanley Eligible Plans) initial investment to qualify to purchase Class I shares you may combine: (1) purchases in a single transaction of Class I shares of the Fund and other Morgan Stanley Multi-Class Funds; and/or (2) previous purchases of Class A and Class I shares of Multi-Class Funds you currently own, along with shares of Morgan Stanley Funds you currently own that you acquired in exchange for those shares. Shareholders cannot combine purchases made by family members or a shareholder's other related accounts in a single transaction for purposes of meeting the $5 million initial investment minimum requirement to qualify to purchase Class I shares.
CLASS R SHARES Class R shares are offered without any sales charge on purchases or sales. Class R shares are subject to an annual distribution and shareholder services (12b-1) fee of up to 0.50% of the average daily net assets of Class R shares. Class R shares are offered only to certain tax-exempt retirement plans (including 401(k) plans, 457 plans, employees-sponsored 403(b) plans, profit-sharing and money purchase pension plans, defined benefit plans and non-qualified deferred compensation plans) held in plan level or omnibus accounts. Individual retirement plans, such as IRAs, are not eligible to purchase Class R shares.
CLASS W SHARES Class W shares are offered without any sales charge on purchases or sales. Class W shares are subject to an annual distribution and shareholder services (12b-1) fee of up to 0.35% of the average daily net assets of Class W shares. Class W shares are offered only to investors purchasing through investment programs managed by investment professionals, including discretionary managed account programs approved by the Distributor.
NO SALES CHARGES FOR REINVESTED CASH DISTRIBUTIONS If you receive a cash payment representing an ordinary dividend or capital gain and you reinvest that amount in the applicable Class of shares by returning the check within 30 days of the payment date, the purchased shares would not be subject to an initial sales charge or CDSC.
PLANS OF DISTRIBUTION (RULE 12b-1 FEES) The Fund has adopted a Plan of Distribution in accordance with Rule 12b-1 under the Investment Company Act with respect to the Class A, Class B and Class C shares and has adopted a Plan of Distribution and Shareholder Services Plan in accordance with Rule 12b-1 under the Investment Company Act with respect to the Class R and Class W shares. (Class I shares are offered without any 12b-1 fee.) The Plans allow the Fund to pay distribution and/or shareholder services (12b-1) fees for these shares. Because these fees are paid out of the Fund's assets on an ongoing basis, over time these fees will increase the cost of your investment and reduce your return in these Classes and may cost you more than paying other types of sales charges.
31
Additional Information
The Adviser and/or Distributor may pay compensation (out of their own funds and not as an expense of the Fund) to certain affiliated or unaffiliated broker-dealers or other financial intermediaries or service providers in connection with the sale, distribution, marketing or retention of Fund shares and/or shareholder servicing. Such compensation may be significant in amount and the prospect of receiving any such additional compensation may provide such affiliated or unaffiliated entities with an incentive to favor sales of shares of the Fund over other investment options. Any such payments will not change the net asset value or the price of the Fund's shares. For more information, please see the Fund's SAI.
32
Financial Highlights
The financial highlights table is intended to help you understand the Fund's financial performance for the periods indicated. Certain information reflects financial results for a single Fund share throughout each period. The total returns in the table represent the rate an investor would have earned or lost on an investment in the Fund (assuming reinvestment of all dividends and distributions). The ratio of expenses to average net assets listed in the tables below for each class of shares of the Fund are based on the average net assets of the Fund for each of the periods listed in the tables. To the extent that the Fund's average net assets decrease over the Fund's next fiscal year, such expense ratios can be expected to increase, potentially significantly, because certain fixed costs will be spread over a smaller amount of assets.
The information for the fiscal year ended October 31, 2011 has been audited by Ernst & Young LLP, an independent registered public accounting firm, whose report, along with the Fund's financial statements, are incorporated by reference in the SAI from the Fund's annual report, which is available upon request. The financial highlights for each of the years in the four-year period ended October 31, 2010 have been audited by another independent registered public accounting firm.
CLASS A SHARES
| For the Year Ended October 31, | | 2011 | | 2010^ | | 2009^ | | 2008^ | | 2007^ | |
| Selected Per Share Data: | |
| Net asset value, beginning of period | | $ | 12.30 | | | $ | 11.32 | | | $ | 9.29 | | | $ | 16.94 | | | $ | 13.14 | | |
| Income (loss) from investment operations: | |
| Net investment income(1) | | | 0.16 | | | | 0.11 | | | | 0.12 | | | | 0.24 | | | | 0.15 | | |
| Net realized and unrealized gain (loss) | | | (1.12 | ) | | | 1.10 | | | | 1.91 | | | | (7.61 | ) | | | 3.86 | | |
| Total income (loss) from investment operations | | | (0.96 | ) | | | 1.21 | | | | 2.03 | | | | (7.37 | ) | | | 4.01 | | |
| Less dividends from net investment income | | | (0.15 | ) | | | (0.23 | ) | | | — | | | | (0.28 | ) | | | (0.21 | ) | |
| Net asset value, end of period | | $ | 11.19 | | | $ | 12.30 | | | $ | 11.32 | | | $ | 9.29 | | | $ | 16.94 | | |
| Total Return(2) | | | (7.95 | )% | | | 10.79 | % | | | 21.85 | % | | | (44.19 | )% | | | 31.03 | % | |
| Ratios to Average Net Assets(3): | |
| Total expenses | | | 1.57 | %(4) | | | 1.50 | %(4) | | | 1.69 | %(4) | | | 1.36 | %(4) | | | 1.33 | %(4)(5) | |
| Net investment income | | | 1.29 | %(4) | | | 0.97 | %(4) | | | 1.30 | %(4) | | | 1.71 | %(4) | | | 1.18 | %(4)(5) | |
| Rebate from Morgan Stanley affiliate | | | 0.01 | % | | | 0.02 | % | | | 0.01 | % | | | 0.01 | % | | | 0.00 | %(6) | |
| Supplemental Data: | |
| Net assets, end of period, in thousands | | $ | 85,116 | | | $ | 107,160 | | | $ | 113,446 | | | $ | 104,619 | | | $ | 193,043 | | |
| Portfolio turnover rate | | | 33 | % | | | 15 | % | | | 36 | % | | | 31 | % | | | 22 | % | |
^ Beginning with the year ended October 31, 2011, the Fund was audited by Ernst & Young LLP. The previous years were audited by another independent registered public accounting firm.
(1) The per share amounts were computed using an average number of shares outstanding during the period.
(2) Does not reflect the deduction of sales charge. Calculated based on the net asset value as of the last business day of the period.
(3) Reflects overall Fund ratios for investment income and non-class specific expenses.
(4) The ratios reflect the rebate of certain Fund expenses in connection with investments in a Morgan Stanley affiliate during the period. The effect of the rebate on the ratios is disclosed in the above table as "Rebate from Morgan Stanley affiliate."
(5) If the Fund had borne all of its expenses that were reimbursed or waived by the Adviser and Administrator, the annualized expense and net investment income ratios would have been as follows:
| PERIOD ENDED | | EXPENSE
RATIO | | NET INVESTMENT
INCOME RATIO | |
| October 31, 2007 | | | 1.34 | % | | | 1.17 | % | |
(6) Amount is less than 0.005%.
33
Financial Highlights (Continued)
CLASS B SHARES
| For the Year Ended October 31, | | 2011 | | 2010^ | | 2009^ | | 2008^ | | 2007^ | |
| Selected Per Share Data: | |
| Net asset value, beginning of period | | $ | 12.08 | | | $ | 11.11 | | | $ | 9.19 | | | $ | 16.69 | | | $ | 12.97 | | |
| Income (loss) from investment operations: | |
| Net investment income(1) | | | 0.07 | | | | 0.02 | | | | 0.05 | | | | 0.13 | | | | 0.08 | | |
| Net realized and unrealized gain (loss) | | | (1.10 | ) | | | 1.08 | | | | 1.87 | | | | (7.53 | ) | | | 3.75 | | |
| Total income (loss) from investment operations | | | (1.03 | ) | | | 1.10 | | | | 1.92 | | | | (7.40 | ) | | | 3.83 | | |
| Less dividends from net investment income | | | (0.03 | ) | | | (0.13 | ) | | | — | | | | (0.10 | ) | | | (0.11 | ) | |
| Net asset value, end of period | | $ | 11.02 | | | $ | 12.08 | | | $ | 11.11 | | | $ | 9.19 | | | $ | 16.69 | | |
| Total Return(2) | | | (8.58 | )% | | | 9.95 | % | | | 20.89 | % | | | (44.49 | )% | | | 29.58 | % | |
| Ratios to Average Net Assets(3): | |
| Total expenses | | | 2.32 | %(4) | | | 2.25 | %(4) | | | 2.44 | %(4) | | | 2.10 | %(4) | | | 2.08 | %(4)(5) | |
| Net investment income | | | 0.54 | %(4) | | | 0.22 | %(4) | | | 0.55 | %(4) | | | 0.90 | %(4) | | | 0.43 | %(4)(5) | |
| Rebate from Morgan Stanley affiliate | | | 0.01 | % | | | 0.02 | % | | | 0.01 | % | | | 0.01 | % | | | 0.00 | %(6) | |
| Supplemental Data: | |
| Net assets, end of period, in thousands | | $ | 7,448 | | | $ | 14,175 | | | $ | 21,247 | | | $ | 30,185 | | | $ | 99,635 | | |
| Portfolio turnover rate | | | 33 | % | | | 15 | % | | | 36 | % | | | 31 | % | | | 22 | % | |
^ Beginning with the year ended October 31, 2011, the Fund was audited by Ernst & Young LLP. The previous years were audited by another independent registered public accounting firm.
(1) The per share amounts were computed using an average number of shares outstanding during the period.
(2) Does not reflect the deduction of sales charge. Calculated based on the net asset value as of the last business day of the period.
(3) Reflects overall Fund ratios for investment income and non-class specific expenses.
(4) The ratios reflect the rebate of certain Fund expenses in connection with investments in a Morgan Stanley affiliate during the period. The effect of the rebate on the ratios is disclosed in the above table as "Rebate from Morgan Stanley affiliate."
(5) If the Fund had borne all of its expenses that were reimbursed or waived by the Adviser and Administrator, the annualized expense and net investment income ratios would have been as follows:
| PERIOD ENDED | | EXPENSE
RATIO | | NET INVESTMENT
INCOME RATIO | |
| October 31, 2007 | | | 2.09 | % | | | 0.42 | % | |
(6) Amount is less than 0.005%.
34
CLASS C SHARES
| For the Year Ended October 31, | | 2011 | | 2010^ | | 2009^ | | 2008^ | | 2007^ | |
| Selected Per Share Data: | |
| Net asset value, beginning of period | | $ | 11.95 | | | $ | 11.02 | | | $ | 9.11 | | | $ | 16.63 | | | $ | 12.94 | | |
| Income (loss) from investment operations: | |
| Net investment income(1) | | | 0.07 | | | | 0.02 | | | | 0.05 | | | | 0.13 | | | | 0.06 | | |
| Net realized and unrealized gain (loss) | | | (1.08 | ) | | | 1.06 | | | | 1.86 | | | | (7.47 | ) | | | 3.76 | | |
| Total income (loss) from investment operations | | | (1.01 | ) | | | 1.08 | | | | 1.91 | | | | (7.34 | ) | | | 3.82 | | |
| Less dividends from net investment income | | | (0.06 | ) | | | (0.15 | ) | | | — | | | | (0.18 | ) | | | (0.13 | ) | |
| Net asset value, end of period | | $ | 10.88 | | | $ | 11.95 | | | $ | 11.02 | | | $ | 9.11 | | | $ | 16.63 | | |
| Total Return(2) | | | (8.54 | )% | | | 9.89 | % | | | 20.97 | % | | | (44.50 | )% | | | 29.58 | % | |
| Ratios to Average Net Assets(3): | |
| Total expenses | | | 2.31 | %(4) | | | 2.25 | %(4) | | | 2.44 | %(4) | | | 2.07 | %(4) | | | 2.08 | %(4)(5) | |
| Net investment income | | | 0.55 | %(4) | | | 0.22 | %(4) | | | 0.55 | %(4) | | | 0.96 | %(4) | | | 0.43 | %(4)(5) | |
| Rebate from Morgan Stanley affiliate | | | 0.01 | % | | | 0.02 | % | | | 0.01 | % | | | 0.01 | % | | | 0.00 | %(6) | |
| Supplemental Data: | |
| Net assets, end of period, in thousands | | $ | 12,050 | | | $ | 16,163 | | | $ | 17,507 | | | $ | 16,660 | | | $ | 37,085 | | |
| Portfolio turnover rate | | | 33 | % | | | 15 | % | | | 36 | % | | | 31 | % | | | 22 | % | |
^ Beginning with the year ended October 31, 2011, the Fund was audited by Ernst & Young LLP. The previous years were audited by another independent registered public accounting firm.
(1) The per share amounts were computed using an average number of shares outstanding during the period.
(2) Does not reflect the deduction of sales charge. Calculated based on the net asset value as of the last business day of the period.
(3) Reflects overall Fund ratios for investment income and non-class specific expenses.
(4) The ratios reflect the rebate of certain Fund expenses in connection with investments in a Morgan Stanley affiliate during the period. The effect of the rebate on the ratios is disclosed in the above table as "Rebate from Morgan Stanley affiliate."
(5) If the Fund had borne all of its expenses that were reimbursed or waived by the Adviser and Administrator, the annualized expense and net investment income ratios would have been as follows:
| PERIOD ENDED | | EXPENSE
RATIO | | NET INVESTMENT
INCOME RATIO | |
| October 31, 2007 | | | 2.09 | % | | | 0.42 | % | |
(6) Amount is less than 0.005%.
35
Financial Highlights (Continued)
CLASS I SHARES
| For the Year Ended October 31, | | 2011 | | 2010^ | | 2009^ | | 2008^ | | 2007^ | |
| Selected Per Share Data: | |
| Net asset value, beginning of period | | $ | 12.39 | | | $ | 11.40 | | | $ | 9.33 | | | $ | 17.00 | | | $ | 13.23 | | |
| Income (loss) from investment operations: | |
| Net investment income(1) | | | 0.19 | | | | 0.14 | | | | 0.16 | | | | 0.27 | | | | 0.21 | | |
| Net realized and unrealized gain (loss) | | | (1.12 | ) | | | 1.10 | | | | 1.91 | | | | (7.64 | ) | | | 3.83 | | |
| Total income (loss) from investment operations | | | (0.93 | ) | | | 1.24 | | | | 2.07 | | | | (7.37 | ) | | | 4.04 | | |
| Less dividends from net investment income | | | (0.18 | ) | | | (0.25 | ) | | | — | | | | (0.30 | ) | | | (0.27 | ) | |
| Net asset value, end of period | | $ | 11.28 | | | $ | 12.39 | | | $ | 11.40 | | | $ | 9.33 | | | $ | 17.00 | | |
| Total Return(2) | | | (7.66 | )% | | | 11.05 | % | | | 22.19 | % | | | (44.16 | )% | | | 31.33 | % | |
| Ratios to Average Net Assets(3): | |
| Total expenses | | | 1.32 | %(4) | | | 1.25 | %(4) | | | 1.44 | %(4) | | | 1.10 | %(4) | | | 1.08 | %(4)(5) | |
| Net investment income | | | 1.54 | %(4) | | | 1.22 | %(4) | | | 1.55 | %(4) | | | 1.95 | %(4) | | | 1.43 | %(4)(5) | |
| Rebate from Morgan Stanley affiliate | | | 0.01 | % | | | 0.02 | % | | | 0.01 | % | | | 0.01 | % | | | 0.00 | %(6) | |
| Supplemental Data: | |
| Net assets, end of period, in thousands | | $ | 623 | | | $ | 682 | | | $ | 733 | | | $ | 10,085 | | | $ | 22,888 | | |
| Portfolio turnover rate | | | 33 | % | | | 15 | % | | | 36 | % | | | 31 | % | | | 22 | % | |
^ Beginning with the year ended October 31, 2011, the Fund was audited by Ernst & Young LLP. The previous years were audited by another independent registered public accounting firm.
(1) The per share amounts were computed using an average number of shares outstanding during the period.
(2) Calculated based on the net asset value as of the last business day of the period.
(3) Reflects overall Fund ratios for investment income and non-class specific expenses.
(4) The ratios reflect the rebate of certain Fund expenses in connection with investments in a Morgan Stanley affiliate during the period. The effect of the rebate on the ratios is disclosed in the above table as "Rebate from Morgan Stanley affiliate."
(5) If the Fund had borne all of its expenses that were reimbursed or waived by the Adviser and Administrator, the annualized expense and net investment income ratios would have been as follows:
| PERIOD ENDED | | EXPENSE
RATIO | | NET INVESTMENT
INCOME RATIO | |
| October 31, 2007 | | | 1.09 | % | | | 1.42 | % | |
(6) Amount is less than 0.005%.
36
CLASS R SHARES
| For the Year Ended October 31, | | 2011 | | 2010^ | | 2009^ | | For the Period
March 31, 2008@@@
through
October 31, 2008^ | |
| Selected Per Share Data: | |
| Net asset value, beginning of period | | $ | 12.23 | | | $ | 11.27 | | | $ | 9.28 | | | $ | 14.14 | | |
| Income (loss) from investment operations: | |
| Net investment income(1) | | | 0.13 | | | | 0.08 | | | | 0.10 | | | | 0.15 | | |
| Net realized and unrealized gain (loss) | | | (1.11 | ) | | | 1.09 | | | | 1.89 | | | | (5.01 | ) | |
| Total income (loss) from investment operations | | | (0.98 | ) | | | 1.17 | | | | 1.99 | | | | (4.86 | ) | |
| Less dividends from net investment income | | | (0.12 | ) | | | (0.21 | ) | | | — | | | | — | | |
| Net asset value, end of period | | $ | 11.13 | | | $ | 12.23 | | | $ | 11.27 | | | $ | 9.28 | | |
| Total Return(2) | | | (8.10 | )% | | | 10.47 | % | | | 21.57 | % | | | (34.44 | )%(5) | |
| Ratios to Average Net Assets(3): | |
| Total expenses | | | 1.82 | %(4) | | | 1.75 | %(4) | | | 1.94 | %(4) | | | 1.62 | %(4)(6) | |
| Net investment income | | | 1.04 | %(4) | | | 0.72 | %(4) | | | 1.05 | %(4) | | | 1.96 | %(4)(6) | |
| Rebate from Morgan Stanley affiliate | | | 0.01 | % | | | 0.02 | % | | | 0.01 | % | | | 0.01 | %(6) | |
| Supplemental Data: | |
| Net assets, end of period, in thousands | | $ | 80 | | | $ | 92 | | | $ | 83 | | | $ | 66 | | |
| Portfolio turnover rate | | | 33 | % | | | 15 | % | | | 36 | % | | | 31 | % | |
@@@ The date shares were first issued.
^ Beginning with the year ended October 31, 2011, the Fund was audited by Ernst & Young LLP. The previous years were audited by another independent registered public accounting firm.
(1) The per share amounts were computed using an average number of shares outstanding during the period.
(2) Calculated based on the net asset value as of the last business day of the period.
(3) Reflects overall Fund ratios for investment income and non-class specific expenses.
(4) The ratios reflect the rebate of certain Fund expenses in connection with investments in a Morgan Stanley affiliate during the period. The effect of the rebate on the ratios is disclosed in the above table as "Rebate from Morgan Stanley affiliate."
(5) Not annualized.
(6) Annualized.
37
Financial Highlights (Continued)
CLASS W SHARES
| For the Year Ended October 31, | | 2011 | | 2010^ | | 2009^ | | For the Period
March 31, 2008@@@
through
October 31, 2008^ | |
| Selected Per Share Data: | |
| Net asset value, beginning of period | | $ | 12.27 | | | $ | 11.30 | | | $ | 9.28 | | | $ | 14.14 | | |
| Income (loss) from investment operations: | |
| Net investment income(1) | | | 0.15 | | | | 0.10 | | | | 0.11 | | | | 0.16 | | |
| Net realized and unrealized gain (loss) | | | (1.12 | ) | | | 1.09 | | | | 1.91 | | | | (5.02 | ) | |
| Total income (loss) from investment operations | | | (0.97 | ) | | | 1.19 | | | | 2.02 | | | | (4.86 | ) | |
| Less dividends from net investment income | | | (0.14 | ) | | | (0.22 | ) | | | — | | | | — | | |
| Net asset value, end of period | | $ | 11.16 | | | $ | 12.27 | | | $ | 11.30 | | | $ | 9.28 | | |
| Total Return(2) | | | (8.03 | )% | | | 10.67 | % | | | 21.77 | % | | | (34.37 | )%(5) | |
| Ratios to Average Net Assets(3): | |
| Total expenses | | | 1.67 | %(4) | | | 1.60 | %(4) | | | 1.79 | %(4) | | | 1.47 | %(4)(6) | |
| Net investment income | | | 1.19 | %(4) | | | 0.87 | %(4) | | | 1.20 | %(4) | | | 2.11 | %(4)(6) | |
| Rebate from Morgan Stanley affiliate | | | 0.01 | % | | | 0.02 | % | | | 0.01 | % | | | 0.01 | %(6) | |
| Supplemental Data: | |
| Net assets, end of period, in thousands | | $ | 85 | | | $ | 93 | | | $ | 86 | | | $ | 66 | | |
| Portfolio turnover rate | | | 33 | % | | | 15 | % | | | 36 | % | | | 31 | % | |
@@@ The date shares were first issued.
^ Beginning with the year ended October 31, 2011, the Fund was audited by Ernst & Young LLP. The previous years were audited by another independent registered public accounting firm.
(1) The per share amounts were computed using an average number of shares outstanding during the period.
(2) Calculated based on the net asset value as of the last business day of the period.
(3) Reflects overall Fund ratios for investment income and non-class specific expenses.
(4) The ratios reflect the rebate of certain Fund expenses in connection with investments in a Morgan Stanley affiliate during the period. The effect of the rebate on the ratios is disclosed in the above table as "Rebate from Morgan Stanley affiliate."
(5) Not annualized.
(6) Annualized.
38
Notes
39
Notes
40
41
Additional information about the Fund's investments is available in the Fund's Annual and Semiannual Reports to Shareholders. In the Fund's Annual Report, you will find a discussion of the market conditions and investment strategies that significantly affected the Fund's performance during its last fiscal year.
The Fund's Statement of Additional Information also provides additional information about the Fund. The Statement of Additional Information is incorporated herein by reference (legally is part of this Prospectus). For a free copy of the Fund's Annual Report, Semiannual Report or Statement of Additional Information, or to request other information about the Fund or to make shareholder inquiries, please call toll-free (800) 869-NEWS. Free copies of these documents are also available from our Internet site at: www.morganstanley.com/im.
You also may obtain information about the Fund by calling your Morgan Stanley Smith Barney Financial Advisor or by visiting our Internet site.
Information about the Fund (including the Statement of Additional Information) can be reviewed and copied at the SEC Public Reference Room in Washington, DC. Information about the Reference Room's operations may be obtained by calling the SEC at (202) 551-8090. Reports and other information about the Fund are available on the EDGAR Database on the SEC's Internet site at: www.sec.gov and copies of this information may be obtained, after paying a duplicating fee, by electronic request at the following E-mail address: publicinfo@sec.gov, or by writing to the Public Reference Section of the SEC, Washington, DC 20549-1520.
(THE FUND'S INVESTMENT COMPANY ACT FILE NO. IS 811-09081)
Morgan Stanley Distribution, Inc., member FINRA.
© 2012 Morgan Stanley

INVESTMENT MANAGEMENT
Morgan Stanley
International Fund
Prospectus
February 29, 2012


INLPRO-00
INVESTMENT MANAGEMENT

Welcome, Shareholder:
In this report, you'll learn about how your investment in Morgan Stanley International Fund performed during the annual period. We will provide an overview of the market conditions, and discuss some of the factors that affected performance during the reporting period. In addition, this report includes the Fund's financial statements and a list of Fund investments.
This material must be preceded or accompanied by a prospectus for the fund being offered.
Market forecasts provided in this report may not necessarily come to pass. There is no assurance that the Fund will achieve its investment objective. The Fund is subject to market risk, which is the possibility that market values of securities owned by the Fund will decline and, therefore, the value of the Fund's shares may be less than what you paid for them. Accordingly, you can lose money investing in this Fund. Please see the prospectus for more complete information on investment risks.
Fund Report (unaudited)
For the year ended October 31, 2011
| Total Return for the 12 Months Ended October 31, 2011 | |
| Class A | | Class B | | Class C | | Class I | | Class R | | Class W | | MSCI
EAFE
Index1 | | Lipper
International
Large-Cap
Core Funds
Index2 | |
| | –7.95 | % | | | –8.58 | % | | | –8.54 | % | | | –7.66 | % | | | –8.10 | % | | | –8.03 | % | | | –4.08 | % | | | –5.91 | % | |
The performance of the Fund's six share classes varies because each has different expenses. The Fund's total returns assume the reinvestment of all distributions but do not reflect the deduction of any applicable sales charges. Such costs would lower performance. See Performance Summary for standardized performance and benchmark information.
Market Conditions
For the 12-month period ended October 31, 2011, international developed market equities (as represented by the MSCI EAFE Index, or the "Index") declined 4.08 percent. On a regional basis, the U.K. and Asia ex-Japan led performance, while Japan and Europe ex-U.K. had weaker returns. Sector performance was the strongest in the energy, consumer staples, and health care sectors. Utilities, financials and materials had the largest declines in the Index.
The 12-month period was somewhat choppy from November 2010 to the end of July 2011 when global equity markets collapsed. From there it was a volatile and negative period, with markets heading nearly into bear market territory from early August to late September, until early October when equities rallied strongly. In August, U.S. economic data was recalibrated to lower levels, the well-regarded business institute Economic Cycle Research Institute (ECRI) called for a U.S. recession, the U.S. government almost went into default, Chinese inflation looked high and growth prospects appeared near peaks, and former French finance minister/new International Monetary Fund (IMF) president Christine Lagarde shocked the world by proclaiming that European banks were badly undercapitalized.
Since then, U.S. economic data and corporate earnings have been above expectations, the U.S. government retreated into its so-called "super committee" until late November, Chinese economic and inflation data were decent, and Europe came up with an imperfect, but improved, plan to recapitalize banks, support Greece, and ring fence Italian and Spanish debt. Bulls now say that equities are cheap, China has the flexibility to loosen policy, and the euro-zone has just put through the biggest structural growth reforms in decades — which will likely support growth and earnings coming out of a currently mild recession. However, bears contend that China cannot escape the property bubble and bad loans produced by its extraordinary 2008-2009 stimulus. European austerity and policy hesitation could lead to a deep recession that would impact Asia, the U.S., and the weakened European banks. The bear case also supposes the U.S. consumer could run out of steam once government support runs out and housing rolls back over.
In our view, both camps make valid arguments. In Europe, we view the change to technocratic governments as a good sign — but the hard work of cutting debt while nurturing growth will still be ahead — for both Europe and the U.S. Fiscal reform, if done
2
properly, can be supportive of further global equity gains, even in a low nominal growth environment, in our opinion. Fiscal reform, if done poorly — or not at all — could disrupt the markets again.
Global economic growth continues to show signs of slowing, although some economic data surprised on the upside during October in the U.S. and, to a lesser extent, in China. If this better trend continues, the U.S. and China may skirt recessions that had seemed more imminent in late August. U.S. gross domestic product (GDP) growth rebounded in the third quarter to an annualized pace of 2.5 percent (versus 1.3 percent in the prior quarter) and China's GDP came in at 9 percent. While the October U.S. Institute for Supply Management (ISM) manufacturing index decreased from the prior month (51.6), at 50.8, most of the fall was due to a decline in inventory, although the new orders component improved. U.S. consumer spending, durable goods, and labor indicators also remain steady.
European data is more concerning, as purchasing manager index (PMI) surveys deteriorated across the board and "core" European nations experienced slowing activity on the back of "peripheral" European countries' debt issues. The eurozone composite PMI manufacturing survey fell significantly to 47.1 (versus a prior 48.5), indicating the eurozone is on the brink of recession. German and French retail sales numbers have also been weak. Chinese data is mixed, but arguably weaker at the margin, with property sales continuing to drop dramatically. On a positive note, Japan's PMI climbed above 50 in October to 50.6 (versus a prior 49.3) and the unemployment rate fell from 4.3 percent to 4.1 percent in September. However, Japanese industrial production fell as heavy floods in Thailand continued to disrupt supply chains.
At the risk of oversimplifying, with valuations relatively inexpensive by our measures, we remain focused on the main question of whether the U.S., Europe, and/or China will go into recession in 2012. Europe already appears to be at the brink, and continued fiscal austerity and bank deleveraging through 2012 will likely further weigh on growth. In addition, while steps have been taken to stabilize peripheral countries' funding, significant uncertainty remains (as reflected in Italy's sovereign debt spreads). Growth in the U.S. and China is slowing (as measured by PMIs and leading economic indicators), but has generally been resilient thus far. We are concerned that China has not yet seen the full impact of policy tightening and are also concerned that the U.S. may not pass legislation to avoid a significant fiscal drag in 2012. We are looking for an improvement in European sovereign credit/bank funding, a stabilization in Chinese property sales and/or a loosening of policy, and more clarity on U.S. fiscal policy as catalysts to improve our outlook.
Performance Analysis
All share classes of Morgan Stanley International Fund underperformed the Index and the Lipper International Large-Cap Core Funds Index for the 12 months ended October 31, 2011, assuming no deduction of applicable sales charges.
The underweights to the U.K. and the health care sector, overweight positions in materials and industrials, and an
3
allocation to emerging markets detracted from portfolio performance. The major contributors to portfolio performance were the underweight allocations to utilities and financials and the overweight to energy.
There is no guarantee that any sectors mentioned will continue to perform as discussed herein or that securities in such sectors will be held by the Fund in the future.
| TOP 10 HOLDINGS+ as of 10/31/11 | |
| Nestle SA (Registered) | | | 2.7 | % | |
| Vodafone Group PLC | | | 1.7 | | |
| BHP Billiton Ltd. | | | 1.5 | | |
| Royal Dutch Shell PLC, Class A | | | 1.3 | | |
| Novartis AG (Registered) | | | 1.3 | | |
| Siemens AG (Registered) | | | 1.2 | | |
| Roche Holding AG | | | 1.1 | | |
| GlaxoSmithKline PLC | | | 1.1 | | |
| HSBC Holdings PLC | | | 1.1 | | |
| Total SA | | | 1.0 | | |
| TOP FIVE COUNTRIES as of 10/31/11 | |
| Japan | | | 22.2 | % | |
| United Kingdom | | | 19.9 | | |
| Switzerland | | | 8.9 | | |
| France | | | 6.9 | | |
| Germany | | | 6.2 | | |
+ Does not include open long futures contracts with an underlying face amount of $8,763,513 with net unrealized appreciation of $452,786 and open foreign currency exchange contracts with net unrealized appreciation of $110,137.
Subject to change daily. Provided for informational purposes only and should not be deemed as a recommendation to buy or sell the securities mentioned above. Top 10 holdings and top five countries are as a percentage of net assets. Morgan Stanley is a full-service securities firm engaged in securities trading and brokerage activities, investment banking, research and analysis, financing and financial advisory services.
4
Investment Strategy
The Fund will normally invest at least 65 percent of its assets in a diversified portfolio of international common stocks and other equity securities. The Fund's "Investment Adviser," Morgan Stanley Investment Management Inc., uses a "top-down" approach that emphasizes country and sector selection and weightings over individual stock selection.
For More Information About Portfolio Holdings
Each Morgan Stanley fund provides a complete schedule of portfolio holdings in its semiannual and annual reports within 60 days of the end of the fund's second and fourth fiscal quarters. The semiannual reports and the annual reports are filed electronically with the Securities and Exchange Commission (SEC) on Form N-CSRS and Form N-CSR, respectively. Morgan Stanley also delivers the semiannual and annual reports to fund shareholders and makes these reports available on its public web site, www.morganstanley.com. Each Morgan Stanley fund also files a complete schedule of portfolio holdings with the SEC for the fund's first and third fiscal quarters on Form N-Q. Morgan Stanley does not deliver the reports for the first and third fiscal quarters to shareholders, nor are the reports posted to the Morgan Stanley public web site. You may, however, obtain the Form N-Q filings (as well as the Form N-CSR and N-CSRS filings) by accessing the SEC's web site, http://www.sec.gov. You may also review and copy them at the SEC's public reference room in Washington, DC. Information on the operation of the SEC's public reference room may be obtained by calling the SEC at (800) SEC-0330. You can also request copies of these materials, upon payment of a duplicating fee, by electronic request at the SEC's e-mail address (publicinfo@sec.gov) or by writing the public reference section of the SEC, Washington, DC 20549-1520.
Proxy Voting Policy and Procedures and Proxy Voting Record
You may obtain a copy of the Fund's Proxy Voting Policy and Procedures without charge, upon request, by calling toll free (800) 869-NEWS or by visiting the Mutual Fund Center on our web site at www.morganstanley.com. It is also available on the SEC's web site at http://www.sec.gov.
You may obtain information regarding how the Fund voted proxies relating to portfolio securities during the most recent twelve-month period ended June 30 without charge by visiting the Mutual Fund Center on our web site at www.morganstanley.com. This information is also available on the SEC's web site at http://www.sec.gov.
Householding Notice
To reduce printing and mailing costs, the Fund attempts to eliminate duplicate mailings to the same address. The Fund delivers a single copy of certain shareholder documents, including shareholder reports, prospectuses and proxy materials, to investors with the same last name who reside at the same address. Your participation in this program will continue for an unlimited period of time unless you instruct us otherwise. You can request multiple copies of these documents by calling (800) 869-NEWS, 8:00 a.m. to 8:00 p.m., ET. Once our Customer Service Center has received your instructions, we will begin sending individual copies for each account within 30 days.
5
Performance Summary (unaudited)
Performance of a $10,000 Investment—Class B
Over 10 Years
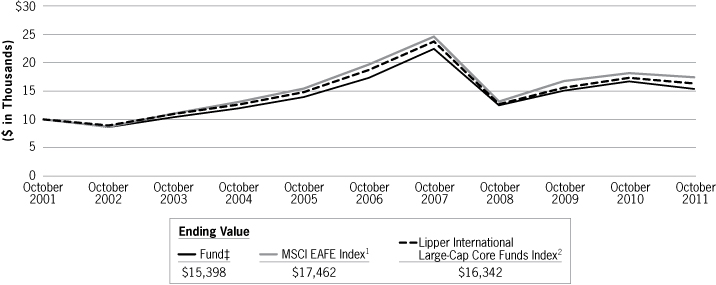
6
| Average Annual Total Returns—Period Ended October 31, 2011 (unaudited) | |
| Symbol | | Class A Shares*
(since 06/28/99)
INLAX | | Class B Shares**
(since 06/28/99)
INLBX | | Class C Shares†
(since 06/28/99)
INLCX | | Class I Shares††
(since 06/28/99)
INLDX | | Class R Shares#
(since 03/31/08)
INLRX | | Class W Shares##
(since 03/31/08)
INLWX | |
1 Year
| | | –7.95
–12.77 4 | %3 | | | –8.58
–13.14 4 | %3 | | | –8.54
–9.45 4 | %3 | | | –7.66
— | %3 | | | –8.10
— | %3 | | | –8.03
— | %3 | |
5 Years
| | | –1.90 3
–2.95 4 | | | | –2.66 3
–3.04 4 | | | | –2.65 3
–2.65 4 | | | | –1.68 3
— | | | | —
— | | | | —
— | | |
10 Years
| | | 5.06 3
4.50 4 | | | | 4.41 3
4.41 4 | | | | 4.28 3
4.28 4 | | | | 5.31 3
— | | | | —
— | | | | —
— | | |
Since
Inception | | | 2.42 3
1.98 4 | | | | 1.89 3
1.89 4 | | | | 1.65 3
1.65 4 | | | | 2.65 3
— | | | | –5.73 3
— | | | | –5.60 3
— | | |
Performance data quoted represents past performance, which is no guarantee of future results and current performance may be lower or higher than the figures shown. For most recent month-end performance figures, please visit www.morganstanley.com/im or speak with your Financial Advisor. Investment returns and principal value will fluctuate and fund shares, when redeemed, may be worth more or less than their original cost. The graph and table do not reflect the deduction of taxes that a shareholder would pay on portfolio distributions or the redemption of portfolio shares. Performance for Class A, Class B, Class C, Class I, Class R, and Class W shares will vary due to differences in sales charges and expenses. See the Fund's current prospectus for complete details on fees and sales charges.
* The maximum front-end sales charge for Class A is 5.25%.
** The maximum contingent deferred sales charge (CDSC) for Class B is 5.0%. The CDSC declines to 0% after six years. Effective April 2005, Class B shares will generally convert to Class A shares approximately eight years after the end of the calendar month in which the shares were purchased. Performance for periods greater than eight years reflects this conversion.
† The maximum contingent deferred sales charge for Class C is 1.0% for shares redeemed within one year of purchase.
†† Class I has no sales charge.
# Class R has no sales charge.
## Class W has no sales charge.
(1) The Morgan Stanley Capital International (MSCI) EAFE Index (Europe, Australasia, Far East) is a free float-adjusted market capitalization index that is designed to measure the international equity market performance of developed markets, excluding the US & Canada. The term "free float" represents the portion of shares outstanding that are deemed to be available for purchase in the public equity markets by investors. The MSCI EAFE Index currently consists of 22 developed market country indices. The performance of the Index is listed in U.S. dollars and assumes reinvestment of net dividends. The Index is unmanaged and its returns do not include any sales charges or fees. Such costs would lower performance. It is not possible to invest directly in an index.
(2) The Lipper International Large-Cap Core Funds Index is an equally weighted performance index of the largest qualifying funds (based on net assets) in the Lipper International Large-Cap Core Funds classification. The Index, which is adjusted for capital gains distributions and income dividends, is unmanaged and should not be considered an investment. There are currently 30 funds represented in this Index. The Fund was in the Lipper International Large-Cap Core Funds classification as of the date of this report.
(3) Figure shown assumes reinvestment of all distributions and does not reflect the deduction of any sales charges.
(4) Figure shown assumes reinvestment of all distributions and the deduction of the maximum applicable sales charge. See the Fund's current prospectus for complete details on fees and sales charges.
‡ Ending value assuming a complete redemption on October 31, 2011.
7
Expense Example (unaudited)
As a shareholder of the Fund, you incur two types of costs: (1) transaction costs, including sales charges (loads) on purchase payments and redemption fees; and (2) ongoing costs, including advisory fees; distribution and service (12b-1) fees; and other Fund expenses. This example is intended to help you understand your ongoing costs (in dollars) of investing in the Fund and to compare these costs with the ongoing costs of investing in other mutual funds.
The example is based on an investment of $1,000 invested at the beginning of the period and held for the entire period 05/01/11 – 10/31/11.
Actual Expenses
The first line of the table below provides information about actual account values and actual expenses. You may use the information in this line, together with the amount you invested, to estimate the expenses that you paid over the period. Simply divide your account value by $1,000 (for example, an $8,600 account value divided by $1,000 = 8.6), then multiply the result by the number in the first line under the heading entitled "Expenses Paid During Period" to estimate the expenses you paid on your account during this period.
Hypothetical Example for Comparison Purposes
The second line of the table below provides information about hypothetical expenses based on the Fund's actual expense ratio and an assumed rate of return of 5% per year before expenses, which is not the Fund's actual return. The hypothetical account values and expenses may not be used to estimate the actual ending account balance or expenses you paid for the period. You may use this information to compare the ongoing cost of investing in the Fund and other funds. To do so, compare this 5% hypothetical example with the 5% hypothetical examples that appear in the shareholder reports of the other funds.
Please note that the expenses shown in the table are meant to highlight your ongoing costs only and do not reflect any transactional costs, such as sales charges (loads) and redemption fees. Therefore, the second line of the table is useful in comparing ongoing costs, and will not help you determine the relative total cost of owning different funds. In addition, if these transactional costs were included, your costs would have been higher.
| | | Beginning
Account Value | | Ending
Account Value | | Expenses Paid
During Period@ | |
| | | 05/01/11 | | 10/31/11 | | 05/01/11 –
10/31/11 | |
| Class A | |
| Actual (–17.66% return) | | $ | 1,000.00 | | | $ | 823.40 | | | $ | 7.77 | | |
| Hypothetical (5% annual return before expenses) | | $ | 1,000.00 | | | $ | 1,016.69 | | | $ | 8.59 | | |
| Class B | |
| Actual (–17.94% return) | | $ | 1,000.00 | | | $ | 820.60 | | | $ | 11.20 | | |
| Hypothetical (5% annual return before expenses) | | $ | 1,000.00 | | | $ | 1,012.91 | | | $ | 12.38 | | |
| Class C | |
| Actual (–17.95% return) | | $ | 1,000.00 | | | $ | 820.50 | | | $ | 11.20 | | |
| Hypothetical (5% annual return before expenses) | | $ | 1,000.00 | | | $ | 1,012.91 | | | $ | 12.38 | | |
| Class I | |
| Actual (–17.54% return) | | $ | 1,000.00 | | | $ | 824.60 | | | $ | 6.62 | | |
| Hypothetical (5% annual return before expenses) | | $ | 1,000.00 | | | $ | 1,017.95 | | | $ | 7.32 | | |
8
Expense Example (unaudited) continued
| | | Beginning
Account Value | | Ending
Account Value | | Expenses Paid
During Period@ | |
| | | 05/01/11 | | 10/31/11 | | 05/01/11 –
10/31/11 | |
| Class R | |
| Actual (–17.74% return) | | $ | 1,000.00 | | | $ | 822.60 | | | $ | 8.91 | | |
| Hypothetical (5% annual return before expenses) | | $ | 1,000.00 | | | $ | 1,015.43 | | | $ | 9.86 | | |
| Class W | |
| Actual (–17.70% return) | | $ | 1,000.00 | | | $ | 823.00 | | | $ | 8.23 | | |
| Hypothetical (5% annual return before expenses) | | $ | 1,000.00 | | | $ | 1,016.18 | | | $ | 9.10 | | |
@ Expenses are equal to the Fund's annualized expense ratios of 1.69%, 2.44%, 2.44%, 1.44%, 1.94%, and 1.79% for Class A, Class B, Class C, Class I, Class R, and Class W shares, respectively, multiplied by the average account value over the period, multiplied by 184/365 (to reflect the one-half year period). If the Fund had borne all of its expenses, the annualized expense ratios would have been 1.70%, 2.45%, 2.45%, 1.45%, 1.95%, and 1.80% for Class A, Class B, Class C, Class I, Class R, and Class W shares, respectively.
9
Investment Advisory Agreement Approval (unaudited)
Nature, Extent and Quality of Services
The Board reviewed and considered the nature and extent of the investment advisory services provided by the Investment Adviser (as defined herein) under the advisory agreement, including portfolio management, investment research and equity and fixed income securities trading. The Board also reviewed and considered the nature and extent of the non-advisory, administrative services provided by the Fund's Administrator (as defined herein) under the administration agreement, including accounting, clerical, bookkeeping, compliance, business management and planning, and the provision of supplies, office space and utilities at the Investment Adviser's expense. (The Investment Adviser and the Administrator together are referred to as the "Adviser" and the advisory and administration agreements together are referred to as the "Management Agreement.") The Board also compared the nature of the services provided by the Adviser with similar services provided by non-affiliated advisers as reported to the Board by Lipper, Inc. ("Lipper").
The Board reviewed and considered the qualifications of the portfolio managers, the senior administrative managers and other key personnel of the Adviser who provide the administrative and advisory services to the Fund. The Board determined that the Adviser's portfolio managers and key personnel are well qualified by education and/or training and experience to perform the services in an efficient and professional manner. The Board concluded that the nature and extent of the advisory and administrative services provided were necessary and appropriate for the conduct of the business and investment activities of the Fund and supported its decision to approve the Management Agreement.
Performance, Fees and Expenses of the Fund
The Board reviewed the performance, fees and expenses of the Fund compared to its peers, as determined by Lipper, and to appropriate benchmarks where applicable. The Board discussed with the Adviser the performance goals and the actual results achieved in managing the Fund. When considering a fund's performance, the Board and the Adviser place emphasis on trends and longer-term returns (focusing on one-year, three-year and five-year performance, as of December 31, 2010, or since inception, as applicable). When a fund underperforms its benchmark and/or its peer group average, the Board and the Adviser discuss the causes of such underperformance and, where necessary, they discuss specific changes to investment strategy or investment personnel. The Board noted that the Fund's performance was better than its peer group average for the one-, three- and five-year periods. The Board discussed with the Adviser the level of the advisory and administration fees (together, the "management fee") for this Fund relative to comparable funds and/or other accounts advised by the Adviser and/or compared to its peers as determined by Lipper. In addition to the management fee, the Board also reviewed the Fund's total expense ratio. The Board noted that the Fund's management fee and total expense ratio were lower than its peer group average. After discussion, the Board concluded that the Fund's management fee, total expense ratio and performance were competitive with its peer group average.
10
Economies of Scale
The Board considered the size and growth prospects of the Fund and how that relates to the Fund's total expense ratio and particularly the Fund's management fee rate, which includes a breakpoint. In conjunction with its review of the Adviser's profitability, the Board discussed with the Adviser how a change in assets can affect the efficiency or effectiveness of managing the Fund and whether the management fee level is appropriate relative to current and projected asset levels and/or whether the management fee structure reflects economies of scale as asset levels change. The Board has determined that its review of the actual and potential economies of scale of the Fund support its decision to approve the Management Agreement.
Profitability of the Adviser and Affiliates
The Board considered information concerning the costs incurred and profits realized by the Adviser and its affiliates during the last year from their relationship with the Fund and during the last two years from their relationship with the Morgan Stanley Fund Complex and reviewed with the Adviser the cost allocation methodology used to determine the profitability of the Adviser and affiliates. The Board has determined that its review of the analysis of the Adviser's expenses and profitability supports its decision to approve the Management Agreement.
Other Benefits of the Relationship
The Board considered other benefits to the Adviser and its affiliates derived from their relationship with the Fund and other funds advised by the Adviser. These benefits may include, among other things, "float" benefits derived from handling of checks for purchases and sales, research received by the Adviser generated from commission dollars spent on funds' portfolio trading and fees for distribution and/or shareholder servicing. The Board reviewed with the Adviser each of these arrangements and the reasonableness of the Adviser's costs relative to the services performed. The Board has determined that its review of the other benefits received by the Adviser or its affiliates supports its decision to approve the Management Agreement.
Resources of the Adviser and Historical Relationship Between the Fund and the Adviser
The Board considered whether the Adviser is financially sound and has the resources necessary to perform its obligations under the Management Agreement. The Board also reviewed and considered the historical relationship between the Fund and the Adviser, including the organizational structure of the Adviser, the policies and procedures formulated and adopted by the Adviser for managing the Fund's operations and the Board's confidence in the competence and integrity of the senior managers and key personnel of the Adviser. The Board concluded that the Adviser has the financial resources necessary to fulfill its obligations under the Management Agreement and that it is beneficial for the Fund to continue its relationship with the Adviser.
11
Other Factors and Current Trends
The Board considered the controls and procedures adopted and implemented by the Adviser and monitored by the Fund's Chief Compliance Officer and concluded that the conduct of business by the Adviser indicates a good faith effort on its part to adhere to high ethical standards in the conduct of the Fund's business.
General Conclusion
After considering and weighing all of the above factors, the Board concluded that it would be in the best interest of the Fund and its shareholders to approve renewal of the Management Agreement for another year. In reaching this conclusion the Board did not give particular weight to any single factor referenced above. The Board considered these factors over the course of numerous meetings, some of which were in executive session with only the independent Board members and their counsel present. It is possible that individual Board members may have weighed these factors differently in reaching their individual decisions to approve the Management Agreement.
12
Morgan Stanley International Fund
Portfolio of Investments n October 31, 2011
NUMBER OF
SHARES | |
| | VALUE | |
| | | Common Stocks (88.4%) | |
| | | Australia (3.5%) | |
| | | Beverages | |
| | 970 | | | Coca-Cola Amatil Ltd. | | $ | 12,528 | | |
| | 3,666 | | | Foster's Group Ltd. | | | 20,551 | | |
| | 1,221 | | | Treasury Wine Estates Ltd. | | | 4,770 | | |
| | | | 37,849 | | |
| | | Biotechnology | |
| | 511 | | | CSL Ltd. | | | 15,303 | | |
| | | Capital Markets | |
| | 362 | | | Macquarie Group Ltd. | | | 9,148 | | |
| | | Chemicals | |
| | 20,543 | | | Incitec Pivot Ltd. | | | 73,319 | | |
| | 4,518 | | | Orica Ltd. | | | 121,292 | | |
| | | | 194,611 | | |
| | | Commercial Banks | |
| | 16,316 | | | Australia & New Zealand
Banking Group Ltd. | | | 367,973 | | |
| | 800 | | | Commonwealth Bank of
Australia (a) | | | 41,084 | | |
| | 1,186 | | | National Australia Bank Ltd. (a) | | | 31,657 | | |
| | 1,203 | | | Westpac Banking Corp. | | | 28,000 | | |
| | | | 468,714 | | |
| | | Commercial Services &
Supplies | |
| | 1,772 | | | Brambles Ltd. | | | 12,229 | | |
| | | Construction & Engineering | |
| | 425 | | | Leighton Holdings Ltd. (a) | | | 9,511 | | |
| | | Construction Materials | |
| | 5,661 | | | Boral Ltd. (a) | | | 23,127 | | |
| | 3,522 | | | James Hardie Industries SE
CDI (b) | | | 22,763 | | |
| | | | 45,890 | | |
| | | Containers & Packaging | |
| | 10,222 | | | Amcor Ltd. | | | 74,902 | | |
| | | Diversified Telecommunication
Services | |
| | 3,853 | | | Telstra Corp., Ltd. | | | 12,531 | | |
NUMBER OF
SHARES | |
| | VALUE | |
| | | Food & Staples Retailing | |
| | 733 | | | Wesfarmers Ltd. | | $ | 24,658 | | |
| | 324 | | | Wesfarmers Ltd. (PPS) | | | 11,087 | | |
| | 1,629 | | | Woolworths Ltd. | | | 40,511 | | |
| | | | 76,256 | | |
| | | Health Care Providers &
Services | |
| | 310 | | | Sonic Healthcare Ltd. | | | 3,579 | | |
| | | Hotels, Restaurants & Leisure | |
| | 838 | | | Echo Entertainment
Group Ltd. (b) | | | 3,247 | | |
| | 857 | | | TABCORP Holdings Ltd. | | | 2,637 | | |
| | | | 5,884 | | |
| | | Industrial Conglomerates | |
| | 1,257 | | | CSR Ltd. (a) | | | 3,169 | | |
| | | Insurance | |
| | 2,491 | | | AMP Ltd. | | | 11,084 | | |
| | 3,028 | | | Insurance Australia Group Ltd. | | | 9,894 | | |
| | 1,154 | | | QBE Insurance Group Ltd. | | | 17,712 | | |
| | 1,016 | | | Suncorp Group Ltd. | | | 9,087 | | |
| | | | 47,777 | | |
| | | Metals & Mining | |
| | 19,416 | | | Alumina Ltd. | | | 29,205 | | |
| | 40,753 | | | BHP Billiton Ltd. | | | 1,595,440 | | |
| | 12,307 | | | BlueScope Steel Ltd. (a) | | | 10,765 | | |
| | 5,007 | | | DuluxGroup Ltd. (a) | | | 13,687 | | |
| | 16,462 | | | Fortescue Metals
Group Ltd. (a) | | | 81,981 | | |
| | 15,761 | | | Newcrest Mining Ltd. | | | 555,214 | | |
| | 11,038 | | | OneSteel Ltd. | | | 13,780 | | |
| | 3,591 | | | OZ Minerals Ltd. | | | 42,330 | | |
| | 3,431 | | | Rio Tinto Ltd. | | | 246,019 | | |
| | 1,930 | | | Sims Metal Management Ltd. | | | 27,808 | | |
| | | | 2,616,229 | | |
| | | Multi-Utilities | |
| | 881 | | | AGL Energy Ltd. | | | 13,282 | | |
| | | Oil, Gas & Consumable Fuels | |
| | 773 | | | Caltex Australia Ltd. | | | 10,711 | | |
See Notes to Financial Statements
13
Morgan Stanley International Fund
Portfolio of Investments n October 31, 2011 continued
NUMBER OF
SHARES | |
| | VALUE | |
| | 1,594 | | | Origin Energy Ltd. | | $ | 23,933 | | |
| | 916 | | | Santos Ltd. | | | 12,177 | | |
| | 840 | | | Woodside Petroleum Ltd. | | | 31,613 | | |
| | | | 78,434 | | |
| | | Real Estate Investment Trusts
(REITs) | |
| | 855 | | | Stockland REIT (Stapled
Securities) (c)(d) | | | 2,794 | | |
| | | Transportation Infrastructure | |
| | 1,444 | | | Transurban Group (Stapled
Securities) (c) | | | 7,910 | | |
| | | | | Total Australia | | | 3,736,002 | | |
| | | Austria (0.4%) | |
| | | Commercial Banks | |
| | 3,697 | | | Erste Group Bank AG | | | 78,771 | | |
| | 1,070 | | | Raiffeisen Bank
International AG (a) | | | 29,597 | | |
| | | | 108,368 | | |
| | | Diversified Telecommunication
Services | |
| | 8,605 | | | Telekom Austria AG | | | 97,833 | | |
| | | Electric Utilities | |
| | 1,397 | | | Verbund AG | | | 40,559 | | |
| | | Insurance | |
| | 773 | | | Vienna Insurance Group AG
Wiener Versicherung Gruppe | | | 32,245 | | |
| | | Metals & Mining | |
| | 3,006 | | | Voestalpine AG | | | 103,121 | | |
| | | Oil, Gas & Consumable Fuels | |
| | 1,682 | | | OMV AG | | | 58,545 | | |
| | | | | Total Austria | | | 440,671 | | |
| | | Belgium (0.7%) | |
| | | Beverages | |
| | 6,218 | | | Anheuser-Busch InBev N.V. | | | 345,220 | | |
| | 2,742 | | | Anheuser-Busch InBev N.V.
VVPR (b) | | | 4 | | |
| | | | 345,224 | | |
NUMBER OF
SHARES | |
| | VALUE | |
| | | Chemicals | |
| | 673 | | | Solvay SA, Class A | | $ | 68,448 | | |
| | 1,595 | | | Umicore SA | | | 68,062 | | |
| | | | 136,510 | | |
| | | Diversified Financial Services | |
| | 979 | | | Groupe Bruxelles Lambert SA | | | 75,222 | | |
| | | Diversified Telecommunication
Services | |
| | 1,903 | | | Belgacom SA | | | 57,395 | | |
| | | Insurance | |
| | 5,238 | | | Ageas | | | 10,408 | | |
| | | Pharmaceuticals | |
| | 1,255 | | | UCB SA | | | 55,035 | | |
| | | Wireless Telecommunication
Services | |
| | 365 | | | Mobistar SA | | | 20,706 | | |
| | | | | Total Belgium | | | 700,500 | | |
| | | Brazil (0.1%) | |
| | | Commercial Banks | |
| | 2,600 | | | Banco do Brasil SA | | | 39,223 | | |
| | | Food Products | |
| | 4,428 | | | BRF - Brasil Foods SA | | | 92,204 | | |
| | | Road & Rail | |
| | 3,200 | | | All America Latina
Logistica SA (d) | | | 15,936 | | |
| | | | | Total Brazil | | | 147,363 | | |
| | | Canada (1.3%) | |
| | | Metals & Mining | |
| | 1,500 | | | Agnico-Eagle Mines Ltd. | | | 65,071 | | |
| | 8,700 | | | Barrick Gold Corp. | | | 429,523 | | |
| | 1,500 | | | Centerra Gold, Inc. | | | 29,737 | | |
| | 4,900 | | | Eldorado Gold Corp. | | | 92,076 | | |
| | 1,200 | | | Franco-Nevada Corp. | | | 47,542 | | |
| | 6,900 | | | Goldcorp, Inc. | | | 335,741 | | |
| | 3,300 | | | IAMGOLD Corp. | | | 70,950 | | |
| | 9,900 | | | Kinross Gold Corp. | | | 141,138 | | |
| | 3,900 | | | New Gold, Inc. (b) | | | 48,322 | | |
See Notes to Financial Statements
14
Morgan Stanley International Fund
Portfolio of Investments n October 31, 2011 continued
NUMBER OF
SHARES | |
| | VALUE | |
| | 3,100 | | | Osisko Mining Corp. (b) | | $ | 37,383 | | |
| | 6,700 | | | Yamana Gold, Inc. | | | 100,021 | | |
| | | | | Total Canada | | | 1,397,504 | | |
| | | China (0.0%) | |
| | | Food Products | |
| | 2,000 | | | Chaoda Modern Agriculture
Holdings Ltd. (e) | | | 283 | | |
| | | Household Durables | |
| | 57 | | | Skyworth Digital
Holdings Ltd. (e) | | | 30 | | |
| | | | | Total China | | | 313 | | |
| | | Denmark (1.0%) | |
| | | Chemicals | |
| | 1,033 | | | Novozymes A/S, Class B | | | 152,262 | | |
| | | Diversified Telecommunication
Services | |
| | 2,971 | | | TDC A/S | | | 24,397 | | |
| | | Electrical Equipment | |
| | 2,012 | | | Vestas Wind Systems A/S (b) | | | 31,204 | | |
| | | Marine | |
| | 24 | | | AP Moller - Maersk A/S,
Class B | | | 162,185 | | |
| | | Pharmaceuticals | |
| | 5,598 | | | Novo Nordisk A/S, Class B | | | 591,133 | | |
| | | Road & Rail | |
| | 2,395 | | | DSV A/S | | | 47,519 | | |
| | | Textiles, Apparel &
Luxury Goods | |
| | 2,721 | | | Pandora A/S | | | 25,970 | | |
| | | | | Total Denmark | | | 1,034,670 | | |
| | | Finland (1.0%) | |
| | | Communications Equipment | |
| | 55,483 | | | Nokia Oyj | | | 373,851 | | |
| | | Diversified Telecommunication
Services | |
| | 1,196 | | | Elisa Oyj (a) | | | 25,147 | | |
NUMBER OF
SHARES | |
| | VALUE | |
| | | Electric Utilities | |
| | 7,027 | | | Fortum Oyj | | $ | 170,964 | | |
| | | Food & Staples Retailing | |
| | 2,234 | | | Kesko Oyj, Class B | | | 79,250 | | |
| | | Insurance | |
| | 3,148 | | | Sampo Oyj, Class A | | | 86,365 | | |
| | | Machinery | |
| | 1,414 | | | Kone Oyj, Class B | | | 77,741 | | |
| | 1,494 | | | Metso Oyj | | | 57,567 | | |
| | 1,351 | | | Wartsila Oyj | | | 41,011 | | |
| | | | 176,319 | | |
| | | Metals & Mining | |
| | 2,591 | | | Outokumpu Oyj (a) | | | 21,828 | | |
| | 1,079 | | | Rautaruukki Oyj | | | 11,471 | | |
| | | | 33,299 | | |
| | | Oil, Gas & Consumable Fuels | |
| | 1,510 | | | Neste Oil Oyj | | | 18,227 | | |
| | | Paper & Forest Products | |
| | 6,572 | | | Stora Enso Oyj, Class R | | | 41,525 | | |
| | 5,427 | | | UPM-Kymmene Oyj | | | 63,257 | | |
| | | | 104,782 | | |
| | | | | Total Finland | | | 1,068,204 | | |
| | | France (6.9%) | |
| | | Aerospace & Defense | |
| | 1,545 | | | European Aeronautic Defense
and Space Co. N.V. | | | 45,318 | | |
| | 734 | | | Safran SA | | | 23,890 | | |
| | 726 | | | Thales SA | | | 25,541 | | |
| | | | 94,749 | | |
| | | Auto Components | |
| | 1,354 | | | Cie Generale des
Etablissements Michelin,
Class B | | | 97,805 | | |
| | | Automobiles | |
| | 1,482 | | | Peugeot SA | | | 32,194 | | |
| | 1,305 | | | Renault SA | | | 54,422 | | |
| | | | 86,616 | | |
See Notes to Financial Statements
15
Morgan Stanley International Fund
Portfolio of Investments n October 31, 2011 continued
NUMBER OF
SHARES | |
| | VALUE | |
| | | Beverages | |
| | 865 | | | Pernod-Ricard SA | | $ | 80,606 | | |
| | | Building Products | |
| | 1,952 | | | Cie de St-Gobain | | | 90,324 | | |
| | | Chemicals | |
| | 2,064 | | | Air Liquide SA | | | 266,583 | | |
| | | Commercial Banks | |
| | 4,323 | | | BNP Paribas SA | | | 191,678 | | |
| | 2,976 | | | Credit Agricole SA | | | 22,812 | | |
| | 2,410 | | | Societe Generale SA | | | 69,104 | | |
| | | | 283,594 | | |
| | | Commercial Services &
Supplies | |
| | 1,618 | | | Edenred | | | 45,588 | | |
| | 218 | | | Societe BIC SA | | | 19,447 | | |
| | | | 65,035 | | |
| | | Communications Equipment | |
| | 20,688 | | | Alcatel-Lucent (b) | | | 56,614 | | |
| | | Construction & Engineering | |
| | 2,794 | | | Bouygues SA (a) | | | 104,470 | | |
| | 3,086 | | | Vinci SA | | | 151,465 | | |
| | | | 255,935 | | |
| | | Construction Materials | |
| | 340 | | | Imerys SA | | | 19,397 | | |
| | 3,137 | | | Lafarge SA (a) | | | 127,074 | | |
| | | | 146,471 | | |
| | | Diversified Financial Services | |
| | 226 | | | Eurazeo | | | 10,761 | | |
| | | Diversified Telecommunication
Services | |
| | 13,092 | | | France Telecom SA | | | 235,539 | | |
| | 8,484 | | | Vivendi SA | | | 190,065 | | |
| | | | 425,604 | | |
| | | Electric Utilities | |
| | 1,122 | | | EDF SA (a) | | | 33,595 | | |
| | | Electrical Equipment | |
| | 4,482 | | | Alstom SA | | | 166,614 | | |
NUMBER OF
SHARES | |
| | VALUE | |
| | 186 | | | Legrand SA | | $ | 6,561 | | |
| | 4,547 | | | Schneider Electric SA | | | 263,378 | | |
| | | | 436,553 | | |
| | | Energy Equipment & Services | |
| | 4,294 | | | Cie Generale de
Geophysique-Veritas (b) | | | 93,821 | | |
| | 1,937 | | | Technip SA | | | 183,137 | | |
| | | | 276,958 | | |
| | | Food & Staples Retailing | |
| | 6,011 | | | Carrefour SA | | | 159,467 | | |
| | 1,061 | | | Casino Guichard Perrachon SA | | | 99,262 | | |
| | | | 258,729 | | |
| | | Food Products | |
| | 5,422 | | | Danone | | | 374,799 | | |
| | | Health Care Equipment &
Supplies | |
| | 1,519 | | | Cie Generale d'Optique Essilor
International SA | | | 109,881 | | |
| | | Hotels, Restaurants & Leisure | |
| | 1,618 | | | Accor SA | | | 52,711 | | |
| | 886 | | | Sodexo | | | 63,842 | | |
| | | | 116,553 | | |
| | | Information Technology Services | |
| | 361 | | | Atos | | | 17,443 | | |
| | 2,037 | | | Cap Gemini SA | | | 77,896 | | |
| | | | 95,339 | | |
| | | Insurance | |
| | 8,413 | | | AXA SA | | | 135,164 | | |
| | 1,997 | | | CNP Assurances | | | 30,532 | | |
| | 1,246 | | | SCOR SE | | | 28,983 | | |
| | | | 194,679 | | |
| | | Machinery | |
| | 463 | | | Vallourec SA | | | 28,038 | | |
| | | Media | |
| | 1,747 | | | Lagardere SCA | | | 46,800 | | |
| | 1,010 | | | Publicis Groupe SA | | | 48,820 | | |
See Notes to Financial Statements
16
Morgan Stanley International Fund
Portfolio of Investments n October 31, 2011 continued
NUMBER OF
SHARES | |
| | VALUE | |
| | 3,568 | | | Societe Television Francaise 1 | | $ | 47,872 | | |
| | | | 143,492 | | |
| | | Metals & Mining | |
| | 8,164 | | | ArcelorMittal | | | 168,257 | | |
| | | Multi-Utilities | |
| | 8,755 | | | GDF Suez | | | 246,536 | | |
| | 1,441 | | | Suez Environnement Co. | | | 22,567 | | |
| | 3,418 | | | Veolia Environnement SA (a) | | | 48,161 | | |
| | | | 317,264 | | |
| | | Multiline Retail | |
| | 858 | | | PPR | | | 133,538 | | |
| | | Office Electronics | |
| | 360 | | | Neopost SA (a) | | | 27,414 | | |
| | | Oil, Gas & Consumable Fuels | |
| | 20,645 | | | Total SA | | | 1,079,599 | | |
| | | Personal Products | |
| | 381 | | | L'Oreal SA | | | 41,960 | | |
| | | Pharmaceuticals | |
| | 9,291 | | | Sanofi | | | 665,080 | | |
| | | Real Estate Investment Trusts
(REITs) | |
| | 244 | | | Fonciere Des Regions REIT | | | 17,930 | | |
| | 196 | | | Gecina SA REIT | | | 19,213 | | |
| | 200 | | | ICADE REIT | | | 17,804 | | |
| | 908 | | | Klepierre REIT | | | 28,231 | | |
| | 1,280 | | | Unibail-Rodamco SE REIT | | | 254,111 | | |
| | | | 337,289 | | |
| | | Semiconductors &
Semiconductor Equipment | |
| | 6,988 | | | STMicroelectronics N.V. (a) | | | 48,160 | | |
| | | Software | |
| | 631 | | | Dassault Systemes SA | | | 53,099 | | |
| | | Textiles, Apparel &
Luxury Goods | |
| | 448 | | | Hermes International | | | 151,979 | | |
NUMBER OF
SHARES | |
| | VALUE | |
| | 1,555 | | | LVMH Moet Hennessy
Louis Vuitton SA | | $ | 257,711 | | |
| | | | 409,690 | | |
| | | | | Total France | | | 7,310,663 | | |
| | | Germany (6.2%) | |
| | | Air Freight & Logistics | |
| | 5,779 | | | Deutsche Post AG (Registered) | | | 87,721 | | |
| | | Airlines | |
| | 1,432 | | | Deutsche Lufthansa AG
(Registered) | | | 19,466 | | |
| | | Auto Components | |
| | 355 | | | Continental AG (b) | | | 26,431 | | |
| | | Automobiles | |
| | 7,783 | | | Bayerische Motoren Werke AG | | | 634,284 | | |
| | 6,477 | | | Daimler AG (Registered) | | | 329,049 | | |
| | 1,112 | | | Porsche Automobil Holding SE
(Preference) | | | 64,888 | | |
| | 2,021 | | | Volkswagen AG | | | 317,347 | | |
| | 839 | | | Volkswagen AG (Preference) | | | 146,773 | | |
| | | | 1,492,341 | | |
| | | Capital Markets | |
| | 4,803 | | | Deutsche Bank AG
(Registered) | | | 199,653 | | |
| | | Chemicals | |
| | 4,721 | | | BASF SE | | | 343,107 | | |
| | 1,254 | | | K+S AG | | | 79,471 | | |
| | 597 | | | Lanxess AG | | | 35,085 | | |
| | 503 | | | Linde AG | | | 79,857 | | |
| | | | 537,520 | | |
| | | Commercial Banks | |
| | 3,658 | | | Commerzbank AG (b) | | | 8,948 | | |
| | | Construction & Engineering | |
| | 673 | | | Hochtief AG | | | 48,832 | | |
| | | Diversified Financial Services | |
| | 334 | | | Deutsche Boerse AG (b) | | | 18,428 | | |
See Notes to Financial Statements
17
Morgan Stanley International Fund
Portfolio of Investments n October 31, 2011 continued
NUMBER OF
SHARES | |
| | VALUE | |
| | | Diversified Telecommunication
Services | |
| | 15,622 | | | Deutsche Telekom AG
(Registered) | | $ | 198,060 | | |
| | | Electric Utilities | |
| | 10,627 | | | E.ON AG | | | 256,923 | | |
| | | Food & Staples Retailing | |
| | 2,199 | | | Metro AG | | | 101,599 | | |
| | | Health Care Providers &
Services | |
| | 2,316 | | | Celesio AG | | | 36,592 | | |
| | 1,900 | | | Fresenius Medical Care
AG & Co. KGaA | | | 138,232 | | |
| | | | 174,824 | | |
| | | Hotels, Restaurants & Leisure | |
| | 1,659 | | | TUI AG (a)(b) | | | 10,714 | | |
| | | Household Products | |
| | 513 | | | Henkel AG & Co. KGaA
(Preference) | | | 30,441 | | |
| | | Industrial Conglomerates | |
| | 12,213 | | | Siemens AG (Registered) | | | 1,280,036 | | |
| | | Insurance | |
| | 2,792 | | | Allianz SE (Registered) | | | 311,908 | | |
| | 1,154 | | | Muenchener
Rueckversicherungs AG
(Registered) | | | 154,699 | | |
| | | | 466,607 | | |
| | | Machinery | |
| | 1,427 | | | GEA Group AG | | | 39,239 | | |
| | 375 | | | MAN SE | | | 44,584 | | |
| | | | 83,823 | | |
| | | Media | |
| | 600 | | | Axel Springer AG | | | 24,114 | | |
| | 1,158 | | | ProSiebenSat.1 Media AG | | | 24,440 | | |
| | | | 48,554 | | |
| | | Metals & Mining | |
| | 2,014 | | | ThyssenKrupp AG | | | 57,782 | | |
NUMBER OF
SHARES | |
| | VALUE | |
| | | Multi-Utilities | |
| | 1,713 | | | RWE AG | | $ | 73,099 | | |
| | 186 | | | RWE AG (Preference) | | | 6,953 | | |
| | | | 80,052 | | |
| | | Personal Products | |
| | 439 | | | Beiersdorf AG | | | 25,296 | | |
| | | Pharmaceuticals | |
| | 8,281 | | | Bayer AG (Registered) | | | 528,161 | | |
| | 253 | | | Merck KGaA | | | 23,585 | | |
| | | | 551,746 | | |
| | | Software | |
| | 10,594 | | | SAP AG | | | 638,391 | | |
| | | Textiles, Apparel &
Luxury Goods | |
| | 1,178 | | | Adidas AG | | | 82,871 | | |
| | 77 | | | Puma AG Rudolf
Dassler Sport | | | 24,727 | | |
| | | | 107,598 | | |
| | | | | Total Germany | | | 6,551,786 | | |
| | | Hong Kong (0.0%) | |
| | | Diversified Financial Services | |
| | 56 | | | Hong Kong Exchanges and
Clearing Ltd. | | | 939 | | |
| | | Real Estate Management &
Development | |
| | 45 | | | Henderson Land
Development Co., Ltd. | | | 243 | | |
| | | | | Total Hong Kong | | | 1,182 | | |
| | | India (0.0%) | |
| | | Oil, Gas & Consumable Fuels | |
| | 971 | | | Cairn Energy PLC (b) | | | 4,573 | | |
| | | Indonesia (0.3%) | |
| | | Automobiles | |
| | 5,500 | | | Astra International Tbk PT | | | 42,101 | | |
| | | Commercial Banks | |
| | 34,500 | | | Bank Central Asia Tbk PT | | | 31,196 | | |
See Notes to Financial Statements
18
Morgan Stanley International Fund
Portfolio of Investments n October 31, 2011 continued
NUMBER OF
SHARES | |
| | VALUE | |
| | 8,500 | | | Bank Danamon Indonesia
Tbk PT | | $ | 4,698 | | |
| | 26,500 | | | Bank Mandiri Tbk PT | | | 20,941 | | |
| | 22,500 | | | Bank Negara Indonesia
Persero Tbk PT | | | 10,020 | | |
| | 32,000 | | | Bank Rakyat Indonesia
Persero Tbk PT | | | 23,905 | | |
| | | | 90,760 | | |
| | | Construction Materials | |
| | 4,000 | | | Indocement Tunggal Prakarsa
Tbk PT | | | 7,241 | | |
| | 10,500 | | | Semen Gresik Persero Tbk PT | | | 11,169 | | |
| | | | 18,410 | | |
| | | Diversified Telecommunication
Services | |
| | 28,000 | | | Telekomunikasi Indonesia
Tbk PT | | | 23,246 | | |
| | | Food Products | |
| | 24,500 | | | Charoen Pokphand Indonesia
Tbk PT | | | 7,235 | | |
| | 13,500 | | | Indofood Sukses Makmur
Tbk PT | | | 7,898 | | |
| | | | 15,133 | | |
| | | Gas Utilities | |
| | 31,000 | | | Perusahaan Gas Negara Tbk PT | | | 10,164 | | |
| | | Household Products | |
| | 4,000 | | | Unilever Indonesia Tbk PT | | | 7,024 | | |
| | | Machinery | |
| | 4,833 | | | United Tractors Tbk PT | | | 13,166 | | |
| | | Oil, Gas & Consumable Fuels | |
| | 30,200 | | | Adaro Energy Tbk PT | | | 6,760 | | |
| | 52,500 | | | Bumi Resources Tbk PT | | | 13,628 | | |
| | 1,300 | | | Indo Tambangraya Megah Tbk PT | | | 6,427 | | |
| | 2,500 | | | Tambang Batubara Bukit Asam
Tbk PT | | | 5,098 | | |
| | | | 31,913 | | |
| | | Pharmaceuticals | |
| | 15,000 | | | Kalbe Farma Tbk PT | | | 5,830 | | |
NUMBER OF
SHARES | |
| | VALUE | |
| | | Tobacco | |
| | 2,000 | | | Gudang Garam Tbk PT | | $ | 13,076 | | |
| | | | | Total Indonesia | | | 270,823 | | |
| | | Ireland (0.0%) | |
| | | Construction Materials | |
| | 508 | | | CRH PLC | | | 9,141 | | |
| | | Italy (0.3%) | |
| | | Diversified Financial Services | |
| | 1,557 | | | Exor SpA | | | 33,911 | | |
| | | Electric Utilities | |
| | 6,585 | | | Enel SpA | | | 30,958 | | |
| | | Energy Equipment & Services | |
| | 2,923 | | | Saipem SpA | | | 129,851 | | |
| | | Oil, Gas & Consumable Fuels | |
| | 4,024 | | | ENI SpA | | | 88,611 | | |
| | | | | Total Italy | | | 283,331 | | |
| | | Japan (22.2%) | |
| | | Air Freight & Logistics | |
| | 3,435 | | | Yamato Holdings Co., Ltd. (a) | | | 56,940 | | |
| | | Auto Components | |
| | 3,200 | | | Aisin Seiki Co., Ltd. | | | 101,658 | | |
| | 16,200 | | | Bridgestone Corp. | | | 378,983 | | |
| | 13,900 | | | Denso Corp. | | | 429,237 | | |
| | 2,059 | | | NGK Spark Plug Co., Ltd. | | | 25,588 | | |
| | 6,200 | | | Stanley Electric Co., Ltd. | | | 90,545 | | |
| | 3,100 | | | Toyota Boshoku Corp. (a) | | | 37,759 | | |
| | 1,200 | | | Toyota Industries Corp. | | | 33,931 | | |
| | | | 1,097,701 | | |
| | | Automobiles | |
| | 21,509 | | | Honda Motor Co., Ltd. | | | 648,316 | | |
| | 29,705 | | | Nissan Motor Co., Ltd. | | | 273,668 | | |
| | 5,400 | | | Suzuki Motor Corp. | | | 115,145 | | |
| | 22,755 | | | Toyota Motor Corp. | | | 760,829 | | |
| | 700 | | | Yamaha Motor Co., Ltd. (b) | | | 9,994 | | |
| | | | 1,807,952 | | |
| | | Beverages | |
| | 5,300 | | | Asahi Group Holdings Ltd. | | | 108,728 | | |
See Notes to Financial Statements
19
Morgan Stanley International Fund
Portfolio of Investments n October 31, 2011 continued
NUMBER OF
SHARES | |
| | VALUE | |
| | 10,000 | | | Kirin Holdings Co., Ltd. | | $ | 122,541 | | |
| | | | 231,269 | | |
| | | Building Products | |
| | 10,500 | | | Asahi Glass Co., Ltd. | | | 91,946 | | |
| | 4,000 | | | Daikin Industries Ltd. (a) | | | 118,501 | | |
| | 2,262 | | | JS Group Corp. | | | 47,338 | | |
| | 6,500 | | | Nippon Sheet Glass Co., Ltd. | | | 13,995 | | |
| | 4,500 | | | TOTO Ltd. (a) | | | 37,220 | | |
| | | | 309,000 | | |
| | | Capital Markets | |
| | 28,000 | | | Daiwa Securities Group, Inc. | | | 97,969 | | |
| | 4,400 | | | Matsui Securities Co., Ltd. | | | 20,790 | | |
| | 19,050 | | | Nomura Holdings, Inc. | | | 72,391 | | |
| | 186 | | | SBI Holdings, Inc. | | | 15,458 | | |
| | | | 206,608 | | |
| | | Chemicals | |
| | 15,000 | | | Asahi Kasei Corp. | | | 88,833 | | |
| | 3,000 | | | Daicel Corp (a) | | | 17,029 | | |
| | 8,546 | | | Denki Kagaku Kogyo KK (a) | | | 32,588 | | |
| | 2,408 | | | JSR Corp. | | | 45,957 | | |
| | 5,000 | | | Kaneka Corp. | | | 27,095 | | |
| | 4,556 | | | Kuraray Co., Ltd. | | | 63,787 | | |
| | 19,500 | | | Mitsubishi Chemical
Holdings Corp. | | | 118,531 | | |
| | 9,500 | | | Mitsui Chemicals, Inc. | | | 31,323 | | |
| | 2,600 | | | Nissan Chemical
Industries Ltd. | | | 25,550 | | |
| | 2,400 | | | Nitto Denko Corp. | | | 101,013 | | |
| | 6,997 | | | Shin-Etsu Chemical Co., Ltd. | | | 359,395 | | |
| | 12,000 | | | Showa Denko KK | | | 21,911 | | |
| | 16,000 | | | Sumitomo Chemical
Co., Ltd. (a) | | | 59,286 | | |
| | 13,608 | | | Teijin Ltd. | | | 47,621 | | |
| | 14,000 | | | Toray Industries, Inc. (a) | | | 99,594 | | |
| | 11,000 | | | Tosoh Corp. (a) | | | 35,773 | | |
| | | | 1,175,286 | | |
| | | Commercial Banks | |
| | 3,500 | | | 77 Bank Ltd. (The) | | | 13,866 | | |
| | 3,000 | | | Bank of Kyoto Ltd. (The) (a) | | | 25,495 | | |
NUMBER OF
SHARES | |
| | VALUE | |
| | 14,000 | | | Bank of Yokohama Ltd. (The) | | $ | 64,144 | | |
| | 7,000 | | | Chiba Bank Ltd. (The) (a) | | | 42,915 | | |
| | 8,000 | | | Fukuoka Financial Group, Inc. | | | 30,974 | | |
| | 17,000 | | | Hokuhoku Financial
Group, Inc. | | | 31,766 | | |
| | 8,000 | | | Joyo Bank Ltd. (The) (a) | | | 33,506 | | |
| | 73,260 | | | Mitsubishi UFJ Financial
Group, Inc. (See Note 6) | | | 317,366 | | |
| | 178,600 | | | Mizuho Financial Group, Inc. | | | 250,487 | | |
| | 9,000 | | | Nishi-Nippon City Bank
Ltd. (The) | | | 24,518 | | |
| | 3,900 | | | Resona Holdings, Inc. | | | 17,423 | | |
| | 17,500 | | | Shinsei Bank Ltd. | | | 19,294 | | |
| | 7,000 | | | Shizuoka Bank Ltd. (The) (a) | | | 68,196 | | |
| | 10,100 | | | Sumitomo Mitsui Financial
Group, Inc. | | | 281,578 | | |
| | 55,623 | | | Sumitomo Mitsui Trust
Holdings, Inc. | | | 189,957 | | |
| | 1,000 | | | Suruga Bank Ltd. | | | 8,352 | | |
| | | | 1,419,837 | | |
| | | Commercial Services &
Supplies | |
| | 5,500 | | | Dai Nippon Printing Co.,
Ltd. (a) | | | 57,587 | | |
| | 2,485 | | | Secom Co., Ltd. | | | 117,968 | | |
| | 6,000 | | | Toppan Printing Co., Ltd. | | | 46,613 | | |
| | | | 222,168 | | |
| | | Computers & Peripherals | |
| | 43,000 | | | Fujitsu Ltd. | | | 229,651 | | |
| | 29,500 | | | NEC Corp. (b) | | | 66,048 | | |
| | 6,600 | | | Seiko Epson Corp. (a) | | | 87,434 | | |
| | 48,026 | | | Toshiba Corp. | | | 211,498 | | |
| | | | 594,631 | | |
| | | Construction & Engineering | |
| | 10,546 | | | JGC Corp. | | | 296,090 | | |
| | 12,000 | | | Kajima Corp. (a) | | | 38,305 | | |
| | 9,571 | | | Obayashi Corp. | | | 43,574 | | |
| | 9,000 | | | Shimizu Corp. (a) | | | 38,349 | | |
| | 14,000 | | | Taisei Corp. | | | 37,317 | | |
| | | | 453,635 | | |
See Notes to Financial Statements
20
Morgan Stanley International Fund
Portfolio of Investments n October 31, 2011 continued
NUMBER OF
SHARES | |
| | VALUE | |
| | | Consumer Finance | |
| | 1,600 | | | Credit Saison Co., Ltd. | | $ | 31,445 | | |
| | | Containers & Packaging | |
| | 2,517 | | | Toyo Seikan Kaisha Ltd. | | | 38,229 | | |
| | | Diversified Consumer Services | |
| | 854 | | | Benesse Holdings, Inc. | | | 37,298 | | |
| | | Diversified Financial Services | |
| | 290 | | | ORIX Corp. (a) | | | 25,339 | | |
| | | Diversified Telecommunication
Services | |
| | 1,900 | | | Nippon Telegraph &
Telephone Corp. | | | 97,134 | | |
| | | Electric Utilities | |
| | 2,500 | | | Chubu Electric Power
Co., Inc. | | | 45,773 | | |
| | 3,800 | | | Kansai Electric Power
Co., Inc. (The) | | | 56,235 | | |
| | 1,600 | | | Kyushu Electric Power
Co., Inc. | | | 21,237 | | |
| | 2,900 | | | Tohoku Electric Power
Co., Inc. (a) | | | 32,029 | | |
| | | | 155,274 | | |
| | | Electrical Equipment | |
| | 7,500 | | | Furukawa Electric Co., Ltd. | | | 20,980 | | |
| | 10,000 | | | GS Yuasa Corp. (a) | | | 51,982 | | |
| | 1,900 | | | Mabuchi Motor Co., Ltd. (a) | | | 83,341 | | |
| | 33,552 | | | Mitsubishi Electric Corp. | | | 308,949 | | |
| | 904 | | | Nidec Corp. (a) | | | 74,399 | | |
| | 5,600 | | | Sumitomo Electric
Industries Ltd. | | | 62,464 | | |
| | 800 | | | Ushio, Inc. | | | 11,899 | | |
| | | | 614,014 | | |
| | | Electronic Equipment,
Instruments & Components | |
| | 5,150 | | | Citizen Holdings Co., Ltd. | | | 27,294 | | |
| | 10,400 | | | FUJIFILM Holdings Corp. | | | 255,032 | | |
| | 500 | | | Hirose Electric Co., Ltd. (a) | | | 47,992 | | |
| | 38,000 | | | Hitachi Ltd. | | | 203,955 | | |
| | 4,800 | | | Hoya Corp. | | | 105,298 | | |
NUMBER OF
SHARES | |
| | VALUE | |
| | 3,500 | | | Ibiden Co., Ltd. (a) | | $ | 76,777 | | |
| | 1,147 | | | Keyence Corp. (a) | | | 291,739 | | |
| | 3,800 | | | Kyocera Corp. | | | 334,620 | | |
| | 2,200 | | | Murata Manufacturing
Co., Ltd. | | | 122,496 | | |
| | 9,500 | | | Nippon Electric Glass Co., Ltd. | | | 84,700 | | |
| | 6,104 | | | Omron Corp. | | | 130,725 | | |
| | 1,552 | | | TDK Corp. (a) | | | 63,449 | | |
| | 3,450 | | | Yokogawa Electric Corp. (a)(b) | | | 32,563 | | |
| | | | 1,776,640 | | |
| | | Food & Staples Retailing | |
| | 2,399 | | | FamilyMart Co., Ltd. | | | 94,495 | | |
| | 6,500 | | | Seven & I Holdings Co., Ltd. | | | 173,840 | | |
| | | | 268,335 | | |
| | | Food Products | |
| | 3,100 | | | Yakult Honsha Co., Ltd. (a) | | | 87,925 | | |
| | | Gas Utilities | |
| | 8,000 | | | Osaka Gas Co., Ltd. | | | 30,316 | | |
| | 10,000 | | | Tokyo Gas Co., Ltd. | | | 42,953 | | |
| | | | 73,269 | | |
| | | Health Care Equipment &
Supplies | |
| | 2,400 | | | Olympus Corp. (a) | | | 36,558 | | |
| | 2,400 | | | Sysmex Corp. | | | 79,035 | | |
| | 3,650 | | | Terumo Corp. | | | 185,307 | | |
| | | | 300,900 | | |
| | | Hotels, Restaurants & Leisure | |
| | 650 | | | Oriental Land Co., Ltd. (a) | | | 64,739 | | |
| | | Household Durables | |
| | 5,050 | | | Casio Computer Co., Ltd. (a) | | | 30,965 | | |
| | 33,000 | | | Panasonic Corp. | | | 336,212 | | |
| | 7,072 | | | Sekisui Chemical Co., Ltd. | | | 55,445 | | |
| | 11,046 | | | Sekisui House Ltd. | | | 98,355 | | |
| | 7,500 | | | Sharp Corp. (a) | | | 69,196 | | |
| | 10,996 | | | Sony Corp. | | | 231,220 | | |
| | | | 821,393 | | |
| | | Household Products | |
| | 3,600 | | | Unicharm Corp. | | | 161,700 | | |
See Notes to Financial Statements
21
Morgan Stanley International Fund
Portfolio of Investments n October 31, 2011 continued
NUMBER OF
SHARES | |
| | VALUE | |
| | | Information Technology Services | |
| | 700 | | | Itochu Techno-Solutions
Corp. (a) | | $ | 30,276 | | |
| | 2,250 | | | Nomura Research
Institute Ltd. | | | 50,818 | | |
| | 18 | | | NTT Data Corp. | | | 60,444 | | |
| | 180 | | | Obic Co., Ltd. | | | 34,438 | | |
| | | | 175,976 | | |
| | | Insurance | |
| | 4,200 | | | MS&AD Insurance Group
Holdings | | | 82,590 | | |
| | 2,200 | | | NKSJ Holdings, Inc. (a) | | | 44,229 | | |
| | 4,700 | | | T&D Holdings, Inc. | | | 46,524 | | |
| | 10,268 | | | Tokio Marine Holdings, Inc. | | | 244,389 | | |
| | | | 417,732 | | |
| | | Internet Software & Services | |
| | 203 | | | Yahoo! Japan Corp. (a) | | | 65,495 | | |
| | | Leisure Equipment & Products | |
| | 3,400 | | | Nikon Corp. (a) | | | 76,312 | | |
| | 2,550 | | | Shimano, Inc. (a) | | | 126,221 | | |
| | 2,100 | | | Yamaha Corp. | | | 21,312 | | |
| | | | 223,845 | | |
| | | Machinery | |
| | 3,553 | | | Amada Co., Ltd. | | | 23,412 | | |
| | 2,950 | | | Fanuc Corp. | | | 476,349 | | |
| | 4,700 | | | Hitachi Construction
Machinery Co., Ltd. (a) | | | 90,380 | | |
| | 12,530 | | | IHI Corp. | | | 28,553 | | |
| | 11,500 | | | Kawasaki Heavy
Industries Ltd. (a) | | | 29,444 | | |
| | 15,700 | | | Komatsu Ltd. | | | 386,564 | | |
| | 24,000 | | | Kubota Corp. | | | 197,393 | | |
| | 1,100 | | | Kurita Water Industries Ltd. | | | 30,334 | | |
| | 1,300 | | | Makita Corp. | | | 48,496 | | |
| | 5,000 | | | Minebea Co., Ltd. (a) | | | 17,828 | | |
| | 28,550 | | | Mitsubishi Heavy
Industries Ltd. | | | 116,656 | | |
| | 2,500 | | | Nabtesco Corp. (a) | | | 54,611 | | |
| | 7,060 | | | NGK Insulators Ltd. | | | 81,355 | | |
| | 5,553 | | | NSK Ltd. | | | 41,952 | | |
NUMBER OF
SHARES | |
| | VALUE | |
| | 6,051 | | | NTN Corp. (a) | | $ | 26,706 | | |
| | 1,105 | | | SMC Corp. | | | 172,165 | | |
| | 5,000 | | | Sumitomo Heavy
Industries Ltd. | | | 28,206 | | |
| | 1,000 | | | THK Co., Ltd. | | | 19,399 | | |
| | | | 1,869,803 | | |
| | | Marine | |
| | 43,000 | | | Kawasaki Kisen Kaisha Ltd. | | | 87,547 | | |
| | 16,000 | | | Mitsui OSK Lines Ltd. (a) | | | 61,804 | | |
| | 13,015 | | | Nippon Yusen KK (a) | | | 32,936 | | |
| | | | 182,287 | | |
| | | Metals & Mining | |
| | 7,595 | | | Dowa Holdings Co., Ltd. (a) | | | 45,874 | | |
| | 6,800 | | | JFE Holdings, Inc. | | | 128,135 | | |
| | 25,000 | | | Kobe Steel Ltd. | | | 41,731 | | |
| | 21,000 | | | Mitsubishi Materials Corp. | | | 55,987 | | |
| | 15,604 | | | Mitsui Mining & Smelting
Co., Ltd. | | | 42,736 | | |
| | 95,108 | | | Nippon Steel Corp. (a) | | | 248,510 | | |
| | 83,000 | | | Sumitomo Metal
Industries Ltd. | | | 156,329 | | |
| | 17,500 | | | Sumitomo Metal Mining
Co., Ltd. | | | 241,120 | | |
| | | | 960,422 | | |
| | | Multiline Retail | |
| | 1,900 | | | Ryohin Keikaku Co., Ltd. | | | 90,390 | | |
| | | Office Electronics | |
| | 8,704 | | | Canon, Inc. | | | 397,478 | | |
| | 7,030 | | | Konica Minolta
Holdings, Inc. (a) | | | 51,209 | | |
| | | | 448,687 | | |
| | | Oil, Gas & Consumable Fuels | |
| | 29 | | | INPEX Corp. | | | 190,792 | | |
| | 24,400 | | | JX Holdings, Inc. | | | 141,976 | | |
| | 3,400 | | | Showa Shell Sekiyu KK | | | 24,583 | | |
| | 4,000 | | | TonenGeneral Sekiyu KK (a) | | | 45,109 | | |
| | | | 402,460 | | |
| | | Paper & Forest Products | |
| | 1,400 | | | Nippon Paper Group, Inc. (a) | | | 32,185 | | |
See Notes to Financial Statements
22
Morgan Stanley International Fund
Portfolio of Investments n October 31, 2011 continued
NUMBER OF
SHARES | |
| | VALUE | |
| | 35,000 | | | OJI Paper Co., Ltd. (a) | | $ | 173,438 | | |
| | | | 205,623 | | |
| | | Personal Products | |
| | 4,700 | | | Shiseido Co., Ltd. (a) | | | 86,091 | | |
| | | Pharmaceuticals | |
| | 5,300 | | | Astellas Pharma, Inc. | | | 193,382 | | |
| | 2,600 | | | Chugai Pharmaceutical
Co., Ltd. (a) | | | 40,696 | | |
| | 14,900 | | | Daiichi Sankyo Co., Ltd. | | | 289,741 | | |
| | 2,500 | | | Eisai Co., Ltd. (a) | | | 99,366 | | |
| | 700 | | | Hisamitsu Pharmaceutical
Co., Inc. (a) | | | 28,208 | | |
| | 2,700 | | | Mitsubishi Tanabe
Pharma Corp. | | | 46,840 | | |
| | 900 | | | Ono Pharmaceutical Co., Ltd. | | | 47,111 | | |
| | 2,800 | | | Otsuka Holdings Co. Ltd. | | | 72,083 | | |
| | 900 | | | Santen Pharmaceutical
Co. Ltd. | | | 33,560 | | |
| | 3,400 | | | Shionogi & Co., Ltd. | | | 46,210 | | |
| | 11,500 | | | Takeda Pharmaceutical
Co., Ltd. | | | 518,880 | | |
| | | | 1,416,077 | | |
| | | Real Estate Investment Trusts
(REITs) | |
| | 7 | | | Japan Real Estate Investment
Corp. REIT | | | 59,920 | | |
| | 24 | | | Japan Retail Fund Investment
Corp. REIT (a) | | | 37,441 | | |
| | 8 | | | Nippon Building Fund, Inc.
REIT | | | 77,543 | | |
| | | | 174,904 | | |
| | | Real Estate Management &
Development | |
| | 4,800 | | | Aeon Mall Co., Ltd. | | | 111,941 | | |
| | 1,256 | | | Daito Trust Construction
Co., Ltd. | | | 111,547 | | |
| | 7,000 | | | Daiwa House Industry
Co., Ltd. | | | 87,013 | | |
| | 17,000 | | | Mitsubishi Estate Co., Ltd. | | | 287,955 | | |
| | 12,500 | | | Mitsui Fudosan Co., Ltd. | | | 206,736 | | |
NUMBER OF
SHARES | |
| | VALUE | |
| | 6,500 | | | Sumitomo Realty &
Development Co., Ltd. | | $ | 134,793 | | |
| | 9,000 | | | Tokyu Land Corp. | | | 37,872 | | |
| | | | 977,857 | | |
| | | Road & Rail | |
| | 13 | | | Central Japan Railway Co. (a) | | | 110,542 | | |
| | 3,400 | | | East Japan Railway Co. | | | 206,463 | | |
| | 6,000 | | | Keikyu Corp. (a) | | | 53,980 | | |
| | 3,000 | | | Keio Corp. (a) | | | 20,611 | | |
| | 15,550 | | | Kintetsu Corp. (a) | | | 54,569 | | |
| | 11,500 | | | Nippon Express Co., Ltd. | | | 44,596 | | |
| | 8,500 | | | Tobu Railway Co., Ltd. (a) | | | 40,693 | | |
| | 12,000 | | | Tokyu Corp. (a) | | | 58,058 | | |
| | 900 | | | West Japan Railway Co. | | | 38,149 | | |
| | | | 627,661 | | |
| | | Semiconductors &
Semiconductor Equipment | |
| | 2,450 | | | Advantest Corp. (a) | | | 28,493 | | |
| | 1,605 | | | Rohm Co., Ltd. | | | 81,761 | | |
| | 3,700 | | | Tokyo Electron Ltd. | | | 197,561 | | |
| | | | 307,815 | | |
| | | Software | |
| | 1,700 | | | Konami Corp. (a) | | | 55,643 | | |
| | 1,508 | | | Nintendo Co., Ltd. | | | 228,077 | | |
| | 750 | | | Oracle Corp. Japan | | | 25,854 | | |
| | 1,600 | | | Trend Micro, Inc. | | | 57,256 | | |
| | | | 366,830 | | |
| | | Specialty Retail | |
| | 1,700 | | | Fast Retailing Co., Ltd. | | | 305,365 | | |
| | 300 | | | Shimamura Co., Ltd. | | | 30,050 | | |
| | 620 | | | USS Co., Ltd. (a) | | | 51,309 | | |
| | 1,160 | | | Yamada Denki Co., Ltd. (a) | | | 83,602 | | |
| | | | 470,326 | | |
| | | Textiles, Apparel &
Luxury Goods | |
| | 2,571 | | | Nisshinbo Holdings, Inc. (a) | | | 23,379 | | |
| | | Tobacco | |
| | 51 | | | Japan Tobacco, Inc. | | | 255,677 | | |
See Notes to Financial Statements
23
Morgan Stanley International Fund
Portfolio of Investments n October 31, 2011 continued
NUMBER OF
SHARES | |
| | VALUE | |
| | | Trading Companies &
Distributors | |
| | 19,251 | | | ITOCHU Corp. | | $ | 189,863 | | |
| | 17,550 | | | Marubeni Corp. | | | 101,639 | | |
| | 18,100 | | | Mitsubishi Corp. | | | 372,576 | | |
| | 13,700 | | | Mitsui & Co., Ltd. | | | 199,903 | | |
| | 8,300 | | | Sumitomo Corp. | | | 102,953 | | |
| | | | 966,934 | | |
| | | Transportation Infrastructure | |
| | 2,000 | | | Mitsubishi Logistics Corp. | | | 22,026 | | |
| | | Wireless Telecommunication
Services | |
| | 30 | | | NTT DoCoMo, Inc. | | | 52,991 | | |
| | 13,700 | | | Softbank Corp. | | | 445,703 | | |
| | | | 498,694 | | |
| | | | | Total Japan | | | 23,365,652 | | |
| | | Korea, Republic of (1.1%) | |
| | | Auto Components | |
| | 117 | | | Hyundai Mobis | | | 33,759 | | |
| | | Automobiles | |
| | 280 | | | Hyundai Motor Co. | | | 56,796 | | |
| | 420 | | | Kia Motors Corp. | | | 27,144 | | |
| | | | 83,940 | | |
| | | Capital Markets | |
| | 360 | | | Daewoo Securities Co., Ltd. | | | 3,475 | | |
| | 142 | | | Samsung Securities Co., Ltd. | | | 7,285 | | |
| | | | 10,760 | | |
| | | Chemicals | |
| | 142 | | | Cheil Industries, Inc. | | | 12,519 | | |
| | 88 | | | LG Chem Ltd. | | | 28,355 | | |
| | 35 | | | OCI Co., Ltd. | | | 7,194 | | |
| | | | 48,068 | | |
| | | Commercial Banks | |
| | 380 | | | Hana Financial Group, Inc. | | | 13,426 | | |
| | 610 | | | Industrial Bank of Korea | | | 7,957 | | |
| | 710 | | | KB Financial Group, Inc. | | | 27,754 | | |
| | 1,020 | | | Korea Exchange Bank | | | 7,558 | | |
NUMBER OF
SHARES | |
| | VALUE | |
| | 790 | | | Shinhan Financial Group
Co., Ltd. | | $ | 30,985 | | |
| | 470 | | | Woori Finance Holdings
Co., Ltd. | | | 4,457 | | |
| | | | 92,137 | | |
| | | Construction & Engineering | |
| | 190 | | | Doosan Heavy Industries and
Construction Co., Ltd. | | | 10,123 | | |
| | 123 | | | GS Engineering &
Construction Corp. | | | 10,712 | | |
| | 150 | | | Hyundai Engineering &
Construction Co., Ltd. | | | 9,561 | | |
| | 70 | | | Samsung Engineering
Co., Ltd. | | | 14,293 | | |
| | | | 44,689 | | |
| | | Diversified Telecommunication
Services | |
| | 420 | | | KT Corp. | | | 14,048 | | |
| | | Electric Utilities | |
| | 510 | | | Korea Electric Power Corp. (b) | | | 11,502 | | |
| | | Electronic Equipment,
Instruments & Components | |
| | 450 | | | LG Display Co., Ltd. | | | 9,098 | | |
| | 115 | | | Samsung Electro-Mechanics
Co., Ltd. | | | 8,750 | | |
| | 72 | | | Samsung SDI Co., Ltd. | | | 8,722 | | |
| | | | 26,570 | | |
| | | Food & Staples Retailing | |
| | 47 | | | E-Mart Co., Ltd. (b) | | | 12,194 | | |
| | | Household Durables | |
| | 182 | | | LG Electronics, Inc. | | | 12,137 | | |
| | | Industrial Conglomerates | |
| | 339 | | | LG Corp. | | | 19,673 | | |
| | 77 | | | Samsung Techwin Co., Ltd. | | | 4,115 | | |
| | | | 23,788 | | |
| | | Insurance | |
| | 75 | | | Samsung Fire & Marine
Insurance Co., Ltd. | | | 15,877 | | |
See Notes to Financial Statements
24
Morgan Stanley International Fund
Portfolio of Investments n October 31, 2011 continued
NUMBER OF
SHARES | |
| | VALUE | |
| | | Internet Software & Services | |
| | 83 | | | NHN Corp. (b) | | $ | 17,328 | | |
| | | Machinery | |
| | 84 | | | Hyundai Heavy Industries
Co., Ltd. | | | 22,587 | | |
| | 450 | | | Samsung Heavy Industries
Co., Ltd. | | | 13,842 | | |
| | | | 36,429 | | |
| | | Metals & Mining | |
| | 149 | | | Hyundai Steel Co. | | | 13,525 | | |
| | 118 | | | POSCO | | | 40,922 | | |
| | | | 54,447 | | |
| | | Multiline Retail | |
| | 26 | | | Lotte Shopping Co., Ltd. | | | 9,331 | | |
| | 16 | | | Shinsegae Co., Ltd. | | | 4,007 | | |
| | | | 13,338 | | |
| | | Oil, Gas & Consumable Fuels | |
| | 140 | | | S-Oil Corp. | | | 14,368 | | |
| | 126 | | | SK Innovation Co., Ltd. | | | 18,821 | | |
| | | | 33,189 | | |
| | | Semiconductors &
Semiconductor Equipment | |
| | 900 | | | Hynix Semiconductor, Inc. | | | 18,377 | | |
| | 506 | | | Samsung Electronics Co., Ltd. | | | 438,923 | | |
| | 36 | | | Samsung Electronics Co., Ltd.
(Preference) | | | 20,577 | | |
| | | | 477,877 | | |
| | | Tobacco | |
| | 221 | | | KT&G Corp. | | | 13,869 | | |
| | | Trading Companies &
Distributors | |
| | 290 | | | Samsung C&T Corp. | | | 17,942 | | |
| | | Wireless Telecommunication
Services | |
| | 98 | | | SK Telecom Co., Ltd. | | | 12,993 | | |
| | | | | Total Korea, Republic of | | | 1,106,881 | | |
NUMBER OF
SHARES | |
| | VALUE | |
| | | Mexico (0.6%) | |
| | | Beverages | |
| | 8,500 | | | Fomento Economico Mexicano
SAB de CV (Units) (d) | | $ | 57,039 | | |
| | 2,700 | | | Grupo Modelo SAB de CV | | | 17,176 | | |
| | | | 74,215 | | |
| | | Chemicals | |
| | 3,300 | | | Mexichem SAB de CV | | | 11,378 | | |
| | | Commercial Banks | |
| | 6,300 | | | Grupo Financiero Banorte
SAB de CV, Series O | | | 21,485 | | |
| | 7,000 | | | Grupo Financiero Inbursa SA | | | 15,017 | | |
| | | | 36,502 | | |
| | | Construction Materials | |
| | 37,300 | | | Cemex SAB de CV (Units) (b)(d) | | | 16,317 | | |
| | | Diversified Telecommunication
Services | |
| | 25,300 | | | Telefonos de Mexico
SAB de CV | | | 19,876 | | |
| | | Food & Staples Retailing | |
| | 27,600 | | | Wal-Mart de Mexico SAB de CV,
Series V | | | 71,242 | | |
| | | Food Products | |
| | 7,200 | | | Grupo Bimbo SAB de CV | | | 14,830 | | |
| | | Household Products | |
| | 2,400 | | | Kimberly-Clark de Mexico
SAB de CV, Class A | | | 13,660 | | |
| | | Industrial Conglomerates | |
| | 1,200 | | | Alfa SAB de CV | | | 13,854 | | |
| | | Media | |
| | 10,200 | | | Grupo Televisa SA | | | 43,626 | | |
| | | Metals & Mining | |
| | 512 | | | Fresnillo PLC | | | 13,907 | | |
| | 14,800 | | | Grupo Mexico SAB de CV,
Series B | | | 41,023 | | |
| | 420 | | | Industrias Penoles SAB de CV | | | 17,144 | | |
| | 2,500 | | | Minera Frisco SAB de CV (b) | | | 9,850 | | |
| | | | 81,924 | | |
See Notes to Financial Statements
25
Morgan Stanley International Fund
Portfolio of Investments n October 31, 2011 continued
NUMBER OF
SHARES | |
| | VALUE | |
| | | Specialty Retail | |
| | 295 | | | Grupo Elektra SA de CV | | $ | 22,733 | | |
| | | Wireless Telecommunication
Services | |
| | 152,400 | | | America Movil SAB de CV | | | 193,716 | | |
| | | | | Total Mexico | | | 613,873 | | |
| | | Netherlands (3.0%) | |
| | | Air Freight & Logistics | |
| | 8,488 | | | PostNL N.V. | | | 42,996 | | |
| | 8,488 | | | TNT Express N.V. | | | 71,696 | | |
| | | | 114,692 | | |
| | | Beverages | |
| | 3,824 | | | Heineken N.V. | | | 185,202 | | |
| | | Chemicals | |
| | 3,503 | | | Akzo Nobel N.V. (a) | | | 184,205 | | |
| | 1,643 | | | Koninklijke DSM N.V. | | | 84,103 | | |
| | | | 268,308 | | |
| | | Diversified Financial Services | |
| | 33,580 | | | ING Groep N.V. CVA (b) | | | 289,960 | | |
| | | Diversified Telecommunication
Services | |
| | 24,056 | | | Koninklijke KPN N.V. | | | 314,315 | | |
| | | Energy Equipment & Services | |
| | 1,175 | | | Fugro N.V. CVA | | | 68,908 | | |
| | 1,865 | | | SBM Offshore N.V. | | | 40,998 | | |
| | | | 109,906 | | |
| | | Food & Staples Retailing | |
| | 18,160 | | | Koninklijke Ahold N.V. | | | 232,222 | | |
| | | Food Products | |
| | 23,924 | | | Unilever N.V. CVA | | | 822,682 | | |
| | | Industrial Conglomerates | |
| | 12,034 | | | Koninklijke Philips
Electronics N.V. | | | 249,232 | | |
| | | Insurance | |
| | 15,100 | | | Aegon N.V. (b) | | | 71,753 | | |
NUMBER OF
SHARES | |
| | VALUE | |
| | | Media | |
| | 10,597 | | | Reed Elsevier N.V. | | $ | 130,119 | | |
| | 7,033 | | | Wolters Kluwer N.V. | | | 123,795 | | |
| | | | 253,914 | | |
| | | Professional Services | |
| | 395 | | | Randstad Holding N.V. | | | 13,967 | | |
| | | Real Estate Investment Trusts
(REITs) | |
| | 769 | | | Corio N.V. REIT | | | 38,979 | | |
| | | Semiconductors &
Semiconductor Equipment | |
| | 5,597 | | | ASML Holding N.V. | | | 233,714 | | |
| | | | | Total Netherlands | | | 3,198,846 | | |
| | | Norway (2.0%) | |
| | | Chemicals | |
| | 10,517 | | | Yara International ASA | | | 496,646 | | |
| | | Commercial Banks | |
| | 14,486 | | | DnB NOR ASA | | | 167,524 | | |
| | | Diversified Telecommunication
Services | |
| | 37,970 | | | Telenor ASA | | | 676,070 | | |
| | | Energy Equipment & Services | |
| | 3,730 | | | Aker Solutions ASA | | | 43,129 | | |
| | 3,064 | | | Subsea 7 SA (a)(b) | | | 66,166 | | |
| | | | 109,295 | | |
| | | Industrial Conglomerates | |
| | 12,154 | | | Orkla ASA (a) | | | 105,306 | | |
| | | Metals & Mining | |
| | 19,537 | | | Norsk Hydro ASA | | | 101,188 | | |
| | | Oil, Gas & Consumable Fuels | |
| | 15,543 | | | Statoil ASA | | | 395,338 | | |
| | | Semiconductors &
Semiconductor Equipment | |
| | 2,800 | | | Renewable Energy Corp.
ASA (a)(b) | | | 2,691 | | |
| | | | | Total Norway | | | 2,054,058 | | |
See Notes to Financial Statements
26
Morgan Stanley International Fund
Portfolio of Investments n October 31, 2011 continued
NUMBER OF
SHARES | |
| | VALUE | |
| | | Philippines (0.7%) | |
| | | Commercial Banks | |
| | 58,200 | | | Bank of the Philippine Islands | | $ | 79,181 | | |
| | 34,300 | | | Metropolitan Bank & Trust | | | 56,889 | | |
| | | | 136,070 | | |
| | | Diversified Financial Services | |
| | 7,176 | | | Ayala Corp. | | | 50,783 | | |
| | | Electric Utilities | |
| | 9,230 | | | Manila Electric Co. | | | 51,346 | | |
| | | Independent Power
Producers & Energy Traders | |
| | 59,200 | | | Aboitiz Power Corp. | | | 41,036 | | |
| | 250,000 | | | Energy Development Corp. | | | 35,426 | | |
| | | | 76,462 | | |
| | | Industrial Conglomerates | |
| | 69,000 | | | Aboitiz Equity Ventures, Inc. | | | 65,885 | | |
| | 130,700 | | | Alliance Global Group, Inc. | | | 31,524 | | |
| | 6,000 | | | SM Investments Corp. | | | 77,512 | | |
| | | | 174,921 | | |
| | | Real Estate Management &
Development | |
| | 172,300 | | | Ayala Land, Inc. | | | 64,411 | | |
| | 173,000 | | | SM Prime Holdings, Inc. | | | 52,011 | | |
| | | | 116,422 | | |
| | | Wireless Telecommunication
Services | |
| | 1,530 | | | Philippine Long Distance
Telephone Co. | | | 85,334 | | |
| | | | | Total Philippines | | | 691,338 | | |
| | | Poland (0.9%) | |
| | | Chemicals | |
| | 405 | | | Synthos SA | | | 536 | | |
| | | Commercial Banks | |
| | 2,638 | | | Bank Pekao SA | | | 121,958 | | |
| | 334 | | | BRE Bank SA (b) | | | 28,585 | | |
| | 8,481 | | | Getin Holding SA (b) | | | 22,616 | | |
NUMBER OF
SHARES | |
| | VALUE | |
| | 15,012 | | | Powszechna Kasa
Oszczednosci Bank
Polski SA | | $ | 168,864 | | |
| | | | 342,023 | | |
| | | Diversified Telecommunication
Services | |
| | 15,679 | | | Telekomunikacja Polska SA | | | 83,197 | | |
| | | Electric Utilities | |
| | 15,174 | | | PGE SA | | | 93,056 | | |
| | 23,900 | | | Tauron Polska Energia SA | | | 41,301 | | |
| | | | 134,357 | | |
| | | Insurance | |
| | 1,100 | | | Powszechny Zaklad
Ubezpieczen SA | | | 116,173 | | |
| | | Metals & Mining | |
| | 3,062 | | | KGHM Polska Miedz SA | | | 147,700 | | |
| | | Oil, Gas & Consumable Fuels | |
| | 7,537 | | | Polski Koncern Naftowy
Orlen SA (b) | | | 93,025 | | |
| | 41,073 | | | Polskie Gornictwo Naftowe i
Gazownictwo SA | | | 51,163 | | |
| | | | 144,188 | | |
| | | Software | |
| | 646 | | | Asseco Poland SA | | | 10,030 | | |
| | | | | Total Poland | | | 978,204 | | |
| | | Russia (0.4%) | |
| | | Commercial Banks | |
| | 7,106 | | | VTB Bank OJSC
(Registered GDR) (a) | | | 33,664 | | |
| | | Metals & Mining | |
| | 3,209 | | | MMC Norilsk Nickel OJSC
(ADR) (a) | | | 62,431 | | |
| | | Oil, Gas & Consumable Fuels | |
| | 12,519 | | | Gazprom OAO (ADR) | | | 145,059 | | |
| | 1,272 | | | LUKOIL OAO (ADR) | | | 73,625 | | |
| | 209 | | | NovaTek OAO
(Registered GDR) | | | 29,099 | | |
See Notes to Financial Statements
27
Morgan Stanley International Fund
Portfolio of Investments n October 31, 2011 continued
NUMBER OF
SHARES | |
| | VALUE | |
| | 4,144 | | | Rosneft Oil Co.
(Registered GDR) | | $ | 29,274 | | |
| | 4,000 | | | Surgutneftegas OJSC (ADR) (a) | | | 34,600 | | |
| | 1,098 | | | Tatneft (ADR) | | | 32,394 | | |
| | | | 344,051 | | |
| | | Wireless Telecommunication
Services | |
| | 1,250 | | | Mobile Telesystems
OJSC (ADR) | | | 17,862 | | |
| | | | | Total Russia | | | 458,008 | | |
| | | Singapore (1.9%) | |
| | | Aerospace & Defense | |
| | 16,000 | | | Singapore Technologies
Engineering Ltd. | | | 35,838 | | |
| | | Airlines | |
| | 9,276 | | | Singapore Airlines Ltd. (a) | | | 85,824 | | |
| | | Commercial Banks | |
| | 24,413 | | | DBS Group Holdings Ltd. | | | 238,158 | | |
| | 45,093 | | | Oversea-Chinese Banking
Corp., Ltd. | | | 301,397 | | |
| | 21,508 | | | United Overseas Bank Ltd. | | | 291,490 | | |
| | | | 831,045 | | |
| | | Distributors | |
| | 31 | | | Jardine Cycle & Carriage Ltd. | | | 1,117 | | |
| | | Diversified Financial Services | |
| | 7,490 | | | Singapore Exchange Ltd. (a) | | | 40,023 | | |
| | | Diversified Telecommunication
Services | |
| | 94,630 | | | Singapore
Telecommunications Ltd. | | | 242,558 | | |
| | | Food & Staples Retailing | |
| | 7,000 | | | Olam International Ltd. (a) | | | 13,995 | | |
| | | Food Products | |
| | 13,000 | | | Wilmar International Ltd. | | | 55,807 | | |
| | | Hotels, Restaurants & Leisure | |
| | 87,000 | | | Genting Singapore PLC (a)(b) | | | 118,798 | | |
NUMBER OF
SHARES | |
| | VALUE | |
| | | Industrial Conglomerates | |
| | 13,000 | | | Fraser and Neave Ltd. | | $ | 63,191 | | |
| | 18,700 | | | Keppel Corp., Ltd. | | | 139,737 | | |
| | 12,511 | | | SembCorp Industries Ltd. | | | 41,206 | | |
| | | | 244,134 | | |
| | | Machinery | |
| | 11,400 | | | SembCorp Marine Ltd. (a) | | | 37,706 | | |
| | | Media | |
| | 11,350 | | | Singapore Press
Holdings Ltd. (a) | | | 35,106 | | |
| | | Real Estate Investment Trusts
(REITs) | |
| | 18,000 | | | Ascendas Real Estate
Investment Trust REIT | | | 29,276 | | |
| | 26,704 | | | CapitaMall Trust REIT | | | 39,529 | | |
| | | | 68,805 | | |
| | | Real Estate Management &
Development | |
| | 30,000 | | | CapitaLand Ltd. | | | 64,543 | | |
| | 6,462 | | | City Developments Ltd. | | | 55,857 | | |
| | | | 120,400 | | |
| | | Road & Rail | |
| | 19,089 | | | ComfortDelGro Corp. Ltd. | | | 21,162 | | |
| | | Trading Companies &
Distributors | |
| | 29,726 | | | Noble Group Ltd. | | | 36,194 | | |
| | | | | Total Singapore | | | 1,988,512 | | |
| | | South Africa (0.3%) | |
| | | Beverages | |
| | 10,120 | | | SABMiller PLC | | | 367,218 | | |
| | | Spain (0.2%) | |
| | | Diversified Telecommunication
Services | |
| | 5,923 | | | Telefonica SA (a) | | | 126,367 | | |
| | | Electric Utilities | |
| | 4,150 | | | Iberdrola SA | | | 30,105 | | |
See Notes to Financial Statements
28
Morgan Stanley International Fund
Portfolio of Investments n October 31, 2011 continued
NUMBER OF
SHARES | |
| | VALUE | |
| | | Food & Staples Retailing | |
| | 6,282 | | | Distribuidora Internacional de
Alimentacion SA (b) | | $ | 28,568 | | |
| | | Oil, Gas & Consumable Fuels | |
| | 1,444 | | | Repsol YPF SA | | | 43,502 | | |
| | | Transportation Infrastructure | |
| | 546 | | | Abertis Infraestructuras SA (a) | | | 8,954 | | |
| | | | | Total Spain | | | 237,496 | | |
| | | Sweden (3.3%) | |
| | | Building Products | |
| | 3,406 | | | Assa Abloy AB, Class B | | | 82,670 | | |
| | | Commercial Banks | |
| | 18,247 | | | Nordea Bank AB | | | 165,624 | | |
| | 5,400 | | | Svenska Handelsbanken AB,
Class A | | | 154,652 | | |
| | | | 320,276 | | |
| | | Commercial Services &
Supplies | |
| | 1,600 | | | Securitas AB, Class B | | | 14,518 | | |
| | | Communications Equipment | |
| | 52,416 | | | Telefonaktiebolaget LM
Ericsson, Class B | | | 545,643 | | |
| | | Construction & Engineering | |
| | 8,026 | | | Skanska AB, Class B | | | 130,993 | | |
| | | Diversified Financial Services | |
| | 6,402 | | | Investor AB, Class B | | | 124,946 | | |
| | | Diversified Telecommunication
Services | |
| | 4,013 | | | Tele2 AB, Class B | | | 84,217 | | |
| | 32,459 | | | TeliaSonera AB | | | 224,728 | | |
| | | | 308,945 | | |
| | | Health Care Equipment &
Supplies | |
| | 4,160 | | | Getinge AB, Class B | | | 107,547 | | |
| | | Household Durables | |
| | 5,297 | | | Electrolux AB, Series B | | | 98,586 | | |
NUMBER OF
SHARES | |
| | VALUE | |
| | 3,913 | | | Husqvarna AB, Class B | | $ | 19,839 | | |
| | | | 118,425 | | |
| | | Machinery | |
| | 2,826 | | | Alfa Laval AB | | | 52,739 | | |
| | 7,209 | | | Atlas Copco AB, Class A | | | 156,759 | | |
| | 4,569 | | | Atlas Copco AB, Class B | | | 88,739 | | |
| | 10,326 | | | Sandvik AB | | | 141,563 | | |
| | 568 | | | Scania AB, Class B | | | 9,524 | | |
| | 3,356 | | | SKF AB, Class B | | | 74,072 | | |
| | 6,398 | | | Volvo AB, Class A | | | 79,398 | | |
| | 11,067 | | | Volvo AB, Class B | | | 137,212 | | |
| | | | 740,006 | | |
| | | Metals & Mining | |
| | 3,286 | | | SSAB AB, Class A | | | 31,662 | | |
| | | Oil, Gas & Consumable Fuels | |
| | 2,451 | | | Lundin Petroleum AB (b) | | | 59,837 | | |
| | | Paper & Forest Products | |
| | 859 | | | Holmen AB, Class B | | | 24,248 | | |
| | 9,321 | | | Svenska Cellulosa AB,
Class B | | | 135,419 | | |
| | | | 159,667 | | |
| | | Personal Products | |
| | 3,237 | | | Oriflame Cosmetics SA SDR | | | 128,726 | | |
| | | Specialty Retail | |
| | 12,916 | | | Hennes & Mauritz AB, Class B | | | 425,971 | | |
| | | Tobacco | |
| | 4,193 | | | Swedish Match AB | | | 144,695 | | |
| | | | | Total Sweden | | | 3,444,527 | | |
| | | Switzerland (8.9%) | |
| | | Building Products | |
| | 361 | | | Geberit AG (Registered) (b) | | | 73,866 | | |
| | | Capital Markets | |
| | 5,527 | | | Credit Suisse Group AG
(Registered) (b) | | | 159,322 | | |
| | 4,324 | | | GAM Holding AG (b) | | | 51,253 | | |
| | 1,827 | | | Julius Baer Group Ltd. (b) | | | 68,722 | | |
See Notes to Financial Statements
29
Morgan Stanley International Fund
Portfolio of Investments n October 31, 2011 continued
NUMBER OF
SHARES | |
| | VALUE | |
| | 18,078 | | | UBS AG (Registered) (b) | | $ | 228,060 | | |
| | | | 507,357 | | |
| | | Chemicals | |
| | 68 | | | Givaudan SA (Registered) (b) | | | 61,812 | | |
| | 1,918 | | | Syngenta AG (Registered) (b) | | | 586,566 | | |
| | | | 648,378 | | |
| | | Computers & Peripherals | |
| | 2,768 | | | Logitech International SA
(Registered) (a)(b) | | | 26,565 | | |
| | | Construction Materials | |
| | 2,195 | | | Holcim Ltd. (Registered) (b) | | | 139,101 | | |
| | | Diversified Financial Services | |
| | 57 | | | Pargesa Holding SA | | | 4,444 | | |
| | | Diversified Telecommunication
Services | |
| | 325 | | | Swisscom AG (Registered) | | | 130,814 | | |
| | | Electrical Equipment | |
| | 30,695 | | | ABB Ltd. (Registered) (b) | | | 578,686 | | |
| | | Energy Equipment & Services | |
| | 633 | | | Transocean Ltd. | | | 35,769 | | |
| | | Food Products | |
| | 49,508 | | | Nestle SA (Registered) | | | 2,865,015 | | |
| | | Health Care Equipment &
Supplies | |
| | 144 | | | Straumann Holding AG
(Registered) | | | 25,326 | | |
| | 977 | | | Synthes, Inc. (f) | | | 163,472 | | |
| | | | 188,798 | | |
| | | Insurance | |
| | 404 | | | Baloise-Holding AG
(Registered) | | | 32,828 | | |
| | 231 | | | Swiss Life Holding AG
(Registered) (b) | | | 28,318 | | |
| | 2,797 | | | Swiss Re AG (b) | | | 152,985 | | |
| | 955 | | | Zurich Financial
Services AG (b) | | | 219,478 | | |
| | | | 433,609 | | |
NUMBER OF
SHARES | |
| | VALUE | |
| | | Life Sciences Tools & Services | |
| | 771 | | | Lonza Group AG
(Registered) (b) | | $ | 51,153 | | |
| | | Machinery | |
| | 482 | | | Schindler Holding AG | | | 56,667 | | |
| | | Pharmaceuticals | |
| | 23,666 | | | Novartis AG (Registered) | | | 1,336,954 | | |
| | 7,148 | | | Roche Holding AG | | | 1,175,158 | | |
| | | | 2,512,112 | | |
| | | Professional Services | |
| | 193 | | | Adecco SA (Registered) (b) | | | 9,231 | | |
| | 22 | | | SGS SA (Registered) | | | 37,621 | | |
| | | | 46,852 | | |
| | | Textiles, Apparel &
Luxury Goods | |
| | 10,414 | | | Cie Financiere Richemont SA | | | 590,886 | | |
| | 977 | | | Swatch Group AG (The) | | | 409,666 | | |
| | 742 | | | Swatch Group AG (The)
(Registered) | | | 54,279 | | |
| | | | 1,054,831 | | |
| | | | | Total Switzerland | | | 9,354,017 | | |
| | | Thailand (0.2%) | |
| | | Commercial Banks | |
| | 5,500 | | | Bangkok Bank PCL | | | 26,393 | | |
| | 9,900 | | | Bangkok Bank PCL
(Foreign Registered) | | | 49,846 | | |
| | 22,100 | | | Bank of Ayudhya PCL
(Foreign) | | | 14,456 | | |
| | 7,000 | | | Kasikornbank PCL | | | 27,835 | | |
| | 13,600 | | | Kasikornbank PCL (Foreign) | | | 54,668 | | |
| | 30,600 | | | Krung Thai Bank PCL | | | 14,893 | | |
| | 17,800 | | | Siam Commercial Bank PCL
(Foreign) | | | 67,139 | | |
| | | | | Total Thailand | | | 255,230 | | |
| | | Turkey (1.0%) | |
| | | Beverages | |
| | 5,444 | | | Anadolu Efes Biracilik Ve Malt
Sanayii AS | | | 66,021 | | |
See Notes to Financial Statements
30
Morgan Stanley International Fund
Portfolio of Investments n October 31, 2011 continued
NUMBER OF
SHARES | |
| | VALUE | |
| | 1,784 | | | Coca-Cola Icecek AS
(Units) (d) | | $ | 24,173 | | |
| | | | 90,194 | | |
| | | Commercial Banks | |
| | 29,665 | | | Akbank TAS | | | 107,846 | | |
| | 49,692 | | | Turkiye Garanti Bankasi AS
(Units) (d) | | | 174,496 | | |
| | 8,358 | | | Turkiye Halk Bankasi AS | | | 51,215 | | |
| | 38,513 | | | Turkiye Is Bankasi, Series C | | | 89,486 | | |
| | 21,114 | | | Turkiye Vakiflar Bankasi Tao,
Class D | | | 35,876 | | |
| | 21,685 | | | Yapi ve Kredi Bankasi AS (b) | | | 40,503 | | |
| | | | 499,422 | | |
| | | Diversified Financial Services | |
| | 13,838 | | | Haci Omer Sabanci
Holding AS | | | 47,190 | | |
| | | Diversified Telecommunication
Services | |
| | 13,794 | | | Turk Telekomunikasyon AS | | | 58,323 | | |
| | | Food & Staples Retailing | |
| | 2,148 | | | BIM Birlesik Magazalar AS | | | 65,301 | | |
| | | Industrial Conglomerates | |
| | 16,101 | | | KOC Holding AS | | | 57,329 | | |
| | | Metals & Mining | |
| | 15,032 | | | Eregli Demir ve Celik
Fabrikalari TAS | | | 30,969 | | |
| | | Oil, Gas & Consumable Fuels | |
| | 3,235 | | | Tupras Turkiye Petrol
Rafinerileri AS | | | 72,799 | | |
| | | Real Estate Investment Trusts
(REITs) | |
| | 20,057 | | | Emlak Konut Gayrimenkul
Yatirim Ortakligi AS REIT | | | 26,951 | | |
| | | Wireless Telecommunication
Services | |
| | 19,356 | | | Turkcell Iletisim
Hizmetleri AS (b) | | | 95,419 | | |
| | | | | Total Turkey | | | 1,043,897 | | |
NUMBER OF
SHARES | |
| | VALUE | |
| | | United Kingdom (19.9%) | |
| | | Aerospace & Defense | |
| | 26,293 | | | BAE Systems PLC | | $ | 116,140 | | |
| | 11,529 | | | Cobham PLC | | | 33,267 | | |
| | 14,154 | | | Rolls-Royce Holdings PLC (b) | | | 159,029 | | |
| | 976,626 | | | Rolls-Royce Holdings PLC,
Class C (b) | | | 1,570 | | |
| | | | 310,006 | | |
| | | Beverages | |
| | 35,234 | | | Diageo PLC | | | 729,818 | | |
| | | Capital Markets | |
| | 5,781 | | | 3i Group PLC | | | 18,975 | | |
| | 2,531 | | | Investec PLC | | | 15,299 | | |
| | 15,431 | | | Man Group PLC | | | 36,789 | | |
| | 1,714 | | | Schroders PLC | | | 39,260 | | |
| | | | 110,323 | | |
| | | Chemicals | |
| | 1,911 | | | Johnson Matthey PLC | | | 57,424 | | |
| | | Commercial Banks | |
| | 40,299 | | | Barclays PLC | | | 124,594 | | |
| | 131,030 | | | HSBC Holdings PLC | | | 1,143,426 | | |
| | 57,454 | | | Lloyds Banking Group PLC (b) | | | 29,595 | | |
| | 107,782 | | | Royal Bank of Scotland
Group PLC (b) | | | 41,121 | | |
| | 19,325 | | | Standard Chartered PLC | | | 450,200 | | |
| | | | 1,788,936 | | |
| | | Commercial Services &
Supplies | |
| | 12,385 | | | Aggreko PLC | | | 338,621 | | |
| | 4,556 | | | G4S PLC | | | 17,850 | | |
| | 1,852 | | | Serco Group PLC | | | 15,347 | | |
| | | | 371,818 | | |
| | | Construction & Engineering | |
| | 12,118 | | | Balfour Beatty PLC | | | 48,846 | | |
| | | Containers & Packaging | |
| | 7,876 | | | Rexam PLC | | | 43,542 | | |
See Notes to Financial Statements
31
Morgan Stanley International Fund
Portfolio of Investments n October 31, 2011 continued
NUMBER OF
SHARES | |
| | VALUE | |
| | | Diversified Telecommunication
Services | |
| | 108,542 | | | BT Group PLC | | $ | 327,797 | | |
| | | Electric Utilities | |
| | 13,950 | | | Scottish & Southern
Energy PLC | | | 299,802 | | |
| | | Energy Equipment & Services | |
| | 3,695 | | | AMEC PLC | | | 54,728 | | |
| | 4,108 | | | Petrofac Ltd. | | | 94,351 | | |
| | | | 149,079 | | |
| | | Food & Staples Retailing | |
| | 13,046 | | | J Sainsbury PLC | | | 62,233 | | |
| | 73,147 | | | Tesco PLC | | | 471,426 | | |
| | | | 533,659 | | |
| | | Food Products | |
| | 14,443 | | | Unilever PLC | | | 482,120 | | |
| | | Health Care Equipment &
Supplies | |
| | 17,251 | | | Smith & Nephew PLC | | | 157,390 | | |
| | | Hotels, Restaurants & Leisure | |
| | 2,947 | | | Carnival PLC | | | 106,758 | | |
| | 24,002 | | | Compass Group PLC | | | 217,852 | | |
| | 4,888 | | | Intercontinental Hotels
Group PLC | | | 90,174 | | |
| | 9,530 | | | TUI Travel PLC | | | 26,013 | | |
| | 2,883 | | | Whitbread PLC | | | 76,496 | | |
| | | | 517,293 | | |
| | | Household Products | |
| | 6,776 | | | Reckitt Benckiser Group PLC | | | 347,563 | | |
| | | Independent Power Producers &
Energy Traders | |
| | 4,314 | | | International Power PLC | | | 23,390 | | |
| | | Industrial Conglomerates | |
| | 3,015 | | | Smiths Group PLC | | | 46,057 | | |
| | | Insurance | |
| | 1,422 | | | Admiral Group PLC | | | 26,806 | | |
| | 16,683 | | | Aviva PLC | | | 90,556 | | |
| | 47,626 | | | Legal & General Group PLC | | | 83,893 | | |
NUMBER OF
SHARES | |
| | VALUE | |
| | 44,303 | | | Old Mutual PLC | | $ | 77,732 | | |
| | 15,879 | | | Prudential PLC | | | 164,262 | | |
| | 27,792 | | | RSA Insurance Group PLC | | | 49,565 | | |
| | 15,153 | | | Standard Life PLC | | | 52,180 | | |
| | | | 544,994 | | |
| | | Internet & Catalog Retail | |
| | 10,876 | | | Home Retail Group PLC | | | 17,448 | | |
| | | Machinery | |
| | 7,144 | | | Charter International PLC (a) | | | 102,735 | | |
| | 5,761 | | | Invensys PLC | | | 20,735 | | |
| | | | 123,470 | | |
| | | Media | |
| | 23,145 | | | British Sky Broadcasting
Group PLC | | | 259,839 | | |
| | 11,351 | | | Pearson PLC | | | 208,972 | | |
| | 18,650 | | | Reed Elsevier PLC | | | 159,646 | | |
| | 49,043 | | | WPP PLC | | | 508,283 | | |
| | | | 1,136,740 | | |
| | | Metals & Mining | |
| | 11,462 | | | Anglo American PLC | | | 420,030 | | |
| | 11,296 | | | BHP Billiton PLC | | | 355,583 | | |
| | 2,433 | | | Randgold Resources Ltd. | | | 266,188 | | |
| | 13,612 | | | Rio Tinto PLC | | | 736,047 | | |
| | 12,598 | | | Xstrata PLC | | | 209,876 | | |
| | | | 1,987,724 | | |
| | | Multi-Utilities | |
| | 32,213 | | | Centrica PLC | | | 152,567 | | |
| | 32,306 | | | National Grid PLC | | | 319,985 | | |
| | | | 472,552 | | |
| | | Multiline Retail | |
| | 19,628 | | | Marks & Spencer Group PLC | | | 100,859 | | |
| | 2,785 | | | Next PLC | | | 113,752 | | |
| | | | 214,611 | | |
| | | Oil, Gas & Consumable Fuels | |
| | 32,972 | | | BG Group PLC | | | 714,531 | | |
| | 135,584 | | | BP PLC | | | 999,394 | | |
| | 39,680 | | | Royal Dutch Shell PLC,
Class A | | | 1,401,476 | | |
See Notes to Financial Statements
32
Morgan Stanley International Fund
Portfolio of Investments n October 31, 2011 continued
NUMBER OF
SHARES | |
| | VALUE | |
| | 26,821 | | | Royal Dutch Shell PLC,
Class B | | $ | 962,534 | | |
| | 557 | | | Tullow Oil PLC | | | 12,503 | | |
| | | | 4,090,438 | | |
| | | Pharmaceuticals | |
| | 13,665 | | | AstraZeneca PLC | | | 652,513 | | |
| | 51,688 | | | GlaxoSmithKline PLC | | | 1,158,562 | | |
| | | | 1,811,075 | | |
| | | Professional Services | |
| | 1,773 | | | Capita Group PLC (The) | | | 20,646 | | |
| | 9,477 | | | Experian PLC | | | 122,792 | | |
| | | | 143,438 | | |
| | | Real Estate Investment Trusts
(REITs) | |
| | 9,395 | | | British Land Co., PLC REIT | | | 76,855 | | |
| | 6,556 | | | Capital Shopping Centres
Group PLC REIT | | | 34,605 | | |
| | 8,687 | | | Hammerson PLC REIT | | | 56,480 | | |
| | 8,823 | | | Land Securities Group PLC
REIT | | | 96,730 | | |
| | 8,784 | | | Segro PLC REIT | | | 34,323 | | |
| | | | 298,993 | | |
| | | Road & Rail | |
| | 9,040 | | | Firstgroup PLC | | | 48,272 | | |
| | | Semiconductors &
Semiconductor Equipment | |
| | 25,507 | | | ARM Holdings PLC | | | 238,939 | | |
| | | Software | |
| | 20,512 | | | Sage Group PLC (The) | | | 91,507 | | |
| | | Specialty Retail | |
| | 15,420 | | | Kingfisher PLC | | | 63,771 | | |
| | | Textiles, Apparel &
Luxury Goods | |
| | 4,894 | | | Burberry Group PLC | | | 104,736 | | |
| | | Tobacco | |
| | 19,297 | | | British American Tobacco PLC | | | 883,075 | | |
| | 7,884 | | | Imperial Tobacco Group PLC | | | 287,318 | | |
| | | | 1,170,393 | | |
NUMBER OF
SHARES | |
| | VALUE | |
| | | Trading Companies &
Distributors | |
| | 3,506 | | | Bunzl PLC | | $ | 45,175 | | |
| | 676 | | | Wolseley PLC | | | 19,467 | | |
| | | | 64,642 | | |
| | | Water Utilities | |
| | 4,677 | | | Severn Trent PLC | | | 113,750 | | |
| | 1,972 | | | United Utilities Group PLC | | | 19,184 | | |
| | | | 132,934 | | |
| | | Wireless Telecommunication
Services | |
| | 656,080 | | | Vodafone Group PLC | | | 1,819,495 | | |
| | | Total United Kingdom | | | 20,921,035 | | |
| | | United States (0.1%) | |
| | | Energy Equipment & Services | |
| | 7,773 | | | Tenaris SA (a) | | | 123,693 | | |
| | | Real Estate Management &
Development | |
| | 1,774 | | | Lend Lease Group REIT
(Stapled Securities) (c)(d) | | | 14,243 | | |
| | | Total United States | | | 137,936 | | |
| | | Total Common Stocks
(Cost $94,063,592) | | | 93,173,454 | | |
NUMBER OF
RIGHTS | |
| | | |
| | | Rights (0.0%) | |
| | | Korea, Republic of | |
| | | Capital Markets | |
| | 16 | | | Samsung Securities Co. Ltd.
(Cost $0) (b) | | | 144 | | |
See Notes to Financial Statements
33
Morgan Stanley International Fund
Portfolio of Investments n October 31, 2011 continued
PRINCIPAL
AMOUNT IN
THOUSANDS | |
| | VALUE | |
| | | Short-Term Investments (15.8%) | |
| | | Securities held as Collateral
on Loaned Securities (5.2%) | |
| | | Repurchase Agreements (1.1%) | |
| $ | 537 | | | Barclays Capital, Inc.
(0.11%, dated 10/31/11,
due 11/01/11; proceeds
$536,983; fully collateralized
by a U.S. Government
Agency; Federal Home Loan
Mortgage Corporation
3.75% due 06/28/13;
valued at $547,723) | | $ | 536,981 | | |
| | 24 | | | Barclays Capital, Inc.
(0.10%, dated 10/31/11,
due 11/01/11; proceeds
$23,839; fully collateralized
by a U.S. Government
Obligation; U.S. Treasury Note
1.38% due 02/15/13;
valued at $24,317) | | | 23,839 | | |
| | 594 | | | Nomura Holdings, Inc.
(0.16%, dated 10/31/11,
due 11/01/11; proceeds
$593,508; fully collateralized
by U.S. Government Agencies;
Federal Home Loan Mortgage
Corporation 4.00% due
05/01/26; Federal National
Mortgage Association
4.00% due 07/01/26;
valued at $605,376) | | | 593,506 | | |
| | | | | Total Repurchase Agreements
(Cost $1,154,326) | | | 1,154,326 | | |
NUMBER OF
SHARES (000) | |
| | VALUE | |
| | | Investment Company (4.1%) | | | |
| | 4,353 | | | Morgan Stanley Institutional
Liquidity Funds - Money Market
Portfolio - Institutional Class
(See Note 6)
(Cost $4,352,600) | | $ | 4,352,600 | | |
| | | Total Securities held as
Collateral on
Loaned Securities
(Cost $5,506,926) | | | 5,506,926 | | |
| | | Investment Company (10.6%) | | | |
| | 11,115 | | | Morgan Stanley Institutional
Liquidity Funds - Money Market
Portfolio - Institutional Class
(See Note 6)
(Cost $11,115,218) | | | 11,115,218 | | |
| | | Total Short-Term
Investments
(Cost $16,622,144) | | | 16,622,144 | | |
Total Investments
(Cost $110,685,736) (g)(h)(i) | | | 104.2 | % | | | 109,795,742 | | |
Liabilities in Excess of
Other Assets | | | (4.2 | ) | | | (4,395,325 | ) | |
| Net Assets | | | 100.0 | % | | $ | 105,400,417 | | |
ADR American Depositary Receipt.
CDI CHESS Depositary Interest.
CVA Certificaten Van Aandelen.
GDR Global Depositary Receipt.
PPS Price Protected Shares.
REIT Real Estate Investment Trust.
SDR Swedish Depositary Receipt.
VVPR Verminderde Voorheffing Précompte Réduit.
(a) All or a portion of this security was on loan at October 31, 2011.
(b) Non-income producing security.
(c) Comprised of securities in separate entities that are traded as a single stapled security.
(d) Consists of one or more classes of securities traded together as a unit; stocks with attached warrants.
(e) Security trades on the Hong Kong exchange.
See Notes to Financial Statements
34
Morgan Stanley International Fund
Portfolio of Investments n October 31, 2011 continued
(f) 144A security - Certain conditions for public sale may exist. Unless otherwise noted, these securities are deemed to be liquid.
(g) Securities are available for collateral in connection with open foreign currency exchange contracts and futures contracts.
(h) The market value and percentage of net assets, $90,917,783 and 86.3%, respectively, represent the securities that have been fair valued under the fair valuation policy for international investments as described in Note 1A within the Notes to the Financial Statements.
(i) The aggregate cost for federal income tax purposes is $113,748,767. The aggregate gross unrealized appreciation is $11,016,139 and the aggregate gross unrealized depreciation is $14,969,164 resulting in net unrealized depreciation of $3,953,025.
Foreign Currency Exchange Contracts Open at October 31, 2011:
| COUNTERPARTY | | CONTRACTS
TO DELIVER | | IN EXCHANGE
FOR | | DELIVERY
DATE | | UNREALIZED
APPRECIATION
(DEPRECIATION) | |
| Credit Suisse London Branch | | $ | 1,970,205 | | | EUR | 1,440,230 | | | 11/17/11 | | $ | 22,338 | | |
| Deutsche Bank | | EUR | 3,339,439 | | | $ | 4,570,306 | | | 11/17/11 | | | (49,774 | ) | |
| Deutsche Bank | | GBP | 375,886 | | | $ | 587,678 | | | 11/17/11 | | | (16,618 | ) | |
| Deutsche Bank | | $ | 4,676,428 | | | EUR | 3,418,367 | | | 11/17/11 | | | 52,848 | | |
| Deutsche Bank | | $ | 2,026,839 | | | EUR | 1,458,493 | | | 11/17/11 | | | (9,028 | ) | |
| J.P.Morgan Chase Bank | | $ | 806,705 | | | EUR | 589,735 | | | 11/17/11 | | | 9,188 | | |
| Mellon Bank | | $ | 2,434,483 | | | AUD | 2,397,041 | | | 11/17/11 | | | 87,147 | | |
| Mellon Bank | | $ | 2,581,241 | | | AUD | 2,470,206 | | | 11/17/11 | | | 17,356 | | |
| Mellon Bank | | $ | 1,726,184 | | | EUR | 1,261,803 | | | 11/17/11 | | | 19,507 | | |
| Royal Bank of Scotland | | JPY | 154,601,658 | | | $ | 2,027,682 | | | 11/17/11 | | | 49,638 | | |
| Royal Bank of Scotland | | $ | 289,294 | | | EUR | 211,472 | | | 11/17/11 | | | 3,276 | | |
| Royal Bank of Scotland | | $ | 2,436,190 | | | JPY | 186,913,048 | | | 11/17/11 | | | (44,739 | ) | |
| UBS AG London | | CHF | 729,371 | | | $ | 807,872 | | | 11/17/11 | | | (23,216 | ) | |
| UBS AG London | | EUR | 2,216,286 | | | $ | 3,031,724 | | | 11/17/11 | | | (34,485 | ) | |
| UBS AG London | | GBP | 1,580,051 | | | $ | 2,525,364 | | | 11/17/11 | | | (14,822 | ) | |
| UBS AG London | | GBP | 665,159 | | | $ | 1,061,614 | | | 11/17/11 | | | (7,736 | ) | |
| UBS AG London | | $ | 4,141,866 | | | EUR | 2,972,233 | | | 11/17/11 | | | (29,812 | ) | |
| UBS AG London | | $ | 2,799,570 | | | GBP | 1,790,577 | | | 11/17/11 | | | 79,069 | | |
| | | | | Net Unrealized Appreciation | | | | $ | 110,137 | | |
Currency Abbreviations:
AUD Australian Dollar.
CHF Swiss Franc.
EUR Euro.
GBP British Pound.
JPY Japanese Yen.
See Notes to Financial Statements
35
Morgan Stanley International Fund
Portfolio of Investments n October 31, 2011 continued
Futures Contracts Open at October 31, 2011:
NUMBER OF
CONTRACTS | | LONG/SHORT | | DESCRIPTION, DELIVERY
MONTH AND YEAR | | UNDERLYING FACE
AMOUNT AT VALUE | | UNREALIZED
APPRECIATION
(DEPRECIATION) | |
| | 25 | | | Long | | TOPIX Index,
Dec-11 | | $ | 2,433,784 | | | $ | 17,703 | | |
| | 11 | | | Long | | DAX Index,
Dec-11 | | | 2,363,829 | | | | 311,057 | | |
| | 14 | | | Long | | ASX Index, | | | | | | | | | |
| | 9 | | | Long | | Dec-11
Hang Seng China ENT Index, | | | 1,587,039
| | | | 89,649
| | |
| | | | | | | Nov-11 | | | 1,146,322 | | | | 58,417 | | |
| | 9 | | | Long | | FTSE MIB Index, | | | | | | | | | |
| | | | | | | Dec-11 | | | 999,735 | | | | (55,041 | ) | |
| | 7 | | | Long | | Dow Jones Euro Stoxx 50 Index, | | | | | | | | | |
| | | | | | | Dec-11 | | | 232,804 | | | | 31,001 | | |
| | | | | | | Net Unrealized Appreciation | | | | $ | 452,786 | | |
See Notes to Financial Statements
36
Morgan Stanley International Fund
Summary of Investments n October 31, 2011
| INDUSTRY | | VALUE | | PERCENT OF
TOTAL
INVESTMENTS | |
| Investment Company | | $ | 11,115,218 | | | | 10.7 | % | |
| Metals & Mining | | | 7,834,659 | | | | 7.5 | | |
| Pharmaceuticals | | | 7,608,088 | | | | 7.3 | | |
| Oil, Gas & Consumable Fuels | | | 6,945,704 | | | | 6.7 | | |
| Commercial Banks | | | 6,922,273 | | | | 6.6 | | |
| Food Products | | | 4,810,798 | | | | 4.6 | | |
| Chemicals | | | 3,993,510 | | | | 3.8 | | |
| Automobiles | | | 3,512,950 | | | | 3.4 | | |
Diversified Telecommunication
Services | | | 3,263,657 | | | | 3.1 | | |
| Machinery | | | 3,165,427 | | | | 3.0 | | |
Wireless Telecommunication
Services | | | 2,744,219 | | | | 2.6 | | |
| Insurance | | | 2,438,219 | | | | 2.3 | | |
| Industrial Conglomerates | | | 2,197,826 | | | | 2.1 | | |
| Beverages | | | 2,141,595 | | | | 2.1 | | |
Electronic Equipment,
Instruments & Components | | | 1,803,210 | | | | 1.7 | | |
| Food & Staples Retailing | | | 1,741,350 | | | | 1.7 | | |
Textiles, Apparel &
Luxury Goods | | | 1,726,204 | | | | 1.7 | | |
| Media | | | 1,661,432 | | | | 1.6 | | |
| Electrical Equipment | | | 1,660,457 | | | | 1.6 | | |
| Tobacco | | | 1,597,710 | | | | 1.5 | | |
Semiconductors &
Semiconductor Equipment | | | 1,309,196 | | | | 1.3 | | |
| Auto Components | | | 1,255,696 | | | | 1.2 | | |
Real Estate Management &
Development | | | 1,229,165 | | | | 1.2 | | |
| Electric Utilities | | | 1,215,385 | | | | 1.2 | | |
| Software | | | 1,159,857 | | | | 1.1 | | |
Trading Companies &
Distributors | | | 1,085,712 | | | | 1.0 | | |
| Capital Markets | | | 1,043,993 | | | | 1.0 | | |
| Construction & Engineering | | | 992,441 | | | | 1.0 | | |
| Specialty Retail | | | 982,801 | | | | 0.9 | | |
| Communications Equipment | | | 976,108 | | | | 0.9 | | |
| Household Durables | | | 951,985 | | | | 0.9 | | |
Real Estate Investment
Trusts (REITs) | | | 948,715 | | | | 0.9 | | |
Energy Equipment &
Services | | | 934,551 | | | | 0.9 | | |
| Multi-Utilities | | | 883,150 | | | | 0.8 | | |
Health Care Equipment &
Supplies | | | 864,516 | | | | 0.8 | | |
Hotels, Restaurants &
Leisure | | | 833,981 | | | | 0.8 | | |
| Road & Rail | | | 760,550 | | | | 0.7 | | |
| INDUSTRY | | VALUE | | PERCENT OF
TOTAL
INVESTMENTS | |
| Diversified Financial Services | | $ | 721,946 | | | | 0.7 | % | |
Commercial Services &
Supplies | | | 685,768 | | | | 0.7 | | |
| Computers & Peripherals | | | 621,196 | | | | 0.6 | | |
| Household Products | | | 560,388 | | | | 0.5 | | |
| Building Products | | | 555,860 | | | | 0.5 | | |
| Office Electronics | | | 476,101 | | | | 0.5 | | |
| Paper & Forest Products | | | 470,072 | | | | 0.5 | | |
| Multiline Retail | | | 451,877 | | | | 0.4 | | |
| Aerospace & Defense | | | 440,593 | | | | 0.4 | | |
| Construction Materials | | | 375,330 | | | | 0.4 | | |
| Marine | | | 344,472 | | | | 0.3 | | |
| Personal Products | | | 282,073 | | | | 0.3 | | |
Information Technology
Services | | | 271,315 | | | | 0.3 | | |
| Air Freight & Logistics | | | 259,353 | | | | 0.3 | | |
Leisure Equipment &
Products | | | 223,845 | | | | 0.2 | | |
| Professional Services | | | 204,257 | | | | 0.2 | | |
Health Care Providers &
Services | | | 178,403 | | | | 0.2 | | |
| Containers & Packaging | | | 156,673 | | | | 0.2 | | |
| Water Utilities | | | 132,934 | | | | 0.1 | | |
| Airlines | | | 105,290 | | | | 0.1 | | |
Independent Power
Producers & Energy
Traders | | | 99,852 | | | | 0.1 | | |
| Gas Utilities | | | 83,433 | | | | 0.1 | | |
| Internet Software & Services | | | 82,823 | | | | 0.1 | | |
Life Sciences Tools &
Services | | | 51,153 | | | | 0.1 | | |
| Transportation Infrastructure | | | 38,890 | | | | 0.0 | | |
Diversified Consumer
Services | | | 37,298 | | | | 0.0 | | |
| Consumer Finance | | | 31,445 | | | | 0.0 | | |
| Internet & Catalog Retail | | | 17,448 | | | | 0.0 | | |
| Biotechnology | | | 15,303 | | | | 0.0 | | |
| Distributors | | | 1,117 | | | | 0.0 | | |
| | | $ | 104,288,816 | ^ | | | 100.0 | % | |
^ Does not include open long futures contracts with an underlying face amount of $8,763,513 with net unrealized appreciation of $452,786 and open foreign currency exchange contracts with net unrealized appreciation of $110,137. Also does not reflect the value of securities held as collateral on loaned securities.
See Notes to Financial Statements
37
Morgan Stanley International Fund
Financial Statements
Statement of Assets and Liabilities
October 31, 2011
| Assets: | |
| Investments in securities, at value (cost $94,530,433) (including $5,090,177 for securities loaned) | | $ | 94,010,558 | | |
| Investments in affiliates, at value (cost $16,155,303) | | | 15,785,184 | | |
| Total investments in securities, at value (cost $110,685,736) | | | 109,795,742 | | |
| Unrealized appreciation on open foreign currency exchange contracts | | | 340,367 | | |
| Cash (including foreign currency valued at $647,574 with a cost of $656,654) | | | 647,574 | | |
| Receivable for: | |
| Variation margin | | | 527,687 | | |
| Dividends | | | 247,882 | | |
| Foreign withholding taxes reclaimed | | | 71,773 | | |
| Dividends from affiliates | | | 6,304 | | |
| Shares of beneficial interest sold | | | 5,209 | | |
| Prepaid expenses and other assets | | | 2,859 | | |
| Total Assets | | | 111,645,397 | | |
| Liabilities: | |
| Collateral on securities loaned, at value | | | 5,506,926 | | |
| Unrealized depreciation on open foreign currency exchange contracts | | | 230,230 | | |
| Payable for: | |
| Shares of beneficial interest redeemed | | | 232,718 | | |
| Investment advisory fee | | | 57,355 | | |
| Transfer agent fee | | | 54,934 | | |
| Distribution fee | | | 34,352 | | |
| Administration fee | | | 7,059 | | |
| Investments purchased | | | 1,570 | | |
| Deferred Capital Gain Country Tax | | | 544 | | |
| Accrued expenses and other payables | | | 119,292 | | |
| Total Liabilities | | | 6,244,980 | | |
| Net Assets | | $ | 105,400,417 | | |
| Composition of Net Assets: | |
| Paid-in-capital | | $ | 123,907,100 | | |
| Net unrealized depreciation (Net of $544 Deferred Capital Gain Country tax) | | | (337,823 | ) | |
| Accumulated undistributed net investment income | | | 402,370 | | |
| Accumulated net realized loss | | | (18,571,230 | ) | |
| Net Assets | | $ | 105,400,417 | | |
| Class A Shares: | |
| Net Assets | | $ | 85,115,809 | | |
| Shares Outstanding (unlimited shares authorized, $.01 par value) | | | 7,606,394 | | |
| Net Asset Value Per Share | | $ | 11.19 | | |
Maximum Offering Price Per Share,
(net asset value plus 5.54% of net asset value) | | $ | 11.81 | | |
| Class B Shares: | |
| Net Assets | | $ | 7,448,072 | | |
| Shares Outstanding (unlimited shares authorized, $.01 par value) | | | 675,873 | | |
| Net Asset Value Per Share | | $ | 11.02 | | |
| Class C Shares: | |
| Net Assets | | $ | 12,049,649 | | |
| Shares Outstanding (unlimited shares authorized, $.01 par value) | | | 1,107,873 | | |
| Net Asset Value Per Share | | $ | 10.88 | | |
| Class I Shares: | |
| Net Assets | | $ | 622,540 | | |
| Shares Outstanding (unlimited shares authorized, $.01 par value) | | | 55,189 | | |
| Net Asset Value Per Share | | $ | 11.28 | | |
| Class R Shares: | |
| Net Assets | | $ | 79,554 | | |
| Shares Outstanding (unlimited shares authorized, $.01 par value) | | | 7,149 | | |
| Net Asset Value Per Share | | $ | 11.13 | | |
| Class W Shares: | |
| Net Assets | | $ | 84,793 | | |
| Shares Outstanding (unlimited shares authorized, $.01 par value) | | | 7,598 | | |
| Net Asset Value Per Share | | $ | 11.16 | | |
See Notes to Financial Statements
38
Morgan Stanley International Fund
Financial Statements continued
Statement of Operations
For the year ended October 31, 2011
Net Investment Income:
Income | |
| Dividends (net of $336,604 foreign withholding tax) | | $ | 3,495,305 | | |
| Income from securities loaned - net | | | 142,145 | | |
| Dividends from affiliates (net of $775 foreign withholding tax) (Note 6) | | | 25,456 | | |
| Interest | | | 2,980 | | |
| Total Income | | | 3,665,886 | | |
| Expenses | |
| Investment advisory fee (Note 4) | | | 832,960 | | |
| Distribution fee (Class A shares) (Note 5) | | | 252,673 | | |
| Distribution fee (Class B shares) (Note 5) | | | 113,409 | | |
| Distribution fee (Class C shares) (Note 5) | | | 147,113 | | |
| Distribution fee (Class R shares) (Note 5) | | | 448 | | |
| Distribution fee (Class W shares) (Note 5) | | | 327 | | |
| Transfer agent fees and expenses | | | 237,799 | | |
| Custodian fees | | | 145,066 | | |
| Professional fees | | | 118,942 | | |
| Administration fee (Note 4) | | | 102,518 | | |
| Registration fees | | | 76,476 | | |
| Shareholder reports and notices | | | 65,512 | | |
| Trustees' fees and expenses | | | 4,420 | | |
| Other | | | 122,347 | | |
| Total Expenses | | | 2,220,010 | | |
| Less: rebate from Morgan Stanley affiliated cash sweep (Note 6) | | | (11,612 | ) | |
| Net Expenses | | | 2,208,398 | | |
| Net Investment Income | | | 1,457,488 | | |
Realized and Unrealized Gain (Loss):
Realized Gain (Loss) on: | |
| Investments | | | 6,393,970 | | |
| Investments in affiliates (Note 6) | | | (30,379 | ) | |
| Futures contracts | | | (1,800,065 | ) | |
| Foreign currency exchange contracts | | | (629,421 | ) | |
| Foreign currency translation | | | (208,922 | ) | |
| Net Realized Gain | | | 3,725,183 | | |
| Change in Unrealized Appreciation/Depreciation on: | |
| Investments (Net of Increase in Deferred Capital Gain Country tax accruals of $544) | | | (14,297,789 | ) | |
| Investments in affiliates (Note 6) | | | 9,993 | | |
| Futures contracts | | | 308,119 | | |
| Foreign currency exchange contracts | | | (65,986 | ) | |
| Foreign currency translation | | | (144,455 | ) | |
| Net Change in Unrealized Appreciation/Depreciation | | | (14,190,118 | ) | |
| Net Loss | | | (10,464,935 | ) | |
| Net Decrease | | $ | (9,007,447 | ) | |
See Notes to Financial Statements
39
Morgan Stanley International Fund
Financial Statements continued
Statements of Changes in Net Assets
| | | FOR THE YEAR
ENDED
OCTOBER 31, 2011 | | FOR THE YEAR
ENDED
OCTOBER 31, 2010^ | |
Increase (Decrease) in Net Assets:
Operations: | |
| Net investment income | | $ | 1,457,488 | | | $ | 1,119,890 | | |
| Net realized gain | | | 3,725,183 | | | | 1,196,136 | | |
| Net change in unrealized appreciation/depreciation | | | (14,190,118 | ) | | | 11,161,791 | | |
| Net Increase (Decrease) | | | (9,007,447 | ) | | | 13,477,817 | | |
| Dividends to Shareholders from Net Investment Income: | |
| Class A shares | | | (1,252,005 | ) | | | (2,237,415 | ) | |
| Class B shares | | | (29,130 | ) | | | (235,383 | ) | |
| Class C shares | | | (73,316 | ) | | | (237,045 | ) | |
| Class I shares | | | (9,843 | ) | | | (15,223 | ) | |
| Class R shares | | | (921 | ) | | | (1,546 | ) | |
| Class W shares | | | (1,057 | ) | | | (1,680 | ) | |
| Total Dividends | | | (1,366,272 | ) | | | (2,728,292 | ) | |
| Net decrease from transactions in shares of beneficial interest | | | (22,590,414 | ) | | | (25,486,498 | ) | |
| Net Decrease | | | (32,964,133 | ) | | | (14,736,973 | ) | |
| Net Assets: | |
| Beginning of period | | | 138,364,550 | | | | 153,101,523 | | |
End of Period
(Including accumulated undistributed net investment income of $402,370
and $1,030,350, respectively) | | $ | 105,400,417 | | | $ | 138,364,550 | | |
^ Beginning with the year ended October 31, 2011, the Fund was audited by Ernst & Young LLP. The previous year was audited by another independent registered public accounting firm.
See Notes to Financial Statements
40
Morgan Stanley International Fund
Notes to Financial Statements n October 31, 2011
1. Organization and Accounting Policies
Morgan Stanley International Fund (the "Fund") is registered under the Investment Company Act of 1940, as amended (the "Act"), as a diversified, open-end management investment company. The Fund's investment objective is long-term capital growth. The Fund was organized as a Massachusetts business trust on October 23, 1998 and commenced operations June 28, 1999. On March 31, 2008, the Fund commenced offering Class R and Class W shares.
The Fund offers Class A shares, Class B shares, Class C shares, Class I shares, Class R shares and Class W shares. The six classes are substantially the same except that most Class A shares are subject to a sales charge imposed at the time of purchase and some Class A shares, and most Class B shares and Class C shares are subject to a contingent deferred sales charge imposed on shares redeemed within eighteen months, six years and one year, respectively. Class I shares, Class R shares, and Class W shares are not subject to a sales charge. Additionally, Class A shares, Class B shares, Class C shares, Class R shares and Class W shares incur distribution expenses.
The Fund will assess a 2% redemption fee, on Class A shares, Class B shares, Class C shares, Class I shares, Class R shares and Class W shares, which is paid directly to the Fund, for shares redeemed or exchanged within thirty days of purchase, subject to certain exceptions. The redemption fee is designed to protect the Fund and its remaining shareholders from the effects of short-term trading. These fees, if any, are included on the Statements of Changes in Net Assets.
The following is a summary of significant accounting policies:
A. Valuation of Investments — (1) For equity securities traded on foreign exchanges, the last reported sale price or the latest bid price may be used if there were no sales on a particular day; (2) an equity security listed or traded on the New York Stock Exchange ("NYSE") or American Stock Exchange or other domestic exchange is valued at its latest sale price prior to the time when assets are valued; if there were no sales that day, the security is valued at the mean between the last reported bid and ask price; (3) an equity security listed or traded on the Nasdaq is valued at the Nasdaq Official Closing Price; if there were no sales that day, the security is valued at the mean between the last reported bid and ask price; (4) all other domestic securities for which over-the-counter market quotations are readily available are valued at the mean between the last reported bid and ask price. In cases where a security is traded on more than one domestic exchange, the security is valued on the exchange designated as the primary market; (5) futures are valued at the latest price published by the commodities exchange on which they trade; (6) when market quotations are not readily available, including circumstances under which Morgan Stanley Investment Management Inc. (the "Adviser"), a wholly owned subsidiary of Morgan Stanley, determines that the latest sale price, the bid price or the mean between the last reported bid and ask price do not reflect a security's fair value, portfolio securities are valued at their fair value as determined in good faith under procedures established by and under the general supervision of the
41
Morgan Stanley International Fund
Notes to Financial Statements n October 31, 2011 continued
Fund's Trustees. Occasionally, developments affecting the closing prices of securities and other assets may occur between the times at which valuations of such securities are determined (that is, close of the foreign market on which the securities trade) and the close of business on the NYSE. If developments occur during such periods that are expected to materially affect the value of such securities, such valuations may be adjusted to reflect the estimated fair value of such securities as of the close of the NYSE, as determined in good faith by the Fund's Trustees or by the Adviser using a pricing service and/or procedures approved by the Trustees of the Fund; (7) certain securities may be valued by an outside pricing service approved by the Fund's Trustees; (8) investments in mutual funds, including the Morgan Stanley Institutional Liquidity Funds, are valued at the net asset value as of the close of each business day; and (9) short-term debt securities having a maturity date of more than sixty days at time of purchase are valued on a mark-to-market basis until sixty days prior to maturity and thereafter at amortized cost based on their value on the 61st day. Short-term debt securities having a maturity date of sixty days or less at the time of purchase are valued at amortized cost, which approximates fair value.
B. Accounting for Investments — Security transactions are accounted for on the trade date (date the order to buy or sell is executed). Realized gains and losses on security transactions are determined by the identified cost method. Dividend income and other distributions are recorded on the ex-dividend date except for certain dividends on foreign securities which are recorded as soon as the Fund is informed after the ex-dividend date. Discounts are accreted and premiums are amortized over the life of the respective securities and are included in interest income. Interest income is accrued daily as earned.
C. Multiple Class Allocations — Investment income, expenses (other than distribution fees), and realized and unrealized gains and losses are allocated to each class of shares based upon the relative net asset value on the date such items are recognized. Distribution fees are charged directly to the respective class.
D. Foreign Currency Translation — The books and records of the Fund are maintained in U.S. dollars as follows: (1) the foreign currency market value of investment securities, other assets and liabilities and foreign currency exchange contracts are translated at the exchange rates prevailing at the end of the period; and (2) purchases, sales, income and expenses are translated at the exchange rates prevailing on the respective dates of such transactions. The resultant exchange gains and losses are recorded as realized and unrealized gains/losses on foreign currency exchange contracts and foreign currency translations. Pursuant to U.S. federal income tax regulations, certain foreign exchange gains/losses included in realized and unrealized gains/losses are included in or are a reduction of ordinary income for federal income tax purposes. The Fund does not isolate that portion of the results
42
Morgan Stanley International Fund
Notes to Financial Statements n October 31, 2011 continued
of operations arising as a result of changes in the foreign exchange rates from the changes in the market prices of the securities held.
E. Federal Income Tax Policy — It is the Fund's policy to comply with the requirements of Subchapter M of the Internal Revenue Code applicable to regulated investment companies and to distribute substantially all of its taxable income to its shareholders. Therefore, no federal income tax provision is required. The Fund files tax returns with the U.S. Internal Revenue Service, New York State and New York City. The Fund recognizes the tax effects of a tax position taken or expected to be taken in a tax return only if it is more likely than not to be sustained based solely on its technical merits as of the reporting date. The more-likely-than-not threshold must continue to be met in each reporting period to support continued recognition of the benefit. The difference between the tax benefit recognized in the financial statements for a tax position taken and the tax benefit claimed in the income tax return is referred to as an unrecognized tax benefit. There are no unrecognized tax benefits in the accompanying financial statements. If applicable, the Fund recognizes interest accrued related to unrecognized tax benefits in interest expense and penalties in "other expenses" in the Statement of Operations. Each of the tax years in the four-year period ended October 31, 2011 remains subject to examination by taxing authorities.
F. Securities Lending — The Fund may lend securities to qualified financial institutions, such as broker-dealers, to earn additional income. Any increase or decrease in the fair value of the securities loaned that might occur and any interest earned or dividends declared on those securities during the term of the loan would remain in the Fund. The Fund receives cash or securities as collateral in an amount equal to or exceeding 100% of the current fair value of the loaned securities. The collateral is marked-to-market daily, by the securities lending agent, to ensure that a minimum of 100% collateral coverage is maintained.
Based on pre-established guidelines, the securities lending agent invests any cash collateral that is received in high-quality short-term investments. Securities lending income is generated from the earnings on the invested collateral and borrowing fees, less any rebates owed to the borrowers and compensation to the lending agent.
The value of loaned securities and related collateral outstanding at October 31, 2011 were $5,090,177 and $5,533,055, respectively. The Fund received cash collateral of which $5,506,926 was subsequently invested in Repurchase Agreements and Morgan Stanley Institutional Liquidity Funds as reported in the Portfolio of Investments. The remaining collateral of $26,130 was received in the form of U.S. Government Obligations, which the Fund cannot sell or re-pledge and accordingly are not reflected in the Portfolio of Investments. The Fund has the right under the lending agreement to recover the securities from the borrower on demand.
43
Morgan Stanley International Fund
Notes to Financial Statements n October 31, 2011 continued
G. Dividends and Distributions to Shareholders — Dividends and distributions to shareholders are recorded on the ex-dividend date.
H. Use of Estimates — The preparation of financial statements in accordance with generally accepted accounting principles in the United States ("GAAP") requires management to make estimates and assumptions that affect the reported amounts and disclosures. Actual results could differ from those estimates.
I. Indemnifications — The Fund enters into contracts that contain a variety of indemnifications. The Fund's maximum exposure under these arrangements is unknown. However, the Fund has not had prior claims or losses pursuant to these contracts and expects the risk of loss to be remote.
2. Fair Valuation Measurements
Financial Accounting Standards Board ("FASB") Accounting Standards Codification ("ASC") 820, Fair Value Measurements and Disclosures ("ASC 820"), defines fair value as the value that the Fund would receive to sell an investment or pay to transfer a liability in a timely transaction with an independent buyer in the principal market, or in the absence of a principal market the most advantageous market for the investment or liability. ASC 820 establishes a three-tier hierarchy to distinguish between (1) inputs that reflect the assumptions market participants would use in valuing an asset or liability developed based on market data obtained from sources independent of the reporting entity (observable inputs); and (2) inputs that reflect the reporting entity's own assumptions about the assumptions market participants would use in valuing an asset or liability developed based on the best information available in the circumstances (unobservable inputs) and to establish classification of fair value measurements for disclosure purposes. Various inputs are used in determining the value of the Fund's investments. The inputs are summarized in the three broad levels listed below.
• Level 1 — unadjusted quoted prices in active markets for identical investments
• Level 2 — other significant observable inputs (including quoted prices for similar investments, interest rates, prepayment speeds, credit risk, etc.)
• Level 3 — significant unobservable inputs including the Fund's own assumptions in determining the fair value of investments. Factors considered in making this determination may include, but are not limited to, information obtained by contacting the issuer, analysts, or the appropriate stock exchange (for exchange-traded securities), analysis of the issuer's financial statements or other available documents and, if necessary, available information concerning other securities in similar circumstances
44
Morgan Stanley International Fund
Notes to Financial Statements n October 31, 2011 continued
The inputs or methodology used for valuing securities are not necessarily an indication of the risk associated with investing in those securities and the determination of the significance of a particular input to the fair value measurement in its entirety requires judgment and considers factors specific to each security.
The following is a summary of the inputs used as of October 31, 2011 in valuing the Fund's investments carried at fair value:
| | | | | FAIR VALUE MEASUREMENTS AT OCTOBER 31, 2011 USING | |
| INVESTMENT TYPE | | TOTAL | | UNADJUSTED
QUOTED PRICES IN
ACTIVE MARKETS FOR
IDENTICAL
INVESTMENTS
(LEVEL 1) | | OTHER
SIGNIFICANT
OBSERVABLE
INPUTS
(LEVEL 2) | | SIGNIFICANT
UNOBSERVABLE
INPUTS
(LEVEL 3) | |
| Assets: | |
| Common Stocks | |
| Aerospace & Defense | | $ | 440,593 | | | $ | 1,570 | | | $ | 439,023 | | | | — | | |
| Air Freight & Logistics | | | 259,353 | | | | — | | | | 259,353 | | | | — | | |
| Airlines | | | 105,290 | | | | — | | | | 105,290 | | | | — | | |
| Auto Components | | | 1,255,696 | | | | — | | | | 1,255,696 | | | | — | | |
| Automobiles | | | 3,512,950 | | | | — | | | | 3,512,950 | | | | — | | |
| Beverages | | | 2,141,595 | | | | 74,215 | | | | 2,067,380 | | | | — | | |
| Biotechnology | | | 15,303 | | | | — | | | | 15,303 | | | | — | | |
| Building Products | | | 555,860 | | | | — | | | | 555,860 | | | | — | | |
| Capital Markets | | | 1,043,849 | | | | — | | | | 1,043,849 | | | | — | | |
| Chemicals | | | 3,993,510 | | | | 11,378 | | | | 3,982,132 | | | | — | | |
| Commercial Banks | | | 6,922,273 | | | | 75,725 | | | | 6,846,548 | | | | — | | |
| Commercial Services & Supplies | | | 685,768 | | | | — | | | | 685,768 | | | | — | | |
| Communications Equipment | | | 976,108 | | | | — | | | | 976,108 | | | | — | | |
| Computers & Peripherals | | | 621,196 | | | | — | | | | 621,196 | | | | — | | |
| Construction & Engineering | | | 992,441 | | | | — | | | | 992,441 | | | | — | | |
| Construction Materials | | | 375,330 | | | | 16,317 | | | | 359,013 | | | | — | | |
| Consumer Finance | | | 31,445 | | | | — | | | | 31,445 | | | | — | | |
| Containers & Packaging | | | 156,673 | | | | — | | | | 156,673 | | | | — | | |
| Distributors | | | 1,117 | | | | — | | | | 1,117 | | | | — | | |
| Diversified Consumer Services | | | 37,298 | | | | — | | | | 37,298 | | | | — | | |
| Diversified Financial Services | | | 721,946 | | | | — | | | | 721,946 | | | | — | | |
| Diversified Telecommunication Services | | | 3,263,657 | | | | 19,876 | | | | 3,243,781 | | | | — | | |
| Electric Utilities | | | 1,215,385 | | | | — | | | | 1,215,385 | | | | — | | |
| Electrical Equipment | | | 1,660,457 | | | | — | | | | 1,660,457 | | | | — | | |
| Electronic Equipment, Instruments & Components | | | 1,803,210 | | | | — | | | | 1,803,210 | | | | — | | |
| Energy Equipment & Services | | | 934,551 | | | | — | | | | 934,551 | | | | — | | |
| Food & Staples Retailing | | | 1,741,350 | | | | 71,242 | | | | 1,670,108 | | | | — | | |
| Food Products | | | 4,810,798 | | | | 107,317 | | | | 4,703,481 | | | | — | | |
45
Morgan Stanley International Fund
Notes to Financial Statements n October 31, 2011 continued
| | | | | FAIR VALUE MEASUREMENTS AT OCTOBER 31, 2011 USING | |
| INVESTMENT TYPE | | TOTAL | | UNADJUSTED
QUOTED PRICES IN
ACTIVE MARKETS FOR
IDENTICAL
INVESTMENTS
(LEVEL 1) | | OTHER
SIGNIFICANT
OBSERVABLE
INPUTS
(LEVEL 2) | | SIGNIFICANT
UNOBSERVABLE
INPUTS
(LEVEL 3) | |
| Assets: | |
| Common Stocks | |
| Gas Utilities | | $ | 83,433 | | | | — | | | $ | 83,433 | | | | — | | |
| Health Care Equipment & Supplies | | | 864,516 | | | | — | | | | 864,516 | | | | — | | |
| Health Care Providers & Services | | | 178,403 | | | | — | | | | 178,403 | | | | — | | |
| Hotels, Restaurants & Leisure | | | 833,981 | | | | — | | | | 833,981 | | | | — | | |
| Household Durables | | | 951,985 | | | | — | | | | 951,985 | | | | — | | |
| Household Products | | | 560,388 | | | $ | 13,660 | | | | 546,728 | | | | — | | |
| Independent Power Producers & Energy Traders | | | 99,852 | | | | — | | | | 99,852 | | | | — | | |
| Industrial Conglomerates | | | 2,197,826 | | | | 13,854 | | | | 2,183,972 | | | | — | | |
| Information Technology Services | | | 271,315 | | | | — | | | | 271,315 | | | | — | | |
| Insurance | | | 2,438,219 | | | | — | | | | 2,438,219 | | | | — | | |
| Internet & Catalog Retail | | | 17,448 | | | | — | | | | 17,448 | | | | — | | |
| Internet Software & Services | | | 82,823 | | | | — | | | | 82,823 | | | | — | | |
| Leisure Equipment & Products | | | 223,845 | | | | — | | | | 223,845 | | | | — | | |
| Life Sciences Tools & Services | | | 51,153 | | | | — | | | | 51,153 | | | | — | | |
| Machinery | | | 3,165,427 | | | | 56,667 | | | | 3,108,760 | | | | — | | |
| Marine | | | 344,472 | | | | — | | | | 344,472 | | | | — | | |
| Media | | | 1,661,432 | | | | 43,626 | | | | 1,617,806 | | | | — | | |
| Metals & Mining | | | 7,834,659 | | | | 1,465,521 | | | | 6,369,138 | | | | — | | |
| Multi-Utilities | | | 883,150 | | | | — | | | | 883,150 | | | | — | | |
| Multiline Retail | | | 451,877 | | | | — | | | | 451,877 | | | | — | | |
| Office Electronics | | | 476,101 | | | | — | | | | 476,101 | | | | — | | |
| Oil, Gas & Consumable Fuels | | | 6,945,704 | | | | 34,600 | | | | 6,911,104 | | | | — | | |
| Paper & Forest Products | | | 470,072 | | | | — | | | | 470,072 | | | | — | | |
| Personal Products | | | 282,073 | | | | — | | | | 282,073 | | | | — | | |
| Pharmaceuticals | | | 7,608,088 | | | | — | | | | 7,608,088 | | | | — | | |
| Professional Services | | | 204,257 | | | | — | | | | 204,257 | | | | — | | |
| Real Estate Investment Trusts (REITs) | | | 948,715 | | | | — | | | | 948,715 | | | | — | | |
| Real Estate Management & Development | | | 1,229,165 | | | | — | | | | 1,229,165 | | | | — | | |
| Road & Rail | | | 760,550 | | | | 15,936 | | | | 744,614 | | | | — | | |
| Semiconductors & Semiconductor Equipment | | | 1,309,196 | | | | — | | | | 1,309,196 | | | | — | | |
| Software | | | 1,159,857 | | | | — | | | | 1,159,857 | | | | — | | |
| Specialty Retail | | | 982,801 | | | | 22,733 | | | | 960,068 | | | | — | | |
| Textiles, Apparel & Luxury Goods | | | 1,726,204 | | | | — | | | | 1,726,204 | | | | — | | |
| Tobacco | | | 1,597,710 | | | | — | | | | 1,597,710 | | | | — | | |
| Trading Companies & Distributors | | | 1,085,712 | | | | — | | | | 1,085,712 | | | | — | | |
| Transportation Infrastructure | | | 38,890 | | | | — | | | | 38,890 | | | | — | | |
| Water Utilities | | | 132,934 | | | | — | | | | 132,934 | | | | — | | |
46
Morgan Stanley International Fund
Notes to Financial Statements n October 31, 2011 continued
| | | | | FAIR VALUE MEASUREMENTS AT OCTOBER 31, 2011 USING | |
| INVESTMENT TYPE | | TOTAL | | UNADJUSTED
QUOTED PRICES IN
ACTIVE MARKETS FOR
IDENTICAL
INVESTMENTS
(LEVEL 1) | | OTHER
SIGNIFICANT
OBSERVABLE
INPUTS
(LEVEL 2) | | SIGNIFICANT
UNOBSERVABLE
INPUTS
(LEVEL 3) | |
| Assets: | |
| Common Stocks | |
| Wireless Telecommunication Services | | $ | 2,744,219 | | | $ | 211,578 | | | $ | 2,532,641 | | | | — | | |
| Total Common Stocks | | | 93,173,454 | | | | 2,255,815 | | | | 90,917,639 | | | | — | | |
| Rights | | | 144 | | | | — | | | | 144 | | | | — | | |
| Short-Term Investments | |
| Repurchase Agreements | | | 1,154,326 | | | | — | | | | 1,154,326 | | | | — | | |
| Investment Company | | | 15,467,818 | | | | 15,467,818 | | | | — | | | | — | | |
| Total Short-Term Investments | | | 16,622,144 | | | | 15,467,818 | | | | 1,154,326 | | | | — | | |
| Foreign Currency Exchange Contracts | | | 340,367 | | | | — | | | | 340,367 | | | | — | | |
| Futures | | | 507,827 | | | | 507,827 | | | | — | | | | — | | |
| Total Assets | | | 110,643,936 | | | | 18,231,460 | | | | 92,412,476 | | | | — | | |
| Liabilities: | |
| Foreign Currency Exchange Contracts | | | (230,230 | ) | | | — | | | | (230,230 | ) | | | — | | |
| Futures | | | (55,041 | ) | | | (55,041 | ) | | | — | | | | — | | |
| Total Liabilities | | | (285,271 | ) | | | (55,041 | ) | | | (230,230 | ) | | | — | | |
| Total | | $ | 110,358,665 | | | $ | 18,176,419 | | | $ | 92,182,246 | | | | — | | |
Transfers between investment levels may occur as the markets fluctuate and/or the availability of data used in an investment's valuation changes. The Fund recognizes transfers between the levels as of the end of the period. As of October 31, 2011, securities with a total value of $87,355,184 transferred from Level 1 to Level 2. At October 31, 2011, the fair market value of certain securities were adjusted due to developments which occurred between the time of the close of the foreign markets on which they trade and the close of business on the NYSE which resulted in their Level 2 classification.
3. Derivatives
The Fund uses derivative instruments for a variety of purposes, including hedging, risk management, portfolio management or to earn income. Derivatives are financial instruments whose value is based on the value of another underlying asset, interest rate, index or financial instrument. A derivative instrument often has risks similar to its underlying instrument and may have additional risks, including imperfect correlation between the value of the derivative and the underlying instrument, risks of default by the other party to certain transactions, magnification of losses incurred due to changes in the market value
47
Morgan Stanley International Fund
Notes to Financial Statements n October 31, 2011 continued
of the securities, instruments, indices or interest rates to which they relate, and risks that the transactions may not be liquid. The use of derivatives involves risks that are different from, and possibly greater than, the risks associated with other portfolio investments. Derivatives may involve the use of highly specialized instruments that require investment techniques and risk analyses different from those associated with other portfolio investments. All of the Fund's holdings, including derivative instruments, are marked-to-market each day with the change in value reflected in unrealized appreciation (depreciation). Upon disposition, a realized gain or loss is recognized.
Certain derivative transactions may give rise to a form of leverage. Leverage associated with derivative transactions may cause the Fund to liquidate portfolio positions when it may not be advantageous to do so to satisfy its obligations or to meet earmarking or segregation requirements, pursuant to applicable Securities and Exchange Commission rules and regulations, or may cause the Fund to be more volatile than if the Fund had not been leveraged. Although the Adviser seeks to use derivatives to further the Fund's investment objectives, there is no assurance that the use of derivatives will achieve this result.
Following is a description of the derivative instruments and techniques that the Fund used during the period and their associated risks:
Foreign Currency Exchange Contracts In connection with its investments in foreign securities, the Fund entered into contracts with banks, brokers or dealers to purchase or sell foreign currencies at a future date. A foreign currency exchange contract ("currency contracts") is a negotiated agreement between the contracting parties to exchange a specified amount of currency at a specified future time at a specified rate. The rate can be higher or lower than the spot rate between the currencies that are the subject of the currency contract. Currency contracts are used to protect against uncertainty in the level of future foreign currency exchange rates or to gain or modify exposure to a particular currency. In addition, the Fund may use cross currency hedging or proxy hedging with respect to currencies in which the Fund has or expects to have portfolio or currency exposure. Cross currency hedges involve the sale of one currency against the positive exposure to a different currency and may be used for hedging purposes or to establish an active exposure to the exchange rate between any two currencies. Hedging the Fund's currency risks involves the risk of mismatching the Fund's objectives under a currency contract with the value of securities denominated in a particular currency. Furthermore, such transactions reduce or preclude the opportunity for gain if the value of the currency should move in the direction opposite to the position taken. There is an additional risk to the effect that currency contracts create exposure to currencies in which the Fund's securities are not denominated. Unanticipated changes in currency prices may result in poorer overall performance for the Fund than if it had not entered into such contracts. A currency contract is marked-to-market daily and the change in market value is recorded by the Fund as unrealized gain or (loss). The Fund records realized gains (losses)
48
Morgan Stanley International Fund
Notes to Financial Statements n October 31, 2011 continued
when the currency contract is closed equal to the difference between the value of the currency contract at the time it was opened and the value at the time it was closed.
Futures A futures contract is a standardized agreement between two parties to buy or sell a specific quantity of an underlying instrument at a specific price at a specific future time. The value of a futures contract tends to increase and decrease in tandem with the value of the underlying instrument. Futures contracts are bilateral agreements, with both the purchaser and the seller equally obligated to complete the transaction. Depending on the terms of the particular contract, futures contracts are settled through either physical delivery of the underlying instrument on the settlement date or by payment of a cash settlement amount on the settlement date. During the period the futures contract is open, payments are received from or made to the broker based upon changes in the value of the contract (the variation margin). A decision as to whether, when and how to use futures involves the exercise of skill and judgment and even a well-conceived futures transaction may be unsuccessful because of market behavior or unexpected events. In addition to the derivatives risks discussed above, the prices of futures can be highly volatile, using futures can lower total return, and the potential loss from futures can exceed the Fund's initial investment in such contracts.
FASB ASC 815, Derivatives and Hedging: Overall ("ASC 815"), is intended to improve financial reporting about derivative instruments by requiring enhanced disclosures to enable investors to better understand how and why the Fund uses derivative instruments, how these derivative instruments are accounted for and their effects on the Fund's financial position and results of operations.
The following table sets forth the fair value of the Fund's derivative contracts by primary risk exposure as of October 31, 2011.
| PRIMARY RISK EXPOSURE | | ASSET DERIVATIVES
STATEMENT OF ASSETS
AND LIABILITIES LOCATION | | FAIR VALUE | | LIABILITY DERIVATIVES
STATEMENT OF ASSETS
AND LIABILITIES LOCATION | | FAIR VALUE | |
| Equity Risk | | Variation margin | | $ | 507,827 | † | | Variation margin | | $ | (55,041 | )† | |
| Foreign Currency Risk | | Unrealized appreciation on
open foreign currency
exchange contracts | | | 340,367 | | | Unrealized depreciation on
open foreign currency
exchange contracts | | | (230,230 | ) | |
| | | | | $ | 848,194 | | | | | $ | (285,271 | ) | |
† Includes cumulative appreciation/depreciation of futures contracts as reported in the Portfolio of Investments. Only current day's variation margin is reported within the Statement of Assets and Liabilities.
The following tables set forth by primary risk exposure the Fund's realized gains (losses) and change in unrealized appreciation (depreciation) by type of derivative contract for the year ended October 31, 2011 in accordance with ASC 815.
49
Morgan Stanley International Fund
Notes to Financial Statements n October 31, 2011 continued
AMOUNT OF REALIZED LOSS ON DERIVATIVE CONTRACTS
| PRIMARY RISK EXPOSURE | | FUTURES | | FOREIGN
CURRENCY
EXCHANGE | |
| Equity Risk | | $ | (1,800,065 | ) | | | — | | |
| Foreign Currency Risk | | | — | | | $ | (629,421 | ) | |
| Total | | $ | (1,800,065 | ) | | $ | (629,421 | ) | |
CHANGE IN UNREALIZED APPRECIATION (DEPRECIATION) ON DERIVATIVE CONTRACTS
| PRIMARY RISK EXPOSURE | | FUTURES | | FOREIGN
CURRENCY
EXCHANGE | |
| Equity Risk | | $ | 308,119 | | | | — | | |
| Foreign Currency Risk | | | — | | | $ | (65,986 | ) | |
| Total | | $ | 308,119 | | | $ | (65,986 | ) | |
For the year ended October 31, 2011, the average monthly original value of futures contracts was $9,929,012 and the average monthly principal amount of foreign currency exchange contracts was $32,092,198.
4. Investment Advisory/Administration Agreements
Pursuant to an Investment Advisory Agreement, the Fund pays the Adviser an advisory fee, accrued daily and payable monthly, by applying the following annual rates to the net assets of the Fund determined at the close of each business day: 0.65% to the portion of the daily net assets not exceeding $1 billion and 0.60% to the portion of the daily net assets exceeding $1 billion.
Pursuant to an Administration Agreement with Morgan Stanley Services Company Inc. (the "Administrator"), an affiliate of the Adviser, the Fund pays an administration fee, accrued daily and payable monthly, by applying the annual rate of 0.08% to the Fund's daily net assets.
Under a Sub-Administration Agreement between the Administrator and State Street Bank and Trust Company ("State Street"), State Street provides certain administrative services to the Fund. For such services, the Administrator pays State Street a portion of the fee the Administrator receives from the Fund.
5. Plan of Distribution
Shares of the Fund are distributed by Morgan Stanley Distribution, Inc. (the "Distributor"), an affiliate of the Adviser and Administrator. The Fund has adopted a Plan of Distribution (the "Plan") pursuant to Rule 12b-1 under the Act. The Plan provides that the Fund will pay the Distributor a fee which is accrued
50
Morgan Stanley International Fund
Notes to Financial Statements n October 31, 2011 continued
daily and paid monthly at the following annual rates: (i) Class A — up to 0.25% of the average daily net assets of Class A shares; (ii) Class B — up to 1.00% of the average daily net assets of Class B shares; and (iii) Class C — up to 1.00% of the average daily net assets of Class C shares; (iv) Class R — up to 0.50% of the average daily net assets of Class R shares; and (v) Class W — up to 0.35% of the average daily net assets of Class W shares.
In the case of Class B shares, provided that the Plan continues in effect, any cumulative expenses incurred by the Distributor but not yet recovered may be recovered through the payment of future distribution fees from the Fund pursuant to the Plan and contingent deferred sales charges paid by investors upon redemption of Class B shares. Although there is no legal obligation for the Fund to pay expenses incurred in excess of payments made to the Distributor under the Plan and the proceeds of contingent deferred sales charges paid by investors upon redemption of shares, if for any reason the Plan is terminated, the Trustees will consider at that time the manner in which to treat such expenses. The Distributor has advised the Fund that such excess amounts totaled $18,065,763 at October 31, 2011.
In the case of Class A, Class C, Class R and Class W shares, expenses incurred pursuant to the Plan in any calendar year in excess of 0.25%, 1.00%, 0.50% or 0.35% of the average daily net assets of Class A, Class C, Class R or Class W shares, respectively, will not be reimbursed by the Fund through payments in any subsequent year, except that expenses representing a gross sales credit to Morgan Stanley Smith Barney Financial Advisors and other authorized financial representatives at the time of sale may be reimbursed in the subsequent calendar year. For the year ended October 31, 2011, the distribution fee was accrued for Class A, Class C, Class R and Class W shares at the annual rate of 0.25%, 0.99%, 0.50% and 0.35%, respectively.
The Distributor has informed the Fund that for the year ended October 31, 2011, it received contingent deferred sales charges from certain redemptions of the Fund's Class B shares and Class C shares of $9,000 and $203, respectively, and received $8,005 in front-end sales charges from sales of the Fund's Class A shares. The respective shareholders pay such charges, which are not an expense of the Fund.
6. Security Transactions and Transactions with Affiliates
The cost of purchases and proceeds from sales of investment securities, excluding short-term investments, for the year ended October 31, 2011 aggregated $37,589,391 and $56,332,223, respectively.
The Fund invests in the Institutional Class of the Morgan Stanley Institutional Liquidity Funds – Money Market Portfolio (the "Liquidity Funds"), an open-end management investment company managed by the
51
Morgan Stanley International Fund
Notes to Financial Statements n October 31, 2011 continued
Adviser, both directly, and as a portion of the securities held as collateral on loaned securities. Investment advisory fees paid by the Fund are reduced by an amount equal to its pro-rata share of the advisory and administration fees paid by the Fund due to its investment in the Liquidity Funds. For the year ended October 31, 2011, advisory fees paid were reduced by $11,612 relating to the Fund's investment in the Liquidity Funds.
A summary of the Fund's transactions in shares of the Liquidity Funds during the year ended October 31, 2011 is as follows:
VALUE
OCTOBER 31,
2010 | | PURCHASES
AT COST | | SALES | | DIVIDEND
INCOME | | VALUE
OCTOBER 31,
2011 | |
| $ | 15,953,008 | | | $ | 57,244,489 | | | $ | 57,729,679 | | | $ | 15,156 | | | $ | 15,467,818 | | |
For the year ended October 31, 2011, the Fund had transactions with Mitsubishi UFJ Financial Group, Inc., an affiliate of the Adviser, Administrator and Distributor:
VALUE
OCTOBER 31,
2010 | | PURCHASES
AT COST | | SALES | | NET REALIZED
LOSS | | DIVIDEND
INCOME | | VALUE
OCTOBER 31,
2011 | |
| $ | 366,099 | | | | — | | | $ | 28,346 | | | $ | (30,379 | ) | | $ | 10,300 | | | $ | 317,366 | | |
Morgan Stanley Services Company Inc., an affiliate of the Adviser and Distributor, is the Fund's transfer agent.
The Fund has an unfunded Deferred Compensation Plan (the "Compensation Plan"), which allows each independent Trustee to defer payment of all, or a portion, of the fees he or she receives for serving on the Board of Trustees. Each eligible Trustee generally may elect to have the deferred amounts credited with a return equal to the total return on one or more of the Morgan Stanley funds that are offered as investment options under the Compensation Plan. Appreciation/depreciation and distributions received from these investments are recorded with an offsetting increase/decrease in the deferred compensation obligation and do not affect the net asset value of the Fund.
7. Federal Income Tax Status
The amount of dividends and distributions from net investment income and net realized capital gains are determined in accordance with federal income tax regulations which may differ from GAAP. These "book/tax" differences are either considered temporary or permanent in nature. To the extent these differences are permanent in nature, such amounts are reclassified within the capital accounts based on their federal tax-basis treatment; temporary differences do not require reclassification. Dividends and
52
Morgan Stanley International Fund
Notes to Financial Statements n October 31, 2011 continued
distributions which exceed net investment income and net realized capital gains for tax purposes are reported as distributions of paid-in-capital.
The Fund may be subject to taxes imposed by countries in which it invests. Such taxes are generally based on income and/or capital gains earned or repatriated. Taxes are accrued based on net investment income, net realized gains and net unrealized appreciation as such income and/or gains are earned. Taxes may also be based on transactions in foreign currency and are accrued based on the value of investments denominated in such currency.
The tax character of distributions paid was as follows:
| | | FOR THE YEAR
ENDED
OCTOBER 31, 2011 | | FOR THE YEAR
ENDED
OCTOBER 31, 2010 | |
| Ordinary income | | $ | 1,366,272 | | | $ | 2,728,292 | | |
As of October 31, 2011, the tax-basis components of accumulated losses were as follows:
| Undistributed ordinary income | | $ | 602,089 | | | | | | |
| Undistributed long-term gains | | | — | | | | | | |
| Net accumulated earnings | | | 602,089 | | | | | | |
| Capital loss carryforward | | | (15,579,002 | ) | | | | | |
| Temporary differences | | | (18,779 | ) | | | | | |
| Net unrealized depreciation | | | (3,510,991 | ) | | | | | |
| Total accumulated losses | | $ | (18,506,683 | ) | | | | | |
As of October 31, 2011, $7,150,186 of the Fund's net capital loss carryforward expired. During the year ended October 31, 2011, the Fund utilized $3,584,030 of its net capital loss carryforward. As of October 31, 2011, the Fund had a net capital loss carryforward of $15,579,002, to offset future capital gains to the extent provided by regulations, which will expire according to the following schedule.
| AMOUNT | | EXPIRATION | |
| $ | 14,780,909 | | | October 31, 2017 | |
| | 798,093 | | | October 31, 2018 | |
As of October 31, 2011, the Fund had temporary book/tax differences primarily attributable to the mark-to-market of open forward foreign currency exchange contracts and passive foreign investment companies ("PFICs"), capital loss deferrals on wash sales and nondeductible expenses.
53
Morgan Stanley International Fund
Notes to Financial Statements n October 31, 2011 continued
Permanent differences, primarily due to foreign currency losses, tax adjustments on PFICs sold by the Fund and an expired capital loss carryforward, resulted in the following reclassifications among the Fund's components of net assets at October 31, 2011:
ACCUMULATED
UNDISTRIBUTED
NET INVESTMENT
INCOME | | ACCUMULATED
NET REALIZED
LOSS | | PAID-IN-CAPITAL | |
| $ | (719,196 | ) | | $ | 7,892,953 | | | $ | (7,173,757 | ) | |
8. Expense Offset
The Fund has entered into an arrangement with State Street (the "Custodian"), whereby credits realized on uninvested cash balances were used to offset a portion of the Fund's expenses. If applicable, these custodian credits are shown as "expense offset" in the Statement of Operations.
9. Purposes of and Risks Relating to Certain Financial Instruments
The Fund may lend securities to qualified financial institutions, such as broker-dealers, to earn additional income. Risks in securities lending transactions are that a borrower may not provide additional collateral when required or return the securities when due, and that the value of the short-term investments will be less than the amount of cash collateral plus any rebate that is required to be returned to the borrower.
At October 31, 2011, investments in securities of issuers in Japan and United Kingdom represented 22.2% and 19.9%, respectively, of the Fund's net assets. These investments, as well as other non-U.S. investments, which involve risks and considerations not present with respect to U.S. securities, may be affected by economic or political developments in these countries.
At October 31, 2011, the Fund's cash balance consisted of interest bearing deposits with State Street, the Fund's Custodian.
54
Morgan Stanley International Fund
Notes to Financial Statements n October 31, 2011 continued
10. Shares of Beneficial Interest
Transactions in shares of beneficial interest were as follows:
| | | FOR THE YEAR
ENDED
OCTOBER 31, 2011 | | FOR THE YEAR
ENDED
OCTOBER 31, 2010^ | |
| | | SHARES | | AMOUNT | | SHARES | | AMOUNT | |
| CLASS A SHARES | |
| Sold | | | 239,164 | | | $ | 2,966,253 | | | | 731,038 | | | $ | 8,335,895 | | |
| Conversion from Class B | | | 229,694 | | | | 2,845,003 | | | | 38,527 | | | | 437,041 | | |
| Reinvestment of dividends | | | 97,533 | | | | 1,212,331 | | | | 187,478 | | | | 2,170,992 | | |
| Redeemed | | | (1,674,626 | ) | | | (20,588,427 | ) | | | (2,268,165 | ) | | | (25,602,200 | ) | |
| Net decrease — Class A | | | (1,108,235 | ) | | | (13,564,840 | ) | | | (1,311,122 | ) | | | (14,658,272 | ) | |
| CLASS B SHARES | |
| Sold | | | 14,781 | | | | 181,764 | | | | 69,514 | | | | 814,590 | | |
| Conversion to Class A | | | (232,571 | ) | | | (2,845,003 | ) | | | (39,094 | ) | | | (437,041 | ) | |
| Reinvestment of dividends | | | 2,214 | | | | 27,271 | | | | 19,413 | | | | 222,279 | | |
| Redeemed | | | (281,682 | ) | | | (3,434,191 | ) | | | (788,979 | ) | | | (8,767,126 | ) | |
| Net decrease — Class B | | | (497,258 | ) | | | (6,070,159 | ) | | | (739,146 | ) | | | (8,167,298 | ) | |
| CLASS C SHARES | |
| Sold | | | 14,747 | | | | 175,873 | | | | 37,753 | | | | 439,900 | | |
| Reinvestment of dividends | | | 5,832 | | | | 70,914 | | | | 20,327 | | | | 230,305 | | |
| Redeemed | | | (264,764 | ) | | | (3,201,181 | ) | | | (295,225 | ) | | | (3,230,418 | ) | |
| Net decrease — Class C | | | (244,185 | ) | | | (2,954,394 | ) | | | (237,145 | ) | | | (2,560,213 | ) | |
| CLASS I SHARES | |
| Sold | | | 1,843 | | | | 24,048 | | | | 774 | | | | 9,339 | | |
| Reinvestment of dividends | | | 676 | | | | 8,456 | | | | 1,148 | | | | 13,362 | | |
| Redeemed | | | (2,364 | ) | | | (28,785 | ) | | | (11,212 | ) | | | (125,958 | ) | |
| Net increase (decrease) — Class I | | | 155 | | | | 3,719 | | | | (9,290 | ) | | | (103,257 | ) | |
| CLASS R SHARES | |
| Sold | | | 141 | | | $ | 1,804 | | | | 565 | | | $ | 6,478 | | |
| Reinvestment of dividends | | | 5 | | | | 57 | | | | 7 | | | | 80 | | |
| Redeemed | | | (512 | ) | | | (6,673 | ) | | | (396 | ) | | | (4,183 | ) | |
| Net increase (decrease) — Class R | | | (366 | ) | | | (4,812 | ) | | | 176 | | | | 2,375 | | |
| CLASS W SHARES | |
| Sold | | | — | | | | — | | | | — | | | | 54 | | |
| Reinvestment of dividends and distributions | | | 5 | | | | 72 | | | | 10 | | | | 113 | | |
| Net increase — Class W | | | 5 | | | | 72 | | | | 10 | | | | 167 | | |
| Net decrease in Fund | | | (1,849,884 | ) | | $ | (22,590,414 | ) | | | (2,296,517 | ) | | $ | (25,486,498 | ) | |
^ Beginning with the year ended October 31, 2011, the Fund was audited by Ernst & Young LLP. The previous year was audited by another independent registered public accounting firm.
55
Morgan Stanley International Fund
Notes to Financial Statements n October 31, 2011 continued
11. Accounting Pronouncement
In May 2011, FASB issued Accounting Standards Update ("ASU") 2011-04. The amendments in this update are the results of the work of FASB and the International Accounting Standards Board to develop common requirements for measuring fair value and for disclosing information about fair value measurements, which are effective during interim and annual periods beginning after December 15, 2011. Consequently, these amendments improve the comparability of fair value measurements presented and disclosed in the financial statements prepared in accordance with GAAP and International Financial Reporting Standards. At this time, the Fund's management is evaluating the implications of ASU 2011-04.
56
Morgan Stanley International Fund
Financial Highlights
Selected ratios and per share data for a share of beneficial interest outstanding throughout each period:
| | | FOR THE YEAR ENDED OCTOBER 31, | |
| | | 2011 | | 2010^ | | 2009^ | | 2008^ | | 2007^ | |
| Class A Shares | |
| Selected Per Share Data: | |
| Net asset value, beginning of period | | $ | 12.30 | | | $ | 11.32 | | | $ | 9.29 | | | $ | 16.94 | | | $ | 13.14 | | |
| Income (loss) from investment operations: | |
| Net investment income(1) | | | 0.16 | | | | 0.11 | | | | 0.12 | | | | 0.24 | | | | 0.15 | | |
| Net realized and unrealized gain (loss) | | | (1.12 | ) | | | 1.10 | | | | 1.91 | | | | (7.61 | ) | | | 3.86 | | |
Total income (loss) from investment
operations | | | (0.96 | ) | | | 1.21 | | | | 2.03 | | | | (7.37 | ) | | | 4.01 | | |
Less dividends from net investment
income | | | (0.15 | ) | | | (0.23 | ) | | | — | | | | (0.28 | ) | | | (0.21 | ) | |
| Net asset value, end of period | | $ | 11.19 | | | $ | 12.30 | | | $ | 11.32 | | | $ | 9.29 | | | $ | 16.94 | | |
| Total Return(2) | | | (7.95 | )% | | | 10.79 | % | | | 21.85 | % | | | (44.19 | )% | | | 31.03 | % | |
| Ratios to Average Net Assets(3): | |
| Total expenses | | | 1.57 | %(4) | | | 1.50 | %(4) | | | 1.69 | %(4) | | | 1.36 | %(4) | | | 1.33 | %(4)(5) | |
| Net investment income | | | 1.29 | %(4) | | | 0.97 | %(4) | | | 1.30 | %(4) | | | 1.71 | %(4) | | | 1.18 | %(4)(5) | |
| Rebate from Morgan Stanley affiliate | | | 0.01 | % | | | 0.02 | % | | | 0.01 | % | | | 0.01 | % | | | 0.00 | %(6) | |
| Supplemental Data: | |
| Net assets, end of period, in thousands | | $ | 85,116 | | | $ | 107,160 | | | $ | 113,446 | | | $ | 104,619 | | | $ | 193,043 | | |
| Portfolio turnover rate | | | 33 | % | | | 15 | % | | | 36 | % | | | 31 | % | | | 22 | % | |
^ Beginning with the year ended October 31, 2011, the Fund was audited by Ernst & Young LLP. The previous years were audited by another independent registered public accounting firm.
(1) The per share amounts were computed using an average number of shares outstanding during the period.
(2) Does not reflect the deduction of sales charge. Calculated based on the net asset value as of the last business day of the period.
(3) Reflects overall Fund ratios for investment income and non-class specific expenses.
(4) The ratios reflect the rebate of certain Fund expenses in connection with investments in a Morgan Stanley affiliate during the period. The effect of the rebate on the ratios is disclosed in the above table as "Rebate from Morgan Stanley affiliate."
(5) If the Fund had borne all of its expenses that were reimbursed or waived by the Adviser and Administrator, the annualized expense and net investment income ratios would have been as follows:
| PERIOD ENDED | | EXPENSE
RATIO | | NET INVESTMENT
INCOME RATIO | |
| October 31, 2007 | | | 1.34 | % | | | 1.17 | % | |
(6) Amount is less than 0.005%.
See Notes to Financial Statements
57
Morgan Stanley International Fund
Financial Highlights continued
| | | FOR THE YEAR ENDED OCTOBER 31, | |
| | | 2011 | | 2010^ | | 2009^ | | 2008^ | | 2007^ | |
| Class B Shares | |
| Selected Per Share Data: | |
| Net asset value, beginning of period | | $ | 12.08 | | | $ | 11.11 | | | $ | 9.19 | | | $ | 16.69 | | | $ | 12.97 | | |
| Income (loss) from investment operations: | |
| Net investment income(1) | | | 0.07 | | | | 0.02 | | | | 0.05 | | | | 0.13 | | | | 0.08 | | |
| Net realized and unrealized gain (loss) | | | (1.10 | ) | | | 1.08 | | | | 1.87 | | | | (7.53 | ) | | | 3.75 | | |
Total income (loss) from investment
operations | | | (1.03 | ) | | | 1.10 | | | | 1.92 | | | | (7.40 | ) | | | 3.83 | | |
Less dividends from net investment
income | | | (0.03 | ) | | | (0.13 | ) | | | — | | | | (0.10 | ) | | | (0.11 | ) | |
| Net asset value, end of period | | $ | 11.02 | | | $ | 12.08 | | | $ | 11.11 | | | $ | 9.19 | | | $ | 16.69 | | |
| Total Return(2) | | | (8.58 | )% | | | 9.95 | % | | | 20.89 | % | | | (44.49 | )% | | | 29.58 | % | |
| Ratios to Average Net Assets(3): | |
| Total expenses | | | 2.32 | %(4) | | | 2.25 | %(4) | | | 2.44 | %(4) | | | 2.10 | %(4) | | | 2.08 | %(4)(5) | |
| Net investment income | | | 0.54 | %(4) | | | 0.22 | %(4) | | | 0.55 | %(4) | | | 0.90 | %(4) | | | 0.43 | %(4)(5) | |
| Rebate from Morgan Stanley affiliate | | | 0.01 | % | | | 0.02 | % | | | 0.01 | % | | | 0.01 | % | | | 0.00 | %(6) | |
| Supplemental Data: | |
| Net assets, end of period, in thousands | | $ | 7,448 | | | $ | 14,175 | | | $ | 21,247 | | | $ | 30,185 | | | $ | 99,635 | | |
| Portfolio turnover rate | | | 33 | % | | | 15 | % | | | 36 | % | | | 31 | % | | | 22 | % | |
^ Beginning with the year ended October 31, 2011, the Fund was audited by Ernst & Young LLP. The previous years were audited by another independent registered public accounting firm.
(1) The per share amounts were computed using an average number of shares outstanding during the period.
(2) Does not reflect the deduction of sales charge. Calculated based on the net asset value as of the last business day of the period.
(3) Reflects overall Fund ratios for investment income and non-class specific expenses.
(4) The ratios reflect the rebate of certain Fund expenses in connection with investments in a Morgan Stanley affiliate during the period. The effect of the rebate on the ratios is disclosed in the above table as "Rebate from Morgan Stanley affiliate."
(5) If the Fund had borne all of its expenses that were reimbursed or waived by the Adviser and Administrator, the annualized expense and net investment income ratios would have been as follows:
| PERIOD ENDED | | EXPENSE
RATIO | | NET INVESTMENT
INCOME RATIO | |
| October 31, 2007 | | | 2.09 | % | | | 0.42 | % | |
(6) Amount is less than 0.005%.
See Notes to Financial Statements
58
Morgan Stanley International Fund
Financial Highlights continued
| | | FOR THE YEAR ENDED OCTOBER 31, | |
| | | 2011 | | 2010^ | | 2009^ | | 2008^ | | 2007^ | |
| Class C Shares | |
| Selected Per Share Data: | |
| Net asset value, beginning of period | | $ | 11.95 | | | $ | 11.02 | | | $ | 9.11 | | | $ | 16.63 | | | $ | 12.94 | | |
| Income (loss) from investment operations: | |
| Net investment income(1) | | | 0.07 | | | | 0.02 | | | | 0.05 | | | | 0.13 | | | | 0.06 | | |
| Net realized and unrealized gain (loss) | | | (1.08 | ) | | | 1.06 | | | | 1.86 | | | | (7.47 | ) | | | 3.76 | | |
Total income (loss) from investment
operations | | | (1.01 | ) | | | 1.08 | | | | 1.91 | | | | (7.34 | ) | | | 3.82 | | |
Less dividends from net investment
income | | | (0.06 | ) | | | (0.15 | ) | | | — | | | | (0.18 | ) | | | (0.13 | ) | |
| Net asset value, end of period | | $ | 10.88 | | | $ | 11.95 | | | $ | 11.02 | | | $ | 9.11 | | | $ | 16.63 | | |
| Total Return(2) | | | (8.54 | )% | | | 9.89 | % | | | 20.97 | % | | | (44.50 | )% | | | 29.58 | % | |
| Ratios to Average Net Assets(3): | |
| Total expenses | | | 2.31 | %(4) | | | 2.25 | %(4) | | | 2.44 | %(4) | | | 2.07 | %(4) | | | 2.08 | %(4)(5) | |
| Net investment income | | | 0.55 | %(4) | | | 0.22 | %(4) | | | 0.55 | %(4) | | | 0.96 | %(4) | | | 0.43 | %(4)(5) | |
| Rebate from Morgan Stanley affiliate | | | 0.01 | % | | | 0.02 | % | | | 0.01 | % | | | 0.01 | % | | | 0.00 | %(6) | |
| Supplemental Data: | |
| Net assets, end of period, in thousands | | $ | 12,050 | | | $ | 16,163 | | | $ | 17,507 | | | $ | 16,660 | | | $ | 37,085 | | |
| Portfolio turnover rate | | | 33 | % | | | 15 | % | | | 36 | % | | | 31 | % | | | 22 | % | |
^ Beginning with the year ended October 31, 2011, the Fund was audited by Ernst & Young LLP. The previous years were audited by another independent registered public accounting firm.
(1) The per share amounts were computed using an average number of shares outstanding during the period.
(2) Does not reflect the deduction of sales charge. Calculated based on the net asset value as of the last business day of the period.
(3) Reflects overall Fund ratios for investment income and non-class specific expenses.
(4) The ratios reflect the rebate of certain Fund expenses in connection with investments in a Morgan Stanley affiliate during the period. The effect of the rebate on the ratios is disclosed in the above table as "Rebate from Morgan Stanley affiliate."
(5) If the Fund had borne all of its expenses that were reimbursed or waived by the Adviser and Administrator, the annualized expense and net investment income ratios would have been as follows:
| PERIOD ENDED | | EXPENSE
RATIO | | NET INVESTMENT
INCOME RATIO | |
| October 31, 2007 | | | 2.09 | % | | | 0.42 | % | |
(6) Amount is less than 0.005%.
See Notes to Financial Statements
59
Morgan Stanley International Fund
Financial Highlights continued
| | | FOR THE YEAR ENDED OCTOBER 31, | |
| | | 2011 | | 2010^ | | 2009^ | | 2008^ | | 2007^ | |
| Class I Shares | |
| Selected Per Share Data: | |
| Net asset value, beginning of period | | $ | 12.39 | | | $ | 11.40 | | | $ | 9.33 | | | $ | 17.00 | | | $ | 13.23 | | |
| Income (loss) from investment operations: | |
| Net investment income(1) | | | 0.19 | | | | 0.14 | | | | 0.16 | | | | 0.27 | | | | 0.21 | | |
| Net realized and unrealized gain (loss) | | | (1.12 | ) | | | 1.10 | | | | 1.91 | | | | (7.64 | ) | | | 3.83 | | |
Total income (loss) from investment
operations | | | (0.93 | ) | | | 1.24 | | | | 2.07 | | | | (7.37 | ) | | | 4.04 | | |
Less dividends from net investment
income | | | (0.18 | ) | | | (0.25 | ) | | | — | | | | (0.30 | ) | | | (0.27 | ) | |
| Net asset value, end of period | | $ | 11.28 | | | $ | 12.39 | | | $ | 11.40 | | | $ | 9.33 | | | $ | 17.00 | | |
| Total Return(2) | | | (7.66 | )% | | | 11.05 | % | | | 22.19 | % | | | (44.16 | )% | | | 31.33 | % | |
| Ratios to Average Net Assets(3): | |
| Total expenses | | | 1.32 | %(4) | | | 1.25 | %(4) | | | 1.44 | %(4) | | | 1.10 | %(4) | | | 1.08 | %(4)(5) | |
| Net investment income | | | 1.54 | %(4) | | | 1.22 | %(4) | | | 1.55 | %(4) | | | 1.95 | %(4) | | | 1.43 | %(4)(5) | |
| Rebate from Morgan Stanley affiliate | | | 0.01 | % | | | 0.02 | % | | | 0.01 | % | | | 0.01 | % | | | 0.00 | %(6) | |
| Supplemental Data: | |
| Net assets, end of period, in thousands | | $ | 623 | | | $ | 682 | | | $ | 733 | | | $ | 10,085 | | | $ | 22,888 | | |
| Portfolio turnover rate | | | 33 | % | | | 15 | % | | | 36 | % | | | 31 | % | | | 22 | % | |
^ Beginning with the year ended October 31, 2011, the Fund was audited by Ernst & Young LLP. The previous years were audited by another independent registered public accounting firm.
(1) The per share amounts were computed using an average number of shares outstanding during the period.
(2) Calculated based on the net asset value as of the last business day of the period.
(3) Reflects overall Fund ratios for investment income and non-class specific expenses.
(4) The ratios reflect the rebate of certain Fund expenses in connection with investments in a Morgan Stanley affiliate during the period. The effect of the rebate on the ratios is disclosed in the above table as "Rebate from Morgan Stanley affiliate."
(5) If the Fund had borne all of its expenses that were reimbursed or waived by the Adviser and Administrator, the annualized expense and net investment income ratios would have been as follows:
| PERIOD ENDED | | EXPENSE
RATIO | | NET INVESTMENT
INCOME RATIO | |
| October 31, 2007 | | | 1.09 | % | | | 1.42 | % | |
(6) Amount is less than 0.005%.
See Notes to Financial Statements
60
Morgan Stanley International Fund
Financial Highlights continued
| | | FOR THE YEAR ENDED OCTOBER 31, | | FOR THE PERIOD
MARCH 31, 2008@@@ | |
| | | | | THROUGH | |
| | | 2011 | | 2010^ | | 2009^ | | OCTOBER 31, 2008^ | |
| Class R Shares | |
| Selected Per Share Data: | |
| Net asset value, beginning of period | | $ | 12.23 | | | $ | 11.27 | | | $ | 9.28 | | | $ | 14.14 | | |
| Income (loss) from investment operations: | |
| Net investment income(1) | | | 0.13 | | | | 0.08 | | | | 0.10 | | | | 0.15 | | |
| Net realized and unrealized gain (loss) | | | (1.11 | ) | | | 1.09 | | | | 1.89 | | | | (5.01 | ) | |
| Total income (loss) from investment operations | | | (0.98 | ) | | | 1.17 | | | | 1.99 | | | | (4.86 | ) | |
| Less dividends from net investment income | | | (0.12 | ) | | | (0.21 | ) | | | — | | | | — | | |
| Net asset value, end of period | | $ | 11.13 | | | $ | 12.23 | | | $ | 11.27 | | | $ | 9.28 | | |
| Total Return(2) | | | (8.10 | )% | | | 10.47 | % | | | 21.57 | % | | | (34.44 | )%(5) | |
| Ratios to Average Net Assets(3): | |
| Total expenses | | | 1.82 | %(4) | | | 1.75 | %(4) | | | 1.94 | %(4) | | | 1.62 | %(4)(6) | |
| Net investment income | | | 1.04 | %(4) | | | 0.72 | %(4) | | | 1.05 | %(4) | | | 1.96 | %(4)(6) | |
| Rebate from Morgan Stanley affiliate | | | 0.01 | % | | | 0.02 | % | | | 0.01 | % | | | 0.01 | %(6) | |
| Supplemental Data: | |
| Net assets, end of period, in thousands | | $ | 80 | | | $ | 92 | | | $ | 83 | | | $ | 66 | | |
| Portfolio turnover rate | | | 33 | % | | | 15 | % | | | 36 | % | | | 31 | % | |
@@@ The date shares were first issued.
^ Beginning with the year ended October 31, 2011, the Fund was audited by Ernst & Young LLP. The previous years were audited by another independent registered public accounting firm.
(1) The per share amounts were computed using an average number of shares outstanding during the period.
(2) Calculated based on the net asset value as of the last business day of the period.
(3) Reflects overall Fund ratios for investment income and non-class specific expenses.
(4) The ratios reflect the rebate of certain Fund expenses in connection with investments in a Morgan Stanley affiliate during the period. The effect of the rebate on the ratios is disclosed in the above table as "Rebate from Morgan Stanley affiliate."
(5) Not annualized.
(6) Annualized.
See Notes to Financial Statements
61
Morgan Stanley International Fund
Financial Highlights continued
| | | FOR THE YEAR ENDED OCTOBER 31, | | FOR THE PERIOD
MARCH 31, 2008@@@ | |
| | | | | THROUGH | |
| | | 2011 | | 2010^ | | 2009^ | | OCTOBER 31, 2008^ | |
| Class W Shares | |
| Selected Per Share Data: | |
| Net asset value, beginning of period | | $ | 12.27 | | | $ | 11.30 | | | $ | 9.28 | | | $ | 14.14 | | |
| Income (loss) from investment operations: | |
| Net investment income(1) | | | 0.15 | | | | 0.10 | | | | 0.11 | | | | 0.16 | | |
| Net realized and unrealized gain (loss) | | | (1.12 | ) | | | 1.09 | | | | 1.91 | | | | (5.02 | ) | |
| Total income (loss) from investment operations | | | (0.97 | ) | | | 1.19 | | | | 2.02 | | | | (4.86 | ) | |
| Less dividends from net investment income | | | (0.14 | ) | | | (0.22 | ) | | | — | | | | — | | |
| Net asset value, end of period | | $ | 11.16 | | | $ | 12.27 | | | $ | 11.30 | | | $ | 9.28 | | |
| Total Return(2) | | | (8.03 | )% | | | 10.67 | % | | | 21.77 | % | | | (34.37 | )%(5) | |
| Ratios to Average Net Assets(3): | |
| Total expenses | | | 1.67 | %(4) | | | 1.60 | %(4) | | | 1.79 | %(4) | | | 1.47 | %(4)(6) | |
| Net investment income | | | 1.19 | %(4) | | | 0.87 | %(4) | | | 1.20 | %(4) | | | 2.11 | %(4)(6) | |
| Rebate from Morgan Stanley affiliate | | | 0.01 | % | | | 0.02 | % | | | 0.01 | % | | | 0.01 | %(6) | |
| Supplemental Data: | |
| Net assets, end of period, in thousands | | $ | 85 | | | $ | 93 | | | $ | 86 | | | $ | 66 | | |
| Portfolio turnover rate | | | 33 | % | | | 15 | % | | | 36 | % | | | 31 | % | |
@@@ The date shares were first issued.
^ Beginning with the year ended October 31, 2011, the Fund was audited by Ernst & Young LLP. The previous years were audited by another independent registered public accounting firm.
(1) The per share amounts were computed using an average number of shares outstanding during the period.
(2) Calculated based on the net asset value as of the last business day of the period.
(3) Reflects overall Fund ratios for investment income and non-class specific expenses.
(4) The ratios reflect the rebate of certain Fund expenses in connection with investments in a Morgan Stanley affiliate during the period. The effect of the rebate on the ratios is disclosed in the above table as "Rebate from Morgan Stanley affiliate."
(5) Not annualized.
(6) Annualized.
See Notes to Financial Statements
62
Morgan Stanley International Fund
Report of Independent Registered Public Accounting Firm
To the Shareholders and Board of Trustees of
Morgan Stanley International Fund:
We have audited the accompanying statement of assets and liabilities of Morgan Stanley International Fund (the "Fund"), including the portfolio of investments, as of October 31, 2011, and the related statements of operations and changes in net assets and the financial highlights for the year then ended. These financial statements and financial highlights are the responsibility of the Fund's management. Our responsibility is to express an opinion on these financial statements and financial highlights based on our audit. The statement of changes in net assets for the year ended October 31, 2010 and the financial highlights for periods ended prior to November 1, 2010 were audited by another independent registered public accounting firm whose report, dated December 23, 2010, expressed an unqualified opinion on that statement of changes in net assets and those financial highlights.
We conducted our audit in accordance with the standards of the Public Company Accounting Oversight Board (United States). Those standards require that we plan and perform the audit to obtain reasonable assurance about whether the financial statements and financial highlights are free of material misstatement. The Fund was not required to have, nor were we engaged to perform, an audit of its internal control over financial reporting. Our audit included consideration of internal control over financial reporting as a basis for designing audit procedures that are appropriate in the circumstances, but not for the purpose of expressing an opinion on the effectiveness of the Fund's internal control over financial reporting. Accordingly, we express no such opinion. An audit also includes examining, on a test basis, evidence supporting the amounts and disclosures in the financial statements, assessing the accounting principles used and significant estimates made by management, as well as evaluating the overall financial statement presentation. Our procedures included confirmation of securities owned as of October 31, 2011, by correspondence with the custodian and others or by other appropriate auditing procedures where replies from others were not received. We believe that our audit provides a reasonable basis for our opinion.
In our opinion, the financial statements and financial highlights referred to above present fairly, in all material respects, the financial position of Morgan Stanley International Fund as of October 31, 2011, the results of its operations, the changes in its net assets, and the financial highlights for the year then ended, in conformity with U.S. generally accepted accounting principles.

Boston, Massachusetts
December 22, 2011
63
Morgan Stanley International Fund
Change in Independent Registered Public Accounting Firm (unaudited)
On June 7, 2011, Deloitte & Touche LLP were dismissed as the Independent Registered Public Accounting Firm of the Fund.
The reports of Deloitte & Touche LLP on the financial statements of the Fund for the past two fiscal years contained no adverse opinion or disclaimer of opinion and were not qualified or modified as to uncertainty, audit scope or accounting principle.
In connection with its audits for the two most recent fiscal years, there have been no disagreements with Deloitte & Touche LLP on any matter of accounting principles or practices, financial statement disclosure, or auditing scope or procedure, which disagreements, if not resolved to the satisfaction of Deloitte & Touche LLP, would have caused them to make reference thereto in their reports on the financial statements for such years.
On June 7, 2011, the Fund, with the approval of its Board of Trustees and its Audit Committee, engaged Ernst & Young LLP as its new Independent Registered Public Accounting Firm.
64
Morgan Stanley International Fund
An Important Notice Concerning Our U.S. Privacy Policy (unaudited)
We are required by federal law to provide you with a copy of our privacy policy ("Policy") annually.
This Policy applies to current and former individual clients of Morgan Stanley Distribution, Inc., as well as current and former individual investors in Morgan Stanley mutual funds and related companies.
This Policy is not applicable to partnerships, corporations, trusts or other non-individual clients or account holders, nor is this Policy applicable to individuals who are either beneficiaries of a trust for which we serve as trustee or participants in an employee benefit plan administered or advised by us. This Policy is, however, applicable to individuals who select us to be a custodian of securities or assets in individual retirement accounts, 401(k) accounts, 529 Educational Savings Accounts, accounts subject to the Uniform Gifts to Minors Act, or similar accounts. We may amend this Policy at any time, and will inform you of any changes to this Policy as required by law.
We Respect Your Privacy
We appreciate that you have provided us with your personal financial information and understand your concerns about safeguarding such information. We strive to maintain the privacy of such information while we help you achieve your financial objectives. This Policy describes what nonpublic personal information we collect about you, how we collect it, when we may share it with others, and how others may use it. It discusses the steps you may take to limit our sharing of information about you with affiliated Morgan Stanley companies ("affiliated companies"). It also discloses how you may limit our affiliates' use of shared information for marketing purposes. Throughout this Policy, we refer to the nonpublic information that personally identifies you or your accounts as "personal information."
1. What Personal Information Do We Collect About You?
To better serve you and manage our business, it is important that we collect and maintain accurate information about you. We obtain this information from applications and other forms you submit to us, from your dealings with us, from consumer reporting agencies, from our websites and from third parties and other sources.
For example:
• We collect information such as your name, address, e-mail address, telephone/fax numbers, assets, income and investment objectives through application forms you submit to us.
• We may obtain information about account balances, your use of account(s) and the types of products and services you prefer to receive from us through your dealings and transactions with us and other sources.
65
Morgan Stanley International Fund
An Important Notice Concerning Our U.S. Privacy Policy (unaudited) continued
• We may obtain information about your creditworthiness and credit history from consumer reporting agencies.
• We may collect background information from and through third-party vendors to verify representations you have made and to comply with various regulatory requirements.
• If you interact with us through our public and private Web sites, we may collect information that you provide directly through online communications (such as an e-mail address). We may also collect information about your Internet service provider, your domain name, your computer's operating system and Web browser, your use of our Web sites and your product and service preferences, through the use of ''cookies.'' ''Cookies'' recognize your computer each time you return to one of our sites, and help to improve our sites' content and personalize your experience on our sites by, for example, suggesting offerings that may interest you. Please consult the Terms of Use of these sites for more details on our use of cookies.
2. When Do We Disclose Personal Information We Collect About You?
To provide you with the products and services you request, to better serve you, to manage our business and as otherwise required or permitted by law, we may disclose personal information we collect about you to other affiliated companies and to nonaffiliated third parties.
a. Information We Disclose to Our Affiliated Companies. In order to manage your account(s) effectively, including servicing and processing your transactions, to let you know about products and services offered by us and affiliated companies, to manage our business, and as otherwise required or permitted by law, we may disclose personal information about you to other affiliated companies. Offers for products and services from affiliated companies are developed under conditions designed to safeguard your personal information.
b. Information We Disclose to Third Parties. We do not disclose personal information that we collect about you to nonaffiliated third parties except to enable them to provide marketing services on our behalf, to perform joint marketing agreements with other financial institutions, and as otherwise required or permitted by law. For example, some instances where we may disclose information about you to third parties include: for servicing and processing transactions, to offer our own products and services, to protect against fraud, for institutional risk control, to respond to judicial process or to perform services on our behalf. When we share personal information with a nonaffiliated third party, they are required to limit their use of personal information about you to the particular purpose for which it was shared and they are not allowed to share personal information about you with others except to fulfill that limited purpose or as may be required by law.
66
Morgan Stanley International Fund
An Important Notice Concerning Our U.S. Privacy Policy (unaudited) continued
3. How Do We Protect the Security and Confidentiality of Personal Information We Collect About You?
We maintain physical, electronic and procedural security measures to help safeguard the personal information we collect about you. We have internal policies governing the proper handling of client information. Third parties that provide support or marketing services on our behalf may also receive personal information about you, and we require them to adhere to confidentiality standards with respect to such information.
4. How Can You Limit Our Sharing of Certain Personal Information About You With Our Affiliated Companies for Eligibility Determination?
We respect your privacy and offer you choices as to whether we share with our affiliated companies personal information that was collected to determine your eligibility for products and services such as credit reports and other information that you have provided to us or that we may obtain from third parties ("eligibility information"). Please note that, even if you direct us not to share certain eligibility information with our affiliated companies, we may still share your personal information, including eligibility information, with those companies under circumstances that are permitted under applicable law, such as to process transactions or to service your account. We may also share certain other types of personal information with affiliated companies — such as your name, address, telephone number, e-mail address and account number(s), and information about your transactions and experiences with us.
5. How Can You Limit the Use of Certain Personal Information About You by our Affiliated Companies for Marketing?
You may limit our affiliated companies from using certain personal information about you that we may share with them for marketing their products or services to you. This information includes our transactions and other experiences with you such as your assets and account history. Please note that, even if you choose to limit our affiliated companies from using certain personal information about you that we may share with them for marketing their products and services to you, we may still share such personal information about you with them, including our transactions and experiences with you, for other purposes as permitted under applicable law.
67
Morgan Stanley International Fund
An Important Notice Concerning Our U.S. Privacy Policy (unaudited) continued
6. How Can You Send Us an Opt-Out Instruction?
If you wish to limit our sharing of certain personal information about you with our affiliated companies for "eligibility purposes" and for our affiliated companies' use in marketing products and services to you as described in this notice, you may do so by:
• Calling us at (800) 869-6397
Monday–Friday between 8a.m. and 6p.m. (EST)
• Writing to us at the following address:
Morgan Stanley Privacy Department
Harborside Financial Center
201 Plaza Two, 3rd Floor
Jersey City, NJ 07311
If you choose to write to us, your written request should include: your name, address, telephone number and account number(s) to which the opt-out applies and should not be sent with any other correspondence. In order to process your request, we require that the request be provided by you directly and not through a third party. Once you have informed us about your privacy preferences, your opt-out preference will remain in effect with respect to this Policy (as it may be amended) until you notify us otherwise. If you are a joint account owner, we will accept instructions from any one of you and apply those instructions to the entire account. Please allow approximately 30 days from our receipt of your opt-out for your instructions to become effective.
Please understand that if you opt-out, you and any joint account holders may not receive certain Morgan Stanley or our affiliated companies' products and services that could help you manage your financial resources and achieve your investment objectives.
If you have more than one account with us or our affiliates, you may receive multiple privacy policies from us, and would need to follow the directions stated in each particular policy for each account you have with us.
7. What if an affiliated company becomes a nonaffiliated third party?
If, at any time in the future, an affiliated company becomes a nonaffiliated third party, further disclosures of personal information made to the former affiliated company will be limited to those described in Section 2(b) above relating to nonaffiliated third parties. If you elected under Section 6 to limit disclosures we make to affiliated companies, or use of personal information by affiliated companies, your election will not apply to use by any former affiliated company of your personal information in their possession once it becomes a nonaffiliated third party.
68
Morgan Stanley International Fund
An Important Notice Concerning Our U.S. Privacy Policy (unaudited) continued
Special Notice to Residents of Vermont
This section supplements our Policy with respect to our individual clients who have a Vermont address and supersedes anything to the contrary in the above Policy with respect to those clients only.
The State of Vermont requires financial institutions to obtain your consent prior to sharing personal information that they collect about you with affiliated companies and nonaffiliated third parties other than in certain limited circumstances. Except as permitted by law, we will not share personal information we collect about you with nonaffiliated third parties or other affiliated companies unless you provide us with your written consent to share such information ("opt-in").
If you wish to receive offers for investment products and services offered by or through other affiliated companies, please notify us in writing at the following address:
Morgan Stanley Privacy Department
Harborside Financial Center
201 Plaza Two, 3rd Floor
Jersey City, NJ 07311
Your authorization should include: your name, address, telephone number and account number(s) to which the opt-in applies and should not be sent with any other correspondence. In order to process your authorization, we require that the authorization be provided by you directly and not through a third-party.
Special Notice to Residents of California
The following section supplements our Policy with respect to our individual clients who have a California address and supersedes anything to the contrary in the above Policy with respect to those clients only.
In response to a California law, if your account has a California home address, your personal information will not be disclosed to nonaffiliated third parties except as permitted by applicable California law, and we will limit sharing such personal information with our affiliates to comply with California privacy laws that apply to us.
69
Morgan Stanley International Fund
Trustee and Officer Information (unaudited)
Independent Trustees:
Name, Age and Address of
Independent Trustee | | Position(s)
Held with
Registrant | | Length of
Time Served* | | Principal Occupation(s)
During Past 5 Years | | Number of
Portfolios
in Fund
Complex
Overseen by
Independent
Trustee** | | Other Directorships
Held by Independent Trustee*** | |
Frank L. Bowman (67)
c/o Kramer Levin Naftalis & Frankel LLP
Counsel to the Independent Trustees
1177 Avenue of the Americas
New York, NY 10036 | | Trustee | | Since
August 2006 | | President, Strategic Decisions, LLC (consulting) (since February 2009); Director or Trustee of various Morgan Stanley Funds (since August 2006); Chairperson of the Insurance Sub-Committee of the Compliance and Insurance Committee (since February 2007); served as President and Chief Executive Officer of the Nuclear Energy Institute (policy organization) (February 2005 through November 2008); retired as Admiral, U.S. Navy after serving over 38 years on active duty including 8 years as Director of the Naval Nuclear Propulsion Program in the Department of the Navy and the U.S. Department of Energy (1996-2004); served as Chief of Naval Personnel (July 1994-September 1996); and on the joint staff as Director of Political-Military Affairs (June 1992 to July 1994); Knighted as Honorary Knight Commander of the Most Excellent Order of the British Empire; Awarded the Officer de l'Orde National du Mérite by the French Government; elected to the National Academy of Engineering (2009). | | | 102 | | | Director of BP p.l.c.; Director of Naval and Nuclear Technologies LLP; Director of the Armed Services YMCA of the USA and the Naval Submarine League; Director of the American Shipbuilding Suppliers Association; Member of the National Security Advisory Council of the Center for U.S. Global Engagement and a member of the CNA military Advisory Board. | |
|
Michael Bozic (70)
c/o Kramer Levin Naftalis & Frankel LLP
Counsel to the Independent Trustees
1177 Avenue of the Americas
New York, NY 10036 | | Trustee | | Since
April 1994 | | Private investor; Chairperson of the Compliance and Insurance Committee (since October 2006); Director or Trustee of various Morgan Stanley Funds (since April 1994); formerly, Chairperson of the Insurance Committee (July 2006-September 2006); Vice Chairman of Kmart Corporation (December 1998-October 2000), Chairman and Chief Executive Officer of Levitz Furniture Corporation (November 1995-November 1998) and President and Chief Executive Officer of Hills Department Stores (May 1991-July 1995); variously Chairman, Chief Executive Officer, President and Chief Operating Officer (1987-1991) of the Sears Merchandise Group of Sears, Roebuck & Co. | | | 104 | | | Director of various business
organizations. | |
|
70
Morgan Stanley International Fund
Trustee and Officer Information (unaudited) continued
Name, Age and Address of
Independent Trustee | | Position(s)
Held with
Registrant | | Length of
Time Served* | | Principal Occupation(s)
During Past 5 Years | | Number of
Portfolios
in Fund
Complex
Overseen by
Independent
Trustee** | | Other Directorships
Held by Independent Trustee*** | |
Kathleen A. Dennis (58)
c/o Kramer Levin Naftalis & Frankel LLP
Counsel to the Independent Trustees
1177 Avenue of the Americas
New York, NY 10036 | | Trustee | | Since
August 2006 | | President, Cedarwood Associates (mutual fund and investment management consulting) (since July 2006); Chairperson of the Money Market and Alternatives Sub-Committee of the Investment Committee (since October 2006) and Director or Trustee of various Morgan Stanley Funds (since August 2006); formerly, Senior Managing Director of Victory Capital Management (1993-2006). | | | 102 | | | Director of various non-profit organizations. | |
|
Dr. Manuel H. Johnson (62)
c/o Johnson Smick Group, Inc.
888 16th Street, N.W.
Suite 740
Washington, D.C. 20006 | | Trustee | | Since
July 1991 | | Senior Partner, Johnson Smick International, Inc. (consulting firm); Chairperson of the Investment Committee (since October 2006) and Director or Trustee of various Morgan Stanley Funds (since July 1991); Co-Chairman and a founder of the Group of Seven Council (G7C) (international economic commission); formerly, Chairperson of the Audit Committee (July 1991-September 2006), Vice Chairman of the Board of Governors of the Federal Reserve System and Assistant Secretary of the U.S. Treasury. | | | 104 | | | Director of NVR, Inc. (home construction); Director of Evergreen Energy; Director of Greenwich Capital Holdings. | |
|
Joseph J. Kearns (69)
c/o Kearns & Associates LLC
PMB754
22631 Pacific Coast Highway
Malibu, CA 90265 | | Trustee | | Since
August 1994 | | President, Kearns & Associates LLC (investment consulting); Chairperson of the Audit Committee (since October 2006) and Director or Trustee of various Morgan Stanley Funds (since August 1994); formerly, Deputy Chairperson of the Audit Committee (July 2003-September 2006) and Chairperson of the Audit Committee of various Morgan Stanley Funds (since August 1994); CFO of the J. Paul Getty Trust. | | | 105 | | | Director of Electro Rent Corporation (equipment leasing) and The Ford Family Foundation. | |
|
71
Morgan Stanley International Fund
Trustee and Officer Information (unaudited) continued
Name, Age and Address of
Independent Trustee | | Position(s)
Held with
Registrant | | Length of
Time Served* | | Principal Occupation(s)
During Past 5 Years | | Number of
Portfolios
in Fund
Complex
Overseen by
Independent
Trustee** | | Other Directorships
Held by Independent Trustee*** | |
Michael F. Klein (53)
c/o Kramer Levin Naftalis & Frankel LLP
Counsel to the Independent Trustees
1177 Avenue of the Americas
New York, NY 10036 | | Trustee | | Since
August 2006 | | Managing Director, Aetos Capital, LLC (since March 2000) and Co-President, Aetos Alternatives Management, LLC (since January 2004); Chairperson of the Fixed Income Sub-Committee of the Investment Committee (since October 2006) and Director or Trustee of various Morgan Stanley Funds (since August 2006); formerly, Managing Director, Morgan Stanley & Co. Inc. and Morgan Stanley Dean Witter Investment Management, President, Morgan Stanley Funds (June 1998-March 2000) and Principal, Morgan Stanley & Co. Inc. and Morgan Stanley Dean Witter Investment Management (August 1997-December 1999). | | | 102 | | | Director of certain investment funds managed or sponsored by Aetos Capital, LLC. Director of Sanitized AG and Sanitized Marketing AG (specialty chemicals). | |
|
Michael E. Nugent (75)
c/o Triumph Capital, L.P.
445 Park Avenue
New York, NY 10022 | | Chairperson of the Board and Trustee | | Chairperson of the Boards since July 2006 and Trustee since July 1991 | | General Partner, Triumph Capital, L.P. (private investment partnership); Chairperson of various Morgan Stanley Funds (since July 2006); Director or Trustee of the Funds (since July 1991); formerly, Chairperson of the Insurance Committee (until July 2006). | | | 104 | | | None. | |
|
72
Morgan Stanley International Fund
Trustee and Officer Information (unaudited) continued
Name, Age and Address of
Independent Trustee | | Position(s)
Held with
Registrant | | Length of
Time Served* | | Principal Occupation(s)
During Past 5 Years | | Number of
Portfolios
in Fund
Complex
Overseen by
Independent
Trustee** | | Other Directorships
Held by Independent Trustee*** | |
W. Allen Reed (64)
c/o Kramer Levin Naftalis & Frankel LLP
Counsel to the Independent Trustees
1177 Avenue of the Americas
New York, NY 10036 | | Trustee | | Since
August 2006 | | Chairperson of the Equity Sub-Committee of the Investment Committee (since October 2006) and Director or Trustee of various Morgan Stanley Funds (since August 2006); formerly, President and CEO of General Motors Asset Management; Chairman and Chief Executive Officer of the GM Trust Bank and Corporate Vice President of General Motors Corporation (August 1994-December 2005). | | | 102 | | | Director of Temple-Inland Industries (packaging and forest products); Director of Legg Mason, Inc. and Director of the Auburn University Foundation; formerly, Director of iShares, Inc. (2001-2006). | |
|
Fergus Reid (79)
c/o Joe Pietryka, Inc.
85 Charles Colman Blvd.
Pawling, NY 12564 | | Trustee | | Since
June 1992 | | Chairman, Joe Pietryka, Inc.; Chairperson of the Governance Committee and Director or Trustee of various Morgan Stanley Funds (since June 1992). | | | 105 | | | Trustee and Director of certain investment companies in the JPMorgan Funds complex managed by JP Morgan Investment Management Inc. | |
|
Interested Trustee:
Name, Age and Address of
Interested Trustee | | Position(s)
Held with
Registrant | | Length of
Time Served* | | Principal Occupation(s)
During Past 5 Years | | Number of
Portfolios
in Fund
Complex
Overseen by
Interested
Trustee** | | Other Directorships
Held by Interested Trustee*** | |
James F. Higgins (63)
c/o Morgan Stanley Services Company Inc.
Harborside Financial Center
201 Plaza Two
Jersey City, NJ 07311 | | Trustee | | Since
June 2000 | | Director or Trustee of various Morgan Stanley Funds (since June 2000); Senior Advisor of Morgan Stanley (since August 2000). | | | 103 | | | Director of AXA Financial, Inc. and The Equitable Life Assurance Society of the United States (financial services). | |
|
* Each Trustee serves an indefinite term, until his or her successor is elected.
** The Fund Complex includes all open-end and closed-end funds (including all of their portfolios) advised by Morgan Stanley Investment Management Inc. (the "Adviser") (as of December 31, 2010) and any funds that have an adviser that is an affiliated person of the Adviser (including, but not limited to, Morgan Stanley AIP GP LP).
*** This includes any directorships at public companies and registered investment companies held by the Trustee at any time during the past five years.
73
Morgan Stanley International Fund
Trustee and Officer Information (unaudited) continued
Executive Officers:
Name, Age and Address of
Executive Officer | | Position(s)
Held with
Registrant | | Length of
Time Served* | | Principal Occupation(s) During Past 5 Years | |
Arthur Lev (50)
522 Fifth Avenue
New York, NY 10036 | | President and Principal Executive Officer – Equity and Fixed Income Funds | | Since June 2011 | | President and Principal Executive Officer (since June 2011) of the Equity and Fixed Income Funds in the Fund Complex; Head of the Long Only Business of Morgan Stanley Investment Management (since February 2011); Managing Director of the Adviser and various entities affiliated with the Adviser (since December 2006). Formerly, Chief Strategy Officer of Morgan Stanley Investment Management's Traditional Asset Management business (November 2010-February 2011); General Counsel of Morgan Stanley Investment Management (December 2006-October 2010); Partner and General Counsel of FrontPoint Partners LLC (July 2002 to December 2006); Managing Director and General Counsel of Morgan Stanley Investment Management (May 2000 to June 2002). | |
|
Mary Ann Picciotto (38)
c/o Morgan Stanley Services
Company Inc.
Harborside Financial Center
201 Plaza Two
Jersey City, NJ 07311 | | Chief Compliance Officer | | Since May 2010 | | Executive Director of the Adviser and various entities affiliated with the Adviser; Chief Compliance Officer of various Morgan Stanley Funds (since May 2010); Chief Compliance Officer of the Adviser (since April 2007). | |
|
Stefanie V. Chang Yu (45)
522 Fifth Avenue
New York, NY 10036 | | Vice President | | Since December 1997 | | Managing Director of the Adviser and various entities affiliated with the Adviser; Vice President of various Morgan Stanley Funds (since December 1997). Formerly, Secretary of the Adviser. | |
|
Francis J. Smith (46)
c/o Morgan Stanley Services Company Inc.
Harborside Financial Center
201 Plaza Two
Jersey City, NJ 07311 | | Treasurer and Principal Financial
Officer | | Treasurer since July 2003 and Principal Financial Officer since September 2002 | | Executive Director of the Adviser and various entities affiliated with the Adviser; Treasurer and Principal Financial Officer of various Morgan Stanley Funds (since July 2003). | |
|
Mary E. Mullin (44)
522 Fifth Avenue
New York, NY 10036 | | Secretary | | Since June 1999 | | Executive Director of the Adviser and various entities affiliated with the Adviser; Secretary of various Morgan Stanley Funds (since June 1999). | |
|
* Each officer serves an indefinite term, until his or her successor is elected.
2011 Federal Tax Notice (unaudited)
For Federal income tax purposes, the following information is furnished with respect to the Fund's earnings for its taxable year ended October 31, 2011. When distributed, certain earnings may be subject to a maximum tax rate of 15% as provided for by the Jobs and Growth Tax Relief Reconciliation Act of 2003. The Fund designated up to a maximum of $3,736,504 as taxable at this lower rate.
During the taxable year ended October 31, 2011, the Fund intends to pass through foreign tax credits of $309,519, and has derived income of $3,842,665 from sources within foreign countries.
In January, the Fund provides tax information to shareholders for the preceding calendar year.
74
(This page has been left blank intentionally.)
Trustees
Frank L. Bowman
Michael Bozic
Kathleen A. Dennis
James F. Higgins
Dr. Manuel H. Johnson
Joseph J. Kearns
Michael F. Klein
Michael E. Nugent
W. Allen Reed
Fergus Reid
Officers
Michael E. Nugent
Chairperson of the Board
Arthur Lev
President and Principal Executive Officer
Mary Ann Picciotto
Chief Compliance Officer
Stefanie V. Chang Yu
Vice President
Francis J. Smith
Treasurer and Principal Financial Officer
Mary E. Mullin
Secretary
Transfer Agent
Morgan Stanley Services Company Inc.
P.O. Box 219886
Kansas City, Missouri 64121
Custodian
State Street Bank and Trust Company
One Lincoln Street
Boston, Massachusetts 02111
Independent Registered Public Accounting Firm
Ernst & Young LLP
200 Clarendon Street
Boston, Massachusetts 02116
Legal Counsel
Dechert LLP
1095 Avenue of the Americas
New York, New York 10036
Counsel to the Independent Trustees
Kramer Levin Naftalis & Frankel LLP
1177 Avenue of the Americas
New York, New York 10036
Investment Adviser
Morgan Stanley Investment Management Inc.
522 Fifth Avenue
New York, New York 10036

INVESTMENT MANAGEMENT
Morgan Stanley
International Fund
This report is submitted for the general information of the shareholders of the Fund. For more detailed information about the Fund, its fees and expenses and other pertinent information, please read its Prospectus. The Fund's Statement of Additional Information contains additional information about the Fund, including its trustees. It is available, without charge, by calling (800) 869-NEWS.
This report is not authorized for distribution to prospective investors in the Fund unless preceded or accompanied by an effective Prospectus. Read the Prospectus carefully before investing.
Morgan Stanley Distribution, Inc., member FINRA.
© 2011 Morgan Stanley

Annual Report
October 31, 2011

INLANN
IU11-02639P-Y10/11
Trustees
Frank L. Bowman
Michael Bozic
Kathleen A. Dennis
James F. Higgins
Dr. Manuel H. Johnson
Joseph J. Kearns
Michael F. Klein
Michael E. Nugent
W. Allen Reed
Fergus Reid
Officers
Michael E. Nugent
Chairperson of the Board
Arthur Lev
President and Principal Executive Officer
Mary Ann Picciotto
Chief Compliance Officer
Stefanie V. Chang Yu
Vice President
Francis J. Smith
Treasurer and Principal Financial Officer
Mary E. Mullin
Secretary
Transfer Agent
Morgan Stanley Services Company Inc.
P.O. Box 219886
Kansas City, Missouri 64121
Custodian
State Street Bank and Trust Company
One Lincoln Street
Boston, Massachusetts 02111
Independent Registered Public Accounting Firm
Ernst & Young LLP
200 Clarendon Street
Boston, Massachusetts 02116
Legal Counsel
Dechert LLP
1095 Avenue of the Americas
New York, New York 10036
Counsel to the Independent Trustees
Kramer Levin Naftalis & Frankel LLP
1177 Avenue of the Americas
New York, New York 10036
Adviser
Morgan Stanley Investment Management Inc.
522 Fifth Avenue
New York, New York 10036
The financial statements included herein have been taken from the records of the Fund without examination by the independent auditors and accordingly they do not express an opinion thereon.
This report is submitted for the general information of the shareholders of the Fund. For more detailed information about the Fund, its fees and expenses and other pertinent information, please read its Prospectus. The Fund's Statement of Additional Information contains additional information about the Fund, including its trustees. It is available, without charge, by calling (800) 869-NEWS.
This report is not authorized for distribution to prospective investors in the Fund unless preceded or accompanied by an effective Prospectus. Read the Prospectus carefully before investing.
Morgan Stanley Distribution, Inc., member FINRA.
© 2012 Morgan Stanley
INLSAN
IU12-01272P-Y04/12


INVESTMENT MANAGEMENT
Morgan Stanley
International Fund
Semiannual Report
April 30, 2012


Morgan Stanley International Fund
Table of Contents
| Welcome Shareholder | | | 3 | | |
|
| Fund Report | | | 4 | | |
|
| Performance Summary | | | 9 | | |
|
| Expense Example | | | 10 | | |
|
| Portfolio of Investments | | | 12 | | |
|
| Statement of Assets and Liabilities | | | 36 | | |
|
| Statement of Operations | | | 37 | | |
|
| Statements of Changes in Net Assets | | | 38 | | |
|
| Notes to Financial Statements | | | 39 | | |
|
| Financial Highlights | | | 55 | | |
|
| U.S. Privacy Policy | | | 61 | | |
|
2
Welcome Shareholder,
We are pleased to provide this semiannual report, in which you will learn how your investment in Morgan Stanley International Fund performed during the latest six-month period. It includes an overview of the market conditions and discusses some of the factors that affected performance during the reporting period. In addition, the report contains financial statements and a list of portfolio holdings.
Morgan Stanley Investment Management is a client-centric, investor-led organization. Our global presence, intellectual capital, and breadth of products and services enable us to partner with investors to meet the evolving challenges of today's financial markets. We aim to deliver superior investment service and to empower our clients to make the informed decisions that help them reach their investment goals.
As always, we thank you for selecting Morgan Stanley Investment Management, and look forward to working with you in the months and years ahead.
This material must be preceded or accompanied by a prospectus for the fund being offered.
Market forecasts provided in this report may not necessarily come to pass. There is no assurance that the Fund will achieve its investment objective. The Fund is subject to market risk, which is the possibility that market values of securities owned by the Fund will decline and, therefore, the value of the Fund's shares may be less than what you paid for them. Accordingly, you can lose money investing in this Fund. Please see the prospectus for more complete information on investment risks.
3
Fund Report (unaudited)
For the six months ended April 30, 2012
| Total Return for the 6 Months Ended April 30, 2012 | |
| Class A | | Class B | | Class C | | Class I | | Class R | | Class W | | MSCI
EAFE
Index1 | | Lipper
International
Large-
Cap Core
Funds Index2 | |
| | 2.61 | % | | | 2.27 | % | | | 2.19 | % | | | 2.75 | % | | | 2.53 | % | | | 2.54 | % | | | 2.44 | % | | | 3.77 | % | |
The performance of the Fund's six share classes varies because each has different expenses. The Fund's total returns assume the reinvestment of all distributions but do not reflect the deduction of any applicable sales charges. Such costs would lower performance. See Performance Summary for standardized performance and benchmark information.
Market Conditions
For the six-month period ended April 30, 2012 the MSCI EAFE Index (the "Index") returned 2.44 percent. On a regional basis, the U.K. was up 6 percent, Japan and Asia ex-Japan were each up 4 percent, and Europe ex-U.K. was down 1 percent (based on MSCI regional indices). Sector performance within the Index was led by consumer discretionary (up 8 percent), consumer staples and health care (each up 7 percent), while telecommunications (down 8 percent), utilities (down 5 percent) and technology (down 1 percent) were the weakest performers.
Equity markets were volatile but moved higher for this six-month period and stocks entered April near their highs for this period. Mixed global economic data and political uncertainty in Europe were the main drivers of equity market performance. In Europe, the European Central Bank's long-term refinancing operations (LTRO) and decent January and February economic data had provided some respite from last year's panic, but weaker April data has renewed investor concerns. The composite eurozone purchasing managers index (PMI) is now at 46.7, as of April 2012, the lowest level since last October. Admittedly, the aggregate picture masks big divergences between the "core" and the "periphery" countries, but even the German economy shed more jobs in April than in any other month since 2009. In Spain, the surprise bailout of the country's third largest bank by assets, Bankia, put a dent in confidence in the announcements of the Spanish authorities. Just last summer regulators allowed Bankia to list as a public company for the first time — and this time last month, all were denying the need for additional state funding for Spanish banks.
European politics are heating up again. In Greece, the radical anti-austerity party came in second in the May elections — and it is unclear if a government can form without calling new elections in June/July. Even if one dismisses Greece as too small to make an impact, this would increase the odds that Greece will have to leave the eurozone — and no one knows if extraction from the eurozone can be orderly. In France, recently elected socialist President Hollande will need to meet fiscal targets, agree with Germany on key features of the European Monetary Union structure, and secure a viable
4
long-term growth model for France. Time is running out — as may patience in Germany.
Spanish, Italian, and French growth continued to struggle under fiscal austerity. We expect Spain, in particular, to weaken throughout 2012. Spanish construction activity would need to see further declines in order to unwind the country's housing bubble, and Spain still has a large fiscal deficit to close (8.5 percent of Gross Domestic Product (GDP)). While the French deficit is not as daunting (5.1 percent of GDP in 2011), French labor competitiveness needs to improve. Thus, we believe income growth is likely to lag productivity growth in the medium term, although a high French household savings rate (13.5 percent) can help cushion the adjustment.
Although the U.S. manufacturing PMI survey continued to trend higher, most other U.S. data disappointed in April and the first quarter 2012 GDP number came in at only 1.5 percent. Total non-farm income (jobs, earnings, and hours) has now been roughly flat for two months in a row, indicating little nominal growth in consumer spending power, and March durable goods orders unexpectedly declined month over month. New residential construction fell for the second month in a row in March, dampening hopes that U.S. residential construction will pick up in response to an improving household formation rate. However, tentative signs of a pick-up in home purchases — and recent oil/gasoline price drops — add to the continued rise in U.S. consumer confidence.
A looming concern is the so-called U.S. "fiscal cliff" scheduled in 2013. Uncertainty as to how U.S. fiscal policy will affect economic and market sentiment in the second half of the year is very high. While the most bearish estimates for the 2013 fiscal impact exceed 4 percent of GDP, many people we follow believe that the fiscal drag will settle in the range of 1 percent of GDP (similar to this year). However, as the U.S. presidential election campaign gears up in late summer/early fall, policy uncertainty will most likely rise, along with divisive political rhetoric.
While Japanese growth was fairly solid through April, deflationary pressures continued and the hope for reconstruction-driven economic momentum has not developed. Optimism over the Bank of Japan's (BOJ) balance sheet expansion fueled yen weakness and Japanese equity outperformance in February and March. However, the BOJ disappointed market expectations for more rapid, large-scale asset purchases at its April meeting. As we head into the summer, Japan faces uncertainty as to how nuclear power capacity will be reactivated in time for peak electricity demand. The country may also face fiscal tightening next year (with tax increases to pay for earthquake rebuilding) and a proposed value-added tax increase in 2014.
Thus far, China has defied bearish skeptics. First quarter GDP growth was roughly 8 percent, despite continued weakness in residential real estate sales and depressed industrial profitability (profits down 5 percent year-over-year in February and 1.5 percent year-over-year in March). The Chinese manufacturing PMI index appears to have bottomed in the fourth quarter of last year (around 49) and has trended higher since (currently at 53.3). While residential construction activity is likely to
5
slow from here with a lag to sales, the Chinese government can increase infrastructure investment after virtually no growth in spending last year. There have also been some signs of incremental policy easing, as mortgage rates are falling for first-time buyers. While we expect slowing construction to cap the pace of any Chinese recovery, it does not appear that the bear case for Chinese growth is playing out.
Performance Analysis
Morgan Stanley International Fund Class A, Class I, Class R, and Class W shares outperformed and Class B and Class C shares underperformed the MSCI EAFE Index (the "Index"), and all share classes underperformed the Lipper International Large-Cap Core Funds Index for the six months ended April 30, 2012, assuming no deduction of applicable sales charges.
Regionally, the portfolio's overweight to Japan and the allocation to emerging markets (average balance over the period of about 5 percent) contributed to relative performance, while the underweight to Europe detracted from performance. Sector positions that added to portfolio performance were underweight positions in utilities and financials and an above-benchmark allocation to industrials. Overweight positions to technology and materials dampened relative results.
The Fund utilized stock index futures and currency forward contracts as additional vehicles to implement the portfolio manager's macro investment decisions. For the six-month period, stock index futures contributed to portfolio performance, while currency forward positions were a net detractor.
Overall, the portfolio is tilted cautiously, but we do not expect to position for a major market decline unless news from Europe (or China) worsens precipitously. For now, we are maintaining a portfolio beta marginally below one. We are still underweight Europe as we expect eurozone economies to underperform with fiscal austerity and bank deleveraging; however, we are mindful that European valuations are inexpensive and that European growth prospects may bottom sometime this year. Overall, we are looking for better visibility on U.S. fiscal plans, stabilization of European growth prospects and politics, or cheaper equity valuations to become more bullish.
There is no guarantee that any sectors mentioned will continue to perform as discussed herein or that securities in such sectors will be held by the Fund in the future.
| TOP 10 HOLDINGS+ as of 04/30/12 | |
| Nestle SA (Registered) | | | 2.2 | % | |
| HSBC Holdings PLC | | | 2.0 | | |
| Vodafone Group PLC | | | 1.7 | | |
| Royal Dutch Shell PLC, Class A | | | 1.3 | | |
| Siemens AG (Registered) | | | 1.3 | | |
| Novartis AG (Registered) | | | 1.3 | | |
| Roche Holding AG (Genusschein) | | | 1.3 | | |
| GlaxoSmithKline PLC | | | 1.2 | | |
| Royal Dutch Shell PLC, Class B | | | 1.0 | | |
| BP PLC | | | 0.9 | | |
6
| TOP FIVE COUNTRIES as of 04/30/12 | |
| United Kingdom | | | 22.4 | % | |
| Japan | | | 20.9 | | |
| Switzerland | | | 8.3 | | |
| Germany | | | 6.5 | | |
| France | | | 4.9 | | |
+ Does not include open long futures contracts with an underlying face amount of $12,230,750 with net unrealized depreciation of $48,896 and open foreign currency exchange contracts with net unrealized appreciation of $77,418.
Subject to change daily. Provided for informational purposes only and should not be deemed as a recommendation to buy or sell the securities mentioned above. Top 10 holdings and top five countries are as a percentage of net assets. Morgan Stanley is a full-service securities firm engaged in securities trading and brokerage activities, investment banking, research and analysis, financing and financial advisory services.
Investment Strategy
The Fund will normally invest at least 65 percent of its assets in a diversified portfolio of international common stocks and other equity securities. The Fund's "Adviser," Morgan Stanley Investment Management Inc., uses a "top-down" approach that emphasizes region, country, sector and industry selection and weightings over individual stock selection.
For More Information About Portfolio Holdings
Each Morgan Stanley fund provides a complete schedule of portfolio holdings in its semiannual and annual reports within 60 days of the end of the fund's second and fourth fiscal quarters. The semiannual reports and the annual reports are filed electronically with the Securities and Exchange Commission (SEC) on Form N-CSRS and Form N-CSR, respectively. Morgan Stanley also delivers the semiannual and annual reports to fund shareholders and makes these reports available on its public web site, www.morganstanley.com. Each Morgan Stanley fund also files a complete schedule of portfolio holdings with the SEC for the fund's first and third fiscal quarters on Form N-Q. Morgan Stanley does not deliver the reports for the first and third fiscal quarters to shareholders, nor are the reports posted to the Morgan Stanley public web site. You may, however, obtain the Form N-Q filings (as well as the Form N-CSR and N-CSRS filings) by accessing the SEC's web site, http://www.sec.gov. You may also review and copy them at the SEC's public reference room in Washington, DC. Information on the operation of the SEC's public reference room may be obtained by calling the SEC at (800) SEC-0330. You can also request copies of these materials, upon payment of a duplicating fee, by
7
electronic request at the SEC's e-mail address (publicinfo@sec.gov) or by writing the public reference section of the SEC, Washington, DC 20549-1520.
Proxy Voting Policy and Procedures and Proxy Voting Record
You may obtain a copy of the Fund's Proxy Voting Policy and Procedures without charge, upon request, by calling toll free (800) 869-NEWS or by visiting the Mutual Fund Center on our web site at www.morganstanley.com. It is also available on the SEC's web site at http://www.sec.gov.
You may obtain information regarding how the Fund voted proxies relating to portfolio securities during the most recent twelve-month period ended June 30 without charge by visiting the Mutual Fund Center on our web site at www.morganstanley.com. This information is also available on the SEC's web site at http://www.sec.gov.
Householding Notices
To reduce printing and mailing costs, the Fund attempts to eliminate duplicate mailings to the same address. The Fund delivers a single copy of certain shareholder documents, including shareholder reports, prospectuses and proxy materials, to investors with the same last name who reside at the same address. Your participation in this program will continue for an unlimited period of time unless you instruct us otherwise. You can request multiple copies of these documents by calling (800) 869-NEWS, 8:00 a.m. to 8:00 p.m., ET. Once our Customer Service Center has received your instructions, we will begin sending individual copies for each account within 30 days.
8
Performance Summary (unaudited)
| Average Annual Total Returns—Period Ended April 30, 2012 | |
| Symbol | | Class A Shares*
(since 06/28/99)
INLAX | | Class B Shares**
(since 06/28/99)
INLBX | | Class C Shares†
(since 06/28/99)
INLCX | | Class I Shares††
(since 06/28/99)
INLDX | | Class R Shares#
(since 03/31/08)
INLRX | | Class W Shares##
(since 03/31/08)
INLWX | |
| 1 Year | | | –15.51
–19.93 4 | %3 | | | –16.08
–20.28 4 | %3 | | | –16.15
–16.99 4 | %3 | | | –15.28
— | %3 | | | –15.66
— | %3 | | | –15.61
— | %3 | |
| 5 Years | | | –4.11 3
–5.13 4 | | | | –4.81 3
–5.18 4 | | | | –4.82 3
–4.82 4 | | | | –3.86 3
— | | | | —
— | | | | —
— | | |
| 10 Years | | | 4.81 3
4.24 4 | | | | 4.16 3
4.16 4 | | | | 4.02 3
4.02 4 | | | | 5.05 3
— | | | | —
— | | | | —
— | | |
Since
Inception | | | 2.53 3
2.10 4 | | | | 2.02 3
2.02 4 | | | | 1.75 3
1.75 4 | | | | 2.76 3
— | | | | –4.47 3
— | | | | –4.35 3
— | | |
Gross
Expense Ratio | | |
1.58 | | | |
2.33 | | | |
2.32 | | | |
1.33 | | | |
1.83 | | | |
1.68 | | |
Performance data quoted represents past performance, which is no guarantee of future results and current performance may be lower or higher than the figures shown. For most recent month-end performance figures, please visit www.morganstanley.com/im or speak with your Financial Advisor. Investment returns and principal value will fluctuate and fund shares, when redeemed, may be worth more or less than their original cost. The table does not reflect the deduction of taxes that a shareholder would pay on fund distributions or the redemption of fund shares. Performance for Class A, Class B, Class C, Class I, Class R, and Class W shares will vary due to differences in sales charges and expenses. See the Fund's current prospectus for complete details on fees and sales charges. Expense ratios are as of each Fund's fiscal year end as outlined in the Fund's current prospectus.
* The maximum front-end sales charge for Class A is 5.25%.
** The maximum contingent deferred sales charge (CDSC) for Class B is 5.0%. The CDSC declines to 0% after six years. Effective April 2005, Class B shares will generally convert to Class A shares approximately eight years after the end of the calendar month in which the shares were purchased. Performance for periods greater than eight years reflects this conversion.
† The maximum contingent deferred sales charge for Class C is 1.0% for shares redeemed within one year of purchase.
†† Class I has no sales charge.
# Class R has no sales charge.
## Class W has no sales charge.
(1) The Morgan Stanley Capital International (MSCI) EAFE Index (Europe, Australasia, Far East) is a free float-adjusted market capitalization index that is designed to measure the international equity market performance of developed markets, excluding the US & Canada. The term "free float" represents the portion of shares outstanding that are deemed to be available for purchase in the public equity markets by investors. The MSCI EAFE Index currently consists of 22 developed market country indices. The performance of the Index is listed in U.S. dollars and assumes reinvestment of net dividends. "Net dividends" reflects a reduction in dividends after taking into account withholding of taxes by certain foreign countries represented in the Index. The Index is unmanaged and its returns do not include any sales charges or fees. Such costs would lower performance. It is not possible to invest directly in an index.
(2) The Lipper International Large-Cap Core Funds Index is an equally weighted performance index of the largest qualifying funds (based on net assets) in the Lipper International Large-Cap Core Funds classification. The Index, which is adjusted for capital gains distributions and income dividends, is unmanaged and should not be considered an investment. There are currently 30 funds represented in this Index. The Fund was in the Lipper International Large-Cap Core Funds classification as of the date of this report.
(3) Figure shown assumes reinvestment of all distributions and does not reflect the deduction of any sales charges.
(4) Figure shown assumes reinvestment of all distributions and the deduction of the maximum applicable sales charge. See the Fund's current prospectus for complete details on fees and sales charges.
9
Expense Example (unaudited)
As a shareholder of the Fund, you incur two types of costs: (1) transaction costs, including sales charges (loads) on purchase payments and redemption fees; and (2) ongoing costs, including advisory fees; distribution and service (12b-1) fees; and other Fund expenses. This example is intended to help you understand your ongoing costs (in dollars) of investing in the Fund and to compare these costs with the ongoing costs of investing in other mutual funds.
The example is based on an investment of $1,000 invested at the beginning of the period and held for the entire period 11/01/11 – 04/30/12.
Actual Expenses
The first line of the table below provides information about actual account values and actual expenses. You may use the information in this line, together with the amount you invested, to estimate the expenses that you paid over the period. Simply divide your account value by $1,000 (for example, an $8,600 account value divided by $1,000 = 8.6), then multiply the result by the number in the first line under the heading entitled "Expenses Paid During Period" to estimate the expenses you paid on your account during this period.
Hypothetical Example for Comparison Purposes
The second line of the table below provides information about hypothetical expenses based on the Fund's actual expense ratio and an assumed rate of return of 5% per year before expenses, which is not the Fund's actual return. The hypothetical account values and expenses may not be used to estimate the actual ending account balance or expenses you paid for the period. You may use this information to compare the ongoing cost of investing in the Fund and other funds. To do so, compare this 5% hypothetical example with the 5% hypothetical examples that appear in the shareholder reports of the other funds.
Please note that the expenses shown in the table are meant to highlight your ongoing costs only and do not reflect any transactional costs, such as sales charges (loads) and redemption fees. Therefore, the second line of the table is useful in comparing ongoing costs, and will not help you determine the relative total cost of owning different funds. In addition, if these transactional costs were included, your costs would have been higher.
| | | Beginning
Account Value | | Ending
Account Value | | Expenses Paid
During Period@ | |
| | | 11/01/11 | | 04/30/12 | | 11/01/11 –
04/30/12 | |
| Class A | |
| Actual (2.61% return) | | $ | 1,000.00 | | | $ | 1,026.10 | | | $ | 8.56 | | |
| Hypothetical (5% annual return before expenses) | | $ | 1,000.00 | | | $ | 1,016.41 | | | $ | 8.52 | | |
| Class B | |
| Actual (2.27% return) | | $ | 1,000.00 | | | $ | 1,022.70 | | | $ | 12.32 | | |
| Hypothetical (5% annual return before expenses) | | $ | 1,000.00 | | | $ | 1,012.68 | | | $ | 12.26 | | |
| Class C | |
| Actual (2.19% return) | | $ | 1,000.00 | | | $ | 1,021.90 | | | $ | 12.27 | | |
| Hypothetical (5% annual return before expenses) | | $ | 1,000.00 | | | $ | 1,012.73 | | | $ | 12.21 | | |
| Class I | |
| Actual (2.75% return) | | $ | 1,000.00 | | | $ | 1,027.50 | | | $ | 7.31 | | |
| Hypothetical (5% annual return before expenses) | | $ | 1,000.00 | | | $ | 1,017.65 | | | $ | 7.27 | | |
10
Expense Example (unaudited) continued
| | | Beginning
Account Value | | Ending
Account Value | | Expenses Paid
During Period@ | |
| | | 11/01/11 | | 04/30/12 | | 11/01/11 –
04/30/12 | |
| Class R | |
| Actual (2.53% return) | | $ | 1,000.00 | | | $ | 1,025.30 | | | $ | 9.82 | | |
| Hypothetical (5% annual return before expenses) | | $ | 1,000.00 | | | $ | 1,015.17 | | | $ | 9.77 | | |
| Class W | |
| Actual (2.54% return) | | $ | 1,000.00 | | | $ | 1,025.40 | | | $ | 9.06 | | |
| Hypothetical (5% annual return before expenses) | | $ | 1,000.00 | | | $ | 1,015.91 | | | $ | 9.02 | | |
@ Expenses are equal to the Fund's annualized expense ratios of 1.70%, 2.45%, 2.44%, 1.45%, 1.95%, and 1.80% for Class A, Class B, Class C, Class I, Class R, and Class W shares, respectively, multiplied by the average account value over the period, multiplied by 182/366 (to reflect the one-half year period). If the Fund had borne all of its expenses, the annualized expense ratios would have been 1.72%, 2.47%, 2.46%, 1.47%, 1.97%, and 1.82% for Class A, Class B, Class C, Class I, Class R and Class W shares, respectively.
11
Morgan Stanley International Fund
Portfolio of Investments n April 30, 2012 (unaudited)
NUMBER OF
SHARES | |
| | VALUE | |
| | | Common Stocks (86.4%) | |
| | | Australia (3.9%) | |
| | | Beverages | |
| | 970 | | | Coca-Cola Amatil Ltd. | | $ | 12,583 | | |
| | | Biotechnology | |
| | 511 | | | CSL Ltd. | | | 19,519 | | |
| | | Capital Markets | |
| | 2,338 | | | Macquarie Group Ltd. | | | 71,158 | | |
| | | Chemicals | |
| | 1,659 | | | DuluxGroup Ltd. (a) | | | 5,359 | | |
| | 7,133 | | | Incitec Pivot Ltd. | | | 24,303 | | |
| | 1,537 | | | Orica Ltd. | | | 43,032 | | |
| | | | 72,694 | | |
| | | Commercial Banks | |
| | 29,630 | | | Australia & New Zealand
Banking Group Ltd. | | | 738,173 | | |
| | 8,839 | | | Commonwealth Bank of
Australia (a) | | | 478,633 | | |
| | 12,157 | | | National Australia Bank Ltd. (a) | | | 319,588 | | |
| | 15,622 | | | Westpac Banking Corp. (a) | | | 369,984 | | |
| | | | 1,906,378 | | |
| | | Commercial Services &
Supplies | |
| | 1,772 | | | Brambles Ltd. | | | 13,349 | | |
| | | Construction & Engineering | |
| | 425 | | | Leighton Holdings Ltd. (a) | | | 9,118 | | |
| | | Construction Materials | |
| | 5,666 | | | Boral Ltd. (a) | | | 22,316 | | |
| | 2,078 | | | James Hardie Industries
SE CDI | | | 16,217 | | |
| | | | 38,533 | | |
| | | Containers & Packaging | |
| | 5,247 | | | Amcor Ltd. | | | 41,113 | | |
| | | Diversified Financial Services | |
| | 1,012 | | | ASX Ltd. | | | 33,743 | | |
| | | Diversified Telecommunication
Services | |
| | 3,853 | | | Telstra Corp., Ltd. | | | 14,212 | | |
NUMBER OF
SHARES | |
| | VALUE | |
| | | Food & Staples Retailing | |
| | 733 | | | Wesfarmers Ltd. | | $ | 23,126 | | |
| | 1,629 | | | Woolworths Ltd. | | | 44,029 | | |
| | | | 67,155 | | |
| | | Health Care Providers &
Services | |
| | 310 | | | Sonic Healthcare Ltd. | | | 4,073 | | |
| | | Hotels, Restaurants & Leisure | |
| | 838 | | | Echo Entertainment
Group Ltd. | | | 3,929 | | |
| | 859 | | | TABCORP Holdings Ltd. | | | 2,569 | | |
| | | | 6,498 | | |
| | | Insurance | |
| | 18,551 | | | AMP Ltd. | | | 82,535 | | |
| | 15,201 | | | Insurance Australia Group Ltd. | | | 56,069 | | |
| | 7,173 | | | QBE Insurance Group Ltd. | | | 103,439 | | |
| | 8,235 | | | Suncorp Group Ltd. | | | 69,845 | | |
| | | | 311,888 | | |
| | | Metals & Mining | |
| | 11,591 | | | Alumina Ltd. | | | 14,010 | | |
| | 13,067 | | | BHP Billiton Ltd. | | | 484,019 | | |
| | 5,072 | | | Fortescue Metals Group
Ltd. (a) | | | 29,806 | | |
| | 2,994 | | | Newcrest Mining Ltd. | | | 82,045 | | |
| | 1,561 | | | OZ Minerals Ltd. | | | 15,175 | | |
| | 1,817 | | | Rio Tinto Ltd. | | | 125,615 | | |
| | 1,930 | | | Sims Metal Management
Ltd. (a) | | | 28,596 | | |
| | | | 779,266 | | |
| | | Multi-Utilities | |
| | 898 | | | AGL Energy Ltd. | | | 14,016 | | |
| | | Oil, Gas & Consumable Fuels | |
| | 773 | | | Caltex Australia Ltd. | | | 11,091 | | |
| | 1,594 | | | Origin Energy Ltd. | | | 22,023 | | |
| | 916 | | | Santos Ltd. | | | 13,381 | | |
| | 840 | | | Woodside Petroleum Ltd. | | | 30,563 | | |
| | | | 77,058 | | |
See Notes to Financial Statements
12
Morgan Stanley International Fund
Portfolio of Investments n April 30, 2012 (unaudited) continued
NUMBER OF
SHARES | |
| | VALUE | |
| | | Real Estate Investment Trusts
(REITs) | |
| | 13,129 | | | GPT Group REIT (Stapled
Securities) (b) | | $ | 44,733 | | |
| | 21,898 | | | Stockland REIT (Stapled
Securities) (b)(c) | | | 70,731 | | |
| | 12,064 | | | Westfield Group REIT (Stapled
Securities) (b)(c) | | | 116,148 | | |
| | 21,100 | | | Westfield Retail Trust REIT | | | 59,800 | | |
| | | | 291,412 | | |
| | | Transportation Infrastructure | |
| | 1,444 | | | Transurban Group (Stapled
Securities) (b) | | | 8,832 | | |
| | | | | Total Australia | | | 3,792,598 | | |
| | | Austria (0.6%) | |
| | | Commercial Banks | |
| | 6,084 | | | Erste Group Bank AG | | | 140,089 | | |
| | 1,761 | | | Raiffeisen Bank International
AG (a) | | | 58,474 | | |
| | | | 198,563 | | |
| | | Diversified Telecommunication
Services | |
| | 8,075 | | | Telekom Austria AG | | | 88,568 | | |
| | | Electric Utilities | |
| | 1,397 | | | Verbund AG | | | 39,102 | | |
| | | Insurance | |
| | 946 | | | Vienna Insurance Group AG
Wiener Versicherung Gruppe | | | 38,568 | | |
| | | Metals & Mining | |
| | 3,006 | | | Voestalpine AG | | | 97,307 | | |
| | | Oil, Gas & Consumable Fuels | |
| | 2,528 | | | OMV AG (a) | | | 85,582 | | |
| | | | | Total Austria | | | 547,690 | | |
| | | Belgium (0.8%) | |
| | | Beverages | |
| | 5,360 | | | Anheuser-Busch InBev N.V. (a) | | | 386,324 | | |
NUMBER OF
SHARES | |
| | VALUE | |
| | 2,742 | | | Anheuser-Busch InBev N.V.
VVPR (d) | | $ | 4 | | |
| | | | 386,328 | | |
| | | Chemicals | |
| | 673 | | | Solvay SA, Class A | | | 81,896 | | |
| | 1,595 | | | Umicore SA | | | 86,553 | | |
| | | | 168,449 | | |
| | | Diversified Financial Services | |
| | 1,305 | | | Groupe Bruxelles Lambert
SA (a) | | | 90,534 | | |
| | | Diversified Telecommunication
Services | |
| | 1,786 | | | Belgacom SA (a) | | | 50,734 | | |
| | | Electrical Equipment | |
| | 426 | | | NV Bekaert SA | | | 12,620 | | |
| | | Insurance | |
| | 5,238 | | | Ageas (a) | | | 9,534 | | |
| | | Pharmaceuticals | |
| | 1,255 | | | UCB SA (a) | | | 58,617 | | |
| | | Wireless Telecommunication
Services | |
| | 297 | | | Mobistar SA | | | 11,232 | | |
| | | | | Total Belgium | | | 788,048 | | |
| | | Brazil (0.6%) | |
| | | Aerospace & Defense | |
| | 600 | | | Embraer SA | | | 5,175 | | |
| | | Beverages | |
| | 800 | | | Cia de Bebidas das Americas | | | 33,697 | | |
| | | Commercial Banks | |
| | 2,021 | | | Banco Bradesco SA
(Preference) | | | 32,475 | | |
| | 3,200 | | | Banco do Brasil SA | | | 39,586 | | |
| | 800 | | | Banco Santander Brasil SA
(Units) (c) | | | 6,522 | | |
| | 2,378 | | | Itau Unibanco Holding SA
(Preference) | | | 37,426 | | |
See Notes to Financial Statements
13
Morgan Stanley International Fund
Portfolio of Investments n April 30, 2012 (unaudited) continued
NUMBER OF
SHARES | |
| | VALUE | |
| | 4,459 | | | Itausa - Investimentos Itau SA
(Preference) | | $ | 21,194 | | |
| | | | 137,203 | | |
| | | Diversified Financial Services | |
| | 1,900 | | | BM&F Bovespa SA | | | 10,685 | | |
| | | Diversified Telecommunication
Services | |
| | 1,168 | | | Oi SA | | | 7,041 | | |
| | 349 | | | Telefonica Brasil SA
(Preference) | | | 9,960 | | |
| | | | 17,001 | | |
| | | Electric Utilities | |
| | 1,032 | | | Cia Energetica de Minas Gerais
(Preference) | | | 20,454 | | |
| | | Food & Staples Retailing | |
| | 120 | | | Cia Brasileira de Distribuicao
Grupo Pao de Acucar | | | 5,571 | | |
| | | Food Products | |
| | 5,228 | | | BRF - Brasil Foods SA | | | 95,583 | | |
| | | Information Technology
Services | |
| | 360 | | | Cielo SA | | | 10,803 | | |
| | 400 | | | Redecard SA | | | 6,736 | | |
| | | | 17,539 | | |
| | | Metals & Mining | |
| | 368 | | | Bradespar SA (Preference) | | | 6,738 | | |
| | 1,100 | | | Cia Siderurgica Nacional SA | | | 9,435 | | |
| | 659 | | | Gerdau SA (Preference) | | | 6,195 | | |
| | 1,957 | | | Vale SA (Preference) | | | 42,556 | | |
| | 1,300 | | | Vale SA | | | 29,053 | | |
| | | | 93,977 | | |
| | | Oil, Gas & Consumable Fuels | |
| | 1,600 | | | OGX Petroleo e Gas
Participacoes SA (d) | | | 11,105 | | |
| | 2,900 | | | Petroleo Brasileiro SA | | | 34,064 | | |
| | 4,122 | | | Petroleo Brasileiro SA
(Preference) | | | 46,039 | | |
NUMBER OF
SHARES | |
| | VALUE | |
| | 400 | | | Ultrapar Participacoes SA | | $ | 9,087 | | |
| | | | 100,295 | | |
| | | Real Estate Management &
Development | |
| | 500 | | | BR Malls Participacoes SA | | | 6,212 | | |
| | | Road & Rail | |
| | 3,200 | | | All America Latina Logistica SA
(Units) (c) | | | 14,572 | | |
| | | Tobacco | |
| | 500 | | | Souza Cruz SA | | | 7,788 | | |
| | | Transportation Infrastructure | |
| | 1,100 | | | CCR SA | | | 8,541 | | |
| | | Water Utilities | |
| | 200 | | | Cia de Saneamento Basico do
Estado de Sao Paulo | | | 7,853 | | |
| | | | | Total Brazil | | | 582,146 | | |
| | | Canada (0.7%) | |
| | | Metals & Mining | |
| | 900 | | | Agnico-Eagle Mines Ltd. | | | 35,951 | | |
| | 5,300 | | | Barrick Gold Corp. | | | 214,393 | | |
| | 900 | | | Centerra Gold, Inc. | | | 11,653 | | |
| | 3,000 | | | Eldorado Gold Corp. | | | 42,516 | | |
| | 700 | | | Franco-Nevada Corp. | | | 31,398 | | |
| | 4,200 | | | Goldcorp, Inc. | | | 160,840 | | |
| | 2,000 | | | IAMGOLD Corp. | | | 24,801 | | |
| | 6,100 | | | Kinross Gold Corp. | | | 54,649 | | |
| | 2,400 | | | New Gold, Inc. (Units) (c)(d) | | | 21,866 | | |
| | 1,900 | | | Osisko Mining Corp. (d) | | | 19,561 | | |
| | 4,100 | | | Yamana Gold, Inc. | | | 60,140 | | |
| | | | | Total Canada | | | 677,768 | | |
| | | China (0.0%) | |
| | | Household Durables | |
| | 58 | | | Skyworth Digital Holdings
Ltd. (e) | | | 24 | | |
See Notes to Financial Statements
14
Morgan Stanley International Fund
Portfolio of Investments n April 30, 2012 (unaudited) continued
NUMBER OF
SHARES | |
| | VALUE | |
| | | Transportation Infrastructure | |
| | 1 | | | China Merchants Holdings
International Co., Ltd. (e) | | $ | 3 | | |
| | | | | Total China | | | 27 | | |
| | | Denmark (1.3%) | |
| | | Chemicals | |
| | 5,165 | | | Novozymes A/S, Series B | | | 135,462 | | |
| | | Diversified Telecommunication
Services | |
| | 3,974 | | | TDC A/S | | | 28,496 | | |
| | | Electrical Equipment | |
| | 2,332 | | | Vestas Wind Systems A/S (d) | | | 20,585 | | |
| | | Marine | |
| | 24 | | | AP Moller - Maersk A/S,
Class B | | | 187,723 | | |
| | | Pharmaceuticals | |
| | 5,598 | | | Novo Nordisk A/S, Class B | | | 825,725 | | |
| | | Road & Rail | |
| | 2,395 | | | DSV A/S | | | 54,546 | | |
| | | | | Total Denmark | | | 1,252,537 | | |
| | | Finland (1.0%) | |
| | | Communications Equipment | |
| | 55,483 | | | Nokia Oyj | | | 199,324 | | |
| | | Diversified Telecommunication
Services | |
| | 1,306 | | | Elisa Oyj (a) | | | 29,458 | | |
| | | Electric Utilities | |
| | 6,044 | | | Fortum Oyj | | | 130,007 | | |
| | | Food & Staples Retailing | |
| | 2,234 | | | Kesko Oyj, Class B | | | 59,675 | | |
| | | Insurance | |
| | 3,993 | | | Sampo Oyj, Class A | | | 106,239 | | |
| | | Machinery | |
| | 1,639 | | | Kone Oyj, Class B | | | 101,426 | | |
| | 2,394 | | | Metso Oyj | | | 102,674 | | |
NUMBER OF
SHARES | |
| | VALUE | |
| | 1,566 | | | Wartsila Oyj | | $ | 63,390 | | |
| | | | 267,490 | | |
| | | Oil, Gas & Consumable Fuels | |
| | 2,667 | | | Neste Oil Oyj | | | 31,526 | | |
| | | Paper & Forest Products | |
| | 6,572 | | | Stora Enso Oyj, Class R | | | 44,802 | | |
| | 7,711 | | | UPM-Kymmene Oyj (a) | | | 98,702 | | |
| | | | 143,504 | | |
| | | | | Total Finland | | | 967,223 | | |
| | | France (4.9%) | |
| | | Aerospace & Defense | |
| | 1,139 | | | European Aeronautic Defense
and Space Co. N.V. (a) | | | 44,967 | | |
| | 851 | | | Safran SA | | | 31,541 | | |
| | 656 | | | Thales SA | | | 22,729 | | |
| | | | 99,237 | | |
| | | Auto Components | |
| | 812 | | | Cie Generale des
Etablissements Michelin,
Class B | | | 60,643 | | |
| | | Automobiles | |
| | 1,662 | | | Peugeot SA | | | 19,954 | | |
| | 840 | | | Renault SA | | | 38,166 | | |
| | | | 58,120 | | |
| | | Beverages | |
| | 413 | | | Pernod-Ricard SA | | | 42,866 | | |
| | | Building Products | |
| | 1,158 | | | Cie de St-Gobain | | | 48,507 | | |
| | | Chemicals | |
| | 1,314 | | | Air Liquide SA | | | 169,012 | | |
| | | Commercial Banks | |
| | 4,527 | | | BNP Paribas SA | | | 181,869 | | |
| | 4,897 | | | Credit Agricole SA | | | 25,170 | | |
| | 2,524 | | | Societe Generale SA | | | 59,671 | | |
| | | | 266,710 | | |
See Notes to Financial Statements
15
Morgan Stanley International Fund
Portfolio of Investments n April 30, 2012 (unaudited) continued
NUMBER OF
SHARES | |
| | VALUE | |
| | | Commercial Services &
Supplies | |
| | 1,030 | | | Edenred | | $ | 32,899 | | |
| | 218 | | | Societe BIC SA | | | 24,012 | | |
| | | | 56,911 | | |
| | | Communications Equipment | |
| | 13,164 | | | Alcatel-Lucent (d) | | | 20,283 | | |
| | | Construction & Engineering | |
| | 3,937 | | | Bouygues SA (a) | | | 106,938 | | |
| | 2,587 | | | Vinci SA | | | 119,855 | | |
| | | | 226,793 | | |
| | | Construction Materials | |
| | 340 | | | Imerys SA | | | 19,325 | | |
| | 2,495 | | | Lafarge SA (a) | | | 97,279 | | |
| | | | 116,604 | | |
| | | Diversified Financial Services | |
| | 301 | | | Eurazeo | | | 15,425 | | |
| | | Diversified Telecommunication
Services | |
| | 7,818 | | | France Telecom SA | | | 106,953 | | |
| | 5,870 | | | Vivendi SA | | | 108,510 | | |
| | | | 215,463 | | |
| | | Electric Utilities | |
| | 714 | | | Electricite de France SA | | | 15,108 | | |
| | | Electrical Equipment | |
| | 3,868 | | | Alstom SA | | | 138,140 | | |
| | 3,066 | | | Schneider Electric SA (d) | | | 188,353 | | |
| | | | 326,493 | | |
| | | Energy Equipment & Services | |
| | 3,712 | | | Cie Generale de
Geophysique-Veritas (d) | | | 105,691 | | |
| | 1,559 | | | Technip SA | | | 176,297 | | |
| | | | 281,988 | | |
| | | Food & Staples Retailing | |
| | 3,825 | | | Carrefour SA | | | 76,834 | | |
NUMBER OF
SHARES | |
| | VALUE | |
| | 479 | | | Casino Guichard Perrachon
SA (d) | | $ | 47,040 | | |
| | | | 123,874 | | |
| | | Food Products | |
| | 3,938 | | | Danone | | | 277,057 | | |
| | | Health Care Equipment &
Supplies | |
| | 967 | | | Cie Generale d'Optique Essilor
International SA | | | 85,172 | | |
| | | Hotels, Restaurants & Leisure | |
| | 1,030 | | | Accor SA | | | 35,578 | | |
| | 564 | | | Sodexo | | | 44,914 | | |
| | | | 80,492 | | |
| | | Information Technology
Services | |
| | 361 | | | Atos | | | 23,250 | | |
| | 929 | | | Cap Gemini SA | | | 36,264 | | |
| | | | 59,514 | | |
| | | Insurance | |
| | 6,804 | | | AXA SA (d) | | | 96,369 | | |
| | 2,004 | | | CNP Assurances | | | 28,119 | | |
| | 1,759 | | | SCOR SE | | | 46,509 | | |
| | | | 170,997 | | |
| | | Machinery | |
| | 418 | | | Vallourec SA | | | 25,137 | | |
| | | Media | |
| | 1,112 | | | Lagardere SCA | | | 33,707 | | |
| | 642 | | | Publicis Groupe SA | | | 33,109 | | |
| | 591 | | | SES SA FDR | | | 14,152 | | |
| | 3,229 | | | Societe Television
Francaise 1 (a) | | | 31,202 | | |
| | | | 112,170 | | |
| | | Multi-Utilities | |
| | 5,571 | | | GDF Suez (a) | | | 128,239 | | |
See Notes to Financial Statements
16
Morgan Stanley International Fund
Portfolio of Investments n April 30, 2012 (unaudited) continued
NUMBER OF
SHARES | |
| | VALUE | |
| | 2,175 | | | Veolia Environnement SA | | $ | 31,857 | | |
| | | | 160,096 | | |
| | | Multiline Retail | |
| | 546 | | | PPR (a) | | | 91,318 | | |
| | | Office Electronics | |
| | 281 | | | Neopost SA (a) | | | 16,156 | | |
| | | Oil, Gas & Consumable Fuels | |
| | 12,070 | | | Total SA | | | 576,293 | | |
| | | Personal Products | |
| | 242 | | | L'Oreal SA (a) | | | 29,115 | | |
| | | Pharmaceuticals | |
| | 6,517 | | | Sanofi | | | 497,407 | | |
| | | Real Estate Investment Trusts
(REITs) | |
| | 244 | | | Fonciere Des Regions REIT | | | 18,911 | | |
| | 196 | | | Gecina SA REIT | | | 18,169 | | |
| | 200 | | | ICADE REIT (a)(d) | | | 16,872 | | |
| | 708 | | | Klepierre REIT | | | 22,417 | | |
| | 815 | | | Unibail-Rodamco SE REIT | | | 152,329 | | |
| | | | 228,698 | | |
| | | Semiconductors &
Semiconductor Equipment | |
| | 4,447 | | | STMicroelectronics N.V. | | | 25,224 | | |
| | | Software | |
| | 402 | | | Dassault Systemes SA | | | 39,016 | | |
| | | Textiles, Apparel & Luxury
Goods | |
| | 316 | | | LVMH Moet Hennessy Louis
Vuitton SA (a) | | | 52,349 | | |
| | | | | Total France | | | 4,670,248 | | |
| | | Germany (6.5%) | |
| | | Air Freight & Logistics | |
| | 6,717 | | | Deutsche Post AG (Registered) | | | 125,367 | | |
| | | Airlines | |
| | 1,432 | | | Deutsche Lufthansa AG
(Registered) | | | 18,635 | | |
NUMBER OF
SHARES | |
| | VALUE | |
| | | Auto Components | |
| | 364 | | | Continental AG (a) | | $ | 35,279 | | |
| | | Automobiles | |
| | 3,729 | | | Bayerische Motoren Werke AG | | | 354,460 | | |
| | 6,684 | | | Daimler AG (Registered) | | | 369,521 | | |
| | 1,133 | | | Porsche Automobil Holding SE
(Preference) | | | 69,161 | | |
| | 835 | | | Volkswagen AG | | | 142,527 | | |
| | 881 | | | Volkswagen AG (Preference) | | | 166,880 | | |
| | | | 1,102,549 | | |
| | | Capital Markets | |
| | 6,662 | | | Deutsche Bank AG
(Registered) | | | 289,864 | | |
| | | Chemicals | |
| | 4,065 | | | BASF SE (a) | | | 334,635 | | |
| | 1,254 | | | K+S AG (Registered) | | | 62,670 | | |
| | 597 | | | Lanxess AG | | | 47,533 | | |
| | 503 | | | Linde AG | | | 86,091 | | |
| | | | 530,929 | | |
| | | Commercial Banks | |
| | 6,020 | | | Commerzbank AG (d) | | | 13,029 | | |
| | | Construction & Engineering | |
| | 780 | | | Hochtief AG | | | 45,729 | | |
| | | Diversified Financial Services | |
| | 445 | | | Deutsche Boerse AG | | | 27,938 | | |
| | | Diversified Telecommunication
Services | |
| | 14,659 | | | Deutsche Telekom AG
(Registered) | | | 165,265 | | |
| | | Electric Utilities | |
| | 10,627 | | | E.ON AG (a) | | | 240,756 | | |
| | | Food & Staples Retailing | |
| | 1,677 | | | Metro AG | | | 54,109 | | |
| | | Health Care Providers &
Services | |
| | 2,542 | | | Celesio AG | | | 43,827 | | |
See Notes to Financial Statements
17
Morgan Stanley International Fund
Portfolio of Investments n April 30, 2012 (unaudited) continued
NUMBER OF
SHARES | |
| | VALUE | |
| | 1,900 | | | Fresenius Medical Care AG &
Co. KGaA | | $ | 134,881 | | |
| | | | 178,708 | | |
| | | Household Products | |
| | 513 | | | Henkel AG & Co. KGaA
(Preference) | | | 38,163 | | |
| | | Industrial Conglomerates | |
| | 13,400 | | | Siemens AG (Registered) | | | 1,241,099 | | |
| | | Insurance | |
| | 3,148 | | | Allianz SE (Registered) | | | 350,779 | | |
| | 568 | | | Hannover Rueckversicherung
AG (a) | | | 34,334 | | |
| | 1,470 | | | Muenchener
Rueckversicherungs AG
(Registered) (a) | | | 213,361 | | |
| | | | 598,474 | | |
| | | Machinery | |
| | 1,654 | | | GEA Group AG | | | 54,582 | | |
| | | Media | |
| | 1,212 | | | ProSiebenSat.1 Media AG | | | 30,771 | | |
| | | Metals & Mining | |
| | 2,014 | | | ThyssenKrupp AG | | | 47,720 | | |
| | | Multi-Utilities | |
| | 1,713 | | | RWE AG | | | 73,637 | | |
| | 186 | | | RWE AG (Preference) | | | 7,354 | | |
| | | | 80,991 | | |
| | | Personal Products | |
| | 439 | | | Beiersdorf AG (a) | | | 30,799 | | |
| | | Pharmaceuticals | |
| | 7,698 | | | Bayer AG (Registered) (a) | | | 542,202 | | |
| | 253 | | | Merck KGaA (a) | | | 27,796 | | |
| | | | 569,998 | | |
| | | Software | |
| | 10,594 | | | SAP AG | | | 702,426 | | |
NUMBER OF
SHARES | |
| | VALUE | |
| | | Textiles, Apparel & Luxury
Goods | |
| | 377 | | | Adidas AG | | $ | 31,439 | | |
| | | | | Total Germany | | | 6,254,619 | | |
| | | Hong Kong (0.0%) | |
| | | Diversified Financial Services | |
| | 56 | | | Hong Kong Exchanges and
Clearing Ltd. | | | 896 | | |
| | | Real Estate Management &
Development | |
| | 45 | | | Henderson Land Development
Co., Ltd. | | | 256 | | |
| | | | | Total Hong Kong | | | 1,152 | | |
| | | Indonesia (0.3%) | |
| | | Automobiles | |
| | 5,500 | | | Astra International Tbk PT | | | 42,490 | | |
| | | Commercial Banks | |
| | 34,500 | | | Bank Central Asia Tbk PT | | | 30,031 | | |
| | 8,500 | | | Bank Danamon Indonesia
Tbk PT | | | 5,179 | | |
| | 26,500 | | | Bank Mandiri Tbk PT | | | 21,337 | | |
| | 22,500 | | | Bank Negara Indonesia
Persero Tbk PT | | | 9,854 | | |
| | 32,000 | | | Bank Rakyat Indonesia Persero
Tbk PT | | | 23,155 | | |
| | | | 89,556 | | |
| | | Construction Materials | |
| | 4,000 | | | Indocement Tunggal Prakarsa
Tbk PT | | | 7,856 | | |
| | 10,500 | | | Semen Gresik Persero Tbk PT | | | 13,881 | | |
| | | | 21,737 | | |
| | | Diversified Telecommunication
Services | |
| | 28,000 | | | Telekomunikasi Indonesia
Tbk PT | | | 25,896 | | |
See Notes to Financial Statements
18
Morgan Stanley International Fund
Portfolio of Investments n April 30, 2012 (unaudited) continued
NUMBER OF
SHARES | |
| | VALUE | |
| | | Food Products | |
| | 24,500 | | | Charoen Pokphand Indonesia
Tbk PT | | $ | 7,331 | | |
| | 13,500 | | | Indofood Sukses Makmur
Tbk PT | | | 7,124 | | |
| | | | 14,455 | | |
| | | Gas Utilities | |
| | 31,000 | | | Perusahaan Gas Negara
Tbk PT | | | 11,300 | | |
| | | Household Products | |
| | 4,000 | | | Unilever Indonesia Tbk PT | | | 8,639 | | |
| | | Machinery | |
| | 4,833 | | | United Tractors Tbk PT | | | 15,566 | | |
| | | Oil, Gas & Consumable Fuels | |
| | 30,200 | | | Adaro Energy Tbk PT | | | 6,112 | | |
| | 52,500 | | | Bumi Resources Tbk PT | | | 11,567 | | |
| | 1,300 | | | Indo Tambangraya Megah
Tbk PT | | | 5,623 | | |
| | 2,500 | | | Tambang Batubara Bukit Asam
Tbk PT | | | 5,019 | | |
| | | | 28,321 | | |
| | | Pharmaceuticals | |
| | 15,000 | | | Kalbe Farma Tbk PT | | | 6,569 | | |
| | | Tobacco | |
| | 2,000 | | | Gudang Garam Tbk PT | | | 12,883 | | |
| | | | | Total Indonesia | | | 277,412 | | |
| | | Japan (20.9%) | |
| | | Air Freight & Logistics | |
| | 3,435 | | | Yamato Holdings Co., Ltd. | | | 53,220 | | |
| | | Auto Components | |
| | 12,500 | | | Bridgestone Corp. | | | 298,253 | | |
| | 10,200 | | | Denso Corp. | | | 333,314 | | |
| | 2,059 | | | NGK Spark Plug Co., Ltd. | | | 29,554 | | |
| | 3,800 | | | Stanley Electric Co., Ltd. | | | 58,590 | | |
| | 1,600 | | | Toyota Boshoku Corp. (a) | | | 19,780 | | |
| | 1,200 | | | Toyota Industries Corp. | | | 34,163 | | |
| | | | 773,654 | | |
NUMBER OF
SHARES | |
| | VALUE | |
| | | Automobiles | |
| | 18,009 | | | Honda Motor Co., Ltd. | | $ | 653,232 | | |
| | 25,605 | | | Nissan Motor Co., Ltd. | | | 268,109 | | |
| | 2,800 | | | Suzuki Motor Corp. | | | 66,528 | | |
| | 15,555 | | | Toyota Motor Corp. | | | 643,904 | | |
| | 700 | | | Yamaha Motor Co., Ltd. (a) | | | 9,425 | | |
| | | | 1,641,198 | | |
| | | Beverages | |
| | 5,000 | | | Kirin Holdings Co., Ltd. | | | 64,003 | | |
| | | Building Products | |
| | 10,500 | | | Asahi Glass Co., Ltd. | | | 83,248 | | |
| | 2,900 | | | Daikin Industries Ltd. | | | 77,149 | | |
| | 2,262 | | | JS Group Corp. | | | 44,565 | | |
| | 6,500 | | | Nippon Sheet Glass Co.,
Ltd. (a) | | | 8,467 | | |
| | 4,500 | | | TOTO Ltd. | | | 33,367 | | |
| | | | 246,796 | | |
| | | Capital Markets | |
| | 28,000 | | | Daiwa Securities Group, Inc. (a) | | | 106,613 | | |
| | 19,050 | | | Nomura Holdings, Inc. | | | 78,739 | | |
| | 186 | | | SBI Holdings, Inc. | | | 15,143 | | |
| | | | 200,495 | | |
| | | Chemicals | |
| | 15,000 | | | Asahi Kasei Corp. | | | 93,186 | | |
| | 3,000 | | | Daicel Corp. (a) | | | 19,088 | | |
| | 8,546 | | | Denki Kagaku Kogyo KK | | | 33,396 | | |
| | 2,408 | | | JSR Corp. | | | 47,834 | | |
| | 5,000 | | | Kaneka Corp. (a) | | | 31,062 | | |
| | 4,556 | | | Kuraray Co., Ltd. | | | 65,281 | | |
| | 19,500 | | | Mitsubishi Chemical
Holdings Corp. | | | 103,069 | | |
| | 9,500 | | | Mitsui Chemicals, Inc. | | | 27,486 | | |
| | 2,400 | | | Nitto Denko Corp. | | | 99,499 | | |
| | 5,697 | | | Shin-Etsu Chemical Co., Ltd. | | | 331,088 | | |
| | 12,000 | | | Showa Denko KK | | | 26,904 | | |
| | 16,000 | | | Sumitomo Chemical Co., Ltd. | | | 66,333 | | |
| | 13,608 | | | Teijin Ltd. | | | 46,019 | | |
| | 14,000 | | | Toray Industries, Inc. | | | 108,192 | | |
See Notes to Financial Statements
19
Morgan Stanley International Fund
Portfolio of Investments n April 30, 2012 (unaudited) continued
NUMBER OF
SHARES | |
| | VALUE | |
| | 11,000 | | | Tosoh Corp. (a) | | $ | 30,724 | | |
| | | | 1,129,161 | | |
| | | Commercial Banks | |
| | 3,000 | | | Bank of Kyoto Ltd. (The) (a) | | | 25,513 | | |
| | 14,000 | | | Bank of Yokohama Ltd. (The) | | | 68,211 | | |
| | 7,000 | | | Chiba Bank Ltd. (The) | | | 42,698 | | |
| | 8,000 | | | Fukuoka Financial Group, Inc. | | | 33,467 | | |
| | 17,000 | | | Hokuhoku Financial Group, Inc. | | | 29,810 | | |
| | 8,000 | | | Joyo Bank Ltd. (The) (a) | | | 35,070 | | |
| | 73,260 | | | Mitsubishi UFJ Financial
Group, Inc. (See Note 6) | | | 355,105 | | |
| | 178,600 | | | Mizuho Financial Group, Inc. | | | 284,096 | | |
| | 9,000 | | | Nishi-Nippon City Bank
Ltd. (The) | | | 23,785 | | |
| | 3,900 | | | Resona Holdings, Inc. | | | 16,657 | | |
| | 17,500 | | | Shinsei Bank Ltd. | | | 22,796 | | |
| | 7,000 | | | Shizuoka Bank Ltd. (The) | | | 73,384 | | |
| | 10,100 | | | Sumitomo Mitsui Financial
Group, Inc. | | | 326,884 | | |
| | 55,623 | | | Sumitomo Mitsui Trust
Holdings, Inc. | | | 164,417 | | |
| | 1,000 | | | Suruga Bank Ltd. | | | 10,020 | | |
| | | | 1,511,913 | | |
| | | Commercial Services &
Supplies | |
| | 5,500 | | | Dai Nippon Printing Co., Ltd. | | | 49,117 | | |
| | 2,485 | | | Secom Co., Ltd. | | | 118,274 | | |
| | 6,000 | | | Toppan Printing Co., Ltd. (a) | | | 40,807 | | |
| | | | 208,198 | | |
| | | Computers & Peripherals | |
| | 33,000 | | | Fujitsu Ltd. | | | 161,197 | | |
| | 29,500 | | | NEC Corp. (d) | | | 53,576 | | |
| | 4,400 | | | Seiko Epson Corp. (a) | | | 59,299 | | |
| | 41,026 | | | Toshiba Corp. | | | 169,057 | | |
| | | | 443,129 | | |
| | | Construction & Engineering | |
| | 7,546 | | | JGC Corp. | | | 218,516 | | |
| | 12,000 | | | Kajima Corp. (a) | | | 34,269 | | |
| | 9,571 | | | Obayashi Corp. | | | 40,638 | | |
NUMBER OF
SHARES | |
| | VALUE | |
| | 9,000 | | | Shimizu Corp. (a) | | $ | 34,269 | | |
| | 14,000 | | | Taisei Corp. (a) | | | 35,596 | | |
| | | | 363,288 | | |
| | | Consumer Finance | |
| | 1,600 | | | Credit Saison Co., Ltd. | | | 34,549 | | |
| | | Containers & Packaging | |
| | 2,517 | | | Toyo Seikan Kaisha Ltd. | | | 33,795 | | |
| | | Diversified Consumer Services | |
| | 854 | | | Benesse Holdings, Inc. | | | 42,358 | | |
| | | Diversified Financial Services | |
| | 290 | | | ORIX Corp. | | | 27,896 | | |
| | | Diversified Telecommunication
Services | |
| | 1,900 | | | Nippon Telegraph &
Telephone Corp. | | | 86,266 | | |
| | | Electric Utilities | |
| | 2,500 | | | Chubu Electric Power
Co., Inc. | | | 40,957 | | |
| | 3,800 | | | Kansai Electric Power
Co., Inc. (The) | | | 55,115 | | |
| | 1,600 | | | Kyushu Electric Power
Co., Inc. | | | 21,262 | | |
| | 2,900 | | | Tohoku Electric Power
Co., Inc. (a)(d) | | | 30,475 | | |
| | | | 147,809 | | |
| | | Electrical Equipment | |
| | 7,500 | | | Furukawa Electric Co., Ltd. | | | 20,479 | | |
| | 5,000 | | | GS Yuasa Corp. (a) | | | 25,927 | | |
| | 1,200 | | | Mabuchi Motor Co., Ltd. (a) | | | 50,576 | | |
| | 25,552 | | | Mitsubishi Electric Corp. | | | 226,268 | | |
| | 904 | | | Nidec Corp. (a) | | | 81,523 | | |
| | 5,600 | | | Sumitomo Electric
Industries Ltd. | | | 76,383 | | |
| | 800 | | | Ushio, Inc. | | | 10,511 | | |
| | | | 491,667 | | |
| | | Electronic Equipment,
Instruments & Components | |
| | 5,150 | | | Citizen Holdings Co., Ltd. | | | 32,446 | | |
See Notes to Financial Statements
20
Morgan Stanley International Fund
Portfolio of Investments n April 30, 2012 (unaudited) continued
NUMBER OF
SHARES | |
| | VALUE | |
| | 7,900 | | | FUJIFILM Holdings Corp. | | $ | 168,904 | | |
| | 500 | | | Hirose Electric Co., Ltd. | | | 52,668 | | |
| | 38,000 | | | Hitachi Ltd. | | | 243,687 | | |
| | 4,800 | | | Hoya Corp. | | | 110,621 | | |
| | 2,600 | | | Ibiden Co., Ltd. (a) | | | 53,700 | | |
| | 847 | | | Keyence Corp. | | | 201,141 | | |
| | 2,900 | | | Kyocera Corp. | | | 285,496 | | |
| | 2,200 | | | Murata Manufacturing
Co., Ltd. | | | 126,616 | | |
| | 4,500 | | | Nippon Electric Glass Co., Ltd. | | | 36,748 | | |
| | 4,604 | | | Omron Corp. | | | 98,435 | | |
| | 1,552 | | | TDK Corp. | | | 82,032 | | |
| | 3,450 | | | Yokogawa Electric Corp. (a) | | | 33,359 | | |
| | | | 1,525,853 | | |
| | | Food & Staples Retailing | |
| | 1,299 | | | FamilyMart Co., Ltd. | | | 57,921 | | |
| | 3,400 | | | Seven & I Holdings Co., Ltd. | | | 103,184 | | |
| | | | 161,105 | | |
| | | Food Products | |
| | 1,600 | | | Yakult Honsha Co., Ltd. (a) | | | 59,078 | | |
| | | Gas Utilities | |
| | 8,000 | | | Osaka Gas Co., Ltd. | | | 32,365 | | |
| | 10,000 | | | Tokyo Gas Co., Ltd. | | | 48,346 | | |
| | | | 80,711 | | |
| | | Health Care Equipment &
Supplies | |
| | 1,300 | | | Sysmex Corp. | | | 52,593 | | |
| | 2,850 | | | Terumo Corp. | | | 131,184 | | |
| | | | 183,777 | | |
| | | Hotels, Restaurants & Leisure | |
| | 650 | | | Oriental Land Co., Ltd. (a) | | | 72,132 | | |
| | | Household Durables | |
| | 5,050 | | | Casio Computer Co., Ltd. (a) | | | 33,840 | | |
| | 26,800 | | | Panasonic Corp. | | | 208,788 | | |
| | 7,072 | | | Sekisui Chemical Co., Ltd. | | | 63,775 | | |
| | 11,046 | | | Sekisui House Ltd. | | | 103,072 | | |
| | 7,500 | | | Sharp Corp. (a) | | | 48,472 | | |
NUMBER OF
SHARES | |
| | VALUE | |
| | 9,096 | | | Sony Corp. | | $ | 149,929 | | |
| | | | 607,876 | | |
| | | Household Products | |
| | 2,700 | | | Unicharm Corp. | | | 150,827 | | |
| | | Information Technology
Services | |
| | 700 | | | Itochu Techno-Solutions
Corp. (a) | | | 31,958 | | |
| | 2,250 | | | Nomura Research Institute
Ltd. (a) | | | 51,994 | | |
| | 18 | | | NTT Data Corp. | | | 62,743 | | |
| | | | 146,695 | | |
| | | Insurance | |
| | 4,200 | | | MS&AD Insurance Group
Holdings | | | 78,014 | | |
| | 2,200 | | | NKSJ Holdings, Inc. | | | 45,604 | | |
| | 4,700 | | | T&D Holdings, Inc. | | | 51,038 | | |
| | 8,968 | | | Tokio Marine Holdings, Inc. | | | 231,276 | | |
| | | | 405,932 | | |
| | | Internet Software & Services | |
| | 203 | | | Yahoo! Japan Corp. | | | 61,047 | | |
| | | Leisure Equipment & Products | |
| | 3,400 | | | Nikon Corp. | | | 101,906 | | |
| | 1,950 | | | Shimano, Inc. | | | 128,470 | | |
| | 2,100 | | | Yamaha Corp. | | | 20,490 | | |
| | | | 250,866 | | |
| | | Machinery | |
| | 3,553 | | | Amada Co., Ltd. | | | 24,298 | | |
| | 2,250 | | | Fanuc Corp. | | | 382,985 | | |
| | 2,800 | | | Hitachi Construction
Machinery Co., Ltd. (a) | | | 61,267 | | |
| | 12,530 | | | IHI Corp. | | | 30,446 | | |
| | 11,500 | | | Kawasaki Heavy
Industries Ltd. | | | 34,857 | | |
| | 12,400 | | | Komatsu Ltd. | | | 359,544 | | |
| | 19,000 | | | Kubota Corp. (a) | | | 184,669 | | |
| | 1,100 | | | Kurita Water Industries Ltd. (a) | | | 27,018 | | |
| | 700 | | | Makita Corp. | | | 27,092 | | |
See Notes to Financial Statements
21
Morgan Stanley International Fund
Portfolio of Investments n April 30, 2012 (unaudited) continued
NUMBER OF
SHARES | |
| | VALUE | |
| | 28,550 | | | Mitsubishi Heavy
Industries Ltd. | | $ | 130,163 | | |
| | 1,300 | | | Nabtesco Corp. (a) | | | 28,039 | | |
| | 6,060 | | | NGK Insulators Ltd. | | | 76,281 | | |
| | 5,553 | | | NSK Ltd. | | | 38,532 | | |
| | 6,051 | | | NTN Corp. | | | 23,116 | | |
| | 805 | | | SMC Corp. | | | 135,208 | | |
| | 5,000 | | | Sumitomo Heavy
Industries Ltd. | | | 25,927 | | |
| | 1,000 | | | THK Co., Ltd. | | | 20,090 | | |
| | | | 1,609,532 | | |
| | | Marine | |
| | 23,000 | | | Kawasaki Kisen Kaisha
Ltd. (a)(d) | | | 48,973 | | |
| | 2,000 | | | Mitsui OSK Lines Ltd. | | | 7,816 | | |
| | 13,015 | | | Nippon Yusen KK (a) | | | 38,797 | | |
| | | | 95,586 | | |
| | | Metals & Mining | |
| | 3,700 | | | JFE Holdings, Inc. (a) | | | 70,024 | | |
| | 25,000 | | | Kobe Steel Ltd. (a) | | | 36,009 | | |
| | 21,000 | | | Mitsubishi Materials Corp. | | | 63,126 | | |
| | 48,108 | | | Nippon Steel Corp. | | | 121,114 | | |
| | 32,000 | | | Sumitomo Metal
Industries Ltd. | | | 58,116 | | |
| | 14,500 | | | Sumitomo Metal Mining
Co., Ltd. | | | 191,784 | | |
| | | | 540,173 | | |
| | | Office Electronics | |
| | 6,004 | | | Canon, Inc. | | | 275,986 | | |
| | 7,030 | | | Konica Minolta Holdings, Inc. | | | 57,585 | | |
| | | | 333,571 | | |
| | | Oil, Gas & Consumable Fuels | |
| | 19 | | | Inpex Corp. | | | 126,127 | | |
| | 24,400 | | | JX Holdings, Inc. | | | 138,442 | | |
| | 3,400 | | | Showa Shell Sekiyu KK | | | 21,506 | | |
| | 4,000 | | | TonenGeneral Sekiyu KK | | | 37,575 | | |
| | | | 323,650 | | |
| | | Paper & Forest Products | |
| | 1,400 | | | Nippon Paper Group, Inc. (a) | | | 28,056 | | |
NUMBER OF
SHARES | |
| | VALUE | |
| | 16,000 | | | OJI Paper Co., Ltd. | | $ | 73,547 | | |
| | | | 101,603 | | |
| | | Personal Products | |
| | 2,500 | | | Shiseido Co., Ltd. | | | 43,900 | | |
| | | Pharmaceuticals | |
| | 5,300 | | | Astellas Pharma, Inc. | | | 215,412 | | |
| | 2,600 | | | Chugai Pharmaceutical
Co., Ltd. | | | 47,024 | | |
| | 11,500 | | | Daiichi Sankyo Co., Ltd. | | | 197,908 | | |
| | 2,500 | | | Eisai Co., Ltd. | | | 97,695 | | |
| | 700 | | | Hisamitsu Pharmaceutical
Co., Inc. | | | 31,213 | | |
| | 2,700 | | | Mitsubishi Tanabe
Pharma Corp. | | | 37,605 | | |
| | 900 | | | Ono Pharmaceutical Co., Ltd. | | | 50,952 | | |
| | 2,800 | | | Otsuka Holdings Co., Ltd. | | | 84,519 | | |
| | 900 | | | Santen Pharmaceutical
Co. Ltd. | | | 37,594 | | |
| | 3,400 | | | Shionogi & Co., Ltd. | | | 44,502 | | |
| | 10,300 | | | Takeda Pharmaceutical
Co., Ltd. | | | 449,593 | | |
| | | | 1,294,017 | | |
| | | Real Estate Investment Trusts
(REITs) | |
| | 9 | | | Japan Real Estate Investment
Corp. REIT | | | 79,810 | | |
| | 29 | | | Japan Retail Fund Investment
Corp. REIT | | | 46,311 | | |
| | 10 | | | Nippon Building Fund, Inc.
REIT | | | 95,316 | | |
| | | | 221,437 | | |
| | | Real Estate Management &
Development | |
| | 1,500 | | | Aeon Mall Co., Ltd. | | | 33,461 | | |
| | 1,556 | | | Daito Trust Construction
Co., Ltd. | | | 140,516 | | |
| | 9,000 | | | Daiwa House Industry
Co., Ltd. | | | 116,558 | | |
| | 21,000 | | | Mitsubishi Estate Co., Ltd. | | | 374,549 | | |
| | 15,500 | | | Mitsui Fudosan Co., Ltd. | | | 286,742 | | |
See Notes to Financial Statements
22
Morgan Stanley International Fund
Portfolio of Investments n April 30, 2012 (unaudited) continued
NUMBER OF
SHARES | |
| | VALUE | |
| | 7,500 | | | Sumitomo Realty &
Development Co., Ltd. | | $ | 180,736 | | |
| | 11,000 | | | Tokyu Land Corp. | | | 53,457 | | |
| | | | 1,186,019 | | |
| | | Road & Rail | |
| | 13 | | | Central Japan Railway Co. | | | 108,116 | | |
| | 3,400 | | | East Japan Railway Co. | | | 212,074 | | |
| | 6,000 | | | Keikyu Corp. | | | 51,553 | | |
| | 3,000 | | | Keio Corp. (a) | | | 21,719 | | |
| | 15,550 | | | Kintetsu Corp. (a) | | | 54,924 | | |
| | 11,500 | | | Nippon Express Co., Ltd. | | | 43,644 | | |
| | 8,500 | | | Tobu Railway Co., Ltd. | | | 43,330 | | |
| | 12,000 | | | Tokyu Corp. | | | 56,212 | | |
| | 900 | | | West Japan Railway Co. | | | 37,030 | | |
| | | | 628,602 | | |
| | | Semiconductors &
Semiconductor Equipment | |
| | 2,450 | | | Advantest Corp. | | | 41,120 | | |
| | 1,605 | | | Rohm Co., Ltd. | | | 72,772 | | |
| | 3,100 | | | Tokyo Electron Ltd. | | | 172,977 | | |
| | | | 286,869 | | |
| | | Software | |
| | 1,700 | | | Konami Corp. (a) | | | 49,612 | | |
| | 1,008 | | | Nintendo Co., Ltd. | | | 137,615 | | |
| | 750 | | | Oracle Corp. Japan | | | 29,027 | | |
| | 1,600 | | | Trend Micro, Inc. (a) | | | 48,777 | | |
| | | | 265,031 | | |
| | | Specialty Retail | |
| | 1,300 | | | Fast Retailing Co., Ltd. | | | 291,946 | | |
| | 300 | | | Shimamura Co., Ltd. | | | 34,081 | | |
| | 620 | | | USS Co., Ltd. | | | 63,134 | | |
| | 1,160 | | | Yamada Denki Co., Ltd. | | | 75,551 | | |
| | | | 464,712 | | |
| | | Tobacco | |
| | 27 | | | Japan Tobacco, Inc. | | | 149,981 | | |
| | | Trading Companies &
Distributors | |
| | 16,351 | | | ITOCHU Corp. | | | 185,546 | | |
| | 17,550 | | | Marubeni Corp. | | | 122,657 | | |
NUMBER OF
SHARES | |
| | VALUE | |
| | 14,900 | | | Mitsubishi Corp. | | $ | 325,284 | | |
| | 13,700 | | | Mitsui & Co., Ltd. | | | 215,178 | | |
| | 8,300 | | | Sumitomo Corp. | | | 118,512 | | |
| | | | 967,177 | | |
| | | Transportation Infrastructure | |
| | 2,000 | | | Mitsubishi Logistics Corp. | | | 22,069 | | |
| | | Wireless Telecommunication
Services | |
| | 30 | | | NTT DoCoMo, Inc. | | | 51,178 | | |
| | 11,300 | | | Softbank Corp. | | | 339,113 | | |
| | | | 390,291 | | |
| | | | | Total Japan | | | 20,129,514 | | |
| | | Korea, Republic of (1.3%) | |
| | | Auto Components | |
| | 117 | | | Hyundai Mobis | | | 31,835 | | |
| | | Automobiles | |
| | 280 | | | Hyundai Motor Co. | | | 66,523 | | |
| | 420 | | | Kia Motors Corp. | | | 30,995 | | |
| | | | 97,518 | | |
| | | Capital Markets | |
| | 360 | | | Daewoo Securities Co., Ltd. (d) | | | 3,663 | | |
| | 142 | | | Samsung Securities Co., Ltd. | | | 6,308 | | |
| | | | 9,971 | | |
| | | Chemicals | |
| | 142 | | | Cheil Industries, Inc. | | | 12,188 | | |
| | 88 | | | LG Chem Ltd. | | | 22,153 | | |
| | 35 | | | OCI Co., Ltd. | | | 6,628 | | |
| | | | 40,969 | | |
| | | Commercial Banks | |
| | 380 | | | Hana Financial Group, Inc. | | | 13,063 | | |
| | 610 | | | Industrial Bank of Korea | | | 6,747 | | |
| | 710 | | | KB Financial Group, Inc. | | | 24,188 | | |
| | 1,020 | | | Korea Exchange Bank | | | 7,753 | | |
| | 790 | | | Shinhan Financial Group
Co., Ltd. | | | 27,612 | | |
See Notes to Financial Statements
23
Morgan Stanley International Fund
Portfolio of Investments n April 30, 2012 (unaudited) continued
NUMBER OF
SHARES | |
| | VALUE | |
| | 470 | | | Woori Finance Holdings
Co., Ltd. | | $ | 4,970 | | |
| | | | 84,333 | | |
| | | Construction & Engineering | |
| | 190 | | | Doosan Heavy Industries and
Construction Co., Ltd. | | | 8,961 | | |
| | 123 | | | GS Engineering &
Construction Corp. | | | 9,175 | | |
| | 150 | | | Hyundai Engineering &
Construction Co., Ltd. | | | 9,477 | | |
| | 70 | | | Samsung Engineering
Co., Ltd. | | | 13,317 | | |
| | | | 40,930 | | |
| | | Diversified Telecommunication
Services | |
| | 420 | | | KT Corp. | | | 10,926 | | |
| | | Electric Utilities | |
| | 510 | | | Korea Electric Power Corp. (d) | | | 9,793 | | |
| | | Electronic Equipment,
Instruments & Components | |
| | 450 | | | LG Display Co., Ltd. (d) | | | 9,915 | | |
| | 115 | | | Samsung Electro-Mechanics
Co., Ltd. | | | 11,142 | | |
| | 72 | | | Samsung SDI Co., Ltd. | | | 10,385 | | |
| | | | 31,442 | | |
| | | Food & Staples Retailing | |
| | 47 | | | E-Mart Co., Ltd. | | | 11,166 | | |
| | | Household Durables | |
| | 199 | | | LG Electronics, Inc. | | | 12,361 | | |
| | | Industrial Conglomerates | |
| | 339 | | | LG Corp. | | | 17,278 | | |
| | 77 | | | Samsung Techwin Co., Ltd. | | | 4,715 | | |
| | | | 21,993 | | |
| | | Insurance | |
| | 75 | | | Samsung Fire & Marine
Insurance Co., Ltd. | | | 14,335 | | |
| | | Internet Software & Services | |
| | 83 | | | NHN Corp. | | | 18,801 | | |
NUMBER OF
SHARES | |
| | VALUE | |
| | | Machinery | |
| | 84 | | | Hyundai Heavy Industries
Co., Ltd. | | $ | 21,035 | | |
| | 450 | | | Samsung Heavy Industries
Co., Ltd. | | | 16,604 | | |
| | | | 37,639 | | |
| | | Metals & Mining | |
| | 149 | | | Hyundai Steel Co. | | | 13,000 | | |
| | 118 | | | POSCO | | | 39,207 | | |
| | | | 52,207 | | |
| | | Multiline Retail | |
| | 26 | | | Lotte Shopping Co., Ltd. | | | 8,075 | | |
| | 16 | | | Shinsegae Co., Ltd. | | | 3,511 | | |
| | | | 11,586 | | |
| | | Oil, Gas & Consumable Fuels | |
| | 140 | | | S-Oil Corp. | | | 12,128 | | |
| | 126 | | | SK Innovation Co., Ltd. | | | 17,616 | | |
| | | | 29,744 | | |
| | | Semiconductors &
Semiconductor Equipment | |
| | 900 | | | Hynix Semiconductor, Inc. (d) | | | 22,338 | | |
| | 506 | | | Samsung Electronics Co., Ltd. | | | 622,356 | | |
| | 36 | | | Samsung Electronics Co., Ltd.
(Preference) | | | 25,771 | | |
| | | | 670,465 | | |
| | | Tobacco | |
| | 221 | | | KT&G Corp. | | | 15,175 | | |
| | | Trading Companies &
Distributors | |
| | 290 | | | Samsung C&T Corp. | | | 19,708 | | |
| | | Wireless Telecommunication
Services | |
| | 98 | | | SK Telecom Co., Ltd. | | | 11,707 | | |
| | | | | Total Korea, Republic of | | | 1,284,604 | | |
| | | Netherlands (3.1%) | |
| | | Air Freight & Logistics | |
| | 8,488 | | | TNT Express N.V. | | | 102,918 | | |
See Notes to Financial Statements
24
Morgan Stanley International Fund
Portfolio of Investments n April 30, 2012 (unaudited) continued
NUMBER OF
SHARES | |
| | VALUE | |
| | | Beverages | |
| | 2,696 | | | Heineken N.V. (a) | | $ | 147,441 | | |
| | | Chemicals | |
| | 3,337 | | | Akzo Nobel N.V. | | | 178,830 | | |
| | 1,514 | | | Koninklijke DSM N.V. | | | 86,807 | | |
| | | | 265,637 | | |
| | | Construction & Engineering | |
| | 822 | | | Koninklijke Boskalis
Westminster N.V. | | | 29,987 | | |
| | | Diversified Financial Services | |
| | 46,563 | | | ING Groep N.V. CVA (d) | | | 328,332 | | |
| | | Diversified Telecommunication
Services | |
| | 20,919 | | | Koninklijke KPN N.V. (a) | | | 187,769 | | |
| | | Energy Equipment & Services | |
| | 738 | | | Fugro N.V. CVA | | | 53,787 | | |
| | 1,865 | | | SBM Offshore N.V. | | | 33,883 | | |
| | | | 87,670 | | |
| | | Food & Staples Retailing | |
| | 18,160 | | | Koninklijke Ahold N.V. (a) | | | 230,336 | | |
| | | Food Products | |
| | 15,359 | | | Unilever N.V. CVA | | | 525,956 | | |
| | | Industrial Conglomerates | |
| | 13,946 | | | Koninklijke Philips Electronics
N.V. (d) | | | 276,905 | | |
| | | Insurance | |
| | 19,354 | | | Aegon N.V. (d) | | | 89,384 | | |
| | | Media | |
| | 8,407 | | | Reed Elsevier N.V. (a) | | | 99,142 | | |
| | 7,415 | | | Wolters Kluwer N.V. | | | 127,991 | | |
| | | | 227,133 | | |
| | | Metals & Mining | |
| | 6,021 | | | ArcelorMittal | | | 104,128 | | |
| | | Professional Services | |
| | 1,227 | | | Randstad Holding N.V. | | | 42,489 | | |
NUMBER OF
SHARES | |
| | VALUE | |
| | | Real Estate Investment Trusts
(REITs) | |
| | 769 | | | Corio N.V. REIT (a) | | $ | 34,416 | | |
| | | Semiconductors &
Semiconductor Equipment | |
| | 5,597 | | | ASML Holding N.V. (a) | | | 284,792 | | |
| | | | | Total Netherlands | | | 2,965,293 | | |
| | | Norway (1.7%) | |
| | | Chemicals | |
| | 8,199 | | | Yara International ASA | | | 402,146 | | |
| | | Commercial Banks | |
| | 15,497 | | | DnB NOR ASA (a) | | | 167,076 | | |
| | | Diversified Telecommunication
Services | |
| | 29,041 | | | Telenor ASA | | | 533,835 | | |
| | | Energy Equipment & Services | |
| | 2,989 | | | Aker Solutions ASA (a) | | | 50,792 | | |
| | 1,992 | | | Subsea 7 SA (d) | | | 51,619 | | |
| | | | 102,411 | | |
| | | Industrial Conglomerates | |
| | 12,726 | | | Orkla ASA | | | 93,483 | | |
| | | Metals & Mining | |
| | 12,701 | | | Norsk Hydro ASA (a) | | | 61,786 | | |
| | | Oil, Gas & Consumable Fuels | |
| | 9,737 | | | Statoil ASA | | | 259,973 | | |
| | | | | Total Norway | | | 1,620,710 | | |
| | | Philippines (0.9%) | |
| | | Commercial Banks | |
| | 58,200 | | | Bank of the Philippine Islands | | | 101,595 | | |
| | 34,300 | | | Metropolitan Bank & Trust | | | 74,254 | | |
| | | | 175,849 | | |
| | | Diversified Financial Services | |
| | 7,176 | | | Ayala Corp. | | | 73,086 | | |
| | | Electric Utilities | |
| | 9,230 | | | Manila Electric Co. | | | 57,671 | | |
See Notes to Financial Statements
25
Morgan Stanley International Fund
Portfolio of Investments n April 30, 2012 (unaudited) continued
NUMBER OF
SHARES | |
| | VALUE | |
| | | Independent Power
Producers & Energy Traders | |
| | 59,200 | | | Aboitiz Power Corp. | | $ | 47,674 | | |
| | 250,000 | | | Energy Development Corp. | | | 34,936 | | |
| | | | 82,610 | | |
| | | Industrial Conglomerates | |
| | 69,000 | | | Aboitiz Equity Ventures, Inc. | | | 83,349 | | |
| | 130,700 | | | Alliance Global Group, Inc. | | | 38,263 | | |
| | 6,000 | | | SM Investments Corp. | | | 99,337 | | |
| | | | 220,949 | | |
| | | Real Estate Management &
Development | |
| | 172,300 | | | Ayala Land, Inc. | | | 87,537 | | |
| | 173,000 | | | SM Prime Holdings, Inc. | | | 68,430 | | |
| | | | 155,967 | | |
| | | Wireless Telecommunication
Services | |
| | 1,530 | | | Philippine Long Distance
Telephone Co. | | | 93,786 | | |
| | | | | Total Philippines | | | 859,918 | | |
| | | Poland (1.0%) | |
| | | Chemicals | |
| | 405 | | | Synthos SA | | | 783 | | |
| | | Commercial Banks | |
| | 2,638 | | | Bank Pekao SA | | | 124,400 | | |
| | 334 | | | BRE Bank SA (d) | | | 30,600 | | |
| | 4,848 | | | Get Bank SA (d) | | | 2,921 | | |
| | 15,012 | | | Powszechna Kasa
Oszczednosci Bank
Polski SA | | | 160,913 | | |
| | | | 318,834 | | |
| | | Diversified Telecommunication
Services | |
| | 15,679 | | | Telekomunikacja Polska SA | | | 82,042 | | |
| | | Electric Utilities | |
| | 15,174 | | | PGE SA | | | 90,852 | | |
NUMBER OF
SHARES | |
| | VALUE | |
| | 23,900 | | | Tauron Polska Energia SA | | $ | 35,396 | | |
| | | | 126,248 | | |
| | | Insurance | |
| | 1,100 | | | Powszechny Zaklad
Ubezpieczen SA | | | 111,211 | | |
| | | Metals & Mining | |
| | 3,062 | | | KGHM Polska Miedz SA | | | 134,781 | | |
| | | Oil, Gas & Consumable Fuels | |
| | 7,537 | | | Polski Koncern Naftowy Orlen
SA (d) | | | 87,935 | | |
| | 41,073 | | | Polskie Gornictwo Naftowe i
Gazownictwo SA | | | 53,144 | | |
| | | | 141,079 | | |
| | | Software | |
| | 646 | | | Asseco Poland SA | | | 9,594 | | |
| | | | | Total Poland | | | 924,572 | | |
| | | Singapore (2.2%) | |
| | | Aerospace & Defense | |
| | 16,000 | | | Singapore Technologies
Engineering Ltd. | | | 38,917 | | |
| | | Airlines | |
| | 9,276 | | | Singapore Airlines Ltd. (a) | | | 80,205 | | |
| | | Commercial Banks | |
| | 24,413 | | | DBS Group Holdings Ltd. | | | 275,398 | | |
| | 45,093 | | | Oversea-Chinese Banking
Corp., Ltd. | | | 326,492 | | |
| | 21,508 | | | United Overseas Bank Ltd. | | | 334,569 | | |
| | | | 936,459 | | |
| | | Distributors | |
| | 31 | | | Jardine Cycle & Carriage Ltd. | | | 1,182 | | |
| | | Diversified Financial Services | |
| | 7,490 | | | Singapore Exchange Ltd. | | | 40,552 | | |
| | | Diversified Telecommunication
Services | |
| | 94,630 | | | Singapore
Telecommunications Ltd. | | | 237,818 | | |
See Notes to Financial Statements
26
Morgan Stanley International Fund
Portfolio of Investments n April 30, 2012 (unaudited) continued
NUMBER OF
SHARES | |
| | VALUE | |
| | | Food & Staples Retailing | |
| | 7,000 | | | Olam International Ltd. (a) | | $ | 12,840 | | |
| | | Food Products | |
| | 13,000 | | | Wilmar International Ltd. (a) | | | 51,159 | | |
| | | Hotels, Restaurants & Leisure | |
| | 87,000 | | | Genting Singapore PLC (a)(d) | | | 121,624 | | |
| | | Industrial Conglomerates | |
| | 13,000 | | | Fraser and Neave Ltd. | | | 73,955 | | |
| | 18,700 | | | Keppel Corp., Ltd. | | | 166,978 | | |
| | 12,511 | | | SembCorp Industries Ltd. | | | 51,055 | | |
| | | | 291,988 | | |
| | | Machinery | |
| | 11,400 | | | SembCorp Marine Ltd. (a) | | | 46,797 | | |
| | | Media | |
| | 11,350 | | | Singapore Press Holdings
Ltd. (a) | | | 36,412 | | |
| | | Real Estate Investment Trusts
(REITs) | |
| | 18,000 | | | Ascendas Real Estate
Investment Trust REIT | | | 30,255 | | |
| | 26,704 | | | CapitaMall Trust REIT | | | 38,842 | | |
| | | | 69,097 | | |
| | | Real Estate Management &
Development | |
| | 30,000 | | | CapitaLand Ltd. | | | 71,273 | | |
| | 6,462 | | | City Developments Ltd. | | | 52,949 | | |
| | | | 124,222 | | |
| | | Road & Rail | |
| | 19,089 | | | ComfortDelGro Corp., Ltd. | | | 23,601 | | |
| | | Trading Companies & Distributors | |
| | 29,726 | | | Noble Group Ltd. (a) | | | 28,345 | | |
| | | | | Total Singapore | | | 2,141,218 | | |
| | | South Africa (0.4%) | |
| | | Beverages | |
| | 9,770 | | | SABMiller PLC | | | 410,426 | | |
NUMBER OF
SHARES | |
| | VALUE | |
| | | Sweden (3.3%) | |
| | | Building Products | |
| | 3,264 | | | Assa Abloy AB, Class B (a) | | $ | 95,133 | | |
| | | Commercial Banks | |
| | 24,832 | | | Nordea Bank AB | | | 220,194 | | |
| | 7,349 | | | Svenska Handelsbanken AB,
Class A | | | 238,140 | | |
| | | | 458,334 | | |
| | | Commercial Services &
Supplies | |
| | 4,869 | | | Securitas AB, Class B | | | 44,624 | | |
| | | Communications Equipment | |
| | 43,347 | | | Telefonaktiebolaget LM
Ericsson, Class B (d) | | | 429,517 | | |
| | | Construction & Engineering | |
| | 7,691 | | | Skanska AB, Class B (a) | | | 125,183 | | |
| | | Diversified Financial Services | |
| | 7,327 | | | Investor AB, Class B | | | 146,075 | | |
| | | Diversified Telecommunication
Services | |
| | 3,665 | | | Tele2 AB, Class B | | | 69,851 | | |
| | 26,725 | | | TeliaSonera AB | | | 178,649 | | |
| | | | 248,500 | | |
| | | Health Care Equipment &
Supplies | |
| | 3,440 | | | Getinge AB, Class B | | | 92,330 | | |
| | | Household Durables | |
| | 2,466 | | | Electrolux AB, Class B | | | 55,071 | | |
| | 3,614 | | | Husqvarna AB, Class B | | | 20,798 | | |
| | | | 75,869 | | |
| | | Machinery | |
| | 2,708 | | | Alfa Laval AB (a) | | | 53,988 | | |
| | 6,909 | | | Atlas Copco AB, Class A (a) | | | 164,468 | | |
| | 4,378 | | | Atlas Copco AB, Class B | | | 91,907 | | |
| | 9,100 | | | Sandvik AB | | | 144,191 | | |
| | 2,911 | | | SKF AB, Class B (a) | | | 69,080 | | |
| | 6,131 | | | Volvo AB, Class A | | | 84,924 | | |
See Notes to Financial Statements
27
Morgan Stanley International Fund
Portfolio of Investments n April 30, 2012 (unaudited) continued
NUMBER OF
SHARES | |
| | VALUE | |
| | 9,151 | | | Volvo AB, Class B | | $ | 126,891 | | |
| | | | 735,449 | | |
| | | Metals & Mining | |
| | 1,794 | | | Boliden AB | | | 28,720 | | |
| | 3,286 | | | SSAB AB, Class A (a) | | | 33,538 | | |
| | | | 62,258 | | |
| | | Oil, Gas & Consumable Fuels | |
| | 2,027 | | | Lundin Petroleum AB (d) | | | 40,321 | | |
| | | Paper & Forest Products | |
| | 859 | | | Holmen AB, Class B | | | 22,813 | | |
| | 9,059 | | | Svenska Cellulosa AB, Class B | | | 143,541 | | |
| | | | 166,354 | | |
| | | Specialty Retail | |
| | 10,681 | | | Hennes & Mauritz AB,
Class B (d) | | | 366,929 | | |
| | | Tobacco | |
| | 2,444 | | | Swedish Match AB | | | 99,341 | | |
| | | | | Total Sweden | | | 3,186,217 | | |
| | | Switzerland (8.3%) | |
| | | Building Products | |
| | 418 | | | Geberit AG (Registered) (d) | | | 88,376 | | |
| | | Capital Markets | |
| | 7,663 | | | Credit Suisse Group AG
(Registered) | | | 183,290 | | |
| | 1,827 | | | GAM Holding AG (d) | | | 23,450 | | |
| | 2,435 | | | Julius Baer Group Ltd. (d) | | | 93,226 | | |
| | 25,115 | | | UBS AG (Registered) (d) | | | 313,505 | | |
| | | | 613,471 | | |
| | | Chemicals | |
| | 68 | | | Givaudan SA (Registered) (d) | | | 66,003 | | |
| | 1,918 | | | Syngenta AG (Registered) | | | 673,461 | | |
| | | | 739,464 | | |
| | | Computers & Peripherals | |
| | 2,768 | | | Logitech International SA
(Registered) (a)(d) | | | 28,270 | | |
| | | Construction Materials | |
| | 2,195 | | | Holcim Ltd. (Registered) (d) | | | 136,636 | | |
NUMBER OF
SHARES | |
| | VALUE | |
| | | Diversified Financial Services | |
| �� | 76 | | | Pargesa Holding SA | | $ | 5,087 | | |
| | | Diversified Telecommunication
Services | |
| | 255 | | | Swisscom AG (Registered) (a) | | | 94,988 | | |
| | | Electrical Equipment | |
| | 32,443 | | | ABB Ltd. (Registered) (d) | | | 591,205 | | |
| | | Food Products | |
| | 35,151 | | | Nestle SA (Registered) | | | 2,153,248 | | |
| | | Health Care Equipment &
Supplies | |
| | 144 | | | Straumann Holding AG
(Registered) | | | 23,893 | | |
| | 977 | | | Synthes, Inc. (f) | | | 168,457 | | |
| | | | 192,350 | | |
| | | Insurance | |
| | 519 | | | Baloise-Holding AG
(Registered) | | | 40,169 | | |
| | 294 | | | Swiss Life Holding AG
(Registered) (d) | | | 30,075 | | |
| | 3,577 | | | Swiss Re AG (d) | | | 224,240 | | |
| | 1,090 | | | Zurich Insurance Group AG (d) | | | 266,601 | | |
| | | | 561,085 | | |
| | | Life Sciences Tools & Services | |
| | 401 | | | Lonza Group AG
(Registered) (d) | | | 18,083 | | |
| | | Machinery | |
| | 559 | | | Schindler Holding AG | | | 72,304 | | |
| | | Pharmaceuticals | |
| | 22,312 | | | Novartis AG (Registered) | | | 1,230,337 | | |
| | 6,721 | | | Roche Holding AG
(Genusschein) | | | 1,227,722 | | |
| | | | 2,458,059 | | |
| | | Professional Services | |
| | 193 | | | Adecco SA (Registered) (d) | | | 9,398 | | |
| | 22 | | | SGS SA (Registered) | | | 42,490 | | |
| | | | 51,888 | | |
See Notes to Financial Statements
28
Morgan Stanley International Fund
Portfolio of Investments n April 30, 2012 (unaudited) continued
NUMBER OF
SHARES | |
| | VALUE | |
| | | Textiles, Apparel & Luxury Goods | |
| | 1,585 | | | Cie Financiere Richemont SA | | $ | 97,966 | | |
| | 107 | | | Swatch Group AG (The) | | | 49,347 | | |
| | 237 | | | Swatch Group AG (The)
(Registered) | | | 18,905 | | |
| | | | 166,218 | | |
| | | | | Total Switzerland | | | 7,970,732 | | |
| | | Thailand (0.3%) | |
| | | Commercial Banks | |
| | 5,500 | | | Bangkok Bank PCL | | | 34,163 | | |
| | 9,900 | | | Bangkok Bank PCL (Foreign
Registered) | | | 62,459 | | |
| | 22,100 | | | Bank of Ayudhya PCL
(Foreign) | | | 20,303 | | |
| | 7,000 | | | Kasikornbank PCL | | | 37,219 | | |
| | 13,600 | | | Kasikornbank PCL (Foreign) | | | 72,091 | | |
| | 30,600 | | | Krung Thai Bank PCL | | | 17,912 | | |
| | 17,800 | | | Siam Commercial Bank PCL
(Foreign) | | | 87,119 | | |
| | | | | Total Thailand | | | 331,266 | | |
| | | United Kingdom (22.4%) | |
| | | Aerospace & Defense | |
| | 34,102 | | | BAE Systems PLC | | | 163,376 | | |
| | 18,140 | | | Cobham PLC | | | 66,680 | | |
| | 16,402 | | | Rolls-Royce Holdings PLC (d) | | | 219,206 | | |
| | | | 449,262 | | |
| | | Beverages | |
| | 24,840 | | | Diageo PLC | | | 625,252 | | |
| | | Capital Markets | |
| | 7,704 | | | 3i Group PLC | | | 23,893 | | |
| | 5,144 | | | ICAP PLC | | | 31,698 | | |
| | 3,373 | | | Investec PLC | | | 19,444 | | |
| | 20,565 | | | Man Group PLC | | | 34,543 | | |
| | 2,284 | | | Schroders PLC | | | 52,561 | | |
| | | | 162,139 | | |
| | | Chemicals | |
| | 1,911 | | | Johnson Matthey PLC | | | 71,766 | | |
NUMBER OF
SHARES | |
| | VALUE | |
| | | Commercial Banks | |
| | 66,316 | | | Barclays PLC | | $ | 234,890 | | |
| | 215,622 | | | HSBC Holdings PLC | | | 1,942,478 | | |
| | 94,546 | | | Lloyds Banking Group PLC (d) | | | 47,581 | | |
| | 177,365 | | | Royal Bank of Scotland Group
PLC (d) | | | 69,860 | | |
| | 27,563 | | | Standard Chartered PLC | | | 673,664 | | |
| | | | 2,968,473 | | |
| | | Commercial Services &
Supplies | |
| | 12,385 | | | Aggreko PLC | | | 452,442 | | |
| | 4,556 | | | G4S PLC | | | 20,674 | | |
| | 1,852 | | | Serco Group PLC | | | 16,305 | | |
| | | | 489,421 | | |
| | | Construction & Engineering | |
| | 14,043 | | | Balfour Beatty PLC | | | 59,483 | | |
| | | Containers & Packaging | |
| | 7,876 | | | Rexam PLC | | | 54,962 | | |
| | | Diversified Telecommunication
Services | |
| | 93,863 | | | BT Group PLC | | | 321,112 | | |
| | | Electric Utilities | |
| | 13,950 | | | SSE PLC | | | 299,067 | | |
| | | Energy Equipment & Services | |
| | 3,695 | | | AMEC PLC | | | 68,061 | | |
| | 2,898 | | | Petrofac Ltd. | | | 81,600 | | |
| | | | 149,661 | | |
| | | Food & Staples Retailing | |
| | 13,046 | | | J Sainsbury PLC | | | 65,190 | | |
| | 67,485 | | | Tesco PLC | | | 347,566 | | |
| | | | 412,756 | | |
| | | Food Products | |
| | 10,182 | | | Unilever PLC | | | 347,507 | | |
| | | Health Care Equipment &
Supplies | |
| | 17,251 | | | Smith & Nephew PLC | | | 169,800 | | |
| | | Hotels, Restaurants & Leisure | |
| | 3,425 | | | Carnival PLC | | | 111,336 | | |
See Notes to Financial Statements
29
Morgan Stanley International Fund
Portfolio of Investments n April 30, 2012 (unaudited) continued
NUMBER OF
SHARES | |
| | VALUE | |
| | 24,002 | | | Compass Group PLC | | $ | 250,856 | | |
| | 4,888 | | | Intercontinental Hotels
Group PLC | | | 116,373 | | |
| | 9,998 | | | TUI Travel PLC (a) | | | 30,991 | | |
| | 2,883 | | | Whitbread PLC | | | 90,161 | | |
| | | | 599,717 | | |
| | | Household Products | |
| | 7,345 | | | Reckitt Benckiser Group PLC | | | 427,578 | | |
| | | Independent Power Producers &
Energy Traders | |
| | 4,314 | | | International Power PLC | | | 29,195 | | |
| | | Industrial Conglomerates | |
| | 3,494 | | | Smiths Group PLC | | | 60,673 | | |
| | | Insurance | |
| | 1,798 | | | Admiral Group PLC | | | 35,337 | | |
| | 26,507 | | | Aviva PLC | | | 132,539 | | |
| | 71,100 | | | Legal & General Group PLC | | | 135,696 | | |
| | 44,499 | | | Old Mutual PLC | | | 106,737 | | |
| | 20,110 | | | Prudential PLC | | | 246,243 | | |
| | 3,330 | | | Resolution Ltd. | | | 12,095 | | |
| | 34,960 | | | RSA Insurance Group PLC | | | 59,573 | | |
| | 19,165 | | | Standard Life PLC | | | 69,546 | | |
| | | | 797,766 | | |
| | | Machinery | |
| | 6,676 | | | Invensys PLC | | | 24,063 | | |
| | | Media | |
| | 23,145 | | | British Sky Broadcasting
Group PLC | | | 254,670 | | |
| | 13,002 | | | Pearson PLC | | | 244,771 | | |
| | 15,530 | | | Reed Elsevier PLC | | | 128,539 | | |
| | 49,043 | | | WPP PLC | | | 663,398 | | |
| | | | 1,291,378 | | |
| | | Metals & Mining | |
| | 11,462 | | | Anglo American PLC | | | 440,488 | | |
| | 7,988 | | | BHP Billiton PLC | | | 255,969 | | |
| | 13,612 | | | Rio Tinto PLC | | | 758,270 | | |
| | 12,598 | | | Xstrata PLC | | | 240,743 | | |
| | | | 1,695,470 | | |
NUMBER OF
SHARES | |
| | VALUE | |
| | | Multi-Utilities | |
| | 33,839 | | | Centrica PLC | | $ | 168,541 | | |
| | 32,306 | | | National Grid PLC | | | 348,918 | | |
| | | | 517,459 | | |
| | | Multiline Retail | |
| | 20,663 | | | Marks & Spencer Group PLC | | | 119,717 | | |
| | 2,785 | | | Next PLC | | | 132,384 | | |
| | | | 252,101 | | |
| | | Oil, Gas & Consumable Fuels | |
| | 32,972 | | | BG Group PLC | | | 776,166 | | |
| | 126,168 | | | BP PLC | | | 911,173 | | |
| | 36,068 | | | Royal Dutch Shell PLC,
Class A | | | 1,283,667 | | |
| | 26,821 | | | Royal Dutch Shell PLC,
Class B | | | 977,852 | | |
| | 557 | | | Tullow Oil PLC | | | 13,867 | | |
| | | | 3,962,725 | | |
| | | Pharmaceuticals | |
| | 13,431 | | | AstraZeneca PLC | | | 588,414 | | |
| | 49,530 | | | GlaxoSmithKline PLC | | | 1,145,447 | | |
| | | | 1,733,861 | | |
| | | Professional Services | |
| | 1,773 | | | Capita Group PLC (The) | | | 19,077 | | |
| | 8,775 | | | Experian PLC | | | 138,493 | | |
| | | | 157,570 | | |
| | | Real Estate Investment Trusts
(REITs) | |
| | 9,395 | | | British Land Co., PLC REIT | | | 74,620 | | |
| | 6,556 | | | Capital Shopping Centres
Group PLC REIT | | | 34,579 | | |
| | 8,687 | | | Hammerson PLC REIT | | | 58,874 | | |
| | 8,271 | | | Land Securities Group PLC
REIT | | | 97,652 | | |
| | 8,784 | | | Segro PLC REIT | | | 31,519 | | |
| | | | 297,244 | | |
| | | Semiconductors &
Semiconductor Equipment | |
| | 25,507 | | | ARM Holdings PLC | | | 216,911 | | |
See Notes to Financial Statements
30
Morgan Stanley International Fund
Portfolio of Investments n April 30, 2012 (unaudited) continued
NUMBER OF
SHARES | |
| | VALUE | |
| | | Software | |
| | 20,512 | | | Sage Group PLC (The) | | $ | 95,240 | | |
| | | Specialty Retail | |
| | 15,420 | | | Kingfisher PLC | | | 72,698 | | |
| | | Textiles, Apparel & Luxury
Goods | |
| | 1,565 | | | Burberry Group PLC | | | 37,717 | | |
| | | Tobacco | |
| | 13,243 | | | British American Tobacco PLC | | | 678,934 | | |
| | 5,837 | | | Imperial Tobacco Group PLC | | | 233,412 | | |
| | | | 912,346 | | |
| | | Trading Companies &
Distributors | |
| | 4,063 | | | Bunzl PLC | | | 67,455 | | |
| | 783 | | | Wolseley PLC | | | 29,773 | | |
| | | | 97,228 | | |
| | | Water Utilities | |
| | 4,677 | | | Severn Trent PLC | | | 128,276 | | |
| | 1,972 | | | United Utilities Group PLC | | | 19,794 | | |
| | | | 148,070 | | |
| | | Wireless Telecommunication
Services | |
| | 593,962 | | | Vodafone Group PLC | | | 1,643,519 | | |
| | | | | Total United Kingdom | | | 21,651,190 | | |
| | | United States (0.0%) | |
| | | Real Estate Management &
Development | |
| | 1,774 | | | Lend Lease Group REIT
(Stapled Securities) (b)(c) | | | 13,771 | | |
| | | | | Total Common Stocks
(Cost $83,584,338) | | | 83,300,899 | | |
| | | Preferred Stock (0.0%) | |
| | | United Kingdom | |
| | | Aerospace & Defense | |
| | 1,738,612 | | | Rolls-Royce Holdings PLC,
Class C
(Cost $2,806) (d) | | | 2,822 | | |
NUMBER OF
SHARES | |
| | VALUE | |
| | | Rights (0.0%) | |
| | | Brazil | |
| | 1 | | | Cia de Bebidas das
Americas (d) | | $ | — | | |
| | 54 | | | Itausa - Investimentos Itau
SA (d) | | | 16 | | |
| | | | | Total Rights
(Cost $0) | | | 16 | | |
PRINCIPAL
AMOUNT IN
THOUSANDS | | | | | |
| | | Short-Term Investments (18.7%) | |
| | | Securities held as Collateral
on Loaned Securities (7.4%) | |
| | | Repurchase Agreements (2.0%) | |
| $ | 761 | | | Barclays Capital, Inc.
(0.20%, dated 04/30/12,
due 05/01/12; proceeds
$760,572; fully collateralized
by a U.S. Government
Agency; Federal Home Loan
Mortgage Corporation
4.00% due 08/01/41;
valued at $775,779) | | | 760,568 | | |
| | 1,184 | | | Merrill Lynch & Co., Inc.
(0.21%, dated 04/30/12,
due 05/01/12; proceeds
$1,184,320; fully
collateralized by a U.S.
Government Agency;
Federal Home Loan
Mortgage Corporation
4.50% due 07/01/41;
valued at $1,207,999) | | | 1,184,312 | | |
| | | | | Total Repurchase Agreements
(Cost $1,944,880) | | | 1,944,880 | | |
See Notes to Financial Statements
31
Morgan Stanley International Fund
Portfolio of Investments n April 30, 2012 (unaudited) continued
NUMBER OF
SHARES (000) | |
| | VALUE | |
| | | Investment Company (5.4%) | | | |
| | 5,237 | | | Morgan Stanley Institutional
Liquidity Funds - Money Market
Portfolio - Institutional Class
(See Note 6)
(Cost $5,237,227) | | $ | 5,237,227 | | |
| | | Total Securities held as
Collateral on
Loaned Securities
(Cost $7,182,107) | | | 7,182,107 | | |
| | | Investment Company (11.3%) | | | |
| | 10,903 | | | Morgan Stanley Institutional
Liquidity Funds - Money Market
Portfolio - Institutional Class
(See Note 6)
(Cost $10,902,618) | | | 10,902,618 | | |
| | | Total Short-Term
Investments
(Cost $18,084,725) | | | 18,084,725 | | |
Total Investments
(Cost $101,671,869) (g) | | | 105.1 | % | | | 101,388,462 | | |
Liabilities in Excess of
Other Assets | | | (5.1 | ) | | | (4,938,432 | ) | |
| Net Assets | | | 100.0 | % | | $ | 96,450,030 | | |
CDI CHESS Depositary Interest.
CVA Certificaten Van Aandelen.
FDR Fiduciary Depositary Receipt.
VVPR Verminderde Voorheffing Précompte Réduit.
(a) All or a portion of this security was on loan at April 30, 2012.
(b) Comprised of securities in separate entities that are traded as a single stapled security.
(c) Consists of one or more classes of securities traded together as a unit; stocks with attached warrants.
(d) Non-income producing security.
(e) Security trades on the Hong Kong exchange.
(f) 144A security - Certain conditions for public sale may exist. Unless otherwise noted, these securities are deemed to be liquid.
(g) Securities are available for collateral in connection with open foreign currency exchange contracts and futures contracts.
See Notes to Financial Statements
32
Morgan Stanley International Fund
Portfolio of Investments n April 30, 2012 (unaudited) continued
Foreign Currency Exchange Contracts Open at April 30, 2012:
| COUNTERPARTY | | CONTRACTS
TO DELIVER | | IN EXCHANGE
FOR | | DELIVERY
DATE | | UNREALIZED
APPRECIATION
(DEPRECIATION) | |
| Mellon Bank | | $ | 1,219,186 | | | AUD | 1,176,991 | | | 05/24/12 | | $ | 4,312 | | |
| Credit Suisse London Branch | | $ | 104,164 | | | CAD | 103,049 | | | 05/24/12 | | | 102 | | |
| Credit Suisse London Branch | | $ | 186,431 | | | CHF | 170,421 | | | 05/24/12 | | | 1,371 | | |
| UBS AG | | $ | 16,564 | | | CHF | 15,143 | | | 05/24/12 | | | 123 | | |
| JPMorgan Chase Bank | | $ | 775,081 | | | EUR | 589,735 | | | 05/24/12 | | | 5,613 | | |
| Credit Suisse London Branch | | $ | 5,154,188 | | | EUR | 3,921,580 | | | 05/24/12 | | | 37,221 | | |
| Deutsche Bank AG London | | $ | 1,784,277 | | | EUR | 1,357,484 | | | 05/24/12 | | | 12,768 | | |
| Mellon Bank | | $ | 909,711 | | | EUR | 692,143 | | | 05/24/12 | | | 6,551 | | |
| Royal Bank of Scotland | | $ | 277,949 | | | EUR | 211,472 | | | 05/24/12 | | | 2,000 | | |
| UBS AG | | $ | 1,132,564 | | | EUR | 861,718 | | | 05/24/12 | | | 8,182 | | |
| UBS AG | | $ | 490,481 | | | GBP | 308,015 | | | 05/24/12 | | | 9,330 | | |
| State Street Bank and Trust Co. | | $ | 150,611 | | | HKD | 1,168,596 | | | 05/24/12 | | | 19 | | |
| Royal Bank of Scotland | | $ | 527,456 | | | JPY | 42,594,189 | | | 05/24/12 | | | 6,135 | | |
| Credit Suisse London Branch | | CAD | 1,092,758 | | | $ | 1,105,647 | | | 05/24/12 | | | (11 | ) | |
| Credit Suisse London Branch | | CHF | 185,563 | | | $ | 202,880 | | | 05/24/12 | | | (1,609 | ) | |
| UBS AG | | EUR | 176,593 | | | $ | 232,138 | | | 05/24/12 | | | (1,637 | ) | |
| Deutsche Bank AG London | | GBP | 375,886 | | | $ | 598,538 | | | 05/24/12 | | | (11,404 | ) | |
| UBS AG | | GBP | 96,366 | | | $ | 154,723 | | | 05/24/12 | | | (1,648 | ) | |
| | | | | Net Unrealized Appreciation | | | | $ | 77,418 | | |
See Notes to Financial Statements
33
Morgan Stanley International Fund
Portfolio of Investments n April 30, 2012 (unaudited) continued
Futures Contracts Open at April 30, 2012:
NUMBER OF
CONTRACTS | | LONG/SHORT | | DESCRIPTION, DELIVERY
MONTH AND YEAR | | UNDERLYING FACE
AMOUNT AT VALUE | | UNREALIZED
APPRECIATION
(DEPRECIATION) | |
| | 18 | | | Long | | DAX Index,
Jun-12 | | $ | 4,035,632 | | | $ | (102,382 | ) | |
| | 25 | | | Long | | TOPIX Index,
Jun-12 | | | 2,512,838 | | | | (61,377 | ) | |
| | 17 | | | Long | | Hang Seng Index,
May-12 | | | 2,294,085 | | | | 47,425 | | |
| | 12 | | | Long | | ASX SPI 200 Index,
Jun-12 | | | 1,374,436 | | | | 56,265 | | |
| | 11 | | | Long | | FTSE 100 Index,
Jun-12 | | | 1,020,236 | | | | (15,352 | ) | |
| | 14 | | | Long | | Hang Seng China ENT Index,
May-12 | | | 993,523 | | | | 26,525 | | |
| | | | | | | Net Unrealized Depreciation | | | | $ | (48,896 | ) | |
Currency Abbreviations:
AUD Australian Dollar.
CAD Canadian Dollar.
CHF Swiss Franc.
EUR Euro.
GBP British Pound.
HKD Hong Kong Dollar.
JPY Japanese Yen.
See Notes to Financial Statements
34
Morgan Stanley International Fund
Summary of Investments n April 30, 2012 (unaudited)
| INDUSTRY | | VALUE | | PERCENT OF
TOTAL
INVESTMENTS | |
| Investment Companies | | $ | 10,902,618 | | | | 11.6 | % | |
| Commercial Banks | | | 9,563,976 | | | | 10.1 | | |
| Pharmaceuticals | | | 7,444,253 | | | | 7.9 | | |
| Oil, Gas & Consumable Fuels | | | 5,656,567 | | | | 6.0 | | |
| Metals & Mining | | | 4,346,841 | | | | 4.6 | | |
| Chemicals | | | 3,726,472 | | | | 4.0 | | |
| Food Products | | | 3,524,043 | | | | 3.7 | | |
| Insurance | | | 3,215,429 | | | | 3.4 | | |
| Automobiles | | | 2,941,875 | | | | 3.1 | | |
| Machinery | | | 2,888,559 | | | | 3.1 | | |
Diversified Telecommunication
Services | | | 2,438,349 | | | | 2.6 | | |
| Industrial Conglomerates | | | 2,207,090 | | | | 2.3 | | |
Wireless Telecommunication
Services | | | 2,150,535 | | | | 2.3 | | |
| Beverages | | | 1,722,596 | | | | 1.8 | | |
| Media | | | 1,697,864 | | | | 1.8 | | |
Electronic Equipment,
Instruments & Components | | | 1,557,295 | | | | 1.7 | | |
Real Estate Management &
Development | | | 1,486,447 | | | | 1.6 | | |
Semiconductors &
Semiconductor Equipment | | | 1,484,261 | | | | 1.6 | | |
| Electrical Equipment | | | 1,442,570 | | | | 1.5 | | |
| Capital Markets | | | 1,347,098 | | | | 1.4 | | |
| Tobacco | | | 1,197,514 | | | | 1.3 | | |
Real Estate Investment Trusts
(REITs) | | | 1,142,304 | | | | 1.2 | | |
| Food & Staples Retailing | | | 1,138,587 | | | | 1.2 | | |
Trading Companies &
Distributors | | | 1,112,458 | | | | 1.2 | | |
| Software | | | 1,111,307 | | | | 1.2 | | |
| Electric Utilities | | | 1,086,015 | | | | 1.2 | | |
| Specialty Retail | | | 904,339 | | | | 1.0 | | |
| Auto Components | | | 901,411 | | | | 1.0 | | |
| Construction & Engineering | | | 900,511 | | | | 1.0 | | |
| Hotels, Restaurants & Leisure | | | 880,463 | | | | 0.9 | | |
Commercial Services &
Supplies | | | 812,503 | | | | 0.9 | | |
| Diversified Financial Services | | | 800,249 | | | | 0.8 | | |
| Multi-Utilities | | | 772,562 | | | | 0.8 | | |
Health Care Equipment &
Supplies | | | 723,429 | | | | 0.8 | | |
| Road & Rail | | | 721,321 | | | | 0.8 | | |
| Household Durables | | | 696,130 | | | | 0.7 | | |
| Communications Equipment | | | 649,124 | | | | 0.7 | | |
| INDUSTRY | | VALUE | | PERCENT OF
TOTAL
INVESTMENTS | |
| Household Products | | $ | 625,207 | | | | 0.7 | % | |
| Energy Equipment & Services | | | 621,730 | | | | 0.7 | | |
| Aerospace & Defense | | | 595,413 | | | | 0.6 | | |
| Building Products | | | 478,812 | | | | 0.5 | | |
| Computers & Peripherals | | | 471,399 | | | | 0.5 | | |
| Paper & Forest Products | | | 411,461 | | | | 0.4 | | |
| Multiline Retail | | | 355,005 | | | | 0.4 | | |
| Office Electronics | | | 349,727 | | | | 0.4 | | |
| Construction Materials | | | 313,510 | | | | 0.3 | | |
Textiles, Apparel & Luxury
Goods | | | 287,723 | | | | 0.3 | | |
| Marine | | | 283,309 | | | | 0.3 | | |
| Air Freight & Logistics | | | 281,505 | | | | 0.3 | | |
| Professional Services | | | 251,947 | | | | 0.3 | | |
| Leisure Equipment & Products | | | 250,866 | | | | 0.3 | | |
Information Technology
Services | | | 223,748 | | | | 0.2 | | |
Health Care Providers &
Services | | | 182,781 | | | | 0.2 | | |
| Water Utilities | | | 155,923 | | | | 0.2 | | |
| Containers & Packaging | | | 129,870 | | | | 0.1 | | |
Independent Power
Producers & Energy Traders | | | 111,805 | | | | 0.1 | | |
| Personal Products | | | 103,814 | | | | 0.1 | | |
| Airlines | | | 98,840 | | | | 0.1 | | |
| Gas Utilities | | | 92,011 | | | | 0.1 | | |
| Internet Software & Services | | | 79,848 | | | | 0.1 | | |
Diversified Consumer
Services | | | 42,358 | | | | 0.0 | + | |
| Transportation Infrastructure | | | 39,445 | | | | 0.0 | + | |
| Consumer Finance | | | 34,549 | | | | 0.0 | + | |
| Biotechnology | | | 19,519 | | | | 0.0 | + | |
Life Sciences Tools &
Services | | | 18,083 | | | | 0.0 | + | |
| Distributors | | | 1,182 | | | | 0.0 | + | |
| | | $ | 94,206,355 | ++ | | | 100.0 | % | |
+ Value is less than 0.05%.
++ Does not reflect the value of securities held as collateral on loaned securities. Also does not include open long futures contracts with an underlying face amount of $12,230,750 with net unrealized depreciation of $48,896 and open foreign currency exchange contracts with net unrealized appreciation of $77,418.
See Notes to Financial Statements
35
Morgan Stanley International Fund
Financial Statements
Statement of Assets and Liabilities
April 30, 2012 (unaudited)
| Assets: | |
| Investments in securities, at value (cost $84,844,539) (including $6,932,948 for securities loaned) | | $ | 84,893,512 | | |
| Investment in affiliate, at value (cost $16,827,330) | | | 16,494,950 | | |
| Total investments in securities, at value (cost $101,671,869) | | | 101,388,462 | | |
| Unrealized appreciation on open foreign currency exchange contracts | | | 93,727 | | |
| Foreign currency (cost of $615,871) | | | 618,891 | | |
| Receivable for: | |
| Variation margin | | | 796,074 | | |
| Investments sold | | | 516,859 | | |
| Dividends | | | 516,191 | | |
| Foreign withholding taxes reclaimed | | | 119,802 | | |
| Interest and dividends from affiliates | | | 7,144 | | |
| Shares of beneficial interest sold | | | 1,519 | | |
| Prepaid expenses and other assets | | | 25,170 | | |
| Total Assets | | | 104,083,839 | | |
| Liabilities: | |
| Collateral on securities loaned, at value | | | 7,182,107 | | |
| Unrealized depreciation on open foreign currency exchange contracts | | | 16,309 | | |
| Payable for: | |
| Shares of beneficial interest redeemed | | | 149,365 | | |
| Transfer agent fee | | | 83,870 | | |
| Advisory fee | | | 51,834 | | |
| Distribution fee | | | 30,879 | | |
| Administration fee | | | 6,536 | | |
| Investments purchased | | | 2,726 | | |
| Deferred Capital Gain Country Tax | | | 7,863 | | |
| Accrued expenses and other payables | | | 102,320 | | |
| Total Liabilities | | | 7,633,809 | | |
| Net Assets | | $ | 96,450,030 | | |
| Composition of Net Assets: | |
| Paid-in-capital | | $ | 113,614,628 | | |
| Net unrealized depreciation (Net of $7,863 Deferred Capital Gain Country Tax) | | | (249,793 | ) | |
| Accumulated undistributed net investment income | | | 116,305 | | |
| Accumulated net realized loss | | | (17,031,110 | ) | |
| Net Assets | | $ | 96,450,030 | | |
| Class A Shares: | |
| Net Assets | | $ | 79,225,543 | | |
| Shares Outstanding (unlimited shares authorized, $.01 par value) | | | 6,978,865 | | |
| Net Asset Value Per Share | | $ | 11.35 | | |
Maximum Offering Price Per Share,
(net asset value plus 5.54% of net asset value) | | $ | 11.98 | | |
| Class B Shares: | |
| Net Assets | | $ | 5,195,338 | | |
| Shares Outstanding (unlimited shares authorized, $.01 par value) | | | 461,071 | | |
| Net Asset Value Per Share | | $ | 11.27 | | |
| Class C Shares: | |
| Net Assets | | $ | 11,171,070 | | |
| Shares Outstanding (unlimited shares authorized, $.01 par value) | | | 1,006,115 | | |
| Net Asset Value Per Share | | $ | 11.10 | | |
| Class I Shares: | |
| Net Assets | | $ | 691,138 | | |
| Shares Outstanding (unlimited shares authorized, $.01 par value) | | | 60,512 | | |
| Net Asset Value Per Share | | $ | 11.42 | | |
| Class R Shares: | |
| Net Assets | | $ | 80,829 | | |
| Shares Outstanding (unlimited shares authorized, $.01 par value) | | | 7,150 | | |
| Net Asset Value Per Share | | $ | 11.30 | | |
| Class W Shares: | |
| Net Assets | | $ | 86,112 | | |
| Shares Outstanding (unlimited shares authorized, $.01 par value) | | | 7,604 | | |
| Net Asset Value Per Share | | $ | 11.32 | | |
See Notes to Financial Statements
36
Morgan Stanley International Fund
Financial Statements continued
Statement of Operations
For the six months ended April 30, 2012 (unaudited)
Net Investment Income:
Income | |
| Dividends (net of $130,824 foreign withholding tax) | | $ | 1,488,262 | | |
| Income from securities loaned - net | | | 24,749 | | |
| Dividends from affiliates (Note 6) | | | 13,037 | | |
| Interest | | | 118 | | |
| Total Income | | | 1,526,166 | | |
| Expenses | |
| Advisory fee (Note 4) | | | 317,555 | | |
| Distribution fee (Class A shares) (Note 5) | | | 99,242 | | |
| Distribution fee (Class B shares) (Note 5) | | | 31,668 | | |
| Distribution fee (Class C shares) (Note 5) | | | 55,655 | | |
| Distribution fee (Class R shares) (Note 5) | | | 195 | | |
| Distribution fee (Class W shares) (Note 5) | | | 146 | | |
| Transfer agent fees and expenses | | | 132,449 | | |
| Custodian fees | | | 75,084 | | |
| Administration fee (Note 4) | | | 39,096 | | |
| Shareholder reports and notices | | | 36,620 | | |
| Registration fees | | | 36,011 | | |
| Professional fees | | | 35,105 | | |
| Trustees' fees and expenses | | | 1,822 | | |
| Other | | | 45,016 | | |
| Total Expenses | | | 905,664 | | |
| Less: rebate from Morgan Stanley affiliated cash sweep (Note 6) | | | (8,441 | ) | |
| Net Expenses | | | 897,223 | | |
| Net Investment Income | | | 628,943 | | |
Realized and Unrealized Gain (Loss):
Realized Gain (Loss) on: | |
| Investments | | | 1,176,861 | | |
| Futures contracts | | | 831,348 | | |
| Foreign currency exchange contracts | | | (468,238 | ) | |
| Foreign currency translation | | | 149 | | |
| Net Realized Gain | | | 1,540,120 | | |
| Change in Unrealized Appreciation/Depreciation on: | |
| Investments (Net of Increase in Deferred Capital Gain Country tax accruals of $7,319) | | | 561,529 | | |
| Investments in affiliates (Note 6) | | | 37,739 | | |
| Futures contracts | | | (501,682 | ) | |
| Foreign currency exchange contracts | | | (32,719 | ) | |
| Foreign currency translation | | | 23,163 | | |
| Net Change in Unrealized Appreciation/Depreciation | | | 88,030 | | |
| Net Gain | | | 1,628,150 | | |
| Net Increase | | $ | 2,257,093 | | |
See Notes to Financial Statements
37
Morgan Stanley International Fund
Financial Statements continued
Statements of Changes in Net Assets
| | | FOR THE SIX
MONTHS ENDED | | FOR THE YEAR
ENDED | |
| | | APRIL 30, 2012 | | OCTOBER 31, 2011 | |
| | | (unaudited) | | | |
Increase (Decrease) in Net Assets:
Operations: | |
| Net investment income | | $ | 628,943 | | | $ | 1,457,488 | | |
| Net realized gain | | | 1,540,120 | | | | 3,725,183 | | |
| Net change in unrealized appreciation/depreciation | | | 88,030 | | | | (14,190,118 | ) | |
| Net Increase (Decrease) | | | 2,257,093 | | | | (9,007,447 | ) | |
| Dividends to Shareholders from Net Investment Income: | |
| Class A shares | | | (887,405 | ) | | | (1,252,005 | ) | |
| Class B shares | | | — | | | | (29,130 | ) | |
| Class C shares | | | (18,007 | ) | | | (73,316 | ) | |
| Class I shares | | | (8,073 | ) | | | (9,843 | ) | |
| Class R shares | | | (666 | ) | | | (921 | ) | |
| Class W shares | | | (857 | ) | | | (1,057 | ) | |
| Total Dividends | | | (915,008 | ) | | | (1,366,272 | ) | |
| Net decrease from transactions in shares of beneficial interest | | | (10,292,472 | ) | | | (22,590,414 | ) | |
| Net Decrease | | | (8,950,387 | ) | | | (32,964,133 | ) | |
| Net Assets: | |
| Beginning of period | | | 105,400,417 | | | | 138,364,550 | | |
End of Period
(Including accumulated undistributed net investment income of $116,305
and $402,370, respectively) | | $ | 96,450,030 | | | $ | 105,400,417 | | |
See Notes to Financial Statements
38
Morgan Stanley International Fund
Notes to Financial Statements n April 30, 2012 (unaudited)
1. Organization and Accounting Policies
Morgan Stanley International Fund (the "Fund") is registered under the Investment Company Act of 1940, as amended (the "Act"), as a diversified, open-end management investment company. The Fund's investment objective is long-term capital growth. The Fund was organized as a Massachusetts business trust on October 23, 1998 and commenced operations June 28, 1999. On March 31, 2008, the Fund commenced offering Class R and Class W shares.
The Fund offers Class A shares, Class B shares, Class C shares, Class I shares, Class R shares and Class W shares. The six classes are substantially the same except that most Class A shares are subject to a sales charge imposed at the time of purchase and some Class A shares, and most Class B shares and Class C shares are subject to a contingent deferred sales charge imposed on shares redeemed within eighteen months, six years and one year, respectively. Class I shares, Class R shares, and Class W shares are not subject to a sales charge. Additionally, Class A shares, Class B shares, Class C shares, Class R shares and Class W shares incur distribution expenses.
The Fund will assess a 2% redemption fee, on Class A shares, Class B shares, Class C shares, Class I shares, Class R shares and Class W shares, which is paid directly to the Fund, for shares redeemed or exchanged within thirty days of purchase, subject to certain exceptions. The redemption fee is designed to protect the Fund and its remaining shareholders from the effects of short-term trading. These fees, if any, are included in the Statements of Changes in Net Assets.
The following is a summary of significant accounting policies:
A. Valuation of Investments — (1) For equity securities traded on foreign exchanges, the last reported sale price or the latest bid price may be used if there were no sales on a particular day; (2) an equity portfolio security listed or traded on the New York Stock Exchange ("NYSE") or American Stock Exchange or other domestic exchange is valued at its latest sale price prior to the time when assets are valued; if there were no sales that day, the security is valued at the mean between the last reported bid and ask price; (3) an equity portfolio security listed or traded on the Nasdaq is valued at the Nasdaq Official Closing Price; if there were no sales that day, the security is valued at the mean between the last reported bid and ask price; (4) all other domestic securities for which over-the-counter market quotations are readily available are valued at the mean between the last reported bid and ask price. In cases where a security is traded on more than one domestic exchange, the security is valued on the exchange designated as the primary market; (5) futures are valued at the latest price published by the commodities exchange on which they trade; (6) when market quotations are not readily available, including circumstances under which Morgan Stanley Investment Management Inc. (the "Adviser"), a wholly owned subsidiary of Morgan Stanley, determines that the latest sale price, the bid price or the mean between the last reported bid and ask price do not reflect a security's fair value, portfolio securities are valued at their fair value as determined in good faith under procedures established by and
39
Morgan Stanley International Fund
Notes to Financial Statements n April 30, 2012 (unaudited) continued
under the general supervision of the Fund's Trustees. Occasionally, developments affecting the closing prices of securities and other assets may occur between the times at which valuations of such securities are determined (that is, close of the foreign market on which the securities trade) and the close of business on the NYSE. If developments occur during such periods that are expected to materially affect the value of such securities, such valuations may be adjusted to reflect the estimated fair value of such securities as of the close of the NYSE, as determined in good faith by the Fund's Trustees or by the Adviser using a pricing service and/or procedures approved by the Trustees of the Fund; (7) certain portfolio securities may be valued by an outside pricing service approved by the Fund's Trustees; (8) investments in mutual funds, including the Morgan Stanley Institutional Liquidity Funds, are valued at the net asset value as of the close of each business day; and (9) short-term debt securities having a maturity date of more than sixty days at time of purchase are valued on a mark-to-market basis until sixty days prior to maturity and thereafter at amortized cost based on their value on the 61st day. Short-term debt securities having a maturity date of sixty days or less at the time of purchase are valued at amortized cost, which approximates fair value.
B. Accounting for Investments — Security transactions are accounted for on the trade date (date the order to buy or sell is executed). Realized gains and losses on security transactions are determined by the identified cost method. Dividend income and other distributions are recorded on the ex-dividend date except for certain dividends on foreign securities which are recorded as soon as the Fund is informed after the ex-dividend date. Discounts are accreted and premiums are amortized over the life of the respective securities and are included in interest income. Interest income is accrued daily as earned.
C. Multiple Class Allocations — Investment income, expenses (other than distribution fees), and realized and unrealized gains and losses are allocated to each class of shares based upon the relative net asset value on the date such items are recognized. Distribution fees are charged directly to the respective class.
D. Foreign Currency Translation — The books and records of the Fund are maintained in U.S. dollars as follows: (1) the foreign currency market value of investment securities, other assets and liabilities and foreign currency exchange contracts are translated at the exchange rates prevailing at the end of the period; and (2) purchases, sales, income and expenses are translated at the exchange rates prevailing on the respective dates of such transactions. The resultant exchange gains and losses are recorded as realized and unrealized gains/losses on foreign currency exchange contracts and foreign currency translations. Pursuant to U.S. federal income tax regulations, certain foreign exchange gains/losses included in realized and unrealized gains/losses are included in or are a reduction of ordinary income for federal income tax purposes. The Fund does not isolate that portion of the results of operations arising as a result of changes in the foreign exchange rates from the changes in the market prices of the securities held.
40
Morgan Stanley International Fund
Notes to Financial Statements n April 30, 2012 (unaudited) continued
E. Securities Lending — The Fund may lend securities to qualified financial institutions, such as broker-dealers, to earn additional income. Any increase or decrease in the fair value of the securities loaned that might occur and any interest earned or dividends declared on those securities during the term of the loan would remain in the Fund. The Fund receives cash or securities as collateral in an amount equal to or exceeding 100% of the current fair value of the loaned securities. The collateral is marked-to-market daily, by the securities lending agent, to ensure that a minimum of 100% collateral coverage is maintained.
Based on pre-established guidelines, the securities lending agent invests any cash collateral that is received in high-quality short-term investments. Securities lending income is generated from the earnings on the invested collateral and borrowing fees, less any rebates owed to the borrowers and compensation to the lending agent.
The value of loaned securities and related collateral outstanding at April 30, 2012 were $6,932,948 and $7,371,334, respectively. The Fund received cash collateral of which $7,182,107 was subsequently invested in Repurchase Agreements and Morgan Stanley Institutional Liquidity Funds as reported in the Portfolio of Investments. The remaining collateral of $189,227 was received in the form of a common stock and U.S. Government Obligations, which the Fund cannot sell or re-pledge and accordingly are not reflected in the Portfolio of Investments. The Fund has the right under the lending agreement to recover the securities from the borrower on demand.
F. Dividends and Distributions to Shareholders — Dividends and distributions to shareholders are recorded on the ex-dividend date.
G. Use of Estimates — The preparation of financial statements in accordance with generally accepted accounting principles in the United States ("GAAP") requires management to make estimates and assumptions that affect the reported amounts and disclosures. Actual results could differ from those estimates.
H. Indemnifications — The Fund enters into contracts that contain a variety of indemnifications. The Fund's maximum exposure under these arrangements is unknown. However, the Fund has not had prior claims or losses pursuant to these contracts and expects the risk of loss to be remote.
2. Fair Valuation Measurements
Financial Accounting Standards Board ("FASB") Accounting Standards Codification ("ASC") 820, Fair Value Measurements and Disclosures ("ASC 820"), defines fair value as the value that the Fund would receive to sell an investment or pay to transfer a liability in a timely transaction with an independent buyer in the principal market, or in the absence of a principal market the most advantageous market for the investment or liability. ASC 820 establishes a three-tier hierarchy to distinguish between (1) inputs
41
Morgan Stanley International Fund
Notes to Financial Statements n April 30, 2012 (unaudited) continued
that reflect the assumptions market participants would use in valuing an asset or liability developed based on market data obtained from sources independent of the reporting entity (observable inputs); and (2) inputs that reflect the reporting entity's own assumptions about the assumptions market participants would use in valuing an asset or liability developed based on the best information available in the circumstances (unobservable inputs) and to establish classification of fair value measurements for disclosure purposes. Various inputs are used in determining the value of the Fund's investments. The inputs are summarized in the three broad levels listed below.
• Level 1 — unadjusted quoted prices in active markets for identical investments
• Level 2 — other significant observable inputs (including quoted prices for similar investments, interest rates, prepayment speeds, credit risk, etc.)
• Level 3 — significant unobservable inputs including the Fund's own assumptions in determining the fair value of investments. Factors considered in making this determination may include, but are not limited to, information obtained by contacting the issuer, analysts, or the appropriate stock exchange (for exchange-traded securities), analysis of the issuer's financial statements or other available documents and, if necessary, available information concerning other securities in similar circumstances
The inputs or methodology used for valuing securities are not necessarily an indication of the risk associated with investing in those securities and the determination of the significance of a particular input to the fair value measurement in its entirety requires judgment and considers factors specific to each security.
The following is a summary of the inputs used to value the Fund's investments as of April 30, 2012.
| INVESTMENT TYPE | | LEVEL 1
UNADJUSTED
QUOTED
PRICES | | LEVEL 2
OTHER
SIGNIFICANT
OBSERVABLE
INPUTS | | LEVEL 3
SIGNIFICANT
UNOBSERVABLE
INPUTS | | TOTAL | |
| Assets: | |
| Common Stocks | |
| Aerospace & Defense | | $ | 592,591 | | | $ | — | | | $ | — | | | $ | 592,591 | | |
| Air Freight & Logistics | | | 281,505 | | | | — | | | | — | | | | 281,505 | | |
| Airlines | | | 98,840 | | | | — | | | | — | | | | 98,840 | | |
| Auto Components | | | 901,411 | | | | — | | | | — | | | | 901,411 | | |
| Automobiles | | | 2,941,875 | | | | — | | | | — | | | | 2,941,875 | | |
| Beverages | | | 1,722,596 | | | | — | | | | — | | | | 1,722,596 | | |
| Biotechnology | | | 19,519 | | | | — | | | | — | | | | 19,519 | | |
| Building Products | | | 478,812 | | | | — | | | | — | | | | 478,812 | | |
42
Morgan Stanley International Fund
Notes to Financial Statements n April 30, 2012 (unaudited) continued
| INVESTMENT TYPE | | LEVEL 1
UNADJUSTED
QUOTED
PRICES | | LEVEL 2
OTHER
SIGNIFICANT
OBSERVABLE
INPUTS | | LEVEL 3
SIGNIFICANT
UNOBSERVABLE
INPUTS | | TOTAL | |
| Capital Markets | | $ | 1,347,098 | | | $ | — | | | $ | — | | | $ | 1,347,098 | | |
| Chemicals | | | 3,726,472 | | | | — | | | | — | | | | 3,726,472 | | |
| Commercial Banks | | | 9,438,642 | | | | 125,334 | | | | — | | | | 9,563,976 | | |
| Commercial Services & Supplies | | | 812,503 | | | | — | | | | — | | | | 812,503 | | |
| Communications Equipment | | | 649,124 | | | | — | | | | — | | | | 649,124 | | |
| Computers & Peripherals | | | 471,399 | | | | — | | | | — | | | | 471,399 | | |
| Construction & Engineering | | | 900,511 | | | | — | | | | — | | | | 900,511 | | |
| Construction Materials | | | 313,510 | | | | — | | | | — | | | | 313,510 | | |
| Consumer Finance | | | 34,549 | | | | — | | | | — | | | | 34,549 | | |
| Containers & Packaging | | | 129,870 | | | | — | | | | — | | | | 129,870 | | |
| Distributors | | | 1,182 | | | | — | | | | — | | | | 1,182 | | |
| Diversified Consumer Services | | | 42,358 | | | | — | | | | — | | | | 42,358 | | |
| Diversified Financial Services | | | 800,249 | | | | — | | | | — | | | | 800,249 | | |
| Diversified Telecommunication Services | | | 2,438,349 | | | | — | | | | — | | | | 2,438,349 | | |
| Electric Utilities | | | 1,086,015 | | | | — | | | | — | | | | 1,086,015 | | |
| Electrical Equipment | | | 1,442,570 | | | | — | | | | — | | | | 1,442,570 | | |
| Electronic Equipment, Instruments & Components | | | 1,557,295 | | | | — | | | | — | | | | 1,557,295 | | |
| Energy Equipment & Services | | | 621,730 | | | | — | | | | — | | | | 621,730 | | |
| Food & Staples Retailing | | | 1,138,587 | | | | — | | | | — | | | | 1,138,587 | | |
| Food Products | | | 3,524,043 | | | | — | | | | — | | | | 3,524,043 | | |
| Gas Utilities | | | 92,011 | | | | — | | | | — | | | | 92,011 | | |
| Health Care Equipment & Supplies | | | 723,429 | | | | — | | | | — | | | | 723,429 | | |
| Health Care Providers & Services | | | 182,781 | | | | — | | | | — | | | | 182,781 | | |
| Hotels, Restaurants & Leisure | | | 880,463 | | | | — | | | | — | | | | 880,463 | | |
| Household Durables | | | 696,130 | | | | — | | | | — | | | | 696,130 | | |
| Household Products | | | 625,207 | | | | — | | | | — | | | | 625,207 | | |
| Independent Power Producers & Energy Traders | | | 111,805 | | | | — | | | | — | | | | 111,805 | | |
| Industrial Conglomerates | | | 2,207,090 | | | | — | | | | — | | | | 2,207,090 | | |
| Information Technology Services | | | 223,748 | | | | — | | | | — | | | | 223,748 | | |
| Insurance | | | 3,215,413 | | | | — | | | | — | | | | 3,215,413 | | |
| Internet Software & Services | | | 79,848 | | | | — | | | | — | | | | 79,848 | | |
| Leisure Equipment & Products | | | 250,866 | | | | — | | | | — | | | | 250,866 | | |
| Life Sciences Tools & Services | | | 18,083 | | | | — | | | | — | | | | 18,083 | | |
| Machinery | | | 2,888,559 | | | | — | | | | — | | | | 2,888,559 | | |
| Marine | | | 283,309 | | | | — | | | | — | | | | 283,309 | | |
| Media | | | 1,697,864 | | | | — | | | | — | | | | 1,697,864 | | |
| Metals & Mining | | | 4,346,841 | | | | — | | | | — | | | | 4,346,841 | | |
| Multi-Utilities | | | 772,562 | | | | — | | | | — | | | | 772,562 | | |
| Multiline Retail | | | 355,005 | | | | — | | | | — | | | | 355,005 | | |
43
Morgan Stanley International Fund
Notes to Financial Statements n April 30, 2012 (unaudited) continued
| INVESTMENT TYPE | | LEVEL 1
UNADJUSTED
QUOTED
PRICES | | LEVEL 2
OTHER
SIGNIFICANT
OBSERVABLE
INPUTS | | LEVEL 3
SIGNIFICANT
UNOBSERVABLE
INPUTS | | TOTAL | |
| Office Electronics | | $ | 349,727 | | | $ | — | | | $ | — | | | $ | 349,727 | | |
| Oil, Gas & Consumable Fuels | | | 5,656,567 | | | | — | | | | — | | | | 5,656,567 | | |
| Paper & Forest Products | | | 411,461 | | | | — | | | | — | | | | 411,461 | | |
| Personal Products | | | 103,814 | | | | — | | | | — | | | | 103,814 | | |
| Pharmaceuticals | | | 7,444,253 | | | | — | | | | — | | | | 7,444,253 | | |
| Professional Services | | | 251,947 | | | | — | | | | — | | | | 251,947 | | |
| Real Estate Investment Trusts (REITs) | | | 1,142,304 | | | | — | | | | — | | | | 1,142,304 | | |
| Real Estate Management & Development | | | 1,486,447 | | | | — | | | | — | | | | 1,486,447 | | |
| Road & Rail | | | 721,321 | | | | — | | | | — | | | | 721,321 | | |
| Semiconductors & Semiconductor Equipment | | | 1,484,261 | | | | — | | | | — | | | | 1,484,261 | | |
| Software | | | 1,111,307 | | | | — | | | | — | | | | 1,111,307 | | |
| Specialty Retail | | | 904,339 | | | | — | | | | — | | | | 904,339 | | |
| Textiles, Apparel & Luxury Goods | | | 287,723 | | | | — | | | | — | | | | 287,723 | | |
| Tobacco | | | 1,197,514 | | | | — | | | | — | | | | 1,197,514 | | |
| Trading Companies & Distributors | | | 1,112,458 | | | | — | | | | — | | | | 1,112,458 | | |
| Transportation Infrastructure | | | 39,445 | | | | — | | | | — | | | | 39,445 | | |
| Water Utilities | | | 155,923 | | | | — | | | | — | | | | 155,923 | | |
| Wireless Telecommunication Services | | | 2,150,535 | | | | — | | | | — | | | | 2,150,535 | | |
| Total Common Stocks | | | 83,175,565 | | | | 125,334 | | | | — | | | | 83,300,899 | | |
| Preferred Stock | | | — | | | | 2,822 | | | | — | | | | 2,822 | | |
| Rights | | | — | | | | 16 | | | | — | | | | 16 | | |
| Short-Term Investments | |
| Repurchase Agreements | | | — | | | | 1,944,880 | | | | — | | | | 1,944,880 | | |
| Investment Company | | | 16,139,845 | | | | — | | | | — | | | | 16,139,845 | | |
| Total Short-Term Investments | | | 16,139,845 | | | | 1,944,880 | | | | — | | | | 18,084,725 | | |
| Foreign Currency Exchange Contracts | | | — | | | | 93,727 | | | | — | | | | 93,727 | | |
| Futures Contracts | | | 130,215 | | | | — | | | | — | | | | 130,215 | | |
| Total Assets | | | 99,445,625 | | | | 2,166,779 | | | | — | | | | 101,612,404 | | |
| Liabilities: | |
| Foreign Currency Exchange Contracts | | | — | | | | (16,309 | ) | | | — | | | | (16,309 | ) | |
| Futures Contracts | | | (179,111 | ) | | | — | | | | — | | | | (179,111 | ) | |
| Total Liabilities | | | (179,111 | ) | | | (16,309 | ) | | | — | | | | (195,420 | ) | |
| Total | | $ | 99,266,514 | | | $ | 2,150,470 | | | $ | — | | | $ | 101,416,984 | | |
Transfers between investment levels may occur as the markets fluctuate and/or the availability of data used in an investment's valuation changes. The Fund recognizes transfers between the levels as of the end of the period. As of April 30, 2012, securities with a total value of $81,152,258 transferred from
44
Morgan Stanley International Fund
Notes to Financial Statements n April 30, 2012 (unaudited) continued
Level 2 to Level 1. At October 31, 2011, the fair market value of certain securities were adjusted due to developments which occurred between the time of the close of the foreign markets on which they trade and the close of business on the NYSE which resulted in their Level 2 classification.
3. Derivatives
The Fund may, but is not required to, use derivative instruments for a variety of purposes, including hedging, risk management, portfolio management or to earn income. Derivatives are financial instruments whose value is based on the value of an underlying asset, interest rate, index or financial instrument. A derivative instrument often has risks similar to its underlying asset and may have additional risks, including imperfect correlation between the value of the derivative and the underlying asset, risks of default by the counterparty to certain transactions, magnification of losses incurred due to changes in the market value of the securities, instruments, indices or interest rates to which they relate, and risks that the transactions may not be liquid. The use of derivatives involves risks that are different from, and possibly greater than, the risks associated with other portfolio investments. Derivatives may involve the use of highly specialized instruments that require investment techniques and risk analyses different from those associated with other portfolio investments. All of the Fund's holdings, including derivative instruments, are marked-to-market each day with the change in value reflected in unrealized appreciation (depreciation). Upon disposition, a realized gain or loss is recognized.
Certain derivative transactions may give rise to a form of leverage. Leverage magnifies the potential for gain and risk of loss. Leverage associated with derivative transactions may cause the Fund to liquidate portfolio positions when it may not be advantageous to do so to satisfy its obligations or to meet earmarking or segregation requirements, pursuant to applicable Securities and Exchange Commission rules and regulations, or may cause the Fund to be more volatile than if the Fund had not been leveraged. Although the Adviser seeks to use derivatives to further the Fund's investment objectives, there is no assurance that the use of derivatives will achieve this result.
Following is a description of the derivative instruments and techniques that the Fund used during the period and their associated risks:
Foreign Currency Exchange Contracts In connection with its investments in foreign securities, the Fund entered into contracts with banks, brokers or dealers to purchase or sell foreign currencies at a future date. A foreign currency exchange contract ("currency contracts") is a negotiated agreement between two parties to exchange specified amounts of two or more currencies at a specified future time at a specified rate. The rate specified by the currency contract can be higher or lower than the spot rate between the currencies that are the subject of the currency contract. Currency contracts may be used to protect against uncertainty in the level of future foreign currency exchange rates or to gain
45
Morgan Stanley International Fund
Notes to Financial Statements n April 30, 2012 (unaudited) continued
or modify exposure to a particular currency. In addition, the Fund may use cross currency hedging or proxy hedging with respect to currencies in which the Fund has or expects to have portfolio or currency exposure. Cross currency hedges involve the sale of one currency against the positive exposure to a different currency and may be used for hedging purposes or to establish an active exposure to the exchange rate between any two currencies. Hedging the Fund's currency risks involves the risk of mismatching the Fund's objectives under a currency contract with the value of securities denominated in a particular currency. Furthermore, such transactions reduce or preclude the opportunity for gain if the value of the currency should move in the direction opposite to the position taken. There is an additional risk to the effect that currency contracts create exposure to currencies in which the Fund's securities are not denominated. Unanticipated changes in currency prices may result in poorer overall performance for the Fund than if it had not entered into such contracts. The use of currency contracts involves the risk of loss from the insolvency or bankruptcy of the counterparty to the contract or the failure of the counterparty to make payments or otherwise comply with the term of the contract. A currency contract is marked-to-market daily and the change in market value is recorded by the Fund as unrealized gain or (loss). The Fund records realized gains (losses) when the currency contract is closed equal to the difference between the value of the currency contract at the time it was opened and the value at the time it was closed.
Futures A futures contract is a standardized agreement between two parties to buy or sell a specific quantity of an underlying instrument at a specific price at a specific future time. The value of a futures contract tends to increase and decrease in tandem with the value of the underlying instrument. Depending on the terms of the particular contract, futures contracts are settled through either physical delivery of the underlying instrument on the settlement date or by payment of a cash settlement amount on the settlement date. During the period the futures contract is open, payments are received from or made to the broker based upon changes in the value of the contract (the variation margin). A decision as to whether, when and how to use futures involves the exercise of skill and judgment and even a well conceived futures transaction may be unsuccessful because of market behavior or unexpected events. In addition to the derivatives risks discussed above, the prices of futures can be highly volatile, using futures can lower total return, and the potential loss from futures can exceed the Fund's initial investment in such contracts.
FASB ASC 815, Derivatives and Hedging: Overall ("ASC 815"), is intended to improve financial reporting about derivative instruments by requiring enhanced disclosures to enable investors to better understand how and why the Fund uses derivative instruments, how these derivative instruments are accounted for and their effects on the Fund's financial position and results of operations.
46
Morgan Stanley International Fund
Notes to Financial Statements n April 30, 2012 (unaudited) continued
The following table sets forth the fair value of the Fund's derivative contracts by primary risk exposure as of April 30, 2012.
| PRIMARY RISK EXPOSURE | | ASSET DERIVATIVES
STATEMENT OF ASSETS
AND LIABILITIES LOCATION | | FAIR VALUE | | LIABILITY DERIVATIVES
STATEMENT OF ASSETS
AND LIABILITIES LOCATION | | FAIR VALUE | |
| Equity Risk | | Variation margin | | $ | 130,215 | † | | Variation margin | | $ | (179,111 | )† | |
| Foreign Currency Risk | | Unrealized appreciation on
open foreign currency
exchange contracts | | | 93,727 | | | Unrealized depreciation on
open foreign currency
exchange contracts | | | (16,309 | ) | |
| | | | | $ | 223,942 | | | | | $ | (195,420 | ) | |
† Includes cumulative appreciation/depreciation of futures contracts as reported in the Portfolio of Investments. Only current day's net variation margin is reported within the Statement of Assets and Liabilities.
The following tables set forth by primary risk exposure the Fund's realized gains (losses) and change in unrealized appreciation (depreciation) by type of derivative contract for the six months ended April 30, 2012 in accordance with ASC 815.
AMOUNT OF REALIZED GAIN (LOSS) ON DERIVATIVE CONTRACTS
| PRIMARY RISK EXPOSURE | | FUTURES | | FOREIGN
CURRENCY
EXCHANGE | |
| Equity Risk | | $ | 831,348 | | | | — | | |
| Foreign Currency Risk | | | — | | | $ | (468,238 | ) | |
| Total | | $ | 831,348 | | | $ | (468,238 | ) | |
CHANGE IN UNREALIZED APPRECIATION (DEPRECIATION) ON DERIVATIVE CONTRACTS
| PRIMARY RISK EXPOSURE | | FUTURES | | FOREIGN
CURRENCY
EXCHANGE | |
| Equity Risk | | $ | (501,682 | ) | | | — | | |
| Foreign Currency Risk | | | — | | | $ | (32,719 | ) | |
| Total | | $ | (501,682 | ) | | $ | (32,719 | ) | |
For the six months ended April 30, 2012, the average monthly original value of futures contracts was $10,728,892 and the average monthly principal amount of foreign currency exchange contracts was $18,592,579.
4. Advisory/Administration Agreements
Pursuant to an Investment Advisory Agreement, the Fund pays the Adviser an advisory fee, accrued daily and payable monthly, by applying the following annual rates to the net assets of the Fund
47
Morgan Stanley International Fund
Notes to Financial Statements n April 30, 2012 (unaudited) continued
determined at the close of each business day: 0.65% to the portion of the daily net assets not exceeding $1 billion and 0.60% to the portion of the daily net assets exceeding $1 billion.
Pursuant to an Administration Agreement with Morgan Stanley Services Company Inc. (the "Administrator"), an affiliate of the Adviser, the Fund pays an administration fee, accrued daily and payable monthly, by applying the annual rate of 0.08% to the Fund's daily net assets.
Under a Sub-Administration Agreement between the Administrator and State Street Bank and Trust Company ("State Street"), State Street provides certain administrative services to the Fund. For such services, the Administrator pays State Street a portion of the fee the Administrator receives from the Fund.
5. Plan of Distribution
Shares of the Fund are distributed by Morgan Stanley Distribution, Inc. (the "Distributor"), an affiliate of the Adviser and Administrator. The Fund has adopted a Plan of Distribution (the "Plan") pursuant to Rule 12b-1 under the Act. The Plan provides that the Fund will pay the Distributor a fee which is accrued daily and paid monthly at the following annual rates: (i) Class A — up to 0.25% of the average daily net assets of Class A shares; (ii) Class B — up to 1.00% of the average daily net assets of Class B shares; and (iii) Class C — up to 1.00% of the average daily net assets of Class C shares; (iv) Class R — up to 0.50% of the average daily net assets of Class R shares; and (v) Class W — up to 0.35% of the average daily net assets of Class W shares.
In the case of Class B shares, provided that the Plan continues in effect, any cumulative expenses incurred by the Distributor but not yet recovered may be recovered through the payment of future distribution fees from the Fund pursuant to the Plan and contingent deferred sales charges paid by investors upon redemption of Class B shares. Although there is no legal obligation for the Fund to pay expenses incurred in excess of payments made to the Distributor under the Plan and the proceeds of contingent deferred sales charges paid by investors upon redemption of shares, if for any reason the Plan is terminated, the Trustees will consider at that time the manner in which to treat such expenses. The Distributor has advised the Fund that such excess amounts totaled $18,125,772 at April 30, 2012.
In the case of Class A, Class C, Class R and Class W shares, expenses incurred pursuant to the Plan in any calendar year in excess of 0.25%, 1.00%, 0.50% or 0.35% of the average daily net assets of Class A, Class C, Class R or Class W shares, respectively, will not be reimbursed by the Fund through payments in any subsequent year, except that expenses representing a gross sales credit to Morgan Stanley Smith Barney Financial Advisors and other authorized financial representatives at the time of sale may be reimbursed in the subsequent calendar year. For the six months ended April 30, 2012, the distribution fee was accrued for Class A, Class C, Class R and Class W shares at the annual rate of 0.25%, 0.99%, 0.50% and 0.35%, respectively.
48
Morgan Stanley International Fund
Notes to Financial Statements n April 30, 2012 (unaudited) continued
The Distributor has informed the Fund that for the six months ended April 30, 2012, it received contingent deferred sales charges from certain redemptions of the Fund's Class B shares and Class C shares of $2,822 and $426, respectively, and received $2,087 in front-end sales charges from sales of the Fund's Class A shares. The respective shareholders pay such charges, which are not an expense of the Fund.
6. Security Transactions and Transactions with Affiliates
The cost of purchases and proceeds from sales of investment securities, excluding short-term investments, for the six months ended April 30, 2012 aggregated $8,896,727 and $20,475,983, respectively.
The Fund invests in the Institutional Class of the Morgan Stanley Institutional Liquidity Funds — Money Market Portfolio (the "Liquidity Funds"), an open-end management investment company managed by the Adviser, both directly, and as a portion of the securities held as collateral on loaned securities. Advisory fees paid by the Fund are reduced by an amount equal to its pro-rata share of the advisory and administration fees paid by the Fund due to its investment in the Liquidity Funds. For the six months ended April 30, 2012, advisory fees paid were reduced by $8,441 relating to the Fund's investment in the Liquidity Funds.
A summary of the Fund's transactions in shares of the Liquidity Funds during the six months ended April 30, 2012 is as follows:
VALUE
OCTOBER 31,
2011 | | PURCHASES
AT COST | | SALES | | DIVIDEND
INCOME | | VALUE
APRIL 30,
2012 | |
| $ | 15,467,818 | | | $ | 20,440,799 | | | $ | 19,768,772 | | | $ | 8,103 | | | $ | 16,139,845 | | |
For the six months ended April 30, 2012, the Fund had transactions with Mitsubishi UFJ Financial Group, Inc., an affiliate of the Adviser, Administrator and Distributor:
VALUE
OCTOBER 31,
2011 | | PURCHASES
AT COST | | SALES | | REALIZED
LOSS | | DIVIDEND
INCOME | | VALUE
APRIL 30,
2012 | |
| $ | 317,366 | | | | — | | | | — | | | | — | | | $ | 4,934 | | | $ | 355,105 | | |
For the six months ended April 30, 2012, the Fund incurred brokerage commissions of $792 with Citigroup, Inc., and its affiliated broker-dealers, which may be deemed affiliates of the Adviser, Administrator and Distributor under Section 17 of the Act, for portfolio transactions executed on behalf of the Fund.
49
Morgan Stanley International Fund
Notes to Financial Statements n April 30, 2012 (unaudited) continued
Morgan Stanley Services Company Inc., an affiliate of the Adviser and Distributor, is the Fund's transfer agent.
The Fund has an unfunded Deferred Compensation Plan (the "Compensation Plan"), which allows each independent Trustee to defer payment of all, or a portion, of the fees he or she receives for serving on the Board of Trustees. Each eligible Trustee generally may elect to have the deferred amounts credited with a return equal to the total return on one or more of the Morgan Stanley funds that are offered as investment options under the Compensation Plan. Appreciation/depreciation and distributions received from these investments are recorded with an offsetting increase/decrease in the deferred compensation obligation and do not affect the net asset value of the Fund.
7. Federal Income Tax Status
It is the Fund's intention to continue to qualify as a regulated investment company and distribute all of its taxable and tax-exempt income. Accordingly, no provision for Federal income taxes is required in the financial statements.
Dividend income and distributions to shareholders are recorded on the ex-dividend date. Interest income is recognized on an accrual basis. Dividends from net investment income, if any, are declared and paid annually. Net realized capital gains, if any, are distributed at least annually.
The Fund may be subject to taxes imposed by countries in which it invests. Such taxes are generally based on income and/or capital gains earned or repatriated. Taxes are accrued based on net investment income, net realized gains and net unrealized appreciation as such income and/or gains are earned. Taxes may also be based on transactions in foreign currency and are accrued based on the value of investments denominated in such currency.
FASB ASC 740-10, Income Taxes — Overall, sets forth a minimum threshold for financial statement recognition of the benefit of a tax position taken or expected to be taken in a tax return. Management has concluded there are no significant uncertain tax positions that would require recognition in the financial statements. If applicable, the Fund recognizes interest accrued related to unrecognized tax benefits in "Interest Expense" and penalties in ''Other Expenses" in the Statement of Operations. The Fund files tax returns with the U.S. Internal Revenue Service, New York and various states. Each of the tax years in the four-year period ended October 31, 2011, remains subject to examination by taxing authorities.
50
Morgan Stanley International Fund
Notes to Financial Statements n April 30, 2012 (unaudited) continued
The tax character of distributions paid may differ from the character of distributions shown in the Statements of Changes in Net Assets due to short-term capital gains being treated as ordinary income for tax purposes. The tax character of distributions paid during fiscal 2011 and 2010 was as follows:
2011 DISTRIBUTIONS
PAID FROM:
ORDINARY INCOME | | 2010 DISTRIBUTIONS
PAID FROM:
ORDINARY INCOME | |
| $ | 1,366,272 | | | $ | 2,728,292 | | |
The amount and character of income and gains to be distributed are determined in accordance with income tax regulations which may differ from GAAP. These book/tax differences are either considered temporary or permanent in nature.
Temporary differences are primarily due to differing book and tax treatments in the timing of the recognition of gains (losses) on certain investment transactions and the timing of the deductibility of certain expenses.
Permanent differences, primarily due to foreign currency losses, tax adjustments on passive foreign investment companies ("PFICs") sold by the Fund and an expired capital loss carryforward, resulted in the following reclassifications among the Fund's components of net assets at October 31, 2011:
ACCUMULATED
UNDISTRIBUTED
NET INVESTMENT
INCOME | | ACCUMULATED
NET REALIZED
LOSS | | PAID-IN-CAPITAL | |
| $ | (719,196 | ) | | $ | 7,892,953 | | | $ | (7,173,757 | ) | |
At October 31, 2011, the components of distributable earnings for the Fund on a tax basis were as follows:
UNDISTRIBUTED
ORDINARY
INCOME | | UNDISTRIBUTED
LONG-TERM
CAPITAL GAINS | |
| $ | 602,089 | | | | — | | |
At April 30, 2012, the aggregate cost for federal income tax purposes approximates the aggregate cost for book purposes. The aggregate gross unrealized appreciation is $10,549,511 and the aggregate gross unrealized depreciation is $10,832,918 resulting in net unrealized depreciation of $283,407.
On December 22, 2010, the Regulated Investment Company Modernization Act of 2010 (the "Modernization Act") was signed into law. The Modernization Act modernizes several tax provisions
51
Morgan Stanley International Fund
Notes to Financial Statements n April 30, 2012 (unaudited) continued
related to Regulated Investment Companies ("RICs") and their shareholders. One key change made by the Modernization Act is that capital losses will generally retain their character as short-term or long-term and may be carried forward indefinitely to offset future gains. These losses are utilized before other capital loss carryforwards that expire. Generally, the Modernization Act is effective for taxable years beginning after December 22, 2010.
At October 31, 2011, the Fund had available for Federal income tax purposes capital loss carryforwards, which will expire on the indicated dates:
| AMOUNT | | EXPIRATION | |
| $ | 14,780,909 | | | October 31, 2017 | |
| | 798,093 | | | October 31, 2018 | |
To the extent that capital loss carryforwards are used to offset any future capital gains realized during the carryover period as provided by U.S. Federal income tax regulations, no capital gains tax liability will be incurred by a Fund for gains realized and not distributed. To the extent that capital gains are offset, such gains will not be distributed to the shareholders. During the year ended October 31, 2011, the Fund utilized capital loss carryforwards for U.S. Federal income tax purposes of $3,584,030.
8. Expense Offset
The Fund has entered into an arrangement with State Street (the "Custodian"), whereby credits realized on uninvested cash balances were used to offset a portion of the Fund's expenses. If applicable, these custodian credits are shown as "expense offset" in the Statement of Operations.
9. Purposes of and Risks Relating to Certain Financial Instruments
The Fund may lend securities to qualified financial institutions, such as broker-dealers, to earn additional income. Risks in securities lending transactions are that a borrower may not provide additional collateral when required or return the securities when due, and that the value of the short-term investments will be less than the amount of cash collateral plus any rebate that is required to be returned to the borrower.
At April 30, 2012, investments in securities of issuers in United Kingdom and the Japan represented 22.4% and 20.9%, respectively, of the Fund's net assets. These investments, as well as other non-U.S. investments, which involve risks and considerations not present with respect to U.S. securities, may be affected by economic or political developments in these countries.
At April 30, 2012, the Fund's cash balance consisted of interest bearing deposits with State Street, the Fund's Custodian.
52
Morgan Stanley International Fund
Notes to Financial Statements n April 30, 2012 (unaudited) continued
10. Shares of Beneficial Interest
Transactions in shares of beneficial interest were as follows:
| | | FOR THE SIX
MONTHS ENDED
APRIL 30, 2012 | | FOR THE YEAR
ENDED
OCTOBER 31, 2011 | |
| | | (unaudited) | | | |
| | | SHARES | | AMOUNT | | SHARES | | AMOUNT | |
| CLASS A SHARES | |
| Sold | | | 66,049 | | | $ | 717,006 | | | | 239,164 | | | $ | 2,966,253 | | |
| Conversion from Class B | | | 124,217 | | | | 1,391,587 | | | | 229,694 | | | | 2,845,003 | | |
| Reinvestment of dividends | | | 82,823 | | | | 860,534 | | | | 97,533 | | | | 1,212,331 | | |
| Redeemed | | | (900,618 | ) | | | (9,866,194 | ) | | | (1,674,626 | ) | | | (20,588,427 | ) | |
| Net decrease — Class A | | | (627,529 | ) | | | (6,897,067 | ) | | | (1,108,235 | ) | | | (13,564,840 | ) | |
| CLASS B SHARES | |
| Sold | | | 4,048 | | | | 44,753 | | | | 14,781 | | | | 181,764 | | |
| Conversion to Class A | | | (125,079 | ) | | | (1,391,587 | ) | | | (232,571 | ) | | | (2,845,003 | ) | |
| Reinvestment of dividends | | | — | | | | — | | | | 2,214 | | | | 27,271 | | |
| Redeemed | | | (93,771 | ) | | | (1,026,331 | ) | | | (281,682 | ) | | | (3,434,191 | ) | |
| Net decrease — Class B | | | (214,802 | ) | | | (2,373,165 | ) | | | (497,258 | ) | | | (6,070,159 | ) | |
| CLASS C SHARES | |
| Sold | | | 3,768 | | | | 40,620 | | | | 14,747 | | | | 175,873 | | |
| Reinvestment of dividends | | | 1,707 | | | | 17,391 | | | | 5,832 | | | | 70,914 | | |
| Redeemed | | | (107,233 | ) | | | (1,138,668 | ) | | | (264,764 | ) | | | (3,201,181 | ) | |
| Net decrease — Class C | | | (101,758 | ) | | | (1,080,657 | ) | | | (244,185 | ) | | | (2,954,394 | ) | |
| CLASS I SHARES | |
| Sold | | | 14,363 | | | | 158,343 | | | | 1,843 | | | | 24,048 | | |
| Reinvestment of dividends | | | 657 | | | | 6,863 | | | | 676 | | | | 8,456 | | |
| Redeemed | | | (9,697 | ) | | | (106,855 | ) | | | (2,364 | ) | | | (28,785 | ) | |
| Net increase — Class I | | | 5,323 | | | | 58,351 | | | | 155 | | | | 3,719 | | |
| CLASS R SHARES | |
| Sold | | | — | | | | — | | | | 141 | | | | 1,804 | | |
| Reinvestment of dividends | | | 1 | | | | 7 | | | | 5 | | | | 57 | | |
| Redeemed | | | — | | | | — | | | | (512 | ) | | | (6,673 | ) | |
| Net increase (decrease) — Class R | | | 1 | | | | 7 | | | | (366 | ) | | | (4,812 | ) | |
| CLASS W SHARES | |
| Reinvestment of dividends | | | 6 | | | | 59 | | | | 5 | | | | 72 | | |
| Net increase — Class W | | | 6 | | | | 59 | | | | 5 | | | | 72 | | |
| Net decrease in Fund | | | (938,759 | ) | | $ | (10,292,472 | ) | | | (1,849,884 | ) | | $ | (22,590,414 | ) | |
53
Morgan Stanley International Fund
Notes to Financial Statements n April 30, 2012 (unaudited) continued
11. Accounting Pronouncement
In May 2011, FASB issued Accounting Standards Update ("ASU") 2011-04. The amendments in this update are the results of the work of FASB and the International Accounting Standards Board to develop common requirements for measuring fair value and for disclosing information about fair value measurements, which are effective during interim and annual periods beginning after December 15, 2011. Consequently, these amendments improve the comparability of fair value measurements presented and disclosed in the financial statements prepared in accordance with GAAP and International Financial Reporting Standards. At this time, the Fund's management is evaluating the implications of ASU 2011-04.
12. Subsequent Events
The Board of Trustees of the Fund approved an Agreement and Plan of Reorganization by and between the Fund and Morgan Stanley Institutional Fund, Inc., on behalf of its series Active International Allocation Portfolio (Active International Allocation), pursuant to which substantially all of the assets of the Fund would be combined with those of Active International Allocation and shareholders of the Fund would become shareholders of Active International Allocation, receiving shares of Active International Allocation equal to the value of their holdings in the Fund (the "Reorganization"). Each shareholder of the Fund would receive the Class of shares of Active International Allocation that corresponds to the Class of shares of the Fund currently held by that shareholder. The Reorganization is subject to the approval of shareholders of the Fund at a special meeting of shareholders scheduled to be held during the third quarter of 2012.
Effective as of the close of business on May 16, 2012, the Fund is suspending the continuous offering of its Class R shares and Class W shares and thus, no further purchases of Class R shares and Class W shares of the Fund may be made by investors. In addition, Class B shares of the Fund will be closed for purchases by new investors.
Effective as of the close of business on June 12, 2012, Class A, Class C and Class I shares of the Fund will be closed for purchases by new investors.
54
Morgan Stanley International Fund
Financial Highlights
Selected ratios and per share data for a share of beneficial interest outstanding throughout each period:
| | | FOR THE SIX | | FOR THE YEAR ENDED OCTOBER 31, | |
| | | MONTHS ENDED | | | |
| | | APRIL 30, 2012 | | 2011 | | 2010^ | | 2009^ | | 2008^ | | 2007^ | |
| | | (unaudited) | | | | | | | | | | | |
| Class A Shares | |
| Selected Per Share Data: | |
| Net asset value, beginning of period | | $ | 11.19 | | | $ | 12.30 | | | $ | 11.32 | | | $ | 9.29 | | | $ | 16.94 | | | $ | 13.14 | | |
| Income (loss) from investment operations: | |
| Net investment income(1) | | | 0.08 | | | | 0.16 | | | | 0.11 | | | | 0.12 | | | | 0.24 | | | | 0.15 | | |
| Net realized and unrealized gain (loss) | | | 0.20 | | | | (1.12 | ) | | | 1.10 | | | | 1.91 | | | | (7.61 | ) | | | 3.86 | | |
Total income (loss) from investment
operations | | | 0.28 | | | | (0.96 | ) | | | 1.21 | | | | 2.03 | | | | (7.37 | ) | | | 4.01 | | |
Less dividends and distributions from
net investment income | | | (0.12 | ) | | | (0.15 | ) | | | (0.23 | ) | | | — | | | | (0.28 | ) | | | (0.21 | ) | |
| Net asset value, end of period | | $ | 11.35 | | | $ | 11.19 | | | $ | 12.30 | | | $ | 11.32 | | | $ | 9.29 | | | $ | 16.94 | | |
| Total Return(2) | | | 2.61 | %(7) | | | (7.95 | )% | | | 10.79 | % | | | 21.85 | % | | | (44.19 | )% | | | 31.03 | % | |
| Ratios to Average Net Assets(3): | |
| Total expenses | | | 1.70 | %(4)(8) | | | 1.57 | %(4) | | | 1.50 | %(4) | | | 1.69 | %(4) | | | 1.36 | %(4) | | | 1.33 | %(4)(5) | |
| Net investment income | | | 1.42 | %(4)(8) | | | 1.29 | %(4) | | | 0.97 | %(4) | | | 1.30 | %(4) | | | 1.71 | %(4) | | | 1.18 | %(4)(5) | |
| Rebate from Morgan Stanley affiliate | | | 0.02 | %(8) | | | 0.01 | % | | | 0.02 | % | | | 0.01 | % | | | 0.01 | % | | | 0.00 | %(6) | |
| Supplemental Data: | |
| Net assets, end of period, in thousands | | $ | 79,226 | | | $ | 85,116 | | | $ | 107,160 | | | $ | 113,446 | | | $ | 104,619 | | | $ | 193,043 | | |
| Portfolio turnover rate | | | 10 | %(7) | | | 33 | % | | | 15 | % | | | 36 | % | | | 31 | % | | | 22 | % | |
^ Beginning with the year ended October 31, 2011, the Fund was audited by Ernst & Young LLP. The previous years were audited by another independent registered public accounting firm.
(1) The per share amounts were computed using an average number of shares outstanding during the period.
(2) Does not reflect the deduction of sales charge. Calculated based on the net asset value as of the last business day of the period.
(3) Reflects overall Fund ratios for investment income and non-class specific expenses.
(4) The ratios reflect the rebate of certain Fund expenses in connection with investments in a Morgan Stanley affiliate during the period. The effect of the rebate on the ratios is disclosed in the above table as "Rebate from Morgan Stanley affiliate."
(5) If the Fund had borne all of its expenses that were waived by the Adviser and Administrator, the annualized expense and net investment income ratios, would have been as follows:
| PERIOD ENDED | | EXPENSE
RATIO | | NET INVESTMENT
INCOME RATIO | |
| October 31, 2007 | | | 1.34 | % | | | 1.17 | % | |
(6) Amount is less than 0.005%.
(7) Not annualized.
(8) Annualized.
See Notes to Financial Statements
55
Morgan Stanley International Fund
Financial Highlights continued
| | | FOR THE SIX | | FOR THE YEAR ENDED OCTOBER 31, | |
| | | MONTHS ENDED | | | |
| | | APRIL 30, 2012 | | 2011 | | 2010^ | | 2009^ | | 2008^ | | 2007^ | |
| | | (unaudited) | | | | | | | | | | | |
| Class B Shares | |
| Selected Per Share Data: | |
| Net asset value, beginning of period | | $ | 11.02 | | | $ | 12.08 | | | $ | 11.11 | | | $ | 9.19 | | | $ | 16.69 | | | $ | 12.97 | | |
| Income (loss) from investment operations: | |
| Net investment income(1) | | | 0.04 | | | | 0.07 | | | | 0.02 | | | | 0.05 | | | | 0.13 | | | | 0.08 | | |
| Net realized and unrealized gain (loss) | | | 0.21 | | | | (1.10 | ) | | | 1.08 | | | | 1.87 | | | | (7.53 | ) | | | 3.75 | | |
Total income (loss) from investment
operations | | | 0.25 | | | | (1.03 | ) | | | 1.10 | | | | 1.92 | | | | (7.40 | ) | | | 3.83 | | |
Less dividends from net investment
income | | | — | | | | (0.03 | ) | | | (0.13 | ) | | | — | | | | (0.10 | ) | | | (0.11 | ) | |
| Net asset value, end of period | | $ | 11.27 | | | $ | 11.02 | | | $ | 12.08 | | | $ | 11.11 | | | $ | 9.19 | | | $ | 16.69 | | |
| Total Return(2) | | | 2.27 | %(7) | | | (8.58 | )% | | | 9.95 | % | | | 20.89 | % | | | (44.49 | )% | | | 29.58 | % | |
| Ratios to Average Net Assets(3): | |
| Total expenses | | | 2.45 | %(4)(8) | | | 2.32 | %(4) | | | 2.25 | %(4) | | | 2.44 | %(4) | | | 2.10 | %(4) | | | 2.08 | %(4)(5) | |
| Net investment income | | | 0.67 | %(4)(8) | | | 0.54 | %(4) | | | 0.22 | %(4) | | | 0.55 | %(4) | | | 0.90 | %(4) | | | 0.43 | %(4)(5) | |
| Rebate from Morgan Stanley affiliate | | | 0.02 | %(8) | | | 0.01 | % | | | 0.02 | % | | | 0.01 | % | | | 0.01 | % | | | 0.00 | %(6) | |
| Supplemental Data: | |
| Net assets, end of period, in thousands | | $ | 5,195 | | | $ | 7,448 | | | $ | 14,175 | | | $ | 21,247 | | | $ | 30,185 | | | $ | 99,635 | | |
| Portfolio turnover rate | | | 10 | %(7) | | | 33 | % | | | 15 | % | | | 36 | % | | | 31 | % | | | 22 | % | |
^ Beginning with the year ended October 31, 2011, the Fund was audited by Ernst & Young LLP. The previous years were audited by another independent registered public accounting firm.
(1) The per share amounts were computed using an average number of shares outstanding during the period.
(2) Does not reflect the deduction of sales charge. Calculated based on the net asset value as of the last business day of the period.
(3) Reflects overall Fund ratios for investment income and non-class specific expenses.
(4) The ratios reflect the rebate of certain Fund expenses in connection with investments in a Morgan Stanley affiliate during the period. The effect of the rebate on the ratios is disclosed in the above table as "Rebate from Morgan Stanley affiliate."
(5) If the Fund had borne all of its expenses that were waived by the Adviser and Administrator, the annualized expense and net investment income ratios, would have been as follows:
| PERIOD ENDED | | EXPENSE
RATIO | | INVESTMENT NET
INCOME RATIO | |
| October 31, 2007 | | | 2.09 | % | | | 0.42 | % | |
(6) Amount is less than 0.005%.
(7) Not annualized.
(8) Annualized.
See Notes to Financial Statements
56
Morgan Stanley International Fund
Financial Highlights continued
| | | FOR THE SIX | | FOR THE YEAR ENDED OCTOBER 31, | |
| | | MONTHS ENDED | | | |
| | | APRIL 30, 2012 | | 2011 | | 2010^ | | 2009^ | | 2008^ | | 2007^ | |
| | | (unaudited) | | | | | | | | | | | |
| Class C Shares | |
| Selected Per Share Data: | |
| Net asset value, beginning of period | | $ | 10.88 | | | $ | 11.95 | | | $ | 11.02 | | | $ | 9.11 | | | $ | 16.63 | | | $ | 12.94 | | |
| Income (loss) from investment operations: | |
| Net investment income(1) | | | 0.04 | | | | 0.07 | | | | 0.02 | | | | 0.05 | | | | 0.13 | | | | 0.06 | | |
| Net realized and unrealized gain (loss) | | | 0.20 | | | | (1.08 | ) | | | 1.06 | | | | 1.86 | | | | (7.47 | ) | | | 3.76 | | |
Total income (loss) from investment
operations | | | 0.24 | | | | (1.01 | ) | | | 1.08 | | | | 1.91 | | | | (7.34 | ) | | | 3.82 | | |
Less dividends from net investment
income | | | (0.02 | ) | | | (0.06 | ) | | | (0.15 | ) | | | — | | | | (0.18 | ) | | | (0.13 | ) | |
| Net asset value, end of period | | $ | 11.10 | | | $ | 10.88 | | | $ | 11.95 | | | $ | 11.02 | | | $ | 9.11 | | | $ | 16.63 | | |
| Total Return(2) | | | 2.19 | %(7) | | | (8.54 | )% | | | 9.89 | % | | | 20.97 | % | | | (44.50 | )% | | | 29.58 | % | |
| Ratios to Average Net Assets(3): | |
| Total expenses | | | 2.44 | %(4)(8) | | | 2.31 | %(4) | | | 2.25 | %(4) | | | 2.44 | %(4) | | | 2.07 | %(4) | | | 2.08 | %(4)(5) | |
| Net investment income | | | 0.68 | %(4)(8) | | | 0.55 | %(4) | | | 0.22 | %(4) | | | 0.55 | %(4) | | | 0.96 | %(4) | | | 0.43 | %(4)(5) | |
| Rebate from Morgan Stanley affiliate | | | 0.02 | %(8) | | | 0.01 | % | | | 0.02 | % | | | 0.01 | % | | | 0.01 | % | | | 0.00 | %(6) | |
| Supplemental Data: | |
| Net assets, end of period, in thousands | | $ | 11,171 | | | $ | 12,050 | | | $ | 16,163 | | | $ | 17,507 | | | $ | 16,660 | | | $ | 37,085 | | |
| Portfolio turnover rate | | | 10 | %(7) | | | 33 | % | | | 15 | % | | | 36 | % | | | 31 | % | | | 22 | % | |
^ Beginning with the year ended October 31, 2011, the Fund was audited by Ernst & Young LLP. The previous years were audited by another independent registered public accounting firm.
(1) The per share amounts were computed using an average number of shares outstanding during the period.
(2) Does not reflect the deduction of sales charge. Calculated based on the net asset value as of the last business day of the period.
(3) Reflects overall Fund ratios for investment income and non-class specific expenses.
(4) The ratios reflect the rebate of certain Fund expenses in connection with investments in a Morgan Stanley affiliate during the period. The effect of the rebate on the ratios is disclosed in the above table as "Rebate from Morgan Stanley affiliate."
(5) If the Fund had borne all of its expenses that were waived by the Adviser and Administrator, the annualized expense and net investment income ratios, would have been as follows:
| PERIOD ENDED | | EXPENSE
RATIO | | INVESTMENT NET
INCOME RATIO | |
| October 31, 2007 | | | 2.09 | % | | | 0.42 | % | |
(6) Amount is less than 0.005%.
(7) Not annualized.
(8) Annualized.
See Notes to Financial Statements
57
Morgan Stanley International Fund
Financial Highlights continued
| | | FOR THE SIX | | FOR THE YEAR ENDED OCTOBER 31, | |
| | | MONTHS ENDED | | | |
| | | APRIL 30, 2012 | | 2011 | | 2010^ | | 2009^ | | 2008^ | | 2007^ | |
| | | (unaudited) | | | | | | | | | | | |
| Class I Shares | |
| Selected Per Share Data: | |
| Net asset value, beginning of period | | $ | 11.28 | | | $ | 12.39 | | | $ | 11.40 | | | $ | 9.33 | | | $ | 17.00 | | | $ | 13.23 | | |
| Income (loss) from investment operations: | |
| Net investment income(1) | | | 0.09 | | | | 0.19 | | | | 0.14 | | | | 0.16 | | | | 0.27 | | | | 0.21 | | |
| Net realized and unrealized gain (loss) | | | 0.21 | | | | (1.12 | ) | | | 1.10 | | | | 1.91 | | | | (7.64 | ) | | | 3.83 | | |
Total income (loss) from investment
operations | | | 0.30 | | | | (0.93 | ) | | | 1.24 | | | | 2.07 | | | | (7.37 | ) | | | 4.04 | | |
Less dividends from net investment
income | | | (0.16 | ) | | | (0.18 | ) | | | (0.25 | ) | | | — | | | | (0.30 | ) | | | (0.27 | ) | |
| Net asset value, end of period | | $ | 11.42 | | | $ | 11.28 | | | $ | 12.39 | | | $ | 11.40 | | | $ | 9.33 | | | $ | 17.00 | | |
| Total Return(2) | | | 2.75 | %(7) | | | (7.66 | )% | | | 11.05 | % | | | 22.19 | % | | | (44.16 | )% | | | 31.33 | % | |
| Ratios to Average Net Assets(3): | |
| Total expenses | | | 1.45 | %(4)(8) | | | 1.32 | %(4) | | | 1.25 | %(4) | | | 1.44 | %(4) | | | 1.10 | %(4) | | | 1.08 | %(4)(5) | |
| Net investment income | | | 1.67 | %(4)(8) | | | 1.54 | %(4) | | | 1.22 | %(4) | | | 1.55 | %(4) | | | 1.95 | %(4) | | | 1.43 | %(4)(5) | |
| Rebate from Morgan Stanley affiliate | | | 0.02 | %(8) | | | 0.01 | % | | | 0.02 | % | | | 0.01 | % | | | 0.01 | % | | | 0.00 | %(6) | |
| Supplemental Data: | |
| Net assets, end of period, in thousands | | $ | 691 | | | $ | 623 | | | $ | 682 | | | $ | 733 | | | $ | 10,085 | | | $ | 22,888 | | |
| Portfolio turnover rate | | | 10 | %(7) | | | 33 | % | | | 15 | % | | | 36 | % | | | 31 | % | | | 22 | % | |
^ Beginning with the year ended October 31, 2011, the Fund was audited by Ernst & Young LLP. The previous years were audited by another independent registered public accounting firm.
(1) The per share amounts were computed using an average number of shares outstanding during the period.
(2) Calculated based on the net asset value as of the last business day of the period.
(3) Reflects overall Fund ratios for investment income and non-class specific expenses.
(4) The ratios reflect the rebate of certain Fund expenses in connection with investments in a Morgan Stanley affiliate during the period. The effect of the rebate on the ratios is disclosed in the above table as "Rebate from Morgan Stanley affiliate."
(5) If the Fund had borne all of its expenses that were waived by the Adviser and Administrator, the annualized expense and net investment income ratios, would have been as follows:
| PERIOD ENDED | | EXPENSE
RATIO | | NET INVESTMENT
INCOME RATIO | |
| October 31, 2007 | | | 1.09 | % | | | 1.42 | % | |
(6) Amount is less than 0.005%.
(7) Not annualized.
(8) Annualized.
See Notes to Financial Statements
58
Morgan Stanley International Fund
Financial Highlights continued
| | | FOR THE SIX | | FOR THE YEAR ENDED OCTOBER 31, | | FOR THE PERIOD
MARCH 31, 2008@@@ | |
| | | MONTHS ENDED | | | | THROUGH | |
| | | APRIL 30, 2012 | | 2011 | | 2010^ | | 2009^ | | OCTOBER 31, 2008^ | |
| | | (unaudited) | | | | | | | | | |
| Class R Shares | |
| Selected Per Share Data: | |
| Net asset value, beginning of period | | $ | 11.13 | | | $ | 12.23 | | | $ | 11.27 | | | $ | 9.28 | | | $ | 14.14 | | |
| Income (loss) from investment operations: | |
| Net investment income(1) | | | 0.06 | | | | 0.13 | | | | 0.08 | | | | 0.10 | | | | 0.15 | | |
| Net realized and unrealized gain (loss) | | | 0.20 | | | | (1.11 | ) | | | 1.09 | | | | 1.89 | | | | (5.01 | ) | |
Total income (loss) from investment
operations | | | 0.26 | | | | (0.98 | ) | | | 1.17 | | | | 1.99 | | | | (4.86 | ) | |
| Less dividends from net investment income | | | (0.09 | ) | | | (0.12 | ) | | | (0.21 | ) | | | — | | | | — | | |
| Net asset value, end of period | | $ | 11.30 | | | $ | 11.13 | | | $ | 12.23 | | | $ | 11.27 | | | $ | 9.28 | | |
| Total Return(2) | | | 2.53 | %(5) | | | (8.10 | )% | | | 10.47 | % | | | 21.57 | % | | | (34.44 | )%(5) | |
| Ratios to Average Net Assets(3): | |
| Total expenses | | | 1.95 | %(4)(6) | | | 1.82 | %(4) | | | 1.75 | %(4) | | | 1.94 | %(4) | | | 1.62 | %(4)(6) | |
| Net investment income | | | 1.17 | %(4)(6) | | | 1.04 | %(4) | | | 0.72 | %(4) | | | 1.05 | %(4) | | | 1.96 | %(4)(6) | |
| Rebate from Morgan Stanley affiliate | | | 0.02 | %(6) | | | 0.01 | % | | | 0.02 | % | | | 0.01 | % | | | 0.01 | %(6) | |
| Supplemental Data: | |
| Net assets, end of period, in thousands | | $ | 81 | | | $ | 80 | | | $ | 92 | | | $ | 83 | | | $ | 66 | | |
| Portfolio turnover rate | | | 10 | %(5) | | | 33 | % | | | 15 | % | | | 36 | % | | | 31 | %(5) | |
@@@ The date shares were first issued.
^ Beginning with the year ended October 31, 2011, the Fund was audited by Ernst & Young LLP. The previous years were audited by another independent registered public accounting firm.
(1) The per share amounts were computed using an average number of shares outstanding during the period.
(2) Calculated based on the net asset value as of the last business day of the period.
(3) Reflects overall Fund ratios for investment income and non-class specific expenses.
(4) The ratios reflect the rebate of certain Fund expenses in connection with investments in a Morgan Stanley affiliate during the period. The effect of the rebate on the ratios is disclosed in the above table as "Rebate from Morgan Stanley affiliate."
(5) Not annualized.
(6) Annualized.
See Notes to Financial Statements
59
Morgan Stanley International Fund
Financial Highlights continued
| | | FOR THE SIX | | FOR THE YEAR ENDED OCTOBER 31, | | FOR THE PERIOD
MARCH 31, 2008@@@ | |
| | | MONTHS ENDED | | | | THROUGH | |
| | | APRIL 30, 2012 | | 2011 | | 2010^ | | 2009^ | | OCTOBER 31, 2008^ | |
| | | (unaudited) | | | | | | | | | |
| Class W Shares | |
| Selected Per Share Data: | |
| Net asset value, beginning of period | | $ | 11.16 | | | $ | 12.27 | | | $ | 11.30 | | | $ | 9.28 | | | $ | 14.14 | | |
| Income (loss) from investment operations: | |
| Net investment income(1) | | | 0.07 | | | | 0.15 | | | | 0.10 | | | | 0.11 | | | | 0.16 | | |
| Net realized and unrealized gain (loss) | | | 0.20 | | | | (1.12 | ) | | | 1.09 | | | | 1.91 | | | | (5.02 | ) | |
Total income (loss) from investment
operations | | | 0.27 | | | | (0.97 | ) | | | 1.19 | | | | 2.02 | | | | (4.86 | ) | |
| Less dividends from net investment income | | | (0.11 | ) | | | (0.14 | ) | | | (0.22 | ) | | | — | | | | — | | |
| Net asset value, end of period | | $ | 11.32 | | | $ | 11.16 | | | $ | 12.27 | | | $ | 11.30 | | | $ | 9.28 | | |
| Total Return(2) | | | 2.54 | %(5) | | | (8.03 | )% | | | 10.67 | % | | | 21.77 | % | | | (34.37 | )%(5) | |
| Ratios to Average Net Assets(3): | |
| Total expenses | | | 1.80 | %(4)(6) | | | 1.67 | %(4) | | | 1.60 | %(4) | | | 1.79 | %(4) | | | 1.47 | %(4)(6) | |
| Net investment income | | | 1.32 | %(4)(6) | | | 1.19 | %(4) | | | 0.87 | %(4) | | | 1.20 | %(4) | | | 2.11 | %(4)(6) | |
| Rebate from Morgan Stanley affiliate | | | 0.02 | %(6) | | | 0.01 | % | | | 0.02 | % | | | 0.01 | % | | | 0.01 | %(6) | |
| Supplemental Data: | |
| Net assets, end of period, in thousands | | $ | 86 | | | $ | 85 | | | $ | 93 | | | $ | 86 | | | $ | 66 | | |
| Portfolio turnover rate | | | 10 | %(5) | | | 33 | % | | | 15 | % | | | 36 | % | | | 31 | %(5) | |
@@@ The date shares were first issued.
^ Beginning with the year ended October 31, 2011, the Fund was audited by Ernst & Young LLP. The previous years were audited by another independent registered public accounting firm.
(1) The per share amounts were computed using an average number of shares outstanding during the period.
(2) Calculated based on the net asset value as of the last business day of the period.
(3) Reflects overall Fund ratios for investment income and non-class specific expenses.
(4) The ratios reflect the rebate of certain Fund expenses in connection with investments in a Morgan Stanley affiliate during the period. The effect of the rebate on the ratios is disclosed in the above table as "Rebate from Morgan Stanley affiliate."
(5) Not annualized.
(6) Annualized.
See Notes to Financial Statements
60
Morgan Stanley International Fund
U.S. Privacy Policy (unaudited)
An Important Notice Concerning Our U.S. Privacy Policy
This privacy notice describes the U.S. privacy policy of Morgan Stanley Distribution, Inc., and the Morgan Stanley family of mutual funds ("us", "our", "we").
We are required by federal law to provide you with notice of our U.S. privacy policy ("Policy"). This Policy applies to both our current and former clients unless we state otherwise and is intended for individual clients who purchase products or receive services from us for personal, family or household purposes. This Policy is not applicable to partnerships, corporations, trusts or other non-individual clients or account holders, nor is this Policy applicable to individuals who are either beneficiaries of a trust for which we serve as trustee or participants in an employee benefit plan administered or advised by us. This Policy is, however, applicable to individuals who select us to be a custodian of securities or assets in individual retirement accounts, 401(k) accounts, or accounts subject to the Uniform Gifts to Minors Act.
This notice sets out our business practices to protect your privacy; how we collect and share personal information about you; and how you can limit our sharing or certain uses by others of this information. We may amend this Policy at any time, and will inform you of any changes to our Policy as required by law.
We Respect Your Privacy
We appreciate that you have provided us with your personal financial information and understand your concerns about your information. We strive to safeguard the information our clients entrust to us. Protecting the confidentiality and security of client information is an important part of how we conduct our business.
This notice describes what personal information we collect about you, how we collect it, when we may share it with others, and how certain others may use it. It discusses the steps you may take to limit our sharing of certain information about you with our affiliated companies, including, but not limited to our affiliated banking businesses, brokerage firms and credit service affiliates. It also discloses how you may limit our affiliates' use of shared information for marketing purposes.
Throughout this Policy, we refer to the nonpublic information that personally identifies you as "personal information." We also use the term "affiliated company" in this notice. An affiliated company is a company in our family of companies and includes companies with the Morgan Stanley name. These affiliated companies are financial institutions such as broker-dealers, banks, investment advisers and credit card issuers. We refer to any company that is not an affiliated company as a nonaffiliated third party. For purposes of Section 5 of this notice, and your ability to limit certain uses of personal information by our affiliates, this notice applies to the use of personal information by our affiliated companies.
61
Morgan Stanley International Fund
U.S. Privacy Policy (unaudited) continued
1. What Personal Information Do We Collect From You?
We may collect the following types of information about you: (i) information provided by you, including information from applications and other forms we receive from you, (ii) information about your transactions with us or our affiliates, (iii) information about your transactions with nonaffiliated third parties, (iv) information from consumer reporting agencies, (v) information obtained from our websites, and (vi) information obtained from other sources. For example:
• We collect information such as your name, address, e-mail address, telephone/fax numbers, assets, income and investment objectives through applications and other forms you submit to us.
• We may obtain information about account balances, your use of account(s) and the types of products and services you prefer to receive from us through your dealings and transactions with us and other sources.
• We may obtain information about your creditworthiness and credit history from consumer reporting agencies.
• We may collect background information from and through third-party vendors to verify representations you have made and to comply with various regulatory requirements.
2. When Do We Disclose Personal Information We Collect About You?
We may disclose personal information we collect about you in each of the categories listed above to affiliated and nonaffiliated third parties.
a. Information We Disclose to Affiliated Companies. We may disclose personal information that we collect about you to our affiliated companies to manage your account(s) effectively, to service and process your transactions, and to let you know about products and services offered by us and affiliated companies, to manage our business, and as otherwise required or permitted by law. Offers for products and services from affiliated companies are developed under conditions designed to safeguard your personal information.
b. Information We Disclose to Third Parties. We may disclose personal information that we collect about you to nonaffiliated third parties to provide marketing services on our behalf or to other financial institutions with whom we have joint marketing agreements. We may also disclose all of the information we collect to other nonaffiliated third parties for our everyday business purposes, such as to process transactions, maintain account(s), respond to court orders and legal investigations, report to credit bureaus, offer our own products and services, protect against fraud, for institutional risk control, to perform services on our behalf, and as otherwise required or permitted by law.
62
Morgan Stanley International Fund
U.S. Privacy Policy (unaudited) continued
When we share personal information about you with a nonaffiliated third party, they are required to limit their use of personal information about you to the particular purpose for which it was shared and they are not allowed to share personal information about you with others except to fulfill that limited purpose or as may be permitted or required by law.
3. How Do We Protect The Security and Confidentiality Of Personal Information We Collect About You?
We maintain physical, electronic and procedural security measures that comply with applicable law and regulations to help safeguard the personal information we collect about you. We have internal policies governing the proper handling of client information by employees. Third parties that provide support or marketing services on our behalf may also receive personal information about you, and we require them to adhere to appropriate security standards with respect to such information.
4. How Can You Limit Our Sharing Certain Personal Information About You With Our Affiliated Companies For Eligibility Determination?
By following the opt-out procedures in Section 6 below, you may limit the extent to which we share with our affiliated companies, personal information that was collected to determine your eligibility for products and services such as your credit reports and other information that you have provided to us or that we may obtain from third parties ("eligibility information"). Eligibility information does not include your identification information or personal information pertaining to our transactions or experiences with you. Please note that, even if you direct us not to share eligibility information with our affiliated companies, we may still share your personal information, including eligibility information, with our affiliated companies under circumstances that are permitted under applicable law, such as to process transactions or to service your account.
5. How Can You Limit the Use of Certain Personal Information About You by Our Affiliated Companies for Marketing?
By following the opt-out instructions in Section 6 below, you may limit our affiliated companies from marketing their products or services to you based on personal information we disclose to them. This information may include, for example, your income and account history with us. Please note that, even if you choose to limit our affiliated companies from using personal information about you that we may share with them for marketing their products and services to you, our affiliated companies may use your personal information that they obtain from us to market to you in circumstances permitted by law, such as if the affiliated party has its own relationship with you.
63
Morgan Stanley International Fund
U.S. Privacy Policy (unaudited) continued
6. How Can You Send Us an Opt-Out Instruction?
If you wish to limit our sharing of eligibility information about you with our affiliated companies, or our affiliated companies' use of personal information for marketing purposes, as described in this notice, you may do so by:
• Calling us at (800) 548-7786
Monday–Friday between 8a.m. and 5p.m. (EST)
• Writing to us at the following address:
Morgan Stanley Services Company Inc.
c/o Privacy Coordinator
201 Plaza Two, 3rd Floor
Jersey City, New Jersey 07311
If you choose to write to us, your request should include: your name, address, telephone number and account number(s) to which the opt-out applies and whether you are opting out with respect to sharing of eligibility information (Section 4 above), or information used for marketing (Section 5 above), or both. Written opt-out requests should not be sent with any other correspondence. In order to process your request, we require that the request be provided by you directly and not through a third party. Once you have informed us about your privacy preferences, your opt-out preference will remain in effect with respect to this Policy (as it may be amended) until you notify us otherwise. If you are a joint account owner, we will accept instructions from any one of you and apply those instructions to the entire account.
Please understand that if you limit our sharing or our affiliated companies' use of personal information, you and any joint account holder(s) may not receive information about our affiliated companies' products and services, including products or services that could help you manage your financial resources and achieve your investment objectives.
If you have more than one account or relationship with us, please specify the accounts to which you would like us to apply your privacy choices. If you have accounts or relationships with our affiliates, you may receive multiple privacy policies from them, and will need to separately notify those companies of your privacy choices for those accounts or relationships.
7. What if an affiliated company becomes a nonaffiliated third party?
If, at any time in the future, an affiliated company becomes a nonaffiliated third party, further disclosures of personal information made to the former affiliated company will be limited to those described in Section 2(b) above relating to nonaffiliated third parties. If you elected under Section 6 to limit disclosures we make to affiliated companies, or use of personal information by affiliated companies,
64
Morgan Stanley International Fund
U.S. Privacy Policy (unaudited) continued
your election will not apply to use by any former affiliated company of your personal information in their possession once it becomes a nonaffiliated third party.
Special Notice to Residents of Vermont
The following section supplements our Policy with respect to our individual clients who have a Vermont address and supersedes anything to the contrary in the above Policy with respect to those clients only.
The State of Vermont requires financial institutions to obtain your consent prior to sharing personal information that they collect about you with nonaffiliated third parties, or eligibility information with affiliated companies, other than in certain limited circumstances. Except as permitted by law, we will not share personal information we collect about you with nonaffiliated third parties or eligibility information with affiliated companies, unless you provide us with your written consent to share such information.
Special Notice to Residents of California
The following section supplements our Policy with respect to our individual clients who have a California address and supersedes anything to the contrary in the above Policy with respect to those clients only.
In response to a California law, if your account has a California home address, your personal information will not be disclosed to nonaffiliated third parties except as permitted by applicable California law, and we will limit sharing such personal information with our affiliates to comply with California privacy laws that apply to us.
65
(This page has been left blank intentionally.)
(This page has been left blank intentionally.)
MORGAN STANLEY INSTITUTIONAL FUND, INC.
INTERNATIONAL EQUITY PORTFOLIO
ACTIVE INTERNATIONAL ALLOCATION PORTFOLIO
PART B
STATEMENT OF ADDITIONAL INFORMATION
This Statement of Additional Information (the “SAI”) relates to the shares of common stock (“shares”) of each of the International Equity Portfolio (“MSIF International Equity”) and Active International Allocation Portfolio (“MSIF Active International”), each a series of Morgan Stanley Institutional Fund, Inc. (the “Company”), to be issued pursuant to (i) an Agreement and Plan of Reorganization, dated June 28, 2012, between the Company, on behalf of MSIF International Equity, and Morgan Stanley International Value Equity Fund (“International Value Equity”), in connection with the acquisition by MSIF International Equity of substantially all of the assets and liabilities of International Value Equity (the “International Equity Reorganization”) and (ii) an Agreement and Plan of Reorganization, dated June 28, 2012, between the Company, on behalf of MSIF Active International, and Morgan Stanley International Fund (“International”), in connection with the acquisition by MSIF Active International of substantially all of the assets and liabilities of International (the “Active International Reorganization”).
MSIF International Equity and MSIF Active International are each referred to herein as an “Acquiring Fund,” and together as the “Acquiring Funds.” International Value Equity and International are each referred to herein as an “Acquired Fund,” and together as the “Acquired Funds.” The International Equity Reorganization and Active International Reorganization are each referred to herein as a “Reorganization,” and together as the “Reorganizations.”
This SAI does not constitute a prospectus. This SAI does not include all information that a shareholder should consider before voting on the proposals contained in the Joint Proxy Statement and Prospectus, and, therefore, should be read in conjunction with the related Joint Proxy Statement and Prospectus, dated July 24, 2012. A copy of the Joint Proxy Statement and Prospectus may be obtained upon request and without charge by calling (800) 548-7786 (toll-free). Please retain this document for future reference.
The date of this SAI is July 24, 2012.
Table of Contents
| Page |
| |
Introduction | B-2 |
| |
Additional Information About the Acquiring Funds | B-2 |
| |
Financial Statements | B-4 |
B-1
INTRODUCTION
This SAI is intended to supplement the information provided in the Joint Proxy Statement and Prospectus dated July 24, 2012 (the “Joint Proxy Statement and Prospectus”). The Joint Proxy Statement and Prospectus has been sent to the Acquired Funds’ Shareholders in connection with the solicitation of proxies by the Board of Trustees of each of the Acquired Funds to be voted at the Special Meetings of Shareholders of each of the Acquired Funds to be held on September 27, 2012. Each of (i) the Company’s Statement of Additional Information, dated April 30, 2012, as it may be amended and supplemented from time to time (the “Company’s Statement of Additional Information”), (ii) International Value Equity’s Statement of Additional Information, dated December 30, 2011, as may be amended and supplemented from time to time (the “International Value Equity Statement of Additional Information”); and (iii) Active International’s Statement of Additional Information, dated February 29, 2012, as it may be amended and supplemented from time to time (the “Active International Statement of Additional Information”) accompany, and are incorporated by reference in, this SAI.
ADDITIONAL INFORMATION ABOUT THE ACQUIRING FUNDS
Fund History
For additional information about each Acquiring Fund’s history, see “General Information—Fund History” in the Company’s Statement of Additional Information relating to each Acquiring Fund.
Investment Objectives and Policies
For additional information about each Acquiring Fund’s investment objectives and policies, see “Investment Policies and Strategies” in the Company’s Statement of Additional Information relating to each Acquiring Fund.
Fund Holdings
For additional information about each Acquiring Fund’s policies and procedures with respect to the disclosure of their portfolio securities to any person, see “Disclosure of Fund Holdings” in the Company’s Statement of Additional Information relating to each Acquiring Fund.
Management
For additional information about the Board of Directors, officers and management personnel of each Acquiring Fund, see “Management of the Fund” and “Investment Advisory and Other Services” in the Company’s Statement of Additional Information relating to each Acquiring Fund.
Investment Advisory and Other Services
For additional information about each Acquiring Fund’s investment adviser, each Acquiring Fund’s independent registered public accounting firm and other services provided to each Acquiring Fund, see “Investment Advisory and Other Services” in the Company’s Statement of Additional Information relating to each Acquiring Fund.
Codes of Ethics
For additional information about the Codes of Ethics adopted by each Acquiring Fund, each Acquiring Fund’s investment adviser and each Acquiring Fund’s distributor, see “Management of the Fund—Code of Ethics” in the Company’s Statement of Additional Information relating to each Acquiring Fund.
B-2
Proxy Voting Policies
For additional information about the voting of proxies held by each Acquiring Fund, see “Investment Advisory and Other Services—Proxy Voting Policy and Proxy Voting Record” in the Company’s Statement of Additional Information relating to each Acquiring Fund.
Fund Managers
For additional information about the portfolio managers primarily responsible for the day-to-day management of each Acquiring Fund, their compensation structure and their holdings in each Acquiring Fund, see “Investment Advisory and Other Services—Portfolio Managers” in the Company’s Statement of Additional Information relating to each Acquiring Fund.
Fund Transactions and Brokerage
For additional information about brokerage allocation practices, see “Brokerage Practices” in the Company’s Statement of Additional Information relating to each Acquiring Fund.
Description of Fund Shares
For additional information about the voting rights and other characteristics of the shares of each Acquiring Fund, see “General Information—Description of Shares and Voting Rights” in the Company’s Statement of Additional Information relating to each Acquiring Fund.
Purchase, Redemption and Pricing of Shares
For additional information about the purchase and redemption of each Acquiring Fund’s shares and the determination of net asset value, see “Purchase of Shares” and “Redemption of Shares” in the Company’s Statement of Additional Information relating to each Acquiring Fund.
Dividends, Distributions and Tax Status
For additional information about each Acquiring Fund’s policies regarding dividends and distributions and tax matters affecting each Acquiring Fund and its Shareholders, see “General Information—Dividends and Capital Gains Distributions” and “Taxes” in the Company’s Statement of Additional Information relating to each Acquiring Fund.
Distribution of Shares
For additional information about each Acquiring Fund’s distributor and the distribution agreement between each Acquiring Fund and its distributor, see “Investment Advisory and Other Services” in the Company’s Statement of Additional Information relating to each Acquiring Fund.
Performance Data
For additional information about each Acquiring Fund’s performance, see “Performance Information” in the Company’s Statement of Additional Information relating to each Acquiring Fund.
B-3
FINANCIAL STATEMENTS
1. The most recent audited financial statements of (i) the Acquiring Funds, for the fiscal year ended December 31, 2011, (ii) International Value Equity, for the fiscal year ended August 31, 2011 and (iii) International, for the fiscal year ended October 31, 2011, have been audited by Ernst & Young LLP, an independent registered public accounting firm. Ernst & Young LLP’s reports, along with the Funds’ audited financial statements, are included in each respective Fund’s Annual Report to Shareholders for the most recently completed fiscal year. International Value Equity’s and International’s most recent financial statements (unaudited) are set forth in each Fund’s Semi-Annual Report for the six-month period ended February 29, 2012 and April 30, 2012, respectively. A copy of each report accompanies and is incorporated by reference in this SAI. In addition, a copy of the Acquiring Funds’ Annual Report for the fiscal year ended December 31, 2011 accompanies the Proxy Statement and Prospectus.
2. Pursuant to Item 14(2) of Form N-14, the pro forma financial statements required by Rule 11-01 of Regulation S-X are not prepared for the International Equity Reorganization because the net asset value of the Acquired Fund does not exceed ten percent of the Acquiring Fund’s net asset value, measured at July 23, 2012.
3. Shown below are Financial Statements for International and MSIF Active International and Pro Forma Financial Statements for the applicable Combined Fund as of December 31, 2011, as though the reorganization occurred as of that date. These financial statements set forth the unaudited pro forma condensed Statement of Assets and Liabilities as of December 31, 2011, the unaudited pro forma condensed Statement of Operations for the twelve month period ended December 31, 2011 and the unaudited pro forma condensed Portfolio of Investments as of December 31, 2011. These statements have been derived from the books and records utilized in calculating daily net asset value for each Portfolio.
B-4
Pro Forma Combined Condensed Statement of Assets and Liabilities
As of December 31, 2011 (Unaudited)
| | Morgan Stanley
International
Fund (000) | | Morgan
Stanley
Institutional
Fund, Inc.
Active
International
Allocation
Portfolio
(000) | | Adjustments
(000) | | Pro Forma
Combined Portfolio
(000) | |
| | | | | | | | | |
Assets: | | | | | | | | | |
Investments in Securities of Unaffiliated Issuers, at Cost | | $ | 88,439 | | $ | 314,111 | | $ | — | | $ | 402,550 | |
Investments in Securities of Affiliated Issuers, at Cost | | 17,610 | | 53,695 | | — | | 71,305 | |
Total Investments in Securities, at Cost | | 106,049 | | 367,806 | | — | | 473,855 | |
Foreign Currency, at Cost | | 1,082 | | 5,008 | | — | | 6,090 | |
Investments in Securities of Unaffiliated Issuers, at Value (1) | | 83,854 | | 283,477 | | — | | 367,331 | |
Investments in Securities of Affiliated Issuers, at Value | | 17,234 | | 52,065 | | — | | 69,299 | |
Total Investments in Securities, at Value (1) | | 101,088 | | 335,542 | | — | | 436,630 | |
Cash | | — | | 210 | | — | | 210 | |
Foreign Currency, at Value | | 1,060 | | 4,957 | | — | | 6,017 | |
Receivable for Investments Sold | | 2 | | 5 | | — | | 7 | |
Variation Margin | | 748 | | 2,151 | | — | | 2,899 | |
Dividends Receivable | | 167 | | 548 | | — | | 715 | |
Receivable for Portfolio Shares Sold | | 3 | | 12 | | — | | 15 | |
Unrealized Appreciation on Foreign Currency Exchange Contracts | | 109 | | 333 | | — | | 442 | |
Tax Reclaim Receivable | | 67 | | 203 | | — | | 270 | |
Receivable from Affiliate | | 1 | | 3 | | — | | 4 | |
Other Assets | | (7 | ) | 1 | | — | | (6 | ) |
Total Assets | | 103,238 | | 343,965 | | — | | 447,203 | |
| | | | | | | | | |
Liabilities: | | | | | | | | | |
Collateral on Securities Loaned, at Value | | 7,306 | | 29,174 | | — | | 36,480 | |
Payable for Portfolio Shares Redeemed | | 761 | | 811 | | — | | 1,572 | |
Payable for Investment Advisory Fees | | 53 | | 499 | | — | | 552 | |
Payable for Sub Transfer Agency Fees | | — | | 286 | | — | | 286 | |
Deferred Capital Gain Country Tax | | — | @ | 1 | | — | | 1 | |
Unrealized Depreciation on Foreign Currency Exchange Contracts | | 189 | | 598 | | — | | 787 | |
Payable for Custodian Fees | | 28 | | 45 | | — | | 73 | |
Payable for Professional Fees | | 26 | | 21 | | — | | 47 | |
Payable for Administration Fees | | 7 | | 22 | | — | | 29 | |
Payable for Directors’ Fees and Expenses | | 2 | | 20 | | — | | 22 | |
Payable for Transfer Agent Fees | | 79 | | 2 | | — | | 81 | |
Payable for Distribution and Shareholder Servicing Fees — Class P | | — | | 2 | | — | | 2 | |
Distribution Fee | | 32 | | — | | — | | 32 | |
Payable for Reorganization Expense | | — | | — | | 392 | | 392 | |
Other Liabilities | | 37 | | 49 | | — | | 86 | |
Total Liabilities | | $ | 8,520 | | $ | 31,530 | | $ | 392 | | $ | 40,442 | |
Net Assets | | $ | 94,718 | | $ | 312,435 | | $ | (392 | ) | $ | 406,761 | |
| | | | | | | | | |
Net Assets Consist Of: | | | | | | | | | |
Paid in Capital | | $ | 126,910 | | $ | 414,180 | | — | | 541,090 | |
Distributions in Excess of Net Investment Income | | 181 | | (1,888 | ) | (392 | ) | (2,099 | ) |
Accumulated Net Realized Loss | | (27,136 | ) | (67,020 | ) | — | | (94,156 | ) |
B-5
| | Morgan Stanley
International
Fund (000) | | Morgan
Stanley
Institutional
Fund, Inc.
Active
International
Allocation
Portfolio
(000) | | Adjustments
(000) | | Pro Forma
Combined Portfolio
(000) | |
| | | | | | | | | |
Unrealized Appreciation (Depreciation) on: | | | | | | | | — | |
Investments | | (4,995 | ) | (30,635 | ) | — | | (35,630 | ) |
Investments in Affiliates | | (6 | ) | (1,630 | ) | — | | (1,636 | ) |
Futures Contracts | | (129 | ) | (144 | ) | — | | (273 | ) |
Foreign Currency Exchange Contracts | | (80 | ) | (265 | ) | — | | (345 | ) |
Foreign Currency Translations | | (27 | ) | (163 | ) | — | | (190 | ) |
Net Assets | | $ | 94,718 | | $ | 312,435 | | $ | (392 | ) | $ | 406,761 | |
| | | | | | | | | |
Net Assets | | | | | | | | | |
Class A | | 76,712 | | | | (76,712 | ) | — | |
Class B | | 6,437 | | | | (6,437 | ) | — | |
Class C | | 10,878 | | | | (10,878 | ) | — | |
Class I | | 537 | | 302,048 | | (291 | ) | 302,294 | |
Class R | | 75 | | | | (75 | ) | — | |
Class W | | 79 | | | | (79 | ) | — | |
Class P | | — | | 10,387 | | (10 | ) | 10,377 | |
Class H | | — | | | | $ | 83,223 | | 83,223 | |
Class L | | — | | | | $ | 10,867 | | 10,867 | |
| | $ | 94,718 | | $ | 312,435 | | $ | (392 | ) | $ | 406,761 | |
| | | | | | | | | |
Shares Outstanding (not in thousands) | | | | | | | | | |
Class A | | 7,325,418 | | — | | (7,325,418 | ) | — | |
Class B | | 617,703 | | — | | (617,703 | ) | — | |
Class C | | 1,059,500 | | — | | (1,059,500 | ) | — | |
Class I | | 51,013 | | 30,000,363 | | (26,581 | ) | 30,024,795 | |
Class R | | 7,150 | | — | | (7,150 | ) | — | |
Class W | | 7,604 | | — | | (7,604 | ) | — | |
Class P | | — | | 1,011,858 | | (974 | ) | 1,010,884 | |
Class H | | — | | — | | 8,103,505 | | 8,103,505 | |
Class L | | — | | — | | 1,058,130 | | 1,058,130 | |
| | | | | | | | | |
Net Asset Value Per Share | | | | | | | | | |
Class A | | $ | 10.47 | | $ | — | | — | | $ | — | |
Class B | | $ | 10.42 | | $ | — | | — | | $ | — | |
Class C | | $ | 10.27 | | $ | — | | — | | $ | — | |
Class I | | $ | 10.53 | | $ | 10.07 | | — | | $ | 10.07 | |
Class R | | $ | 10.44 | | $ | — | | — | | $ | — | |
Class W | | $ | 10.45 | | $ | — | | — | | $ | — | |
Class P | | $ | — | | $ | 10.27 | | — | | $ | 10.27 | |
Class H | | $ | — | | $ | 10.27 | | — | | $ | 10.27 | |
Class L | | $ | — | | $ | 10.27 | | — | | $ | 10.27 | |
| | | | | | | | | | | | |
(1) Including: | | | | | | | | | |
Securities on Loan, at Value | | $ | 7,085 | | $ | 28,149 | | — | | $ | 35,234 | |
@ - Amount is less than $500
B-6
PRO FORMA COMBINING CONDENSED STATEMENT OF OPERATIONS
FOR THE TWELVE MONTH PERIOD ENDED December 31, 2011 (Unaudited)
| | Morgan
Stanley
International
Fund (000) | | Morgan Stanley
Institutional Fund,
Inc. Active
International
Allocation
Portfolio
(000) | | Adjustments
(000) | | Pro Forma
Combined
Portfolio (000) | |
Investment Income: | | | | | | | | | |
Dividends from Securities of Unaffiliated Issuers | | $ | 3,743 | | $ | 13,415 | | $ | — | | $ | 17,158 | |
Income from Securities Loaned — Net | | 140 | | 540 | | — | | 680 | |
Dividends from Securities of Affiliated Issuers | | 24 | | 60 | | — | | 84 | |
Interest from Securities of Unaffiliated Issuers | | 28 | | 10 | | — | | 38 | |
Less: Foreign Taxes Withheld | | (332 | ) | (1,164 | )* | — | | (1,496 | ) |
Total Investment Income | | 3,603 | | 12,861 | | — | | 16,464 | |
Expenses: | | | | | | | | | |
Investment Advisory Fees | | 790 | | 2,635 | | — | | 3,425 | |
Custodian Fees | | 160 | | 283 | | (39 | )(a) | 404 | |
Sub Transfer Agency Fees | | — | | 271 | | — | | 271 | |
Administration Fees | | 98 | | 324 | | — | | 422 | |
Professional Fees | | 116 | | 75 | | (68 | )(b) | 123 | |
Shareholder Reporting Fees | | 63 | | 82 | | (16 | )(c) | 129 | |
Registration Fees | | 76 | | 40 | | (76 | )(d) | 40 | |
Pricing Fees | | 83 | | 64 | | — | | 147 | |
Transfer Agency Fees | | 233 | | 19 | | (6 | )(e) | 246 | |
Directors’ Fees and Expenses | | 3 | | 14 | | — | | 17 | |
Distribution and Shareholder Servicing Fees — Class P | | — | | 34 | | — | | 34 | |
Distribution and Shareholder Servicing Fees — Class H | | — | | — | | 342 | (f) | 342 | |
Distribution and Shareholder Servicing Fees — Class L | | — | | — | | 139 | (f) | 139 | |
Distribution Fees (Class A Shares) | | 241 | | | | (241 | )(f) | — | |
Distribution Fees (Class B Shares) | | 101 | | | | (101 | )(f) | — | |
Distribution Fees (Class C Shares) | | 139 | | | | (139 | )(f) | — | |
Distribution Fees (Class R Shares) | | — | @ | | | — | @(f) | — | |
Distribution Fees (Class W Shares) | | — | @ | | | — | @(f) | — | |
Reorganization Expense | | — | | — | | 392 | (g) | 392 | |
Other Expenses | | 35 | | 24 | | (10 | )(h) | 49 | |
Total Expenses | | 2,138 | | 3,865 | | 177 | | 6,180 | |
Waiver of Investment Advisory Fees | | — | | (407 | ) | | | (407 | ) |
Rebate from Morgan Stanley Affiliate | | (12 | ) | (26 | ) | | | (38 | ) |
Net Expenses | | 2,126 | | 3,432 | | 177 | | 5,735 | |
Net Investment Income (Loss) | | $ | 1,477 | | $ | 9,429 | | $ | (177 | ) | $ | 10,729 | |
| | | | | | | | | |
Realized Gain (Loss): | | | | | | | | | |
Investment Sold | | 6,239 | | 30,565 | ** | — | | 36,804 | |
Investments in Affiliates | | (30 | ) | (81 | ) | — | | (111 | ) |
Foreign Currency Exchange Contracts | | (786 | ) | (2,377 | ) | — | | (3,163 | ) |
Foreign Currency Transactions | | (129 | ) | (814 | ) | — | | (943 | ) |
Futures Contracts | | (2,239 | ) | (6,806 | ) | — | | (9,045 | ) |
Net Realized Gain (Loss) | | 3,055 | | 20,487 | | — | | 23,542 | |
Change in Unrealized Appreciation (Depreciation): | | | | | | | | | |
Investments | | (8,919 | ) | (88,128 | )*** | — | | (97,047 | ) |
Investments in Affiliates | | (65 | ) | (199 | ) | — | | (264 | ) |
Foreign Currency Exchange Contracts | | (4 | ) | (47 | ) | — | | (51 | ) |
Foreign Currency Translations | | 274 | | (316 | ) | — | | (42 | ) |
Futures Contracts | | 61 | | (232 | ) | — | | (171 | ) |
Net Change in Unrealized Appreciation (Depreciation) | | (8,653 | ) | (88,922 | ) | — | | (97,575 | ) |
Total Net Realized Gain (Loss) and Change in Unrealized Appreciation (Depreciation) | | (5,598 | ) | (68,435 | ) | — | | (74,033 | ) |
Net Increase (Decrease) in Net Assets Resulting from Operations | | $ | (4,121 | ) | $ | (59,006 | ) | $ | (177 | ) | $ | (63,304 | ) |
B-7
* Including Foreign Taxes Withheld from Securities of Affiliated Issuers of approximately $3,000 for Active International Allocation Portfolio.
** Net of Capital Gain Country Tax of approximately $6,000 for Active International Allocation Portfolio.
*** Net of Increase (Decrease) in Deferred Capital Gain Country Tax Accrual of approximately $1,000 for Active International Allocation.
(a) — Reflects elimination of transaction based fees of approximately $39,000 for MS International Custody OOP Fees.
(b) — Reflects elimination of audit fee for MS International Fund.
(c) — Reflects elimination of approximately $16,000 for Annual Mailing, Printing, & Typsetting of MS International Shareholder Reports.
(d) — Reflects elimination of blue sky fees for MS International.
(e) — Reflects elimination of approximately $6,000 TA OOP Fees for MS International Fund.
(f) — Reclass of Class Level Expenses into actual class MS International will be processed into.
(g) — Reflects adjustment estimated for Reorganization Expense.
(h) — Reflects elimination of approximately $10,000 for miscellaneous invoices for NASDAQ, ITG and Lipper for MS International Fund.
@ Amount is less than $500.
B-8
Portfolio of Investments
As of December 31, 2011 (unaudited)
Security Description | | MS
International
Fund
Shares | | MSIF Active
International
Al location
Shares | | Pro Forma
Shares | | MS
International
Fund
(000) | | MSIF Active
International
Allocation
(000) | | Adjustments | | Pro Forma
Value
(000) | |
Common Stocks (88.2%) | | | | | | | | | | | | | | | |
Australia (3.8%) | | | | | | | | | | | | | | | |
AGL Energy Ltd. | | 881 | | 4,864 | | 5,745 | | $ | 13 | | $ | 71 | | | | $ | 84 | |
Alumina Ltd. | | 19,416 | | 61,436 | | 80,852 | | 22 | | 70 | | | | 92 | |
Amcor Ltd. | | 10,222 | | 32,344 | | 42,566 | | 75 | | 239 | | | | 314 | |
AMP Ltd. | | 2,491 | | 20,428 | | 22,919 | | 10 | | 86 | | | | 96 | |
ASX Ltd. | | — | | 896 | | 896 | | — | | 28 | | | | 28 | |
Australia & New Zealand Banking Group Ltd. | | 16,348 | | 24,702 | | 41,050 | | 343 | | 519 | | | | 862 | |
BHP Billiton Ltd. (a) | | 40,753 | | 128,952 | | 169,705 | | 1,435 | | 4,540 | | | | 5,975 | |
Boral Ltd. (a) | | 5,661 | | 23,491 | | 29,152 | | 21 | | 86 | | | | 107 | |
Brambles Ltd. | | 1,772 | | 12,583 | | 14,355 | | 13 | | 92 | | | | 105 | |
Caltex Australia Ltd. | | 773 | | 3,825 | | 4,598 | | 9 | | 46 | | | | 55 | |
Coca-Cola Amatil Ltd. | | 970 | | 5,977 | | 6,947 | | 12 | | 70 | | | | 82 | |
Cochlear Ltd. (a) | | — | | 319 | | 319 | | — | | 20 | | | | 20 | |
Commonwealth Bank of Australia (a) | | 800 | | 3,975 | | 4,775 | | 40 | | 200 | | | | 240 | |
Computershare Ltd. | | — | | 2,767 | | 2,767 | | — | | 23 | | | | 23 | |
CSL Ltd. | | 511 | | 4,636 | | 5,147 | | 17 | | 152 | | | | 169 | |
CSR Ltd. (a) | | 1,257 | | 5,902 | | 7,159 | | 2 | | 12 | | | | 14 | |
DuluxGroup Ltd. (a) | | 5,007 | | 14,641 | | 19,648 | | 15 | | 43 | | | | 58 | |
Echo Entertainment Group Ltd. (b) | | 838 | | 4,938 | | 5,776 | | 3 | | 18 | | | | 21 | |
Fortescue Metals Group Ltd. | | 16,462 | | 52,090 | | 68,552 | | 72 | | 227 | | | | 299 | |
GPT Group REIT (Stapled Securities)(c) | | — | | 4,988 | | 4,988 | | — | | 16 | | | | 16 | |
Incitec Pivot Ltd. | | 20,543 | | 65,003 | | 85,546 | | 65 | | 207 | | | | 272 | |
Insurance Australia Group Ltd. | | 3,028 | | 16,506 | | 19,534 | | 9 | | 51 | | | | 60 | |
James Hardie Industries SE CDI | | 3,522 | | 16,816 | | 20,338 | | 25 | | 117 | | | | 142 | |
Leighton Holdings Ltd. (a) | | 425 | | 1,886 | | 2,311 | | 8 | | 37 | | | | 45 | |
Macquarie Group Ltd. (a) | | 362 | | 2,367 | | 2,729 | | 9 | | 58 | | | | 67 | |
Mirvac Group REIT (Stapled Securities)(a)(c)(d) | | — | | 8,147 | | 8,147 | | — | | 10 | | | | 10 | |
National Australia Bank Ltd. (a) | | 1,188 | | 5,099 | | 6,287 | | 28 | | 122 | | | | 150 | |
Newcrest Mining Ltd. | | 15,761 | | 61,509 | | 77,270 | | 477 | | 1,862 | | | | 2,339 | |
OneSteel Ltd. | | 11,038 | | 32,592 | | 43,630 | | 8 | | 23 | | | | 31 | |
Orica Ltd. | | 4,518 | | 14,276 | | 18,794 | | 112 | | 354 | | | | 466 | |
Origin Energy Ltd. | | 1,594 | | 10,576 | | 12,170 | | 22 | | 144 | | | | 166 | |
OZ Minerals Ltd. | | 3,591 | | 11,364 | | 14,955 | | 37 | | 116 | | | | 153 | |
Perpetual Ltd. (a) | | — | | 315 | | 315 | | — | | 7 | | | | 7 | |
| | | | | | | | | | | | | | | | | | |
B-9
Security Description | | MS
International
Fund
Shares | | MSIF Active
International
Al location
Shares | | Pro Forma
Shares | | MS
International
Fund
(000) | | MSIF Active
International
Allocation
(000) | | Adjustments | | Pro Forma
Value
(000) | |
Qantas Airways Ltd. (b) | | — | | 5,339 | | 5,339 | | — | | 8 | | | | 8 | |
QBE Insurance Group Ltd. | | 1,154 | | 7,459 | | 8,613 | | 15 | | 99 | | | | 114 | |
Rio Tinto Ltd. (a) | | 3,431 | | 10,857 | | 14,288 | | 212 | | 669 | | | | 881 | |
Santos Ltd. | | 916 | | 6,289 | | 7,205 | | 11 | | 79 | | | | 90 | |
Sims Metal Management Ltd. (a) | | 1,930 | | 6,190 | | 8,120 | | 25 | | 80 | | | | 105 | |
Sonic Healthcare Ltd. | | 310 | | 2,599 | | 2,909 | | 4 | | 30 | | | | 34 | |
Stockland REIT (Stapled Securities)(c)(d) | | 855 | | 8,391 | | 9,246 | | 3 | | 27 | | | | 30 | |
Suncorp Group Ltd. (a) | | 1,016 | | 8,001 | | 9,017 | | 9 | | 68 | | | | 77 | |
TABCORP Holdings Ltd. | | 857 | | 4,933 | | 5,790 | | 2 | | 14 | | | | 16 | |
Telstra Corp, Ltd. | | 3,853 | | 34,266 | | 38,119 | | 13 | | 117 | | | | 130 | |
Toll Holdings Ltd. (a) | | — | | 5,604 | | 5,604 | | — | | 24 | | | | 24 | |
Transurban Group (Stapled Securities)(c) | | 1,444 | | 10,994 | | 12,438 | | 8 | | 64 | | | | 72 | |
Treasury Wine Estates Ltd. | | 1,221 | | 6,561 | | 7,782 | | 5 | | 24 | | | | 29 | |
Wesfarmers Ltd. | | 733 | | 8,383 | | 9,116 | | 22 | | 253 | | | | 275 | |
Westfield Group REIT (Stapled Securities)(c)(d) | | — | | 10,520 | | 10,520 | | — | | 84 | | | | 84 | |
Westfield Retail Trust REIT | | — | | 10,501 | | 10,501 | | — | | 27 | | | | 27 | |
Westpac Banking Corp. (a) | | 1,203 | | 7,742 | | 8,945 | | 25 | | 158 | | | | 183 | |
Woodside Petroleum Ltd. | | 840 | | 6,199 | | 7,039 | | 26 | | 194 | | | | 220 | |
Woolworths Ltd. | | 1,629 | | 11,881 | | 13,510 | | 42 | | 305 | | | | 347 | |
WorleyParsons Ltd. | | — | | 926 | | 926 | | — | | 24 | | | | 24 | |
| | | | | | | | 3,324 | | 12,014 | | | | 15,338 | |
Austria (0.4%) | | | | | | | | | | | | | | | |
Erste Group Bank AG | | 3,697 | | 11,823 | | 15,520 | | 65 | | 208 | | | | 273 | |
OMV AG | | 1,682 | | 6,528 | | 8,210 | | 51 | | 199 | | | | 250 | |
Raiffeisen Bank International AG (a) | | 1,070 | | 3,341 | | 4,411 | | 28 | | 87 | | | | 115 | |
Telekom Austria AG | | 8,605 | | 32,532 | | 41,137 | | 103 | | 390 | | | | 493 | |
Verbund AG Class A(a) | | 1,397 | | 4,525 | | 5,922 | | 37 | | 122 | | | | 159 | |
Vienna Insurance Group AG Wiener Versicherung Gruppe | | 773 | | 2,934 | | 3,707 | | 31 | | 116 | | | | 147 | |
Voestalpine AG | | 3,006 | | 9,872 | | 12,878 | | 85 | | 277 | | | | 362 | |
| | | | | | | | 400 | | 1,399 | | | | 1,799 | |
Belgium (0.8%) | | | | | | | | | | | | | | | |
Ageas | | 5,238 | | 12,628 | | 17,866 | | 8 | | 20 | | | | 28 | |
Anheuser-Busch InBev N.V. | | 6,218 | | 26,825 | | 33,043 | | 381 | | 1,642 | | | | 2,023 | |
Anheuser-Busch InBev N.V. VVPR(b) | | 2,742 | | 17,784 | | 20,526 | | — | | — | @ | | | — | @ |
Belgacom SA | | 1,903 | | 6,959 | | 8,862 | | 60 | | 218 | | | | 278 | |
Delhaize Group SA | | — | | 164 | | 164 | | — | | 9 | | | | 9 | |
Groupe Bruxelles Lambert SA | | 979 | | 3,704 | | 4,683 | | 65 | | 247 | | | | 312 | |
B-10
Security Description | | MS
International
Fund
Shares | | MSIF Active
International
Al location
Shares | | Pro Forma
Shares | | MS
International
Fund
(000) | | MSIF Active
International
Allocation
(000) | | Adjustments | | Pro Forma
Value
(000) | |
Mobistar SA | | 365 | | 96 | | 461 | | 19 | | 5 | | | | 24 | |
Solvay SA Class A | | 673 | | 2,263 | | 2,936 | | 55 | | 187 | | | | 242 | |
UCB SA | | 1,255 | | 4,789 | | 6,044 | | 53 | | 201 | | | | 254 | |
Umicore SA | | 1,595 | | 4,728 | | 6,323 | | 66 | | 195 | | | | 261 | |
| | | | | | | | 707 | | 2,724 | | | | 3,431 | |
Brazil (0.1%) | | | | | | | | | | | | | | | |
All America Latina Logistica SA (Units)(d) | | 3,200 | | 10,200 | | 13,400 | | 16 | | 51 | | | | 67 | |
Banco do Brasil SA | | 2,600 | | 8,100 | | 10,700 | | 33 | | 103 | | | | 136 | |
BRF - Brasil Foods SA | | 4,428 | | 14,848 | | 19,276 | | 86 | | 290 | | | | 376 | |
Cia Energetica de Minas Gerais (Preference) | | — | | 1 | | 1 | | — | | — | @ | | | — | @ |
| | | | | | | | 135 | | 444 | | | | 579 | |
Canada (1.3%) | | | | | | | | | | | | | | | |
Agnico-Eagle Mines Ltd. (a) | | 1,500 | | 4,900 | | 6,400 | | 55 | | 178 | | | | 233 | |
Barrick Gold Corp. | | 8,700 | | 28,100 | | 36,800 | | 394 | | 1,273 | | | | 1,667 | |
Centerra Gold, Inc. | | 1,500 | | 5,000 | | 6,500 | | 27 | | 88 | | | | 115 | |
Eldorado Gold Corp. | | 4,900 | | 15,700 | | 20,600 | | 67 | | 216 | | | | 283 | |
Franco-Nevada Corp. | | 1,200 | | 3,800 | | 5,000 | | 46 | | 144 | | | | 190 | |
Goldcorp, Inc. | | 6,900 | | 22,400 | | 29,300 | | 306 | | 994 | | | | 1,300 | |
IAMGOLD Corp. | | 3,300 | | 10,600 | | 13,900 | | 52 | | 169 | | | | 221 | |
Kinross Gold Corp. | | 9,900 | | 32,000 | | 41,900 | | 113 | | 365 | | | | 478 | |
New Gold, Inc. (Units)(b) | | 3,900 | | 12,700 | | 16,600 | | 39 | | 129 | | | | 168 | |
Osisko Mining Corp. (b) | | 3,100 | | 9,900 | | 13,000 | | 30 | | 96 | | | | 126 | |
Yamana Gold, Inc. (a) | | 6,700 | | 21,700 | | 28,400 | | 99 | | 320 | | | | 419 | |
| | | | | | | | 1,228 | | 3,972 | | | | 5,200 | |
China (0.0%) | | | | | | | | | | | | | | | |
China Merchants Holdings International Co., Ltd. (e) | | 1 | | 29 | | 30 | | — | | — | @ | | | — | @ |
Skyworth Digital Holdings Ltd. (a)(e) | | 57 | | 114 | | 171 | | — | | — | @ | | | — | @ |
| | | | | | | | — | | — | @ | | | — | @ |
Denmark (1.2%) | | | | | | | | | | | | | | | |
AP Moller - Maersk A/S Series B | | 24 | | 80 | | 104 | | 159 | | 528 | | | | 687 | |
DSV A/S | | 2,395 | | 13,027 | | 15,422 | | 43 | | 233 | | | | 276 | |
Novo Nordisk A/S Series B | | 5,598 | | 21,308 | | 26,906 | | 643 | | 2,449 | | | | 3,092 | |
Novozymes A/S Series B | | 5,165 | | 13,415 | | 18,580 | | 159 | | 415 | | | | 574 | |
TDC A/S | | 2,971 | | 1,320 | | 4,291 | | 24 | | 11 | | | | 35 | |
Vestas Wind Systems A/S (b) | | 2,012 | | 9,396 | | 11,408 | | 22 | | 101 | | | | 123 | |
| | | | | | | | 1,050 | | 3,737 | | | | 4,787 | |
B-11
Security Description | | MS
International
Fund
Shares | | MSIF Active
International
Al location
Shares | | Pro Forma
Shares | | MS
International
Fund
(000) | | MSIF Active
International
Allocation
(000) | | Adjustments | | Pro Forma
Value
(000) | |
Finland (0.8%) | | | | | | | | | | | | | | | |
Elisa Oyj (a) | | 1,196 | | 268 | | 1,464 | | 25 | | 6 | | | | 31 | |
Fortum Oyj | | 7,027 | | 18,201 | | 25,228 | | 150 | | 388 | | | | 538 | |
Kesko Oyj Class B | | 2,234 | | 10,179 | | 12,413 | | 75 | | 342 | | | | 417 | |
Kone Oyj Class B | | 1,414 | | 5,707 | | 7,121 | | 74 | | 296 | | | | 370 | |
Metso Oyj | | 1,494 | | 6,139 | | 7,633 | | 55 | | 228 | | | | 283 | |
Neste Oil Oyj | | 1,510 | | 3,925 | | 5,435 | | 15 | | 40 | | | | 55 | |
Nokia Oyj | | 55,483 | | 72,648 | | 128,131 | | 271 | | 355 | | | | 626 | |
Sampo Oyj Class A | | 3,148 | | 10,536 | | 13,684 | | 78 | | 261 | | | | 339 | |
Stora Enso Oyj Class R | | 6,572 | | 27,433 | | 34,005 | | 39 | | 165 | | | | 204 | |
UPM-Kymmene Oyj | | 5,427 | | 23,485 | | 28,912 | | 60 | | 258 | | | | 318 | |
Wartsila Oyj | | 1,351 | | 5,505 | | 6,856 | | 39 | | 159 | | | | 198 | |
| | | | | | | | 881 | | 2,498 | | | | 3,379 | |
France (4.4%) | | | | | | | | | | | | | | | |
Accor SA | | 1,030 | | 3,759 | | 4,789 | | 26 | | 95 | | | | 121 | |
Air Liquide SA | | 1,314 | | 4,261 | | 5,575 | | 163 | | 527 | | | | 690 | |
Alcatel-Lucent (a)(b) | | 13,164 | | 10,323 | | 23,487 | | 21 | | 16 | | | | 37 | |
Alstom SA | | 3,631 | | 11,339 | | 14,970 | | 110 | | 344 | | | | 454 | |
ArcelorMittal | | 5,195 | | 13,431 | | 18,626 | | 95 | | 246 | | | | 341 | |
AtoS | | 361 | | 497 | | 858 | | 16 | | 22 | | | | 38 | |
AXA SA | | 5,354 | | 19,570 | | 24,924 | | 70 | | 254 | | | | 324 | |
BNP Paribas SA | | 2,751 | | 9,067 | | 11,818 | | 108 | | 356 | | | | 464 | |
Bouygues SA (a) | | 2,794 | | 10,509 | | 13,303 | | 88 | | 331 | | | | 419 | |
Cap Gemini SA | | 1,505 | | 3,035 | | 4,540 | | 47 | | 95 | | | | 142 | |
Carrefour SA | | 3,825 | | 19,578 | | 23,403 | | 87 | | 447 | | | | 534 | |
Casino Guichard Perrachon SA | | 786 | | 2,469 | | 3,255 | | 66 | | 208 | | | | 274 | |
Cie de St-Gobain | | 1,382 | | 4,086 | | 5,468 | | 53 | | 157 | | | | 210 | |
Cie Generale d’Optique Essilor International SA | | 967 | | 5,321 | | 6,288 | | 68 | | 376 | | | | 444 | |
Cie Generale de Geophysique-Veritas (b) | | 3,712 | | 10,908 | | 14,620 | | 87 | | 256 | | | | 343 | |
Cie Generale des Etablissements Michelin Series B | | 497 | | 995 | | 1,492 | | 29 | | 59 | | | | 88 | |
CNP Assurances | | 1,997 | | 3,726 | | 5,723 | | 25 | | 46 | | | | 71 | |
Credit Agricole SA | | 2,976 | | 5,762 | | 8,738 | | 17 | | 32 | | | | 49 | |
Danone | | 4,443 | | 13,703 | | 18,146 | | 279 | | 862 | | | | 1,141 | |
Dassault Systemes SA | | 402 | | 1,201 | | 1,603 | | 32 | | 96 | | | | 128 | |
Edenred | | 1,030 | | 3,759 | | 4,789 | | 25 | | 93 | | | | 118 | |
EDF SA | | 714 | | 109 | | 823 | | 17 | | 3 | | | | 20 | |
Eurazeo | | 226 | | 539 | | 765 | | 8 | | 19 | | | | 27 | |
B-12
Security Description | | MS
International
Fund
Shares | | MSIF Active
International
Al location
Shares | | Pro Forma
Shares | | MS
International
Fund
(000) | | MSIF Active
International
Allocation
(000) | | Adjustments | | Pro Forma
Value
(000) | |
European Aeronautic Defence and Space Co. N.V. | | 983 | | 2,580 | | 3,563 | | 31 | | 80 | | | | 111 | |
Fonciere Des Regions REIT | | 244 | | 487 | | 731 | | 16 | | 31 | | | | 47 | |
France Telecom SA | | 8,331 | | 29,891 | | 38,222 | | 131 | | 469 | | | | 600 | |
GDF Suez | | 5,571 | | 6,735 | | 12,306 | | 152 | | 184 | | | | 336 | |
Gecina SA REIT | | 196 | | 392 | | 588 | | 17 | | 33 | | | | 50 | |
Hermes International (a) | | 91 | | 307 | | 398 | | 27 | | 92 | | | | 119 | |
ICADE REIT(a) | | 200 | | 411 | | 611 | | 16 | | 32 | | | | 48 | |
Imerys SA | | 340 | | 465 | | 805 | | 16 | | 21 | | | | 37 | |
Klepierre REIT | | 708 | | 1,814 | | 2,522 | | 20 | | 52 | | | | 72 | |
L’Oreal SA | | 242 | | 1,106 | | 1,348 | | 25 | | 116 | | | | 141 | |
Lafarge SA (a) | | 2,700 | | 7,873 | | 10,573 | | 95 | | 277 | | | | 372 | |
Lagardere SCA | | 1,112 | | 3,184 | | 4,296 | | 29 | | 84 | | | | 113 | |
Legrand SA | | 186 | | 424 | | 610 | | 6 | | 14 | | | | 20 | |
LVMH Moet Hennessy Louis Vuitton SA | | 316 | | 1,187 | | 1,503 | | 45 | | 168 | | | | 213 | |
Neopost SA (a) | | 281 | | 251 | | 532 | | 19 | | 17 | | | | 36 | |
Pernod-Ricard SA | | 567 | | 671 | | 1,238 | | 53 | | 62 | | | | 115 | |
Peugeot SA | | 699 | | 1,160 | | 1,859 | | 11 | | 18 | | | | 29 | |
PPR | | 546 | | 907 | | 1,453 | | 78 | | 130 | | | | 208 | |
Publicis Groupe SA | | 642 | | 1,545 | | 2,187 | | 30 | | 71 | | | | 101 | |
Renault SA | | 479 | | 1,136 | | 1,615 | | 17 | | 39 | | | | 56 | |
Safran SA | | 734 | | 1,108 | | 1,842 | | 22 | | 33 | | | | 55 | |
Sanofi | | 7,030 | | 21,970 | | 29,000 | | 516 | | 1,614 | | | | 2,130 | |
Schneider Electric SA | | 3,035 | | 8,728 | | 11,763 | | 160 | | 459 | | | | 619 | |
SCOR SE | | 971 | | 2,725 | | 3,696 | | 23 | | 63 | | | | 86 | |
Societe BIC SA | | 218 | | 586 | | 804 | | 19 | | 52 | | | | 71 | |
Societe Generale SA | | 1,534 | | 5,183 | | 6,717 | | 34 | | 116 | | | | 150 | |
Societe Television Francaise 1 | | 3,568 | | 3,828 | | 7,396 | | 35 | | 37 | | | | 72 | |
Sodexo | | 564 | | 1,806 | | 2,370 | | 40 | | 130 | | | | 170 | |
STMicroelectronics N.V. | | 4,447 | | 13,202 | | 17,649 | | 26 | | 79 | | | | 105 | |
Suez Environnement Co. | | 1,441 | | 817 | | 2,258 | | 17 | | 9 | | | | 26 | |
Technip SA | | 1,559 | | 4,733 | | 6,292 | | 146 | | 445 | | | | 591 | |
Thales SA (a) | | 566 | | 1,159 | | 1,725 | | 18 | | 37 | | | | 55 | |
Total SA | | 13,746 | | 45,255 | | 59,001 | | 703 | | 2,313 | | | | 3,016 | |
Unibail-Rodamco SE REIT | | 815 | | 1,726 | | 2,541 | | 147 | | 310 | | | | 457 | |
Vallourec SA | | 361 | | 1,220 | | 1,581 | | 23 | | 80 | | | | 103 | |
Veolia Environnement SA | | 2,175 | | 6,388 | | 8,563 | | 24 | | 70 | | | | 94 | |
B-13
Security Description | | MS
International
Fund
Shares | | MSIF Active
International
Al location
Shares | | Pro Forma
Shares | | MS
International
Fund
(000) | | MSIF Active
International
Allocation
(000) | | Adjustments | | Pro Forma
Value
(000) | |
Vinci SA | | 2,109 | | 7,207 | | 9,316 | | 92 | | 315 | | | | 407 | |
Vivendi SA | | 5,803 | | 16,686 | | 22,489 | | 127 | | 365 | | | | 492 | |
| | | | | | | | 4,543 | | 13,457 | | | | 18,000 | |
Germany (6.2%) | | | | | | | | | | | | | | | |
Adidas AG | | 377 | | 1,929 | | 2,306 | | 25 | | 125 | | | | 150 | |
Allianz SE (Registered) | | 2,792 | | 9,957 | | 12,749 | | 267 | | 953 | | | | 1,220 | |
Axel Springer AG (a) | | 600 | | 200 | | 800 | | 26 | | 8 | | | | 34 | |
BASF SE | | 4,721 | | 25,309 | | 30,030 | | 329 | | 1,766 | | | | 2,095 | |
Bayer AG (Registered) | | 8,281 | | 26,024 | | 34,305 | | 529 | | 1,664 | | | | 2,193 | |
Bayerische Motoren Werke AG | | 2,079 | | 276 | | 2,355 | | 139 | | 19 | | | | 158 | |
Beiersdorf AG | | 439 | | 2,162 | | 2,601 | | 25 | | 123 | | | | 148 | |
Celesio AG | | 2,316 | | 3,968 | | 6,284 | | 37 | | 63 | | | | 100 | |
Commerzbank AG (a)(b) | | 3,658 | | 10,234 | | 13,892 | | 6 | | 17 | | | | 23 | |
Continental AG (b) | | 205 | | 731 | | 936 | | 13 | | 45 | | | | 58 | |
Daimler AG (Registered) | | 3,739 | | 18,430 | | 22,169 | | 164 | | 809 | | | | 973 | |
Deutsche Bank AG (Registered) | | 4,803 | | 16,744 | | 21,547 | | 183 | | 638 | | | | 821 | |
Deutsche Boerse AG (b) | | 334 | | 1,776 | | 2,110 | | 18 | | 93 | | | | 111 | |
Deutsche Lufthansa AG (Registered) | | 1,432 | | 9,297 | | 10,729 | | 17 | | 111 | | | | 128 | |
Deutsche Post AG (Registered) | | 5,779 | | 31,565 | | 37,344 | | 89 | | 485 | | | | 574 | |
Deutsche Telekom AG (Registered) | | 15,622 | | 110,382 | | 126,004 | | 179 | | 1,267 | | | | 1,446 | |
E.ON AG | | 10,627 | | 74,947 | | 85,574 | | 229 | | 1,617 | | | | 1,846 | |
Fresenius Medical Care AG & Co. KGaA | | 1,900 | | 9,132 | | 11,032 | | 129 | | 621 | | | | 750 | |
GEA Group AG | | 1,427 | | 4,471 | | 5,898 | | 40 | | 127 | | | | 167 | |
Hannover Rueckversicherung AG | | — | | 194 | | 194 | | — | | 10 | | | | 10 | |
Henkel AG & Co. KGaA (Preference) | | 513 | | 3,203 | | 3,716 | | 30 | | 184 | | | | 214 | |
Hochtief AG | | 673 | | 2,409 | | 3,082 | | 39 | | 139 | | | | 178 | |
K&S AG (Registered) | | 1,254 | | 2,249 | | 3,503 | | 57 | | 101 | | | | 158 | |
Lanxess AG | | 597 | | 1,805 | | 2,402 | | 31 | | 93 | | | | 124 | |
Linde AG | | 503 | | 3,164 | | 3,667 | | 75 | | 471 | | | | 546 | |
MAN SE | | 103 | | 236 | | 339 | | 9 | | 21 | | | | 30 | |
Merck KGaA | | 253 | | 1,765 | | 2,018 | | 25 | | 176 | | | | 201 | |
Metro AG | | 2,199 | | 12,088 | | 14,287 | | 80 | | 441 | | | | 521 | |
Muenchener Rueckversicherungs AG (Registered) | | 1,154 | | 4,325 | | 5,479 | | 142 | | 530 | | | | 672 | |
Porsche Automobil Holding SE (Preference) | | 642 | | 2,748 | | 3,390 | | 34 | | 147 | | | | 181 | |
ProSiebenSat.1 Media AG | | 1,158 | | 355 | | 1,513 | | 21 | | 7 | | | | 28 | |
Puma SE (a) | | 25 | | 90 | | 115 | | 7 | | 26 | | | | 33 | |
RWE AG | | 1,713 | | 11,421 | | 13,134 | | 60 | | 402 | | | | 462 | |
RWE AG (Preference) | | 186 | | 877 | | 1,063 | | 6 | | 29 | | | | 35 | |
B-14
Security Description | | MS
International
Fund
Shares | | MSIF Active
International
Al location
Shares | | Pro Forma
Shares | | MS
International
Fund
(000) | | MSIF Active
International
Allocation
(000) | | Adjustments | | Pro Forma
Value
(000) | |
SAP AG | | 10,594 | | 40,422 | | 51,016 | | 560 | | 2,137 | | | | 2,697 | |
Siemens AG (Registered) | | 12,213 | | 40,781 | | 52,994 | | 1,169 | | 3,902 | | | | 5,071 | |
ThyssenKrupp AG | | 2,014 | | 7,875 | | 9,889 | | 46 | | 181 | | | | 227 | |
Volkswagen AG | | 478 | | 2,553 | | 3,031 | | 64 | | 343 | | | | 407 | |
Volkswagen AG (Preference) | | 484 | | 2,295 | | 2,779 | | 73 | | 343 | | | | 416 | |
| | | | | | | | 4,972 | | 20,234 | | | | 25,206 | |
Hong Kong (0.0%) | | | | | | | | | | | | | | | |
Henderson Land Development Co., Ltd. (a) | | 45 | | 164 | | 209 | | — | @ | 1 | | | | 1 | |
Hong Kong Exchanges and Clearing Ltd. (a) | | 56 | | 187 | | 243 | | 1 | | 3 | | | | 4 | |
| | | | | | | | 1 | | 4 | | | | 5 | |
India(0.0%) | | | | | | | | | | | | | | | |
Cairn Energy PLC (b) | | 971 | | — | | 971 | | 4 | | — | | | | 4 | |
Indonesia (0.3%) | | | | | | | | | | | | | | | |
Adaro Energy Tbk PT | | 30,200 | | 98,000 | | 128,200 | | 6 | | 19 | | | | 25 | |
Astra International Tbk PT | | 5,500 | | 18,500 | | 24,000 | | 45 | | 151 | | | | 196 | |
Bank Central Asia Tbk PT | | 34,500 | | 112,500 | | 147,000 | | 31 | | 99 | | | | 130 | |
Bank Danamon Indonesia Tbk PT | | 8,500 | | 28,500 | | 37,000 | | 4 | | 13 | | | | 17 | |
Bank Mandiri Tbk PT | | 26,500 | | 86,000 | | 112,500 | | 20 | | 64 | | | | 84 | |
Bank Negara Indonesia Persero Tbk PT | | 22,500 | | 73,500 | | 96,000 | | 9 | | 31 | | | | 40 | |
Bank Rakyat Indonesia Persero Tbk PT | | 32,000 | | 103,500 | | 135,500 | | 24 | | 77 | | | | 101 | |
Bumi Resources Tbk PT | | 52,500 | | 170,000 | | 222,500 | | 12 | | 41 | | | | 53 | |
Charoen Pokphand Indonesia Tbk PT | | 24,500 | | 79,000 | | 103,500 | | 6 | | 19 | | | | 25 | |
Golden Agri-Resources Ltd. | | — | | 184,315 | | 184,315 | | — | | 102 | | | | 102 | |
Gudang Garam Tbk PT | | 2,000 | | 5,500 | | 7,500 | | 13 | | 38 | | | | 51 | |
Indo Tambangraya Megah PT | | 1,300 | | 4,100 | | 5,400 | | 5 | | 18 | | | | 23 | |
Indocement Tunggal Prakarsa Tbk PT | | 4,000 | | 13,500 | | 17,500 | | 8 | | 25 | | | | 33 | |
Indofood Sukses Makmur Tbk PT | | 13,500 | | 42,500 | | 56,000 | | 7 | | 21 | | | | 28 | |
Kalbe Farma Tbk PT | | 15,000 | | 48,500 | | 63,500 | | 6 | | 18 | | | | 24 | |
Perusahaan Gas Negara PT | | 31,000 | | 100,500 | | 131,500 | | 11 | | 35 | | | | 46 | |
Semen Gresik Persero Tbk PT | | 10,500 | | 33,500 | | 44,000 | | 13 | | 43 | | | | 56 | |
Tambang Batubara Bukit Asam Tbk PT | | 2,500 | | 8,000 | | 10,500 | | 5 | | 15 | | | | 20 | |
Telekomunikasi Indonesia Tbk PT | | 28,000 | | 90,500 | | 118,500 | | 22 | | 70 | | | | 92 | |
Unilever Indonesia Tbk PT | | 4,000 | | 13,000 | | 17,000 | | 8 | | 27 | | | | 35 | |
United Tractors Tbk PT | | 4,833 | | 15,984 | | 20,817 | | 14 | | 46 | | | | 60 | |
| | | | | | | | 269 | | 972 | | | | 1,241 | |
B-15
Security Description | | MS
International
Fund
Shares | | MSIF Active
International
Al location
Shares | | Pro Forma
Shares | | MS
International
Fund
(000) | | MSIF Active
International
Allocation
(000) | | Adjustments | | Pro Forma
Value
(000) | |
Ireland (0.0%) | | | | | | | | | | | | | | | |
CRH PLC | | 508 | | 1,158 | | 1,666 | | 10 | | 23 | | | | 33 | |
Italy (0.2%) | | | | | | | | | | | | | | | |
Enel SpA | | 6,585 | | 15,011 | | 21,596 | | 27 | | 61 | | | | 88 | |
Eni SpA | | 4,024 | | 6,448 | | 10,472 | | 84 | | 133 | | | | 217 | |
Exor SpA | | 1,557 | | 3,550 | | 5,107 | | 31 | | 72 | | | | 103 | |
Saipem SpA | | 2,923 | | 9,857 | | 12,780 | | 124 | | 419 | | | | 543 | |
| | | | | | | | 266 | | 685 | | | | 951 | |
Japan (23.8%) | | | | | | | | | | | | | | | |
Advantest Corp. | | 2,450 | | 8,290 | | 10,740 | | 23 | | 79 | | | | 102 | |
Aeon Credit Service Co., Ltd. (a) | | — | | 2,300 | | 2,300 | | — | | 36 | | | | 36 | |
Aeon Mall Co., Ltd. | | 4,800 | | 14,900 | | 19,700 | | 102 | | 316 | | | | 418 | |
Aisin Seiki Co., Ltd. | | 3,200 | | 10,300 | | 13,500 | | 91 | | 294 | | | | 385 | |
Amada Co., Ltd. | | 3,553 | | 9,000 | | 12,553 | | 23 | | 57 | | | | 80 | |
Asahi Glass Co., Ltd. (a) | | 10,500 | | 37,800 | | 48,300 | | 88 | | 317 | | | | 405 | |
Asahi Group Holdings Ltd. (a) | | 5,300 | | 17,200 | | 22,500 | | 116 | | 378 | | | | 494 | |
Asahi Kasei Corp. | | 15,000 | | 50,000 | | 65,000 | | 90 | | 302 | | | | 392 | |
Astellas Pharma, Inc. | | 5,300 | | 19,100 | | 24,400 | | 216 | | 776 | | | | 992 | |
Bank of Kyoto Ltd. (The) (a) | | 3,000 | | 7,000 | | 10,000 | | 26 | | 60 | | | | 86 | |
Bank of Yokohama Ltd. (The) | | 14,000 | | 46,000 | | 60,000 | | 66 | | 218 | | | | 284 | |
Benesse Holdings, Inc. | | 854 | | 2,400 | | 3,254 | | 41 | | 116 | | | | 157 | |
Bridgestone Corp. (a) | | 16,200 | | 56,700 | | 72,900 | | 367 | | 1,286 | | | | 1,653 | |
Canon, Inc. (a) | | 8,704 | | 35,100 | | 43,804 | | 386 | | 1,555 | | | | 1,941 | |
Casio Computer Co., Ltd. (a) | | 5,050 | | 14,600 | | 19,650 | | 31 | | 88 | | | | 119 | |
Central Japan Railway Co. | | 13 | | 55 | | 68 | | 110 | | 464 | | | | 574 | |
Chiba Bank Ltd. (The) (a) | | 7,000 | | 18,000 | | 25,000 | | 45 | | 116 | | | | 161 | |
Chubu Electric Power Co., Inc. | | 2,500 | | 10,300 | | 12,800 | | 47 | | 192 | | | | 239 | |
Chugai Pharmaceutical Co., Ltd. (a) | | 2,600 | | 9,500 | | 12,100 | | 43 | | 156 | | | | 199 | |
Citizen Holdings Co., Ltd. | | 5,150 | | 16,800 | | 21,950 | | 30 | | 97 | | | | 127 | |
Credit Saison Co., Ltd. | | 1,600 | | 3,100 | | 4,700 | | 32 | | 62 | | | | 94 | |
Dai Nippon Printing Co., Ltd. (a) | | 5,500 | | 16,600 | | 22,100 | | 53 | | 159 | | | | 212 | |
Daicel Corp | | 3,000 | | 8,000 | | 11,000 | | 18 | | 49 | | | | 67 | |
Daiichi Sankyo Co., Ltd. | | 14,900 | | 51,100 | | 66,000 | | 295 | | 1,014 | | | | 1,309 | |
Daikin Industries Ltd. | | 4,000 | | 13,300 | | 17,300 | | 110 | | 364 | | | | 474 | |
Daito Trust Construction Co., Ltd. | | 1,256 | | 4,200 | | 5,456 | | 108 | | 360 | | | | 468 | |
Daiwa House Industry Co., Ltd. | | 7,000 | | 26,600 | | 33,600 | | 83 | | 318 | | | | 401 | |
Daiwa Securities Group, Inc. | | 28,000 | | 61,000 | | 89,000 | | 87 | | 191 | | | | 278 | |
Denki Kagaku Kogyo KK | | 8,546 | | 21,000 | | 29,546 | | 32 | | 77 | | | | 109 | |
Denso Corp. | | 13,900 | | 47,850 | | 61,750 | | 384 | | 1,322 | | | | 1,706 | |
B-16
Security Description | | MS
International
Fund
Shares | | MSIF Active
International
Al location
Shares | | Pro Forma
Shares | | MS
International
Fund
(000) | | MSIF Active
International
Allocation
(000) | | Adjustments | | Pro Forma
Value
(000) | |
East Japan Railway Co. | | 3,400 | | 13,700 | | 17,100 | | 216 | | 873 | | | | 1,089 | |
Eisai Co., Ltd. (a) | | 2,500 | | 9,100 | | 11,600 | | 103 | | 377 | | | | 480 | |
FamilyMart Co., Ltd. | | 2,399 | | 7,096 | | 9,495 | | 97 | | 287 | | | | 384 | |
Fanuc Corp. | | 2,950 | | 10,100 | | 13,050 | | 451 | | 1,546 | | | | 1,997 | |
Fast Retailing Co., Ltd. | | 1,700 | | 6,400 | | 8,100 | | 309 | | 1,164 | | | | 1,473 | |
Fuji Electric Co., Ltd. (a) | | — | | 8,000 | | 8,000 | | — | | 22 | | | | 22 | |
FUJIFILM Holdings Corp. | | 10,400 | | 38,100 | | 48,500 | | 246 | | 903 | | | | 1,149 | |
Fujitsu Ltd. | | 43,000 | | 147,200 | | 190,200 | | 223 | | 765 | | | | 988 | |
Fukuoka Financial Group, Inc. | | 8,000 | | 26,000 | | 34,000 | | 34 | | 109 | | | | 143 | |
Furukawa Electric Co., Ltd. | | 7,500 | | 18,800 | | 26,300 | | 17 | | 43 | | | | 60 | |
GS Yuasa Corp. (a) | | 10,000 | | 28,000 | | 38,000 | | 54 | | 150 | | | | 204 | |
Hirose Electric Co., Ltd. (a) | | 500 | | 1,200 | | 1,700 | | 44 | | 105 | | | | 149 | |
Hisamitsu Pharmaceutical Co., Inc. (a) | | 700 | | 2,600 | | 3,300 | | 30 | | 110 | | | | 140 | |
Hitachi Construction Machinery Co., Ltd. (a) | | 4,700 | | 13,600 | | 18,300 | | 79 | | 229 | | | | 308 | |
Hitachi Ltd. | | 38,000 | | 142,000 | | 180,000 | | 200 | | 745 | | | | 945 | |
Hokkaido Electric Power Co., Inc. | | — | | 2,200 | | 2,200 | | — | | 31 | | | | 31 | |
Hokuhoku Financial Group, Inc. | | 17,000 | | 48,000 | | 65,000 | | 33 | | 94 | | | | 127 | |
Honda Motor Co., Ltd. (a) | | 21,509 | | 76,104 | | 97,613 | | 656 | | 2,322 | | | | 2,978 | |
Hoya Corp. | | 4,800 | | 17,500 | | 22,300 | | 103 | | 377 | | | | 480 | |
Ibiden Co., Ltd. | | 3,500 | | 11,500 | | 15,000 | | 70 | | 227 | | | | 297 | |
IHI Corp. (a) | | 12,530 | | 36,000 | | 48,530 | | 31 | | 87 | | | | 118 | |
Inpex Corp. | | 29 | | 95 | | 124 | | 182 | | 599 | | | | 781 | |
ITOCHU Corp. | | 19,251 | | 67,500 | | 86,751 | | 195 | | 686 | | | | 881 | |
Itochu Techno-Solutions Corp. (a) | | 700 | | 1,800 | | 2,500 | | 31 | | 81 | | | | 112 | |
Japan Real Estate Investment Corp. REIT | | 7 | | 26 | | 33 | | 54 | | 203 | | | | 257 | |
Japan Retail Fund Investment Corp. REIT | | 24 | | 81 | | 105 | | 36 | | 120 | | | | 156 | |
Japan Tobacco, Inc. | | 51 | | 171 | | 222 | | 240 | | 804 | | | | 1,044 | |
JFE Holdings, Inc. | | 6,800 | | 24,300 | | 31,100 | | 123 | | 440 | | | | 563 | |
JGC Corp. | | 10,546 | | 28,000 | | 38,546 | | 253 | | 672 | | | | 925 | |
Joyo Bank Ltd. (The) (a) | | 8,000 | | 35,000 | | 43,000 | | 35 | | 155 | | | | 190 | |
JS Group Corp. | | 2,262 | | 7,500 | | 9,762 | | 43 | | 144 | | | | 187 | |
JSR Corp. | | 2,408 | | 6,200 | | 8,608 | | 45 | | 114 | | | | 159 | |
JX Holdings, Inc. | | 24,400 | | 90,546 | | 114,946 | | 147 | | 547 | | | | 694 | |
Kajima Corp. (a) | | 12,000 | | 39,400 | | 51,400 | | 37 | | 121 | | | | 158 | |
Kaneka Corp. (a) | | 5,000 | | 10,000 | | 15,000 | | 27 | | 53 | | | | 80 | |
Kansai Electric Power Co., Inc. (The) | | 3,800 | | 14,700 | | 18,500 | | 58 | | 226 | | | | 284 | |
Kawasaki Heavy Industries Ltd. (a) | | 11,500 | | 34,000 | | 45,500 | | 28 | | 85 | | | | 113 | |
Kawasaki Kisen Kaisha Ltd. (a) | | 43,000 | | 143,000 | | 186,000 | | 78 | | 258 | | | | 336 | |
Keikyu Corp. (a) | | 6,000 | | 15,000 | | 21,000 | | 54 | | 135 | | | | 189 | |
B-17
Security Description | | MS
International
Fund
Shares | | MSIF Active
International
Al location
Shares | | Pro Forma
Shares | | MS
International
Fund
(000) | | MSIF Active
International
Allocation
(000) | | Adjustments | | Pro Forma
Value
(000) | |
Keio Corp. (a) | | 3,000 | | 9,000 | | 12,000 | | 21 | | 64 | | | | 85 | |
Keyence Corp. | | 1,147 | | 3,430 | | 4,577 | | 277 | | 827 | | | | 1,104 | |
Kintetsu Corp. (a) | | 15,550 | | 64,200 | | 79,750 | | 61 | | 251 | | | | 312 | |
Kirin Holdings Co., Ltd. (a) | | 10,000 | | 34,000 | | 44,000 | | 122 | | 413 | | | | 535 | |
Kobe Steel Ltd. | | 25,000 | | 80,000 | | 105,000 | | 38 | | 124 | | | | 162 | |
Komatsu Ltd. | | 15,700 | | 55,500 | | 71,200 | | 367 | | 1,297 | | | | 1,664 | |
Konami Corp. (a) | | 1,700 | | 4,800 | | 6,500 | | 51 | | 144 | | | | 195 | |
Konica Minolta Holdings, Inc. | | 7,030 | | 19,500 | | 26,530 | | 53 | | 145 | | | | 198 | |
Kubota Corp. (a) | | 24,000 | | 77,000 | | 101,000 | | 201 | | 645 | | | | 846 | |
Kuraray Co., Ltd. | | 4,556 | | 14,000 | | 18,556 | | 65 | | 199 | | | | 264 | |
Kurita Water Industries Ltd. (a) | | 1,100 | | 2,200 | | 3,300 | | 29 | | 57 | | | | 86 | |
Kyocera Corp. | | 3,800 | | 12,700 | | 16,500 | | 306 | | 1,021 | | | | 1,327 | |
Kyushu Electric Power Co., Inc. | | 1,600 | | 6,400 | | 8,000 | | 23 | | 92 | | | | 115 | |
Mabuchi Motor Co., Ltd. (a) | | 1,900 | | 5,100 | | 7,000 | | 79 | | 212 | | | | 291 | |
Makita Corp. | | 1,300 | | 4,000 | | 5,300 | | 42 | | 130 | | | | 172 | |
Marubeni Corp. | | 17,550 | | 63,000 | | 80,550 | | 107 | | 384 | | | | 491 | |
Mitsubishi Chemical Holdings Corp. (a) | | 19,500 | | 54,000 | | 73,500 | | 107 | | 298 | | | | 405 | |
Mitsubishi Corp. | | 18,100 | | 66,900 | | 85,000 | | 366 | | 1,351 | | | | 1,717 | |
Mitsubishi Electric Corp. | | 33,552 | | 115,800 | | 149,352 | | 322 | | 1,110 | | | | 1,432 | |
Mitsubishi Estate Co., Ltd. | | 17,000 | | 60,000 | | 77,000 | | 254 | | 896 | | | | 1,150 | |
Mitsubishi Heavy Industries Ltd. | | 28,550 | | 109,000 | | 137,550 | | 122 | | 464 | | | | 586 | |
Mitsubishi Logistics Corp. | | 2,000 | | 4,000 | | 6,000 | | 22 | | 45 | | | | 67 | |
Mitsubishi Materials Corp. | | 21,000 | | 77,000 | | 98,000 | | 57 | | 209 | | | | 266 | |
Mitsubishi Tanabe Pharma Corp. | | 2,700 | | 9,900 | | 12,600 | | 43 | | 156 | | | | 199 | |
Mitsubishi UFJ Financial Group, Inc. (i) | | 73,260 | | 239,546 | | 312,806 | | 311 | | 1,018 | | | | 1,329 | |
Mitsui & Co., Ltd. | | 13,700 | | 54,500 | | 68,200 | | 213 | | 848 | | | | 1,061 | |
Mitsui Chemicals, Inc. (a) | | 9,500 | | 21,000 | | 30,500 | | 29 | | 64 | | | | 93 | |
Mitsui Fudosan Co., Ltd. | | 12,500 | | 42,400 | | 54,900 | | 182 | | 618 | | | | 800 | |
Mitsui OSK Lines Ltd. | | 16,000 | | 55,000 | | 71,000 | | 62 | | 213 | | | | 275 | |
Mizuho Financial Group, Inc. | | 178,600 | | 579,900 | | 758,500 | | 241 | | 784 | | | | 1,025 | |
MS&AD Insurance Group Holdings | | 4,200 | | 12,160 | | 16,360 | | 78 | | 225 | | | | 303 | |
Murata Manufacturing Co., Ltd. (a) | | 2,200 | | 8,500 | | 10,700 | | 113 | | 437 | | | | 550 | |
Nabtesco Corp. (a) | | 2,500 | | 7,500 | | 10,000 | | 45 | | 137 | | | | 182 | |
NEC Corp. (b) | | 29,500 | | 100,400 | | 129,900 | | 60 | | 203 | | | | 263 | |
NGK Insulators Ltd. | | 7,060 | | 22,600 | | 29,660 | | 84 | | 268 | | | | 352 | |
NGK Spark Plug Co., Ltd. | | 2,059 | | 8,000 | | 10,059 | | 26 | | 99 | | | | 125 | |
Nidec Corp. | | 904 | | 3,400 | | 4,304 | | 78 | | 296 | | | | 374 | |
Nikon Corp. | | 3,400 | | 11,600 | | 15,000 | | 76 | | 258 | | | | 334 | |
Nintendo Co., Ltd. | | 1,508 | | 5,200 | | 6,708 | | 208 | | 716 | | | | 924 | |
B-18
Security Description | | MS
International
Fund
Shares | | MSIF Active
International
Al location
Shares | | Pro Forma
Shares | | MS
International
Fund
(000) | | MSIF Active
International
Allocation
(000) | | Adjustments | | Pro Forma
Value
(000) | |
Nippon Building Fund, Inc. REIT | | 8 | | 29 | | 37 | | 66 | | 237 | | | | 303 | |
Nippon Electric Glass Co., Ltd. | | 9,500 | | 31,500 | | 41,000 | | 94 | | 312 | | | | 406 | |
Nippon Express Co., Ltd. | | 11,500 | | 33,800 | | 45,300 | | 45 | | 132 | | | | 177 | |
Nippon Paper Group, Inc. (a) | | 1,400 | | 3,700 | | 5,100 | | 30 | | 81 | | | | 111 | |
Nippon Sheet Glass Co., Ltd. | | 6,500 | | 16,000 | | 22,500 | | 12 | | 30 | | | | 42 | |
Nippon Steel Corp. (a) | | 95,108 | | 355,000 | | 450,108 | | 237 | | 886 | | | | 1,123 | |
Nippon Telegraph & Telephone Corp. | | 1,900 | | 10,600 | | 12,500 | | 97 | | 542 | | | | 639 | |
Nippon Yusen KK (a) | | 13,015 | | 43,000 | | 56,015 | | 33 | | 110 | | | | 143 | |
Nishi-Nippon City Bank Ltd. (The) | | 9,000 | | 18,000 | | 27,000 | | 26 | | 52 | | | | 78 | |
Nissan Motor Co., Ltd. (a) | | 29,705 | | 103,600 | | 133,305 | | 267 | | 931 | | | | 1,198 | |
Nitto Denko Corp. (a) | | 2,400 | | 8,300 | | 10,700 | | 86 | | 297 | | | | 383 | |
NKSJ Holdings, Inc. | | 2,200 | | 7,700 | | 9,900 | | 43 | | 151 | | | | 194 | |
Nomura Holdings, Inc. | | 19,050 | | 86,400 | | 105,450 | | 58 | | 261 | | | | 319 | |
Nomura Research Institute Ltd. | | 2,250 | | 5,900 | | 8,150 | | 51 | | 133 | | | | 184 | |
NSK Ltd. | | 5,553 | | 22,000 | | 27,553 | | 36 | | 143 | | | | 179 | |
NTN Corp. | | 6,051 | | 16,000 | | 22,051 | | 24 | | 65 | | | | 89 | |
NTT Data Corp. | | 18 | | 64 | | 82 | | 58 | | 204 | | | | 262 | |
NTT DoCoMo, Inc. | | 30 | | 144 | | 174 | | 55 | | 265 | | | | 320 | |
Obayashi Corp. | | 9,571 | | 26,000 | | 35,571 | | 43 | | 115 | | | | 158 | |
OJI Paper Co., Ltd. (a) | | 35,000 | | 102,400 | | 137,400 | | 180 | | 525 | | | | 705 | |
Omron Corp. (a) | | 6,104 | | 19,000 | | 25,104 | | 123 | | 382 | | | | 505 | |
Ono Pharmaceutical Co., Ltd. | | 900 | | 3,300 | | 4,200 | | 51 | | 185 | | | | 236 | |
Oracle Corp. Japan | | 750 | | 1,900 | | 2,650 | | 25 | | 63 | | | | 88 | |
Oriental Land Co., Ltd. (a) | | 650 | | 2,500 | | 3,150 | | 69 | | 264 | | | | 333 | |
ORIX Corp. (a) | | 290 | | 470 | | 760 | | 24 | | 39 | | | | 63 | |
Osaka Gas Co., Ltd. | | 8,000 | | 38,600 | | 46,600 | | 32 | | 152 | | | | 184 | |
Otsuka Holdings Co. Ltd. | | 2,800 | | 10,000 | | 12,800 | | 79 | | 281 | | | | 360 | |
Panasonic Corp. (a) | | 33,000 | | 118,800 | | 151,800 | | 280 | | 1,010 | | | | 1,290 | |
Resona Holdings, Inc. | | 3,900 | | 12,400 | | 16,300 | | 17 | | 55 | | | | 72 | |
Rohm Co., Ltd. | | 1,605 | | 6,000 | | 7,605 | | 75 | | 280 | | | | 355 | |
Santen Pharmaceutical Co. Ltd. | | 900 | | 3,200 | | 4,100 | | 37 | | 132 | | | | 169 | |
SBI Holdings, Inc. | | 186 | | 383 | | 569 | | 14 | | 28 | | | | 42 | |
Secom Co., Ltd. | | 2,485 | | 6,400 | | 8,885 | | 115 | | 295 | | | | 410 | |
Seiko Epson Corp. (a) | | 6,600 | | 19,400 | | 26,000 | | 88 | | 258 | | | | 346 | |
Sekisui Chemical Co., Ltd. | | 7,072 | | 18,000 | | 25,072 | | 58 | | 149 | | | | 207 | |
Sekisui House Ltd. | | 11,046 | | 38,600 | | 49,646 | | 98 | | 343 | | | | 441 | |
Seven & I Holdings Co., Ltd. | | 6,500 | | 21,500 | | 28,000 | | 181 | | 599 | | | | 780 | |
Sharp Corp. (a) | | 7,500 | | 31,200 | | 38,700 | | 65 | | 273 | | | | 338 | |
Shimamura Co., Ltd. | | 300 | | 900 | | 1,200 | | 31 | | 92 | | | | 123 | |
B-19
Security Description | | MS
International
Fund
Shares | | MSIF Active
International
Al location
Shares | | Pro Forma
Shares | | MS
International
Fund
(000) | | MSIF Active
International
Allocation
(000) | | Adjustments | | Pro Forma
Value
(000) | |
Shimano, Inc. (a) | | 2,550 | | 7,800 | | 10,350 | | 124 | | 379 | | | | 503 | |
Shimizu Corp. (a) | | 9,000 | | 27,600 | | 36,600 | | 38 | | 116 | | | | 154 | |
Shin-Etsu Chemical Co., Ltd. | | 6,997 | | 25,496 | | 32,493 | | 345 | | 1,255 | | | | 1,600 | |
Shinsei Bank Ltd. | | 17,500 | | 43,000 | | 60,500 | | 18 | | 45 | | | | 63 | |
Shionogi & Co., Ltd. | | 3,400 | | 12,300 | | 15,700 | | 44 | | 158 | | | | 202 | |
Shiseido Co., Ltd. (a) | | 4,700 | | 15,600 | | 20,300 | | 86 | | 287 | | | | 373 | |
Shizuoka Bank Ltd. (The) (a) | | 7,000 | | 16,000 | | 23,000 | | 74 | | 168 | | | | 242 | |
Showa Denko KK (a) | | 12,000 | | 31,000 | | 43,000 | | 24 | | 63 | | | | 87 | |
Showa Shell Sekiyu KK (a) | | 3,400 | | 7,500 | | 10,900 | | 23 | | 50 | | | | 73 | |
SMC Corp. | | 1,105 | | 3,800 | | 4,905 | | 178 | | 613 | | | | 791 | |
Softbank Corp. | | 13,700 | | 51,800 | | 65,500 | | 403 | | 1,526 | | | | 1,929 | |
Sony Corp. | | 10,996 | | 40,497 | | 51,493 | | 198 | | 727 | | | | 925 | |
Stanley Electric Co., Ltd. | | 6,200 | | 17,900 | | 24,100 | | 91 | | 263 | | | | 354 | |
Sumitomo Chemical Co., Ltd. (a) | | 16,000 | | 55,600 | | 71,600 | | 58 | | 203 | | | | 261 | |
Sumitomo Corp. | | 8,300 | | 32,700 | | 41,000 | | 112 | | 443 | | | | 555 | |
Sumitomo Electric Industries Ltd. | | 5,600 | | 20,500 | | 26,100 | | 61 | | 223 | | | | 284 | |
Sumitomo Heavy Industries Ltd. | | 5,000 | | 16,000 | | 21,000 | | 29 | | 94 | | | | 123 | |
Sumitomo Metal Industries Ltd. | | 83,000 | | 284,000 | | 367,000 | | 151 | | 517 | | | | 668 | |
Sumitomo Metal Mining Co., Ltd. | | 17,500 | | 62,800 | | 80,300 | | 225 | | 807 | | | | 1,032 | |
Sumitomo Mitsui Financial Group, Inc. | | 10,100 | | 27,100 | | 37,200 | | 281 | | 755 | | | | 1,036 | |
Sumitomo Mitsui Trust Holdings, Inc. | | 55,623 | | 148,544 | | 204,167 | | 163 | | 436 | | | | 599 | |
Sumitomo Realty & Development Co., Ltd. | | 6,500 | | 18,000 | | 24,500 | | 114 | | 315 | | | | 429 | |
Suzuki Motor Corp. | | 5,400 | | 17,500 | | 22,900 | | 112 | | 362 | | | | 474 | |
Suruga Bank Ltd. | | 1,000 | | — | | 1,000 | | 9 | | — | | | | 9 | |
Sysmex Corp. | | 2,400 | | 7,400 | | 9,800 | | 78 | | 241 | | | | 319 | |
T&D Holdings, Inc. | | 4,700 | | 14,100 | | 18,800 | | 44 | | 131 | | | | 175 | |
Taisei Corp. | | 14,000 | | 39,000 | | 53,000 | | 35 | | 99 | | | | 134 | |
Takeda Pharmaceutical Co., Ltd. | | 11,500 | | 40,300 | | 51,800 | | 505 | | 1,770 | | | | 2,275 | |
TDK Corp. | | 1,552 | | 5,200 | | 6,752 | | 69 | | 230 | | | | 299 | |
Teijin Ltd. | | 13,608 | | 36,400 | | 50,008 | | 42 | | 112 | | | | 154 | |
Terumo Corp. | | 3,650 | | 13,200 | | 16,850 | | 172 | | 622 | | | | 794 | |
THK Co., Ltd. (a) | | 1,000 | | 1,600 | | 2,600 | | 20 | | 31 | | | | 51 | |
Tobu Railway Co., Ltd. (a) | | 8,500 | | 33,400 | | 41,900 | | 43 | | 171 | | | | 214 | |
Tohoku Electric Power Co., Inc. (a) | | 2,900 | | 8,700 | | 11,600 | | 28 | | 83 | | | | 111 | |
Tokio Marine Holdings, Inc. | | 10,268 | | 32,252 | | 42,520 | | 227 | | 715 | | | | 942 | |
Tokyo Electron Ltd. | | 3,700 | | 13,400 | | 17,100 | | 188 | | 682 | | | | 870 | |
Tokyo Gas Co., Ltd. | | 10,000 | | 44,600 | | 54,600 | | 46 | | 205 | | | | 251 | |
Tokyu Corp. (a) | | 12,000 | | 40,400 | | 52,400 | | 59 | | 199 | | | | 258 | |
Tokyu Land Corp. | | 9,000 | | 31,000 | | 40,000 | | 34 | | 117 | | | | 151 | |
B-20
Security Description | | MS
International
Fund
Shares | | MSIF Active
International
Al location
Shares | | Pro Forma
Shares | | MS
International
Fund
(000) | | MSIF Active
International
Allocation
(000) | | Adjustments | | Pro Forma
Value
(000) | |
TonenGeneral Sekiyu KK (a) | | 4,000 | | 14,000 | | 18,000 | | 44 | | 153 | | | | 197 | |
Toppan Printing Co., Ltd. (a) | | 6,000 | | 16,600 | | 22,600 | | 44 | | 122 | | | | 166 | |
Toray Industries, Inc. (a) | | 14,000 | | 49,100 | | 63,100 | | 100 | | 352 | | | | 452 | |
Toshiba Corp. (a) | | 48,026 | | 170,000 | | 218,026 | | 196 | | 696 | | | | 892 | |
Tosoh Corp. | | 11,000 | | 23,000 | | 34,000 | | 29 | | 62 | | | | 91 | |
TOTO Ltd. | | 4,500 | | 15,600 | | 20,100 | | 35 | | 120 | | | | 155 | |
Toyo Seikan Kaisha Ltd. | | 2,517 | | 8,000 | | 10,517 | | 34 | | 109 | | | | 143 | |
Toyota Boshoku Corp. (a) | | 3,100 | | 9,700 | | 12,800 | | 33 | | 101 | | | | 134 | |
Toyota Industries Corp. | | 1,200 | | 3,250 | | 4,450 | | 33 | | 88 | | | | 121 | |
Toyota Motor Corp. | | 15,555 | | 52,800 | | 68,355 | | 519 | | 1,759 | | | | 2,278 | |
Trend Micro, Inc. (a) | | 1,600 | | 4,800 | | 6,400 | | 48 | | 143 | | | | 191 | |
Unicharm Corp. | | 3,600 | | 10,100 | | 13,700 | | 177 | | 498 | | | | 675 | |
Ushio, Inc. | | 800 | | 1,600 | | 2,400 | | 12 | | 23 | | | | 35 | |
USS Co., Ltd. | | 620 | | 1,250 | | 1,870 | | 56 | | 113 | | | | 169 | |
West Japan Railway Co. | | 900 | | 1,900 | | 2,800 | | 39 | | 83 | | | | 122 | |
Yahoo! Japan Corp. (a) | | 203 | | 763 | | 966 | | 65 | | 246 | | | | 311 | |
Yakult Honsha Co., Ltd. (a) | | 3,100 | | 9,199 | | 12,299 | | 98 | | 289 | | | | 387 | |
Yamada Denki Co., Ltd. (a) | | 1,160 | | 4,190 | | 5,350 | | 79 | | 285 | | | | 364 | |
Yamaha Corp. | | 2,100 | | 5,100 | | 7,200 | | 19 | | 47 | | | | 66 | |
Yamaha Motor Co., Ltd. | | 700 | | 1,800 | | 2,500 | | 9 | | 23 | | | | 32 | |
Yamato Holdings Co., Ltd. | | 3,435 | | 10,600 | | 14,035 | | 58 | | 179 | | | | 237 | |
Yokogawa Electric Corp. (a)(b) | | 3,450 | | 11,000 | | 14,450 | | 31 | | 99 | | | | 130 | |
| | | | | | | | 22,058 | | 74,701 | | | | 96,759 | |
Korea, Republic of (1.2%) | | | | | | | | | | | | | | | |
Amorepacific Corp. (b) | | — | | 22 | | 22 | | — | | 20 | | | | 20 | |
Cheil Industries, Inc. (b) | | 142 | | 481 | | 623 | | 13 | | 42 | | | | 55 | |
Daewoo Securities Co., Ltd. | | 360 | | 1,230 | | 1,590 | | 3 | | 11 | | | | 14 | |
Doosan Heavy Industries and Construction Co., Ltd. (b) | | 190 | | 646 | | 836 | | 11 | | 36 | | | | 47 | |
E-Mart Co., Ltd. (b) | | 47 | | 159 | | 206 | | 11 | | 39 | | | | 50 | |
GS Engineering & Construction Corp. (b) | | 123 | | 417 | | 540 | | 9 | | 34 | | | | 43 | |
Hana Financial Group, Inc. | | 380 | | 1,290 | | 1,670 | | 12 | | 40 | | | | 52 | |
Hynix Semiconductor, Inc. (b) | | 900 | | 3,060 | | 3,960 | | 17 | | 59 | | | | 76 | |
Hyundai Engineering & Construction Co., Ltd. (b) | | 150 | | 500 | | 650 | | 9 | | 31 | | | | 40 | |
Hyundai Heavy Industries Co., Ltd. (b) | | 84 | | 284 | | 368 | | 19 | | 64 | | | | 83 | |
Hyundai Mobis (b) | | 117 | | 397 | | 514 | | 30 | | 101 | | | | 131 | |
Hyundai Motor Co. (b) | | 280 | | 949 | | 1,229 | | 52 | | 176 | | | | 228 | |
Hyundai Steel Co. (b) | | 149 | | 507 | | 656 | | 12 | | 43 | | | | 55 | |
B-21
Security Description | | MS
International
Fund
Shares | | MSIF Active
International
Al location
Shares | | Pro Forma
Shares | | MS
International
Fund
(000) | | MSIF Active
International
Allocation
(000) | | Adjustments | | Pro Forma
Value
(000) | |
Industrial Bank of Korea (b) | | 610 | | 2,060 | | 2,670 | | 7 | | 22 | | | | 29 | |
KB Financial Group, Inc. (b) | | 710 | | 2,410 | | 3,120 | | 23 | | 76 | | | | 99 | |
Kia Motors Corp. (b) | | 420 | | 1,430 | | 1,850 | | 25 | | 83 | | | | 108 | |
Korea Electric Power Corp. (b) | | 510 | | 1,710 | | 2,220 | | 11 | | 38 | | | | 49 | |
Korea Exchange Bank (b) | | 1,020 | | 3,450 | | 4,470 | | 7 | | 22 | | | | 29 | |
Korean Air Lines Co., Ltd. (b) | | — | | 248 | | 248 | | — | | 9 | | | | 9 | |
KT Corp. (b) | | 420 | | 1,430 | | 1,850 | | 13 | | 44 | | | | 57 | |
KT&G Corp. (b) | | 221 | | 749 | | 970 | | 16 | | 53 | | | | 69 | |
LG Chem Ltd. (b) | | 88 | | 298 | | 386 | | 24 | | 83 | | | | 107 | |
LG Corp. (b) | | 339 | | 1,151 | | 1,490 | | 18 | | 62 | | | | 80 | |
LG Display Co., Ltd. (b) | | 450 | | 1,520 | | 1,970 | | 10 | | 32 | | | | 42 | |
LG Electronics, Inc. (b) | | 199 | | 675 | | 874 | | 13 | | 44 | | | | 57 | |
LG Household & Health Care Ltd. (b) | | — | | 62 | | 62 | | — | | 26 | | | | 26 | |
Lotte Shopping Co., Ltd. (b) | | 26 | | 87 | | 113 | | 8 | | 25 | | | | 33 | |
NCSoft Corp. (b) | | — | | 104 | | 104 | | — | | 28 | | | | 28 | |
NHN Corp. (b) | | 83 | | 282 | | 365 | | 15 | | 52 | | | | 67 | |
OCI Co., Ltd. (b) | | 35 | | 119 | | 154 | | 7 | | 23 | | | | 30 | |
POSCO | | 118 | | 400 | | 518 | | 39 | | 133 | | | | 172 | |
S-Oil Corp. | | 140 | | 490 | | 630 | | 12 | | 43 | | | | 55 | |
Samsung C&T Corp. (b) | | 290 | | 985 | | 1,275 | | 17 | | 59 | | | | 76 | |
Samsung Electro-Mechanics Co., Ltd. (b) | | 115 | | 391 | | 506 | | 8 | | 26 | | | | 34 | |
Samsung Electronics Co., Ltd. | | 506 | | 1,696 | | 2,202 | | 466 | | 1,561 | | | | 2,027 | |
Samsung Electronics Co., Ltd. (Preference) | | 36 | | 124 | | 160 | | 21 | | 72 | | | | 93 | |
Samsung Engineering Co., Ltd. (b) | | 70 | | 238 | | 308 | | 12 | | 42 | | | | 54 | |
Samsung Fire & Marine Insurance Co., Ltd. | | 75 | | 256 | | 331 | | 14 | | 47 | | | | 61 | |
Samsung Heavy Industries Co., Ltd. (b) | | 450 | | 1,520 | | 1,970 | | 11 | | 37 | | | | 48 | |
Samsung SDI Co., Ltd. (b) | | 72 | | 244 | | 316 | | 8 | | 29 | | | | 37 | |
Samsung Securities Co., Ltd. | | 142 | | 482 | | 624 | | 6 | | 21 | | | | 27 | |
Samsung Techwin Co., Ltd. (b) | | 77 | | 263 | | 340 | | 4 | | 12 | | | | 16 | |
Shinhan Financial Group Co., Ltd. (b) | | 790 | | 2,670 | | 3,460 | | 27 | | 93 | | | | 120 | |
Shinsegae Co., Ltd. (b) | | 16 | | 56 | | 72 | | 3 | | 12 | | | | 15 | |
SK Innovation Co., Ltd. (b) | | 126 | | 427 | | 553 | | 16 | | 53 | | | | 69 | |
SK Telecom Co., Ltd. | | 98 | | 333 | | 431 | | 12 | | 41 | | | | 53 | |
Woori Finance Holdings Co., Ltd. (b) | | 470 | | 1,590 | | 2,060 | | 4 | | 13 | | | | 17 | |
| | | | | | | | 1,075 | | 3,712 | | | | 4,787 | |
Malta (0.0%) | | | | | | | | | | | | | | | |
BGP Holdings PLC (b)(f) | | — | | 72,261 | | 72,261 | | — | | — | | | | — | |
B-22
Security Description | | MS
International
Fund
Shares | | MSIF Active
International
Al location
Shares | | Pro Forma
Shares | | MS
International
Fund
(000) | | MSIF Active
International
Allocation
(000) | | Adjustments | | Pro Forma
Value
(000) | |
Mexico (0.6%) | | | | | | | | — | | — | | | | — | |
Alfa SAB de CV | | 1,200 | | 3,900 | | 5,100 | | 13 | | 43 | | | | 56 | |
America Movil SAB de CV | | 152,400 | | 511,400 | | 663,800 | | 173 | | 578 | | | | 751 | |
Cemex SAB de CV (Units)(b)(d) | | 37,300 | | 125,300 | | 162,600 | | 20 | | 66 | | | | 86 | |
Fomento Economico Mexicano SAB de CV (Units)(d) | | 8,500 | | 28,700 | | 37,200 | | 59 | | 201 | | | | 260 | |
Fresnillo PLC | | 512 | | 1,167 | | 1,679 | | 12 | | 28 | | | | 40 | |
Grupo Bimbo SAB de CV | | 7,200 | | 24,000 | | 31,200 | | 15 | | 49 | | | | 64 | |
Grupo Elektra SA de CV | | 295 | | 995 | | 1,290 | | 29 | | 100 | | | | 129 | |
Grupo Financiero Banorte SAB de CV Series O | | 6,300 | | 21,300 | | 27,600 | | 19 | | 64 | | | | 83 | |
Grupo Financiero Inbursa SA | | 7,000 | | 23,200 | | 30,200 | | 13 | | 43 | | | | 56 | |
Grupo Mexico SAB de CV Series B | | 14,838 | | 49,928 | | 64,766 | | 39 | | 131 | | | | 170 | |
Grupo Modelo SAB de CV | | 2,700 | | 8,900 | | 11,600 | | 17 | | 56 | | | | 73 | |
Grupo Televisa SAB | | 10,200 | | 34,100 | | 44,300 | | 43 | | 144 | | | | 187 | |
Industrias Penoles SAB de CV | | 420 | | 1,405 | | 1,825 | | 18 | | 62 | | | | 80 | |
Kimberly-Clark de Mexico SAB de CV Class A | | 2,400 | | 8,000 | | 10,400 | | 14 | | 43 | | | | 57 | |
Mexichem SAB de CV | | 3,300 | | 11,100 | | 14,400 | | 10 | | 35 | | | | 45 | |
Minera Frisco SAB de CV (b) | | 2,500 | | 8,500 | | 11,000 | | 9 | | 31 | | | | 40 | |
Wal-Mart de Mexico SAB de CV Series V | | 27,600 | | 92,802 | | 120,402 | | 76 | | 254 | | | | 330 | |
| | | | | | | | 579 | | 1,928 | | | | 2,507 | |
Netherlands (3.4%) | | | | | | | | | | | | | | | |
Aegon N.V. (b) | | 15,100 | | 56,151 | | 71,251 | | 61 | | 225 | | | | 286 | |
Akzo Nobel N.V. (a) | | 3,503 | | 15,704 | | 19,207 | | 169 | | 760 | | | | 929 | |
ASML Holding N.V. | | 5,597 | | 22,764 | | 28,361 | | 235 | | 957 | | | | 1,192 | |
Corio N.V. REIT | | 769 | | 2,333 | | 3,102 | | 33 | | 102 | | | | 135 | |
Fugro N.V. CVA | | 1,175 | | 2,618 | | 3,793 | | 68 | | 152 | | | | 220 | |
Heineken N.V. | | 3,824 | | 13,278 | | 17,102 | | 177 | | 615 | | | | 792 | |
ING Groep N.V. CVA (b) | | 33,580 | | 119,831 | | 153,411 | | 242 | | 862 | | | | 1,104 | |
Koninklijke Ahold N.V. | | 18,160 | | 1,806 | | 19,966 | | 244 | | 25 | | | | 269 | |
Koninklijke Boskalis Westminster N.V. | | — | | 166 | | 166 | | — | | 6 | | | | 6 | |
Koninklijke DSM N.V. | | 1,643 | | 6,104 | | 7,747 | | 76 | | 283 | | | | 359 | |
Koninklijke KPN N.V. | | 24,056 | | 111,174 | | 135,230 | | 288 | | 1,330 | | | | 1,618 | |
Koninklijke Philips Electronics N.V. | | 12,034 | | 46,957 | | 58,991 | | 254 | | 989 | | | | 1,243 | |
Randstad Holding N.V. | | 395 | | 275 | | 670 | | 12 | | 8 | | | | 20 | |
Reed Elsevier N.V. | | 10,597 | | 41,257 | | 51,854 | | 124 | | 481 | | | | 605 | |
SBM Offshore N.V. | | 1,865 | | 6,287 | | 8,152 | | 38 | | 130 | | | | 168 | |
TNT Express N.V. | | 8,488 | | 35,304 | | 43,792 | | 63 | | 264 | | | | 327 | |
Unilever N.V. CVA | | 23,924 | | 94,647 | | 118,571 | | 823 | | 3,254 | | | | 4,077 | |
B-23
Security Description | | MS
International
Fund
Shares | | MSIF Active
International
Al location
Shares | | Pro Forma
Shares | | MS
International
Fund
(000) | | MSIF Active
International
Allocation
(000) | | Adjustments | | Pro Forma
Value
(000) | |
Wolters Kluwer N.V. | | 7,033 | | 27,716 | | 34,749 | | 122 | | 479 | | | | 601 | |
| | | | | | | | 3,029 | | 10,922 | | | | 13,951 | |
Norway (1.4%) | | | | | | | | | | | | | | | |
Aker Solutions ASA | | 3,097 | | 3,994 | | 7,091 | | 33 | | 42 | | | | 75 | |
DnB NOR ASA | | 9,417 | | 25,134 | | 34,551 | | 92 | | 246 | | | | 338 | |
Gjensidige Forsikring ASA | | — | | 798 | | 798 | | — | | 9 | | | | 9 | |
Norsk Hydro ASA | | 12,701 | | 39,166 | | 51,867 | | 59 | | 182 | | | | 241 | |
Orkla ASA | | 7,901 | | 31,161 | | 39,062 | | 59 | | 233 | | | | 292 | |
Statoil ASA | | 10,893 | | 37,537 | | 48,430 | | 279 | | 964 | | | | 1,243 | |
Subsea 7 SA (a)(b) | | 1,992 | | 6,763 | | 8,755 | | 37 | | 125 | | | | 162 | |
Telenor ASA | | 29,805 | | 93,562 | | 123,367 | | 489 | | 1,535 | | | | 2,024 | |
Yara International ASA | | 8,199 | | 26,152 | | 34,351 | | 329 | | 1,049 | | | | 1,378 | |
| | | | | | | | 1,377 | | 4,385 | | | | 5,762 | |
Philippines (0.7%) | | | | | | | | | | | | | | | |
Aboitiz Equity Ventures, Inc. | | 69,000 | | 231,000 | | 300,000 | | 63 | | 212 | | | | 275 | |
Aboitiz Power Corp. | | 59,200 | | 198,700 | | 257,900 | | 40 | | 136 | | | | 176 | |
Alliance Global Group, Inc. | | 130,700 | | 438,900 | | 569,600 | | 31 | | 104 | | | | 135 | |
Ayala Corp. | | 7,176 | | 24,096 | | 31,272 | | 51 | | 171 | | | | 222 | |
Ayala Land, Inc. | | 172,300 | | 578,500 | | 750,800 | | 60 | | 201 | | | | 261 | |
Bank of the Philippine Islands | | 58,200 | | 195,500 | | 253,700 | | 74 | | 247 | | | | 321 | |
Energy Development Corp. | | 250,000 | | 840,000 | | 1,090,000 | | 36 | | 121 | | | | 157 | |
Manila Electric Co. | | 9,230 | | 31,000 | | 40,230 | | 52 | | 175 | | | | 227 | |
Metropolitan Bank & Trust | | 34,300 | | 115,200 | | 149,500 | | 54 | | 179 | | | | 233 | |
Philippine Long Distance Telephone Co. | | 1,530 | | 5,120 | | 6,650 | | 89 | | 298 | | | | 387 | |
SM Investments Corp. | | 6,000 | | 20,140 | | 26,140 | | 80 | | 269 | | | | 349 | |
SM Prime Holdings, Inc. | | 173,000 | | 581,000 | | 754,000 | | 52 | | 177 | | | | 229 | |
| | | | | | | | 682 | | 2,290 | | | | 2,972 | |
Poland (0.9%) | | | | | | | | | | | | | | | |
Asseco Poland SA | | 646 | | 5,048 | | 5,694 | | 9 | | 71 | | | | 80 | |
Bank Pekao SA | | 2,638 | | 8,927 | | 11,565 | | 108 | | 365 | | | | 473 | |
BRE Bank SA (b) | | 334 | | 1,130 | | 1,464 | | 24 | | 81 | | | | 105 | |
Getin Holding SA (b) | | 8,481 | | 28,702 | | 37,183 | | 17 | | 59 | | | | 76 | |
KGHM Polska Miedz SA | | 3,062 | | 10,362 | | 13,424 | | 98 | | 332 | | | | 430 | |
PGE SA | | 15,174 | | 51,351 | | 66,525 | | 91 | | 308 | | | | 399 | |
Polski Koncern Naftowy Orlen SA (b) | | 7,537 | | 25,504 | | 33,041 | | 74 | | 251 | | | | 325 | |
Polskie Gornictwo Naftowe i Gazownictwo SA | | 41,073 | | 138,995 | | 180,068 | | 49 | | 164 | | | | 213 | |
Powszechna Kasa Oszczednosci Bank Polski SA | | 15,012 | | 50,802 | | 65,814 | | 140 | | 473 | | | | 613 | |
Powszechny Zaklad Ubezpieczen SA | | 1,100 | | 3,700 | | 4,800 | | 99 | | 331 | | | | 430 | |
B-24
Security Description | | MS
International
Fund
Shares | | MSIF Active
International
Al location
Shares | | Pro Forma
Shares | | MS
International
Fund
(000) | | MSIF Active
International
Allocation
(000) | | Adjustments | | Pro Forma
Value
(000) | |
Synthos SA | | 405 | | 1,374 | | 1,779 | | — | | 2 | | | | 2 | |
Tauron Polska Energia SA | | 23,900 | | 80,800 | | 104,700 | | 37 | | 125 | | | | 162 | |
Telekomunikacja Polska SA | | 15,679 | | 53,058 | | 68,737 | | 78 | | 265 | | | | 343 | |
| | | | | | | | 824 | | 2,827 | | | | 3,651 | |
Portugal (0.0%) | | | | | | | | | | | | | | | |
Cimpor Cimentos de Portugal SGPS SA | | — | | 1,085 | | 1,085 | | — | | 8 | | | | 8 | |
Russia (0.5%) | | | | | | | | | | | | | | | |
Gazprom OAO ADR | | 12,519 | | 48,606 | | 61,125 | | 133 | | 518 | | | | 651 | |
Lukoil OAO ADR | | 1,272 | | 4,934 | | 6,206 | | 68 | | 261 | | | | 329 | |
MMC Norilsk Nickel OJSC ADR | | 3,209 | | 7,892 | | 11,101 | | 49 | | 121 | | | | 170 | |
Mobile Telesystems OJSC ADR (a) | | 1,250 | | 5,100 | | 6,350 | | 18 | | 75 | | | | 93 | |
NovaTek OAO (Registerd GDR) | | 209 | | 585 | | 794 | | 26 | | 73 | | | | 99 | |
Rosneft Oil Co. (Registerd GDR) | | 4,144 | | 16,411 | | 20,555 | | 28 | | 108 | | | | 136 | |
Surgutneftegas OJSC ADR | | 4,000 | | 8,300 | | 12,300 | | 31 | | 66 | | | | 97 | |
Tatneft ADR | | 1,098 | | 2,878 | | 3,976 | | 33 | | 85 | | | | 118 | |
VTB Bank OJSC (Registerd GDR) | | 7,106 | | 15,972 | | 23,078 | | 25 | | 58 | | | | 83 | |
| | | | | | | | 411 | | 1,365 | | | | 1,776 | |
Singapore (1.9%) | | | | | | | | | | | | | | | |
Ascendas Real Estate Investment Trust REIT(a) | | 18,000 | | 60,000 | | 78,000 | | 25 | | 85 | | | | 110 | |
CapitaLand Ltd. | | 30,000 | | 100,000 | | 130,000 | | 51 | | 170 | | | | 221 | |
CapitaMall Trust REIT | | 26,704 | | 85,514 | | 112,218 | | 35 | | 112 | | | | 147 | |
City Developments Ltd. | | 6,462 | | 22,741 | | 29,203 | | 44 | | 156 | | | | 200 | |
ComfortDelGro Corp. Ltd. | | 19,089 | | 64,538 | | 83,627 | | 21 | | 70 | | | | 91 | |
DBS Group Holdings Ltd. | | 24,413 | | 85,678 | | 110,091 | | 217 | | 761 | | | | 978 | |
Fraser and Neave Ltd. | | 13,000 | | 42,000 | | 55,000 | | 62 | | 201 | | | | 263 | |
Genting Singapore PLC (a)(b) | | 87,000 | | 284,000 | | 371,000 | | 101 | | 331 | | | | 432 | |
Jardine Cycle & Carriage Ltd. | | 31 | | 3,034 | | 3,065 | | 1 | | 113 | | | | 114 | |
Keppel Corp., Ltd. | | 18,700 | | 60,500 | | 79,200 | | 134 | | 434 | | | | 568 | |
Noble Group Ltd. | | 29,726 | | 100,090 | | 129,816 | | 26 | | 87 | | | | 113 | |
Olam International Ltd. (a) | | 7,000 | | 15,000 | | 22,000 | | 11 | | 25 | | | | 36 | |
Oversea-Chinese Banking Corp., Ltd. | | 45,093 | | 157,758 | | 202,851 | | 272 | | 953 | | | | 1,225 | |
SembCorp Industries Ltd. | | 12,511 | | 44,183 | | 56,694 | | 39 | | 138 | | | | 177 | |
SembCorp Marine Ltd. (a) | | 11,400 | | 40,000 | | 51,400 | | 34 | | 117 | | | | 151 | |
Singapore Airlines Ltd. | | 9,276 | | 29,010 | | 38,286 | | 73 | | 227 | | | | 300 | |
Singapore Exchange Ltd. | | 7,490 | | 24,581 | | 32,071 | | 36 | | 116 | | | | 152 | |
Singapore Press Holdings Ltd. (a) | | 11,350 | | 34,083 | | 45,433 | | 32 | | 97 | | | | 129 | |
Singapore Technologies Engineering Ltd. | | 16,000 | | 52,000 | | 68,000 | | 33 | | 108 | | | | 141 | |
Singapore Telecommunications Ltd. | | 94,630 | | 309,115 | | 403,745 | | 226 | | 736 | | | | 962 | |
United Overseas Bank Ltd. | | 21,508 | | 72,448 | | 93,956 | | 253 | | 853 | | | | 1,106 | |
B-25
Security Description | | MS
International
Fund
Shares | | MSIF Active
International
Al location
Shares | | Pro Forma
Shares | | MS
International
Fund
(000) | | MSIF Active
International
Allocation
(000) | | Adjustments | | Pro Forma
Value
(000) | |
Wilmar International Ltd. (a) | | 13,000 | | 45,000 | | 58,000 | | 51 | | 173 | | | | 224 | |
| | | | | | | | 1,777 | | 6,063 | | | | 7,840 | |
South Africa (0.5%) | | | | | | | | | | | | | | | |
SABMiller PLC | | 10,120 | | 44,312 | | 54,432 | | 356 | | 1,560 | | | | 1,916 | |
Spain (0.2%) | | | | | | | | | | | | | | | |
Abertis Infraestructuras SA | | 546 | | 1,245 | | 1,791 | | 9 | | 20 | | | | 29 | |
Amadeus IT Holding SA Class A | | — | | 700 | | 700 | | — | | 11 | | | | 11 | |
Distribuidora Internacional de Alimentacion SA (a)(b) | | 6,282 | | 33,138 | | 39,420 | | 28 | | 150 | | | | 178 | |
Iberdrola SA | | 4,150 | | 9,459 | | 13,609 | | 26 | | 59 | | | | 85 | |
Repsol YPF SA | | 1,444 | | 1,968 | | 3,412 | | 44 | | 61 | | | | 105 | |
Telefonica SA | | 5,923 | | 17,154 | | 23,077 | | 103 | | 297 | | | | 400 | |
| | | | | | | | 210 | | 598 | | | | 808 | |
Sweden (2.6%) | | | | | | | | | | | | | | | |
Alfa Laval AB | | 2,337 | | 8,833 | | 11,170 | | 44 | | 168 | | | | 212 | |
Assa Abloy AB Class B | | 2,817 | | 8,838 | | 11,655 | | 71 | | 221 | | | | 292 | |
Atlas Copco AB Class A | | 5,962 | | 20,848 | | 26,810 | | 128 | | 449 | | | | 577 | |
Atlas Copco AB Class B | | 3,778 | | 11,467 | | 15,245 | | 72 | | 218 | | | | 290 | |
Electrolux AB Class B | | 2,419 | | 2,711 | | 5,130 | | 39 | | 43 | | | | 82 | |
Getinge AB Class B | | 3,440 | | 11,829 | | 15,269 | | 87 | | 300 | | | | 387 | |
Hennes & Mauritz AB Class B | | 10,681 | | 31,727 | | 42,408 | | 344 | | 1,020 | | | | 1,364 | |
Holmen AB Class B | | 859 | | 1,793 | | 2,652 | | 24 | | 52 | | | | 76 | |
Husqvarna AB Class B | | 1,251 | | 2,711 | | 3,962 | | 6 | | 12 | | | | 18 | |
Investor AB Class B | | 5,294 | | 19,540 | | 24,834 | | 99 | | 364 | | | | 463 | |
Lundin Petroleum AB (b) | | 2,027 | | 5,580 | | 7,607 | | 50 | | 137 | | | | 187 | |
Nordea Bank AB | | 15,090 | | 71,635 | | 86,725 | | 117 | | 554 | | | | 671 | |
Oriflame Cosmetics SA SDR (a) | | 3,237 | | 9,373 | | 12,610 | | 102 | | 296 | | | | 398 | |
Sandvik AB | | 8,683 | | 33,130 | | 41,813 | | 106 | | 407 | | | | 513 | |
Scania AB Class B | | 568 | | 1,295 | | 1,863 | | 9 | | 19 | | | | 28 | |
Securitas AB Class B | | 1,600 | | 800 | | 2,400 | | 14 | | 7 | | | | 21 | |
Skanska AB Class B | | 6,637 | | 19,316 | | 25,953 | | 110 | | 320 | | | | 430 | |
SKF AB Class B | | 2,831 | | 10,403 | | 13,234 | | 60 | | 220 | | | | 280 | |
SSAB AB Class A | | 3,286 | | 7,094 | | 10,380 | | 29 | | 62 | | | | 91 | |
Svenska Cellulosa AB Class B | | 7,794 | | 20,989 | | 28,783 | | 116 | | 311 | | | | 427 | |
Svenska Handelsbanken AB Class A | | 4,466 | | 15,836 | | 20,302 | | 117 | | 417 | | | | 534 | |
Swedish Match AB | | 3,467 | | 11,240 | | 14,707 | | 123 | | 399 | | | | 522 | |
Tele2 AB Class B | | 3,540 | | 8,263 | | 11,803 | | 69 | | 161 | | | | 230 | |
Telefonaktiebolaget LM Ericsson Class B | | 43,347 | | 55,403 | | 98,750 | | 443 | | 567 | | | | 1,010 | |
TeliaSonera AB | | 27,460 | | 83,532 | | 110,992 | | 186 | | 568 | | | | 754 | |
B-26
Security Description | | MS
International
Fund
Shares | | MSIF Active
International
Al location
Shares | | Pro Forma
Shares | | MS
International
Fund
(000) | | MSIF Active
International
Allocation
(000) | | Adjustments | | Pro Forma
Value
(000) | |
Volvo AB Class A | | 5,291 | | 12,907 | | 18,198 | | 58 | | 142 | | | | 200 | |
Volvo AB Class B | | 9,415 | | 34,479 | | 43,894 | | 103 | | 377 | | | | 480 | |
| | | | | | | | 2,726 | | 7,811 | | | | 10,537 | |
Switzerland (8.7%) | | | | | | | | | | | | | | | |
ABB Ltd. (Registered)(b) | | 30,695 | | 106,353 | | 137,048 | | 578 | | 2,002 | | | | 2,580 | |
Adecco SA (Registered) (b) | | 193 | | — | | 193 | | 8 | | — | | | | 8 | |
Baloise-Holding AG (Registered) | | 404 | | 1,454 | | 1,858 | | 28 | | 99 | | | | 127 | |
Cie Financiere Richemont SA | | 1,585 | | 6,054 | | 7,639 | | 80 | | 306 | | | | 386 | |
Credit Suisse Group AG (Registered)(b) | | 5,527 | | 19,066 | | 24,593 | | 130 | | 448 | | | | 578 | |
GAM Holding AG (b) | | 4,324 | | 11,678 | | 16,002 | | 47 | | 127 | | | | 174 | |
Geberit AG (Registered)(b) | | 361 | | 989 | | 1,350 | | 69 | | 191 | | | | 260 | |
Givaudan SA (Registered)(b) | | 68 | | 198 | | 266 | | 65 | | 189 | | | | 254 | |
Holcim Ltd. (Registered)(b) | | 2,195 | | 6,542 | | 8,737 | | 117 | | 350 | | | | 467 | |
Julius Baer Group Ltd. (b) | | 1,827 | | 5,987 | | 7,814 | | 72 | | 234 | | | | 306 | |
Logitech International SA (Registered)(a)(b) | | 2,768 | | 2,992 | | 5,760 | | 22 | | 23 | | | | 45 | |
Lonza Group AG (Registered)(b) | | 771 | | 1,199 | | 1,970 | | 45 | | 71 | | | | 116 | |
Nestle SA (Registered) | | 49,508 | | 152,403 | | 201,911 | | 2,846 | | 8,762 | | | | 11,608 | |
Novartis AG (Registered) | | 23,666 | | 81,315 | | 104,981 | | 1,353 | | 4,649 | | | | 6,002 | |
Pargesa Holding SA | | 57 | | 377 | | 434 | | 4 | | 24 | | | | 28 | |
Roche Holding AG (Genusschein) | | 7,148 | | 23,918 | | 31,066 | | 1,211 | | 4,054 | | | | 5,265 | |
Schindler Holding AG | | 482 | | 1,720 | | 2,202 | | 56 | | 201 | | | | 257 | |
SGS SA (Registered) | | 22 | | — | | 22 | | 36 | | — | | | | 36 | |
Straumann Holding AG (Registered) | | 144 | | 484 | | 628 | | 25 | | 83 | | | | 108 | |
Swatch Group AG (The) | | 107 | | 359 | | 466 | | 40 | | 134 | | | | 174 | |
Swatch Group AG (The) (Registered) | | 237 | | 689 | | 926 | | 16 | | 46 | | | | 62 | |
Swiss Life Holding AG (Registered)(b) | | 231 | | 609 | | 840 | | 21 | | 56 | | | | 77 | |
Swiss Re AG (b) | | 2,797 | | 10,178 | | 12,975 | | 142 | | 519 | | | | 661 | |
Swisscom AG (Registered) | | 325 | | 1,038 | | 1,363 | | 123 | | 394 | | | | 517 | |
Syngenta AG (Registered)(b) | | 1,918 | | 6,458 | | 8,376 | | 562 | | 1,890 | | | | 2,452 | |
Synthes, Inc. (Registered)(g) | | 977 | | 3,733 | | 4,710 | | 164 | | 626 | | | | 790 | |
Transocean Ltd. | | 633 | | 1,443 | | 2,076 | | 24 | | 56 | | | | 80 | |
UBS AG (Registered)(b) | | 18,078 | | 63,558 | | 81,636 | | 216 | | 756 | | | | 972 | |
Zurich Financial Services AG (b) | | 955 | | 3,178 | | 4,133 | | 216 | | 719 | | | | 935 | |
| | | | | | | | 8,316 | | 27,009 | | | | 35,325 | |
Thailand (0.3%) | | | | | | | | | | | | | | | |
Bangkok Bank PCL | | 5,500 | | 17,800 | | 23,300 | | 27 | | 86 | | | | 113 | |
Bangkok Bank PCL (Foreign Registered) | | 9,900 | | 32,100 | | 42,000 | | 51 | | 167 | | | | 218 | |
Bank of Ayudhya PCL (Foreign) | | 22,100 | | 71,500 | | 93,600 | | 16 | | 50 | | | | 66 | |
Kasikornbank PCL | | 7,000 | | 22,600 | | 29,600 | | 27 | | 88 | | | | 115 | |
B-27
Security Description | | MS
International
Fund
Shares | | MSIF Active
International
Al location
Shares | | Pro Forma
Shares | | MS
International
Fund
(000) | | MSIF Active
International
Allocation
(000) | | Adjustments | | Pro Forma
Value
(000) | |
Kasikornbank PCL (Foreign) | | 13,600 | | 44,100 | | 57,700 | | 54 | | 174 | | | | 228 | |
Krung Thai Bank PCL | | 30,600 | | 99,100 | | 129,700 | | 14 | | 47 | | | | 61 | |
Siam Commercial Bank PCL (Foreign) | | 17,800 | | 57,700 | | 75,500 | | 65 | | 210 | | | | 275 | |
| | | | | | | | 254 | | 822 | | | | 1,076 | |
United Kingdom (21.8%) | | | | | | | | | | | | | | | |
3i Group PLC | | 5,781 | | 16,093 | | 21,874 | | 16 | | 45 | | | | 61 | |
Admiral Group PLC | | 1,422 | | 3,982 | | 5,404 | | 19 | | 53 | | | | 72 | |
Aggreko PLC | | 12,385 | | 35,863 | | 48,248 | | 388 | | 1,123 | | | | 1,511 | |
AMEC PLC | | 3,695 | | 12,459 | | 16,154 | | 52 | | 176 | | | | 228 | |
Anglo American PLC | | 11,462 | | 38,159 | | 49,621 | | 423 | | 1,410 | | | | 1,833 | |
ARM Holdings PLC | | 25,507 | | 85,867 | | 111,374 | | 235 | | 789 | | | | 1,024 | |
AstraZeneca PLC | | 13,665 | | 46,432 | | 60,097 | | 632 | | 2,145 | | | | 2,777 | |
Aviva PLC | | 16,683 | | 61,572 | | 78,255 | | 78 | | 288 | | | | 366 | |
BAE Systems PLC | | 26,293 | | 91,329 | | 117,622 | | 117 | | 404 | | | | 521 | |
Balfour Beatty PLC | | 12,118 | | 28,670 | | 40,788 | | 50 | | 118 | | | | 168 | |
Barclays PLC | | 40,299 | | 158,650 | | 198,949 | | 110 | | 434 | | | | 544 | |
BG Group PLC | | 32,972 | | 117,962 | | 150,934 | | 705 | | 2,522 | | | | 3,227 | |
BHP Billiton PLC | | 11,296 | | 31,582 | | 42,878 | | 329 | | 921 | | | | 1,250 | |
BP PLC | | 135,584 | | 425,737 | | 561,321 | | 970 | | 3,044 | | | | 4,014 | |
British American Tobacco PLC | | 19,297 | | 65,519 | | 84,816 | | 916 | | 3,109 | | | | 4,025 | |
British Land Co., PLC REIT | | 9,395 | | 30,701 | | 40,096 | | 67 | | 221 | | | | 288 | |
British Sky Broadcasting Group PLC | | 23,145 | | 80,070 | | 103,215 | | 263 | | 911 | | | | 1,174 | |
BT Group PLC | | 108,542 | | 393,519 | | 502,061 | | 322 | | 1,166 | | | | 1,488 | |
Bunzl PLC | | 3,506 | | 11,071 | | 14,577 | | 48 | | 152 | | | | 200 | |
Burberry Group PLC | | 1,565 | | 4,860 | | 6,425 | | 29 | | 89 | | | | 118 | |
Capita PLC | | 1,773 | | 6,717 | | 8,490 | | 17 | | 66 | | | | 83 | |
Capital Shopping Centres Group PLC REIT | | 6,556 | | 17,037 | | 23,593 | | 32 | | 82 | | | | 114 | |
Carnival PLC | | 2,947 | | 8,133 | | 11,080 | | 97 | | 269 | | | | 366 | |
Centrica PLC | | 32,213 | | 100,817 | | 133,030 | | 145 | | 453 | | | | 598 | |
Charter International PLC (a) | | 7,144 | | 20,687 | | 27,831 | | 105 | | 303 | | | | 408 | |
Cobham PLC | | 11,529 | | 31,176 | | 42,705 | | 33 | | 89 | | | | 122 | |
Compass Group PLC | | 24,002 | | 83,308 | | 107,310 | | 228 | | 790 | | | | 1,018 | |
Diageo PLC | | 35,234 | | 91,133 | | 126,367 | | 770 | | 1,990 | | | | 2,760 | |
Experian PLC | | 9,477 | | 26,369 | | 35,846 | | 129 | | 358 | | | | 487 | |
Firstgroup PLC | | 9,040 | | 22,411 | | 31,451 | | 47 | | 118 | | | | 165 | |
G4S PLC | | 4,556 | | 14,295 | | 18,851 | | 19 | | 61 | | | | 80 | |
GlaxoSmithKline PLC | | 51,688 | | 175,121 | | 226,809 | | 1,181 | | 4,002 | | | | 5,183 | |
Hammerson PLC REIT | | 8,687 | | 25,762 | | 34,449 | | 49 | | 144 | | | | 193 | |
Home Retail Group PLC | | 10,876 | | 25,617 | | 36,493 | | 14 | | 33 | | | | 47 | |
B-28
Security Description | | MS
International
Fund
Shares | | MSIF Active
International
Al location
Shares | | Pro Forma
Shares | | MS
International
Fund
(000) | | MSIF Active
International
Allocation
(000) | | Adjustments | | Pro Forma
Value
(000) | |
HSBC Holdings PLC | | 131,030 | | 447,113 | | 578,143 | | 999 | | 3,410 | | | | 4,409 | |
ICAP PLC | | — | | 1,056 | | 1,056 | | — | | 6 | | | | 6 | |
Imperial Tobacco Group PLC | | 7,884 | | 26,399 | | 34,283 | | 298 | | 998 | | | | 1,296 | |
Intercontinental Hotels Group PLC | | 4,888 | | 13,994 | | 18,882 | | 88 | | 251 | | | | 339 | |
International Power PLC | | 4,314 | | 13,555 | | 17,869 | | 23 | | 71 | | | | 94 | |
Invensys PLC | | 5,761 | | 18,025 | | 23,786 | | 19 | | 59 | | | | 78 | |
Investec PLC | | 2,531 | | 5,696 | | 8,227 | | 13 | | 30 | | | | 43 | |
J Sainsbury PLC | | 13,046 | | 44,001 | | 57,047 | | 61 | | 207 | | | | 268 | |
Johnson Matthey PLC | | 1,911 | | 5,343 | | 7,254 | | 55 | | 152 | | | | 207 | |
Kingfisher PLC | | 15,420 | | 35,198 | | 50,618 | | 60 | | 137 | | | | 197 | |
Land Securities Group PLC REIT | | 8,823 | | 28,746 | | 37,569 | | 87 | | 284 | | | | 371 | |
Legal & General Group PLC | | 47,626 | | 162,231 | | 209,857 | | 76 | | 259 | | | | 335 | |
Lloyds Banking Group PLC (b) | | 57,454 | | 234,312 | | 291,766 | | 23 | | 94 | | | | 117 | |
Man Group PLC | | 15,431 | | 61,874 | | 77,305 | | 30 | | 121 | | | | 151 | |
Marks & Spencer Group PLC | | 19,628 | | 48,963 | | 68,591 | | 95 | | 236 | | | | 331 | |
National Grid PLC | | 32,306 | | 104,557 | | 136,863 | | 313 | | 1,015 | | | | 1,328 | |
Next PLC | | 2,785 | | 7,151 | | 9,936 | | 118 | | 304 | | | | 422 | |
Old Mutual PLC | | 44,303 | | 139,096 | | 183,399 | | 93 | | 293 | | | | 386 | |
Pearson PLC | | 11,351 | | 36,307 | | 47,658 | | 214 | | 682 | | | | 896 | |
Petrofac Ltd. | | 4,108 | | 10,323 | | 14,431 | | 92 | | 231 | | | | 323 | |
Prudential PLC | | 15,879 | | 52,385 | | 68,264 | | 157 | | 520 | | | | 677 | |
Randgold Resources Ltd. | | 2,433 | | 9,535 | | 11,968 | | 249 | | 975 | | | | 1,224 | |
Reckitt Benckiser Group PLC | | 6,776 | | 22,412 | | 29,188 | | 334 | | 1,107 | | | | 1,441 | |
Reed Elsevier PLC | | 18,650 | | 51,569 | | 70,219 | | 150 | | 416 | | | | 566 | |
Resolution Ltd. | | — | | 2,240 | | 2,240 | | — | | 9 | | | | 9 | |
Rexam PLC | | 7,876 | | 18,628 | | 26,504 | | 43 | | 102 | | | | 145 | |
Rio Tinto PLC | | 13,612 | | 42,279 | | 55,891 | | 660 | | 2,052 | | | | 2,712 | |
Rolls-Royce Holdings PLC (b) | | 14,154 | | 46,906 | | 61,060 | | 164 | | 544 | | | | 708 | |
Royal Bank of Scotland Group PLC (b) | | 107,782 | | 404,465 | | 512,247 | | 34 | | 127 | | | | 161 | |
Royal Dutch Shell PLC Class A | | 39,680 | | 136,182 | | 175,862 | | 1,461 | | 5,015 | | | | 6,476 | |
Royal Dutch Shell PLC Class B | | 26,821 | | 96,049 | | 122,870 | | 1,022 | | 3,661 | | | | 4,683 | |
RSA Insurance Group PLC | | 27,792 | | 88,836 | | 116,628 | | 46 | | 145 | | | | 191 | |
Sage Group PLC (The) | | 20,512 | | 60,492 | | 81,004 | | 94 | | 276 | | | | 370 | |
Schroders PLC | | 1,714 | | 2,457 | | 4,171 | | 35 | | 50 | | | | 85 | |
Segro PLC REIT | | 8,784 | | 25,562 | | 34,346 | | 28 | | 83 | | | | 111 | |
Serco Group PLC | | 1,852 | | 5,810 | | 7,662 | | 13 | | 43 | | | | 56 | |
Severn Trent PLC | | 4,677 | | 15,300 | | 19,977 | | 109 | | 355 | | | | 464 | |
Smith & Nephew PLC | | 17,251 | | 102,037 | | 119,288 | | 168 | | 991 | | | | 1,159 | |
Smiths Group PLC | | 3,015 | | 10,326 | | 13,341 | | 43 | | 147 | | | | 190 | |
B-29
Security Description | | MS
International
Fund
Shares | | MSIF Active
International
Al location
Shares | | Pro Forma
Shares | | MS
International
Fund
(000) | | MSIF Active
International
Allocation
(000) | | Adjustments | | Pro Forma
Value
(000) | |
SSE PLC | | 13,950 | | 46,176 | | 60,126 | | 279 | | 926 | | | | 1,205 | |
Standard Chartered PLC | | 19,325 | | 64,310 | | 83,635 | | 423 | | 1,407 | | | | 1,830 | |
Standard Life PLC | | 15,153 | | 44,995 | | 60,148 | | 49 | | 144 | | | | 193 | |
Tesco PLC | | 73,147 | | 260,101 | | 333,248 | | 458 | | 1,630 | | | | 2,088 | |
Tullow Oil PLC | | 557 | | — | | 557 | | 12 | | — | | | | 12 | |
TUI Travel PLC | | 9,530 | | — | | 9,530 | | 25 | | — | | | | 25 | |
Unilever PLC | | 14,443 | | 36,785 | | 51,228 | | 485 | | 1,236 | | | | 1,721 | |
United Utilities Group PLC | | 1,972 | | 6,703 | | 8,675 | | 19 | | 63 | | | | 82 | |
Vodafone Group PLC | | 656,080 | | 2,444,465 | | 3,100,545 | | 1,823 | | 6,791 | | | | 8,614 | |
Whitbread PLC | | 2,883 | | 8,223 | | 11,106 | | 70 | | 200 | | | | 270 | |
Wolseley PLC | | 676 | | 1,711 | | 2,387 | | 22 | | 57 | | | | 79 | |
WPP PLC | | 49,043 | | 159,268 | | 208,311 | | 515 | | 1,670 | | | | 2,185 | |
Xstrata PLC | | 12,598 | | 40,712 | | 53,310 | | 192 | | 618 | | | | 810 | |
| | | | | | | | 20,574 | | 68,078 | | | | 88,652 | |
United States (0.2%) | | | | | | | | | | | | | | | |
Lend Lease Group REIT (Stapled Securities)(c)(d) | | 1,774 | | 5,983 | | 7,757 | | 13 | | 44 | | | | 57 | |
Tenaris SA (a) | | 7,773 | | 27,737 | | 35,510 | | 144 | | 512 | | | | 656 | |
| | | | | | | | 157 | | 556 | | | | 713 | |
Total Common Stocks (Cost $396,256) | | | | | | | | 82,195 | | 276,798 | | | | 358,993 | |
| | | | | | | | | | | | | | | |
| | | | | | | | | | | | | | | |
Short-Term Investments (19.1%) Securities held as Collateral on Loaned Securities (8.9%) Investment Company (6.5%) Morgan Stanley Institutional Liquidity Funds - Money Market Portfolio - Institutional Class (i) | | 5,335,751 | | 21,266,995 | | 26,602,746 | | 5,336 | | 21,267 | | | | 26,603 | |
| | | | | | | | | | | | | | | |
Repurchase Agreements (2.4%) | | | | | | | | | | | | | | | |
Barclays Capital, Inc. (0.02%, dated 12/30/11, due 1/3/12; proceeds $1,142; fully collateralized by a U.S. Government Obligation; U.S. Treasury Bond 4.50% due 5/15/38; valued at $1,165) | | 229,131 | | 913,262 | | 1,142,393 | | | 234 | | | 913 | | | | | 1,147 | |
Merrill Lynch & Co., Inc. (0.07%, dated 12/30/11, due 1/3/12; proceeds $8,486; fully collateralized by a U.S. Government Agency; Government National Mortgage Association 3.50% due 11/20/41; valued at $8,656) | | 1,702,119 | | 6,784,230 | | 8,486,349 | | 1,736 | | 6,784 | | | | 8,520 | |
Total Repurchase Agreements (Cost $9,628,743) | | | | | | | | 1,970 | | 7,697 | | | | 9,667 | |
Total Securities held as Collateral on Loaned Securities (Cost $36,231) | | | | | | | | 7,306 | | 28,964 | | | | 36,270 | |
| | | | | | | | | | | | | | | | | | |
B-30
Security Description | | MS
International
Fund
Shares | | MSIF Active
International
Al location
Shares | | Pro Forma
Shares | | MS
International
Fund
(000) | | MSIF Active
International
Allocation
(000) | | Adjustments | | Pro Forma
Value
(000) | |
Investment Company (10.2%) | | | | | | | | | | | | | | | |
Morgan Stanley Institutional Liquidity Funds - Money Market Portfolio - Institutional Class (i) | | 11,587,262 | | 29,780,274 | | 41,367,536 | | 11,587 | | 29,780 | | | | 41,367 | |
Total Short-Term Investments (Cost $77,599) | | | | | | | | 18,893 | | 58,744 | | | | 77,637 | |
| | | | | | | | | | | | | | | |
Total Investments (107.3%) (Cost $473,855) including $35,234 of Securities Loaned (h) | | | | | | | | 101,088 | | 335,542 | | | | 436,630 | |
Liabilities in Excess of Other Assets (-7.3%) | | | | | | | | (6,370 | ) | (23,107 | ) | (392 | ) | (29,869 | ) |
Net Assets (100%) | | | | | | | | $ | 94,718 | | $ | 312,435 | | $ | (392 | ) | $ | 406,761 | |
| | | | | | | | | | | | | | | | | | | |
Percentages indicated are based on net assets.
B-31
Foreign Currency Exchange Contract Information
The Portfolio had the following foreign currency exchange contract(s) open at period end:
| | | | | | | | | | | | | | | | | | | | | | | | | | | | | | | | | | | | | | | |
| | MS International | | MSIF Active
International
Allocation | | Combined Pro
Forma | | MS
International | | MSIF Active
International
Allocation | | Combined
Pro
Forma | | | | MS International | | MSIF Active
International
Allocation | | Combined
ProForma | | MS
International | | MSIF Active
International
Allocation | | Combined
Pro
Forma | | MS
International | | MSIF Active
International
Allocation | | Combined Pro
Forma | |
Counterparty | | Currency to
Deliver
(000) | | Currency to
Deliver
(000) | | Currency to
Deliver
(000) | | Value
(000) | | Value
(000) | | Value
(000) | | Settlement
Date | | In Exchange
For
(000) | | In Exchange
For
(000) | | In Exchange
For
(000) | | Value
(000) | | Value
(000) | | Value
(000) | | Unrealized
Appreciation /
(Depreciation)
(000) | | Unrealized
Appreciation /
(Depreciation)
(000) | | Unrealized
Appreciation /
(Depreciation)
(000) | |
Credit Suisse London Branch (GFX) | | | | USD | 1,689 | | USD | 1,689 | | | | 1,689 | | 1,689 | | 1/19/2012 | | | | CHF | 1,571 | | CHF | 1,571 | | | | 1,674 | | 1,674 | | | | (15 | ) | (15 | ) |
Credit Suisse London Branch (GFX) | | | | USD | 2,694 | | USD | 2,694 | | | | 2,694 | | 2,694 | | 1/19/2012 | | | | EUR | 2,056 | | EUR | 2,056 | | | | 2,662 | | 2,662 | | | | (32 | ) | (32 | ) |
Deutsche Bank AG London | | | | EUR | 2,637 | | EUR | 2,637 | | | | 3,413 | | 3,413 | | 1/19/2012 | | | | USD | 3,423 | | USD | 3,423 | | | | 3,423 | | 3,423 | | | | 10 | | 10 | |
Deutsche Bank AG London | | | | GBP | 1,231 | | GBP | 1,231 | | | | 1,911 | | 1,911 | | 1/19/2012 | | | | USD | 1,912 | | USD | 1,912 | | | | 1,912 | | 1,912 | | | | 1 | | 1 | |
Deutsche Bank AG London | | | | USD | 2,652 | | USD | 2,652 | | | | 2,652 | | 2,652 | | 1/19/2012 | | | | EUR | 2,024 | | EUR | 2,024 | | | | 2,621 | | 2,621 | | | | (31 | ) | (31 | ) |
Deutsche Bank AG London | | | | USD | 2,831 | | USD | 2,831 | | | | 2,831 | | 2,831 | | 1/19/2012 | | | | EUR | 2,164 | | EUR | 2,164 | | | | 2,801 | | 2,801 | | | | (30 | ) | (30 | ) |
Goldman Sachs International | | | | USD | 1,767 | | USD | 1,767 | | | | 1,767 | | 1,767 | | 1/19/2012 | | | | EUR | 1,350 | | EUR | 1,350 | | | | 1,746 | | 1,746 | | | | (21 | ) | (21 | ) |
JPMorgan Chase Bank | | | | USD | 5,509 | | USD | 5,509 | | | | 5,509 | | 5,509 | | 1/19/2012 | | | | EUR | 4,206 | | EUR | 4,206 | | | | 5,445 | | 5,445 | | | | (64 | ) | (64 | ) |
Mellon Bank | | | | AUD | 5,638 | | AUD | 5,638 | | | | 5,756 | | 5,756 | | 1/19/2012 | | | | USD | 5,601 | | USD | 5,601 | | | | 5,601 | | 5,601 | | | | (155 | ) | (155 | ) |
Mellon Bank | | | | USD | 14,721 | | USD | 14,721 | | | | 14,721 | | 14,721 | | 1/19/2012 | | | | AUD | 14,657 | | AUD | 14,657 | | | | 14,966 | | 14,966 | | | | 245 | | 245 | |
Mellon Bank | | | | USD | 4,529 | | USD | 4,529 | | | | 4,529 | | 4,529 | | 1/19/2012 | | | | EUR | 3,458 | | EUR | 3,458 | | | | 4,475 | | 4,475 | | | | (54 | ) | (54 | ) |
Royal Bank of Scotland | | | | JPY | 737,774 | | JPY | 737,774 | | | | 9,587 | | 9,587 | | 1/19/2012 | | | | USD | 9,459 | | USD | 9,459 | | | | 9,459 | | 9,459 | | | | (128 | ) | (128 | ) |
Royal Bank of Scotland | | | | USD | 6,717 | | USD | 6,717 | | | | 6,717 | | 6,717 | | 1/19/2012 | | | | JPY | 522,342 | | JPY | 522,342 | | | | 6,788 | | 6,788 | | | | 71 | | 71 | |
State Street Bank and Trust Co. | | | | USD | 6,601 | | USD | 6,601 | | | | 6,601 | | 6,601 | | 1/19/2012 | | | | GBP | 4,250 | | GBP | 4,250 | | | | 6,599 | | 6,599 | | | | (2 | ) | (2 | ) |
UBS AG | | | | CHF | 1,450 | | CHF | 1,450 | | | | 1,544 | | 1,544 | | 1/19/2012 | | | | USD | 1,541 | | USD | 1,541 | | | | 1,541 | | 1,541 | | | | (3 | ) | (3 | ) |
UBS AG | | | | CHF | 725 | | CHF | 725 | | | | 772 | | 772 | | 1/19/2012 | | | | USD | 775 | | USD | 775 | | | | 775 | | 775 | | | | 3 | | 3 | |
UBS AG | | | | GBP | 6,932 | | GBP | 6,932 | | | | 10,765 | | 10,765 | | 1/19/2012 | | | | USD | 10,768 | | USD | 10,768 | | | | 10,768 | | 10,768 | | | | 3 | | 3 | |
UBS AG | | | | USD | 5,335 | | USD | 5,335 | | | | 5,335 | | 5,335 | | 1/19/2012 | | | | EUR | 4,073 | | EUR | 4,073 | | | | 5,272 | | 5,272 | | | | (63 | ) | (63 | ) |
Royal Bank of Scotland | | JPY | 181,846 | | | | JPY | 181,846 | | 2,363 | | | | 2,363 | | 1/19/2012 | | USD | 2,332 | | | | USD | 2,332 | | 2,332 | | | | 2,332 | | (31 | ) | | | (31 | ) |
Deutsche Bank AG London | | USD | 906 | | | | USD | 906 | | 906 | | | | 906 | | 1/19/2012 | | EUR | 692 | | | | EUR | 692 | | 896 | | | | 896 | | (10 | ) | | | (10 | ) |
Royal Bank of Scotland | | USD | 277 | | | | USD | 277 | | 277 | | | | 277 | | 1/19/2012 | | EUR | 211 | | | | EUR | 211 | | 274 | | | | 274 | | (3 | ) | | | (3 | ) |
JPMorgan Chase Bank | | USD | 772 | | | | USD | 772 | | 772 | | | | 772 | | 1/19/2012 | | EUR | 590 | | | | EUR | 590 | | 763 | | | | 763 | | (9 | ) | | | (9 | ) |
Mellon Bank | | USD | 4,888 | | | | USD | 4,888 | | 4,888 | | | | 4,888 | | 1/19/2012 | | AUD | 4,867 | | | | AUD | 4,867 | | 4,970 | | | | 4,970 | | 82 | | | | 82 | |
Mellon Bank | | USD | 1,231 | | | | USD | 1,231 | | 1,231 | | | | 1,231 | | 1/19/2012 | | EUR | 940 | | | | EUR | 940 | | 1,216 | | | | 1,216 | | (15 | ) | | | (15 | ) |
Deutsche Bank AG London | | USD | 2,523 | | | | USD | 2,523 | | 2,523 | | | | 2,523 | | 1/19/2012 | | EUR | 1,926 | | | | EUR | 1,926 | | 2,493 | | | | 2,493 | | (30 | ) | | | (30 | ) |
Royal Bank of Scotland | | USD | 2,275 | | | | USD | 2,275 | | 2,275 | | | | 2,275 | | 1/19/2012 | | JPY | 176,900 | | | | JPY | 176,900 | | 2,299 | | | | 2,299 | | 24 | | | | 24 | |
Credit Suisse London Branch (GFX) | | USD | 1,886 | | | | USD | 1,886 | | 1,886 | | | | 1,886 | | 1/19/2012 | | EUR | 1,440 | | | | EUR | 1,440 | | 1,864 | | | | 1,864 | | (22 | ) | | | (22 | ) |
UBS AG | | USD | 990 | | | | USD | 990 | | 990 | | | | 990 | | 1/19/2012 | | EUR | 756 | | | | EUR | 756 | | 978 | | | | 978 | | (12 | ) | | | (12 | ) |
Deutsche Bank AG London | | EUR | 1,049 | | | | EUR | 1,049 | | 1,358 | | | | 1,358 | | 1/19/2012 | | USD | 1,362 | | | | USD | 1,362 | | 1,362 | | | | 1,362 | | 4 | | | | 4 | |
Mellon Bank | | AUD | 1,872 | | | | AUD | 1,872 | | 1,911 | | | | 1,911 | | 1/19/2012 | | USD | 1,860 | | | | USD | 1,860 | | 1,860 | | | | 1,860 | | (51 | ) | | | (51 | ) |
Deutsche Bank AG London | | GBP | 376 | | | | GBP | 376 | | 584 | | | | 584 | | 1/19/2012 | | USD | 584 | | | | USD | 584 | | 584 | | | | 584 | | — | | | | — | |
UBS AG | | GBP | 455 | | | | GBP | 455 | | 706 | | | | 706 | | 1/19/2012 | | USD | 706 | | | | USD | 706 | | 706 | | | | 706 | | — | | | | — | |
UBS AG | | CHF | 729 | | | | CHF | 729 | | 777 | | | | 777 | | 1/19/2012 | | USD | 775 | | | | USD | 775 | | 775 | | | | 775 | | (2 | ) | | | (2 | ) |
Credit Suisse London Branch (GFX) | | USD | 554 | | | | USD | 554 | | 554 | | | | 554 | | 1/19/2012 | | CHF | 515 | | | | CHF | 515 | | 549 | | | | 549 | | (5 | ) | | | (5 | ) |
| | | | | | | | | | 24,001 | | 88,793 | | 112,794 | | | | | | | | | | | | 23,921 | | 88,528 | | 112,449 | | (80 | ) | (265 | ) | (345 | ) |
AUD - Australian Dollar
CHF - Swiss Franc
EUR - Euro Currency
GBP - British Pound
JPY - Japanese Yen
USD - United States Dollar
B-32
Futures Contract Information
The Portfolio had the following futures contract(s) open at period end:
| | | | MSIF Active | | Combined | | | | MSIF Active | | | | | | MS
International | | MSIF Active
International
Allocation | | Combined Pro
Forma | |
| | MS
International | | International
Allocation | | Pro
Forma | | MS
International | | International
Allocation | | Combined Pro
Forma | | Unrealized
Appreciation | | Unrealized
Appreciation | | Unrealized
Appreciation | |
| | Number of
Contracts | | Number of
Contracts | | Number of
Contracts | | Value
(000) | | Value
(000) | | Value
(000) | | Settlement
Date | | (Depreciation)
(000) | | (Depreciation)
(000) | | (Depreciation)
(000) | |
Long: | | | | | | | | | | | | | | | | | | | | | |
ASX Spi 200 Index (Australia) | | 14 | | 19 | | 33 | | 1,443 | | 1,958 | | 3,401 | | Mar-12 | | (66 | ) | (86 | ) | (152 | ) |
DAX Index (Germany) | | 11 | | 7 | | 18 | | 2,103 | | 1,338 | | 3,441 | | Mar-12 | | 3 | | 2 | | 5 | |
FTSE 100 Index (United Kingdom) | | 24 | | 78 | | 102 | | 2,061 | | 6,697 | | 8,758 | | Mar-12 | | 46 | | 149 | | 195 | |
Hang Seng China ENT Index (Hong Kong) | | 17 | | 57 | | 74 | | 2,020 | | 6,772 | | 8,792 | | Jan-12 | | (18 | ) | (62 | ) | (80 | ) |
IBEX 35 Index (Spain) | | — | | 27 | | 27 | | — | | 2,966 | | 2,966 | | Jan-12 | | — | | 29 | | 29 | |
TOPIX Index (Japan) | | 25 | | 74 | | 99 | | 2,364 | | 6,998 | | 9,362 | | Mar-12 | | (56 | ) | (166 | ) | (222 | ) |
Short: | | | | | | | | | | | | | | | | | | | | | |
Euro STOXX 50 Index (Germany) | | 33 | | 8 | | 41 | | 987 | | (239 | ) | 748 | | Mar-12 | | (40 | ) | (10 | ) | (50 | ) |
| | | | | | | | | | | | | | | | $ | (131 | ) | $ | (144 | ) | $ | (275 | ) |
| | | | | | | | | | | | | | | | | | | | | | | | |
B-33
NOTES TO SCHEDULE OF PORTFOLIO INVESTMENTS:
(a) | All or a portion of this security was on loan at December 31, 2011. |
(b) | Non-income producing security. |
(c) | Comprised of securities in separate entities that are traded as a single stapled security. |
(d) | Consists of one or more classes of securities traded together as a unit; stocks with attached warrants. |
(e) | Security trades on the Hong Kong exchange. |
(f) | At December 31, 2011, the Portfolio held a fair valued security valued at $0, representing 0.0% of net assets. This security has been fair valued as determined in good faith under procedures established by and under the general supervision of the Fund’s Directors. |
(g) | 144A security — Certain conditions for public sale may exist. Unless otherwise noted, these securities are deemed to be liquid. |
(h) | Securities are available for collateral in connection with open foreign currency exchange and futures contracts. |
@ | Value is less than $500. |
ADR | American Depositary Receipt. |
CDI | CHESS Depositary Interest. |
CVA | Certificaten Van Aandelen. |
GDR | Global Depositary Receipt. |
REIT | Real Estate Investment Trust. |
SDR | Swedish Depositary Receipt. |
WPR | Verminderde Voorheffing Précompte Réduit. |
As of December 31, 2011, the gross unrealized appreciation (depreciation) of investments based on the aggregate cost of investments for federal income tax purposes was as follows:
| | MS International | | MSIF Active
International
Allocation | | Combined Pro
Forma | |
| | (000) | | (000) | | (000) | |
Aggregate gross unrealized appreciation | | $ | 8,839 | | $ | 26,271 | | $ | 35,110 | |
| | | | | | | |
Aggregate gross unrealized depreciation | | (13,800 | ) | (66,642 | ) | (80,442 | ) |
| | | | | | | |
Net unrealized appreciation (depreciation) | | $ | (4,961 | ) | $ | (40,371 | ) | $ | (45,332 | ) |
Federal income tax cost of investments | | $ | 106,049 | | $ | 375,913 | | $ | 481,962 | |
B-34
Fair Value Measurement: FASB ASC 820, “Fair Value Measurements and Disclosures” (“ASC 820”), defines fair value as the value that the Fund would receive to sell an investment or pay to transfer a liability in a timely transaction with an independent buyer in the principal market, or in the absence of a principal market the most advantageous market for the investment or liability. ASC 820 establishes a three-tier hierarchy to distinguish between (1) inputs that reflect the assumptions market participants would use in valuing an asset or liability developed based on market data obtained from sources independent of the reporting entity (observable inputs) and (2) inputs that reflect the reporting entity’s own assumptions about the assumptions market participants would use in valuing an asset or liability developed based on the best information available in the circumstances (unobservable inputs) and to establish classification of fair value measurements for disclosure purposes. Various inputs are used in determining the value of the Fund’s investments. The inputs are summarized in the three broad levels listed below.
· Level 1 — unadjusted quoted prices in active markets for identical investments
· Level 2 — other significant observable inputs (including quoted prices for similar investments, interest rates, prepayment speeds, credit risk, etc.)
· Level 3 — significant unobservable inputs including the Fund’s own assumptions in determining the fair value of investments. Factors considered in making this determination may include, but are not limited to, information obtained by contactingthe issuer, analysts, or the appropriate stock exchange (for exchange-traded securities), analysis of the issuer’s financial statements or other available documents and, if necessary, available information concerning other securities in similar circumstances
The inputs or methodology used for valuing securities are not necessarily an indication of the risk associated with investing in those securities and the determination of the significance of a particular input to the fair value measurement in its entirety requires judgment and considers factors specific to each security.
In May 2011, FASB issued Accounting Standards Update (“ASU”) 2011-04. The amendments in this update are the results of the work of FASB and the International Accounting Standards Board to develop common requirements for measuring fair value and for disclosing information about fair value measurements, which are effective during interim and annual periods beginning after December 15, 2011. Consequently, these amendments improve the comparability of fair value measurements presented and disclosed in the financial statements prepared in accordance with GAAP and International Financial Reporting Standards. At this time, the Fund’s management is evaluating the implications of ASU 2011-04.
The following is a summary of the inputs used to value the Portfolio’s investments as of December 31, 2011.
| | MS International | | MSIF Active International Allocation | | Combined Pro Forma | |
Portfolios | | (000) | | (000) | | (000) | |
Investments in Securities (Level 1) (000) | | $ | 99,039 | | $ | 327,845 | | $ | 426,884 | |
Investments in Securities (Level 2) (000) | | 2,049 | | 7,697 | | 9,746 | |
Investments in Securities (Level 3) (000) | | — | | — | | — | |
Total for Investments in Securities (000) | | 101,088 | | 335,542 | | 436,630 | |
Other Financial Instruments* (Level 1) (000) | | (131 | ) | (144 | ) | (275 | ) |
Other Financial Instruments* (Level 2) (000) | | (80 | ) | (265 | ) | (345 | ) |
Other Financial Instruments* (Level 3) (000) | | — | | — | | — | |
Total for Other Financial Instruments (000) | | $ | (211 | ) | $ | (409 | ) | $ | (620 | ) |
* Other financial instruments include futures and forwards.
At December 31, 2011 there were no Level 3 investments in MS International Fund for which significant unobservable inputs were used to determine fair value. The following is a reconciliation of MSIF Active International Allocation investments in which significant unobservable inputs (Level 3) were used in determining fair value.
| | Common
Stocks
(000) | |
Beginning Balance | | $ | — | † |
Purchases | | — | |
Sales | | — | ‡ |
Amortization of discount | | — | |
Transfers in | | — | |
Transfers out | | — | |
Change in unrealized appreciation (depreciation) | | — | |
Realized gains (losses) | | — | |
Ending Balance | | $ | — | † |
Net change in unrealized appreciation/depreciation from investments still held as of December 31, 2011 | | $ | — | |
† Includes one or more securities which are valued at zero.
‡ Includes one or more securities with proceeds from sales of zero.
B-35
Security Valuation: Securities listed on a foreign exchange are valued at their closing price. Unlisted securities and listed securities not traded on the valuation date for which market quotations are readily available are valued at the mean between the current bid and ask prices. Equity securities listed on a U.S. exchange are valued at the latest quoted sales price on the valuation date. Equity securities listed or traded on NASDAQ, for which market quotations are available, are valued at the NASDAQ Official Closing Price. Bonds and other fixed income securities may be valued according to the broadest and most representative market. In addition, bonds and other fixed income securities may be valued on the basis of prices provided by a pricing service. The prices provided by a pricing service take into account broker dealer market price quotations for institutional size trading in similar groups of securities, security quality, maturity, coupon and other security characteristics as well as any developments related to the specific securities. Short-term debt securities purchased with remaining maturities of 60 days or less are valued at amortized cost, unless the Board of Directors (the “Directors”) determines such valuation does not reflect the securities’ fair value, in which case these securities will be valued at their fair value as determined in good faith under procedures adopted by the Directors.
All other securities and investments for which market values are not readily available, including restricted securities, and those securities for which it is inappropriate to determine prices in accordance with the aforementioned procedures, are valued at fair value as determined in good faith under procedures adopted by the Directors, although the actual calculations may be done by others. Factors considered in making this determination may include, but are not limited to, information obtained by contacting the issuer, analysts, or the appropriate stock exchange (for exchange-traded securities), analysis of the issuer’s financial statements or other available documents and, if necessary, available information concerning other securities in similar circumstances.
Most foreign markets close before the New York Stock Exchange (“NYSE”). Occasionally, developments that could affect the closing prices of securities and other assets may occur between the times at which valuations of such securities are determined (that is, close of the foreign market on which the securities trade) and the close of business on the NYSE. If these developments are expected to materially affect the value of the securities, the valuations may be adjusted to reflect the estimated fair value as of the close of the NYSE, as determined in good faith under procedures established by the Directors.
B-36
Statement of Additional Information Supplement
May 17, 2012
Morgan Stanley Institutional Fund, Inc.
Supplement dated May 17, 2012 to the Morgan Stanley Institutional Fund, Inc. Statement of Additional Information dated April 30, 2012
Effective immediately, Munib Madni and Samuel Rhee have been added to the teams primarily responsible for the day-to-day management of each of the Asian Equity Portfolio and the Emerging Markets Portfolio. Accordingly, effective immediately, the Statement of Additional Information is revised as follows:
The section of the Statement of Additional Information entitled "Investment Advisory and Other Services—Portfolio Managers—Other Accounts Managed by the Portfolio Managers at December 31, 2011 (unless otherwise indicated)—Asian Equity" is hereby deleted and replaced with the following:
| | | Registered Investment
Companies | | Other Pooled
Investment Vehicles | | Other Accounts | |
| Portfolio Managers | | Number of
Accounts | | Total Assets
in the Accounts | | Number of
Accounts | | Total Assets
in the Accounts | | Number of
Accounts | | Total Assets
in the Accounts | |
| James Cheng | | | 12 | | | $4.2 billion | | | 7 | | | $2.6 billion | | | 26 | (2) | | $10.9 billion(2) | |
| Munib Madni* | | | 2 | | | $335.6 million | | | 5 | | | $2.6 billion | | | 25 | (8) | | $11.4 billion(8) | |
| Samuel Rhee* | | | 0 | | | $0 | | | 2 | | | $129.3 million | | | 7 | | | $7.0 billion | |
* As of March 31, 2012
(2) Of these other accounts, three accounts with a total of approximately $1.5 billion in assets, had performance-based fees.
(8) Of these other accounts, two accounts with a total of approximately $913.4 million in assets, had performance-based fees.
The section of the Statement of Additional Information entitled "Investment Advisory and Other Services—Portfolio Managers—Other Accounts Managed by the Portfolio Managers at December 31, 2011 (unless otherwise indicated)—Emerging Markets" is hereby deleted and replaced with the following:
| | | Registered Investment
Companies | | Other Pooled
Investment Vehicles | | Other Accounts | |
| Portfolio Managers | | Number of
Accounts | | Total Assets
in the Accounts | | Number of
Accounts | | Total Assets
in the Accounts | | Number of
Accounts | | Total Assets
in the Accounts | |
| Eric Carlson | | | 7 | | | $2.7 billion | | | 5 | | | $2.6 billion | | | 19 | (2) | | $4.7 billion(2) | |
| James Cheng | | | 12 | | | $4.2 billion | | | 7 | | | $2.6 billion | | | 26 | (2) | | $10.9 billion(2) | |
| Munib Madni* | | | 2 | | | $335.6 million | | | 5 | | | $2.6 billion | | | 25 | (8) | | $11.4 billion(8) | |
Ana Cristina
Piedrahita | | | 7 | | | $2.9 billion | | | 6 | | | $3.2 billion | | | 21 | (3) | | $6.7 billion(3) | |
| Paul C. Psaila | | | 8 | | | $3.0 billion | | | 5 | | | $2.6 billion | | | 19 | (2) | | $4.7 billion(2) | |
| Samuel Rhee* | | | 0 | | | $0 | | | 2 | | | $129.3 million | | | 7 | | | $7.0 billion | |
| Ruchir Sharma | | | 10 | | | $3.5 billion | | | 7 | | | $3.6 billion | | | 19 | (2) | | $4.7 billion(2) | |
* As of March 31, 2012
(2) Of these other accounts, three accounts with a total of approximately $1.5 billion in assets, had performance-based fees.
(3) Of these other accounts, four accounts with a total of approximately $3.5 billion in assets, had performance-based fees.
(8) Of these other accounts, two accounts with a total of approximately $913.4 million in assets, had performance-based fees.
The section of the Statement of Additional Information entitled "Investment Advisory and Other Services—Portfolio Managers—Securities Ownership of Portfolio Managers (as of December 31, 2011, unless otherwise noted)—Asian Equity" is hereby deleted and replaced with the following:
| Portfolio and Portfolio Managers | | Portfolio Holdings | |
| James Cheng | | None | |
| Munib Madni** | | $50,001-$100,000 | |
| Samuel Rhee** | | $100,001-$500,000 | |
** As of March 31, 2012.
The section of the Statement of Additional Information entitled "Investment Advisory and Other Services—Portfolio Managers—Securities Ownership of Portfolio Managers (as of December 31, 2011, unless otherwise noted)—Emerging Markets" is hereby deleted and replaced with the following:
| Portfolio and Portfolio Managers | | Portfolio Holdings | |
| Eric Carlson | | $100,000-$500,000 | |
| James Cheng | | None | |
| Munib Madni** | | $100,001-$500,000 | |
| Ana Cristina Piedrahita | | $50,001-$100,000 | |
| Paul C. Psaila | | $100,001-$500,000 | |
| Samuel Rhee** | | $100,001-$500,000 | |
| Ruchir Sharma | | Over $1 million | |
** As of March 31, 2012.
***
Effective December 31, 2012, James Cheng will retire from his position as portfolio manager of each of the Asian Equity Portfolio and the Emerging Markets Portfolio. As a result, effective December 31, 2012, all references to Mr. Cheng are hereby deleted from the Statement of Additional Information.
Please retain this supplement for future reference.
MORGAN STANLEY INSTITUTIONAL FUND, INC.
522 Fifth Ave.
New York, NY 10036
STATEMENT OF ADDITIONAL INFORMATION
April 30, 2012
Morgan Stanley Institutional Fund, Inc. (the "Fund") is a mutual fund consisting of 23 portfolios offering a variety of investment alternatives, 23 of which are included in this Statement of Additional Information ("SAI") (each a "Portfolio" and collectively the "Portfolios"). Each Portfolio (except the Global Insight and Insight Portfolios) offers Class I, Class P, Class H and Class L shares. The Global Insight and Insight Portfolios each offer Class I, Class H and Class L shares. Following is a list of the 23 Portfolios included in this SAI:
| | | Share Class and Ticker Symbol | |
| | | Class I | | Class P | | Class H | | Class L | |
| GLOBAL AND INTERNATIONAL EQUITY PORTFOLIOS: | |
| Active International Allocation Portfolio | | MSACX | | MSIBX | | MSAHX | | MSLLX | |
| Asian Equity Portfolio | | MEQIX | | MEQPX | | MEQHX | | MEQLX | |
| Emerging Markets Portfolio | | MGEMX | | MMKBX | | MSMHX | | MSELX | |
| Global Advantage Portfolio | | MIGIX | | MIGPX | | MGAHX | | MIGLX | |
| Global Discovery Portfolio | | MLDIX | | MGDPX | | MGDHX | | MGDLX | |
| Global Franchise Portfolio | | MSFAX | | MSFBX | | MSIHX | | MSFLX | |
| Global Insight Portfolio | | MBPIX | | | — | | | MBPHX | | MBPLX | |
| Global Opportunity Portfolio | | MGGIX | | MGGPX | | MGGHX | | MGGLX | |
| Global Real Estate Portfolio | | MRLAX | | MRLBX | | MSRHX | | MGRLX | |
| International Advantage Portfolio | | MFAIX | | MFAPX | | MFAHX | | MSALX | |
| International Equity Portfolio | | MSIQX | | MIQBX | | MSQHX | | MSQLX | |
| International Opportunity Portfolio | | MIOIX | | MIOPX | | MIOHX | | MIOLX | |
| International Real Estate Portfolio | | MSUAX | | IERBX | | MSTHX | | MSOLX | |
| International Small Cap Portfolio | | MSISX | | MSCPX | | MSCHX | | MSNLX | |
| Select Global Infrastructure Portfolio | | MTIIX | | MTIPX | | MTIHX | | MTILX | |
| U.S. EQUITY PORTFOLIOS: | |
| Advantage Portfolio | | MPAIX | | MAPPX | | MAPHX | | MAPLX | |
| Focus Growth Portfolio | | MSAGX | | MAEBX | | MSWHX | | MSWLX | |
| Growth Portfolio | | MSEQX | | MSEGX | | MSHHX | | MSHLX | |
| Insight Portfolio | | MFPIX | | | — | | | MFPHX | | MFPLX | |
| Opportunity Portfolio | | MGEIX | | MEGPX | | MEGHX | | MGELX | |
| Small Company Growth Portfolio* | | MSSGX | | MSSMX | | MSSHX | | MSSLX | |
| U.S. Real Estate Portfolio | | MSUSX | | MUSDX | | MSUHX | | MSULX | |
| FIXED INCOME PORTFOLIO: | |
Emerging Markets Domestic Debt Portfolio
(formerly Emerging Markets Debt Portfolio) | | MSIEX | | IEDBX | | MSEHX | | MEDLX | |
* Portfolio is currently closed to new investors.
This SAI is not a prospectus, but should be read in conjunction with the Portfolios' prospectuses, each dated April 30, 2012, as may be supplemented from time to time. To obtain any of these prospectuses, please call the Fund toll-free at 1-800-548-7786.
The Fund's most recent Annual Report to Shareholders is a separate document supplied with this SAI and includes the Fund's audited financial statements, including notes thereto, and the report of Ernst & Young LLP, which are incorporated by reference into this SAI.
Certain Portfolios are "non-diversified" and, as such, such Portfolios' investments are not required to meet certain diversification requirements under federal securities law. Compared with "diversified" funds or portfolios, each such Portfolio may invest a greater percentage of its assets in the securities of an individual corporation or governmental entity. Thus, the Portfolio's assets may be concentrated in fewer securities than other funds. A decline in the value of those investments would cause the Portfolio's overall value to decline to a greater degree. The Emerging Markets Domestic Debt, Focus Growth, Global Discovery, Global Franchise, Global Real Estate, International Real Estate, Select Global Infrastructure and U.S. Real Estate Portfolios are non-diversified portfolios.
1
| Table of Contents | | Page | |
| Investment Policies and Strategies | | 2 | |
|
| Investment Limitations | | 35 | |
|
| Disclosure of Portfolio Holdings | | 38 | |
|
| Purchase of Shares | | 41 | |
|
| Redemption of Shares | | 43 | |
|
| Account Policies and Features | | 44 | |
|
| Management of the Fund | | 45 | |
|
| Investment Advisory and Other Services | | 57 | |
|
| Distribution and Shareholder Services Plans | | 67 | |
|
| Brokerage Practices | | 70 | |
|
| General Information | | 74 | |
|
| Taxes | | 75 | |
|
| Control Persons and Principal Holders of Securities | | 80 | |
|
| Performance Information | | 92 | |
|
| Financial Statements | | 96 | |
|
| Appendix A Morgan Stanley Investment Management Proxy Voting Policy and Procedures | | A-1 | |
|
| Appendix B Description of Ratings | | B-1 | |
|
INVESTMENT POLICIES AND STRATEGIES
This SAI provides additional information about the investment policies and operations of the Fund and its Portfolios. Morgan Stanley Investment Management Inc. (the "Adviser") acts as investment adviser to each Portfolio. Under the supervision of the Adviser, Morgan Stanley Investment Management Limited ("MSIM Limited") acts as investment sub-adviser to the Emerging Markets, Global Franchise, Global Real Estate, International Equity, International Real Estate, International Small Cap and Select Global Infrastructure Portfolios; Morgan Stanley Investment Management Company ("MSIM Company") acts as investment sub-adviser to the Asian Equity, Emerging Markets, Global Franchise, Global Real Estate, International Equity, International Real Estate and Select Global Infrastructure Portfolios (MSIM Limited and MSIM Company are each referred to herein individually as the "Sub-Adviser" and together as the "Sub-Advisers"). References to the Adviser, when used in connection with its activities as investment adviser, include any Sub-Adviser acting under its supervision.
The following tables summarize the permissible strategies and investments for each Portfolio. These tables should be used in conjunction with the investment summaries for each Portfolio contained in the Prospectus in order to provide a more complete description of such Portfolio's investment policies. More details about each investment and related risks are provided in the discussion following the tables.
2
GLOBAL AND INTERNATIONAL EQUITY PORTFOLIOS
| | | Active International Allocation | | Asian Equity | | Emerging Markets | | Global Advantage | | Global Discovery | | Global Franchise | | Global Insight | | Global Opportunity | | Global Real Estate | | International Advantage | | International Equity | | International Opportunity | | International Real Estate | | International Small Cap | | Select Global Infrastructure | |
| Equity Securities: | |
|
| Common Stocks | | a | | a | | a | | a | | a | | a | | a | | a | | a | | a | | a | | a | | a | | a | | a | |
|
| Depositary Receipts | | a | | a | | a | | a | | a | | a | | a | | a | | a | | a | | a | | a | | a | | a | | a | |
|
| Preferred Stocks | | a | | a | | a | | a | | a | | a | | a | | a | | a | | a | | a | | a | | a | | a | | a | |
|
| Rights | | a | | a | | a | | a | | a | | a | | a | | a | | a | | a | | a | | a | | a | | a | | a | |
|
| Warrants | | a | | a | | a | | a | | a | | a | | a | | a | | a | | a | | a | | a | | a | | a | | a | |
|
| IPOs | | a | | a | | a | | a | | a | | a | | a | | a | | a | | a | | a | | a | | a | | a | | a | |
|
| Convertible Securities | | a | | a | | a | | a | | a | | a | | a | | a | | a | | a | | a | | a | | a | | a | | a | |
|
| Limited Partnerships | | a | | a | | a | | a | | a | | a | | a | | a | | a | | a | | a | | a | | a | | a | | a | |
|
| Investment Company Securities | | a | | a | | a | | a | | a | | a | | a | | a | | a | | a | | a | | a | | a | | a | | a | |
|
| Exchange-Traded Funds | | a | | a | | a | | a | | a | | a | | a | | a | | a | | a | | a | | a | | a | | a | | a | |
|
| Real Estate Investing | | a | | a | | a | | a | | a | | a | | a | | a | | a | | a | | a | | a | | a | | a | | a | |
|
| —REITs | | a | | a | | a | | a | | a | | a | | a | | a | | a | | a | | a | | a | | a | | a | | a | |
|
—Foreign Real Estate
Companies | | a | | a | | a | | a | | a | | a | | a | | a | | a | | a | | a | | a | | a | | a | | a | |
|
—Specialized Ownership
Vehicles | | a | | a | | a | | a | | a | | a | | a | | a | | a | | a | | a | | a | | a | | a | | a | |
|
| Fixed Income Securities: | |
|
| Investment Grade Securities | | a | | a | | a | | a | | a | | a | | a | | a | | a | | a | | a | | a | | a | | a | | a | |
|
| High Yield Securities | | | | a | | a | | | | | | | | | | | | | | | | | | | | | | | | a | |
|
| U.S. Government Securities | | a | | a | | a | | a | | a | | * | | a | | a | | a | | a | | * | | a | | a | | * | | a | |
|
| Agencies | | a | | a | | a | | a | | a | | * | | a | | a | | a | | a | | * | | a | | a | | * | | a | |
|
| Corporates | | a | | a | | a | | a | | a | | * | | a | | a | | a | | a | | * | | a | | a | | * | | a | |
|
| Money Market Instruments | | a | | a | | a | | a | | a | | a | | a | | a | | a | | a | | a | | a | | a | | a | | a | |
|
| Cash Equivalents | | a | | a | | a | | a | | a | | a | | a | | a | | a | | a | | a | | a | | a | | a | | a | |
|
| Mortgage Related Securities | | | | a | | | | a | | a | | | | a | | a | | | | a | | | | a | | | | | | a | |
|
| Repurchase Agreements | | a | | a | | a | | a | | a | | a | | a | | a | | a | | a | | a | | a | | a | | a | | a | |
|
| Municipals | | | | a | | | | | | | | | | | | | | | | | | | | | | | | | | a | |
|
| Asset-Backed Securities | | | | a | | | | | | | | | | | | | | | | | | | | | | | | | | a | |
|
Loan Participations and
Assignments | | | | a | | a | | | | | | | | | | | | | | | | | | | | | | | | a | |
|
| Temporary Investments | | a | | a | | a | | a | | a | | a | | a | | a | | a | | a | | a | | a | | a | | a | | a | |
|
Zero Coupons, Pay-In-Kind
Securities or Deferred
Payment Securities | | a | | a | | a | | a | | a | | | | a | | a | | a | | a | | | | a | | a | | | | a | |
|
| Floaters | | | | | | | | | | | | | | | | | | | | | | | | | | | | | | | |
|
| Inverse Floaters | | | | | | | | | | | | | | | | | | | | | | | | | | | | | | | |
|
Eurodollar and Yankee Dollar
Obligations | | a | | a | | a | | a | | a | | a | | a | | a | | a | | a | | a | | a | | a | | a | | a | |
|
| Foreign Investment: | |
|
| Foreign Equity Securities | | a | | a | | a | | a | | a | | a | | a | | a | | a | | a | | a | | a | | a | | a | | a | |
|
Foreign Government Fixed
Income Securities | | a | | a | | a | | a | | a | | | | a | | a | | | | a | | | | a | | | | | | a | |
|
Foreign Corporate Fixed
Income Securities | | a | | a | | a | | a | | a | | | | a | | a | | a | | a | | | | a | | a | | | | a | |
|
| Emerging Market Securities | | a | | a | | a | | a | | a | | a | | a | | a | | a | | a | | a | | a | | a | | a | | a | |
|
| Foreign Currency Transactions | | a | | a | | a | | a | | a | | a | | a | | a | | a | | a | | a | | a | | a | | a | | a | |
|
| Brady Bonds | | a | | a | | a | | a | | a | | | | a | | a | | a | | a | | | | a | | a | | | | a | |
|
| Investment Funds | | a | | a | | a | | a | | a | | a | | a | | a | | a | | a | | a | | a | | a | | a | | a | |
|
3
| | | Active International Allocation | | Asian Equity | | Emerging Markets | | Global Advantage | | Global Discovery | | Global Franchise | | Global Insight | | Global Opportunity | | Global Real Estate | | International Advantage | | International Equity | | International Opportunity | | International Real Estate | | International Small Cap | | Select Global Infrastructure | |
Other Securities and Investment
Strategies: | |
|
| Loans of Portfolio Securities | | a | | a | | a | | a | | a | | a | | a | | a | | a | | a | | a | | a | | a | | a | | a | |
|
Non-Publicly Traded Securities,
Private Placements and
Restricted Securities | | a | | a | | a | | a | | a | | a | | a | | a | | a | | a | | a | | a | | a | | a | | a | |
|
When-Issued and Delayed
Delivery Securities | | a | | a | | a | | a | | a | | a | | a | | a | | a | | a | | a | | a | | a | | a | | a | |
|
Borrowing for Investment
Purposes | | | | | | | | | | | | | | | | | | | | | | | | | | | |
|
| Temporary Borrowing | | a | | a | | a | | a | | a | | a | | a | | a | | a | | a | | a | | a | | a | | a | | a | |
|
Reverse Repurchase
Agreements | | | | | | | | | | | | | | | | | | | | | | | | | | | |
|
| Short Sales | | | | | | | | | | | | | | | | | | | | | | | |
|
| Derivatives: | |
|
| Forwards | | a | | a | | a | | a | | a | | a | | a | | a | | | | a | | a | | a | | | | a | | a | |
|
| Futures Contracts | | a | | a | | a | | a | | a | | | | a | | a | | | | a | | a | | a | | | | a | | | |
|
| Options | | a | | | | | | a | | a | | | | a | | a | | | | a | | a | | a | | | | a | | | |
|
| Swaps | | a | | a | | a | | a | | a | | | | a | | a | | | | a | | a | | a | | | | a | | | |
|
| Contracts for Difference | | a | | a | | a | | a | | a | | | | a | | a | | | | a | | a | | a | | | | a | | | |
|
| Structured Investments | | | | a | | | | a | | a | | | | a | | a | | | | a | | | | a | | | | | | | |
|
| Combined Transactions | | a | | a | | a | | a | | a | | | | a | | a | | | | a | | a | | a | | | | a | | | |
|
* See Money Market Instruments and Temporary Investments.
U.S. EQUITY PORTFOLIOS
| | | Advantage | | Focus Growth | | Growth | | Insight | | Opportunity | | Small Company Growth | | U.S. Real Estate | |
| Equity Securities: | | | |
|
| Common Stocks | | | | a | | a | | a | | a | | a | | a | | a | |
|
| Depositary Receipts | | | | a | | a | | a | | a | | a | | a | | a | |
|
| Preferred Stocks | | | | a | | a | | a | | a | | a | | a | | a | |
|
| Rights | | | | a | | a | | a | | a | | a | | a | | a | |
|
| Warrants | | | | a | | a | | a | | a | | a | | a | | a | |
|
| IPOs | | | | a | | a | | a | | a | | a | | a | | a | |
|
| Convertible Securities | | | | a | | a | | a | | a | | a | | a | | a | |
|
| Limited Partnerships | | | | a | | a | | a | | a | | a | | a | | a | |
|
| Investment Company Securities | | | | a | | a | | a | | a | | a | | a | | a | |
|
| Exchange-Traded Funds | | | | a | | a | | a | | a | | a | | a | | a | |
|
| Real Estate Investing | | | | a | | a | | a | | a | | a | | a | | a | |
|
| —REITs | | | | a | | a | | a | | a | | a | | a | | a | |
|
| —Foreign Real Estate Companies | | | | a | | | | | | a | | a | | | | | |
|
| —Specialized Ownership Vehicles | | | | a | | a | | a | | a | | a | | a | | a | |
|
4
| | | Advantage | | Focus Growth | | Growth | | Insight | | Opportunity | | Small Company Growth | | U.S. Real Estate | |
| Fixed Income Securities: | |
|
| Investment Grade Securities | | a | | a | | a | | a | | a | | a | | a | |
|
| High Yield Securities | | | | | | | | | | | | | | | |
|
| U.S. Government Securities | | a | | a | | a | | a | | a | | a | | a | |
|
| Agencies | | a | | a | | a | | a | | a | | a | | a | |
|
| Corporates | | a | | a | | a | | a | | a | | a | | a | |
|
| Money Market Instruments | | a | | a | | a | | a | | a | | a | | a | |
|
| Cash Equivalents | | a | | a | | a | | a | | a | | a | | a | |
|
| Mortgage Related Securities | | a | | | | | | a | | a | | | | | |
|
| Repurchase Agreements | | a | | a | | a | | a | | a | | a | | a | |
|
| Municipals | | | | | | | | | | | | | | | |
|
| Asset-Backed Securities | | | | | | | | | | | | | | | |
|
| Loan Participations and Assignments | | | | | | | | | | | | | | | |
|
| Temporary Investments | | a | | a | | a | | a | | a | | a | | a | |
|
Zero Coupons, Pay-In-Kind Securities or Deferred
Payment Securities | | a | | a | | a | | a | | a | | a | | a | |
|
| Floaters | | | | | | | | | | | | | | | |
|
| Inverse Floaters | | | | | | | | | | | | | | | |
|
| Eurodollar and Yankee Dollar Obligations | | a | | | | | | a | | a | | | | | |
|
| Foreign Investment: | |
|
| Foreign Equity Securities | | a | | a | | a | | a | | a | | a | | a | |
|
| Foreign Government Fixed Income Securities | | a | | | | | | a | | a | | | | a | |
|
| Foreign Corporate Fixed Income Securities | | a | | | | | | a | | a | | | | a | |
|
| Emerging Market Securities | | a | | a | | a | | a | | a | | a | | | |
|
| Foreign Currency Transactions | | a | | a | | a | | a | | a | | a | | a | |
|
| Brady Bonds | | a | | | | | | a | | a | | | | | |
|
| Investment Funds | | a | | a | | a | | a | | a | | a | | a | |
|
| Other Securities and Investment Strategies: | |
|
| Loans of Portfolio Securities | | a | | a | | a | | a | | a | | a | | a | |
|
Non-Publicly Traded Securities, Private Placements
and Restricted Securities | | a | | a | | a | | a | | a | | a | | a | |
|
| When-Issued and Delayed Delivery Securities | | a | | a | | a | | a | | a | | a | | a | |
|
| Borrowing for Investment Purposes | | | | | | | | | | | | | | | |
|
| Temporary Borrowing | | a | | a | | a | | a | | a | | a | | a | |
|
| Reverse Repurchase Agreements | | | | | | a | | | | | | | | | |
|
| Short Sales | | | | | | | | | | | | | | | |
|
| Derivatives: | |
|
| Forwards | | a | | a | | a | | a | | a | | a | | | |
|
| Futures Contracts | | a | | a | | a | | a | | a | | a | | | |
|
| Options | | a | | a | | a | | a | | a | | a | | | |
|
| Swaps | | a | | a | | a | | a | | a | | a | | | |
|
| Contracts for Difference | | a | | a | | a | | a | | a | | a | | | |
|
| Structured Investments | | a | | a | | a | | a | | a | | a | | | |
|
| Combined Transactions | | a | | a | | a | | a | | a | | a | | | |
|
5
FIXED INCOME PORTFOLIO
Emerging Markets
Domestic Debt | |
| | | | |
| Equity Securities: | | | |
|
| Common Stocks | | | |
|
| Depositary Receipts | | a | |
|
| Preferred Stocks | | a | |
|
| Rights | | a | |
|
| Warrants | | a | |
|
| IPOs | | | |
|
| Convertible Securities | | a | |
|
| Limited Partnerships | | | |
|
| Investment Company Securities | | a | |
|
| Exchange-Traded Funds | | a | |
|
| Real Estate Investing | | | |
|
| —REITs | | | |
|
| —Foreign Real Estate Companies | | | |
|
| —Specialized Ownership Vehicles | | | |
|
| Fixed Income Securities: | | | |
|
| Investment Grade Securities | | a | |
|
| High Yield Securities | | a | |
|
| U.S. Government Securities | | a | |
|
| Agencies | | a | |
|
| Corporates | | a | |
|
| Money Market Instruments | | a | |
|
| Cash Equivalents | | a | |
|
| Mortgage Related Securities | | a | |
|
| Repurchase Agreements | | a | |
|
| Municipals | | a | |
|
| Asset-Backed Securities | | a | |
|
| Loan Participations and Assignments | | a | |
|
| Temporary Investments | | a | |
|
| Zero Coupons, Pay-In-Kind Securities or Deferred Payment | | a | |
|
| Floaters | | a | |
|
| Inverse Floaters | | a | |
|
| Eurodollar and Yankee Dollar Obligations | | a | |
|
| Foreign Investment: | | | |
|
| Foreign Equity Securities | | a | |
|
| Foreign Government Fixed Income Securities | | a | |
|
| Foreign Corporate Fixed Income Securities | | a | |
|
| Emerging Market Securities | | a | |
|
| Foreign Currency Transactions | | a | |
|
| Brady Bonds | | a | |
|
| Investment Funds | | a | |
|
| Other Securities and Investment Strategies: | | | |
|
| Loans of Portfolio Securities | | a | |
|
| Non-Publicly Traded Securities, Private Placements and Restricted Securities | | a | |
|
| When-Issued and Delayed Delivery Securities | | a | |
|
| Borrowing for Investment Purposes | | a | |
|
| Temporary Borrowing | | a | |
|
| Reverse Repurchase Agreements | | a | |
|
| Short Sales | | a | |
|
| Derivatives: | | | |
|
| Forwards | | a | |
|
| Futures Contracts | | a | |
|
| Options | | a | |
|
| Swaps | | a | |
|
| Contracts for Difference | | | |
|
| Structured Investments | | a | |
|
| Combined Transactions | | a | |
|
6
EQUITY SECURITIES
Equity securities generally represent an ownership interest in an issuer, or may be convertible into or represent a right to acquire an ownership interest in an issuer. While there are many types of equity securities, prices of all equity securities will fluctuate. Economic, political and other events may affect the prices of broad equity markets. For example, changes in inflation or consumer demand may affect the prices of equity securities generally in the United States. Similar events also may affect the prices of particular equity securities. For example, news about the success or failure of a new product may affect the price of a particular issuer's equity securities.
Common Stocks. Common stocks are equity securities representing an ownership interest in a corporation, entitling the stockholder to voting rights and receipt of dividends paid based on proportionate ownership.
Depositary Receipts. Depositary Receipts represent an ownership interest in securities of foreign companies (an "underlying issuer") that are deposited with a depositary. Depositary Receipts are not necessarily denominated in the same currency as the underlying securities. Depositary Receipts include American Depositary Receipts ("ADRs"), Global Depositary Receipts ("GDRs") and other types of depositary receipts (which, together with ADRs and GDRs, are hereinafter collectively referred to as "Depositary Receipts"). ADRs are dollar-denominated Depositary Receipts typically issued by a U.S. financial institution which evidence an ownership interest in a security or pool of securities issued by a foreign issuer. ADRs are listed and traded in the United States. ADRs also include American depositary shares. GDRs and other types of Depositary Receipts are typically issued by foreign banks or trust companies, although they also may be issued by U.S. financial institutions, and evidence ownership interests in a security or pool of securities issued by either a foreign or a U.S. corporation. Generally, depositary receipts in registered form are designed for use in the U.S. securities market and depositary receipts in bearer form are designed for use in securities markets outside the United States.
Depositary Receipts may be "sponsored" or "unsponsored." Sponsored Depositary Receipts are established jointly by a depositary and the underlying issuer, whereas unsponsored Depositary Receipts may be established by a depositary without participation by the underlying issuer. Holders of unsponsored Depositary Receipts generally bear all the costs associated with establishing unsponsored Depositary Receipts. In addition, the issuers of the securities underlying unsponsored Depository Receipts are not obligated to disclose material information in the United States and, therefore, there may be less information available regarding such issuers and there may not be a correlation between such information and the market value of the Depositary Receipts. For purposes of a Portfolio's investment policies, a Portfolio's investments in Depositary Receipts will be deemed to be an investment in the underlying securities, except that ADRs may be deemed to be issued by a U.S. issuer.
Preferred Stocks. Preferred stocks are securities that evidence ownership in a corporation which pay a fixed or variable stream of dividends. Preferred stocks have a preference over common stocks in the event of the liquidation of an issuer and usually do not carry voting rights. Because preferred stocks pay a fixed or variable stream of dividends, they have many of the characteristics of a fixed income security and are, therefore, included in both the definition of equity security and fixed income security.
Rights. Rights represent the right, but not the obligation, for a fixed period of time to purchase additional shares of an issuer's common stock at the time of a new issuance, usually at a price below the initial offering price of the common stock and before the common stock is offered to the general public. Rights are usually freely transferable. The risk of investing in a right is that the right may expire prior to the market value of the common stock exceeding the price fixed by the right.
Warrants. Warrants give holders the right, but not the obligation, to buy common stock of an issuer at a given price, usually higher than the market price at the time of issuance, during a specified period. Warrants are usually freely transferable. The risk of investing in a warrant is that the warrant may expire prior to the market value of the common stock exceeding the price fixed by the warrant.
IPOs. The Portfolios may purchase equity securities issued as part of, or a short period after, a company's initial public offering ("IPOs"), and may at times dispose of those securities shortly after their acquisition. A Portfolio's purchase of securities issued in IPOs exposes it to the risks associated with companies that have little operating history as public companies, as well as to the risks inherent in those sectors of the market where these issuers operate. The market for IPO issuers has been volatile, and share prices of newly-public companies have fluctuated significantly over short periods of time.
Convertible Securities. A convertible security is a bond, debenture, note, preferred stock, right, warrant or other security that may be converted into or exchanged for a prescribed amount of common stock or other security of the same or a different issuer or into cash within a particular period of time at a specified price or formula. A
7
convertible security generally entitles the holder to receive interest paid or accrued on debt securities or the dividend paid on preferred stock until the convertible security matures or is redeemed, converted or exchanged. Before conversion, convertible securities generally have characteristics similar to both debt and equity securities. The value of convertible securities tends to decline as interest rates rise and, because of the conversion feature, tends to vary with fluctuations in the market value of the underlying securities. Convertible securities ordinarily provide a stream of income with generally higher yields than those of common stock of the same or similar issuers. Convertible securities generally rank senior to common stock in a corporation's capital structure but are usually subordinated to comparable nonconvertible securities. Convertible securities generally do not participate directly in any dividend increases or decreases of the underlying securities although the market prices of convertible securities may be affected by any dividend changes or other changes in the underlying securities. Certain of the convertible securities in which a Portfolio may invest are rated below investment grade or are unrated. The prices of such securities are likely to be more sensitive to adverse economic changes, resulting in increased volatility of market prices of these securities during periods of economic uncertainty, or adverse individual corporate developments, than higher-rated securities. In addition, during an economic downturn or substantial period of rising interest rates, lower rated issuers may experience financial stress.
Limited Partnerships. A limited partnership interest entitles a Portfolio to participate in the investment return of the partnership's assets as defined by the agreement among the partners. As a limited partner, a Portfolio generally is not permitted to participate in the management of the partnership. However, unlike a general partner whose liability is not limited, a limited partner's liability generally is limited to the amount of its commitment to the partnership. A Portfolio that invests in limited partnership interests may invest to the same extent in limited liability company interests. Limited liability company interests have similar characteristics as limited partnership interests.
Investment Company Securities. Investment company securities are securities of other open-end, closed-end and unregistered investment companies, including foreign investment companies, hedge funds and exchange-traded funds. A Portfolio may invest in investment company securities as may be permitted by (i) the Investment Company Act of 1940, as amended from time to time (the "1940 Act"); (ii) the rules and regulations promulgated by the United States Securities and Exchange Commission (the "SEC") under the 1940 Act, as amended from time to time; or (iii) an exemption or other relief applicable to the Portfolio from provisions of the 1940 Act, as amended from time to time. The 1940 Act generally prohibits an investment company from acquiring more than 3% of the outstanding voting shares of an investment company and limits such investments to no more than 5% of a portfolio's total assets in any one investment company, and no more than 10% in any combination of investment companies. A Portfolio may invest in investment company securities of investment companies managed by the Adviser or its affiliates to the extent permitted under the 1940 Act or as otherwise authorized by the SEC. To the extent a Portfolio invests a portion of its assets in investment company securities, those assets will be subject to the risks of the purchased investment company's portfolio securities, and a shareholder in any such Portfolio will bear not only his proportionate share of the expenses of the Portfolio, but also, indirectly the expenses of the purchased investment company.
To the extent permitted by applicable law, each Portfolio may invest all or some of its short term cash investments in any money market fund advised or managed by the Adviser or its affiliates. In connection with any such investments, each Portfolio, to the extent permitted by the 1940 Act, will pay its share of all expenses (other than advisory and administrative fees) of a money market fund in which it invests which may result in the Portfolio bearing some additional expenses.
Exchange-Traded Funds ("ETFs"). The Portfolios may invest in shares of various ETFs. Shares of ETFs have many of the same risks as direct investments in common stocks or bonds. In addition, their market value is expected to rise and fall as the value of the underlying index or bond rises and falls. The market value of their shares may differ from the net asset value of the particular fund. As a shareholder in an ETF (as with other investment companies), the Portfolio would bear its ratable share of that entity's expenses. At the same time, the Portfolio would continue to pay its own investment management fees and other expenses. As a result, the Portfolio and its shareholders, in effect, will be absorbing duplicate levels of fees with respect to investments in ETFs.
Real Estate Investing. Investments in securities of issuers engaged in the real estate industry entail special risks and considerations. In particular, securities of such issuers may be subject to risks associated with the direct ownership of real estate. These risks include the cyclical nature of real estate values, risks related to general and local economic conditions, overbuilding and increased competition, increases in property taxes and operating expenses, demographic trends and variations in rental income, changes in zoning laws, casualty or condemnation losses, environmental risks, regulatory limitations on rents, changes in neighborhood values, changes in the appeal of properties to tenants, increases in interest rates and other real estate capital market influences. Generally,
8
increases in interest rates will increase the costs of obtaining financing, which could directly and indirectly decrease the value of a Portfolio's investments.
Real estate investment trusts ("REITs") and foreign real estate companies. Certain Portfolios may invest in REITs and/or foreign real estate companies, which are similar to entities organized and operated as REITs in the United States. REITs and foreign real estate companies pool investors' funds for investment primarily in real estate properties or real estate-related loans. REITs and foreign real estate companies generally derive their income from rents on the underlying properties or interest on the underlying loans, and their value is impacted by changes in the value of the underlying property or changes in interest rates affecting the underlying loans owned by the REITs and/or foreign real estate companies. REITs and foreign real estate companies are more susceptible to risks associated with the ownership of real estate and the real estate industry in general. These risks can include fluctuations in the value of underlying properties; defaults by borrowers or tenants; market saturation; changes in general and local economic conditions; decreases in market rates for rents; increases in competition, property taxes, capital expenditures or operating expenses; and other economic, political or regulatory occurrences affecting the real estate industry. In addition, REITs and foreign real estate companies depend upon specialized management skills, may not be diversified (which may increase the volatility of a REIT's and/or foreign real estate company's value), may have less trading volume and may be subject to more abrupt or erratic price movements than the overall securities market. Foreign real estate companies may be subject to laws, rules and regulations governing those entities and their failure to comply with those laws, rules and regulations could negatively impact the performance of those entities. Operating REITS and foreign real estate companies requires specialized management skills and a Portfolio indirectly bears management expenses along with the direct expenses of the Portfolio. REITs are not taxed on income distributed to shareholders provided they comply with several requirements of the Internal Revenue Code of 1986, as amended (the "Code"). REITs are subject to the risk of failing to qualify for tax-free pass-through of income under the Code.
Specialized Ownership Vehicles. Specialized ownership vehicles pool investors' funds for investment primarily in income-producing real estate or real estate-related loans or interests. Such specialized ownership vehicles in which the Portfolios may invest include property unit trusts, foreign real estate companies, REITs and other similar specialized investment vehicles. Investments in such specialized ownership vehicles may have favorable or unfavorable legal, regulatory or tax implications for a Portfolio and, to the extent such vehicles are structured similarly to investment funds, a shareholder in the Portfolio will bear not only his proportionate share of the expenses of the Portfolio, but also, indirectly the expenses of the specialized ownership vehicle.
FIXED INCOME SECURITIES
Fixed income securities generally represent an issuer's obligation to repay to the investor (or lender) the amount borrowed plus interest over a specified time period. A typical fixed income security specifies a fixed date when the amount borrowed (principal) is due in full, known as the maturity date, and specifies dates when periodic interest (coupon) payments will be made over the life of the security.
Fixed income securities come in many varieties and may differ in the way that interest is calculated, the amount and frequency of payments, the type of collateral, if any, and the presence of special features (e.g., conversion rights). Prices of fixed income securities fluctuate and, in particular, are subject to several key risks including, but not limited to, interest rate risk, credit risk, prepayment risk and spread risk.
Interest rate risk arises due to general changes in the level of market rates after the purchase of a fixed income security. Generally, the values of fixed income securities vary inversely with changes in interest rates. During periods of falling interest rates, the values of most outstanding fixed income securities generally rise and during periods of rising interest rates, the values of most fixed income securities generally decline. While fixed income securities with longer final maturities often have higher yields than those with shorter maturities, they usually possess greater price sensitivity to changes in interest rates and other factors. Traditionally, the remaining term to maturity has been used as a barometer of a fixed income security's sensitivity to interest rate changes. This measure, however, considers only the time until the final principal payment and takes no account of the pattern or amount of principal or interest payments prior to maturity. Duration combines consideration of yield, coupon, interest and principal payments, final maturity and call (prepayment) features. Duration measures the likely percentage change in a fixed income security's price for a small parallel shift in the general level of interest rates; it is also an estimate of the weighted average life of the remaining cash flows of a fixed income security. In almost all cases, the duration of a fixed income security is shorter than its term to maturity.
Credit risk, also known as default risk, represents the possibility that an issuer may be unable to meet scheduled interest and principal payment obligations. It is most often associated with corporate bonds, although it can be
9
present in other fixed income securities as well (note that the market generally assumes that obligations of the U.S. Treasury are free from credit risk). Credit ratings and quantitative models attempt to measure the degree of credit risk in fixed income securities, and provide insight as to whether prevailing yield spreads afford sufficient compensation for such risk. Other things being equal, fixed income securities with high degrees of credit risk should trade in the market at lower prices (and higher yields) than fixed income securities with low degrees of credit risk.
Prepayment risk, also known as call risk, arises due to the issuer's ability to prepay all or most of the fixed income security prior to the stated final maturity date. Prepayments generally rise in response to a decline in interest rates as debtors take advantage of the opportunity to refinance their obligations. This risk is often associated with mortgage securities where the underlying mortgage loans can be refinanced, although it can also be present in corporate or other types of bonds with call provisions. When a prepayment occurs, a Portfolio may be forced to reinvest in lower yielding fixed income securities. Quantitative models are designed to help assess the degree of prepayment risk, and provide insight as to whether prevailing yield spreads afford sufficient compensation for such risk.
Spread risk is the potential for the value of a Portfolio's assets to fall due to the widening of spreads. Fixed income securities generally compensate for greater credit risk by paying interest at a higher rate. The difference (or "spread") between the yield of a security and the yield of a benchmark, such as a U.S. Treasury security with a comparable maturity, measures the additional interest paid for credit risk. As the spread on a security widens (or increases), the price (or value) of the security falls. Spread widening may occur, among other reasons, as a result of market concerns over the stability of the market, excess supply, general credit concerns in other markets, security- or market-specific credit concerns or general reductions in risk tolerance.
Economic, political and other events also may affect the prices of broad fixed income markets, although the risks associated with such events are transmitted to the market via changes in the prevailing levels of interest rates, credit risk, prepayment risk or spread risk.
Investment Grade Securities. Investment grade securities are fixed income securities rated by one or more of the rating agencies in one of the four highest rating categories at the time of purchase (e.g., AAA, AA, A or BBB by Standard & Poor's Rating Group, a division of The McGraw-Hill Companies, Inc. ("S&P"), or Fitch Ratings ("Fitch"), or Aaa, Aa, A or Baa by Moody's Investors Service, Inc. ("Moody's")) or determined to be of equivalent quality by the Adviser. Securities rated BBB or Baa represent the lowest of four levels of investment grade securities and are regarded as borderline between definitely sound obligations and those in which the speculative element begins to predominate. Ratings assigned to fixed income securities represent only the opinion of the rating agency assigning the rating and are not dispositive of the credit risk associated with the purchase of a particular fixed income security. Moreover, market risk also will affect the prices of even the highest rated fixed income securities so that their prices may rise or fall even if the issuer's capacity to repay its obligations remains unchanged.
High Yield Securities. High yield securities are generally considered to include fixed income securities rated below the four highest rating categories at the time of purchase (e.g., Ba through C by Moody's, or BB through D by S&P or Fitch) and unrated fixed income securities considered by the Adviser to be of equivalent quality. High yield securities are not considered investment grade and are commonly referred to as "junk bonds" or high yield, high risk securities. Investment grade securities that a Portfolio holds may be downgraded to below investment grade by the rating agencies. If a Portfolio holds a security that is downgraded, the Portfolio may choose to retain the security.
While high yield securities offer higher yields, they also normally carry a high degree of credit risk and are considered speculative by the major credit rating agencies. High yield securities may be issued as a consequence of corporate restructuring or similar events. High yield securities are often issued by smaller, less creditworthy issuers, or by highly leveraged (indebted) issuers, that are generally less able than more established or less leveraged issuers to make scheduled payments of interest and principal. In comparison to investment grade securities, the price movement of these securities is influenced less by changes in interest rates and more by the financial and business position of the issuer. The values of high yield securities are more volatile and may react with greater sensitivity to market changes.
U.S. Government Securities. U.S. government securities refers to a variety of fixed income securities issued or guaranteed by the U.S. Government and various instrumentalities and agencies. The U.S. government securities that certain Portfolios may purchase include U.S. Treasury bills, notes and bonds, all of which are direct obligations of the U.S. Government. In addition, certain Portfolios may purchase securities issued by agencies and instrumentalities of the U.S. Government which are backed by the full faith and credit of the United States. Among the agencies and instrumentalities issuing these obligations are the Government National Mortgage Association
10
("Ginnie Mae") and the Federal Housing Administration ("FHA"). Certain of the Portfolios may also purchase securities issued by agencies and instrumentalities which are not backed by the full faith and credit of the United States, but whose issuing agency or instrumentality has the right to borrow, to meet its obligations, from the U.S. Treasury. Among these agencies and instrumentalities are the Federal National Mortgage Association ("Fannie Mae"), the Federal Home Loan Mortgage Corporation ("Freddie Mac") and the Federal Home Loan Banks. Further, certain Portfolios may purchase securities issued by agencies and instrumentalities which are backed solely by the credit of the issuing agency or instrumentality. Among these agencies and instrumentalities is the Federal Farm Credit System.
Agencies. Agencies refer to fixed income securities issued or guaranteed by federal agencies and U.S. government sponsored instrumentalities. They may or may not be backed by the full faith and credit of the U.S. Government. If they are not backed by the full faith and credit of the United States, the investor must look principally to the agency or instrumentality issuing or guaranteeing the obligation for ultimate repayment, and may not be able to assert a claim against the United States itself in the event the agency or instrumentality does not meet its commitment. Agencies which are backed by the full faith and credit of the United States include the Export-Import Bank, Farmers Home Administration, Federal Financing Bank and others. Certain debt issued by Resolution Funding Corporation has both its principal and interest backed by the full faith and credit of the U.S. Treasury in that its principal is backed by U.S. Treasury zero coupon issues, while the U.S. Treasury is explicitly required to advance funds sufficient to pay interest on it, if needed. Certain agencies and instrumentalities, such as Ginnie Mae, are, in effect, backed by the full faith and credit of the United States through provisions in their charters that they may make "indefinite and unlimited" drawings on the Treasury, if needed to service its debt. Debt from certain other agencies and instrumentalities, including the Federal Home Loan Bank and Fannie Mae, are not guaranteed by the United States, but those institutions are protected by the discretionary authority of the U.S. Treasury to purchase certain amounts of their securities to assist them in meeting their debt obligations. Finally, other agencies and instrumentalities, such as the Farm Credit System, are federally chartered institutions under U.S. government supervision, but their debt securities are backed only by the credit worthiness of those institutions, not the U.S. Government. Some of the U.S. government agencies that issue or guarantee securities include the Export-Import Bank of the United States, Farmers Home Administration, FHA, Maritime Administration, Small Business Administration and The Tennessee Valley Authority ("TVA"). An instrumentality of the U.S. Government is a government agency organized under federal charter with government supervision. Instrumentalities issuing or guaranteeing securities include, among others, Federal Home Loan Banks, the Federal Land Banks, Central Bank for Cooperatives, Federal Intermediate Credit Banks and Fannie Mae.
In September 2008, the U.S. Treasury Department announced that the U.S. Government would be taking over Fannie Mae and Freddie Mac and placing the companies into a conservatorship. In addition, the U.S. Treasury announced additional steps that it intended to take with respect to the debt and mortgage-backed securities issued by Fannie Mae and Freddie Mac in order to support the conservatorship. No assurance can be given that these initiatives will be successful. The maximum potential liability of the issuers of some U.S. government securities held by a Portfolio may greatly exceed their current resources, including their legal right to support from the U.S. Treasury. It is possible that these issuers will not have the funds to meet their payment obligations in the future.
An instrumentality of the U.S. Government is a government agency organized under federal charter with government supervision. Instrumentalities issuing or guaranteeing securities include, among others, Federal Home Loan Banks, the Federal Land Banks, Central Bank for Cooperatives, Federal Intermediate Credit Banks and Fannie Mae.
Corporates. Corporates are fixed income securities issued by private businesses. Holders, as creditors, have a prior legal claim over holders of equity securities of the issuer as to both income and assets for the principal and interest due the holder.
Money Market Instruments. Money market instruments are high quality short-term fixed income securities. Money market instruments may include obligations of governments, government agencies, banks, corporations and special purpose entities and repurchase agreements relating to these obligations. Certain money market instruments may be denominated in a foreign currency.
Cash Equivalents. Cash equivalents are short-term fixed income securities comprising:
(1) Time deposits, certificates of deposit (including marketable variable rate certificates of deposit) and bankers' acceptances issued by a commercial bank or savings and loan association. Time deposits are non-negotiable deposits maintained in a banking institution for a specified period of time at a stated interest rate. Certificates of deposit are negotiable short-term obligations issued by commercial banks or savings and loan associations against funds deposited in the issuing institution. Variable rate certificates of deposit are certificates
11
of deposit on which the interest rate is periodically adjusted prior to their stated maturity based upon a specified market rate. A bankers' acceptance is a time draft drawn on a commercial bank by a borrower, usually in connection with an international commercial transaction (to finance the import, export, transfer or storage of goods).
Each Portfolio may invest in obligations of U.S. banks, foreign branches of U.S. banks (Eurodollars) and U.S. branches of foreign banks (Yankee dollars). Eurodollar and Yankee dollar investments will involve some of the same risks of investing in international securities that are discussed in various foreign investing sections of this SAI.
A Portfolio will not invest in any security issued by a commercial bank unless (i) the bank has total assets of at least $1 billion, or the equivalent in other currencies or, in the case of domestic banks which do not have total assets of at least $1 billion, the aggregate investment made in any one such bank is limited to $250,000 principal amount per certificate (a temporary increase from $100,000, which is due to expire on December 31, 2013) and the principal amount of such investment is insured in full by the Federal Deposit Insurance Corporation ("FDIC"), (ii) in the case of U.S. banks, it is a member of the FDIC and (iii) in the case of foreign branches of U.S. banks, the security is deemed by the Adviser to be of an investment quality comparable with other debt securities which the Portfolio may purchase;
(2) Each Portfolio may invest in commercial paper (see below) rated at time of purchase by one or more nationally recognized statistical rating organizations ("NRSROs") in one of their two highest categories (e.g., A-l or A-2 by S&P or Prime 1 or Prime 2 by Moody's) or, if not rated, issued by a corporation having an outstanding unsecured debt issue rated high-grade by an NRSRO (e.g., A or better by Moody's, S&P or Fitch);
(3) Short-term corporate obligations rated high-grade at the time of purchase by an NRSRO (e.g., A or better by Moody's, S&P or Fitch);
(4) U.S. government obligations, including bills, notes, bonds and other debt securities issued by the U.S. Treasury. These are direct obligations of the U.S. Government and differ mainly in interest rates, maturities and dates of issue;
(5) Government agency securities issued or guaranteed by U.S. government sponsored instrumentalities and Federal agencies. These include securities issued by the Federal Home Loan Banks, Federal Land Bank, Farmers Home Administration, Farm Credit Banks, Federal Intermediate Credit Bank, Fannie Mae, Federal Financing Bank, TVA and others; and
(6) Repurchase agreements collateralized by the securities listed above.
Commercial Paper. Commercial paper refers to short-term fixed income securities with maturities ranging from 1 to 270 days. They are primarily issued by corporations needing to finance large amounts of receivables, but may be issued by banks and other borrowers. Commercial paper is issued either directly or through broker-dealers, and may be discounted or interest bearing. Commercial paper is unsecured, but is almost always backed by bank lines of credit. Virtually all commercial paper is rated by Moody's or S&P.
Commercial paper rated A-1 by S&P has the following characteristics: (1) liquidity ratios are adequate to meet cash requirements; (2) long-term senior debt is rated "A" or better; (3) the issuer has access to at least two additional channels of borrowing; (4) basic earnings and cash flow have an upward trend with allowance made for unusual circumstances; (5) typically, the issuer's industry is well established and the issuer has a strong position within the industry; and (6) the reliability and quality of management are unquestioned. Relative strength or weakness of the above factors determine whether the issuer's commercial paper is A-1, A-2 or A-3.
The rating Prime-1 is the highest commercial paper rating assigned by Moody's. Among the factors considered by Moody's in assigning ratings are the following: (1) evaluation of the management of the issuer; (2) economic evaluation of the issuer's industry or industries and the appraisal of speculative-type risks which may be inherent in certain areas; (3) evaluation of the issuer's products in relation to competition and customer acceptance; (4) liquidity; (5) amount and quality of long-term debt; (6) trend of earnings over a period of ten years; (7) financial strength of a parent company and the relationships that exist with the issuer; and (8) recognition by the management of obligations which may be present or may arise as a result of public interest questions and preparations to meet such obligations.
Mortgage Related Securities. Mortgage related securities are securities that, directly or indirectly, represent a participation in, or are secured by and payable from, mortgage loans on real property. Mortgage related securities include collateralized mortgage obligations and mortgage-backed securities issued or guaranteed by agencies or instrumentalities of the U.S. Government or by private sector entities.
12
Mortgage-Backed Securities. With mortgage-backed securities ("MBSs"), many mortgagees' obligations to make monthly payments to their lending institution are pooled together and passed through to investors. The pools are assembled by various governmental, Government-related and private organizations. A Portfolio may invest in securities issued or guaranteed by Ginnie Mae, Freddie Mac or Fannie Mae, private issuers and other government agencies. MBSs issued by non-agency issuers, whether or not such securities are subject to guarantees, may entail greater risk, since private issuers may not be able to meet their obligations under the policies. If there is no guarantee provided by the issuer, a Portfolio will purchase only MBSs that, at the time of purchase, are rated investment grade by one or more NRSROs or, if unrated, are deemed by the Adviser to be of comparable quality.
MBSs are issued or guaranteed by private sector originators of or investors in mortgage loans and structured similarly to governmental pass-through securities. Because private pass-throughs typically lack a guarantee by an entity having the credit status of a governmental agency or instrumentality, however, they are generally structured with one or more of the types of credit enhancement described below. Fannie Mae and Freddie Mac obligations are not backed by the full faith and credit of the U.S. Government as GNMA certificates are. Freddie Mac securities are supported by Freddie Mac's right to borrow from the U.S. Treasury. Each of GNMA, Fannie Mae and Freddie Mac guarantees timely distributions of interest to certificate holders. Each of GNMA and Fannie Mae also guarantees timely distributions of scheduled principal. Although Freddie Mac has in the past guaranteed only the ultimate collection of principal of the underlying mortgage loan, Freddie Mac now issues MBSs (Freddie Mac Gold PCS) that also guarantee timely payment of monthly principal reductions. Resolution Funding Corporation ("REFCORP") obligations are backed, as to principal payments, by zero coupon U.S. Treasury bonds and, as to interest payments, ultimately by the U.S. Treasury.
There are two methods of trading MBSs. A specified pool transaction is a trade in which the pool number of the security to be delivered on the settlement date is known at the time the trade is made. This is in contrast with the typical MBS transaction, called a TBA ("To Be Announced") transaction, in which the type of MBS to be delivered is specified at the time of trade but the actual pool numbers of the securities that will be delivered are not known at the time of the trade. The pool numbers of the pools to be delivered at settlement are announced shortly before settlement takes place. The terms of the TBA trade may be made more specific if desired. Generally, agency pass-through MBSs are traded on a TBA basis.
Like fixed income securities in general, MBSs will generally decline in price when interest rates rise. Rising interest rates also tend to discourage refinancings of home mortgages, with the result that the average life of MBSs held by a Portfolio may be lengthened. As average life extends, price volatility generally increases. This extension of average life causes the market price of the MBSs to decrease further when interest rates rise than if their average lives were fixed. However, when interest rates fall, mortgages may not enjoy as large a gain in market value due to prepayment risk because additional mortgage prepayments must be reinvested at lower interest rates. Faster prepayment will shorten the average life and slower prepayments will lengthen it. However, it is possible to determine what the range of the average life movement could be and to calculate the effect that it will have on the price of the MBS. In selecting MBSs, the Adviser looks for those that offer a higher yield to compensate for any variation in average maturity. If the underlying mortgage assets experience greater than anticipated prepayments of principal, a Portfolio may fail to fully recoup its initial investment in these securities, even if the security is in one of the highest rating categories. A Portfolio may invest, without limit, in MBSs issued by private issuers when the Adviser deems that the quality of the investment, the quality of the issuer, and market conditions warrant such investments. The Portfolios will purchase securities issued by private issuers that are rated investment grade at the time of purchase by Moody's, Fitch or S&P or are deemed by the Adviser to be of comparable investment quality.
Fannie Mae Certificates. Fannie Mae is a federally chartered and privately owned corporation organized and existing under the Federal National Mortgage Association Charter Act of 1938. Each Fannie Mae certificate represents a pro rata interest in one or more pools of mortgage loans insured by the FHA under the Housing Act, or Title V of the Housing Act of 1949 ("FHA Loans"), or guaranteed by the Department of Veteran Affairs under the Servicemen's Readjustment Act of 1944, as amended ("VA Loans") or conventional mortgage loans (i.e., mortgage loans that are not insured or guaranteed by any governmental agency) of the following types: (i) fixed rate level payment mortgage loans; (ii) fixed rate growing equity mortgage loans; (iii) fixed rate graduated payment mortgage loans; (iv) variable rate California mortgage loans; (v) other adjustable rate mortgage loans; and (vi) fixed rate and adjustable mortgage loans secured by multi-family projects.
Freddie Mac Certificates. Freddie Mac is a corporate instrumentality of the United States created pursuant to the Emergency Home Finance Act of 1970, as amended (the "FHLMC Act"). Freddie Mac certificates represent a pro rata interest in a group of mortgage loans (a "Freddie Mac Certificate group") purchased by Freddie Mac. The mortgage loans underlying the Freddie Mac Certificates consist of fixed rate or adjustable rate mortgage loans with
13
original terms to maturity of between ten and thirty years, substantially all of which are secured by first liens on one-to-four-family residential properties or multi-family projects. Each mortgage loan must meet the applicable standards set forth in the FHLMC Act. A Freddie Mac Certificate group may include whole loans, participation interests in whole loans and undivided interests in whole loans and participations comprising another Freddie Mac Certificate group.
In September 2008, the U.S. Treasury Department announced that the government would be taking over Fannie Mae and Freddie Mac and placing the companies into a conservatorship. In addition, the U.S. Treasury announced three additional steps that it intended to take with respect to Fannie Mae and Freddie Mac in order to support the conservatorship. First, the U.S. Treasury entered into "Preferred Stock Purchase Agreements" (PSPAs) under which, if the Federal Housing Finance Agency ("FHFA") determines that Fannie Mae's or Freddie Mac's liabilities exceed its assets under generally accepted accounting principles, the U.S. Treasury will contribute cash capital to the company in an amount equal to the difference between liabilities and assets. The PSPAs are designed to provide protection to the senior and subordinated debt and the mortgage-backed securities issued by Fannie Mae and Freddie Mac. Second, the U.S. Treasury established a new secured lending credit facility that was available to Fannie Mae and Freddie Mac until December 2009. Third, the U.S. Treasury initiated a temporary program to purchase Fannie Mae and Freddie Mac mortgage-backed securities, which terminated in December 2009. In addition, the Federal Reserve exercised its separate authority in 2009 to purchase mortgage-backed securities of Fannie Mae and Freddie Mac. While the U.S. Treasury is committed to offset negative equity at Fannie Mae and Freddie Mac through its stock purchases, no assurance can be given that the Federal Reserve, U.S. Treasury, or FHFA initiatives discussed above will ensure that Fannie Mae and Freddie Mac will remain successful in meeting their obligations with respect to the debt and mortgage-backed securities they issue.
Ginnie Mae Certificates. Ginnie Mae is a wholly-owned corporate instrumentality of the United States within the Department of Housing and Urban Development. The National Housing Act of 1934, as amended (the "Housing Act"), authorizes Ginnie Mae to guarantee the timely payment of the principal and interest on certificates that are based on and backed by a pool of FHA Loans, VA Loans or by pools of other eligible mortgage loans. The Housing Act provides that the full faith and credit of the U.S. Government is pledged to the payment of all amounts that may be required to be paid under any guaranty. In order to meet its obligations under such guaranty, Ginnie Mae is authorized to borrow from the U.S. Treasury with no limitations as to amount.
Each Ginnie Mae certificate represents a pro rata interest in one or more of the following types of mortgage loans: (i) fixed rate level payment mortgage loans; (ii) fixed rate graduated payment mortgage loans; (iii) fixed rate growing equity mortgage loans; (iv) fixed rate mortgage loans secured by manufactured (mobile) homes; (v) mortgage loans on multi-family residential properties under construction; (vi) mortgage loans on completed multi-family projects; (vii) fixed rate mortgage loans as to which escrowed funds are used to reduce the borrower's monthly payments during the early years of the mortgage loans ("buydown" mortgage loans); (viii) mortgage loans that provide for adjustments in payments based on periodic changes in interest rates or in other payment terms of the mortgage loans; and (ix) mortgage-backed serial notes. All of these mortgage loans will be FHA Loans or VA loans and, except as otherwise specified above, will be fully-amortizing loans secured by first liens on one to four-family housing units.
Collateralized Mortgage Obligations. Certain Portfolios may invest in collateralized mortgage obligations ("CMOs"), which are mortgage-backed securities that are collateralized by mortgage loans or mortgage pass-through securities, and multi-class pass-through securities, which are equity interests in a trust composed of mortgage loans or other mortgage-backed securities. Unless the context indicates otherwise, the discussion of CMOs below also applies to multi-class pass through securities.
CMOs may be issued by governmental or government-related entities or by private entities, such as banks, savings and loan institutions, private mortgage insurance companies, mortgage bankers and other secondary market traders. CMOs are issued in multiple classes, often referred to as "tranches," with each tranche having a specific fixed or floating coupon rate and stated maturity or final distribution date. Under the traditional CMO structure, the cash flows generated by the mortgages or mortgage pass-through securities in the collateral pool are used to first pay interest and then pay principal to the holders of the CMOs. Subject to the various provisions of individual CMO issues, the cash flow generated by the underlying collateral (to the extent it exceeds the amount required to pay the stated interest) is used to retire the bonds.
The principal and interest on the underlying collateral may be allocated among the several tranches of a CMO in innumerable ways. In a common CMO structure, the tranches are retired sequentially in the order of their respective stated maturities or final distribution dates (as opposed to the pro-rata return of principal found in
14
traditional pass-through obligations). The fastest-pay tranches would initially receive all principal payments. When those tranches are retired, the next tranches in the sequence receive all of the principal payments until they are retired. The sequential retirement of bond groups continues until the last tranche is retired. Accordingly, the CMO structure allows the issuer to use cash flows of long maturity, monthly-pay collateral to formulate securities with short, intermediate, and long final maturities and expected average lives and risk characteristics.
The primary risk of CMOs is the uncertainty of the timing of cash flows that results from the rate of prepayments on the underlying mortgages serving as collateral and from the structure of the particular CMO transaction (that is, the priority of the individual tranches). An increase or decrease in prepayment rates (resulting from a decrease or increase in mortgage interest rates) may cause the CMOs to be retired substantially earlier than their stated maturities or final distribution dates and will affect the yield and price of CMOs. In addition, the collateral securing CMOs or any third party guarantees are insufficient to make payments, a Portfolio could sustain a loss. The prices of certain CMOs, depending on their structure and the rate of prepayments, can be volatile. Some CMOs may also not be as liquid as other types of mortgage securities. As a result, it may be difficult or impossible to sell the securities at an advantageous time or price.
New types of CMO tranches have evolved. These include floating rate CMOs, planned amortization classes, accrual bonds and CMO residuals. These newer structures affect the amount and timing of principal and interest received by each tranche from the underlying collateral. Under certain of these newer structures, given classes of CMOs have priority over others with respect to the receipt of prepayments on the mortgages. Therefore, depending on the type of CMOs in which a Portfolio invests, the investment may be subject to a greater or lesser risk of prepayment than other types of mortgage-backed securities.
CMOs may include real estate investment conduits ("REMICs"). REMICs, which were authorized under the Tax Reform Act of 1986, are private entities formed for the purpose of holding a fixed pool of mortgages secured by an interest in real property. A REMIC is a CMO that qualifies for special tax treatment under the Internal Revenue Code and invests in certain mortgages principally secured by interests in real property.
A Portfolio may invest in, among others, parallel pay CMOs and Planned Amortization Class CMOs ("PAC Bonds"). Parallel pay CMOs are structured to provide payments of principal on each payment date to more than one tranche. These simultaneous payments are taken into account in calculating the stated maturity date or final distribution date of each tranche which, as with other CMO structures, must be retired by its stated maturity date or final distribution date but may be retired earlier. PAC Bonds are a form of parallel pay CMO, with the required principal payment on such securities having the highest priority after interest has been paid to all classes. PAC Bonds generally require payments of a specified amount of principal on each payment date.
Stripped Mortgage-Backed Securities. Certain Portfolios may invest in stripped mortgage-backed securities ("SMBS"). A SMBS is a derivative multi-class mortgage security. SMBS usually are structured with two classes that receive different proportions of the interest and principal distribution on a pool of mortgage assets. In the most extreme case, one class will receive all of the interest (the interest-only or "IO" class), while the other class will receive all of the principal (the principal-only or "PO" class). The yield to maturity on an IO class is extremely sensitive to the rate of principal payments (including prepayments) on the related underlying mortgage assets, and a rapid rate of principal payments may have a material adverse effect on such security's yield to maturity. If the underlying mortgage assets experience greater than anticipated prepayments of principal, a Portfolio may fail to fully recoup its initial investment in these securities. Conversely, if the underlying mortgage assets experience less than anticipated prepayments of principal, the yield of POs could be materially adversely affected. The market values of IOs and POs are subject to greater risk of fluctuation in response to changes in market rates of interest than many other types of government securities. To the extent a Portfolio invests in IOs and POs, this increases the risk of fluctuations in the net asset value of a Portfolio.
Credit Enhancement. Mortgage related securities are often backed by a pool of assets representing the obligations of a number of parties. To lessen the effect of failure by obligors on underlying assets to make payments, these securities may have various types of credit support. Credit support falls into two primary categories: (i) liquidity protection, and (ii) protection against losses resulting from ultimate default by an obligor on the underlying assets. Liquidity protection generally refers to the provision of advances, typically by the entity administering the pool of assets, to ensure that the pass-through of payments due on the underlying pool occurs in a timely fashion. Protection against losses resulting from ultimate default enhances the likelihood of ultimate payment of the obligations on at least a portion of the assets in the pool. Such protection may be provided through guarantees, insurance policies or letters of credit obtained by the issuer or sponsor from third parties (referred to
15
herein as "third party credit support"), through various means of structuring the transaction or through a combination of such approaches.
The ratings of mortgage related securities for which third party credit enhancement provides liquidity protection or protection against losses from default are generally dependent upon the continued creditworthiness of the provider of the credit enhancement. The ratings of such securities could decline in the event of deterioration in the creditworthiness of the credit enhancement provider even in cases where the delinquency and loss experience on the underlying pool of assets is better than expected.
Examples of credit support arising out of the structure of the transaction include "senior-subordinated securities" (multiple class securities with one or more classes subordinate to other classes as to the payment of principal and interest thereon, with defaults on the underlying assets being borne first by the holders of the most subordinated class), creation of "reserve funds" (where cash or investments, sometimes funded from a portion of the payments on the underlying assets, are held in reserve against future losses) and "over-collateralization" (where the scheduled payments on, or the principal amount of, the underlying assets exceed those required to make payment of the securities and pay any servicing or other fees). The degree of credit support provided for each security is generally based on historical information with respect to the level of credit risk associated with the underlying assets. Delinquency or loss in excess of that which is anticipated could adversely affect the return on an investment in such a security.
Repurchase Agreements. Repurchase agreements are transactions in which a Portfolio purchases a security or basket of securities and simultaneously commits to resell that security or basket to the seller (a bank, broker or dealer) at a mutually agreed upon date and price. The resale price reflects the purchase price plus an agreed upon market rate of interest which is unrelated to the coupon rate or date of maturity of the purchased security. The term of these agreements is usually from overnight to one week, and never exceeds one year. Repurchase agreements with a term of over seven days are considered illiquid.
In these transactions, the Portfolio receives securities that have a market value at least equal to the purchase price (including accrued interest) of the repurchase agreement, and this value is maintained during the term of the agreement. These securities are held by the Fund's custodian or an approved third party for the benefit of the Portfolio until repurchased. Repurchase agreements permit a Portfolio to remain fully invested while retaining overnight flexibility to pursue investments of a longer-term nature. If the seller defaults and the value of the repurchased securities declines, the Portfolio might incur a loss. If bankruptcy proceedings are commenced with respect to the seller, the Portfolio's realization upon the collateral may be delayed.
While repurchase agreements involve certain risks not associated with direct investments in debt securities, the Portfolios follow procedures approved by the Directors that are designed to minimize such risks. These procedures include effecting repurchase transactions only with large, well-capitalized and well-established financial institutions whose financial condition will be continually monitored by the Adviser. In addition, as described above, the value of the collateral underlying the repurchase agreement will be at least equal to the repurchase price, including any accrued interest earned on the repurchase agreement. In the event of a default or bankruptcy by a selling financial institution, the Portfolios will seek to liquidate such collateral. However, the exercising of the Portfolio's right to liquidate such collateral could involve certain costs or delays and, to the extent that proceeds from any sale upon a default of the obligation to repurchase were less than the repurchase price, the Portfolio could suffer a loss.
Pursuant to an order issued by the SEC, the Portfolios may pool their daily uninvested cash balances in order to invest in repurchase agreements on a joint basis with other investment companies advised by the Adviser. By entering into repurchase agreements on a joint basis, the Portfolios expect to incur lower transaction costs and potentially obtain higher rates of interest on such repurchase agreements. Each Portfolio's participation in the income from jointly purchased repurchase agreements will be based on that Portfolio's percentage share in the total repurchase agreement.
Municipals. Municipal securities are fixed income securities issued by local, state and regional governments that provide interest income which is exempt from federal income taxes. Municipals include both municipal bonds (those securities with maturities of five years or more) and municipal notes (those with maturities of less than five years). Municipal bonds are issued for a wide variety of reasons: to construct public facilities, such as airports, highways, bridges, schools, hospitals, mass transportation, streets, water and sewer works; to obtain funds for operating expenses; to refund outstanding municipal obligations; and to loan funds to various public institutions and facilities. Certain industrial development bonds are also considered municipal bonds if their interest is exempt from federal income tax. Industrial development bonds are issued by, or on behalf of, public authorities to obtain
16
funds for various privately-operated manufacturing facilities, housing, sports arenas, convention centers, airports, mass transportation systems and water, gas or sewage works. Industrial development bonds are ordinarily dependent on the credit quality of a private user, not the public issuer.
The two principal classifications of municipal bonds are "general obligation" and "revenue" or "special tax" bonds. General obligation bonds are secured by the issuer's pledge of its full faith, credit and taxing power for the payment of principal and interest. Revenue or special tax bonds are payable only from the revenues derived from a particular facility or class of facilities or, in some cases, from the proceeds of a special excise or other tax, but not from general tax revenues.
Industrial revenue bonds in most cases are revenue bonds and generally do not have the pledge of the credit of the issuer. The payment of the principal and interest on such industrial revenue bonds is dependent solely on the ability of the user of the facilities financed by the bonds to meet its financial obligations and the pledge, if any, of real and personal property so financed as security for such payment. Short-term municipal obligations issued by states, cities, municipalities or municipal agencies, include tax anticipation notes, revenue anticipation notes, bond anticipation notes, construction loan notes and short-term discount notes.
Municipal notes are issued to meet the short-term funding requirements of local, regional and state governments. Municipal notes include bond anticipation notes, revenue anticipation notes and tax and revenue anticipation notes. These are short-term debt obligations issued by state and local governments to aid cash flows while waiting for taxes or revenue to be collected, at which time the debt is retired. Other types of municipal notes in which the Portfolio may invest are construction loan notes, short-term discount notes, tax-exempt commercial paper, demand notes and similar instruments.
Municipal bonds generally include debt obligations issued by states and their political subdivisions, and duly constituted authorities and corporations, to obtain funds to construct, repair or improve various public facilities such as airports, bridges, highways, hospitals, housing, schools, streets and water and sewer works. Municipal bonds may also be issued to refinance outstanding obligations as well as to obtain funds for general operating expenses and for loans to other public institutions and facilities.
Note obligations with demand or put options may have a stated maturity in excess of one year, but permit any holder to demand payment of principal plus accrued interest upon a specified number of days' notice. Frequently, such obligations are secured by letters of credit or other credit support arrangements provided by banks. The issuer of such notes normally has a corresponding right, after a given period, to repay at its discretion the outstanding principal of the note plus accrued interest upon a specific number of days' notice to the bondholders. The interest rate on a demand note may be based upon a known lending rate, such as the prime lending rate, and be adjusted when such rate changes, or the interest rate on a demand note may be a market rate that is adjusted at specified intervals. Each note purchased by the Portfolios will meet the quality criteria set out in the Prospectus for the Portfolios.
The yields of municipal bonds depend on, among other things, general money market conditions, conditions in the municipal bond market, the size of a particular offering, the maturity of the obligation, and the rating of the issue. The ratings of Moody's and S&P represent their opinions of the quality of the municipal bonds rated by them. It should be emphasized that such ratings are general and are not absolute standards of quality. Consequently, municipal bonds with the same maturity, coupon and rating may have different yields, while municipal bonds of the same maturity and coupon, but with different ratings, may have the same yield. It will be the responsibility of the Adviser to appraise independently the fundamental quality of the bonds held by the Portfolios.
Municipal bonds are sometimes purchased on a "when-issued" or "delayed-delivery" basis, which means the Portfolio has committed to purchase certain specified securities at an agreed upon price when they are issued. The period between commitment date and issuance date can be a month or more. It is possible that the securities will never be issued and the commitment canceled.
From time to time proposals have been introduced before Congress to restrict or eliminate the federal income tax exemption for interest on municipal bonds. Similar proposals may be introduced in the future. If any such proposal were enacted, it might restrict or eliminate the ability of the Portfolios to achieve their investment objectives. In that event, the Fund's Directors and officers would reevaluate investment objectives and policies and consider recommending to shareholders changes in such objectives and policies.
Similarly, from time to time proposals have been introduced before state and local legislatures to restrict or eliminate the state and local income tax exemption for interest on municipal bonds. Similar proposals may be introduced in the future. If any such proposal were enacted, it might restrict or eliminate the ability of a Portfolio to achieve its investment objective. In that event, the Fund's Directors and officers would reevaluate investment
17
objectives and policies and consider recommending to shareholders changes in such investment objectives and policies.
The Portfolios eligible to purchase municipal bonds may also purchase bonds the income on which is subject to the alternative minimum tax ("AMT bonds"). AMT bonds are tax-exempt private activity bonds issued after August 7, 1986, the proceeds of which are directed, at least in part, to private, for-profit organizations. While the income from AMT bonds is exempt from regular federal income tax, it is a tax preference item in the calculation of the alternative minimum tax. The alternative minimum tax is a special separate tax that applies to some taxpayers who have certain adjustments to income or tax preference items.
Build America Bonds are taxable municipal securities on which the issuer receives federal support of the interest paid. Assuming certain specified conditions are satisfied, issuers of Build America Bonds may either (i) receive reimbursement from the U.S. Treasury with respect to a portion of its interest payments on the bonds ("direct pay" Build America Bonds) or (ii) provide tax credits to investors in the bonds ("tax credit" Build America Bonds). Unlike most other municipal securities, interest received on Build America Bonds is subject to federal and state income tax. Issuance of Build America Bonds ceased on December 31, 2010. The number of Build America Bonds available in the market is limited, which may negatively affect the value of the Build America Bonds.
Lease Obligations. Included within the revenue bonds category, as noted above, are participations in lease obligations or installment purchase contracts (hereinafter collectively called "lease obligations") of municipalities. State and local governments, agencies or authorities issue lease obligations to acquire equipment and facilities. Lease obligations may have risks not normally associated with general obligation or other revenue bonds. Leases, and installment purchase or conditional sale contracts (which may provide for title to the leased asset to pass eventually to the issuer), have developed as a means for governmental issuers to acquire property and equipment without the necessity of complying with the constitutional and statutory requirements generally applicable for the issuance of debt. Certain lease obligations contain "non-appropriation" clauses that provide that the governmental issuer has no obligation to make future payments under the lease or contract unless money is appropriated for such purpose by the appropriate legislative body on an annual or other periodic basis. Consequently, continued lease payments on those lease obligations containing "non-appropriation" clauses are dependent on future legislative actions. If such legislative actions do not occur, the holders of the lease obligation may experience difficulty in exercising their rights, including disposition of the property.
In addition, lease obligations represent a relatively new type of financing that has not yet developed the depth of marketability associated with more conventional municipal obligations, and, as a result, certain of such lease obligations may be considered illiquid securities. To determine whether or not a Portfolio will consider such securities to be illiquid (and subject to each Portfolio's limitation on investing in illiquid securities), the Fund's Board of Directors has established guidelines to be utilized by the Portfolios in determining the liquidity of a lease obligation. The factors to be considered in making the determination include (i) the frequency of trades and quoted prices for the obligation; (ii) the number of dealers willing to purchase or sell the security and the number of other potential purchasers; (iii) the willingness of dealers to undertake to make a market in the security; and (iv) the nature of the marketplace trades, including the time needed to dispose of the security, the method of soliciting offers, and the mechanics of the transfer.
Asset-Backed Securities. Certain Portfolios may invest in asset-backed securities. Asset-backed securities utilize the securitization techniques used to develop mortgage-backed securities. These techniques are also applied to a broad range of other assets. Various types of assets, primarily automobile and credit card receivables and home equity loans, are being securitized in pass-through structures similar to the mortgage pass-through structures. These types of securities are known as asset-backed securities. A Portfolio may invest in any type of asset-backed security. Asset-backed securities have risk characteristics similar to mortgage-backed securities. Like mortgage-backed securities, they generally decrease in value as a result of interest rate increases, but may benefit less than other fixed income securities from declining interest rates, principally because of prepayments. Also, as in the case of mortgage-backed securities, prepayments generally increase during a period of declining interest rates although other factors, such as changes in credit use and payment patterns, may also influence prepayment rates. Asset-backed securities also involve the risk that various federal and state consumer laws and other legal, regulatory and economic factors may result in the collateral backing the securities being insufficient to support payment on the securities.
Loan Participations and Assignments. Loan participations are interests in loans or other direct debt instruments ("Loans") relating to amounts owed by a corporate, governmental or other borrower to another party. Loans may represent amounts owed to lenders or lending syndicates, to suppliers of goods or services (trade claims or other
18
receivables), or to other parties ("Lenders") and may be fixed rate or floating rate. Loans also may be arranged through private negotiations between an issuer of sovereign debt obligations and Lenders.
A Portfolio's investments in Loans may be in the form of a participation in Loans ("Participations") and assignments of all or a portion of Loans ("Assignments") from third parties. In the case of a Participation, a Portfolio will have the right to receive payments of principal, interest and any fees to which it is entitled only from the Lender selling the Participation and only upon receipt by the Lender of the payments from the borrower. In the event of an insolvency of the Lender selling a Participation, a Portfolio may be treated as a general creditor of the Lender and may not benefit from any set-off between the Lender and the borrower. Certain Participations may be structured in a manner designed to avoid purchasers of Participations being subject to the credit risk of the Lender with respect to the Participation. Even under such a structure, in the event of a Lender's insolvency, the Lender's servicing of the Participation may be delayed and the assignability of the Participation may be impaired. A Portfolio will acquire Participations only if the Lender interpositioned between a Portfolio and the borrower is determined by the Adviser to be creditworthy.
When a Portfolio purchases Assignments from Lenders it will acquire direct rights against the borrower on the Loan. However, because Assignments are arranged through private negotiations between potential assignees and potential assignors, the rights and obligations acquired by a Portfolio as the purchaser of an Assignment may differ from, and be more limited than, those held by the assigning Lender. Because there is no liquid market for Loan Participations and Assignments, it is likely that such securities could be sold only to a limited number of institutional investors. The lack of a liquid secondary market may have an adverse impact on the value of such securities and a Portfolio's ability to dispose of particular Assignments or Participations when necessary to meet a Portfolio's liquidity needs or in response to a specific economic event, such as a deterioration in the creditworthiness of the borrower. The lack of a liquid secondary market for Loan Participations and Assignments also may make it more difficult for a Portfolio to assign a value to these securities for purposes of valuing a Portfolio's securities and calculating its net asset value.
Loan Participations and Assignments involve a risk of loss in case of default or insolvency of the borrower. In addition, they may offer less legal protection to a Portfolio in the event of fraud or misrepresentation and may involve a risk of insolvency of the Lender. Certain Loan Participations and Assignments may also include standby financing commitments that obligate the investing Portfolio to supply additional cash to the borrower on demand. Participations involving emerging market country issuers may relate to Loans as to which there has been or currently exists an event of default or other failure to make payment when due, and may represent amounts owed to Lenders that are themselves subject to political and economic risks, including the risk of currency devaluation, expropriation, or failure. Such Loan Participations and Assignments present additional risk of default or loss.
Temporary Investments. When the Adviser believes that changes in economic, financial or political conditions make it advisable, each Portfolio may invest up to 100% of its assets in cash and certain short- and medium-term fixed income securities for temporary defensive purposes. These temporary investments may consist of obligations of the U.S. or foreign governments, their agencies or instrumentalities; money market instruments; and instruments issued by international development agencies.
Zero Coupons, Pay-In-Kind Securities or Deferred Payment Securities. Zero coupon, pay-in-kind and deferred payment securities are all types of fixed income securities on which the holder does not receive periodic cash payments of interest or principal. Generally, these securities are subject to greater price volatility and lesser liquidity in the event of adverse market conditions than comparably rated securities paying cash interest at regular intervals. Although a Portfolio will not receive cash periodic coupon payments on these securities, the Portfolio may be deemed to have received interest income, or "phantom income" during the life of the obligation. The Portfolio may have to pay taxes on this phantom income, although it has not received any cash payment.
Zero Coupons. Zero coupons are fixed income securities that do not make regular interest payments. Instead, zero coupons are sold at a discount from their face value. The difference between a zero coupon's issue or purchase price and its face value represents the imputed interest an investor will earn if the obligation is held until maturity. For tax purposes, a portion of this imputed interest is deemed as income received by zero coupon bondholders each year. Each Portfolio intends to pass along such interest as a component of the Portfolio's distributions of net investment income.
Zero coupons may offer investors the opportunity to earn a higher yield than that available on ordinary interest-paying obligations of similar credit quality and maturity. However, zero coupon prices may also exhibit greater price volatility than ordinary fixed income securities because of the manner in which their principal and interest are returned to the investor.
19
Pay-In-Kind Securities. Pay-in-kind securities are securities that have interest payable by delivery of additional securities. Upon maturity, the holder is entitled to receive the aggregate par value of the securities.
Deferred Payment Securities. Deferred payment securities are securities that remain zero coupons until a predetermined date, at which time the stated coupon rate becomes effective and interest becomes payable at regular intervals.
Floaters. Floaters are fixed income securities with a rate of interest that varies with changes in specified market rates or indices, such as the prime rate, or at specified intervals. Certain floating or variable rate obligations may carry a demand feature that permits the holder to tender them back to the issuer of the underlying instrument, or to a third party, at par value prior to maturity. When the demand feature of certain floating or variable rate obligations represents an obligation of a foreign entity, the demand feature will be subject to certain risks discussed under "Foreign Investment."
Inverse Floaters. Inverse floating rate obligations are obligations which pay interest at rates that vary inversely with changes in market rates of interest. Because the interest rate paid to holders of such obligations is generally determined by subtracting a variable or floating rate from a predetermined amount, the interest rate paid to holders of such obligations will decrease as such variable or floating rate increases and increase as such variable or floating rate decreases.
Like most other fixed income securities, the value of inverse floaters will decrease as interest rates increase. They are more volatile, however, than most other fixed income securities because the coupon rate on an inverse floater typically changes at a multiple of the change in the relevant index rate. Thus, any rise in the index rate (as a consequence of an increase in interest rates) causes a correspondingly greater drop in the coupon rate of an inverse floater while a drop in the index rate causes a correspondingly greater increase in the coupon of an inverse floater. Some inverse floaters may also increase or decrease substantially because of changes in the rate of prepayments.
Eurodollar and Yankee Dollar Obligations. Eurodollar and Yankee dollar obligations are fixed income securities that include time deposits, which are non-negotiable deposits maintained in a bank for a specified period of time at a stated interest rate. The Eurodollar obligations may include bonds issued and denominated in euros (the new currency implemented on January 1, 1999 by the countries participating in the EMU). Eurodollar obligations may be issued by government and corporate issuers in Europe. Yankee bank obligations, which include time deposits and certificates of deposit, are U.S. dollar-denominated obligations issued in the U.S. capital markets by foreign banks. Eurodollar bank obligations, which include time deposits and certificates of deposit, are U.S. dollar-denominated obligations issued outside the U.S. capital markets by foreign branches of U.S. banks and by foreign banks. The Portfolios may consider Yankee dollar obligations to be domestic securities for purposes of their investment policies.
Eurodollar and Yankee dollar obligations are subject to the same risks as domestic issues, notably credit risk, market risk and liquidity risk. However, Eurodollar (and to a limited extent, Yankee dollar) obligations are also subject to certain sovereign risks. One such risk is the possibility that a sovereign country might prevent capital from flowing across its borders. Other risks include adverse political and economic developments; the extent and quality of government regulations of financial markets and institutions; the imposition of foreign withholding taxes; and the expropriation or nationalization of foreign issuers.
FOREIGN INVESTMENT
Investing in foreign securities involves certain special considerations which are not typically associated with investments in the securities of U.S. issuers. Foreign issuers are not generally subject to uniform accounting, auditing and financial reporting standards and may have policies that are not comparable to those of domestic issuers. As a result, there may be less information available about foreign issuers than about domestic issuers. Securities of some foreign issuers may be less liquid and more volatile than securities of comparable domestic issuers. There is generally less government supervision and regulation of stock exchanges, brokers and listed issuers than in the United States. In addition, with respect to certain foreign countries, there is a possibility of expropriation or confiscatory taxation, political and social instability, or diplomatic developments which could affect U.S. investments in those countries. The costs of investing in foreign countries frequently are higher than the costs of investing in the United States. Although the Adviser endeavors to achieve the most favorable execution costs in portfolio transactions, fixed commissions on many foreign stock exchanges are generally higher than negotiated commissions on U.S. exchanges. In addition, investments in certain foreign markets which have
20
historically been considered stable may become more volatile and subject to increased risk due to ongoing developments and changing conditions in such markets. Moreover, the growing interconnectivity of global economies and financial markets has increased the probability that adverse developments and conditions in one country or region will affect the stability of economies and financial markets in other countries or regions.
Investments in securities of foreign issuers may be denominated in foreign currencies. Accordingly, the value of a Portfolio's assets, as measured in U.S. dollars, may be affected favorably or unfavorably by changes in currency exchange rates and in exchange control regulations. A Portfolio may incur costs in connection with conversions between various currencies.
Certain foreign governments may levy withholding or other taxes on dividend and interest income. Although in some countries a portion of these taxes may be recoverable, the non-recovered portion of foreign withholding taxes will reduce the income received from investments in such countries. The Portfolios may be able to claim a credit for U.S. tax purposes with respect to any such foreign taxes.
The Adviser may consider an issuer to be from a particular country (including the United States) or geographic region if (i) its principal securities trading market is in that country or geographic region; (ii) alone or on a consolidated basis it derives 50% or more of its annual revenue from goods produced, sales made or services performed in that country or geographic region; or (iii) it is organized under the laws of, or has a principal office in, that country or geographic region. By applying these tests, it is possible that a particular issuer could be deemed to be from more than one country or geographic region.
Foreign Equity Securities. Foreign equity securities are equity securities of a non-U.S. issuer.
Foreign Government Fixed Income Securities. Foreign government fixed income securities are fixed income securities issued by a government other than the U.S. government or government-related issuer in a country other than the United States.
Foreign Corporate Fixed Income Securities. Foreign corporate fixed income securities are fixed income securities issued by a private issuer in a country other than the United States.
Emerging Market Securities. Certain Portfolios may invest in emerging market securities. An emerging market security is one issued by a foreign government or private issuer that has one or more of the following characteristics: (i) its principal securities trading market is in an emerging market or developing country, (ii) alone or on a consolidated basis it derives 50% or more of its annual revenue from goods produced, sales made or services performed in emerging markets or (iii) it is organized under the laws of, or has a principal office in, an emerging market or developing country. Based on these criteria it is possible for a security to be considered issued by an issuer in more than one country. Therefore, it is possible for the securities of any issuer that has one or more of these characteristics in connection with any emerging market or developing country not to be considered an emerging market security if it has one or more of these characteristics in connection with a developed country.
Emerging market describes any country which is generally considered to be an emerging or developing country by major organizations in the international financial community, such as the International Bank for Reconstruction and Development (more commonly known as the World Bank) and the International Finance Corporation or the Portfolio's benchmark index. Emerging markets can include every nation in the world except the United States, Canada, Japan, Australia, New Zealand and most nations located in Western Europe.
The economies of individual emerging market or developing countries may differ favorably or unfavorably from the U.S. economy in such respects as growth of gross domestic product, rate of inflation or deflation, currency depreciation, capital reinvestment, resource self-sufficiency and balance of payments position. Further, the economies of developing countries generally are heavily dependent upon international trade and, accordingly, have been, and may continue to be, adversely affected by trade barriers, exchange controls, managed adjustments in relative currency values and other protectionist measures. These economies also have been, and may continue to be, adversely affected by economic conditions in the countries with which they trade.
Prior governmental approval for foreign investments may be required under certain circumstances in some emerging market or developing countries, and the extent of foreign investment in certain fixed income securities and domestic companies may be subject to limitation in other emerging market or developing countries. Foreign ownership limitations also may be imposed by the charters of individual companies in emerging market or developing countries to prevent, among other concerns, violation of foreign investment limitations. Repatriation of investment income, capital and the proceeds of sales by foreign investors may require governmental registration
21
and/or approval in some emerging countries. A Portfolio could be adversely affected by delays in, or a refusal to grant, any required governmental registration or approval for such repatriation. Any investment subject to such repatriation controls will be considered illiquid if it appears reasonably likely that this process will take more than seven days.
Investment in emerging market or developing countries may entail purchasing securities issued by or on behalf of entities that are insolvent, bankrupt, in default or otherwise engaged in an attempt to reorganize or reschedule their obligations and in entities that have little or no proven credit rating or credit history. In any such case, the issuer's poor or deteriorating financial condition may increase the likelihood that the Portfolio will experience losses or diminution in available gains due to bankruptcy, insolvency or fraud. Emerging market or developing countries also pose the risk of nationalization, expropriation or confiscatory taxation, political changes, government regulation, social instability or diplomatic developments (including war) that could adversely affect the economies of such countries or the value of a Portfolio's investments in those countries. In addition, it may be difficult to obtain and enforce a judgment in a court outside the United States.
A Portfolio may also be exposed to an extra degree of custodial and/or market risk, especially where the securities purchased are not traded on an official exchange or where ownership records regarding the securities are maintained by an unregulated entity (or even the issuer itself).
Foreign Currency Transactions. The U.S. dollar value of the assets of the Portfolios, to the extent they invest in securities denominated in foreign currencies, may be affected favorably or unfavorably by changes in foreign currency exchange rates and exchange control regulations, and the Portfolios may incur costs in connection with conversions between various currencies. The Portfolios may conduct their foreign currency exchange transactions on a spot (i.e., cash) basis at the spot rate prevailing in the foreign currency exchange market. The Portfolios also may manage their foreign currency transactions by entering into foreign currency forward exchange contracts to purchase or sell foreign currencies or by using other instruments and techniques described under "Derivatives" below.
Under normal circumstances, consideration of the prospect for changes in the values of currency will be incorporated into the long-term investment decisions made with regard to overall diversification strategies. However, the Adviser believes that it is important to have the flexibility to use such derivative products when it determines that it is in the best interests of a Portfolio. It may not be practicable to hedge foreign currency risk in all markets, particularly emerging markets.
Foreign Currency Warrants. Certain Portfolios may invest in foreign currency warrants, which entitle the holder to receive from the issuer an amount of cash (generally, for warrants issued in the United States, in U.S. dollars) which is calculated pursuant to a predetermined formula and based on the exchange rate between a specified foreign currency and the U.S. dollar as of the exercise date of the warrant. Foreign currency warrants generally are exercisable upon their issuance and expire as of a specified date and time.
Foreign currency warrants have been issued in connection with U.S. dollar-denominated debt offerings by major corporate issuers in an attempt to reduce the foreign currency exchange risk which, from the point of view of prospective purchasers of the securities, is inherent in the international fixed income marketplace. Foreign currency warrants may attempt to reduce the foreign exchange risk assumed by purchasers of a security by, for example, providing for a supplemental payment in the event that the U.S. dollar depreciates against the value of a major foreign currency such as the Japanese Yen. The formula used to determine the amount payable upon exercise of a foreign currency warrant may make the warrant worthless unless the applicable foreign currency exchange rate moves in a particular direction (e.g., unless the U.S. dollar appreciates or depreciates against the particular foreign currency to which the warrant is linked or indexed). Foreign currency warrants are severable from the debt obligations with which they may be offered, and may be listed on exchanges.
Foreign currency warrants may be exercisable only in certain minimum amounts, and an investor wishing to exercise warrants who possesses less than the minimum number required for exercise may be required either to sell the warrants or to purchase additional warrants, thereby incurring additional transaction costs. In the case of any exercise of warrants, there may be a delay between the time a holder of warrants gives instructions to exercise and the time the exchange rate relating to exercise is determined, during which time the exchange rate could change significantly, thereby affecting both the market and cash settlement values of the warrants being exercised. The expiration date of the warrants may be accelerated if the warrants should be delisted from an exchange or if their trading should be suspended permanently, which would result in the loss of any remaining "time value" of the warrants (i.e., the difference between the current market value and the exercise value of the warrants), and, in the case where the warrants were "out-of-the-money," in a total loss of the purchase price of the warrants.
22
Foreign currency warrants are generally unsecured obligations of their issuers and are not standardized foreign currency options issued by the Options Clearing Corporation ("OCC"). Unlike foreign currency options issued by the OCC, the terms of foreign exchange warrants generally will not be amended in the event of governmental or regulatory actions affecting exchange rates or in the event of the imposition of other regulatory controls affecting the international currency markets. The initial public offering price of foreign currency warrants is generally considerably in excess of the price that a commercial user of foreign currencies might pay in the interbank market for a comparable option involving significantly larger amounts of foreign currencies. Foreign currency warrants are subject to complex political or economic factors.
Principal Exchange Rate Linked Securities. Principal exchange rate linked securities are debt obligations the principal on which is payable at maturity in an amount that may vary based on the exchange rate between the U.S. dollar and a particular foreign currency at or about that time. The return on "standard" principal exchange rate linked securities is enhanced if the foreign currency to which the security is linked appreciates against the U.S. dollar, and is adversely affected by increases in the foreign exchange value of the U.S. dollar; "reverse" principal exchange rate linked securities are like the "standard" securities, except that their return is enhanced by increases in the value of the U.S. dollar and adversely impacted by increases in the value of foreign currency. Interest payments on the securities are generally made in U.S. dollars at rates that reflect the degree of foreign currency risk assumed or given up by the purchaser of the notes (i.e., at relatively higher interest rates if the purchaser has assumed some foreign currency risk).
Brady Bonds. Brady Bonds are fixed income securities that are created through the exchange of existing commercial bank loans to foreign entities for new obligations in connection with debt restructuring under a plan introduced by Nicholas F. Brady when he was the U.S. Secretary of the Treasury. They may be collateralized or uncollateralized and issued in various currencies (although most are U.S. dollar-denominated) and they are actively traded in the over-the-counter ("OTC") secondary market. A Portfolio will invest in Brady Bonds only if they are consistent with the Portfolio's quality specifications. Dollar-denominated, collateralized Brady Bonds may be fixed rate par bonds or floating rate discount bonds. Interest payments on Brady Bonds generally are collateralized by cash or securities in an amount that, in the case of fixed rate bonds, is equal to at least one year of rolling interest payments or, in the case of floating rate bonds, initially is equal to at least one year's rolling interest payments based on the applicable interest rate at that time and is adjusted at regular intervals thereafter. Certain Brady Bonds are entitled to "value recovery payments" in certain circumstances, which in effect constitute supplemental interest payments but generally are not collateralized.
Brady Bonds are often viewed as having three or four valuation components: (i) the collateralized repayment of principal at final maturity; (ii) the collateralized interest payments; (iii) the uncollateralized interest payments; and (iv) any uncollateralized repayment of principal at maturity (these uncollateralized amounts constitute the "residual risk"). In the event of a default with respect to collateralized Brady Bonds as a result of which the payment obligations of the issuer are accelerated, the U.S. Treasury zero coupon obligations held as collateral for the payment of principal will not be distributed to investors, nor will such obligations be sold and the proceeds distributed. The collateral will be held by the collateral agent to the scheduled maturity of the defaulted Brady Bonds, which will continue to be outstanding, at which time the face amount of the collateral will equal the principal payments due on the Brady Bonds in the normal course. However, Brady Bonds should be viewed as speculative in light of the history of defaults with respect to commercial bank loans by public and private entities of countries issuing Brady Bonds.
Investment Funds. Some emerging market countries have laws and regulations that currently preclude direct investment or make it undesirable to invest directly in the securities of their companies. However, indirect investment in the securities of companies listed and traded on the stock exchanges in these countries is permitted by certain emerging market countries through investment funds that have been specifically authorized. A Portfolio may invest in these investment funds subject to the provisions of the 1940 Act, as applicable, and other applicable laws.
OTHER SECURITIES AND INVESTMENT STRATEGIES
Loans of Portfolio Securities. Each Portfolio may lend its portfolio securities to brokers, dealers, banks and other institutional investors. By lending its portfolio securities, a Portfolio attempts to increase its net investment income through the receipt of interest on the cash collateral with respect to the loan or fees received from the borrower in connection with the loan. Any gain or loss in the market price of the securities loaned that might occur during the term of the loan would be for the account of the Portfolio. The Portfolios employ an agent to implement the securities lending program and the agent receives a fee from the Portfolios for its services. A Portfolio will not lend more than 331/3% of the value of its total assets.
23
Each Portfolio may lend its portfolio securities so long as the terms, structure and the aggregate amount of such loans are not inconsistent with the 1940 Act or the rules and regulations or interpretations of the SEC thereunder, which currently require that (i) the borrower pledge and maintain with the Portfolio collateral consisting of liquid, unencumbered assets having a value at all times not less than 100% of the value of the securities loaned; (ii) the borrower add to such collateral whenever the price of the securities loaned rises (i.e., the borrower "marks to market" on a daily basis); (iii) the loan be made subject to termination by the Portfolio at any time; and (iv) the Portfolio receives a reasonable return on the loan (which may include the Portfolio investing any cash collateral in interest bearing short-term investments), any distributions on the loaned securities and any increase in their market value. In addition, voting rights may pass with the loaned securities, but the Portfolio will retain the right to call any security in anticipation of a vote that the Adviser deems material to the security on loan.
There may be risks of delay and costs involved in recovery of securities or even loss of rights in the collateral should the borrower of the securities fail financially. These delays and costs could be greater for foreign securities. However, loans will be made only to borrowers deemed by the Adviser to be creditworthy and when, in the judgment of the Adviser, the income which can be earned from such securities loans justifies the attendant risk. All relevant facts and circumstances, including the creditworthiness of the broker, dealer, bank or institution, will be considered in making decisions with respect to the lending of securities, subject to review by the Fund's Board of Directors. Each Portfolio loaning securities also bears the risk that the reinvestment of collateral will result in a principal loss. Finally, there is the risk that the price of the securities will increase while they are on loan and the collateral will not be adequate to cover their value.
Non-Publicly Traded Securities, Private Placements and Restricted Securities. The Portfolios may invest in securities that are neither listed on a stock exchange nor traded OTC, including privately placed and restricted securities. Such unlisted securities may involve a higher degree of business and financial risk that can result in substantial losses. As a result of the absence of a public trading market for these securities, they may be less liquid than publicly traded securities. Although these securities may be resold in privately negotiated transactions, the prices realized from these sales could be less than those originally paid by the Portfolio or less than what may be considered the fair value of such securities. Furthermore, companies whose securities are not publicly traded may not be subject to the disclosure and other investor protection requirements which might be applicable if their securities were publicly traded. If such securities are required to be registered under the securities laws of one or more jurisdictions before being sold, a Portfolio may be required to bear the expenses of registration.
As a general matter, a Portfolio may not invest more than 15% of its net assets in illiquid securities, such as securities for which there is not a readily available secondary market or securities that are restricted from sale to the public without registration. However, certain Restricted Securities can be offered and sold to qualified institutional buyers under Rule 144A under the Securities Act of 1933, as amended (the "1933 Act") ("Rule 144A Securities"), and may be deemed to be liquid under guidelines adopted by the Fund's Board of Directors. The Portfolios may invest without limit in liquid Rule 144A Securities. Rule 144A Securities may become illiquid if qualified institutional buyers are not interested in acquiring the securities.
The Portfolios may purchase equity securities in a private placement that are issued by issuers who have outstanding, publicly-traded equity securities of the same class ("private investments in public equity" or "PIPES"). Shares in PIPES generally are not registered with the SEC until after a certain time period from the date the private sale is completed. This restricted period can last many months. Until the public registration process is completed, PIPES are restricted as to resale and the Portfolios cannot freely trade the securities. Generally, such restrictions cause the PIPES to be illiquid during this time. PIPES may contain provisions that the issuer will pay specified financial penalties to the holder if the issuer does not publicly register the restricted equity securities within a specified period of time, but there is no assurance that the restricted equity securities will be publicly registered, or that the registration will remain in effect.
When-Issued and Delayed Delivery Securities. From time to time, the Portfolios may purchase securities on a when-issued or delayed delivery basis or may purchase or sell securities on a forward commitment basis. When these transactions are negotiated, the price is fixed at the time of the commitment, but delivery and payment can take place a month or more after the date of commitment. The Portfolios may sell the securities before the settlement date, if it is deemed advisable. The securities so purchased or sold are subject to market fluctuation and no interest or dividends accrue to the purchaser prior to the settlement date.
At the time a Portfolio makes the commitment to purchase or sell securities on a when-issued, delayed delivery or forward commitment basis, it will record the transaction and thereafter reflect the value, each day, of such security
24
purchased, or if a sale, the proceeds to be received, in determining its net asset value. At the time of delivery of the securities, their value may be more or less than the purchase or sale price. An increase in the percentage of a Portfolio's assets committed to the purchase of securities on a when-issued, delayed delivery or forward commitment basis may increase the volatility of its net asset value. Each Portfolio will also earmark or segregate cash or liquid assets or on the Portfolio's books in which it will continually maintain cash or cash equivalents or other liquid portfolio securities equal in value to commitments to purchase securities on a when-issued, delayed delivery or forward commitment basis.
Borrowing for Investment Purposes. Borrowing for investment purposes creates leverage which is a speculative characteristic. Portfolios authorized to borrow will do so only when the Adviser believes that borrowing will benefit the Portfolio after taking into account considerations such as the costs of borrowing and the likely investment returns on securities purchased with borrowed funds. Borrowing by a Portfolio will create the opportunity for increased net income but, at the same time, will involve special risk considerations. Leverage that results from borrowing will magnify declines as well as increases in a Portfolio's net asset value per share and net yield. Each Portfolio that engages in borrowing expects that all of its borrowing will be made on a secured basis. The Portfolio will either segregate the assets securing the borrowing for the benefit of the lenders or arrangements will be made with a suitable sub-custodian. If assets used to secure the borrowing decrease in value, a Portfolio may be required to pledge additional collateral to the lender in the form of cash or securities to avoid liquidation of those assets.
Temporary Borrowing. Each Portfolio is permitted to borrow from banks in an amount up to 10% of its total assets for extraordinary or emergency purposes, except that the Emerging Markets Domestic Debt Portfolio may borrow in accordance with fundamental investment limitation number (5) below. For example, the Portfolios may borrow for temporary defensive purposes or to meet shareholder redemptions when the Adviser believes that it would not be in the best interests of a Portfolio to liquidate portfolio holdings. Each Portfolio (other than the Emerging Markets Domestic Debt Portfolio) will not purchase additional securities while temporary borrowings exceed 5% of its total assets.
The Board of Directors of the Fund has approved procedures whereby the Portfolios together with other investment companies advised by the Adviser or its affiliates may enter into a joint line of credit arrangement with a bank. Each Portfolio would be liable only for its own temporary borrowings under the joint line of credit arrangements.
Reverse Repurchase Agreements. Under a reverse repurchase agreement, a Portfolio sells a security and promises to repurchase that security at an agreed upon future date and price. The price paid to repurchase the security reflects interest accrued during the term of the agreement. The Portfolio will earmark cash or liquid assets or establish a segregated account holding cash and other liquid assets in an amount not less than the purchase obligations of the agreement. Reverse repurchase agreements may be viewed as a speculative form of borrowing called leveraging. A Portfolio may invest in reverse repurchase agreements if (i) interest earned from leveraging exceeds the interest expense of the original reverse repurchase transaction and (ii) proceeds from the transaction are not invested for longer than the term of the reverse repurchase agreement.
Short Sales. A short sale is a transaction in which a Portfolio sells securities that it owns or has the right to acquire at no added cost (i.e., "against the box") or does not own (but has borrowed) in anticipation of a decline in the market price of the securities. To deliver the securities to the buyer, the Portfolio arranges through a broker to borrow the securities and, in so doing, the Portfolio becomes obligated to replace the securities borrowed at their market price at the time of replacement. When selling short, the Portfolio intends to replace the securities at a lower price and therefore, profit from the difference between the cost to replace the securities and the proceeds received from the sale of the securities. When the Portfolio makes a short sale, the proceeds it receives from the sale will be held on behalf of a broker until the Portfolio replaces the borrowed securities. The Portfolio may have to pay a premium to borrow the securities and must pay any dividends or interest payable on the securities until they are replaced.
The Portfolio's obligation to replace the securities borrowed in connection with a short sale will be secured by collateral deposited with the broker that consists of cash or other liquid securities. In addition, the Portfolio will earmark cash or liquid assets or place in a segregated account an amount of cash or other liquid assets equal to the difference, if any, between (i) the current market value of the securities sold at the time they were sold short, and (ii) any cash or other liquid securities deposited as collateral with the broker in connection with the short sale. This amount will be adjusted daily to reflect changes in the value of the securities sold short. A Portfolio also can cover its obligations by owning another security (such as a call option) giving it the right to obtain the same kind and amount of the security it sold short. Short sales by the Portfolio involve certain risks and special considerations. If
25
the Adviser incorrectly predicts that the price of the borrowed security will decline, the Portfolio will have to replace the securities with securities with a greater value than the amount received from the sale. As a result, losses from short sales differ from losses that could be incurred from a purchase of a security, because losses from short sales may be unlimited, whereas losses from purchases can equal only the total amount invested.
DERIVATIVES
Certain Portfolios may, but are not required to, use various derivatives and related investment strategies as described below. Derivatives may be used for a variety of purposes including hedging, risk management, portfolio management or to earn income. Any or all of the investment techniques described herein may be used at any time and there is no particular strategy that dictates the use of one technique rather than another, as the use of any derivative by a Portfolio is a function of numerous variables, including market conditions. A Portfolio complies with applicable regulatory requirements when using derivatives, including the segregation or earmarking of cash or liquid assets when mandated by the SEC rules or SEC staff positions. Although the Adviser seeks to use derivatives to further a Portfolio's investment objective, no assurance can be given that the use of derivatives will achieve this result.
General Risks of Derivatives. Derivatives utilized by a Portfolio may involve the purchase and sale of derivative instruments. A derivative is a financial instrument the value of which depends upon (or derives from) the value of another asset, security, interest rate or index. Derivatives may relate to a wide variety of underlying instruments, including equity and debt securities, indexes, interest rates, currencies and other assets. Certain derivative instruments which a Portfolio may use and the risks of those instruments are described in further detail below. A Portfolio may in the future also utilize derivatives techniques, instruments and strategies that may be newly developed or permitted as a result of regulatory changes, consistent with a Portfolio's investment objective and policies. Such newly developed techniques, instruments and strategies may involve risks different than or in addition to those described herein. No assurance can be given that any derivatives strategy employed by a Portfolio will be successful.
The risks associated with the use of derivatives are different from, and possibly greater than, the risks associated with investing directly in the instruments underlying such derivatives. Derivatives are highly specialized instruments that require investment techniques and risk analyses different from other portfolio investments. The use of derivative instruments requires an understanding not only of the underlying instrument but also of the derivative itself. Certain risk factors generally applicable to derivative transactions are described below.
• Derivatives are subject to the risk that the market value of the derivative itself or the market value of underlying instruments will change in a way adverse to a Portfolio's interests. A Portfolio bears the risk that the Adviser may incorrectly forecast future market trends and other financial or economic factors or the value of the underlying security, index, interest rate or currency when establishing a derivatives position for a Portfolio.
• Derivatives may be subject to pricing risk, which exists when a derivative becomes extraordinarily expensive (or inexpensive) relative to historical prices or corresponding instruments. Under such market conditions, it may not be economically feasible to initiate a transaction or liquidate a position at an advantageous time or price.
• Many derivatives are complex and often valued subjectively. Improper valuations can result in increased payment requirements to counterparties or a loss of value to a Portfolio.
• Using derivatives as a hedge against a portfolio investment subjects a Portfolio to the risk that the derivative will have imperfect correlation with the portfolio investment, which could result in a Portfolio incurring substantial losses. This correlation risk may be greater in the case of derivatives based on an index or other basket of securities, as the portfolio securities being hedged may not duplicate the components of the underlying index or the basket may not be of exactly the same type of obligation as those underlying the derivative. The use of derivatives for "cross hedging" purposes (using a derivative based on one instrument as a hedge on a different instrument) may also involve greater correlation risks.
• While using derivatives for hedging purposes can reduce a Portfolio's risk of loss, it may also limit a Portfolio's opportunity for gains or result in losses by offsetting or limiting a Portfolio's ability to participate in favorable price movements in portfolio investments.
• Derivatives transactions for non-hedging purposes involve greater risks and may result in losses which would not be offset by increases in the value of portfolio securities or declines in the cost of securities to be acquired. In the event that a Portfolio enters into a derivatives transaction as an alternative to purchasing
26
or selling the underlying instrument or in order to obtain desired exposure to an index or market, a Portfolio will be exposed to the same risks as are incurred in purchasing or selling the underlying instruments directly.
• The use of certain derivatives transactions involves the risk of loss resulting from the insolvency or bankruptcy of the counterparty to the contract or the failure by the counterparty to make required payments or otherwise comply with the terms of the contract. In the event of default by a counterparty, a Portfolio may have contractual remedies pursuant to the agreements related to the transaction.
• Liquidity risk exists when a particular derivative is difficult to purchase or sell. If a derivative transaction is particularly large or if the relevant market is illiquid, a Portfolio may be unable to initiate a transaction or liquidate a position at an advantageous time or price.
• Certain derivatives transactions are not entered into or traded on exchanges or in markets regulated by the U.S. Commodity Futures Trading Commission ("CFTC") or the SEC. Instead, such OTC derivatives are entered into directly by a Portfolio and a counterparty and may be traded only through financial institutions acting as market makers. OTC derivatives transactions can only be entered into with a willing counterparty that is approved by the Adviser in accordance with guidelines established by the Board. Where no such counterparty is available, a Portfolio will be unable to enter into a desired OTC transaction. There also may be greater risk that no liquid secondary market in the trading of OTC derivatives will exist, in which case a Portfolio may be required to hold such instruments until exercise, expiration or maturity. Many of the protections afforded to exchange participants are not available to participants in OTC derivatives transactions. OTC derivatives transactions are not subject to the guarantee of an exchange or clearinghouse and, as a result, a Portfolio would bear greater risk of default by the counterparties to such transactions.
• A Portfolio may be required to make physical delivery of portfolio securities underlying a derivative in order to close out a derivatives position or to sell portfolio securities at a time or price at which it may be disadvantageous to do so in order to obtain cash to close out or to maintain a derivatives position.
• As a result of the structure of certain derivatives, adverse changes in the value of the underlying instrument can result in losses substantially greater than the amount invested in the derivative itself. Certain derivatives have the potential for unlimited loss, regardless of the size of the initial investment.
• Certain derivatives may be considered illiquid and therefore subject to a Portfolio's limitation on investments in illiquid securities.
• Derivatives transactions conducted outside the United States may not be conducted in the same manner as those entered into on U.S. exchanges, and may be subject to different margin, exercise, settlement or expiration procedures. Brokerage commissions, clearing costs and other transaction costs may be higher on foreign exchanges. Many of the risks of OTC derivatives transactions are also applicable to derivatives transactions conducted outside the United States. Derivatives transactions conducted outside the United States are subject to the risk of governmental action affecting the trading in, or the prices of, foreign securities, currencies and other instruments. The value of such positions could be adversely affected by foreign political and economic factors; lesser availability of data on which to make trading decisions; delays on a Portfolio's ability to act upon economic events occurring in foreign markets; and less liquidity than U.S. markets.
• Currency derivatives are subject to additional risks. Currency derivatives transactions may be negatively affected by government exchange controls, blockages and manipulations. Currency exchange rates may be influenced by factors extrinsic to a country's economy. There is no systematic reporting of last sale information with respect to foreign currencies. As a result, the available information on which trading in currency derivatives will be based may not be as complete as comparable data for other transactions. Events could occur in the foreign currency market which will not be reflected in currency derivatives until the following day, making it more difficult for a Portfolio to respond to such events in a timely manner.
Regulatory Matters. As described herein, a Portfolio may be required to cover its potential economic exposure to certain derivatives transactions by holding an offsetting financial position and/or earmarking or segregating cash or liquid assets equal in value to a Portfolio's potential economic exposure under the transaction. A Portfolio will cover such transactions as described herein or in such other manner in accordance with applicable laws and regulations. Assets used to cover derivatives transactions cannot be sold while the derivatives position is open, unless they are replaced by other appropriate assets. Earmarked or segregated cash or liquid assets and assets held in margin accounts are not otherwise available to a Portfolio for investment purposes. If a large portion of a
27
Portfolio's assets are used to cover derivatives transactions or are otherwise earmarked or segregated, it could affect portfolio management or a Portfolio's ability to meet redemption requests or other current obligations. With respect to derivatives which are cash-settled (i.e., have no physical delivery requirement), a Portfolio is permitted to set aside liquid assets in an amount equal to a Portfolio's daily marked-to-market net obligations (i.e., a Portfolio's daily net liability) under the derivative, if any, rather than the derivative's full notional value or the market value of the instrument underlying the derivative, as applicable. By setting aside assets equal to only its net obligations under cash-settled derivatives, a Portfolio will have the ability to employ leverage to a greater extent than if a Portfolio were required to segregate assets equal to the full notional amount of the derivative or the market value of the underlying instrument, as applicable.
Regulatory developments affecting the exchange-traded and OTC derivatives markets may impair a Portfolio's ability to manage or hedge its investment portfolio through the use of derivatives. The Dodd-Frank Wall Street Reform and Consumer Protection Act (the "Dodd-Frank Act") and the rules promulgated thereunder may limit the ability of a Portfolio to enter into one or more exchange-traded or OTC derivatives transactions. In particular, pursuant to authority granted under the Dodd-Frank Act, the CFTC in October 2011 promulgated final rules that impose new federal position limits on listed futures and options contracts on, and economically equivalent OTC derivatives referencing, 28 individual agricultural, metal and energy commodities. A Portfolio's futures and options positions in these 28 contracts will be aggregated with its positions, if any, in economically equivalent OTC derivatives referencing these contracts. These new position limits, which will be imposed on a Portfolio and its counterparties, may impact a Portfolio's ability to invest in futures, options and swaps in a manner that efficiently meets its investment objectives. Derivatives positions of all investment companies advised by the Adviser are combined for purposes of these limits. An exchange may order the liquidation of positions found to be in excess of these limits and may impose certain other sanctions or restrictions.
A Portfolio's use of derivatives may be limited by the requirements of the Code for qualification as a regulated investment company for U.S. federal income tax purposes.
In February 2012, the CFTC adopted certain regulatory changes that may impact the Fund by subjecting the Adviser to registration with the CFTC as the commodity pool operator ("CPO") of a Portfolio, unless the Portfolio is able to comply with certain trading and marketing limitations on its investments in futures and certain other instruments. If the Adviser becomes subject to CFTC registration as a CPO, the disclosure and operations of a Portfolio would need to comply with all applicable CFTC regulations. Compliance with these additional registration and regulatory requirements would increase Portfolio expenses.
Forwards. A foreign currency forward exchange contract is a negotiated agreement between two parties to exchange specified amounts of two or more currencies at a specified future time at a specified rate. The rate specified by the foreign currency forward exchange contract can be higher or lower than the spot rate between the currencies that are the subject of the contract. Currency futures are similar to foreign currency forward exchange contracts, except that they are traded on an exchange and standardized as to contract size and delivery date. Most currency futures call for payment or delivery in U.S. dollars. Unanticipated changes in currency prices may result in losses to a Portfolio and poorer overall performance for a Portfolio than if it had not entered into foreign currency forward exchange contracts. Certain Portfolios may enter into foreign currency forward exchange contracts under various circumstances. The typical use of a foreign currency forward exchange contract is to "lock in" the price of a security in U.S. dollars or some other foreign currency, which a Portfolio is holding in its portfolio. By entering into a foreign currency forward exchange contract for the purchase or sale, for a fixed amount of dollars or other currency, of the amount of foreign currency involved in the underlying security transactions, a Portfolio may be able to protect itself against a possible loss resulting from an adverse change in the relationship between the U.S. dollar or other currency which is being used for the security purchase and the foreign currency in which the security is denominated during the period between the date on which the security is purchased or sold and the date on which payment is made or received. The Adviser also may from time to time utilize foreign currency forward exchange contracts for other purposes. For example, they may be used to hedge a foreign security held in the portfolio or a security which pays out principal tied to an exchange rate between the U.S. dollar and a foreign currency, against a decline in value of the applicable foreign currency. They also may be used to lock in the current exchange rate of the currency in which those securities anticipated to be purchased are denominated. At times, a Portfolio may enter into "cross-currency" hedging transactions involving currencies other than those in which securities are held or proposed to be purchased are denominated.
A Portfolio will not enter into foreign currency forward exchange contracts or maintain a net exposure to these contracts where the consummation of the contracts would obligate a Portfolio to deliver an amount of foreign currency in excess of the value of a Portfolio's portfolio securities.
28
When required by law, a Portfolio will segregate or earmark cash, U.S. government securities or other appropriate liquid portfolio securities in an amount equal to the value of a Portfolio's total assets committed to the consummation of foreign currency forward exchange contracts entered into under the circumstances set forth above. If the value of the securities so earmarked declines, additional cash or securities will be segregated or earmarked on a daily basis so that the value of such securities will equal the amount of a Portfolio's commitments with respect to such contracts.
A Portfolio may be limited in its ability to enter into hedging transactions involving foreign currency forward exchange contracts by the Code requirements relating to qualification as a regulated investment company.
Foreign currency forward exchange contracts may limit gains on portfolio securities that could otherwise be realized had they not been utilized and could result in losses. The contracts also may increase a Portfolio's volatility and may involve a significant amount of risk relative to the investment of cash.
Futures Contracts. A futures contract is a standardized agreement to buy or sell a specific quantity of a commodity at a specific price at a specific future time (the "settlement date"). Futures contracts may be based on, among other things, a specified equity security (securities futures), a specified debt security or reference rate (interest rate futures), the value of a specified securities index (index futures) or the value of a foreign currency (forward contracts and currency futures). The value of a futures contract tends to increase and decrease in tandem with the value of the underlying instrument. The buyer of a futures contract agrees to purchase the underlying instrument on the settlement date and is said to be "long" the contract. The seller of a futures contract agrees to sell the underlying instrument on the settlement date and is said to be "short" the contract. Futures contracts call for settlement only on the expiration date and cannot be "exercised" at any other time during their term.
Depending on the terms of the particular contract, futures contracts are settled through either physical delivery of the underlying instrument on the settlement date (such as in the case of securities futures based on a specified debt security) or by payment of a cash settlement amount on the settlement date (such as in the case of futures contracts relating to interest rates, foreign currencies and broad-based securities indexes). In the case of cash settled futures contracts, the settlement amount is equal to the difference between the reference instrument's price on the last trading day of the contract and the reference instrument's price at the time the contract was entered into. Most futures contracts, particularly futures contracts requiring physical delivery, are not held until the settlement date, but instead are offset before the settlement date through the establishment of an opposite and equal futures position (buying a contract that had been sold, or selling a contract that had been purchased). All futures transactions are effected through a clearinghouse associated with the exchange on which the futures are traded.
The buyer and seller of a futures contract are not required to deliver or pay for the underlying commodity unless the contract is held until the settlement date. However, both the buyer and seller are required to deposit "initial margin" with a futures commission merchant when the futures contract is entered into. Initial margin deposits are typically calculated as a percentage of the contract's market value. If the value of either party's position declines, the party will be required to make additional "variation margin" payments to settle the change in value on a daily basis. The process is known as "marking-to-market." Upon the closing of a futures position through the establishment of an offsetting position, a final determination of variation margin will be made and additional cash will be paid by or released to a Portfolio.
In addition, a Portfolio may be required to earmark cash or liquid assets or maintain segregated cash or liquid assets in order to cover futures transactions. A Portfolio will earmark or segregate cash or liquid assets in an amount equal to the difference between the market value of a futures contract entered into by a Portfolio and the aggregate value of the initial and variation margin payments made by a Portfolio with respect to such contract or as otherwise permitted by SEC rules or SEC staff positions. See "Regulatory Matters" below.
Additional Risks of Futures Transactions. The risks associated with futures contract transactions are different from, and possibly greater than, the risks associated with investing directly in the underlying instruments. Futures are highly specialized instruments that require investment techniques and risk analyses different from those associated with other portfolio investments. The use of futures requires an understanding not only of the underlying instrument but also of the futures contract itself. Futures may be subject to the risk factors generally applicable to derivatives transactions described herein, and may also be subject to certain additional risk factors, including:
• The risk of loss in buying and selling futures contracts can be substantial. Small price movements in the commodity underlying a futures position may result in immediate and substantial loss (or gain) to a Portfolio.
29
• Buying and selling futures contracts may result in losses in excess of the amount invested in the position in the form of initial margin. In the event of adverse price movements in the underlying commodity, security, index, currency or instrument, a Portfolio would be required to make daily cash payments to maintain its required margin. A Portfolio may be required to sell portfolio securities, or make or take delivery of the underlying securities in order to meet daily margin requirements at a time when it may be disadvantageous to do so. A Portfolio could lose margin payments deposited with a futures commission merchant if the futures commission merchant breaches its agreement with a Portfolio, becomes insolvent or declares bankruptcy.
• Most exchanges limit the amount of fluctuation permitted in futures contract prices during any single trading day. Once the daily limit has been reached in a particular futures contract, no trades may be made on that day at prices beyond that limit. If futures contract prices were to move to the daily limit for several trading days with little or no trading, a Portfolio could be prevented from prompt liquidation of a futures position and subject to substantial losses. The daily limit governs only price movements during a single trading day and therefore does not limit a Portfolio's potential losses.
• Index futures based upon a narrower index of securities may present greater risks than futures based on broad market indexes, as narrower indexes are more susceptible to rapid and extreme fluctuations as a result of changes in value of a small number of securities.
Options. An option is a contract that gives the holder of the option the right, but not the obligation, to buy from (in the case of a call option) or sell to (in the case of a put option) the seller of the option (the "option writer") the underlying security at a specified fixed price (the "exercise price") on or prior to a specified date (the "expiration date"). The buyer of the option pays to the option writer the option premium, which is the purchase price of the option.
Exchange-traded options are issued by a regulated intermediary such as the Options Clearing Corporation ("OCC"), which guarantees the performance of the obligations of the parties to such options. OTC options are purchased from or sold to counterparties through direct bilateral agreement between the Portfolios and their counterparties. Certain options, such as options on individual securities, are settled through physical delivery of the underlying security, whereas other options, such as index options, may be settled in cash in an amount based on the value of the underlying instrument multiplied by a specified multiplier.
Writing Options. Certain Portfolios may write call and put options. As the writer of a call option, a Portfolio receives the premium from the purchaser of the option and has the obligation, upon exercise of the option, to deliver the underlying security upon payment of the exercise price. If the option expires without being exercised a Portfolio is not required to deliver the underlying security but retains the premium received.
Certain Portfolios may only write call options that are "covered." A call option on a security is covered if (a) a Portfolio owns the security underlying the call or has an absolute and immediate right to acquire that security without additional cash consideration (or, if additional cash consideration is required, such amount is maintained by a Portfolio in segregated or earmarked cash or liquid assets) upon conversion or exchange of other securities held by a Portfolio; or (b) a Portfolio has purchased a call on the underlying security, the exercise price of which is (i) equal to or less than the exercise price of the call written, or (ii) greater than the exercise price of the call written, provided the difference is maintained by a Portfolio in segregated or earmarked cash or liquid assets.
Selling call options involves the risk that a Portfolio may be required to sell the underlying security at a disadvantageous price, below the market price of such security, at the time the option is exercised. As the writer of a covered call option, a Portfolio forgoes, during the option's life, the opportunity to profit from increases in the market value of the underlying security covering the option above the sum of the premium and the exercise price but retains the risk of loss should the price of the underlying security decline.
Certain Portfolios may write put options. As the writer of a put option, a Portfolio receives the premium from the purchaser of the option and has the obligation, upon exercise of the option, to pay the exercise price and receive delivery of the underlying security. If the option expires without being exercised, a Portfolio is not required to receive the underlying security in exchange for the exercise price but retains the option premium.
A Portfolio may only write put options that are "covered." A put option on a security is covered if (a) a Portfolio segregates or earmarks cash or liquid assets equal to the exercise price; or (b) a Portfolio has purchased a put on the same security as the put written, the exercise price of which is (i) equal to or greater than the exercise price of the put written, or (ii) less than the exercise price of the put written, provided the difference is maintained by a Portfolio in segregated or earmarked cash or liquid assets.
30
Selling put options involves the risk that a Portfolio may be required to buy the underlying security at a disadvantageous price, above the market price of such security, at the time the option is exercised. While a Portfolio's potential gain in writing a covered put option is limited to the premium received plus the interest earned on the liquid assets covering the put option, a Portfolio's risks of loss is equal to the entire value of the underlying security, offset only by the amount of the premium received.
A Portfolio may close out an options position which it has written through a closing purchase transaction. A Portfolio would execute a closing purchase transaction with respect to a call option written by purchasing a call option on the same underlying security and having the same exercise price and expiration date as the call option written by a Portfolio. A Portfolio would execute a closing purchase transaction with respect to a put option written by purchasing a put option on the same underlying security and having the same exercise price and expiration date as the put option written by a Portfolio. A closing purchase transaction may or may not result in a profit to a Portfolio. A Portfolio could close out its position as an option writer only if a liquid market exists for options on the same underlying security and having the same exercise date as the option written by a Portfolio. There is no assurance that such a market will exist with respect to any particular option.
The writer of an option generally has no control over the time when the option is exercised and the option writer is required to deliver or acquire the underlying security. Once an option writer has received an exercise notice, it cannot effect a closing purchase transaction in order to terminate its obligation under the option. Thus, the use of options may require a Portfolio to buy or sell portfolio securities at inopportune times or for prices other than the current market values of such securities, may limit the amount of appreciation a Portfolio can realize on an investment, or may cause a Portfolio to hold a security that it might otherwise sell.
Purchasing Options. Certain Portfolios may purchase call and put options. As the buyer of a call option, a Portfolio pays the premium to the option writer and has the right to purchase the underlying security from the option writer at the exercise price. If the market price of the underlying security rises above the exercise price, a Portfolio could exercise the option and acquire the underlying security at a below market price, which could result in a gain to a Portfolio, minus the premium paid. As the buyer of a put option, a Portfolio pays the premium to the option writer and has the right to sell the underlying security to the option writer at the exercise price. If the market price of the underlying security declines below the exercise price, a Portfolio could exercise the option and sell the underlying security at an above market price, which could result in a gain to a Portfolio, minus the premium paid. A Portfolio may buy call and put options whether or not it holds the underlying securities.
As a buyer of a call or put option, a Portfolio may sell put or call options that it has purchased at any time prior to such option's expiration date through a closing sale transaction. The principal factors affecting the market value of a put or a call option include supply and demand, interest rates, the current market price of the underlying security in relation to the exercise price of the option, the volatility of the underlying security, the underlying security's dividend policy, and the time remaining until the expiration date. A closing sale transaction may or may not result in a profit to a Portfolio. A Portfolio's ability to initiate a closing sale transaction is dependent upon the liquidity of the options market and there is no assurance that such a market will exist with respect to any particular option. If a Portfolio does not exercise or sell an option prior to its expiration date, the option expires and becomes worthless.
OTC Options. Unlike exchange-traded options, which are standardized with respect to the underlying instrument, expiration date, contract size and strike price, the terms of OTC options generally are established through negotiation between the parties to the options contract. This type of arrangement allows the purchaser and writer greater flexibility to tailor the option to their needs. OTC options are available for a greater variety of securities or other assets, and in a wider range of expiration dates and exercise prices, than exchange-traded options. However, unlike exchange-traded options, which are issued and guaranteed by a regulated intermediary, such as the OCC, OTC options are entered into directly with the counterparty. Unless the counterparties provide for it, there is no central clearing or guaranty function for an OTC option. Therefore, OTC options are subject to the risk of default or non-performance by the counterparty. Accordingly, the Adviser must assess the creditworthiness of the counterparty to determine the likelihood that the terms of the option will be satisfied. There can be no assurance that a continuous liquid secondary market will exist for any particular OTC option at any specific time. As a result, a Portfolio may be unable to enter into closing sale transactions with respect to OTC options.
Index Options. Call and put options on indices operate similarly to options on securities. Rather than the right to buy or sell a single security at a specified price, options on an index give the holder the right to receive, upon exercise of the option, an amount of cash determined by reference to the value of the underlying index. The underlying index may be a broad-based index or a narrower market index. Unlike many options on securities, all settlements are in cash. The settlement amount, which the writer of an index option must pay to the holder of the
31
option upon exercise, is generally equal to the difference between the fixed exercise price of the option and the value of the underlying index, multiplied by a specified multiplier. The multiplier determines the size of the investment position the option represents. Gain or loss to a Portfolio on index options transactions will depend, in part, on price movements of the underlying index generally or in a particular segment of the index rather than price movements of individual components of the index. As with other options, a Portfolio may close out its position in index options through closing purchase transactions and closing sale transactions provided that a liquid secondary market exists for such options.
Index options written by a Portfolio will generally be covered in a manner similar to the covering of other types of options, by holding an offsetting financial position and/or segregating or earmarking cash or liquid assets. A Portfolio may cover call options written on an index by owning securities or other assets whose price changes, in the opinion of the Adviser, are expected to correlate to those of the underlying index.
Foreign Currency Options. Options on foreign currencies operate similarly to options on securities. Rather than the right to buy or sell a single security at a specified price, options on foreign currencies give the holder the right to buy or sell foreign currency for a fixed amount in U.S. dollars or other base currencies. Options on foreign currencies are traded primarily in the OTC market, but may also be traded on U.S. and foreign exchanges. The value of a foreign currency option is dependent upon the value of the underlying foreign currency relative to the U.S. dollar or other base currency. The price of the option may vary with changes, among other things, in the value of either or both currencies and has no relationship to the investment merits of a foreign security. Options on foreign currencies are affected by all of those factors which influence foreign exchange rates and foreign investment generally. As with other options, a Portfolio may close out its position in foreign currency options through closing purchase transactions and closing sale transactions provided that a liquid market exists for such options.
Foreign currency options written by a Portfolio will generally be covered in a manner similar to the covering of other types of options, by holding an offsetting financial position and/or segregating or earmarking cash or liquid assets.
Additional Risks of Options Transactions. The risks associated with options transactions are different from, and possibly greater than, the risks associated with investing directly in the underlying instruments. Options are highly specialized instruments that require investment techniques and risk analyses different from those associated with other portfolio investments. The use of options requires an understanding not only of the underlying instrument but also of the option itself. Options may be subject to the risk factors generally applicable to derivatives transactions described herein, and may also be subject to certain additional risk factors, including:
• The exercise of options written or purchased by a Portfolio could cause a Portfolio to sell portfolio securities, thus increasing a Portfolio's portfolio turnover.
• A Portfolio pays brokerage commissions each time it writes or purchases an option or buys or sells an underlying security in connection with the exercise of an option. Such brokerage commissions could be higher relative to the commissions for direct purchases of sales of the underlying securities.
• A Portfolio's options transactions may be limited by limitations on options positions established by the SEC, the CFTC or the exchanges on which such options are traded.
• The hours of trading for exchange listed options may not coincide with the hours during which the underlying securities are traded. To the extent that the options markets close before the markets for the underlying securities, significant price and rate movements can take place in the underlying securities that cannot be reflected in the options markets.
• Index options based upon a narrow index of securities or other assets may present greater risks than options based on broad market indexes, as narrower indexes are more susceptible to rapid and extreme fluctuations as a result of changes in the values of a smaller number of securities or other assets.
• A Portfolio is subject to the risk of market movements between the time that an option is exercised and the time of performance thereunder, which could increase the extent of any losses suffered by a Portfolio in connection with options transactions.
Options on Futures Contracts. Options on futures contracts are similar to options on securities except that options on futures contracts give the purchasers the right, in return for the premium paid, to assume a position in a futures contract (a long position in the case of a call option and a short position in the case of a put option) at a specified exercise price at any time prior to the expiration of the option. Upon exercise of the option, the parties will be subject to all of the risks associated with futures transactions and subject to margin requirements. As the
32
writer of options on futures contracts, a Portfolio would also be subject to initial and variation margin requirements on the option position.
Options on futures contracts written by a Portfolio will generally be covered in a manner similar to the covering of other types of options, by holding an offsetting financial position and/or segregating or earmarking cash or liquid assets. A Portfolio may cover an option on a futures contract by purchasing or selling the underlying futures contract. In such instances the exercise of the option will serve to close out a Portfolio's futures position.
Swaps. An OTC swap contract is an agreement between two parties pursuant to which the parties exchange payments at specified dates on the basis of a specified notional amount, with the payments calculated by reference to specified securities, indexes, reference rates, currencies or other instruments. A small percentage of swap contracts are cleared through a central clearinghouse. Most swap agreements provide that when the period payment dates for both parties are the same, the payments are made on a net basis (i.e., the two payment streams are netted out, with only the net amount paid by one party to the other). A Portfolio's obligations or rights under a swap contract entered into on a net basis will generally be equal only to the net amount to be paid or received under the agreement, based on the relative values of the positions held by each counterparty. Most swap agreements are not entered into or traded on exchanges and often there is no central clearing or guaranty function for swaps. These OTC swaps are often subject to the risk of default or non-performance by the counterparty. Accordingly, the Adviser must assess the creditworthiness of the counterparty to determine the likelihood that the terms of the swap will be satisfied.
Swap agreements allow for a wide variety of transactions. For example, fixed rate payments may be exchanged for floating rate payments, U.S. dollar denominated payments may be exchanged for payments denominated in foreign currencies, and payments tied to the price of one security, index, reference rate, currency or other instrument may be exchanged for payments tied to the price of a different security, index, reference rate, currency or other instrument. Swap contracts are typically individually negotiated and structured to provide exposure to a variety of particular types of investments or market factors. Swap contracts can take many different forms and are known by a variety of names. To the extent consistent with a Portfolio's investment objectives and policies, a Portfolio is not limited to any particular form or variety of swap contract. A Portfolio may utilize swaps to increase or decrease its exposure to the underlying instrument, reference rate, foreign currency, market index or other asset. Certain Portfolios may also enter into related derivative instruments including caps, floors and collars.
A Portfolio may be required to cover swap transactions. Obligations under swap agreements entered into on a net basis are generally accrued daily and any accrued but unpaid amounts owed by a Portfolio to the swap counterparty will be covered by earmarking or segregating cash or liquid assets. If a Portfolio enters into a swap agreement on other than a net basis, a Portfolio will earmark or segregate cash or liquid assets with a value equal to the full amount of a Portfolio's accrued obligations under the agreement.
Interest Rate Swaps, Caps, Floors and Collars. Interest rate swaps consist of an agreement between two parties to exchange their respective commitments to pay or receive interest (e.g., an exchange of floating rate payments for fixed rate payments). Interest rate swaps are generally entered into on a net basis. Interest rate swaps do not involved the delivery of securities, other underlying assets, or principal. Accordingly, the risk of loss with respect to interest rate and total rate of return swaps is limited to the net amount of interest payments that a Portfolio is contractually obligated to make.
Certain Portfolios may also buy or sell interest rate caps, floors and collars. The purchase of an interest rate cap entitles the purchaser, to the extent that a specified index exceeds a predetermined interest rate, to receive payments of interest on a specified notional amount from the party selling the interest rate cap. The purchase of an interest rate floor entitles the purchaser, to the extent that a specified index falls below a predetermined interest rate, to receive payments of interest on a specified notional amount from the party selling the interest rate floor. A collar is a combination of a cap and a floor that preserves a certain return within a predetermined range of interest rate of values. Caps, floors and collars may be less liquid than other types of swaps. If a Portfolio sells caps, floors and collars, it will earmark or segregate cash or liquid assets with a value equal to the full amount, accrued daily, of a Portfolio's net obligations with respect to the caps, floors or collars.
Index Swaps. An index swap consists of an agreement between two parties in which a party exchanges a cash flow based on a notional amount of a reference index for a cash flow based on a different index or on another specified instrument or reference rate. Index swaps are generally entered into on a net basis.
Inflation Swaps. Inflation swap agreements are contracts in which one party agrees to pay the cumulative percentage increase in a price index, such as the Consumer Price Index, over the term of the swap (with some lag on the referenced inflation index), and the other party pays a compounded fixed rate. Inflation swap agreements may be used to protect the net asset value of a Portfolio against an unexpected change in the rate of inflation
33
measured by an inflation index. The value of inflation swap agreements is expected to change in response to changes in real interest rates. Real interest rates are tied to the relationship between nominal interest rates and the rate of inflation.
Currency Swaps. A currency swap consists of an agreement between two parties to exchange cash flows on a notional amount of two or more currencies based on the relative value differential among them, such as exchanging a right to receive a payment in foreign currency for the right to receive U.S. dollars. Currency swap agreements may be entered into on a net basis or may involve the delivery of the entire principal value of one designated currency in exchange for the entire principal value of another designated currency. In such cases, the entire principal value of a currency swap is subject to the risk that the counterparty will default on its contractual delivery obligations.
Credit Default Swaps. A credit default swap consists of an agreement between two parties in which the "buyer" agrees to pay to the "seller" a periodic stream of payments over the term of the contract and the seller agrees to pay the buyer the par value (or other agreed-upon value) of a referenced debt obligation upon the occurrence of a credit event with respect to the issuer of the referenced debt obligation. Generally, a credit event means bankruptcy, failure to pay, obligation acceleration or modified restructuring. A Portfolio may be either the buyer or seller in a credit default swap. As the buyer in a credit default swap, a Portfolio would pay to the counterparty the periodic stream of payments. If no default occurs, a Portfolio would receive no benefit from the contract. As the seller in a credit default swap, a Portfolio would receive the stream of payments but would be subject to exposure on the notional amount of the swap, which it would be required to pay in the event of default. A Portfolio will generally earmark or segregate cash or liquid assets to cover any potential obligation under a credit default swap sold by a Portfolio. The use of credit default swaps could result in losses to a Portfolio if the Adviser fails to correctly evaluate the creditworthiness of the issuer of the referenced debt obligation.
Swaptions. An option on a swap agreement, also called a "swaption," is an option that gives the buyer the right, but not the obligation, to enter into a swap on a future date in exchange for paying a market based "premium." A receiver swaption gives the owner the right to receive the total return of a specified asset, reference rate, or index. A payer swaption gives the owner the right to pay the total return of a specified asset, reference rate, or index. Swaptions also include options that allow an existing swap to be terminated or extended by one of the counterparties.
General Risks of Swaps. The risks associated with swap transactions are different from, and possibly greater than, the risks associated with investing directly in the underlying instruments. Swaps are highly specialized instruments that require investment techniques and risk analyses different from those associated with other portfolio investments. The use of swaps requires an understanding not only of the underlying instrument but also of the swap contract itself. Swap transactions may be subject to the risk factors generally applicable to derivatives transactions described above, and may also be subject to certain additional risk factors, including:
• Many swap agreements are not traded on exchanges and not subject to a similar level of government regulation as exchange-traded derivatives. As a result, parties to a swap agreement are not protected by such government regulations to the same extent participants are in transactions in derivatives traded on organized exchanges.
• In addition to the risk of default by the counterparty, if the creditworthiness of a counterparty to a swap agreement declines, the value of the swap agreement would be likely to decline, potentially resulting in losses.
The swaps market is a relatively new market and currently is largely unregulated. It is possible that further developments in the swaps market, including future governmental regulation, could adversely affect a Portfolio's ability to utilize swaps, terminate existing swap agreements or realize amounts to be received under such agreements.
Contracts for Difference ("CFDs"). Certain Portfolios may purchase CFDs. A CFD is a privately negotiated contract between two parties, buyer and seller, stipulating that the seller will pay to or receive from the buyer the difference between the nominal value of the underlying instrument at the opening of the contract and that instrument's value at the end of the contract. The underlying instrument may be a single security, stock basket or index. A CFD can be set up to take either a short or long position on the underlying instrument. The buyer and seller are typically both required to post margin, which is adjusted daily. The buyer will also pay to the seller a financing rate on the notional amount of the capital employed by the seller less the margin deposit. A CFD is usually terminated at the buyer's initiative. The seller of the CFD will simply match the exposure of the underlying instrument in the open market and the parties will exchange whatever payment is due.
34
As is the case with owning any financial instrument, there is the risk of loss associated with buying a CFD. For example, if a Portfolio buys a long CFD and the underlying security is worth less at the end of the contract, the Portfolio would be required to make a payment to the seller and would suffer a loss. Also, there may be liquidity risk if the underlying instrument is illiquid because the liquidity of a CFD is based on the liquidity of the underlying instrument. A further risk is that adverse movements in the underlying security will require the buyer to post additional margin. CFDs also carry counterparty risk, i.e., the risk that the counterparty to the CFD transaction may be unable or unwilling to make payments or to otherwise honor its financial obligations under the terms of the contract. If the counterparty were to do so, the value of the contract, and of a Portfolio's shares, may be reduced. A Portfolio will not enter into a CFD transaction that is inconsistent with its investment objective, policies and strategies.
Structured Investments. Certain Portfolios also may invest a portion of their assets in structured investments. A structured investment is a derivative security designed to offer a return linked to a particular underlying security, currency, commodity or market, for which the amount of principal repayment and/or interest payments is based on the change in value of such underlying security, currency, commodity or market, including, among others, currency exchange rates, interest rates (such as the prime lending rate or LIBOR), referenced bonds and stock indices or other financial reference. Structured investments may come in various forms, including notes, warrants and options to purchase securities, and may be listed and traded on an exchange or otherwise traded in the OTC market.
The Portfolios will typically use structured investments to gain exposure to a permitted underlying security, currency, commodity or market when direct access to such security, currency, commodity or market is limited or inefficient from a tax, cost or regulatory standpoint. Investments in structured investments involve risks including issuer risk, counterparty risk and market risk. Holders of structured investments bear risks of the underlying investment and are subject to issuer or counterparty risk because the Portfolios are relying on the creditworthiness of such issuer or counterparty and has no rights with respect to the underlying investment. Certain structured investments may be thinly traded or have a limited trading market and may have the effect of increasing a Portfolio's illiquidity to the extent that the Portfolio, at a particular point in time, may be unable to find qualified buyers for these investments.
A structured investment may be linked either positively or negatively to its underlying security, currency, commodity or market and a change in interest rate, principal amount or other factor, depending on the structured investment's design, may be a multiple of the factor's movement. Application of a multiplier is comparable to the use of financial leverage, a speculative technique. Leverage magnifies the potential for gain and the risk of loss. As a result, a relatively small decline in the value of the referenced factor could result in a relatively large loss in the value of a structured investment.
Other types of structured investments include interests in entities organized and operated for the purpose of restructuring the investment characteristics of underlying investment interests or securities. This type of securitization or restructuring usually involves the deposit or purchase of an underlying security by a U.S. or foreign entity, such as a corporation or trust of specified instruments, and the issuance by that entity of one or more classes of securities backed by, or representing an interest in, the underlying instruments. The cash flow or rate of return on the underlying investments may be apportioned among the newly issued securities to create different investment characteristics, such as varying maturities, credit quality, payment priorities and interest rate provisions. Structured investments which are subordinated, for example, in payment priority often offer higher returns, but may result in increased risks compared to other investments.
Combined Transactions. Combined transactions involve entering into multiple derivatives transactions (such as multiple options transactions, including purchasing and writing options in combination with each other; multiple futures transactions; and combinations of options, futures, forward and swap transactions) instead of a single derivatives transaction in order to customize the risk and return characteristics of the overall position. Combined transactions typically contain elements of risk that are present in each of the component transactions. A Portfolio may enter into a combined transaction instead of a single derivatives transaction when, in the opinion of the Adviser, it is in the best interest of the Portfolio to do so. Because combined transactions involve multiple transactions, they may result in higher transaction costs and may be more difficult to close out.
INVESTMENT LIMITATIONS
Fundamental Limitations
Each Portfolio has adopted the following restrictions, which are fundamental policies and may not be changed without the approval of the lesser of: (i) at least 67% of the voting securities of the Portfolio present at a meeting if
35
the holders of more than 50% of the outstanding voting securities of the Portfolio are present or represented by proxy; or (ii) more than 50% of the outstanding voting securities of the Portfolio. Each Portfolio (except for the Global Franchise, International Real Estate and Small Company Growth Portfolios) will not:
(1) purchase or sell physical commodities unless acquired as a result of ownership of securities or other instruments; provided that this restriction shall not prohibit the Portfolio from purchasing or selling options, futures contracts and related options thereon, forward contracts, swaps, caps, floors, collars and any other financial instruments or from investing in securities or other instruments backed by physical commodities or as otherwise permitted by (i) the 1940 Act, as amended from time to time, (ii) the rules and regulations promulgated by the SEC under the 1940 Act, as amended from time to time, or (iii) an exemption or other relief applicable to the Portfolio from the provisions of the 1940 Act, as amended from time to time;
(2) purchase or sell real estate, although it may purchase and sell securities of companies that deal in real estate and may purchase and sell securities that are secured by interests in real estate;
(3) make loans of money or property to any person, except (a) to the extent that securities or interests in which the Portfolio may invest are considered to be loans, (b) through the loan of portfolio securities, (c) by engaging in repurchase agreements or (d) as may otherwise be permitted by (i) the 1940 Act, as amended from time to time, (ii) the rules and regulations promulgated by the SEC under the 1940 Act, as amended from time to time, or (iii) an exemption or other relief applicable to the Fund from the provisions of the 1940 Act, as amended from time to time;
(4) except with respect to the Emerging Markets Domestic Debt, Focus Growth, Global Discovery, Global Real Estate, Select Global Infrastructure and U.S. Real Estate Portfolios, invest in a manner inconsistent with its classification as a "diversified company" as provided by (i) the 1940 Act, as amended from time to time, (ii) the rules and regulations promulgated by the SEC under the 1940 Act, as amended from time to time, or (iii) an exemption or other relief applicable to the Portfolio from the provisions of the 1940 Act, as amended from time to time;
(5) borrow money, except the Portfolio may borrow money to the extent permitted by (i) the 1940 Act, as amended from time to time, (ii) the rules and regulations promulgated by the SEC under the 1940 Act, as amended from time to time, or (iii) an exemption or other relief applicable to the Portfolio from the provisions of the 1940 Act, as amended from time to time;
(6) issue senior securities, except the Portfolio may issue senior securities to the extent permitted by (i) the 1940 Act, as amended from time to time, (ii) the rules and regulations promulgated by the SEC under the 1940 Act, as amended from time to time, or (iii) an exemption or other relief applicable to the Portfolio from the provisions of the 1940 Act, as amended from time to time;
(7) underwrite securities issued by others, except to the extent that the Portfolio may be considered an underwriter within the meaning of the 1933 Act in the disposition of restricted securities;
(8) acquire any securities of companies within one industry if, as a result of such acquisition, more than 25% of the value of the Portfolio's total assets would be invested in securities of companies within such industry; provided, however, that there shall be no limitation on the purchase of obligations issued or guaranteed by the U.S. Government, its agencies or instrumentalities, except that the U.S. Real Estate Portfolio will invest more than 25% of its total assets in the U.S. real estate industry, as described in its Prospectus, that the Global Real Estate Portfolio will invest more than 25% of its total assets in the real estate industry, as described in its Prospectus, and that the Select Global Infrastructure Portfolio will invest more than 25% of its total assets in the utilities industry; and
(9) except with respect to the Global Real Estate Portfolio, write or acquire options or interests in oil, gas or other mineral exploration or development programs.
Each of the Global Franchise, International Real Estate and Small Company Growth Portfolios will not:
(1) purchase or sell physical commodities unless acquired as a result of ownership of securities or other instruments (except this shall not prevent the Portfolio from purchasing or selling options or futures contracts or from investing in securities or other instruments backed by physical commodities);
(2) purchase or sell real estate, although it may purchase and sell securities of companies that deal in real estate and may purchase and sell securities that are secured by interests in real estate;
36
(3) lend any security or make any other loan if, as a result, more than 33 1/3% of its total assets would be lent to other parties, but this limitation does not apply to purchases of debt securities or repurchase agreements;
(4) except with respect to the Global Franchise Portfolio and the International Real Estate Portfolio, with respect to 75% of its total assets (i) purchase more than 10% of any class of the outstanding voting securities of any issuer and (ii) purchase securities of an issuer (except obligations of the U.S. Government and its agencies and instrumentalities) if as a result more than 5% of the Portfolio's total assets, at market value, would be invested in the securities of such issuer;
(5) issue senior securities and will not borrow, except from banks and as a temporary measure for extraordinary or emergency purposes and then, in no event, in excess of 33 1/3% of its total assets (including the amount borrowed) less liabilities (other than borrowings);
(6) underwrite securities issued by others, except to the extent that the Portfolio may be considered an underwriter within the meaning of the 1933 Act in the disposition of restricted securities;
(7) acquire any securities of companies within one industry if, as a result of such acquisition, more than 25% of the value of the Portfolio's total assets would be invested in securities of companies within such industry; provided, however, that there shall be no limitation on the purchase of obligations issued or guaranteed by the U.S. Government, its agencies or instrumentalities, except that the International Real Estate Portfolio will invest more than 25% of its total assets in the European real estate industry, as described in its Prospectus; and
(8) write or acquire options or interests in oil, gas or other mineral exploration or development programs.
Non-Fundamental Limitations
In addition, each Portfolio of the Fund has adopted the following non-fundamental investment limitations, which may be changed by the Board without shareholder approval. Each Portfolio will not:
(1) purchase on margin or sell short except (i) that the Emerging Markets Domestic Debt Portfolio may sell securities short without limitation but consistent with applicable legal requirements as stated in its Prospectus; (ii) that each Portfolio may enter into option transactions and futures contracts as described in its Prospectus; and (iii) as specified above in fundamental investment limitation number (1) above;
(2) except with respect to the Global Real Estate Portfolio, make loans except (i) by purchasing bonds, debentures or similar obligations (including repurchase agreements, subject to the limitations as described in the respective Prospectuses) that are publicly distributed; and (ii) by lending its portfolio securities to banks, brokers, dealers and other financial institutions so long as such loans are not inconsistent with the 1940 Act or the rules and regulations or interpretations of the SEC thereunder;
(3) borrow money, except from banks for extraordinary or emergency purposes, and then only in amounts up to 10% of the value of the Portfolio's total assets (including, in each case, the amount borrowed less liabilities (other than borrowings)), or purchase securities while borrowings exceed 5% of its total assets, except that (i) the Emerging Markets Domestic Debt Portfolio may borrow in accordance with fundamental investment limitation number (5) above and (ii) the Emerging Markets Domestic Debt Portfolio may purchase securities while borrowings exceed 5% of its total assets, provided that the sole purpose of such borrowings is to honor redemption requests; and
(4) invest in other investment companies in reliance on Sections 12(d)(1)(F), 12(d)(1)(G) or 12(d)(1)(J) of the 1940 Act.
Whether diversified or non-diversified, each Portfolio will satisfy the diversification requirements for tax treatment as a regulated investment company ("RIC"). As a result, each Portfolio will diversify its holdings so that, at the close of each quarter of its taxable year or within 30 days thereafter, (i) at least 50% of the market value of the Portfolio's total assets is represented by cash (including cash items and receivables), U.S. government securities, securities of other RICs and other securities, with such other securities limited, in respect of any one issuer, for purposes of this calculation to an amount not greater than 5% of the value of the Portfolio's total assets and 10% of the outstanding voting securities of such issuer; and (ii) not more than 25% of the value of its total assets is invested in the securities of any one issuer (other than U.S. government securities or securities of other RICs). Prior to the close of each quarter (or within 30 days thereafter), the Portfolio's holdings may be less diversified and are not required to satisfy any diversification test.
37
The percentage limitations contained in these restrictions apply at the time of purchase of securities. A later change in percentage resulting from changes in the value of the Portfolio's assets or in total or net assets of the Portfolio will not be considered a violation of the restriction and the sale of securities will not be required. The foregoing does not apply to borrowings or investments in illiquid securities. Future portfolios of the Fund may adopt different limitations.
DISCLOSURE OF PORTFOLIO HOLDINGS
The Fund's Board of Directors and the Adviser have adopted policies and procedures regarding disclosure of portfolio holdings (the "Policy"). Pursuant to the Policy, the Adviser may disclose information concerning Fund portfolio holdings only if such disclosure is consistent with the antifraud provisions of the federal securities laws and the Fund's and the Adviser's fiduciary duties to Fund shareholders. In no instance may the Adviser, Sub-Advisers or the Fund receive compensation or any other consideration in connection with the disclosure of information about the portfolio securities of the Fund. Consideration includes any agreement to maintain assets in the Fund or in other investment companies or accounts managed by the Adviser or by any affiliated person of the Adviser. Non-public information concerning portfolio holdings may be divulged to third parties only when the Fund has a legitimate business purpose for doing so and the recipients of the information are subject to a duty of confidentiality. Under no circumstances shall current or prospective Fund shareholders receive non-public portfolio holdings information, except as described below.
The Fund makes available on its public website the following portfolio holdings information:
• complete portfolio holdings information monthly, at least 15 calendar days after the end of each month (except with respect to the Global Franchise Portfolio); and
• top 10 holdings monthly, at least 15 calendar days after the end of each month.
With respect to the Global Franchise Portfolio, complete holdings will be available on a quarterly basis 15 calendar days after the quarter-end to current shareholders who call (800) 548-7786 or email client service at msimcs@morganstanley.com.
The Fund provides a complete schedule of portfolio holdings for the second and fourth fiscal quarters in its semiannual and annual reports, and for the first and third fiscal quarters in its filings with the SEC on Form N-Q. The Fund's Form N-Qs are available on the SEC's website at http://www.sec.gov and may be reviewed and copied at the SEC's Public Reference Room in Washington, DC. Information on the operation of the Public Reference Room may be obtained by calling 1-800-SEC-0330.
All other portfolio holdings information that has not been disseminated in a manner making it available to investors generally as described above is non-public information for purposes of the Policy.
The Fund may make selective disclosure of non-public portfolio holdings information pursuant to certain exemptions set forth in the Policy. Third parties eligible for exemptions under the Policy and therefore eligible to receive such disclosures currently include fund rating agencies, information exchange subscribers, consultants and analysts, portfolio analytics providers and service providers, provided that the third party expressly agrees to maintain the disclosed information in confidence and not to trade portfolio securities or related derivative securities based on the non-public information. Non-public portfolio holdings information may not be disclosed to a third party pursuant to an exemption unless and until the third party recipient has entered into a non-disclosure agreement with the Fund and the arrangement has been reviewed and approved as set forth in the Policy and discussed below. In addition, persons who owe a duty of trust or confidence to the Fund or the Adviser may receive non-public portfolio holdings information without entering into a non-disclosure agreement. Currently, these persons include (i) the Fund's independent registered public accounting firm (as of the Fund's fiscal year end and on an as needed basis), (ii) counsel to the Fund (on an as needed basis), (iii) counsel to the independent Directors (on an as needed basis) and (iv) members of the Board of Directors (on an as needed basis). Subject to the terms and conditions of any agreement between the Adviser or the Fund and the third party recipient, if these conditions for disclosure are satisfied, there shall be no restriction on the frequency with which Fund non-public portfolio holdings information is released, and no lag period shall apply (unless otherwise indicated below).
The Adviser and/or Sub-Adviser may provide interest lists to broker-dealers who execute securities transactions for the Fund without entering into a non-disclosure agreement with the broker-dealers, provided that the interest list satisfies all of the following criteria: (1) the interest list must contain only the CUSIP numbers and/or ticker symbols of securities held in all registered management investment companies advised by the Adviser and Sub-Advisers or any affiliate of the Adviser or Sub-Advisers (the "MSIM Funds") on an aggregate, rather than a fund-by-fund basis; (2) the interest list must not contain information about the number or value of shares owned
38
by a specified MSIM Fund; (3) the interest list may identify the investment strategy, but not the particular MSIM Funds, to which the list relates; and (4) the interest list may not identify the portfolio manager or team members responsible for managing the MSIM Funds.
Fund shareholders may elect in some circumstances to redeem their shares of the Fund in exchange for their pro rata share of the securities held by the Fund. Under such circumstances, Fund shareholders may receive a complete listing of the holdings of the Fund up to seven calendar days prior to making the redemption request provided that they represent in writing that they agree not to disclose or trade on the basis of the portfolio holdings information.
The Fund may discuss or otherwise disclose performance attribution analyses (i.e., mention the effects of having a particular security in the portfolio(s)) where such discussion is not contemporaneously made public, provided that the particular holding has been disclosed publicly. Additionally, any discussion of the analyses may not be more current than the date the holding was disclosed publicly.
The Fund may disclose portfolio holdings to transition managers, provided that the Fund has entered into a non-disclosure or confidentiality agreement with the party requesting that the information be provided to the transition manager and the party to the non-disclosure agreement has, in turn, entered into a non-disclosure or confidentiality agreement with the transition manager.
The Adviser, the Sub-Advisers, the Fund and/or certain Portfolios currently have entered into ongoing arrangements with the following parties:
| Name | | Information Disclosed | | Frequency(1) | | Lag Time | |
| Service Providers | |
RiskMetrics Group
(proxy voting agent)(*) | | Complete portfolio holdings | | Daily basis | | (2) | |
FT Interactive Data Pricing
Service Provider(*) | | Complete portfolio holdings | | As needed | | (2) | |
State Street Bank and
Trust Company(*) | | Complete portfolio holdings | | As needed | | (2) | |
| Fund Rating Agencies | |
| Lipper(*) | | Top ten and complete
portfolio holdings | | Monthly basis
| | Six business days after
month end | |
| Morningstar(**) | | Top ten and complete
portfolio holdings | | Quarterly basis
| | Approximately 38 days
after quarter end | |
| Standard & Poor's(*) | | Complete portfolio holdings | | Quarterly basis | | Approximately 15 day lag | |
Investment Company
Institute(**) | | Top ten portfolio holdings | | Quarterly basis | | Approximately 15 days
after quarter end | |
| Consultants and Analysts | |
Arnerich Massena &
Associates, Inc.(*) | | Top ten and complete
portfolio holdings | | Quarterly basis(5)
| | Approximately 10-12 days
after quarter end | |
| Bloomberg(**) | | Complete portfolio holdings | | Quarterly basis | | Approximately 38 days after quarter end | |
| Callan Associates(*) | | Top ten and complete
portfolio holdings | | Monthly and
quarterly basis,
respectively(5) | | Approximately 10-12 days
after month/quarter end
| |
| Cambridge Associates(*) | | Top ten and complete
portfolio holdings | | Quarterly basis(5)
| | Approximately 10-12 days
after quarter end | |
| Citigroup(*) | | Complete portfolio holdings | | Quarterly basis(5) | | At least one day after
quarter end | |
| Credit Suisse First Boston(*) | | Top ten and complete
portfolio holdings | | Monthly and
quarterly basis,
respectively | | Approximately 10-12 days
after month/quarter end
| |
| CTC Consulting, Inc.(**) | | Top ten and complete | | Quarterly basis
portfolio holdings | | Approximately 15 days
after quarter end and
approximately 30 days after
quarter end, respectively | |
| Fund Evaluation Group(**) | | Top ten portfolio holdings(3) | | Quarterly basis | | At least 15 days after quarter end | |
39
| Name | | Information Disclosed | | Frequency(1) | | Lag Time | |
Jeffrey Slocum &
Associates(*) | | Complete portfolio
holdings(4) | | Quarterly basis(5)
| | Approximately 10-12 days
after quarter end | |
| Hartland & Co.(**) | | Complete portfolio
holdings(4) | | Quarterly basis
| | At least 30 days after
quarter end | |
| Hewitt Ennis Knupp(*) | | Top ten and complete
portfolio holdings | | Monthly and quarterly
basis, respectively(5) | | Approximately 10-12 days
after month/quarter end | |
Mercer Investment
Consulting(*) | | Complete portfolio | | As needed
holdings | | (2) | |
| Merrill Lynch(*) | | Top ten and complete
portfolio holdings | | Monthly and quarterly
basis, respectively(5) | | Approximately 10-12 days
after month/quarter end | |
| Mobius(**) | | Top ten portfolio holdings(3) | | Monthly basis | | At least 15 days after month end | |
| Nelsons(**) | | Top ten portfolio holdings(3) | | Quarterly basis | | At least 15 days after quarter end | |
Prime, Buchholz &
Associates, Inc.(**) | | Complete portfolio
holdings(4) | | Quarterly basis
| | At least 30 days after
quarter end | |
| PSN(**) | | Top ten portfolio holdings(3) | | Quarterly basis | | At least 15 days after quarter end | |
PFM Asset Management
LLC(*) | | Top ten and complete
portfolio holdings | | Quarterly basis(5)
| | Approximately 10-12 days
after quarter end | |
Russell Investment Group/
Russell/Mellon Analytical
Services, Inc.(**) | | Top ten and complete
portfolio holdings | | Monthly and
quarterly basis | | At least 15 days after
month end and at least
30 days after quarter end,
respectively | |
Stratford Advisory Group,
Inc.(*) | | Top ten portfolio holdings(6) | | Quarterly basis(5) | | Approximately 10-12 days
after quarter end | |
| Thomson Financial(**) | | Complete portfolio
holdings(4) | | Quarterly basis
| | At least 30 days after
quarter end | |
Watershed Investment
Consultants, Inc.(*) | | Top ten and complete
portfolio holdings | | Quarterly basis(5)
| | Approximately 10-12 days
after quarter end | |
| Gallagher Fiduciary | | Top ten portfolio holdings(3) | | Quarterly basis | | At least 15 days after | |
| Partners(**) | | | | | | quarter end | |
| Portfolio Analytics Providers | |
FactSet Research
Systems, Inc.(*) | | Complete portfolio
holdings | | Daily basis
| | One day
| |
(*) This entity has agreed to maintain Fund non-public portfolio holdings information in confidence and not to trade portfolio securities based on the non-public portfolio holdings information.
(**) The Fund does not currently have a non-disclosure agreement in place with this entity and therefore the entity can only receive publicly available information.
(1) Dissemination of portfolio holdings information to entities listed above may occur less frequently than indicated (or not at all).
(2) Information will typically be provided on a real time basis or as soon thereafter as possible.
(3) Complete portfolio holdings will also be provided upon request from time to time on a quarterly basis, with at least a 30 day lag.
(4) Top ten portfolio holdings will also be provided upon request from time to time, with at least a 15 day lag.
(5) This information will also be provided upon request from time to time.
(6) Complete portfolio holdings will also be provided upon request from time to time.
All disclosures of non-public portfolio holdings information made to third parties pursuant to the exemptions set forth in the Policy must be reviewed by Morgan Stanley Investment Management's ("MSIM") Legal and Compliance Division and approved by the Head of the Long-Only Business of MSIM. Disclosures made to third parties in connection with (i) broker-dealer interest lists; (ii) shareholder in-kind distributions; (iii) attribution analyses; or (iv) transition managers are pre-approved for purposes of the Policy. In addition, the following categories of third parties that may receive non-public portfolio holdings information are also pre-approved provided that they enter into non-disclosure agreements (as discussed above): (i) fund rating agencies; (ii) information exchange subscribers; (iii) consultants and analysts (including defined benefit and defined contribution plan sponsors, and variable annuity providers); (iv) portfolio analytics providers; and (v) service providers.
40
The Adviser and/or Sub-Advisers shall report quarterly to the Board of Directors (or a designated committee thereof) at the next regularly scheduled meeting: (i) any material information concerning all parties receiving non-public portfolio holdings information pursuant to an exemption; and (ii) any new non-disclosure agreements entered into during the reporting period. Procedures to monitor the use of such non-public portfolio holdings information may include requiring annual certifications that the recipients have utilized such information only pursuant to the terms of the agreement between the recipient and the Adviser and, for those recipients receiving information electronically, acceptance of the information will constitute reaffirmation that the third party expressly agrees to maintain the disclosed information in confidence and not to trade portfolio securities based on the non-public information.
PURCHASE OF SHARES
You may purchase shares of each Portfolio on any day the New York Stock Exchange ("NYSE") is open. Each Portfolio reserves the right in its sole discretion (i) to suspend the offering of its shares; (ii) to reject purchase orders when in the judgment of management such rejection is in the best interest of the Fund; and (iii) to reduce or waive the minimum for initial and subsequent investments for certain accounts such as employee benefit plans or under circumstances where certain economies can be achieved in sales of a Portfolio's shares.
Shares of each Portfolio may be purchased at the net asset value per share next determined after receipt by the Fund or its designee of a purchase order as described under "Methods of Purchase" and "Investment through Financial Intermediaries." Shares may, in the Fund's discretion, be purchased with investment securities (in lieu of or, in conjunction with cash) acceptable to the Fund. The securities would be accepted by the Fund at their market value in return for Portfolio shares of equal value. The net asset value per share of each Portfolio is calculated on days that the NYSE is open for business. Net asset value per share is determined as of the close of trading of the NYSE (normally 4:00 p.m. Eastern Time) (for each Portfolio, the "Pricing Time").
Minimum Investment
The minimum initial investment generally is $5,000,000 for Class I shares, $1,000,000 for Class P shares and $25,000 for Class L shares of the applicable Portfolios. The minimum initial investment will be waived for certain investments, including sales through banks, broker-dealers and other financial institutions (including registered investment advisers and financial planners) purchasing shares on behalf of their clients in (i) discretionary and non-discretionary advisory programs, (ii) fund supermarkets, (iii) asset allocation programs or (iv) other programs in which the client pays an asset-based fee for advice or for executing transactions in Portfolio shares or for otherwise participating in the program. In addition, the minimum initial investment will be waived for: (i) certain retirement plans investing directly with the Fund; (ii) retirement plans investing through certain retirement plan platforms; (iii) certain endowments, foundations and other not for profit entities investing directly with the Fund; (iv) other registered investment companies advised by Morgan Stanley Investment Management or any of its affiliates; (v) Morgan Stanley Investment Management and its affiliates with respect to shares held in connection with certain retirement and deferred compensation programs established for their employees; (vi) the independent Directors of the Fund; (vii) with respect to Class I and Class P shares only, clients who owned Portfolio shares as of December 31, 2007; and (viii) investments made in connection with certain reorganizations as approved by the Adviser.
The minimum initial investment is $25,000 for Class H shares of the applicable Portfolios.
Methods of Purchase for Class I, Class P and Class L Shares
You may purchase shares directly from the Fund by Federal Funds wire, by bank wire or by check; however, on days that the NYSE is open but the custodian bank is closed, you may only purchase shares by check. Investors may also invest in the Portfolios by purchasing shares through Financial Intermediaries that have made arrangements with the Fund. Some Financial Intermediaries may charge an additional service or transaction fee (see also "Investment Through Financial Intermediaries"). If a purchase is canceled due to nonpayment or because your check does not clear, you will be responsible for any loss the Fund or its agents incur. If you are already a shareholder, the Fund may redeem shares from your account(s) to reimburse the Fund or its agents for any loss. In addition, you may be prohibited or restricted from making future investments in the Fund.
Federal Funds Wire. Purchases may be made by having your bank wire Federal Funds to the Fund's bank account. Federal Funds purchase orders will be accepted only on a day on which the Fund and State Street Bank and Trust Company ("State Street") are open for business. Your bank may charge a service fee for wiring Federal Funds. In order to ensure proper handling of your purchase by Federal Funds wire, please follow these steps.
1. Complete and sign an Account Registration Form and mail it to the address shown thereon.
41
2. Instruct your bank to wire the specified amount to the Fund's Wire Concentration Bank Account as follows:
State Street Bank and Trust Company
One Lincoln Street
Boston, MA 02111-2101
ABA# 011000028
DDA# 00575373
Attn: Morgan Stanley Institutional Fund, Inc.
Subscription Account
Ref: (Portfolio Name, Account Number, Account Name)
When a purchase order is received prior to the Pricing Time and Federal Funds are received prior to the regular close of the Federal Funds Wire Control Center ("FFWCC") (normally 6:00 p.m. Eastern Time), the purchase will be executed at the net asset value computed on the date of receipt. Purchases for which an order is received after the Pricing Time or for which Federal Funds are received after the regular close of the FFWCC will be executed at the net asset value next determined. Certain institutional investors and financial institutions have entered into agreements with the Fund pursuant to which they may place orders prior to the Pricing Time, but make payment in Federal Funds for those shares the following business day.
Bank Wire. A purchase of shares by bank wire must follow the same procedure as for a Federal Funds wire, described above. However, depending on the time the bank wire is sent and the bank handling the wire, money transferred by bank wire may or may not be converted into Federal Funds prior to the close of the FFWCC. Prior to conversion to Federal Funds and receipt by the Fund, an investor's money will not be invested.
Check. An account may be opened by completing and signing an Account Registration Form and mailing it, together with a check payable to "Morgan Stanley Institutional Fund, Inc. — [Portfolio name]" to:
Morgan Stanley Institutional Fund, Inc.
c/o Morgan Stanley Services Company Inc.
P.O. Box 219804
Kansas City, MO 64121-9804
A purchase of shares by check ordinarily will be credited to your account at the net asset value per share of each of the Portfolios determined on the day of receipt.
Additional Investments. You may purchase additional shares for your account at any time by purchasing shares at net asset value by any of the methods described above. For additional purchases directly from the Fund, your account name, account number, the Portfolio name and the class selected must be specified in the letter to assure proper crediting to your account. In addition, you may purchase additional shares by wire by following instructions 1 and 2 under "Federal Funds Wire" above.
Investment Through Financial Intermediaries
Certain Financial Intermediaries have made arrangements with the Fund so that an investor may purchase or redeem shares at the net asset value per share next determined after the Financial Intermediary receives the share order. In other instances, the Fund has also authorized such Financial Intermediaries to designate other intermediaries to receive purchase and redemption orders on the Fund's behalf at the share price next determined after such designees receive the share order. Under these arrangements, the Fund will be deemed to have received a purchase or redemption order when the Financial Intermediary or, if applicable, a Financial Intermediary's authorized designee, receives the share order from an investor.
Conversion to a New Share Class
If the value of an account containing shares of a Portfolio falls below the investment minimum for the class of shares held by the account because of shareholder redemption(s) or the failure to meet one of the waiver criteria set forth in the "Purchase of Shares—Minimum Investment" section and, if the account value remains below such investment minimum, the shares in such account may, at the Adviser's discretion, convert to another class of shares offered by the Portfolio, if an account meets the minimum investment amount for such class, and will be subject to the shareholder services fee and other features applicable to such shares. Conversion to another class of shares will result in holding a share class with higher fees. The Fund will not convert to another class of shares based solely upon changes in the market that reduce the net asset value of shares. Under current tax law, conversion between share classes is not a taxable event to the shareholder. Shareholders will be notified prior to any such conversion.
42
Involuntary Redemption of Shares
If the value of an account falls below the investment minimum for (i) Class L shares or (ii) Class P shares (where the applicable Portfolio does not offer Class H shares or Class L shares) because of shareholder redemption(s) or you no longer meet one of the waiver criteria set forth in the "Purchase of Shares—Minimum Investment" section and if the account value remains below such investment minimum, the shares in such account may be subject to redemption by the Fund. The Fund will not redeem shares based solely upon changes in the market that reduce the net asset value of shares. If redeemed, redemption proceeds will be promptly paid to the shareholder. Shareholders will be notified prior to any such redemption.
REDEMPTION OF SHARES
The Fund normally makes payment for all shares redeemed within one business day of receipt of the request, and in no event more than seven days after receipt of a redemption request in good order. However, payments to investors redeeming shares which were purchased by check will not be made until payment for the purchase has been collected, which may take up to eight days after the date of purchase. The Fund may suspend the right of redemption or postpone the date of payment (i) during any period that the NYSE is closed, or trading on the NYSE is restricted as determined by the SEC; (ii) during any period when an emergency exists as determined by the SEC as a result of which it is not practicable for a Portfolio to dispose of securities it owns, or fairly to determine the value of its assets; and (iii) for such other periods as the SEC may permit.
Class I, Class P and Class L shares of each Portfolio, if offered, may be redeemed at any time at the net asset value per share next determined after receipt by the Fund or its designee of a redemption order as described under "Methods of Redemption" and "Investment through Financial Intermediaries," which may be more or less than the purchase price of your shares. Shares of the Active International Allocation, Asian Equity, Emerging Markets, Emerging Markets Domestic Debt, International Advantage, International Equity, International Opportunity, International Real Estate, International Small Cap and Small Company Growth Portfolios redeemed within 30 days of purchase will be subject to a 2% redemption fee, payable to the relevant Portfolio. The redemption fee is designed to protect the Portfolio and its remaining shareholders from the effects of short-term trading. The redemption fee is calculated based on, and deducted from, the redemption proceeds. Each time you redeem or exchange shares, the shares held the longest will be redeemed or exchanged first. See each Prospectus for additional information about redeeming shares of a Portfolio.
Methods of Redemption for Class I, Class P and Class L Shares
You may redeem shares directly from the Fund or through the Distributor by mail or by telephone. However, shares purchased through a Financial Intermediary must be redeemed through a Financial Intermediary. Certain Financial Intermediaries may charge an additional service or transaction fee.
By Mail. Each Portfolio will redeem shares upon receipt of a redemption request in "good order." Redemption requests may be sent by regular mail to Morgan Stanley Institutional Fund, Inc., c/o Morgan Stanley Services Company Inc., P.O. Box 219804, Kansas City, MO 64121-9804 or, by overnight courier, to Morgan Stanley Institutional Fund, Inc., c/o Morgan Stanley Services Company Inc., 430 West 7th Street, Kansas City, MO 64105.
"Good order" means that the request to redeem shares must include the following:
1. A letter of instruction, if required, or a stock assignment specifying the class and number of shares or dollar amount to be redeemed, signed by all registered owners of the shares in the exact names in which they are registered;
2. Share certificates, if issued;
3. Any required signature guarantees; and
4. Other supporting legal documents, if required, in the case of estates, trusts, guardianships, custodianships, corporations, pension and profit-sharing plans and other organizations.
Redemption requests received in "good order" prior to the Pricing Time will be executed at the net asset value computed on the date of receipt. Redemption requests received after the Pricing Time will be executed at the next determined net asset value. Shareholders who are uncertain of requirements for redemption by mail should consult a Fund representative.
By Telephone. You can redeem Portfolio shares (not purchased through a Financial Intermediary) by calling the Fund and requesting that the redemption proceeds be wired to your bank. Please contact one of the Fund's representatives for further details. To change the commercial bank or account designated to receive redemption proceeds, send a written request to the Fund at the address above. Requests to change the bank or account must be
43
signed by each shareholder and each signature must be guaranteed. The telephone redemption option may be difficult to implement at times, particularly during volatile market conditions. If you experience difficulty in making a telephone redemption, you may redeem shares by mail as described above.
The Fund and the Transfer Agent will employ reasonable procedures to confirm that instructions communicated by telephone are genuine. These procedures include requiring the investor to provide certain personal identification information at the time an account is opened and prior to effecting each telephone transaction. In addition, all telephone transaction requests will be recorded and investors may be required to provide additional telecopied written instructions regarding transactions requests. Neither the Fund nor the Transfer Agent will be responsible for any loss, liability, cost or expense for following instructions received by telephone that either of them reasonably believes to be genuine.
Redemption Through Financial Intermediaries
Certain Financial Intermediaries have made arrangements with the Fund to accept redemption requests. These redemptions may be processed in the same way as purchases made through Financial Intermediaries, as described above.
Further Redemption Information
To protect your account and the Fund from fraud, signature guarantees are required for certain redemptions. Signature guarantees enable the Fund to verify the identity of the person who has authorized a redemption from your account. Signature guarantees are required in connection with: (i) all redemptions, regardless of the amount involved, when the proceeds are to be paid to someone other than the registered owner(s) and/or registered address; and (ii) share transfer requests. An "eligible guarantor institution" may include a bank, a trust company, a credit union or savings and loan association, a member firm of a domestic stock exchange, or a foreign branch of any of the foregoing. Notaries public are not acceptable guarantors. The signature guarantees must appear either: (i) on the written request for redemption; (ii) on a separate instrument for assignment ("stock power") which should specify the total number of shares to be redeemed; or (iii) on all stock certificates tendered for redemption and, if shares held by the Fund are also being redeemed, on the letter or stock power.
ACCOUNT POLICIES AND FEATURES
Transfer of Shares
Shareholders may transfer Portfolio shares to another person by making a written request to the Fund. The request should clearly identify the account and number of shares to be transferred, and include the signature of all registered owners and all stock certificates, if any, which are subject to the transfer. It may not be possible to transfer shares purchased through a Financial Intermediary. The signature on the letter of request, the stock certificate or any stock power must be guaranteed in the same manner as described under "Redemption of Shares." As in the case of redemptions, the written request must be received in good order before any transfer can be made. Transferring shares may affect the eligibility of an account for a given class of a Portfolio's shares and may result in involuntary conversion or redemption of such shares. Under certain circumstances, the person who receives the transfer may be required to complete a new Account Registration Form.
Valuation of Shares
The net asset value per share of a class of shares of each Portfolio is determined by dividing the total market value of the Portfolio's investments and other assets attributable to such class, less all liabilities attributable to such class, by the total number of outstanding shares of such class of the Portfolio. Net asset value is calculated separately for each class of a Portfolio and may differ due to class specific expenses paid by each class. Net asset value per share of the Portfolios is determined as of the close of the NYSE (normally 4:00 p.m. Eastern Time) on each day that the NYSE is open for business. Price information on listed securities is taken from the exchange where the security is primarily traded. Portfolio securities are generally valued at their market value.
In the calculation of a Portfolio's net asset value: (1) an equity portfolio security listed or traded on the NYSE or other exchange is valued at its latest sale price, prior to the time when assets are valued; if there were no sales that day, the security is valued at the mean between the last reported bid and asked price; (2) an equity portfolio security listed or traded on the Nasdaq is valued at the NASDAQ Official Closing Price; if there were no sales that day, the security is valued at the mean between the last reported bid and asked price; and (3) all other portfolio securities for which OTC market quotations are readily available are valued at the mean between the last reported bid and asked price. In cases where a security is traded on more than one exchange, the security is valued on the exchange designated as the primary market. For equity securities traded on foreign exchanges, the closing price or the latest bid price may be used if there were no sales on a particular day. When market quotations are not readily available, including circumstances under which it is determined by the Adviser or Sub-Advisers that the sale price,
44
the bid price or the mean between the last reported bid and asked price are not reflective of a security's market value, portfolio securities are valued at their fair value as determined in good faith under procedures established by and under the general supervision of the Board. For valuation purposes, quotations of foreign portfolio securities, other assets and liabilities and forward contracts stated in foreign currency are translated into U.S. dollar equivalents at the prevailing market rates prior to the close of the NYSE.
Short-term debt securities with remaining maturities of 60 days or less at the time of purchase are valued at amortized cost, unless the Board determines such valuation does not reflect the securities' market value, in which case these securities will be valued at their fair market value as determined by the Board.
Certain of a Portfolio's securities may be valued by an outside pricing service approved by the Board. The pricing service may utilize a matrix system incorporating security quality, maturity and coupon as the evaluation model parameters, and/or research evaluations by its staff, including review of broker-dealer market price quotations in determining what it believes is the fair valuation of the portfolio securities valued by such pricing service.
Listed options on debt securities are valued at the latest sale price on the exchange on which they are listed unless no sales of such options have taken place that day, in which case they will be valued at the mean between their latest bid and asked prices. Unlisted options on debt securities and all options on equity securities are valued at the mean between their latest bid and asked prices. Futures are valued at the latest price published by the commodities exchange on which they trade unless it is determined that such price does not reflect their market value, in which case they will be valued at their fair value as determined in good faith under procedures established by and under the supervision of the Directors.
Generally, trading in foreign securities, as well as corporate bonds, U.S. government securities and money market instruments, is substantially completed each day at various times prior to the close of the NYSE. The values of such securities used in computing the net asset value of the Portfolio's shares are determined as of such times. Foreign currency exchange rates are also generally determined prior to the close of the NYSE. Occasionally, events which may affect the values of such securities and such exchange rates may occur between the times at which they are determined and the close of the NYSE and will therefore not be reflected in the computation of a Portfolio's net asset value. If events that may affect the value of such securities occur during such period, then these securities may be valued at their fair value as determined in good faith under procedures established by and under the supervision of the Directors.
Although the legal rights of Class I, Class P, Class H and Class L shares will be identical, the different expenses borne by each class will result in different net asset values and dividends for the class. Dividends will differ by approximately the amount of the distribution expense accrual differential among the classes. The net asset value of Class P, Class H and Class L shares will generally be lower than the net asset value of Class I shares as a result of the shareholder services fees charged to Class P and Class H shares and the distribution and shareholder services fees charged to Class L shares and certain other class-specific expenses of Class H and Class L shares.
MANAGEMENT OF THE FUND
Directors and Officers
The Board of the Fund consists of 10 Directors. These same individuals also serve as directors or trustees for certain of the funds advised by the Adviser and Morgan Stanley AIP GP LP. Nine Directors have no affiliation or business connection with the Adviser or any of its affiliated persons and do not own any stock or other securities issued by the Adviser's parent company, Morgan Stanley. These Directors are the "non-interested" or "Independent" Directors of the Fund. The other Director (the "Interested Director") is affiliated with the Adviser.
Board Structure and Oversight Function
The Board's leadership structure features an Independent Director serving as Chairperson and the Board Committees described below. The Chairperson participates in the preparation of the agenda for meetings of the Board and the preparation of information to be presented to the Board with respect to matters to be acted upon by the Board. The Chairperson also presides at all meetings of the Board and is involved in discussions regarding matters pertaining to the oversight of the management of the Fund between meetings.
The Board of Directors operates using a system of committees to facilitate the timely and efficient consideration of all matters of importance to the Directors, the Fund and Fund stockholders, and to facilitate compliance with legal and regulatory requirements and oversight of the Fund's activities and associated risks. The Board of Directors has established four standing committees: (1) Audit Committee, (2) Governance Committee, (3) Compliance and Insurance Committee, and (4) Investment Committee. The Audit Committee and the Governance Committee are comprised exclusively of Independent Directors. Each committee charter governs the scope of the committee's responsibilities with respect to the oversight of the Fund. The responsibilities of each
45
committee, including their oversight responsibilities, are described further under the caption "Independent Directors and the Committees."
The Portfolios are subject to a number of risks, including investment, compliance, operational and valuation risk, among others. The Board of Directors oversees these risks as part of its broader oversight of the Fund's affairs through various Board and committee activities. The Board has adopted, and periodically reviews, policies and procedures designed to address various risks to the Portfolios. In addition, appropriate personnel, including but not limited to the Fund's Chief Compliance Officer, members of the Fund's administration and accounting teams, representatives from the Fund's independent registered public accounting firm, the Fund's Treasurer, portfolio management personnel and independent valuation and brokerage evaluation service providers, make regular reports regarding the Fund's activities and related risks to the Board of Directors and the committees, as appropriate. These reports include, among others, quarterly performance reports, quarterly derivatives activity and risk reports and discussions with members of the risk teams relating to each asset class. The Board's committee structure allows separate committees to focus on different aspects of risk and the potential impact of these risks on some or all of the funds in the complex and then report back to the full Board. In between regular meetings, Fund officers also communicate with the Directors regarding material exceptions and items germane to the Board's risk oversight function. The Board recognizes that it is not possible to identify all of the risks that may affect a Portfolio, and that it is not possible to develop processes and controls to eliminate all of the risks that may affect the Portfolios. Moreover, the Board recognizes that it may be necessary for the Portfolios to bear certain risks (such as investment risk) to achieve their investment objectives.
As needed between meetings of the Board, the Board or a specific committee receives and reviews reports relating to the Fund and engages in discussions with appropriate parties relating to the Fund's operations and related risks.
Independent Directors
The Fund seeks as Directors individuals of distinction and experience in business and finance, government service or academia. In determining that a particular Director was and continues to be qualified to serve as Director, the Board has considered a variety of criteria, none of which, in isolation, was controlling. Based on a review of the experience, qualifications, attributes or skills of each Director, including those enumerated in the table below, the Board has determined that each of the Directors is qualified to serve as a Director of the Fund. In addition, the Board believes that, collectively, the Directors have balanced and diverse experience, qualifications, attributes and skills that allow the Board to operate effectively in governing the Fund and protecting the interests of shareholders. Information about the Fund's Governance Committee and Board of Directors nomination process is provided below under the caption "Independent Directors and the Committees."
The Independent Directors of the Fund, their age, address, term of office and length of time served, their principal business occupations during the past five years, the number of portfolios in the Fund Complex (defined below) overseen by each Independent Director (as of December 31, 2011) and other directorships, if any, held by the Directors, are shown below. The Fund Complex includes all open-end and closed-end funds (including all of their portfolios) advised by the Adviser and any funds that have an adviser that is an affiliate of the Adviser (including, but not limited to, Morgan Stanley AIP GP LP) (the "Morgan Stanley Funds").
46
Independent Directors:
Name, Age and Address of
Independent Director | | Position(s)
Held with
Registrant | | Length of
Time
Served* | | Principal Occupation(s)
During Past 5 Years | | Number of
Portfolios in
Fund
Complex
Overseen by
Independent
Director | | Other
Directorships
Held by
Independent
Director** | |
Frank L. Bowman (67)
c/o Kramer Levin Naftalis & Frankel LLP Counsel to the Independent Directors
1177 Avenue of the Americas
New York, NY 10036 | | Director | | Since August 2006 | | President, Strategic Decisions, LLC (consulting) (since February 2009); Director or Trustee of various Morgan Stanley Funds (since August 2006); Chairperson of the Insurance Sub-Committee of the Compliance and Insurance Committee (since February 2007); served as President and Chief Executive Officer of the Nuclear Energy Institute (policy organization) (February 2005-November 2008); retired as Admiral, U.S. Navy after serving over 38 years on active duty including 8 years as Director of the Naval Nuclear Propulsion Program in the Department of the Navy and the U.S. Department of Energy (1996-2004); served as Chief of Naval Personnel (July 1994-September 1996) and on the Joint Staff as Director of Political Military Affairs (June 1992-July 1994); Knighted as Honorary Knight Commander of the Most Excellent Order of the British Empire; Awarded the Officer de l'Orde National du Mérite by the French Government; elected to the National Academy of Engineering (2009). | | | 102 | | | Director of BP p.l.c.; Director of Naval and Nuclear Technologies LLP; Director of the Armed Services YMCA of the USA and the Naval Submarine League; Director of the American Shipbuilding Suppliers Association; Member of the National Security Advisory Council of the Center for U. S. Global Engagement and a member of the CNA Military Advisory Board; Member of the American Lung Association's President's Council. | |
|
* Each Director serves an indefinite term, until his or her successor is elected.
** This includes any directorships at public companies and registered investment companies held by the Director at any time during the past five years.
47
Name, Age and Address of
Independent Director | | Position(s)
Held with
Registrant | | Length of
Time
Served* | | Principal Occupation(s)
During Past 5 Years | | Number of
Portfolios in
Fund
Complex
Overseen by
Independent
Director | | Other
Directorships
Held by
Independent
Director** | |
Michael Bozic (71)
c/o Kramer Levin Naftalis & Frankel LLP Counsel to the Independent Directors
1177 Avenue of the Americas
New York, NY 10036 | | Director | | Since April 1994 | | Private investor; Chairperson of the Compliance and Insurance Committee (since October 2006); Director or Trustee of various Morgan Stanley Funds (since April 1994); formerly, Chairperson of the Insurance Committee (July 2006-September 2006), Vice Chairman of Kmart Corporation (December 1998-October 2000), Chairman and Chief Executive Officer of Levitz Furniture Corporation (November 1995-November 1998) and President and Chief Executive Officer of Hills Department Stores (May 1991-July 1995); variously Chairman, Chief Executive Officer, President and Chief Operating Officer (1987-1991) of the Sears Merchandise Group of Sears, Roebuck & Co. | | | 104 | | | Director of various business organizations. | |
|
Kathleen A. Dennis (58)
c/o Kramer Levin Naftalis & Frankel LLP Counsel to the Independent Directors
1177 Avenue of the Americas
New York, NY 10036 | | Director | | Since August 2006 | | President, Cedarwood Associates (mutual fund and investment management consulting) (since July 2006); Chairperson of the Money Market and Alternatives Sub-Committee of the Investment Committee (since October 2006) and Director or Trustee of various Morgan Stanley Funds (since August 2006); formerly, Senior Managing Director of Victory Capital Management (1993-2006). | | | 102 | | | Director of various non-profit organizations. | |
|
Dr. Manuel H. Johnson (63)
c/o Johnson Smick
Group, Inc.
888 16th Street, N.W.
Suite 740
Washington, D.C. 20006 | | Director | | Since July 1991 | | Senior Partner, Johnson Smick International, Inc. (consulting firm); Chairperson of the Investment Committee (since October 2006) and Director or Trustee of various Morgan Stanley Funds (since July 1991); Co-Chairman and a founder of the Group of Seven Council (G7C) (international economic commission); formerly, Chairperson of the Audit Committee (July 1991-September 2006), Vice Chairman of the Board of Governors of the Federal Reserve System and Assistant Secretary of the U.S. Treasury. | | | 104 | | | Director of NVR, Inc. (home construction). | |
|
* Each Director serves an indefinite term, until his or her successor is elected.
** This includes any directorships at public companies and registered investment companies held by the Director at any time during the past five years.
48
Name, Age and Address of
Independent Director | | Position(s)
Held with
Registrant | | Length of
Time
Served* | | Principal Occupation(s)
During Past 5 Years | | Number of
Portfolios in
Fund
Complex
Overseen by
Independent
Director | | Other
Directorships
Held by
Independent
Director** | |
Joseph J. Kearns (69)
c/o Kearns & Associates LLC
PMB754
22631 Pacific Coast Highway
Malibu, CA 90265 | | Director | | Since August
1994 | | President, Kearns & Associates LLC (investment consulting); Chairperson of the Audit Committee (since October 2006) and Director or Trustee of various Morgan Stanley Funds (since August 1994); formerly, Deputy Chairperson of the Audit Committee (July 2003-September 2006) and Chairperson of the Audit Committee of various Morgan Stanley Funds (since August 1994); CFO of the J. Paul Getty Trust. | | | 105 | | | Director of Electro Rent Corporation (equipment leasing) and The Ford Family Foundation. | |
|
Michael F. Klein (53)
c/o Kramer Levin Naftalis & Frankel LLP
Counsel to the Independent Directors
1177 Avenue of the Americas
New York, NY 10036 | | Director | | Since August
2006 | | Managing Director, Aetos Capital, LLC (since March 2000) and Co-President, Aetos Alternatives Management, LLC (since January 2004); Chairperson of the Fixed Income Sub-Committee of the Investment Committee (since October 2006) and Director or Trustee of various Morgan Stanley Funds (since August 2006); formerly, Managing Director, Morgan Stanley & Co. Inc. and Morgan Stanley Dean Witter Investment Management, President, various Morgan Stanley Funds (June 1998-March 2000) and Principal, Morgan Stanley & Co. Inc. and Morgan Stanley Dean Witter Investment Management (August 1997-December 1999). | | | 102 | | | Director of certain investment funds managed or sponsored by Aetos Capital, LLC; Director of Sanitized AG and Sanitized Marketing AG (specialty chemicals). | |
|
Michael E. Nugent (75)
c/o Triumph Capital, L.P. 445 Park Avenue
New York, NY 10022 | | Chairperson of the Board and Director | | Chairperson of the Boards since July 2006 and Trustee since July 1991 | | General Partner, Triumph Capital, L.P. (private investment partnership); Chairperson of the Boards of various Morgan Stanley Funds (since July 2006); Director or Trustee of various Morgan Stanley Funds (since July 1991); formerly, Chairperson of the Insurance Committee (until July 2006). | | | 104 | | | None. | |
|
* Each Director serves an indefinite term, until his or her successor is elected.
** This includes any directorships at public companies and registered investment companies held by the Director at any time during the past five years.
49
Name, Age and Address of
Independent Director | | Position(s)
Held with
Registrant | | Length of
Time
Served* | | Principal Occupation(s)
During Past 5 Years | | Number of
Portfolios in
Fund
Complex
Overseen by
Independent
Director | | Other
Directorships
Held by
Independent
Director** | |
W. Allen Reed (65)
c/o Kramer Levin Naftalis & Frankel LLP
Counsel to the Independent Directors
1177 Avenue of the Americas
New York, NY 10036 | | Director | | Since August
2006 | | Chairperson of the Equity Sub-Committee of the Investment Committee (since October 2006) and Director or Trustee of various Morgan Stanley Funds (since August 2006); formerly, President and CEO of General Motors Asset Management; Chairman and Chief Executive Officer of the GM Trust Bank and Corporate Vice President of General Motors Corporation (August 1994-December 2005). | | | 102 | | | Director of Temple-Inland Industries (packaging and forest products); Director of Legg Mason, Inc. and Director of the Auburn University Foundation. | |
|
Fergus Reid (79)
c/o Joe Pietryka, Inc.
85 Charles Colman Blvd. Pawling, NY 12564 | | Director | | Since June 1992 | | Chairman, Joe Pietryka, Inc.; Chairperson of the Governance Committee and Director or Trustee of various Morgan Stanley Funds (since June 1992). | | | 105 | | | Trustee and Director of certain investment companies in the JPMorgan Funds complex managed by JP Morgan Investment Management Inc. | |
|
The Director who is affiliated with the Adviser or affiliates of the Adviser (as set forth below) and executive officers of the Fund, their age, address, term of office and length of time served, their principal business occupations during the past five years, the number of portfolios in the Fund Complex overseen by the Interested Director (as of December 31, 2011) and the other directorships, if any, held by the Interested Director, are shown below.
Interested Director:
Name, Age and Address of
Interested Director | | Position(s)
Held with
Registrant | | Length of
Time
Served* | | Principal Occupation(s)
During Past 5 Years | | Number of
Portfolios in
Fund
Complex
Overseen by
Interested
Director | | Other
Directorships
Held by
Interested
Director** | |
James F. Higgins (64)
c/o Morgan Stanley Services Company Inc.
Harborside Financial Center 201 Plaza Two
Jersey City, NJ 07311 | | Director | | Since
June 2000 | | Director or Trustee of various Morgan Stanley Funds (since June 2000); Senior Advisor of Morgan Stanley (since August 2000). | | | 103 | | | Director of AXA Financial, Inc. and The Equitable Life Assurance Society of the United States (financial services). | |
|
* Each Director serves an indefinite term, until his or her successor is elected.
** This includes any directorships at public companies and registered investment companies held by the Director at any time during the past five years.
50
Executive Officers:
Name, Age and Address of
Executive Officer | | Position(s)
Held with
Registrant | | Length of
Time Served** | | Principal Occupation(s)
During Past 5 Years | |
Arthur Lev (50)
522 Fifth Avenue
New York, NY 10036 | | President and Principal Executive Officer–Equity and Fixed Income Funds | | Since June 2011 | | President and Principal Executive Officer (since June 2011) of the Equity and Fixed Income Funds in the Fund Complex; Head of the Long Only Business of Morgan Stanley Investment Management (since February 2011); Managing Director of the Adviser and various entities affiliated with the Adviser (since December 2006). Formerly, Chief Strategy Officer of Morgan Stanley Investment Management Traditional Asset Management business (November 2010-February 2011); General Counsel of Morgan Stanley Investment Management (December 2006-October 2010); Partner and General Counsel of FrontPoint Partners LLC (July 2002-December 2006); Managing Director and General Counsel of Morgan Stanley Investment Management (May 2000-June 2002). | |
|
Mary Ann Picciotto (39)
c/o Morgan Stanley Services
Company Inc.
Harborside Financial Center
201 Plaza Two
Jersey City, NJ 07311 | | Chief Compliance Officer | | Since May 2010 | | Managing Director of the Adviser and various entities affiliated with the Adviser; Chief Compliance Officer of various Morgan Stanley Funds (since May 2010); Chief Compliance Officer of the Adviser (since April 2007). | |
|
Stefanie V. Chang Yu (45)
522 Fifth Avenue
New York, NY 10036 | | Vice President | | Since December 1997 | | Managing Director of the Adviser and various entities affiliated with the Adviser; Vice President of various Morgan Stanley Funds (since December 1997). | |
|
Francis J. Smith (46)
c/o Morgan Stanley Services
Company Inc.
Harborside Financial Center
201 Plaza Two
Jersey City, NJ 07311 | | Treasurer and Principal Financial Officer | | Treasurer since July 2003 and Principal Financial Officer since September 2002 | | Executive Director of the Adviser and various entities affiliated with the Adviser; Treasurer and Principal Financial Officer of various Morgan Stanley Funds (since July 2003). | |
|
Mary E. Mullin (45)
522 Fifth Avenue
New York, NY 10036 | | Secretary | | Since June 1999 | | Executive Director of the Adviser and various entities affiliated with the Adviser; Secretary of various Morgan Stanley Funds (since June 1999). | |
|
** Each Officer serves an indefinite term, until his or her successor is elected.
In addition, the following individuals who are officers of the Adviser or who are officers of its affiliates serve as assistant secretaries of the Fund: Joanne Antico, Joseph C. Benedetti, Daniel E. Burton, Tara A. Farrelly and Edward J. Meehan.
For each Director, the dollar range of equity securities beneficially owned by the Director in the Fund and in the Family of Investment Companies (Family of Investment Companies includes all of the registered investment companies advised by the Adviser and Morgan Stanley AIP GP LP) for the calendar year ended December 31, 2011 is set forth in the table below.
| Name of Director | | Dollar Range of Equity Securities
in the Fund
(As of December 31, 2011) | | Aggregate Dollar Range of
Equity Securities in All
Registered Investment Companies
Overseen by Director in
Family of Investment Companies
(As of December 31, 2011) | |
| Independent: | |
| Frank L. Bowman(1) | | | (2 | ) | | over $100,000 | |
| Michael Bozic | | | None | | | over $100,000 | |
| Kathleen A. Dennis | | | (3) | | | over $100,000 | |
| Manuel H. Johnson | | | None | | | over $100,000 | |
51
| Name of Director | | Dollar Range of Equity Securities
in the Fund
(As of December 31, 2011) | | Aggregate Dollar Range of
Equity Securities in All
Registered Investment Companies
Overseen by Director in
Family of Investment Companies
(As of December 31, 2011) | |
| Joseph J. Kearns(1) | | (4) | | over $100,000 | |
| Michael F. Klein | | (5) | | over $100,000 | |
| Michael E. Nugent | | (6) | | over $100,000 | |
| W. Allen Reed(1) | | (7) | | over $100,000 | |
| Fergus Reid(1) | | (8) | | over $100,000 | |
| Interested: | |
| James F. Higgins | | None | | over $100,000 | |
1 Includes the total amount of compensation deferred by the Director at his election pursuant to a deferred compensation plan. Such deferred compensation is placed in a deferral account and deemed to be invested in one or more of the Morgan Stanley Funds (or portfolio thereof) that are offered as investment options under the plan.
2 Focus Growth Portfolio ($10,001-$50,000); Growth Portfolio ($10,001-$50,000) and Small Company Growth Portfolio ($10,001-$50,000).
3 Small Company Growth Portfolio ($50,001-$100,000).
4 Emerging Markets Portfolio ($50,001-$100,000) and U.S. Real Estate Portfolio (over $100,000).
5 Emerging Markets Portfolio ($10,001-$50,000); Emerging Markets Domestic Debt Portfolio ($10,001-$50,000); Global Real Estate Portfolio ($10,001-$50,000); International Equity Portfolio ($50,001-$100,000) and Small Company Growth Portfolio ($10,001-$50,000).
6 Global Franchise Portfolio ($50,001-$100,000).
7 Emerging Markets Portfolio ($50,001-$100,000); Growth Portfolio ($50,001-$100,000); International Equity Portfolio ($10,001-$50,000); Small Company Growth Portfolio ($50,001-$100,000) and U.S. Real Estate Portfolio ($10,001-$50,000).
8 Active International Allocation Portfolio (over $100,000); Growth Portfolio (over $100,000); International Equity Portfolio (over $100,000); U.S. Real Estate Portfolio (over $100,000).
As to each Independent Director and his or her immediate family members, no person owned beneficially or of record securities in an investment adviser or principal underwriter of the Fund, or a person (other than a registered investment company) directly or indirectly controlling, controlled by or under common control with an investment adviser or principal underwriter of the Fund.
As of December 31, 2011, the Directors and officers of the Fund, as a group, owned less than 1% of the outstanding common stock of each Portfolio.
Independent Directors and the Committees
Law and regulation establish both general guidelines and specific duties for the Independent Directors. The Board has four committees: (1) Audit Committee, (2) Governance Committee, (3) Compliance and Insurance Committee and (4) Investment Committee. Three of the Independent Directors serve as members of the Audit Committee, three Independent Directors serve as members of the Governance Committee, four Directors, including three Independent Directors, serve as members of the Compliance and Insurance Committee and all of the Directors serve as members of the Investment Committee.
The Independent Directors are charged with recommending to the full Board approval of management, advisory and administration contracts, Rule 12b-1 plans and distribution and underwriting agreements; continually reviewing fund performance; checking on the pricing of portfolio securities, brokerage commissions, transfer agent costs and performance and trading among funds in the same complex; and approving fidelity bond and related insurance coverage and allocations, as well as other matters that arise from time to time. The Independent Directors are required to select and nominate individuals to fill any Independent Director vacancy on the board of any fund that has a Rule 12b-1 plan of distribution.
The Board of Directors has a separately-designated standing Audit Committee established in accordance with Section 3(a)(58)(A) of the Securities Exchange Act of 1934, as amended. The Audit Committee is charged with recommending to the full Board the engagement or discharge of the Fund's independent registered public accounting firm; directing investigations into matters within the scope of the independent registered public accounting firm's duties, including the power to retain outside specialists; reviewing with the independent
52
registered public accounting firm the audit plan and results of the auditing engagement; approving professional services provided by the independent registered public accounting firm and other accounting firms prior to the performance of the services; reviewing the independence of the independent registered public account firm; considering the range of audit and non-audit fees; reviewing the adequacy of the Fund's system of internal controls; and reviewing the valuation process. The Fund has adopted a formal, written Audit Committee Charter.
The members of the Audit Committee of the Fund are Joseph J. Kearns, Michael E. Nugent and W. Allen Reed. None of the members of the Fund's Audit Committee is an "interested person," as defined under the 1940 Act, of the Fund (with such disinterested Directors being "Independent Directors" or individually, "Independent Director"). Each Independent Director is also "independent" from the Fund under the listing standards of the NYSE. The Chairperson of the Audit Committee of the Fund is Joseph J. Kearns.
The Board of Directors of the Fund also has a Governance Committee. The Governance Committee identifies individuals qualified to serve as Independent Directors on the Fund's Board and on committees of the Board and recommends such qualified individuals for nomination by the Fund's Independent Directors as candidates for election as Independent Directors, advises the Fund's Board with respect to Board composition, procedures and committees, develops and recommends to the Fund's Board a set of corporate governance principles applicable to the Fund, monitors and makes recommendations on corporate governance matters and policies and procedures of the Fund's Board of Directors and any Board committees and oversees periodic evaluations of the Fund's Board and its committees. The members of the Governance Committee of the Fund are Kathleen A. Dennis, Michael F. Klein and Fergus Reid, each of whom is an Independent Director. The Chairperson of the Governance Committee is Fergus Reid.
The Fund does not have a separate nominating committee. While the Fund's Governance Committee recommends qualified candidates for nominations as Independent Directors, the Board of Directors of the Fund believes that the task of nominating prospective Independent Directors is important enough to require the participation of all current Independent Directors, rather than a separate committee consisting of only certain Independent Directors. Accordingly, each Independent Director (Frank L. Bowman, Michael Bozic, Kathleen A. Dennis, Manuel H. Johnson, Joseph J. Kearns, Michael F. Klein, Michael E. Nugent, W. Allen Reed and Fergus Reid) participates in the election and nomination of candidates for election as Independent Directors for the Fund. Persons recommended by the Fund's Governance Committee as candidates for nomination as Independent Directors shall possess such experience, qualifications, attributes, skills and diversity so as to enhance the Board's ability to manage and direct the affairs and business of the Fund, including, when applicable, to enhance the ability of committees of the Board to fulfill their duties and/or to satisfy any independence requirements imposed by law, regulation or any listing requirements of the NYSE. While the Independent Directors of the Fund expect to be able to continue to identify from their own resources an ample number of qualified candidates for the Fund's Board as they deem appropriate, they will consider nominations from shareholders to the Board. Nominations from shareholders should be in writing and sent to the Independent Directors as described below under the caption "Shareholder Communications."
The Board formed the Compliance and Insurance Committee to address insurance coverage and oversee the compliance function for the Fund and the Board. The Compliance and Insurance Committee consists of Frank L. Bowman, Michael Bozic, James F. Higgins and Manuel H. Johnson. Frank L. Bowman, Michael Bozic and Manuel H. Johnson are Independent Directors. The Chairperson of the Compliance and Insurance Committee is Michael Bozic. The Compliance and Insurance Committee has an Insurance Sub-Committee to review and monitor the insurance coverage maintained by the Fund. The Chairperson of the Insurance Sub-Committee is Frank L. Bowman.
The Investment Committee oversees the portfolio investment process for and reviews the performance of the Fund. The Investment Committee also recommends to the Board to approve or renew the Fund's Investment Advisory, Sub-Advisory and Administration Agreements. The members of the Investment Committee are Frank L. Bowman, Michael Bozic, Kathleen A. Dennis, James F. Higgins, Manuel H. Johnson, Joseph J. Kearns, Michael F. Klein, Michael E. Nugent, W. Allen Reed and Fergus Reid. The Chairperson of the Investment Committee is Manuel H. Johnson.
The Investment Committee has three Sub-Committees, each with its own Chairperson. Each Sub-Committee focuses on the funds' primary areas of investment, namely equities, fixed income and alternatives. The Sub-Committees and their members are as follows:
(1) Equity—W. Allen Reed (Chairperson), Frank L. Bowman and Michael E. Nugent.
(2) Fixed Income—Michael F. Klein (Chairperson), Michael Bozic and Fergus Reid.
(3) Money Market and Alternatives—Kathleen A. Dennis (Chairperson), James F. Higgins and Joseph J. Kearns.
53
During the Fund's fiscal year ended December 31, 2011, the Board of Directors held the following meetings:
| Board of Directors | | | 8 | | |
| Committee/Sub-Committee: | | Number of meetings: | |
| Audit Committee | | | 4 | | |
| Governance Committee | | | 4 | | |
| Compliance and Insurance Committee | | | 4 | | |
| Insurance Sub-Committee | | | 1 | | |
| Investment Committee | | | 5 | | |
| Equity Sub-Committee | | | 5 | | |
| Fixed Income Sub-Committee | | | 5 | | |
| Money Market and Alternatives Sub-Committee | | | 6 | | |
Experience, Qualifications and Attributes. The Board has concluded, based on each Director's experience, qualifications and attributes that each Board member should serve as a Director. Following is a brief summary of the information that led to and/or supports this conclusion.
Mr. Bowman has experience in a variety of business and financial matters through his prior service as a Director or Trustee for various other funds in the Fund Complex, where he serves as Chairperson of the Insurance Sub-Committee of the Compliance and Insurance Committee, and as a Director of BP p.l.c. and Naval and Nuclear Technologies LLP. Mr. Bowman also serves as a Director for the Armed Services YMCA of the USA, the Naval Submarine League and the American Shipbuilding Suppliers Association. Mr. Bowman is also a member of the National Security Advisory Council of the Center for U.S. Global Engagement and a member of the CNA Military Advisory Board. Mr. Bowman retired as an Admiral in the U.S. Navy after serving over 38 years on active duty including eight years as Director of the Naval Nuclear Propulsion Program in the Department of the Navy and the Department of Energy (1996-2004). Additionally, Mr. Bowman served as the U.S. Navy's Chief of Naval Personnel where he was responsible for the planning and programming of all manpower, personnel, training and education resources for the U.S. Navy, and on the Joint Staff as Director of Political Military Affairs (1992-1994). In addition, Mr. Bowman served as President and Chief Executive Officer of the Nuclear Energy Institute. Mr. Bowman has received such distinctions as a knighthood as Honorary Knight Commander of the Most Excellent Order of the British Empire and the Officer de l'Orde National du Mérite from the French Government, and was elected to the National Academy of Engineering (2009). He is President of the consulting firm Strategic Decisions, LLC.
With over 20 years of experience on the boards and in senior management of such companies as Kmart Corporation, Levitz Furniture Corporation, Hills Department Stores and Sears Merchandise Group of Sears, Roebuck & Co., where Mr. Bozic also served as Chief Financial Officer of the Merchandise Group, and with over 15 years of experience as a Director or Trustee of certain other funds in the Fund Complex, Mr. Bozic has experience with a variety of financial, management, regulatory and operational issues as well as experience with marketing and distribution. Mr. Bozic has served as the Chairperson of the Compliance and Insurance Committee since 2006.
Ms. Dennis has over 25 years of business experience in the financial services industry and related fields including serving as a Director or Trustee of various other funds in the Fund Complex, where she serves as Chairperson of the Money Market and Alternatives Sub-Committee of the Investment Committee. Ms. Dennis possesses a strong understanding of the regulatory framework under which investment companies must operate based on her years of service to this Board and her position as Senior Managing Director of Victory Capital Management.
In addition to his tenure as a Director or Trustee of various other funds in the Fund Complex, where he formerly served as Chairperson of the Audit Committee, Dr. Johnson has also served as an officer or a board member of numerous companies for nearly 20 years. These positions included Co-Chairman and a founder of the Group of Seven Council, Director of NVR, Inc., Director of Evergreen Energy and Director of Greenwich Capital Holdings. He also has served as Vice Chairman of the Board of Governors of the Federal Reserve System and Assistant Secretary of the U.S. Treasury. In addition, Dr. Johnson also served as Chairman of the Financial Accounting Foundation, which oversees the Financial Accounting Standards Board, for seven years.
Mr. Kearns gained extensive experience regarding accounting through his experience on the Audit Committees of the boards of other funds in the Funds Complex, including serving as either Chairperson or Deputy Chairperson of the Audit Committee for fourteen years, and through his position as Chief Financial Officer of the
54
J. Paul Getty Trust. He also has experience in financial, accounting, investment and regulatory matters through his position as President and founder of Kearns & Associates LLC, a financial consulting company. Mr. Kearns also serves as a director of Electro Rent Corporation and The Ford Family Foundation. The Board has determined that Mr. Kearns is an "audit committee financial expert" as defined by the SEC.
Through his prior positions as Managing Director of Morgan Stanley & Co. Inc. and Morgan Stanley Dean Witter Investment Management and as President of Morgan Stanley Institutional Funds, Mr. Klein has experience in the management and operation of registered investment companies, enabling him to provide management input and investment guidance to the Board. Mr. Klein also has extensive experience in the investment management industry based on his current positions as Managing Director of Aetos Capital, LLC and as Director of certain investment funds managed or sponsored by Aetos Capital, LLC. In addition, he also has experience as a member of the board of other funds in the Fund Complex.
Mr. Nugent has extensive experience with financial, accounting, investment and regulatory matters through his almost 20 years of service on the boards of various funds in the Fund Complex, including time as the Chairperson of the Insurance Committee and Chairman of the Morgan Stanley Funds. Mr. Nugent also has experience as a General Partner in Triumph Capital, L.P.
Mr. Reed has experience on investment company boards and is experienced with financial, accounting, investment and regulatory matters through his prior service as a Director of iShares Inc. and his service as Trustee and Director of other funds in the Fund Complex. Mr. Reed also gained substantial experience in the financial services industry through his position as Director of Legg Mason, Inc. and prior position as President and CEO of General Motors Asset Management.
Mr. Reid has served on a number of mutual fund boards, including as a Trustee and Director of certain investment companies in the JPMorgan Funds complex and as a Director or Trustee of other funds in the Fund Complex. Therefore, Mr. Reid is experienced with financial, accounting, investment and regulatory matters, enabling him to provide management input and investment guidance to the Board.
Mr. Higgins has over 30 years of experience in the financial services industry. Mr. Higgins has substantial mutual fund experience and is experienced with financial, accounting, investment and regulatory matters due to his experience on the boards of other funds in the Fund Complex. Mr. Higgins also serves on the boards of other companies in the financial services industry, including AXA Financial, Inc. and The Equitable Life Assurance Society of the United States.
The Directors' principal occupations during the past five years or more are shown in the above tables.
Advantages of Having the Same Individuals as Directors for the Morgan Stanley Funds
The Independent Directors and the Fund's management believe that having the same Independent Directors for each of the Morgan Stanley Funds avoids the duplication of effort that would arise from having different groups of individuals serving as Independent Directors for each of the funds or even of sub-groups of funds. They believe that having the same individuals serve as Independent Directors of all the Morgan Stanley Funds tends to increase their knowledge and expertise regarding matters which affect the Fund Complex generally and enhances their ability to negotiate on behalf of each fund with the fund's service providers. This arrangement also precludes the possibility of separate groups of Independent Directors arriving at conflicting decisions regarding operations and management of the funds and avoids the cost and confusion that would likely ensue. Finally, having the same Independent Directors serve on all fund boards enhances the ability of each fund to obtain, at modest cost to each separate fund, the services of Independent Directors of the caliber, experience and business acumen of the individuals who serve as Independent Directors of the Morgan Stanley Funds.
Shareholder Communications
Shareholders may send communications to the Fund's Board of Directors. Shareholders should send communications intended for the Fund's Board by addressing the communications directly to that Board (or individual Board members) and/or otherwise clearly indicating in the salutation that the communication is for the Board (or individual Board members) and by sending the communication to either the Fund's office or directly to such Board member(s) at the address specified for each Director previously noted. Other shareholder communications received by the Fund not directly addressed and sent to the Board will be reviewed and generally responded to by management, and will be forwarded to the Board only at management's discretion based on the matters contained therein.
55
Compensation
Each Director (except for the Chairperson of the Boards) receives an annual retainer fee of $210,000 for serving as a Director of the Morgan Stanley Funds.
The Chairperson of the Audit Committee receives an additional annual retainer fee of $78,750 and the Investment Committee Chairperson receives an additional annual retainer fee of $63,000. Other Committee and, effective January 1, 2012, Sub-Committee Chairpersons receive an additional annual retainer fee of $31,500. Prior to January 1, 2012, each Sub-Committee Chairperson received an additional annual retainer fee of $15,750. The aggregate compensation paid to each Director is paid by the Morgan Stanley Funds, and is allocated on a pro rata basis among each of the operational funds/portfolios of the Morgan Stanley Funds based on the relative net assets of each of the funds/portfolios. Michael E. Nugent receives a total annual retainer fee of $420,000 for his services as Chairperson of the Boards of the Morgan Stanley Funds and for administrative services provided to each Board.
The Fund also reimburses such Directors for travel and other out-of-pocket expenses incurred by them in connection with attending such meetings. Directors of the Fund who are employed by the Adviser receive no compensation or expense reimbursement from the Fund for their services as a Director.
Effective April 1, 2004, the Fund began a Deferred Compensation Plan (the "DC Plan"), which allows each Director to defer payment of all, or a portion, of the fees he or she receives for serving on the Board of Directors throughout the year. Each eligible Director generally may elect to have the deferred amounts credited with a return equal to the total return on one or more of the Morgan Stanley Funds (or portfolios thereof) that are offered as investment options under the DC Plan. At the Director's election, distributions are either in one lump sum payment, or in the form of equal annual installments over a period of five years. The rights of an eligible Director and the beneficiaries to the amounts held under the DC Plan are unsecured and such amounts are subject to the claims of the creditors of the Fund.
Prior to April 1, 2004, the Fund maintained a similar Deferred Compensation Plan (the "Prior DC Plan"), which also allowed each Independent Director to defer payment of all, or a portion, of the fees he or she received for serving on the Board of Directors throughout the year. Generally, the DC Plan amends and supersedes the Prior DC Plan and all amounts payable under the Prior DC Plan are now subject to the terms of the DC Plan (except for amounts paid during the calendar year 2004, which remain subject to the terms of the Prior DC Plan).
The following table shows aggregate compensation payable to each of the Fund's Directors from the Fund for the fiscal year ended December 31, 2011 and the aggregate compensation payable to each of the Fund's Directors by the Fund Complex (which includes all of the Morgan Stanley Funds) for the calendar year ended December 31, 2011.
| | | Compensation(1) | |
| Name of Independent Director: | | Aggregate Compensation
From the Fund(2) | | Total Compensation From
Fund and Fund Complex
Paid to Directors(3) | |
| Frank L. Bowman | | $ | 31,770 | | | $ | 225,750 | | |
| Michael Bozic | | | 33,503 | | | | 241,500 | | |
| Kathleen A. Dennis | | | 31,770 | | | | 225,750 | | |
| Manuel H. Johnson | | | 37,886 | | | | 273,000 | | |
| Joseph J. Kearns(2) | | | 40,093 | | | | 306,750 | | |
| Michael F. Klein | | | 31,770 | | | | 225,750 | | |
| Michael E. Nugent | | | 58,317 | | | | 420,000 | | |
| W. Allen Reed(2) | | | 31,797 | | | | 225,750 | | |
| Fergus Reid | | | 33,503 | | | | 259,500 | | |
| Name of Interested Director: | |
| James F. Higgins | | | 29,149 | | | | 210,000 | | |
(1) Includes all amounts paid for serving as director/trustee of the funds, as well as serving as Chairperson of the Boards or a Chairperson of a Committee or Sub-Committee.
(2) The amounts shown in this column represent the aggregate compensation before deferral with respect to the Fund's fiscal year. The following Directors deferred compensation from the Fund during the fiscal year ended December 31, 2011: Mr. Kearns, $14,834 and Mr. Reed, $31,797.
56
(3) The amounts shown in this column represent the aggregate compensation paid by all of the funds in the Fund Complex as of December 31, 2011 before deferral by the Directors under the DC Plan. As of December 31, 2011, the value (including interest) of the deferral accounts across the Fund Complex for Messrs. Kearns, Reed and Reid pursuant to the deferred compensation plan was $532,157, $674,903 and $523,935, respectively. Because the funds in the Fund Complex have different fiscal year ends, the amounts shown in this column are presented on a calendar year basis.
Prior to December 31, 2003, 49 of the Morgan Stanley Funds (the "Adopting Funds") had adopted a retirement program under which an Independent Director who retired after serving for at least five years as an Independent Director of any such fund (an "Eligible Director") would have been entitled to retirement payments, based on factors such as length of service, upon reaching the eligible retirement age. On December 31, 2003, the amount of accrued retirement benefits for each Eligible Director was frozen, and will be payable, together with a return of 8% per annum, at or following each such Eligible Director's retirement as shown in the table below.
The following table illustrates the retirement benefits accrued to the Fund's Independent Directors by the Adopting Funds for the calendar year ended December 31, 2011, and the estimated retirement benefits for the Independent Directors from the Adopting Funds for each calendar year following retirement. Only the Directors noted below participated in the retirement program.
| Name of Independent Director: | | Retirement Benefits accrued as
Fund Expenses
By All Adopting Funds | | Estimated Annual Benefits
Upon Retirement(1)
From All Adopting Funds | |
| Michael Bozic | | $ | 42,107 | | | $ | 43,940 | | |
| Manuel H. Johnson | | $ | 30,210 | | | $ | 64,338 | | |
| Michael E. Nugent | | $ | 6,805 | | | $ | 57,539 | | |
(1) Total compensation accrued under the retirement plan, together with a return of 8% per annum, will be paid annually commencing upon retirement and continuing for the remainder of the Director's life.
Code of Ethics
Pursuant to Rule 17j-1 under the 1940 Act, the Board of Directors has adopted a Code of Ethics for the Fund and approved a Code of Ethics adopted by the Adviser, each Sub-Adviser and the Distributor (collectively the "Codes"). The Codes are intended to ensure that the interests of shareholders and other clients are placed ahead of any personal interest, that no undue personal benefit is obtained from the person's employment activities and that actual and potential conflicts of interest are avoided.
The Codes are designed to detect and prevent improper personal trading. The Codes permit personnel subject to the Codes to invest in securities, including securities that may be purchased, sold or held by the Fund, subject to a number of restrictions and controls, including prohibitions against purchases of securities in an initial public offering and a pre-clearance requirement with respect to personal securities transactions.
INVESTMENT ADVISORY AND OTHER SERVICES
Adviser
The Adviser is a wholly-owned subsidiary of Morgan Stanley, a preeminent global financial services firm engaged in securities trading and brokerage activities, as well as providing investment banking, research and analysis, financing and financial advisory services. The principal offices of Morgan Stanley are located at 1585 Broadway, New York, NY 10036, and the principal offices of the Adviser are located at 522 Fifth Avenue, New York, NY 10036. As of March 31, 2012, the Adviser, together with its affiliated asset management companies, had approximately $303.8 billion in assets under management or supervision.
The Adviser provides investment advice and portfolio management services pursuant to an Investment Advisory Agreement and, subject to the supervision of the Fund's Board of Directors, makes each of the Portfolio's day-to-day investment decisions, arranges for the execution of portfolio transactions and generally manages each of the Portfolio's investments. Pursuant to the Investment Advisory Agreement, the Adviser is entitled to receive from each class of shares of each Portfolio an annual management fee, payable quarterly, equal to the percentage of average daily net assets set forth in the table below. The Adviser has agreed to a reduction in the fees payable to it and to reimburse the Portfolios, if necessary, if such fees would cause the total annual operating expenses of each Portfolio to exceed the percentage of average daily net assets set forth in the table below. In determining the actual amount of fee waiver and/or expense reimbursement for a Portfolio, if any, the Adviser excludes from annual operating expenses certain investment related expenses. The fee waivers and/or expense reimbursements for a Portfolio will continue for at
57
least one year or until such time as the Fund's Board of Directors acts to discontinue all or a portion of such waivers and/or reimbursements when it deems such action is appropriate.
The following table reflects for each Portfolio (i) the advisory fee paid; and (ii) the advisory fee waived and/or affiliated rebates for each of the past three fiscal years ended December 31, 2009, 2010 and 2011.
| | | Advisory Fees Paid
(After Fee Waivers and/or
Affiliated Rebates) | | Advisory Fees Waived | | Affiliated Rebates | |
| Portfolio | | 2009
(000) | | 2010
(000) | | 2011
(000) | | 2009
(000) | | 2010
(000) | | 2011
(000) | | 2009
(000) | | 2010
(000) | | 2011
(000) | |
Active
International
Allocation | | $ | 3,010 | | | $ | 2,504 | | | $ | 2,202 | | | $ | 280 | | | $ | 567 | | | $ | 407 | | | $ | 32 | | | $ | 53 | | | $ | 26 | | |
| Advantage | | | * | | | $ | 0 | | | $ | 0 | | | | * | | | $ | 15 | | | $ | 51 | | | | * | | | $ | 1 | | | $ | 0 | | |
| Asian Equity | | | * | | | | @ | | | $ | 0 | | | | * | | | | @ | | | $ | 14 | | | | * | | | $ | 0 | | | $ | 0 | | |
| Emerging Markets | | $ | 20,299 | | | $ | 24,777 | | | $ | 20,287 | | | $ | 0 | | | $ | 0 | | | $ | 0 | | | $ | 221 | | | $ | 293 | | | $ | 225 | | |
Emerging Markets
Domestic Debt | | $ | 80 | | | $ | 144 | | | $ | 271 | | | $ | 170 | | | $ | 207 | | | $ | 238 | | | $ | 3 | | | $ | 3 | | | $ | 13 | | |
| Focus Growth | | $ | 0 | | | $ | 0 | | | $ | 94 | | | $ | 37 | | | $ | 56 | | | $ | 22 | | | $ | 1 | | | | @ | | | $ | 2 | | |
| Global Advantage | | | * | | | $ | 0 | | | $ | 0 | | | | * | | | $ | 0 | | | $ | 19 | | | | * | | | $ | 0 | | | $ | 0 | | |
| Global Discovery | | | * | | | $ | 0 | | | $ | 0 | | | | * | | | $ | 0 | | | $ | 25 | | | | * | | | $ | 0 | | | $ | 0 | | |
| Global Franchise | | $ | 722 | | | $ | 653 | | | $ | 1,383 | | | $ | 11 | | | $ | 74 | | | $ | 16 | | | $ | 4 | | | $ | 4 | | | $ | 9 | | |
| Global Insight | | | * | | | | * | | | $ | 0 | | | | * | | | | * | | | $ | 0 | | | | * | | | | * | | | $ | 0 | | |
| Global Opportunity | | | * | | | $ | 0 | | | $ | 0 | | | | * | | | $ | 81 | | | $ | 112 | | | | * | | | $ | 1 | | | $ | 0 | | |
| Global Real Estate | | $ | 4,967 | | | $ | 7,189 | | | $ | 12,722 | | | $ | 0 | | | $ | 0 | | | $ | 2 | | | $ | 22 | | | $ | 30 | | | $ | 58 | | |
| Growth | | $ | 3,299 | | | $ | 3,760 | | | $ | 4,278 | | | $ | 0 | | | $ | 0 | | | $ | 0 | | | $ | 28 | | | $ | 23 | | | $ | 26 | | |
| Insight | | | * | | | | * | | | $ | 0 | | | | * | | | | * | | | $ | 0 | | | | * | | | | * | | | $ | 0 | | |
International
Advantage | | | * | | | $ | 0 | | | $ | 0 | | | | * | | | $ | 0 | | | $ | 19 | | | | * | | | $ | 0 | | | $ | 0 | | |
| International Equity | | $ | 27,917 | | | $ | 32,158 | | | $ | 32,354 | | | $ | 336 | | | $ | 1,307 | | | $ | 1,356 | | | $ | 209 | | | $ | 116 | | | $ | 131 | | |
International
Opportunity | | | * | | | $ | 0 | | | $ | 0 | | | | * | | | $ | 39 | | | $ | 61 | | | | * | | | | @ | | | $ | 0 | | |
International
Real Estate | | $ | 3,314 | | | $ | 3,356 | | | $ | 2,626 | | | $ | 0 | | | $ | 0 | | | $ | 0 | | | $ | 13 | | | $ | 10 | | | $ | 3 | | |
International
Small Cap | | $ | 3,291 | | | $ | 3,654 | | | $ | 3,436 | | | $ | 0 | | | $ | 100 | | | $ | 153 | | | $ | 8 | | | $ | 7 | | | $ | 7 | | |
| Opportunity | | | * | | | $ | 707 | | | $ | 1,197 | | | | * | | | $ | 0 | | | $ | 184 | | | | * | | | $ | 7 | | | $ | 3 | | |
Select Global
Infrastructure | | | * | | | $ | 0 | | | $ | 0 | | | | * | | | $ | 25 | | | $ | 100 | | | | * | | | | @ | | | $ | 0 | | |
Small Company
Growth | | $ | 10,678 | | | $ | 12,628 | | | $ | 13,471 | | | $ | 134 | | | $ | 1,076 | | | $ | 855 | | | $ | 34 | | | $ | 27 | | | $ | 51 | | |
| U.S. Real Estate | | $ | 4,279 | | | $ | 7,182 | | | $ | 7,165 | | | $ | 0 | | | $ | 0 | | | $ | 140 | | | $ | 20 | | | $ | 39 | | | $ | 27 | | |
* Not operational for the period.
@ Amount is less than $500.
58
The following table reflects the contractual advisory fee and the maximum expense ratios for each Portfolio.
| Portfolio | | Contractual Rate of Advisory Fees | | Expense Cap
Class I | | Expense Cap
Class P | | Expense Cap
Class H | | Expense Cap
Class L | |
Active
International
Allocation | | 0.65% of the portion of the daily net assets not exceeding $1 billion; 0.60% of the portion of the daily net assets exceeding $1 billion. | | | 0.90 | % | | | 1.15 | % | | | 1.15 | % | | | 1.65 | % | |
|
| Advantage | | 0.75% of the portion of the daily net assets not exceeding $750 million; 0.70% of the portion of the daily net assets exceeding $750 million but not exceeding $1.5 billion; and 0.65% of the portion of the daily net assets exceeding $1.5 billion. | | | 1.05 | % | | | 1.30 | % | | | 1.30 | % | | | 1.09 | % | |
|
| Asian Equity | | 0.95% of the portion of the daily net assets not exceeding $1 billion; and 0.90% of the daily net assets exceeding $1 billion. | | | 1.45 | % | | | 1.70 | % | | | 1.70 | % | | | 2.20 | % | |
|
Emerging
Markets | | 1.25% of the portion of the daily net assets not exceeding $500 million; 1.20% of the portion of the daily net assets exceeding $500 million but not exceeding $1 billion; 1.15% of the portion of the daily net assets exceeding $1 billion but not exceeding $2.5 billion; 1.00% of the daily net assets exceeding $2.5 billion. | | | 1.25 | %* | | | 1.50 | %* | | | 1.50 | % | | | 2.00 | % | |
|
Emerging Markets
Domestic Debt | | 0.75% of the portion of the daily net assets not exceeding $500 million; 0.70% of the portion of the daily net assets exceeding $500 million but not exceeding $1 billion; 0.65% of the portion of the daily net assets exceeding $1 billion. | | | 0.85 | % | | | 1.10 | % | | | 1.10 | % | | | 1.60 | % | |
|
| Focus Growth | | 0.50% of the portion of the daily net assets not exceeding $1 billion; 0.45% of the portion of the daily net assets exceeding $1 billion but not exceeding $2 billion; 0.40% of the portion of the daily net assets exceeding $2 billion but not exceeding $3 billion; 0.35% of the portion of the daily net assets exceeding $3 billion. | | | 1.00 | % | | | 1.25 | % | | | 1.25 | % | | | 1.75 | % | |
|
| Global Advantage | | 0.90% of the portion of the daily net assets not exceeding $1 billion; and 0.85% of the daily net assets exceeding $1 billion. | | | 1.30 | % | | | 1.55 | % | | | 1.55 | % | | | 2.05 | % | |
|
| Global Discovery | | 0.90% of the portion of the daily net assets not exceeding $1 billion; and 0.85% of the daily net assets exceeding $1 billion. | | | 1.35 | % | | | 1.60 | % | | | 1.60 | % | | | 2.10 | % | |
|
| Global Franchise | | 0.80% of the portion of the daily net assets not exceeding $500 million; 0.75% of the portion of the daily net assets exceeding $500 million but not exceeding $1 billion; 0.70% of the portion of the daily net assets exceeding $1 billion. | | | 1.00 | % | | | 1.25 | % | | | 1.25 | % | | | 1.75 | % | |
|
| Global Insight | | 1.00% of the portion of the daily net assets not exceeding $1 billion; 0.95% of the portion of the daily net assets exceeding $1 billion. | | | 1.35 | % | | — | | | 1.60 | % | | | 2.10 | % | |
|
59
| Portfolio | | Contractual Rate of Advisory Fees | | Expense Cap
Class I | | Expense Cap
Class P | | Expense Cap
Class H | | Expense Cap
Class L | |
Global
Opportunity | | 0.90% of the portion of the daily net assets not exceeding $750 million; 0.85% of the portion of the daily net assets exceeding $750 million but not exceeding $1.5 billion; and 0.80% of the portion of the daily net assets exceeding $1.5 billion. | | | 1.25 | % | | | 1.50 | % | | | 1.50 | % | | | 1.55 | % | |
|
Global Real
Estate | | 0.85% of the portion of the daily net assets not exceeding $2.5 billion; and 0.80% of the portion of the daily net assets exceeding $2.5 billion. | | | 1.05 | % | | | 1.30 | % | | | 1.30 | % | | | 1.80 | % | |
|
| Growth | | 0.50% of the portion of the daily net assets not exceeding $1 billion; 0.45% of the portion of the daily net assets exceeding $1 billion but not exceeding $2 billion; 0.40% of the portion of the daily net assets exceeding $2 billion but not exceeding $3 billion; 0.35% of the portion of the daily net assets exceeding $3 billion. | | | 0.80 | % | | | 1.05 | % | | | 1.05 | % | | | 1.55 | % | |
|
| Insight | | 0.80% of the portion of the daily net assets not exceeding $750 million; 0.75% of the portion of the daily net assets exceeding $750 million but not exceeding $1.5 billion; 0.70% of the portion of the daily net assets exceeding $1.5 billion. | | | 1.05 | % | | — | | | 1.30 | % | | | 1.80 | % | |
|
International
Advantage | | 0.90% of the portion of the daily net assets not exceeding $1 billion; and 0.85% of the daily net assets exceeding $1 billion. | | | 1.25 | % | | | 1.50 | % | | | 1.50 | % | | | 2.00 | % | |
|
| International Equity | | 0.80% of the portion of the daily net assets not exceeding $10 billion; 0.75% of the portion of the daily net assets exceeding $10 billion. | | | 0.95 | % | | | 1.20 | % | | | 1.20 | % | | | 1.70 | % | |
|
International
Opportunity | | 0.90% of the portion of the daily net assets not exceeding $1 billion; 0.85% of the portion of the daily net assets exceeding $1 billion. | | | 1.15 | % | | | 1.40 | % | | | 1.40 | % | | | 1.90 | % | |
|
International Real
Estate | | 0.80% of daily net assets. | | | 1.00 | % | | | 1.25 | % | | | 1.25 | % | | | 1.75 | % | |
|
| International Small Cap | | 0.95% of the portion of the daily net assets not exceeding $1.5 billion; 0.90% of the portion of the daily net assets exceeding $1.5 billion. | | | 1.15 | % | | | 1.40 | % | | | 1.40 | % | | | 1.90 | % | |
|
| Opportunity | | 0.50% of the portion of the daily net assets not exceeding $1 billion; 0.45% of the portion of the daily net assets exceeding $1 billion but not exceeding $2 billion; 0.40% of the portion of the daily net assets exceeding $2 billion but not exceeding $3 billion; and 0.35% of the portion of the daily net assets exceeding $3 billion. | | | 0.88 | % | | | 1.13 | % | | | 1.13 | % | | | 1.63 | % | |
|
Select Global
Infrastructure | | 0.85% of daily net assets. | | | 1.15 | % | | | 1.40 | % | | | 1.40 | % | | | 1.90 | % | |
|
60
| Portfolio | | Contractual Rate of Advisory Fees | | Expense Cap
Class I | | Expense Cap
Class P | | Expense Cap
Class H | | Expense Cap
Class L | |
Small
Company
Growth | | 0.92% of the portion of the daily net assets not exceeding $1 billion; 0.85% of the portion of the daily net assets exceeding $1 billion but not exceeding $1.5 billion; 0.80% of the portion of the daily net assets exceeding $1.5 billion. | | | 1.05 | % | | | 1.30 | % | | | 1.30 | % | | | 1.80 | % | |
|
| U.S. Real Estate | | 0.80% of the portion of the daily net assets not exceeding $500 million; 0.75% of the portion of the daily net assets exceeding $500 million but not exceeding $1 billion; 0.70% of the portion of the daily net assets exceeding $1 billion. | | | 1.00 | % | | | 1.25 | % | | | 1.25 | % | | | 1.75 | % | |
|
* As of December 31, 2011, the expense caps for the Emerging Markets Portfolio were 1.65% and 1.90% for Class I and Class P shares, respectively. These caps were reduced to 1.25% and 1.50% for Class I and Class P shares, respectively, effective March 1, 2012.
Investment Sub-Advisers
The Adviser has entered into Sub-Advisory Agreements with Morgan Stanley Investment Management Limited, located at 25 Cabot Square, Canary Wharf, London, E14 4QA, England (with respect to the Emerging Markets, Global Franchise, Global Real Estate, International Equity, International Real Estate, International Small Cap and Select Global Infrastructure Portfolios) and Morgan Staley Investment Management Company, located at 23 Church Street, 16-01 Capital Square, Singapore 049481 (with respect to the Asian Equity, Emerging Markets, Global Franchise, Global Real Estate, International Equity, International Real Estate and Select Global Infrastructure Portfolios). The Sub-Advisers are wholly owned subsidiaries of Morgan Stanley. The Sub-Advisers provide the relevant Portfolios with investment advisory services subject to the overall supervision of the Adviser and the Fund's officers and Directors. The Adviser pays the Sub-Advisers on a monthly basis a portion of the net advisory fees the Adviser receives from the relevant Portfolios.
Proxy Voting Policy and Proxy Voting Record
The Board of Directors believes that the voting of proxies on securities held by the Fund is an important element of the overall investment process. As such, the Directors have delegated the responsibility to vote such proxies to MSIM.
A copy of MSIM's Proxy Voting Policy ("Proxy Policy") is attached hereto as Appendix A. In addition, a copy of the Proxy Policy, as well as the Fund's most recent proxy voting record for the 12-month period ended June 30, as filed with the SEC, are available without charge on our web site at www.morganstanley.com/im. The Fund's proxy voting record is also available without charge on the SEC's web site at http://www.sec.gov.
Principal Underwriter
Morgan Stanley Distribution, Inc., with principal offices at 522 Fifth Avenue, New York, NY 10036, serves as principal underwriter to the Fund. For information relating to the services provided by Morgan Stanley Distribution, Inc., see "Distribution of Shares."
Fund Administration
The Adviser also provides administrative services to the Fund pursuant to an Administration Agreement. The services provided under the Administration Agreement are subject to the supervision of the officers and the Board of Directors of the Fund and include day-to-day administration of matters related to the corporate existence of the Fund, maintenance of records, preparation of reports, supervision of the Fund's arrangements with its custodian, and assistance in the preparation of the Fund's registration statement under federal laws. For its services under the Administration Agreement, the Fund pays the Adviser a monthly fee which on an annual basis equals 0.08% of the average daily net assets of each Portfolio. The Adviser may compensate other service providers for performing shareholder servicing and administrative services.
61
For the fiscal years ended December 31, 2009, 2010 and 2011, the Fund paid the following administrative fees (no administrative fees were waived):
| | | Administrative Fees Paid | |
| Portfolio | | 2009
($000) | | 2010
($000) | | 2011
($000) | |
| Active International Allocation | | $ | 409 | | | $ | 385 | | | $ | 324 | | |
| Advantage | | | * | | | $ | 2 | | | $ | 5 | | |
| Asian Equity | | | * | | | $ | 0 | | | $ | 1 | | |
| Emerging Markets | | $ | 1,375 | | | $ | 1,692 | | | $ | 1,375 | | |
| Emerging Markets Domestic Debt | | $ | 27 | | | $ | 38 | | | $ | 56 | | |
| Focus Growth | | $ | 6 | | | $ | 9 | | | $ | 19 | | |
| Global Advantage | | | * | | | $ | 0 | | | $ | 2 | | |
| Global Discovery | | | * | | | $ | 0 | | | $ | 2 | | |
| Global Franchise | | $ | 74 | | | $ | 73 | | | $ | 141 | | |
| Global Insight | | | * | | | | * | | | $ | 0 | | |
| Global Opportunity | | | * | | | $ | 5 | | | $ | 10 | | |
| Global Real Estate | | $ | 469 | | | $ | 679 | | | $ | 1,203 | | |
| Growth | | $ | 532 | | | $ | 605 | | | $ | 689 | | |
| Insight | | | * | | | | * | | | $ | 0 | | |
| International Advantage | | | * | | | $ | 0 | | | $ | 2 | | |
| International Equity | | $ | 2,846 | | | $ | 3,358 | | | $ | 3,384 | | |
| International Opportunity | | | * | | | $ | 3 | | | $ | 5 | | |
| International Real Estate | | $ | 333 | | | $ | 337 | | | $ | 263 | | |
| International Small Cap | | $ | 278 | | | $ | 317 | | | $ | 303 | | |
| Opportunity | | | * | | | $ | 114 | | | $ | 222 | | |
| Select Global Infrastructure | | | * | | | $ | 2 | | | $ | 9 | | |
| Small Company Growth | | $ | 956 | | | $ | 1,228 | | | $ | 1,295 | | |
| U.S. Real Estate | | $ | 433 | | | $ | 745 | | | $ | 756 | | |
* Not operational for the period.
Sub-Administrator. Under an agreement between the Administrator and State Street, State Street provides certain administrative services to the Fund. For such services, the Administrator pays State Street a portion of the administrative fee the Administrator receives from the Fund. The Administrator supervises and monitors the administrative and accounting services provided by State Street. Their services are also subject to the supervision of the officers and Board of Directors of the Fund. State Street's business address is One Lincoln Street, Boston, MA 02111-2101.
Custodian
State Street, located at One Lincoln Street, Boston, MA 02111-2101, acts as the Fund's custodian. State Street is not an affiliate of the Adviser or the Distributor. In maintaining custody of foreign assets held outside the United States, State Street employs sub-custodians approved by the Board of Directors of the Fund in accordance with regulations of the SEC for the purpose of providing custodial services for such assets.
In the selection of foreign sub-custodians, the Directors or their delegates consider a number of factors, including, but not limited to, the reliability and financial stability of the institution, the ability of the institution to provide efficiently the custodial services required for the Fund, and the reputation of the institution in the particular country or region.
Dividend Disbursing and Transfer Agent
Morgan Stanley Services Company Inc., P.O. Box 219804, Kansas City, MO 64121-9804, provides dividend disbursing and transfer agency services for the Fund. As Transfer Agent and Dividend Disbursing Agent, the Transfer Agent's responsibilities include maintaining shareholder accounts, disbursing cash dividends and reinvesting dividends, processing account registration changes, handling purchase and redemption transactions, mailing prospectuses and reports, mailing and tabulating proxies, and maintaining shareholder records and lists. Pursuant to a Transfer Agency Agreement, the Fund pays Morgan Stanley Services Company Inc. a fee, which has been approved by the Fund's Board of Directors, generally based on the number of classes, accounts and transactions relating to the Portfolios of the Fund. The Fund and Morgan Stanley Services Company Inc. may enter into agreements with third party intermediaries, pursuant to which such intermediaries agree to provide recordkeeping and other administrative services for their clients who invest in the Portfolios. In such instances, the
62
Fund will pay certain fees to the intermediaries for the services they provide that otherwise would have been performed by Morgan Stanley Services Company Inc.
Portfolio Managers
Other Accounts Managed by the Portfolio Managers
Because the portfolio managers may manage assets for other investment companies, pooled investment vehicles and/or other accounts (including institutional clients, pension plans and certain high net worth individuals), there may be an incentive to favor one client over another resulting in conflicts of interest. For instance, the Adviser and/or Sub-Advisers may receive fees from certain accounts that are higher than the fee it receives from the Fund, or it may receive a performance-based fee on certain accounts. In those instances, the portfolio managers may have an incentive to favor the higher and/or performance-based fee accounts over the Fund. In addition, a conflict of interest could exist to the extent the Adviser and/or Sub-Advisers have proprietary investments in certain accounts, where portfolio managers have personal investments in certain accounts or when certain accounts are investment options in the Adviser's and/or Sub-Advisers' employee benefits and/or deferred compensation plans. The portfolio manager may have an incentive to favor these accounts over others. If the Adviser and/or Sub-Advisers manage accounts that engage in short sales of securities of the type in which the Fund invests, the Adviser and/or Sub-Advisers could be seen as harming the performance of the Fund for the benefit of the accounts engaging in short sales if the short sales cause the market value of the securities to fall. The Adviser and/or Sub-Advisers have adopted trade allocation and other policies and procedures that they believe are reasonably designed to address these and other conflicts of interest.
Portfolio Manager Compensation Structure
Portfolio managers receive a combination of base compensation and discretionary compensation, comprising a cash bonus and several deferred compensation programs described below. The methodology used to determine portfolio manager compensation is applied across all funds/accounts managed by the portfolio managers.
Base Salary Compensation. Generally, the portfolio managers receive base salary compensation based on the level of their position with the Adviser and/or Sub-Advisers.
Discretionary Compensation. In addition to base compensation, the portfolio managers may receive discretionary compensation.
Discretionary compensation can include:
• Cash Bonus.
• Morgan Stanley's Long Term Incentive Compensation awards—a mandatory program that defers a portion of discretionary year-end compensation into restricted stock units or other awards based on Morgan Stanley common stock or other plans that are subject to vesting and other conditions. All long term incentive compensation awards are subject to clawback provisions where awards can be cancelled if an employee takes any action, or omits to take any action which; causes a restatement of Morgan Stanley's consolidated financial results; or constitutes a violation of Morgan Stanley's risk policies and standards.
• Investment Management Alignment Plan (IMAP) awards—a mandatory program that defers a portion of discretionary year-end compensation and notionally invests it in designated funds advised by the Adviser and/or Sub-Advisers or their affiliates. The award is subject to vesting and other conditions. Portfolio managers must notionally invest a minimum of 25% to a maximum of 100% of their IMAP deferral account into a combination of the designated funds they manage that are included in the IMAP fund menu, which may or may not include one of the Portfolios. In addition to the clawbacks listed above for long term incentive compensation awards, the provision on IMAP awards is further strengthened such that it may also be triggered if an employee's actions cause substantial financial loss on a trading strategy, investment, commitment or other holding provided that previous gains on those positions were relevant to the employees' prior year compensation decisions.
• Voluntary Deferred Compensation Plans—voluntary programs that permit certain employees to elect to defer a portion of their discretionary year-end compensation and notionally invest the deferred amount across a range of designated investment funds, including funds advised by the Adviser and/or Sub-Advisers or their affiliates.
63
Several factors determine discretionary compensation, which can vary by portfolio management team and circumstances. These factors may include:
• Revenues generated by the investment companies, pooled investment vehicles and other accounts managed by the portfolio manager.
• The investment performance of the funds/accounts managed by the portfolio manager.
• Contribution to the business objectives of the Adviser and/or Sub-Advisers.
• The dollar amount of assets managed by the portfolio manager.
• Market compensation survey research by independent third parties.
• Other qualitative factors, such as contributions to client objectives.
• Performance of Morgan Stanley and Morgan Stanley Investment Management, and the overall performance of the investment team(s) of which the portfolio manager is a member.
Other Accounts Managed by Portfolio Managers as of December 31, 2011 (unless otherwise indicated)
| | | Registered Investment
Companies | | Other Pooled
Investment Vehicles | | Other Accounts | |
| Portfolio and Portfolio Managers | | Number of
Accounts | | Total Assets
in the Accounts | | Number of
Accounts | | Total Assets
in the Accounts | | Number of
Accounts | | Total Assets
in the Accounts | |
| Active International Allocation | |
| Ann D. Thivierge | | 4 | | $808.6 million | | 2 | | $145.1 million | | 10(1) | | $4.8 billion(1) | |
| Asian Equity | |
| James Cheng | | 12 | | $4.2 billion | | 7 | | $2.6 billion | | 26(2) | | $10.9 billion(2) | |
Advantage, Focus Growth,
Global Advantage, Growth,
Small Company Growth | |
| Sam G. Chainani | | 35 | | $17.3 billion | | 4 | | $3.8 billion | | 13 | | $1.2 billion | |
| David S. Cohen | | 35 | | $17.3 billion | | 4 | | $3.8 billion | | 13 | | $1.2 billion | |
| Dennis P. Lynch | | 35 | | $17.3 billion | | 4 | | $3.8 billion | | 13 | | $1.2 billion | |
| Armistead B. Nash | | 35 | | $17.3 billion | | 4 | | $3.8 billion | | 13 | | $1.2 billion | |
| Alexander T. Norton | | 35 | | $17.3 billion | | 4 | | $3.8 billion | | 13 | | $1.2 billion | |
| Jason C. Yeung | | 35 | | $17.3 billion | | 4 | | $3.8 billion | | 13 | | $1.2 billion | |
| Emerging Markets | |
| Eric Carlson | | 7 | | $2.7 billion | | 5 | | $2.6 billion | | 19(2) | | $4.7 billion(2) | |
| James Cheng | | 12 | | $4.2 billion | | 7 | | $2.6 billion | | 26(2) | | $10.9 billion(2) | |
| Ana Cristina Piedrahita | | 7 | | $2.9 billion | | 6 | | $3.2 billion | | 21(3) | | $6.7 billion(3) | |
| Paul C. Psaila | | 8 | | $3.0 billion | | 5 | | $2.6 billion | | 19(2) | | $4.7 billion(2) | |
| Ruchir Sharma | | 10 | | $3.5 billion | | 7 | | $3.6 billion | | 19(2) | | $4.7 billion(2) | |
| Emerging Markets Domestic Debt | |
| Eric J. Baurmeister | | 6 | | $2.4 billion | | 13 | | $1.7 billion | | 13(4) | | $4.4 billion(4) | |
| Federico L. Kaune | | 6 | | $2.4 billion | | 13 | | $1.7 billion | | 13(4) | | $4.4 billion(4) | |
Global Discovery, Global Insight,
Insight | |
| Burak Alici | | 3 | | $5.1 million | | 0 | | $0 | | 0 | | $0 | |
Global Franchise, International
Equity | |
| Vladimir Demine | | 5 | | $4.8 billion | | 7 | | $9.5 billion | | 47(5) | | $11.9 billion(5) | |
| Christian Derold | | 5 | | $4.8 billion | | 7 | | $9.5 billion | | 47(5) | | $11.9 billion(5) | |
| John S. Goodacre | | 5 | | $4.8 billion | | 7 | | $9.5 billion | | 47(5) | | $11.9 billion(5) | |
| William D. Lock | | 5 | | $4.8 billion | | 7 | | $9.5 billion | | 47(5) | | $11.9 billion(5) | |
| Bruno Paulson | | 5 | | $4.8 billion | | 7 | | $9.5 billion | | 47(5) | | $11.9 billion(5) | |
| Walter B. Riddell | | 5 | | $4.8 billion | | 7 | | $9.5 billion | | 47(5) | | $11.9 billion(5) | |
| Peter J. Wright | | 5 | | $4.8 billion | | 7 | | $9.5 billion | | 47(5) | | $11.9 billion(5) | |
Global Real Estate, International
Real Estate | |
| Theodore R. Bigman | | 14 | | $5.1 billion | | 12 | | $6.8 billion | | 65(6) | | $6.4 billion(6) | |
| Angeline Ho | | 5 | | $2.3 billion | | 10 | | $6.7 billion | | 45(7) | | $3.6 billion(7) | |
| Michiel te Paske | | 5 | | $2.3 billion | | 10 | | $6.5 billion | | 47(7) | | $3.8 billion(7) | |
| Sven van Kemenade | | 5 | | $2.3 billion | | 10 | | $6.5 billion | | 47(7) | | $3.8 billion(7) | |
64
| | | Registered Investment
Companies | | Other Pooled
Investment Vehicles | | Other Accounts | |
| Portfolio and Portfolio Managers | | Number of
Accounts | | Total Assets
in the Accounts | | Number of
Accounts | | Total Assets
in the Accounts | | Number of
Accounts | | Total Assets
in the Accounts | |
Global Opportunity,
International Advantage,
International Opportunity,
Opportunity | |
| Kristian Heugh | | 4 | | $265.1 million | | 1 | | $10.0 million | | 0 | | $0 | |
| International Small Cap | |
| Alistair Corden-Lloyd | | 1 | | $293.9 million | | 1 | | $89.0 million | | 2 | | $159.9 million | |
| Margaret Naylor | | 1 | | $293.9 million | | 2 | | $103.7 million | | 2 | | $159.9 million | |
| Arthur Pollock | | 2 | | $595.6 million | | 2 | | $106.8 million | | 9 | | $258.5 million | |
| Alexander Vislykh | | 1 | | $293.9 million | | 2 | | $103.7 million | | 2 | | $159.9 million | |
| Select Global Infrastructure | |
| Theodore R. Bigman | | 14 | | $5.1 billion | | 12 | | $6.8 billion | | 65(6) | | $6.4 billion(6) | |
| Matthew King | | 4 | | $466.6 million | | 1 | | $105.0 million | | 0 | | $0 | |
| U.S. Real Estate | |
| Theodore R. Bigman | | 14 | | $5.1 billion | | 12 | | $6.8 billion | | 65(6) | | $6.4 billion | |
(1) Of these other accounts, one account with a total of approximately $121.8 million in assets, had performance-based fees.
(2) Of these other accounts, three accounts with a total of approximately $1.5 billion in assets, had performance-based fees.
(3) Of these other accounts, four accounts with a total of approximately $3.5 billion in assets, had performance-based fees.
(4) Of these other accounts, one account with a total of approximately $174.9 million in assets, had performance-based fees.
(5) Of these other accounts, two accounts with a total of approximately $677 million in assets, had performance-based fees.
(6) Of these other accounts, 15 accounts with a total of approximately $766.1 million in assets, had performance-based fees.
(7) Of these other accounts, seven accounts with a total of approximately $138.1 million in assets, had performance-based fees.
Securities Ownership of Portfolio Managers (as of December 31, 2011, unless otherwise noted)
| Portfolio and Portfolio Managers | | Portfolio Holdings | |
| Active International Allocation | |
| Ann D. Thivierge | | $100,001-$500,000 | |
| Advantage | |
| Sam G. Chainani | | $50,001-$100,000 | |
| David S. Cohen | | $100,001-$500,000 | |
| Dennis P. Lynch | | Over $1 million | |
| Armistead B. Nash | | $1-$10,000 | |
| Alexander T. Norton | | $10,001-$50,000 | |
| Jason C. Yeung | | $50,001-$100,000 | |
| Asian Equity | |
| James Cheng | | None | |
| Emerging Markets | |
| Eric Carlson | | $100,000-$500,000 | |
| James Cheng | | $500,001-$1 million | |
| Ana Cristina Piedrahita | | $50,001-$100,000 | |
| Paul C. Psaila | | $100,001-$500,000 | |
| Ruchir Sharma | | Over $1 million | |
| Emerging Markets Domestic Debt | |
| Eric Baurmeister | | $100,001-$500,000 | |
| Federico Kaune | | $100,001-$500,000 | |
65
| Portfolio and Portfolio Managers | | Portfolio Holdings | |
| Focus Growth | |
| Sam G. Chainani | | $50,001-$100,000 | |
| David S. Cohen | | $100,001-$500,000 | |
| Dennis P. Lynch | | $500,001-$1 million | |
| Armistead B. Nash | | $1-$10,000 | |
| Alexander T. Norton | | $10,001-$50,000 | |
| Jason C. Yeung | | $10,001-$50,000 | |
| Global Advantage | |
| Sam G. Chainani | | $100,001-$500,000 | |
| David S. Cohen | | $100,001-$500,000 | |
| Dennis P. Lynch | | Over $1 million | |
| Armistead B. Nash | | $1-$10,000 | |
| Alexander T. Norton | | None | |
| Jason C. Yeung | | None | |
| Global Discovery | |
| Burak Alici | | $100,001-$500,000 | |
| Global Franchise | |
| William D. Lock | | Over $1 million | |
| Walter B. Riddell | | Over $1 million | |
| Peter J. Wright | | Over $1 million | |
| John S. Goodacre | | $100,001-$500,000 | |
| Christian Derold | | $100,001-$500,000 | |
| Bruno Paulson | | $100,001-$500,000* | |
| Vladimir Demine | | $50,001-$100,000 | |
| Global Insight | |
| Burak Alici | | None | |
| Global Opportunity | |
| Kristian Heugh | | $100,001-$500,000 | |
| Global Real Estate | |
| Theodore R. Bigman | | $500,001-$1 million | |
| Angeline Ho | | None** | |
| Michiel te Paske | | None** | |
| Sven van Kemenade | | None** | |
| Growth | |
| Sam G. Chainani | | $50,001-$100,000 | |
| David S. Cohen | | $100,001-$500,000 | |
| Dennis P. Lynch | | $500,001-$1 million | |
| Armistead B. Nash | | $1-$10,000 | |
| Alexander T. Norton | | $50,001-$100,000 | |
| Jason C. Yeung | | $100,001-$500,000 | |
| Insight | |
| Burak Alici | | None | |
| International Equity | |
| William D. Lock | | Over $1 million | |
| Walter B. Riddell | | $100,001-$500,000 | |
| Peter J. Wright | | Over $1 million | |
| John S. Goodacre | | $100,001-$500,000 | |
| Christian Derold | | $100,001-$500,000 | |
| Bruno Paulson | | $10,001-$50,000 | |
| Vladimir Demine | | $10,001-$50,000 | |
| International Advantage | |
| Kristian Heugh | | None | |
| International Opportunity | |
| Kristian Heugh | | $10,001-$50,000 | |
66
| Portfolio and Portfolio Managers | | Portfolio Holdings | |
| International Real Estate | |
| Theodore R. Bigman | | Over $1 million | |
| Angeline Ho | | None | |
| Michiel te Paske | | None | |
| Sven van Kemenade | | None | |
| International Small Cap | |
| Alistair Corden-Lloyd | | $10,001-$50,000 | |
| Margaret Naylor | | $100,001-$500,000 | |
| Arthur Pollock | | $50,001-$100,000 | |
| Alexander Vislykh | | $10,001-$50,000 | |
| Opportunity | |
| Kristian Heugh | | $100,001-$500,000 | |
| Select Global Infrastructure | |
| Theodore R. Bigman | | $500,001-$1 million | |
| Matthew King | | $10,001-$50,000 | |
| Small Company Growth | |
| Sam G. Chainani | | $100,001-$500,000 | |
| David S. Cohen | | $100,001-$500,000 | |
| Dennis P. Lynch | | Over $1 million | |
| Armistead B. Nash | | $50,001-$100,000 | |
| Alexander T. Norton | | $10,001-$50,000 | |
| Jason C. Yeung | | $100,001-$500,000 | |
| U.S. Real Estate | |
| Theodore R. Bigman | | $100,001-$500,000 | |
* Not included in the table above, the portfolio manager has made investments in one or more other pooled investment vehicles (i.e., funds not formed or registered in the United States) managed by the same portfolio management team pursuant to a similar strategy.
** Not included in the table above, the portfolio manager has made investments in one or more other pooled investment vehicles (i.e., funds registered under the 1940 Act) managed by the same portfolio management team pursuant to a similar strategy.
Independent Registered Public Accounting Firm
Ernst & Young LLP, located at 200 Clarendon Street, Boston, MA 02116-5021, serves as the Fund's independent registered public accounting firm and audits the annual financial statements of each Portfolio.
Fund Counsel
Dechert LLP, located at 1095 Avenue of the Americas, New York, NY 10036-6797, acts as the Fund's legal counsel.
DISTRIBUTION AND SHAREHOLDER SERVICES PLANS
Morgan Stanley Distribution, Inc., an indirect wholly owned subsidiary of Morgan Stanley, serves as the Fund's exclusive distributor of Portfolio shares pursuant to a Distribution Agreement. In addition, to promote the sale of Fund shares, the Fund has adopted a Shareholder Services Plan with respect to the Class P shares of each Portfolio (except the Global Insight and Insight Portfolios which do not offer Class P shares), a Shareholder Services Plan with respect to the Class H shares of each Portfolio and a Distribution and Shareholder Services Plan with respect to Class L shares of each Portfolio under Rule 12b-1 of the 1940 Act (each, a "Plan"). Under the Plans, each Portfolio (except the Global Insight and Insight Portfolios) pays the Distributor a shareholder services fee of up to 0.25% of the Class P shares' average daily net assets on an annualized basis. Each Portfolio also pays the Distributor a shareholder services fee of up to 0.25% of each of the Class H shares' and Class L shares' average daily net assets on an annualized basis and a distribution fee of up to 0.50% of the Class L shares' average daily net assets on an annualized basis. For at least one year, the Distributor has agreed to waive the 12b-1 fee on Class L shares of the Advantage and Global Opportunity Portfolios to the extent it exceeds 0.04% and 0.30%, respectively, of the average daily net assets of such shares on an annualized basis. Morgan Stanley Distribution, Inc. may retain any portion of the fees it does not expend in meeting its obligations to the Fund. The Distributor may compensate financial intermediaries, plan fiduciaries and administrators, which may or may not be affiliated with Morgan Stanley, for providing distribution-related and/or shareholder support services, including account maintenance services, to shareholders (including, where applicable, underlying beneficial owners) of the Fund. The Distributor and the Adviser also may compensate third parties out of their own assets.
67
The Plans for the Class P, Class H and Class L shares were approved by the Fund's Board of Directors, including the Independent Directors, none of whom has a direct or indirect financial interest in the operation of a Plan or in any agreements related thereto.
The following table describes the shareholder servicing fees paid by each Portfolio with respect to its Class P, Class H and Class L shares, as applicable, pursuant to the Plans and the distribution-related expenses for each Portfolio with respect to its Class P, Class H and Class L shares, as applicable, for the fiscal year ended December 31, 2011. To the extent that expenditures on distribution-related activities exceed the fees paid by a Portfolio, the excess amounts were paid by the Adviser or the Distributor out of its own resources.
| Portfolio | | Distribution
and/or Total
Shareholder
Servicing
Fees Paid
by Portfolio | | Distribution
and/or
Shareholder
Servicing
Expenses* | | Distribution and/or
Shareholder
Servicing Fees
Retained by
Morgan Stanley
Distribution, Inc.
(Expenditures
in Excess of
Distribution and/or
Shareholder
Servicing Fees) | |
| Class P | |
| Active International Allocation | | $ | 33,603 | | | $ | 33,358 | | | $ | 245 | | |
| Advantage | | | 27 | | | | 0 | | | | 27 | | |
| Asian Equity | | | 242 | | | | 0 | | | | 242 | | |
| Emerging Markets | | | 202,392 | | | | 198,316 | | | | 4,076 | | |
| Emerging Markets Domestic Debt | | | 21,495 | | | | 20,394 | | | | 1,101 | | |
| Focus Growth | | | 4,370 | | | | 3,002 | | | | 1,368 | | |
| Global Advantage | | | 256 | | | | 0 | | | | 256 | | |
| Global Discovery | | | 251 | | | | 0 | | | | 251 | | |
| Global Franchise | | | 33,422 | | | | 28,431 | | | | 4,991 | | |
| Global Opportunity | | | 28 | | | | 0 | | | | 28 | | |
| Global Real Estate | | | 276,749 | | | | 271,295 | | | | 5,454 | | |
| Growth | | | 363,834 | | | | 351,663 | | | | 12,171 | | |
| International Advantage | | | 252 | | | | 0 | | | | 252 | | |
| International Equity | | | 2,456,496 | | | | 2,438,318 | | | | 18,178 | | |
| International Opportunity | | | 300 | | | | 0 | | | | 300 | | |
| International Real Estate | | | 11,741 | | | | 9,631 | | | | 2,110 | | |
| International Small Cap | | | 243,481 | | | | 243,418 | | | | 63 | | |
| Opportunity | | | 7,491 | | | | 0 | | | | 7,491 | | |
| Select Global Infrastructure | | | 279 | | | | 0 | | | | 279 | | |
| Small Company Growth | | | 1,007,515 | | | | 1,004,292 | | | | 3,223 | | |
| U.S. Real Estate | | | 238,799 | | | | 231,065 | | | | 7,734 | | |
| Class H | |
| Active International Allocation | | | ** | | | | ** | | | | ** | | |
| Advantage | | $ | 2,604 | | | $ | 2,348 | | | $ | 256 | | |
| Asian Equity | | | 242 | | | | 0 | | | | 242 | | |
| Emerging Markets | | | ** | | | | ** | | | | ** | | |
| Emerging Markets Domestic Debt | | | 5,425 | | | | 5,429 | | | | -4 | | |
| Focus Growth | | | ** | | | | ** | | | | ** | | |
| Global Advantage | | | 2,244 | | | | 359 | | | | 1,885 | | |
| Global Discovery | | | 2,926 | | | | 377 | | | | 2,549 | | |
| Global Franchise | | | ** | | | | ** | | | | ** | | |
| Global Insight | | | 17 | | | | 0 | | | | 17 | | |
| Global Opportunity | | | 13,714 | | | | 9,916 | | | | 3,798 | | |
| Global Real Estate | | | 28,493 | | | | 14,489 | | | | 14,004 | | |
| Growth | | | ** | | | | ** | | | | ** | | |
| Insight | | | 17 | | | | 0 | | | | 17 | | |
| International Advantage | | | 1,736 | | | | 356 | | | | 1,380 | | |
| International Equity | | | ** | | | | ** | | | | ** | | |
| International Opportunity | | | 2,131 | | | | 458 | | | | 1,673 | | |
| International Real Estate | | | ** | | | | ** | | | | ** | | |
| International Small Cap | | | ** | | | | ** | | | | ** | | |
| Opportunity | | | 564,216 | | | | 466,683 | | | | 97,533 | | |
| Select Global Infrastructure | | | 279 | | | | 0 | | | | 279 | | |
| Small Company Growth | | | 10,652 | | | | 9,721 | | | | 931 | | |
| U.S. Real Estate | | | 8,486 | | | | 7,338 | | | | 1,148 | | |
68
| Portfolio | | Distribution
and/or Total
Shareholder
Servicing
Fees Paid
by Portfolio | | Distribution
and/or
Shareholder
Servicing
Expenses* | | Distribution and/or
Shareholder
Servicing Fees
Retained by
Morgan Stanley
Distribution, Inc.
(Expenditures
in Excess of
Distribution and/or
Shareholder
Servicing Fees) | |
| Class L | |
| Active International Allocation | | | ** | | | | ** | | | | ** | | |
| Advantage | | $ | 64 | (1) | | $ | 13 | | | $ | 51 | | |
| Asian Equity | | | 723 | | | | 0 | | | | 723 | | |
| Emerging Markets | | | ** | | | | ** | | | | ** | | |
| Emerging Markets Domestic Debt | | | 37,155 | | | | 36,695 | | | | 460 | | |
| Focus Growth | | | ** | | | | ** | | | | ** | | |
| Global Advantage | | | 766 | | | | 0 | | | | 766 | | |
| Global Discovery | | | 751 | | | | 0 | | | | 751 | | |
| Global Franchise | | | ** | | | | ** | | | | ** | | |
| Global Insight | | | 1 | | | | 0 | | | | 1 | | |
| Global Opportunity | | | 1,750 | (2) | | | 2,790 | | | | -1,040 | | |
| Global Real Estate | | | 53,508 | | | | 51,521 | | | | 1,987 | | |
| Growth | | | ** | | | | ** | | | | ** | | |
| Insight | | | 1 | | | | 0 | | | | 1 | | |
| International Advantage | | | 754 | | | | 0 | | | | 754 | | |
| International Equity | | | ** | | | | ** | | | | ** | | |
| International Opportunity | | | 894 | | | | 0 | | | | 894 | | |
| International Real Estate | | | ** | | | | ** | | | | ** | | |
| International Small Cap | | | ** | | | | ** | | | | ** | | |
| Opportunity | | | 272,890 | | | | 229,621 | | | | 43,269 | | |
| Select Global Infrastructure | | | 834 | | | | 0 | | | | 834 | | |
| Small Company Growth | | | 1,654 | | | | 1,502 | | | | 152 | | |
| U.S. Real Estate | | | 5,619 | | | | 4,951 | | | | 668 | | |
| Fund Total | | $ | 5,923,569 | | | $ | 5,677,750 | | | $ | 245,819 | | |
* Includes payments for distribution and/or shareholder servicing to third parties and affiliated entities.
** Not operational for the period.
(1) The distribution and shareholder servicing fee paid by the Advantage Portfolio pursuant to the Class L Plan reflects a waiver of $1,126.
(2) The distribution and shareholder servicing fee paid by the Global Opportunity Portfolio pursuant to the Class L Plan reflects a waiver of $2,625.
Revenue Sharing
The Adviser and/or the Distributor may pay compensation, out of their own funds and not as an expense of the Portfolios, to Morgan Stanley Smith Barney LLC, a majority-owned broker-dealer subsidiary of Morgan Stanley ("Morgan Stanley Smith Barney"), Citigroup Global Markets Inc. ("CGM"), certain insurance companies and/or other unaffiliated brokers, dealers and other financial intermediaries, including recordkeepers and administrators of various deferred compensation plans ("Intermediaries"), in connection with the sale, distribution, marketing and retention of shares of the Portfolios and/or shareholder servicing. For example, the Adviser or the Distributor may pay additional compensation to an Intermediary for, among other things, promoting the sale and distribution of Portfolio shares, providing access to various programs, mutual fund platforms or preferred or recommended mutual fund lists that may be offered by an Intermediary, granting the Distributor access to an Intermediary's financial advisors and consultants, providing assistance in the ongoing education and training of an Intermediary's financial personnel, furnishing marketing support, maintaining share balances and/or for sub-accounting, recordkeeping, administrative, shareholder, or transaction processing services. Such payments are in addition to any shareholder servicing fees and/or transfer agency fees that may be payable by the Portfolios. The additional payments are generally based on current assets, but may also be based on other measures as determined from time to time by the Adviser and/or the Distributor (e.g., gross sales or number of accounts). The amount of these payments may be different for different Intermediaries.
69
With respect to Morgan Stanley Smith Barney and CGM, these payments currently include the following amounts, which are paid in accordance with the applicable compensation structure:
(1) on Class I, Class P, Class H and Class L shares of the Portfolios held in traditional brokerage accounts where Morgan Stanley Smith Barney or CGM is designated by purchasers as broker-dealer of record, an ongoing annual fee in an amount up to 0.13% of the total average monthly net asset value of such shares.
(2) on Class I and Class P shares of the Portfolios held in traditional brokerage accounts in the Morgan Stanley channel of Morgan Stanley Smith Barney, in addition to the amounts referenced in paragraph (1) above, an ongoing annual fee in an amount up to 35% of each Portfolio's advisory fees accrued from the average daily net asset value of such shares.
(3) On Class I and Class P shares of the Portfolios held in taxable accounts through any fee-based advisory program offered by Morgan Stanley Smith Barney, an ongoing annual fee in an amount up to 0.08% of the total average monthly net asset value of such shares.
The prospect of receiving, or the receipt of, additional compensation as described above by Morgan Stanley Smith Barney and CGM may provide Morgan Stanley Smith Barney and CGM and their financial advisors and other salespersons with an incentive to favor sales of shares of the Portfolios over other investment options with respect to which Morgan Stanley Smith Barney and CGM do not receive additional compensation (or receives lower levels of additional compensation). These payment arrangements, however, will not change the price that an investor pays for shares of the Portfolios or the amount that the Portfolios receive to invest on behalf of an investor. Investors may wish to take such payment arrangements into account when considering and evaluating any recommendations relating to Portfolio shares and should review carefully any disclosure provided by Morgan Stanley Smith Barney and CGM as to their compensation. Currently, there are no compensation arrangements in place with other Intermediaries.
BROKERAGE PRACTICES
Portfolio Transactions
The Adviser and/or Sub-Advisers are responsible for decisions to buy and sell securities for each Portfolio, for broker-dealer selection and for negotiation of commission rates. The Adviser and/or Sub-Advisers are prohibited from directing brokerage transactions on the basis of the referral of clients or the sale of shares of advised investment companies. Purchases and sales of securities on a stock exchange are effected through brokers who charge a commission for their services. In the OTC market, securities may be traded as agency transactions through broker dealers or traded on a "net" basis with dealers acting as principal for their own accounts without a stated commission, although the price of the security usually includes profit to the dealer. In underwritten offerings, securities are purchased at a fixed price which includes an amount of compensation to the underwriter, generally referred to as the underwriter's concession or discount. When securities are purchased or sold directly from or to an issuer, no commissions or discounts are paid.
On occasion, a Portfolio may purchase certain money market instruments directly from an issuer without payment of a commission or concession. Money market instruments are generally traded on a "net" basis with dealers acting as principal for their own accounts without a stated commission, although the price of the security usually includes a profit to the dealer.
The Fund anticipates that certain of its transactions involving foreign securities will be effected on securities exchanges. Fixed commissions on such transactions are generally higher than negotiated commissions on domestic transactions. There is also generally less government supervision and regulation of foreign securities exchanges and brokers than in the United States.
The Adviser and/or Sub-Advisers serve as investment adviser to a number of clients, including other investment companies. The Adviser and/or Sub-Advisers attempt to equitably allocate purchase and sale transactions among the Portfolios of the Fund and other client accounts. To that end, the Adviser and/or Sub-Advisers consider various factors, including respective investment objectives, relative size of portfolio holdings of the same or comparable securities, availability of cash for investment, size of investment commitments generally held and the opinions of the persons responsible for managing the Portfolios of the Fund and other client accounts.
The Adviser and/or Sub-Advisers select the brokers or dealers that will execute the purchases and sales of investment securities for each Portfolio. The Adviser and/or Sub-Advisers effect transactions with those broker-dealers that they believe provide prompt execution of orders in an effective manner at the most favorable prices. The Adviser and/or Sub-Advisers may place portfolio transactions with those brokers and dealers who also furnish research and other services to the Fund, the Adviser and/or the Sub-Advisers. Services provided may include
70
certain research services (as described below), as well as effecting securities transactions and performing functions incidental thereto (such as clearance, settlement and custody).
The Adviser and its affiliated investment advisers have established commission sharing arrangements under a commission management program (the "Commission Management Program" or "CMP"), pursuant to which execution and research costs or a portion of those costs are decoupled in accordance with applicable laws, rules and regulations. Under the CMP, the Adviser and its affiliated investment advisers select approved equity brokers (which include the Adviser's affiliates) for execution services and after accumulation of commissions at such brokers, the Adviser and/or its affiliates instruct these approved equity brokers to pay for eligible research provided by executing brokers or third-party research providers, which are selected independently by a Research Services Committee of the Adviser and its affiliated investment advisers. Generally, the Adviser and its affiliated investment advisers will direct the approved equity broker to record research credits based upon a previously agreed-upon allocation and will periodically instruct the approved equity broker to direct specified dollar amounts from that pool to pay for eligible research services provided by third-party research providers and executing brokers. The research credits are pooled among the Adviser and its affiliated investment advisers and allocated on behalf of both the Adviser and its affiliated investment advisers. Likewise, the research services obtained under the CMP are shared among the Adviser and its affiliated investment advisers.
Selection of approved equity brokers for execution is based on three main criteria: access to liquidity, provision of capital and quality of execution. Under the CMP, each approved equity broker is responsible for the payment of fees for research services and obtains the research services pursuant to written agreements between the approved equity broker and the third-party research provider.
For those costs not decoupled, but retained by broker-dealers, the Adviser also effects transactions with brokers which directly pay for research services provided by those brokers in accordance with Section 28(e) of the 1934 Act. Such transactions include equity transactions and may include fixed-income transactions effected on an agency basis.
Transactions involving client accounts managed by two or more affiliated investment advisers may be aggregated and executed using the services of broker-dealers that provide third party benefits/research so long as: (i) all client accounts involved in the transaction benefit from one or more of the services offered by such broker-dealer; and (ii) each affiliated investment adviser has approved the use of such broker-dealer and the services provided thereby.
The research services received include those of the nature described above and other services which aid the Adviser in fulfilling its investment decision making responsibilities, including (a) furnishing advice as to the value of securities, the advisability of investing in, purchasing or selling securities, and the availability of securities or purchasers or sellers of securities; and (b) furnishing analyses and reports concerning issuers, industries, securities, economic factors and trends, portfolio strategy and the performance of accounts. Where a particular item (such as proxy services) has both research and non-research related uses, the Adviser will make a reasonable allocation of the cost of the item between research and non-research uses and will only pay for the portion of the cost allocated to research uses with client brokerage transactions. Research services furnished or paid for by brokers through whom the Adviser effects transactions for a particular account may be used by the Adviser or its affiliated investment advisers in servicing their other accounts, and not all such services may be used for the benefit of the client which pays the brokerage commission that results in the receipt of such research services. Commissions paid to brokers providing research services may be higher than those charged by brokers not providing services.
The Adviser and its affiliated investment advisers make a good faith determination of the value of research services in accordance with Section 28(e) of the 1934 Act, UK Financial Services Authority Rules and other relevant regulatory requirements.
Certain investment professionals and other employees of the Adviser are also officers of affiliated investment advisers and may provide investment advisory services to clients of such affiliated investment advisers. The Adviser's personnel also provide research and trading support to personnel of certain affiliated investment advisers. Research related costs may be shared by affiliated investment advisers and may benefit the clients of such affiliated investment advisers. Research services that benefit the Adviser may be received in connection with commissions generated by clients of its affiliated investment advisers. Similarly, research services received in connection with commissions generated by the Adviser's clients may benefit affiliated investment advisers and their clients. Moreover, research services provided by broker-dealers through which the Adviser effects transactions for a particular account may be used by the Adviser and/or an affiliated investment adviser in servicing its other accounts and not all such research services may be used for the benefit of the particular client, which pays the brokerage commission giving rise to the receipt of such research services.
71
Affiliated Brokers
Subject to the overriding objective of obtaining the best execution of orders, the Fund may use broker-dealer affiliates of the Adviser to effect Portfolio brokerage transactions, including transactions in futures contracts and options on futures contracts, under procedures adopted by the Fund's Board of Directors. In order to use such affiliates, the commission rates and other remuneration paid to the affiliates must be fair and reasonable in comparison to those of other broker-dealers for comparable transactions involving similar securities being purchased or sold during a comparable time period. This standard would allow the affiliated broker or dealer to receive no more than the remuneration which would be expected to be received by an unaffiliated broker.
Pursuant to an order issued by the SEC, the Fund is permitted to engage in principal transactions involving money market instruments, subject to certain conditions, with Morgan Stanley & Co. LLC, a broker-dealer affiliated with the Fund's Adviser.
During the fiscal years ended December 31, 2009, 2010 and 2011, the Fund did not effect any principal transactions with an affiliated broker or dealer.
Brokerage Commissions Paid
During the fiscal years ended December 31, 2009, 2010 and 2011, the Fund paid brokerage commissions of approximately $13,691,791, $13,006,131 and $12,788,501, respectively. During the fiscal years ended December 31, 2009, 2010 and 2011, the Fund paid in the aggregate $178,702, $213,013 and $157,372, respectively, in brokerage commissions to Morgan Stanley & Co. LLC and/or its affiliated broker-dealers. During the fiscal year ended December 31, 2011, the brokerage commissions paid to Morgan Stanley & Co. LLC and/or its affiliated broker-dealers represented approximately 1.23% of the total brokerage commissions paid by the Fund during the year 2011 and were paid on account of transactions having an aggregate dollar value equal to approximately 2.05% of the aggregate dollar value of all portfolio transactions of the Fund during the year 2011 for which commissions were paid.
During the fiscal years ended December 31, 2009, 2010 and 2011, the Fund paid in the aggregate $0, $306,743 and $444,009, respectively, as brokerage commissions to Citigroup, Inc. and/or its affiliated broker-dealers. During the fiscal year ended December 31, 2011, the brokerage commissions paid to Citigroup, Inc. and/or its affiliated broker-dealers represented approximately 3.47% of the total brokerage commissions paid by the Fund during the period and were paid on account of transactions having an aggregate dollar value equal to approximately 3.73% of the aggregate dollar value of all portfolio transactions of the Fund during the period for which commissions were paid.
For the fiscal year ended December 31, 2011, each Portfolio paid brokerage commissions, including brokerage commissions paid to affiliated broker-dealers as follows:
| | | Brokerage Commissions Paid During Fiscal Year Ended December 31, 2011 | |
| | |
| | Commissions Paid to
Morgan Stanley & Co. LLC
and/or its affiliated broker-dealers | | Commissions Paid to
Citigroup, Inc. and/or
its affiliated broker-dealers | |
| Portfolio | | Total
Commissions
Paid | | Total
Commissions | | Percent of
Total
Commissions | | Percent of
Total
Brokered
Transactions | | Total
Commissions | | Percent of
Total
Commissions | | Percent of
Total
Brokered
Transactions | |
Active International
Allocation | | $ | 222,313 | | | $ | 0 | | | | 0.00 | % | | | 0.00 | % | | $ | 3,266 | | | | 1.47 | % | | | 0.85 | % | |
| Advantage | | $ | 3,247 | | | $ | 366 | | | | 11.27 | % | | | 11.76 | % | | $ | 0 | | | | 0.00 | % | | | 0.00 | % | |
| Asian Equity | | $ | 1,875 | | | $ | 133 | | | | 7.09 | % | | | 4.84 | % | | $ | 19 | | | | 1.01 | % | | | 0.88 | % | |
| Emerging Markets | | $ | 4,415,616 | | | $ | 68,866 | | | | 1.56 | % | | | 2.32 | % | | $ | 268,156 | | | | 6.07 | % | | | 5.46 | % | |
Emerging Markets Domestic
Debt | | $ | 0 | | | $ | 0 | | | | 0.00 | % | | | 0.00 | % | | $ | 0 | | | | 0.00 | % | | | 0.00 | % | |
| Focus Growth | | $ | 11,493 | | | $ | 784 | | | | 6.82 | % | | | 7.70 | % | | $ | 289 | | | | 2.51 | % | | | 2.10 | % | |
| Global Advantage | | $ | 2,013 | | | $ | 18 | | | | 0.89 | % | | | 1.87 | % | | $ | 0 | | | | 0.00 | % | | | 0.00 | % | |
| Global Discovery | | $ | 6,051 | | | $ | 316 | | | | 5.22 | % | | | 5.70 | % | | $ | 0 | | | | 0.00 | % | | | 0.00 | % | |
| Global Franchise | | $ | 135,501 | | | $ | 7 | | | | 0.01 | % | | | 0.00 | % | | $ | 4,632 | | | | 3.42 | % | | | 2.98 | % | |
| Global Insight* | | $ | 482 | | | $ | 0 | | | | 0.00 | % | | | 0.00 | % | | $ | 0 | | | | 0.00 | % | | | 0.00 | % | |
| Global Opportunity | | $ | 16,173 | | | $ | 280 | | | | 1.73 | % | | | 4.99 | % | | $ | 0 | | | | 0.00 | % | | | 0.00 | % | |
| Global Real Estate | | $ | 1,415,361 | | | $ | 37,314 | | | | 2.64 | % | | | 5.37 | % | | $ | 22,556 | | | | 1.59 | % | | | 1.03 | % | |
| Growth | | $ | 259,333 | | | $ | 0 | | | | 0.00 | % | | | 0.00 | % | | $ | 404 | | | | 0.16 | % | | | 0.06 | % | |
| Insight* | | $ | 468 | | | $ | 0 | | | | 0.00 | % | | | 0.00 | % | | $ | 0 | | | | 0.00 | % | | | 0.00 | % | |
| International Advantage | | $ | 1,931 | | | $ | 7 | | | | 0.36 | % | | | 0.43 | % | | $ | 0 | | | | 0.00 | % | | | 0.00 | % | |
| International Equity | | $ | 3,474,209 | | | $ | 0 | | | | 0.00 | % | | | 0.00 | % | | $ | 119,753 | | | | 3.45 | % | | | 6.98 | % | |
| International Opportunity | | $ | 8,121 | | | $ | 106 | | | | 1.31 | % | | | 4.29 | % | | $ | 0 | | | | 0.00 | % | | | 0.00 | % | |
72
| | | Brokerage Commissions Paid During Fiscal Year Ended December 31, 2011 | |
| | |
| | Commissions Paid to
Morgan Stanley & Co. LLC
and/or its affiliated broker-dealers | | Commissions Paid to
Citigroup, Inc. and/or
its affiliated broker-dealers | |
| Portfolio | | Total
Commissions
Paid | | Total
Commissions | | Percent of
Total
Commissions | | Percent of
Total
Brokered
Transactions | | Total
Commissions | | Percent of
Total
Commissions | | Percent of
Total
Brokered
Transactions | |
| International Real Estate | | $ | 312,324 | | | $ | 0 | | | | 0.00 | % | | | 0.00 | % | | $ | 8,831 | | | | 2.83 | % | | | 1.94 | % | |
| International Small Cap | | $ | 763,576 | | | $ | 0 | | | | 0.00 | % | | | 0.00 | % | | $ | 2,611 | | | | 0.34 | % | | | 0.32 | % | |
| Opportunity | | $ | 176,349 | | | $ | 14,168 | | | | 8.03 | % | | | 12.35 | % | | $ | 0 | | | | 0.00 | % | | | 0.00 | % | |
Select Global
Infrastructure | | $ | 12,714 | | | $ | 36 | | | | 0.28 | % | | | 0.18 | % | | $ | 1,672 | | | | 13.15 | % | | | 6.58 | % | |
| Small Company Growth | | $ | 1,076,241 | | | $ | 7,272 | | | | 0.68 | % | | | 1.33 | % | | $ | 9,941 | | | | 0.92 | % | | | 1.43 | % | |
| U.S. Real Estate | | $ | 473,110 | | | $ | 27,699 | | | | 5.85 | % | | | 11.71 | % | | $ | 1,879 | | | | 0.40 | % | | | 0.94 | % | |
* The Portfolio commenced operations on December 28, 2011.
For the fiscal years ended December 31, 2009 and 2010, each Portfolio paid brokerage commissions, including brokerage commissions paid to affiliated broker-dealers, as follows. No brokerage commissions were paid to Citigroup, Inc. and/or its affiliated broker-dealers by any Portfolio during the period from June 1, 2009 to December 31, 2009.
| | | Brokerage Commission Paid During Fiscal Years Ended
December 31, 2009 and 2010 | |
| | | Fiscal Year Ended
December 31, 2009 | | Fiscal Year Ended
December 31, 2010 | |
| Portfolio | | Total | | Morgan
Stanley & Co. LLC
and/or its affiliated
broker-dealers | | Total | | Morgan
Stanley & Co. LLC
and/or its affiliated
broker-dealers | | Citigroup, Inc.
and/or its affiliated
broker-dealers | |
| Active International Allocation | | $ | 355,625 | | | $ | — | | | $ | 159,406 | | | $ | 0 | | | $ | 0 | | |
| Advantage | | $ | — | | | $ | — | | | $ | 2,655 | | | $ | 181 | | | $ | 56 | | |
| Asian Equity* | | $ | — | | | $ | — | | | $ | 569 | | | $ | 0 | | | $ | 0 | | |
| Emerging Markets | | $ | 4,611,176 | | | $ | 96,921 | | | $ | 3,773,907 | | | $ | 129,180 | | | $ | 190,157 | | |
| Emerging Markets Domestic Debt | | $ | 308 | | | $ | — | | | $ | 0 | | | $ | 0 | | | $ | 0 | | |
| Focus Growth | | $ | 2,289 | | | $ | 251 | | | $ | 13,189 | | | $ | 160 | | | $ | 438 | | |
| Global Advantage* | | $ | — | | | $ | — | | | $ | 440 | | | $ | 0 | | | $ | 0 | | |
| Global Discovery* | | $ | — | | | $ | — | | | $ | 572 | | | $ | 0 | | | $ | 0 | | |
| Global Franchise | | $ | 47,026 | | | $ | — | | | $ | 83,928 | | | $ | 655 | | | $ | 4,748 | | |
| Global Insight** | | $ | — | | | $ | — | | | $ | — | | | $ | — | | | $ | — | | |
| Global Opportunity | | $ | — | | | $ | — | | | $ | 8,437 | | | $ | 0 | | | $ | 0 | | |
| Global Real Estate | | $ | 888,085 | | | $ | 11,119 | | | $ | 835,409 | | | $ | 16,249 | | | $ | 5,879 | | |
| Growth | | $ | 351,906 | | | $ | 18,642 | | | $ | 491,650 | | | $ | 7,665 | | | $ | 6,262 | | |
| Insight** | | $ | — | | | $ | — | | | $ | — | | | $ | — | | | $ | — | | |
| International Advantage* | | $ | — | | | $ | — | | | $ | 712 | | | $ | 0 | | | $ | 0 | | |
| International Equity | | $ | 3,633,228 | | | $ | 522 | | | $ | 4,251,088 | | | $ | 0 | | | $ | 45,978 | | |
| International Opportunity | | $ | — | | | $ | — | | | $ | 8,295 | | | $ | 0 | | | $ | 0 | | |
| International Real Estate | | $ | 681,219 | | | $ | 7,374 | | | $ | 659,222 | | | $ | 0 | | | $ | 25,539 | | |
| International Small Cap | | $ | 1,341,290 | | | $ | 1,561 | | | $ | 848,784 | | | $ | 0 | | | $ | 14,354 | | |
| Opportunity | | $ | — | | | $ | — | | | $ | 69,282 | | | $ | 911 | | | $ | 0 | | |
| Select Global Infrastructure*** | | $ | — | | | $ | — | | | $ | 7,075 | | | $ | 46 | | | $ | 0 | | |
| Small Company Growth | | $ | 794,728 | | | $ | — | | | $ | 1,025,019 | | | $ | 4,545 | | | $ | 5,169 | | |
| U.S. Real Estate | | $ | 550,508 | | | $ | 22,231 | | | $ | 766,492 | | | $ | 53,421 | | | $ | 8,161 | | |
* The Portfolio commenced operations on December 28, 2010.
** The Portfolio commenced operations on December 28, 2011.
*** The Portfolio commenced operations on September 20, 2010.
Regular Broker-Dealers
The Fund's regular broker-dealers are (i) the ten broker-dealers that received the greatest dollar amount of brokerage commissions from the Fund; (ii) the ten broker-dealers that engaged as principal in the largest dollar
73
amount of portfolio transactions; and (iii) the ten broker-dealers that sold the largest dollar amount of Portfolio shares. During the fiscal year ended December 31, 2011, the following Portfolios purchased securities issued by the Fund's regular broker-dealers:
| Portfolio | | Regular Broker-Dealer | | Approximate
Value of Portfolio
Holdings as of
December 31, 2011 | |
| Active International Allocation | | Credit Suisse Group AG | | $ | 448,000 | | |
| | | Deutsche Bank Financial LLC | | | 638,000 | | |
| | | HSBC Holdings PLC | | | 3,410,000 | | |
| | | Barclays Capital Group | | | 434,000 | | |
| | | UBS Financial Services, Inc. | | | 756,000 | | |
| Emerging Markets Domestic Debt | | Banco Santander | | | 249,000 | | |
| | | JP Morgan Securities LLC | | | 2,767,000 | | |
| Global Opportunity | | Deutsche Bank Financial LLC | | | 278,000 | | |
| Growth | | Goldman Sachs & Co. | | | 1,895,000 | | |
| International Advantage | | Deutsche Bank Financial LLC | | | 129,000 | | |
| International Equity | | UBS Financial Services, Inc. | | | 44,547,000 | | |
| | | Barclays Capital Group | | | 32,827,000 | | |
| International Opportunity | | Deutsche Bank Financial LLC | | | 94,000 | | |
| Opportunity | | Deutsche Bank Financial LLC | | | 7,929,000 | | |
Portfolio Turnover
The Portfolios generally do not invest for short-term trading purposes; however, when circumstances warrant, each Portfolio may sell investment securities without regard to the length of time they have been held. Market conditions in a given year could result in a higher or lower portfolio turnover rate than expected and the Portfolios will not consider portfolio turnover rate a limiting factor in making investment decisions consistent with their investment objectives and policies. Higher portfolio turnover (e.g., over 100%) necessarily will cause the Portfolios to pay correspondingly increased brokerage and trading costs. In addition to transaction costs, higher portfolio turnover may result in the realization of capital gains. As discussed under "Taxes," to the extent net short-term capital gains are realized, any distributions resulting from such gains are considered ordinary income for federal income tax purposes.
GENERAL INFORMATION
Fund History
The Fund was incorporated pursuant to the laws of the State of Maryland on June 16, 1988 under the name Morgan Stanley Institutional Fund, Inc. The Fund filed a registration statement with the SEC registering itself as an open-end management investment company offering diversified and non-diversified series under the 1940 Act and its shares under the 1933 Act, as amended, and commenced operations on November 15, 1988. On December 1, 1998, the Fund changed its name to Morgan Stanley Dean Witter Institutional Fund, Inc. Effective May 1, 2001, the Fund changed its name to Morgan Stanley Institutional Fund, Inc.
Description of Shares and Voting Rights
The Fund's Amended and Restated Articles of Incorporation permit the Directors to issue 37.5 billion shares of common stock, par value $.001 per share ($.003 with respect to the Emerging Markets Domestic Debt Portfolio—Class I, Class P, Class H and Class L shares), from an unlimited number of classes or series of shares. The shares of each Portfolio of the Fund, when issued, are fully paid and nonassessable, and have no preference as to conversion, exchange, dividends, retirement or other features. Portfolio shares have no pre-emptive rights. The shares of the Fund have non-cumulative voting rights, which means that the holders of more than 50% of the shares voting for the election of Directors can elect 100% of the Directors if they choose to do so. Shareholders are entitled to one vote for each full share held (and a fractional vote for each fractional share held), then standing in their name on the books of the Fund. No portfolio of the Fund is subject to the liabilities of any other portfolio of the Fund.
Dividends and Capital Gains Distributions
The Fund's policy is to distribute substantially all of each Portfolio's net investment income, if any. The Fund may also distribute any net realized capital gains in the amount and at the times that will avoid both income (including taxable gains) taxes on it and the imposition of the federal excise tax on income and capital gains (see
74
"Taxes"). However, the Fund may also choose to retain net realized capital gains and pay taxes on such gains. The amounts of any income dividends or capital gains distributions cannot be predicted.
Any dividend or distribution paid shortly after the purchase of shares of a Portfolio by an investor may have the effect of reducing the per share net asset value of that Portfolio by the per share amount of the dividend or distribution. Furthermore, such dividends or distributions, although in effect a return of capital, are subject to income taxes for shareholders subject to tax as set forth herein and in the applicable Prospectus.
As set forth in the Prospectuses, unless the shareholder elects otherwise in writing, all dividends and capital gains distributions for a class of shares are automatically reinvested in additional shares of the same class of the Portfolio at net asset value (as of the business day following the record date). This automatic reinvestment of dividends and distributions will remain in effect until the shareholder notifies the Fund by telephone or in writing that either the Income Option (income dividends in cash and capital gain distributions reinvested in shares at net asset value) or the Cash Option (both income dividends and capital gains distributions in cash) has been elected. It may take up to three business days to effect this change. An account statement is sent to shareholders whenever a dividend or distribution is paid.
TAXES
The following is only a summary of certain additional federal income tax considerations generally affecting the Fund, Portfolios and their shareholders. No attempt is made to present a detailed explanation of the federal, state or local tax treatment of the Fund, Portfolios or shareholders, and the discussion here and in the Prospectuses is not intended to be a substitute for careful tax planning.
The following general discussion of certain federal income tax consequences is based on the Code and the regulations issued thereunder as in effect on the date of this SAI. New legislation, as well as administrative changes or court decisions, may significantly change the conclusions expressed herein, and may have a retroactive effect with respect to the transactions contemplated herein.
Each Portfolio within the Fund is generally treated as a separate corporation for federal income tax purposes. Thus, the provisions of the Code generally will be applied to each Portfolio separately, rather than to the Fund as a whole.
Regulated Investment Company Qualification
Each Portfolio intends to qualify and elect to be treated for each taxable year as a RIC under Subchapter M of the Code. In order to so qualify, each Portfolio must, among other things, (i) derive at least 90% of its gross income each taxable year from dividends, interest, payments with respect to securities loans, gains from the sale or other disposition of stock, securities or foreign currencies, and other income derived with respect to its business of investing in such stock, securities or currencies, including, generally, certain gains from options, futures and forward contracts; and (ii) diversify its holdings so that, at the end of each fiscal quarter of the Portfolio's taxable year, (a) at least 50% of the market value of the Portfolio's total assets is represented by cash and cash items, U.S. government securities, securities of other RICs, and other securities, with such other securities limited, in respect to any one issuer, to an amount not greater than 5% of the value of the Portfolio's total assets or 10% of the outstanding voting securities of such issuer, and (b) not more than 25% of the value of its total assets are invested in the securities (other than U.S. government securities or securities of other RICs) of any one issuer or two or more issuers which the Portfolio controls and which are engaged in the same, similar, or related trades or businesses. For purposes of the 90% gross income requirement described above, foreign currency gains will generally be treated as qualifying income under current federal income tax law. However, the Code expressly provides the U.S. Treasury with authority to issue regulations that would exclude foreign currency gains from qualifying income if such gains are not directly related to a RIC's business of investing in stock or securities (or options or futures with respect to stocks or securities). While to date the U.S. Treasury has not exercised this regulatory authority, there can be no assurance that it will not issue regulations in the future (possibly with retroactive application) that would treat some or all of a Portfolio's foreign currency gains as non-qualifying income.
For purposes of the 90% test described above, dividends received by a Portfolio will be treated as qualifying income to the extent they are attributable to the issuer's current and accumulated earnings and profits. Distributions in excess of the distributing issuer's current and accumulated earnings and profits will first reduce the Portfolio's basis in the stock as a return of capital and will not qualify as gross income. Distributions in excess of the Portfolio's basis in the stock will qualify for the 90% test discussed above as the distribution will be treated as gain from the sale of stock. This gain will be long-term capital gain if the Portfolio held the stock for more than a year.
75
For purposes of the diversification requirement described above, the Portfolio will not be treated as in violation of such requirement as a result of a discrepancy between the value of its various investments and the diversification percentages described above, unless such discrepancy exists immediately following the acquisition of any security or other property and is wholly or partly the result of such acquisition. Moreover, even in the event of noncompliance with the diversification requirement as of the end of any given quarter, the Portfolio is permitted to cure the violation by eliminating the discrepancy causing such noncompliance within a period of 30 days from the close of the relevant quarter other than its first quarter following its election to be taxed as a RIC.
Net income derived from an interest in a "qualified publicly traded partnership," as defined in the Code, will be treated as qualifying income for purposes of the income requirement in clause (i) above. In addition, for the purposes of the diversification requirements in clause (ii) above, the outstanding voting securities of any issuer includes the equity securities of a qualified publicly traded partnership, and no more than 25% of the value of a RIC's total assets may be invested in the securities of one or more qualified publicly traded partnerships. The separate treatment for publicly traded partnerships under the passive loss rules of the Code applies to a RIC holding an interest in a qualified publicly traded partnership, with respect to items attributable to such interest.
In addition to the requirements described above, in order to qualify as a RIC, a Portfolio must distribute at least 90% of its investment company taxable income (which generally includes dividends, taxable interest, and the excess of net short-term capital gains over net long-term capital losses less operating expenses) and at least 90% of its net tax-exempt interest income, for each tax year, if any, to its shareholders. If a Portfolio meets all of the RIC requirements, it will not be subject to federal income tax on any of its investment company taxable income or capital gains that it distributes to shareholders.
If a Portfolio fails to qualify as a RIC for any taxable year, all of its net income will be subject to tax at regular corporate rates (whether or not distributed to shareholders), and its distributions (including capital gains distributions) will be taxable as income dividends to its shareholders to the extent of the Portfolio's current and accumulated earnings and profits, and will be eligible for the dividends-received deduction for corporate shareholders.
General Tax Treatment of Qualifying RICs and Shareholders
Each Portfolio intends to distribute substantially all of its net investment income (including, for this purpose, net short-term capital gains) to shareholders. Dividends from a Portfolio's net investment income generally are taxable to shareholders as ordinary income, whether received in cash or in additional shares. Certain income distributions paid by each Portfolio to individual shareholders are taxed at rates equal to those applicable to net long-term capital gains (currently 15%). This tax treatment applies only if certain holding period requirements are satisfied by the shareholder and the dividends are attributable to qualified dividends received by the Portfolio itself. For this purpose, "qualified dividends" means dividends received by a Portfolio from certain U.S. corporations and qualifying foreign corporations, provided that the Portfolio satisfies certain holding period and other requirements in respect of the stock of such corporations. Distributions received from REITs are generally comprised of ordinary income dividends and capital gains dividends, which are generally passed along to shareholders retaining the same character and are subject to tax accordingly, as described above. In the case of securities lending transactions, payments in lieu of dividends are not qualified dividends. Dividends received by a Portfolio from REITs are qualified dividends eligible for this lower tax rate only in limited circumstances. These special rules relating to the taxation of ordinary income dividends from regulated investment companies generally apply to taxable years beginning before January 1, 2013. Thereafter, each Portfolio's dividends, other than capital gain dividends, will be fully taxable at ordinary income tax rates unless further Congressional legislative action is taken.
A dividend paid by a Portfolio to a shareholder will not be treated as qualified dividend income of the shareholder if (1) the dividend is received with respect to any share held for fewer than 61 days during the 121-day period beginning on the date which is 60 days before the date on which such share becomes ex-dividend with respect to such dividend, (2) to the extent that the recipient is under an obligation (whether pursuant to a short sale or otherwise) to make related payments with respect to positions in substantially similar or related property or (3) if the recipient elects to have the dividend treated as investment income for purposes of the limitation on deductibility of investment interest.
You should also be aware that the benefits of the reduced tax rate applicable to long-term capital gains and qualified dividend income may be impacted by the application of the alternative minimum tax to individual shareholders.
Dividends paid to you out of each Portfolio's investment company taxable income that are not attributable to qualified dividends generally will be taxable to you as ordinary income (currently at a maximum federal income
76
tax rate of 35%, except as noted above) to the extent of each Portfolio's earnings and profits. Distributions to you of net capital gain (the excess of net long-term capital gain over net short-term capital loss), if any, will be taxable to you as long-term capital gain, regardless of how long you have held your Fund shares.
Distributions of net long-term capital gains, if any, are taxable to shareholders as long-term capital gains regardless of how long a shareholder has held a Portfolio's shares and regardless of whether the distribution is received in additional shares or in cash. Under current law, for taxable years beginning before January 1, 2013 the maximum tax rate on long-term capital gains available to non-corporate shareholders generally is 15%.
Each Portfolio will decide whether to distribute or to retain all or part of any net capital gains (the excess of net long-term capital gains over net short-term capital losses) in any year for reinvestment. Distributions of net capital gains are taxable to shareholders as a long-term capital gain regardless of how long shareholders have held their shares. Each Portfolio will send reports annually to shareholders regarding the federal income tax status of all distributions made for the preceding year. To the extent such amounts include distributions received from a REIT, they may be based on estimates and be subject to change as REITs do not always have the information available by the time these reports are due and can recharacterize certain amounts after the end of the tax year. As a result, the final character and amount of distributions may differ from that initially reported. If any such gains are retained, the Portfolio will pay federal income tax thereon, and, if the Portfolio makes an election, the shareholders will include such undistributed gains in their income, and will increase their tax basis in Portfolio shares by the difference between the amount of the includable gains and the tax deemed paid by the shareholder in respect of such shares. The shareholder will be able to claim their share of the tax paid by the Portfolio as a refundable credit.
Shareholders generally are taxed on any ordinary dividend or capital gain distributions from a Portfolio in the year they are actually distributed. However, if any such dividends or distributions are declared in October, November or December, to shareholders of record of such month and paid in January, then such amounts will be treated for tax purposes as received by the shareholders on December 31.
After the end of each calendar year, shareholders will be sent information on their dividends and capital gain distributions for tax purposes, including the portion taxable as ordinary income, the portion taxable as long-term capital gains, and the amount of any dividends eligible for the federal dividends received deduction for corporations.
Gains or losses on the sale of securities by a Portfolio held as a capital asset will generally be long-term capital gains or losses if the securities have a tax holding period of more than one year at the time of such sale. Gains or losses on the sale of securities with a tax holding period of one year or less will be short-term capital gains or losses. Special tax rules described below may change the normal treatment of gains and losses recognized by a Portfolio when it makes certain types of investments. Those special tax rules can, among other things, affect the treatment of capital gain or loss as long-term or short-term and may result in ordinary income or loss rather than capital gain or loss. The application of these special rules would therefore also affect the character of distributions made by a Portfolio.
A gain or loss realized by a shareholder on the sale, exchange or redemption of shares of a Portfolio held as a capital asset will be capital gain or loss, and such gain or loss will be long-term if the holding period for the shares exceeds one year and otherwise will be short-term. Any loss realized on a sale, exchange or redemption of shares of a Portfolio will be disallowed to the extent the shares disposed of are replaced with substantially identical shares within the 61-day period beginning 30 days before and ending 30 days after the shares are disposed of. Any loss realized by a shareholder on the disposition of shares held six months or less is treated as a long-term capital loss to the extent of any distributions of net long-term capital gains received by the shareholder with respect to such shares or any inclusion of undistributed capital gain with respect to such shares. The ability to deduct capital losses may otherwise be limited under the Code.
Due to recent legislation, the Portfolios (or their administrative agent) are required to report to the Internal Revenue Service ("IRS") and furnish to Portfolio shareholders the cost basis information for sale transactions of shares purchased on or after January 1, 2012. Shareholders may elect to have one of several cost basis methods applied to their account when calculating the cost basis of shares sold, including average cost, FIFO ("first-in, first-out") or some other specific identification method. Unless you instruct otherwise, each Portfolio will use average cost as its default cost basis method, and will treat sales as first coming from shares purchased prior to January 1, 2012. If average cost is used for the first sale of Portfolio shares covered by these new rules, the shareholder may only use an alternative cost basis method for shares purchased prospectively. Portfolio shareholders should consult with their tax advisors to determine the best cost basis method for their tax situation.
77
Each Portfolio will generally be subject to a nondeductible 4% federal excise tax to the extent it fails to distribute by the end of any calendar year at least 98% of its ordinary income for that year and 98.2% of its capital gain net income (the excess of short- and long-term capital gains over short- and long-term capital losses, including any available capital loss carryforwards) for the one-year period ending on October 31 of that year, plus certain other amounts. Each Portfolio intends to make sufficient distributions or deemed distributions of its ordinary income and capital gain net income, prior to the end of each calendar year to avoid liability for federal excise tax, but can give no assurances that all such liability will be eliminated.
The Fund may be required to withhold and remit to the U.S. Treasury an amount equal (as of the date hereof) to 28% (scheduled to increase to 31% after 2012) of any dividends, capital gains distributions and redemption proceeds paid to any individual or certain other non-corporate shareholder (i) who has failed to provide a correct taxpayer identification number (generally an individual's social security number or non-individual's employer identification number) on the Account Registration Form; (ii) who is subject to backup withholding as notified by the IRS; or (iii) who has not certified to the Fund that such shareholder is not subject to backup withholding. This backup withholding is not an additional tax, and any amounts withheld would be sent to the IRS as an advance payment of taxes due on a shareholder's income for such year.
The Fund may make investments in which it recognizes income or gain prior to receiving cash with respect to such investment. For example, under certain tax rules, the Fund may be required to accrue a portion of any discount at which certain securities are purchased as income each year even though the Fund receives no payments in cash on the security during the year. To the extent that the Fund makes such investments, it generally would be required to pay out such income or gain as a distribution in each year to avoid taxation at the Fund level. Such distributions will be made from the available cash of the Fund or by liquidation of portfolio securities if necessary. If a distribution of cash necessitates the liquidation of portfolio securities, the Adviser will select which securities to sell. The Fund may realize a gain or loss from such sales. In the event the Fund realizes net capital gains from such transactions, the Fund and consequently its shareholders may receive a larger capital gain distribution, if any, than they would in the absence of such transactions.
Special Rules for Certain Foreign Currency and Derivatives Transactions
In general, gains from foreign currencies and from foreign currency options, foreign currency futures and forward foreign exchange contracts relating to investments in stock, securities or foreign currencies are currently considered to be qualifying income for purposes of determining whether the Portfolio qualifies as a RIC.
Under Section 988 of the Code, special rules are provided for certain transactions in a foreign currency other than the taxpayer's functional currency (i.e., unless certain special rules apply, currencies other than the U.S. dollar). In general, foreign currency gains or losses from forward contracts, from futures contracts that are not "regulated futures contracts," and from unlisted options will be treated as ordinary income or loss under Section 988 of the Code. Also, certain foreign exchange gains or losses derived with respect to foreign fixed income securities are also subject to Section 988 treatment. In general, therefore, Section 988 gains or losses will increase or decrease the amount of the Portfolio's investment company taxable income available to be distributed to shareholders as ordinary income, rather than increasing or decreasing the amount of the Portfolio's net capital gain.
A Portfolio's investment in options, swaps and related transactions, futures contracts and forward contracts, options on futures contracts and stock indices and certain other securities, including transactions involving actual or deemed short sales or foreign exchange gains or losses are subject to many complex and special tax rules. For example, OTC options on debt securities and equity options, including options on stock and on narrow-based stock indexes, will be subject to tax under Section 1234 of the Code, generally producing a long-term or short-term capital gain or loss upon exercise, lapse or closing out of the option or sale of the underlying stock or security. By contrast, a Portfolio's treatment of certain other options, futures and forward contracts entered into by a Portfolio is generally governed by Section 1256 of the Code. These "Section 1256" positions generally include listed options on debt securities, options on broad-based stock indexes, options on securities indexes, options on futures contracts, regulated futures contracts and certain foreign currency contracts and options thereon.
When a Portfolio holds options or futures contracts which substantially diminish their risk of loss with respect to other positions (as might occur in some hedging transactions), this combination of positions could be treated as a "straddle" for tax purposes, resulting in possible deferral of losses, adjustments in the holding periods of Portfolio securities and conversion of short-term capital losses into long-term capital losses. Certain tax elections exist for mixed straddles (i.e., straddles comprised of at least one Section 1256 position and at least one non-Section 1256 position) which may reduce or eliminate the operation of these straddle rules.
78
A Section 1256 position held by a Portfolio will generally be marked-to-market (i.e., treated as if it were sold for fair market value) on the last business day of the Fund's fiscal year, and all gain or loss associated with fiscal year transactions and mark-to-market positions at fiscal year end (except certain currency gain or loss covered by Section 988 of the Code) will generally be treated as 60% long-term capital gain or loss and 40% short-term capital gain or loss. The effect of Section 1256 mark-to-market rules may be to accelerate income or to convert what otherwise would have been long-term capital gains into short-term capital gains or short-term capital losses into long-term capital losses within a Portfolio. The acceleration of income on Section 1256 positions may require a Portfolio to accrue taxable income without the corresponding receipt of cash. In order to generate cash to satisfy the distribution requirements of the Code, a Portfolio may be required to dispose of portfolio securities that it otherwise would have continued to hold or to use cash flows from other sources. Any or all of these rules may, therefore, affect the amount, character and timing of income earned and, in turn, distributed to shareholders by a Portfolio.
Special Tax Considerations Relating to Foreign Investments
Gains or losses attributable to foreign currency contracts, or to fluctuations in exchange rates that occur between the time a Portfolio accrues interest or other receivables or accrues expenses or other liabilities denominated in a foreign currency and the time the Portfolio actually collects such receivables or pays such liabilities are treated as ordinary income or ordinary loss to the Portfolio. Similarly, gains or losses on disposition of debt securities denominated in a foreign currency attributable to fluctuations in the value of the foreign currency between the date of acquisition of the security and the date of disposition also are treated as ordinary gain or loss to the Portfolio. These gains or losses increase or decrease the amount of a Portfolio's net investment income available to be distributed to its shareholders as ordinary income.
It is expected that each Portfolio will be subject to foreign withholding taxes with respect to its dividend and interest income from foreign countries, and a Portfolio may be subject to foreign income taxes with respect to other income. So long as more than 50% in value of a Portfolio's total assets at the close of the taxable year consists of stock or securities of foreign corporations, the Portfolio may elect to treat certain foreign income taxes imposed on it for federal income tax purposes as paid directly by its shareholders. A Portfolio will make such an election only if it deems it to be in the best interest of its shareholders and will notify shareholders in writing each year if it makes an election and of the amount of foreign income taxes, if any, to be treated as paid by the shareholders. If a Portfolio makes the election, shareholders will be required to include in income their proportionate share of the amount of foreign income taxes treated as imposed on the Portfolio and will be entitled to claim either a credit (subject to the limitations discussed below) or, if they itemize deductions, a deduction, for their shares of the foreign income taxes in computing their federal income tax liability.
Certain foreign governments levy withholding or other taxes on dividend and interest income. Although in some countries a portion of these taxes are recoverable, the non-recovered portion of foreign withholding taxes will reduce the income received from investments in such countries. Except in the case of the Active International Allocation, Asian Equity, Emerging Markets Domestic Debt, Emerging Markets, Global Advantage, Global Discovery, Global Franchise, Global Insight, Global Opportunity, Global Real Estate, International Advantage, International Equity, International Opportunity, International Real Estate, International Small Cap and Select Global Infrastructure Portfolios, it is not expected that a Portfolio or its shareholders would be able to claim a credit for U.S. tax purposes with respect to any such foreign taxes. However, these foreign withholding taxes may not have a significant impact on such Portfolios, considering that each Portfolio's investment objective is to seek long-term capital appreciation and any dividend or interest income should be considered incidental.
Shareholders who choose to utilize a credit (rather than a deduction) for foreign taxes will be subject to a number of complex limitations regarding the availability and utilization of the credit. Because of these limitations, shareholders may be unable to claim a credit for the full amount of their proportionate shares of the foreign income taxes paid by a Portfolio. Shareholders are urged to consult their tax advisors regarding the application of these rules to their particular circumstances.
Investments in a foreign corporation that are considered to be a passive foreign investment company for federal income tax purposes may cause a Portfolio to accrue certain amounts as taxable income in advance of the receipt of cash.
Taxes and Foreign Shareholders
Taxation of a shareholder who, as to the United States, is a nonresident alien individual, a foreign trust or estate, a foreign corporation or a foreign partnership ("Foreign Shareholder") depends on whether the income from a Portfolio is "effectively connected" with a U.S. trade or business carried on by such shareholder.
79
If the income from a Portfolio is not effectively connected with a U.S. trade or business carried on by a Foreign Shareholder, distributions of investment company taxable income will generally be subject to U.S. withholding tax at the rate of 30% (or such lower treaty rate as may be applicable) upon the gross amount of the dividend. Furthermore, Foreign Shareholders will generally be exempt from U.S. federal income tax on gains realized on the sale of shares of a Portfolio, distributions of net long-term capital gains and amounts retained by the Fund that are reported as undistributed capital gains.
For distributions with respect to taxable years of regulated investment companies beginning before January 1, 2012 (or later date if extended by the U.S. Congress), the Fund is not required to withhold any amounts with respect to distributions to Foreign Shareholders that are properly reported by the Fund as "interest-related dividends" or "short-term capital gains dividends," provided that the income is not subject to federal income tax if earned directly by the Foreign Shareholder. However, the Fund generally intends to withhold these amounts regardless of the fact that it was not required to do so. Any amounts withheld from payments made to a Foreign Shareholder are eligible to be refunded or credited against the shareholder's U.S. federal income tax liability, if any, provided that the required information is furnished to the IRS. Foreign Shareholders that own, either directly or indirectly, more than 5% of a class of Fund shares, are urged to consult their own tax advisors concerning special tax rules that may apply to their investment in Fund shares.
If the income from a Portfolio is effectively connected with a U.S. trade or business carried on by a Foreign Shareholder, then distributions from the Portfolio and any gains realized upon the sale of shares of the Portfolio will be subject to U.S. federal income tax at the rates applicable to U.S. citizens and residents or domestic corporations. In addition, Foreign Shareholders that are corporations may be subject to a branch profit tax.
A Portfolio may be required to withhold federal income tax on distributions that are otherwise exempt from withholding tax (or taxable at a reduced treaty rate) unless the Foreign Shareholder complies with IRS certification requirements.
The Fund will be required to withhold U.S. federal withholding taxes (at 30%) from certain "withholdable payments" made to a non-U.S. shareholder (other than a individual) after 2013, unless the non-U.S. shareholder complies with certain U.S. tax reporting (and, in some cases, withholding) requirements (generally relating to the entity's U.S. owners or account holders, if any) or otherwise qualifies for an exemption from such withholding. Withholdable payments generally will include interest (including original issue discount), dividends, rents, annuities, and other fixed or determinable annual or periodical gains, profits or income, if such payments are derived from U.S. sources, as well as gross proceeds from dispositions of securities that could produce U.S. source interest or dividends. Income which is effectively connected with the conduct of a U.S. trade or business, is not, however, included in this definition.
The tax consequences to a Foreign Shareholder entitled to claim the benefits of an applicable tax treaty may differ from those described here. Furthermore, Foreign Shareholders are strongly urged to consult their own tax advisors with respect to the particular tax consequences to them of an investment in a Portfolio, including the potential application of the provisions of the Foreign Investment in Real Estate Property Tax Act of 1980, as amended and the possible applicability of the U.S. estate tax.
State and Local Tax Considerations
Rules of state and local taxation of dividend and capital gains from regulated investment companies often differ from the rules for federal income taxation described above. Shareholders are urged to consult their tax advisors as to the consequences of these and other state and local tax rules regarding an investment in the Fund.
CONTROL PERSONS AND PRINCIPAL HOLDERS OF SECURITIES
As of March 30, 2012, the following persons or entities owned, of record or beneficially, more than 5% of the shares of any Class of the following Portfolios' outstanding shares.
| Portfolio | | Name and Address | | % of Class | |
| Class I | |
|
| Active International Allocation | | Morgan Stanley & Co.
Harborside Financial Center
201 Plaza Two, 3rd Floor
Jersey City, NJ 07311 | | | 71.21 | % | |
|
80
| Portfolio | | Name and Address | | % of Class | |
| | Morgan Stanley & Co.
517 Kelsey Rd.
Sheffield, MA 01257-9699 | | | 5.27 | % | |
|
| Growth | | Northern Trust Co.
P.O. Box 92994
Chicago, IL 60675 | | | 48.70 | % | |
|
| | Morgan Stanley & Co.
Harborside Financial Center
201 Plaza Two, 3rd Floor
Jersey City, NJ 07311 | | | 27.19 | % | |
|
| | Mac & Co.
P.O. Box 3198
Pittsburgh, PA 15230 | | | 6.04 | % | |
|
| | Northern Trust Co.
P.O. Box 92994
Chicago, IL 60675 | | | 5.55 | % | |
|
| Emerging Markets | | Mac & Co.
P.O. Box 3198
Pittsburgh, PA 15230 | | | 28.19 | % | |
|
| | Northern Trust Co.
P.O. Box 92994
Chicago, IL 60675 | | | 20.42 | % | |
|
| | Fidelity Investments Institutional
Operations Co.
100 Magellan Way, KW1C
Covington, KY 41015 | | | 15.00 | % | |
|
| | Mac & Co.
P.O. Box 3198
Pittsburgh, PA 15230 | | | 6.32 | % | |
|
| Emerging Markets Domestic Debt | | Wells Fargo Bank NA
PO Box 1533
Minneapolis, MN 55480-1533 | | | 60.99 | % | |
|
| | Bell Atlantic Master Trust
295 N Maple Ave.
Building 7, 1st Floor
Basking Ridge, NJ 07920 | | | 9.52 | % | |
|
| | Charles Schwab & Co., Inc.
101 Montgomery St.
San Francisco, CA 94104 | | | 8.72 | % | |
|
| | Wells Fargo Bank NA
PO Box 1533
Minneapolis, MN 55480-1533 | | | 7.40 | % | |
|
81
| Portfolio | | Name and Address | | % of Class | |
| | Morgan Stanley & Co.
1595 Broadway
New York, NY 10036 | | | 5.08 | % | |
|
| Focus Growth | | Trukan & Co.
P.O. Box 3699
Wichita, KS 67201 | | | 61.81 | % | |
|
| | Morgan Stanley & Co.
Harborside Financial Center
201 Plaza Two, 3rd Floor
Jersey City, NJ 07311 | | | 7.54 | % | |
|
| | Taynik & Co.
c/o State Street Bank & Trust Co.
200 Clarendon St. FPG 90
Boston, MA 02116 | | | 5.56 | % | |
|
| Global Franchise | | Trust Company of Illinois
1901 Butterfield Road Suite 1000
Downers Grove, IL 60515-4007 | | | 31.99 | % | |
|
| | Pershing LLC
One Pershing Plaza 14th Fl.
Jersey City, NJ 07399 | | | 13.93 | % | |
|
| | Kruger Inc. Master Trust
200 Bay St. 21st Floor
Toronto, Ontario Canada 033 M5J2J5 | | | 10.04 | % | |
|
| | Charles Schwab & Co. Inc.
101 Montgomery Street
San Francisco, CA 94104 | | | 6.54 | % | |
|
| Global Insight | | Morgan Stanley Investment Management
One Tower Bridge
100 Front St.
West Conshohocken, PA 19428 | | | 100.00 | % | |
|
| Global Opportunity | | Morgan Stanley Investment Management
One Tower Bridge
100 Front St.
West Conshohocken, PA 19428 | | | 51.98 | % | |
|
| | LPL Financial
9785 Towne Centre Dr.
San Diego, CA 92121-1968 | | | 47.74 | % | |
|
| Global Real Estate | | Charles Schwab & Co., Inc.
101 Montgomery St.
San Francisco, CA 94104 | | | 8.37 | % | |
|
| | State Street Bank & Trust Co.
P.O. Box 5501
Boston, MA 02206 | | | 6.80 | % | |
|
82
| Portfolio | | Name and Address | | % of Class | |
| Insight | | Morgan Stanley Investment Management
One Tower Bridge
100 Front St.
West Conshohocken, PA 19428 | | | 100.00 | % | |
|
| International Equity | | Charles Schwab & Co., Inc.
101 Montgomery St.
San Francisco, CA 94104 | | | 20.74 | % | |
|
| | National Financial Services
200 Liberty St.
New York, NY 10281 | | | 15.04 | % | |
|
| | Northern Trust Co.
P.O. Box 92994
Chicago, IL 60675 | | | 6.21 | % | |
|
| | Fidelity Investments Institutional
Operations Co.
100 Magellan Way, KW1C
Covington, KY 41015 | | | 5.81 | % | |
|
| International Opportunity | | Morgan Stanley Investment Management
One Tower Bridge
100 Front St.
West Conshohocken, PA 19428 | | | 100.00 | % | |
|
| International Real Estate | | Wells Fargo Bank NA
P.O. Box 1533
Minneapolis, MN 55480-1533 | | | 39.47 | % | |
|
| | Charles Schwab & Co., Inc.
101 Montgomery St.
San Francisco, CA 94104 | | | 24.41 | % | |
|
| | National Financial Services
200 Liberty St.
New York, NY 10281 | | | 15.25 | % | |
|
| International Small Cap | | Charles Schwab & Co., Inc.
101 Montgomery St.
San Francisco, CA 94104 | | | 44.42 | % | |
|
| | Factory Mutual Insurance Co.
P.O. Box 9198
225 Wyman St.
Waltham, MA 02451 | | | 22.56 | % | |
|
| | National Financial Services
200 Liberty St.
New York, NY 10281 | | | 11.82 | % | |
|
| | Morgan Stanley & Co.
Harborside Financial Center
201 Plaza Two, 3rd Floor
Jersey City, NJ 07311 | | | 10.46 | % | |
|
83
| Portfolio | | Name and Address | | % of Class | |
| Opportunity | | First Clearing LLC
2801 Market St.
Saint Louis, MO 63103-2523 | | | 35.36 | % | |
|
| | Charles Schwab & Co., Inc.
101 Montgomery St.
San Francisco, CA 94104 | | | 34.44 | % | |
|
| | LPL Financial
9785 Towne Centre Dr.
San Diego, CA 92121-1968 | | | 7.67 | % | |
|
| Select Global Infrastructure | | Morgan Stanley Investment Management
One Tower Bridge
100 Front St.
West Conshohocken, PA 19428 | | | 84.52 | % | |
|
| | Morgan Stanley & Co.
1595 Broadway
New York, NY 10036 | | | 15.48 | % | |
|
| Small Company Growth | | Fidelity Investments Institutional
Operations Co.
100 Magellan Way, KW1C
Covington, KY 41015 | | | 34.64 | % | |
|
| | Wells Fargo Bank
1525 West WT Harris Blvd.
Charlotte, NC 28262-8522 | | | 7.58 | % | |
|
| | Charles Schwab & Co., Inc.
101 Montgomery St.
San Francisco, CA 94104 | | | 6.26 | % | |
|
| | Northern Trust Co.
P.O. Box 92994
Chicago, IL 60675 | | | 5.96 | % | |
|
| | Merrill Lynch Pierce Fenner & Smith
4800 Deer Lake Drive East
Jacksonville, FL 32246 | | | 5.88 | % | |
|
| | Frontier Trust Company
Po Box 10758
Fargo, ND 58106-0758 | | | 5.47 | % | |
|
| U.S. Real Estate | | LPL Financial
9785 Towne Centre Dr.
San Diego, CA 92121-1968 | | | 16.77 | % | |
|
| | Charles Schwab & Co., Inc.
101 Montgomery St.
San Francisco, CA 94104 | | | 15.93 | % | |
|
84
| Portfolio | | Name and Address | | % of Class | |
| | Merrill Lynch Pierce Fenner & Smith
4800 Deer Lake Drive East
Jacksonville, FL 32246 | | | 9.60 | % | |
|
| | Morgan Stanley & Co.
Harborside Financial Center
201 Plaza Two, 3rd Floor
Jersey City, NJ 07311 | | | 8.27 | % | |
|
| | Mac & Co.
P.O. Box 3198
Pittsburgh, PA 15230 | | | 7.09 | % | |
|
| Class P | |
|
| Active International Allocation | | Morgan Stanley & Co.
Harborside Financial Center
201 Plaza Two, 3rd Floor
Jersey City, NJ 07311 | | | 70.25 | % | |
|
| | Fidelity Investments Institutional
Operations Co.
100 Magellan Way, KW1C
Covington, KY 41015 | | | 18.49 | % | |
|
| Advantage | | Morgan Stanley Investment Management
One Tower Bridge
100 Front St.
West Conshohocken, PA 19428 | | | 100.0 | % | |
|
| Growth | | State of Florida Employees
Deferred Compensation Plan
P.O. Box 182029
Columbus, OH 43218 | | | 40.36 | % | |
|
| | Fidelity Investments Institutional
Operations Co.
100 Magellan Way, KW1C
Covington, KY 41015 | | | 16.66 | % | |
|
| | DCGT as TTEE and/or Cust
Attn: Npio Trade Desk
711 High St.
Des Moines, IA 50392-0001 | | | 11.82 | % | |
|
| | Morgan Stanley & Co.
Harborside Financial Center
201 Plaza Two, 3rd Floor
Jersey City, NJ 07311 | | | 11.63 | % | |
|
| | Nationwide Life Insurance Co. GPVA
C/O IPO Portfolio Accounting
P.O. Box 182029
Columbus, OH 43218 | | | 5.53 | % | |
|
85
| Portfolio | | Name and Address | | % of Class | |
| | National Financial Services
200 Liberty St.
New York, NY 10281 | | | 5.28 | % | |
|
| Emerging Markets | | Fidelity Investments Institutional
Operations Co.
100 Magellan Way, KW1C
Covington, KY 41015 | | | 64.74 | % | |
|
| | National Financial Services
200 Liberty St.
New York, NY 10281 | | | 8.27 | % | |
|
| | Morgan Stanley & Co.
Harborside Financial Center
201 Plaza Two, 3rd Floor
Jersey City, NJ 07311 | | | 6.90 | % | |
|
| | Fidelity Investments Institutional
Operations Co.
100 Magellan Way KW1C
Covington, KY 41015 | | | 6.19 | % | |
|
| Emerging Markets Domestic Debt | | National Financial Services
200 Liberty St.
New York, NY 10281 | | | 60.33 | % | |
|
| | Morgan Stanley & Co.
Plaza Scotia Bank Ste 704
273 Ponce De Leon Ave
San Juan PR 00917 | | | 19.74 | % | |
|
| | Brenton D. Anderson
P.O. Box 56
Etna, NH 03750-0056 | | | 7.63 | % | |
|
| | Morgan Stanley & Co.
Harborside Financial Center
201 Plaza Two, 3rd Floor
Jersey City, NJ 07311 | | | 6.61 | % | |
|
| Focus Growth | | Norwest Bank Colorado NA
8515 E Orchard Rd.
Englewood, CO 80111 | | | 28.43 | % | |
|
| | Brian T. Marshall
87 Monroe St.
Pelham, NY 10803 | | | 17.71 | % | |
|
| | National Financial Services
200 Liberty St.
New York, NY 10281 | | | 13.74 | % | |
|
| | Morgan Stanley & Co.
8210 SE 33rd Place
Mercer Island, WA 98040 | | | 13.54 | % | |
|
86
| Portfolio | | Name and Address | | % of Class | |
| | Hermine Hilton
26666 Seagull Dr.
Malibu, CA 90265 | | | 11.84 | % | |
|
| | Morgan Stanley & Co.
15 Enterprise
Aliso Viejo, CA 92656 | | | 7.29 | % | |
|
| Global Franchise | | Fidelity Investments Institutional
Operations Co.
100 Magellan Way, KW1C
Covington, KY 41015 | | | 42.58 | % | |
|
| | Morgan Stanley & Co
1600 Kongens Gade
00802 St. Thomas FF 00000 | | | 9.02 | % | |
|
| Global Opportunity | | Morgan Stanley Investment Management
One Tower Bridge
100 Front St.
West Conshohocken, PA 19428 | | | 100.00 | % | |
|
| Global Real Estate | | National Financial Services
200 Liberty St.
New York, NY 10281 | | | 81.60 | % | |
|
| International Equity | | National Financial Services
200 Liberty St.
New York, NY 10281 | | | 91.87 | % | |
|
| International Opportunity | | Morgan Stanley Investment Management
One Tower Bridge
100 Front St.
West Conshohocken, PA 19428 | | | 100.00 | % | |
|
| International Real Estate | | Morgan Stanley & Co.
Harborside Financial Center
201 Plaza Two, 3rd Floor
Jersey City, NJ 07311 | | | 66.92 | % | |
|
| | Nora Effron
1070 Park Avenue
New York, NY 10128-1000 | | | 5.32 | % | |
|
| International Small Cap | | National Financial Services
200 Liberty St.
New York, NY 10281 | | | 98.17 | % | |
|
| Opportunity | | US Bank NA
PO Box 1787
Milwaukee, WI 53201-1787 | | | 99.50 | % | |
|
| Select Global Infrastructure | | Morgan Stanley Investment Management
One Tower Bridge
100 Front St.
West Conshohocken, PA 19428 | | | 100.00 | % | |
|
87
| Portfolio | | Name and Address | | % of Class | |
| Small Company Growth | | Fidelity Investments Institutional
Operations Co.
100 Magellan Way, KW1C
Covington, KY 41015 | | | 66.71 | % | |
|
| | State Street Bk & TR
105 Rosemont Ave
Westwood, MA 02090-2318 | | | 8.60 | % | |
|
| U.S. Real Estate | | The Union Central Life Insurance Co.
5900 O St.
Lincoln, NE 68510-2234 | | | 32.28 | % | |
|
| | Ameritas Life Insurance Corp
Separate Account G
5900 O St.
Lincoln, NE 68510-2234 | | | 11.65 | % | |
|
| | Morgan Stanley & Co.
Harborside Financial Center
201 Plaza Two, 3rd Floor
Jersey City, NJ 07311 | | | 11.40 | % | |
|
| | Trukan & Co.
P.O. Box 3699
Wichita, KS 67201-3699 | | | 8.57 | % | |
|
| | Searless Valley Minerals Ops Inc.
11500 Outlook St.
Overland Park, KS 66211-1804 | | | 5.05 | % | |
|
| Class H | |
|
| Emerging Markets Domestic Debt | | Morgan Stanley & Co.
Harborside Financial Center
201 Plaza Two, 3rd Floor
Jersey City, NJ 07311 | | | 96.70 | % | |
|
| Global Insight | | Dennis P. Lynch
c/o Morgan Stanley Investment Management
522 Fifth Av.
New York, NY 10036 | | | 58.49 | % | |
|
| | David Cohen
c/o Morgan Stanley Investment Management
522 Fifth Av.
New York, NY 10036 | | | 16.94 | % | |
|
| | Mary Sue Marshall
c/o Morgan Stanley Investment Management
522 Fifth Av.
New York, NY 10036 | | | 11.70 | % | |
|
| | Sandeep Chainani
c/o Morgan Stanley Investment Management
522 Fifth Av.
New York, NY 10036 | | | 11.70 | % | |
|
88
| Portfolio | | Name and Address | | % of Class | |
| Global Opportunity | | Morgan Stanley & Co.
2 Ridge Rd.
Rumson, NJ 07760-1959 | | | 12.61 | % | |
|
| | Charles Schwab & Co., Inc.
101 Montgomery St.
San Francisco, CA 94104 | | | 7.56 | % | |
|
| | Pershing LLC
One Pershing Plaza 14th Fl
Jersey City, NJ 07399 | | | 6.61 | % | |
|
| Global Real Estate | | Oppenheimer & Co. Inc.
138th Street & Convent Ave Rm W112
New York, NY 10031 | | | 34.72 | % | |
|
| | Oppenheimer & Co. Inc.
2005 Revocable Trust
6 Bass Pond Lane
Weston, MA 02493-1070 | | | 19.69 | % | |
|
| | Morgan Stanley & Co.
PO Box 365
Prescott, WI 54021-0365 | | | 10.85 | % | |
|
| | Oppenheimer & Co. Inc.
16030 Ventura Blvd Ste. 380
Encino, CA 91436-2778 | | | 10.29 | % | |
|
| Insight | | Dennis P. Lynch
c/o Morgan Stanley Investment Management
522 Fifth Av.
New York, NY 10036 | | | 58.43 | % | |
|
| | David Cohen
c/o Morgan Stanley Investment Management
522 Fifth Av.
New York, NY 10036 | | | 17.03 | % | |
|
| | Mary Sue Marshall
c/o Morgan Stanley Investment Management
522 Fifth Av.
New York, NY 10036 | | | 11.69 | % | |
|
| | Sandeep Chainani
c/o Morgan Stanley Investment Management
522 Fifth Av.
New York, NY 10036 | | | 11.69 | % | |
|
| International Opportunity | | Morgan Stanley & Co.
2 Ridge Rd.
Rumson, NJ 07760-1959 | | | 69.22 | % | |
|
| | David Cohen
c/o Morgan Stanley Investment Management
522 Fifth Av.
New York, NY 10036 | | | 18.11 | % | |
|
89
| Portfolio | | Name and Address | | % of Class | |
| | Morgan Stanley Investment Management
One Tower Bridge
100 Front St.
West Conshohocken, PA 19428 | | | 12.67 | % | |
|
| Opportunity | | Morgan Stanley & Co.
Harborside Financial Center
201 Plaza Two, 3rd Floor
Jersey City, NJ 07311 | | | 17.04 | % | |
|
| | Charles Schwab & Co., Inc.
101 Montgomery
St. San Francisco, CA 94104 | | | 7.92 | % | |
|
| | Pershing LLC
One Pershing Plaza 14th Fl
Jersey City, NJ 07399 | | | 6.96 | % | |
|
| | First Clearing LLC
10750 Wheat First Drive WS1165
Glen Allen, VA 23060-9243 | | | 6.75 | % | |
|
| Select Global Infrastructure | | Morgan Stanley Investment Management
One Tower Bridge
100 Front St.
West Conshohocken, PA 19428 | | | 100.00 | % | |
|
| Class L | |
|
| Emerging Markets Domestic Debt | | Morgan Stanley & Co.
Harborside Financial Center
201 Plaza Two, 3rd Floor
Jersey City, NJ 07311 | | | 91.75 | % | |
|
| | Morgan Stanley & Co.
11531 Skyline Drive
Santa Ana, CA 92705-2480 | | | 7.28 | % | |
|
| Global Insight | | Morgan Stanley Investment Management
One Tower Bridge
100 Front St.
West Conshohocken, PA 19428 | | | 100.00 | % | |
|
| Global Opportunity | | Charles Schwab & Co., Inc.
101 Montgomery St.
San Francisco, CA 94104 | | | 19.45 | % | |
|
| | Morgan Stanley Investment Management
One Tower Bridge
100 Front St.
West Conshohocken, PA 19428 | | | 17.58 | % | |
|
| | Raymond James & Assoc. Inc.
3085 Kiowa Dr.
Loveland, CO 80538-8642 | | | 13.92 | % | |
|
90
| Portfolio | | Name and Address | | % of Class | |
| | State Street Bank & Trust Co.
4109 Cato Rd.
Nashville, TN 37218-3712 | | | 9.36 | % | |
|
| | LPL Financial
9785 Towne Centre Dr.
San Diego, CA 92121-1968 | | | 7.95 | % | |
|
| Global Real Estate | | Morgan Stanley & Co.
Harborside Financial Center
Plaza Two, 3rd Floor
Jersey City, NJ 07311 | | | 29.58 | % | |
|
| | Morgan Stanley
200 Avenue F NE
Winter Haven, FL 33881-4131 | | | 12.47 | % | |
|
| | Morgan Stanley & Co.
PO Box 025645
Miami, FL 33102 | | | 10.64 | % | |
|
| | Morgan Stanley & Co.
210 East Laurier Place
Bryn Mawr, PA 19010-2250 | | | 9.20 | % | |
|
| | Morgan Stanley & Co.
1101 Red Rose Ln
Villanova, PA 19085 | | | 5.14 | % | |
|
| Insight | | Morgan Stanley Investment Management
One Tower Bridge
100 Front St.
West Conshohocken, PA 19428 | | | 100.00 | % | |
|
| International Opportunity | | Morgan Stanley Investment Management
One Tower Bridge
100 Front St.
West Conshohocken, PA 19428 | | | 100.00 | % | |
|
| Opportunity | | Morgan Stanley & Co.
Harborside Financial Center
201 Plaza Two, 3rd Floor
Jersey City, NJ 07311 | | | 21.29 | % | |
|
| | Citigroup Global Markets Inc.
333 West 34th Street—3rd Fl
New York, NY 10901 | | | 9.68 | % | |
|
| | First Clearing LLC
2801 Market St.
Saint Louis, MO 63103-2523 | | | 9.59 | % | |
|
| | Merrill Lynch Pierce Fenner & Smith
4800 Deer Lake Drive East
Jacksonville, FL 32246 | | | 8.66 | % | |
|
91
The persons listed above as owning 25% or more of the outstanding shares of a Portfolio may be presumed to "control" (as that term is defined in the 1940 Act) such Portfolio. As a result, those persons would have the ability to vote a majority of the shares of the respective Portfolio on any matter requiring the approval of shareholders of such Portfolio.
PERFORMANCE INFORMATION
The average annual compounded rates of return (unless otherwise noted) for the Portfolios for the 1-, 5- and 10-year periods ended December 31, 2011 and for the period from inception through December 31, 2011 are as follows:
| Name of Portfolio† | | Inception
Date | | One
Year | | Average
Annual Five
Years | | Average
Annual Ten
Years | | Average
Annual Since
Inception | |
Active International Allocation
Class I | | 01/17/92 | | | -14.56 | % | | | -3.66 | % | | | 4.84 | % | | | 5.36 | % | |
| Class P | | 01/02/96 | | | -14.75 | % | | | -3.90 | % | | | 4.57 | % | | | 4.35 | % | |
Advantage*
Class I | | 06/30/08 | | | 5.33 | % | | | N/A | | | | N/A | | | | 4.73 | % | |
| Class P | | 05/21/10 | | | 5.07 | % | | | N/A | | | | N/A | | | | 16.05 | % | |
| Class H | | 06/30/08 | | | 5.06 | % | | | N/A | | | | N/A | | | | 4.49 | % | |
| Class L | | 06/30/08 | | | 5.19 | % | | | N/A | | | | N/A | | | | 4.53 | % | |
Asian Equity
Class I | | 12/28/10 | | | -16.88 | % | | | N/A | | | | N/A | | | | -15.19 | % | |
| Class P | | 12/28/10 | | | -17.08 | % | | | N/A | | | | N/A | | | | -15.38 | % | |
| Class H | | 12/28/10 | | | -17.08 | % | | | N/A | | | | N/A | | | | -15.38 | % | |
| Class L | | 12/28/10 | | | -17.57 | % | | | N/A | | | | N/A | | | | -15.88 | % | |
Emerging Markets
Class I | | 09/25/92 | | | -18.41 | % | | | 0.23 | % | | | 12.98 | % | | | 8.70 | % | |
| Class P | | 01/02/96 | | | -18.63 | % | | | -0.02 | % | | | 12.69 | % | | | 7.48 | % | |
Emerging Markets Domestic Debt
Class I | | 02/01/94 | | | -3.66 | % | | | 5.15 | % | | | 9.74 | % | | | 9.58 | % | |
| Class P | | 01/02/96 | | | -3.90 | % | | | 4.86 | % | | | 9.46 | % | | | 9.78 | % | |
| Class H | | 01/02/08 | | | -3.88 | % | | | N/A | | | | N/A | | | | 5.03 | % | |
| Class L | | 06/16/08 | | | -4.34 | % | | | N/A | | | | N/A | | | | 4.84 | % | |
Focus Growth
Class I | | 03/08/95 | | | -7.30 | % | | | 3.76 | % | | | 3.79 | % | | | 9.87 | % | |
| Class P | | 01/02/96 | | | -7.53 | % | | | 3.49 | % | | | 3.53 | % | | | 7.73 | % | |
Global Advantage
Class I | | 12/28/10 | | | 0.34 | % | | | N/A | | | | N/A | | | | 0.43 | % | |
| Class P | | 12/28/10 | | | 0.07 | % | | | N/A | | | | N/A | | | | 0.17 | % | |
| Class H | | 12/28/10 | | | 0.08 | % | | | N/A | | | | N/A | | | | 0.18 | % | |
| Class L | | 12/28/10 | | | -0.44 | % | | | N/A | | | | N/A | | | | -0.34 | % | |
Global Discovery
Class I | | 12/28/10 | | | -7.72 | % | | | N/A | | | | N/A | | | | -7.93 | % | |
| Class P | | 12/28/10 | | | -7.98 | % | | | N/A | | | | N/A | | | | -8.19 | % | |
| Class H | | 12/28/10 | | | -7.96 | % | | | N/A | | | | N/A | | | | -8.17 | % | |
| Class L | | 12/28/10 | | | -8.41 | % | | | N/A | | | | N/A | | | | -8.62 | % | |
Global Franchise
Class I | | 11/28/01 | | | 9.38 | % | | | 4.74 | % | | | 10.44 | % | | | 10.85 | % | |
| Class P | | 11/28/01 | | | 8.98 | % | | | 4.46 | % | | | 10.15 | % | | | 10.55 | % | |
Global Opportunity*
Class I | | 05/30/08 | | | -4.90 | % | | | N/A | | | | N/A | | | | 2.83 | % | |
| Class P | | 05/21/10 | | | -5.16 | % | | | N/A | | | | N/A | | | | 16.07 | % | |
| Class H | | 05/30/08 | | | -5.18 | % | | | N/A | | | | N/A | | | | 2.60 | % | |
| Class L | | 05/30/08 | | | -5.19 | % | | | N/A | | | | N/A | | | | 2.51 | % | |
92
| Name of Portfolio† | | Inception
Date | | One
Year | | Average
Annual Five
Years | | Average
Annual Ten
Years | | Average
Annual Since
Inception | |
Global Real Estate
Class I | | 08/30/06 | | | -9.67 | % | | | -4.94 | % | | | N/A | | | | -1.76 | % | |
| Class P | | 08/30/06 | | | -9.91 | % | | | -5.21 | % | | | N/A | | | | -2.03 | % | |
| Class H | | 01/02/08 | | | -9.90 | % | | | N/A | | | | N/A | | | | -4.34 | % | |
| Class L | | 06/16/08 | | | -10.33 | % | | | N/A | | | | N/A | | | | -4.13 | % | |
Growth
Class I | | 04/02/91 | | | -3.01 | % | | | 3.34 | % | | | 3.42 | % | | | 8.73 | % | |
| Class P | | 01/02/96 | | | -3.27 | % | | | 3.09 | % | | | 3.17 | % | | | 6.83 | % | |
International Advantage
Class I | | 12/28/10 | | | -1.31 | % | | | N/A | | | | N/A | | | | -1.40 | % | |
| Class P | | 12/28/10 | | | -1.57 | % | | | N/A | | | | N/A | | | | -1.66 | % | |
| Class H | | 12/28/10 | | | -1.57 | % | | | N/A | | | | N/A | | | | -1.65 | % | |
| Class L | | 12/28/10 | | | -2.09 | % | | | N/A | | | | N/A | | | | -2.17 | % | |
International Equity
Class I | | 08/04/89 | | | -7.63 | % | | | -2.63 | % | | | 5.72 | % | | | 8.53 | % | |
| Class P | | 01/02/96 | | | -7.83 | % | | | -2.88 | % | | | 5.47 | % | | | 7.34 | % | |
International Opportunity
Class I | | 03/31/10 | | | -10.16 | % | | | N/A | | | | N/A | | | | 4.73 | % | |
| Class P | | 03/31/10 | | | -10.33 | % | | | N/A | | | | N/A | | | | 4.47 | % | |
| Class H | | 03/31/10 | | | -10.30 | % | | | N/A | | | | N/A | | | | 4.49 | % | |
| Class L | | 03/31/10 | | | -10.81 | % | | | N/A | | | | N/A | | | | 3.95 | % | |
International Real Estate
Class I | | 10/01/97 | | | -19.92 | % | | | -11.92 | % | | | 9.59 | % | | | 6.87 | % | |
| Class P | | 10/01/97 | | | -20.16 | % | | | -12.14 | % | | | 9.31 | % | | | 6.61 | % | |
International Small Cap
Class I | | 12/15/92 | | | -18.33 | % | | | -6.39 | % | | | 6.45 | % | | | 8.29 | % | |
| Class P | | 10/21/08 | | | -18.56 | % | | | N/A | | | | N/A | | | | 6.25 | % | |
Opportunity*
Class I | | 08/12/05 | | | -0.46 | % | | | 5.16 | % | | | N/A | | | | 6.58 | % | |
| Class P | | 05/21/10 | | | -0.72 | % | | | N/A | | | | N/A | | | | 14.44 | % | |
| Class H | | 05/28/98 | | | -0.73 | % | | | 4.86 | % | | | 3.85 | % | | | 3.68 | % | |
| Class L | | 05/28/98 | | | -1.17 | % | | | 4.18 | % | | | 3.17 | % | | | 2.97 | % | |
Select Global Infrastructure
Class I | | 09/20/10 | | | 15.95 | % | | | N/A | | | | N/A | | | | 16.57 | % | |
| Class P | | 09/20/10 | | | 15.67 | % | | | N/A | | | | N/A | | | | 16.29 | % | |
| Class H | | 09/20/10 | | | 15.67 | % | | | N/A | | | | N/A | | | | 16.29 | % | |
| Class L | | 09/20/10 | | | 15.12 | % | | | N/A | | | | N/A | | | | 15.73 | % | |
Small Company Growth
Class I | | 11/01/89 | | | -9.12 | % | | | 0.49 | % | | | 5.68 | % | | | 10.39 | % | |
| Class P | | 01/02/96 | | | -9.28 | % | | | 0.24 | % | | | 5.42 | % | | | 8.99 | % | |
U.S. Real Estate
Class I | | 02/24/95 | | | 5.57 | % | | | -1.70 | % | | | 10.99 | % | | | 12.69 | % | |
| Class P | | 01/02/96 | | | 5.26 | % | | | -1.97 | % | | | 10.70 | % | | | 11.71 | % | |
† Performance information for the Class H and Class L shares of the Active International Allocation, Emerging Markets, Focus Growth, Global Franchise, Growth, International Equity, International Real Estate, International Small Cap, Small Company Growth and U.S. Real Estate Portfolios will be provided once the Class H and Class L shares have completed a full calendar year of operations. Performance information for the Class I, Class H and Class L shares of the Global Insight and Insight Portfolios will be provided once the Portfolios have completed a full calendar year of operations.
* Performance shown for each Portfolio's Class I, Class H and Class L shares, as applicable, for periods prior to May 21, 2010 reflects the performance of the Class I, Class A and Class C shares of the applicable Predecessor Fund.
93
The average annual compounded rates of return, inclusive of a maximum sales charge of 3.50% for Emerging Markets Domestic Debt Portfolio and 4.75% for Advantage, Asian Equity, Global Advantage, Global Discovery, Global Opportunity, Global Real Estate, International Advantage, International Opportunity, Opportunity and Select Global Infrastructure Portfolios, of the Class H shares of the Portfolios for the 1-, 5- and 10-year periods ended December 31, 2011 and for the period from inception through December 31, 2011 are as follows:
| Name of Portfolio† | | Inception
Date | | One
Year | | Average
Annual Five
Years | | Average
Annual Ten
Years | | Average
Annual Since
Inception | |
Advantage*
Class H | | 06/30/08 | | | 0.08 | % | | | N/A | | | | N/A | | | | 3.04 | % | |
Asian Equity
Class H | | 12/28/10 | | | -21.03 | % | | | N/A | | | | N/A | | | | -19.38 | % | |
Emerging Markets Domestic Debt
Class H | | 01/02/08 | | | -7.22 | % | | | N/A | | | | N/A | | | | 4.09 | % | |
Global Advantage
Class H | | 12/28/10 | | | -4.68 | % | | | N/A | | | | N/A | | | | -4.55 | % | |
Global Discovery
Class H | | 12/28/10 | | | -12.36 | % | | | N/A | | | | N/A | | | | -12.51 | % | |
Global Opportunity*
Class H | | 05/30/08 | | | -9.64 | % | | | N/A | | | | N/A | | | | 1.22 | % | |
Global Real Estate
Class H | | 01/02/08 | | | -14.13 | % | | | N/A | | | | N/A | | | | -5.50 | % | |
International Advantage
Class H | | 12/28/10 | | | -6.26 | % | | | N/A | | | | N/A | | | | -6.30 | % | |
International Opportunity
Class H | | 03/31/10 | | | -14.56 | % | | | N/A | | | | N/A | | | | 1.62 | % | |
Opportunity*
Class H | | 05/28/98 | | | -5.45 | % | | | 3.84 | % | | | 3.34 | % | | | 3.30 | % | |
Select Global Infrastructure
Class H | | 09/20/10 | | | 10.17 | % | | | N/A | | | | N/A | | | | 11.94 | % | |
† Performance information for the Class H shares of the Active International Allocation, Emerging Markets, Focus Growth, Global Franchise, Global Insight, Growth, Insight, International Equity, International Real Estate, International Small Cap, Small Company Growth and U.S. Real Estate Portfolios will be provided once the Class H shares have completed a full calendar year of operations.
* Performance shown for each Portfolio's Class H shares for periods prior to May 21, 2010 reflects the performance of the Class A shares of the applicable Predecessor Fund.
The average annual compounded rates of return (after taxes on distributions) (unless otherwise noted) for the Class I Shares (with the exception of Opportunity Portfolio which shows results for Class H Shares) of the Portfolios for the 1-, 5- and 10- year periods ended December 31, 2011 and for the period from inception through December 31, 2011 are as follows:
| Name of Portfolio† | | Inception
Date | | One
Year | | Average
Annual Five
Years | | Average
Annual Ten
Years | | Average
Annual Since
Inception | |
Active International Allocation
Class I | | 01/17/92 | | | -14.79 | % | | | -4.32 | % | | | 4.22 | % | | | 3.91 | % | |
Advantage*
Class I | | 06/30/08 | | | 5.24 | % | | | N/A | | | | N/A | | | | 4.48 | % | |
Asian Equity
Class I | | 12/28/10 | | | -16.88 | % | | | N/A | | | | N/A | | | | -15.19 | % | |
Emerging Markets
Class I | | 09/25/92 | | | -18.48 | % | | | -0.71 | % | | | 12.17 | % | | | 7.79 | % | |
Emerging Markets Domestic Debt
Class I | | 02/01/94 | | | -5.59 | % | | | 2.93 | % | | | 7.16 | % | | | 4.09 | % | |
94
| Name of Portfolio† | | Inception
Date | | One
Year | | Average
Annual Five
Years | | Average
Annual Ten
Years | | Average
Annual Since
Inception | |
Focus Growth
Class I | | 03/08/95 | | | -7.30 | % | | | 3.74 | % | | | 3.77 | % | | | 7.61 | % | |
Global Advantage
Class I | | 12/28/10 | | | 0.21 | % | | | N/A | | | | N/A | | | | 0.31 | % | |
Global Discovery
Class I | | 12/28/10 | | | -7.93 | % | | | N/A | | | | N/A | | | | -8.14 | % | |
Global Franchise
Class I | | 11/28/01 | | | 8.95 | % | | | 3.72 | % | | | 9.57 | % | | | 9.99 | % | |
Global Opportunity*
Class I | | 05/30/08 | | | -6.06 | % | | | N/A | | | | N/A | | | | 2.46 | % | |
Global Real Estate
Class I | | 08/30/06 | | | -10.18 | % | | | -5.71 | % | | | N/A | | | | -2.58 | % | |
Growth
Class I | | 04/02/91 | | | -3.04 | % | | | 3.28 | % | | | 3.37 | % | | | 7.22 | % | |
International Advantage
Class I | | 12/28/10 | | | -1.69 | % | | | N/A | | | | N/A | | | | -1.78 | % | |
International Equity
Class I | | 08/04/89 | | | -7.93 | % | | | -3.71 | % | | | 4.44 | % | | | 6.95 | % | |
International Opportunity
Class I | | 03/31/10 | | | -10.98 | % | | | N/A | | | | N/A | | | | 4.18 | % | |
International Real Estate
Class I | | 10/01/97 | | | -20.37 | % | | | -12.67 | % | | | 8.56 | % | | | 5.94 | % | |
International Small Cap
Class I | | 12/15/92 | | | -18.22 | % | | | -7.28 | % | | | 5.18 | % | | | 6.88 | % | |
Opportunity*
Class H | | 05/28/98 | | | -5.45 | % | | | 3.84 | % | | | 3.34 | % | | | 3.10 | % | |
Select Global Infrastructure
Class I | | 09/20/10 | | | 14.82 | % | | | N/A | | | | N/A | | | | 15.66 | % | |
Small Company Growth
Class I | | 11/01/89 | | | -9.37 | % | | | 0.26 | % | | | 5.20 | % | | | 8.02 | % | |
U.S. Real Estate
Class I | | 02/24/95 | | | 5.25 | % | | | -5.00 | % | | | 7.33 | % | | | 9.03 | % | |
† Performance information for the Class I shares of the Global Insight and Insight Portfolios will be provided once the Portfolios have completed a full calendar year of operations.
* Performance shown for each Portfolio's Class I and Class H shares, as applicable, for periods prior to May 21, 2010 reflects the performance of the Class I and Class A shares, respectively, of the applicable Predecessor Fund.
The average annual compounded rates of return (after taxes on distributions and redemptions) (unless otherwise noted) for the Class I shares (with the exception of Opportunity Portfolio which shows results for Class H shares) of the Portfolios for the 1-, 5- and 10-year periods ended December 31, 2011 and for the period from inception through December 31, 2011 are as follows:
| Name of Portfolio† | | Inception
Date | | One
Year | | Average
Annual Five
Years | | Average
Annual Ten
Years | | Average
Annual Since
Inception | |
Active International Allocation
Class I | | 01/17/92 | | | -9.03 | % | | | -3.03 | % | | | 4.13 | % | | | 3.98 | % | |
Advantage*
Class I | | 06/30/08 | | | 3.59 | % | | | N/A | | | | N/A | | | | 3.92 | % | |
Asian Equity
Class I | | 12/28/10 | | | -10.97 | % | | | N/A | | | | N/A | | | | -12.91 | % | |
Emerging Markets
Class I | | 09/25/92 | | | -11.50 | % | | | 0.29 | % | | | 11.80 | % | | | 7.61 | % | |
Emerging Markets Domestic Debt
Class I | | 02/01/94 | | | -2.10 | % | | | 3.14 | % | | | 6.94 | % | | | 4.46 | % | |
95
| Name of Portfolio† | | Inception
Date | | One
Year | | Average
Annual Five
Years | | Average
Annual Ten
Years | | Average
Annual Since
Inception | |
Focus Growth
Class I | | 03/08/95 | | | -4.75 | % | | | 3.22 | % | | | 3.29 | % | | | 7.32 | % | |
Global Advantage
Class I | | 12/28/10 | | | 0.35 | % | | | N/A | | | | N/A | | | | 0.36 | % | |
Global Discovery
Class I | | 12/28/10 | | | -4.78 | % | | | N/A | | | | N/A | | | | -6.76 | % | |
Global Franchise
Class I | | 11/28/01 | | | 6.76 | % | | | 3.91 | % | | | 9.16 | % | | | 9.55 | % | |
Global Opportunity*
Class I | | 05/30/08 | | | -2.00 | % | | | N/A | | | | N/A | | | | 2.36 | % | |
Global Real Estate
Class I | | 08/30/06 | | | -6.16 | % | | | -4.47 | % | | | N/A | | | | -1.85 | % | |
Growth
Class I | | 04/02/91 | | | -1.91 | % | | | 2.86 | % | | | 2.95 | % | | | 6.86 | % | |
International Advantage
Class I | | 12/28/10 | | | -0.51 | % | | | N/A | | | | N/A | | | | -1.26 | % | |
International Equity
Class I | | 08/04/89 | | | -4.46 | % | | | -2.21 | % | | | 4.94 | % | | | 7.10 | % | |
International Opportunity
Class I | | 03/31/10 | | | -5.73 | % | | | N/A | | | | N/A | | | | 3.97 | % | |
International Real Estate
Class I | | 10/01/97 | | | -12.45 | % | | | -9.66 | % | | | 8.40 | % | | | 5.86 | % | |
International Small Cap
Class I | | 12/15/92 | | | -11.81 | % | | | -4.96 | % | | | 5.96 | % | | | 7.20 | % | |
Opportunity*
Class H | | 05/28/98 | | | -3.54 | % | | | 3.30 | % | | | 2.90 | % | | | 2.77 | % | |
Select Global Infrastructure
Class I | | 09/20/10 | | | 11.10 | % | | | N/A | | | | N/A | | | | 13.92 | % | |
Small Company Growth
Class I | | 11/01/89 | | | -5.60 | % | | | 0.41 | % | | | 4.91 | % | | | 7.90 | % | |
U.S. Real Estate
Class I | | 02/24/95 | | | 3.63 | % | | | -3.31 | % | | | 7.48 | % | | | 9.01 | % | |
† Performance information for the Class I shares of the Global Insight and Insight Portfolios will be provided once the Portfolios have completed a full calendar year of operations.
* Performance shown for each Portfolio's Class I and Class H shares, as applicable, for periods prior to May 21, 2010 reflects the performance of the Class I and Class A shares, respectively, of the applicable Predecessor Fund.
Calculation of Yield For Emerging Markets Domestic Debt Portfolio
The current yields for the Emerging Markets Domestic Debt Portfolio for the 30-day period ended December 31, 2011 were as follows:
| Portfolio Name | | Class I
Shares | | Class P
Shares | | Class H
Shares | | Class L
Shares | |
| Emerging Markets Domestic Debt | | | 4.65 | % | | | 4.39 | % | | | 4.39 | % | | | 3.88 | % | |
FINANCIAL STATEMENTS
The Fund's audited financial statements for the fiscal year ended December 31, 2011, including notes thereto, and the report of Ernst & Young LLP, an independent registered public accounting firm, are herein incorporated by reference to the Fund's Annual Report. A copy of the Fund's Annual Report to Shareholders must accompany the delivery of this SAI.
96
This page intentionally left blank
This page intentionally left blank
APPENDIX A
MORGAN STANLEY INVESTMENT MANAGEMENT
PROXY VOTING POLICY AND PROCEDURES
I. POLICY STATEMENT
Morgan Stanley Investment Management's ("MSIM") policy and procedures for voting proxies ("Policy") with respect to securities held in the accounts of clients applies to those MSIM entities that provide discretionary investment management services and for which an MSIM entity has authority to vote proxies. This Policy is reviewed and updated as necessary to address new and evolving proxy voting issues and standards.
The MSIM entities covered by this Policy currently include the following: Morgan Stanley AIP GP LP, Morgan Stanley Investment Management Inc., Morgan Stanley Investment Management Limited, Morgan Stanley Investment Management Company, Morgan Stanley Asset & Investment Trust Management Co., Limited, Morgan Stanley Investment Management Private Limited and Private Investment Partners Inc. (each an "MSIM Affiliate" and collectively referred to as the "MSIM Affiliates" or as "we" below).
Each MSIM Affiliate will use its best efforts to vote proxies as part of its authority to manage, acquire and dispose of account assets. With respect to the MSIM registered management investment companies (the "MSIM Funds"), each MSIM Affiliate will vote proxies under this Policy pursuant to authority granted under its applicable investment advisory agreement or, in the absence of such authority, as authorized by the Board of Directors/Trustees of the MSIM Funds. A MSIM Affiliate will not vote proxies unless the investment management or investment advisory agreement explicitly authorizes the MSIM Affiliate to vote proxies. MSIM Affiliates will vote proxies in a prudent and diligent manner and in the best interests of clients, including beneficiaries of and participants in a client's benefit plan(s) for which the MSIM Affiliates manage assets, consistent with the objective of maximizing long-term investment returns ("Client Proxy Standard"). In certain situations, a client or its fiduciary may provide an MSIM Affiliate with a proxy voting policy. In these situations, the MSIM Affiliate will comply with the client's policy.
Proxy Research Services—ISS Governance Services ("ISS") and Glass Lewis (together with other proxy research providers as we may retain from time to time, the "Research Providers") are independent advisers that specialize in providing a variety of fiduciary-level proxy-related services to institutional investment managers, plan sponsors, custodians, consultants, and other institutional investors. The services provided include in-depth research, global issuer analysis, and voting recommendations. While we may review and utilize the recommendations of one or more Research Providers in making proxy voting decisions, we are in no way obligated to follow such recommendations. In addition to research, ISS provides vote execution, reporting, and recordkeeping services.
Voting Proxies for Certain Non-U.S. Companies—Voting proxies of companies located in some jurisdictions may involve several problems that can restrict or prevent the ability to vote such proxies or entail significant costs. These problems include, but are not limited to: (i) proxy statements and ballots being written in a language other than English; (ii) untimely and/or inadequate notice of shareholder meetings; (iii) restrictions on the ability of holders outside the issuer's jurisdiction of organization to exercise votes; (iv) requirements to vote proxies in person; (v) the imposition of restrictions on the sale of the securities for a period of time in proximity to the shareholder meeting; and (vi) requirements to provide local agents with power of attorney to facilitate our voting instructions. As a result, we vote clients' non-U.S. proxies on a best efforts basis only, after weighing the costs and benefits of voting such proxies, consistent with the Client Proxy Standard. ISS has been retained to provide assistance in connection with voting non-U.S. proxies.
II. GENERAL PROXY VOTING GUIDELINES
To promote consistency in voting proxies on behalf of its clients, we follow this Policy (subject to any exception set forth herein). The Policy addresses a broad range of issues, and provides general voting parameters on proposals that arise most frequently. However, details of specific proposals vary, and those details affect particular voting decisions, as do factors specific to a given company. Pursuant to the procedures set forth herein, we may vote in a manner that is not in accordance with the following general guidelines, provided the vote is approved by the Proxy Review Committee (see Section III for description) and is consistent with the Client Proxy Standard. Morgan Stanley AIP GP LP will follow the procedures as described in Appendix A.
A-1
We endeavor to integrate governance and proxy voting policy with investment goals, using the vote to encourage portfolio companies to enhance long-term shareholder value and to provide a high standard of transparency such that equity markets can value corporate assets appropriately.
We seek to follow the Client Proxy Standard for each client. At times, this may result in split votes, for example when different clients have varying economic interests in the outcome of a particular voting matter (such as a case in which varied ownership interests in two companies involved in a merger result in different stakes in the outcome). We also may split votes at times based on differing views of portfolio managers.
We may abstain on matters for which disclosure is inadequate.
A. Routine Matters.
We generally support routine management proposals. The following are examples of routine management proposals:
• Approval of financial statements and auditor reports if delivered with an unqualified auditor's opinion.
• General updating/corrective amendments to the charter, articles of association or bylaws, unless we believe that such amendments would diminish shareholder rights.
• Most proposals related to the conduct of the annual meeting, with the following exceptions. We generally oppose proposals that relate to "the transaction of such other business which may come before the meeting," and open-ended requests for adjournment. However, where management specifically states the reason for requesting an adjournment and the requested adjournment would facilitate passage of a proposal that would otherwise be supported under this Policy (i.e. an uncontested corporate transaction), the adjournment request will be supported.
We generally support shareholder proposals advocating confidential voting procedures and independent tabulation of voting results.
B. Board of Directors.
1. Election of directors: Votes on board nominees can involve balancing a variety of considerations. In vote decisions, we may take into consideration whether the company has a majority voting policy in place that we believe makes the director vote more meaningful. In the absence of a proxy contest, we generally support the board's nominees for director except as follows:
a. We consider withholding support from or voting against a nominee if we believe a direct conflict exists between the interests of the nominee and the public shareholders, including failure to meet fiduciary standards of care and/or loyalty. We may oppose directors where we conclude that actions of directors are unlawful, unethical or negligent. We consider opposing individual board members or an entire slate if we believe the board is entrenched and/or dealing inadequately with performance problems; if we believe the board is acting with insufficient independence between the board and management; or if we believe the board has not been sufficiently forthcoming with information on key governance or other material matters.
b. We consider withholding support from or voting against interested directors if the company's board does not meet market standards for director independence, or if otherwise we believe board independence is insufficient. We refer to prevalent market standards as promulgated by a stock exchange or other authority within a given market (e.g., New York Stock Exchange or Nasdaq rules for most U.S. companies, and The Combined Code on Corporate Governance in the United Kingdom). Thus, for an NYSE company with no controlling shareholder, we would expect that at a minimum a majority of directors should be independent as defined by NYSE. Where we view market standards as inadequate, we may withhold votes based on stronger independence standards. Market standards notwithstanding, we generally do not view long board tenure alone as a basis to classify a director as non-independent.
i. At a company with a shareholder or group that controls the company by virtue of a majority economic interest in the company, we have a reduced expectation for board independence, although we believe the presence of independent directors can be helpful, particularly in staffing the audit committee, and at times we may withhold support from or vote against a nominee on the view the
A-2
board or its committees are not sufficiently independent. In markets where board independence is not the norm (e.g. Japan), however, we consider factors including whether a board of a controlled company includes independent members who can be expected to look out for interests of minority holders.
ii. We consider withholding support from or voting against a nominee if he or she is affiliated with a major shareholder that has representation on a board disproportionate to its economic interest.
c. Depending on market standards, we consider withholding support from or voting against a nominee who is interested and who is standing for election as a member of the company's compensation/remuneration, nominating/governance or audit committee.
d. We consider withholding support or voting against nominees if the term for which they are nominated is excessive. We consider this issue on a market-specific basis.
e. We consider withholding support from or voting against nominees if, in our view, there has been insufficient board renewal (turnover), particularly in the context of extended poor company performance.
f. We consider withholding support from or voting against a nominee standing for election if the board has not taken action to implement generally accepted governance practices for which there is a "bright line" test. For example, in the context of the U.S. market, failure to eliminate a dead hand or slow hand poison pill would be seen as a basis for opposing one or more incumbent nominees.
g. In markets that encourage designated audit committee financial experts, we consider voting against members of an audit committee if no members are designated as such. We also may not support the audit committee members if the company has faced financial reporting issues and/or does not put the auditor up for ratification by shareholders.
h. We believe investors should have the ability to vote on individual nominees, and may abstain or vote against a slate of nominees where we are not given the opportunity to vote on individual nominees.
i. We consider withholding support from or voting against a nominee who has failed to attend at least 75% of the nominee's board and board committee meetings within a given year without a reasonable excuse. We also consider opposing nominees if the company does not meet market standards for disclosure on attendance.
j. We consider withholding support from or voting against a nominee who appears overcommitted, particularly through service on an excessive number of boards. Market expectations are incorporated into this analysis; for U.S. boards, we generally oppose election of a nominee who serves on more than six public company boards (excluding investment companies), although we may reference National Association of Corporate Directors guidance suggesting that public company CEOs, for example, should serve no more than two outside boards given the level of time commitment required in their primary job.
2. Discharge of directors' duties: In markets where an annual discharge of directors' responsibility is a routine agenda item, we generally support such discharge. However, we may vote against discharge or abstain from voting where there are serious findings of fraud or other unethical behavior for which the individual bears responsibility. The annual discharge of responsibility represents shareholder approval of disclosed actions taken by the board during the year and may make future shareholder action against the board difficult to pursue.
3. Board independence: We generally support U.S. shareholder proposals requiring that a certain percentage (up to 66 2/3%) of the company's board members be independent directors, and promoting all-independent audit, compensation and nominating/governance committees.
4. Board diversity: We consider on a case-by-case basis shareholder proposals urging diversity of board membership with respect to social, religious or ethnic group.
5. Majority voting: We generally support proposals requesting or requiring majority voting policies in election of directors, so long as there is a carve-out for plurality voting in the case of contested elections.
A-3
6. Proxy access: We consider on a case-by-case basis shareholder proposals on particular procedures for inclusion of shareholder nominees in company proxy statements.
7. Reimbursement for dissident nominees: We generally support well-crafted U.S. shareholder proposals that would provide for reimbursement of dissident nominees elected to a board, as the cost to shareholders in electing such nominees can be factored into the voting decision on those nominees.
8. Proposals to elect directors more frequently: In the U.S. public company context, we usually support shareholder and management proposals to elect all directors annually (to "declassify" the board), although we make an exception to this policy where we believe that long-term shareholder value may be harmed by this change given particular circumstances at the company at the time of the vote on such proposal. As indicated above, outside the U.S., we generally support greater accountability to shareholders that comes through more frequent director elections, but recognize that many markets embrace longer term lengths, sometimes for valid reasons given other aspects of the legal context in electing boards.
9. Cumulative voting: We generally support proposals to eliminate cumulative voting in the U.S. market context. (Cumulative voting provides that shareholders may concentrate their votes for one or a handful of candidates, a system that can enable a minority bloc to place representation on a board.) U.S. proposals to establish cumulative voting in the election of directors generally will not be supported.
10. Separation of Chairman and CEO positions: We vote on shareholder proposals to separate the Chairman and CEO positions and/or to appoint an independent Chairman based in part on prevailing practice in particular markets, since the context for such a practice varies. In many non-U.S. markets, we view separation of the roles as a market standard practice, and support division of the roles in that context. In the U.S., we consider such proposals on a case-by-case basis, considering, among other things, the existing board leadership structure, company performance, and any other evidence of entrenchment or perceived risk that power is overly concentrated in a single individual.
11. Director retirement age and term limits: Proposals setting or recommending director retirement ages or director term limits are voted on a case-by-case basis that includes consideration of company performance, the rate of board renewal, evidence of effective individual director evaluation processes, and any indications of entrenchment...
12. Proposals to limit directors' liability and/or broaden indemnification of officers and directors. Generally, we will support such proposals provided that an individual is eligible only if he or she has not acted in bad faith, with gross negligence or with reckless disregard of their duties.
C. Statutory auditor boards
The statutory auditor board, which is separate from the main board of directors, plays a role in corporate governance in several markets. These boards are elected by shareholders to provide assurance on compliance with legal and accounting standards and the company's articles of association. We generally vote for statutory auditor nominees if they meet independence standards. In markets that require disclosure on attendance by internal statutory auditors, however, we consider voting against nominees for these positions who failed to attend at least 75% of meetings in the previous year. We also consider opposing nominees if the company does not meet market standards for disclosure on attendance.
D. Corporate transactions and proxy fights.
We examine proposals relating to mergers, acquisitions and other special corporate transactions (i.e., takeovers, spin-offs, sales of assets, reorganizations, restructurings and recapitalizations) on a case-by-case basis in the interests of each fund or other account. Proposals for mergers or other significant transactions that are friendly and approved by the Research Providers usually are supported if there is no portfolio manager objection. We also analyze proxy contests on a case-by-case basis.
E. Changes in capital structure.
1. We generally support the following:
• Management and shareholder proposals aimed at eliminating unequal voting rights, assuming fair economic treatment of classes of shares we hold.
A-4
• U.S. management proposals to increase the authorization of existing classes of common stock (or securities convertible into common stock) if: (i) a clear business purpose is stated that we can support and the number of shares requested is reasonable in relation to the purpose for which authorization is requested; and/or (ii) the authorization does not exceed 100% of shares currently authorized and at least 30% of the total new authorization will be outstanding. (We consider proposals that do not meet these criteria on a case-by-case basis.)
• U.S. management proposals to create a new class of preferred stock or for issuances of preferred stock up to 50% of issued capital, unless we have concerns about use of the authority for anti-takeover purposes.
• Proposals in non-U.S. markets that in our view appropriately limit potential dilution of existing shareholders. A major consideration is whether existing shareholders would have preemptive rights for any issuance under a proposal for standing share issuance authority. We generally consider market-specific guidance in making these decisions; for example, in the U.K. market, we usually follow Association of British Insurers' ("ABI") guidance, although company-specific factors may be considered and for example, may sometimes lead us to voting against share authorization proposals even if they meet ABI guidance.
• Management proposals to authorize share repurchase plans, except in some cases in which we believe there are insufficient protections against use of an authorization for anti-takeover purposes.
• Management proposals to reduce the number of authorized shares of common or preferred stock, or to eliminate classes of preferred stock.
• Management proposals to effect stock splits.
• Management proposals to effect reverse stock splits if management proportionately reduces the authorized share amount set forth in the corporate charter. Reverse stock splits that do not adjust proportionately to the authorized share amount generally will be approved if the resulting increase in authorized shares coincides with the proxy guidelines set forth above for common stock increases.
• Management dividend payout proposals, except where we perceive company payouts to shareholders as inadequate.
2. We generally oppose the following (notwithstanding management support):
• Proposals to add classes of stock that would substantially dilute the voting interests of existing shareholders.
• Proposals to increase the authorized or issued number of shares of existing classes of stock that are unreasonably dilutive, particularly if there are no preemptive rights for existing shareholders. However, depending on market practices, we consider voting for proposals giving general authorization for issuance of shares not subject to pre-emptive rights if the authority is limited.
• Proposals that authorize share issuance at a discount to market rates, except where authority for such issuance is de minimis, or if there is a special situation that we believe justifies such authorization (as may be the case, for example, at a company under severe stress and risk of bankruptcy).
• Proposals relating to changes in capitalization by 100% or more.
We consider on a case-by-case basis shareholder proposals to increase dividend payout ratios, in light of market practice and perceived market weaknesses, as well as individual company payout history and current circumstances. For example, currently we perceive low payouts to shareholders as a concern at some Japanese companies, but may deem a low payout ratio as appropriate for a growth company making good use of its cash, notwithstanding the broader market concern.
F. Takeover Defenses and Shareholder Rights.
1. Shareholder rights plans: We generally support proposals to require shareholder approval or ratification of shareholder rights plans (poison pills). In voting on rights plans or similar takeover defenses, we consider on a case-by-case basis whether the company has demonstrated a need for the defense in the context of promoting long-term share value; whether provisions of the defense are in line with generally accepted governance principles in the market (and specifically the presence of an adequate qualified offer provision that would
A-5
exempt offers meeting certain conditions from the pill); and the specific context if the proposal is made in the midst of a takeover bid or contest for control.
2. Supermajority voting requirements: We generally oppose requirements for supermajority votes to amend the charter or bylaws, unless the provisions protect minority shareholders where there is a large shareholder. In line with this view, in the absence of a large shareholder we support reasonable shareholder proposals to limit such supermajority voting requirements.
3. Shareholder rights to call meetings: We consider proposals to enhance shareholder rights to call meetings on a case-by-case basis. At large-cap U.S. companies, we generally support efforts to establish the rights of holders of 10% or more of shares to call special meetings, unless the board or state law has a set policy or law establishing such rights at a threshold that we believe to be acceptable.
4. Written consent rights: In the U.S. context, we examine proposals for shareholder written consent rights on a case-by-case basis.
5. Reincorporation: We consider management and shareholder proposals to reincorporate to a different jurisdiction on a case-by-case basis. We oppose such proposals if we believe the main purpose is to take advantage of laws or judicial precedents that reduce shareholder rights.
6. Anti-greenmail provisions: Proposals relating to the adoption of anti-greenmail provisions will be supported, provided that the proposal: (i) defines greenmail; (ii) prohibits buyback offers to large block holders (holders of at least 1% of the outstanding shares and in certain cases, a greater amount) not made to all shareholders or not approved by disinterested shareholders; and (iii) contains no anti-takeover measures or other provisions restricting the rights of shareholders.
7. Bundled proposals: We may consider opposing or abstaining on proposals if disparate issues are "bundled" and presented for a single vote.
G. Auditors.
We generally support management proposals for selection or ratification of independent auditors. However, we may consider opposing such proposals with reference to incumbent audit firms if the company has suffered from serious accounting irregularities and we believe rotation of the audit firm is appropriate, or if fees paid to the auditor for non-audit-related services are excessive. Generally, to determine if non-audit fees are excessive, a 50% test will be applied (i.e., non-audit-related fees should be less than 50% of the total fees paid to the auditor). We generally vote against proposals to indemnify auditors.
H. Executive and Director Remuneration.
1. We generally support the following:
• Proposals for employee equity compensation plans and other employee ownership plans, provided that our research does not indicate that approval of the plan would be against shareholder interest. Such approval may be against shareholder interest if it authorizes excessive dilution and shareholder cost, particularly in the context of high usage ("run rate") of equity compensation in the recent past; or if there are objectionable plan design and provision.
• Proposals relating to fees to outside directors, provided the amounts are not excessive relative to other companies in the country or industry, and provided that the structure is appropriate within the market context. While stock-based compensation to outside directors is positive if moderate and appropriately structured, we are wary of significant stock option awards or other performance-based awards for outside directors, as well as provisions that could result in significant forfeiture of value on a director's decision to resign from a board (such forfeiture can undercut director independence).
• Proposals for employee stock purchase plans that permit discounts, but only for grants that are part of a broad-based employee plan, including all non-executive employees, and only if the discounts are limited to a reasonable market standard or less.
• Proposals for the establishment of employee retirement and severance plans, provided that our research does not indicate that approval of the plan would be against shareholder interest.
A-6
2. We generally oppose retirement plans and bonuses for non-executive directors and independent statutory auditors.
3. In the U.S. context, shareholder proposals requiring shareholder approval of all severance agreements will not be supported, but proposals that require shareholder approval for agreements in excess of three times the annual compensation (salary and bonus) generally will be supported. We generally oppose shareholder proposals that would establish arbitrary caps on pay. We consider on a case-by-case basis shareholder proposals that seek to limit Supplemental Executive Retirement Plans (SERPs), but support such proposals where we consider SERPs to be excessive.
4. Shareholder proposals advocating stronger and/or particular pay-for-performance models will be evaluated on a case-by-case basis, with consideration of the merits of the individual proposal within the context of the particular company and its labor markets, and the company's current and past practices. While we generally support emphasis on long-term components of senior executive pay and strong linkage of pay to performance, we consider factors including whether a proposal may be overly prescriptive, and the impact of the proposal, if implemented as written, on recruitment and retention.
5. We generally support proposals advocating reasonable senior executive and director stock ownership guidelines and holding requirements for shares gained in executive equity compensation programs
6. We generally support shareholder proposals for reasonable "claw-back" provisions that provide for company recovery of senior executive bonuses to the extent they were based on achieving financial benchmarks that were not actually met in light of subsequent restatements.
7. Management proposals effectively to re-price stock options are considered on a case-by-case basis. Considerations include the company's reasons and justifications for a re-pricing, the company's competitive position, whether senior executives and outside directors are excluded, potential cost to shareholders, whether the re-pricing or share exchange is on a value-for-value basis, and whether vesting requirements are extended.
8. Say-on-Pay: We consider proposals relating to an advisory vote on remuneration on a case-by-case basis. Considerations include a review of the relationship between executive remuneration and performance based on operating trends and total shareholder return over multiple performance periods. In addition, we review remuneration structures and potential poor pay practices, including relative magnitude of pay, discretionary bonus awards, tax gross ups, change-in-control features, internal pay equity and peer group construction. As long-term investors, we support remuneration policies that align with long-term shareholder returns.
I. Social, Political and Environmental Issues.
Shareholders in the U.S. and certain other markets submit proposals encouraging changes in company disclosure and practices related to particular corporate, social, political and environmental matters. We consider how to vote on the proposals on a case-by-case basis to determine likely impacts on shareholder value. We seek to balance concerns on reputational and other risks that lie behind a proposal against costs of implementation, while considering appropriate shareholder and management prerogatives. We may abstain from voting on proposals that do not have a readily determinable financial impact on shareholder value. We support proposals that, if implemented, would enhance useful disclosure, but we generally vote against proposals requesting reports that we believe are duplicative, related to matters not material to the business, or that would impose unnecessary or excessive costs. We believe that certain social and environmental shareholder proposals may intrude excessively on management prerogatives, which can lead us to oppose them.
J. Fund of Funds.
Certain Funds advised by an MSIM Affiliate invest only in other MSIM Funds. If an underlying fund has a shareholder meeting, in order to avoid any potential conflict of interest, such proposals will be voted in the same proportion as the votes of the other shareholders of the underlying fund, unless otherwise determined by the Proxy Review Committee.
III. ADMINISTRATION OF POLICY
The MSIM Proxy Review Committee (the "Committee") has overall responsibility for the Policy. The Committee, which is appointed by MSIM's Long-Only Executive Committee, consists of investment professionals who represent the different investment disciplines and geographic locations of the firm, and is chaired by the director
A-7
of the Corporate Governance Team ("CGT"). Because proxy voting is an investment responsibility and impacts shareholder value, and because of their knowledge of companies and markets, portfolio managers and other members of investment staff play a key role in proxy voting, although the Committee has final authority over proxy votes.
The CGT Director is responsible for identifying issues that require Committee deliberation or ratification. The CGT, working with advice of investment teams and the Committee, is responsible for voting on routine items and on matters that can be addressed in line with these Policy guidelines. The CGT has responsibility for voting case-by-case where guidelines and precedent provide adequate guidance.
The Committee will periodically review and have the authority to amend, as necessary, the Policy and establish and direct voting positions consistent with the Client Proxy Standard.
CGT and members of the Committee may take into account Research Providers' recommendations and research as well as any other relevant information they may request or receive, including portfolio manager and/or analyst comments and research, as applicable. Generally, proxies related to securities held in accounts that are managed pursuant to quantitative, index or index-like strategies ("Index Strategies") will be voted in the same manner as those held in actively managed accounts, unless economic interests of the accounts differ. Because accounts managed using Index Strategies are passively managed accounts, research from portfolio managers and/or analysts related to securities held in these accounts may not be available. If the affected securities are held only in accounts that are managed pursuant to Index Strategies, and the proxy relates to a matter that is not described in this Policy, the CGT will consider all available information from the Research Providers, and to the extent that the holdings are significant, from the portfolio managers and/or analysts.
A. Committee Procedures
The Committee meets at least quarterly and reviews and considers changes to the Policy at least annually. Through meetings and/or written communications, the Committee is responsible for monitoring and ratifying "split votes" (i.e., allowing certain shares of the same issuer that are the subject of the same proxy solicitation and held by one or more MSIM portfolios to be voted differently than other shares) and/or "override voting" (i.e., voting all MSIM portfolio shares in a manner contrary to the Policy). The Committee will review developing issues and approve upcoming votes, as appropriate, for matters as requested by CGT.
The Committee reserves the right to review voting decisions at any time and to make voting decisions as necessary to ensure the independence and integrity of the votes.
B. Material Conflicts of Interest
In addition to the procedures discussed above, if the CGT Director determines that an issue raises a material conflict of interest, the CGT Director may request a special committee to review, and recommend a course of action with respect to, the conflict(s) in question ("Special Committee").
A potential material conflict of interest could exist in the following situations, among others:
1. The issuer soliciting the vote is a client of MSIM or an affiliate of MSIM and the vote is on a matter that materially affects the issuer.
2. The proxy relates to Morgan Stanley common stock or any other security issued by Morgan Stanley or its affiliates except if echo voting is used, as with MSIM Funds, as described herein.
3. Morgan Stanley has a material pecuniary interest in the matter submitted for a vote (e.g., acting as a financial advisor to a party to a merger or acquisition for which Morgan Stanley will be paid a success fee if completed).
If the CGT Director determines that an issue raises a potential material conflict of interest, depending on the facts and circumstances, the issue will be addressed as follows:
1. If the matter relates to a topic that is discussed in this Policy, the proposal will be voted as per the Policy.
2. If the matter is not discussed in this Policy or the Policy indicates that the issue is to be decided case-by-case, the proposal will be voted in a manner consistent with the Research Providers, provided that all the Research Providers consulted have the same recommendation, no portfolio manager objects to that vote, and the vote is consistent with MSIM's Client Proxy Standard.
A-8
3. If the Research Providers' recommendations differ, the CGT Director will refer the matter to a Special Committee to vote on the proposal, as appropriate.
Any Special Committee shall be comprised of the CGT Director and at least two portfolio managers (preferably members of the Committee) as approved by the Committee. The CGT Director may request non-voting participation by MSIM's General Counsel or his/her designee and the Chief Compliance Officer or his/her designee. In addition to the research provided by Research Providers, the Special Committee may request analysis from MSIM Affiliate investment professionals and outside sources to the extent it deems appropriate.
C. Proxy Voting Reporting
The CGT will document in writing all Committee and Special Committee decisions and actions, which documentation will be maintained by the CGT for a period of at least six years. To the extent these decisions relate to a security held by an MSIM Fund, the CGT will report the decisions to each applicable Board of Trustees/Directors of those Funds at each Board's next regularly scheduled Board meeting. The report will contain information concerning decisions made during the most recently ended calendar quarter immediately preceding the Board meeting.
MSIM will promptly provide a copy of this Policy to any client requesting it. MSIM will also, upon client request, promptly provide a report indicating how each proxy was voted with respect to securities held in that client's account.
MSIM's Legal Department is responsible for filing an annual Form N-PX on behalf of each MSIM Fund for which such filing is required, indicating how all proxies were voted with respect to such Fund's holdings.
A-9
APPENDIX A
The following procedures apply to accounts managed by Morgan Stanley AIP GP LP and Private Investment Partners Inc. ("AIP").
Generally, AIP will follow the guidelines set forth in Section II of MSIM's Proxy Voting Policy and Procedures. To the extent that such guidelines do not provide specific direction, or AIP determines that consistent with the Client Proxy Standard, the guidelines should not be followed, the Proxy Review Committee has delegated the voting authority to vote securities held by accounts managed by AIP to the Fund of Hedge Funds investment team, the Private Equity Fund of Funds investment team or the Private Equity Real Estate Fund of Funds investment team of AIP. A summary of decisions made by the investment teams will be made available to the Proxy Review Committee for its information at the next scheduled meeting of the Proxy Review Committee.
In certain cases, AIP may determine to abstain from determining (or recommending) how a proxy should be voted (and therefore abstain from voting such proxy or recommending how such proxy should be voted), such as where the expected cost of giving due consideration to the proxy does not justify the potential benefits to the affected account(s) that might result from adopting or rejecting (as the case may be) the measure in question.
Waiver of Voting Rights
For regulatory reasons, AIP may either 1) invest in a class of securities of an underlying fund (the "Fund") that does not provide for voting rights; or 2) waive 100% of its voting rights with respect to the following:
1. Any rights with respect to the removal or replacement of a director, general partner, managing member or other person acting in a similar capacity for or on behalf of the Fund (each individually a "Designated Person," and collectively, the "Designated Persons"), which may include, but are not limited to, voting on the election or removal of a Designated Person in the event of such Designated Person's death, disability, insolvency, bankruptcy, incapacity, or other event requiring a vote of interest holders of the Fund to remove or replace a Designated Person; and
2. Any rights in connection with a determination to renew, dissolve, liquidate, or otherwise terminate or continue the Fund, which may include, but are not limited to, voting on the renewal, dissolution, liquidation, termination or continuance of the Fund upon the occurrence of an event described in the Fund's organizational documents; provided, however, that, if the Fund's organizational documents require the consent of the Fund's general partner or manager, as the case may be, for any such termination or continuation of the Fund to be effective, then AIP may exercise its voting rights with respect to such matter.
Approved by Morgan Stanley Funds Board on September 27-28, 2011
A-10
APPENDIX B — DESCRIPTION OF RATINGS
I. Excerpts from Moody's Investors Service, Inc.'s Corporate Bond Ratings:
Aaa: Judged to be of the best quality; carry the smallest degree of invest risk;
Aa: judged to be of high quality by all standards;
A: possess many favorable investment attributes and are to be considered upper medium grade obligations;
Baa: considered as medium grade obligations; i.e., they are neither highly protected nor poorly secured;
Ba: judged to have speculative elements; their future cannot be considered well-assured;
B: assurance of interest and principal payments or of maintenance of other terms of the contract over any long period of time may be small.
Caa: Bonds which are rated Caa are of poor standing. Such issues may be in default or there may be present elements of danger with respect to principal or interest.
Ca: Bonds which are rated Ca represent obligations which are speculative in a high degree. Such issues are often in default or have other marked shortcomings.
C: Bonds which are rated C are lowest rated class of bonds and issues so rated can be regarded as having extremely poor prospects of ever attaining any real investment standing.
Note: Moody's applies numerical modifiers, 1, 2 and 3 in each generic rating classification from Aa through Caa in its corporate bond rating system. The modifier 1 indicates that the obligation ranks in the higher end of its generic rating category; the modifier 2 indicates a mid-range ranking; and the modifier 3 indicates that the issue ranks in the lower end of its generic rating category.
II. Excerpts from Standard & Poor's Rating Group's Corporate Bond Ratings:
AAA: Highest rating assigned for an obligation; obligor has extremely strong capacity to meet its financial commitments;
AA: obligation differs from the highest-rated obligations only in small degree; obligor's capacity to meet its financial commitment on the obligation is very strong;
A: obligation is somewhat more susceptible to the adverse effects of changes in circumstances and economic conditions than obligations in higher-rated categories; obligor's capacity to meet its financial commitment on the obligation is still strong;
BBB: obligation exhibits adequate protection parameters; adverse economic conditions or changing circumstances are more likely to lead to a weakened capacity of the obligor to meet its financial commitment on the obligation.
BB, B, CCC, CC, C: Obligations rated BB, B, CCC, and CC are regarded as having significant speculative characteristics. BB indicates the least degree of speculation and CC the highest. While such obligations will likely have some quality and protective characteristics, these may be outweighed by large uncertainties or major exposures to adverse conditions. The C rating may be used to cover a situation where a bankruptcy petition has been filed or similar action has been taken, but payments on this obligation are being continued.
D: An obligation rated D is in payment default. The D rating category is used when payments on an obligation are not made on the date due even if the applicable grace period has not expired, unless Standard & Poor's believes that such payments will be made during such grace period. The D rating also will be used upon the filing of a bankruptcy petition or the taking of a similar action if payments on an obligation are jeopardized.
Plus (+) or minus (-): The ratings from AA to CCC may be modified by the addition of a plus or minus sign to show relative standing within the major rating categories.
B-1
III. Excerpts from Fitch, Inc.'s Corporate Bond Ratings:
AAA: Highest credit quality; denotes the lowest expectation of credit risk; assigned only in case of exceptionally strong capacity for payment of financial commitments. This capacity is highly unlikely to be adversely affected by foreseeable events.
AA: Very high credit quality; denote expectations of very low credit risk; indicate very strong capacity for payment of financial commitments. This capacity is not significantly vulnerable to foreseeable events.
A: High credit quality; denote expectations of low credit risk. The capacity for payment of financial commitments is considered strong. This capacity may, nevertheless, be more vulnerable to changes in circumstances or in economic conditions than is the case for higher ratings.
BBB: Good credit quality; indicate that there is currently expectations of low credit risk. The capacity for payment of financial commitments is considered adequate but adverse changes in circumstances and economic conditions are more likely to impair this capacity. This is the lowest investment grade category.
BB: Speculative; indicate that there is a possibility of credit risk developing, particularly as the result of adverse economic change over time; however, business or financial alternatives may be available to allow financial commitments to be met. Securities rated in this category are not investment grade.
B: Highly speculative; indicate that significant credit risk is present, but a limited margin of safety remains. Financial commitments are currently being met; however, capacity for continued payment is contingent upon a sustained, favorable business and economic environment.
CCC: Default is a real possibility. Capacity for meeting financial commitments is solely reliant upon sustained, favorable business or economic conditions.
CC: Default of some kind appears probable.
C: Default is imminent.
RD: Indicates an entity that has failed to make due payments (within the applicable grace period) on some but not all material financial obligations, but continues to honor other classes of obligations.
D: Default. Default is determined by reference to the terms of the obligations' documentation. Fitch will assign default ratings where it has reasonably determined that payment has not been made on a material obligation in accordance with the requirements of the obligation's documentation, or where it believes that default ratings consistent with Fitch's published definition of default are the most appropriate ratings to assign.
The modifiers "+" or "-" may be appended to a rating to denote relative status within major rating categories. Such suffixes are not added to the AAA Long-term rating category or to categories below CCC.
IV. Excerpts from Moody's Investors Service, Inc.'s Preferred Stock Ratings:
aaa: An issue which is rated aaa is considered to be a top-quality preferred stock. This rating indicates good asset protection and the least risk of dividend impairment within the universe of preferred stocks.
aa: An issue which is rated aa is considered a high-grade preferred stock. This rating indicates that there is reasonable assurance that earnings and asset protection will remain relatively well maintained in the foreseeable future.
a: An issue which is rated a is considered to be an upper medium grade preferred stock. While risks are judged to be somewhat greater than in the aaa and aa classifications, earnings and asset protection are, nevertheless expected to be maintained at adequate levels.
baa: An issue which is rated baa is considered to be medium grade, neither highly protected nor poorly secured. Earnings and asset protection appear adequate at present but may be questionable over any great length of time.
ba: an issue which is rated ba is considered to have speculative elements and its future cannot be considered well assured. Earnings and asset protection may be very moderate and not well safeguarded during adverse periods. Uncertainty of position characterizes preferred stocks in this class.
B-2
b: An issue which is rated b generally lacks the characteristics of a desirable investment. Assurance of dividend payments and maintenance of other terms of the issue over any long period of time may be small.
caa: An issue which is rated caa is likely to be in arrears on dividend payments. This rating designation does not purport to indicate the future status of payment.
ca: An issue which is rated ca is speculative in a high degree and is likely to be in arrears on dividends with little likelihood of eventual payment.
c: This is the lowest rated class of preferred of preference stock. Issues so rated can be regarded as having extremely poor prospects of ever attaining any real investment standing.
Note: Moody's may apply numerical modifiers 1, 2 and 3 in each rating classification from "aa" through "b" in its preferred stock rating system. The modifier 1 indicated that the security ranks in the higher end of its generic rating category; the modifier 2 indicates a mid-range ranking; and the modifier 3 indicates that the issue ranks in the lower end of its generic rating category.
V. Excerpts from Standard & Poor's Rating Group's Preferred Stock Ratings:
AAA: This is the highest rating that may be assigned by S&P's to a preferred stock issue and indicates an extremely strong capacity to pay the preferred stock obligations.
AA: A preferred stock issue rated AA also qualifies as a high quality fixed income security. The capacity to pay preferred stock obligations is very strong, although not as overwhelming as for issues rated AAA.
A: An issue rated A is backed by a sound capacity to pay the preferred stock obligations, although it is somewhat more susceptible to the adverse effect of the changes in circumstances and economic conditions.
BBB: An issue rated BBB is regarded as backed by an adequate capacity to pay the preferred stock obligations. Whereas it normally exhibits adequate protection parameter, adverse economic conditions or changing circumstances are more likely to lead to a weakened capacity to make payments for a preferred stock in this category than for issues in the A category.
BB, B, CCC: Preferred stock rated BB, B, and CCC are regarded, on balance, as predominantly speculative with respect to the issuer's capacity to pay preferred stock obligations. Bb indicates the lowest degree of speculation and CCC the highest degree of speculation. While such issues will likely have some quality and protective characteristics, these are outweighed by large uncertainties of major risk exposures to adverse conditions.
CC: The rating CC is reserved for a preferred stock in arrears on dividends or sinking fund payments but that is currently paying.
C: A preferred stock rated C is a non-paying issue.
D: A preferred stock rated D is a non-paying issue with the issuer in default on debt instruments.
Plus (+) or Minus (-): The ratings from AA for CCC may be modified by the addition of a plus or minus sign to show relative standing within the major rating categories.
VI. Excerpts from Fitch, Inc's Preferred Stock Ratings:
AAA: These preferred stocks are considered to be investment grade and of the highest credit quality. The obligor has an exceptionally strong ability to pay, which is unlikely to be affected by reasonably foreseeable events.
AA: These preferred stocks are considered to be investment grade and of very high credit quality. The obligor's ability to pay is very strong, although not quite as strong as preferred stocks rated "AAA".
A: These preferred stocks are considered to be investment grade and of high credit quality. The obligor's ability to pay is considered to be strong, but may be more vulnerable to adverse changes in economic conditions and circumstances than preferred stocks with higher ratings.
BBB: These preferred stocks are considered to be investment grade and of satisfactory credit quality. The obligor's ability to pay interest and repay principal is considered to be adequate. Adverse changes in economic
B-3
conditions and circumstances, however, are more likely to have adverse impact on these preferred stocks, and therefore, impair timely payment. The likelihood that the ratings of these preferred stocks will fall below investment grade is higher than for preferred stocks with higher ratings.
BB: These preferred stocks are considered speculative. The obligor's ability to pay may be affected over time by adverse economic changes. However, business and financial alternatives can be identified that could assist the obligor in satisfying its dividend payment requirements.
B: These preferred stocks are considered highly speculative. While preferred in this class are currently meeting dividend payment requirements, the probability of continued timely payment reflects the obligor's limited margin of safety and the need for reasonable business and economic activity throughout the life of the issue.
CCC: These preferred stocks have certain identifiable characteristics which, if not remedied, may lead to non-payment. The ability to meet obligations requires an advantageous business and economic environment.
CC: These preferred stocks are minimally protected. Non-payment seems probable over time.
C: These preferred stocks are in imminent non-payment.
DDD, DD AND D: These preferred stocks are in non-payment. Such preferred stocks are extremely speculative and should be valued on the basis of their ultimate recovery value in liquidation or reorganization of the obligor. DDD represents the highest potential for recovery and D represents the lowest potential for recovery.
PLUS (+) OR MINUS (-): The ratings from AA to C may be modified by the addition of a plus or minus sign to indicate the relative position of a credit within the rating category.
B-4

January 19, 2012
Supplement
SUPPLEMENT DATED JANUARY 19, 2012 TO THE STATEMENT OF
ADDITIONAL INFORMATION OF
MORGAN STANLEY INTERNATIONAL VALUE EQUITY FUND
Dated December 30, 2011
The first bullet point under the second paragraph under the section of the Fund's Statement of Additional Information entitled "II. Description of the Fund and Its Investments and Risks — D. Disclosure of Portfolio Holdings" is hereby deleted and replaced with the following:
• complete portfolio holdings information monthly, at least 15 calendar days after the end of each month; and
PLEASE RETAIN THIS SUPPLEMENT FOR FUTURE REFERENCE.
STATEMENT OF ADDITIONAL INFORMATION
Morgan Stanley
International Value
Equity Fund
| Share Class | | Ticker
Symbol | |
| Class A | | IVQAX | |
|
| Class B | | IVQBX | |
|
| Class C | | IVQCX | |
|
| Class I | | IVQDX | |
|
| Class R | | IVQRX | |
|
| Class W | | IVQWX | |
|
December 30, 2011
This Statement of Additional Information ("SAI") is not a prospectus. The Prospectus (dated December 30, 2011) for Morgan Stanley International Value Equity Fund may be obtained without charge from the Fund at its address or telephone number listed below.
The Fund's audited financial statements for the fiscal year ended August 31, 2011, including notes thereto, and the report of Ernst & Young LLP, are herein incorporated by reference from the Fund's Annual Report to Shareholders. A copy of the Fund's Annual Report to Shareholders must accompany the delivery of this SAI.
Morgan Stanley
International Value Equity Fund
522 Fifth Avenue
New York, NY 10036
(800) 869-NEWS
TABLE OF CONTENTS
| I. | | Fund History | | 4 | |
|
| II. | | Description of the Fund and Its Investments and Risks | | 4 | |
|
| | A. Classification | | 4 | |
|
| | B. Investment Strategies and Risks | | 4 | |
|
| | C. Fund Policies/Investment Restrictions | | 19 | |
|
| | D. Disclosure of Portfolio Holdings | | 20 | |
|
| III. | | Management of the Fund | | 24 | |
|
| | A. Board of Trustees | | 24 | |
|
| | B. Management Information | | 25 | |
|
| | C. Compensation | | 34 | |
|
| IV. | | Control Persons and Principal Holders of Securities | | 36 | |
|
| V. | | Investment Advisory and Other Services | | 36 | |
|
| | A. Adviser, Sub-Advisers and Administrator | | 36 | |
|
| | B. Principal Underwriter | | 37 | |
|
| | C. Services Provided by the Adviser, Sub-Advisers and Administrator | | 38 | |
|
| | D. Dealer Reallowances | | 39 | |
|
| | E. Rule 12b-1 Plans | | 39 | |
|
| | F. Other Service Providers | | 42 | |
|
| | G. Fund Management | | 43 | |
|
| | H. Codes of Ethics | | 44 | |
|
| | I. Proxy Voting Policy and Proxy Voting Record | | 44 | |
|
| | J. Revenue Sharing | | 45 | |
|
| VI. | | Brokerage Allocation and Other Practices | | 46 | |
|
| | A. Brokerage Transactions | | 46 | |
|
| | B. Commissions | | 47 | |
|
| | C. Brokerage Selection | | 47 | |
|
| | D. Regular Broker-Dealers | | 49 | |
|
| VII. | | Capital Stock and Other Securities | | 49 | |
|
| VIII. | | Purchase, Redemption and Pricing of Shares | | 50 | |
|
| | A. Purchase/Redemption of Shares | | 50 | |
|
| | B. Offering Price | | 51 | |
|
| IX. | | Taxation of the Fund and Shareholders | | 52 | |
|
| X. | | Underwriters | | 55 | |
|
| XI. | | Performance Data | | 55 | |
|
| XII. | | Financial Statements | | 56 | |
|
| XIII. | | Fund Counsel | | 56 | |
|
| | Appendix A — Proxy Voting Policy and Procedures | | A-1 | |
|
2
Glossary of Selected Defined Terms
The terms defined in this glossary are frequently used in this SAI (other terms used occasionally are defined in the text of the document).
"Administrator" or "Morgan Stanley Services" — Morgan Stanley Services Company Inc., a wholly-owned fund services subsidiary of the Adviser.
"Adviser" — Morgan Stanley Investment Management Inc., a wholly-owned investment adviser subsidiary of Morgan Stanley.
"Custodian" — State Street Bank and Trust Company.
"Distributor" — Morgan Stanley Distribution, Inc., a wholly-owned broker-dealer subsidiary of Morgan Stanley.
"Financial Advisors" — Morgan Stanley authorized financial services representatives.
"Fund" — Morgan Stanley International Value Equity Fund, a registered open-end investment company.
"Independent Trustees" — Trustees who are not "interested persons" (as defined by the Investment Company Act of 1940, as amended ("Investment Company Act")) of the Fund.
"Morgan Stanley & Co." — Morgan Stanley & Co. LLC, a wholly-owned broker-dealer subsidiary of Morgan Stanley.
"Morgan Stanley Funds" — Registered investment companies for which the Adviser serves as the investment adviser and that hold themselves out to investors as related companies for investment and investor services.
"Morgan Stanley Smith Barney" — Morgan Stanley Smith Barney LLC, a majority-owned broker dealer subsidiary of Morgan Stanley.
"Sub-Advisers" — Morgan Stanley Investment Management Limited and Morgan Stanley Investment Management Company, each a wholly-owned subsidiary of Morgan Stanley.
"Transfer Agent" — Morgan Stanley Services Company Inc., a wholly-owned transfer agent subsidiary of Morgan Stanley.
"Trustees" — The Board of Trustees of the Fund.
3
I. FUND HISTORY
The Fund was organized as a Massachusetts business trust, under a Declaration of Trust, on January 11, 2001, with the name Morgan Stanley Dean Witter International Equity Fund. Effective January 19, 2001, the Fund's name was changed to Morgan Stanley Dean Witter International Value Equity Fund. Effective June 18, 2001, the Fund's name was changed to Morgan Stanley International Value Equity Fund.
II. DESCRIPTION OF THE FUND AND ITS INVESTMENTS AND RISKS
A. Classification
The Fund is an open-end, diversified management investment company whose investment objective is to seek long-term capital appreciation.
B. Investment Strategies and Risks
The following discussion of the Fund's investment strategies and risks should be read with the sections of the Fund's Prospectus titled "Principal Investment Strategies," "Principal Risks" and "Additional Information About the Fund's Investment Objective, Strategies and Risks."
Derivatives. The Fund may, but is not required to, use various derivatives and related investment strategies as described below. Derivatives may be used for a variety of purposes including hedging, risk management, portfolio management or to earn income. Any or all of the investment techniques described herein may be used at any time and there is no particular strategy that dictates the use of one technique rather than another, as the use of any derivative by the Fund is a function of numerous variables, including market conditions. The Fund complies with applicable regulatory requirements when using derivatives, including the segregation or earmarking of cash or liquid assets when mandated by U.S. Securities and Exchange Commission ("SEC") rules or SEC staff positions. Although the Adviser and/or Sub-Advisers seeks to use derivatives to further the Fund's investment objective, no assurance can be given that the use of derivatives will achieve this result.
General Risks of Derivatives
Derivatives utilized by the Fund may involve the purchase and sale of derivative instruments. A derivative is a financial instrument the value of which depends upon (or derives from) the value of another asset, security, interest rate or index. Derivatives may relate to a wide variety of underlying instruments, including equity and debt securities, indexes, interest rates, currencies and other assets. Certain derivative instruments which the Fund may use and the risks of those instruments are described in further detail below. The Fund may in the future also utilize derivatives techniques, instruments and strategies that may be newly developed or permitted as a result of regulatory changes, consistent with the Fund's investment objective and policies. Such newly developed techniques, instruments and strategies may involve risks different than or in addition to those described herein. No assurance can be given that any derivatives strategy employed by the Fund will be successful.
The risks associated with the use of derivatives are different from, and possibly greater than, the risks associated with investing directly in the instruments underlying such derivatives. Derivatives are highly specialized instruments that require investment techniques and risk analyses different from other portfolio investments. The use of derivative instruments requires an understanding not only of the underlying instrument but also of the derivative itself. Certain risk factors generally applicable to derivative transactions are described below.
• Derivatives are subject to the risk that the market value of the derivative itself or the market value of underlying instruments will change in a way adverse to the Fund's interests. The Fund bears the risk that the Adviser and/or Sub-Advisers may incorrectly forecast future market trends and other financial or economic factors or the value of the underlying security, index, interest rate or currency when establishing a derivatives position for the Fund.
4
• Derivatives may be subject to pricing risk, which exists when a derivative becomes extraordinarily expensive (or inexpensive) relative to historical prices or corresponding instruments. Under such market conditions, it may not be economically feasible to initiate a transaction or liquidate a position at an advantageous time or price.
• Many derivatives are complex and often valued subjectively. Improper valuations can result in increased payment requirements to counterparties or a loss of value to the Fund.
• Using derivatives as a hedge against a portfolio investment subjects the Fund to the risk that the derivative will have imperfect correlation with the portfolio investment, which could result in the Fund incurring substantial losses. This correlation risk may be greater in the case of derivatives based on an index or other basket of securities, as the portfolio securities being hedged may not duplicate the components of the underlying index or the basket may not be of exactly the same type of obligation as those underlying the derivative. The use of derivatives for "cross hedging" purposes (using a derivative based on one instrument as a hedge for a different instrument) may also involve greater correlation risks.
• While using derivatives for hedging purposes can reduce the Fund's risk of loss, it may also limit the Fund's opportunity for gains or result in losses by offsetting or limiting the Fund's ability to participate in favorable price movements in portfolio investments.
• Derivatives transactions for non-hedging purposes involve greater risks and may result in losses which would not be offset by increases in the value of portfolio securities or declines in the cost of securities to be acquired. In the event that the Fund enters into a derivatives transaction as an alternative to purchasing or selling the underlying instrument or in order to obtain desired exposure to an index or market, the Fund will be exposed to the same risks as are incurred in purchasing or selling the underlying instruments directly.
• The use of certain derivatives transactions involves the risk of loss resulting from the insolvency or bankruptcy of the counterparty to the contract or the failure by the counterparty to make required payments or otherwise comply with the terms of the contract. In the event of default by a counterparty, the Fund may have contractual remedies pursuant to the agreements related to the transaction.
• Liquidity risk exists when a particular derivative is difficult to purchase or sell. If a derivative transaction is particularly large or if the relevant market is illiquid, the Fund may be unable to initiate a transaction or liquidate a position at an advantageous time or price.
• Certain derivatives transactions are not entered into or traded on exchanges or in markets regulated by the U.S. Commodity Futures Trading Commission ("CFTC") or the SEC. Instead, such over-the-counter ("OTC") derivatives are entered into directly by the Fund and a counterparty and may be traded only through financial institutions acting as market makers. OTC derivatives transactions can only be entered into with a willing counterparty that is approved by the Adviser and/or Sub-Advisers in accordance with guidelines established by the Board. Where no such counterparty is available, the Fund will be unable to enter into a desired OTC transaction. There also may be greater risk that no liquid secondary market in the trading of OTC derivatives will exist, in which case the Fund may be required to hold such instruments until exercise, expiration or maturity. Many of the protections afforded to exchange participants are not available to participants in OTC derivatives transactions. OTC derivatives transactions are not subject to the guarantee of an exchange or clearinghouse, and as a result the Fund would bear greater risk of default by the counterparties to such transactions.
• The Fund may be required to make physical delivery of portfolio securities underlying a derivative in order to close out a derivatives position or to sell portfolio securities at a time or price at which it may be disadvantageous to do so in order to obtain cash to close out or to maintain a derivatives position.
• As a result of the structure of certain derivatives, adverse changes in the value of the underlying instrument can result in losses substantially greater than the amount invested in the derivative
5
itself. Certain derivatives have the potential for unlimited loss, regardless of the size of the initial investment.
• Certain derivatives may be considered illiquid and therefore subject to the Fund's limitation on investments in illiquid securities.
• Derivatives transactions conducted outside the United States may not be conducted in the same manner as those entered into on U.S. exchanges, and may be subject to different margin, exercise, settlement or expiration procedures. Brokerage commissions, clearing costs and other transaction costs may be higher on foreign exchanges. Many of the risks of OTC derivatives transactions are also applicable to derivatives transactions conducted outside the United States. Derivatives transactions conducted outside the United States are subject to the risk of governmental action affecting the trading in, or the prices of, foreign securities, currencies and other instruments. The value of such positions could be adversely affected by foreign political and economic factors; lesser availability of data on which to make trading decisions; delays on the Fund's ability to act upon economic events occurring in foreign markets; and less liquidity than U.S. markets.
• Currency derivatives are subject to additional risks. Currency derivatives transactions may be negatively affected by government exchange controls, blockages, and manipulations. Currency exchange rates may be influenced by factors extrinsic to a country's economy. There is no systematic reporting of last sale information with respect to foreign currencies. As a result, the available information on which trading in currency derivatives will be based may not be as complete as comparable data for other transactions. Events could occur in the foreign currency market which will not be reflected in currency derivatives until the following day, making it more difficult for the Fund to respond to such events in a timely manner.
Options
An option is a contract that gives the holder of the option the right, but not the obligation, to buy from (in the case of a call option) or sell to (in the case of a put option) the seller of the option (the "option writer") the underlying security at a specified fixed price (the "exercise price") on or prior to a specified date (the "expiration date"). The buyer of the option pays to the option writer the option premium, which is the purchase price of the option.
Exchange-traded options are issued by a regulated intermediary such as the Options Clearing Corporation ("OCC"), which guarantees the performance of the obligations of the parties to such options. OTC options are purchased from or sold to counterparties through direct bilateral agreement between the Fund and its counterparties. Certain options, such as options on individual securities, may be settled through physical delivery of the underlying security, whereas other options, such as index options, are settled in cash in an amount based on the value of the underlying instrument multiplied by a specified multiplier.
Writing Options. The Fund may write call and put options. As the writer of a call option, the Fund receives the premium from the purchaser of the option and has the obligation, upon exercise of the option, to deliver the underlying security upon payment of the exercise price. If the option expires without being exercised the Fund is not required to deliver the underlying security but retains the premium received.
The Fund may only write call options that are "covered." A call option on a security is covered if (a) the Fund owns the security underlying the call or has an absolute and immediate right to acquire that security without additional cash consideration (or, if additional cash consideration is required, such amount is maintained by the Fund in segregated or earmarked cash or liquid assets) upon conversion or exchange of other securities held by the Fund; or (b) the Fund has purchased a call on the underlying security, the exercise price of which is (i) equal to or less than the exercise price of the call written, or (ii) greater than the exercise price of the call written, provided the difference is maintained by the Fund in segregated or earmarked cash or liquid assets.
Selling call options involves the risk that the Fund may be required to sell the underlying security at a disadvantageous price, below the market price of such security, at the time the option is exercised. As the writer of a covered call option, the Fund forgoes, during the option's life, the opportunity to profit from
6
increases in the market value of the underlying security covering the option above the sum of the premium and the exercise price but retains the risk of loss should the price of the underlying security decline.
The Fund may write put options. As the writer of a put option, the Fund receives the premium from the purchaser of the option and has the obligation, upon exercise of the option, to pay the exercise price and receive delivery of the underlying security. If the option expires without being exercised, the Fund is not required to receive the underlying security in exchange for the exercise price but retains the option premium.
The Fund may only write put options that are "covered." A put option on a security is covered if (a) the Fund segregates or earmarks cash or liquid assets equal to the exercise price; or (b) the Fund has purchased a put on the same security as the put written, the exercise price of which is (i) equal to or greater than the exercise price of the put written, or (ii) less than the exercise price of the put written, provided the difference is maintained by the Fund in segregated or earmarked cash or liquid assets.
Selling put options involves the risk that the Fund may be required to buy the underlying security at a disadvantageous price, above the market price of such security, at the time the option is exercised. While the Fund's potential gain in writing a covered put option is limited to the premium received plus the interest earned on the liquid assets covering the put option, the Fund's risks of loss is equal to the entire value of the underlying security, offset only by the amount of the premium received.
The Fund may close out an options position which it has written through a closing purchase transaction. The Fund would execute a closing purchase transaction with respect to a call option written by purchasing a call option on the same underlying security and having the same exercise price and expiration date as the call option written by the Fund. The Fund would execute a closing purchase transaction with respect to a put option written by purchasing a put option on the same underlying security and having the same exercise price and expiration date as the put option written by the Fund. A closing purchase transaction may or may not result in a profit to a Fund. The Fund could close out its position as an option writer only if a liquid market exists for options on the same underlying security and having the same exercise date as the option written by the Fund. There is no assurance that such a market will exist with respect to any particular option.
The writer of an option generally has no control over the time when the option is exercised, and the option writer is required to deliver or acquire the underlying security. Once an option writer has received an exercise notice, it cannot effect a closing purchase transaction in order to terminate its obligation under the option. Thus, the use of options may require the Fund to buy or sell portfolio securities at inopportune times or for prices other than the current market values of such securities, may limit the amount of appreciation the Fund can realize on an investment, or may cause the Fund to hold a security that it might otherwise sell.
Purchasing Options. The Fund may purchase call and put options. As the buyer of a call option, the Fund pays the premium to the option writer and has the right to purchase the underlying security from the option writer at the exercise price. If the market price of the underlying security rises above the exercise price, the Fund could exercise the option and acquire the underlying security at a below-market price, which could result in a gain to the Fund, minus the premium paid. As the buyer of a put option, the Fund pays the premium to the option writer and has the right to sell the underlying security to the option writer at the exercise price. If the market price of the underlying security declines below the exercise price, the Fund could exercise the option and sell the underlying security at an above-market price, which could result in a gain to the Fund, minus the premium paid. The Fund may buy call and put options whether or not it holds the underlying securities.
As a buyer of a call or put option, the Fund may sell put or call options that it has purchased at any time prior to such option's expiration date through a closing sale transaction. The principal factors affecting the market value of a put or a call option include supply and demand, interest rates, the current market price of the underlying security in relation to the exercise price of the option, the volatility of the underlying security, the underlying security's dividend policy, and the time remaining until the expiration date. A closing sale transaction may or may not result in a profit to the Fund. The Fund's ability to initiate a closing sale transaction is dependent upon the liquidity of the options market and there is no assurance that such a
7
market will exist with respect to any particular option. If the Fund does not exercise or sell an option prior to its expiration date, the option expires and becomes worthless.
OTC Options. Unlike exchange-traded options, which are standardized with respect to the underlying instrument, expiration date, contract size and strike price, the terms of OTC options generally are established through negotiation between the parties to the options contract. This type of arrangement allows the purchaser and writer greater flexibility to tailor the option to their needs. OTC options are available for a greater variety of securities or baskets of securities, and in a wider range of expiration dates and exercise prices than exchange-traded options. However, unlike exchange-traded options, which are issued and guaranteed by a regulated intermediary, such as the OCC, OTC options are entered into directly with the counterparty. Unless the counterparties provide for it, there is no central clearing or guaranty function for an OTC option. Therefore, OTC options are subject to the risk of default or non-performance by the counterparty. Accordingly, the Adviser and/or Sub-Advisers must assess the creditworthiness of the counterparty to determine the likelihood that the terms of the option will be satisfied. There can be no assurance that a continuous liquid secondary market will exist for any particular OTC option at any specific time. As a result, the Fund may be unable to enter into closing sale transactions with respect to OTC options.
Index Options. Call and put options on indices operate similarly to options on securities. Rather than the right to buy or sell a single security at a specified price, options on an index give the holder the right to receive, upon exercise of the option, an amount of cash determined by reference to the value of the underlying index. The underlying index may be a broad-based index or a narrower market index. Unlike options on securities, all settlements are in cash. The settlement amount, which the writer of a index option must pay to the holder of the option upon exercise, is generally equal to the difference between the fixed exercise price of the option and the value of the underlying index, multiplied by a specified multiplier. The multiplier determines the size of the investment position the option represents. Gain or loss to the Fund on index options transactions will depend on price movements in the underlying securities market generally or in a particular segment of the market rather than price movements of individual securities. As with other options, the Fund may close out its position in index options through closing purchase transactions and closing sale transactions provided that a liquid secondary market exists for such options.
Index options written by the Fund will generally be covered in a manner similar to the covering of other types of options, by holding an offsetting financial position and/or segregating or earmarking cash or liquid assets. The Fund may cover call options written on an index by owning securities whose price changes, in the opinion of the Adviser and/or Sub-Advisers, are expected to correlate to those of the underlying index.
Additional Risks of Options Transactions. The risks associated with options transactions are different from, and possibly greater than, the risks associated with investing directly in the underlying instruments. Options are highly specialized instruments that require investment techniques and risk analyses different from those associated with other portfolio investments. The use of options requires an understanding not only of the underlying instrument but also of the option itself. Options may be subject to the risk factors generally applicable to derivatives transactions described herein, and may also be subject to certain additional risk factors, including:
• The exercise of options written or purchased by the Fund could cause the Fund to sell portfolio securities, thus increasing the Fund's portfolio turnover.
• The Fund pays brokerage commissions each time it writes or purchases an option or buys or sells an underlying security in connection with the exercise of an option. Such brokerage commissions could be higher relative to the commissions for direct purchases of sales of the underlying securities.
• The Fund's options transactions may be limited by limitations on options positions established by the SEC, CFTC or the exchanges on which such options are traded.
• The hours of trading for exchange-listed options may not coincide with the hours during which the underlying securities are traded. To the extent that the options markets close before the markets
8
for the underlying securities, significant price and rate movements can take place in the underlying securities that cannot be reflected in the options markets.
• Index options based upon a narrower index of securities may present greater risks than options based on broad market indexes, as narrower indexes are more susceptible to rapid and extreme fluctuations as a result of changes in the values of a smaller number of securities.
• The Fund is subject to the risk of market movements between the time that an option is exercised and the time of performance thereunder, which could increase the extent of any losses suffered by the Fund in connection with options transactions.
Futures Contracts
A futures contract is a standardized agreement to buy or sell a specific quantity of a commodity at a specific price at a specific future time (the "settlement date"). Futures contracts may be based on, among other things, a specified equity security (securities futures), a specified debt security or reference rate (interest rate futures), the value of a specified securities index (index futures) or the value of a foreign currency (forward contracts and currency futures). The value of a futures contract tends to increase and decrease in tandem with the value of the underlying instrument. The buyer of a futures contract agrees to purchase the underlying instrument on the settlement date and is said to be "long" the contract. The seller of a futures contract agrees to sell the underlying instrument on the settlement date and is said to be "short" the contract. Futures contracts call for settlement only on the expiration date and cannot be "exercised" at any other time during their term.
Depending on the terms of the particular contract, futures contracts are settled through either physical delivery of the underlying instrument on the settlement date (such as in the case of securities futures based on a specified debt security) or by payment of a cash settlement amount on the settlement date (such as in the case of futures contracts relating to interest rates, foreign currencies and broad-based securities indexes). In the case of cash-settled futures contracts, the settlement amount is equal to the difference between the reference instrument's price on the last trading day of the contract and the reference instrument's price at the time the contract was entered into. Most futures contracts, particularly futures contracts requiring physical delivery, are not held until the settlement date, but instead are offset before the settlement date through the establishment of an opposite and equal futures position (buying a contract that had been sold, or selling a contract that had been purchased). All futures transactions are effected through a clearinghouse associated with the exchange on which the futures are traded.
The buyer and seller of a futures contract are not required to deliver or pay for the underlying commodity unless the contract is held until the settlement date. However, both the buyer and seller are required to deposit "initial margin" with a futures commission merchant when the futures contract is entered into. Initial margin deposits are typically calculated as a percentage of the contract's market value. If the value of either party's position declines, the party will be required to make additional "variation margin" payments to settle the change in value on a daily basis. The process is known as "marking-to-market." Upon the closing of a futures position through the establishment of an offsetting position, a final determination of variation margin will be made and additional cash will be paid by or released to the Fund.
In addition, the Fund may be required to maintain segregated cash or liquid assets in order to cover futures transactions. The Fund will segregate or earmark cash or liquid assets in an amount equal to the difference between the market value of a futures contract entered into by the Fund and the aggregate value of the initial and variation margin payments made by the Fund with respect to such contract or as otherwise permitted by SEC rules or SEC staff positions. See "Regulatory Matters" below.
Currency Forward Contracts and Currency Futures. A forward foreign currency contract is a negotiated agreement between two parties to exchange specified amounts of two or more currencies at a specified future time at a specified rate. The rate specified by the forward contract can be higher or lower than the spot rate between the currencies that are the subject of the contract. Currency futures are similar to currency forward contracts, except that they are traded on an exchange and standardized as to contract size and delivery date. Most currency futures call for payment or delivery in U.S. dollars. Unanticipated changes in currency prices may result in losses to the Fund and poorer overall performance for the Fund than if it had not entered into currency forward or futures contracts. The Fund may enter into a forward or
9
futures contract under various circumstances. The typical use of a forward or futures contract is to "lock in" the price of a security in U.S. dollars or some other foreign currency, which the Fund is holding in its portfolio. By entering into a forward or futures contract for the purchase or sale, for a fixed amount of dollars or other currency, of the amount of foreign currency involved in the underlying security transactions, the Fund may be able to protect itself against a possible loss resulting from an adverse change in the relationship between the U.S. dollar or other currency which is being used for the security purchase and the foreign currency in which the security is denominated during the period between the date on which the security is purchased or sold and the date on which payment is made or received. The Adviser and/or Sub-Advisers also may from time to time utilize forward or futures contracts for other purposes. For example, they may be used to hedge a foreign security held in the portfolio or a security which pays out principal tied to an exchange rate between the U.S. dollar and a foreign currency, against a decline in value of the applicable foreign currency. They also may be used to lock in the current exchange rate of the currency in which those securities anticipated to be purchased are denominated. At times, the Fund may enter into "cross-currency" hedging transactions involving currencies other than those in which securities are held or proposed to be purchased are denominated.
The Fund will not enter into forward or futures contracts or maintain a net exposure to these contracts where the consummation of the contracts would obligate the Fund to deliver an amount of foreign currency in excess of the value of the Fund's portfolio securities.
When required by law, the Fund will segregate or earmark cash, U.S. government securities or other appropriate liquid portfolio securities in an amount equal to the value of the Fund's total assets committed to the consummation of forward or futures contracts entered into under the circumstances set forth above. If the value of the securities so earmarked declines, additional cash or securities will be segregated or earmarked on a daily basis so that the value of such securities will equal the amount of the Fund's commitments with respect to such contracts.
The Fund may be limited in its ability to enter into hedging transactions involving forward or futures contracts by the Internal Revenue Code of 1986, as amended (the "Code"), requirements relating to qualification as a regulated investment company.
Forward and futures contracts may limit gains on portfolio securities that could otherwise be realized had they not been utilized and could result in losses. The contracts also may increase the Fund's volatility and may involve a significant amount of risk relative to the investment of cash.
Options on Futures Contracts. Options on futures contracts are similar to options on securities except that options on futures contracts give the purchasers the right, in return for the premium paid, to assume a position in a futures contract (a long position in the case of a call option and a short position in the case of a put option) at a specified exercise price at any time prior to the expiration of the option. Upon exercise of the option, the parties will be subject to all of the risks associated with futures transactions and subject to margin requirements. As the writer of options on futures contracts, the Fund would also be subject to initial and variation margin requirements on the option position.
Options on futures contracts written by the Fund will generally be covered in a manner similar to the covering of other types of options, by holding an offsetting financial position and/or segregating or earmarking cash or liquid assets. The Fund may cover an option on a futures contract by purchasing or selling the underlying futures contract. In such instances the exercise of the option will serve to close out the Fund's futures position.
Additional Risk of Futures Transactions. The risks associated with futures contract transactions are different from, and possibly greater than, the risks associated with investing directly in the underlying instruments. Futures are highly specialized instruments that require investment techniques and risk analyses different from those associated with other portfolio investments. The use of futures requires an understanding not only of the underlying instrument but also of the futures contract itself. Futures may be
10
subject to the risk factors generally applicable to derivatives transactions described herein, and may also be subject to certain additional risk factors, including:
• The risk of loss in buying and selling futures contracts can be substantial. Small price movements in the commodity underlying a futures position may result in immediate and substantial loss (or gain) to the Fund.
• Buying and selling futures contracts may result in losses in excess of the amount invested in the position in the form of initial margin. In the event of adverse price movements in the underlying commodity, security, index, currency or instrument, the Fund would be required to make daily cash payments to maintain its required margin. The Fund may be required to sell portfolio securities, or make or take delivery of the underlying securities in order to meet daily margin requirements at a time when it may be disadvantageous to do so. The Fund could lose margin payments deposited with a futures commission merchant if the futures commission merchant breaches its agreement with the Fund, becomes insolvent or declares bankruptcy.
• Most exchanges limit the amount of fluctuation permitted in futures contract prices during any single trading day. Once the daily limit has been reached in a particular futures contract, no trades may be made on that day at prices beyond that limit. If futures contract prices were to move to the daily limit for several trading days with little or no trading, the Fund could be prevented from prompt liquidation of a futures position and subject to substantial losses. The daily limit governs only price movements during a single trading day and therefore does not limit the Fund's potential losses.
• Index futures based upon a narrower index of securities may present greater risks than futures based on broad market indexes, as narrower indexes are more susceptible to rapid and extreme fluctuations as a result of changes in value of a small number of securities.
Combined Transactions
Combined transactions involve entering into multiple derivatives transactions (such as multiple options transactions, including purchasing and writing options in combination with each other; multiple futures transactions; and combinations of options, futures, forward and swap transactions) instead of a single derivatives transaction in order to customize the risk and return characteristics of the overall position. Combined transactions typically contain elements of risk that are present in each of the component transactions. The Fund may enter into a combined transaction instead of a single derivatives transaction when, in the opinion of the Adviser and/or Sub-Advisers, it is in the best interest of the Fund to do so. Because combined transactions involve multiple transactions, they may result in higher transaction costs and may be more difficult to close out.
Regulatory Matters
As described herein, the Fund may be required to cover its potential economic exposure to certain derivatives transactions by holding an offsetting financial position and/or segregating or earmarking cash or liquid assets equal in value to the Fund's potential economic exposure under the transaction. The Fund will cover such transactions as described herein or in such other manner in accordance with applicable laws and regulations. Assets used to cover derivatives transactions cannot be sold while the derivatives position is open, unless they are replaced by other appropriate assets. Segregated or earmarked cash or liquid assets and assets held in margin accounts are not otherwise available to the Fund for investment purposes. If a large portion of the Fund's assets are used to cover derivatives transactions or are otherwise segregated or earmarked, it could affect portfolio management or the Fund's ability to meet redemption requests or other current obligations. With respect to derivatives which are cash settled (i.e., have no physical delivery requirement), the Fund is permitted to set aside liquid assets in an amount equal to the Fund's daily marked-to-market net obligations (i.e., the Fund's daily net liability) under the derivative, if any, rather than the derivative's full notional value or the market value of the instrument underlying the derivative, as applicable. By setting aside assets equal to only its net obligations under cash-settled derivatives, the Fund will have the ability to employ leverage to a greater extent than if the Fund were required to segregate assets equal to the full notional amount of the derivative or the market value of the underlying instrument, as applicable.
11
Regulatory developments affecting the exchange-traded and OTC derivatives markets may impair the Fund's ability to manage or hedge its investment portfolio through the use of derivatives. The Dodd-Frank Wall Street Reform and Consumer Protection Act (the "Dodd-Frank Act") and the rules promulgated thereunder may limit the ability of the Fund to enter into one or more exchange-traded or OTC derivatives transactions. In particular, pursuant to authority granted under the Dodd-Frank Act, the CFTC in October 2011 promulgated final rules that impose new federal position limits on listed futures and options contracts on, and economically equivalent OTC derivatives referencing, 28 individual agricultural, metal and energy commodities. A Fund's futures and options positions in these 28 contracts will be aggregated with its positions, if any, in economically equivalent OTC derivatives referencing these contracts. These new position limits, which will be imposed on the Fund and its counterparties, may impact the Fund's ability to invest in futures, options and swaps in a manner that efficiently meets its investment objective. Derivatives positions of all investment companies advised by the Adviser and Sub-Advisers are combined for purposes of these limits. An exchange may order the liquidation of positions found to be in excess of these limits and may impose certain other sanctions or restrictions.
The Fund's use of derivatives may be limited by the requirements of the Code, for qualification as a regulated investment company for U.S. federal income tax purposes.
The CFTC eliminated limitations on futures trading by certain regulated entities, including registered investment companies, and consequently registered investment companies may engage in unlimited futures transactions and options thereon provided that the investment adviser to the company claims an exclusion from regulation as a commodity pool operator. In connection with its management of the Fund, the Adviser has claimed such an exclusion from registration as a commodity pool operator under the Commodity Exchange Act ("CEA"). Therefore, it is not subject to the registration and regulatory requirements of the CEA. Therefore, there are no limitations on the extent to which the Fund may engage in non-hedging transactions involving futures and options thereon except as set forth in the Fund's Prospectus or SAI . There is no overall limitation on the percentage of the Fund's net assets which may be subject to a hedge position.
Money Market Securities. In addition to the money market securities in which the Fund may otherwise invest, the Fund may invest in various money market securities for cash management purposes or when assuming a temporary defensive position, which among others may include commercial paper, bankers' acceptances, bank obligations, corporate debt securities, certificates of deposit, U.S. government securities, obligations of savings institutions and repurchase agreements. Such securities are limited to:
U.S. Government Securities. Obligations issued or guaranteed as to principal and interest by the United States or its agencies (such as the Export-Import Bank of the United States, Federal Housing Administration and Government National Mortgage Association) or its instrumentalities (such as the Federal Home Loan Bank), including Treasury bills, notes and bonds;
Bank Obligations. Obligations (including certificates of deposit, time deposits and bankers' acceptances) of banks subject to regulation by the U.S. Government and having total assets of $1 billion or more, and instruments secured by such obligations, not including obligations of foreign branches of domestic banks except to the extent below;
Eurodollar Certificates of Deposit. Eurodollar certificates of deposit issued by foreign branches of domestic banks having total assets of $1 billion or more;
Obligations of Savings Institutions. Certificates of deposit of savings banks and savings and loan associations, having total assets of $1 billion or more;
Fully Insured Certificates of Deposit. Certificates of deposit of banks and savings institutions, having total assets of less than $1 billion, if the principal amount of the obligation is federally insured by the Bank Insurance Fund or the Savings Association Insurance Fund (each of which is administered by the FDIC), limited to $250,000 principal amount per certificate (a temporary increase from $100,000, which is due to expire on December 31, 2013) and to 15% or less of the Fund's total assets in all such obligations and in all illiquid assets, in the aggregate;
12
Commercial Paper. Commercial paper rated within the two highest grades by Standard & Poor's Rating Group, a division of The McGraw-Hill Companies, Inc. ("S&P"), or by Moody's Investors Service, Inc. ("Moody's") or, if not rated, issued by a company having an outstanding debt issue rated at least AA by S&P or Aa by Moody's; and
Repurchase Agreements. The Fund may invest in repurchase agreements. When cash may be available for only a few days, it may be invested by the Fund in repurchase agreements until such time as it may otherwise be invested or used for payments of obligations of the Fund. These agreements typically involve the acquisition by the Fund of debt securities from a selling financial institution such as a bank, savings and loan association or broker-dealer. The agreement provides that the Fund will sell back to the institution, and that the institution will repurchase, the underlying security serving as collateral at a specified price and at a fixed time in the future, usually not more than seven days from the date of purchase. The collateral will be marked-to-market daily to determine that the value of the collateral, as specified in the agreement, does not decrease below the purchase price plus accrued interest. If such decrease occurs, additional collateral will be requested and, when received, added to the account to maintain full collateralization. The Fund will accrue interest from the institution until the time when the repurchase is to occur. Although this date is deemed by the Fund to be the maturity date of a repurchase agreement, the maturities of securities subject to repurchase agreements are not subject to any limits.
While repurchase agreements involve certain risks not associated with direct investments in debt securities, the Fund follows procedures approved by the Trustees that are designed to minimize such risks. These procedures include effecting repurchase transactions only with large, well-capitalized and well-established financial institutions whose financial condition will be continually monitored by the Adviser and/or Sub-Advisers. In addition, as described above, the value of the collateral underlying the repurchase agreement will be at least equal to the repurchase price, including any accrued interest earned on the repurchase agreement. In the event of a default or bankruptcy by a selling financial institution, the Fund will seek to liquidate such collateral. However, the exercising of the Fund's right to liquidate such collateral could involve certain costs or delays and, to the extent that proceeds from any sale upon a default of the obligation to repurchase were less than the repurchase price, the Fund could suffer a loss. It is the current policy of the Fund not to invest in repurchase agreements that do not mature within seven days if any such investment, together with any other illiquid assets held by the Fund, amounts to more than 15% of its net assets.
Zero Coupon Securities. A portion of the fixed-income securities purchased by the Fund may be "zero coupon" securities. Such securities are purchased at a discount from their face amount, giving the purchaser the right to receive their full value at maturity. A zero-coupon security pays no interest to its holder during its life. Its value to an investor consists of the difference between its face value at the time of maturity and the price for which it was acquired, which is generally an amount significantly less than its face value (sometimes referred to as a "deep discount" price). The interest earned on such securities is, implicitly, automatically compounded and paid out at maturity. While such compounding at a constant rate eliminates the risk of receiving lower yields upon reinvestment of interest if prevailing interest rates decline, the owner of a zero coupon security will be unable to participate in higher yields upon reinvestment of interest received on interest-paying securities if prevailing interest rates rise. For this reason, zero coupon securities are subject to substantially greater market price fluctuations during periods of changing prevailing interest rates than are comparable debt securities which make current distributions of interest.
Therefore, to the extent the Fund invests in zero coupon securities, it will not receive current cash available for distribution to shareholders. In addition, zero coupon securities are subject to substantially greater price fluctuations during periods of changing prevailing interest rates than are comparable securities which pay interest on a current basis. Current federal tax law requires that a holder (such as the Fund) of a zero coupon security accrue a portion of the discount at which the security was purchased as income each year even though the Fund receives no interest payments in cash on the security during the year.
Loans of Portfolio Securities. The Fund may lend its portfolio securities to brokers, dealers, banks and other institutional investors. By lending its portfolio securities, the Fund attempts to increase its net investment income through the receipt of interest on the cash collateral with respect to the loan or fees
13
received from the borrower in connection with the loan. Any gain or loss in the market price of the securities loaned that might occur during the term of the loan would be for the account of the Fund. The Fund employs an agent to implement the securities lending program and the agent receives a fee from the Fund for its services. The Fund will not lend more than 331/3% of the value of its total assets.
The Fund may lend its portfolio securities so long as the terms, structure and the aggregate amount of such loans are not inconsistent with the Investment Company Act or the rules and regulations or interpretations of the SEC thereunder, which currently require that (i) the borrower pledge and maintain with the Fund collateral consisting of liquid, unencumbered assets having a value at all times not less than 100% of the value of the securities loaned; (ii) the borrower add to such collateral whenever the price of the securities loaned rises (i.e., the borrower "marks to market" on a daily basis); (iii) the loan be made subject to termination by the Fund at any time; and (iv) the Fund receives a reasonable return on the loan (which may include the Fund investing any cash collateral in interest bearing short-term investments), any distributions on the loaned securities and any increase in their market value. In addition, voting rights may pass with the loaned securities, but the Fund will retain the right to call any security in anticipation of a vote that the Adviser deems material to the security on loan.
There may be risks of delay and costs involved in recovery of securities or even loss of rights in the collateral should the borrower of the securities fail financially. These delays and costs could be greater for foreign securities. However, loans will be made only to borrowers deemed by the Adviser to be creditworthy and when, in the judgment of the Adviser, the income which can be earned from such securities loans justifies the attendant risk. All relevant facts and circumstances, including the creditworthiness of the broker, dealer, bank or institution, will be considered in making decisions with respect to the lending of securities, subject to review by the Fund's Board of Trustees. The Fund also bears the risk that the reinvestment of collateral will result in a principal loss. Finally, there is the risk that the price of the securities will increase while they are on loan and the collateral will not be adequate to cover their value.
Borrowing. The Fund has an operating policy, which may be changed by the Fund's Board of Trustees, not to borrow except from a bank for temporary or emergency purposes in amounts not exceeding 5% (taken at the lower of cost or current value) of its total assets (not including the amount borrowed). Should the Board of Trustees remove this operating policy, the Fund would be permitted to borrow money from banks in accordance with the Investment Company Act or the rules and regulations promulgated by the SEC thereunder. Currently, the Investment Company Act permits a fund to borrow money from banks in an amount up to 331/3% of its total assets (including the amount borrowed) less its liabilities (not including any borrowings but including the fair market value at the time of computation of any other senior securities then outstanding). The Fund may also borrow an additional 5% of its total assets without regard to the foregoing limitation for temporary purposes such as clearance of portfolio transactions. The Fund will only borrow when the Adviser believes that such borrowings will benefit the Fund after taking into account considerations such as interest income and possible gains or losses upon liquidation. The Fund will maintain asset coverage in accordance with the Investment Company Act.
Borrowing by the Fund creates an opportunity for increased net income but, at the same time, creates special risks. For example, leveraging may exaggerate changes in and increase the volatility of the net asset value of Fund shares. This is because leverage tends to exaggerate the effect of any increase or decrease in the value of the Fund's portfolio securities. The use of leverage also may cause the Fund to liquidate portfolio positions when it may not be advantageous to do so to satisfy its obligations or to maintain asset coverage.
In general, the Fund may not issue any class of senior security, except that the Fund may (i) borrow from banks, provided that immediately following any such borrowing there is an asset coverage of at least 300% for all Fund borrowings and in the event such asset coverage falls below 300% the Fund will within three days or such longer period as the SEC may prescribe by rules and regulations, reduce the amount of its borrowings to an extent that the asset coverage of such borrowings shall be at least 300%, and (ii) engage in trading practices which could be deemed to involve the issuance of a senior security, including but not limited to options, futures, forward contracts and reverse repurchase agreements, provided that the Fund earmarks or segregates liquid assets in accordance with applicable SEC regulations and interpretations.
14
When-Issued and Delayed Delivery Securities and Forward Commitments. From time to time, the Fund may purchase securities on a when-issued or delayed delivery basis or may purchase or sell securities on a forward commitment basis. When these transactions are negotiated, the price is fixed at the time of the commitment, but delivery and payment can take place a month or more after the date of commitment. While the Fund will only purchase securities on a when-issued, delayed delivery or forward commitment basis with the intention of acquiring the securities, the Fund may sell the securities before the settlement date, if it is deemed advisable. The securities so purchased or sold are subject to market fluctuation and no interest or dividends accrue to the purchaser prior to the settlement date.
At the time the Fund makes the commitment to purchase or sell securities on a when-issued, delayed delivery or forward commitment basis, it will record the transaction and thereafter reflect the value, each day, of such security purchased, or if a sale, the proceeds to be received, in determining its net asset value. At the time of delivery of the securities, their value may be more or less than the purchase or sale price. An increase in the percentage of the Fund's assets committed to the purchase of securities on a when-issued, delayed delivery or forward commitment basis may increase the volatility of its net asset value. The Fund will also earmark cash or liquid assets or establish a segregated account on the Fund's books in which it will continually maintain cash or cash equivalents or other liquid portfolio securities equal in value to commitments to purchase securities on a when-issued, delayed delivery or forward commitment basis.
When, As and If Issued Securities. The Fund may purchase securities on a "when, as and if issued" basis, under which the issuance of the security depends upon the occurrence of a subsequent event, such as approval of a merger, corporate reorganization or debt restructuring. The commitment for the purchase of any such security will not be recognized in the portfolio of the Fund until the Adviser and/or Sub-Advisers determines that issuance of the security is probable. At that time, the Fund will record the transaction and, in determining its net asset value, will reflect the value of the security daily. At that time, the Fund will also earmark cash or liquid assets or establish a segregated account on the Fund's books in which it will maintain cash, cash equivalents, or other liquid portfolio securities equal in value to recognized commitments for such securities.
An increase in the percentage of the Fund's assets committed to the purchase of securities on a "when, as and if issued" basis may increase the volatility of its net asset value. The Fund may also sell securities on a "when, as and if issued" basis provided that the issuance of the security will result automatically from the exchange or conversion of a security owned by the Fund at the time of sale.
Private Placements and Restricted Securities. The Fund may invest up to 15% of its net assets in securities which are subject to restrictions on resale because they have not been registered under the Securities Act of 1933, as amended (the "Securities Act"), or which are otherwise not readily marketable. (Securities eligible for resale pursuant to Rule 144A under the Securities Act, and determined to be liquid pursuant to the procedures discussed in the following paragraph, are not subject to the foregoing restriction.) These securities are generally referred to as private placements or restricted securities. Limitations on the resale of these securities may have an adverse effect on their marketability, and may prevent the Fund from disposing of them promptly at reasonable prices. The Fund may have to bear the expense of registering the securities for resale and the risk of substantial delays in effecting the registration.
Rule 144A permits the Fund to sell restricted securities to qualified institutional buyers without limitation. The Adviser and/or Sub-Advisers, pursuant to procedures adopted by the Trustees, will make a determination as to the liquidity of each restricted security purchased by the Fund. If a restricted security is determined to be "liquid," the security will not be included within the category "illiquid securities," which may not exceed 15% of the Fund's net assets. However, investing in Rule 144A securities could have the effect of increasing the level of Fund illiquidity to the extent the Fund, at a particular point in time, may be unable to find qualified institutional buyers interested in purchasing such securities.
Private Investments in Public Equity. The Fund may purchase equity securities in a private placement that are issued by issuers who have outstanding, publicly-traded equity securities of the same class ("private investments in public equity" or "PIPES"). Shares in PIPES generally are not registered with the SEC until after a certain time period from the date the private sale is completed. This restricted period can
15
last many months. Until the public registration process is completed, PIPES are restricted as to resale and the Fund cannot freely trade the securities. Generally, such restrictions cause the PIPES to be illiquid during this time. PIPES may contain provisions that the issuer will pay specified financial penalties to the holder if the issuer does not publicly register the restricted equity securities within a specified period of time, but there is no assurance that the restricted equity securities will be publicly registered, or that the registration will remain in effect.
Limited Partnerships. A limited partnership interest entitles the Fund to participate in the investment return of the partnership's assets as defined by the agreement among the partners. As a limited partner, the Fund generally is not permitted to participate in the management of the partnership. However, unlike a general partner whose liability is not limited, a limited partner's liability generally is limited to the amount of its commitment to the partnership.
Convertible Securities. The Fund may invest in securities which are convertible into common stock or other securities of the same or a different issuer or into cash within a particular period of time at a specified price or formula. Convertible securities are generally fixed-income securities (but may include preferred stock) and generally rank senior to common stocks in a corporation's capital structure and, therefore, entail less risk than the corporation's common stock. The value of a convertible security is a function of its "investment value" (its value as if it did not have a conversion privilege), and its "conversion value" (the security's worth if it were to be exchanged for the underlying security, at market value, pursuant to its conversion privilege).
To the extent that a convertible security's investment value is greater than its conversion value, its price will be primarily a reflection of such investment value and its price will be likely to increase when interest rates fall and decrease when interest rates rise, as with a fixed-income security (the credit standing of the issuer and other factors may also have an effect on the convertible security's value). If the conversion value exceeds the investment value, the price of the convertible security will rise above its investment value and, in addition, will sell at some premium over its conversion value. (This premium represents the price investors are willing to pay for the privilege of purchasing a fixed-income security with a possibility of capital appreciation due to the conversion privilege.) At such times the price of the convertible security will tend to fluctuate directly with the price of the underlying equity security. Convertible securities may be purchased by the Fund at varying price levels above their investment values and/or their conversion values in keeping with the Fund's objective.
Up to 5% of the Fund's net assets may be invested in convertible securities that are below investment grade. Debt securities rated below investment grade are commonly known as "junk bonds." Although the Fund selects these securities primarily on the basis of their equity characteristics, investors should be aware that convertible securities rated in these categories are considered high risk securities; the rating agencies consider them speculative with respect to the issuer's continuing ability to make timely payments of interest and principal. Thus, to the extent that such convertible securities are acquired by the Fund, there is a greater risk as to the timely repayment of the principal of, and timely payment of interest or dividends on, such securities than in the case of higher-rated convertible securities.
Foreign Investment. Investing in foreign securities involves certain special considerations which are not typically associated with investments in the securities of U.S. issuers. Foreign issuers are not generally subject to uniform accounting, auditing and financial reporting standards and may have policies that are not comparable to those of domestic issuers. As a result, there may be less information available about foreign issuers than about domestic issuers. Securities of some foreign issuers may be less liquid and more volatile than securities of comparable domestic issuers. There is generally less government supervision and regulation of stock exchanges, brokers and listed issuers than in the United States. In addition, with respect to certain foreign countries, there is a possibility of expropriation or confiscatory taxation, political and social instability, or diplomatic development which could affect U.S. investments in those countries. The costs of investing in foreign countries frequently are higher than the costs of investing in the United States. Although the Adviser and Sub-Advisers endeavor to achieve the most favorable execution costs in portfolio transactions, fixed commissions on many foreign stock exchanges are generally higher than negotiated commissions on U.S. exchanges.
16
Investments in securities of foreign issuers may be denominated in foreign currencies. Accordingly, the value of the Fund's assets, as measured in U.S. dollars, may be affected favorably or unfavorably by changes in currency exchange rates and in exchange control regulations. The Fund may incur costs in connection with conversions between various currencies.
Certain foreign governments levy withholding or other taxes on dividend and interest income. Although in some countries a portion of these taxes are recoverable, the non-recovered portion of foreign withholding taxes will reduce the income received from investments in such countries.
The Adviser and/or Sub-Advisers may consider an issuer to be from a particular country or geographic region if (i) its principal securities trading market is in that country or geographic region; (ii) alone or on a consolidated basis it derives 50% or more of its annual revenue from goods produced, sales made or services performed in that country or geographic region; or (iii) it is organized under the laws of, or has a principal office in, that country or geographic region. By applying these tests, it is possible that a particular issuer could be deemed to be from more than one country or geographic region.
Emerging Market Securities. An emerging market security is one issued by a foreign government or private issuer that has one or more of the following characteristics: (i) its principal securities trading market is in an emerging market or developing country, (ii) alone or on a consolidated basis it derives 50% or more of its annual revenue from goods produced, sales made or services performed in emerging markets or (iii) it is organized under the laws of, or has a principal office in, an emerging market or developing country. Based on these criteria it is possible for a security to be considered issued by an issuer in more than one country. Therefore, it is possible for the securities of any issuer that has one or more of these characteristics in connection with any emerging market or developing country not to be considered an emerging market security if it has one or more of these characteristics in connection with a developed country.
Emerging market describes any country which is generally considered to be an emerging or developing country by major organizations in the international financial community, such as the International Bank for Reconstruction and Development (more commonly known as the World Bank) and the International Finance Corporation. Emerging markets can include every nation in the world except the United States, Canada, Japan, Australia, New Zealand and most nations located in Western Europe.
The economies of individual emerging market or developing countries may differ favorably or unfavorably from the U.S. economy in such respects as growth of gross domestic product, rate of inflation, currency depreciation, capital reinvestment, resource self-sufficiency and balance of payments position. Further, the economies of developing countries generally are heavily dependent upon international trade and, accordingly, have been, and may continue to be, adversely affected by trade barriers, exchange controls, managed adjustments in relative currency values and other protectionist measures. These economies also have been, and may continue to be, adversely effected by economic conditions in the countries with which they trade.
Prior governmental approval for foreign investments may be required under certain circumstances in some emerging market or developing countries, and the extent of foreign investment in certain fixed income securities and domestic companies may be subject to limitation in other emerging market or developing countries. Foreign ownership limitations also may be imposed by the charters of individual companies in emerging market or developing countries to prevent, among other concerns, violation of foreign investment limitations. Repatriation of investment income, capital and the proceeds of sales by foreign investors may require governmental registration and/or approval in some emerging countries. The Fund could be adversely affected by delays in, or a refusal to grant, any required governmental registration or approval for such repatriation. Any investment subject to such repatriation controls will be considered illiquid if it appears reasonably likely that this process will take more than seven days.
Investment in emerging market or developing countries may entail purchasing securities issued by or on behalf of entities that are insolvent, bankrupt, in default or otherwise engaged in an attempt to reorganize or reschedule their obligations and in entities that have little or no proven credit rating or credit history. In any such case, the issuer's poor or deteriorating financial condition may increase the likelihood that the Fund will experience losses or diminution in available gains due to bankruptcy, insolvency or fraud. Emerging
17
market or developing countries also pose the risk of nationalization, expropriation or confiscatory taxation, political changes, government regulation, social instability or diplomatic development (including war) that could affect adversely the economies of such countries or the value of a fund's investments in those countries. In addition, it may be difficult to obtain and enforce a judgment in a court outside the United States.
Investments in emerging markets may also be exposed to an extra degree of custodial and/or market risk, especially where the securities purchased are not traded on an official exchange or where ownership records regarding the securities are maintained by an unregulated entity (or even the issuer itself).
Depositary Receipts. Depositary Receipts represent an ownership interest in securities of foreign companies (an "underlying issuer") that are deposited with a depositary. Depositary Receipts are not necessarily denominated in the same currency as the underlying securities. Depositary Receipts include American Depositary Receipts ("ADRs"), Global Depositary Receipts ("GDRs") and other types of Depositary Receipts (which, together with ADRs and GDRs, are hereinafter collectively referred to as "Depositary Receipts"). ADRs are dollar-denominated Depositary Receipts typically issued by a U.S. financial institution which evidence an ownership interest in a security or pool of securities issued by a foreign issuer. ADRs are listed and traded in the United States. GDRs and other types of Depositary Receipts are typically issued by foreign banks or trust companies, although they also may be issued by U.S. financial institutions, and evidence ownership interests in a security or pool of securities issued by either a foreign or a U.S. corporation. Generally, Depositary Receipts in registered form are designed for use in the U.S. securities market and Depositary Receipts in bearer form are designed for use in securities markets outside the United States.
Depositary Receipts may be "sponsored" or "unsponsored." Sponsored Depositary Receipts are established jointly by a depositary and the underlying issuer, whereas unsponsored Depositary Receipts may be established by a depositary without participation by the underlying issuer. Holders of unsponsored Depositary Receipts generally bear all the costs associated with establishing unsponsored Depositary Receipts. In addition, the issuers of the securities underlying unsponsored Depositary Receipts are not obligated to disclose material information in the United States and, therefore, there may be less information available regarding such issuers and there may not be a correlation between such information and the market value of the Depositary Receipts. For purposes of the Fund's investment policies, the Fund's investments in Depositary Receipts will be deemed to be an investment in the underlying securities, except that ADRs may be deemed to be issued by a U.S. issuer.
Foreign real estate companies. The Fund may invest in foreign real estate companies. Foreign real estate companies pool investors' funds for investment primarily in real estate properties or real estate-related loans. Investing in foreign real estate companies makes the Fund susceptible to the risks associated with the ownership of real estate and with the real estate industry in general. These risks can include fluctuations in the value of underlying properties; defaults by borrowers or tenants; market saturation; changes in general and local economic conditions; decreases in market rates for rents; increases in competition, property taxes, capital expenditures or operating expenses; and other economic, political or regulatory occurrences affecting the real estate industry, as well as risks that relate specifically to the way foreign real estate companies are organized and operated. Foreign real estate companies may be subject to laws, rules and regulations governing those entities and their failure to comply with those laws, rules and regulations could negatively impact the performance of those entities. In addition, operating foreign real estate companies, like operating U.S. real estate investment trusts requires specialized management skills and the Fund indirectly bears foreign real estate company management expenses along with the direct expenses of the Fund.
Warrants and Subscription Rights. The Fund may acquire warrants and subscription rights attached to other securities. A warrant is, in effect, an option to purchase equity securities at a specific price, generally valid for a specific period of time, and has no voting rights, pays no dividends and has no rights with respect to the corporation issuing it.
A subscription right is a privilege granted to existing shareholders of a corporation to subscribe to shares of a new issue of common stock before it is offered to the public. A subscription right normally has
18
a life of two to four weeks and a subscription price lower than the current market value of the common stock.
Investment Company Securities. Investment company securities are securities of other open-end, closed-end and unregistered investment companies, including foreign investment companies and exchange-traded funds. The Fund may invest in investment company securities as may be permitted by (i) the Investment Company Act, as amended from time to time; (ii) the rules and regulations promulgated by the SEC under the Investment Company Act, as amended from time to time; or (iii) an exemption or other relief applicable to the Fund from provisions of the Investment Company Act, as amended from time to time. The Investment Company Act generally prohibits an investment company from acquiring more than 3% of the outstanding voting shares of an investment company and limits such investments to no more than 5% of a portfolio's total assets in any one investment company, and no more than 10% in any combination of investment companies. The Fund may invest in investment company securities of investment companies managed by the Adviser or its affiliates to the extent permitted under the Investment Company Act or as otherwise authorized by the SEC. To the extent the Fund invests a portion of its assets in investment company securities, those assets will be subject to the risks of the purchased investment company's portfolio securities, and a shareholder in the Fund will bear not only his proportionate share of the expenses of the Fund, but also, indirectly the expenses of the purchased investment company.
To the extent permitted by applicable law, the Fund may invest all or some of its short term cash investments in any money market fund advised or managed by the Adviser or its affiliates. In connection with any such investments, the Fund, to the extent permitted by the Investment Company Act, will pay its share of all expenses (other than advisory and administrative fees) of a money market fund in which it invests which may result in the Fund bearing some additional expenses.
Exchange-Traded Funds ("ETFs"). The Fund may invest in shares of various ETFs, including exchange-traded index and bond funds. Exchange-traded index funds seek to track the performance of various securities indices. Shares of ETFs have many of the same risks as direct investments in common stocks or bonds. In addition, their market value is expected to rise and fall as the value of the underlying index or bond rises and falls. The market value of their shares may differ from the net asset value of the particular fund. As a shareholder in an ETF (as with other investment companies), the Fund would bear its ratable share of that entity's expenses. At the same time, the Fund would continue to pay its own investment management fees and other expenses. As a result, the Fund and its shareholders, in effect, will be absorbing duplicate levels of fees with respect to investments in ETFs.
C. Fund Policies/Investment Restrictions
The investment objective, policies and restrictions listed below have been adopted by the Fund as fundamental policies. Under the Investment Company Act, a fundamental policy may not be changed without the vote of a majority of the outstanding voting securities of the Fund. The Investment Company Act defines a majority as the lesser of (a) 67% or more of the shares present at a meeting of shareholders, if the holders of 50% of the outstanding shares of the Fund are present or represented by proxy; or (b) more than 50% of the outstanding shares of the Fund. For purposes of the following restrictions: (i) all percentage limitations apply immediately after a purchase or initial investment, and (ii) any subsequent change in any applicable percentage resulting from market fluctuations or other changes in total or net assets does not require elimination of any security from the portfolio, except in the case of borrowing and investments in illiquid securities.
The Fund will:
1. Seek long-term capital appreciation.
The Fund will not:
1. Invest in a manner inconsistent with its classification as a "diversified company" as provided by (i) the Investment Company Act, as amended from time to time, (ii) the rules and regulations promulgated by the SEC under the Investment Company Act, as amended from time to time, or (iii) an exemption or other relief applicable to the Fund from the provisions of the Investment Company Act, as amended from time to time.
19
2. Invest 25% or more of the value of its total assets in securities of issuers in any one industry. This restriction does not apply to obligations issued or guaranteed by the U.S. Government, its agencies or instrumentalities.
3. Purchase or sell real estate or interests therein (including limited partnership interests), although the Fund may purchase securities of issuers which engage in real estate operations and securities secured by real estate or interests therein.
4. Borrow money, except the Fund may borrow money to the extent permitted by (i) the Investment Company Act, as amended from time to time, (ii) the rules and regulations promulgated by the SEC under the Investment Company Act, as amended from time to time, or (iii) an exemption or other relief applicable to the Fund from the provisions of the Investment Company Act, as amended from time to time.
5. Issue senior securities, except the Fund may issue senior securities to the extent permitted by (i) the Investment Company Act, as amended from time to time, (ii) the rules and regulations promulgated by the SEC under the Investment Company Act, as amended from time to time, or (iii) an exemption or other relief applicable to the Fund from the provisions of the Investment Company Act, as amended from time to time.
6. Make loans of money or property to any person, except (a) to the extent that securities or interests in which the Fund may invest are considered to be loans, (b) through the loan of portfolio securities, (c) by engaging in repurchase agreements or (d) as may otherwise be permitted by (i) the Investment Company Act, as amended from time to time, (ii) the rules and regulations promulgated by the SEC under the Investment Company Act, as amended from time to time, or (iii) an exemption or other relief applicable to the Fund from the provisions of the Investment Company Act, as amended from time to time.
7. Purchase or sell physical commodities unless acquired as a result of ownership of securities or other instruments; provided that this restriction shall not prohibit the Fund from purchasing or selling options, futures contracts and related options thereon, forward contracts, swaps, caps, floors, collars and any other financial instruments or from investing in securities or other instruments backed by physical commodities or as otherwise permitted by (i) the Investment Company Act, as amended from time to time, (ii) the rules and regulations promulgated by the SEC under the Investment Company Act, as amended from time to time, or (iii) an exemption or other relief applicable to the Fund from the provisions of the Investment Company Act, as amended from time to time.
8. Engage in the underwriting of securities, except insofar as the Fund may be deemed an underwriter under the Securities Act in disposing of a portfolio security.
In addition, as a non-fundamental policy, which can be changed with Board approval and without shareholder vote, the Fund will not invest in other investment companies in reliance on Section 12(d)(1)(F), 12(d)(1)(G) or 12(d)(1)(J) of the Investment Company Act.
The Fund has an operating policy, which may be changed by the Fund's Board of Trustees, not to borrow except from a bank for temporary or emergency purposes in amounts not exceeding 5% (taken at the lower of cost or current value) of its total assets (not including the amount borrowed).
Notwithstanding any other investment policy or restriction, the Fund may seek to achieve its investment objective by investing all or substantially all of its assets in another investment company having substantially the same investment objective and policies as the Fund.
D. Disclosure of Portfolio Holdings
The Fund's Board of Trustees, the Adviser and the Sub-Advisers have adopted policies and procedures regarding disclosure of portfolio holdings (the "Policy"). Pursuant to the Policy, the Adviser and the Sub-Advisers may disclose information concerning Fund portfolio holdings only if such disclosure is consistent with the antifraud provisions of the federal securities laws and the Fund's, the Adviser's and the Sub-Advisers' fiduciary duties to Fund shareholders. In no instance may the Adviser, the Sub-Advisers or the Fund receive compensation or any other consideration in connection with the disclosure of information about the portfolio securities of the Fund. Consideration includes any agreement to maintain assets in the Fund or in other investment companies or accounts managed by the Adviser, Sub-Advisers
20
or by any affiliated person of the Adviser or the Sub-Advisers. Non-public information concerning portfolio holdings may be divulged to third parties only when the Fund has a legitimate business purpose for doing so and the recipients of the information are subject to a duty of confidentiality. Under no circumstances shall current or prospective Fund shareholders receive non-public portfolio holdings information, except as described below.
The Fund makes available on its public website the following portfolio holdings information:
• complete portfolio holdings information quarterly, at least 15 calendar days after the end of each month; and
• top 10 holdings monthly, at least 15 calendar days after the end of each month.
The Fund provides a complete schedule of portfolio holdings for the second and fourth fiscal quarters in its semiannual and annual reports, and for the first and third fiscal quarters in its filings with the SEC on Form N-Q.
All other portfolio holdings information that has not been disseminated in a manner making it available to investors generally as described above is non-public information for purposes of the Policy.
The Fund may make selective disclosure of non-public portfolio holdings pursuant to certain exemptions set forth in the Policy. Third parties eligible for exemptions under the Policy and therefore eligible to receive such disclosures currently include fund rating agencies, information exchange subscribers, consultants and analysts, portfolio analytics providers and service providers, provided that the third party expressly agrees to maintain the disclosed information in confidence and not to trade portfolio securities or related derivative securities based on the non-public information. Non-public portfolio holdings information may not be disclosed to a third party pursuant to an exemption unless and until the third party recipient has entered into a non-disclosure agreement with the Fund and the arrangement has been reviewed and approved, as set forth in the Policy and discussed below. In addition, persons who owe a duty of trust or confidence to the Fund or the Adviser may receive non-public portfolio holdings information without entering into a non-disclosure agreement. Currently, these persons include (i) the Fund's independent registered public accounting firm (as of the Fund's fiscal year-end and on an as needed basis), (ii) counsel to the Fund (on an as needed basis), (iii) counsel to the independent Directors (on an as needed basis) and (iv) members of the Board of Directors (on an as needed basis). Subject to the terms and conditions of any agreement between the Adviser or the Fund and the third party recipient, if these conditions for disclosure are satisfied, there shall be no restriction on the frequency with which Fund non-public portfolio holdings information is released, and no lag period shall apply (unless otherwise indicated below).
The Adviser and the Sub-Advisers may provide interest lists to broker-dealers who execute securities transactions for the Fund without entering into a non-disclosure agreement with the broker-dealers, provided that the interest list satisfies all of the following criteria: (1) the interest list must contain only the CUSIP numbers and/or ticker symbols of securities held in all registered management investment companies advised by the Adviser and the Sub-Advisers or any affiliate of the Adviser or Sub-Advisers (the "MSIM Funds") on an aggregate, rather than a fund-by-fund basis; (2) the interest list must not contain information about the number or value of shares owned by a specified MSIM Fund; (3) the interest list may identify the investment strategy, but not the particular MSIM Funds, to which the list relates; and (4) the interest list may not identify the portfolio manager or team members responsible for managing the MSIM Funds.
Fund shareholders may elect in some circumstances to redeem their shares of the Fund in exchange for their pro rata share of the securities held by the Fund. Under such circumstances, Fund shareholders may receive a complete listing of the holdings of the Fund up to seven calendar days prior to making the redemption request provided that they represent in writing that they agree not to disclose or trade on the basis of the portfolio holdings information.
The Fund may discuss or otherwise disclose performance attribution analyses (i.e., mention the effects of having a particular security in the portfolio(s)) where such discussion is not contemporaneously made public, provided that the particular holding has been disclosed publicly. Additionally, any discussion of the analyses may not be more current than the date the holding was disclosed publicly.
21
The Fund may disclose portfolio holdings to transition managers, provided that the Fund has entered into a non-disclosure or confidentiality agreement with the party requesting that the information be provided to the transition manager and the party to the non-disclosure agreement has, in turn, entered into a non-disclosure or confidentiality agreement with the transition manager.
The Adviser and/or the Fund currently have entered into ongoing arrangements with the following parties:
| Name | | Information Disclosed | | Frequency(1) | | Lag Time | |
| Service Providers | |
|
RiskMetrics Group
(proxy voting agent)(*) | | Complete portfolio holdings | | Daily basis | | (2) | |
|
FT Interactive Data Pricing Service
Provider(*) | | Complete portfolio holdings | | As needed | | (2) | |
|
| State Street Bank and Trust Company(*) | | Complete portfolio holdings | | As needed | | (2) | |
|
| Fund Rating Agencies | |
|
| Lipper(*) | | Top ten and complete portfolio holdings | | Quarterly basis | | Approximately 15 days after quarter end and approximately 30 days after quarter end | |
|
| Morningstar(**) | | Top ten and complete portfolio holdings | | Quarterly basis | | Approximately 15 days after quarter end and approximately 30 days after quarter end | |
|
| Standard & Poor's(*) | | Complete portfolio holdings | | Quarterly basis | | Approximately 15 day lag | |
|
| Investment Company Institute(**) | | Top ten portfolio holdings | | Quarterly basis | | Approximately 15 days after quarter end | |
|
| Consultants and Analysts | |
|
| Americh Massena & Associates, Inc.(*) | | Top ten and complete portfolio holdings | | Quarterly basis(5) | | Approximately 10-12 days after quarter end | |
|
| Bloomberg(**) | | Complete portfolio holdings | | Quarterly basis | | Approximately 30 days after quarter end | |
|
| Callan Associates(*) | | Top ten and complete portfolio holdings | | Monthly and quarterly basis, respectively(5) | | Approximately 10-12 days after month/quarter end | |
|
| Cambridge Associates(*) | | Top ten and complete portfolio holdings | | Quarterly basis(5) | | Approximately 10-12 days after quarter end | |
|
| Citigroup(*) | | Complete portfolio holdings | | Quarterly basis(5) | | At least one day after quarter end | |
|
| Credit Suisse First Boston(*) | | Top ten and complete portfolio holdings | | Monthly and quarterly basis, respectively | | Approximately 10-12 days after month/quarter end | |
|
| CTC Consulting, Inc.(*) | | Top ten and complete portfolio holdings | | Quarterly basis | | Approximately 15 days after quarter end and approximately 30 days after quarter end, respectively | |
|
| Evaluation Associates(*) | | Top ten and complete portfolio holdings | | Monthly and quarterly basis, respectively(5) | | Approximately 10-12 days after month/quarter end | |
|
| Fund Evaluation Group(**) | | Top ten portfolio holdings(3) | | Quarterly basis | | At least 15 days after quarter end | |
|
| Jeffrey Slocum & Associates(*) | | Complete portfolio holdings(4) | | Quarterly basis(5) | | Approximately 10-12 days after quarter end | |
|
| Hammond Associates(**) | | Complete portfolio holdings(4) | | Quarterly basis | | At least 30 days after quarter end | |
|
22
| Name | | Information Disclosed | | Frequency(1) | | Lag Time | |
| Hartland & Co.(**) | | Complete portfolio holdings(4) | | Quarterly basis | | At least 30 days after quarter end | |
|
| Hewitt EnnisKnupp(*) | | Top ten and complete portfolio holdings | | Monthly and quarterly basis, respectively(5) | | Approximately 10-12 days after month/quarter end | |
|
| Merrill Lynch(*) | | Top ten and complete portfolio holdings | | Monthly and quarterly basis, respectively(5) | | Approximately 10-12 days after month/quarter end | |
|
| Mobius(**) | | Top ten portfolio holdings(3) | | Monthly basis | | At least 15 days after month end | |
|
| Nelsons(**) | | Top ten portfolio holdings(3) | | Quarterly basis | | At least 15 days after quarter end | |
|
| Prime, Buchholz & Associates, Inc.(**) | | Complete portfolio holdings(4) | | Quarterly basis | | At least 30 days after quarter end | |
|
| PSN(**) | | Top ten portfolio holdings(3) | | Quarterly basis | | At least 15 days after quarter end | |
|
| PFM Asset Management LLC(*) | | Top ten and complete portfolio holdings | | Quarterly basis(5) | | Approximately 10-12 days after quarter end | |
|
| Russell Investment Group/Russell/Mellon Analytical Services, Inc.(**) | | Top ten and complete portfolio holdings | | Monthly and quarterly basis | | At least 15 days after month end and at least 30 days after quarter end, respectively | |
|
| Stratford Advisory Group, Inc.(*) | | Top ten portfolio holdings(6) | | Quarterly basis(5) | | Approximately 10-12 days after quarter end | |
|
| Thompson Financial(**) | | Complete portfolio holdings(4) | | Quarterly basis | | At least 30 days after quarter end | |
|
| Watershed Investment Consultants, Inc.(*) | | Top ten and complete portfolio holdings | | Quarterly basis(5) | | Approximately 10-12 days after quarter end | |
|
| Yanni Partners(**) | | Top ten portfolio holdings(3) | | Quarterly basis | | At least 15 days after quarter end | |
|
| Portfolio Analytics Providers | |
|
| FactSet Research Systems, Inc.(*) | | Complete portfolio holdings | | Daily basis | | One day | |
|
(*) This entity has agreed to maintain Fund non-public portfolio holdings information in confidence and not to trade portfolio securities based on the non-public portfolio holdings information.
(**) The Fund does not currently have a non-disclosure agreement in place with this entity and therefore the entity can only receive publicly available information.
(1) Dissemination of portfolio holdings information to entities listed above may occur less frequently than indicated (or not at all).
(2) Information will typically be provided on a real time basis or as soon thereafter as possible.
(3) Complete portfolio holdings will also be provided upon request from time to time on a quarterly basis, with at least a 30 day lag.
(4) Top ten portfolio holdings will also be provided upon request from time to time, with at least a 15 day lag.
(5) This information will also be provided upon request from time to time.
(6) Complete portfolio holdings will also be provided upon request from time to time.
All disclosures of non-public portfolio holdings information made to third parties pursuant to the exemptions set forth in the Policy must be reviewed by Morgan Stanley Investment Management's ("MSIM") Legal and Compliance Division and approved by the Head of the Long-Only Business of MSIM. Disclosures made to third parties in connection with (i) broker-dealer interest lists; (ii) shareholder in-kind distributions; (iii) attribution analyses; or (iv) transition managers are pre-approved for purposes of the Policy. In addition, the following categories of third parties that may receive non-public portfolio holdings information are also pre-approved provided that they enter into non-disclosure agreements (as discussed above) (i) fund rating agencies; (ii) information exchange subscribers; (iii) consultants and analysts (including defined benefit and defined contribution plan sponsors, and variable annuity providers); (iv) portfolio analytics providers; and (v) service providers.
23
The Adviser shall report quarterly to the Board of Trustees (or a designated committee thereof) at the next regularly scheduled meeting (i) any material information concerning all parties receiving non-public portfolio holdings information pursuant to an exemption; and (ii) any new non-disclosure agreements entered into during the reporting period. Procedures to monitor the use of such non-public portfolio holdings information may include requiring annual certifications that the recipients have utilized such information only pursuant to the terms of the agreement between the recipient and the Adviser and, for those recipients receiving information electronically, acceptance of the information will constitute reaffirmation that the third party expressly agrees to maintain the disclosed information in confidence and not to trade portfolio securities based on the non-public information.
III. MANAGEMENT OF THE FUND
A. Board of Trustees
General. The Board of Trustees of the Fund oversees the management of the Fund, but does not itself manage the Fund. The Trustees review various services provided by or under the direction of the Adviser to ensure that the Fund's general investment policies and programs are properly carried out. The Trustees also conduct their review to ensure that administrative services are provided to the Fund in a satisfactory manner.
Under state law, the duties of the Trustees are generally characterized as a duty of loyalty and a duty of care. The duty of loyalty requires a Trustee to exercise his or her powers in the interest of the Fund and not the Trustee's own interest or the interest of another person or organization. A Trustee satisfies his or her duty of care by acting in good faith with the care of an ordinarily prudent person and in a manner the Trustee reasonably believes to be in the best interest of the Fund and its shareholders.
Trustees and Officers. The Board of the Fund consists of 10 Trustees. These same individuals also serve as directors or trustees for certain of the funds advised by the Adviser and Morgan Stanley AIP GP LP. Nine Trustees have no affiliation or business connection with the Adviser or any of its affiliated persons and do not own any stock or other securities issued by the Adviser's parent company, Morgan Stanley. These are the "non-interested" or "Independent" Trustees. The other Trustee (the "Interested Trustee") is affiliated with the Adviser.
Board Structure and Oversight Function. The Board's leadership structure features an Independent Trustee serving as Chairperson and the Board Committees described below. The Chairperson participates in the preparation of the agenda for meetings of the Board and the preparation of information to be presented to the Board with respect to matters to be acted upon by the Board. The Chairperson also presides at all meetings of the Board and is involved in discussions regarding matters pertaining to the oversight of the management of the Fund between meetings.
The Board of Trustees operates using a system of committees to facilitate the timely and efficient consideration of all matters of importance to the Trustees, the Fund and Fund shareholders, and to facilitate compliance with legal and regulatory requirements and oversight of the Fund's activities and associated risks. The Board of Trustees has established four standing committees: (1) Audit Committee, (2) Governance Committee, (3) Compliance and Insurance Committee and (4) Investment Committee. The Audit Committee and the Governance Committee are comprised exclusively of Independent Trustees. Each committee charter governs the scope of the committee's responsibilities with respect to the oversight of the Fund. The responsibilities of each committee, including their oversight responsibilities, are described further under the caption "Independent Trustees and the Committees."
The Fund is subject to a number of risks, including investment, compliance, operational and valuation risk, among others. The Board of Trustees oversees these risks as part of its broader oversight of the Fund's affairs through various Board and committee activities. The Board has adopted, and periodically reviews, policies and procedures designed to address various risks to the Fund. In addition, appropriate personnel, including but not limited to the Fund's Chief Compliance Officer, members of the Fund's administration and accounting teams, representatives from the Fund's independent registered public accounting firm, the Fund's Treasurer, portfolio management personnel and independent valuation and brokerage
24
calculation service providers, make regular reports regarding the Fund's activities and related risks to the Board of Trustees and the committees, as appropriate. These reports include, among others, quarterly performance reports, quarterly derivatives activity and risk reports and discussions with members of the risk teams relating to each asset class. The Board's committee structure allows separate committees to focus on different aspects of risk and potential impact on some or all of the funds in the complex and then report back to the full Board. In between regular meetings, Fund officers also communicate with the Trustees regarding material exceptions and items revelant to the Board's risk oversight function. The Board recognizes that it is not possible to identify all of the risks that may affect the Fund, and that it is not possible to develop processes and controls to eliminate all of the risks that may affect the Fund. Moreover, the Board recognizes that it may be necessary for the Fund to bear certain risks (such as investment risk) to achieve its investment objective.
As needed between meetings of the Board, the Board or a specific committee receives and reviews reports relating to the Fund and engages in discussions with appropriate parties relating to the Fund's operations and related risks.
B. Management Information
Independent Trustees. The Fund seeks as Trustees individuals of distinction and experience in business and finance, government service or academia. In determining that a particular Trustee was and continues to be qualified to serve as Trustee, the Board has considered a variety of criteria, none of which, in isolation, was controlling. Based on a review of the experience, qualifications, attributes or skills of each Trustee, including those enumerated in the table below, the Board has determined that each of the Trustees is qualified to serve as a Trustee of the Fund. In addition, the Board believes that, collectively, the Trustees have balanced and diverse experience, qualifications, attributes and skills that allow the Board to operate effectively in governing the Fund and protecting the interests of shareholders. Information about the Fund's Governance Committee and Board of Trustees nomination process is provided below under the caption "Independent Trustees and the Committees."
The Independent Trustees of the Fund, their age, address, term of office and length of time served, their principal business occupations during the past five years, the number of portfolios in the Fund Complex (defined below) overseen by each Independent Trustee (as of December 31, 2010) and other directorships, if any, held by the Trustees, are shown below. The Fund Complex includes all open-end and closed-end funds (including all of their portfolios) advised by the Adviser and any funds that have an adviser that is an affiliate of the Adviser (including, but not limited to, Morgan Stanley AIP GP LP) (the "Morgan Stanley Funds").
25
Independent Trustees:
Name, Age and Address of
Independent Trustee | | Position(s)
Held with
Registrant | | Length of
Time
Served* | | Principal Occupation(s) During
Past 5 Years | | Number of
Portfolios
in Fund
Complex
Overseen by
Independent
Trustee | | Other Directorships Held
by Independent Trustee** | |
Frank L. Bowman (67)
c/o Kramer Levin Naftalis & Frankel LLP
Counsel to the
Independent Trustees
1177 Avenue of the Americas
New York, NY 10036 | | Trustee | | Since August 2006 | | President, Strategic Decisions, LLC (consulting) (since February 2009); Director or Trustee of various Morgan Stanley Funds (since August 2006); Chairperson of the Insurance Sub-Committee of the Compliance and Insurance Committee (since February 2007); served as President and Chief Executive Officer of the Nuclear Energy Institute (policy organization) (February 2005 through November 2008); retired as Admiral, U.S. Navy after serving over 38 years on active duty including 8 years as Director of the Naval Nuclear Propulsion Program in the Department of the Navy and the U.S. Department of Energy (1996-2004); Served as Chief of Naval Personnel (July 1994-September 1996) and on the Joint Staff as Director of Political Military Affairs (June 1992 to July 1994); Knighted as Honorary Knight Commander of the Most Excellent Order of the British Empire; Awarded the Officer de I'Orde National du Mérite by the French Government; elected to the National Academy of Engineering (2009). | | | 102 | | | Director of BP p.l.c.; Director of Naval and Nuclear Technologies LLP; Director of the Armed Services YMCA of the U.S.A. and the Naval Submarine League; Director of the American Shipbuilding Suppliers Association; Member of the National Security Advisory Council of the Center for U.S. Global Engagement and a member of the CNA Military Advisory Board. | |
|
Michael Bozic (70)
c/o Kramer Levin Naftalis & Frankel LLP
Counsel to the
Independent Trustees
1177 Avenue of the Americas
New York, NY 10036 | | Trustee | | Since April 1994 | | Private investor; Chairperson of the Compliance and Insurance Committee (since October 2006); Director or Trustee of various Morgan Stanley Funds (since April 1994); formerly, Chairperson of the Insurance Committee (July 2006-September 2006); Vice Chairman of Kmart Corporation (December 1998- October 2000), Chairman and Chief Executive Officer of Levitz Furniture Corporation (November 1995- November 1998) and President and Chief Executive Officer of Hills Department Stores (May 1991-July 1995); variously Chairman, Chief Executive Officer, President and Chief Operating Officer (1987-1991) of the Sears Merchandise Group of Sears, Roebuck & Co. | | | 104 | | | Director of various business organizations. | |
|
* Each Trustee serves an indefinite term, until his or her successor is elected.
** This includes any directorships at public companies and registered investment companies held by the Trustee at any time during the past five years.
26
Name, Age and Address of
Independent Trustee | | Position(s)
Held with
Registrant | | Length of
Time
Served* | | Principal Occupation(s) During
Past 5 Years | | Number of
Portfolios
in Fund
Complex
Overseen by
Independent
Trustee | | Other Directorships Held
by Independent Trustee** | |
Kathleen A. Dennis (58)
c/o Kramer Levin Naftalis & Frankel LLP
Counsel to the
Independent Trustees
1177 Avenue of the Americas
New York, NY 10036 | | Trustee | | Since August 2006 | | President, Cedarwood Associates (mutual fund and investment management consulting) (since July 2006); Chairperson of the Money Market and Alternatives Sub-Committee of the Investment Committee (since October 2006) and Director or Trustee of various Morgan Stanley Funds (since August 2006); formerly, Senior Managing Director of Victory Capital Management (1993-2006). | | | 102 | | | Director of various non-profit organizations. | |
|
Dr. Manuel H. Johnson (62)
c/o Johnson Smick
Group, Inc.
888 16th Street, N.W.
Suite 740
Washington, D.C. 20006 | | Trustee | | Since July 1991 | | Senior Partner, Johnson Smick International, Inc. (consulting firm); Chairperson of the Investment Committee (since October 2006) and Director or Trustee of various Morgan Stanley Funds (since July 1991) (since July 2003); Co-Chairman and a founder of the Group of Seven Council (G7C) (international economic commission); formerly, Chairperson of the Audit Committee (July 1991-September 2006); Vice Chairman of the Board of Governors of the Federal Reserve System and Assistant Secretary of the U.S. Treasury. | | | 104 | | | Director of NVR, Inc. (home construction); Director of Evergreen Energy; Director of Greenwich Capital Holdings. | |
|
Joseph J. Kearns (69)
c/o Kearns & Associates LLC
PMB754
22631 Pacific Coast Highway
Malibu, CA 90265 | | Trustee | | Since August 1994 | | President, Kearns & Associates LLC (investment consulting); Chairperson of the Audit Committee (since October 2006) and Director or Trustee of various Morgan Stanley Funds (since August 1994); formerly, Deputy Chairperson of the Audit Committee (July 2003-September 2006) and Chairperson of the Audit Committee of various Morgan Stanley Funds (since August 1994); CFO of the J. Paul Getty Trust. | | | 105 | | | Director of Electro Rent Corporation (equipment leasing) and The Ford Family Foundation. | |
|
* Each Trustee serves an indefinite term, until his or her successor is elected.
** This includes any directorships at public companies and registered investment companies held by the Trustee at any time during the past five years.
27
Name, Age and Address of
Independent Trustee | | Position(s)
Held with
Registrant | | Length of
Time
Served* | | Principal Occupation(s) During
Past 5 Years | | Number of
Portfolios
in Fund
Complex
Overseen by
Independent
Trustee | | Other Directorships Held
by Independent Trustee** | |
Michael F. Klein (53)
c/o Kramer Levin Naftalis & Frankel LLP
Counsel to the
Independent Trustees
1177 Avenue of the Americas
New York, NY 10036 | | Trustee | | Since August 2006 | | Managing Director, Aetos Capital, LLC (since March 2000) and Co-President, Aetos Alternatives Management, LLC (since January 2004); Chairperson of the Fixed Income Sub-Committee of the Investment Committee (since October 2006) and Director or Trustee of various Morgan Stanley Funds (since August 2006); formerly, Managing Director, Morgan Stanley & Co. Inc. and Morgan Stanley Dean Witter Investment Management, President, various Morgan Stanley Funds (June 1998-March 2000) and Principal, Morgan Stanley & Co. Inc. and Morgan Stanley Dean Witter Investment Management (August 1997-December 1999). | | | 102 | | | Director of certain investment funds managed or sponsored by Aetos Capital, LLC; Director of Sanitized AG and Sanitized Marketing AG (specialty chemicals). | |
|
Michael E. Nugent (75)
c/o Triumph Capital, L.P.
445 Park Avenue
New York, NY 10022 | | Chairperson of the Board and Trustee | | Chairperson of the Boards since July 2006 and Trustee since July 1991 | | General Partner, Triumph Capital, L.P. (private investment partnership); Chairperson of the Boards of various Morgan Stanley Funds (since July 2006); Director or Trustee of various Morgan Stanley Funds (since July 1991) formerly, Chairperson of the Insurance Committee (until July 2006). | | | 104 | | | None. | |
|
W. Allen Reed (64)
c/o Kramer Levin Naftalis &
Frankel LLP
Counsel to the
Independent Trustees
1177 Avenue of the Americas
New York, NY 10036 | | Trustee | | Since August 2006 | | Chairperson of the Equity Sub-Committee of the Investment Committee (since October 2006) and Director or Trustee of various Morgan Stanley Funds (since August 2006); formerly, President and CEO of General Motors Asset Management; Chairman and Chief Executive Officer of the GM Trust Bank and Corporate Vice President of General Motors Corporation (August 1994-December 2005). | | | 104 | | | Director of Temple-Inland Industries (packaging and forest products); Director of Legg Mason, Inc. and Director of the Auburn University Foundation; formerly, Director of iShares, Inc. (2001-2006). | |
|
Fergus Reid (79)
c/o Joe Pietryka, Inc.
85 Charles Colman Blvd.
Pawling, NY 12564 | | Trustee | | Since June 1992 | | Chairman, Joe Pietryka, Inc.; Chairperson of the Governance Committee and Director or Trustee of various Morgan Stanley Funds (since June 1992). | | | 105 | | | Trustee and Director of certain investment companies in the JPMorgan Funds complex managed by JP Morgan Investment Management Inc. | |
|
* Each Trustee serves an indefinite term, until his or her successor is elected.
** This includes any directorships at public companies and registered investment companies held by the Trustee at any time during the past five years.
28
The Trustee who is affiliated with the Adviser or affiliates of the Adviser (as set forth below) and executive officers of the Fund, their age, address, term of office and length of time served, their principal business occupations during the past five years, the number of portfolios in the Fund Complex overseen by the Interested Trustee (as of December 31, 2010) and the other directorships, if any, held by the Interested Trustee, are shown below.
Interested Trustee:
Name, Age and Address of
Interested Trustee | | Position(s)
Held with
Registrant | | Length of
Time
Served* | | Principal Occupation(s) During
Past 5 Years | | Number of
Portfolios
in Fund
Complex
Overseen by
Interested
Trustee | | Other Directorships Held
by Interested Trustee** | |
James F. Higgins (63)
c/o Morgan Stanley Trust Harborside Financial Center
201 Plaza Two
Jersey City, NJ 07311 | | Trustee | | Since June 2000 | | Director or Trustee of various Morgan Stanley Funds (since June 2000); Senior Advisor of Morgan Stanley (since August 2000). | | | 103 | | | Director of AXA Financial, Inc. and The Equitable Life Assurance Society of the United States (financial services). | |
|
* Each Trustee serves an indefinite term, until his or her successor is elected.
** This includes any directorships at public companies and registered investment companies held by the Trustee at any time during the past five years.
Executive Officers:
Name, Age and Address of
Executive Officer | | Position(s)
Held with
Registrant | | Length of
Time
Served* | | Principal Occupation(s) During
Past 5 Years | |
Arthur Lev (50)
522 Fifth Avenue
New York, NY 10036 | | President and Principal Executive Officer — Equity and Fixed Income Funds | | Since June 2011 | | President and Principal Executive Officer (since June 2011) of the Equity and Fixed Income Funds in the Fund Complex; Head of the Long Only Business of Morgan Stanley Investment Management (since February 2011); Managing Director of the Adviser and various entities affiliated with the Adviser (since December 2006). Formerly, Chief Strategy Officer of Morgan Stanley Investment Management's Traditional Asset Management business (November 2010-February 2011); General Counsel of Morgan Stanley Investment Management (December 2006-October 2010); Partner and General Counsel of FrontPoint Partners LLC (July 2002 to December 2006); Managing Director and General Counsel of Morgan Stanley Investment Management (May 2000 to June 2002). | |
|
Mary Ann Picciotto (38)
c/o Morgan Stanley Services Company Inc.
Harborside Financial Center
201 Plaza Two
Jersey City, NJ 07311 | | Chief Compliance Officer | | Since May 2010 | | Executive Director of the Adviser and various entities affiliated with the Adviser; Chief Compliance Officer of various Morgan Stanley Funds (since May 2010); Chief Compliance Officer of the Adviser (since April 2007). | |
|
Stefanie V. Chang Yu (45)
522 Fifth Avenue
New York, NY 10036 | | Vice President | | Since December 1997 | | Managing Director of the Adviser and various entities affiliated with the Adviser; Vice President of various Morgan Stanley Funds (since December 1997). Formerly Secretary of the Adviser and various entities affiliated with the Adviser. | |
|
* Each Officer serves an indefinite term, until his or her successor is elected.
29
Name, Age and Address of
Executive Officer | | Position(s)
Held with
Registrant | | Length of
Time
Served* | | Principal Occupation(s) During
Past 5 Years | |
Francis J. Smith (46)
c/o Morgan Stanley Services Company Inc.
Harborside Financial Center
201 Plaza Two
Jersey City, NJ 07311 | | Treasurer and Principal Financial Officer | | Treasurer since July 2003 and Principal Financial Officer since September 2002 | | Executive Director of the Adviser and various entities affiliated with the Adviser; Treasurer and Principal Financial Officer of various Morgan Stanley Funds (since July 2003). | |
|
Mary E. Mullin (44)
522 Fifth Avenue
New York, NY 10036 | | Secretary | | Since June 1999 | | Executive Director of the Adviser and various entities affiliated with the Adviser; Secretary of various Morgan Stanley Funds (since June 1999). | |
|
* Each Officer serves an indefinite term, until his or her successor is elected.
In addition, the following individuals who are officers of the Adviser or its affiliates serve as assistant secretaries of the Fund: Joanne Antico, Joseph C. Benedetti, Daniel E. Burton, Tara A. Farrelly and Edward J. Meehan.
For each Trustee, the dollar range of equity securities beneficially owned by the Trustee in the Fund and in the Family of Investment Companies (Family of Investment Companies includes all of the registered investment companies advised by the Adviser and Morgan Stanley AIP GP LP) for the calendar year ended December 31, 2010, is set forth in the table below.
| Name of Trustee | | Dollar Range of Equity Securities in the Fund
(As of December 31, 2010) | | Aggregate Dollar Range of Equity Securities in
All Registered Investment Companies Overseen
by Trustee in Family of Investment Companies
(As of December 31, 2010) | |
| Independent: | | | | | |
|
| Frank L. Bowman(1) | | None | | over $100,000 | |
|
| Michael Bozic | | None | | over $100,000 | |
|
| Kathleen A. Dennis | | None | | over $100,000 | |
|
| Manuel H. Johnson | | None | | over $100,000 | |
|
| Joseph J. Kearns(1) | | None | | over $100,000 | |
|
| Michael F. Klein | | None | | over $100,000 | |
|
| Michael E. Nugent | | None | | over $100,000 | |
|
| W. Allen Reed(1) | | None | | over $100,000 | |
|
| Fergus Reid(1) | | None | | over $100,000 | |
|
| Interested: | | | | | |
|
| James F. Higgins | | None | | $1-$10,000 | |
|
(1) Includes the total amount of compensation deferred by the Trustee at his election pursuant to a deferred compensation plan. Such deferred compensation is placed in a deferral account and deemed to be invested in one or more of the Morgan Stanley Funds (or portfolio thereof) that are offered as investment options under the plan.
As to each Independent Trustee and his or her immediate family members, no person owned beneficially or of record securities in an investment adviser or principal underwriter of the Fund, or a person (other than a registered investment company) directly or indirectly controlling, controlled by or under common control with an investment adviser or principal underwriter of the Fund.
Independent Trustees and the Committees. Law and regulation establish both general guidelines and specific duties for the Independent Trustees. The Board has four committees: (1) Audit Committee, (2) Governance Committee, (3) Compliance and Insurance Committee and (4) Investment Committee. Three of the Independent Trustees serve as members of the Audit Committee, three Independent Trustees serve as members of the Governance Committee, four Trustees, including three Independent Trustees, serve as members of the Compliance and Insurance Committee and all of the Trustees serve as members of the Investment Committee.
The Independent Trustees are charged with recommending to the full Board approval of management, advisory and administration contracts, Rule 12b-1 plans and distribution and underwriting agreements; continually reviewing fund performance; checking on the pricing of portfolio securities, brokerage commissions,
30
transfer agent costs and performance and trading among funds in the same complex; and approving fidelity bond and related insurance coverage and allocations, as well as other matters that arise from time to time. The Independent Trustees are required to select and nominate individuals to fill any Independent Trustee vacancy on the board of any fund that has a Rule 12b-1 plan of distribution. Most of the retail Morgan Stanley Funds have a Rule 12b-1 plan.
The Board of Trustees has a separately-designated standing Audit Committee established in accordance with Section 3(a)(58)(A) of the Securities Exchange Act of 1934, as amended (the "Exchange Act"). The Audit Committee is charged with recommending to the full Board the engagement or discharge of the Fund's independent registered public accounting firm; directing investigations into matters within the scope of the independent registered public accounting firm's duties, including the power to retain outside specialists; reviewing with the independent registered public accounting firm the audit plan and results of the auditing engagement; approving professional services provided by the independent registered public accounting firm and other accounting firms prior to the performance of the services; reviewing the independence of the independent registered public accounting firm; considering the range of audit and non-audit fees; reviewing the adequacy of the Fund's system of internal controls; and reviewing the valuation process. The Fund has adopted a formal, written Audit Committee Charter.
The members of the Audit Committee of the Fund are Joseph J. Kearns, Michael E. Nugent and W. Allen Reed. None of the members of the Fund's Audit Committee is an "interested person," as defined under the Investment Company Act, of the Fund (with such disinterested Trustees being "Independent Trustees" or individually, "Independent Trustee"). Each Independent Trustee is also "independent" from the Fund under the listing standards of the New York Stock Exchange, Inc. ("NYSE"). The Chairperson of the Audit Committee of the Fund is Joseph J. Kearns.
The Board of Trustees of the Fund also has a Governance Committee. The Governance Committee identifies individuals qualified to serve as Independent Trustees on the Fund's Board and on committees of such Board and recommends such qualified individuals for nomination by the Fund's Independent Trustees as candidates for election as Independent Trustees, advises the Fund's Board with respect to Board composition, procedures and committees, develops and recommends to the Fund's Board a set of corporate governance principles applicable to the Fund, monitors and makes recommendations on corporate governance matters and policies and procedures of the Fund's Board of Trustees and any Board committees and oversees periodic evaluations of the Fund's Board and its committees. The members of the Governance Committee of the Fund are Kathleen A. Dennis, Michael F. Klein and Fergus Reid, each of whom is an Independent Trustee. The Chairperson of the Governance Committee is Fergus Reid.
The Fund does not have a separate nominating committee. While the Fund's Governance Committee recommends qualified candidates for nominations as Independent Trustees, the Board of Trustees of the Fund believes that the task of nominating prospective Independent Trustees is important enough to require the participation of all current Independent Trustees, rather than a separate committee consisting of only certain Independent Trustees. Accordingly, each Independent Trustee (Frank L. Bowman, Michael Bozic, Kathleen A. Dennis, Manuel H. Johnson, Joseph J. Kearns, Michael F. Klein, Michael E. Nugent, W. Allen Reed and Fergus Reid) participates in the election and nomination of candidates for election as Independent Trustees for the Fund. Persons recommended by the Fund's Governance Committee as candidates for nomination as Independent Trustees shall possess such experience, qualifications, attributes, skills and diversity so as to enhance the Board's ability to manage and direct the affairs and business of the Fund, including, when applicable, to enhance the ability of committees of the Board to fulfill their duties and/or to satisfy any independence requirements imposed by law, regulation or any listing requirements of the NYSE. While the Independent Trustees of the Fund expect to be able to continue to identify from their own resources an ample number of qualified candidates for the Fund's Board as they deem appropriate, they will consider nominations from shareholders to the Board. Nominations from shareholders should be in writing and sent to the Independent Trustees as described below under the caption "Shareholder Communications."
The Board formed the Compliance and Insurance Committee to address insurance coverage and oversee the compliance function for the Fund and the Board. The Compliance and Insurance Committee consists of Frank L. Bowman, Michael Bozic, James F. Higgins and Manuel H. Johnson. Frank L. Bowman,
31
Michael Bozic and Manuel H. Johnson are Independent Trustees. The Chairperson of the Compliance and Insurance Committee is Michael Bozic. The Compliance and Insurance Committee has an Insurance Sub-Committee to review and monitor the insurance coverage maintained by the Fund. The Chairperson of the Insurance Sub-Committee is Frank L. Bowman.
The Investment Committee oversees the portfolio investment process for and reviews the performance of the Fund. The Investment Committee also recommends to the Board to approve or renew the Fund's Investment Advisory, Sub-Advisory and Administration Agreements. The members of the Investment Committee are Frank L. Bowman, Michael Bozic, Kathleen A. Dennis, James F. Higgins, Manuel H. Johnson, Joseph J. Kearns, Michael F. Klein, Michael E. Nugent, W. Allen Reed and Fergus Reid. The Chairperson of the Investment Committee is Manuel H. Johnson.
The Investment Committee has three Sub-Committees, each with its own Chairperson. Each Sub-Committee focuses on the funds' primary areas of investment, namely equities, fixed income and alternatives. The Sub-Committees and their members are as follows:
(1) Equity — W. Allen Reed (Chairperson), Frank L. Bowman and Michael E. Nugent
(2) Fixed Income — Michael F. Klein (Chairperson), Michael Bozic and Fergus Reid.
(3) Money Market and Alternatives — Kathleen A. Dennis (Chairperson), James F. Higgins and Joseph J. Kearns.
During the Fund's fiscal year ended August 31, 2011, the Board of Trustees held the following meetings:
| Board of Trustees | | | 7 | | |
| Committee/Sub-Committee | | Number of Meetings: | |
| Audit Committee | | | 4 | | |
| Governance Committee | | | 4 | | |
| Compliance and Insurance Committee | | | 4 | | |
| Insurance Sub-Committee | | | 1 | | |
| Investment Committee | | | 5 | | |
| Equity Sub-Committee | | | 5 | | |
| Fixed Income Sub-Committee | | | 5 | | |
| Money Market and Alternatives Sub-Committee | | | 7 | | |
Experience, Qualifications and Attributes
The Board has concluded, based on each Trustee's experience, qualifications and attributes that each Board member should serve as a Trustee. Following is a brief summary of the information that led to and/or supports this conclusion.
Mr. Bowman has experience in a variety of business and financial matters through his prior service as a Director or Trustee for various other funds in the Fund Complex, where he serves as Chairperson of the Insurance Sub-Committee of the Compliance and Insurance Committee, and as a Director of BP p.l.c. and Naval and Nuclear Technologies LLP. Mr. Bowman also serves as a Director for the Armed Services YMCA of the USA, the Naval Submarine League and the American Shipbuilding Suppliers Association. Mr. Bowman is also a member of the National Security Advisory Council of the Center for U.S. Global Engagement and a member of the CNA Military Advisory Board. Mr. Bowman retired as an Admiral in the U.S. Navy after serving over 38 years on active duty including eight years as Director of the Naval Nuclear Propulsion Program in the Department of the Navy and the Department of Energy (1996-2004). Additionally, Mr. Bowman served as the U.S. Navy's Chief of Naval Personnel (1994-1996), where he was responsible for the planning and programming of all manpower, personnel, training and education resources for the U.S. Navy and on the Joint Staff as Director of Political Military Affairs (1992-1994). In addition, Mr. Bowman served as President and Chief Executive Officer of the Nuclear Energy Institute. Mr. Bowman has received such distinctions as a knighthood as Honorary Knight Commander of the Most Excellent Order of the
32
British Empire and the Officer de l'Orde National du Mérite from the French Government and was elected to the National Academy of Engineering (2009). He is President of the consulting firm Strategic Decisions, LLC.
With over 20 years of experience on the boards and in senior management of such companies as Kmart Corporation, Levitz Furniture Corporation, Hills Department Stores and Sears Merchandise Group of Sears, Roebuck & Co., where Mr. Bozic also served as Chief Financial Officer of the Merchandise Group, and with over 15 years of experience as a Director or Trustee of certain other funds in the Fund Complex, Mr. Bozic has experience with a variety of financial, management, regulatory and operational issues as well as experience with marketing and distribution. Mr. Bozic has served as the Chairperson of the Compliance and Insurance Committee since 2006.
Ms. Dennis has over 25 years of business experience in the financial services industry and related fields including serving as a Director or Trustee of various other funds in the Fund Complex, where she serves as Chairperson of the Money Market and Alternatives Sub-Committee of the Investment Committee. Ms. Dennis possesses a strong understanding of the regulatory framework under which investment companies must operate based on her years of service to this Board and her position as Senior Managing Trustee of Victory Capital Management.
In addition to his tenure as a Director or Trustee of various other funds in the Fund Complex, where he formerly served as Chairperson of the Audit Committee, Dr. Johnson has also served as an officer or a board member of numerous companies for nearly 20 years. These positions included Co-Chairman and a founder of the Group of Seven Council, Director of NVR, Inc., Director of Evergreen Energy and Director of Greenwich Capital Holdings. He also has served as Vice Chairman of the Board of Governors of the Federal Reserve System and Assistant Secretary of the U.S. Treasury. In addition, Dr. Johnson also served as Chairman of the Financial Accounting Foundation, which oversees the Financial Accounting Standards Board, for seven years.
Mr. Kearns gained extensive experience regarding accounting through his experience on the Audit Committees of the boards of other funds in the Funds Complex, including serving as either Chairperson or Deputy Chairperson of the Audit Committee for fourteen years, and through his position as Chief Financial Officer of the J. Paul Getty Trust. He also has experience in financial, accounting, investment and regulatory matters through his position as President and founder of Kearns & Associates LLC, a financial consulting company. Mr. Kearns also serves as a director of Electro Rent Corporation and The Ford Family Foundation. The Board has determined that Mr. Kearns is an "audit committee financial expert" as defined by the SEC.
Through his prior positions as Managing Director of Morgan Stanley & Co. Inc. and Morgan Stanley Dean Witter Investment Management and as President of Morgan Stanley Institutional Funds, Mr. Klein has experience in the management and operation of registered investment companies, enabling him to provide management input and investment guidance to the Board. Mr. Klein also has extensive experience in the investment management industry based on his current positions as Managing Director of Aetos Capital, LLC and as Director of certain investment funds managed or sponsored by Aetos Capital, LLC. In addition, he also has experience as a member of the board of other funds in the Fund Complex.
Mr. Nugent has extensive experience with financial, accounting, investment and regulatory matters through his almost 20 years of service on the boards of various funds in the Fund Complex, including time as the Chairperson of the Insurance Committee and Chairman of the Morgan Stanley Funds. Mr. Nugent also has experience as a General Partner in Triumph Capital, L.P.
Mr. Reed has experience on investment company boards and is experienced with financial, accounting, investment and regulatory matters through his service as a director of iShares Inc. and other funds in the Fund Complex. Mr. Reed also gained substantial experience in the financial services industry through his positions as Director of Legg Mason, Inc. and prior position as President and CEO of General Motors Asset Management.
Mr. Reid has served on a number of mutual fund boards, including as a trustee and director of certain investment companies in the JPMorgan Funds complex and as a Director or Trustee of other funds in the
33
Fund Complex. Therefore, Mr. Reid is experienced with financial, accounting, investment and regulatory matters, enabling him to provide management input and investment guidance to the Board.
Mr. Higgins has over 30 years of experience in the financial services industry. Mr. Higgins has substantial mutual fund experience and is experienced with financial, accounting, investment and regulatory matters due to his experience on the boards of other funds in the Fund Complex. Mr. Higgins also serves on the boards of other companies in the financial services industry, including AXA Financial, Inc. and The Equitable Life Assurance Society of the United States.
The Trustees' principal occupations during the past five years or more are shown in the above tables.
Advantages of Having Same Individuals as Trustees for the Morgan Stanley Funds. The Independent Trustees and the Fund's management believe that having the same Independent Trustees for each of the Morgan Stanley Funds avoids the duplication of effort that would arise from having different groups of individuals serving as Independent Trustees for each of the funds or even of sub-groups of funds. They believe that having the same individuals serve as Independent Trustees of all the Morgan Stanley Funds tends to increase their knowledge and expertise regarding matters which affect the Fund Complex generally and enhances their ability to negotiate on behalf of each fund with the fund's service providers. This arrangement also precludes the possibility of separate groups of Independent Trustees arriving at conflicting decisions regarding operations and management of the funds and avoids the cost and confusion that would likely ensue. Finally, having the same Independent Trustees serve on all fund boards enhances the ability of each fund to obtain, at modest cost to each separate fund, the services of Independent Trustees of the caliber, experience and business acumen of the individuals who serve as Independent Trustees of the Morgan Stanley Funds.
Trustee and Officer Indemnification. The Fund's Declaration of Trust provides that no Trustee, Officer, employee or agent of the Fund is liable to the Fund or to a shareholder, nor is any Trustee, Officer, employee or agent liable to any third persons in connection with the affairs of the Fund, except as such liability may arise from his/her or its own bad faith, willful misfeasance, gross negligence or reckless disregard of his/her or its duties. It also provides that all third persons shall look solely to Fund property for satisfaction of claims arising in connection with the affairs of the Fund. With the exceptions stated, the Declaration of Trust provides that a Trustee, Officer, employee or agent is entitled to be indemnified against all liability in connection with the affairs of the Fund.
Shareholder Communications. Shareholders may send communications to the Fund's Board of Trustees. Shareholders should send communications intended for the Fund's Board by addressing the communications directly to that Board (or individual Board members) and/or otherwise clearly indicating in the salutation that the communication is for the Board (or individual Board members) and by sending the communication to either the Fund's office or directly to such Board member(s) at the address specified for each Trustee previously noted. Other shareholder communications received by the Fund not directly addressed and sent to the Board will be reviewed and generally responded to by management, and will be forwarded to the Board only at management's discretion based on the matters contained therein.
C. Compensation
Each Trustee (except for the Chairperson of the Boards) receives an annual retainer fee of $210,000 for serving the Morgan Stanley Funds. Prior to January 1, 2011, each Trustee (except for the Chairperson of the Boards) received and annual retainer fee of $200,000 for serving the Morgan Stanley Funds.
The Chairperson of the Audit Committee receives an additional annual retainer fee of $78,750 ($75,000 prior to January 1, 2011) and the Investment Committee Chairperson receives an additional annual retainer fee of $63,000 ($60,000 prior to January 1, 2011). Other Committee Chairpersons receive an additional annual retainer fee of $31,500 ($30,000 prior to January 1, 2011) and the Sub-Committee Chairpersons receive an additional annual retainer fee of $15,750 ($15,000 prior to January 1, 2011). The aggregate compensation paid to each Trustee is paid by the Morgan Stanley Funds, and is allocated on a pro rata basis among each of the operational funds/portfolios of the Morgan Stanley Funds based on the relative net assets of each of the funds/portfolios. Michael E. Nugent receives a total annual retainer fee of $420,000 ($400,000 prior to January 1, 2011) for his services as Chairperson of the Boards of the Morgan Stanley Funds and for administrative services provided to each Board.
34
The Fund also reimburses such Trustees for travel and other out-of-pocket expenses incurred by them in connection with attending such meetings. Trustees of the Fund who are employed by the Adviser receive no compensation or expense reimbursement from the Fund for their services as Trustee.
Effective April 1, 2004, the Fund began a Deferred Compensation Plan (the "DC Plan"), which allows each Trustee to defer payment of all, or a portion, of the fees he or she receives for serving on the Board of Trustees throughout the year. Each eligible Trustee generally may elect to have the deferred amounts credited with a return equal to the total return on one or more of the Morgan Stanley Funds (or portfolios thereof) that are offered as investment options under the DC Plan. At the Trustee's election, distributions are either in one lump sum payment, or in the form of equal annual installments over a period of five years. The rights of an eligible Trustee and the beneficiaries to the amounts held under the DC Plan are unsecured and such amounts are subject to the claims of the creditors of the Fund.
Prior to April 1, 2004, certain Morgan Stanley Funds maintained a similar Deferred Compensation Plan (the "Prior DC Plan"), which also allowed each Independent Trustee to defer payment of all, or a portion, of the fees he or she received for serving on the Board of Trustees throughout the year. Generally, the DC Plan amends and supersedes the Prior DC Plan and all amounts payable under the Prior DC Plan are now subject to the terms of the DC Plan (except for amounts paid during the calendar year 2004, which remain subject to the terms of the Prior DC Plan).
The following table shows aggregate compensation payable to each of the Fund's Trustees from the Fund for the fiscal year ended August 31, 2011 and the aggregate compensation payable to each of the funds' Trustees by the Fund Complex (which includes all of the Morgan Stanley Funds) for the calendar year ended December 31, 2010.
Compensation(1)
| Name of Independent Trustee | |
Aggregate Compensation
From the Fund(2) | | Total Compensation
From Fund and Fund
Complex Paid to Trustee(3) | |
| Frank L. Bowman | | $ | 617 | | | $ | 215,000 | | |
| Michael Bozic | | | 650 | | | | 230,000 | | |
| Kathleen A. Dennis | | | 617 | | | | 215,000 | | |
| Manuel H. Johnson | | | 735 | | | | 260,000 | | |
| Joseph J. Kearns(2) | | | 777 | | | | 290,000 | | |
| Michael F. Klein | | | 617 | | | | 215,000 | | |
| Michael E. Nugent | | | 1,131 | | | | 400,000 | | |
| W. Allen Reed(2) | | | 616 | | | | 215,000 | | |
| Fergus Reid | | | 650 | | | | 245,000 | | |
| Name of Interested Trustee | |
| James F. Higgins | | | 565 | | | | 200,000 | | |
(1) Includes all amounts paid for serving as director/trustee of the funds, as well as serving as Chairperson of the Boards or a Chairperson of a Committee or Sub-Committee.
(2) The amounts shown in this column represent the aggregate compensation before deferral with respect to the Fund's fiscal year. The following Trustees deferred compensation from the Fund during the fiscal year ended August 31, 2011: Mr. Kearns, $288; Mr. Reed, $616.
(3) The amounts shown in this column represent the aggregate compensation paid by all of the funds in the Fund Complex as of December 31, 2010 before deferral by the Trustees under the DC Plan. As of December 31, 2010, the value (including interest) of the deferral accounts across the Fund Complex for Messrs. Kearns, Reed and Reid pursuant to the deferred compensation plan was $438,616, $478,362 and $594,829, respectively. Because the funds in the Fund Complex have different fiscal year ends, the amounts shown in this column are presented on a calendar year basis.
Prior to December 31, 2003, 49 of the Morgan Stanley Funds (the "Adopting Funds"), not including the Fund, had adopted a retirement program under which an Independent Trustee who retired after serving for at least five years as an Independent Trustee of any such fund (an "Eligible Trustee") would have been entitled to retirement payments, based on factors such as length of service, upon reaching the eligible retirement age. On December 31, 2003, the amount of accrued retirement benefits for each Eligible Trustee was frozen, and will be payable, together with a return of 8% per annum, at or following each such Eligible Trustee's retirement as shown in the table below.
35
The following table illustrates the retirement benefits accrued to the Fund's Independent Trustees by the Adopting Funds for the calendar year ended December 31, 2010, and the estimated retirement benefits for the Independent Trustees from the Adopting Funds for each calendar year following retirement. Only the Trustees listed below participated in the retirement program.
| Name of Independent Trustee | | Retirement benefits
accrued as Fund expenses
by all
Adopting Funds | | Estimated annual
benefits upon retirement(1)
from all
Adopting Funds | |
| Michael Bozic | | $ | 42,107 | | | $ | 43,940 | | |
| Manuel H. Johnson | | | 30,210 | | | | 64,338 | | |
| Michael E. Nugent | | | 6,805 | | | | 57,539 | | |
(1) Total compensation accrued under the retirement plan, together with a return of 8% per annum, will be paid annually commencing upon retirement and continuing for the remainder of the Trustee's life.
IV. CONTROL PERSONS AND PRINCIPAL HOLDERS OF SECURITIES
The following owned beneficially or of record 5% or more of the outstanding Class A shares of the Fund as of December 1, 2011: Morgan Stanley & Co., Harborside Financial Center, 201 Plaza Two, Jersey City, NJ 07311 — 69.56% State Street Bank and Trust Co, FBO ADP/Morgan Stanley Alliance, 105 Rosemont Avenue, Westwood, MA 02090-2318 — 11.17%. The following owned beneficially or of record 5% or more of the outstanding Class B shares of the Fund as of December 1, 2011: Morgan Stanley & Co., Harborside Financial Center, 201 Plaza Two, Jersey City, NJ 07311 — 76.15%; First Clearing, LLC, Special Custody Account FBO Customer, 2801 Market St., St. Louis, MO 63103-2523 — 6.08%. The following owned beneficially or of record 5% or more of the outstanding Class C shares of the Fund as of December 1, 2011: Morgan Stanley & Co., Harborside Financial Center, 201 Plaza Two, Jersey City, NJ 07311 — 75.88%. The following owned beneficially or of record 5% or more of the outstanding Class I shares of the Fund as of December 1, 2011: Morgan Stanley & Co., Harborside Financial Center, 201 Plaza Two, Jersey City, NJ 07311 — 95.93%. The following owned beneficially or of record 5% or more of the outstanding Class R shares of the Fund as of December 1, 2011: Morgan Stanley Investment Management Inc., 100 Front Street, West Conshohocken, PA 19428-2800 — 100.0%. The following owned beneficially or of record 5% or more of the outstanding Class W shares of the Fund as of December 1, 2011: Morgan Stanley Investment Management Inc., 100 Front Street, West Conshohocken, PA 19428-2800 — 100.0%. The percentage ownership of shares of the Fund changes from time to time depending on purchases and redemptions by shareholders and the total number of shares outstanding.
As of the date of this SAI , the aggregate number of shares of beneficial interest of the Fund owned by the Fund's officers and Trustees as a group was less than 1% of the Fund's shares of beneficial interest outstanding.
V. INVESTMENT ADVISORY AND OTHER SERVICES
A. Adviser, Sub-Advisers and Administrator
The Adviser to the Fund is Morgan Stanley Investment Management Inc., a Delaware corporation, whose address is 522 Fifth Avenue, New York, NY 10036. The Adviser is a wholly-owned subsidiary of Morgan Stanley, a Delaware corporation. Morgan Stanley is a preeminent global financial services firm engaged in securities trading and brokerage activities, as well as providing investment banking, research and analysis, financing and financial advisory services.
The Sub-Advisers are Morgan Stanley Investment Management Limited ("MSIM Limited"), located at 25 Cabot Square, Canary Wharf, London, E14 4QA, England and Morgan Stanley Investment Management Company ("MSIM Company"), located at 23 Church Street, 16-01 Capital Square, Singapore 049481. Both MSIM Limited and MSIM Company are wholly-owned subsidiaries of Morgan Stanley.
Pursuant to an Investment Advisory Agreement (the "Investment Advisory Agreement") with the Adviser, the Fund has retained the Adviser to manage its business affairs and oversee the purchase and
36
sale of portfolio securities. The Fund pays the Adviser monthly compensation calculated daily at an annual rate of 0.80% of the average daily net assets of the Fund determined as of the close of business each day. The investment advisory fee is allocated among the Classes pro rata based on the net assets of the Fund attributable to each Class.
Administration services are provided to the Fund by Morgan Stanley Services Company Inc. ("Administrator"), a wholly-owned subsidiary of the Adviser, pursuant to a separate administration agreement ("Administration Agreement") entered into by the Fund with the Administrator. The Fund pays the Administrator monthly compensation of 0.08% of daily net assets.
The following table shows for the Fund (i) the advisory fee paid; and (ii) the advisory fee waived and/or rebated from affiliated transactions for each of the past three fiscal years ended August 31, 2009, 2010 and 2011.
Advisory Fees Paid
(After Fee Waivers and/or
Rebate from Affiliated
Transactions) | | Advisory Fees Waived | | Rebate from Affiliated
Transactions | |
| 2009 | | 2010 | | 2011 | | 2009 | | 2010 | | 2011 | | 2009 | | 2010 | | 2011 | |
| $ | 2,536,393 | | | $ | 2,233,569 | | | $ | 1,906,783 | | | | — | | | | — | | | | — | | | $ | 8,394 | | | $ | 6,511 | | | $ | 4,420 | | |
The Adviser has entered into a sub-advisory agreement with each of MSIM Limited and MSIM Company (the "Sub-Advisory Agreements"). The Sub-Advisers provide the Fund with investment advisory services subject to the overall supervision of the Adviser and the Fund's Officers and Trustees. The Adviser pays MSIM Limited and MSIM Company on a monthly basis a portion of the net advisory fees the Adviser receives from the Fund.
For the fiscal years ended August 31, 2009, 2010 and 2011, the Fund paid compensation under its Administration Agreement as follows:
| | | Compensation Paid for the Fiscal Year
Ended August 31, | |
| | | 2009 | | 2010 | | 2011 | |
| | | | | $ | 254,479 | | | $ | 224,008 | | | $ | 191,120 | | |
Under a Sub-Administration Agreement between the Administrator and State Street Bank and Trust Company ("State Street"), State Street provides certain administrative services to the Fund. For such services, the Administrator pays State Street a portion of the fee the Administrator receives from the Fund.
B. Principal Underwriter
The Fund's principal underwriter is the Distributor (which has the same address as the Adviser). In this capacity, the Fund's shares are distributed by the Distributor. The Distributor has entered into a selected dealer agreement with Morgan Stanley Smith Barney and Morgan Stanley & Co., which through their own sales organizations sell shares of the Fund. In addition, the Distributor may enter into similar agreements with other selected broker-dealers. The Distributor, a Delaware corporation, is a wholly-owned subsidiary of Morgan Stanley.
The Distributor bears all expenses it may incur in providing services under the Distribution Agreement. These expenses include the payment of commissions for sales of the Fund's shares and incentive compensation to Financial Advisors, the cost of educational and/or business-related trips, and educational and/or promotional and business-related expenses. The Distributor also pays certain expenses in connection with the distribution of the Fund's shares, including the costs of preparing, printing and distributing advertising or promotional materials, and the costs of printing and distributing prospectuses and supplements thereto used in connection with the offering and sale of the Fund's shares. The Fund bears the costs of initial typesetting, printing and distribution of prospectuses and supplements thereto to shareholders. The Fund also bears the costs of registering the Fund and its shares under federal and state securities laws and pays filing fees in accordance with state securities laws.
37
The Fund and the Distributor have agreed to indemnify each other against certain liabilities, including liabilities under the Securities Act. Under the Distribution Agreement, the Distributor uses its best efforts in rendering services to the Fund, but in the absence of willful misfeasance, bad faith, gross negligence or reckless disregard of its obligations, the Distributor is not liable to the Fund or any of its shareholders for any error of judgment or mistake of law or for any act or omission or for any losses sustained by the Fund or its shareholders.
C. Services Provided by the Adviser, Sub-Advisers and Administrator
The Adviser manages the Fund's business affairs and oversees the purchase and sale of portfolio securities. Pursuant to the Sub-Advisory Agreements, the Sub-Advisers have been retained, subject to the overall supervision of the Adviser, to continuously furnish investment advice concerning individual security selections, asset allocations and overall economic trends and to manage the Fund's portfolio. The Sub-Advisers obtain and evaluate the information and advice relating to the economy, securities markets and specific securities as it considers necessary or useful to continuously manage the assets of the Fund in a manner consistent with its investment objective.
Under the terms of the Administration Agreement, the Administrator maintains certain of the Fund's books and records and furnishes, at its own expense, the office space, facilities, equipment, clerical help and bookkeeping as the Fund may reasonably require in the conduct of its business. The Administrator also assists in the preparation of prospectuses, proxy statements and reports required to be filed with federal and state securities commissions (except insofar as the participation or assistance of the independent registered public accounting firm and attorneys is, in the opinion of the Administrator, necessary or desirable). The Administrator also bears the cost of telephone service, heat, light, power and other utilities provided to the Fund.
Expenses not expressly assumed by the Adviser under the Investment Advisory Agreement, the Sub-Advisers under the Sub-Advisory Agreements or by the Administrator under the Administration Agreement or by the Distributor, will be paid by the Fund. These expenses will be allocated among the six Classes of shares pro rata based on the net assets of the Fund attributable to each Class, except as described below. Such expenses include, but are not limited to: expenses of the Plans of Distribution and Shareholder Service Plan pursuant to Rule 12b-1; charges and expenses of any registrar, custodian, stock transfer and dividend disbursing agent; brokerage commissions; taxes; engraving and printing share certificates; registration costs of the Fund and its shares under federal and state securities laws; the cost and expense of printing, including typesetting, and distributing prospectuses of the Fund and supplements thereto to the Fund's shareholders; all expenses of shareholders' and Trustees' meetings and of preparing, printing and mailing of proxy statements and reports to shareholders; fees and travel expenses of Trustees or members of any advisory board or committee who are not employees of the Adviser or any corporate affiliate of the Adviser; all expenses incident to any dividend, withdrawal or redemption options; charges and expenses of any outside service used for pricing of the Fund's shares; fees and expenses of legal counsel, including counsel to the Trustees who are not interested persons of the Fund or of the Adviser or the Sub-Advisers (not including compensation or expenses of attorneys who are employees of the Adviser or the Sub-Advisers); fees and expenses of the Fund's independent registered public accounting firm; membership dues of industry associations; interest on Fund borrowings; postage; insurance premiums on property or personnel (including officers and Trustees) of the Fund which inure to its benefit; extraordinary expenses (including, but not limited to, legal claims and liabilities and litigation costs and any indemnification relating thereto); and all other costs of the Fund's operation. The 12b-1 fees relating to a particular Class will be allocated directly to that Class. In addition, other expenses associated with a particular Class (except advisory or custodial fees) may be allocated directly to that Class, provided that such expenses are reasonably identified as specifically attributable to that Class and the direct allocation to that Class is approved by the Trustees.
The Investment Advisory Agreement provides that in the absence of willful misfeasance, bad faith, gross negligence or reckless disregard of its obligations thereunder, the Adviser is not liable to the Fund or any of its investors for any act or omission by the Adviser or for any losses sustained by the Fund or its investors.
38
The Investment Advisory Agreement will remain in effect from year to year, provided continuance of the Investment Advisory Agreement is approved at least annually by the vote of the holders of a majority, as defined in the Investment Company Act, of the outstanding shares of the Fund, or by the Trustees, provided that in either event such continuance is approved annually by the vote of a majority of the Independent Trustees.
The Administration Agreement provides that in the absence of willful misfeasance, bad faith, gross negligence or reckless disregard of its obligations thereunder, the Administrator is not liable to the Fund or any of its investors for any act or omission by the Administrator or for any losses sustained by the Fund or its investors. The Administration Agreement will continue unless terminated by either party by written notice delivered to the other party within 30 days.
D. Dealer Reallowances
Upon notice to selected broker-dealers, the Distributor may reallow up to the full applicable front-end sales charge during periods specified in such notice. During periods when 90% or more of the sales charge is reallowed, such selected broker-dealers may be deemed to be underwriters as that term is defined in the Securities Act.
E. Rule 12b-1 Plans
The Fund has adopted a Plan of Distribution, effective July 31, 2011, in accordance with Rule 12b-1 under the Investment Company Act with respect to its Class A, Class B and Class C shares and has adopted a Plan of Distribution and a Shareholder Services Plan, each effective July 31, 2011, in accordance with Rule 12b-1 under the Investment Company Act with respect to its Class R and Class W shares (each, a "Plan" and together, the "Plans"). Pursuant to the Plans, each Class, other than Class I, pays the Distributor compensation accrued daily and payable monthly at the following maximum annual rates: 0.25%, 1.00%, 1.00%, 0.50% and 0.35% of the average daily net assets of Class A, Class B, Class C, Class R and Class W shares, respectively. Prior to July 31, 2011, in accordance with Rule 12b-1 under the Investment Company Act, the Fund had adopted (i) a Plan of Distribution with respect to the Class A, Class B and Class C shares, and (ii) and a Plan of Distribution and a Shareholder Services Plan, each with respect to the Class R and Class W shares, each between the Fund and Morgan Stanley Distributors Inc. (the "Prior Distributor"), pursuant to which the Prior Distributor provided certain services in connection with the promotion and sale of the Fund's shares (each, a "Prior Plan" and together, the "Prior Plans").
The Distributor also receives the proceeds of front-end sales charges ("FSCs") and of contingent deferred sales charges ("CDSCs") imposed on certain redemptions of shares, which are separate and apart from payments made pursuant to the Plans. The Distributor and Prior Distributor have informed the Fund that each of them and/or Morgan Stanley & Co. received the proceeds of CDSCs and FSCs, for the last three fiscal years ended August 31, as applicable, in approximate amounts as provided in the table below.
| | | 2011 | | 2010 | | 2009 | |
| Class A | | FSCs:(1) | | $ | 2,142 | | | FSCs:(1) | | $ | 1,031 | | | FSCs:(1) | | $ | 5,425 | | |
| | | CDSCs: | | $ | — | | | CDSCs: | | $ | 1,092 | | | CDSCs: | | $ | 1,353 | | |
| Class B | | CDSCs: | | $ | 25,077 | | | CDSCs: | | $ | 39,843 | | | CDSCs: | | $ | 109,252 | | |
| Class C | | CDSCs: | | $ | 747 | | | CDSCs: | | $ | 2,297 | | | CDSCs: | | $ | 1,289 | | |
(1) FSCs apply to Class A only.
The entire fee payable by Class A and a portion of the fees payable by each of Class B, Class C, Class R and Class W shares each year pursuant to the Plans up to 0.25% of such Class' average daily net assets are currently each characterized as a "service fee" under the Rules of the Financial Industry Regulatory Authority ("FINRA") (of which the Distributor is a member). The "service fee" is a payment made for personal service and/or the maintenance of shareholder accounts. The remaining portion of the Plan fees payable by a Class, if any, is characterized as an "asset-based sales charge" as such is defined by the Rules of FINRA.
39
Under the Plans and as required by Rule 12b-1, the Trustees receive and review promptly after the end of each calendar quarter a written report provided by the Distributor of the amounts expended under the Plans and the purpose for which such expenditures were made. For the fiscal year ended August 31, 2011, Class A, Class B, Class C, Class R and Class W shares of the Fund made payments under the Plans and the Prior Plans amounting to $119,112, $134,995, $187,418, $442 and $312, respectively, which amounts are equal to 0.25%, 0.24%, 0.99%, 0.50% and 0.35% of the average daily net assets of Class A, Class B, Class C, Class R and Class W, respectively, for the fiscal year. The Distributor has agreed to reduce the 12b-1 fee on Class B shares to the extent it exceeds 0.24% of the average daily net assets of such shares on an annualized basis. This waiver will continue for at least one year or until such time as the Fund's Board of Trustees acts to discontinue all or a portion of such waiver when it deems that such action is appropriate. The amounts paid by the Class B and Class C shares reflect reductions of $435,119 and $2,744, respectively.
The Plans were adopted in order to permit the implementation of the Fund's method of distribution. Under this distribution method the Fund offers six Classes, each with a different distribution arrangement.
With respect to Class A shares, the Distributor generally compensates authorized dealers from proceeds of the FSC, commissions for the sale of Class A shares, currently a gross sales credit of up to 5.00% of the amount sold and an annual residual commission, currently a residual of up to 0.25% of the current value of the respective accounts for which they are dealers of record in all cases.
With respect to sales of Class B and Class C shares of the Fund, a commission or transaction fee generally will be compensated by the Distributor at the time of purchase directly out of the Distributor's assets (and not out of the Fund's assets) to authorized dealers who initiate and are responsible for such purchases computed based on a percentage of the dollar value of such shares sold of up to 4.00% on Class B shares and up to 1.00% on Class C shares.
Proceeds from any CDSC and any distribution fees on Class B and Class C shares of the Fund are paid to the Distributor and are used by the Distributor to defray its distribution related expenses in connection with the sale of the Fund's shares, such as the payment to authorized dealers for selling such shares. With respect to Class C shares, the authorized dealers generally receive from the Distributor ongoing distribution fees of up to 1.00% of the average daily net assets of the Fund's Class C shares annually commencing in the second year after purchase.
The distribution fee that the Distributor receives from the Fund under the Plans, in effect, offsets distribution expenses incurred under the Plans on behalf of the Fund and, in the case of Class B shares, opportunity costs, such as the gross sales credit and an assumed interest charge thereon ("carrying charge"). These expenses may include the cost of Fund-related educational and/or business-related trips or payment of Fund-related educational and/or promotional expenses of Financial Advisors. In the Distributor's reporting of the distribution expenses to the Fund, in the case of Class B shares, such assumed interest (computed at the "broker's call rate") has been calculated on the gross credit as it is reduced by amounts received by the Distributor under the Plans and any CDSCs received by the Distributor upon redemption of shares of the Fund. No other interest charge is included as a distribution expense in the Distributor's calculation of its distribution costs for this purpose. The broker's call rate is the interest rate charged to securities brokers on loans secured by exchange-listed securities.
The Fund may reimburse expenses incurred or to be incurred in promoting the distribution of the Fund's Class A, Class B, Class C, Class R and Class W shares and in servicing shareholder accounts. Reimbursement will be made through payments at the end of each month. The amount of each monthly payment may in no event exceed an amount equal to a payment at the annual rate of 0.25%, in the case of Class A shares, 1.00%, in the case of Class B and Class C shares, 0.50% in the case of Class R shares and 0.35% in the case of Class W shares, of the average daily net assets of the respective Class during the month. No interest or other financing charges, if any, incurred on any distribution expenses on behalf of Class A shares, Class C shares, Class R shares and Class W shares will be reimbursable under the Plans.
Each Class paid 100% of the amounts accrued under the Plans and the Prior Plans with respect to that Class for the fiscal year ended August 31, 2011 to the Distributor and the Prior Distributor, respectively.
40
It is estimated that the Distributor and the Prior Distributor spent this amount in approximately the following ways: (i) 0% ($0) — advertising and promotional expenses; (ii) 0% ($0) — printing and mailing of prospectuses for distribution to other than current shareholders; and (iii) 100% ($154,467) — other expenses, including the gross sales credit and the carrying charge, of which 0% ($0) represents carrying charges, 41.40% ($63,949) represents commission credits to Morgan Stanley Smith Barney and Morgan Stanley & Co. branch offices and other selected broker-dealers for payments of commissions to Financial Advisors and other authorized financial representatives, and 58.60% ($90,518) represents overhead and other branch office distribution-related expenses. The amounts accrued by Class A and a portion of the amounts accrued by Class C under the Plan and the Prior Plan relating to Class A and Class C during the fiscal year ended August 31, 2011 were service fees. The remainder of the amounts accrued by Class C were for expenses, which relate to compensation of sales personnel and associated overhead expenses.
In the case of Class B shares, at any given time, the expenses of distributing shares of the Fund may be more or less than the total of (i) the payments made by the Fund pursuant to the Plan; and (ii) the proceeds of CDSCs paid by investors upon redemption of shares. For example, if $1 million in expenses in distributing Class B shares of the Fund had been incurred and $750,000 had been received as described in (i) and (ii) above, the excess expense would amount to $250,000. The Distributor and the Prior Distributor have advised the Fund that in the case of Class B shares there were no excess distribution expenses, including carrying charges designed to approximate the opportunity costs incurred by Morgan Stanley Smith Barney and Morgan Stanley & Co. which arise from their having advanced monies without having received the amount of any sales charges imposed at the time of sale of the Fund's Class B shares, as of August 31, 2011 (the end of the Fund's fiscal year). Because there is no requirement under the Plans or the Prior Plans that the Distributor or the Prior Distributor, respectively, be reimbursed for all distribution expenses with respect to Class B shares or any requirement that the Plans be continued from year to year, this excess amount does not constitute a liability of the Fund. Although there is no legal obligation for the Fund to pay expenses incurred in excess of payments made to the Distributor under the Plan and the proceeds of CDSCs paid by investors upon redemption of shares, if for any reason the Plans are terminated, the Trustees will consider at that time the manner in which to treat such expenses. Any cumulative expenses incurred, but not yet recovered through distribution fees or CDSCs, may or may not be recovered through future distribution fees or CDSCs.
In the case of Class A, Class C, Class R and Class W shares, expenses incurred pursuant to the Plans in any calendar year in excess of 0.25%, 1.00%, 0.50% or 0.35% of the average daily net assets of Class A, Class C, Class R and Class W shares, respectively, will not be reimbursed by the Fund through payments in any subsequent year, except that expenses representing a gross sales commission credited to Morgan Stanley Smith Barney Financial Advisors and other authorized financial representatives at the time of sale may be reimbursed in the subsequent calendar year. The Distributor and the Prior Distributor have advised the Fund that there were no unreimbursed expenses representing a gross sales commission credited to Morgan Stanley Smith Barney Financial Advisors and other authorized financial representatives in the case of Class A or Class C at December 31, 2010 (the end of the calendar year). No interest or other financing charges will be incurred on any Class A, Class C, Class R and Class W shares distribution expenses incurred by the Distributor under the Plans or on any unreimbursed expenses due to the Distributor or the Prior Distributor pursuant to the Plans or the Prior Plans, respectively.
No interested person of the Fund nor any Independent Trustee has any direct financial interest in the operation of the Plan except to the extent that the Distributor, the Adviser, Morgan Stanley & Co., Morgan Stanley Smith Barney, Morgan Stanley Services or certain of their employees may be deemed to have such an interest as a result of benefits derived from the successful operation of the Plans or as a result of receiving a portion of the amounts expended thereunder by the Fund.
On an annual basis, the Trustees, including a majority of the Independent Trustees, consider whether the Plans should be continued. Prior to approving the last continuation of the Plan, the Trustees requested and received from the Distributor and reviewed all the information which they deemed necessary to arrive at an informed determination. In making their determination to continue the Plan, the Trustees considered: (1) the Fund's experience under the Plan and whether such experience indicates that the Plan is operating as anticipated; (2) the benefits the Fund had obtained, was obtaining and would be likely to obtain under
41
the Plan, including that: (a) the Plan is essential in order to give Fund investors a choice of alternatives for payment of distribution and service charges and to enable the Fund to continue to grow and avoid a pattern of net redemptions which, in turn, are essential for effective investment management; and (b) without the compensation to individual brokers and the reimbursement of distribution and account maintenance expenses of Morgan Stanley & Co. and Morgan Stanley Smith Barney branch offices made possible by the 12b-1 fees, Morgan Stanley & Co. and Morgan Stanley Smith Barney could not establish and maintain an effective system for distribution, servicing of Fund shareholders and maintenance of shareholder accounts; and (3) what services had been provided and were continuing to be provided under the Plan to the Fund and its shareholders. Based upon their review, the Trustees, including each of the Independent Trustees, determined that continuation of the Plan would be in the best interest of the Fund and would have a reasonable likelihood of continuing to benefit the Fund and its shareholders.
The Plans may not be amended to increase materially the amount to be spent for the services described therein without approval by the shareholders of the affected Class or Classes of the Fund, and all material amendments to the Plans must also be approved by the Trustees. The Plan may be terminated at any time, without payment of any penalty, by vote of a majority of the Independent Trustees or by a vote of a majority of the outstanding voting securities of the Fund (as defined in the Investment Company Act) on not more than 30 days' written notice to any other party to the Plans. So long as the Plans are in effect, the election and nomination of Independent Trustees shall be committed to the discretion of the Independent Trustees.
F. Other Service Providers
(1) Transfer Agent/Dividend Disbursing Agent
Morgan Stanley Services Company Inc., P.O. Box 219886, Kansas City, MO 64121-9804, is the Transfer Agent for the Fund's shares and the Dividend Disbursing Agent for payment of dividends and distributions on Fund shares and Agent for shareholders under various investment plans.
(2) Custodian and Independent Registered Public Accounting Firm
State Street Bank and Trust Company, One Lincoln Street, Boston, MA 02111, is the Custodian of the Fund's assets. Any of the Fund's cash balances with the Custodian in excess of $250,000 (a temporary increase from $100,000, which is due to expire on December 31, 2013) are unprotected by federal deposit insurance. These balances may, at times, be substantial.
As of June 7, 2011, Ernst & Young LLP, located at 200 Clarendon Street, Boston, MA 02116-5072, is the independent registered public accounting firm of the Fund. Prior to June 7, 2011, Deloitte & Touche LLP, located at Two World Financial Center, New York, NY 10281, was the independent registered public accounting firm of the Fund. The Fund's independent registered public accounting firm is responsible for auditing the annual financial statements.
(3) Affiliated Persons
The Transfer Agent is an affiliate of the Adviser, the Sub-Advisers and the Distributor. As Transfer Agent and Dividend Disbursing Agent, the Transfer Agent's responsibilities include maintaining shareholder accounts, disbursing cash dividends and reinvesting dividends, processing account registration changes, handling purchase and redemption transactions, mailing prospectuses and reports, mailing and tabulating proxies, processing share certificate transactions, and maintaining shareholder records and lists. Pursuant to a Transfer Agency and Service Agreement, as consideration for the services it provides, the Transfer Agent receives certain fees from the Fund, which are approved by the Trustees, generally based on the number of shareholder accounts and is reimbursed for its out-of-pocket expenses in connection with such services. The Fund and the Transfer Agent may enter into agreements with unaffiliated third party intermediaries, pursuant to which such intermediaries agree to provide recordkeeping and other administrative services for their clients who invest in the Fund. In such instances, the Fund will pay certain fees to the intermediaries for the services they provide that otherwise would have been performed by the Transfer Agent.
42
G. Fund Management
Other Accounts Managed by Portfolio Managers at August 31, 2011 (unless otherwise indicated):
| | | Registered
Investment Companies | | Other Pooled
Investment Vehicles | | Other Accounts | |
| Portfolio Managers | | Number of
Accounts | | Total Assets
in the Accounts | | Number of
Accounts | | Total Assets
in the Accounts | | Number of
Accounts | | Total Assets
in the Accounts | |
| William D. Lock | | | 5 | | | $5.0 billion | | | 7 | | | $8.4 billion | | | 47 | * | | $12.1 billion* | |
| Walter B. Riddell | | | 5 | | | $5.0 billion | | | 7 | | | $8.4 billion | | | 47 | * | | $12.1 billion* | |
| Peter J. Wright | | | 5 | | | $5.0 billion | | | 7 | | | $8.4 billion | | | 47 | * | | $12.1 billion* | |
| Vladimir A. Demine | | | 5 | | | $5.0 billion | | | 7 | | | $8.4 billion | | | 47 | * | | $12.1 billion* | |
| Christian Derold | | | 5 | | | $5.0 billion | | | 7 | | | $8.4 billion | | | 47 | * | | $12.1 billion* | |
| John Goodacre | | | 5 | | | $5.0 billion | | | 7 | | | $8.4 billion | | | 47 | * | | $12.1 billion* | |
| Bruno Paulson | | | 5 | | | $5.0 billion | | | 7 | | | $8.4 billion | | | 47 | * | | $12.1 billion* | |
* Of these other accounts, two accounts with assets of approximately $658.4 million had performance-based fees.
Because the portfolio managers may manage assets for other investment companies, pooled investment vehicles and/or other accounts (including institutional clients, pension plans and certain high net worth individuals), there may be an incentive to favor one client over another resulting in conflicts of interest. For instance, the Adviser and/or Sub-Advisers may receive fees from certain accounts that are higher than the fee they receive from the Fund, or they may receive a performance-based fee on certain accounts. In those instances, the portfolio managers may have an incentive to favor the higher and/or performance-based fee accounts over the Fund. In addition, a conflict of interest could exist to the extent the Adviser and/or Sub-Advisers have proprietary investments in certain accounts, where portfolio managers have personal investments in certain accounts or when certain accounts are investment options in the Adviser's and/or Sub-Advisers' employee benefits and/or deferred compensation plans. The portfolio managers may have an incentive to favor these accounts over others. If the Adviser and/or Sub-Advisers manage accounts that engage in short sales of securities of the type in which the Fund invests, the Adviser and/or Sub-Advisers could be seen as harming the performance of the Fund for the benefit of the accounts engaging in short sales if the short sales cause the market value of the securities to fall. The Adviser and/or Sub-Advisers have adopted trade allocation and other policies and procedures that they believe are reasonably designed to address these and other conflicts of interest.
Portfolio Manager Compensation Structure
Portfolio managers receive a combination of base compensation and discretionary compensation, comprising a cash bonus and several deferred compensation programs described below. The methodology used to determine portfolio manager compensation is applied across all funds/accounts managed by the portfolio managers.
Base salary compensation. Generally, portfolio managers receive base salary compensation based on the level of their position with the Adviser and/or Sub-Advisers.
Discretionary compensation. In addition to base compensation, portfolio managers may receive discretionary compensation.
Discretionary compensation can include:
• Cash Bonus.
• Morgan Stanley's Long Term Incentive Compensation awards — a mandatory program that defers a portion of discretionary year-end compensation into restricted stock units or other awards based on Morgan Stanley common stock or other plans that are subject to vesting and other conditions.
• Investment Management Alignment Plan (IMAP) awards — a mandatory program that defers a portion of discretionary year-end compensation and notionally invests it in designated funds advised by the Adviser or its affiliates. The award is subject to vesting and other conditions. Portfolio managers must notionally invest a minimum of 25% to a maximum of 100% of their IMAP deferral account into a combination of the designated funds they manage that are included in the IMAP fund menu, which may or may not include the Fund. IMAP awards contain a clawback provision that can be triggered if an individual engages in certain conduct detrimental to Morgan Stanley or
43
one of its businesses — such as causing the need for a material restatement of results, a substantial loss on a holding or any loss on a holding if the employee operated outside of risk parameters, where such holding was a factor in determining compensation.
• Voluntary Deferred Compensation Plans — voluntary programs that permit certain employees to elect to defer a portion of their discretionary year-end compensation and notionally invest the deferred amount across a range of designated investment funds, which may include funds advised by the Adviser and/or Sub-Advisers or their affiliates.
Several factors determine discretionary compensation, which can vary by portfolio management team and circumstances. These factors include:
• Revenues generated by the investment companies, pooled investment vehicles and other accounts managed by the portfolio manager.
• The investment performance of the funds/accounts managed by the portfolio manager.
• Contribution to the business objectives of the Adviser.
• The dollar amount of assets managed by the portfolio manager.
• Market compensation survey research by independent third parties.
• Other qualitative factors, such as contributions to client objectives.
• Performance of Morgan Stanley and Morgan Stanley Investment Management, and the overall performance of the investment team(s) of which the portfolio manager is a member.
Securities Ownership of Portfolio Managers
As of August 31, 2011, the dollar range of securities beneficially owned by each portfolio manager in the Fund is shown below:
| William D. Lock | | | None* | | |
| Walter B. Riddell | | | None* | | |
| Peter J. Wright | | | None* | | |
| Vladimir A. Demine | | | None* | | |
| Christian Derold | | | None* | | |
| John S. Goodacre | | | None* | | |
| Bruno Paulson | | | None* | | |
* Not included in the table above, the portfolio manager has made investments in one or more mutual funds managed by the same portfolio management team pursuant to a similar strategy.
H. Codes of Ethics
The Fund, the Adviser, the Sub-Advisers and the Distributor have each adopted a Code of Ethics pursuant to Rule 17j-1 under the Investment Company Act. The Codes of Ethics are designed to detect and prevent improper personal trading. The Codes of Ethics permit personnel subject to the Codes to invest in securities, including securities that may be purchased, sold or held by the Fund, subject to a number of restrictions and controls, including prohibitions against purchases of securities in an initial public offering and a preclearance requirement with respect to personal securities transactions.
I. Proxy Voting Policy and Proxy Voting Record
The Board of Trustees believes that the voting of proxies on securities held by the Fund is an important element of the overall investment process. As such, the Trustees have delegated the responsibility to vote such proxies to MSIM.
A copy of MSIM's Proxy Voting Policy ("Proxy Policy") is attached hereto as Appendix A. In addition, a copy of the Proxy Policy, as well as the Fund's most recent proxy voting record for the 12-month period ended June 30, as filed with the SEC, are available without charge on our web site at www.morganstanley.com/im. The Fund's proxy voting record is also available without charge on the SEC's web site at www.sec.gov.
44
J. Revenue Sharing
The Adviser and/or Distributor may pay compensation, out of their own funds and not as an expense of the Fund, to Morgan Stanley Smith Barney, Citigroup Global Markets Inc. ("CGM") and certain unaffiliated brokers, dealers or other financial intermediaries, including recordkeepers and administrators of various deferred compensation plans ("Intermediaries") in connection with the sale, distribution, marketing and retention of Fund shares and/or shareholder servicing. For example, the Adviser or the Distributor may pay additional compensation to Intermediaries for, among other things, promoting the sale and distribution of Fund shares, providing access to various programs, mutual fund platforms or preferred or recommended mutual fund lists that may be offered by an Intermediary, granting the Distributor access to the Intermediary's financial advisors and consultants, providing assistance in the ongoing education and training of an Intermediary's financial personnel, furnishing marketing support, maintaining share balances and/or for sub-accounting, recordkeeping, administrative, shareholder or transaction processing services. Such payments are in addition to any distribution fees, shareholder service fees and/or transfer agency fees that may be payable by the Fund. The additional payments may be based on various factors, including level of sales (based on gross or net sales or some specified minimum sales or some other similar criteria related to sales of the Fund and/or some or all other Morgan Stanley Funds), amount of assets invested by the Intermediary's customers (which could include current or aged assets of the Fund and/or some or all other Morgan Stanley Funds), a Fund's advisory fees some other agreed upon amount, or other measures as determined from time to time by the Adviser and/or Distributor. The amount of these payments may be different for different Intermediaries.
With respect to Morgan Stanley Smith Barney and CGM, these payments currently include the following amounts, which are paid in accordance with the applicable compensation structure:
(1) On $1 million or more of Class A shares (for which no sales charge was paid) or net asset value purchases by certain employee benefit plans, Morgan Stanley Smith Barney and CGM, as applicable, receive a gross sales credit of up to 1.00% of the amount sold.*
(2) On Class A, Class B, Class C and Class I shares of the Fund held in traditional brokerage accounts where Morgan Stanley Smith Barney or CGM is designated by purchasers as broker-dealer of record:
• For the period beginning January 1, 2011 and ending December 31, 2011, an amount up to $1.6 million, which covers the Fund and all other Morgan Stanley Funds; and
• For the period beginning January 1, 2012 and thereafter, an ongoing annual fee in an amount up to 0.13% of the total average quarterly net asset value of such shares.
(3) On Class I shares of the Fund held directly in traditional brokerage accounts where Morgan Stanley Smith Barney is designated by purchasers as broker-dealer of record in addition to the amounts referenced in paragraph (2) above:
• A gross sales credit of 0.25% of the amount sold and an ongoing annual fee in an amount up to 0.10% of the total average monthly net asset value of such shares; or
• An ongoing annual fee in an amount up to 35% of the advisory fee the Adviser receives based on the average daily net assets of such shares.
There is a chargeback of 100% of the gross sales credit amount paid if the Class I shares are redeemed in the first year and a chargeback of 50% of the gross sales credit amount paid if the shares are redeemed in the second year.
(4) On Class A, Class B, Class C and Class I shares of the Fund held in taxable accounts through any fee-based advisory program offered by the Morgan Stanley channel of Morgan Stanley Smith Barney, an ongoing annual fee in an amount up to 0.03% of the total average monthly net asset value of such shares.
(5) On any shares of the Fund held in an account through certain 401(k) platforms in the Morgan Stanley channel of Morgan Stanley Smith Barney's Corporate Retirement Solutions, an ongoing
45
annual fee in an amount up to 0.20% of the total average monthly net asset value of such shares.
With respect to other Intermediaries, these payments currently include the following amounts, which are paid in accordance with the applicable compensation structure for each Intermediary:
(1) On $1 million or more of Class A shares (for which no sales charge was paid) or net asset value purchases by certain employee benefit plans, Intermediaries receive a gross sales credit of up to 1.00% of the amount sold.*
(2) On Class A, Class B and Class C shares of the Fund held in Intermediary accounts other than those held through Intermediary 401(k) platforms, an ongoing annual fee in an amount up to 0.10% of the total average monthly net asset value of such shares.
(3) On Class I shares of the Fund held in Intermediary accounts other than those held through Intermediary 401(k) platforms:
• A gross sales credit of 0.25% of the amount sold; and
• An ongoing annual fee in an amount up to 0.10% of the total average monthly net asset value of such shares.
There is a chargeback of 100% of the gross sales credit amount paid if the Class I shares are redeemed in the first year and a chargeback of 50% of the gross sales credit amount paid if the shares are redeemed in the second year.
The prospect of receiving, or the receipt of, additional compensation, as described above, by Intermediaries may provide such Intermediaries, and/or their financial advisors or other salespersons, with an incentive to favor sales of shares of the Fund over other investment options with respect to which an Intermediary does not receive additional compensation (or receives lower levels of additional compensation). These payment arrangements, however, will not change the price that an investor pays for shares of the Fund or the amount that the Fund receives to invest on behalf of an investor. Investors may wish to take such payment arrangements into account when considering and evaluating any recommendations relating to Fund shares and should review carefully any disclosure provided by Intermediaries as to their compensation.
VI. BROKERAGE ALLOCATION AND OTHER PRACTICES
A. Brokerage Transactions
Subject to the general supervision of the Trustees, the Adviser and the Sub-Advisers are responsible for decisions to buy and sell securities for the Fund, the selection of brokers and dealers to effect the transactions, and the negotiation of brokerage commissions, if any. Purchases and sales of securities on a stock exchange are effected through brokers who charge a commission for their services. In the OTC market, securities are generally traded on a "net" basis with dealers acting as principal for their own accounts without a stated commission, although the price of the security usually includes a profit to the dealer. The Fund also expects that securities will be purchased at times in underwritten offerings where the price includes a fixed amount of compensation, generally referred to as the underwriter's concession or discount. Options and futures transactions will usually be effected through a broker and a commission will be charged. On occasion, the Fund may also purchase certain money market instruments directly from an issuer, in which case no commissions or discounts are paid.
During the fiscal years ended August 31, 2009, 2010 and 2011, the Fund paid a total of $367,223, $297,186 and $229,158, respectively, in brokerage commissions.
* Commissions or transaction fees paid when Morgan Stanley Smith Barney, CGM or other Intermediaries initiate and are responsible for purchases of $1 million or more are computed on a percentage of the dollar value of such shares sold as follows: 1.00% on sales of $1 million to $2 million, plus 0.75% on the next $1 million, plus 0.50% on the next $2 million, plus 0.25% on the excess over $5 million.
46
B. Commissions
Pursuant to an order issued by the SEC, the Fund is permitted to engage in principal transactions involving money market instruments, subject to certain conditions, with Morgan Stanley & Co., a broker-dealer affiliated with the Fund's Adviser.
During the fiscal years ended August 31, 2009, 2010 and 2011, the Fund did not effect any principal transactions with Morgan Stanley & Co.
Brokerage transactions in securities listed on exchanges or admitted to unlisted trading privileges may be effected through Morgan Stanley & Co., Citigroup, Inc. and other affiliated brokers and dealers. In order for an affiliated broker or dealer to effect any portfolio transactions on an exchange for the Fund, the commissions, fees or other remuneration received by the affiliated broker or dealer must be reasonable and fair compared to the commissions, fees or other remuneration paid to other brokers in connection with comparable transactions involving similar securities being purchased or sold on an exchange during a comparable period of time. This standard would allow the affiliated broker or dealer to receive no more than the remuneration which would be expected to be received by an unaffiliated broker in a commensurate arm's-length transaction. Furthermore, the Trustees, including the Independent Trustees, have adopted procedures which are reasonably designed to provide that any commissions, fees or other remuneration paid to an affiliated broker or dealer are consistent with the foregoing standard. The Fund does not reduce the management fee it pays to the Adviser by any amount of the brokerage commissions it may pay to an affiliated broker or dealer.
During the fiscal years ended August 31, 2009, 2010 and 2011, the Fund paid a total of $523, $0 and $0, respectively, in brokerage commissions to Morgan Stanley & Co.
For the period June 1, 2009 to August 31, 2009, and during the fiscal years ended August 31, 2010 and 2011, the Fund paid a total of $632, $4,152 and $4,956 in brokerage commissions to Citigroup, Inc. During the fiscal year ended August 31, 2011, the brokerage commissions paid to Citigroup, Inc. represented approximately 2.16% of the total brokerage commissions paid by the Fund during the period and were paid on account of transactions having an aggregate dollar value equal to approximately 4.21% of the aggregate dollar value of all portfolio transactions of the Fund during the period for which commissions were paid.
C. Brokerage Selection
The policy of the Fund regarding purchases and sales of securities for its portfolio is that primary consideration will be given to obtaining the most favorable prices and efficient executions of transactions. The Adviser and/or the Sub-Advisers are prohibited from directing brokerage transactions on the basis of the referral of clients or the sale of shares of investment companies for which they act as investment adviser and/or sub-advisers. Consistent with this policy, when securities transactions are effected on a stock exchange, the Fund's policy is to pay commissions which are considered fair and reasonable without necessarily determining that the lowest possible commissions are paid in all circumstances. The Fund believes that a requirement always to seek the lowest possible commission cost could impede effective portfolio management and preclude the Fund and the Adviser and/or the Sub-Advisers from obtaining a high quality of brokerage and research services. The Fund anticipates that certain of its transactions involving foreign securities will be effected on foreign securities exchanges. Fixed commissions on such transactions are generally higher than negotiated commissions on domestic transactions. There is also generally less government supervision and regulation of foreign securities exchanges and brokers than in the United States.
In seeking to implement the Fund's policies, the Adviser and/or the Sub-Advisers effect transactions with those broker-dealers that they believe provide prompt execution of orders in an effective manner at the most favorable prices. The Adviser and/or the Sub-Advisers may place portfolio transactions with those broker-dealers that also furnish research and other services to the Fund or the Adviser and/or the Sub-Advisers. Services provided may include certain research services (as described below) as well as effecting securities transactions and performing functions incidental thereto (such as clearance settlement and custody).
47
The Adviser and its affiliated investment advisers have established commission sharing arrangements under a commission management program (the "Commission Management Program" or "CMP"), pursuant to which execution and research costs or a portion of those costs are decoupled in accordance with applicable laws, rules and regulations. Under the CMP, the Adviser and its affiliated investment advisers select approved equity brokers (which include the Adviser's affiliates) for execution services, and after accumulation of commissions at such brokers, the Adviser and/or its affiliates instruct these approved equity brokers to pay for eligible research provided by executing brokers or third-party research providers, which are selected independently by a Research Services Committee of the Adviser and its affiliated investment advisers. Generally, the Adviser and its affiliated investment advisers will direct the approved equity broker to record research credits based upon a previously agreed-upon allocation and will periodically instruct the approved equity broker to direct specified dollar amounts from that pool to pay for eligible research services provided by third-party research providers and executing brokers. The research credits are pooled among the Adviser and its affiliated investment advisers and allocated from this pool. Likewise, the research services obtained under the CMP are shared among the Adviser and its affiliated investment advisers.
Selection of approved equity brokers for execution is based on three main criteria: access to liquidity, provision of capital and quality of execution. Under the CMP, each approved equity broker is responsible for the payment of fees for research services and obtains the research services pursuant to written agreements between the approved equity broker and the third-party research provider.
For those costs not decoupled, but retained by broker-dealers, the Adviser also effects transactions with brokers which directly pay for research services provided by those brokers in accordance with Section 28(e) of the Exchange Act. Such transactions include equity transactions and may include fixed-income transactions effected on an agency basis.
Transactions involving client accounts managed by two or more affiliated investment advisers may be aggregated and executed using the services of broker-dealers that provide third party benefits/research so long as: (i) all client accounts involved in the transaction benefit from one or more of the services offered by such broker-dealer; and (ii) each affiliated investment adviser has approved the use of such broker-dealer and the services provided thereby.
The research services received include those of the nature described above and other services which aid the Adviser in fulfilling its investment decision-making responsibilities, including (a) furnishing advice as to the value of securities, the advisability of investing in, purchasing or selling securities, and the availability of securities or purchasers or sellers of securities; and (b) furnishing analyses and reports concerning issuers, industries, securities, economic factors and trends, portfolio strategy, and the performance of accounts. Where a particular item has both research and non-research related uses (such as proxy services where both research services and services relating to the administration of the proxy itself are provided), the Adviser will make a reasonable allocation of the cost of the item between research and non-research uses and will only pay for the portion of the cost allocated to research uses with client brokerage transactions. Research services furnished or paid for by brokers through whom the Adviser effects transactions for a particular account may be used by the Adviser or its affiliated investment advisers in servicing their other accounts, and not all such services may be used for the benefit of the client which pays the brokerage commission that results in the receipt of such research services. Commissions paid to brokers providing research services may be higher than those charged by brokers not providing services.
The Adviser and its affiliated investment advisers make a good faith determination of the value of research services in accordance with Section 28(e) of the Exchange Act, UK Financial Services Authority Rules and other relevant regulatory requirements.
Certain investment professionals and other employees of the Adviser are also officers of affiliated investment advisers and may provide investment advisory services to clients of such affiliated investment advisers. The Adviser's personnel also provide research and trading support to personnel of certain affiliated investment advisers. Research related costs may be shared by affiliated investment advisers and may benefit the clients of such affiliated investment advisers. Research services that benefit the Adviser may be received in connection with commissions generated by clients of its affiliated investment advisers. Similarly, research services received in connection with commissions generated by the Adviser's clients
48
may benefit affiliated investment advisers and their clients. Moreover, research services provided by broker-dealers through which the Adviser effects transactions for a particular account may be used by the Adviser and/or an affiliated investment adviser in servicing its other accounts and not all such research services may be used for the benefit of the particular client, which pays the brokerage commission giving rise to the receipt of such research services.
The Adviser and certain of its affiliates currently serve as investment adviser to a number of clients, including other investment companies, and may in the future act as investment adviser to others. It is the practice of the Adviser and its affiliates to cause purchase and sale transactions to be allocated among clients whose assets they manage (including the Fund) in such manner as it deems equitable. In making such allocations among the Fund and other client accounts, various factors may be considered, including the respective investment objectives, the relative size of portfolio holdings of the same or comparable securities, the availability of cash for investment, the size of investment commitments generally held and the opinions of the persons responsible for managing the portfolios of the Fund and other client accounts. The Adviser and its affiliates may operate one or more order placement facilities and each facility will implement order allocation in accordance with the procedures described above. From time to time, each facility may transact in a security at the same time as other facilities are trading in that security.
D. Regular Broker-Dealers
During the fiscal year ended August 31, 2011, the Fund purchased securities issued by Barclays Capital Group, UBS Financial Services, Inc. and HSBC Holdings PLC which were among the ten brokers or ten dealers which executed transactions for or with the Fund in the largest dollar amounts during the period. At August 31, 2011, the Fund held securities issued by Barclays Capital Group, UBS Financial Services, Inc. and HSBC Holdings PLC, with market values of $2,712,480, $2,712,303 and $5,161,231, respectively.
VII. CAPITAL STOCK AND OTHER SECURITIES
The shareholders of the Fund are entitled to a full vote for each full share of beneficial interest held. The Fund is authorized to issue an unlimited number of shares of beneficial interest. All shares of beneficial interest of the Fund are of $0.01 par value and are equal as to earnings, assets and voting privileges except that each Class will have exclusive voting privileges with respect to matters relating to distribution expenses borne solely by such Class or any other matter in which the interests of one Class differ from the interests of any other Class. In addition, Class B shareholders will have the right to vote on any proposed material increase in Class A's expenses, if such proposal is submitted separately to Class A shareholders. Also, Class A, Class B, Class C, Class R and Class W bear expenses related to the distribution of their respective shares.
The Fund's Declaration of Trust permits the Trustees to authorize the creation of additional series of shares (the proceeds of which would be invested in separate, independently managed portfolios) and additional Classes of shares within any series. The Trustees have not presently authorized any such additional series or Classes of shares other than as set forth in the Prospectus.
The Fund is not required to hold annual meetings of shareholders and in ordinary circumstances the Fund does not intend to hold such meetings. The Trustees may call special meetings of shareholders for action by shareholder vote as may be required by the Investment Company Act or the Declaration of Trust. Under certain circumstances, the Trustees may be removed by the actions of the Trustees. In addition, under certain circumstances, the shareholders may call a meeting to remove the Trustees and the Fund is required to provide assistance in communicating with shareholders about such a meeting. The voting rights of shareholders are not cumulative, so that holders of more than 50% of the shares voting can, if they choose, elect all Trustees being selected, while the holders of the remaining shares would be unable to elect any Trustees.
Under Massachusetts law, shareholders of a business trust may, under certain limited circumstances, be held personally liable as partners for the obligations of the Fund. However, the Declaration of Trust contains an express disclaimer of shareholder liability for acts or obligations of the Fund, requires that
49
notice of such Fund obligations include such disclaimer, and provides for indemnification out of the Fund's property for any shareholder held personally liable for the obligations of the Fund. Thus, the risk of a shareholder incurring financial loss on account of shareholder liability is limited to circumstances in which the Fund itself would be unable to meet its obligations. Given the above limitations on shareholder personal liability, and the nature of the Fund's assets and operations, the possibility of the Fund being unable to meet its obligations is remote and thus, in the opinion of Massachusetts counsel to the Fund, the risk to Fund shareholders of personal liability is remote.
The Trustees themselves have the power to alter the number and the terms of office of the Trustees (as provided for in the Declaration of Trust), and they may at any time lengthen or shorten their own terms or make their terms of unlimited duration and appoint their own successors, provided that always at least a majority of the Trustees has been elected by the shareholders of the Fund.
VIII. PURCHASE, REDEMPTION AND PRICING OF SHARES
A. Purchase/Redemption of Shares
Information concerning how Fund shares are offered to the public (and how they are redeemed and exchanged) is provided in the Fund's Prospectus.
Suspension of Redemptions. Redemptions are not made on days during which the NYSE is closed. The right of redemption may be suspended and the payment therefore may be postponed for more than seven days during any period when (a) the NYSE is closed for other than customary weekends or holidays; (b) the SEC determines trading on the NYSE is restricted; (c) the SEC determines an emergency exists as a result of which disposal by the Fund of securities owned by it is not reasonably practicable or it is not reasonably practicable for the Fund to fairly determine the value of its net assets; or (d) the SEC, by order, so permits.
Transfer Agent as Agent. With respect to the redemption or repurchase of Fund shares, the application of proceeds to the purchase of new shares in the Fund or any other Morgan Stanley Funds and the general administration of the exchange privilege, the Transfer Agent acts as agent for the Distributor and for the shareholder's authorized broker-dealer, if any, in the performance of such functions. With respect to exchanges, redemptions or repurchases, the Transfer Agent is liable for its own negligence and not for the default or negligence of its correspondents or for losses in transit. The Fund is not liable for any default or negligence of the Transfer Agent, the Distributor or any authorized broker-dealer.
The Distributor and any authorized broker-dealer have appointed the Transfer Agent to act as their agent in connection with the application of proceeds of any redemption of Fund shares to the purchase of shares of any other Morgan Stanley Fund and the general administration of the exchange privilege. No commission or discounts will be paid to the Distributor or any authorized broker-dealer for any transaction pursuant to the exchange privilege.
Transfers of Shares. In the event a shareholder requests a transfer of Fund shares to a new registration, the shares will be transferred without sales charge at the time of transfer. With regard to the status of shares which are either subject to the CDSC or free of such charge (and with regard to the length of time shares subject to the charge have been held), any transfer involving less than all of the shares in an account will be made on a pro rata basis (that is, by transferring shares in the same proportion that the transferred shares bear to the total shares in the account immediately prior to the transfer). The transferred shares will continue to be subject to any applicable CDSC as if they had not been so transferred.
Outside Brokerage Accounts/Limited Portability. Most Fund shareholders hold their shares with Morgan Stanley Smith Barney. Please note that your ability to transfer your Fund shares to a brokerage account at another securities dealer may be limited. Fund shares may only be transferred to accounts held at securities dealers or financial intermediaries that have entered into agreements with the Distributor. After a transfer, you may purchase additional shares of the Morgan Stanley Fund(s) you owned before the transfer and, in most instances, you will also be able to purchase shares of most other Morgan Stanley Funds. If you transfer shares of a fund that is not a Multi-Class Fund (for example, a Money Market Fund) you will not be able to exchange shares of that fund for any other Morgan Stanley Fund after the transfer.
50
If you wish to transfer Fund shares to a securities dealer or other financial intermediary that has not entered into an agreement with the Distributor, you may request that the securities dealer or financial intermediary maintain the shares in an account at the Transfer Agent registered in the name of such securities dealer or financial intermediary for your benefit. You may also hold your Fund shares in your own name directly with the Transfer Agent. In either case, you will continue to have the ability to purchase additional Morgan Stanley Funds and will have full exchange privileges. Other options may also be available; please check with the respective securities dealer or financial intermediary. If you choose not to hold your shares with the Transfer Agent, either directly or through a securities dealer or other financial intermediary, you must redeem your shares and pay any applicable CDSC.
B. Offering Price
The Fund's Class B, Class C, Class I, Class R and Class W shares are offered at net asset value per share and the Class A shares are offered at net asset value per share plus any applicable FSC which is distributed among the Fund's Distributor, Morgan Stanley Smith Barney and other authorized dealers as described in Section "V. Investment Advisory and Other Services-E. Rule 12b-1 Plans." The price of Fund shares, called "net asset value," is based on the value of the Fund's portfolio securities. Net asset value per share of each Class is calculated by dividing the value of the portion of the Fund's securities and other assets attributable to that Class, less the liabilities attributable to that Class, by the number of shares of that Class outstanding. The assets of each Class of shares are invested in a single portfolio. The net asset value of each Class, however, will differ because the Classes have different ongoing fees.
In the calculation of the Fund's net asset value: (1) an equity portfolio security listed or traded on the NYSE or other exchange is valued at its latest sale price, prior to the time when assets are valued; if there were no sales that day, the security is valued at the mean between the last reported bid and asked price; (2) an equity portfolio security listed or traded on the Nasdaq is valued at the Nasdaq Official Closing Price; if there were no sales that day, the security is valued at the mean between the last reported bid and asked price; and (3) all other portfolio securities for which OTC market quotations are readily available are valued at the mean between the last reported bid and asked price. In cases where a security is traded on more than one exchange, the security is valued on the exchange designated as the primary market. For equity securities traded on foreign exchanges, the closing price or the latest bid price may be used if there were no sales on a particular day. When market quotations are not readily available, including circumstances under which it is determined by the Adviser that the sale price, the bid price or the mean between the last reported bid and asked price are not reflective of a security's market value, portfolio securities are valued at their fair value as determined in good faith under procedures established by and under the general supervision of the Fund's Trustees. For valuation purposes, quotations of foreign portfolio securities, other assets and liabilities and forward contracts stated in foreign currency are translated into U.S. dollar equivalents at the prevailing market rates prior to the close of the NYSE.
Short-term debt securities with remaining maturities of 60 days or less at the time of purchase are valued at amortized cost, unless the Trustees determine such price does not reflect the securities' market value, in which case these securities will be valued at their fair value as determined by the Trustees.
Certain of the Fund's portfolio securities may be valued by an outside pricing service approved by the Fund's Trustees. The pricing service may utilize a matrix system incorporating security quality, maturity and coupon as the evaluation model parameters, and/or research evaluations by its staff, including review of broker-dealer market price quotations in determining what it believes is the fair valuation of the portfolio securities valued by such pricing service.
Listed options on debt securities are valued at the latest sale price on the exchange on which they are listed unless no sales of such options have taken place that day, in which case they will be valued at the mean between their latest bid and asked prices. Unlisted options on debt securities and all options on equity securities are valued at the mean between their latest bid and asked prices. Futures are valued at the latest price published by the commodities exchange on which they trade unless it is determined that such price does not reflect their market value, in which case they will be valued at their fair value as determined in good faith under procedures established by and under the supervision of the Trustees.
51
Generally, trading in foreign securities, as well as corporate bonds, U.S. government securities and money market instruments, is substantially completed each day at various times prior to the close of the NYSE. The values of such securities used in computing the net asset value of the Fund's shares are determined as of such times. Foreign currency exchange rates are also generally determined prior to the close of the NYSE. Occasionally, events which may affect the values of such securities and such exchange rates may occur between the times at which they are determined and the close of the NYSE and will therefore not be reflected in the computation of the Fund's net asset value. If events that may affect the value of such securities occur during such period, then these securities may be valued at their fair value as determined in good faith under procedures established by and under the supervision of the Trustees.
IX. TAXATION OF THE FUND AND SHAREHOLDERS
The Fund generally will make two basic types of distributions: ordinary dividends and long-term capital gain distributions. These two types of distributions are reported differently on a shareholder's income tax return. The tax treatment of the investment activities of the Fund will affect the amount, timing and character of the distributions made by the Fund. The following discussion is only a summary of certain tax considerations generally affecting the Fund and shareholders of the Fund and is not intended as a substitute for careful tax planning. Tax issues relating to the Fund are not generally a consideration for shareholders such as tax-exempt entities and tax-advantaged retirement vehicles such as an IRA or 401(k) plan. Shareholders are urged to consult their own tax professionals regarding specific questions as to federal, state or local taxes.
Investment Company Taxation. The Fund intends to continue to qualify as a regulated investment company under Subchapter M of the Code. As such, the Fund will not be subject to federal income tax on its net investment income and capital gains, if any, to the extent that it timely distributes such income and capital gains to its shareholders. If the Fund fails to qualify for any taxable year as a regulated investment company, all of its taxable income will be subject to tax at regular corporate income tax rates without any deduction for distributions to shareholders, and such distributions generally will be taxable to shareholders as ordinary dividends to the extent of the Fund's current and accumulated earnings and profits.
The Fund generally intends to distribute sufficient income and gains so that the Fund will not pay corporate income tax on its earnings. The Fund also generally intends to distribute to its shareholders in each calendar year a sufficient amount of ordinary income and capital gains to avoid the imposition of a 4% excise tax. However, the Fund may instead determine to retain all or part of any income or net long-term capital gains in any year for reinvestment. In such event, the Fund will pay federal income tax (and possibly excise tax) on such retained income or gains.
Gains or losses on sales of securities by the Fund will generally be long-term capital gains or losses if the securities have a tax holding period of more than one year at the time of such sale. Gains or losses on the sale of securities with a tax holding period of one year or less will be short-term capital gains or losses. Special tax rules may change the normal treatment of gains and losses recognized by the Fund when the Fund invests in forward foreign currency exchange contracts, options, futures transactions, and non-U.S. corporations classified as "passive foreign investment companies." Those special tax rules can, among other things, affect the treatment of capital gain or loss as long-term or short-term and may result in ordinary income or loss rather than capital gain or loss. The application of these special rules would therefore also affect the character of distributions made by the Fund.
If more than 50% of the Fund's assets are invested in foreign securities at the end of any fiscal year, the Fund may elect to permit shareholders to generally take a credit or deduction on their federal income tax return for foreign taxes paid by the Fund. If the Fund makes such an election, the shareholders would also include the amount of such foreign taxes in their income.
The Fund may make investments in which it recognizes income or gain prior to receiving cash with respect to such investment. For example, under certain tax rules, the Fund may be required to accrue a portion of any discount at which certain securities are purchased as income each year even though the Fund receives no payments in cash on the security during the year. To the extent that the Fund makes
52
such investments, it generally would be required to pay out such income or gain as a distribution in each year to avoid taxation at the Fund level. Such distributions will be made from the available cash of the Fund or by liquidation of portfolio securities if necessary. If a distribution of cash necessitates the liquidation of portfolio securities, the Adviser and/or Sub-Advisers will select which securities to sell. The Fund may realize a gain or loss from such sales. In the event the Fund realizes net capital gains from such transactions, its shareholders may receive a larger capital gain distribution, if any, than they would in the absence of such transactions.
Taxation of Dividends and Distributions. Shareholders normally will be subject to federal income taxes, and any state and/or local income taxes, on the dividends and other distributions they receive from the Fund. Such dividends and distributions, to the extent that they are derived from net investment income or short-term capital gains, are generally taxable to the shareholder as ordinary income regardless of whether the shareholder receives such payments in additional shares or in cash. Under current law (through 2012), if certain holding period requirements are met with respect to your shares, a portion of the ordinary income dividends received by a shareholder may be taxed at the same rate as long-term capital gains. However, even if income received in the form of ordinary income dividends is taxed at the same rates as long-term capital gains, such income will not be considered long-term capital gains for other federal income tax purposes. For example, you generally will not be permitted to offset income dividends with capital losses. Short-term capital gain distributions will continue to be taxed at ordinary income rates.
Distributions of net long-term capital gains, if any, are taxable to shareholders as long-term capital gains regardless of how long a shareholder has held the Fund's shares and regardless of whether the distribution is received in additional shares or in cash. Under current law, the maximum tax rate on long-term capital gains available to non-corporate shareholders generally is 15%. Without future congressional action, the maximum tax rate on long-term capital gains will return to 20% in 2013, and all dividends will be taxed at ordinary income rates.
Shareholders are generally taxed on any income dividend or capital gain distributions from the Fund in the year they are actually distributed. However, if any such dividends or distributions are declared in October, November or December and paid to shareholders of record of such month in January then such amounts will be treated for tax purposes as received by the shareholders on December 31.
Subject to certain exceptions, a corporate shareholder may be eligible for a 70% dividends received deduction to the extent that the Fund earns and distributes qualifying dividends from its investments. Distributions of net capital gains by the Fund will not be eligible for the dividends received deduction.
Shareholders who are not citizens or residents of the United States and certain foreign entities may be subject to withholding of U.S. tax on distributions made by the Fund of investment income and short-term capital gains. The Fund is not required to withhold any amounts with respect to distributions to foreign shareholders that are properly designated by the Fund as "interest-related" dividends or "short-term capital gain dividends," provided that the income would not be subject to federal income tax if earned directly by the foreign shareholder. However, the Fund may withhold on some of these amounts regardless of the fact that it is not required to do so. Any amounts withheld from payments made to a shareholder may be refunded or credited against the shareholder's U.S. federal income tax liability, if any, provided that the required information is furnished to the IRS. The provisions discussed above relating to distributions to foreign persons generally would apply to distributions with respect to taxable years of regulated investment companies beginning before January 1, 2012 (or a later date, if extended by the U.S. Congress). Prospective investors are urged to consult their tax advisors regarding the specific tax consequences discussed above.
The Fund will be required to withhold U.S. federal withholding taxes (at 30%) from certain "withholdable payments" made to a Non-U.S. shareholder (other than a individual) after 2013, unless the Non-U.S. shareholder complies with certain U.S. tax reporting (and, in some cases, withholding) requirements (generally relating to the entity's U.S. owners or account holders, if any) or otherwise qualifies for an exemption from such withholding. Withholdable payments generally will include interest (including original issue discount), dividends, rents, annuities, and other fixed or determinable annual or periodical gains, profits or income, if such payments are derived from U.S. sources, as well as gross proceeds from dispositions of securities
53
that could produce U.S. source interest or dividends. Income which is effectively connected with the conduct of a U.S. trade or business is not, however, included in this definition.
After the end of each calendar year, shareholders will be sent information on their dividends and capital gain distributions for tax purposes, including the portion taxable as ordinary income, the portion taxable as long-term capital gains, and the amount of any dividends eligible for the federal dividends received deduction for corporations.
Purchases and Redemptions and Exchanges of Fund Shares. Any dividend or capital gains distribution received by a shareholder from any investment company will have the effect of reducing the net asset value of the shareholder's stock in that company by the exact amount of the dividend or capital gains distribution. Furthermore, such dividends and capital gains distributions are subject to federal income taxes. If the net asset value of the shares should be reduced below a shareholder's cost as a result of the payment of dividends or the distribution of realized long-term capital gains, such payment or distribution would be in part a return of the shareholder's investment but nonetheless would be taxable to the shareholder. Therefore, an investor should consider the tax implications of purchasing Fund shares immediately prior to a distribution record date.
Shareholders normally will be subject to federal income taxes, and state and/or local income taxes, on the sale or disposition of Fund shares. In general, a sale of shares results in capital gain or loss, and for individual shareholders, is taxable at a federal rate dependent upon the length of time the shares were held. A redemption of a shareholder's Fund shares is normally treated as a sale for tax purposes. Fund shares held for a period of one year or less at the time of such sale or redemption will, for tax purposes, generally result in short-term capital gains or losses and those held for more than one year will generally result in long-term capital gains or losses. Under current law, the maximum tax rate on long-term capital gains available to non-corporate shareholders generally is 15%. Without future congressional action, the maximum tax rate on long-term capital gains will return to 20% in 2013. Any loss realized by shareholders upon a sale or redemption of shares within six months of the date of their purchase will be treated as a long-term capital loss to the extent of any distributions of net long-term capital gains with respect to such shares during the six-month period.
Gain or loss on the sale or redemption of shares in the Fund is measured by the difference between the amount of cash received (or the fair market value of any property received) and the adjusted tax basis of the shares. Shareholders should keep records of investments made (including shares acquired through reinvestment of dividends and distributions) so they can compute the tax basis of their shares. Under certain circumstances, a shareholder may compute and use an average cost basis in determining the gain or loss on the sale or redemption of shares.
Due to recent legislation, the Fund (or its administrative agent) is required to report to the IRS and furnish to Fund shareholders the cost basis information for sale transactions of shares purchased on or after January 1, 2012. Shareholders may elect to have one of several cost basis methods applied to their account when calculating the cost basis of shares sold, including average cost, FIFO ("first-in, first-out"), or some other specific identification method. Unless you instruct otherwise, the Fund will use average cost as its default cost basis method, and will treat sales as first coming from shares purchased prior to January 1, 2012. If average cost is used for the first sale of Fund shares covered by these new rules, the shareholder may only use an alternative cost basis method for shares purchased prospectively. Fund shareholders should consult with their tax advisors to determine the best cost basis method for their tax situation.
Exchanges of Fund shares for shares of another fund, including shares of other Morgan Stanley Funds, are also subject to similar tax treatment. Such an exchange is treated for tax purposes as a sale of the original shares in the Fund, followed by the purchase of shares in the other fund.
The ability to deduct capital losses may be limited. In addition, if a shareholder realizes a loss on the redemption or exchange of a fund's shares and receives securities that are considered substantially identical to that fund's shares or reinvests in that fund's shares or substantially identical shares within 30 days before or after the redemption or exchange, the transactions may be subject to the "wash sale" rules, resulting in a postponement of the recognition of such loss for tax purposes.
54
X. UNDERWRITERS
The Fund's shares are offered to the public on a continuous basis. The Distributor, as the principal underwriter of the shares, has certain obligations under the Distribution Agreement concerning the distribution of the shares. These obligations and the compensation the Distributor receives are described above in the sections titled "Principal Underwriter" and "Rule 12b-1 Plans."
XI. PERFORMANCE DATA
Average annual returns assuming deduction of maximum sales charge
Period Ended August 31, 2011
| Class | | Inception
Date: | | 1 Year | | 5 Years | | 10 Years | | Life of Fund | |
| Class A | | 04/26/01 | | | 4.75 | % | | | –1.69 | % | | | 4.89 | % | | | 4.31 | % | |
| Class B | | 04/26/01 | | | 5.60 | % | | | –0.91 | % | | | 5.02 | %* | | | 4.41 | %* | |
| Class C | | 04/26/01 | | | 8.91 | % | | | –1.34 | % | | | 4.68 | % | | | 4.07 | % | |
| Class I | | 04/26/01 | | | 10.88 | % | | | –0.37 | % | | | 5.71 | % | | | 5.10 | % | |
| Class R | | 03/31/08 | | | 10.34 | % | | | — | | | | — | | | | –4.02 | % | |
| Class W | | 03/31/08 | | | 10.49 | % | | | — | | | | — | | | | –3.88 | % | |
Average annual returns assuming NO deduction of sales charge
Period Ended August 31, 2011
| Class | | Inception
Date: | | 1 Year | | 5 Years | | 10 Years | | Life of Fund | |
| Class A | | 04/26/01 | | | 10.62 | % | | | –0.62 | % | | | 5.45 | % | | | 4.85 | % | |
| Class B | | 04/26/01 | | | 10.60 | % | | | –0.67 | % | | | 5.02 | %* | | | 4.41 | %* | |
| Class C | | 04/26/01 | | | 9.91 | % | | | –1.34 | % | | | 4.68 | % | | | 4.07 | % | |
| Class I | | 04/26/01 | | | 10.88 | % | | | –0.37 | % | | | 5.71 | % | | | 5.10 | % | |
| Class R | | 03/31/08 | | | 10.34 | % | | | — | | | | — | | | | –4.02 | % | |
| Class W | | 03/31/08 | | | 10.49 | % | | | — | | | | — | | | | –3.88 | % | |
Aggregate total returns assuming NO deduction of sales charge
Period Ended August 31, 2011
| Class | | Inception
Date: | | 1 Year | | 5 Years | | 10 Years | | Life of Fund | |
| Class A | | 04/26/01 | | | 10.62 | % | | | –3.08 | % | | | 70.04 | % | | | 63.24 | % | |
| Class B | | 04/26/01 | | | 10.60 | % | | | –3.31 | % | | | 63.25 | %* | | | 56.23 | %* | |
| Class C | | 04/26/01 | | | 9.91 | % | | | –6.52 | % | | | 57.96 | % | | | 51.16 | % | |
| Class I | | 04/26/01 | | | 10.88 | % | | | –1.85 | % | | | 74.30 | % | | | 67.33 | % | |
| Class R | | 03/31/08 | | | 10.34 | % | | | — | | | | — | | | | –13.08 | % | |
| Class W | | 03/31/08 | | | 10.49 | % | | | — | | | | — | | | | –12.67 | % | |
Average annual after-tax returns assuming deduction of maximum sales charge
Class B
Period Ended August 31, 2011
| Calculation Methodology | | Inception
Date: | | 1 Year | | 5 Years | | 10 Years | | Life of Fund | |
| After taxes on distributions | | 04/26/01 | | | 4.89 | % | | | –2.28 | % | | | 4.10 | %* | | | 3.52 | %* | |
| After taxes on distributions and redemptions | | 04/26/01 | | | 3.66 | % | | | –0.67 | % | | | 4.46 | %* | | | 3.90 | %* | |
* Does not reflect conversion to Class A shares eight years after the end of the calendar month in which shares were purchased. The conversion feature is currently suspended because the total annual operating expense ratio of Class B is currently lower than that of Class A. See "Conversion Feature" for Class B shares in "Share Class Arrangements" provided in the Fund's Prospectus for more information.
55
XII. FINANCIAL STATEMENTS
The Fund's audited financial statements for the fiscal year ended August 31, 2011, including notes thereto, and the report of Ernst & Young LLP, an independent registered public accounting firm, are herein incorporated by reference to the Fund's Annual Report to Shareholders. A copy of the Fund's Annual Report to Shareholders must accompany the delivery of this SAI.
On June 7, 2011, Deloitte & Touche LLP was dismissed as the independent registered public accounting firm of the Fund. The Fund, with the approval of its Board of Trustees and its Audit Committee, engaged Ernst & Young LLP as its new independent registered public accounting firm as of June 7, 2011.
XIII. FUND COUNSEL
Dechert LLP, located at 1095 Avenue of the Americas, New York, NY 10036, acts as the Fund's legal counsel.
*****
This SAI and the Prospectus do not contain all of the information set forth in the Registration Statement the Fund has filed with the SEC. The complete Registration Statement may be obtained from the SEC.
56
MORGAN STANLEY INVESTMENT MANAGEMENT
PROXY VOTING POLICY AND PROCEDURES
I. POLICY STATEMENT
Morgan Stanley Investment Management's ("MSIM") policy and procedures for voting proxies ("Policy") with respect to securities held in the accounts of clients applies to those MSIM entities that provide discretionary investment management services and for which an MSIM entity has authority to vote proxies. This Policy is reviewed and updated as necessary to address new and evolving proxy voting issues and standards.
The MSIM entities covered by this Policy currently include the following: Morgan Stanley AIP GP LP, Morgan Stanley Investment Management Inc., Morgan Stanley Investment Management Limited, Morgan Stanley Investment Management Company, Morgan Stanley Asset & Investment Trust Management Co., Limited, Morgan Stanley Investment Management Private Limited and Private Investment Partners Inc. (each an "MSIM Affiliate" and collectively referred to as the "MSIM Affiliates" or as "we" below).
Each MSIM Affiliate will use its best efforts to vote proxies as part of its authority to manage, acquire and dispose of account assets. With respect to the MSIM registered management investment companies (the "MSIM Funds"), each MSIM Affiliate will vote proxies under this Policy pursuant to authority granted under its applicable investment advisory agreement or, in the absence of such authority, as authorized by the Board of Directors/Trustees of the MSIM Funds. A MSIM Affiliate will not vote proxies unless the investment management or investment advisory agreement explicitly authorizes the MSIM Affiliate to vote proxies. MSIM Affiliates will vote proxies in a prudent and diligent manner and in the best interests of clients, including beneficiaries of and participants in a client's benefit plan(s) for which the MSIM Affiliates manage assets, consistent with the objective of maximizing long-term investment returns ("Client Proxy Standard"). In certain situations, a client or its fiduciary may provide an MSIM Affiliate with a proxy voting policy. In these situations, the MSIM Affiliate will comply with the client's policy.
Proxy Research Services — ISS Governance Services ("ISS") and Glass Lewis (together with other proxy research providers as we may retain from time to time, the "Research Providers") are independent advisers that specialize in providing a variety of fiduciary-level proxy-related services to institutional investment managers, plan sponsors, custodians, consultants, and other institutional investors. The services provided include in-depth research, global issuer analysis, and voting recommendations. While we may review and utilize the recommendations of one or more Research Providers in making proxy voting decisions, we are in no way obligated to follow such recommendations. In addition to research, ISS provides vote execution, reporting, and recordkeeping services.
Voting Proxies for Certain Non-U.S. Companies — Voting proxies of companies located in some jurisdictions may involve several problems that can restrict or prevent the ability to vote such proxies or entail significant costs. These problems include, but are not limited to: (i) proxy statements and ballots being written in a language other than English; (ii) untimely and/or inadequate notice of shareholder meetings; (iii) restrictions on the ability of holders outside the issuer's jurisdiction of organization to exercise votes; (iv) requirements to vote proxies in person; (v) the imposition of restrictions on the sale of the securities for a period of time in proximity to the shareholder meeting; and (vi) requirements to provide local agents with power of attorney to facilitate our voting instructions. As a result, we vote clients' non-U.S. proxies on a best efforts basis only, after weighing the costs and benefits of voting such proxies, consistent with the Client Proxy Standard. ISS has been retained to provide assistance in connection with voting non-U.S. proxies.
II. GENERAL PROXY VOTING GUIDELINES
To promotes consistency in voting proxies on behalf of its clients, we follow this Policy (subject to any exception set forth herein). The Policy addresses a broad range of issues, and provides general voting parameters on proposals that arise most frequently. However, details of specific proposals vary, and those details affect particular voting decisions, as do factors specific to a given company. Pursuant to the procedures set forth herein, we may vote in a manner that is not in accordance with the following
A-1
general guidelines, provided the vote is approved by the Proxy Review Committee (see Section III for description) and is consistent with the Client Proxy Standard. Morgan Stanley AIP GP LP will follow the procedures as described in Appendix A.
We endeavor to integrate governance and proxy voting policy with investment goals, using the vote to encourage portfolio companies to enhance long-term shareholder value and to provide a high standard of transparency such that equity markets can value corporate assets appropriately.
We seek to follow the Client Proxy Standard for each client. At times, this may result in split votes, for example when different clients have varying economic interests in the outcome of a particular voting matter (such as a case in which varied ownership interests in two companies involved in a merger result in different stakes in the outcome). We also may split votes at times based on differing views of portfolio managers.
We may abstain on matters for which disclosure is inadequate.
A. Routine Matters.
We generally support routine management proposals. The following are examples of routine management proposals:
• Approval of financial statements and auditor reports if delivered with an unqualified auditor's opinion.
• General updating/corrective amendments to the charter, articles of association or bylaws, unless we believe that such amendments would diminish shareholder rights.
• Most proposals related to the conduct of the annual meeting, with the following exceptions. We generally oppose proposals that relate to "the transaction of such other business which may come before the meeting," and open-ended requests for adjournment. However, where management specifically states the reason for requesting an adjournment and the requested adjournment would facilitate passage of a proposal that would otherwise be supported under this Policy (i.e. an uncontested corporate transaction), the adjournment request will be supported.
We generally support shareholder proposals advocating confidential voting procedures and independent tabulation of voting results.
B. Board of Directors.
1. Election of directors: Votes on board nominees can involve balancing a variety of considerations. In vote decisions, we may take into consideration whether the company has a majority voting policy in place that we believe makes the director vote more meaningful. In the absence of a proxy contest, we generally support the board's nominees for director except as follows:
a. We consider withholding support from or voting against a nominee if we believe a direct conflict exists between the interests of the nominee and the public shareholders, including failure to meet fiduciary standards of care and/or loyalty. We may oppose directors where we conclude that actions of directors are unlawful, unethical or negligent. We consider opposing individual board members or an entire slate if we believe the board is entrenched and/or dealing inadequately with performance problems; if we believe the board is acting with insufficient independence between the board and management; or if we believe the board has not been sufficiently forthcoming with information on key governance or other material matters.
b. We consider witholding support from or voting against interested directors if the company's board does not meet market standards for director independence, or if otherwise we believe board independence is insufficient. We refer to prevalent market standards as promulgated by a stock exchange or other authority within a given market (e.g., New York Stock Exchange or Nasdaq rules for most U.S. companies, and The Combined Code on Corporate Governance in the United Kingdom). Thus, for an NYSE company with no controlling shareholder, we would expect that at a minimum a majority of directors should be independent as defined by NYSE. Where we view market standards as inadequate, we may withhold votes based on
A-2
stronger independence standards. Market standards notwithstanding, we generally do not view long board tenure alone as a basis to classify a director as non-independent.
i. At a company with a shareholder or group that controls the company by virtue of a majority economic interest in the company, we have a reduced expectation for board independence, although we believe the presence of independent directors can be helpful, particularly in staffing the audit committee, and at times we may withhold support from or vote against a nominee on the view the board or its committees are not sufficiently independent. In markets where board independence is not the norm (e.g. Japan), however, we consider factors including whether a board of a controlled company includes independent members who can be expected to look out for interests of minority holders.
ii. We consider withholding support from or voting against a nominee if he or she is affiliated with a major shareholder that has representation on a board disproportionate to its economic interest.
c. Depending on market standards, we consider withholding support from or voting against a nominee who is interested and who is standing for election as a member of the company's compensation/renumeration, nominating/governance or audit committee.
d. We consider withholding support or voting against nominees if the term for which they are nominated is excessive. We consider this issue on a market-specific basis.
e. We consider withholding support from or voting against nominees if, in our view, there has been insufficient board renewal (turnover0, particularly in the context of extended poor company performance.
f. We consider withholding support from or voting against a nominee standing for election if the board has not taken action to implement generally accepted governance practices for which there is a "bright line" test. For example, in the context of the U.S. market, failure to eliminate a dead hand or slow hand poison pill would be seen as a basis for opposing one or more incumbent nominees.
g. In markets that encourage designated audit committee financial experts, we consider voting against members of an audit committee if no members are designated as such. We also may not support the audit committee members if the company has faced financial reporting issues and/or does not put the auditor up for ratification by shareholders.
h. We believe investors should have the ability to vote on individual nominees, and may abstain or vote against a slate of nominees where we are not given the opportunity to vote on individual nominees.
i. We consider withholding support from or voting against a nominee who has failed to attend at least 75% of the nominee's board and board committee meetings within a given year without a reasonable excuse. We also consider opposing nominees if the company does not meet market standards for disclosure on attendance.
j. We consider withholding support from or voting against a nominee who appears overcommitted, particularly through service on an excessive number of boards. Market expectations are incorporated into this analysis; for U.S. boards, we generally oppose election of a nominee who serves on more than six public company boards (excluding investment companies), although we may reference National Association of Corporate Directors guidance suggesting that public company CEOs, for example, should serve no more than two outside boards given the level of time commitment required in their primary job.
2. Discharge of directors' duties: In markets where an annual discharge of directors' responsibility is a routine agenda item, we generally support such discharge. However, we may vote against discharge or abstain from voting where there are serious findings of fraud or other unethical behavior for which the individual bears responsibility. The annual discharge of responsibility represents shareholder approval of disclosed actions taken by the board during the year and may make future shareholder action against the board difficult to pursue.
A-3
3. Board independence: We generally support U.S. shareholder proposals requiring that a certain percentage (up to 66 2/3%) of the company's board members be independent directors, and promoting all-independent audit, compensation and nominating/governance committees.
4. Board diversity: We consider on a case-by-case basis shareholder proposals urging diversity of board membership with respect to social, religious or ethnic group.
5. Majority voting: We generally support proposals requesting or requiring majority voting policies in election of directors, so long as there is a carve-out for plurality voting in the case of contested elections.
6. Proxy access: We consider on a case-by-case basis shareholder proposals on particular procedures for inclusion of shareholder nominees in company proxy statements.
7. Reimbursement for dissident nominees: We generally support well-crafted U.S. shareholder proposals that would provide for reimbursement of dissident nominees elected to a board, as the cost to shareholders in electing such nominees can be factored into the voting decision on those nominees.
8. Proposals to elect directors more frequently: In the U.S. public company context, we usually support shareholder and management proposals to elect all directors annually (to "declassify" the board), although we make an exception to this policy where we believe that long-term shareholder value may be harmed by this change given particular circumstances at the company at the time of the vote on such proposal. As indicated above, outside the U.S., we generally support greater accountability to shareholders that comes through more frequent director elections, but recognize that many markets embrace longer term lengths, sometimes for valid reasons given other aspects of the legal context in electing boards.
9. Cumulative voting: We generally support proposals to eliminate cumulative voting in the U.S. market context. (Cumulative voting provides that shareholders may concentrate their votes for one or a handful of candidates, a system that can enable a minority bloc to place representation on a board.) U.S. proposals to establish cumulative voting in the election of directors generally will not be supported.
10. Separation of Chairman and CEO positions: We vote on shareholder proposals to separate the Chairman and CEO positions and/or to appoint an independent Chairman based in part on prevailing practice in particular markets, since the context for such a practice varies. In many non-U.S. markets, we view separation of the roles as a market standard practice, and support division of the roles in that context. In the U.S., we consider such proposals on a case-by-case basis, considering, among other things, the existing board leadership structure, company performance, and any other evidence of entrenchment or perceived risk that power is overly concentrated in a single individual.
11. Director retirement age and term limits: Proposals setting or recommending director retirement ages or director term limits are voted on a case-by-case basis that includes consideration of company performance, the rate of board renewal, evidence of effective individual director evaluation processes, and any indications of entrenchment...
12. Proposals to limit directors' liability and/or broaden indemnification of officers and directors. Generally, we will support such proposals provided that an individual is eligible only if he or she has not acted in bad faith, with gross negligence or with reckless disregard of their duties.
C. Statutory auditor boards.
The statutory auditor board, which is separate from the main board of directors, plays a role in corporate governance in several markets. These boards are elected by shareholders to provide assurance on compliance with legal and accounting standards and the company's articles of association. We generally vote for statutory auditor nominees if they meet independence standards. In markets that require disclosure on attendance by internal statutory auditors, however, we consider voting against nominees for these
A-4
positions who failed to attend at least 75% of meetings in the previous year. We also consider opposing nominees if the company does not meet market standards for disclosure on attendance.
D. Corporate transactions and proxy fights.
We examine proposals relating to mergers, acquisitions and other special corporate transactions (i.e., takeovers, spin-offs, sales of assets, reorganizations, restructurings and recapitalizations) on a case-by-case basis in the interests of each fund or other account. Proposals for mergers or other significant transactions that are friendly and approved by the Research Providers usually are supported if there is no portfolio manager objection. We also analyze proxy contests on a case-by-case basis.
E. Changes in capital structure.
1. We generally support the following:
• Management and shareholder proposals aimed at eliminating unequal voting rights, assuming fair economic treatment of classes of shares we hold.
• U.S. management proposals to increase the authorization of existing classes of common stock (or securities convertible into common stock) if: (i) a clear business purpose is stated that we can support and the number of shares requested is reasonable in relation to the purpose for which authorization is requested; and/or (ii) the authorization does not exceed 100% of shares currently authorized and at least 30% of the total new authorization will be outstanding. (We consider proposals that do not meet these criteria on a case-by-case basis.)
• U.S. management proposals to create a new class of preferred stock or for issuances of preferred stock up to 50% of issued capital, unless we have concerns about use of the authority for anti-takeover purposes.
• Proposals in non-U.S. markets that in our view appropriately limit potential dilution of existing shareholders. A major consideration is whether existing shareholders would have preemptive rights for any issuance under a proposal for standing share issuance authority. We generally consider market-specific guidance in making these decisions; for example, in the U.K. market, we usually follow Association of British Insurers' ("ABI") guidance, although company-specific factors may be considered and for example, may sometimes lead us to voting against share authorization proposals even if they meet ABI guidance.
• Management proposals to authorize share repurchase plans, except in some cases in which we believe there are insufficient protections against use of an authorization for anti-takeover purposes.
• Management proposals to reduce the number of authorized shares of common or preferred stock, or to eliminate classes of preferred stock.
• Management proposals to effect stock splits.
• Management proposals to effect reverse stock splits if management proportionately reduces the authorized share amount set forth in the corporate charter. Reverse stock splits that do not adjust proportionately to the authorized share amount generally will be approved if the resulting increase in authorized shares coincides with the proxy guidelines set forth above for common stock increases.
• Management dividend payout proposals, except where we perceive company payouts to shareholders as inadequate.
2. We generally oppose the following (notwithstanding management support):
• Proposals to add classes of stock that would substantially dilute the voting interests of existing shareholders.
• Proposals to increase the authorized or issued number of shares of existing classes of stock that are unreasonably dilutive, particularly if there are no preemptive rights for existing shareholders. However, depending on market practices, we consider voting for proposals giving general authorization for issuance of shares not subject to pre-emptive rights if the authority is limited.
A-5
• Proposals that authorize share issuance at a discount to market rates, except where authority for such issuance is de minimis, or if there is a special situation that we believe justifies such authorization (as may be the case, for example, at a company under severe stress and risk of bankruptcy).
• Proposals relating to changes in capitalization by 100% or more.
We consider on a case-by-case basis shareholder proposals to increase dividend payout ratios, in light of market practice and perceived market weaknesses, as well as individual company payout history and current circumstances. For example, currently we perceive low payouts to shareholders as a concern at some Japanese companies, but may deem a low payout ratio as appropriate for a growth company making good use of its cash, notwithstanding the broader market concern.
F. Takeover Defenses and Shareholder Rights.
1. Shareholder rights plans: We generally support proposals to require shareholder approval or ratification of shareholder rights plans (poison pills). In voting on rights plans or similar takeover defenses, we consider on a case-by-case basis whether the company has demonstrated a need for the defense in the context of promoting long-term share value; whether provisions of the defense are in line with generally accepted governance principles in the market (and specifically the presence of an adequate qualified offer provision that would exempt offers meeting certain conditions from the pill); and the specific context if the proposal is made in the midst of a takeover bid or contest for control.
2. Supermajority voting requirements: We generally oppose requirements for supermajority votes to amend the charter or bylaws, unless the provisions protect minority shareholders where there is a large shareholder. In line with this view, in the absence of a large shareholder we support reasonable shareholder proposals to limit such supermajority voting requirements.
3. Shareholder rights to call meetings: We consider proposals to enhance shareholder rights to call meetings on a case-by-case basis. At large-cap U.S. companies, we generally support efforts to establish the rights of holders of 10% or more of shares to call special meetings, unless the board or state law has a set policy or law establishing such rights at a threshold that we believe to be acceptable.
4. Written consent rights: In the U.S. context, we examine proposals for shareholder written consent rights on a case-by-case basis.
5. Reincorporation: We consider management and shareholder proposals to reincorporate to a different jurisdiction on a case-by-case basis. We oppose such proposals if we believe the main purpose is to take advantage of laws or judicial precedents that reduce shareholder rights.
6. Anti-greenmail provisions: Proposals relating to the adoption of anti-greenmail provisions will be supported, provided that the proposal: (i) defines greenmail; (ii) prohibits buyback offers to large block holders (holders of at least 1% of the outstanding shares and in certain cases, a greater amount) not made to all shareholders or not approved by disinterested shareholders; and (iii) contains no anti-takeover measures or other provisions restricting the rights of shareholders.
7. Bundled proposals: We may consider opposing or abstaining on proposals if disparate issues are "bundled" and presented for a single vote.
G. Auditors.
We generally support management proposals for selection or ratification of independent auditors. However, we may consider opposing such proposals with reference to incumbent audit firms if the company has suffered from serious accounting irregularities and we believe rotation of the audit firm is appropriate, or if fees paid to the auditor for non-audit-related services are excessive. Generally, to determine if non-audit fees are excessive, a 50% test will be applied (i.e., non-audit-related fees should be less than 50% of the total fees paid to the auditor). We generally vote against proposals to indemnify auditors.
A-6
H. Executive and Director Remuneration.
1. We generally support the following:
• Proposals for employee equity compensation plans and other employee ownership plans, provided that our research does not indicate that approval of the plan would be against shareholder interest. Such approval may be against shareholder interest if it authorizes excessive dilution and shareholder cost, particularly in the context of high usage ("run rate") of equity compensation in the recent past; or if there are objectionable plan design and provision.
• Proposals relating to fees to outside directors, provided the amounts are not excessive relative to other companies in the country or industry, and provided that the structure is appropriate within the market context. While stock-based compensation to outside directors is positive if moderate and appropriately structured, we are wary of significant stock option awards or other performance-based awards for outside directors, as well as provisions that could result in significant forfeiture of value on a director's decision to resign from a board (such forfeiture can undercut director independence).
• Proposals for employee stock purchase plans that permit discounts, but only for grants that are part of a broad-based employee plan, including all non-executive employees, and only if the discounts are limited to a reasonable market standard or less.
• Proposals for the establishment of employee retirement and severance plans, provided that our research does not indicate that approval of the plan would be against shareholder interest.
2. We generally oppose retirement plans and bonuses for non-executive directors and independent statutory auditors.
3. In the U.S. context, shareholder proposals requiring shareholder approval of all severance agreements will not be supported, but proposals that require shareholder approval for agreements in excess of three times the annual compensation (salary and bonus) generally will be supported. We generally oppose shareholder proposals that would establish arbitrary caps on pay. We consider on a case-by-case basis shareholder proposals that seek to limit Supplemental Executive Retirement Plans (SERPs), but support such proposals where we consider SERPs to be excessive.
4. Shareholder proposals advocating stronger and/or particular pay-for-performance models will be evaluated on a case-by-case basis, with consideration of the merits of the individual proposal within the context of the particular company and its labor markets, and the company's current and past practices. While we generally support emphasis on long-term components of senior executive pay and strong linkage of pay to performance, we consider factors including whether a proposal may be overly prescriptive, and the impact of the proposal, if implemented as written, on recruitment and retention.
5. We generally support proposals advocating reasonable senior executive and director stock ownership guidelines and holding requirements for shares gained in executive equity compensation programs
6. We generally support shareholder proposals for reasonable "claw-back" provisions that provide for company recovery of senior executive bonuses to the extent they were based on achieving financial benchmarks that were not actually met in light of subsequent restatements.
7. Management proposals effectively to re-price stock options are considered on a case-by-case basis. Considerations include the company's reasons and justifications for a re-pricing, the company's competitive position, whether senior executives and outside directors are excluded, potential cost to shareholders, whether the re-pricing or share exchange is on a value-for-value basis, and whether vesting requirements are extended.
8. Say-on-Pay: We consider proposals relating to an advisory vote on remuneration on a case-by-case basis. Considerations include a review of the relationship between executive remuneration and performance based on operating trends and total shareholder return over multiple performance periods. In addition, we review remuneration structures and potential poor pay practices, including
A-7
relative magnitude of pay, discretionary bonus awards, tax gross ups, change-in-control features, internal pay equity and peer group construction. As long-term investors, we support remuneration policies that align with long-term shareholder returns.
I. Social, Political and Environmental Issues.
Shareholders in the U.S. and certain other markets submit proposals encouraging changes in company disclosure and practices related to particular corporate, social, political and environmental matters. We consider how to vote on the proposals on a case-by-case basis to determine likely impacts on shareholder value. We seek to balance concerns on reputational and other risks that lie behind a proposal against costs of implementation, while considering appropriate shareholder and management prerogatives. We may abstain from voting on proposals that do not have a readily determinable financial impact on shareholder value. We support proposals that, if implemented, would enhance useful disclosure, but we generally vote against proposals requesting reports that we believe are duplicative, related to matters not material to the business, or that would impose unnecessary or excessive costs. We believe that certain social and environmental shareholder proposals may intrude excessively on management prerogatives, which can lead us to oppose them.
J. Fund of Funds.
Certain Funds advised by an MSIM Affiliate invest only in other MSIM Funds. If an underlying fund has a shareholder meeting, in order to avoid any potential conflict of interest, such proposals will be voted in the same proportion as the votes of the other shareholders of the underlying fund, unless otherwise determined by the Proxy Review Committee.
III. ADMINISTRATION OF POLICY
The MSIM Proxy Review Committee (the "Committee") has overall responsibility for the Policy. The Committee, which is appointed by MSIM's Long-Only Executive Committee, consists of investment professionals who represent the different investment disciplines and geographic locations of the firm, and is chaired by the director of the Corporate Governance Team ("CGT"). Because proxy voting is an investment responsibility and impacts shareholder value, and because of their knowledge of companies and markets, portfolio managers and other members of investment staff play a key role in proxy voting, although the Committee has final authority over proxy votes.
The CGT Director is responsible for identifying issues that require Committee deliberation or ratification. The CGT, working with advice of investment teams and the Committee, is responsible for voting on routine items and on matters that can be addressed in line with these Policy guidelines. The CGT has responsibility for voting case-by-case where guidelines and precedent provide adequate guidance.
The Committee will periodically review and have the authority to amend, as necessary, the Policy and establish and direct voting positions consistent with the Client Proxy Standard.
CGT and members of the Committee may take into account Research Providers' recommendations and research as well as any other relevant information they may request or receive, including portfolio manager and/or analyst comments and research, as applicable. Generally, proxies related to securities held in accounts that are managed pursuant to quantitative, index or index-like strategies ("Index Strategies") will be voted in the same manner as those held in actively managed accounts, unless economic interests of the accounts differ. Because accounts managed using Index Strategies are passively managed accounts, research from portfolio managers and/or analysts related to securities held in these accounts may not be available. If the affected securities are held only in accounts that are managed pursuant to Index Strategies, and the proxy relates to a matter that is not described in this Policy, the CGT will consider all available information from the Research Providers, and to the extent that the holdings are significant, from the portfolio managers and/or analysts.
A. Committee Procedures
The Committee meets at least quarterly and reviews and considers changes to the Policy at least annually. Through meetings and/or written communications, the Committee is responsible for monitoring and ratifying "split votes" (i.e., allowing certain shares of the same issuer that are the subject of the same
A-8
proxy solicitation and held by one or more MSIM portfolios to be voted differently than other shares) and/or "override voting" (i.e., voting all MSIM portfolio shares in a manner contrary to the Policy). The Committee will review developing issues and approve upcoming votes, as appropriate, for matters as requested by CGT.
The Committee reserves the right to review voting decisions at any time and to make voting decisions as necessary to ensure the independence and integrity of the votes.
B. Material Conflicts of Interest
In addition to the procedures discussed above, if the CGT Director determines that an issue raises a material conflict of interest, the CGT Director may request a special committee to review, and recommend a course of action with respect to, the conflict(s) in question ("Special Committee").
A potential material conflict of interest could exist in the following situations, among others:
1. The issuer soliciting the vote is a client of MSIM or an affiliate of MSIM and the vote is on a matter that materially affects the issuer.
2. The proxy relates to Morgan Stanley common stock or any other security issued by Morgan Stanley or its affiliates except if echo voting is used, as with MSIM Funds, as described herein.
3. Morgan Stanley has a material pecuniary interest in the matter submitted for a vote (e.g., acting as a financial advisor to a party to a merger or acquisition for which Morgan Stanley will be paid a success fee if completed).
If the CGT Director determines that an issue raises a potential material conflict of interest, depending on the facts and circumstances, the issue will be addressed as follows:
1. If the matter relates to a topic that is discussed in this Policy, the proposal will be voted as per the Policy.
2. If the matter is not discussed in this Policy or the Policy indicates that the issue is to be decided case-by-case, the proposal will be voted in a manner consistent with the Research Providers, provided that all the Research Providers consulted have the same recommendation, no portfolio manager objects to that vote, and the vote is consistent with MSIM's Client Proxy Standard.
3. If the Research Providers' recommendations differ, the CGT Director will refer the matter to a Special Committee to vote on the proposal, as appropriate.
Any Special Committee shall be comprised of the CGT Director and at least two portfolio managers (preferably members of the Committee) as approved by the Committee. The CGT Director may request non-voting participation by MSIM's General Counsel or his/her designee and the Chief Compliance Officer or his/her designee. In addition to the research provided by Research Providers, the Special Committee may request analysis from MSIM Affiliate investment professionals and outside sources to the extent it deems appropriate.
C. Proxy Voting Reporting
The CGT will document in writing all Committee and Special Committee decisions and actions, which documentation will be maintained by the CGT for a period of at least six years. To the extent these decisions relate to a security held by an MSIM Fund, the CGT will report the decisions to each applicable Board of Trustees/Directors of those Funds at each Board's next regularly scheduled Board meeting. The report will contain information concerning decisions made during the most recently ended calendar quarter immediately preceding the Board meeting.
MSIM will promptly provide a copy of this Policy to any client requesting it. MSIM will also, upon client request, promptly provide a report indicating how each proxy was voted with respect to securities held in that client's account.
MSIM's Legal Department is responsible for filing an annual Form N-PX on behalf of each MSIM Fund for which such filing is required, indicating how all proxies were voted with respect to such Fund's holdings.
A-9
APPENDIX A
The following procedures apply to accounts managed by Morgan Stanley AIP GP LP and Private Investment Partners Inc. ("AIP").
Generally, AIP will follow the guidelines set forth in Section II of MSIM's Proxy Voting Policy and Procedures. To the extent that such guidelines do not provide specific direction, or AIP determines that consistent with the Client Proxy Standard, the guidelines should not be followed, the Proxy Review Committee has delegated the voting authority to vote securities held by accounts managed by AIP to the Fund of Hedge Funds investment team, the Private Equity Fund of Funds investment team or the Private Equity Real Estate Fund of Funds investment team of AIP. A summary of decisions made by the investment teams will be made available to the Proxy Review Committee for its information at the next scheduled meeting of the Proxy Review Committee.
In certain cases, AIP may determine to abstain from determining (or recommending) how a proxy should be voted (and therefore abstain from voting such proxy or recommending how such proxy should be voted), such as where the expected cost of giving due consideration to the proxy does not justify the potential benefits to the affected account(s) that might result from adopting or rejecting (as the case may be) the measure in question.
Waiver of Voting Rights
For regulatory reasons, AIP may either 1) invest in a class of securities of an underlying fund (the "Fund") that does not provide for voting rights; or 2) waive 100% of its voting rights with respect to the following:
1. Any rights with respect to the removal or replacement of a director, general partner, managing member or other person acting in a similar capacity for or on behalf of the Fund (each individually a "Designated Person," and collectively, the "Designated Persons"), which may include, but are not limited to, voting on the election or removal of a Designated Person in the event of such Designated Person's death, disability, insolvency, bankruptcy, incapacity, or other event requiring a vote of interest holders of the Fund to remove or replace a Designated Person; and
2. Any rights in connection with a determination to renew, dissolve, liquidate, or otherwise terminate or continue the Fund, which may include, but are not limited to, voting on the renewal, dissolution, liquidation, termination or continuance of the Fund upon the occurrence of an event described in the Fund's organizational documents; provided, however, that, if the Fund's organizational documents require the consent of the Fund's general partner or manager, as the case may be, for any such termination or continuation of the Fund to be effective, then AIP may exercise its voting rights with respect to such matter.
Approved by Morgan Stanley Funds Board on September 27-28, 2011
A-10
STATEMENT OF ADDITIONAL INFORMATION
February 29, 2012
Morgan Stanley
International Fund
| Share Class | | Ticker
Symbol | |
| Class A | | INLAX | |
|
| Class B | | INLBX | |
|
| Class C | | INLCX | |
|
| Class I | | INLDX | |
|
| Class R | | INLRX | |
|
| Class W | | INLWX | |
|
This Statement of Additional Information ("SAI") is not a prospectus. The Prospectus (dated February 29, 2012) for Morgan Stanley International Fund may be obtained without charge from the Fund at its address or telephone number listed below.
The Fund's audited financial statements for the fiscal year ended October 31, 2011, including notes thereto, and the report of Ernst & Young LLP, are herein incorporated by reference to the Fund's Annual Report to Shareholders. A copy of the Fund's Annual Report to Shareholders must accompany the delivery of this SAI.
Morgan Stanley
International Fund
522 Fifth Avenue
New York, NY 10036
(800) 869-NEWS
TABLE OF CONTENTS
| I. | | Fund History | | 4 | |
|
| II. | | Description of the Fund and Its Investments and Risks | | 4 | |
|
| | A. Classification | | 4 | |
|
| | B. Investment Strategies and Risks | | 4 | |
|
| | C. Fund Policies/Investment Restrictions | | 22 | |
|
| | D. Disclosure of Portfolio Holdings | | 23 | |
|
| III. | | Management of the Fund | | 26 | |
|
| | A. Board of Trustees | | 26 | |
|
| | B. Management Information | | 27 | |
|
| | C. Compensation | | 36 | |
|
| IV. | | Control Persons and Principal Holders of Securities | | 38 | |
|
| V. | | Investment Advisory and Other Services | | 38 | |
|
| | A. Adviser and Administrator | | 38 | |
|
| | B. Principal Underwriter | | 39 | |
|
| | C. Services Provided by the Adviser and Administrator | | 39 | |
|
| | D. Dealer Reallowances | | 40 | |
|
| | E. Rule 12b-1 Plans | | 40 | |
|
| | F. Other Service Providers | | 43 | |
|
| | G. Fund Management | | 44 | |
|
| | H. Codes of Ethics | | 45 | |
|
| | I. Proxy Voting Policy and Proxy Voting Record | | 45 | |
|
| | J. Revenue Sharing | | 45 | |
|
| VI. | | Brokerage Allocation and Other Practices | | 47 | |
|
| | A. Brokerage Transactions | | 47 | |
|
| | B. Commissions | | 47 | |
|
| | C. Brokerage Selection | | 48 | |
|
| | D. Regular Broker-Dealers | | 49 | |
|
| VII. | | Capital Stock and Other Securities | | 49 | |
|
| VIII. | | Purchase, Redemption and Pricing of Shares | | 50 | |
|
| | A. Purchase/Redemption of Shares | | 50 | |
|
| | B. Offering Price | | 51 | |
|
| IX. | | Taxation of the Fund and Shareholders | | 52 | |
|
| X. | | Underwriters | | 55 | |
|
| XI. | | Performance Data | | 55 | |
|
| XII. | | Financial Statements | | 56 | |
|
| XIII. | | Fund Counsel | | 56 | |
|
| Appendix A. | | Proxy Voting Policy and Procedures | | A-1 | |
|
2
Glossary of Selected Defined Terms
The terms defined in this glossary are frequently used in this SAI (other terms used occasionally are defined in the text of the document).
"Administrator" or "Morgan Stanley Services" — Morgan Stanley Services Company Inc., a wholly-owned fund services subsidiary of the Adviser.
"Adviser" — Morgan Stanley Investment Management Inc., a wholly-owned investment adviser subsidiary of Morgan Stanley.
"Custodian" — State Street Bank and Trust Company.
"Distributor" — Morgan Stanley Distribution, Inc., a wholly-owned broker-dealer subsidiary of Morgan Stanley.
"Financial Advisors" — Morgan Stanley authorized financial services representatives.
"Fund" — Morgan Stanley International Fund, a registered open-end investment company.
"Independent Trustees" — Trustees who are not "interested persons" (as defined by the Investment Company Act of 1940, as amended ("Investment Company Act")) of the Fund.
"Morgan Stanley & Co." — Morgan Stanley & Co. LLC, a wholly-owned broker-dealer subsidiary of Morgan Stanley.
"Morgan Stanley Funds" — Registered investment companies for which the Adviser serves as the investment adviser and that hold themselves out to investors as related companies for investment and investor services.
"Morgan Stanley Smith Barney" — Morgan Stanley Smith Barney LLC, a majority-owned broker-dealer subsidiary of Morgan Stanley.
"Transfer Agent" — Morgan Stanley Services Company Inc., a wholly-owned transfer agent subsidiary of Morgan Stanley.
"Trustees" — The Board of Trustees of the Fund.
3
I. FUND HISTORY
The Fund was organized as a Massachusetts business trust, under a Declaration of Trust, on October 23, 1998, with the name Morgan Stanley Dean Witter International Fund. Effective June 18, 2001, the Fund's name was changed to Morgan Stanley International Fund.
II. DESCRIPTION OF THE FUND AND ITS INVESTMENTS AND RISKS
A. Classification
The Fund is an open-end, diversified management investment company whose investment objective is long-term capital growth.
B. Investment Strategies and Risks
The following discussion of the Fund's investment strategies and risks should be read with the sections of the Fund's Prospectus titled "Principal Investment Strategies," "Principal Risks" and "Additional Information About the Fund's Investment Objective, Strategies and Risks."
U.S. Government Securities. Securities issued by the U.S. Government, its agencies or instrumentalities in which the Fund may invest include:
(1) U.S. Treasury bills (maturities of one year or less), U.S. Treasury notes (maturities of one to ten years) and U.S. Treasury bonds (generally maturities of greater than ten years), all of which are direct obligations of the U.S. Government and, as such, are backed by the "full faith and credit" of the United States.
(2) Securities issued by agencies and instrumentalities of the U.S. Government which are backed by the full faith and credit of the United States. Among the agencies and instrumentalities issuing such obligations are the Federal Housing Administration, the Government National Mortgage Association ("GNMA"), the Department of Housing and Urban Development, the Export-Import Bank, the Farmers Home Administration, the General Services Administration, the Maritime Administration and the Small Business Administration. The maturities of such obligations range from three months to 30 years.
Neither the value nor the yield of the U.S. government securities which may be invested in by the Fund are guaranteed by the U.S. Government. Such values and yield will fluctuate with changes in prevailing interest rates and other factors. Generally, as prevailing interest rates rise, the value of any U.S. government securities held by the Fund will fall. Such securities with longer maturities generally tend to produce higher yields and are subject to greater market fluctuation as a result of changes in interest rates than debt securities with shorter maturities.
Derivatives. The Fund may, but is not required to, use various derivatives and related investment strategies as described below. Derivatives may be used for a variety of purposes including hedging, risk management, portfolio management or to earn income. Any or all of the investment techniques described herein may be used at any time and there is no particular strategy that dictates the use of one technique rather than another, as the use of any derivative by the Fund is a function of numerous variables, including market conditions. The Fund complies with applicable regulatory requirements when using derivatives, including the segregation or earmarking of cash or liquid assets when mandated by U.S. Securities and Exchange Commission ("SEC") rules or SEC staff positions. Although the Adviser seeks to use derivatives to further the Fund's investment objective, no assurance can be given that the use of derivatives will achieve this result.
General Risks of Derivatives
Derivatives utilized by the Fund may involve the purchase and sale of derivative instruments. A derivative is a financial instrument the value of which depends upon (or derives from) the value of another asset, security, interest rate or index. Derivatives may relate to a wide variety of underlying instruments, including equity and debt securities, indexes, interest rates, currencies and other assets. Certain derivative instruments which the Fund may use and the risks of those instruments are described in further detail below. The Fund may in the future also utilize derivatives techniques, instruments and strategies that may be
4
newly developed or permitted as a result of regulatory changes, consistent with the Fund's investment objective and policies. Such newly developed techniques, instruments and strategies may involve risks different than or in addition to those described herein. No assurance can be given that any derivatives strategy employed by the Fund will be successful.
The risks associated with the use of derivatives are different from, and possibly greater than, the risks associated with investing directly in the instruments underlying such derivatives. Derivatives are highly specialized instruments that require investment techniques and risk analyses different from other portfolio investments. The use of derivative instruments requires an understanding not only of the underlying instrument but also of the derivative itself. Certain risk factors generally applicable to derivative transactions are described below.
• Derivatives are subject to the risk that the market value of the derivative itself or the market value of underlying instruments will change in a way adverse to the Fund's interests. The Fund bears the risk that the Adviser may incorrectly forecast future market trends and other financial or economic factors or the value of the underlying security, index, interest rate or currency when establishing a derivatives position for the Fund.
• Derivatives may be subject to pricing risk, which exists when a derivative becomes extraordinarily expensive (or inexpensive) relative to historical prices or corresponding instruments. Under such market conditions, it may not be economically feasible to initiate a transaction or liquidate a position at an advantageous time or price.
• Many derivatives are complex and often valued subjectively. Improper valuations can result in increased payment requirements to counterparties or a loss of value to the Fund.
• Using derivatives as a hedge against a portfolio investment subjects the Fund to the risk that the derivative will have imperfect correlation with the portfolio investment, which could result in the Fund incurring substantial losses. This correlation risk may be greater in the case of derivatives based on an index or other basket of securities, as the portfolio securities being hedged may not duplicate the components of the underlying index or the basket may not be of exactly the same type of obligation as those underlying the derivative. The use of derivatives for "cross hedging" purposes (using a derivative based on one instrument as a hedge for a different instrument) may also involve greater correlation risks.
• While using derivatives for hedging purposes can reduce the Fund's risk of loss, it may also limit the Fund's opportunity for gains or result in losses by offsetting or limiting the Fund's ability to participate in favorable price movements in portfolio investments.
• Derivatives transactions for non-hedging purposes involve greater risks and may result in losses which would not be offset by increases in the value of portfolio securities or declines in the cost of securities to be acquired. In the event that the Fund enters into a derivatives transaction as an alternative to purchasing or selling the underlying instrument or in order to obtain desired exposure to an index or market, the Fund will be exposed to the same risks as are incurred in purchasing or selling the underlying instruments directly.
• The use of certain derivatives transactions involves the risk of loss resulting from the insolvency or bankruptcy of the counterparty to the contract or the failure by the counterparty to make required payments or otherwise comply with the terms of the contract. In the event of default by a counterparty, the Fund may have contractual remedies pursuant to the agreements related to the transaction.
• Liquidity risk exists when a particular derivative is difficult to purchase or sell. If a derivative transaction is particularly large or if the relevant market is illiquid, the Fund may be unable to initiate a transaction or liquidate a position at an advantageous time or price.
• Certain derivatives transactions are not entered into or traded on exchanges or in markets regulated by the U.S. Commodity Futures Trading Commission ("CFTC") or the SEC. Instead, such over-the-counter ("OTC") derivatives are entered into directly by the Fund and a counterparty and may be traded only through financial institutions acting as market makers. OTC derivatives
5
transactions can only be entered into with a willing counterparty that is approved by the Adviser in accordance with guidelines established by the Board. Where no such counterparty is available, the Fund will be unable to enter into a desired OTC transaction. There also may be greater risk that no liquid secondary market in the trading of OTC derivatives will exist, in which case the Fund may be required to hold such instruments until exercise, expiration or maturity. Many of the protections afforded to exchange participants are not available to participants in OTC derivatives transactions. OTC derivatives transactions are not subject to the guarantee of an exchange or clearinghouse and, as a result, the Fund would bear greater risk of default by the counterparties to such transactions.
• The Fund may be required to make physical delivery of portfolio securities underlying a derivative in order to close out a derivatives position or to sell portfolio securities at a time or price at which it may be disadvantageous to do so in order to obtain cash to close out or to maintain a derivatives position.
• As a result of the structure of certain derivatives, adverse changes in the value of the underlying instrument can result in losses substantially greater than the amount invested in the derivative itself. Certain derivatives have the potential for unlimited loss, regardless of the size of the initial investment.
• Certain derivatives may be considered illiquid and therefore subject to the Fund's limitation on investments in illiquid securities.
• Derivatives transactions conducted outside the United States may not be conducted in the same manner as those entered into on U.S. exchanges, and may be subject to different margin, exercise, settlement or expiration procedures. Brokerage commissions, clearing costs and other transaction costs may be higher on foreign exchanges. Many of the risks of OTC derivatives transactions are also applicable to derivatives transactions conducted outside the United States. Derivatives transactions conducted outside the United States are subject to the risk of governmental action affecting the trading in, or the prices of, foreign securities, currencies and other instruments. The value of such positions could be adversely affected by foreign political and economic factors; lesser availability of data on which to make trading decisions; delays on the Fund's ability to act upon economic events occurring in foreign markets; and less liquidity than U.S. markets.
• Currency derivatives are subject to additional risks. Currency derivatives transactions may be negatively affected by government exchange controls, blockages and manipulations. Currency exchange rates may be influenced by factors extrinsic to a country's economy. There is no systematic reporting of last sale information with respect to foreign currencies. As a result, the available information on which trading in currency derivatives will be based may not be as complete as comparable data for other transactions. Events could occur in the foreign currency market which will not be reflected in currency derivatives until the following day, making it more difficult for the Fund to respond to such events in a timely manner.
Options
An option is a contract that gives the holder of the option the right, but not the obligation, to buy from (in the case of a call option) or sell to (in the case of a put option) the seller of the option (the "option writer") the underlying security at a specified fixed price (the "exercise price") on or prior to a specified date (the "expiration date"). The buyer of the option pays to the option writer the option premium, which is the purchase price of the option.
Exchange-traded options are issued by a regulated intermediary such as the Options Clearing Corporation ("OCC"), which guarantees the performance of the obligations of the parties to such options. OTC options are purchased from or sold to counterparties through direct bilateral agreement between the Fund and its counterparties. Certain options, such as options on individual securities, may be settled through physical delivery of the underlying security, whereas other options, such as index options, are settled in cash in an amount based on the value of the underlying instrument multiplied by a specified multiplier.
6
Writing Options. The Fund may write call and put options. As the writer of a call option, the Fund receives the premium from the purchaser of the option and has the obligation, upon exercise of the option, to deliver the underlying security upon payment of the exercise price. If the option expires without being exercised the Fund is not required to deliver the underlying security but retains the premium received.
The Fund may only write call options that are "covered." A call option on a security is covered if (a) the Fund owns the security underlying the call or has an absolute and immediate right to acquire that security without additional cash consideration (or, if additional cash consideration is required, such amount is maintained by the Fund in segregated or earmarked cash or liquid assets) upon conversion or exchange of other securities held by the Fund; or (b) the Fund has purchased a call on the underlying security, the exercise price of which is (i) equal to or less than the exercise price of the call written, or (ii) greater than the exercise price of the call written, provided the difference is maintained by the Fund in segregated or earmarked cash or liquid assets.
Selling call options involves the risk that the Fund may be required to sell the underlying security at a disadvantageous price, below the market price of such security, at the time the option is exercised. As the writer of a covered call option, the Fund forgoes, during the option's life, the opportunity to profit from increases in the market value of the underlying security covering the option above the sum of the premium and the exercise price but retains the risk of loss should the price of the underlying security decline.
The Fund may write put options. As the writer of a put option, the Fund receives the premium from the purchaser of the option and has the obligation, upon exercise of the option, to pay the exercise price and receive delivery of the underlying security. If the option expires without being exercised, the Fund is not required to receive the underlying security in exchange for the exercise price but retains the option premium.
The Fund may only write put options that are "covered." A put option on a security is covered if (a) the Fund segregates or earmarks cash or liquid assets equal to the exercise price; or (b) the Fund has purchased a put on the same security as the put written, the exercise price of which is (i) equal to or greater than the exercise price of the put written, or (ii) less than the exercise price of the put written, provided the difference is maintained by the Fund in segregated or earmarked cash or liquid assets.
Selling put options involves the risk that the Fund may be required to buy the underlying security at a disadvantageous price, above the market price of such security, at the time the option is exercised. While the Fund's potential gain in writing a covered put option is limited to the premium received plus the interest earned on the liquid assets covering the put option, the Fund's risks of loss is equal to the entire value of the underlying security, offset only by the amount of the premium received.
The Fund may close out an options position which it has written through a closing purchase transaction. The Fund would execute a closing purchase transaction with respect to a call option written by purchasing a call option on the same underlying security and having the same exercise price and expiration date as the call option written by the Fund. The Fund would execute a closing purchase transaction with respect to a put option written by purchasing a put option on the same underlying security and having the same exercise price and expiration date as the put option written by the Fund. A closing purchase transaction may or may not result in a profit to a Fund. The Fund could close out its position as an option writer only if a liquid market exists for options on the same underlying security and having the same exercise date as the option written by the Fund. There is no assurance that such a market will exist with respect to any particular option.
The writer of an option generally has no control over the time when the option is exercised, and the option writer is required to deliver or acquire the underlying security. Once an option writer has received an exercise notice, it cannot effect a closing purchase transaction in order to terminate its obligation under the option. Thus, the use of options may require the Fund to buy or sell portfolio securities at inopportune times or for prices other than the current market values of such securities, may limit the amount of appreciation the Fund can realize on an investment, or may cause the Fund to hold a security that it might otherwise sell.
Purchasing Options. The Fund may purchase call and put options. As the buyer of a call option, the Fund pays the premium to the option writer and has the right to purchase the underlying security from the option writer at the exercise price. If the market price of the underlying security rises above the
7
exercise price, the Fund could exercise the option and acquire the underlying security at a below-market price, which could result in a gain to the Fund, minus the premium paid. As the buyer of a put option, the Fund pays the premium to the option writer and has the right to sell the underlying security to the option writer at the exercise price. If the market price of the underlying security declines below the exercise price, the Fund could exercise the option and sell the underlying security at an above-market price, which could result in a gain to the Fund, minus the premium paid. The Fund may buy call and put options whether or not it holds the underlying securities.
As a buyer of a call or put option, the Fund may sell put or call options that it has purchased at any time prior to such option's expiration date through a closing sale transaction. The principal factors affecting the market value of a put or a call option include supply and demand, interest rates, the current market price of the underlying security in relation to the exercise price of the option, the volatility of the underlying security, the underlying security's dividend policy, and the time remaining until the expiration date. A closing sale transaction may or may not result in a profit to the Fund. The Fund's ability to initiate a closing sale transaction is dependent upon the liquidity of the options market and there is no assurance that such a market will exist with respect to any particular option. If the Fund does not exercise or sell an option prior to its expiration date, the option expires and becomes worthless.
OTC Options. Unlike exchange-traded options, which are standardized with respect to the underlying instrument, expiration date, contract size and strike price, the terms of OTC options generally are established through negotiation between the parties to the options contract. This type of arrangement allows the purchaser and writer greater flexibility to tailor the option to their needs. OTC options are available for a greater variety of securities or baskets of securities, and in a wider range of expiration dates and exercise prices than exchange-traded options. However, unlike exchange-traded options, which are issued and guaranteed by a regulated intermediary, such as the OCC, OTC options are entered into directly with the counterparty. Unless the counterparties provide for it, there is no central clearing or guaranty function for an OTC option. Therefore, OTC options are subject to the risk of default or non-performance by the counterparty. Accordingly, the Adviser must assess the creditworthiness of the counterparty to determine the likelihood that the terms of the option will be satisfied. There can be no assurance that a continuous liquid secondary market will exist for any particular OTC option at any specific time. As a result, the Fund may be unable to enter into closing sale transactions with respect to OTC options.
Index Options. Call and put options on indices operate similarly to options on securities. Rather than the right to buy or sell a single security at a specified price, options on an index give the holder the right to receive, upon exercise of the option, an amount of cash determined by reference to the value of the underlying index. The underlying index may be a broad-based index or a narrower market index. Unlike options on securities, all settlements are in cash. The settlement amount, which the writer of a index option must pay to the holder of the option upon exercise, is generally equal to the difference between the fixed exercise price of the option and the value of the underlying index, multiplied by a specified multiplier. The multiplier determines the size of the investment position the option represents. Gain or loss to the Fund on index options transactions will depend on price movements in the underlying securities market generally or in a particular segment of the market rather than price movements of individual securities. As with other options, the Fund may close out its position in index options through closing purchase transactions and closing sale transactions provided that a liquid secondary market exists for such options.
Index options written by the Fund will generally be covered in a manner similar to the covering of other types of options, by holding an offsetting financial position and/or segregating or earmarking cash or liquid assets. The Fund may cover call options written on an index by owning securities whose price changes, in the opinion of the Adviser, are expected to correlate to those of the underlying index.
Foreign Currency Options. Options on foreign currencies operate similarly to options on securities. Rather than the right to buy or sell a single security at a specified price, options on foreign currencies give the holder the right to buy or sell foreign currency for a fixed amount in U.S. dollars or other base currencies. Options on foreign currencies are traded primarily in the OTC market, but may also be traded on U.S. and foreign exchanges. The value of a foreign currency option is dependent upon the value of the underlying foreign currency relative to the U.S. dollar or other base currency. The price of the option may vary with changes in, among other things, the value of either or both currencies and has no relationship to the investment merits of a foreign security. Options on foreign currencies are affected by all of those factors which influence foreign exchange rates and foreign investment generally. As with other options, the Fund
8
may close out its position in foreign currency options through closing purchase transactions and closing sale transactions provided that a liquid market exists for such options.
Foreign currency options written by the Fund will generally be covered in a manner similar to the covering of other types of options, by holding an offsetting financial position and/or segregating or earmarking cash or liquid assets.
Additional Risks of Options Transactions. The risks associated with options transactions are different from, and possibly greater than, the risks associated with investing directly in the underlying instruments. Options are highly specialized instruments that require investment techniques and risk analyses different from those associated with other portfolio investments. The use of options requires an understanding not only of the underlying instrument but also of the option itself. Options may be subject to the risk factors generally applicable to derivatives transactions described herein, and may also be subject to certain additional risk factors, including:
• The exercise of options written or purchased by the Fund could cause the Fund to sell portfolio securities, thus increasing the Fund's portfolio turnover.
• The Fund pays brokerage commissions each time it writes or purchases an option or buys or sells an underlying security in connection with the exercise of an option. Such brokerage commissions could be higher relative to the commissions for direct purchases of sales of the underlying securities.
• The Fund's options transactions may be limited by limitations on options positions established by the SEC, the CFTC or the exchanges on which such options are traded.
• The hours of trading for exchange listed options may not coincide with the hours during which the underlying securities are traded. To the extent that the options markets close before the markets for the underlying securities, significant price and rate movements can take place in the underlying securities that cannot be reflected in the options markets.
• Index options based upon a narrower index of securities may present greater risks than options based on broad market indexes, as narrower indexes are more susceptible to rapid and extreme fluctuations as a result of changes in the values of a smaller number of securities.
• The Fund is subject to the risk of market movements between the time that an option is exercised and the time of performance thereunder, which could increase the extent of any losses suffered by the Fund in connection with options transactions.
Futures Contracts
A futures contract is a standardized agreement to buy or sell a specific quantity of a commodity at a specific price at a specific future time (the "settlement date"). Futures contracts may be based on, among other things, a specified equity security (securities futures), a specified debt security or reference rate (interest rate futures), the value of a specified securities index (index futures) or the value of a foreign currency (forward contracts and currency futures). The value of a futures contract tends to increase and decrease in tandem with the value of the underlying instrument. The buyer of a futures contract agrees to purchase the underlying instrument on the settlement date and is said to be "long" the contract. The seller of a futures contract agrees to sell the underlying instrument on the settlement date and is said to be "short" the contract. Futures contracts call for settlement only on the expiration date and cannot be "exercised" at any other time during their term.
Depending on the terms of the particular contract, futures contracts are settled through either physical delivery of the underlying instrument on the settlement date (such as in the case of securities futures based on a specified debt security) or by payment of a cash settlement amount on the settlement date (such as in the case of futures contracts relating to interest rates, foreign currencies and broad-based securities indexes). In the case of cash settled futures contracts, the settlement amount is equal to the difference between the reference instrument's price on the last trading day of the contract and the reference instrument's price at the time the contract was entered into. Most futures contracts, particularly futures contracts requiring physical delivery, are not held until the settlement date, but instead are offset before the settlement date through the establishment of an opposite and equal futures position (buying a
9
contract that had been sold, or selling a contract that had been purchased). All futures transactions are effected through a clearinghouse associated with the exchange on which the futures are traded.
The buyer and seller of a futures contract are not required to deliver or pay for the underlying commodity unless the contract is held until the settlement date. However, both the buyer and seller are required to deposit "initial margin" with a futures commodities merchant when the futures contract is entered into. Initial margin deposits are typically calculated as a percentage of the contract's market value. If the value of either party's position declines, the party will be required to make additional "variation margin" payments to settle the change in value on a daily basis. The process is known as "marking-to-market." Upon the closing of a futures position through the establishment of an offsetting position, a final determination of variation margin will be made and additional cash will be paid by or released to the Fund.
In addition, the Fund may be required to maintain segregated cash or liquid assets in order to cover futures transactions. The Fund will segregate or earmark cash or liquid assets in an amount equal to the difference between the market value of a futures contract entered into by the Fund and the aggregate value of the initial and variation margin payments made by the Fund with respect to such contract or as otherwise permitted by SEC rules or SEC staff positions. See "Regulatory Matters" below.
Currency Forward Contracts and Currency Futures. A forward foreign currency contract is a negotiated agreement between two parties to exchange specified amounts of two or more currencies at a specified future time at a specified rate. The rate specified by the forward contract can be higher or lower than the spot rate between the currencies that are the subject of the contract. Currency futures are similar to currency forward contracts, except that they are traded on an exchange and standardized as to contract size and delivery date. Most currency futures call for payment or delivery in U.S. dollars. Unanticipated changes in currency prices may result in losses to the Fund and poorer overall performance for the Fund than if it had not entered into currency forward or futures contracts. The Fund may enter into forward or futures contracts under various circumstances. The typical use of a forward or futures contract is to "lock in" the price of a security in U.S. dollars or some other foreign currency, which the Fund is holding in its portfolio. By entering into a forward or futures contract for the purchase or sale, for a fixed amount of dollars or other currency, of the amount of foreign currency involved in the underlying security transactions, the Fund may be able to protect itself against a possible loss resulting from an adverse change in the relationship between the U.S. dollar or other currency which is being used for the security purchase and the foreign currency in which the security is denominated during the period between the date on which the security is purchased or sold and the date on which payment is made or received. The Adviser also may from time to time utilize forward or futures contracts for other purposes. For example, they may be used to hedge a foreign security held in the portfolio or a security which pays out principal tied to an exchange rate between the U.S. dollar and a foreign currency, against a decline in value of the applicable foreign currency. They also may be used to lock in the current exchange rate of the currency in which those securities anticipated to be purchased are denominated. At times, the Fund may enter into "cross-currency" hedging transactions involving currencies other than those in which securities are held or proposed to be purchased are denominated.
The Fund will not enter into forward or futures contracts or maintain a net exposure to these contracts where the consummation of the contracts would obligate the Fund to deliver an amount of foreign currency in excess of the value of the Fund's portfolio securities.
When required by law, the Fund will segregate or earmark cash, U.S. government securities or other appropriate liquid portfolio securities in an amount equal to the value of the Fund's total assets committed to the consummation of forward or futures contracts entered into under the circumstances set forth above. If the value of the securities so earmarked declines, additional cash or securities will be segregated or earmarked on a daily basis so that the value of such securities will equal the amount of the Fund's commitments with respect to such contracts.
The Fund may be limited in its ability to enter into hedging transactions involving forward or futures contracts by the Internal Revenue Code of 1986, as amended (the "Code"), requirements relating to qualification as a regulated investment company.
10
Forward and futures contracts may limit gains on portfolio securities that could otherwise be realized had they not been utilized and could result in losses. The contracts also may increase the Fund's volatility and may involve a significant amount of risk relative to the investment of cash.
Options on Futures Contracts. Options on futures contracts are similar to options on securities except that options on futures contracts give the purchasers the right, in return for the premium paid, to assume a position in a futures contract (a long position in the case of a call option and a short position in the case of a put option) at a specified exercise price at any time prior to the expiration of the option. Upon exercise of the option, the parties will be subject to all of the risks associated with futures transactions and subject to margin requirements. As the writer of options on futures contracts, the Fund would also be subject to initial and variation margin requirements on the option position.
Options on futures contracts written by the Fund will generally be covered in a manner similar to the covering of other types of options, by holding an offsetting financial position and/or segregating or earmarking cash or liquid assets. The Fund may cover an option on a futures contract by purchasing or selling the underlying futures contract. In such instances the exercise of the option will serve to close out the Fund's futures position.
Additional Risk of Futures Transactions. The risks associated with futures contract transactions are different from, and possibly greater than, the risks associated with investing directly in the underlying instruments. Futures are highly specialized instruments that require investment techniques and risk analyses different from those associated with other portfolio investments. The use of futures requires an understanding not only of the underlying instrument but also of the futures contract itself. Futures may be subject to the risk factors generally applicable to derivatives transactions described herein, and may also be subject to certain additional risk factors, including:
• The risk of loss in buying and selling futures contracts can be substantial. Small price movements in the commodity underlying a futures position may result in immediate and substantial loss (or gain) to the Fund.
• Buying and selling futures contracts may result in losses in excess of the amount invested in the position in the form of initial margin. In the event of adverse price movements in the underlying commodity, security, index, currency or instrument, the Fund would be required to make daily cash payments to maintain its required margin. The Fund may be required to sell portfolio securities, or make or take delivery of the underlying securities in order to meet daily margin requirements at a time when it may be disadvantageous to do so. The Fund could lose margin payments deposited with a futures commission merchant if the futures commission merchant breaches its agreement with the Fund, becomes insolvent or declares bankruptcy.
• Most exchanges limit the amount of fluctuation permitted in futures contract prices during any single trading day. Once the daily limit has been reached in a particular futures contract, no trades may be made on that day at prices beyond that limit. If futures contract prices were to move to the daily limit for several trading days with little or no trading, the Fund could be prevented from prompt liquidation of a futures position and subject to substantial losses. The daily limit governs only price movements during a single trading day and therefore does not limit the Fund's potential losses.
• Index futures based upon a narrower index of securities may present greater risks than futures based on broad market indexes, as narrower indexes are more susceptible to rapid and extreme fluctuations as a result of changes in value of a small number of securities.
Swap Contracts and Related Derivative Instruments
A swap contract is an agreement between two parties pursuant to which the parties exchange payments at specified dates on the basis of a specified notional amount, with the payments calculated by reference to specified securities, indexes, reference rates, currencies or other instruments. Most swap agreements provide that when the period payment dates for both parties are the same, the payments are made on a net basis (i.e., the two payment streams are netted out, with only the net amount paid by one party to the other). The Fund's obligations or rights under a swap contract entered into on a net basis will generally be equal only to the net amount to be paid or received under the agreement, based on the relative values of the positions held by each counterparty. With limited exceptions, swap agreements are
11
generally not entered into or traded on exchanges. For most swaps, there is no central clearing or guaranty function. Therefore, swaps are generally subject to the risk of default or non-performance by the counterparty. Accordingly, the Adviser must assess the creditworthiness of the counterparty to determine the likelihood that the terms of the swap will be satisfied.
Swap agreements allow for a wide variety of transactions. For example, fixed rate payments may be exchanged for floating rate payments, U.S. dollar denominated payments may be exchanged for payments denominated in foreign currencies, and payments tied to the price of one security, index, reference rate, currency or other instrument may be exchanged for payments tied to the price of a different security, index, reference rate, currency or other instrument. Swap contracts are typically individually negotiated and structured to provide exposure to a variety of particular types of investments or market factors. Swap contracts can take many different forms and are known by a variety of names. To the extent consistent with a Fund's investment objectives and policies, the Fund is not limited to any particular form or variety of swap contract. The Fund may utilize swaps to increase or decrease its exposure to the underlying instrument, reference rate, foreign currency, market index or other asset. The Fund may also enter into related derivative instruments including caps, floors and collars.
The Fund may be required to cover swap transactions. Obligations under swap agreements entered into on a net basis are generally accrued daily and any accrued but unpaid amounts owed by the Fund to the swap counterparty will be covered by segregating or earmarking cash or liquid assets. If the Fund enters into a swap agreement on other than a net basis, the Fund will segregate or earmark cash or liquid assets with a value equal to the full amount of the Fund's accrued obligations under the agreement.
Interest Rate Swaps, Caps, Floors and Collars. Interest rate swaps consist of an agreement between two parties to exchange their respective commitments to pay or receive interest (e.g., an exchange of floating rate payments for fixed rate payments). Interest rate swaps are generally entered into on a net basis. Interest rate swaps do not involve the delivery of securities, other underlying assets, or principal. Accordingly, the risk of loss with respect to interest rate and total rate of return swaps is limited to the net amount of interest payments that the Fund is contractually obligated to make.
The Fund may also buy or sell interest rate caps, floors and collars. The purchase of an interest rate cap entitles the purchaser, to the extent that a specified index exceeds a predetermined interest rate, to receive payments of interest on a specified notional amount from the party selling the interest rate cap. The purchase of an interest rate floor entitles the purchaser, to the extent that a specified index falls below a predetermined interest rate, to receive payments of interest on a specified notional amount from the party selling the interest rate floor. A collar is a combination of a cap and a floor that preserves a certain return within a predetermined range of interest rate of values. Caps, floors and collars may be less liquid than other types of swaps. If a Fund sells caps, floors and collars, it will segregate liquid assets with a value equal to the full amount, accrued daily, of the Fund's net obligations with respect to the caps, floors or collars.
Index Swaps. An index swap consists of an agreement between two parties in which a party exchanges a cash flow based on a notional amount of a reference index for a cash flow based on a different index or on another specified instrument or reference rate. Index swaps are generally entered into on a net basis.
Inflation Swaps. Inflation swap agreements are contracts in which one party agrees to pay the cumulative percentage increase in a price index, such as the Consumer Price Index, over the term of the swap (with some lag on the referenced inflation index), and the other party pays a compounded fixed rate. Inflation swap agreements may be used to protect the net asset value of the Fund against an unexpected change in the rate of inflation measured by an inflation index. The value of inflation swap agreements is expected to change in response to changes in real interest rates. Real interest rates are tied to the relationship between nominal interest rates and the rate of inflation.
Currency Swaps. A currency swap consists of an agreement between two parties to exchange cash flows on a notional amount of two or more currencies based on the relative value differential among them, such as exchanging a right to receive a payment in foreign currency for the right to receive U.S. dollars. Currency swap agreements may be entered into on a net basis or may involve the delivery of the entire principal value of one designated currency in exchange for the entire principal value of another designated currency. In such cases, the entire principal value of a currency swap is subject to the risk that the counterparty will default on its contractual delivery obligations.
12
Swaptions. An option on a swap agreement, also called a "swaption," is an option that gives the buyer the right, but not the obligation, to enter into a swap on a future date in exchange for paying a market based "premium." A receiver swaption gives the owner the right to receive the total return of a specified asset, reference rate, or index. A payer swaption gives the owner the right to pay the total return of a specified asset, reference rate, or index. Swaptions also include options that allow an existing swap to be terminated or extended by one of the counterparties.
General Risks of Swaps. The risks associated with swap transactions are different from, and possibly greater than, the risks associated with investing directly in the underlying instruments. Swaps are highly specialized instruments that require investment techniques and risk analyses different from those associated with other portfolio investments. The use of swaps requires an understanding not only of the underlying instrument but also of the swap contract itself. Swap transactions may be subject to the risk factors generally applicable to derivatives transactions described above, and may also be subject to certain additional risk factors, including:
• Many swap agreements are not traded on exchanges and not subject to a similar level of government regulation like exchange traded derivatives. As a result, parties to a swap agreement are not protected by such government regulations to the same extent participants in transactions in derivatives traded on organized exchanges.
• In addition to the risk of default by the counterparty, if the creditworthiness of a counterparty to a swap agreement declines, the value of the swap agreement would be likely to decline, potentially resulting in losses.
• The swaps market is a relatively new market and currently is largely unregulated. It is possible that further developments in the swaps market, including future governmental regulation, could adversely affect the Fund's ability to utilize swaps, terminate existing swap agreements or realize amounts to be received under such agreements.
Combined Transactions
Combined transactions involve entering into multiple derivatives transactions (such as multiple options transactions, including purchasing and writing options in combination with each other; multiple futures transactions; and combinations of options, futures, forward and swap transactions) instead of a single derivatives transaction in order to customize the risk and return characteristics of the overall position. Combined transactions typically contain elements of risk that are present in each of the component transactions. The Fund may enter into a combined transaction instead of a single derivatives transaction when, in the opinion of the Adviser, it is in the best interest of the Fund to do so. Because combined transactions involve multiple transactions, they may result in higher transaction costs and may be more difficult to close out.
Regulatory Matters
As described herein, the Fund may be required to cover its potential economic exposure to certain derivatives transactions by holding an offsetting financial position and/or segregating or earmarking cash or liquid assets equal in value to the Fund's potential economic exposure under the transaction. The Fund will cover such transactions as described herein or in such other manner in accordance with applicable laws and regulations. Assets used to cover derivatives transactions cannot be sold while the derivatives position is open, unless they are replaced by other appropriate assets. Segregated or earmarked cash or liquid assets and assets held in margin accounts are not otherwise available to the Fund for investment purposes. If a large portion of the Fund's assets are used to cover derivatives transactions or are otherwise segregated or earmarked, it could affect portfolio management or the Fund's ability to meet redemption requests or other current obligations. With respect to derivatives which are cash-settled (i.e., have no physical delivery requirement), the Fund is permitted to set aside liquid assets in an amount equal to the Fund's daily marked-to-market net obligations (i.e., the Fund's daily net liability) under the derivative, if any, rather than the derivative's full notional value or the market value of the instrument underlying the derivative, as applicable. By setting aside assets equal to only its net obligations under cash-settled derivatives, the Fund will have the ability to employ leverage to a greater extent than if the Fund were required to segregate assets equal to the full notional amount of the derivative or the market value of the underlying instrument, as applicable.
13
Regulatory developments affecting the exchange-traded and OTC derivatives markets may impair the Fund's ability to manage or hedge its investment portfolio through the use of derivatives. The Dodd-Frank Wall Street Reform and Consumer Protection Act (the "Dodd-Frank Act") and the rules promulgated thereunder may limit the ability of the Fund to enter into one or more exchange-traded or OTC derivatives transactions. In particular, pursuant to authority granted under the Dodd-Frank Act, the CFTC in October 2011 promulgated final rules that impose new federal position limits on listed futures and options contracts on, and economically equivalent OTC derivatives referencing, 28 individual agricultural, metal and energy commodities. The Fund's futures and options positions in these 28 contracts will be aggregated with its positions, if any, in economically equivalent OTC derivatives referencing these contracts. These new position limits, which will be imposed on the Fund and its counterparties, may impact the Fund's ability to invest in futures, options and swaps in a manner that efficiently meets its investment objective. Derivatives positions of all investment companies advised by the Adviser are combined for purposes of these limits. An exchange may order the liquidation of positions found to be in excess of these limits and may impose certain other sanctions or restrictions.
The Fund's use of derivatives may be limited by the requirements of the Code, for qualification as a regulated investment company for U.S. federal income tax purposes.
In February 2012, the CFTC adopted certain regulatory changes that may impact the Fund by subjecting the Adviser to registration with the CFTC as the commodity pool operator ("CPO") of the Fund, unless the Fund is able to comply with certain trading and marketing limitations on its investments in futures and certain other instruments. If the Adviser becomes subject to CFTC registration as a CPO, the disclosure and operations of the Fund would need to comply with all applicable CFTC regulations. Compliance with these additional registration and regulatory requirements would increase Fund expenses.
Contracts for Difference ("CFDs"). The Fund may purchase CFDs. A CFD is a privately negotiated contract between two parties, buyer and seller, stipulating that the seller will pay to or receive from the buyer the difference between the nominal value of the underlying instrument at the opening of the contract and that instrument's value at the end of the contract. The underlying instrument may be a single security, stock basket or index. A CFD can be set up to take either a short or long position on the underlying instrument. The buyer and seller are both required to post margin, which is adjusted daily. The buyer will also pay to the seller a financing rate on the notional amount of the capital employed by the seller less the margin deposit. A CFD is usually terminated at the buyer's initiative. The seller of the CFD will simply match the exposure of the underlying instrument in the open market and the parties will exchange whatever payment is due.
As is the case with owning any financial instrument, there is the risk of loss associated with buying a CFD. For example, if the Fund buys a long CFD and the underlying security is worth less at the end of the contract, the Fund would be required to make a payment to the seller and would suffer a loss. Also, there may be liquidity risk if the underlying instrument is illiquid because the liquidity of a CFD is based on the liquidity of the underlying instrument. A further risk is that adverse movements in the underlying security will require the buyer to post additional margin. CFDs also carry counterparty risk, i.e., the risk that the counterparty to the CFD transaction may be unable or unwilling to make payments or to otherwise honor its financial obligations under the terms of the contract. If the counterparty were to do so, the value of the contract, and of the Fund's shares, may be reduced.
To the extent that there is an imperfect correlation between the return on the Fund's obligation to its counterparty under the CFDs and the return on related assets in its portfolio, the CFD transaction may increase the Fund's financial risk. The Fund will not enter into a CFD transaction that is inconsistent with its investment objective, policies and strategies.
Money Market Securities. The Fund may invest in various money market securities for cash management purposes or when assuming a temporary defensive position, which among others may include commercial paper, bankers' acceptances, bank obligations, corporate debt securities, certificates of deposit, U.S. government securities, obligations of savings institutions and repurchase agreements. Such securities are limited to:
U.S. Government Securities. Obligations issued or guaranteed as to principal and interest by the United States or its agencies (such as the Export-Import Bank of the United States, Federal Housing
14
Administration and GNMA) or its instrumentalities (such as the Federal Home Loan Bank), including Treasury bills, notes and bonds;
Bank Obligations. Obligations (including certificates of deposit, time deposits and bankers' acceptances) of banks subject to regulation by the U.S. Government and having total assets of $1 billion or more, and instruments secured by such obligations, not including obligations of foreign branches of domestic banks except to the extent below;
Eurodollar Certificates of Deposit. Eurodollar certificates of deposit issued by foreign branches of domestic banks having total assets of $1 billion or more;
Obligations of Savings Institutions. Certificates of deposit of savings banks and savings and loan associations, having total assets of $1 billion or more;
Fully Insured Certificates of Deposit. Certificates of deposit of banks and savings institutions, having total assets of less than $1 billion, if the principal amount of the obligation is federally insured by the Bank Insurance Fund or the Savings Association Insurance Fund (each of which is administered by the FDIC), limited to $250,000 principal amount per certificate (a temporary increase from $100,000, which is due to expire on December 31, 2013) and to 10% or less of the Fund's total assets in all such obligations and in all illiquid assets, in the aggregate;
Commercial Paper. Commercial paper rated within the two highest grades by Standard & Poor's Rating Group, a division of The McGraw-Hill Companies, Inc. ("S&P"), or by Moody's Investors Service, Inc. ("Moody's") or, if not rated, issued by a company having an outstanding debt issue rated at least AA by S&P or Aa by Moody's; and
Repurchase Agreements. The Fund may invest in repurchase agreements. When cash may be available for only a few days, it may be invested by the Fund in repurchase agreements until such time as it may otherwise be invested or used for payments of obligations of the Fund. These agreements typically involve the acquisition by the Fund of debt securities from a selling financial institution such as a bank, savings and loan association or broker-dealer. The agreement provides that the Fund will sell back to the institution, and that the institution will repurchase, the underlying securities serving as collateral at a specified price and at a fixed time in the future, usually not more than seven days from the date of purchase. The collateral will be marked-to-market daily to determine that the value of the collateral, as specified in the agreement, does not decrease below the purchase price plus accrued interest. If such decrease occurs, additional collateral will be requested and, when received, added to the account to maintain full collateralization. The Fund will accrue interest from the institution until the time when the repurchase is to occur. Although this date is deemed by the Fund to be the maturity date of a repurchase agreement, the maturities of securities subject to repurchase agreements are not subject to any limits.
While repurchase agreements involve certain risks not associated with direct investments in debt securities, the Fund follows procedures approved by the Trustees that are designed to minimize such risks. These procedures include effecting repurchase transactions only with large, well-capitalized and well-established financial institutions whose financial condition will be continually monitored by the Adviser. In addition, as described above, the value of the collateral underlying the repurchase agreement will be at least equal to the repurchase price, including any accrued interest earned on the repurchase agreement. In the event of a default or bankruptcy by a selling financial institution, the Fund will seek to liquidate such collateral. However, the exercising of the Fund's right to liquidate such collateral could involve certain costs or delays and, to the extent that proceeds from any sale upon a default of the obligation to repurchase were less than the repurchase price, the Fund could suffer a loss.
Reverse Repurchase Agreements. The Fund may also use reverse repurchase agreements for purposes of meeting redemptions or as part of its investment strategy. Reverse repurchase agreements involve sales by the Fund of portfolio assets concurrently with an agreement by the Fund to repurchase the same assets at a later date at a fixed price. Generally, the effect of such a transaction is that the Fund can recover all or most of the cash invested in the portfolio securities involved during the term of the reverse repurchase agreement, while it will be able to keep the interest income associated with those portfolio securities. These transactions are only advantageous if the interest cost to the Fund of the reverse repurchase transaction is less than the cost of obtaining the cash otherwise. Opportunities to achieve this
15
advantage may not always be available, and the Fund intends to use the reverse repurchase technique only when it will be to its advantage to do so.
The Fund will earmark cash or liquid assets or establish a segregated account in which it will maintain cash, U.S. Government securities or other appropriate liquid portfolio securities equal in value to its obligations in respect of reverse repurchase agreements. Reverse repurchase agreements may not exceed 10% of the Fund's total assets. The Fund will make no purchases of portfolio securities while it is still subject to a reverse repurchase agreement.
Zero Coupon Treasury Securities. A portion of the U.S. government securities purchased by the Fund may be "zero coupon" Treasury securities. These are U.S. Treasury notes and bonds which have been stripped of their unmatured interest coupons and receipts or which are certificates representing interests in such stripped debt obligations and coupons. Such securities are purchased at a discount from their face amount, giving the purchaser the right to receive their full value at maturity. A zero coupon security pays no interest to its holder during its life. Its value to an investor consists of the difference between its face value at the time of maturity and the price for which it was acquired, which is generally an amount significantly less than its face value (sometimes referred to as a "deep discount" price).
The interest earned on such securities is, implicitly, automatically compounded and paid out at maturity. While such compounding at a constant rate eliminates the risk of receiving lower yields upon reinvestment of interest if prevailing interest rates decline, the owner of a zero coupon security will be unable to participate in higher yields upon reinvestment of interest received if prevailing interest rates rise. For this reason, zero coupon securities are subject to substantially greater market price fluctuations during periods of changing prevailing interest rates than are comparable debt securities which make current distributions of interest. Current federal tax law requires that a holder (such as the Fund) of a zero coupon security accrue a portion of the discount at which the security was purchased as income each year even though the Fund receives no interest payments in cash on the security during the year.
Real Estate Investment Trusts ("REITs") and Foreign Real Estate Companies. The Fund may invest in REITs and foreign real estate companies, which are similar to entities organized and operated as REITs in the United States. REITs and foreign real estate companies pool investors' funds for investment primarily in real estate properties or real estate-related loans. REITs and foreign real estate companies generally derive their income from rents on the underlying properties or interest on the underlying loans, and their value is impacted by changes in the value of the underlying property or changes in the interest rates affecting the underlying loans owned by the REITs and/or foreign real estate companies. REITs and foreign real estate companies are more susceptible to risks associated with the ownership of real estate and the real estate industry in general. These risks can include fluctuations in the value of underlying properties; defaults by borrowers or tenants; market saturation; changes in general and local economic conditions; decreases in market rates for rents; increases in competition, property taxes, capital expenditures or operating expenses; and other economic, political or regulatory occurrences affecting the real estate industry. In addition, REITs and foreign real estate companies depend upon specialized management skills, may not be diversified (which may increase the volatility of a REIT's and/or foreign real estate company's value), may have less trading volume and may be subject to more abrupt or erratic price movements than the overall securities market. Foreign real estate companies may be subject to laws, rules and regulations governing those entities and their failure to comply with those laws, rules and regulations could negatively impact the performance of those entities. Operating REITs and foreign real estate companies requires specialized management skills and the Fund indirectly bears REIT and foreign real estate company management expenses along with the direct expenses of the Fund. REITs are not taxed on income distributed to shareholders provided they comply with several requirements of the Code. REITs are subject to the risk of failing to qualify for tax-free pass-through of income under the Code.
Loans of Portfolio Securities. The Fund may lend its portfolio securities to brokers, dealers, banks and other institutional investors. By lending its portfolio securities, the Fund attempts to increase its net investment income through the receipt of interest on the cash collateral with respect to the loan or fees received from the borrower in connection with the loan. Any gain or loss in the market price of the securities loaned that might occur during the term of the loan would be for the account of the Fund. The
16
Fund employs an agent to implement the securities lending program and the agent receives a fee from the Fund for its services. The Fund will not lend more than 331/3% of the value of its total assets.
The Fund may lend its portfolio securities so long as the terms, structure and the aggregate amount of such loans are not inconsistent with the Investment Company Act or the rules and regulations or interpretations of the SEC thereunder, which currently require that (i) the borrower pledge and maintain with the Fund collateral consisting of liquid, unencumbered assets having a value at all times not less than 100% of the value of the securities loaned; (ii) the borrower add to such collateral whenever the price of the securities loaned rises (i.e., the borrower "marks to market" on a daily basis); (iii) the loan be made subject to termination by the Fund at any time; and (iv) the Fund receives a reasonable return on the loan (which may include the Fund investing any cash collateral in interest bearing short-term investments), any distributions on the loaned securities and any increase in their market value. In addition, voting rights may pass with the loaned securities, but the Fund will retain the right to call any security in anticipation of a vote that the Adviser deems material to the security on loan.
There may be risks of delay and costs involved in recovery of securities or even loss of rights in the collateral should the borrower of the securities fail financially. These delays and costs could be greater for foreign securities. However, loans will be made only to borrowers deemed by the Adviser to be creditworthy and when, in the judgment of the Adviser, the income which can be earned from such securities loans justifies the attendant risk. All relevant facts and circumstances, including the creditworthiness of the broker, dealer, bank or institution, will be considered in making decisions with respect to the lending of securities, subject to review by the Fund's Board of Trustees. The Fund also bears the risk that the reinvestment of collateral will result in a principal loss. Finally, there is the risk that the price of the securities will increase while they are on loan and the collateral will not be adequate to cover their value.
Borrowing. The Fund has an operating policy, which may be changed by the Fund's Board of Trustees, not to borrow except from a bank for temporary or emergency purposes in amounts not exceeding 5% (taken at the lower of cost or current value) of its total assets (not including the amount borrowed). Should the Board of Trustees remove this operating policy, the Fund would be permitted to borrow money from banks in accordance with the Investment Company Act or the rules and regulations promulgated by the SEC thereunder. Currently the Investment Company Act permits a fund to borrow money from banks in an amount up to 331/3% of its total assets (including the amount borrowed) less its liabilities (not including any borrowings but including the fair market value at the time of computation of any other senior securities then outstanding). The Fund may also borrow an additional 5% of its total assets without regard to the foregoing limitation for temporary purposes such as clearance of portfolio transactions. The Fund would only borrow when the Adviser believes that such borrowings will benefit the Fund after taking into account considerations such as interest income and possible gains or losses upon liquidation. The Fund will maintain asset coverage in accordance with the Investment Company Act.
Borrowing by the Fund creates an opportunity for increased net income but, at the same time, creates special risks. For example, leveraging may exaggerate changes in and increase the volatility of the net asset value of Fund shares. This is because leverage tends to exaggerate the effect of any increase or decrease in the value of the Fund's portfolio securities. The use of leverage also may cause the Fund to liquidate portfolio positions when it may not be advantageous to do so to satisfy its obligations or to maintain asset coverage.
In general, the Fund may not issue any class of senior security, except that the Fund may (i) borrow from banks, provided that immediately following any such borrowing there is an asset coverage of at least 300% for all Fund borrowings and in the event such asset coverage falls below 300% the Fund will within three days or such longer period as the SEC may prescribe by rules and regulations, reduce the amount of its borrowings to an extent that the asset coverage of such borrowings shall be at least 300%, and (ii) engage in trading practices which could be deemed to involve the issuance of a senior security, including but not limited to options, futures, forward contracts and reverse repurchase agreements, provided that the Fund earmarks or segregates liquid assets in accordance with applicable SEC regulations and interpretations.
When-Issued and Delayed Delivery Securities and Forward Commitments. From time to time, the Fund may purchase securities on a when-issued or delayed delivery basis or may purchase or sell securities on a forward commitment basis. When these transactions are negotiated, the price is fixed at the time of the commitment, but delivery and payment may take place a month or more after the date of
17
commitment. While the Fund will only purchase securities on a when issued, delayed delivery or forward commitment basis with the intention of acquiring the securities, the Fund may sell the securities before the settlement date, if it is deemed advisable. The securities so purchased or sold are subject to market fluctuation and no interest or dividends accrue to the purchaser prior to the settlement date.
At the time the Fund makes the commitment to purchase or sell securities on a when-issued, delayed delivery or forward commitment basis, it will record the transaction and thereafter reflect the value, each day, of such security purchased, or if a sale, the proceeds to be received, in determining its net asset value. At the time of delivery of the securities, their value may be more or less than the purchase or sale price. An increase in the percentage of the Fund's assets committed to the purchase of securities on a when-issued, delayed delivery or forward commitment basis may increase the volatility of its net asset value. The Fund will also earmark cash or liquid assets or establish a segregated account on the Fund's books in which it will continually maintain cash or cash equivalents or other liquid portfolio securities equal in value to commitments to purchase securities on a when-issued, delayed delivery or forward commitment basis.
When, As and If Issued Securities. The Fund may purchase securities on a "when, as and if issued" basis, under which the issuance of the security depends upon the occurrence of a subsequent event, such as approval of a merger, corporate reorganization or debt restructuring. The commitment for the purchase of any such security will not be recognized in the portfolio of the Fund until the Adviser determines that issuance of the security is probable. At that time, the Fund will record the transaction and, in determining its net asset value, will reflect the value of the security daily. At that time, the Fund will also earmark cash or liquid assets or establish a segregated account on the Fund's books in which it will maintain cash, cash equivalents or other liquid portfolio securities equal in value to recognized commitments for such securities.
An increase in the percentage of the Fund's assets committed to the purchase of securities on a "when, as and if issued" basis may increase the volatility of its net asset value. The Fund may also sell securities on a "when, as and if issued" basis provided that the issuance of the security will result automatically from the exchange or conversion of a security owned by the Fund at the time of sale.
Private Placements and Restricted Securities. The Fund may invest up to 15% of its net assets in securities which are subject to restrictions on resale because they have not been registered under the Securities Act of 1933, as amended (the "Securities Act"), or which are otherwise not readily marketable. (Securities eligible for resale pursuant to Rule 144A under the Securities Act, and determined to be liquid pursuant to the procedures discussed in the following paragraph, are not subject to the foregoing restriction.) These securities are generally referred to as private placements or restricted securities. Such securities may involve a higher degree of business and financial risk that can result in substantial losses. As a result of the absence of a public trading market for these securities, they may be less liquid than publicly traded securities. To the extent these securities may be resold in privately negotiated transactions, the prices realized from these sales could be less than those originally paid by the Fund or less than what may be considered the fair value of such securities. Furthermore, companies whose securities are not publicly traded may not be subject to the disclosure and other investor protection requirements which might be applicable if their securities were publicly traded. The illiquidity of the market, as well as the lack of publicly available information regarding these securities, may also adversely affect the ability to arrive at a fair value for certain securities at certain times and could make it difficult for the Fund to sell certain securities. If such securities are required to be registered under the securities laws of one or more jurisdictions before being sold, the Fund may be required to bear the expenses of registration.
Rule 144A permits the Fund to sell restricted securities to qualified institutional buyers without limitation. The Adviser, pursuant to procedures adopted by the Trustees, will make a determination as to the liquidity of each restricted security purchased by the Fund. If a restricted security is determined to be "liquid," the security will not be included within the category "illiquid securities," which may not exceed 15% of the Fund's net assets. However, investing in Rule 144A securities could have the effect of increasing the level of Fund illiquidity to the extent the Fund, at a particular point in time, may be unable to find qualified institutional buyers interested in purchasing such securities.
Private Investments in Public Equity. The Fund may purchase equity securities in a private placement that are issued by issuers who have outstanding, publicly-traded equity securities of the same class ("private investments in public equity" or "PIPES"). Shares in PIPES generally are not registered with
18
the SEC until after a certain time period from the date the private sale is completed. This restricted period can last many months. Until the public registration process is completed, PIPES are restricted as to resale and the Fund cannot freely trade the securities. Generally, such restrictions cause the PIPES to be illiquid during this time. PIPES may contain provisions that the issuer will pay specified financial penalties to the holder if the issuer does not publicly register the restricted equity securities within a specified period of time, but there is no assurance that the restricted equity securities will be publicly registered, or that the registration will remain in effect.
Limited Partnerships. A limited partnership interest entitles the Fund to participate in the investment return of the partnership's assets as defined by the agreement among the partners. As a limited partner, the Fund generally is not permitted to participate in the management of the partnership. However, unlike a general partner whose liability is not limited, a limited partner's liability generally is limited to the amount of its commitment to the partnership.
Warrants and Subscription Rights. The Fund may acquire warrants and subscription rights attached to other securities. A warrant is, in effect, an option to purchase equity securities at a specific price, generally valid for a specific period of time, and has no voting rights, pays no dividends and has no rights with respect to the corporation issuing it.
A subscription right is a privilege granted to existing shareholders of a corporation to subscribe to shares of a new issue of common stock before it is offered to the public. A subscription right normally has a life of two to four weeks and a subscription price lower than the current market value of the common stock.
Convertible Securities. The Fund may invest in securities which are convertible into common stock or other securities of the same or a different issuer or into cash within a particular period of time at a specified price or formula. Convertible securities are generally fixed-income securities (but may include preferred stock) and generally rank senior to common stocks in a corporation's capital structure and, therefore, entail less risk than the corporation's common stock. The value of a convertible security is a function of its "investment value" (its value as if it did not have a conversion privilege), and its "conversion value" (the security's worth if it were to be exchanged for the underlying security, at market value, pursuant to its conversion privilege).
To the extent that a convertible security's investment value is greater than its conversion value, its price will be primarily a reflection of such investment value and its price will be likely to increase when interest rates fall and decrease when interest rates rise, as with a fixed-income security (the credit standing of the issuer and other factors may also have an effect on the convertible security's value). If the conversion value exceeds the investment value, the price of the convertible security will rise above its investment value and, in addition, will sell at some premium over its conversion value. (This premium represents the price investors are willing to pay for the privilege of purchasing a fixed-income security with a possibility of capital appreciation due to the conversion privilege.) At such times the price of the convertible security will tend to fluctuate directly with the price of the underlying equity security. Convertible securities may be purchased by the Fund at varying price levels above their investment values and/or their conversion values in keeping with the Fund's objective.
Up to 5% of the Fund's net assets may be invested in convertible securities that are below investment grade. Debt securities rated below investment grade are commonly known as "junk bonds." Although the Fund selects these securities primarily on the basis of their equity characteristics, investors should be aware that convertible securities rated in these categories are considered high risk securities; the rating agencies consider them speculative with respect to the issuer's continuing ability to make timely payments of interest and principal. Thus, to the extent that such convertible securities are acquired by the Fund, there is a greater risk as to the timely repayment of the principal of, and timely payment of interest or dividends on, such securities than in the case of higher-rated convertible securities.
Foreign Investment. Investing in foreign securities involves certain special considerations which are not typically associated with investments in the securities of U.S. issuers. Foreign issuers are not generally subject to uniform accounting, auditing and financial reporting standards and may have policies that are not comparable to those of domestic issuers. As a result, there may be less information available about foreign issuers than about domestic issuers. Securities of some foreign issuers may be less liquid and more volatile than securities of comparable domestic issuers. There is generally less government
19
supervision and regulation of stock exchanges, brokers and listed issuers than in the United States. In addition, with respect to certain foreign countries, there is a possibility of expropriation or confiscatory taxation, political and social instability, or diplomatic development which could affect U.S. investments in those countries. The costs of investing in foreign countries frequently are higher than the costs of investing in the United States. Although the Adviser endeavors to achieve the most favorable execution costs in portfolio transactions, fixed commissions on many foreign stock exchanges are generally higher than negotiated commissions on U.S. exchanges. In addition, investments in certain foreign markets, which have historically been considered stable, may become more volatile and subject to increased risk due to ongoing developments and changing conditions in such markets. Moreover, the growing interconnectivity of global economies and financial markets has increased the probability that adverse developments and conditions in one country or region will affect the stability of economies and financial markets in other countries or regions.
Investments in securities of foreign issuers may be denominated in foreign currencies. Accordingly, the value of the Fund's assets, as measured in U.S. dollars, may be affected favorably or unfavorably by changes in currency exchange rates and in exchange control regulations. The Fund may incur costs in connection with conversions between various currencies.
Certain foreign governments levy withholding or other taxes on dividend and interest income. Although in some countries a portion of these taxes are recoverable, the non-recovered portion of foreign withholding taxes will reduce the income received from investments in such countries.
The Adviser may consider an issuer to be from a particular country or geographic region if (i) its principal securities trading market is in that country or geographic region; (ii) alone or on a consolidated basis it derives 50% or more of its annual revenue from goods produced, sales made or services performed in that country or geographic region; or (iii) it is organized under the laws of, or has a principal office in, that country or geographic region. By applying these tests, it is possible that a particular issuer could be deemed to be from more than one country or geographic region.
Emerging Market Securities. An emerging market security is one issued by a foreign government or private issuer that has one or more of the following characteristics: (i) its principal securities trading market is in an emerging market or developing country, (ii) alone or on a consolidated basis it derives 50% or more of its annual revenue from goods produced, sales made or services performed in emerging markets or (iii) it is organized under the laws of, or has a principal office in, an emerging market or developing country. Based on these criteria it is possible for a security to be considered issued by an issuer in more than one country. Therefore, it is possible for the securities of any issuer that has one or more of these characteristics in connection with any emerging market or developing country not to be considered an emerging market security if it has one or more of these characteristics in connection with a developed country.
Emerging market describes any country which is generally considered to be an emerging or developing country by major organizations in the international financial community, such as the International Bank for Reconstruction and Development (more commonly known as the World Bank) and the International Finance Corporation. Emerging markets can include every nation in the world except the United States, Canada, Japan, Australia, New Zealand and most nations located in Western Europe.
The economies of individual emerging market or developing countries may differ favorably or unfavorably from the U.S. economy in such respects as growth of gross domestic product, rate of inflation or deflation, currency depreciation, capital reinvestment, resource self-sufficiency and balance of payments position. Further, the economies of developing countries generally are heavily dependent upon international trade and, accordingly, have been, and may continue to be, adversely affected by trade barriers, exchange controls, managed adjustments in relative currency values and other protectionist measures. These economies also have been, and may continue to be, adversely effected by economic conditions in the countries with which they trade.
Prior governmental approval for foreign investments may be required under certain circumstances in some emerging market or developing countries, and the extent of foreign investment in certain fixed-income securities and domestic companies may be subject to limitation in other emerging market or developing countries. Foreign ownership limitations also may be imposed by the charters of individual companies in emerging market or developing countries to prevent, among other concerns, violation of foreign investment limitations. Repatriation of investment income, capital and the proceeds of sales by
20
foreign investors may require governmental registration and/or approval in some emerging countries. The Fund could be adversely affected by delays in, or a refusal to grant, any required governmental registration or approval for such repatriation. Any investment subject to such repatriation controls will be considered illiquid if it appears reasonably likely that this process will take more than seven days.
Investment in emerging market or developing countries may entail purchasing securities issued by or on behalf of entities that are insolvent, bankrupt, in default or otherwise engaged in an attempt to reorganize or reschedule their obligations and in entities that have little or no proven credit rating or credit history. In any such case, the issuer's poor or deteriorating financial condition may increase the likelihood that the Fund will experience losses or diminution in available gains due to bankruptcy, insolvency or fraud. Emerging market or developing countries also pose the risk of nationalization, expropriation or confiscatory taxation, political changes, government regulation, social instability or diplomatic development (including war) that could affect adversely the economies of such countries or the value of the Fund's investments in those countries. In addition, it may be difficult to obtain and enforce a judgment in a court outside the United States.
Investments in emerging markets may also be exposed to an extra degree of custodial and/or market risk, especially where the securities purchased are not traded on an official exchange or where ownership records regarding the securities are maintained by an unregulated entity (or even the issuer itself).
Depositary Receipts. Depositary Receipts represent an ownership interest in securities of foreign companies (an "underlying issuer") that are deposited with a depositary. Depositary Receipts are not necessarily denominated in the same currency as the underlying securities. Depositary Receipts include American Depositary Receipts ("ADRs"), Global Depositary Receipts ("GDRs") and other types of Depositary Receipts (which, together with ADRs and GDRs, are hereinafter collectively referred to as "Depositary Receipts"). ADRs are dollar-denominated Depositary Receipts typically issued by a U.S. financial institution which evidence an ownership interest in a security or pool of securities issued by a foreign issuer. ADRs are listed and traded in the United States. GDRs and other types of Depositary Receipts are typically issued by foreign banks or trust companies, although they also may be issued by U.S. financial institutions, and evidence ownership interests in a security or pool of securities issued by either a foreign or a U.S. corporation. Generally, Depositary Receipts in registered form are designed for use in the U.S. securities market and Depositary Receipts in bearer form are designed for use in securities markets outside the United States.
Depositary Receipts may be "sponsored" or "unsponsored." Sponsored Depositary Receipts are established jointly by a depositary and the underlying issuer, whereas unsponsored Depositary Receipts may be established by a depositary without participation by the underlying issuer. Holders of unsponsored Depositary Receipts generally bear all the costs associated with establishing unsponsored Depositary Receipts. In addition, the issuers of the securities underlying unsponsored Depositary Receipts are not obligated to disclose material information in the United States and, therefore, there may be less information available regarding such issuers and there may not be a correlation between such information and the market value of the Depositary Receipts. For purposes of the Fund's investment policies, the Fund's investments in Depositary Receipts will be deemed to be an investment in the underlying securities, except that ADRs may be deemed to be issued by a U.S. issuer.
Investment Company Securities. Investment company securities are securities of other open-end, closed-end and unregistered investment companies, including foreign investment companies and exchange-traded funds. The Fund may invest in investment company securities as may be permitted by (i) the Investment Company Act; (ii) the rules and regulations promulgated by the SEC under the Investment Company Act; or (iii) an exemption or other relief applicable to the Fund from provisions of the Investment Company Act. The Investment Company Act generally prohibits an investment company from acquiring more than 3% of the outstanding voting shares of an investment company and limits such investments to no more than 5% of a portfolio's total assets in any one investment company, and no more than 10% in any combination of investment companies. The Fund may invest in investment company securities of investment companies managed by the Adviser or its affiliates to the extent permitted under the Investment Company Act or as otherwise authorized by the SEC. To the extent the Fund invests a portion of its assets in investment company securities, those assets will be subject to the risks of the purchased investment company's portfolio securities, and a shareholder in the Fund will bear not only his proportionate share of the expenses of the Fund, but also, indirectly the expenses of the purchased investment company.
21
To the extent permitted by applicable law, the Fund may invest all or some of its short term cash investments in any money market fund advised or managed by the Adviser or its affiliates. In connection with any such investments, the Fund, to the extent permitted by the Investment Company Act, will pay its share of all expenses (other than advisory and administrative fees) of a money market fund in which it invests which may result in the Fund bearing some additional expenses.
Exchange-Traded Funds ("ETFs"). The Fund may invest in shares of various ETFs, including exchange-traded index and bond funds. Exchange-traded index funds seek to track the performance of various securities indices. Shares of ETFs have many of the same risks as direct investments in common stocks or bonds. In addition, their market value is expected to rise and fall as the value of the underlying index or bond rises and falls. The market value of their shares may differ from the net asset value of the particular fund. As a shareholder in an ETF (as with other investment companies), the Fund would bear its ratable share of that entity's expenses. At the same time, the Fund would continue to pay its own investment management fees and other expenses. As a result, the Fund and its shareholders, in effect, will be absorbing duplicate levels of fees with respect to investments in ETFs.
C. Fund Policies/Investment Restrictions
The investment objective, policies and restrictions listed below have been adopted by the Fund as fundamental policies. Under the Investment Company Act, a fundamental policy may not be changed without the vote of a majority of the outstanding voting securities of the Fund. The Investment Company Act defines a majority as the lesser of (a) 67% or more of the shares present at a meeting of shareholders, if the holders of 50% of the outstanding shares of the Fund are present or represented by proxy; or (b) more than 50% of the outstanding shares of the Fund. For purposes of the following restrictions: (i) all percentage limitations apply immediately after a purchase or initial investment, and (ii) any subsequent change in any applicable percentage resulting from market fluctuations or other changes in total or net assets does not require elimination of any security from the portfolio, except in the case of borrowing and investments in illiquid securities.
The Fund will:
1. Seek long-term capital growth.
The Fund will not:
1. Invest in a manner inconsistent with its classification as a "diversified company" as provided by (i) the Investment Company Act, as amended from time to time, (ii) the rules and regulations promulgated by the SEC under the Investment Company Act, as amended from time to time, or (iii) an exemption or other relief applicable to the Fund from the provisions of the Investment Company Act, as amended from time to time.
2. Borrow money, except the Fund may borrow money to the extent permitted by (i) the Investment Company Act, as amended from time to time, (ii) the rules and regulations promulgated by the SEC under the Investment Company Act, as amended from time to time, or (iii) an exemption or other relief applicable to the Fund from the provisions of the Investment Company Act, as amended from time to time.
3. Make loans of money or property to any person, except (a) to the extent that securities or interests in which the Fund may invest are considered to be loans, (b) through the loan of portfolio securities, (c) by engaging in repurchase agreements, or (d) as may otherwise be permitted by (i) the Investment Company Act, as amended from time to time, (ii) the rules and regulations promulgated by the SEC under the Investment Company Act, as amended from time to time, or (iii) an exemption or other relief applicable to the Fund from the provision of the Investment Company Act, as amended from time to time.
4. Purchase or sell physical commodities unless acquired as a result of ownership of securities or other instruments; provided that this restriction shall not prohibit the Fund from purchasing or selling options, futures contracts and related options thereon, forward contracts, swaps, caps, floors, collars and any other financial instruments or from investing in securities or other instruments backed by physical commodities or as otherwise permitted by (i) the Investment Company Act, as amended from time to time, (ii) the rules and regulations promulgated by the SEC under the Investment Company Act, as amended from time to time, or (iii) an exemption or other relief applicable to the Fund from the provisions of the Investment Company Act, as amended from time to time.
22
5. Issue senior securities, except the Fund may issue senior securities to the extent permitted by (i) the Investment Company Act, as amended from time to time, (ii) the rules and regulations promulgated by the SEC under the Investment Company Act, as amended from time to time, or (iii) an exemption or other relief applicable to the Fund from the provisions of the Investment Company Act, as amended from time to time.
6. Invest 25% or more of the value of its total assets in securities of issuers in any one industry. This restriction does not apply to obligations issued or guaranteed by the U.S. government or its agencies or instrumentalities.
7. Purchase or sell real estate or interests therein (including real estate limited partnerships), although the Fund may purchase securities of issuers which engage in real estate operations and securities secured by real estate or interests therein.
8. Engage in the underwriting of securities, except insofar as the Fund may be deemed an underwriter under the Securities Act in disposing of a portfolio security.
In addition, as non-fundamental policies, which can be changed with Board approval and without shareholder vote, the Fund will not:
1. Invest in other investment companies in reliance on Sections 12(d)(1)(F), 12(d)(1)(G) or 12(d)(1)(J) of the Investment Company Act.
2. Make short sales of securities, except short sales against the box.
The Fund has an operating policy, which may be changed by the Fund's Board of Trustees, not to borrow except from a bank for temporary or emergency purposes in amounts not exceeding 5% (taken at the lower of cost or current value) of its total assets (not including the amount borrowed).
Notwithstanding any other investment policy or restriction, the Fund may seek to achieve its investment objective by investing all or substantially all of its assets in another investment company having substantially the same investment objective and policies as the Fund.
D. Disclosure of Portfolio Holdings
The Fund's Board of Trustees and the Adviser have adopted policies and procedures regarding disclosure of portfolio holdings (the "Policy"). Pursuant to the Policy, the Adviser may disclose information concerning Fund portfolio holdings only if such disclosure is consistent with the antifraud provisions of the federal securities laws and the Fund's and the Adviser's fiduciary duties to Fund shareholders. In no instance may the Adviser or the Fund receive compensation or any other consideration in connection with the disclosure of information about the portfolio securities of the Fund. Consideration includes any agreement to maintain assets in the Fund or in other investment companies or accounts managed by the Adviser or by any affiliated person of the Adviser. Non-public information concerning portfolio holdings may be divulged to third parties only when the Fund has a legitimate business purpose for doing so and the recipients of the information are subject to a duty of confidentiality. Under no circumstances shall current or prospective Fund shareholders receive non-public portfolio holdings information, except as described below.
The Fund makes available on its public website the following portfolio holdings information:
• complete portfolio holdings information monthly, at least 15 calendar days after the end of each month; and
• top 10 holdings monthly, at least 15 calendar days after the end of each month.
The Fund provides a complete schedule of portfolio holdings for the second and fourth fiscal quarters in its semiannual and annual reports, and for the first and third fiscal quarters in its filings with the SEC on Form N-Q.
All other portfolio holdings information that has not been disseminated in a manner making it available to investors generally as described above is non-public information for purposes of the Policy.
The Fund may make selective disclosure of non-public portfolio holdings pursuant to certain exemptions set forth in the Policy. Third parties eligible for exemptions under the Policy and therefore eligible to receive such disclosures currently include fund rating agencies, information exchange subscribers, consultants and analysts, portfolio analytics providers and service providers, provided that the third party expressly
23
agrees to maintain the disclosed information in confidence and not to trade portfolio securities or related derivative securities based on the non-public information. Non-public portfolio holdings information may not be disclosed to a third party pursuant to an exemption unless and until the third party recipient has entered into a non-disclosure agreement with the Fund and the arrangement has been reviewed and approved, as set forth in the Policy and discussed below. In addition, persons who owe a duty of trust or confidence to the Fund or the Adviser may receive non-public portfolio holdings information without entering into a non-disclosure agreement. Currently, these persons include (i) the Fund's independent registered public accounting firm (as of the Fund's fiscal year-end and on an as needed basis), (ii) counsel to the Fund (on an as needed basis), (iii) counsel to the independent Trustees (on an as needed basis) and (iv) members of the Board of Trustees (on an as needed basis). Subject to the terms and conditions of any agreement between the Adviser or the Fund and the third party recipient, if these conditions for disclosure are satisfied, there shall be no restriction on the frequency with which Fund non-public portfolio holdings information is released, and no lag period shall apply (unless otherwise indicated below).
The Adviser may provide interest lists to broker-dealers who execute securities transactions for the Fund without entering into a non-disclosure agreement with the broker-dealers, provided that the interest list satisfies all of the following criteria: (1) the interest list must contain only the CUSIP numbers and/or ticker symbols of securities held in all registered management investment companies advised by the Adviser or any affiliate of the Adviser (the "MSIM Funds") on an aggregate, rather than a fund-by-fund basis; (2) the interest list must not contain information about the number or value of shares owned by a specified MSIM Fund; (3) the interest list may identify the investment strategy, but not the particular MSIM Funds, to which the list relates; and (4) the interest list may not identify the portfolio manager or team members responsible for managing the MSIM Funds.
Fund shareholders may elect in some circumstances to redeem their shares of the Fund in exchange for their pro rata share of the securities held by the Fund. Under such circumstances, Fund shareholders may receive a complete listing of the holdings of the Fund up to seven calendar days prior to making the redemption request provided that they represent in writing that they agree not to disclose or trade on the basis of the portfolio holdings information.
The Fund may discuss or otherwise disclose performance attribution analyses (i.e., mention the effects of having a particular security in the portfolio(s)) where such discussion is not contemporaneously made public, provided that the particular holding has been disclosed publicly. Additionally, any discussion of the analyses may not be more current than the date the holding was disclosed publicly.
The Fund may disclose portfolio holdings to transition managers, provided that the Fund has entered into a non-disclosure or confidentiality agreement with the party requesting that the information be provided to the transition manager and the party to the non-disclosure agreement has, in turn, entered into a non-disclosure or confidentiality agreement with the transition manager.
The Adviser and/or the Fund currently have entered into ongoing arrangements with the following parties:
| Name | | Information Disclosed | | Frequency(1) | | Lag Time | |
| Service Providers | |
|
RiskMetrics Group
(proxy voting agent)(*) | | Complete portfolio holdings | | Daily basis | | (2) | |
|
FT Interactive Data Pricing Service
Provider(*) | | Complete portfolio holdings | | As needed | | (2) | |
|
State Street Bank and Trust
Company(*) | | Complete portfolio holdings | | As needed | | (2) | |
|
| Fund Rating Agencies | |
|
| Lipper(*) | | Top ten and complete portfolio holdings | | Quarterly basis | | Approximately 15 days after quarter end and approximately 30 days after quarter end | |
|
| Morningstar(**) | | Top ten and complete portfolio holdings | | Quarterly basis | | Approximately 15 days after quarter end and approximately 30 days after quarter end | |
|
24
| Name | | Information Disclosed | | Frequency(1) | | Lag Time | |
| Standard & Poor's(*) | | Complete portfolio holdings | | Quarterly basis | | Approximately 15 day lag | |
|
| Investment Company Institute(**) | | Top ten portfolio holdings | | Quarterly basis | | Approximately 15 days after quarter end | |
|
| Consultants and Analysts | |
|
| Americh Massena & Associates, Inc.(*) | | Top ten and complete portfolio holdings | | Quarterly basis(5) | | Approximately 10-12 days after quarter end | |
|
| Bloomberg(**) | | Complete portfolio holdings | | Quarterly basis | | Approximately 30 days after quarter end | |
|
| Callan Associates(*) | | Top ten and complete portfolio holdings | | Monthly and quarterly basis, respectively(5) | | Approximately 10-12 days after month/quarter end | |
|
| Cambridge Associates(*) | | Top ten and complete portfolio holdings | | Quarterly basis(5) | | Approximately 10-12 days after quarter end | |
|
| Citigroup(*) | | Complete portfolio holdings | | Quarterly basis(5) | | At least one day after quarter end | |
|
| Credit Suisse First Boston(*) | | Top ten and complete portfolio holdings | | Monthly and quarterly basis, respectively | | Approximately 10-12 days after month/quarter end | |
|
| CTC Consulting, Inc.(*) | | Top ten and complete portfolio holdings | | Quarterly basis | | Approximately 15 days after quarter end and approximately 30 days after quarter end, respectively | |
|
| Evaluation Associates(*) | | Top ten and complete portfolio holdings | | Monthly and quarterly basis, respectively(5) | | Approximately 10-12 days after month/quarter end | |
|
| Fund Evaluation Group(**) | | Top ten portfolio holdings(3) | | Quarterly basis | | At least 15 days after quarter end | |
|
| Jeffrey Slocum & Associates(*) | | Complete portfolio holdings(4) | | Quarterly basis(5) | | Approximately 10-12 days after quarter end | |
|
| Hammond Associates(**) | | Complete portfolio holdings(4) | | Quarterly basis | | At least 30 days after quarter end | |
|
| Hartland & Co.(**) | | Complete portfolio holdings(4) | | Quarterly basis | | At least 30 days after quarter end | |
|
| Hewitt EnnisKnupp(*) | | Top ten and complete portfolio holdings | | Monthly and quarterly basis, respectively(5) | | Approximately 10-12 days after month/quarter end | |
|
| Merrill Lynch(*) | | Top ten and complete portfolio holdings | | Monthly and quarterly basis, respectively(5) | | Approximately 10-12 days after month/quarter end | |
|
| Mobius(**) | | Top ten portfolio holdings(3) | | Monthly basis | | At least 15 days after month end | |
|
| Nelsons(**) | | Top ten portfolio holdings(3) | | Quarterly basis | | At least 15 days after quarter end | |
|
| Prime, Buchholz & Associates, Inc.(**) | | Complete portfolio holdings(4) | | Quarterly basis | | At least 30 days after quarter end | |
|
| PSN(**) | | Top ten portfolio holdings(3) | | Quarterly basis | | At least 15 days after quarter end | |
|
| PFM Asset Management LLC(*) | | Top ten and complete portfolio holdings | | Quarterly basis(5) | | Approximately 10-12 days after quarter end | |
|
Russell Investment Group/Russell/
Mellon Analytical Services, Inc.(**) | | Top ten and complete portfolio holdings | | Monthly and quarterly basis | | At least 15 days after month end and at least 30 days after quarter end, respectively | |
|
| Stratford Advisory Group, Inc.(*) | | Top ten portfolio holdings(6) | | Quarterly basis(5) | | Approximately 10-12 days after quarter end | |
|
| Thompson Financial(**) | | Complete portfolio holdings(4) | | Quarterly basis | | At least 30 days after quarter end | |
|
25
| Name | | Information Disclosed | | Frequency(1) | | Lag Time | |
Watershed Investment Consultants,
Inc.(*) | | Top ten and complete portfolio holdings | | Quarterly basis(5) | | Approximately 10-12 days after quarter end | |
|
| Yanni Partners(**) | | Top ten portfolio holdings(3) | | Quarterly basis | | At least 15 days after quarter end | |
|
| Portfolio Analytics Providers | |
|
| FactSet Research Systems, Inc.(*) | | Complete portfolio holdings | | Daily basis | | One day | |
|
(*) This entity has agreed to maintain Fund non-public portfolio holdings information in confidence and not to trade portfolio securities based on the non-public portfolio holdings information.
(**) The Fund does not currently have a non-disclosure agreement in place with this entity and therefore the entity can only receive publicly available information.
(1) Dissemination of portfolio holdings information to entities listed above may occur less frequently than indicated (or not at all).
(2) Information will typically be provided on a real time basis or as soon thereafter as possible.
(3) Complete portfolio holdings will also be provided upon request from time to time on a quarterly basis, with at least a 30 day lag.
(4) Top ten portfolio holdings will also be provided upon request from time to time, with at least a 15 day lag.
(5) This information will also be provided upon request from time to time.
(6) Complete portfolio holdings will also be provided upon request from time to time.
All disclosures of non-public portfolio holdings information made to third parties pursuant to the exemptions set forth in the Policy must be reviewed by Morgan Stanley Investment Management's ("MSIM") Legal and Compliance Division and approved by the Head of the Long-Only Business of MSIM. Disclosures made to third parties in connection with (i) broker-dealer interest lists; (ii) shareholder in-kind distributions; (iii) attribution analyses; or (iv) transition managers are pre-approved for purposes of the Policy. In addition, the following categories of third parties that may receive non-public portfolio holdings information are also pre-approved provided that they enter into non-disclosure agreements (as discussed above) (i) fund rating agencies; (ii) information exchange subscribers; (iii) consultants and analysts (including defined benefit and defined contribution plan sponsors, and variable annuity providers); (iv) portfolio analytics providers; and (v) service providers.
The Adviser shall report quarterly to the Board of Trustees (or a designated committee thereof) at the next regularly scheduled meeting (i) any material information concerning all parties receiving non-public portfolio holdings information pursuant to an exemption; and (ii) any new non-disclosure agreements entered into during the reporting period. Procedures to monitor the use of such non-public portfolio holdings information may include requiring annual certifications that the recipients have utilized such information only pursuant to the terms of the agreement between the recipient and the Adviser and, for those recipients receiving information electronically, acceptance of the information will constitute reaffirmation that the third party expressly agrees to maintain the disclosed information in confidence and not to trade portfolio securities based on the non-public information.
III. MANAGEMENT OF THE FUND
A. Board of Trustees
General. The Board of Trustees of the Fund oversees the management of the Fund, but does not itself manage the Fund. The Trustees review various services provided by or under the direction of the Adviser to ensure that the Fund's general investment policies and programs are properly carried out. The Trustees also conduct their review to ensure that administrative services are provided to the Fund in a satisfactory manner.
Under state law, the duties of the Trustees are generally characterized as a duty of loyalty and a duty of care. The duty of loyalty requires a Trustee to exercise his or her powers in the interest of the Fund and not the Trustee's own interest or the interest of another person or organization. A Trustee satisfies his or her duty of care by acting in good faith with the care of an ordinarily prudent person and in a manner the Trustee reasonably believes to be in the best interest of the Fund and its shareholders.
Trustees and Officers. The Board of the Fund consists of 10 Trustees. These same individuals also serve as directors or trustees for certain of the funds advised by the Adviser and Morgan Stanley AIP GP LP. Nine Trustees have no affiliation or business connection with the Adviser or any of its affiliated persons and do not own any stock or other securities issued by the Adviser's parent company, Morgan Stanley. These are the "non-interested" or "Independent" Trustees. The other Trustee (the "Interested Trustee") is affiliated with the Adviser.
26
Board Structure and Oversight Function. The Board's leadership structure features an Independent Trustee serving as Chairperson and the Board Committees described below. The Chairperson participates in the preparation of the agenda for meetings of the Board and the preparation of information to be presented to the Board with respect to matters to be acted upon by the Board. The Chairperson also presides at all meetings of the Board and is involved in discussions regarding matters pertaining to the oversight of the management of the Fund between meetings.
The Board of Trustees operates using a system of committees to facilitate the timely and efficient consideration of all matters of importance to the Trustees, the Fund and Fund shareholders, and to facilitate compliance with legal and regulatory requirements and oversight of the Fund's activities and associated risks. The Board of Trustees has established four standing committees: (1) Audit Committee, (2) Governance Committee, (3) Compliance and Insurance Committee, and (4) Investment Committee. The Audit Committee and the Governance Committee are comprised exclusively of Independent Trustees. Each committee charter governs the scope of the committee's responsibilities with respect to the oversight of the Fund. The responsibilities of each committee, including their oversight responsibilities, are described further under the caption "Independent Trustees and the Committees."
The Fund is subject to a number of risks, including investment, compliance, operational and valuation risk, among others. The Board of Trustees oversees these risks as part of its broader oversight of the Fund's affairs through various Board and committee activities. The Board has adopted, and periodically reviews, policies and procedures designed to address various risks to the Fund. In addition, appropriate personnel, including but not limited to the Fund's Chief Compliance Officer, members of the Fund's administration and accounting teams, representatives from the Fund's independent registered public accounting firm, the Fund's Treasurer, portfolio management personnel and independent valuation and brokerage evaluation service providers, make regular reports regarding the Fund's activities and related risks to the Board of Trustees and the committees, as appropriate. These reports include, among others, quarterly performance reports, quarterly derivatives activity and risk reports and discussions with members of the risk teams relating to each asset class. The Board's committee structure allows separate committees to focus on different aspects of risk and the potential impact it has on some or all of the funds in the complex and then report back to the full Board. In between regular meetings, Fund officers also communicate with the Trustees regarding material exceptions and items relevant to the Board's risk oversight function. The Board recognizes that it is not possible to identify all of the risks that may affect the Fund, and that it is not possible to develop processes and controls to eliminate all of the risks that may affect the Fund. Moreover, the Board recognizes that it may be necessary for the Fund to bear certain risks (such as investment risk) to achieve its investment objective.
As needed between meetings of the Board, the Board or a specific committee receives and reviews reports relating to the Fund and engages in discussions with appropriate parties relating to the Fund's operations and related risks.
B. Management Information
Independent Trustees. The Fund seeks as Trustees individuals of distinction and experience in business and finance, government service or academia. In determining that a particular Trustee was and continues to be qualified to serve as Trustee, the Board has considered a variety of criteria, none of which, in isolation, was controlling. Based on a review of the experience, qualifications, attributes or skills of each Trustee, including those enumerated in the table below, the Board has determined that each of the Trustees is qualified to serve as a Trustee of the Fund. In addition, the Board believes that, collectively, the Trustees have balanced and diverse experience, qualifications, attributes and skills that allow the Board to operate effectively in governing the Fund and protecting the interests of shareholders. Information about the Fund's Governance Committee and Board of Trustees nomination process is provided below under the caption "Independent Trustees and the Committees."
The Independent Trustees of the Fund, their age, address, term of office and length of time served, their principal business occupations during the past five years, the number of portfolios in the Fund Complex (defined below) overseen by each Independent Trustee (as of December 31, 2011) and other directorships, if any, held by the Trustees, are shown below. The Fund Complex includes all open-end and closed-end funds (including all of their portfolios) advised by the Adviser and any funds that have an adviser that is an affiliate of the Adviser (including, but not limited to, Morgan Stanley AIP GP LP) (the "Morgan Stanley Funds").
27
Independent Trustees:
Name, Age and Address of
Independent Trustee | | Position(s)
Held with
Registrant | | Length of
Time
Served* | | Principal Occupation(s) During
Past 5 Years | | Number of
Portfolios
in Fund
Complex
Overseen by
Independent
Trustee | | Other Directorships Held
by Independent Trustee** | |
Frank L. Bowman (67)
c/o Kramer Levin Naftalis & Frankel LLP
Counsel to the
Independent Trustees
1177 Avenue of the Americas
New York, NY 10036 | | Trustee | | Since August 2006 | | President, Strategic Decisions, LLC (consulting) (since February 2009); Director or Trustee of various Morgan Stanley Funds (since August 2006); Chairperson of the Insurance Sub-Committee of the Compliance and Insurance Committee (since February 2007); served as President and Chief Executive Officer of the Nuclear Energy Institute (policy organization) (February 2005-November 2008); retired as Admiral, U.S. Navy after serving over 38 years on active duty including 8 years as Director of the Naval Nuclear Propulsion Program in the Department of the Navy and the U.S. Department of Energy (1996-2004); served as Chief of Naval Personnel (July 1994-September 1996) and on the Joint Staff as Director of Politicial Military Affairs (June 1992-July 1994); Knighted as Honorary Knight Commander of the Most Excellent Order of the British Empire; Awarded the Officer de l'Orde National du Mérite by the French Government; elected to the National Academy of Engineering (2009). | | | 102 | | | Director of BP p.l.c.; Director of Naval and Nuclear Technologies LLP; Director of the Armed Services YMCA of the USA and the Naval Submarine League; Director of the American Shipbuilding Suppliers Association; Member of the National Security Advisory Council of the Center for U.S. Global Engagement and a member of the CNA Military Advisory Board; Member of the American Lung Association's President's Council. | |
|
Michael Bozic (71)
c/o Kramer Levin Naftalis & Frankel LLP
Counsel to the
Independent Trustees
1177 Avenue of the Americas
New York, NY 10036 | | Trustee | | Since April 1994 | | Private investor; Chairperson of the Compliance and Insurance Committee (since October 2006); Director or Trustee of various Morgan Stanley Funds (since April 1994); formerly, Chairperson of the Insurance Committee (July 2006-September 2006); Vice Chairman of Kmart Corporation (December 1998-October 2000), Chairman and Chief Executive Officer of Levitz Furniture Corporation (November 1995-November 1998) and President and Chief Executive Officer of Hills Department Stores (May 1991-July 1995); variously Chairman, Chief Executive Officer, President and Chief Operating Officer (1987-1991) of the Sears Merchandise Group of Sears, Roebuck & Co. | | | 104 | | | Director of various business organizations. | |
|
* Each Trustee serves an indefinite term, until his or her successor is elected.
** This includes any directorships at public companies and registered investment companies held by the Trustee at any time during the past five years.
28
Name, Age and Address of
Independent Trustee | | Position(s)
Held with
Registrant | | Length of
Time
Served* | | Principal Occupation(s) During
Past 5 Years | | Number of
Portfolios
in Fund
Complex
Overseen by
Independent
Trustee | | Other Directorships Held
by Independent Trustee** | |
Kathleen A. Dennis (58)
c/o Kramer Levin Naftalis & Frankel LLP
Counsel to the
Independent Trustees
1177 Avenue of the Americas
New York, NY 10036 | | Trustee | | Since August 2006 | | President, Cedarwood Associates (mutual fund and investment management consulting) (since July 2006); Chairperson of the Money Market and Alternatives Sub-Committee of the Investment Committee (since October 2006) and Director or Trustee of various Morgan Stanley Funds (since August 2006); formerly, Senior Managing Director of Victory Capital Management (1993-2006). | | | 102 | | | Director of various non-profit organizations. | |
|
Dr. Manuel H. Johnson (63)
c/o Johnson Smick
Group, Inc.
888 16th Street, N.W.
Suite 740
Washington, D.C. 20006 | | Trustee | | Since July 1991 | | Senior Partner, Johnson Smick International, Inc. (consulting firm); Chairperson of the Investment Committee (since October 2006) and Director or Trustee of various Morgan Stanley Funds (since July 1991); Co-Chairman and a founder of the Group of Seven Council (G7C) (international economic commission); formerly, Chairperson of the Audit Committee (July 1991-September 2006), Vice Chairman of the Board of Governors of the Federal Reserve System and Assistant Secretary of the U.S. Treasury. | | | 104 | | | Director of NVR, Inc. (home construction). | |
|
Joseph J. Kearns (69)
c/o Kearns & Associates LLC
PMB754
22631 Pacific Coast Highway
Malibu, CA 90265 | | Trustee | | Since August 1994 | | President, Kearns & Associates LLC (investment consulting); Chairperson of the Audit Committee (since October 2006) and Director or Trustee of various Morgan Stanley Funds (since August 1994); formerly, Deputy Chairperson of the Audit Committee (July 2003-September 2006) and Chairperson of the Audit Committee of various Morgan Stanley Funds (since August 1994); CFO of the J. Paul Getty Trust. | | | 105 | | | Director of Electro Rent Corporation (equipment leasing) and The Ford Family Foundation. | |
|
* Each Trustee serves an indefinite term, until his or her successor is elected.
** This includes any directorships at public companies and registered investment companies held by the Trustee at any time during the past five years.
29
Name, Age and Address of
Independent Trustee | | Position(s)
Held with
Registrant | | Length of
Time
Served* | | Principal Occupation(s) During
Past 5 Years | | Number of
Portfolios
in Fund
Complex
Overseen by
Independent
Trustee | | Other Directorships Held
by Independent Trustee** | |
Michael F. Klein (53)
c/o Kramer Levin Naftalis &
Frankel LLP
Counsel to the
Independent Trustees
1177 Avenue of the Americas
New York, NY 10036 | | Trustee | | Since August 2006 | | Managing Director, Aetos Capital, LLC (since March 2000) and Co-President, Aetos Alternatives Management, LLC (since January 2004); Chairperson of the Fixed Income Sub-Committee of the Investment Committee (since October 2006) and Director or Trustee of various Morgan Stanley Funds (since August 2006); formerly, Managing Director, Morgan Stanley & Co. Inc. and Morgan Stanley Dean Witter Investment Management, President, various Morgan Stanley Funds (June 1998-March 2000) and Principal, Morgan Stanley & Co. Inc. and Morgan Stanley Dean Witter Investment Management (August 1997-December 1999). | | | 102 | | | Director of certain investment funds managed or sponsored by Aetos Capital, LLC; Director of Sanitized AG and Sanitized Marketing AG (specialty chemicals). | |
|
Michael E. Nugent (75)
c/o Triumph Capital, L.P.
445 Park Avenue
New York, NY 10022 | | Chairperson of the Board and Trustee | | Chairperson of the Boards since July 2006 and Trustee since July 1991 | | General Partner, Triumph Capital, L.P. (private investment partnership); Chairperson of the Boards of various Morgan Stanley Funds (since July 2006); Director or Trustee of various Morgan Stanley Funds (since July 1991); formerly, Chairperson of the Insurance Committee (until July 2006). | | | 104 | | | None. | |
|
W. Allen Reed (64)
c/o Kramer Levin Naftalis &
Frankel LLP
Counsel to the
Independent Trustees
1177 Avenue of the Americas
New York, NY 10036 | | Trustee | | Since August 2006 | | Chairperson of the Equity Sub-Committee of the Investment Committee (since October 2006) and Director or Trustee of various Morgan Stanley Funds (since August 2006); formerly, President and CEO of General Motors Asset Management; Chairman and Chief Executive Officer of the GM Trust Bank and Corporate Vice President of General Motors Corporation (August 1994-December 2005). | | | 102 | | | Director of Temple-Inland Industries (packaging and forest products); Director of Legg Mason, Inc.; Director of the Auburn University Foundation. | |
|
Fergus Reid (79)
c/o Joe Pietryka, Inc.
85 Charles Colman Blvd.
Pawling, NY 12564 | | Trustee | | Since June 1992 | | Chairman, Joe Pietryka, Inc.; Chairperson of the Governance Committee and Director or Trustee of various Morgan Stanley Funds (since June 1992). | | | 105 | | | Trustee and Director of certain investment companies in the JPMorgan Funds complex managed by
JP Morgan Investment Management Inc. | |
|
* Each Trustee serves an indefinite term, until his or her successor is elected.
** This includes any directorships at public companies and registered investment companies held by the Trustee at any time during the past five years.
30
The Trustee who is affiliated with the Adviser or affiliates of the Adviser (as set forth below) and executive officers of the Fund, their age, address, term of office and length of time served, their principal business occupations during the past five years, the number of portfolios in the Fund Complex overseen by the Interested Trustee (as of December 31, 2011) and the other directorships, if any, held by the Interested Trustee, are shown below.
Interested Trustee:
Name, Age and Address of
Interested Trustee | | Position(s)
Held with
Registrant | | Length of
Time
Served* | | Principal Occupation(s) During
Past 5 Years | | Number of
Portfolios
in Fund
Complex
Overseen by
Interested
Trustee | | Other Directorships Held
by Interested Trustee** | |
James F. Higgins (64)
c/o Morgan Stanley Services Company Inc. Harborside Financial Center
201 Plaza Two
Jersey City, NJ 07311 | | Trustee | | Since June 2000 | | Director or Trustee of various Morgan Stanley Funds (since June 2000); Senior Advisor of Morgan Stanley (since August 2000). | | | 103 | | | Director of AXA Financial, Inc. and The Equitable Life Assurance Society of the United States (financial services). | |
|
* Each Trustee serves an indefinite term, until his or her successor is elected.
** This includes any directorships at public companies and registered investment companies held by the Trustee at any time during the past five years.
Executive Officers:
Name, Age and Address of
Executive Officer | | Position(s)
Held with
Registrant | | Length of
Time
Served* | | Principal Occupation(s) During
Past 5 Years | |
Arthur Lev (50)
522 Fifth Avenue
New York, NY 10036 | | President and Principal Executive Officer — Equity and Fixed Income Funds | | Since June 2011 | | President and Principal Executive Officer (since June 2011) of the Equity and Fixed Income Funds in the Fund Complex; Head of the Long Only Business of Morgan Stanley Investment Management (since February 2011); Managing Director of the Adviser (since December 2006). Formerly, Chief Strategy Officer of Morgan Stanley Investment Management's Traditional Asset Management business (November 2010-February 2011); General Counsel of Morgan Stanley Investment Management (December 2006-October 2010); Partner and General Counsel of FrontPoint Partners LLC (July 2002-December 2006); Managing Director and General Counsel of Morgan Stanley Investment Management (May 2000-June 2002). | |
|
Mary Ann Picciotto (38)
c/o Morgan Stanley
Services Company Inc.
Harborside Financial
Center
201 Plaza Two
Jersey City, NJ 07311 | | Chief Compliance Officer | | Since May 2010 | | Managing Director of the Adviser; Chief Compliance Officer of various Morgan Stanley Funds (since May 2010); Chief Compliance Officer of the Adviser (since April 2007). | |
|
Stefanie V. Chang Yu (45)
522 Fifth Avenue
New York, NY 10036 | | Vice President | | Since December 1997 | | Managing Director of the Adviser; Vice President of various Morgan Stanley Funds (since December 1997). | |
|
* Each Officer serves an indefinite term, until his or her successor is elected.
31
Name, Age and Address of
Executive Officer | | Position(s)
Held with
Registrant | | Length of
Time
Served* | | Principal Occupation(s) During
Past 5 Years | |
Francis J. Smith (46)
c/o Morgan Stanley
Services Company Inc.
Harborside Financial
Center
201 Plaza Two
Jersey City, NJ 07311 | | Treasurer and Principal Financial Officer | | Treasurer since July 2003 and Principal Financial Officer since September 2002 | | Executive Director of the Adviser; Treasurer and Principal Financial Officer of various Morgan Stanley Funds (since July 2003). | |
|
Mary E. Mullin (44)
522 Fifth Avenue
New York, NY 10036 | | Secretary | | Since June 1999 | | Executive Director of the Adviser; Secretary of various Morgan Stanley Funds (since June 1999). | |
|
* Each Officer serves an indefinite term, until his or her successor is elected.
In addition, the following individuals who are officers of the Adviser or its affiliates serve as assistant secretaries of the Fund: Joanne Antico, Joseph C. Benedetti, Daniel E. Burton, Tara A. Farrelly and Edward J. Meehan.
For each Trustee, the dollar range of equity securities beneficially owned by the Trustee in the Fund and in the Family of Investment Companies (Family of Investment Companies includes all of the registered investment companies advised by the Adviser and Morgan Stanley AIP GP LP) for the calendar year ended December 31, 2011, is set forth in the table below.
| Name of Trustee | | Dollar Range of Equity Securities in the Fund
(As of December 31, 2011) | | Aggregate Dollar Range of Equity Securities in
All Registered Investment Companies Overseen
by Trustee in Family of Investment Companies
(As of December 31, 2011) | |
| Independent: | | | | | |
|
| Frank L. Bowman(1) | | None | | over $100,000 | |
|
| Michael Bozic | | None | | over $100,000 | |
|
| Kathleen A. Dennis | | None | | over $100,000 | |
|
| Manuel H. Johnson | | None | | over $100,000 | |
|
| Joseph J. Kearns(1) | | None | | over $100,000 | |
|
| Michael F. Klein | | None | | over $100,000 | |
|
| Michael E. Nugent | | None | | over $100,000 | |
|
| W. Allen Reed(1) | | None | | over $100,000 | |
|
| Fergus Reid(1) | | None | | over $100,000 | |
|
| Interested: | | | | | |
|
| James F. Higgins | | None | | over $100,000 | |
|
(1) Includes the total amount of compensation deferred by the Trustee at his election pursuant to a deferred compensation plan. Such deferred compensation is placed in a deferral account and deemed to be invested in one or more of the Morgan Stanley Funds (or portfolio thereof) that are offered as investment options under the plan.
As to each Independent Trustee and his or her immediate family members, no person owned beneficially or of record securities in an investment adviser or principal underwriter of the Fund, or a person (other than a registered investment company) directly or indirectly controlling, controlled by or under common control with an investment adviser or principal underwriter of the Fund.
Independent Trustees and the Committees. Law and regulation establish both general guidelines and specific duties for the Independent Trustees. The Board has four committees: (1) Audit Committee, (2) Governance Committee, (3) Compliance and Insurance Committee and (4) Investment Committee. Three of the Independent Trustees serve as members of the Audit Committee, three Independent Trustees serve as members of the Governance Committee, four Trustees, including three Independent Trustees, serve as members of the Compliance and Insurance Committee and all of the Trustees serve as members of the Investment Committee.
The Independent Trustees are charged with recommending to the full Board approval of management, advisory and administration contracts, Rule 12b-1 plans and distribution and underwriting agreements; continually reviewing fund performance; checking on the pricing of portfolio securities, brokerage commissions, transfer agent costs and performance and trading among funds in the same complex; and approving fidelity bond and related insurance coverage and allocations, as well as other matters that arise from time to time. The Independent Trustees are required to select and nominate
32
individuals to fill any Independent Trustee vacancy on the board of any fund that has a Rule 12b-1 plan of distribution. Most of the retail Morgan Stanley Funds have a Rule 12b-1 plan.
The Board of Trustees has a separately-designated standing Audit Committee established in accordance with Section 3(a)(58)(A) of the Securities Exchange Act of 1934, as amended (the "Exchange Act"). The Audit Committee is charged with recommending to the full Board the engagement or discharge of the Fund's independent registered public accounting firm; directing investigations into matters within the scope of the independent registered public accounting firm's duties, including the power to retain outside specialists; reviewing with the independent registered public accounting firm the audit plan and results of the auditing engagement; approving professional services provided by the independent registered public accounting firm and other accounting firms prior to the performance of the services; reviewing the independence of the independent registered public accounting firm; considering the range of audit and non-audit fees; reviewing the adequacy of the Fund's system of internal controls; and reviewing the valuation process. The Fund has adopted a formal, written Audit Committee Charter.
The members of the Audit Committee of the Fund are Joseph J. Kearns, Michael E. Nugent and W. Allen Reed. None of the members of the Fund's Audit Committee is an "interested person," as defined under the Investment Company Act, of the Fund (with such disinterested Trustees being "Independent Trustees" or individually, "Independent Trustee"). Each Independent Trustee is also "independent" from the Fund under the listing standards of the New York Stock Exchange, Inc. ("NYSE"). The Chairperson of the Audit Committee of the Fund is Joseph J. Kearns.
The Board of Trustees of the Fund also has a Governance Committee. The Governance Committee identifies individuals qualified to serve as Independent Trustees on the Fund's Board and on committees of such Board and recommends such qualified individuals for nomination by the Fund's Independent Trustees as candidates for election as Independent Trustees, advises the Fund's Board with respect to Board composition, procedures and committees, develops and recommends to the Fund's Board a set of corporate governance principles applicable to the Fund, monitors and makes recommendations on corporate governance matters and policies and procedures of the Fund's Board of Trustees and any Board committees and oversees periodic evaluations of the Fund's Board and its committees. The members of the Governance Committee of the Fund are Kathleen A. Dennis, Michael F. Klein and Fergus Reid, each of whom is an Independent Trustee. The Chairperson of the Governance Committee is Fergus Reid.
The Fund does not have a separate nominating committee. While the Fund's Governance Committee recommends qualified candidates for nominations as Independent Trustees, the Board of Trustees of the Fund believes that the task of nominating prospective Independent Trustees is important enough to require the participation of all current Independent Trustees, rather than a separate committee consisting of only certain Independent Trustees. Accordingly, each Independent Trustee (Frank L. Bowman, Michael Bozic, Kathleen A. Dennis, Manuel H. Johnson, Joseph J. Kearns, Michael F. Klein, Michael E. Nugent, W. Allen Reed and Fergus Reid) participates in the election and nomination of candidates for election as Independent Trustees for the Fund. Persons recommended by the Fund's Governance Committee as candidates for nomination as Independent Trustees shall possess such experience, qualifications, attributes, skills and diversity so as to enhance the Board's ability to manage and direct the affairs and business of the Fund, including, when applicable, to enhance the ability of committees of the Board to fulfill their duties and/or to satisfy any independence requirements imposed by law, regulation or any listing requirements of the NYSE. While the Independent Trustees of the Fund expect to be able to continue to identify from their own resources an ample number of qualified candidates for the Fund's Board as they deem appropriate, they will consider nominations from shareholders to the Board. Nominations from shareholders should be in writing and sent to the Independent Trustees as described below under the caption "Shareholder Communications."
The Board formed the Compliance and Insurance Committee to address insurance coverage and oversee the compliance function for the Fund and the Board. The Compliance and Insurance Committee consists of Frank L. Bowman, Michael Bozic, James F. Higgins and Manuel H. Johnson. Frank L. Bowman, Michael Bozic and Manuel H. Johnson are Independent Trustees. The Chairperson of the Compliance and Insurance Committee is Michael Bozic. The Compliance and Insurance Committee has an Insurance Sub-Committee to review and monitor the insurance coverage maintained by the Fund. The Chairperson of the Insurance Sub-Committee is Frank L. Bowman.
33
The Investment Committee oversees the portfolio investment process for and reviews the performance of the Fund. The Investment Committee also recommends to the Board to approve or renew the Fund's Investment Advisory and Administration Agreements. The members of the Investment Committee are Frank L. Bowman, Michael Bozic, Kathleen A. Dennis, James F. Higgins, Manuel H. Johnson, Joseph J. Kearns, Michael F. Klein, Michael E. Nugent, W. Allen Reed and Fergus Reid. The Chairperson of the Investment Committee is Manuel H. Johnson.
The Investment Committee has three Sub-Committees, each with its own Chairperson. Each Sub-Committee focuses on the funds' primary areas of investment, namely equities, fixed income and alternatives. The Sub-Committees and their members are as follows:
(1) Equity — W. Allen Reed (Chairperson), Frank L. Bowman and Michael E. Nugent.
(2) Fixed Income — Michael F. Klein (Chairperson), Michael Bozic and Fergus Reid.
(3) Money Market and Alternatives — Kathleen A. Dennis (Chairperson), James F. Higgins and Joseph J. Kearns.
During the Fund's fiscal year ended October 31, 2011, the Board of Trustees held the following meetings:
| Board of Trustees | | | 7 | | |
| Committee/Sub-Committee: | | Number of meetings: | |
| Audit Committee | | | 4 | | |
| Governance Committee | | | 4 | | |
| Compliance and Insurance Committee | | | 4 | | |
| Insurance Sub-Committee | | | 1 | | |
| Investment Committee | | | 5 | | |
| Equity Sub-Committee | | | 5 | | |
| Fixed Income Sub-Committee | | | 5 | | |
| Money Market and Alternatives Sub-Committee | | | 6 | | |
Experience, Qualifications and Attributes
The Board has concluded, based on each Trustee's experience, qualifications and attributes that each Board member should serve as a Trustee. Following is a brief summary of the information that led to and/or supports this conclusion.
Mr. Bowman has experience in a variety of business and financial matters through his prior service as a Director or Trustee for various other funds in the Fund Complex, where he serves as Chairperson of the Insurance Sub-Committee of the Compliance and Insurance Committee, and as a Director of B.P. p.l.c. and Naval and Nuclear Technologies LLP. Mr. Bowman also serves as a Director for the Armed Services YMCA of the USA, the Naval Submarine League and the American Shipbuilding Suppliers Association. Mr. Bowman is also a member of the National Security Advisory Council of the Center for U.S. Global Engagement and a member of the CNA Military Advisory Board. Mr. Bowman retired as an Admiral in the U.S. Navy after serving over 38 years on active duty including eight years as Director of the Naval Nuclear Propulsion Program in the Department of the Navy and the U.S. Department of Energy (1996-2004). Additionally, Mr. Bowman served as the U.S. Navy's Chief of Naval Personnel where he was responsible for the planning and programming of all manpower, personnel, training and education resources for the U.S. Navy, and on the Joint Staff as Director of Political Military Affairs (1992-1994). In addition, Mr. Bowman served as President and Chief Executive Officer of the Nuclear Energy Institute. Mr. Bowman has received such distinctions as a knighthood as Honorary Knight Commander of the Most Excellent Order of the British Empire and the Officer de l'Orde National du Mérite from the French Government and was elected to the National Academy of Engineering (2009). He is President of the consulting firm Strategic Decisions, LLC.
With over 20 years of experience on the boards and in senior management of such companies as Kmart Corporation, Levitz Furniture Corporation, Hills Department Stores and Sears Merchandise Group
34
of Sears, Roebuck & Co., where Mr. Bozic also served as Chief Financial Officer of the Merchandise Group, and with over 15 years of experience as a Director or Trustee of certain other funds in the Fund Complex, Mr. Bozic has experience with a variety of financial, management, regulatory and operational issues as well as experience with marketing and distribution. Mr. Bozic has served as the Chairperson of the Compliance and Insurance Committee since 2006.
Ms. Dennis has over 25 years of business experience in the financial services industry and related fields including serving as a Director or Trustee of various other funds in the Fund Complex, where she serves as Chairperson of the Money Market and Alternatives Sub-Committee of the Investment Committee. Ms. Dennis possesses a strong understanding of the regulatory framework under which investment companies must operate based on her years of service to this Board and her position as Senior Managing Trustee of Victory Capital Management.
In addition to his tenure as a Director or Trustee of various other funds in the Fund Complex, where he formerly served as Chairperson of the Audit Committee, Dr. Johnson has also served as an officer or a board member of numerous companies for nearly 20 years. These positions included Co-Chairman and a founder of the Group of Seven Council, Director of NVR, Inc., Director of Evergreen Energy and Director of Greenwich Capital Holdings. He also has served as Vice Chairman of the Board of Governors of the Federal Reserve System and Assistant Secretary of the U.S. Treasury. In addition, Dr. Johnson also served as Chairman of the Financial Accounting Foundation, which oversees the Financial Accounting Standards Board, for seven years.
Mr. Kearns gained extensive experience regarding accounting through his experience on the Audit Committees of the boards of other funds in the Funds Complex, including serving as either Chairperson or Deputy Chairperson of the Audit Committee for fourteen years, and through his position as Chief Financial Officer of the J. Paul Getty Trust. He also has experience in financial, accounting, investment and regulatory matters through his position as President and founder of Kearns & Associates LLC, a financial consulting company. Mr. Kearns also serves as a Director of Electro Rent Corporation and The Ford Family Foundation. The Board has determined that Mr. Kearns is an "audit committee financial expert" as defined by the SEC.
Through his prior positions as Managing Director of Morgan Stanley & Co. Inc. and Morgan Stanley Dean Witter Investment Management and as President of Morgan Stanley Institutional Funds, Mr. Klein has experience in the management and operation of registered investment companies, enabling him to provide management input and investment guidance to the Board. Mr. Klein also has extensive experience in the investment management industry based on his current positions as Managing Director of Aetos Capital, LLC and as Director of certain investment funds managed or sponsored by Aetos Capital, LLC. In addition, he also has experience as a member of the board of other funds in the Fund Complex.
Mr. Nugent has extensive experience with financial, accounting, investment and regulatory matters through his almost 20 years of service on the boards of various funds in the Fund Complex, including time as the Chairperson of the Insurance Committee and Chairperson of the Morgan Stanley Funds. Mr. Nugent also has experience as a General Partner in Triumph Capital, L.P.
Mr. Reed has experience on investment company boards and is experienced with financial, accounting, investment and regulatory matters through his service as a Director of iShares, Inc. and other funds in the Fund Complex. Mr. Reed also gained substantial experience in the financial services industry through his position as Director of Legg Mason, Inc. and prior position as President and CEO of General Motors Asset Management.
Mr. Reid has served on a number of mutual fund boards, including as a Trustee and Director of certain investment companies in the JPMorgan Funds complex and as a Director or Trustee of other funds in the Fund Complex. Therefore, Mr. Reid is experienced with financial, accounting, investment and regulatory matters, enabling him to provide management input and investment guidance to the Board.
Mr. Higgins has over 30 years of experience in the financial services industry. Mr. Higgins has substantial mutual fund experience and is experienced with financial, accounting, investment and regulatory matters due to his experience on the boards of other funds in the Fund Complex. Mr. Higgins also serves on the boards of other companies in the financial services industry, including AXA Financial, Inc. and The Equitable Life Assurance Society of the United States.
The Trustees' principal occupations during the past five years or more are shown in the above tables.
35
Advantages of Having Same Individuals as Trustees for the Morgan Stanley Funds. The Independent Trustees and the Fund's management believe that having the same Independent Trustees for each of the Morgan Stanley Funds avoids the duplication of effort that would arise from having different groups of individuals serving as Independent Trustees for each of the funds or even of sub-groups of funds. They believe that having the same individuals serve as Independent Trustees of all the Morgan Stanley Funds tends to increase their knowledge and expertise regarding matters which affect the Fund Complex generally and enhances their ability to negotiate on behalf of each fund with the fund's service providers. This arrangement also precludes the possibility of separate groups of Independent Trustees arriving at conflicting decisions regarding operations and management of the funds and avoids the cost and confusion that would likely ensue. Finally, having the same Independent Trustees serve on all fund boards enhances the ability of each fund to obtain, at modest cost to each separate fund, the services of Independent Trustees of the caliber, experience and business acumen of the individuals who serve as Independent Trustees of the Morgan Stanley Funds.
Trustee and Officer Indemnification. The Fund's Declaration of Trust provides that no Trustee, Officer, employee or agent of the Fund is liable to the Fund or to a shareholder, nor is any Trustee, Officer, employee or agent liable to any third persons in connection with the affairs of the Fund, except as such liability may arise from his/her or its own bad faith, willful misfeasance, gross negligence or reckless disregard of his/her or its duties. It also provides that all third persons shall look solely to Fund property for satisfaction of claims arising in connection with the affairs of the Fund. With the exceptions stated, the Declaration of Trust provides that a Trustee, Officer, employee or agent is entitled to be indemnified against all liability in connection with the affairs of the Fund.
Shareholder Communications. Shareholders may send communications to the Fund's Board of Trustees. Shareholders should send communications intended for the Fund's Board by addressing the communications directly to the Board (or individual Board members) and/or otherwise clearly indicating in the salutation that the communication is for the Board (or individual Board members) and by sending the communication to either the Fund's office or directly to such Board member(s) at the address specified for each Trustee previously noted. Other shareholder communications received by the Fund not directly addressed and sent to the Board will be reviewed and generally responded to by management, and will be forwarded to the Board only at management's discretion based on the matters contained therein.
C. Compensation
Each Trustee (except for the chairperson of the Boards) receives an annual retainer fee of $210,000 for serving as a Trustee of the Morgan Stanley Funds.
The Chairperson of the Audit Committee receives an additional annual retainer fee of $78,750 and the Investment Committee Chairperson receives an additional annual retainer fee of $63,000. Other Committee and, effective January 1, 2012, Sub-Committee Chairpersons receive an additional annual retainer fee of $31,500. Prior to January 1, 2012, each Sub-Committee Chairperson received an annual retainer of $15,750. The aggregate compensation paid to each Trustee is paid by the Morgan Stanley Funds, and is allocated on a pro rata basis among each of the operational funds/portfolios of the Morgan Stanley Funds based on the relative net assets of each of the funds/portfolios. Michael E. Nugent receives a total annual retainer fee of $420,000 for his services as Chairperson of the Boards of the Morgan Stanley Funds and for administrative services provided to each Board.
The Fund also reimburses such Trustees for travel and other out-of-pocket expenses incurred by them in connection with attending such meetings. Trustees of the Fund who are employed by the Adviser receive no compensation or expense reimbursement from the Fund for their services as Trustee.
Effective April 1, 2004, the Fund began a Deferred Compensation Plan (the "DC Plan"), which allows each Trustee to defer payment of all, or a portion, of the fees he or she receives for serving on the Board of Trustees throughout the year. Each eligible Trustee generally may elect to have the deferred amounts credited with a return equal to the total return on one or more of the Morgan Stanley Funds (or portfolios thereof) that are offered as investment options under the DC Plan. At the Trustee's election, distributions are either in one lump sum payment, or in the form of equal annual installments over a period of five years. The rights of an eligible Trustee and the beneficiaries to the amounts held under the DC Plan are unsecured and such amounts are subject to the claims of the creditors of the Fund.
36
Prior to April 1, 2004, certain Morgan Stanley Funds maintained a similar Deferred Compensation Plan (the "Prior DC Plan"), which also allowed each Independent Trustee to defer payment of all, or a portion, of the fees he or she received for serving on the Board of Trustees throughout the year. Generally, the DC Plan amends and supersedes the Prior DC Plan and all amounts payable under the Prior DC Plan are now subject to the terms of the DC Plan (except for amounts paid during the calendar year 2004, which remain subject to the terms of the Prior DC Plan).
The following table shows aggregate compensation payable to each of the Fund's Trustees from the Fund for the fiscal year ended October 31, 2011 and the aggregate compensation payable to each of the funds' Trustees by the Fund Complex (which includes all of the Morgan Stanley Funds) for the calendar year ended December 31, 2011.
Compensation(1)
| Name of Independent Trustee: | | Aggregate Compensation
From the Fund(2) | | Total Compensation
From Fund and
Fund Complex
Paid to Trustee(3) | |
| Frank L. Bowman | | $ | 323 | | | $ | 225,750 | | |
| Michael Bozic | | | 341 | | | | 241,500 | | |
| Kathleen A. Dennis | | | 323 | | | | 225,750 | | |
| Manuel H. Johnson | | | 385 | | | | 273,000 | | |
| Joseph J. Kearns(2) | | | 407 | | | | 306,750 | | |
| Michael F. Klein | | | 323 | | | | 225,750 | | |
| Michael E. Nugent | | | 592 | | | | 420,000 | | |
| W. Allen Reed(2) | | | 323 | | | | 225,750 | | |
| Fergus Reid | | | 341 | | | | 259,500 | | |
| Name of Interested Trustee: | | | | | |
| James F. Higgins | | | 296 | | | | 210,000 | | |
(1) Includes all amounts paid for serving as director/trustee of the funds, as well as serving as Chairperson of the Boards or a Chairperson of a Committee or Sub-Committee.
(2) The amounts shown in this column represent the aggregate compensation before deferral with respect to the Fund's fiscal year. The following Trustees deferred compensation from the Fund during the fiscal year ended October 31, 2011: Mr. Kearns, $151; Mr. Reed, $323.
(3) The amounts shown in this column represent the aggregate compensation paid by all of the funds in the Fund Complex as of December 31, 2011 before deferral by the Trustees under the DC Plan. As of December 31, 2011, the value (including interest) of the deferral accounts across the Fund Complex for Messrs. Kearns, Reed and Reid pursuant to the deferred compensation plan was $532,157, $674,903 and $523,935, respectively. Because the funds in the Fund Complex have different fiscal year ends, the amounts shown in this column are presented on a calendar year basis.
Prior to December 31, 2003, 49 of the Morgan Stanley Funds (the "Adopting Funds"), not including the Fund, had adopted a retirement program under which an Independent Trustee who retired after serving for at least five years as an Independent Trustee of any such fund (an "Eligible Trustee") would have been entitled to retirement payments, based on factors such as length of service, upon reaching the eligible retirement age. On December 31, 2003, the amount of accrued retirement benefits for each Eligible Trustee was frozen, and will be payable, together with a return of 8% per annum, at or following each such Eligible Trustee's retirement as shown in the table below.
The following table illustrates the retirement benefits accrued to the Fund's Independent Trustees by the Adopting Funds for the calendar year ended December 31, 2011, and the estimated retirement benefits for the Independent Trustees from the Adopting Funds for each calendar year following retirement. Only the Trustees listed below participated in the retirement program.
37
| Name of Independent Trustee: | | Retirement Benefits Accrued as
Fund Expenses
By All Adopting
Funds | | Estimated Annual Benefits Upon
Retirement(1)
From All Adopting
Funds | |
| Michael Bozic | | $ | 42,107 | | | $ | 43,940 | | |
| Manuel H. Johnson | | | 30,210 | | | | 64,338 | | |
| Michael E. Nugent | | | 6,805 | | | | 57,539 | | |
(1) Total compensation accrued under the retirement plan, together with a return of 8% per annum, will be paid annually commencing upon retirement and continuing for the remainder of the Trustee's life.
IV. CONTROL PERSONS AND PRINCIPAL HOLDERS OF SECURITIES
The following owned beneficially or of record 5% or more of the outstanding Class A shares of the Fund as of January 31, 2012: Morgan Stanley & Co., Harborside Financial Center, 201 Plaza Two, Jersey City, NJ 07311 — 69.76%; State Street Bank and Trust Co., FBO ADP/Morgan Stanley Alliance, 105 Rosemont Avenue, Westwood, MA 02090 — 12.33%. The following owned beneficially or of record 5% or more of the outstanding Class B shares of the Fund as of January 31, 2012: Morgan Stanley & Co., Harborside Financial Center, 201 Plaza Two, Jersey City, NJ 07311 — 69.72%. Merrill Lynch Pierce Fenner & Smith Inc., for the sole benefit of its customers, 4800 Deer Lake Drive East, Jacksonville, FL 32246-6484 — 6.56%. The following owned beneficially or of record 5% or more of the outstanding Class C shares of the Fund as of January 31, 2012: Morgan Stanley & Co., Harborside Financial Center, 201 Plaza Two, Jersey City, NJ 07311 — 79.70%. The following owned beneficially or of record 5% or more of the outstanding Class I shares of the Fund as of January 31, 2012: Morgan Stanley & Co., Harborside Financial Center, 201 Plaza Two, Jersey City, NJ 07311 — 60.76%; UBS Financial Services Inc, FBO Esther Lory Jacobs, Tod RJ Jacobs, KM Jacobs, SJ Jacobs, 104 KBS Road, York, PA 17408 — 11.80%. Citigroup Global Markets Inc., 700 Red Brook Blvd, Owings Mills, MD 21117 — 7.90%. The following owned beneficially or of record 5% or more of the outstanding Class R shares of the Fund as of January 31, 2012: Morgan Stanley Investment Management Inc., Attn Lawrence Markey Controllers, 100 Front Street, West Conshohocken, PA 19428 — 98.91%. The following owned beneficially or of record 5% or more of the outstanding Class W shares of the Fund as of January 31, 2012: Morgan Stanley Investment Management Inc., Attn: Lawrence Markey Controllers, 100 Front Street, West Conshohocken, PA 19428 — 93.00%; Charles Schwab & Co. Inc., Special Custody Acct for the Exclusive Benefit of Customers, Attn Mutual Funds, 101 Montgomery Street, San Francisco, CA 94104 — 7.00%. The percentage ownership of shares of the Fund changes from time to time depending on purchases and redemptions by shareholders and the total number of shares outstanding.
As of the date of this SAI, the aggregate number of shares of beneficial interest of the Fund owned by the Fund's officers and Trustees as a group was less than 1% of the Fund's shares of beneficial interest outstanding.
V. INVESTMENT ADVISORY AND OTHER SERVICES
A. Adviser and Administrator
The Adviser to the Fund is Morgan Stanley Investment Management Inc., a Delaware corporation, whose address is 522 Fifth Avenue, New York, NY 10036. The Adviser is a wholly-owned subsidiary of Morgan Stanley, a Delaware corporation. Morgan Stanley is a preeminent global financial services firm engaged in securities trading and brokerage activities, as well as providing investment banking, research and analysis, financing and financial advisory services.
Pursuant to an Investment Advisory Agreement (the "Investment Advisory Agreement") with the Adviser, the Fund has retained the Adviser to manage the investment of the Fund's assets, including the placing of orders for the purchase and sale of portfolio securities. The Fund pays the Adviser monthly compensation calculated daily by applying the following annual rates to the average daily net assets of the Fund determined as of the close of each business day: 0.65% of the portion of daily net assets not exceeding $1 billion; and 0.60% of the portion of daily net assets exceeding $1 billion. The investment advisory fee is allocated among the Classes pro rata based on the net assets of the Fund attributable to each Class.
38
Administration services are provided to the Fund by Morgan Stanley Services Company Inc. ("Administrator"), a wholly-owned subsidiary of the Adviser, pursuant to a separate administration agreement ("Administration Agreement") entered into by the Fund with the Administrator. The Fund pays the Administrator monthly compensation of 0.08% of daily net assets.
The following table shows for the Fund (i) the advisory fee paid; and (ii) the advisory fee waived and/or rebated from affiliated transactions for each of the past three fiscal years ended October 31, 2009, 2010 and 2011:
| | | Advisory Fees Paid
(After Fee Waivers and/or
Rebate from Affiliated Transactions) | |
Advisory Fees Waived | | Rebate from Affiliated
Transactions | |
| | | 2009 | | 2010 | | 2011 | | 2009 | | 2010 | | 2011 | | 2009 | | 2010 | | 2011 | |
| | | | | $ | 911,471 | | | $ | 900,919 | | | $ | 821,348 | | | | — | | | | — | | | | — | | | $ | 9,404 | | | $ | 22,630 | | | $ | 11,612 | | |
For the fiscal years ended October 31, 2009, 2010 and 2011, the Fund paid compensation under its Administration Agreement as follows:
| | | Compensation Paid for the Fiscal Year
Ended October 31, | |
| | | 2009 | | 2010 | | 2011 | |
| | | | | $ | 113,339 | | | $ | 113,668 | | | $ | 102,518 | | |
Under a Sub-Administration Agreement between the Administrator and State Street Bank and Trust Company ("State Street"), State Street provides certain administrative services to the Fund. For such services, the Administrator pays State Street a portion of the fee the Administrator receives from the Fund.
B. Principal Underwriter
The Fund's principal underwriter is the Distributor (which has the same address as the Adviser). In this capacity, the Fund's shares are distributed by the Distributor. The Distributor has entered into a selected dealer agreement with Morgan Stanley Smith Barney and Morgan Stanley & Co., which through their own sales organizations sell shares of the Fund. In addition, the Distributor may enter into similar agreements with other selected broker-dealers. The Distributor, a Delaware corporation, is a wholly-owned subsidiary of Morgan Stanley.
The Distributor bears all expenses it may incur in providing services under the Distribution Agreement. These expenses include the payment of commissions for sales of the Fund's shares and incentive compensation to Financial Advisors, the cost of educational and/or business-related trips, and educational and/or promotional and business-related expenses. The Distributor also pays certain expenses in connection with the distribution of the Fund's shares, including the costs of preparing, printing and distributing advertising or promotional materials, and the costs of printing and distributing prospectuses and supplements thereto used in connection with the offering and sale of the Fund's shares. The Fund bears the costs of initial typesetting, printing and distribution of prospectuses and supplements thereto to shareholders. The Fund also bears the costs of registering the Fund and its shares under federal and state securities laws and pays filing fees in accordance with state securities laws.
The Fund and the Distributor have agreed to indemnify each other against certain liabilities, including liabilities under the Securities Act. Under the Distribution Agreement, the Distributor uses its best efforts in rendering services to the Fund, but in the absence of willful misfeasance, bad faith, gross negligence or reckless disregard of its obligations, the Distributor is not liable to the Fund or any of its shareholders for any error of judgment or mistake of law or for any act or omission or for any losses sustained by the Fund or its shareholders.
C. Services Provided by the Adviser and Administrator
The Adviser manages the investment of the Fund's assets, including the placing of orders for the purchase and sale of portfolio securities. The Adviser obtains and evaluates the information and advice relating to the economy, securities markets and specific securities as it considers necessary or useful to continuously manage the assets of the Fund in a manner consistent with its investment objective.
Under the terms of the Administration Agreement, the Administrator maintains certain of the Fund's books and records and furnishes, at its own expense, the office space, facilities, equipment, clerical help and bookkeeping as the Fund may reasonably require in the conduct of its business. The Administrator
39
also assists in the preparation of prospectuses, proxy statements and reports required to be filed with federal and state securities commissions (except insofar as the participation or assistance of the independent registered public accounting firm and attorneys is, in the opinion of the Administrator, necessary or desirable). The Administrator also bears the cost of telephone service, heat, light, power and other utilities provided to the Fund.
Expenses not expressly assumed by the Adviser under the Investment Advisory Agreement or by the Administrator under the Administration Agreement or by the Distributor will be paid by the Fund. These expenses will be allocated among the six Classes of shares pro rata based on the net assets of the Fund attributable to each Class, except as described below. Such expenses include, but are not limited to: expenses of the Plans of Distribution and Shareholder Services Plan pursuant to Rule 12b-1; charges and expenses of any registrar, custodian, stock transfer and dividend disbursing agent; brokerage commissions; taxes; engraving and printing share certificates; registration costs of the Fund and its shares under federal and state securities laws; the cost and expense of printing, including typesetting, and distributing prospectuses of the Fund and supplements thereto to the Fund's shareholders; all expenses of shareholders' and Trustees' meetings and of preparing, printing and mailing of proxy statements and reports to shareholders; fees and travel expenses of Trustees or members of any advisory board or committee who are not employees of the Adviser or any corporate affiliate of the Adviser; all expenses incident to any dividend, withdrawal or redemption options; charges and expenses of any outside service used for pricing of the Fund's shares; fees and expenses of legal counsel, including counsel to the Trustees who are not interested persons of the Fund or of the Adviser (not including compensation or expenses of attorneys who are employees of the Adviser); fees and expenses of the Fund's independent registered public accounting firm; membership dues of industry associations; interest on Fund borrowings; postage; insurance premiums on property or personnel (including officers and Trustees) of the Fund which inure to its benefit; extraordinary expenses (including, but not limited to, legal claims and liabilities and litigation costs and any indemnification relating thereto); and all other costs of the Fund's operation. The 12b-1 fees relating to a particular Class will be allocated directly to that Class. In addition, other expenses associated with a particular Class (except advisory or custodial fees) may be allocated directly to that Class, provided that such expenses are reasonably identified as specifically attributable to that Class and the direct allocation to that Class is approved by the Trustees.
The Investment Advisory Agreement provides that in the absence of willful misfeasance, bad faith, gross negligence or reckless disregard of its obligations thereunder, the Adviser is not liable to the Fund or any of its investors for any act or omission by the Adviser or for any losses sustained by the Fund or its investors.
The Investment Advisory Agreement will remain in effect from year to year, provided continuance of the Investment Advisory Agreement is approved at least annually by the vote of the holders of a majority, as defined in the Investment Company Act, of the outstanding shares of the Fund, or by the Trustees; provided that in either event such continuance is approved annually by the vote of a majority of the Independent Trustees.
The Administration Agreement provides that in the absence of willful misfeasance, bad faith, gross negligence or reckless disregard of its obligations thereunder, the Administrator is not liable to the Fund or any of its investors for any act or omission by the Administrator or for any losses sustained by the Fund or its investors. The Administration Agreement will continue unless terminated by either party by written notice delivered to the other party within 30 days.
D. Dealer Reallowances
Upon notice to selected broker-dealers, the Distributor may reallow up to the full applicable front-end sales charge during periods specified in such notice. During periods when 90% or more of the sales charge is reallowed, such selected broker-dealers may be deemed to be underwriters as that term is defined in the Securities Act.
E. Rule 12b-1 Plans
The Fund has adopted a Plan of Distribution, effective July 31, 2011, in accordance with to Rule 12b-1 under the Investment Company Act with respect to its Class A, Class B and Class C shares and has adopted a Plan of Distribution and a Shareholder Services Plan, effective July 31, 2011, in accordance with Rule 12b-1 under the Investment Company Act with respect to its Class R and Class W shares (the "Plans"). Pursuant to the Plans, each Class, other than Class I, pays the Distributor compensation accrued daily and payable monthly at the following maximum annual rates: 0.25%, 1.00%, 1.00%, 0.50% and
40
0.35% of the average daily net assets of Class A, Class B, Class C, Class R and Class W shares, respectively. Prior to July 31, 2011, in accordance with Rule 12b-1 under the Investment Company Act, the Fund had adopted (i) a Plan of Distribution with respect to the Class A, Class B and Class C shares, and (ii) a Plan of Distribution and a Shareholder Services Plan, each with respect to the Class R and Class W shares, each between the Fund and Morgan Stanley Distributors Inc. (the "Prior Distributor"), pursuant to which the Prior Distributor provided certain services in connection with the promotion and sale of the Fund's shares (each, a "Prior Plan" and together, the "Prior Plans").
The Distributor also receives the proceeds of front-end sales charges ("FSCs") and of contingent deferred sales charges ("CDSCs") imposed on certain redemptions of shares, which are separate and apart from payments made pursuant to the Plans. The Distributor and the Prior Distributor have informed the Fund that each of them and/or Morgan Stanley & Co. received the proceeds of CDSCs and FSCs, for the last three fiscal years ended October 31, as applicable, in approximate amounts as provided in the table below.
| | | 2011 | | 2010 | | 2009 | |
| Class A | | FSCs:(1) | | $ | 8,005 | | | FSCs:(1) | | $ | 12,617 | | | FSCs:(1) | | $ | 18,866 | | |
| | | CDSCs: | | $ | 0 | | | CDSCs: | | $ | 0 | | | CDSCs: | | $ | 2,314 | | |
| Class B | | CDSCs: | | $ | 9,000 | | | CDSCs: | | $ | 18,674 | | | CDSCs: | | $ | 40,423 | | |
| Class C | | CDSCs: | | $ | 203 | | | CDSCs: | | $ | 488 | | | CDSCs: | | $ | 2,877 | | |
(1) FSC applies to Class A only.
The entire fee payable by Class A shares and a portion of the fees payable by each of Class B, Class C, Class R and Class W shares each year pursuant to the Plans up to 0.25% of such Class' average daily net assets are currently each characterized as a "service fee" under the Rules of the Financial Industry Regulatory Authority ("FINRA") (of which the Distributor is a member). The "service fee" is a payment made for personal service and/or the maintenance of shareholder accounts. The remaining portion of the Plan fees payable by a Class, if any, is characterized as an "asset-based sales charge" as such is defined by the Rules of FINRA.
Under the Plans and as required by Rule 12b-1, the Trustees receive and review promptly after the end of each calendar quarter a written report provided by the Distributor of the amounts expended under the Plans and the purpose for which such expenditures were made. For the fiscal year ended October 31, 2011, Class A, Class B, Class C, Class R and Class W shares of the Fund made payments under the Plans and the Prior Plans amounting to $252,673, $113,409, $147,113, $448 and $327, respectively, which amounts are equal to 0.25%, 1.00%, 0.99%, 0.50% and 0.35% of the average daily net assets of Class A, Class B, Class C, Class R and Class W, respectively, for the fiscal year. The amount paid by Class C shares reflects a reduction of $1,513.
The Plans were adopted in order to permit the implementation of the Fund's method of distribution. Under this distribution method the Fund offers six Classes, each with a different distribution arrangement.
With respect to Class A shares, the Distributor generally compensates authorized dealers, from proceeds of the FSC, commissions for the sale of Class A shares, currently a gross sales credit of up to 5.00% of the amount sold and an annual residual commission, currently a residual of up to 0.25% of the current value of the respective accounts for which they are dealers of record in all cases.
With respect to sales of Class B and Class C shares of the Fund, a commission or transaction fee generally will be compensated by the Distributor at the time of purchase directly out of the Distributor's assets (and not out of the Fund's assets) to authorized dealers who initiate and are responsible for such purchases computed based on a percentage of the dollar value of such shares sold of up to 4.00% on Class B shares and up to 1.00% on Class C shares.
Proceeds from any CDSC and any distribution fees on Class B and Class C shares of the Fund are paid to the Distributor and are used by the Distributor to defray its distribution related expenses in connection with the sale of the Fund's shares, such as the payment to authorized dealers for selling such shares. With respect to Class C shares, the authorized dealers generally receive from the Distributor ongoing distribution fees of up to 1.00% of the average daily net assets of the Fund's Class C shares annually commencing in the second year after purchase.
The distribution fee that the Distributor receives from the Fund under the Plans, in effect, offsets distribution expenses incurred under the Plans on behalf of the Fund and, in the case of Class B shares,
41
opportunity costs, such as the gross sales credit and an assumed interest charge thereon ("carrying charge"). These expenses may include the cost of Fund-related educational and/or business-related trips or payment of Fund-related educational and/or promotional expenses of Financial Advisors. In the Distributor's reporting of the distribution expenses to the Fund, in the case of Class B shares, such assumed interest (computed at the "broker's call rate") has been calculated on the gross credit as it is reduced by amounts received by the Distributor under the Plans and any CDSCs received by the Distributor upon redemption of shares of the Fund. No other interest charge is included as a distribution expense in the Distributor's calculation of its distribution costs for this purpose. The broker's call rate is the interest rate charged to securities brokers on loans secured by exchange-listed securities.
The Fund may reimburse expenses incurred or to be incurred in promoting the distribution of the Fund's Class A, Class B, Class C, Class R and Class W shares and in servicing shareholder accounts. Reimbursement will be made through payments at the end of each month. The amount of each monthly payment may in no event exceed an amount equal to a payment at the annual rate of 0.25%, in the case of Class A shares, 1.00%, in the case of Class B and Class C shares, 0.50%, in the case of Class R shares and 0.35%, in the case of Class W shares, of the average daily net assets of the respective Class during the month. No interest or other financing charges, if any, incurred on any distribution expenses on behalf of Class A, Class B, Class C, Class R and Class W shares will be reimbursable under the Plans.
Each Class paid 100% of the amounts accrued under the Plans and the Prior Plans with respect to that Class for the fiscal year ended October 31, 2011 to the Distributor and the Prior Distributor, respectively. It is estimated that the Distributor and the Prior Distributor spent this amount in approximately the following ways: (i) 0.00% ($0) — advertising and promotional expenses; (ii) 0.00% ($0) — printing and mailing of prospectuses for distribution to other than current shareholders; and (iii) 100.00% ($201,174) — other expenses, including the gross sales credit and the carrying charge, of which 85.17% ($171,348) represents carrying charges, 6.14% ($12,348) represents commission credits to Morgan Stanley Smith Barney and Morgan Stanley & Co. branch offices and other selected broker-dealers for payments of commissions to Financial Advisors and other authorized financial representatives, and 8.69% ($17,478) represents overhead and other branch office distribution-related expenses. The amounts accrued by Class A and a portion of the amounts accrued by Class C under the Plans and the Prior Plans during the fiscal year ended October 31, 2011 were service fees. The remainder of the amounts accrued by Class C were for expenses which relate to compensation of sales personnel and associated overhead expenses.
In the case of Class B shares, at any given time, the expenses of distributing shares of the Fund may be more or less than the total of (i) the payments made by the Fund pursuant to the Plans; and (ii) the proceeds of CDSCs paid by investors upon redemption of shares. For example, if $1 million in expenses in distributing Class B shares of the Fund had been incurred and $750,000 had been received as described in (i) and (ii) above, the excess expense would amount to $250,000. The Distributor and the Prior Distributor have advised the Fund that in the case of Class B shares the excess distribution expenses, including the carrying charge designed to approximate the opportunity costs incurred by Morgan Stanley Smith Barney and Morgan Stanley & Co. which arise from their having advanced monies without having received the amount of any sales charges imposed at the time of sale of the Fund's Class B shares, totaled $18,065,763 as of October 31, 2011 (the end of the Fund's fiscal year), which was equal to approximately 242.56% of the net assets of Class B on such date. Because there is no requirement under the Plans or the Prior Plans that the Distributor or the Prior Distributor, respectively, be reimbursed for all distribution expenses with respect to Class B shares or any requirement that the Plans be continued from year to year, this excess amount does not constitute a liability of the Fund. Although there is no legal obligation for the Fund to pay expenses incurred in excess of payments made to the Distributor under the Plans and the proceeds of CDSCs paid by investors upon redemption of shares, if for any reason the Plans are terminated, the Trustees will consider at that time the manner in which to treat such expenses. Any cumulative expenses incurred, but not yet recovered through distribution fees or CDSCs, may or may not be recovered through future distribution fees or CDSCs.
In the case of Class A, Class C, Class R and Class W shares, expenses incurred pursuant to the Plans in any calendar year in excess of 0.25%, 1.00%, 0.50% or 0.35% of the average daily net assets of Class A, Class C, Class R and Class W shares, respectively, will not be reimbursed by the Fund through payments in any subsequent year, except that expenses representing a gross sales commission credited to Morgan Stanley Smith Barney Financial Advisors and other authorized financial representatives at the time of sale may be reimbursed in the subsequent calendar year. The Distributor and the Prior Distributor have advised the Fund that there were no unreimbursed expenses representing a gross sales commission credited to Morgan Stanley Smith Barney Financial Advisors and other authorized financial
42
representatives in the case of Class A or Class C at December 31, 2011 (the end of the calendar year). No interest or other financing charges will be incurred on any Class A, Class C, Class R or Class W distribution expenses incurred by the Distributor or the Prior Distributor, respectively, under the Plans or the Prior Plans or on any unreimbursed expenses due to the Distributor or the Prior Distributor, respectively, pursuant to the Plans or the Prior Plans, respectively.
No interested person of the Fund nor any Independent Trustee has any direct financial interest in the operation of the Plans except to the extent that the Distributor, the Adviser, Morgan Stanley & Co, Morgan Stanley Smith Barney, Morgan Stanley Services or certain of their employees may be deemed to have such an interest as a result of benefits derived from the successful operation of the Plans or as a result of receiving a portion of the amounts expended thereunder by the Fund.
On an annual basis, the Trustees, including a majority of the Independent Trustees, consider whether the Plans should be continued. Prior to approving the last continuation of the Plans, the Trustees requested and received from the Distributor and reviewed all the information which they deemed necessary to arrive at an informed determination. In making their determination to continue the Plans, the Trustees considered: (1) the Fund's experience under the Plans and whether such experience indicates that the Plans are operating as anticipated; (2) the benefits the Fund had obtained, was obtaining and would be likely to obtain under the Plans, including that: (a) the Plans are essential in order to give Fund investors a choice of alternatives for payment of distribution and service charges and to enable the Fund to continue to grow and avoid a pattern of net redemptions which, in turn, are essential for effective investment management; and (b) without the compensation to individual brokers and the reimbursement of distribution and account maintenance expenses of Morgan Stanley & Co. and Morgan Stanley Smith Barney branch offices made possible by the 12b-1 fees, Morgan Stanley & Co. and Morgan Stanley Smith Barney could not establish and maintain an effective system for distribution, servicing of Fund shareholders and maintenance of shareholder accounts; and (3) what services had been provided and were continuing to be provided under the Plans to the Fund and its shareholders. Based upon their review, the Trustees, including each of the Independent Trustees, determined that continuation of the Plans would be in the best interest of the Fund and would have a reasonable likelihood of continuing to benefit the Fund and its shareholders.
The Plans may not be amended to increase materially the amount to be spent for the services described therein without approval by the shareholders of the affected Class or Classes of the Fund, and all material amendments to the Plans must also be approved by the Trustees. The Plans may be terminated at any time, without payment of any penalty, by vote of a majority of the Independent Trustees or by a vote of a majority of the outstanding voting securities of the Fund (as defined in the Investment Company Act) on not more than 30 days' written notice to any other party to the Plans. So long as the Plans are in effect, the election and nomination of Independent Trustees shall be committed to the discretion of the Independent Trustees.
F. Other Service Providers
(1) Transfer Agent/Dividend Disbursing Agent
Morgan Stanley Services Company Inc., P.O. Box 219886, Kansas City, MO 64121-9886, is the Transfer Agent for the Fund's shares and the Dividend Disbursing Agent for payment of dividends and distributions on Fund shares and Agent for shareholders under various investment plans.
(2) Custodian and Independent Registered Public Accounting Firm
State Street Bank and Trust Company, One Lincoln Street, Boston, MA 02111, is the Custodian of the Fund's assets. The Custodian has contracted with various foreign banks and depositaries to hold portfolio securities of non-U.S. issuers on behalf of the Fund. Any of the Fund's cash balances with the Custodian in excess of $250,000 (a temporary increase from $100,000, which is due to expire on December 31, 2013) are unprotected by federal deposit insurance. These balances may, at times, be substantial.
As of June 7, 2011, Ernst & Young LLP, located at 200 Clarendon Street, Boston, MA 02116-5072, is the independent registered public accounting firm of the Fund. Prior to June 7, 2011, Deloitte & Touche LLP, located at Two World Financial Center, New York, NY 10281 was the independent registered public accounting firm of the Fund. The Fund's independent registered public accounting firm is responsible for auditing the annual financial statements.
(3) Affiliated Persons
The Transfer Agent is an affiliate of the Adviser and the Distributor. As Transfer Agent and Dividend Disbursing Agent, the Transfer Agent's responsibilities include maintaining shareholder accounts, disbursing
43
cash dividends and reinvesting dividends, processing account registration changes, handling purchase and redemption transactions, mailing prospectuses and reports, mailing and tabulating proxies, processing share certificate transactions, and maintaining shareholder records and lists. Pursuant to a Transfer Agency and Service Agreement, as consideration for the services it provides, the Transfer Agent receives certain fees from the Fund, which are approved by the Trustees, generally based on the number of shareholder accounts and is reimbursed for its out-of-pocket expenses in connection with such services. The Fund and the Transfer Agent may enter into agreements with unaffiliated third party intermediaries, pursuant to which such intermediaries agree to provide recordkeeping and other administrative services for their clients who invest in the Fund. In such instances, the Fund will pay certain fees to the intermediaries for the services they provide that otherwise would have been performed by the Transfer Agent.
G. Fund Management
Other Accounts Managed by the Portfolio Manager
As of October 31, 2011, Ann D. Thivierge managed four registered investment companies with a total of approximately $889.2 million in assets; one pooled investment vehicle other than registered investment companies with a total of approximately $141 million in assets; and 10 other accounts (which include separate accounts managed under certain "wrap fee programs") with a total of approximately $5.0 billion in assets. Of these other accounts, one account with a total of approximately $122.8 million in assets had performance-based fees.
Because the portfolio manager may manage assets for other investment companies, pooled investment vehicles and/or other accounts (including institutional clients, pension plans and certain high net worth individuals), there may be an incentive to favor one client over another resulting in conflicts of interest. For instance, the Adviser may receive fees from certain accounts that are higher than the fee it receives from the Fund, or it may receive a performance-based fee on certain accounts. In those instances, a portfolio manager may have an incentive to favor the higher and/or performance-based fee accounts over the Fund. In addition, a conflict of interest could exist to the extent the Adviser has proprietary investments in certain accounts, where portfolio managers have personal investments in certain accounts or when certain accounts are investment options in the Adviser's employee benefits and/or deferred compensation plans. The portfolio manager may have an incentive to favor these accounts over others. If the Adviser manages accounts that engage in short sales of securities of the type in which the Fund invests, the Adviser could be seen as harming the performance of the Fund for the benefit of the accounts engaging in short sales if the short sales cause the market value of the securities to fall. The Adviser has adopted trade allocation and other policies and procedures that it believes are reasonably designed to address these and other conflicts of interest.
Portfolio Manager Compensation Structure
The portfolio manager receives a combination of base compensation and discretionary compensation, comprising a cash bonus and several deferred compensation programs described below. The methodology used to determine portfolio manager compensation is applied across all funds/accounts managed by the portfolio manager.
Base salary compensation. Generally, the portfolio manager receives base salary compensation based on the level of her position with the Adviser.
Discretionary compensation. In addition to base compensation, the portfolio manager may receive discretionary compensation.
Discretionary compensation can include:
• Cash Bonus.
• Morgan Stanley's Long Term Incentive Compensation awards — a mandatory program that defers a portion of discretionary year-end compensation into restricted stock units or other awards based on Morgan Stanley common stock or other plans that are subject to vesting and other conditions. All long term incentive compensation awards are subject to clawback provisions where awards can be cancelled if an employee takes any action, or omits to take any action which causes a restatement of Morgan Stanley's consolidated financial results, or constitutes a violation of Morgan Stanley's risk policies and standards.
• Investment Management Alignment Plan (IMAP) awards — a mandatory program that defers a portion of discretionary year-end compensation and notionally invests it in designated funds advised
44
by the Adviser or its affiliates. The award is subject to vesting and other conditions. Portfolio managers must notionally invest a minimum of 25% to a maximum of 100% of their IMAP deferral account into a combination of the designated funds they manage that are included in the IMAP fund menu, which may or may not include the Fund. In addition to the clawbacks listed above for long term incentive compensation awards, the provision on IMAP awards is further strengthened such that it may also be triggered if an employee's actions cause substantial financial loss on a trading strategy, investment, commitment or other holding provided that previous gains on those positions were relevant to the employees' prior year compensation decisions.
• Voluntary Deferred Compensation Plans — voluntary programs that permit certain employees to elect to defer a portion of their discretionary year-end compensation and notionally invest the deferred amount across a range of designated investment funds, which may include funds advised by the Adviser or its affiliates.
Several factors determine discretionary compensation, which can vary by portfolio management team and circumstances. These factors may include:
• Revenues generated by the investment companies, pooled investment vehicles and other accounts managed by the portfolio manager.
• The investment performance of the funds/accounts managed by the portfolio manager.
• Contribution to the business objectives of the Adviser.
• The dollar amount of assets managed by the portfolio manager.
• Market compensation survey research by independent third parties.
• Other qualitative factors, such as contributions to client objectives.
• Performance of Morgan Stanley and Morgan Stanley Investment Management, and the overall performance of the investment team(s) of which the portfolio manager is a member.
Securities Ownership of Portfolio Manager
As of October 31, 2011, Ann D. Thivierge did not own any shares of the Fund.
H. Codes of Ethics
The Fund, the Adviser and the Distributor have each adopted a Code of Ethics pursuant to Rule 17j-1 under the Investment Company Act. The Codes of Ethics are designed to detect and prevent improper personal trading. The Codes of Ethics permit personnel subject to the Codes to invest in securities, including securities that may be purchased, sold or held by the Fund, subject to a number of restrictions and controls, including prohibitions against purchases of securities in an initial public offering and a preclearance requirement with respect to personal securities transactions.
I. Proxy Voting Policy and Proxy Voting Record
The Board of Trustees believes that the voting of proxies on securities held by the Fund is an important element of the overall investment process. As such, the Trustees have delegated the responsibility to vote such proxies to MSIM.
A copy of MSIM's Proxy Voting Policy ("Proxy Policy") is attached hereto as Appendix A. In addition, a copy of the Proxy Policy, as well as the Fund's most recent proxy voting record for the 12-month period ended June 30, as filed with the SEC, are available without charge on our web site at www.morganstanley.com/im. The Fund's proxy voting record is also available without charge on the SEC's web site at www.sec.gov.
J. Revenue Sharing
The Adviser and/or Distributor may pay compensation, out of their own funds and not as an expense of the Fund, to Morgan Stanley Smith Barney, Citigroup Global Markets Inc. ("CGM") and certain unaffiliated brokers, dealers or other financial intermediaries, including recordkeepers and administrators of various deferred compensation plans ("Intermediaries") in connection with the sale, distribution, marketing and retention of Fund shares and/or shareholder servicing. For example, the Adviser or the Distributor may pay additional compensation to Intermediaries for, among other things, promoting the sale and distribution of Fund shares, providing access to various programs, mutual fund platforms or preferred or recommended mutual fund lists that may be offered by an Intermediary, granting the Distributor access to the Intermediary's financial advisors and consultants, providing assistance in the ongoing education and training of an
45
Intermediary's financial personnel, furnishing marketing support, maintaining share balances and/or for sub-accounting, recordkeeping, administrative, shareholder or transaction processing services. Such payments are in addition to any distribution fees, shareholder service fees and/or transfer agency fees that may be payable by the Fund. The additional payments may be based on various factors, including level of sales (based on gross or net sales or some specified minimum sales or some other similar criteria related to sales of the Fund and/or some or all other Morgan Stanley Funds), amount of assets invested by the Intermediary's customers (which could include current or aged assets of the Fund and/or some or all other Morgan Stanley Funds), a Fund's advisory fees, some other agreed upon amount, or other measures as determined from time to time by the Adviser and/or Distributor. The amount of these payments may be different for different Intermediaries.
With respect to Morgan Stanley Smith Barney and CGM, these payments currently include the following amounts, which are paid in accordance with the applicable compensation structure:
(1) On $1 million or more of Class A shares (for which no sales charge was paid) or net asset value purchases by certain employee benefit plans, Morgan Stanley Smith Barney and CGM, as applicable, receive a gross sales credit of up to 1.00% of the amount sold.*
(2) On Class A, Class B, Class C and Class I shares of the Fund held in traditional brokerage accounts where Morgan Stanley Smith Barney or CGM is designated by purchasers as broker-dealer of record:
• For the period beginning January 1, 2011 and ending December 31, 2011, an amount up to $1.6 million, which covers the Fund and all other Morgan Stanley Funds; and
• For the period beginning January 1, 2012 and thereafter, an ongoing annual fee in an amount up to 0.13% of the total average quarterly net asset value of such shares.
(3) On Class I shares of the Fund held in traditional brokerage accounts where Morgan Stanley Smith Barney is designated by purchasers as broker-dealer of record, in addition to the amounts referenced in paragraph (2) above:
• A gross sales credit of 0.25% of the amount sold and an ongoing annual fee in an amount up to 0.10% of the total average quarterly net asset value of such shares; or
• An ongoing annual fee in an amount up to 35% of the advisory fee the Adviser receives based on the average daily net assets of such shares.
There is a chargeback of 100% of the gross sales credit amount paid if the Class I shares are redeemed in the first year and a chargeback of 50% of the gross sales credit amount paid if the shares are redeemed in the second year.
(4) On Class A, Class B, Class C and Class I shares of the Fund held in taxable accounts through any fee-based advisory program offered by the Morgan Stanley channel of Morgan Stanley Smith Barney, an ongoing annual fee in an amount up to 0.03% of the total average monthly net asset value of such shares.
(5) On any shares held in an account through certain 401(k) platforms in the Morgan Stanley channel of Morgan Stanley Smith Barney's Corporate Retirement Solutions, an ongoing annual fee in an amount up to 0.20% of the total average monthly net asset value of such shares.
With respect to other Intermediaries, these payments currently include the following amounts, which are paid in accordance with the applicable compensation structure for each Intermediary:
(1) On $1 million or more of Class A shares (for which no sales charge was paid) or net asset value purchases by certain employee benefit plans, Intermediaries receive a gross sales credit of up to 1.00% of the amount sold.*
(2) On Class A, Class B and Class C shares of the Fund held in Intermediary accounts other than those held through Intermediary 401(k) platforms, an ongoing annual fee in an amount up to 0.10% of the total average monthly net asset value of such shares.
* Commissions or transaction fees paid when Morgan Stanley Smith Barney, CGM or other Intermediaries initiate and are responsible for purchases of $1 million or more are computed on a percentage of the dollar value of such shares sold as follows: 1.00% on sales of $1 million to $2 million, plus 0.75% on the next $1 million, plus 0.50% on the next $2 million, plus 0.25% on the excess over $5 million.
46
(3) On Class I shares of the Fund held in Intermediary accounts other than those held through Intermediary 401(k) platforms:
• A gross sales credit of 0.25% of the amount sold; and
• An ongoing annual fee in an amount up to 0.10% of the total average monthly net asset value of such shares.
There is a chargeback of 100% of the gross sales credit amount paid if the Class I shares are redeemed in the first year and a chargeback of 50% of the gross sales credit amount paid if the shares are redeemed in the second year.
The prospect of receiving, or the receipt of, additional compensation, as described above, by Intermediaries may provide such Intermediaries, and/or their financial advisors or other salespersons, with an incentive to favor sales of shares of the Fund over other investment options with respect to which an Intermediary does not receive additional compensation (or receives lower levels of additional compensation). These payment arrangements, however, will not change the price that an investor pays for shares of the Fund or the amount that the Fund receives to invest on behalf of an investor. Investors may wish to take such payment arrangements into account when considering and evaluating any recommendations relating to Fund shares and should review carefully any disclosure provided by Intermediaries as to their compensation.
VI. BROKERAGE ALLOCATION AND OTHER PRACTICES
A. Brokerage Transactions
Subject to the general supervision of the Trustees, the Adviser is responsible for decisions to buy and sell securities for the Fund, the selection of brokers and dealers to effect the transactions, and the negotiation of brokerage commissions, if any. Purchases and sales of securities on a stock exchange are effected through brokers who charge a commission for their services. In the OTC market, securities are generally traded on a "net" basis with dealers acting as principal for their own accounts without a stated commission, although the price of the security usually includes a profit to the dealer. The Fund also expects that securities will be purchased at times in underwritten offerings where the price includes a fixed amount of compensation, generally referred to as the underwriter's concession or discount. Options and futures transactions will usually be effected through a broker and a commission will be charged. On occasion, the Fund may also purchase certain money market instruments directly from an issuer, in which case no commissions or discounts are paid.
During the fiscal years ended October 31, 2009, 2010 and 2011, the Fund paid a total of $95,623, $60,046 and $70,219, respectively, in brokerage commissions.
B. Commissions
Pursuant to an order issued by the SEC, the Fund is permitted to engage in principal transactions involving money market instruments, subject to certain conditions, with Morgan Stanley & Co., a broker-dealer affiliated with the Fund's Adviser.
During the fiscal years ended October 31, 2009, 2010 and 2011, the Fund did not effect any principal transactions with Morgan Stanley & Co.
Brokerage transactions in securities listed on exchanges or admitted to unlisted trading privileges may be effected through Morgan Stanley & Co., Citigroup, Inc. and other affiliated brokers and dealers. In order for an affiliated broker or dealer to effect any portfolio transactions on an exchange for the Fund, the commissions, fees or other remuneration received by the affiliated broker or dealer must be reasonable and fair compared to the commissions, fees or other remuneration paid to other brokers in connection with comparable transactions involving similar securities being purchased or sold on an exchange during a comparable period of time. This standard would allow the affiliated broker or dealer to receive no more than the remuneration which would be expected to be received by an unaffiliated broker in a commensurate arm's-length transaction. Furthermore, the Trustees, including the Independent Trustees, have adopted procedures which are reasonably designed to provide that any commissions, fees or other remuneration paid to an affiliated broker or dealer are consistent with the foregoing standard. The Fund does not reduce the management fee it pays to the Adviser by any amount of the brokerage commissions it may pay to an affiliated broker or dealer.
47
During the fiscal years ended October 31, 2009, 2010 and 2011, the Fund did not pay any brokerage commissions to an affiliated broker or dealer.
C. Brokerage Selection
The policy of the Fund regarding purchases and sales of securities for its portfolio is that primary consideration will be given to obtaining the most favorable prices and efficient executions of transactions. The Adviser is prohibited from directing brokerage transactions on the basis of the referral of clients or the sale of shares of investment companies for which it acts as investment adviser. Consistent with this policy, when securities transactions are effected on a stock exchange, the Fund's policy is to pay commissions which are considered fair and reasonable without necessarily determining that the lowest possible commissions are paid in all circumstances. The Fund believes that a requirement always to seek the lowest possible commission cost could impede effective portfolio management and preclude the Fund and the Adviser from obtaining a high quality of brokerage and research services. The Fund anticipates that certain of its transactions involving foreign securities will be effected on foreign securities exchanges. Fixed commissions on such transactions are generally higher than negotiated commissions on domestic transactions. There is also generally less government supervision and regulation of foreign securities exchanges and brokers than in the United States.
In seeking to implement the Fund's policies, the Adviser effects transactions with those broker-dealers that the Adviser believes provide prompt execution of orders in an effective manner at the most favorable prices. The Adviser may place portfolio transactions with those broker-dealers that also furnish research and other services to the Fund or the Adviser. Services provided may include certain research services (as described below) as well as effecting securities transactions and performing functions incidental thereto (such as clearance settlement and custody).
The Adviser and its affiliated investment advisers have established commission sharing arrangements under a commission management program (the "Commission Management Program" or "CMP"), pursuant to which execution and research costs or a portion of those costs are decoupled in accordance with applicable laws, rules and regulations. Under the CMP, the Adviser and its affiliated investment advisers select approved equity brokers (which include the Adviser's affiliates) for execution services, and after accumulation of commissions at such brokers, the Adviser and/or its affiliates instruct these approved equity brokers to pay for eligible research provided by executing brokers or third-party research providers, which are selected independently by a Research Services Committee of the Adviser and its affiliated investment advisers. Generally, the Adviser and its affiliated investment advisers will direct the approved equity broker to record research credits based upon a previously agreed-upon allocation and will periodically instruct the approved equity broker to direct specified dollar amounts from that pool to pay for eligible research services provided by third-party research providers and executing brokers. The research credits are pooled among the Adviser and its affiliated investment advisers and allocated from this pool. Likewise, the research services obtained under the CMP are shared among the Adviser and its affiliated investment advisers.
Selection of approved equity brokers for execution is based on three main criteria: access to liquidity, provision of capital and quality of execution. Under the CMP, each approved equity broker is responsible for the payment of fees for research services and obtains the research services pursuant to written agreements between the approved equity broker and the third-party research provider.
For those costs not decoupled, but retained by broker-dealers, the Adviser also effects transactions with brokers which directly pay for research services provided by those brokers in accordance with Section 28(e) of the Exchange Act. Such transactions include equity transactions and may include fixed-income transactions effected on an agency basis.
Transactions involving client accounts managed by two or more affiliated investment advisers may be aggregated and executed using the services of broker-dealers that provide third party benefits/research so long as: (i) all client accounts involved in the transaction benefit from one or more of the services offered by such broker-dealer; and (ii) each affiliated investment adviser has approved the use of such broker-dealer and the services provided thereby.
The research services received include those of the nature described above and other services which aid the Adviser in fulfilling its investment decision-making responsibilities, including (a) furnishing advice as to the value of securities, the advisability of investing in, purchasing or selling securities, and the availability of securities or purchasers or sellers of securities; and (b) furnishing analyses and reports
48
concerning issuers, industries, securities, economic factors and trends, portfolio strategy, and the performance of accounts. Where a particular item has both research and non-research related uses (such as proxy services where both research services and services relating to the administration of the proxy itself are provided), the Adviser will make a reasonable allocation of the cost of the item between research and non-research uses and will only pay for the portion of the cost allocated to research uses with client brokerage transactions. Research services furnished or paid for by brokers through whom the Adviser effects transactions for a particular account may be used by the Adviser or its affiliated investment advisers in servicing their other accounts, and not all such services may be used for the benefit of the client which pays the brokerage commission that results in the receipt of such research services. Commissions paid to brokers providing research services may be higher than those charged by brokers not providing services.
The Adviser and its affiliated investment advisers make a good faith determination of the value of research services in accordance with Section 28(e) of the Exchange Act, UK Financial Services Authority Rules and other relevant regulatory requirements.
Certain investment professionals and other employees of the Adviser are also officers of affiliated investment advisers and may provide investment advisory services to clients of such affiliated investment advisers. The Adviser's personnel also provide research and trading support to personnel of certain affiliated investment advisers. Research related costs may be shared by affiliated investment advisers and may benefit the clients of such affiliated investment advisers. Research services that benefit the Adviser may be received in connection with commissions generated by clients of its affiliated investment advisers. Similarly, research services received in connection with commissions generated by the Adviser's clients may benefit affiliated investment advisers and their clients. Moreover, research services provided by broker-dealers through which the Adviser effects transactions for a particular account may be used by the Adviser and/or an affiliated investment adviser in servicing its other accounts and not all such research services may be used for the benefit of the particular client, which pays the brokerage commission giving rise to the receipt of such research services.
The Adviser and certain of its affiliates currently serve as an investment adviser to a number of clients, including other investment companies, and may in the future act as an investment adviser to others. It is the practice of the Adviser and its affiliates to cause purchase and sale transactions (including transactions in certain initial and secondary public offerings) to be allocated among clients whose assets they manage (including the Fund) in such manner as they deem equitable. In making such allocations among the Fund and other client accounts, various factors may be considered, including the respective investment objectives, the relative size of portfolio holdings of the same or comparable securities, the availability of cash for investment, the size of investment commitments generally held and the opinions of the persons responsible for managing the portfolios of the Fund and other client accounts. The Adviser and its affiliates may operate one or more order placement facilities and each facility will implement order allocation in accordance with the procedures described above. From time to time, each facility may transact in a security at the same time as other facilities are trading in that security.
D. Regular Broker-Dealers
During the fiscal year ended October 31, 2011, the Fund purchased securities issued by Barclays Capital Group, Credit Suisse Group AG, Deutsche Bank Financial LLC, HSBC Holdings PLC, Societe Generale, UBS Financial Services, Inc and Nomura Securities, which were among the ten brokers or ten dealers which executed transactions for or with the Fund in the largest dollar amounts during the period. At October 31, 2011, the Fund held securities issued by Barclays Capital Group, Credit Suisse Group AG, Deutsche Bank Financial LLC, HSBC Holdings PLC, Societe Generale, UBS Financial Services, Inc. and Nomura Securities, with market values of $124,594, $159,322, $199,653, $1,143,426, $69,104, $228,060 and $72,391, respectively.
VII. CAPITAL STOCK AND OTHER SECURITIES
The shareholders of the Fund are entitled to a full vote for each full share of beneficial interest held. The Fund is authorized to issue an unlimited number of shares of beneficial interest. All shares of beneficial interest of the Fund are of $0.01 par value and are equal as to earnings, assets and voting privileges except that each Class will have exclusive voting privileges with respect to matters relating to distribution expenses borne solely by such Class or any other matter in which the interests of one Class differ from the interests of any other Class. In addition, Class B shareholders will have the right to vote on any proposed material
49
increase in Class A's expenses, if such proposal is submitted separately to Class A shareholders. Also, Class A, Class B and Class C bear expenses related to the distribution of their respective shares.
The Fund's Declaration of Trust permits the Trustees to authorize the creation of additional series of shares (the proceeds of which would be invested in separate, independently managed portfolios) and additional Classes of shares within any series. The Trustees have not presently authorized any such additional series or Classes of shares other than as set forth in the Prospectus.
The Fund is not required to hold annual meetings of shareholders and in ordinary circumstances the Fund does not intend to hold such meetings. The Trustees may call special meetings of shareholders for action by shareholder vote as may be required by the Investment Company Act or the Declaration of Trust. Under certain circumstances, the Trustees may be removed by the actions of the Trustees. In addition, under certain circumstances, the shareholders may call a meeting to remove the Trustees and the Fund is required to provide assistance in communication with shareholders about such a meeting. The voting rights of shareholders are not cumulative, so that holders of more than 50% of the shares voting can, if they choose, elect all Trustees being selected, while the holders of the remaining shares would be unable to elect any Trustees.
Under Massachusetts law, shareholders of a business trust may, under certain limited circumstances, be held personally liable as partners for the obligations of the Fund. However, the Declaration of Trust contains an express disclaimer of shareholder liability for acts or obligations of the Fund, requires that notice of such Fund obligations include such disclaimer, and provides for indemnification out of the Fund's property for any shareholder held personally liable for the obligations of the Fund. Thus, the risk of a shareholder incurring financial loss on account of shareholder liability is limited to circumstances in which the Fund itself would be unable to meet its obligations. Given the above limitations on shareholder personal liability, and the nature of the Fund's assets and operations, the possibility of the Fund being unable to meet its obligations is remote and thus, in the opinion of Massachusetts counsel to the Fund, the risk to Fund shareholders of personal liability is remote.
The Trustees themselves have the power to alter the number and the terms of office of the Trustees (as provided for in the Declaration of Trust), and they may at any time lengthen or shorten their own terms or make their terms of unlimited duration and appoint their own successors, provided that always at least a majority of the Trustees has been elected by the shareholders of the Fund.
VIII. PURCHASE, REDEMPTION AND PRICING OF SHARES
A. Purchase/Redemption of Shares
Information concerning how Fund shares are offered to the public (and how they are redeemed and exchanged) is provided in the Fund's Prospectus.
Suspension of Redemptions. Redemptions are not made on days during which the NYSE is closed. The right of redemption may be suspended and the payment therefore may be postponed for more than seven days during any period when (a) the NYSE is closed for other than customary weekends or holidays; (b) the SEC determines trading on the NYSE is restricted; (c) the SEC determines an emergency exists as a result of which disposal by the Fund of securities owned by it is not reasonably practicable or it is not reasonably practicable for the Fund to fairly determine the value of its net assets; or (d) the SEC, by order, so permits.
Transfer Agent as Agent. With respect to the redemption or repurchase of Fund shares, the application of proceeds to the purchase of new shares in the Fund or any other Morgan Stanley Funds and the general administration of the exchange privilege, the Transfer Agent acts as agent for the Distributor and for the shareholder's authorized broker-dealer, if any, in the performance of such functions. With respect to exchanges, redemptions or repurchases, the Transfer Agent is liable for its own negligence and not for the default or negligence of its correspondents or for losses in transit. The Fund is not liable for any default or negligence of the Transfer Agent, the Distributor or any authorized broker-dealer.
The Distributor and any authorized broker-dealer have appointed the Transfer Agent to act as their agent in connection with the application of proceeds of any redemption of Fund shares to the purchase of shares of any other Morgan Stanley Fund and the general administration of the exchange privilege. No commission or discounts will be paid to the Distributor or any authorized broker-dealer for any transaction pursuant to the exchange privilege.
50
Transfers of Shares. In the event a shareholder requests a transfer of Fund shares to a new registration, the shares will be transferred without sales charge at the time of transfer. With regard to the status of shares which are either subject to the CDSC or free of such charge (and with regard to the length of time shares subject to the charge have been held), any transfer involving less than all of the shares in an account will be made on a pro rata basis (that is, by transferring shares in the same proportion that the transferred shares bear to the total shares in the account immediately prior to the transfer). The transferred shares will continue to be subject to any applicable CDSC as if they had not been so transferred.
Outside Brokerage Accounts/Limited Portability. Most Fund shareholders hold their shares with Morgan Stanley Smith Barney. Please note that your ability to transfer your Fund shares to a brokerage account at another securities dealer may be limited. Fund shares may only be transferred to accounts held at securities dealers or financial intermediaries that have entered into agreements with the Distributor. After a transfer, you may purchase additional shares of the Morgan Stanley Fund(s) you owned before the transfer and, in most instances, you will also be able to purchase shares of most other Morgan Stanley Funds. If you transfer shares of a fund that is not a Multi-Class Fund (for example, a Money Market Fund) you will not be able to exchange shares of that fund for any other Morgan Stanley Fund after the transfer.
If you wish to transfer Fund shares to a securities dealer or other financial intermediary that has not entered into an agreement with the Distributor, you may request that the securities dealer or financial intermediary maintain the shares in an account at the Transfer Agent registered in the name of such securities dealer or financial intermediary for your benefit. You may also hold your Fund shares in your own name directly with the Transfer Agent. In either case, you will continue to have the ability to purchase additional Morgan Stanley Funds and will have full exchange privileges. Other options may also be available; please check with the respective securities dealer or financial intermediary. If you choose not to hold your shares with the Transfer Agent, either directly or through a securities dealer or other financial intermediary, you must redeem your shares and pay any applicable CDSC.
B. Offering Price
The Fund's Class B, Class C, Class I, Class R and Class W shares are offered at net asset value and the Class A shares are offered at net asset value per share plus any applicable FSC which is distributed among the Fund's Distributor, Morgan Stanley Smith Barney and other authorized dealers as described in Section "V. Investment Advisory and Other Services — E. Rule 12b1 Plans." The price of Fund shares, called "net asset value," is based on the value of the Fund's portfolio securities. Net asset value per share of each Class is calculated by dividing the value of the portion of the Fund's securities and other assets attributable to that Class, less the liabilities attributable to that Class, by the number of shares of that Class outstanding. The assets of each Class of shares are invested in a single portfolio. The net asset value of each Class, however, will differ because the Classes have different ongoing fees.
In the calculation of the Fund's net asset value: (1) an equity portfolio security listed or traded on the NYSE or other exchange is valued at its latest sale price, prior to the time when assets are valued; if there were no sales that day, the security is valued at the mean between the last reported bid and asked price; (2) an equity portfolio security listed or traded on the Nasdaq is valued at the Nasdaq Official Closing Price; if there were no sales that day, the security is valued at the mean between the last reported bid and asked price; and (3) all other portfolio securities for which over-the-counter market quotations are readily available are valued at the mean between the last reported bid and asked price. In cases where a security is traded on more than one exchange, the security is valued on the exchange designated as the primary market. For equity securities traded on foreign exchanges, the closing price or the latest bid price may be used if there were no sales on a particular day. When market quotations are not readily available, including circumstances under which it is determined by the Adviser that the sale price, the bid price or the mean between the last reported bid and asked price are not reflective of a security's market value, portfolio securities are valued at their fair value as determined in good faith under procedures established by and under the general supervision of the Fund's Trustees. For valuation purposes, quotations of foreign portfolio securities, other assets and liabilities and forward contracts stated in foreign currency are translated into U.S. dollar equivalents at the prevailing market rates prior to the close of the NYSE.
Short-term debt securities with remaining maturities of 60 days or less at the time of purchase are valued at amortized cost, unless the Trustees determine such price does not reflect the securities' market value, in which case these securities will be valued at their fair value as determined by the Trustees.
51
Certain of the Fund's portfolio securities may be valued by an outside pricing service approved by the Fund's Trustees. The pricing service may utilize a matrix system incorporating security quality, maturity and coupon as the evaluation model parameters, and/or research evaluations by its staff, including review of broker-dealer market price quotations in determining what it believes is the fair valuation of the portfolio securities valued by such pricing service.
Listed options on debt securities are valued at the latest sale price on the exchange on which they are listed unless no sales of such options have taken place that day, in which case they will be valued at the mean between their latest bid and asked prices. Unlisted options on debt securities and all options on equity securities are valued at the mean between their latest bid and asked prices. Futures are valued at the latest price published by the commodities exchange on which they trade unless it is determined that such price does not reflect their market value, in which case they will be valued at their fair value as determined in good faith under procedures established by and under the supervision of the Trustees.
Generally, trading in foreign securities, as well as corporate bonds, U.S. government securities and money market instruments, is substantially completed each day at various times prior to the close of the NYSE. The values of such securities used in computing the net asset value of the Fund's shares are determined as of such times. Foreign currency exchange rates are also generally determined prior to the close of the NYSE. Occasionally, events which may affect the values of such securities and such exchange rates may occur between the times at which they are determined and the close of the NYSE and will therefore not be reflected in the computation of the Fund's net asset value. If events that may affect the value of such securities occur during such period, then these securities may be valued at their fair value as determined in good faith under procedures established by and under the supervision of the Trustees.
IX. TAXATION OF THE FUND AND SHAREHOLDERS
The Fund generally will make two basic types of distributions: ordinary dividends and long-term capital gain distributions. These two types of distributions are reported differently on a shareholder's income tax return. The tax treatment of the investment activities of the Fund will affect the amount, timing and character of the distributions made by the Fund. The following discussion is only a summary of certain tax considerations generally affecting the Fund and shareholders of the Fund and is not intended as a substitute for careful tax planning. Tax issues relating to the Fund are not generally a consideration for shareholders such as tax-exempt entities and tax-advantaged retirement vehicles such as an IRA or 401(k) plan. Shareholders are urged to consult their own tax professionals regarding specific questions as to federal, state or local taxes.
Investment Company Taxation. The Fund intends to continue to qualify as a regulated investment company under Subchapter M of the Code. As such, the Fund will not be subject to federal income tax on its net investment income and capital gains, if any, to the extent that it timely distributes such income and capital gains to its shareholders. If the Fund fails to qualify for any taxable year as a regulated investment company, all of its taxable income will be subject to tax at regular corporate income tax rates without any deduction for distributions to shareholders, and such distributions generally will be taxable to shareholders as ordinary dividends to the extent of the Fund's current and accumulated earnings and profits.
The Fund generally intends to distribute sufficient income and gains so that the Fund will not pay corporate income tax on its earnings. The Fund also generally intends to distribute to its shareholders in each calendar year a sufficient amount of ordinary income and capital gains to avoid the imposition of a 4% excise tax. However, the Fund may instead determine to retain all or part of any income or net long-term capital gains in any year for reinvestment. In such event, the Fund will pay federal income tax (and possibly excise tax) on such retained income or gains.
Gains or losses on sales of securities by the Fund will generally be long-term capital gains or losses if the securities have a tax holding period of more than one year at the time of such sale. Gains or losses on the sale of securities with a tax holding period of one year or less will be short-term capital gains or losses. Special tax rules may change the normal treatment of gains and losses recognized by the Fund when the Fund invests in forward foreign currency exchange contracts, options, futures transactions and non-U.S. corporations classified as "passive foreign investment companies." Those special tax rules can, among other things, affect the treatment of capital gain or loss as long-term or short-term and may result in ordinary income or loss rather than capital gain or loss. The application of these special rules would therefore also affect the character of distributions made by the Fund.
52
If more than 50% of the Fund's assets are invested in foreign securities at the end of any fiscal year, the Fund may elect to treat certain foreign income taxes imposed on it for federal income tax purposes as paid directly by the Fund's shareholders. The Fund will notify shareholders in writing each year if it makes an election and of the amount of foreign taxes, if any, to be treated as paid by shareholders. If the Fund makes the election, shareholders will be required to include in income their proportionate share of the amount of foreign income taxes treated as imposed on the Fund and will be entitled, subject to certain limitations, to take a credit or deduction on their federal income tax return for foreign taxes paid by the Fund.
The Fund may make investments in which it recognizes income or gain prior to receiving cash with respect to such investment. For example, under certain tax rules, the Fund may be required to accrue a portion of any discount at which certain securities are purchased as income each year even though the Fund receives no payments in cash on the security during the year. To the extent that the Fund makes such investments, it generally would be required to pay out such income or gain as a distribution in each year to avoid taxation at the Fund level. Such distributions will be made from the available cash of the Fund or by liquidation of portfolio securities if necessary. If a distribution of cash necessitates the liquidation of portfolio securities, the Adviser will select which securities to sell. The Fund may realize a gain or loss from such sales. In the event the Fund realizes net capital gains from such transactions, its shareholders may receive a larger capital gain distribution, if any, than they would in the absence of such transactions.
Taxation of Dividends and Distributions. Shareholders normally will be subject to federal income taxes, and any state and/or local income taxes, on the dividends and other distributions they receive from the Fund. Such dividends and distributions, to the extent that they are derived from net investment income or short-term capital gains, are generally taxable to the shareholder as ordinary income regardless of whether the shareholder receives such payments in additional shares or in cash. Under current law (through 2012), if certain holding period requirements are met with respect to a shareholder's shares, a portion of the income dividends received by a shareholder may be taxed at the same rate as long-term capital gains. However, even if income received in the form of income dividends is taxed at the same rates as long-term capital gains, such income will not be considered long-term capital gains for other federal income tax purposes. For example, you generally will not be permitted to offset income dividends with capital losses. Short-term capital gain distributions will continue to be taxed at ordinary income rates.
Distributions of net long-term capital gains, if any, are taxable to shareholders as long-term capital gains regardless of how long a shareholder has held the Fund's shares and regardless of whether the distribution is received in additional shares or in cash. Under current law, the maximum tax rate on long-term capital gains available to non-corporate shareholders generally is 15%. Without future congressional action, the maximum tax rate on long-term capital gains will return to 20% in 2013, and all dividends will be taxed at ordinary income rates.
Shareholders are generally taxed on any income dividend or capital gain distributions from the Fund in the year they are actually distributed. However, if any such dividends or distributions are declared in October, November or December and paid to shareholders of record of such month in January then such amounts will be treated for tax purposes as received by the shareholders on December 31.
Subject to certain exceptions, a corporate shareholder may be eligible for a 70% dividends received deduction to the extent that a Portfolio earns and distributes qualifying dividends from its investments. Distributions of net capital gains by a Portfolio will not be eligible for the dividends received deduction.
Shareholders who are not citizens or residents of the United States and certain foreign entities may be subject to withholding of U.S. tax on distributions made by the Fund of investment income and short-term capital gains. The Fund is not required to withhold any amounts with respect to distributions to foreign shareholders that are properly designated by the Fund as "interest-related dividends" or "short-term capital gain dividends," provided that the income would not be subject to federal income tax if earned directly by the foreign shareholder. However, the Fund may withhold on some of these amounts regardless of the fact that it is not required to do so. Any amounts withheld from payments made to a shareholder may be refunded or credited against the shareholder's U.S. federal income tax liability, if any, provided that the required information is furnished to the U.S. Internal Revenue Service ("IRS"). The provisions discussed above relating to distributions to foreign persons generally would apply to distributions with respect to taxable years of regulated investment companies beginning before January 1, 2012 (or a later date if extended by the U.S. Congress). Prospective investors are urged to consult their tax advisors regarding the specific tax consequences discussed above.
53
The Fund will be required to withhold U.S. federal withholding taxes (at 30%) from certain "withholdable payments" made to a non-U.S. shareholder (other than an individual) after 2014, unless the non-U.S. shareholder complies with certain U.S. tax reporting (and, in some cases, withholding) requirements (generally relating to the entity's U.S. owners or account holders, if any) or otherwise qualifies for an exemption from such withholding. Withholdable payments generally will include interest (including original issue discount), dividends, rents, annuities, and other fixed or determinable annual or periodical gains, profits or income, if such payments are derived from U.S. sources, as well as gross proceeds from dispositions of securities that could produce U.S. source interest or dividends. Income which is effectively connected with the conduct of a U.S. trade or business is not, however, included in this definition.
After the end of each calendar year, shareholders will be sent information on their dividends and capital gain distributions for tax purposes, including the portion taxable as ordinary income, the portion taxable as long-term capital gains and the amount of any dividends eligible for the federal dividends received deduction for corporations.
Purchases and Redemptions and Exchanges of Fund Shares. Any dividend or capital gains distribution received by a shareholder from any investment company will have the effect of reducing the net asset value of the shareholder's stock in that company by the exact amount of the dividend or capital gains distribution. Furthermore, such dividends and capital gains distributions are subject to federal income taxes. If the net asset value of the shares should be reduced below a shareholder's cost as a result of the payment of dividends or the distribution of realized long-term capital gains, such payment or distribution would be in part a return of the shareholder's investment but nonetheless would be taxable to the shareholder. Therefore, an investor should consider the tax implications of purchasing Fund shares immediately prior to a distribution record date.
Shareholders normally will be subject to federal income taxes, and state and/or local income taxes, on the sale or disposition of Fund shares. In general, a sale of shares results in capital gain or loss, and for individual shareholders, is taxable at a federal rate dependent upon the length of time the shares were held. A redemption of a shareholder's Fund shares is normally treated as a sale for tax purposes. Fund shares held for a period of one year or less at the time of such sale or redemption will, for tax purposes, generally result in short-term capital gains or losses and those held for more than one year will generally result in long-term capital gains or losses. Under current law, the maximum tax rate on long-term capital gains available to non-corporate shareholders generally is 15%. Without future congressional action, the maximum tax rate on long-term capital gains will return to 20% in 2013. Any loss realized by shareholders upon a sale or redemption of shares within six months of the date of their purchase will be treated as a long-term capital loss to the extent of any distributions of net long-term capital gains with respect to such shares during the six-month period.
Gain or loss on the sale or redemption of shares in the Fund is measured by the difference between the amount of cash received (or the fair market value of any property received) and the adjusted tax basis of the shares. Shareholders should keep records of investments made (including shares acquired through reinvestment of dividends and distributions) so they can compute the tax basis of their shares. Under certain circumstances a shareholder may compute and use an average cost basis in determining the gain or loss on the sale or redemption of shares.
Due to recent legislation, the Fund (or its administrative agent) is required to report to the IRS and furnish to Fund shareholders the cost basis information for sale transactions of shares purchased on or after January 1, 2012. Shareholders may elect to have one of several cost basis methods applied to their account when calculating the cost basis of shares sold, including average cost, FIFO ("first-in, first-out"), or some other specific identification method. Unless you instruct otherwise, the Fund will use average cost as its default cost basis method, and will treat sales as first coming from shares purchased prior to January 1, 2012. If average cost is used for the first sale of Fund shares covered by these new rules, the shareholder may only use an alternative cost basis method for shares purchased prospectively. Fund shareholders should consult with their tax advisors to determine the best cost basis method for their tax situation.
Exchanges of Fund shares for shares of another fund, including shares of other Morgan Stanley Funds, are also subject to similar tax treatment. Such an exchange is treated for tax purposes as a sale of the original shares in the Fund, followed by the purchase of shares in the other fund.
The ability to deduct capital losses may be limited. In addition, if a shareholder realizes a loss on the redemption or exchange of a fund's shares and receives securities that are considered substantially
54
identical to that fund's shares or reinvests in that fund's shares or substantially identical shares within 30 days before or after the redemption or exchange, the transactions may be subject to the "wash sale" rules, resulting in a postponement of the recognition of such loss for tax purposes.
X. UNDERWRITERS
The Fund's shares are offered to the public on a continuous basis. The Distributor, as the principal underwriter of the shares, has certain obligations under the Distribution Agreement concerning the distribution of the shares. These obligations and the compensation the Distributor receives are described above in the sections titled "Principal Underwriter" and "Rule 12b-1 Plans."
XI. PERFORMANCE DATA
Average annual returns assuming deduction of maximum sales charge
Period Ended October 31, 2011
| Class | | Inception
Date | | 1 Year | | 5 Years | | 10 Years | | Life of Fund | |
| Class A | | 06/28/99 | | | –12.77 | % | | | –2.95 | % | | | 4.50 | % | | | 1.98 | % | |
| Class B | | 06/28/99 | | | –13.14 | % | | | –3.04 | % | | | 4.41 | %* | | | 1.89 | %* | |
| Class C | | 06/28/99 | | | –9.45 | % | | | –2.65 | % | | | 4.28 | % | | | 1.65 | % | |
| Class I | | 06/28/99 | | | –7.66 | % | | | –1.68 | % | | | 5.31 | % | | | 2.65 | % | |
| Class R | | 03/31/08 | | | –8.10 | % | | | — | | | | — | | | | –5.73 | % | |
| Class W | | 03/31/08 | | | –8.03 | % | | | — | | | | — | | | | –5.60 | % | |
Average annual returns assuming NO deduction of sales charge
Period Ended October 31, 2011
| Class | | Inception
Date | | 1 Year | | 5 Years | | 10 Years | | Life of Fund | |
| Class A | | 06/28/99 | | | –7.95 | % | | | –1.90 | % | | | 5.06 | % | | | 2.42 | % | |
| Class B | | 06/28/99 | | | –8.58 | % | | | –2.66 | % | | | 4.41 | %* | | | 1.89 | %* | |
| Class C | | 06/28/99 | | | –8.54 | % | | | –2.65 | % | | | 4.28 | % | | | 1.65 | % | |
| Class I | | 06/28/99 | | | –7.66 | % | | | –1.68 | % | | | 5.31 | % | | | 2.65 | % | |
| Class R | | 03/31/08 | | | –8.10 | % | | | — | | | | — | | | | –5.73 | % | |
| Class W | | 03/31/08 | | | –8.03 | % | | | — | | | | — | | | | –5.60 | % | |
Aggregate total returns assuming NO deduction of sales charge
Period Ended October 31, 2011
| Class | | Inception
Date | | 1 Year | | 5 Years | | 10 Years | | Life of Fund | |
| Class A | | 06/28/99 | | | –7.95 | % | | | –9.12 | % | | | 63.88 | % | | | 34.30 | % | |
| Class B | | 06/28/99 | | | –8.58 | % | | | –12.61 | % | | | 53.98 | %* | | | 25.96 | %* | |
| Class C | | 06/28/99 | | | –8.54 | % | | | –12.57 | % | | | 52.10 | % | | | 22.32 | % | |
| Class I | | 06/28/99 | | | –7.66 | % | | | –8.12 | % | | | 67.81 | % | | | 38.03 | % | |
| Class R | | 03/31/08 | | | –8.10 | % | | | — | | | | — | | | | –19.08 | % | |
| Class W | | 03/31/08 | | | –8.03 | % | | | — | | | | — | | | | –18.66 | % | |
Average annual after-tax returns assuming deduction of maximum sales charge
Class B
Period Ended October 31, 2011
| Calculation Methodology | | Inception
Date | | 1 Year | | 5 Years | | 10 Years | | Life of Fund | |
| After taxes on distributions | | 06/28/99 | | | –13.10 | % | | | –3.02 | % | | | 4.41 | %* | | | 1.70 | %* | |
| After taxes on distributions and redemptions | | 06/28/99 | | | –8.42 | % | | | –2.44 | % | | | 3.96 | %* | | | 1.60 | %* | |
* Effective April 2005, Class B shares will generally convert to Class A shares approximately eight years after the end of the calendar month in which the shares were purchased. Performance for periods greater than eight years reflects this conversion.
55
XII. FINANCIAL STATEMENTS
The Fund's audited financial statements for the fiscal year ended October 31, 2011, including notes thereto, and the report of Ernst & Young LLP, an independent registered public accounting firm, are herein incorporated by reference to the Fund's Annual Report to Shareholders. A copy of the Fund's Annual Report to Shareholders must accompany the delivery of this SAI.
On June 7, 2011, Deloitte & Touche LLP was dismissed as the independent registered public accounting firm of the Fund. The Fund, with the approval of its Board of Trustees and its Audit Committee, engaged Ernst & Young LLP as its new independent registered public accounting firm as of June 7, 2011.
XIII. FUND COUNSEL
Dechert LLP, located at 1095 Avenue of the Americas, New York, NY 10036, acts as the Fund's legal counsel.
This SAI and the Prospectus do not contain all of the information set forth in the Registration Statement the Fund has filed with the SEC. The complete Registration Statement may be obtained from the SEC.
56
MORGAN STANLEY INVESTMENT MANAGEMENT
PROXY VOTING POLICY AND PROCEDURES
I. POLICY STATEMENT
Morgan Stanley Investment Management's ("MSIM") policy and procedures for voting proxies ("Policy") with respect to securities held in the accounts of clients applies to those MSIM entities that provide discretionary investment management services and for which an MSIM entity has authority to vote proxies. This Policy is reviewed and updated as necessary to address new and evolving proxy voting issues and standards.
The MSIM entities covered by this Policy currently include the following: Morgan Stanley AIP GP LP, Morgan Stanley Investment Management Inc., Morgan Stanley Investment Management Limited, Morgan Stanley Investment Management Company, Morgan Stanley Asset & Investment Trust Management Co., Limited, Morgan Stanley Investment Management Private Limited and Private Investment Partners Inc. (each an "MSIM Affiliate" and collectively referred to as the "MSIM Affiliates" or as "we" below).
Each MSIM Affiliate will use its best efforts to vote proxies as part of its authority to manage, acquire and dispose of account assets. With respect to the MSIM registered management investment companies (the "MSIM Funds"), each MSIM Affiliate will vote proxies under this Policy pursuant to authority granted under its applicable investment advisory agreement or, in the absence of such authority, as authorized by the Board of Directors/Trustees of the MSIM Funds. A MSIM Affiliate will not vote proxies unless the investment management or investment advisory agreement explicitly authorizes the MSIM Affiliate to vote proxies. MSIM Affiliates will vote proxies in a prudent and diligent manner and in the best interests of clients, including beneficiaries of and participants in a client's benefit plan(s) for which the MSIM Affiliates manage assets, consistent with the objective of maximizing long-term investment returns ("Client Proxy Standard"). In certain situations, a client or its fiduciary may provide an MSIM Affiliate with a proxy voting policy. In these situations, the MSIM Affiliate will comply with the client's policy.
Proxy Research Services — ISS Governance Services ("ISS") and Glass Lewis (together with other proxy research providers as we may retain from time to time, the "Research Providers") are independent advisers that specialize in providing a variety of fiduciary-level proxy-related services to institutional investment managers, plan sponsors, custodians, consultants, and other institutional investors. The services provided include in-depth research, global issuer analysis, and voting recommendations. While we may review and utilize the recommendations of one or more Research Providers in making proxy voting decisions, we are in no way obligated to follow such recommendations. In addition to research, ISS provides vote execution, reporting, and recordkeeping services.
Voting Proxies for Certain Non-U.S. Companies — Voting proxies of companies located in some jurisdictions may involve several problems that can restrict or prevent the ability to vote such proxies or entail significant costs. These problems include, but are not limited to: (i) proxy statements and ballots being written in a language other than English; (ii) untimely and/or inadequate notice of shareholder meetings; (iii) restrictions on the ability of holders outside the issuer's jurisdiction of organization to exercise votes; (iv) requirements to vote proxies in person; (v) the imposition of restrictions on the sale of the securities for a period of time in proximity to the shareholder meeting; and (vi) requirements to provide local agents with power of attorney to facilitate our voting instructions. As a result, we vote clients' non-U.S. proxies on a best efforts basis only, after weighing the costs and benefits of voting such proxies, consistent with the Client Proxy Standard. ISS has been retained to provide assistance in connection with voting non-U.S. proxies.
II. GENERAL PROXY VOTING GUIDELINES
To promotes consistency in voting proxies on behalf of its clients, we follow this Policy (subject to any exception set forth herein). The Policy addresses a broad range of issues, and provides general voting parameters on proposals that arise most frequently. However, details of specific proposals vary, and those details affect particular voting decisions, as do factors specific to a given company. Pursuant to the procedures set forth herein, we may vote in a manner that is not in accordance with the following
A-1
general guidelines, provided the vote is approved by the Proxy Review Committee (see Section III for description) and is consistent with the Client Proxy Standard. Morgan Stanley AIP GP LP will follow the procedures as described in Appendix A.
We endeavor to integrate governance and proxy voting policy with investment goals, using the vote to encourage portfolio companies to enhance long-term shareholder value and to provide a high standard of transparency such that equity markets can value corporate assets appropriately.
We seek to follow the Client Proxy Standard for each client. At times, this may result in split votes, for example when different clients have varying economic interests in the outcome of a particular voting matter (such as a case in which varied ownership interests in two companies involved in a merger result in different stakes in the outcome). We also may split votes at times based on differing views of portfolio managers.
We may abstain on matters for which disclosure is inadequate.
A. Routine Matters.
We generally support routine management proposals. The following are examples of routine management proposals:
• Approval of financial statements and auditor reports if delivered with an unqualified auditor's opinion.
• General updating/corrective amendments to the charter, articles of association or bylaws, unless we believe that such amendments would diminish shareholder rights.
• Most proposals related to the conduct of the annual meeting, with the following exceptions. We generally oppose proposals that relate to "the transaction of such other business which may come before the meeting," and open-ended requests for adjournment. However, where management specifically states the reason for requesting an adjournment and the requested adjournment would facilitate passage of a proposal that would otherwise be supported under this Policy (i.e. an uncontested corporate transaction), the adjournment request will be supported.
We generally support shareholder proposals advocating confidential voting procedures and independent tabulation of voting results.
B. Board of Directors.
1. Election of directors: Votes on board nominees can involve balancing a variety of considerations. In vote decisions, we may take into consideration whether the company has a majority voting policy in place that we believe makes the director vote more meaningful. In the absence of a proxy contest, we generally support the board's nominees for director except as follows:
a. We consider withholding support from or voting against a nominee if we believe a direct conflict exists between the interests of the nominee and the public shareholders, including failure to meet fiduciary standards of care and/or loyalty. We may oppose directors where we conclude that actions of directors are unlawful, unethical or negligent. We consider opposing individual board members or an entire slate if we believe the board is entrenched and/or dealing inadequately with performance problems; if we believe the board is acting with insufficient independence between the board and management; or if we believe the board has not been sufficiently forthcoming with information on key governance or other material matters.
b. We consider witholding support from or voting against interested directors if the company's board does not meet market standards for director independence, or if otherwise we believe board independence is insufficient. We refer to prevalent market standards as promulgated by a stock exchange or other authority within a given market (e.g., New York Stock Exchange or Nasdaq rules for most U.S. companies, and The Combined Code on Corporate Governance in the United Kingdom). Thus, for an NYSE company with no controlling shareholder, we would expect that at a minimum a majority of directors should be independent as defined by NYSE. Where we view market standards as inadequate, we may withhold votes based on
A-2
stronger independence standards. Market standards notwithstanding, we generally do not view long board tenure alone as a basis to classify a director as non-independent.
i. At a company with a shareholder or group that controls the company by virtue of a majority economic interest in the company, we have a reduced expectation for board independence, although we believe the presence of independent directors can be helpful, particularly in staffing the audit committee, and at times we may withhold support from or vote against a nominee on the view the board or its committees are not sufficiently independent. In markets where board independence is not the norm (e.g. Japan), however, we consider factors including whether a board of a controlled company includes independent members who can be expected to look out for interests of minority holders.
ii. We consider withholding support from or voting against a nominee if he or she is affiliated with a major shareholder that has representation on a board disproportionate to its economic interest.
c. Depending on market standards, we consider withholding support from or voting against a nominee who is interested and who is standing for election as a member of the company's compensation/renumeration, nominating/governance or audit committee.
d. We consider withholding support or voting against nominees if the term for which they are nominated is excessive. We consider this issue on a market-specific basis.
e. We consider withholding support from or voting against nominees if, in our view, there has been insufficient board renewal (turnover0, particularly in the context of extended poor company performance.
f. We consider withholding support from or voting against a nominee standing for election if the board has not taken action to implement generally accepted governance practices for which there is a "bright line" test. For example, in the context of the U.S. market, failure to eliminate a dead hand or slow hand poison pill would be seen as a basis for opposing one or more incumbent nominees.
g. In markets that encourage designated audit committee financial experts, we consider voting against members of an audit committee if no members are designated as such. We also may not support the audit committee members if the company has faced financial reporting issues and/or does not put the auditor up for ratification by shareholders.
h. We believe investors should have the ability to vote on individual nominees, and may abstain or vote against a slate of nominees where we are not given the opportunity to vote on individual nominees.
i. We consider withholding support from or voting against a nominee who has failed to attend at least 75% of the nominee's board and board committee meetings within a given year without a reasonable excuse. We also consider opposing nominees if the company does not meet market standards for disclosure on attendance.
j. We consider withholding support from or voting against a nominee who appears overcommitted, particularly through service on an excessive number of boards. Market expectations are incorporated into this analysis; for U.S. boards, we generally oppose election of a nominee who serves on more than six public company boards (excluding investment companies), although we may reference National Association of Corporate Directors guidance suggesting that public company CEOs, for example, should serve no more than two outside boards given the level of time commitment required in their primary job.
2. Discharge of directors' duties: In markets where an annual discharge of directors' responsibility is a routine agenda item, we generally support such discharge. However, we may vote against discharge or abstain from voting where there are serious findings of fraud or other unethical behavior for which the individual bears responsibility. The annual discharge of responsibility represents shareholder approval of disclosed actions taken by the board during the year and may make future shareholder action against the board difficult to pursue.
A-3
3. Board independence: We generally support U.S. shareholder proposals requiring that a certain percentage (up to 66 2/3%) of the company's board members be independent directors, and promoting all-independent audit, compensation and nominating/governance committees.
4. Board diversity: We consider on a case-by-case basis shareholder proposals urging diversity of board membership with respect to social, religious or ethnic group.
5. Majority voting: We generally support proposals requesting or requiring majority voting policies in election of directors, so long as there is a carve-out for plurality voting in the case of contested elections.
6. Proxy access: We consider on a case-by-case basis shareholder proposals on particular procedures for inclusion of shareholder nominees in company proxy statements.
7. Reimbursement for dissident nominees: We generally support well-crafted U.S. shareholder proposals that would provide for reimbursement of dissident nominees elected to a board, as the cost to shareholders in electing such nominees can be factored into the voting decision on those nominees.
8. Proposals to elect directors more frequently: In the U.S. public company context, we usually support shareholder and management proposals to elect all directors annually (to "declassify" the board), although we make an exception to this policy where we believe that long-term shareholder value may be harmed by this change given particular circumstances at the company at the time of the vote on such proposal. As indicated above, outside the U.S., we generally support greater accountability to shareholders that comes through more frequent director elections, but recognize that many markets embrace longer term lengths, sometimes for valid reasons given other aspects of the legal context in electing boards.
9. Cumulative voting: We generally support proposals to eliminate cumulative voting in the U.S. market context. (Cumulative voting provides that shareholders may concentrate their votes for one or a handful of candidates, a system that can enable a minority bloc to place representation on a board.) U.S. proposals to establish cumulative voting in the election of directors generally will not be supported.
10. Separation of Chairman and CEO positions: We vote on shareholder proposals to separate the Chairman and CEO positions and/or to appoint an independent Chairman based in part on prevailing practice in particular markets, since the context for such a practice varies. In many non-U.S. markets, we view separation of the roles as a market standard practice, and support division of the roles in that context. In the U.S., we consider such proposals on a case-by-case basis, considering, among other things, the existing board leadership structure, company performance, and any other evidence of entrenchment or perceived risk that power is overly concentrated in a single individual.
11. Director retirement age and term limits: Proposals setting or recommending director retirement ages or director term limits are voted on a case-by-case basis that includes consideration of company performance, the rate of board renewal, evidence of effective individual director evaluation processes, and any indications of entrenchment.
12. Proposals to limit directors' liability and/or broaden indemnification of officers and directors. Generally, we will support such proposals provided that an individual is eligible only if he or she has not acted in bad faith, with gross negligence or with reckless disregard of their duties.
C. Statutory auditor boards.
The statutory auditor board, which is separate from the main board of directors, plays a role in corporate governance in several markets. These boards are elected by shareholders to provide assurance on compliance with legal and accounting standards and the company's articles of association. We generally vote for statutory auditor nominees if they meet independence standards. In markets that require disclosure on attendance by internal statutory auditors, however, we consider voting against nominees for these
A-4
positions who failed to attend at least 75% of meetings in the previous year. We also consider opposing nominees if the company does not meet market standards for disclosure on attendance.
D. Corporate transactions and proxy fights.
We examine proposals relating to mergers, acquisitions and other special corporate transactions (i.e., takeovers, spin-offs, sales of assets, reorganizations, restructurings and recapitalizations) on a case-by-case basis in the interests of each fund or other account. Proposals for mergers or other significant transactions that are friendly and approved by the Research Providers usually are supported if there is no portfolio manager objection. We also analyze proxy contests on a case-by-case basis.
E. Changes in capital structure.
1. We generally support the following:
• Management and shareholder proposals aimed at eliminating unequal voting rights, assuming fair economic treatment of classes of shares we hold.
• U.S. management proposals to increase the authorization of existing classes of common stock (or securities convertible into common stock) if: (i) a clear business purpose is stated that we can support and the number of shares requested is reasonable in relation to the purpose for which authorization is requested; and/or (ii) the authorization does not exceed 100% of shares currently authorized and at least 30% of the total new authorization will be outstanding. (We consider proposals that do not meet these criteria on a case-by-case basis.)
• U.S. management proposals to create a new class of preferred stock or for issuances of preferred stock up to 50% of issued capital, unless we have concerns about use of the authority for anti-takeover purposes.
• Proposals in non-U.S. markets that in our view appropriately limit potential dilution of existing shareholders. A major consideration is whether existing shareholders would have preemptive rights for any issuance under a proposal for standing share issuance authority. We generally consider market-specific guidance in making these decisions; for example, in the U.K. market, we usually follow Association of British Insurers' ("ABI") guidance, although company-specific factors may be considered and for example, may sometimes lead us to voting against share authorization proposals even if they meet ABI guidance.
• Management proposals to authorize share repurchase plans, except in some cases in which we believe there are insufficient protections against use of an authorization for anti-takeover purposes.
• Management proposals to reduce the number of authorized shares of common or preferred stock, or to eliminate classes of preferred stock.
• Management proposals to effect stock splits.
• Management proposals to effect reverse stock splits if management proportionately reduces the authorized share amount set forth in the corporate charter. Reverse stock splits that do not adjust proportionately to the authorized share amount generally will be approved if the resulting increase in authorized shares coincides with the proxy guidelines set forth above for common stock increases.
• Management dividend payout proposals, except where we perceive company payouts to shareholders as inadequate.
2. We generally oppose the following (notwithstanding management support):
• Proposals to add classes of stock that would substantially dilute the voting interests of existing shareholders.
• Proposals to increase the authorized or issued number of shares of existing classes of stock that are unreasonably dilutive, particularly if there are no preemptive rights for existing shareholders.
A-5
However, depending on market practices, we consider voting for proposals giving general authorization for issuance of shares not subject to pre-emptive rights if the authority is limited.
• Proposals that authorize share issuance at a discount to market rates, except where authority for such issuance is de minimis, or if there is a special situation that we believe justifies such authorization (as may be the case, for example, at a company under severe stress and risk of bankruptcy).
• Proposals relating to changes in capitalization by 100% or more.
We consider on a case-by-case basis shareholder proposals to increase dividend payout ratios, in light of market practice and perceived market weaknesses, as well as individual company payout history and current circumstances. For example, currently we perceive low payouts to shareholders as a concern at some Japanese companies, but may deem a low payout ratio as appropriate for a growth company making good use of its cash, notwithstanding the broader market concern.
F. Takeover Defenses and Shareholder Rights.
1. Shareholder rights plans: We generally support proposals to require shareholder approval or ratification of shareholder rights plans (poison pills). In voting on rights plans or similar takeover defenses, we consider on a case-by-case basis whether the company has demonstrated a need for the defense in the context of promoting long-term share value; whether provisions of the defense are in line with generally accepted governance principles in the market (and specifically the presence of an adequate qualified offer provision that would exempt offers meeting certain conditions from the pill); and the specific context if the proposal is made in the midst of a takeover bid or contest for control.
2. Supermajority voting requirements: We generally oppose requirements for supermajority votes to amend the charter or bylaws, unless the provisions protect minority shareholders where there is a large shareholder. In line with this view, in the absence of a large shareholder we support reasonable shareholder proposals to limit such supermajority voting requirements.
3. Shareholder rights to call meetings: We consider proposals to enhance shareholder rights to call meetings on a case-by-case basis. At large-cap U.S. companies, we generally support efforts to establish the rights of holders of 10% or more of shares to call special meetings, unless the board or state law has a set policy or law establishing such rights at a threshold that we believe to be acceptable.
4. Written consent rights: In the U.S. context, we examine proposals for shareholder written consent rights on a case-by-case basis.
5. Reincorporation: We consider management and shareholder proposals to reincorporate to a different jurisdiction on a case-by-case basis. We oppose such proposals if we believe the main purpose is to take advantage of laws or judicial precedents that reduce shareholder rights.
6. Anti-greenmail provisions: Proposals relating to the adoption of anti-greenmail provisions will be supported, provided that the proposal: (i) defines greenmail; (ii) prohibits buyback offers to large block holders (holders of at least 1% of the outstanding shares and in certain cases, a greater amount) not made to all shareholders or not approved by disinterested shareholders; and (iii) contains no anti-takeover measures or other provisions restricting the rights of shareholders.
7. Bundled proposals: We may consider opposing or abstaining on proposals if disparate issues are "bundled" and presented for a single vote.
G. Auditors.
We generally support management proposals for selection or ratification of independent auditors. However, we may consider opposing such proposals with reference to incumbent audit firms if the company has suffered from serious accounting irregularities and we believe rotation of the audit firm is appropriate, or if fees paid to the auditor for non-audit-related services are excessive. Generally, to determine if non-audit fees are excessive, a 50% test will be applied (i.e., non-audit-related fees should be
A-6
less than 50% of the total fees paid to the auditor). We generally vote against proposals to indemnify auditors.
H. Executive and Director Remuneration.
1. We generally support the following:
• Proposals for employee equity compensation plans and other employee ownership plans, provided that our research does not indicate that approval of the plan would be against shareholder interest. Such approval may be against shareholder interest if it authorizes excessive dilution and shareholder cost, particularly in the context of high usage ("run rate") of equity compensation in the recent past; or if there are objectionable plan design and provision.
• Proposals relating to fees to outside directors, provided the amounts are not excessive relative to other companies in the country or industry, and provided that the structure is appropriate within the market context. While stock-based compensation to outside directors is positive if moderate and appropriately structured, we are wary of significant stock option awards or other performance-based awards for outside directors, as well as provisions that could result in significant forfeiture of value on a director's decision to resign from a board (such forfeiture can undercut director independence).
• Proposals for employee stock purchase plans that permit discounts, but only for grants that are part of a broad-based employee plan, including all non-executive employees, and only if the discounts are limited to a reasonable market standard or less.
• Proposals for the establishment of employee retirement and severance plans, provided that our research does not indicate that approval of the plan would be against shareholder interest.
2. We generally oppose retirement plans and bonuses for non-executive directors and independent statutory auditors.
3. In the U.S. context, shareholder proposals requiring shareholder approval of all severance agreements will not be supported, but proposals that require shareholder approval for agreements in excess of three times the annual compensation (salary and bonus) generally will be supported. We generally oppose shareholder proposals that would establish arbitrary caps on pay. We consider on a case-by-case basis shareholder proposals that seek to limit Supplemental Executive Retirement Plans (SERPs), but support such proposals where we consider SERPs to be excessive.
4. Shareholder proposals advocating stronger and/or particular pay-for-performance models will be evaluated on a case-by-case basis, with consideration of the merits of the individual proposal within the context of the particular company and its labor markets, and the company's current and past practices. While we generally support emphasis on long-term components of senior executive pay and strong linkage of pay to performance, we consider factors including whether a proposal may be overly prescriptive, and the impact of the proposal, if implemented as written, on recruitment and retention.
5. We generally support proposals advocating reasonable senior executive and director stock ownership guidelines and holding requirements for shares gained in executive equity compensation programs
6. We generally support shareholder proposals for reasonable "claw-back" provisions that provide for company recovery of senior executive bonuses to the extent they were based on achieving financial benchmarks that were not actually met in light of subsequent restatements.
7. Management proposals effectively to re-price stock options are considered on a case-by-case basis. Considerations include the company's reasons and justifications for a re-pricing, the company's competitive position, whether senior executives and outside directors are excluded, potential cost to shareholders, whether the re-pricing or share exchange is on a value-for-value basis, and whether vesting requirements are extended.
A-7
8. Say-on-Pay: We consider proposals relating to an advisory vote on remuneration on a case-by-case basis. Considerations include a review of the relationship between executive remuneration and performance based on operating trends and total shareholder return over multiple performance periods. In addition, we review remuneration structures and potential poor pay practices, including relative magnitude of pay, discretionary bonus awards, tax gross ups, change-in-control features, internal pay equity and peer group construction. As long-term investors, we support remuneration policies that align with long-term shareholder returns.
I. Social, Political and Environmental Issues.
Shareholders in the U.S. and certain other markets submit proposals encouraging changes in company disclosure and practices related to particular corporate, social, political and environmental matters. We consider how to vote on the proposals on a case-by-case basis to determine likely impacts on shareholder value. We seek to balance concerns on reputational and other risks that lie behind a proposal against costs of implementation, while considering appropriate shareholder and management prerogatives. We may abstain from voting on proposals that do not have a readily determinable financial impact on shareholder value. We support proposals that, if implemented, would enhance useful disclosure, but we generally vote against proposals requesting reports that we believe are duplicative, related to matters not material to the business, or that would impose unnecessary or excessive costs. We believe that certain social and environmental shareholder proposals may intrude excessively on management prerogatives, which can lead us to oppose them.
J. Fund of Funds.
Certain Funds advised by an MSIM Affiliate invest only in other MSIM Funds. If an underlying fund has a shareholder meeting, in order to avoid any potential conflict of interest, such proposals will be voted in the same proportion as the votes of the other shareholders of the underlying fund, unless otherwise determined by the Proxy Review Committee.
III. ADMINISTRATION OF POLICY
The MSIM Proxy Review Committee (the "Committee") has overall responsibility for the Policy. The Committee, which is appointed by MSIM's Long-Only Executive Committee, consists of investment professionals who represent the different investment disciplines and geographic locations of the firm, and is chaired by the director of the Corporate Governance Team ("CGT"). Because proxy voting is an investment responsibility and impacts shareholder value, and because of their knowledge of companies and markets, portfolio managers and other members of investment staff play a key role in proxy voting, although the Committee has final authority over proxy votes.
The CGT Director is responsible for identifying issues that require Committee deliberation or ratification. The CGT, working with advice of investment teams and the Committee, is responsible for voting on routine items and on matters that can be addressed in line with these Policy guidelines. The CGT has responsibility for voting case-by-case where guidelines and precedent provide adequate guidance.
The Committee will periodically review and have the authority to amend, as necessary, the Policy and establish and direct voting positions consistent with the Client Proxy Standard.
CGT and members of the Committee may take into account Research Providers' recommendations and research as well as any other relevant information they may request or receive, including portfolio manager and/or analyst comments and research, as applicable. Generally, proxies related to securities held in accounts that are managed pursuant to quantitative, index or index-like strategies ("Index Strategies") will be voted in the same manner as those held in actively managed accounts, unless economic interests of the accounts differ. Because accounts managed using Index Strategies are passively managed accounts, research from portfolio managers and/or analysts related to securities held in these accounts may not be available. If the affected securities are held only in accounts that are managed pursuant to Index Strategies, and the proxy relates to a matter that is not described in this Policy, the CGT will consider all available information from the Research Providers, and to the extent that the holdings are significant, from the portfolio managers and/or analysts.
A-8
A. Committee Procedures
The Committee meets at least quarterly and reviews and considers changes to the Policy at least annually. Through meetings and/or written communications, the Committee is responsible for monitoring and ratifying "split votes" (i.e., allowing certain shares of the same issuer that are the subject of the same proxy solicitation and held by one or more MSIM portfolios to be voted differently than other shares) and/or "override voting" (i.e., voting all MSIM portfolio shares in a manner contrary to the Policy). The Committee will review developing issues and approve upcoming votes, as appropriate, for matters as requested by CGT.
The Committee reserves the right to review voting decisions at any time and to make voting decisions as necessary to ensure the independence and integrity of the votes.
B. Material Conflicts of Interest
In addition to the procedures discussed above, if the CGT Director determines that an issue raises a material conflict of interest, the CGT Director may request a special committee to review, and recommend a course of action with respect to, the conflict(s) in question ("Special Committee").
A potential material conflict of interest could exist in the following situations, among others:
1. The issuer soliciting the vote is a client of MSIM or an affiliate of MSIM and the vote is on a matter that materially affects the issuer.
2. The proxy relates to Morgan Stanley common stock or any other security issued by Morgan Stanley or its affiliates except if echo voting is used, as with MSIM Funds, as described herein.
3. Morgan Stanley has a material pecuniary interest in the matter submitted for a vote (e.g., acting as a financial advisor to a party to a merger or acquisition for which Morgan Stanley will be paid a success fee if completed).
If the CGT Director determines that an issue raises a potential material conflict of interest, depending on the facts and circumstances, the issue will be addressed as follows:
1. If the matter relates to a topic that is discussed in this Policy, the proposal will be voted as per the Policy.
2. If the matter is not discussed in this Policy or the Policy indicates that the issue is to be decided case-by-case, the proposal will be voted in a manner consistent with the Research Providers, provided that all the Research Providers consulted have the same recommendation, no portfolio manager objects to that vote, and the vote is consistent with MSIM's Client Proxy Standard.
3. If the Research Providers' recommendations differ, the CGT Director will refer the matter to a Special Committee to vote on the proposal, as appropriate.
Any Special Committee shall be comprised of the CGT Director and at least two portfolio managers (preferably members of the Committee) as approved by the Committee. The CGT Director may request non-voting participation by MSIM's General Counsel or his/her designee and the Chief Compliance Officer or his/her designee. In addition to the research provided by Research Providers, the Special Committee may request analysis from MSIM Affiliate investment professionals and outside sources to the extent it deems appropriate.
C. Proxy Voting Reporting
The CGT will document in writing all Committee and Special Committee decisions and actions, which documentation will be maintained by the CGT for a period of at least six years. To the extent these decisions relate to a security held by an MSIM Fund, the CGT will report the decisions to each applicable Board of Trustees/Directors of those Funds at each Board's next regularly scheduled Board meeting. The report will contain information concerning decisions made during the most recently ended calendar quarter immediately preceding the Board meeting.
A-9
MSIM will promptly provide a copy of this Policy to any client requesting it. MSIM will also, upon client request, promptly provide a report indicating how each proxy was voted with respect to securities held in that client's account.
MSIM's Legal Department is responsible for filing an annual Form N-PX on behalf of each MSIM Fund for which such filing is required, indicating how all proxies were voted with respect to such Fund's holdings.
APPENDIX A
The following procedures apply to accounts managed by Morgan Stanley AIP GP LP and Private Investment Partners Inc. ("AIP").
Generally, AIP will follow the guidelines set forth in Section II of MSIM's Proxy Voting Policy and Procedures. To the extent that such guidelines do not provide specific direction, or AIP determines that consistent with the Client Proxy Standard, the guidelines should not be followed, the Proxy Review Committee has delegated the voting authority to vote securities held by accounts managed by AIP to the Fund of Hedge Funds investment team, the Private Equity Fund of Funds investment team or the Private Equity Real Estate Fund of Funds investment team of AIP. A summary of decisions made by the investment teams will be made available to the Proxy Review Committee for its information at the next scheduled meeting of the Proxy Review Committee.
In certain cases, AIP may determine to abstain from determining (or recommending) how a proxy should be voted (and therefore abstain from voting such proxy or recommending how such proxy should be voted), such as where the expected cost of giving due consideration to the proxy does not justify the potential benefits to the affected account(s) that might result from adopting or rejecting (as the case may be) the measure in question.
Waiver of Voting Rights
For regulatory reasons, AIP may either 1) invest in a class of securities of an underlying fund (the "Fund") that does not provide for voting rights; or 2) waive 100% of its voting rights with respect to the following:
1. Any rights with respect to the removal or replacement of a director, general partner, managing member or other person acting in a similar capacity for or on behalf of the Fund (each individually a "Designated Person," and collectively, the "Designated Persons"), which may include, but are not limited to, voting on the election or removal of a Designated Person in the event of such Designated Person's death, disability, insolvency, bankruptcy, incapacity, or other event requiring a vote of interest holders of the Fund to remove or replace a Designated Person; and
2. Any rights in connection with a determination to renew, dissolve, liquidate, or otherwise terminate or continue the Fund, which may include, but are not limited to, voting on the renewal, dissolution, liquidation, termination or continuance of the Fund upon the occurrence of an event described in the Fund's organizational documents; provided, however, that, if the Fund's organizational documents require the consent of the Fund's general partner or manager, as the case may be, for any such termination or continuation of the Fund to be effective, then AIP may exercise its voting rights with respect to such matter.
Approved by Morgan Stanley Funds Board on September 27-28, 2011
A-10
EVERY SHAREHOLDER’S VOTE IS IMPORTANT
| EASY VOTING OPTIONS: |
| |
| 
| | VOTE ON THE INTERNET |
| Log on to: |
| www.proxy-direct.com |
| Follow the on-screen instructions |
| available 24 hours |
| | | |
| 
| | VOTE BY PHONE |
| Call 1-800-337-3503 |
| Follow the recorded instructions |
| available 24 hours |
| | | |
| 
| | VOTE BY MAIL |
| Vote, sign and date this Proxy Card
and return in the postage-paid
envelope |
| | | |
| 
| | VOTE IN PERSON |
| Attend Shareholder Meeting |
| 522 Fifth Avenue |
| New York NY 10036 |
| on September 27, 2012 |
Please detach at perforation before mailing.
PROXY | | MORGAN STANLEY INTERNATIONAL VALUE EQUITY FUND | | PROXY |
| | JOINT SPECIAL MEETING OF SHAREHOLDERS | | |
| | TO BE HELD ON SEPTEMBER 27, 2012 | | |
This proxy is solicited on behalf of the Board of Trustees of Morgan Stanley International Value Equity Fund.
The undersigned hereby constitutes and appoints Stefanie V. Chang Yu, Mary E. Mullin and Arthur Lev, and each of them, as proxies for the undersigned, with full power of substitution and resubstitution, and hereby authorizes said proxies, and each of them, to represent and vote, as designated on the reverse side, all shares of beneficial interest Morgan Stanley International Value Equity Fund, held of record by the undersigned on July 2, 2012 at the Joint Special Meeting of Shareholders to be held at 522 Fifth Avenue, New York, NY 10036, on September 27, 2012 at 9:00 a.m., New York time, and at any adjournment or postponement thereof. The undersigned hereby revokes any and all proxies with respect to such shares heretofore given by the undersigned.
This proxy card, when properly executed, will be voted in the manner directed herein by the undersigned Shareholder, and, in the discretion of such proxies, upon any and all other matters as may properly come before the meeting or any adjournment or postponement thereof. If no direction is made, this proxy will be voted “FOR” the Proposal.
| VOTE VIA THE INTERNET: www.proxy-direct.com |
| VOTE VIA THE TELEPHONE: 1-800-337-3503 |
| | | |
| Note: Please sign exactly as your name appears on this proxy card. All joint owners should sign. When signing as executor, administrator, attorney, trustee or guardian or as custodian for a minor please sign full title as such. If a corporation, please sign in full corporate name and indicate the signer’s office. If a partner, sign in the partnership name. |
| |
| |
| Signature |
| |
| Signature (if held jointly) |
| |
| Date | ITV_23734_071912 |
| | | | |
EVERY SHAREHOLDER’S VOTE IS IMPORTANT
Important Notice Regarding the Availability of Proxy Materials for the
Joint Special Meeting of Shareholders to Be Held on September 27, 2012.
The Proxy Statement for this meeting is available at: https://www.proxy-direct.com/itv-23734
Please detach at perforation before mailing.
THE BOARD RECOMMENDS THAT YOU CAST YOUR VOTE “FOR” THE PROPOSAL AS DESCRIBED IN THE PROXY STATEMENT/PROSPECTUS.
TO VOTE, MARK BLOCKS BELOW IN BLUE OR BLACK INK AS IN THIS EXAMPLE: 
o To vote in accordance with the Board’s recommendation mark this box. No other vote is necessary. | |
| FOR | AGAINST | ABSTAIN |
1. | To consider and vote upon a proposal to approve the actions and transactions described in that certain Agreement and Plan of Reorganization, dated June 28, 2012, between Morgan Stanley International Value Equity Fund (“International Value Equity”) and Morgan Stanley Institutional Fund, Inc., on behalf of the International Equity Portfolio (“MSIF International Equity”), pursuant to which substantially all of the assets and liabilities of International Value Equity will be transferred to MSIF International Equity in exchange for shares of MSIF International Equity of the Class described in the Joint Proxy Statement and Prospectus and pursuant to which International Value Equity will be liquidated and terminated. | o | o | o |
| | | | |
2. | To act upon such other matters as may properly come before the Meeting. | | | |
PLEASE VOTE, SIGN AND DATE THIS PROXY AND RETURN IT PROMPTLY IN THE ENCLOSED ENVELOPE.
ITV_23734_071912
EVERY SHAREHOLDER’S VOTE IS IMPORTANT
| EASY VOTING OPTIONS: |
| |
| 
| VOTE ON THE INTERNET |
| Log on to: |
| www.proxy-direct.com |
| Follow the on-screen instructions |
| available 24 hours |
| | |
| 
| VOTE BY PHONE |
| Call 1-800-337-3503 |
| Follow the recorded instructions |
| available 24 hours |
| | |
| 
| VOTE BY MAIL |
| Vote, sign and date this Proxy Card |
| and return in the postage-paid |
| envelope |
| | |
| 
| VOTE IN PERSON |
| Attend Shareholder Meeting |
| 522 Fifth Avenue |
| New York NY 10036 |
| on September 27, 2012 |
Please detach at perforation before mailing.
PROXY | | MORGAN STANLEY INTERNATIONAL FUND | | PROXY |
| | JOINT SPECIAL MEETING OF SHAREHOLDERS | | |
| | TO BE HELD ON SEPTEMBER 27, 2012 | | |
This proxy is solicited on behalf of the Board of Trustees of Morgan Stanley International Fund.
The undersigned hereby constitutes and appoints Stefanie V. Chang Yu, Mary E. Mullin and Arthur Lev, and each of them, as proxies for the undersigned, with full power of substitution and resubstitution, and hereby authorizes said proxies, and each of them, to represent and vote, as designated on the reverse side, all shares of beneficial interest of Morgan Stanley International Fund, held of record by the undersigned on July 2, 2012 at the Joint Special Meeting of Shareholders to be held at 522 Fifth Avenue, New York, NY 10036, on September 27, 2012 at 9:00 a.m., New York time, and at any adjournment or postponement thereof. The undersigned hereby revokes any and all proxies with respect to such shares heretofore given by the undersigned.
This proxy card, when properly executed, will be voted in the manner directed herein by the undersigned Shareholder, and, in the discretion of such proxies, upon any and all other matters as may properly come before the meeting or any adjournment or postponement thereof. If no direction is made, this proxy will be voted “FOR” the Proposal.
| VOTE VIA THE INTERNET: www.proxy-direct.com |
| VOTE VIA THE TELEPHONE: 1-800-337-3503 |
| | | |
| Note: Please sign exactly as your name appears on this proxy card. All joint owners should sign. When signing as executor, administrator, attorney, trustee or guardian or as custodian for a minor please sign full title as such. If a corporation, please sign in full corporate name and indicate the signer’s office. If a partner, sign in the partnership name. |
| | | |
| |
| Signature |
| |
| Signature (if held jointly) |
| |
| Date | ITF_23728_071912 |
| | | | |
EVERY SHAREHOLDER’S VOTE IS IMPORTANT
Important Notice Regarding the Availability of Proxy Materials for the
Joint Special Meeting of Shareholders to Be Held on September 27, 2012.
The Proxy Statement for this meeting is available at: https://www.proxy-direct.com/itf-23728
Please detach at perforation before mailing.
THE BOARD RECOMMENDS THAT YOU CAST YOUR VOTE “FOR” THE PROPOSAL AS DESCRIBED IN THE PROXY STATEMENT/PROSPECTUS.
TO VOTE, MARK BLOCKS BELOW IN BLUE OR BLACK INK AS IN THIS EXAMPLE: 
o To vote in accordance with the Board’s recommendation mark this box. No other vote is necessary. | |
| FOR | AGAINST | ABSTAIN |
1. | To consider and vote upon a proposal to approve the actions and transactions described in that certain Agreement and Plan of Reorganization, dated June 28, 2012, between Morgan Stanley International Fund (“International”) and Morgan Stanley Institutional Fund, Inc., on behalf of the Active International Allocation Portfolio (“MSIF Active International”), pursuant to which substantially all of the assets and liabilities of International will be transferred to MSIF Active International in exchange for shares of MSIF Active International of the Class described in the Joint Proxy Statement and Prospectus and pursuant to which International will be liquidated and terminated. | o | o | o |
| | | | |
2. | To act upon such other matters as may properly come before the Meeting. | | | |
PLEASE VOTE, SIGN AND DATE THIS PROXY AND RETURN IT PROMPTLY IN THE ENCLOSED ENVELOPE.
ITF_23728_071912
PART C. OTHER INFORMATION
ITEM 15. INDEMNIFICATION
The response to this item is incorporated herein by reference to Exhibits 1 and 2 under Item 16 below and by reference to Item 30 of the Company’s Post-Effective Amendment No. 107 to its Registration Statement on Form N-1A dated May 23, 2012 (File Nos. 033-23166; 811-05624).
ITEM 16. EXHIBITS
(1) (a) | | Articles of Amendment and Restatement is incorporated herein by reference to Exhibit 1(a) to Post-Effective Amendment No. 26 to the Registration Statement on Form N-1A filed on October 13, 1995. |
| | |
(b) | | Articles Supplementary to Registrant’s Articles of Amendment and Restatement (reclassifying shares) is incorporated herein by reference to Exhibit 1(b) to Post-Effective Amendment No. 30 to the Registration Statement on Form N-1A filed on May 24, 1996. |
| | |
(c) | | Articles Supplementary to Registrant’s Articles of Amendment and Restatement (adding new Technology Portfolio) is incorporated herein by reference to Exhibit 1(c) to Post-Effective Amendment No. 30 to the Registration Statement on Form N-1A filed on May 24, 1996. |
| | |
(d) | | Articles Supplementary to Registrant’s Articles of Amendment and Restatement (adding U.S. Equity Plus Portfolio) is incorporated herein by reference to Exhibit 1(d) to Post-Effective Amendment No. 38 to the Registration Statement on Form N-1A filed on February 27, 1998. |
| | |
(e) | | Articles Supplementary to Registrant’s Articles of Amendment and Restatement (adding European Real Estate and Asian Real Estate Portfolios) is incorporated herein by reference to Exhibit 1(e) to Post-Effective Amendment No. 38 to the Registration Statement on Form N-1A filed on February 27, 1998. |
| | |
(f) | | Articles Supplementary to Registrant’s Articles of Amendment and Restatement (adding Class B shares to the Money Market Portfolio) is incorporated herein by reference to Exhibit 1(f) to Post-Effective Amendment No. 38 to the Registration Statement on Form N-1A filed on February 27, 1998. |
| | |
(g) | | Articles of Amendment to Registrant’s Articles of Amendment and Restatement (Active Country Allocation Portfolio name changed to Active International Portfolio) is incorporated herein by reference to Exhibit (a)(7) to Post-Effective Amendment No. 40 to the Registration Statement on Form N-1A filed on January 27, 1999. |
| | |
(h) | | Articles of Amendment to Registrant’s Articles of Amendment and Restatement (Active International Portfolio name changed to Active International Allocation Portfolio) is incorporated herein by reference to Exhibit (a)(8) to Post-Effective Amendment No. 40 to the Registration Statement on Form N-1A filed on January 27, 1999. |
| | |
(i) | | Articles of Amendment to Registrant’s Articles of Amendment and Restatement (changing corporate name to Morgan Stanley Dean Witter Institutional Fund, Inc.) is incorporated herein by reference to Exhibit (a)(9) to Post-Effective Amendment No. 40 to the Registration Statement on Form N-1A filed on January 27, 1999. |
| | |
(j) | | Articles of Amendment to Registrant’s Articles of Amendment and Restatement (Aggressive Equity Portfolio name changed to Focus Equity Portfolio and Emerging Growth Portfolio name changed to Small Company Growth Portfolio) is incorporated herein by reference to Exhibit (a)(10) to Post-Effective Amendment No. 43 to the Registration Statement on Form N-1A filed on May 1, 2000. |
(k) | | Articles of Amendment to Registrant’s Articles of Amendment and Restatement (changing corporate name to Morgan Stanley Institutional Fund, Inc., Global Equity Portfolio name changed to Global Value Equity Portfolio, European Equity Portfolio named changed to European Value Equity Portfolio and Japanese Equity Portfolio name changed to Japanese Value Equity Portfolio) is incorporated herein by reference to Exhibit (a)(11) to Post-Effective Amendment No. 45 to the Registration Statement on Form N-1A filed on April 30, 2001. |
| | |
(l) | | Articles of Amendment to the Amended and Restated Articles of Incorporation (Fixed Income Portfolio name changed to Fixed Income III Portfolio, High Yield Portfolio name changed to High Yield II Portfolio and Global Fixed Income Portfolio name changed to Global Fixed Income II Portfolio) dated July 23, 2001 is incorporated herein by reference to Exhibit (a)(12) of Post-Effective Amendment No. 59 to the Registration Statement on Form N-1A filed on April 28, 2006. |
| | |
(m) | | Articles Supplementary to Registrant’s Articles of Amendment and Restatement (adding new Global Franchise Portfolio) is incorporated herein by reference to Exhibit (a)(7) to Post-Effective Amendment No. 48 to the Registration Statement on Form N-1A filed on November 26, 2001. |
| | |
(n) | | Articles Supplementary to Registrant’s Articles of Amendment and Restatement (adding Large Cap Relative Value Portfolio) is incorporated herein by reference to Exhibit (a)(13) to Post-Effective Amendment No. 50 to the Registration Statement on Form N-1A filed on June 6, 2003. |
| | |
(o) | | Certificate of Correction to the Articles Supplementary dated as of March 21, 2005, is incorporated herein by reference to Exhibit (a)(15) of Post-Effective Amendment No. 70 to the Registration Statement on Form N-1A filed on July 18, 2007. |
| | |
(p) | | Certificate of Correction to the Articles Supplementary is incorporated herein by reference to Exhibit (a)(14) to Post-Effective Amendment No. 53 to the Registration Statement on Form N-1A filed on April 29, 2005. |
| | |
(q) | | Certificate of Correction to the Articles Supplementary is incorporated herein by reference to Exhibit (a)(15) to Post-Effective Amendment No. 53 to the Registration Statement on Form N-1A filed on April 29, 2005. |
| | |
(r) | | Articles Supplementary to Registrant’s Articles of Amendment and Restatement (liquidating the Asian Equity, Asian Real Estate, European Value Equity, Japanese Value Equity, Latin American and Technology Portfolios) are incorporated herein by reference to Exhibit (a)(16) to Post-Effective Amendment No. 53 to the Registration Statement on Form N-1A filed on April 29, 2005. |
| | |
(s) | | Articles of Amendment to the Articles of Amendment and Restatement (Large Cap Relative Value Portfolio name changed to Large Cap Value Portfolio and Value Equity Portfolio name changed to Large Cap Relative Value Portfolio) is incorporated by reference to Exhibit (a)(17) to Post-Effective Amendment No. 55 to the Registration Statement on Form N-1A filed on October 7, 2005. |
| | |
(t) | | Articles of Amendment to the Articles of Amendment and Restatement (European Real Estate Portfolio name changed to International Real Estate Portfolio) is incorporated herein by reference to Exhibit (a)(18) to Post-Effective Amendment No. 55 to the Registration Statement on Form N-1A filed on October 7, 2005. |
(u) | | Certificate of Correction to the Articles Supplementary is incorporated herein by reference to Exhibit (a)(19) to Post-Effective Amendment No. 55 to the Registration Statement on Form N-1A filed on October 7, 2005. |
| | |
(v) | | Certificate of Correction to the Articles Supplementary is incorporated herein by reference to Exhibit (a)(20) to Post-Effective Amendment No. 55 to the Registration Statement on Form N-1A filed on October 7, 2005. |
| | |
(w) | | Articles of Amendment to Registrant’s Articles of Amendment and Restatement (changing the name of the Value Equity Portfolio to the Large Cap Relative Value Portfolio and the Equity Growth Portfolio to the U.S. Large Cap Growth Portfolio) is incorporated herein by reference to Exhibit (a)(21) to Post-Effective Amendment No. 55 to the Registration Statement on Form N-1A filed on October 7, 2005. |
| | |
(x) | | Articles Supplementary to Registrant’s Articles of Amendment and Restatement (adding International Growth Equity Portfolio), is incorporated herein by reference to Exhibit (a)(22) to Post-Effective Amendment No. 56 to the Registration Statement on Form N-1A filed on December 20, 2005. |
| | |
(y) | | Articles of Amendment to Registrant’s Articles of Amendment and Restatement (effecting a reverse stock split of the Emerging Markets Debt Portfolio), is incorporated herein by reference to Exhibit (a) (24) of Post-Effective Amendment No. 59 to the Registration Statement on Form N-1A filed on April 28, 2006. |
| | |
(z) | | Articles Supplementary to Registrant’s Articles of Amendment and Restatement (adding Systematic Active Large Cap Core Portfolio, Systematic Active Small Cap Core Portfolio, Systematic Active Small Cap Value Portfolio and Systematic Active Small Cap Growth Portfolio), are incorporated herein by reference to Exhibit (a) (25) of Post-Effective Amendment No. 59 to the Registration Statement on Form N-1A filed on April 28, 2006. |
| | |
(aa) | | Articles Supplementary to Registrant’s Articles of Amendment and Restatement (adding Global Real Estate Portfolio), is incorporated herein by reference to Exhibit (a) (26) of Post-Effective Amendment No. 60 to the Registration Statement on Form N-1A filed on May 3, 2006. |
| | |
(bb) | | Articles Supplementary to Registrant’s Articles of Amendment and Restatement (liquidating the assets of Municipal Money Market Portfolio and Money Market Portfolio), is incorporated herein by reference to Exhibit (a)(28) of Post-Effective Amendment No. 70 to the Registration Statement on Form N-1A filed on July 18, 2007. |
| | |
(cc) | | Certificate of Correction to the Registrant’s Articles of Amendment dated February 6, 2007, is incorporated herein by reference to Exhibit (a)(27) of Post-Effective Amendment No. 65 to the Registration Statement on Form N-1A filed on April 27, 2007. |
| | |
(dd) | | Certificate of Correction to the Registrant’s Articles of Amendment dated February 6, 2007, is incorporated herein by reference to Exhibit (a)(28) of Post-Effective Amendment No. 65 to the Registration Statement on Form N-1A filed on April 27, 2007. |
| | |
(ee) | | Articles of Restatement, dated February 20, 2007, is incorporated herein by reference to Exhibit (a)(29) of Post-Effective Amendment No. 65 to the Registration Statement on Form N-1A filed on April 27, 2007. |
| | |
(ff) | | Articles Supplementary to Registrant’s Articles of Amendment and Restatement (adding Disciplined Large Cap Value Active Extension Portfolio and Systematic Large Cap Core Active Extension Portfolio), dated February 21, 2007, is incorporated herein by reference to Exhibit (a)(30) of Post-Effective Amendment No. 68 to the Registration Statement on Form N-1A filed on May 29, 2007. |
(gg) | | Articles Supplementary to Registrant’s Articles of Amendment and Restatement (adding International Growth Active Extension Portfolio), dated April 25, 2007 is incorporated herein by reference to Exhibit (a)(31) of Post-Effective Amendment No. 69 to the Registration Statement on Form N-1A filed on July 10, 2007. |
| | |
(hh) | | Articles Supplementary to Registrant’s Articles of Amendment and Restatement (adding U.S. Small/Mid Cap Value Portfolio), dated September 26, 2007, is incorporated herein by reference to Exhibit (a)(34) to Post-Effective Amendment No. 71 to the Registration Statement on Form N-1A filed on September 26, 2007. |
| | |
(ii) | | Articles Supplementary to Registrant’s Articles of Amendment and Restatement (adding Class H shares to certain Portfolios), dated December 18, 2007, is incorporated herein by reference to Exhibit (a)(35) to Post-Effective Amendment No. 73 to the Registration Statement on Form N-1A filed on December 20, 2007. |
| | |
(jj) | | Articles of Amendment to Registrant’s Articles of Amendment and Restatement, (redesignating all Portfolios’ Class A and Class B shares as Class I and Class P shares, respectively), dated December 18, 2007, is incorporated herein by reference to Exhibit (a)(36) to Post-Effective Amendment No. 73 to the Registration Statement on Form N-1A filed on December 20, 2007. |
| | |
(kk) | | Articles of Amendment to Registrant’s Articles of Amendment and Restatement (changing the name of the Focus Equity Portfolio to the Focus Growth Portfolio and the U.S. Large Cap Growth Portfolio to the Capital Growth Portfolio), dated April 22, 2008, is incorporated herein by reference to Exhibit (a)(37) to Post-Effective Amendment No. 75 to the Registration Statement on Form N-1A filed on April 28, 2008. |
| | |
(ll) | | Articles Supplementary to Registrant’s Articles of Amendment and Restatement (adding Class L shares to certain Portfolios), is incorporated herein by reference to Exhibit (a)(37) to Post-Effective Amendment No. 76 to the Registration Statement on Form N-1A filed on June 3, 2008. |
| | |
(mm) | | Articles Supplementary to Registrant’s Articles of Amendment and Restatement (liquidating the assets of Systematic Active Large Cap Core, Systematic Active Small Cap Core, Systematic Active Small Cap Growth and Systematic Active Small Cap Value Portfolios), dated June 27, 2008, are incorporated herein by reference to Exhibit (a)(38) to Post-Effective Amendment No. 78 to the Registration Statement on Form N-1A filed on October 17, 2008. |
| | |
(nn) | | Articles Supplementary to Registrant’s Articles of Amendment and Restatement (liquidating the assets of Disciplined Large Cap Value Active Extension and Systematic Large Cap Core Active Extension Portfolios), dated October 13, 2008, are incorporated herein by reference to Exhibit (a)(39) to Post-Effective Amendment No. 78 to the Registration Statement on Form N-1A filed on October 17, 2008. |
| | |
(oo) | | Articles Supplementary to Registrant’s Articles of Amendment and Restatement (with respect to Class P shares of International Small Cap Portfolio), are incorporated herein by reference to Exhibit (a)(40) to Post-Effective Amendment No. 78 to the Registration Statement on Form N-1A filed on October 17, 2008. |
| | |
(pp) | | Articles Supplementary to Registrant’s Articles of Amendment and Restatement (liquidating the assets of International Magnum Portfolio) dated April 16, 2009, are incorporated herein by reference to Exhibit (a)(42) to Post-Effective Amendment No. 79 to the Registration Statement on Form N-1A filed on April 28, 2009. |
(qq) | | Articles Supplementary to Registrant’s Articles of Amendment and Restatement (liquidating the assets of International Growth Active Extension Portfolio), dated January 20, 2010, are incorporated herein by reference to Exhibit (a)(43) to Post-Effective Amendment No. 82 to the Registration Statement on Form N-1A filed on February 23, 2010. |
| | |
(rr) | | Articles Supplementary to Registrant’s Articles of Amendment and Restatement (liquidating the assets of Global Value Equity Portfolio), dated January 20, 2010, are incorporated herein by reference to Exhibit (a)(44) to Post-Effective Amendment No. 82 to the Registration Statement on Form N-1A filed on February 23, 2010. |
| | |
(ss) | | Articles Supplementary to Registrant’s Articles of Amendment and Restatement (adding Advantage, Equity Growth, Global Growth and International Opportunity Portfolios), dated January 20, 2010, are incorporated herein by reference to Exhibit (a)(45) to Post-Effective Amendment No. 82 to the Registration Statement on Form N-1A filed on February 23, 2010. |
| | |
(tt) | | Articles Supplementary to Registrant’s Articles of Amendment and Restatement (liquidating the assets of International Growth Equity, Large Cap Relative Value and U.S. Small/Mid Cap Value Portfolios), dated July 28, 2010, is incorporated herein by reference to Exhibit (a)(46) to Post-Effective Amendment No. 87 to the Registration Statement on Form N-1A filed on August 31, 2010. |
| | |
(uu) | | Articles Supplementary to Registrant’s Articles of Amendment and Restatement (adding Select Global Infrastructure Portfolio), dated July 28, 2010, is incorporated herein by reference to Exhibit (a)(47) to Post-Effective Amendment No. 87 to the Registration Statement on Form N-1A filed on August 31, 2010. |
| | |
(vv) | | Articles of Amendment to Registrant’s Articles of Amendment and Restatement (changing the name of the Equity Growth Portfolio to the Opportunity Portfolio and changing the name of the Global Growth Portfolio to the Global Opportunity Portfolio), dated October 4, 2010, is incorporated herein by reference to Exhibit (a)(48) to Post-Effective Amendment No. 90 to the Registration Statement on Form N-1A filed on October 28, 2010. |
| | |
(ww) | | Articles Supplementary to Registrant’s Articles of Amendment and Restatement (adding Asian Equity, Global Advantage, Global Discovery and International Advantage Portfolios), is incorporated herein by reference to Exhibit (a)(49) to Post-Effective Amendment No. 91 to the Registration Statement on Form N-1A filed on December 14, 2010. |
| | |
(xx) | | Articles of Amendment (renaming the Capital Growth Portfolio), dated April 5, 2011, is incorporated herein by reference to Exhibit (a)(50) to Post-Effective No. 93 to the Registration Statement on Form N-1A filed on April 27, 2011. |
| | |
(yy) | | Articles Supplementary to Registrant’s Articles of Amendment and Restatement (adding Class H and Class L shares to Small Company Growth and U.S. Real Estate Portfolios), is incorporated herein by reference to Exhibit (a)(51) to Post-Effective No. 96 to the Registration Statement on Form N-1A filed on August 22, 2011. |
| | |
(zz) | | Articles Supplementary to Registrant’s Articles of Amendment and Restatement (adding Global Insight and Insight Portfolios), are incorporated by reference to Exhibit (a)(52) to Post-Effective Amendment No. 99 to the Registration Statement on Form N-1A filed on December 9, 2011. |
| | |
(aaa) | | Articles Supplementary to Registrant’s Articles of Amendment and Restatement (adding Class H and Class L shares to Active International Allocation, Emerging Markets, Focus Growth, Global Franchise, Growth, International Equity, International Real Estate and International Small Cap Portfolios), are incorporated by reference to Exhibit (a)(53) to Post-Effective Amendment No. 104 to the Registration Statement on Form N-1A filed on April 27, 2012. |
| | |
(bbb) | | Articles of Amendment to Registrant’s Articles of Amendment and Restatement (changing the name of the Emerging Markets Debt Portfolio to Emerging Markets Domestic Debt Portfolio), are incorporated by reference to Exhibit (a)(54) to Post-Effective Amendment No. 104 to the Registration Statement on Form N-1A filed on April 27, 2012. |
(ccc) | | Articles Supplementary to Registrant’s Articles of Amendment and Restatement (adding Emerging Markets External Debt, Multi-Asset and Total Emerging Markets Portfolios), are incorporated by reference to Exhibit (a)(55) to Post-Effective Amendment No. 107 to the Registration Statement on Form N-1A filed on May 23, 2012. |
| | |
(ddd) | | Articles Supplementary to Registrant’s Articles of Amendment and Restatement (adding Frontier Emerging Markets Portfolio), are incorporated by reference to Exhibit (a)(56) to Post-Effective Amendment No. 109 to the Registration Statement on Form N-1A filed on June 26, 2012. |
| | |
(2) | | Amended and Restated By-Laws, dated June 20, 2007, are incorporated herein by reference to Exhibit (b) to Post-Effective Amendment No. 71 to the Registration Statement on Form N-1A filed on September 26, 2007. |
| | |
(3) | | Not applicable. |
| | |
(4) | | Copy of Agreement and Plan of Reorganization (filed herewith as Exhibit A to the Proxy Statement and Prospectus). |
| | |
(5) (a) | | Specimen Security with respect to Morgan Stanley Institutional Fund, Inc. Class A shares is incorporated herein by reference to Exhibit 1(a) (Amended and Restated Articles of Incorporation), as amended to date to Post-Effective Amendment No. 26 to the Registration Statement filed on October 13, 1995 and is incorporated by reference to Exhibit 2 (Amended and Restated By-Laws), as amended to date to Post-Effective Amendment No. 33 to the Registration Statement filed on February 28, 1997. |
| | |
(b) | | Specimen Security with respect to Morgan Stanley Institutional Fund, Inc. Class B shares is incorporated herein by reference to Exhibit 1(a) (Amended and Restated Articles of Incorporation), as amended to date to Post-Effective Amendment No. 26 to the Registration Statement filed on October 13, 1995 and is incorporated by reference to Exhibit 2 (Amended and Restated By-Laws), as amended to date to Post-Effective Amendment No. 33 to the Registration Statement filed on February 28, 1997. |
| | |
(6) (a) | | Amended and Restated Investment Advisory Agreement between the Registrant and Morgan Stanley Investment Management Inc., is incorporated by reference to Exhibit (d)(1) to Post-Effective Amendment No. 109 to the Registration Statement on Form N-1A filed on June 26, 2012. |
| | |
(b) | | Sub-Advisory Agreement between Morgan Stanley Investment Management Inc. and Morgan Stanley Investment Advisors Inc. (formerly Morgan Stanley Dean Witter Investment Advisors Inc.) (with respect to the Money Market and Municipal Money Market Portfolios) is incorporated herein by reference to Exhibit (d)(6) to Post-Effective Amendment No. 43 to the Registration Statement on Form N-1A filed on May 1, 2000. |
| | |
(c) | | Sub-Advisory Agreement between Morgan Stanley Investment Management Inc. and Morgan Stanley Asset & Investment Trust Management Co., Limited (relating to the Japanese Value Equity Portfolio and International Magnum Portfolio), is incorporated herein by reference to Exhibit (d)(10) to Post-Effective Amendment No. 52 to the Registration Statement on Form N-1A filed on April 30, 2004. |
| | |
(d) | | Amended and Restated Sub-Advisory Agreement between Morgan Stanley Investment Management Inc. and Morgan Stanley Investment Management Limited (relating to the Emerging Markets Portfolio, Global Franchise Portfolio, Global Real Estate Portfolio, International Equity Portfolio, International Real Estate Portfolio, International Small Cap Portfolio and Select Global Infrastructure Portfolio), is incorporated herein by reference to Exhibit (d)(4) to Post-Effective Amendment No. 87 to the Registration Statement on Form N-1A filed on August 31, 2010. |
| | |
(e) | | Amended and Restated Sub-Advisory Agreement between Morgan Stanley Investment Management Inc. and Morgan Stanley Investment Management Company (relating to the Asian Equity Portfolio, Emerging Markets Portfolio, Global Franchise Portfolio, Global Real Estate Portfolio, International Equity Portfolio, International Real Estate Portfolio and Select Global Infrastructure Portfolio), is incorporated herein by reference to Exhibit (d)(5) to Post-Effective Amendment No. 91 to the Registration Statement on Form N-1A filed on December 14, 2010. |
| | |
(7) | | Distribution Agreement, between Registrant and Morgan Stanley Distribution, Inc. is incorporated herein by reference to Exhibit (e)(2) to Post-Effective Amendment No. 53 to the Registration Statement on Form N1-A filed on April 29, 2005. |
(8) | | Not applicable. |
| | |
(9) | | Custody Agreement between Registrant and State Street Bank and Trust Company, is incorporated by reference to Exhibit (g) to Post-Effective Amendment No. 109 to the Registration Statement on Form N-1A filed on June 26, 2012. |
| | |
(10) (a) | | Amended and Restated Shareholder Services Plan under Rule 12b-1 for Class P Shares, is incorporated by reference to Exhibit (m)(1) to Post-Effective Amendment No. 109 to the Registration Statement on Form N-1A filed on June 26, 2012. |
| | |
(b) | | Shareholder Services Plan under Rule 12b-1 for Class H Shares, is incorporated by reference to Exhibit (m)(2) to Post-Effective Amendment No. 109 to the Registration Statement on Form N-1A filed on June 26, 2012. |
| | |
(c) | | Amended and Restated Distribution and Shareholder Services Plan under Rule 12b-1 for Class L Shares, is incorporated by reference to Exhibit (m)(3) to Post-Effective Amendment No. 109 to the Registration Statement on Form N-1A filed on June 26, 2012. |
| | |
(d) | | Amended and Restated Multi-Class 18f-3 Plan, is incorporated by reference to Exhibit (o) to Post-Effective Amendment No. 109 to the Registration Statement on Form N-1A filed on June 26, 2012. |
| | |
(11) (a) | | Opinion and Consent of Dechert LLP, is filed herewith. |
| | |
(b) | | Opinion of Ballard Spahr LLP, is filed herewith. |
| | |
(12) (a) | | Form of Opinion (with respect to International and MSIF Active International) of Dechert LLP (as to tax matters), is filed herewith. |
| | |
(b) | | Form of Opinion (with respect to International Value Equity and MSIF International Equity) of Dechert LLP (as to tax matters), is filed herewith. |
| | |
(13) (a) | | Amended and Restated Administration Agreement between the Registrant and Morgan Stanley Investment Management Inc., dated as of November 1, 2004, is incorporated herein by reference to Exhibit (h)(1) to Post-Effective Amendment No. 52 to the Registration Statement on Form N-1A filed on February 11, 2005. |
| | |
(b) | | Transfer Agency and Service Agreement between the Registrant and Morgan Stanley Services Company Inc., dated June 9, 2008, is incorporated by reference to Exhibit (h)(2) to Post-Effective Amendment No. 109 to the Registration Statement on Form N-1A filed on June 26, 2012. |
| | |
(c) | | Amendment to Transfer Agency and Service Agreement between Registrant and Morgan Stanley Services Company Inc., dated April 23, 2009, is incorporated herein by reference to Exhibit (h)(3) to Post-Effective Amendment No. 93 to the Registration Statement on Form N-1A filed on April 27, 2011. |
| | |
(14) | | Consent of Ernst & Young LLP (with respect to Form N-14), is filed herewith. |
| | |
(15) | | Not applicable. |
| | |
(16) | | Powers of Attorney of Directors, dated May 1, 2012, are incorporated by reference to Exhibit (16) to the Registration Statement on Form N-14 filed on May 24, 2012. |
ITEM 17. UNDERTAKINGS
(1) The undersigned registrant agrees that prior to any public reoffering of the securities registered through the use of a prospectus which is a part of this registration statement on Form N-14 by any person or party who is deemed to be an underwriter within the meaning of Rule 145(c) of the Securities Act, the reoffering prospectus will contain the information called for by the applicable registration form for the reofferings by persons who may be deemed underwriters, in addition to the information called for by the other items of the applicable form.
(2) The undersigned registrant agrees that every prospectus that is filed under paragraph (1) above will be filed as a part of an amendment to this registration statement on Form N-14 and will not be used until the amendment is effective, and that, in determining any liability under the Securities Act, each post-effective amendment shall be deemed to be a new registration statement for the securities offered therein, and the offering of the securities at that time shall be deemed to be the initial bona fide offering of them.
(3) The undersigned registrant undertakes to file a post-effective amendment to this registration statement upon the closing of the Reorganizations described in this registration statement that contains opinions of counsel supporting the tax matters discussed in this registration statement.
SIGNATURES
As required by the Securities Act of 1933, this registration statement has been signed on behalf of the registrant, in the City of New York and State of New York on this 23rd day of July, 2012.
| MORGAN STANLEY INSTITUTIONAL FUND, INC. |
| |
| By: | /s/ Arthur Lev |
| | Arthur Lev |
| | President and Principal Executive Officer |
As required by the Securities Act of 1933, this registration statement has been signed below by the following persons in the capacities and on the dates indicated.
Signatures | | Title | | Date |
(1) Principal Executive Officer | | President and Principal Executive Officer | | |
| | | | |
By: | /s/ Arthur Lev | | | | July 23, 2012 |
| Arthur Lev | | | | |
| | | | |
(2) Principal Financial Officer | | Principal Financial Officer | | |
| | | | |
By: | /s/ Francis J. Smith | | | | July 23, 2012 |
| Francis J. Smith | | | | |
| | | | |
(3) Majority of the Directors | | | | |
| | | | |
INDEPENDENT DIRECTORS | | | | |
Frank L. Bowman | | Michael F. Klein | | |
Michael Bozic | | Michael E. Nugent | | |
Kathleen A. Dennis | | W. Allen Reed | | |
Dr. Manuel H. Johnson | | Fergus Reid | | |
Joseph J. Kearns | | | | |
| | | | |
By: | /s/ Carl Frischling | | | | July 23, 2012 |
| Carl Frischling | | | | |
| Attorney-in-Fact for the Independent Directors | | | | |
| | | | |
INTERESTED DIRECTOR | | | | |
James F. Higgins | | | | |
| | | | |
By: | /s/ Stefanie V. Chang Yu | | | | July 23, 2012 |
| Stefanie V. Chang Yu | | | | |
| Attorney-in-Fact for the Interested Director | | | | |
EXHIBIT INDEX
(11) | (a) | | Opinion and Consent of Dechert LLP. |
| | | |
| (b) | | Opinion of Ballard Spahr LLP. |
| | | |
(12) | (a) | | Form of Opinion (with respect to International and MSIF Active International) of Dechert LLP (as to tax matters). |
| | | |
| (b) | | Form of Opinion (with respect to International Value Equity and MSIF International Equity) of Dechert LLP (as to tax matters). |
| | | |
(14) | | | Consent of Ernst & Young LLP (with respect to Form N-14). |