| | |
| UNITED STATES
SECURITIES AND EXCHANGE COMMISSION |
| | |
| CERTIFIED SHAREHOLDER REPORT OF REGISTERED
MANAGEMENT INVESTMENT COMPANIES
|
| | |
| Investment Company Act file number: | (811-05635) |
| | |
| Exact name of registrant as specified in charter: | Putnam Diversified Income Trust |
| | |
| Address of principal executive offices: | 100 Federal Street, Boston, Massachusetts 02110 |
| | |
| Name and address of agent for service: | Stephen Tate, Vice President
100 Federal Street
Boston, Massachusetts 02110 |
| | |
| Copy to: | Bryan Chegwidden, Esq.
Ropes & Gray LLP
1211 Avenue of the Americas
New York, New York 10036 |
| | |
| Registrant’s telephone number, including area code: | (617) 292-1000 |
| | |
| Date of fiscal year end: | September 30, 2022 |
| | |
| Date of reporting period: | October 1, 2021 – September 30, 2022 |
| | |
|
Item 1. Report to Stockholders: | |
| | |
| The following is a copy of the report transmitted to stockholders pursuant to Rule 30e-1 under the Investment Company Act of 1940: | |
Putnam
Diversified Income
Trust
Annual report
9 | 30 | 22
Message from the Trustees
November 11, 2022
Dear Fellow Shareholder:
Financial markets are reminding us that the journey to long-term returns often involves weathering periods of heightened volatility. This year, stocks and bonds have experienced losses, and U.S. gross domestic product has declined slightly. Persistent inflation has caused the U.S. Federal Reserve to raise interest rates to contain price pressures, an effort that may continue into 2023. At the same time, we are encouraged by recent economic data that suggests inflation rates are improving.
While this challenging environment is a test of patience, you can be confident that Putnam portfolio managers are actively working for you. As the prices of many stocks and bonds move lower, our teams are researching new and attractive investment opportunities for your fund while assessing risks.
We also would like to announce changes to the Board of Trustees. In July 2022, we welcomed Jennifer Williams Murphy and Marie Pillai as new Trustees. Both have a wealth of investment advisory and executive management experience. We also want to thank our Trustees who retired from the Board on June 30, 2022. Paul Joskow served with us since 1997, and Ravi Akhoury joined the Board in 2009. We wish them well.
Thank you for investing with Putnam.


Current performance may be lower or higher than the quoted past performance, which cannot guarantee future results. Share price, principal value, and return will fluctuate, and you may have a gain or a loss when you sell your shares. Performance of class A shares assumes reinvestment of distributions and does not account for taxes. Fund returns in the bar chart do not reflect a sales charge of 4.00%; had they, returns would have been lower. See below and pages 9–11 for additional performance information. For a portion of the periods, the fund had expense limitations, without which returns would have been lower. To obtain the most recent month-end performance, visit putnam.com.
Lipper peer group median is provided by Lipper, a Refinitiv company.
* The fund’s benchmark, the ICE BofA U.S. Treasury Bill Index, was introduced on 6/30/92, which post-dates the inception of the fund.

This comparison shows your fund’s performance in the context of broad market indexes for the 12 months ended 9/30/22. See above and pages 9–11 for additional fund performance information. Index descriptions can be found on page 15.
All Bloomberg indices are provided by Bloomberg Index Services Limited.
|
| 2 Diversified Income Trust |


Mike, what was the fund’s investment environment like during the 12 months ended September 30, 2022?
After a relatively quiet period during the fourth quarter of 2021, the market environment changed dramatically as the new year began, with several headwinds stoking anxiety and volatility. Chief among these was the U.S. Federal Reserve’s accelerated plan to hike interest rates and aggressively reduce its asset portfolio to rein in historically high inflation. In addition, geopolitical unrest rose as Russia invaded Ukraine in February and escalated its attack in the ensuing months.
Within this environment, credit spreads widened and interest rates rose. [Spreads are the yield advantage credit-sensitive bonds offer over comparable-maturity U.S. Treasuries. Bond prices rise as yield spreads tighten and decline as spreads widen.] The yield on the benchmark 10-year U.S. Treasury more than doubled, rising from 1.52% at the beginning of the period to 3.83% at the end. In anticipation of Fed policy changes, short-term yields rose even more, causing the yield curve to flatten and then invert.
|
| Diversified Income Trust 3 |

Credit qualities are shown as a percentage of the fund’s net assets as of 9/30/22. A bond rated BBB or higher (A-3 or higher, for short-term debt) is considered investment grade. This chart reflects the highest security rating provided by one or more of Standard & Poor’s, Moody’s, and Fitch. Ratings and portfolio credit quality will vary over time.
Cash and net other assets, if any, represent the market value weights of cash, derivatives, and short-term securities in the portfolio. The fund itself has not been rated by an independent rating agency. Data in the chart reflect a new calculation methodology put into effect on 6/30/22.

In March, the Fed approved a 0.25% hike in its target for short-term interest rates, its first increase since 2018. The central bank implemented four more increases during 2022, to a range of 3.00% to 3.25% as of September 30. It also signaled an additional 1.25% of hikes this year.
Later in the period, investors took the view that inflation had peaked and markets began to price in the probability of interest-rate cuts in 2023. However, sentiment began to shift following Fed Chair Powell’s comments at the Jackson Hole symposium in August. Risk assets fell once again and U.S. Treasury yields rose across the curve as concern about a potential recession intensified.
From a sector perspective, all fixed income categories except for short-term U.S. Treasury bills posted losses. Government agency securities and securitized categories, such as commercial mortgage-backed bonds and asset-backed securities, as well as floating-rate bank loans held up better than the broad fixed income market. Investment-grade [IG] corporate credit and emerging market [EM] debt were among the weakest performers, given rising interest rates, investor risk aversion, and a strengthening U.S. dollar.
Which holdings and strategies hampered the fund’s performance during the period?
First off, I think it’s important to highlight that the fund continued to invest outside the constraints of traditional fixed income benchmarks, seeking what we view as the best investment opportunities based on risk rather than asset class. These risks include interest rate, credit, prepayment, and liquidity. Despite the fund’s negative return, this emphasis on diversification helped it outpace the broad IG fixed income market, as measured by the Bloomberg U.S. Aggregate Bond Index, during the period.
In terms of specific strategies, our interest-rate and yield curve positioning was the primary detractor this period. The portfolio’s
|
| 4 Diversified Income Trust |
interest-rate sensitivity was greater than that of the benchmark. This strategy weighed on returns as interest rates rose sharply in light of the Fed’s aggressive policy posture.
Additionally, the portfolio was positioned to benefit if inflation declined and real interest rates rose. [Real interest rates adjust for the effects of inflation by subtracting the actual or expected rate of inflation from nominal interest rates.] Rising inflation hurt our strategy, but the portfolio benefited from an increase in real interest rates during the first quarter of 2022. This benefit partially offset the negative results of our broader term structure strategy.
An allocation to high-yield corporate credit was a further detractor, particularly in June when spreads widened substantially. During that month, investors shifted their focus to risks of slowing economic growth and a possible recession as the Fed announced plans for larger interest-rate increases at upcoming policy meetings.
Holdings of EM debt also worked against performance this period. The turmoil resulting from Russia’s invasion of Ukraine hit EM bonds particularly hard early in 2022. Rising bond yields and increasing concern about a recession also pressured the asset class.
What about contributors to the fund’s performance?
Mortgage credit holdings added the most value this period, led by an allocation to commercial mortgage-backed securities [CMBS]. Our investments consisted of cash bonds along with synthetic exposure via CMBX. By way of explanation, CMBX is a group of tradable indexes that each reference a basket of 25 CMBS issued
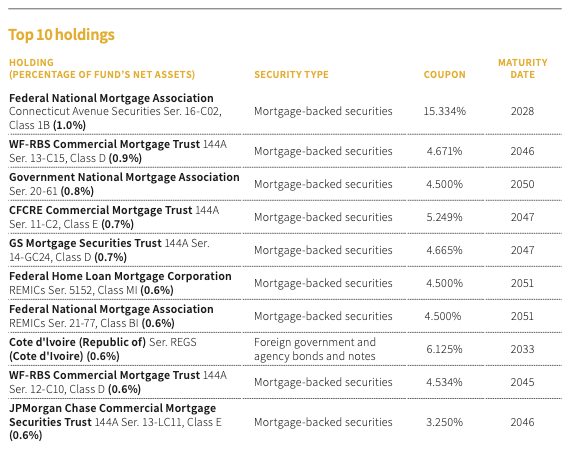
This table shows the fund’s top 10 individual holdings and the percentage of the fund’s net assets that each represented as of 9/30/22. Short-term investments, to-be-announced (TBA) commitments, and derivatives, if any, are excluded. Holdings may vary over time.
|
| Diversified Income Trust 5 |
in a particular year. Despite concerns about the broad economic backdrop, many types of commercial properties continued to recover. Cash flow forecasts continued to improve, boosted by growth in rents and occupancy rates. Favorable supply/demand dynamics also aided CMBS.
Exposure to residential mortgage credit, particularly agency credit risk transfer [CRT] securities, also contributed to the fund’s performance. Agency CRTs benefited from housing-related government policy measures resulting from the pandemic, an exceptionally strong housing market, and optimism about the reopening of the economy.
Active currency positioning provided a further boost to performance. Our strategy included a number of currencies considered to be safe havens, which, historically, have performed well during periods when investors have less appetite for risk. These included the U.S. dollar, Japanese yen, and Swiss franc. During 2022, the U.S. dollar has strengthened against all other major currencies.
What are your current views on the major sectors in which the fund invests?
As we continue through the second half of calendar 2022, we have a more cautious outlook for the high-yield market. Valuations are substantially more attractive than they were at the start of the year, in our view. Corporate fundamentals remain solid overall but will likely weaken in the face of slower growth and margin pressure, in our view. We believe that high inflation, central bank tightening, and the impact of geopolitical developments on energy supplies remain considerable headwinds for both fundamentals and the market’s supply/demand backdrop.
We believe the fundamental environment in the CMBS market will be mixed. While travel, office use, and retail spending have rebounded since the height of the pandemic, we believe current Fed policy will likely result in a recession. Broadly, we think property categories that can effectively pass along higher costs, such as hotels and apartments, will maintain their value. At the same time, we believe property types that have struggled to gain new tenants
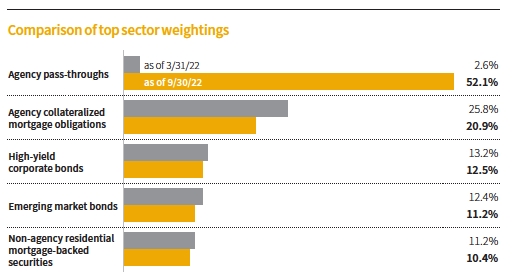
This chart shows how the fund’s top weightings have changed over the past six months. Allocations are shown as a percentage of the fund’s net assets. Current period summary information may differ from the portfolio schedule included in the financial statements due to the inclusion of derivative securities, any interest accruals, the use of different classifications of securities for presentation purposes, and rounding. Holdings and allocations may vary over time.
|
| 6 Diversified Income Trust |

without rent reductions will be exposed to rising capital costs. As a result, we believe they will be pressured to refinance loans to maintain property values. Consistent with risk markets generally, CMBS spreads have widened during 2022. From our perspective, the increased liquidity premium has enhanced the appeal of select market segments.
U.S. home prices soared to record highs during the pandemic. Looking ahead, we expect home prices to experience tepid growth during the next few years due to affordability constraints for many buyers and a gradual increase in housing supply. Within residential mortgage credit, wider spreads have created better value across all credit tiers. As of period-end, we were finding attractive investment opportunities in higher-quality areas of the market, as well as among seasoned collateral that we believe can withstand declining home prices.
We believe many prepayment-sensitive securities offer attractive risk-adjusted returns at current price levels and prepayment speeds. Many of these securities may also offer meaningful upside potential if mortgage prepayment speeds continue to slow, which we believe is likely. We think the fund’s prepayment-related strategies provide an important source of diversification in the portfolio. In light of last year’s repricing of the sector, we are finding what we consider to be compelling investment opportunities across a variety of collateral types.
How did you use derivatives during the period?
We used credit default swaps to gain exposure to CMBS via CMBX, and also to hedge the fund’s credit and market risks. We also used credit
ABOUT DERIVATIVES
Derivatives are an increasingly common type of investment instrument, the performance of which is derived from an underlying security, index, currency, or other area of the capital markets. Derivatives employed by the fund’s managers generally serve one of two main purposes: to implement a strategy that may be difficult or more expensive to invest in through traditional securities, or to hedge unwanted risk associated with a particular position.
For example, the fund’s managers might use currency forward contracts to capitalize on an anticipated change in exchange rates between two currencies. This approach would require a significantly smaller outlay of capital than purchasing traditional bonds denominated in the underlying currencies. In another example, the managers may identify a bond that they believe is undervalued relative to its risk of default, but may seek to reduce the interest-rate risk of that bond by using interest-rate swaps, a derivative through which two parties “swap” payments based on the movement of certain rates. In other examples, the managers may use options and futures contracts to hedge against a variety of risks.
Like any other investment, derivatives may not appreciate in value and may lose money. Derivatives may amplify traditional investment risks through the creation of leverage and may be less liquid than traditional securities. And because derivatives typically represent contractual agreements between two financial institutions, derivatives entail “counterparty risk,” which is the risk that the other party is unable or unwilling to pay. Putnam monitors the counterparty risks we assume. For example, Putnam often enters into collateral agreements that require the counterparties to post collateral on a regular basis to cover their obligations to the fund. Counterparty risk for exchange-traded futures and centrally cleared swaps is mitigated by the daily exchange of margin and other safeguards against default through their respective clearinghouses.
|
| Diversified Income Trust 7 |
default contracts to gain exposure to specific sectors and individual names. We used bond futures and interest-rate swaps to take tactical positions at various points along the yield curve, and to hedge the risk associated with the fund’s curve positioning. We also employed interest-rate swaps to gain exposure to rates in various countries. We utilized options to hedge the fund’s interest-rate risk, to hedge duration and convexity, to isolate the prepayment risk associated with our holdings of collateralized mortgage obligations, and to help manage overall downside risk. We used total return swaps as a hedging tool and to help manage the portfolio’s sector exposure as well as its inflation exposure and risk.
Thanks for your time and for bringing us up to date, Mike.
The views expressed in this report are exclusively those of Putnam Management and are subject to change. They are not meant as investment advice.
Please note that the holdings discussed in this report may not have been held by the fund for the entire period. Portfolio composition is subject to review in accordance with the fund’s investment strategy and may vary in the future. Current and future portfolio holdings are subject to risk.
Of special interest
The fund’s monthly dividend rate for class A shares was increased from $0.019 to $0.022 per share in July 2022 and was raised further to $0.025 per share in October 2022. These adjustments reflect Putnam Management’s earnings expectations in the current fixed income environment. The fund seeks as high a level of current income as Putnam Management believes is consistent with preservation of capital. The portfolio management team will continue to dynamically allocate to the sectors and strategies that they believe offer the best opportunity for total return — through price appreciation, income, or both. Similar increases were made to other share classes.
|
| 8 Diversified Income Trust |
Your fund’s performance
This section shows your fund’s performance, price, and distribution information for periods ended September 30, 2022, the end of its most recent fiscal year. In accordance with regulatory requirements for mutual funds, we also include expense information taken from the fund’s current prospectus. Performance should always be considered in light of a fund’s investment strategy. Data represent past performance. Past performance does not guarantee future results. More recent returns may be less or more than those shown. Investment return and principal value will fluctuate, and you may have a gain or a loss when you sell your shares. Performance information does not reflect any deduction for taxes a shareholder may owe on fund distributions or on the redemption of fund shares. For the most recent month-end performance, please visit the Individual Investors section at putnam.com or call Putnam at 1-800-225-1581. Class M, R, R6, and Y shares are not available to all investors. See the Terms and definitions section in this report for definitions of the share classes offered by your fund.
Annualized fund performance Total return for periods ended 9/30/22
| | | | | |
| | Life of fund | 10 years | 5 years | 3 years | 1 year |
| Class A (10/3/88) | | | | | |
| Before sales charge | 5.18% | 1.72% | –0.47% | –3.58% | –9.29% |
| After sales charge | 5.05 | 1.30 | –1.27 | –4.89 | –12.91 |
| Class B (3/1/93) | | | | | |
| Before CDSC | 4.98 | 1.10 | –1.20 | –4.31 | –9.96 |
| After CDSC | 4.98 | 1.10 | –1.53 | –5.19 | –14.32 |
| Class C (2/1/99) | | | | | |
| Before CDSC | 4.99 | 1.11 | –1.22 | –4.33 | –10.04 |
| After CDSC | 4.99 | 1.11 | –1.22 | –4.33 | –10.91 |
| Class M (12/1/94) | | | | | |
| Before sales charge | 4.90 | 1.48 | –0.70 | –3.81 | –9.39 |
| After sales charge | 4.80 | 1.14 | –1.36 | –4.86 | –12.33 |
| Class R (12/1/03) | | | | | |
| Net asset value | 4.90 | 1.46 | –0.71 | –3.84 | –9.62 |
| Class R6 (11/1/13) | | | | | |
| Net asset value | 5.40 | 2.06 | –0.11 | –3.26 | –8.88 |
| Class Y (7/1/96) | | | | | |
| Net asset value | 5.37 | 1.98 | –0.21 | –3.32 | –9.04 |
Current performance may be lower or higher than the quoted past performance, which cannot guarantee future results. After-sales-charge returns for class A and M shares reflect the deduction of the maximum 4.00% and 3.25% sales charge, respectively, levied at the time of purchase. Class B share returns after contingent deferred sales charge (CDSC) reflect the applicable CDSC, which is 5% in the first year, declining over time to 1% in the sixth year, and is eliminated thereafter. Class C share returns after CDSC reflect a 1% CDSC for the first year that is eliminated thereafter. Class R, R6, and Y shares have no initial sales charge or CDSC. Performance for class B, C, M, R, and Y shares before their inception is derived from the historical performance of class A shares, adjusted for the applicable sales charge (or CDSC) and the higher operating expenses for such shares, except for class Y shares, for which 12b-1 fees are not applicable. Performance for class R6 shares prior to their inception is derived from the historical performance of class Y shares and has not been adjusted for the lower investor servicing fees applicable to class R6 shares; had it, returns would have been higher.
For a portion of the periods, the fund had expense limitations, without which returns would have been lower.
Class B and C share performance reflects conversion to class A shares after eight years.
|
| Diversified Income Trust 9 |
Comparative annualized index returns For periods ended 9/30/22
| | | | | |
| | Life of fund | 10 years | 5 years | 3 years | 1 year |
| ICE BofA U.S. Treasury | | | | | |
| Bill Index | —* | 0.69% | 1.14% | 0.58% | 0.47% |
| Lipper Alternative | | | | | |
| Credit Focus Funds | 5.11% | 1.29 | 0.60 | 0.17 | –9.57 |
| category median† | | | | | |
Index and Lipper results should be compared with fund performance before sales charge, before CDSC, or at net asset value.
Lipper peer group median is provided by Lipper, a Refinitiv company.
* The fund’s benchmark, the ICE BofA U.S. Treasury Bill Index, was introduced on 6/30/92, which post-dates the inception of the fund.
† Over the 1-year, 3-year, 5-year, 10-year, and life-of-fund periods ended 9/30/22, there were 98, 93, 83, 29, and 3 funds, respectively, in this Lipper category.

Past performance does not indicate future results. At the end of the same time period, a $10,000 investment in the fund’s class B and C shares would have been valued at $11,154 and $11,165, respectively, and no contingent deferred sales charges would apply. A $10,000 investment in the fund’s class M shares ($9,675 after sales charge) would have been valued at $11,202. A $10,000 investment in the fund’s class R, R6, and Y shares would have been valued at $11,556, $12,260, and $12,163, respectively.
|
| 10 Diversified Income Trust |
Fund price and distribution information For the 12-month period ended 9/30/22
| | | | | | | | | |
| Distributions | Class A | Class B | Class C | Class M | Class R | Class R6 | Class Y |
| Number | 12 | 12 | 12 | 12 | 12 | 12 | 12 |
| Income | $0.237 | $0.190 | $0.191 | $0.225 | $0.225 | $0.261 | $0.249 |
| Capital gains | — | — | — | — | — | — | — |
| Total | $0.237 | $0.190 | $0.191 | $0.225 | $0.225 | $0.261 | $0.249 |
| | Before | After | Net | Net | Before | After | Net | Net | Net |
| | sales | sales | asset | asset | sales | sales | asset | asset | asset |
| Share value | charge | charge | value | value | charge | charge | value | value | value |
| 9/30/21 | $6.41 | $6.68 | $6.33 | $6.27 | $6.25 | $6.46 | $6.31 | $6.33 | $6.34 |
| 9/30/22 | 5.59 | 5.82 | 5.52 | 5.46 | 5.45 | 5.63 | 5.49 | 5.52 | 5.53 |
| | Before | After | Net | Net | Before | After | Net | Net | Net |
| Current rate | sales | sales | asset | asset | sales | sales | asset | asset | asset |
| (end of period) | charge | charge | value | value | charge | charge | value | value | value |
| Current dividend | | | | | | | | | |
| rate1 | 4.72% | 4.54% | 3.91% | 4.18% | 4.62% | 4.48% | 4.59% | 5.22% | 4.99% |
| Current 30-day | | | | | | | | | |
| SEC yield2 | N/A | 6.02 | 5.48 | 5.48 | N/A | 5.81 | 6.01 | 6.63 | 6.52 |
The classification of distributions, if any, is an estimate. Before-sales-charge share value and current dividend rate for class A and M shares, if applicable, do not take into account any sales charge levied at the time of purchase. After-sales-charge share value, current dividend rate, and current 30-day SEC yield, if applicable, are calculated assuming that the maximum sales charge (4.00% for class A shares and 3.25% for class M shares) was levied at the time of purchase. Final distribution information will appear on your year-end tax forms.
1 Most recent distribution, including any return of capital and excluding capital gains, annualized and divided by share price before or after sales charge at period-end.
2 Based only on investment income and calculated using the maximum offering price for each share class, in accordance with SEC guidelines.
Your fund’s expenses
As a mutual fund investor, you pay ongoing expenses, such as management fees, distribution fees (12b-1 fees), and other expenses. Using the following information, you can estimate how these expenses affect your investment and compare them with the expenses of other funds. You may also pay one-time transaction expenses, including sales charges (loads) and redemption fees, which are not shown in this section and would have resulted in higher total expenses. For more information, see your fund’s prospectus or talk to your financial representative.
Expense ratios
| | | | | | | |
| | Class A | Class B | Class C | Class M | Class R | Class R6 | Class Y |
| Total annual operating expenses for the | | | | | | | |
| fiscal year ended 9/30/21 | 0.97% | 1.72% | 1.72% | 1.22% | 1.22% | 0.63% | 0.72% |
| Annualized expense ratio for the | | | | | | | |
| six-month period ended 9/30/22* | 1.02% | 1.77% | 1.77% | 1.27% | 1.27% | 0.66% | 0.77% |
Fiscal year expense information in this table is taken from the most recent prospectus, is subject to change, and may differ from that shown for the annualized expense ratio and in the financial highlights of this report.
Expenses are shown as a percentage of average net assets.
* Expense ratios for each class are for the fund’s most recent fiscal half year. As a result of this, ratios may differ from expense ratios based on one-year data in the financial highlights.
|
| Diversified Income Trust 11 |
Expenses per $1,000
The following table shows the expenses you would have paid on a $1,000 investment in each class of the fund from 4/1/22 to 9/30/22. It also shows how much a $1,000 investment would be worth at the close of the period, assuming actual returns and expenses.
| | | | | | | |
| | Class A | Class B | Class C | Class M | Class R | Class R6 | Class Y |
| Expenses paid per $1,000*† | $4.97 | $8.61 | $8.61 | $6.19 | $6.18 | $3.22 | $3.76 |
| Ending value (after expenses) | $943.50 | $940.60 | $940.10 | $942.80 | $941.60 | $946.40 | $945.50 |
* Expenses for each share class are calculated using the fund’s annualized expense ratio for each class, which represents the ongoing expenses as a percentage of average net assets for the six months ended 9/30/22. The expense ratio may differ for each share class.
† Expenses are calculated by multiplying the expense ratio by the average account value for the period; then multiplying the result by the number of days in the period (183); and then dividing that result by the number of days in the year (365).
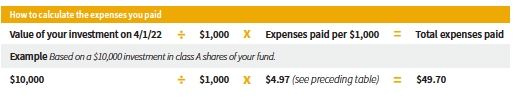
Estimate the expenses you paid
To estimate the ongoing expenses you paid for the six months ended 9/30/22, use the following calculation method. To find the value of your investment on 4/1/22, call Putnam at 1-800-225-1581.
Compare expenses using the SEC’s method
The Securities and Exchange Commission (SEC) has established guidelines to help investors assess fund expenses. Per these guidelines, the following table shows your fund’s expenses based on a $1,000 investment, assuming a hypothetical 5% annualized return. You can use this information to compare the ongoing expenses (but not transaction expenses or total costs) of investing in the fund with those of other funds. All mutual fund shareholder reports will provide this information to help you make this comparison. Please note that you cannot use this information to estimate your actual ending account balance and expenses paid during the period.
| | | | | | | |
| | Class A | Class B | Class C | Class M | Class R | Class R6 | Class Y |
| Expenses paid per $1,000*† | $5.16 | $8.95 | $8.95 | $6.43 | $6.43 | $3.35 | $3.90 |
| Ending value (after expenses) | $1,019.95 | $1,016.19 | $1,016.19 | $1,018.70 | $1,018.70 | $1,021.76 | $1,021.21 |
* Expenses for each share class are calculated using the fund’s annualized expense ratio for each class, which represents the ongoing expenses as a percentage of average net assets for the six months ended 9/30/22. The expense ratio may differ for each share class.
† Expenses are calculated by multiplying the expense ratio by the average account value for the six-month period; then multiplying the result by the number of days in the six-month period (183); and then dividing that result by the number of days in the year (365).
|
| 12 Diversified Income Trust |
Consider these risks before investing
Emerging market securities carry illiquidity and volatility risks. Lower-rated bonds may offer higher yields in return for more risk. Funds that invest in government securities are not guaranteed. Mortgage-backed investments, unlike traditional debt investments, are subject to prepayment risk, which means that they may increase in value less than other bonds when interest rates decline and decline in value more than other bonds when interest rates rise.
The fund’s investments in mortgage-backed securities and asset-backed securities, and in certain other securities and derivatives, may be or become illiquid. The fund’s concentration in an industry group comprising mortgage-backed securities may make the fund’s net asset value more susceptible to economic, market, political, and other developments affecting the housing or real estate markets and the servicing of mortgage loans secured by real estate properties. The fund currently has significant investment exposure to commercial mortgage-backed securities. Bond investments are subject to interest-rate risk (the risk of bond prices falling if interest rates rise) and credit risk (the risk of an issuer defaulting on interest or principal payments). Interest-rate risk is generally greater for longer-term bonds, and credit risk is generally greater for below-investment-grade bonds. Risks associated with derivatives include increased investment exposure (which may be considered leverage) and, in the case of over-the-counter instruments, the potential inability to terminate or sell derivatives positions and the potential failure of the other party to the instrument to meet its obligations. Unlike bonds, funds that invest in bonds have fees and expenses. The value of investments in the fund’s portfolio may fall or fail to rise over time for a variety of reasons, including general economic, political, or financial market conditions; investor sentiment and market perceptions; government actions; geopolitical events or changes; and factors related to a specific issuer, geography, industry, or sector. International investing involves currency, economic, and political risks. These and other factors may lead to increased volatility and reduced liquidity in the fund’s portfolio holdings.
Our investment techniques, analyses, and judgments may not produce the outcome we intend. We, or the fund’s other service providers, may experience disruptions or operating errors that could have a negative effect on the fund. You can lose money by investing in the fund.
|
| Diversified Income Trust 13 |
Terms and definitions
Important terms
Total return shows how the value of the fund’s shares changed over time, assuming you held the shares through the entire period and reinvested all distributions in the fund.
Before sales charge, or net asset value, is the price, or value, of one share of a mutual fund, without a sales charge. Before-sales-charge figures fluctuate with market conditions. They are calculated by dividing the net assets of each class of shares by the number of outstanding shares in the class.
After sales charge is the price of a mutual fund share plus the maximum sales charge levied at the time of purchase. After-sales-charge performance figures shown here assume the 4.00% maximum sales charge for class A shares and 3.25% for class M shares.
Contingent deferred sales charge (CDSC) is generally a charge applied at the time of the redemption of class B or C shares and assumes redemption at the end of the period. Your fund’s class B CDSC declines over time from a 5% maximum during the first year to 1% during the sixth year. After the sixth year, the CDSC no longer applies. The CDSC for class C shares is 1% for one year after purchase.
Share classes
Class A shares are generally subject to an initial sales charge and no CDSC (except on certain redemptions of shares bought without an initial sales charge).
Class B shares are closed to new investments and are only available by exchange from class B shares of another Putnam fund or through dividend and/or capital gains reinvestment. They are not subject to an initial sales charge and may be subject to a CDSC.
Class C shares are not subject to an initial sales charge and are subject to a CDSC only if the shares are redeemed during the first year.
Class M shares have a lower initial sales charge and a higher 12b-1 fee than class A shares and no CDSC. They are only available to individuals purchasing shares of the fund from Japanese distributors that have selling agreements with Putnam Retail Management.
Class R shares are not subject to an initial sales charge or CDSC and are only available to employer-sponsored retirement plans.
Class R6 shares are not subject to an initial sales charge or CDSC and carry no 12b-1 fee. They are generally only available to employer-sponsored retirement plans, corporate and institutional clients, and clients in other approved programs.
Class Y shares are not subject to an initial sales charge or CDSC and carry no 12b-1 fee. They are generally only available to corporate and institutional clients and clients in other approved programs.
Fixed income terms
Current rate is the annual rate of return earned from dividends or interest of an investment. Current rate is expressed as a percentage of the price of a security, fund share, or principal investment.
Mortgage-backed security (MBS), also known as a mortgage “pass-through,” is a type of asset-backed security that is secured by a mortgage or collection of mortgages. The following are types of MBSs:
• Agency credit risk transfer (CRT) security is backed by a reference pool of agency mortgages. Unlike a regular agency pass-through, the principal invested in a CRT is not backed by a U.S. government agency. To compensate investors for this risk, a CRT typically offers a higher yield than conventional pass-through securities. Similar to a CMBS, a CRT is structured into various tranches for investors, offering
|
| 14 Diversified Income Trust |
different levels of risk and yield based on the underlying reference pool.
• Agency “pass-through” has its principal and interest backed by a U.S. government agency, such as the Federal National Mortgage Association (Fannie Mae), Government National Mortgage Association (Ginnie Mae), and Federal Home Loan Mortgage Corporation (Freddie Mac).
• Collateralized mortgage obligation (CMO) represents claims to specific cash flows from pools of home mortgages. The streams of principal and interest payments on the mortgages are distributed to the different classes of CMO interests in “tranches.” Each tranche may have different principal balances, coupon rates, prepayment risks, and maturity dates. A CMO is highly sensitive to changes in interest rates and any resulting change in the rate at which homeowners sell their properties, refinance, or otherwise prepay loans. CMOs are subject to prepayment, market, and liquidity risks.
◦ Interest-only (IO) security is a type of CMO in which the underlying asset is the interest portion of mortgage, Treasury, or bond payments.
• Non-agency residential mortgage-backed security (RMBS) is an MBS not backed by Fannie Mae, Ginnie Mae, or Freddie Mac. One type of RMBS is an Alt-A mortgage-backed security.
• Commercial mortgage-backed security (CMBS) is secured by the loan on a commercial property.
Yield curve is a graph that plots the yields of bonds with equal credit quality against their differing maturity dates, ranging from shortest to longest. It is used as a benchmark for other debt, such as mortgage or bank lending rates.
Comparative indexes
Bloomberg U.S. Aggregate Bond Index is an unmanaged index of U.S. investment-grade fixed income securities.
CMBX Index is an unmanaged index that tracks the performance of a basket of CMBS issued in a particular year.
ICE BofA (Intercontinental Exchange Bank of America) U.S. Treasury Bill Index is an unmanaged index that tracks the performance of U.S. dollar-denominated U.S. Treasury Bills publicly issued in the U.S. domestic market. Qualifying securities must have a remaining term of at least one month to final maturity and a minimum amount outstanding of $1 billion.
S&P 500® Index is an unmanaged index of common stock performance.
Indexes assume reinvestment of all distributions and do not account for fees. Securities and performance of a fund and an index will differ. You cannot invest directly in an index.
BLOOMBERG® is a trademark and service mark of Bloomberg Finance L.P. and its affiliates (collectively “Bloomberg”). Bloomberg or Bloomberg’s licensors own all proprietary rights in the Bloomberg Indices. Neither Bloomberg nor Bloomberg’s licensors approve or endorse this material, or guarantee the accuracy or completeness of any information herein, or make any warranty, express or implied, as to the results to be obtained therefrom, and to the maximum extent allowed by law, neither shall have any liability or responsibility for injury or damages arising in connection therewith.
ICE Data Indices, LLC (“ICE BofA”), used with permission. ICE BofA permits use of the ICE BofA indices and related data on an “as is” basis; makes no warranties regarding same; does not guarantee the suitability, quality, accuracy, timeliness, and/or completeness of the ICE BofA indices or any data included in, related to, or derived therefrom; assumes no liability in connection with the use of the foregoing; and does not sponsor, endorse, or recommend Putnam Investments, or any of its products or services.
Lipper, a Refinitiv company, is a third-party industry-ranking entity that ranks mutual funds. Its rankings do not reflect sales charges. Lipper rankings are based on total return at net asset value relative to other funds that have similar current investment styles or objectives as determined by Lipper. Lipper may change a fund’s category assignment at its discretion. Lipper category medians reflect performance trends for funds within a category.
|
| Diversified Income Trust 15 |
Other information for shareholders
Proxy voting
Putnam is committed to managing our mutual funds in the best interests of our shareholders. The Putnam funds’ proxy voting guidelines and procedures, as well as information regarding how your fund voted proxies relating to portfolio securities during the 12-month period ended June 30, 2022, are available in the Individual Investors section of putnam.com and on the Securities and Exchange Commission (SEC) website, www.sec.gov. If you have questions about finding forms on the SEC’s website, you may call the SEC at 1-800-SEC-0330. You may also obtain the Putnam funds’ proxy voting guidelines and procedures at no charge by calling Putnam’s Shareholder Services at 1-800-225-1581.
Fund portfolio holdings
The fund will file a complete schedule of its portfolio holdings with the SEC for the first and third quarters of each fiscal year on Form N-PORT within 60 days of the end of such fiscal quarter. Shareholders may obtain the fund’s Form N-PORT on the SEC’s website at www.sec.gov.
Prior to its use of Form N-PORT, the fund filed its complete schedule of its portfolio holdings with the SEC on Form N-Q, which is available online at www.sec.gov.
Trustee and employee fund ownership
Putnam employees and members of the Board of Trustees place their faith, confidence, and, most importantly, investment dollars in Putnam mutual funds. As of September 30, 2022, Putnam employees had approximately $428,000,000 and the Trustees had approximately $57,000,000 invested in Putnam mutual funds. These amounts include investments by the Trustees’ and employees’ immediate family members as well as investments through retirement and deferred compensation plans.
Liquidity risk management program
Putnam, as the administrator of the fund’s liquidity risk management program (appointed by the Board of Trustees), presented the most recent annual report on the program to the Trustees in April 2022. The report covered the structure of the program, including the program documents and related policies and procedures adopted to comply with Rule 22e-4 under the Investment Company Act of 1940, and reviewed the operation of the program from January 2021 through December 2021. The report included a description of the annual liquidity assessment of the fund that Putnam performed in November 2021. The report noted that there were no material compliance exceptions identified under Rule 22e-4 during the period. The report included a review of the governance of the program and the methodology for classification of the fund’s investments. The report also included a discussion of liquidity monitoring during the period, including during the market liquidity challenges caused by the Covid-19 pandemic, and the impact those challenges had on the liquidity of the fund’s investments. Putnam concluded that the program has been operating effectively and adequately to ensure compliance with Rule 22e-4.
|
| 16 Diversified Income Trust |
Important notice regarding Putnam’s privacy policy
In order to conduct business with our shareholders, we must obtain certain personal information such as account holders’ names, addresses, Social Security numbers, and dates of birth. Using this information, we are able to maintain accurate records of accounts and transactions.
It is our policy to protect the confidentiality of our shareholder information, whether or not a shareholder currently owns shares of our funds. In particular, it is our policy not to sell information about you or your accounts to outside marketing firms. We have safeguards in place designed to prevent unauthorized access to our computer systems and procedures to protect personal information from unauthorized use.
Under certain circumstances, we must share account information with outside vendors who provide services to us, such as mailings and proxy solicitations. In these cases, the service providers enter into confidentiality agreements with us, and we provide only the information necessary to process transactions and perform other services related to your account. Finally, it is our policy to share account information with your financial representative, if you’ve listed one on your Putnam account.
|
| Diversified Income Trust 17 |
Trustee approval of management contract
General conclusions
The Board of Trustees of The Putnam Funds oversees the management of each fund and, as required by law, determines annually whether to approve the continuance of your fund’s management contract with Putnam Investment Management, LLC (“Putnam Management”) and the sub-management contract with respect to your fund between Putnam Management and its affiliate, Putnam Investments Limited (“PIL”). The Board, with the assistance of its Contract Committee, requests and evaluates all information it deems reasonably necessary under the circumstances in connection with its annual contract review. The Contract Committee consists solely of Trustees who are not “interested persons” (as this term is defined in the Investment Company Act of 1940, as amended (the “1940 Act”)) of The Putnam Funds (“Independent Trustees”).
At the outset of the review process, members of the Board’s independent staff and independent legal counsel considered any possible changes to the annual contract review materials furnished to the Contract Committee during the course of the previous year’s review and, as applicable, identified those changes to Putnam Management. Following these discussions and in consultation with the Contract Committee, the Independent Trustees’ independent legal counsel requested that Putnam Management and its affiliates furnish specified information, together with any additional information that Putnam Management considered relevant, to the Contract Committee. Over the course of several months ending in June 2022, the Contract Committee met on a number of occasions with representatives of Putnam Management, and separately in executive session, to consider the information that Putnam Management provided. Throughout this process, the Contract Committee was assisted by the members of the Board’s independent staff and by independent legal counsel for The Putnam Funds and the Independent Trustees.
In May 2022, the Contract Committee met in executive session to discuss and consider its recommendations with respect to the continuance of the contracts. At the Trustees’ June 2022 meeting, the Contract Committee met in executive session with the other Independent Trustees to review a summary of the key financial, performance and other data that the Contract Committee considered in the course of its review. The Contract Committee then presented its written report, which summarized the key factors that the Committee had considered and set forth its recommendations. The Contract Committee recommended, and the Independent Trustees approved, the continuance of your fund’s management contract and the approval of your fund’s amended and restated sub-management contract, effective July 1, 2022. (Because PIL is an affiliate of Putnam Management and Putnam Management remains fully responsible for all services provided by PIL, the Trustees have not attempted to evaluate PIL as a separate entity, and all subsequent references to Putnam Management below should be deemed to include reference to PIL as necessary or appropriate in the context.)
The Independent Trustees’ approval was based on the following conclusions:
• That the fee schedule in effect for your fund represented reasonable compensation in light of the nature and quality of the services being provided to the fund, the fees paid by competitive funds, the costs incurred by Putnam Management in providing services to the fund and the application of certain reductions and waivers noted below; and
• That the fee schedule in effect for your fund represented an appropriate sharing between fund shareholders and Putnam Management of any economies of scale as may exist in the management of the fund at current asset levels.
These conclusions were based on a comprehensive consideration of all information provided to the Trustees and were not the result of any single factor. Some of the factors that figured particularly in the Trustees’ deliberations and how the Trustees considered these factors are described below, although individual Trustees may have evaluated the information presented differently, giving different weights to various factors. It is also important to recognize that the management arrangements for your fund and the other Putnam funds are the result of many years of review and discussion between the Independent Trustees and Putnam Management, that some aspects of the arrangements may receive greater scrutiny in some years than others and that the Trustees’ conclusions may be based, in part, on their consideration of fee arrangements in previous years. For example,
|
| 18 Diversified Income Trust |
with certain exceptions primarily involving newer or repositioned funds, the current fee arrangements under the vast majority of the funds’ management contracts were first implemented at the beginning of 2010 following extensive review by the Contract Committee and discussions with representatives of Putnam Management, as well as approval by shareholders.
Management fee schedules and total expenses
The Trustees reviewed the management fee schedules in effect for all Putnam funds, including fee levels and breakpoints. Under its management contract, your fund has the benefit of breakpoints in its management fee schedule that provide shareholders with reduced fee levels as assets under management in the Putnam family of funds increase. The Trustees also reviewed the total expenses of each Putnam fund, recognizing that in most cases management fees represented the major, but not the sole, determinant of total costs to fund shareholders. (Two funds have implemented so-called “all-in” management fees covering substantially all routine fund operating costs.) The Trustees considered that the proposed amended and restated sub-management contract would lower the sub-management fees paid by Putnam Management to PIL.
In reviewing fees and expenses, the Trustees generally focus their attention on material changes in circumstances — for example, changes in assets under management, changes in a fund’s investment strategy, changes in Putnam Management’s operating costs or profitability, or changes in competitive practices in the mutual fund industry — that suggest that consideration of fee changes might be warranted. The Trustees concluded that the circumstances did not indicate that changes to the management fee schedule for your fund would be appropriate at this time.
As in the past, the Trustees also focused on the competitiveness of each fund’s total expense ratio. The Trustees and Putnam Management and the funds’ investor servicing agent, Putnam Investor Services, Inc. (“PSERV”), have implemented expense limitations that were in effect during your fund’s fiscal year ending in 2021. These expense limitations were: (i) a contractual expense limitation applicable to specified open-end funds, including your fund, of 25 basis points on investor servicing fees and expenses and (ii) a contractual expense limitation applicable to specified open-end funds, including your fund, of 20 basis points on so-called “other expenses” (i.e., all expenses exclusive of management fees, distribution fees, investor servicing fees, investment-related expenses, interest, taxes, brokerage commissions, acquired fund fees and expenses and extraordinary expenses). These expense limitations attempt to maintain competitive expense levels for the funds. Most funds, including your fund, had sufficiently low expenses that these expense limitations were not operative during their fiscal years ending in 2021. Putnam Management and PSERV have agreed to maintain these expense limitations until at least January 30, 2024. Putnam Management and PSERV’s commitment to these expense limitation arrangements, which were intended to support an effort to have fund expenses meet competitive standards, was an important factor in the Trustees’ decision to approve the continuance of your fund’s management contract and to approve your fund’s amended and restated sub-management contract.
The Trustees reviewed comparative fee and expense information for a custom group of competitive funds selected by Broadridge Financial Solutions, Inc. (“Broadridge”). This comparative information included your fund’s percentile ranking for effective management fees and total expenses (excluding any applicable 12b-1 fees), which provides a general indication of your fund’s relative standing. In the custom peer group, your fund ranked in the first quintile in effective management fees (determined for your fund and the other funds in the custom peer group based on fund asset size and the applicable contractual management fee schedule) and in the second quintile in total expenses (excluding any applicable 12b-1 fees) as of December 31, 2021. The first quintile represents the least expensive funds and the fifth quintile the most expensive funds. The fee and expense data reported by Broadridge as of December 31, 2021 reflected the most recent fiscal year-end data available in Broadridge’s database at that time.
In connection with their review of fund management fees and total expenses, the Trustees also reviewed the costs of the services provided and the profits realized by Putnam Management and its affiliates from their contractual relationships with the funds. This information included trends in revenues, expenses and profitability of Putnam Management and its affiliates relating to the investment management, investor servicing and distribution services provided to the funds. In
|
| Diversified Income Trust 19 |
this regard, the Trustees also reviewed an analysis of the revenues, expenses and profitability of Putnam Management and its affiliates, allocated on a fund-by-fund basis, with respect to the funds’ management, distribution and investor servicing contracts. For each fund, the analysis presented information about revenues, expenses and profitability for each of the agreements separately and for the agreements taken together on a combined basis. The Trustees concluded that, at current asset levels, the fee schedules in place for the Putnam funds, including the fee schedule for your fund, represented reasonable compensation for the services being provided and represented an appropriate sharing between fund shareholders and Putnam Management of any economies of scale as may exist in the management of the Putnam funds at that time.
The information examined by the Trustees in connection with their annual contract review for the Putnam funds included information regarding services provided and fees charged by Putnam Management and its affiliates to other clients, including collective investment trusts offered in the defined contribution and defined benefit retirement plan markets, sub-advised mutual funds, private funds sponsored by affiliates of Putnam Management, model-only separately managed accounts and Putnam Management’s exchange-traded funds. This information included, in cases where a product’s investment strategy corresponds with a fund’s strategy, comparisons of those fees with fees charged to the Putnam funds, as well as an assessment of the differences in the services provided to these clients as compared to the services provided to the Putnam funds. The Trustees observed that the differences in fee rates between these clients and the Putnam funds are by no means uniform when examined by individual asset sectors, suggesting that differences in the pricing of investment management services to these types of clients may reflect, among other things, historical competitive forces operating in separate marketplaces. The Trustees considered the fact that in many cases fee rates across different asset classes are higher on average for mutual funds than for other clients, and the Trustees also considered the differences between the services that Putnam Management provides to the Putnam funds and those that it provides to its other clients. The Trustees did not rely on these comparisons to any significant extent in concluding that the management fees paid by your fund are reasonable.
Investment performance
The quality of the investment process provided by Putnam Management represented a major factor in the Trustees’ evaluation of the quality of services provided by Putnam Management under your fund’s management contract. The Trustees were assisted in their review of Putnam Management’s investment process and performance by the work of the investment oversight committees of the Trustees and the full Board of Trustees, which meet on a regular basis with individual portfolio managers and with senior management of Putnam Management’s Investment Division throughout the year. The Trustees concluded that Putnam Management generally provides a high-quality investment process — based on the experience and skills of the individuals assigned to the management of fund portfolios, the resources made available to them and in general Putnam Management’s ability to attract and retain high-quality personnel — but also recognized that this does not guarantee favorable investment results for every fund in every time period.
The Trustees considered that, in the aggregate, the Putnam funds’ performance was generally solid in 2021 against a backdrop of strong U.S. economic and financial market growth. The Trustees considered Putnam Management’s observation that, despite an environment of generally strong growth, there had been various headwinds experienced in 2021. For the one-year period ended December 31, 2021, the Trustees noted that the Putnam funds, on an asset-weighted basis, ranked in the 52nd percentile of their peers as determined by Lipper Inc. (“Lipper”) and, on an asset-weighted-basis, delivered a gross return that trailed their benchmarks by 0.1%. Over the longer-term, the Committee noted that, on an asset-weighted basis, the Putnam funds delivered strong aggregate performance relative to their Lipper peers over the three-, five- and ten-year periods ended December 31, 2021, ranking in the 31st, 29th and 21st percentiles, respectively, and that the funds, in the aggregate, outperformed their benchmarks on a gross basis for each of those periods.
In addition to the performance of the individual Putnam funds, the Trustees considered, as they had in prior years, the performance of The Putnam Fund complex versus competitor fund complexes. In particular, the Trustees considered The Putnam Fund complex’s performance as reported in the Barron’s/Lipper Fund Families survey (the “Survey”), which ranks mutual fund companies
|
| 20 Diversified Income Trust |
based on their performance across a variety of asset types. The Trustees noted that The Putnam Fund complex continued to rank highly in the Survey, especially over the longer-term, with The Putnam Funds ranking as the 6th best performing mutual fund complex out of 45 complexes for the ten-year period and 13th out of 49 complexes for the five-year period. The Trustees noted that 2021 marked the fifth consecutive year that The Putnam Funds have ranked in the top ten fund complexes for the ten-year period. The Trustees also considered that The Putnam Fund complex’s Survey performance over the one-year period was solid, with The Putnam Funds ranking 27th out of 51 complexes. In addition to the Survey, the Trustees also considered the Putnam funds’ ratings assigned by Morningstar Inc., noting that 25 of the funds were four- or five-star rated at the end of 2021 (representing a decrease of one fund year-over-year) and that this included nine funds that had achieved a five-star rating (representing an increase of two funds year-over-year). They also noted, however, the disappointing investment performance of some Putnam funds for periods ended December 31, 2021 and considered information provided by Putnam Management regarding the factors contributing to the underperformance and actions being taken to improve the performance of these particular funds. The Trustees indicated their intention to continue to monitor closely the performance of those funds and evaluate whether additional actions to address areas of underperformance may be warranted.
For purposes of the Trustees’ evaluation of the Putnam funds’ investment performance, the Trustees generally focus on a competitive industry ranking of each fund’s total net return over a one-year, three-year and five-year period. For a number of Putnam funds with relatively unique investment mandates for which Putnam Management informed the Trustees that meaningful competitive performance rankings are not considered to be available, the Trustees evaluated performance based on their total gross and net returns and comparisons of those returns to the returns of selected investment benchmarks. In the case of your fund, the Trustees considered that its class A share cumulative total return performance at net asset value was in the following quartiles of its Lipper peer group (Lipper Alternative Credit Focus Funds) for the one-year, three-year and five-year periods ended December 31, 2021 (the first quartile representing the best-performing funds and the fourth quartile the worst-performing funds):
| |
| One-year period | 4th |
| Three-year period | 4th |
| Five-year period | 4th |
Over the one-year, three-year and five-year periods ended December 31, 2021, there were 99, 89 and 85 funds, respectively, in your fund’s Lipper peer group. (When considering performance information, shareholders should be mindful that past performance is not a guarantee of future results.)
The Trustees expressed concern about your fund’s fourth quartile performance over the one-year, three-year and five-year periods ended December 31, 2021 and considered the circumstances that may have contributed to this disappointing performance. The Trustees considered Putnam Management’s observation that the fund’s underperformance over those periods was driven by disappointing performance in 2021 and, to a lesser extent, in 2020. The Trustees observed that significant underperformance in the securitized products sector in 2021 had contributed to the fund’s disappointing results, noting that prepayment strategies had suffered as a result of significantly elevated refinancing (given strong home price appreciation and low interest rates) relative to expectations. The Trustees considered that the fund’s underperformance was also driven by significant underperformance in the securitized products sector in 2020, which resulted from the outsized impact of the COVID-19 pandemic on the commercial mortgage sector. In addition, the Trustees considered the negative impact that the fund’s term structure strategies had on performance in 2021 and Putnam Management’s observation that term structure strategies had positively contributed to the fund’s performance from 2017 to 2020 and over the three-year and five-year periods ended December 31, 2021.
The Trustees considered Putnam Management’s observation that a number of the investment strategies that had detracted from the fund’s performance had begun to recover as of March 31, 2022 and that the fund had top decile performance year to date relative to its peers, as of March 31, 2022. In addition, the Trustees considered the retirement of two of the fund’s portfolio managers over the previous year and the addition of a portfolio manager. The Trustees noted that Putnam Management remained confident in the fund’s portfolio managers. The Trustees also considered Putnam Management’s
|
| Diversified Income Trust 21 |
continued efforts to support fund performance through certain initiatives, including structuring compensation for portfolio managers to enhance accountability for fund performance, emphasizing accountability in the portfolio management process and affirming its commitment to a fundamental-driven approach to investing. The Trustees noted further that Putnam Management had made selective hires and internal promotions in 2021 to strengthen its investment team.
As a general matter, the Trustees believe that cooperative efforts between the Trustees and Putnam Management represent the most effective way to address investment performance concerns that may arise from time to time. The Trustees noted that investors in the Putnam funds have, in effect, placed their trust in the Putnam organization, under the oversight of the funds’ Trustees, to make appropriate decisions regarding the management of the funds. The Trustees also considered that Putnam Management has made changes in light of subpar investment performance when warranted. Based on Putnam Management’s willingness to take appropriate measures to address fund performance issues, the Trustees concluded that it continued to be advisable to seek change within Putnam Management to address performance shortcomings. In the Trustees’ view, the alternative of engaging a new investment adviser for an underperforming fund, with all the attendant risks and disruptions, would not likely provide any greater assurance of improved investment performance.
Brokerage and soft-dollar allocations; investor servicing
The Trustees considered various potential benefits that Putnam Management may receive in connection with the services it provides under the management contract with your fund. These include benefits related to brokerage allocation and the use of soft dollars, whereby a portion of the commissions paid by a fund for brokerage may be used to acquire research services that are expected to be useful to Putnam Management in managing the assets of the fund and of other clients. Subject to policies established by the Trustees, soft dollars generated by these means are used predominantly to acquire brokerage and research services (including third-party research and market data) that enhance Putnam Management’s investment capabilities and supplement Putnam Management’s internal research efforts. The Trustees indicated their continued intent to monitor regulatory and industry developments in this area with the assistance of their Brokerage Committee. In addition, with the assistance of their Brokerage Committee, the Trustees indicated their continued intent to monitor the allocation of the Putnam funds’ brokerage in order to ensure that the principle of seeking best price and execution remains paramount in the portfolio trading process.
Putnam Management may also receive benefits from payments that the funds make to Putnam Management’s affiliates for investor or distribution services. In conjunction with the annual review of your fund’s management and sub-management contracts, the Trustees reviewed your fund’s investor servicing agreement with PSERV and its distributor’s contract and distribution plans with Putnam Retail Management Limited Partnership (“PRM”), both of which are affiliates of Putnam Management. The Trustees concluded that the fees payable by the funds to PSERV and PRM, as applicable, for such services are fair and reasonable in relation to the nature and quality of such services, the fees paid by competitive funds and the costs incurred by PSERV and PRM, as applicable, in providing such services. Furthermore, the Trustees were of the view that the investor services provided by PSERV were required for the operation of the funds, and that they were of a quality at least equal to those provided by other providers.
|
| 22 Diversified Income Trust |
Audited financial statements
These sections of the report, as well as the accompanying Notes, preceded by the Report of Independent Registered Public Accounting Firm, constitute the fund’s audited financial statements.
The fund’s portfolio lists all the fund’s investments and their values as of the last day of the reporting period. Holdings are organized by asset type and industry sector, country, or state to show areas of concentration and diversification.
Statement of assets and liabilities shows how the fund’s net assets and share price are determined. All investment and non-investment assets are added together. Any unpaid expenses and other liabilities are subtracted from this total. The result is divided by the number of shares to determine the net asset value per share, which is calculated separately for each class of shares. (For funds with preferred shares, the amount subtracted from total assets includes the liquidation preference of preferred shares.)
Statement of operations shows the fund’s net investment gain or loss. This is done by first adding up all the fund’s earnings — from dividends and interest income — and subtracting its operating expenses to determine net investment income (or loss). Then, any net gain or loss the fund realized on the sales of its holdings — as well as any unrealized gains or losses over the period — is added to or subtracted from the net investment result to determine the fund’s net gain or loss for the fiscal period.
Statement of changes in net assets shows how the fund’s net assets were affected by the fund’s net investment gain or loss, by distributions to shareholders, and by changes in the number of the fund’s shares. It lists distributions and their sources (net investment income or realized capital gains) over the current reporting period and the most recent fiscal year-end. The distributions listed here may not match the sources listed in the Statement of operations because the distributions are determined on a tax basis and may be paid in a different period from the one in which they were earned.
Financial highlights provide an overview of the fund’s investment results, per-share distributions, expense ratios, net investment income ratios, and portfolio turnover in one summary table, reflecting the five most recent reporting periods. In a semiannual report, the highlights table also includes the current reporting period.
|
| Diversified Income Trust 23 |
Report of Independent Registered Public Accounting Firm
To the Board of Trustees and Shareholders of
Putnam Diversified Income Trust:
Opinion on the Financial Statements
We have audited the accompanying statement of assets and liabilities, including the fund’s portfolio, of Putnam Diversified Income Trust (the “Fund”) as of September 30, 2022, the related statement of operations for the year ended September 30, 2022, the statement of changes in net assets for each of the two years in the period ended September 30, 2022, including the related notes, and the financial highlights for each of the three years in the period ended September 30, 2022 (collectively referred to as the “financial statements”). In our opinion, the financial statements present fairly, in all material respects, the financial position of the Fund as of September 30, 2022, the results of its operations for the year then ended, the changes in its net assets for each of the two years in the period ended September 30, 2022 and the financial highlights for each of the three years in the period ended September 30, 2022 in conformity with accounting principles generally accepted in the United States of America.
The financial statements of the Fund as of and for the year ended September 30, 2019 and the financial highlights for each of the periods ended on or prior to September 30, 2019 (not presented herein, other than the financial highlights) were audited by other auditors whose report dated November 12, 2019 expressed an unqualified opinion on those financial statements and financial highlights.
Basis for Opinion
These financial statements are the responsibility of the Fund’s management. Our responsibility is to express an opinion on the Fund’s financial statements based on our audits. We are a public accounting firm registered with the Public Company Accounting Oversight Board (United States) (“PCAOB”) and are required to be independent with respect to the Fund in accordance with the U.S. federal securities laws and the applicable rules and regulations of the Securities and Exchange Commission and the PCAOB.
We conducted our audits of these financial statements in accordance with the standards of the PCAOB. Those standards require that we plan and perform the audit to obtain reasonable assurance about whether the financial statements are free of material misstatement, whether due to error or fraud.
Our audits included performing procedures to assess the risks of material misstatement of the financial statements, whether due to error or fraud, and performing procedures that respond to those risks. Such procedures included examining, on a test basis, evidence regarding the amounts and disclosures in the financial statements. Our audits also included evaluating the accounting principles used and significant estimates made by management, as well as evaluating the overall presentation of the financial statements. Our procedures included confirmation of securities owned as of September 30, 2022 by correspondence with the custodian, transfer agent, agent banks and brokers; when replies were not received from agent banks and brokers, we performed other auditing procedures. We believe that our audits provide a reasonable basis for our opinion.
PricewaterhouseCoopers LLP
Boston, Massachusetts
November 11, 2022
We have served as the auditor of one or more investment companies in the Putnam Investments family of funds since at least 1957. We have not been able to determine the specific year we began serving as auditor.
|
| 24 Diversified Income Trust |
| | |
| The fund’s portfolio 9/30/22 | | |
|
| | |
U.S. GOVERNMENT AND AGENCY
MORTGAGE OBLIGATIONS (81.6%)* | Principal
amount | Value |
| U.S. Government Guaranteed Mortgage Obligations (6.3%) | | |
| Government National Mortgage Association Pass-Through Certificates | | |
| 6.50%, 11/20/38 | $91,626 | $96,948 |
| 5.00%, 3/20/50 | 24,034 | 23,638 |
| 4.50%, TBA, 10/1/52 | 45,000,000 | 43,017,458 |
| 4.00%, TBA, 10/1/52 | 30,000,000 | 27,986,475 |
| 3.50%, with due dates from 9/20/49 to 11/20/49 | 86,273 | 78,729 |
| 3.00%, TBA, 10/1/52 | 32,000,000 | 28,247,187 |
| | 99,450,435 |
| U.S. Government Agency Mortgage Obligations (75.3%) | | |
| Uniform Mortgage-Backed Securities | | |
| 5.50%, TBA, 10/1/52 | 202,000,000 | 200,714,351 |
| 5.00%, TBA, 10/1/52 | 579,000,000 | 563,348,762 |
| 4.50%, TBA, 10/1/52 | 240,000,000 | 228,337,440 |
| 3.50%, TBA, 10/1/52 | 76,000,000 | 68,340,606 |
| 3.00%, TBA, 10/1/52 | 35,000,000 | 30,428,125 |
| 2.50%, TBA, 10/1/52 | 65,000,000 | 54,544,139 |
| 2.00%, TBA, 10/1/52 | 65,000,000 | 52,595,160 |
| | 1,198,308,583 |
| Total U.S. government and agency mortgage obligations (cost $1,340,230,095) | $1,297,759,018 |
|
| | |
| U.S. TREASURY OBLIGATIONS (0.2%)* | Principal
amount | Value |
| U.S. Treasury Bonds 3.00%, 2/15/48 i | $137,000 | $115,772 |
| U.S. Treasury Notes | | |
| 1.75%, 11/15/29 i | 2,064,000 | 1,806,722 |
| 1.625%, 8/15/29 i | 220,000 | 190,177 |
| 0.375%, 4/30/25 i | 338,000 | 306,667 |
| Total U.S. treasury obligations (cost $2,419,338) | $2,419,338 |
|
| | | |
| MORTGAGE-BACKED SECURITIES (41.4%)* | Principal
amount | Value |
| Agency collateralized mortgage obligations (20.5%) |
| Federal Home Loan Mortgage Corporation | | | |
| REMICs Ser. 4509, Class CI, IO, 6.00%, 9/15/45 | | $9,895,544 | $2,131,045 |
| REMICs Ser. 4077, Class IK, IO, 5.00%, 7/15/42 | | 2,639,549 | 519,991 |
| REMICs Ser. 5152, Class MI, IO, 4.50%, 10/25/51 | | 45,113,506 | 10,105,141 |
| REMICs Ser. 5134, Class ID, IO, 4.50%, 8/25/51 | | 29,850,056 | 5,899,894 |
| REMICs Ser. 5049, Class AI, IO, 4.50%, 12/25/50 | | 27,915,683 | 5,756,493 |
| REMICs Ser. 5093, Class YI, IO, 4.50%, 12/25/50 | | 22,642,861 | 4,837,915 |
| REMICs Ser. 5115, Class IK, IO, 4.50%, 12/25/50 | | 25,751,977 | 5,724,235 |
| REMICs Ser. 5024, Class HI, IO, 4.50%, 10/25/50 | | 4,969,823 | 1,059,036 |
| REMICs Ser. 4984, Class IL, IO, 4.50%, 6/25/50 | | 2,452,228 | 526,207 |
| REMICs Ser. 4122, Class TI, IO, 4.50%, 10/15/42 | | 2,726,380 | 527,953 |
| REMICs Ser. 4000, Class PI, IO, 4.50%, 1/15/42 | | 3,655,534 | 548,320 |
| REMICs Ser. 4024, Class PI, IO, 4.50%, 12/15/41 | | 3,812,615 | 416,543 |
| REMICs Ser. 4635, Class PI, IO, 4.00%, 12/15/46 | | 6,019,888 | 1,060,295 |
| REMICs Ser. 4193, Class PI, IO, 4.00%, 3/15/43 | | 13,040,615 | 1,799,423 |
| REMICs Ser. 4213, Class GI, IO, 4.00%, 11/15/41 | | 2,708,442 | 95,347 |
| |
Diversified Income Trust 25 |
| | | |
| MORTGAGE-BACKED SECURITIES (41.4%)* cont. | Principal
amount | Value |
| Agency collateralized mortgage obligations cont. |
| Federal Home Loan Mortgage Corporation | | | |
| REMICs Ser. 4020, Class IA, IO, 4.00%, 3/15/27 | | $1,990,467 | $88,018 |
| REMICs IFB Ser. 3919, Class SA, IO, ((-1 x ICE LIBOR USD 1 Month) + 6.50%), 3.682%, 9/15/41 | | 4,869,080 | 602,932 |
| REMICs Ser. 4484, Class TI, IO, 3.50%, 11/15/44 | | 1,226,084 | 102,116 |
| REMICs Ser. 4105, Class HI, IO, 3.50%, 7/15/41 | | 2,054,211 | 171,891 |
| REMICs IFB Ser. 4742, Class S, IO, ((-1 x ICE LIBOR USD 1 Month) + 6.20%), 3.382%, 12/15/47 | | 11,116,423 | 1,229,476 |
| REMICs IFB Ser. 4731, Class QS, IO, ((-1 x ICE LIBOR USD 1 Month) + 6.20%), 3.382%, 11/15/47 | | 8,570,525 | 993,595 |
| REMICs IFB Ser. 4839, Class WS, IO, ((-1 x ICE LIBOR USD 1 Month) + 6.10%), 3.282%, 8/15/56 | | 1,915,111 | 234,524 |
| REMICs IFB Ser. 4678, Class MS, IO, ((-1 x ICE LIBOR USD 1 Month) + 6.10%), 3.282%, 4/15/47 | | 6,929,484 | 845,292 |
| REMICs IFB Ser. 4265, Class SD, IO, ((-1 x ICE LIBOR USD 1 Month) + 6.10%), 3.282%, 1/15/35 | | 20,817,271 | 1,542,374 |
| REMICs IFB Ser. 5011, Class SA, IO, ((-1 x ICE LIBOR USD 1 Month) + 6.25%), 3.166%, 9/25/50 | | 3,778,803 | 453,456 |
| Strips IFB Ser. 326, Class S2, IO, ((-1 x ICE LIBOR USD 1 Month) + 5.95%), 3.132%, 3/15/44 | | 4,236,227 | 414,531 |
| Strips IFB Ser. 311, Class S1, IO, ((-1 x ICE LIBOR USD 1 Month) + 5.95%), 3.132%, 8/15/43 | | 7,287,913 | 807,377 |
| REMICs IFB Ser. 5004, Class SG, IO, ((-1 x ICE LIBOR USD 1 Month) + 6.10%), 3.016%, 8/25/50 | | 3,898,339 | 457,158 |
| REMICs IFB Ser. 5002, Class SJ, IO, ((-1 x ICE LIBOR USD 1 Month) + 6.10%), 3.016%, 7/25/50 | | 34,163,221 | 3,922,806 |
| REMICs Ser. 4801, Class IG, IO, 3.00%, 6/15/48 | | 4,493,009 | 662,228 |
| REMICs Ser. 4165, Class TI, IO, 3.00%, 12/15/42 | | 6,985,093 | 553,045 |
| REMICs Ser. 4210, Class PI, IO, 3.00%, 12/15/41 | | 1,044,508 | 14,424 |
| REMICs IFB Ser. 4945, Class SL, IO, ((-1 x ICE LIBOR USD 1 Month) + 6.05%), 2.966%, 1/25/50 | | 2,435,856 | 228,568 |
| REMICs IFB Ser. 4937, Class 4937, IO, ((-1 x ICE LIBOR USD 1 Month) + 6.05%), 2.966%, 12/25/49 | | 776,497 | 85,415 |
| Structured Pass-Through Certificates FRB Ser. 57, Class 1AX, IO, 0.399%, 7/25/43 W | | 5,928,330 | 59,283 |
| Federal National Mortgage Association | | | |
| Grantor Trust Ser. 98-T2, Class A4, IO, 6.50%, 10/25/36 | | 5,669 | 394 |
| REMICs Ser. 16-3, Class NI, IO, 6.00%, 2/25/46 | | 8,307,164 | 1,509,737 |
| REMICs Ser. 15-69, IO, 6.00%, 9/25/45 | | 9,414,086 | 2,049,249 |
| REMICs Ser. 15-58, Class KI, IO, 6.00%, 3/25/37 | | 14,450,264 | 2,721,837 |
| Interest Strip Ser. 399, Class 2, IO, 5.50%, 11/25/39 | | 13,540 | 2,719 |
| Interest Strip Ser. 374, Class 6, IO, 5.50%, 8/25/36 | | 584,093 | 98,942 |
| REMICs Ser. 15-30, IO, 5.50%, 5/25/45 | | 1,048,752 | 177,512 |
| Interest Strip Ser. 378, Class 19, IO, 5.00%, 6/25/35 | | 632,763 | 93,384 |
| REMICs Ser. 12-151, Class IN, IO, 5.00%, 1/25/43 | | 6,488,357 | 1,231,296 |
| REMICs Ser. 17-87, Class KI, IO, 5.00%, 6/25/41 | | 475,102 | 82,242 |
| Interest Strip Ser. 404, Class 2, IO, 4.50%, 5/25/40 | | 40,076 | 7,670 |
| REMICs Ser. 21-77, Class BI, IO, 4.50%, 11/25/51 | | 45,676,785 | 9,814,082 |
| REMICs Ser. 21-15, Class IJ, IO, 4.50%, 4/25/51 | | 22,400,887 | 4,928,195 |
| REMICs Ser. 20-76, Class BI, IO, 4.50%, 11/25/50 | | 3,295,435 | 610,488 |
| |
26 Diversified Income Trust |
| | | |
| MORTGAGE-BACKED SECURITIES (41.4%)* cont. | Principal
amount | Value |
| Agency collateralized mortgage obligations cont. |
| Federal National Mortgage Association | | | |
| REMICs Ser. 18-58, Class AI, IO, 4.50%, 8/25/48 | | $18,697,819 | $2,807,809 |
| REMICs Ser. 12-127, Class BI, IO, 4.50%, 11/25/42 | | 3,106,814 | 624,745 |
| Interest Strip Ser. 405, Class 2, IO, 4.00%, 10/25/40 | | 44,854 | 8,004 |
| REMICs Ser. 19-70, Class 70, IO, 4.00%, 12/25/49 | | 5,907,836 | 938,814 |
| REMICs Ser. 18-3, Class PI, IO, 4.00%, 2/25/48 | | 5,069,850 | 1,008,363 |
| REMICs Ser. 17-65, Class LI, IO, 4.00%, 8/25/47 | | 2,115,537 | 348,641 |
| REMICs Ser. 15-88, Class QI, IO, 4.00%, 10/25/44 | | 1,625,357 | 116,166 |
| REMICs Ser. 15-83, IO, 4.00%, 10/25/43 | | 721,114 | 110,005 |
| REMICs Ser. 13-41, Class IP, IO, 4.00%, 5/25/43 | | 7,462,943 | 1,065,185 |
| REMICs Ser. 13-44, Class PI, IO, 4.00%, 1/25/43 | | 2,699,168 | 351,756 |
| REMICs Ser. 13-60, Class IP, IO, 4.00%, 10/25/42 | | 2,332,420 | 282,689 |
| REMICs Ser. 16-70, Class QI, IO, 3.50%, 10/25/46 | | 7,372,942 | 1,092,965 |
| REMICs Ser. 13-18, Class IN, IO, 3.50%, 3/25/43 | | 7,931,359 | 1,289,585 |
| REMICs Ser. 13-70, Class CI, IO, 3.50%, 1/25/43 | | 1,722,070 | 169,173 |
| REMICs Ser. 13-49, Class IP, IO, 3.50%, 12/25/42 | | 4,965,201 | 378,510 |
| REMICs Ser. 13-40, Class YI, IO, 3.50%, 6/25/42 | | 3,557,461 | 317,148 |
| REMICs Ser. 12-123, Class DI, IO, 3.50%, 5/25/41 | | 7,926,908 | 684,164 |
| REMICs IFB Ser. 10-35, Class SG, IO, ((-1 x ICE LIBOR USD 1 Month) + 6.40%), 3.316%, 4/25/40 | | 4,239,047 | 477,325 |
| REMICs IFB Ser. 18-38, Class SA, IO, ((-1 x ICE LIBOR USD 1 Month) + 6.20%), 3.116%, 6/25/48 | | 25,598,852 | 2,729,913 |
| REMICs IFB Ser. 18-44, Class SA, IO, ((-1 x ICE LIBOR USD 1 Month) + 6.20%), 3.116%, 6/25/48 | | 30,465,341 | 3,436,795 |
| REMICs IFB Ser. 15-42, Class LS, IO, ((-1 x ICE LIBOR USD 1 Month) + 6.20%), 3.116%, 6/25/45 | | 1,881,543 | 119,467 |
| REMICs IFB Ser. 13-18, Class SB, IO, ((-1 x ICE LIBOR USD 1 Month) + 6.15%), 3.066%, 10/25/41 | | 860,957 | 10,568 |
| REMICs IFB Ser. 19-5, Class SA, IO, ((-1 x ICE LIBOR USD 1 Month) + 6.10%), 3.016%, 3/25/49 | | 1,577,725 | 159,701 |
| REMICs IFB Ser. 16-96, Class ST, IO, ((-1 x ICE LIBOR USD 1 Month) + 6.10%), 3.016%, 12/25/46 | | 29,963,808 | 2,417,695 |
| REMICs IFB Ser. 16-62, Class GS, IO, ((-1 x ICE LIBOR USD 1 Month) + 6.10%), 3.016%, 9/25/46 | | 21,238,493 | 1,587,153 |
| REMICs Ser. 12-151, Class PI, IO, 3.00%, 1/25/43 | | 15,033,969 | 1,918,786 |
| REMICs Ser. 12-145, Class TI, IO, 3.00%, 11/25/42 | | 1,959,059 | 75,371 |
| REMICs Ser. 13-35, Class PI, IO, 3.00%, 2/25/42 | | 3,786,515 | 109,029 |
| REMICs Ser. 13-30, Class IP, IO, 3.00%, 10/25/41 | | 720,443 | 3,911 |
| REMICs IFB Ser. 20-12, Class SK, IO, ((-1 x ICE LIBOR USD 1 Month) + 6.05%), 2.966%, 3/25/50 | | 1,937,700 | 198,614 |
| REMICs IFB Ser. 19-73, Class 73, IO, ((-1 x ICE LIBOR USD 1 Month) + 6.05%), 2.966%, 12/25/49 | | 983,634 | 110,277 |
| REMICs IFB Ser. 19-57, Class KS, IO, ((-1 x ICE LIBOR USD 1 Month) + 6.05%), 2.966%, 10/25/49 | | 2,233,352 | 238,217 |
| REMICs IFB Ser. 19-43, Class JS, IO, ((-1 x ICE LIBOR USD 1 Month) + 6.05%), 2.966%, 8/25/49 | | 1,084,825 | 90,276 |
| REMICs IFB Ser. 19-47, Class SA, IO, ((-1 x ICE LIBOR USD 1 Month) + 6.05%), 2.966%, 8/25/49 | | 12,309,558 | 1,313,471 |
| REMICs IFB Ser. 19-34, Class SL, IO, ((-1 x ICE LIBOR USD 1 Month) + 6.05%), 2.966%, 7/25/49 | | 14,058,281 | 1,500,148 |
| |
Diversified Income Trust 27 |
| | | |
| MORTGAGE-BACKED SECURITIES (41.4%)* cont. | Principal
amount | Value |
| Agency collateralized mortgage obligations cont. |
| Federal National Mortgage Association | | | |
| REMICs IFB Ser. 19-38, Class 38, IO, ((-1 x ICE LIBOR USD 1 Month) + 6.05%), 2.966%, 7/25/49 | | $715,824 | $69,063 |
| REMICs IFB Ser. 11-101, Class SA, IO, ((-1 x ICE LIBOR USD 1 Month) + 5.90%), 2.816%, 10/25/41 | | 7,802,628 | 712,018 |
| Grantor Trust Ser. 00-T6, IO, 0.717%, 11/25/40 W | | 2,451,938 | 15,938 |
| REMICs FRB Ser. 01-50, Class B1, IO, 0.397%, 10/25/41 W | | 80,841 | 404 |
| FRB Ser. 02-W8, Class 1, IO, 0.298%, 6/25/42 W | | 4,091,576 | 24,538 |
| Government National Mortgage Association | | | |
| Ser. 17-104, Class MI, IO, 5.50%, 7/16/47 | | 9,308,581 | 2,134,306 |
| Ser. 17-79, Class IB, IO, 5.50%, 5/20/47 | | 3,273,123 | 706,327 |
| Ser. 17-52, Class DI, IO, 5.50%, 4/20/47 | | 3,807,271 | 754,783 |
| Ser. 19-119, Class IN, IO, 5.00%, 9/20/49 | | 17,930,983 | 3,320,961 |
| Ser. 18-37, IO, 5.00%, 3/20/48 | | 7,190,564 | 1,359,349 |
| Ser. 17-179, Class WI, IO, 5.00%, 12/20/47 | | 4,262,848 | 912,955 |
| Ser. 17-38, Class DI, IO, 5.00%, 3/16/47 | | 4,192,821 | 846,908 |
| Ser. 16-126, Class PI, IO, 5.00%, 2/20/46 | | 7,341,143 | 1,457,070 |
| Ser. 18-127, Class ID, IO, 5.00%, 7/20/45 | | 4,704,692 | 704,292 |
| Ser. 15-167, Class MI, IO, 5.00%, 6/20/45 | | 12,496,165 | 2,389,316 |
| Ser. 18-127, Class IC, IO, 5.00%, 10/20/44 | | 1,638,072 | 325,239 |
| Ser. 14-132, IO, 5.00%, 9/20/44 | | 5,126,199 | 904,518 |
| Ser. 14-163, Class NI, IO, 5.00%, 2/20/44 | | 4,893,117 | 780,521 |
| Ser. 13-3, Class IT, IO, 5.00%, 1/20/43 | | 1,956,860 | 421,116 |
| Ser. 12-146, IO, 5.00%, 12/20/42 | | 3,627,072 | 735,461 |
| Ser. 10-35, Class UI, IO, 5.00%, 3/20/40 | | 14,439,275 | 2,989,680 |
| Ser. 10-20, Class UI, IO, 5.00%, 2/20/40 | | 4,461,474 | 929,395 |
| Ser. 10-9, Class UI, IO, 5.00%, 1/20/40 | | 24,553,105 | 5,240,615 |
| Ser. 09-121, Class UI, IO, 5.00%, 12/20/39 | | 13,471,709 | 2,829,059 |
| Ser. 17-26, Class MI, IO, 5.00%, 11/20/39 | | 987,666 | 200,972 |
| Ser. 15-105, Class LI, IO, 5.00%, 10/20/39 | | 6,580,927 | 1,297,956 |
| Ser. 15-79, Class GI, IO, 5.00%, 10/20/39 | | 5,923,760 | 1,194,321 |
| Ser. 20-61, IO, 4.50%, 5/20/50 | | 64,045,525 | 12,732,167 |
| Ser. 18-94, Class AI, IO, 4.50%, 7/20/48 | | 1,608,603 | 304,822 |
| Ser. 21-122, Class GI, IO, 4.50%, 11/20/47 | | 32,779,374 | 5,888,271 |
| Ser. 16-17, Class IA, IO, 4.50%, 3/20/45 | | 8,160,245 | 1,486,127 |
| Ser. 13-182, Class IQ, IO, 4.50%, 12/16/43 | | 5,370,263 | 945,680 |
| Ser. 13-34, Class IH, IO, 4.50%, 3/20/43 | | 5,770,677 | 1,003,590 |
| Ser. 13-183, Class JI, IO, 4.50%, 2/16/43 | | 2,469,198 | 178,538 |
| Ser. 14-108, Class IP, IO, 4.50%, 12/20/42 | | 719,137 | 42,810 |
| Ser. 17-42, Class IC, IO, 4.50%, 8/20/41 | | 13,250,424 | 2,664,762 |
| Ser. 13-167, IO, 4.50%, 9/20/40 | | 2,573,349 | 467,128 |
| Ser. 10-35, Class AI, IO, 4.50%, 3/20/40 | | 3,224,303 | 574,031 |
| Ser. 10-35, Class QI, IO, 4.50%, 3/20/40 | | 9,357,496 | 1,801,458 |
| Ser. 10-20, Class BI, IO, 4.50%, 2/16/40 | | 8,031,248 | 1,524,090 |
| Ser. 10-9, Class QI, IO, 4.50%, 1/20/40 | | 4,917,872 | 934,396 |
| Ser. 14-71, Class PI, IO, 4.50%, 12/20/39 | | 4,903,991 | 487,702 |
| Ser. 16-138, Class DI, IO, 4.00%, 10/20/46 | | 6,647,096 | 1,136,254 |
| Ser. 15-89, Class IP, IO, 4.00%, 2/20/45 | | 13,344,260 | 1,900,431 |
| Ser. 15-64, Class YI, IO, 4.00%, 11/20/44 | | 7,766,052 | 963,146 |
| |
28 Diversified Income Trust |
| | | |
| MORTGAGE-BACKED SECURITIES (41.4%)* cont. | Principal
amount | Value |
| Agency collateralized mortgage obligations cont. |
| Government National Mortgage Association | | | |
| Ser. 15-79, Class MI, IO, 4.00%, 5/20/44 | | $2,073,257 | $196,724 |
| Ser. 14-4, Class BI, IO, 4.00%, 1/20/44 | | 6,149,459 | 1,129,034 |
| Ser. 14-4, Class IC, IO, 4.00%, 1/20/44 | | 4,048,479 | 692,251 |
| Ser. 14-163, Class PI, IO, 4.00%, 10/20/43 | | 991,766 | 27,008 |
| Ser. 13-165, Class IL, IO, 4.00%, 3/20/43 | | 2,568,285 | 410,159 |
| Ser. 13-27, Class IJ, IO, 4.00%, 2/20/43 | | 3,064,671 | 500,890 |
| Ser. 13-24, Class PI, IO, 4.00%, 11/20/42 | | 1,353,951 | 176,185 |
| Ser. 12-106, Class QI, IO, 4.00%, 7/20/42 | | 5,017,185 | 781,677 |
| Ser. 12-56, Class IB, IO, 4.00%, 4/20/42 | | 1,879,696 | 328,939 |
| Ser. 12-8, Class PI, IO, 4.00%, 5/20/41 | | 4,497,224 | 432,069 |
| IFB Ser. 13-9, Class S, IO, ((-1 x ICE LIBOR USD 1 Month) + 6.75%), 3.736%, 1/20/43 | | 15,544,129 | 1,958,102 |
| Ser. 21-8, Class VI, IO, 3.50%, 12/20/50 | | 28,616,551 | 4,680,598 |
| Ser. 19-110, Class PI, IO, 3.50%, 9/20/49 | | 9,828,312 | 1,526,336 |
| Ser. 18-21, Class AI, IO, 3.50%, 2/20/48 | | 1,426,537 | 161,511 |
| Ser. 17-139, Class IG, IO, 3.50%, 9/20/47 | | 1,391,458 | 191,887 |
| Ser. 16-79, IO, 3.50%, 6/20/46 | | 3,501,036 | 460,736 |
| Ser. 15-131, Class CI, IO, 3.50%, 9/20/45 | | 3,693,425 | 556,880 |
| Ser. 15-131, Class MI, IO, 3.50%, 9/20/45 | | 5,805,150 | 933,176 |
| Ser. 16-75, Class EI, IO, 3.50%, 8/20/45 | | 6,914,622 | 842,406 |
| Ser. 13-76, IO, 3.50%, 5/20/43 | | 6,765,970 | 907,587 |
| Ser. 15-168, Class IG, IO, 3.50%, 3/20/43 | | 4,122,518 | 549,930 |
| Ser. 13-28, IO, 3.50%, 2/20/43 | | 1,566,715 | 171,744 |
| Ser. 13-54, Class JI, IO, 3.50%, 2/20/43 | | 3,601,072 | 393,453 |
| Ser. 13-37, Class JI, IO, 3.50%, 1/20/43 | | 3,643,736 | 413,200 |
| Ser. 13-27, Class PI, IO, 3.50%, 12/20/42 | | 1,691,069 | 200,815 |
| Ser. 12-140, Class IC, IO, 3.50%, 11/20/42 | | 16,536,224 | 2,588,299 |
| Ser. 12-128, Class IA, IO, 3.50%, 10/20/42 | | 11,015,884 | 1,783,603 |
| Ser. 18-127, Class IA, IO, 3.50%, 4/20/42 | | 2,714,187 | 194,445 |
| Ser. 13-37, Class LI, IO, 3.50%, 1/20/42 | | 4,250,210 | 269,464 |
| Ser. 15-52, Class KI, IO, 3.50%, 11/20/40 | | 6,543,793 | 484,895 |
| Ser. 15-17, Class LI, IO, 3.50%, 5/16/40 | | 1,523,136 | 16,602 |
| Ser. 13-79, Class XI, IO, 3.50%, 11/20/39 | | 4,832,249 | 219,885 |
| Ser. 18-H15, Class EI, IO, 3.493%, 8/20/68 W | | 43,522,248 | 1,875,809 |
| IFB Ser. 20-61, Class SF, IO, ((-1 x ICE LIBOR USD 1 Month) + 6.44%), 3.426%, 7/20/43 | | 16,806,808 | 1,857,462 |
| IFB Ser. 21-98, Class SK, IO, ((-1 x ICE LIBOR USD 1 Month) + 6.30%), 3.286%, 6/20/51 | | 4,043,444 | 470,050 |
| IFB Ser. 21-77, Class SM, IO, ((-1 x ICE LIBOR USD 1 Month) + 6.30%), 3.286%, 5/20/51 | | 35,673,835 | 4,154,739 |
| IFB Ser. 21-42, Class SG, IO, ((-1 x ICE LIBOR USD 1 Month) + 6.30%), 3.286%, 3/20/51 | | 35,784,310 | 2,911,562 |
| IFB Ser. 18-105, Class SG, IO, ((-1 x ICE LIBOR USD 1 Month) + 6.25%), 3.236%, 8/20/48 | | 16,112,536 | 1,435,282 |
| IFB Ser. 18-91, Class SH, IO, ((-1 x ICE LIBOR USD 1 Month) + 6.25%), 3.236%, 7/20/48 | | 12,063,674 | 1,078,662 |
| IFB Ser. 18-104, Class SD, IO, ((-1 x ICE LIBOR USD 1 Month) + 6.20%), 3.186%, 8/20/48 | | 15,178,373 | 1,307,435 |
| |
Diversified Income Trust 29 |
| | | |
| MORTGAGE-BACKED SECURITIES (41.4%)* cont. | Principal
amount | Value |
| Agency collateralized mortgage obligations cont. |
| Government National Mortgage Association | | | |
| IFB Ser. 18-100, Class S, IO, ((-1 x ICE LIBOR USD 1 Month) + 6.20%), 3.186%, 7/20/48 | | $12,090,430 | $1,043,537 |
| IFB Ser. 18-89, Class LS, IO, ((-1 x ICE LIBOR USD 1 Month) + 6.20%), 3.186%, 6/20/48 | | 11,267,753 | 1,003,823 |
| IFB Ser. 18-67, Class SC, IO, ((-1 x ICE LIBOR USD 1 Month) + 6.20%), 3.186%, 5/20/48 | | 10,236,550 | 919,074 |
| IFB Ser. 17-160, Class S, IO, ((-1 x ICE LIBOR USD 1 Month) + 6.20%), 3.186%, 10/20/43 | | 17,662,251 | 1,725,213 |
| IFB Ser. 13-99, Class VS, IO, ((-1 x ICE LIBOR USD 1 Month) + 6.10%), 3.161%, 7/16/43 | | 3,619,184 | 225,910 |
| IFB Ser. 20-97, Class QS, IO, ((-1 x ICE LIBOR USD 1 Month) + 6.15%), 3.136%, 7/20/50 | | 2,632,193 | 359,870 |
| IFB Ser. 18-139, Class SA, IO, ((-1 x ICE LIBOR USD 1 Month) + 6.15%), 3.136%, 10/20/48 | | 1,538,341 | 128,630 |
| IFB Ser. 13-129, Class SN, IO, ((-1 x ICE LIBOR USD 1 Month) + 6.15%), 3.136%, 9/20/43 | | 3,184,603 | 239,960 |
| IFB Ser. 16-77, Class SL, IO, ((-1 x ICE LIBOR USD 1 Month) + 6.15%), 3.136%, 3/20/43 | | 627,732 | 13,063 |
| IFB Ser. 13-152, Class SJ, IO, ((-1 x ICE LIBOR USD 1 Month) + 6.15%), 3.136%, 5/20/41 | | 13,317,789 | 1,340,776 |
| IFB Ser. 10-20, Class SC, IO, ((-1 x ICE LIBOR USD 1 Month) + 6.15%), 3.136%, 2/20/40 | | 3,342,314 | 330,454 |
| IFB Ser. 20-63, Class PS, IO, ((-1 x ICE LIBOR USD 1 Month) + 6.10%), 3.086%, 4/20/50 | | 2,899,829 | 340,104 |
| IFB Ser. 19-96, Class SY, IO, ((-1 x ICE LIBOR USD 1 Month) + 6.10%), 3.086%, 8/20/49 | | 1,535,452 | 143,411 |
| IFB Ser. 19-83, Class SY, IO, ((-1 x ICE LIBOR USD 1 Month) + 6.10%), 3.086%, 7/20/49 | | 1,597,728 | 138,859 |
| IFB Ser. 18-164, Class AS, IO, ((-1 x ICE LIBOR USD 1 Month) + 6.10%), 3.086%, 12/20/48 | | 24,406,112 | 2,342,816 |
| IFB Ser. 16-77, Class SC, IO, ((-1 x ICE LIBOR USD 1 Month) + 6.10%), 3.086%, 10/20/45 | | 12,571,702 | 1,314,625 |
| IFB Ser. 14-46, Class SA, IO, ((-1 x ICE LIBOR USD 1 Month) + 6.10%), 3.086%, 3/20/44 | | 6,676,569 | 536,996 |
| IFB Ser. 14-4, Class SG, IO, ((-1 x ICE LIBOR USD 1 Month) + 6.10%), 3.086%, 1/20/44 | | 10,444,344 | 1,094,273 |
| IFB Ser. 13-182, Class SY, IO, ((-1 x ICE LIBOR USD 1 Month) + 6.10%), 3.086%, 12/20/43 | | 3,844,261 | 421,946 |
| IFB Ser. 20-15, Class CS, IO, ((-1 x ICE LIBOR USD 1 Month) + 6.05%), 3.036%, 2/20/50 | | 4,021,394 | 299,727 |
| IFB Ser. 20-7, Class SK, IO, ((-1 x ICE LIBOR USD 1 Month) + 6.05%), 3.036%, 1/20/50 | | 29,184,907 | 2,969,387 |
| IFB Ser. 19-125, Class SG, IO, ((-1 x ICE LIBOR USD 1 Month) + 6.05%), 3.036%, 10/20/49 | | 8,450,401 | 1,219,156 |
| IFB Ser. 19-99, Class KS, IO, ((-1 x ICE LIBOR USD 1 Month) + 6.05%), 3.036%, 8/20/49 | | 3,524,908 | 323,974 |
| IFB Ser. 19-78, Class SJ, IO, ((-1 x ICE LIBOR USD 1 Month) + 6.05%), 3.036%, 6/20/49 | | 3,444,011 | 272,638 |
| IFB Ser. 19-6, Class SM, IO, ((-1 x ICE LIBOR USD 1 Month) + 6.05%), 3.036%, 1/20/49 | | 14,425,736 | 1,177,012 |
| |
30 Diversified Income Trust |
| | | |
| MORTGAGE-BACKED SECURITIES (41.4%)* cont. | Principal
amount | Value |
| Agency collateralized mortgage obligations cont. |
| Government National Mortgage Association | | | |
| Ser. 17-H18, Class FI, IO, 3.004%, 9/20/67 W | | $29,157,072 | $1,735,803 |
| Ser. 21-55, Class PI, IO, 3.00%, 3/20/51 | | 36,242,303 | 5,719,035 |
| Ser. 21-30, Class KI, IO, 3.00%, 2/20/51 | | 45,680,535 | 7,249,858 |
| Ser. 20-175, Class NI, IO, 3.00%, 11/20/50 | | 31,370,229 | 4,936,604 |
| Ser. 17-H20, Class HI, IO, 2.623%, 10/20/67 W | | 26,126,219 | 1,483,023 |
| IFB Ser. 14-119, Class SA, IO, ((-1 x ICE LIBOR USD 1 Month) + 5.60%), 2.586%, 8/20/44 | | 9,136,133 | 758,202 |
| Ser. 17-H02, Class BI, IO, 2.432%, 1/20/67 W | | 16,797,766 | 588,124 |
| Ser. 16-H04, Class HI, IO, 2.377%, 7/20/65 W | | 35,549,106 | 1,208,670 |
| Ser. 17-H03, Class EI, IO, 2.372%, 1/20/67 W | | 18,950,985 | 1,112,067 |
| Ser. 17-H06, Class BI, IO, 2.362%, 2/20/67 W | | 35,348,123 | 1,951,676 |
| Ser. 18-H03, Class XI, IO, 2.195%, 2/20/68 W | | 66,632,982 | 2,858,555 |
| Ser. 18-H01, IO, 2.186%, 12/20/67 W | | 17,769,883 | 862,603 |
| Ser. 18-H01, Class XI, IO, 2.185%, 1/20/68 W | | 28,461,971 | 2,026,653 |
| Ser. 18-H02, Class EI, IO, 2.131%, 1/20/68 W | | 52,001,090 | 3,640,076 |
| Ser. 17-H06, Class MI, IO, 2.10%, 2/20/67 W | | 28,295,116 | 1,138,766 |
| Ser. 18-H02, Class HI, IO, 2.097%, 1/20/68 W | | 42,952,973 | 3,006,708 |
| Ser. 15-H18, Class BI, IO, 2.079%, 7/20/65 W | | 25,630,069 | 976,506 |
| Ser. 16-H17, Class KI, IO, 2.055%, 7/20/66 W | | 16,121,291 | 648,323 |
| Ser. 17-H08, Class NI, IO, 2.02%, 3/20/67 W | | 36,876,203 | 1,279,604 |
| Ser. 15-H20, Class BI, IO, 2.02%, 8/20/65 W | | 32,317,699 | 1,114,960 |
| Ser. 15-H15, Class BI, IO, 1.914%, 6/20/65 W | | 46,131,170 | 1,826,794 |
| Ser. 15-H24, Class AI, IO, 1.859%, 9/20/65 W | | 23,564,060 | 664,365 |
| Ser. 18-H05, Class BI, IO, 1.803%, 2/20/68 W | | 49,397,891 | 3,426,978 |
| Ser. 18-H05, Class AI, IO, 1.796%, 2/20/68 W | | 41,398,754 | 2,872,039 |
| Ser. 17-H09, IO, 1.766%, 4/20/67 W | | 30,156,612 | 966,671 |
| Ser. 18-H04, IO, 1.758%, 2/20/68 W | | 32,742,998 | 1,771,757 |
| Ser. 15-H23, Class DI, IO, 1.707%, 9/20/65 W | | 25,282,975 | 1,410,790 |
| Ser. 15-H12, Class AI, IO, 1.696%, 5/20/65 W | | 56,384,606 | 2,554,222 |
| Ser. 17-H10, Class MI, IO, 1.695%, 4/20/67 W | | 58,419,260 | 1,799,313 |
| Ser. 15-H15, Class AI, IO, 1.677%, 6/20/65 W | | 33,284,576 | 1,687,528 |
| Ser. 16-H16, Class EI, IO, 1.667%, 6/20/66 W | | 26,638,600 | 1,254,678 |
| FRB Ser. 15-H08, Class CI, IO, 1.635%, 3/20/65 W | | 43,130,704 | 1,863,246 |
| Ser. 17-H06, Class DI, IO, 1.602%, 2/20/67 W | | 23,447,091 | 919,126 |
| Ser. 15-H23, Class BI, IO, 1.591%, 9/20/65 W | | 46,203,613 | 1,843,524 |
| Ser. 17-H03, Class HI, IO, 1.588%, 1/20/67 W | | 46,469,243 | 1,623,969 |
| Ser. 17-H11, Class DI, IO, 1.558%, 5/20/67 W | | 18,474,664 | 990,686 |
| Ser. 15-H03, Class CI, IO, 1.549%, 1/20/65 W | | 49,586,450 | 2,112,382 |
| Ser. 14-H25, Class BI, IO, 1.511%, 12/20/64 W | | 33,243,469 | 1,109,667 |
| Ser. 16-H14, IO, 1.51%, 6/20/66 W | | 30,295,345 | 1,065,518 |
| Ser. 16-H18, IO, 1.493%, 8/20/66 W | | 32,230,024 | 1,152,901 |
| Ser. 15-H01, Class BI, IO, 1.395%, 1/20/65 W | | 24,342,074 | 833,351 |
| Ser. 17-H12, Class QI, IO, 1.363%, 5/20/67 W | | 30,009,886 | 1,189,832 |
| Ser. 14-H06, Class BI, IO, 1.313%, 2/20/64 W | | 27,467,664 | 574,486 |
| Ser. 17-H11, Class TI, IO, 1.252%, 4/20/67 W | | 19,843,116 | 1,287,818 |
| Ser. 16-H23, Class NI, IO, 1.178%, 10/20/66 W | | 67,722,773 | 2,268,713 |
| Ser. 12-H29, Class AI, IO, 1.168%, 10/20/62 W | | 9,060,029 | 165,091 |
| Ser. 12-H29, Class FI, IO, 1.168%, 10/20/62 W | | 9,060,029 | 156,086 |
| |
Diversified Income Trust 31 |
| | | |
| MORTGAGE-BACKED SECURITIES (41.4%)* cont. | Principal
amount | Value |
| Agency collateralized mortgage obligations cont. |
| Government National Mortgage Association | | | |
| Ser. 20-H12, Class IH, IO, 1.054%, 7/20/70 W | | $44,880,267 | $1,676,547 |
| Ser. 16-H08, Class AI, IO, 0.985%, 8/20/65 W | | 28,743,026 | 767,439 |
| Ser. 16-H24, Class JI, IO, 0.962%, 11/20/66 W | | 14,609,433 | 696,724 |
| Ser. 15-H10, Class BI, IO, 0.934%, 4/20/65 W | | 23,626,473 | 923,795 |
| Ser. 17-H05, Class CI, IO, 0.651%, 2/20/67 W | | 4,057,735 | 181,973 |
| Ser. 16-H22, Class AI, IO, 0.613%, 10/20/66 W | | 28,352,973 | 978,688 |
| Ser. 16-H27, Class EI, IO, 0.42%, 12/20/66 W | | 21,916,440 | 595,163 |
| Ser. 17-H16, Class JI, IO, 0.377%, 8/20/67 W | | 28,115,603 | 1,474,488 |
| Ser. 17-H16, IO, 0.112%, 8/20/67 | | 26,374,408 | 1,503,447 |
| Ser. 16-H06, Class CI, IO, 0.092%, 2/20/66 W | | 27,779,260 | 440,302 |
| | | 326,309,655 |
| Commercial mortgage-backed securities (10.5%) |
| Barclays Commercial Mortgage Trust 144A Ser. 19-C5, Class D, 2.50%, 11/15/52 | | 282,000 | 189,334 |
| BBCMS Mortgage Trust 144A Ser. 21-C10, Class E, 2.00%, 7/15/54 | | 308,000 | 177,953 |
| Bear Stearns Commercial Mortgage Securities Trust FRB Ser. 07-T26, Class AJ, 5.566%, 1/12/45 W | | 5,559 | 5,504 |
| Benchmark Mortgage Trust 144A FRB Ser. 18-B3, Class D, 3.187%, 4/10/51 W | | 3,322,000 | 2,432,969 |
| BWAY Mortgage Trust 144A FRB Ser. 22-26BW, Class F, 5.029%, 2/10/44 W | | 5,915,000 | 4,084,319 |
| CD Commercial Mortgage Trust FRB Ser. 17-CD3, Class C, 4.699%, 2/10/50 W | | 205,000 | 180,096 |
| CD Commercial Mortgage Trust 144A Ser. 17-CD3, Class D, 3.25%, 2/10/50 | | 4,873,000 | 3,452,798 |
| CFCRE Commercial Mortgage Trust 144A FRB Ser. 11-C2, Class E, 5.249%, 12/15/47 W | | 13,980,000 | 11,812,773 |
| Citigroup Commercial Mortgage Trust Ser. 13-GC11, Class C, 4.134%, 4/10/46 W | | 2,758,000 | 2,845,484 |
| Citigroup Commercial Mortgage Trust 144A Ser. 15-P1, Class D, 3.225%, 9/15/48 | | 850,000 | 705,173 |
| COMM Mortgage Trust | | | |
| FRB Ser. 14-CR16, Class C, 5.081%, 4/10/47 W | | 389,000 | 368,638 |
| Ser. 12-LC4, Class B, 4.934%, 12/10/44 W | | 227,071 | 226,682 |
| COMM Mortgage Trust 144A | | | |
| FRB Ser. 14-CR17, Class E, 5.007%, 5/10/47 W | | 226,000 | 159,531 |
| FRB Ser. 14-UBS3, Class D, 4.926%, 6/10/47 W | | 165,000 | 149,157 |
| FRB Ser. 13-CR9, Class D, 4.433%, 7/10/45 W | | 192,000 | 160,986 |
| FRB Ser. 15-LC19, Class E, 4.356%, 2/10/48 W | | 3,181,000 | 2,664,218 |
| Ser. 12-LC4, Class E, 4.25%, 12/10/44 | | 10,009,000 | 3,718,344 |
| Credit Suisse Commercial Mortgage Trust 144A FRB Ser. 08-C1, Class AJ, 6.01%, 2/15/41 W | | 10,781,406 | 5,218,200 |
| Credit Suisse Mortgage Trust 144A FRB Ser. 22-NWPT, Class A, 5.989%, 9/15/35 | | 2,015,000 | 2,005,554 |
| CSAIL Commercial Mortgage Trust FRB Ser. 20-C19, Class C, 3.734%, 3/15/53 W | | 2,053,000 | 1,611,703 |
| CSAIL Commercial Mortgage Trust 144A FRB Ser. 15-C1, Class D, 3.901%, 4/15/50 W | | 272,000 | 182,169 |
| |
32 Diversified Income Trust |
| | | |
| MORTGAGE-BACKED SECURITIES (41.4%)* cont. | Principal
amount | Value |
| Commercial mortgage-backed securities cont. |
| Federal Home Loan Mortgage Corporation 144A Multifamily Structured Credit Risk FRB Ser. 21-MN3, Class M2, 6.281%, 11/25/51 | | $1,650,000 | $1,463,564 |
| GS Mortgage Securities Corp., II 144A FRB Ser. 13-GC10, Class D, 4.541%, 2/10/46 W | | 273,000 | 265,505 |
| GS Mortgage Securities Trust Ser. 14-GC18, Class B, 4.885%, 1/10/47 W | | 401,000 | 367,550 |
| GS Mortgage Securities Trust 144A | | | |
| FRB Ser. 12-GCJ7, Class D, 5.431%, 5/10/45 W | | 136,380 | 122,742 |
| FRB Ser. 14-GC24, Class D, 4.665%, 9/10/47 W | | 15,237,000 | 10,713,194 |
| JPMBB Commercial Mortgage Securities Trust FRB Ser. 14-C22, Class C, 4.699%, 9/15/47 W | | 248,000 | 225,957 |
| JPMBB Commercial Mortgage Securities Trust 144A | | | |
| FRB Ser. 14-C18, Class D, 4.947%, 2/15/47 W | | 9,906,000 | 6,495,226 |
| FRB Ser. 14-C18, Class E, 4.447%, 2/15/47 W | | 7,852,000 | 3,909,770 |
| FRB Ser. 14-C25, Class D, 4.084%, 11/15/47 W | | 7,740,000 | 5,072,510 |
| Ser. 14-C25, Class E, 3.332%, 11/15/47 W | | 15,725,000 | 9,031,921 |
| JPMDB Commercial Mortgage Securities Trust Ser. 17-C5, Class C, 4.512%, 3/15/50 W | | 254,000 | 200,912 |
| JPMorgan Chase Commercial Mortgage Securities Trust | | | |
| FRB Ser. 13-LC11, Class D, 4.303%, 4/15/46 W | | 431,000 | 336,767 |
| Ser. 13-LC11, Class B, 3.499%, 4/15/46 | | 180,000 | 175,867 |
| JPMorgan Chase Commercial Mortgage Securities Trust 144A FRB Ser. 13-LC11, Class E, 3.25%, 4/15/46 W | | 13,371,809 | 9,580,621 |
| Mezz Cap Commercial Mortgage Trust 144A FRB Ser. 07-C5, Class X, IO, 7.004%, 12/15/49 W | | 60,277 | 1 |
| Morgan Stanley Bank of America Merrill Lynch Trust | | | |
| Ser. 12-C6, Class C, 4.536%, 11/15/45 W | | 2,604,000 | 2,477,862 |
| Ser. 14-C19, Class C, 4.00%, 12/15/47 | | 1,678,000 | 1,517,470 |
| Morgan Stanley Bank of America Merrill Lynch Trust 144A | | | |
| FRB Ser. 13-C11, Class D, 4.495%, 8/15/46 W | | 650,000 | 45,686 |
| FRB Ser. 15-C23, Class D, 4.281%, 7/15/50 W | | 4,095,000 | 3,530,890 |
| FRB Ser. 13-C9, Class D, 4.241%, 5/15/46 W | | 389,000 | 343,534 |
| FRB Ser. 13-C10, Class F, 4.206%, 7/15/46 W | | 254,000 | 56,570 |
| Ser. 14-C17, Class E, 3.50%, 8/15/47 | | 9,096,000 | 6,324,421 |
| Ser. 14-C19, Class D, 3.25%, 12/15/47 | | 3,933,000 | 3,395,056 |
| Morgan Stanley Capital I Trust | | | |
| Ser. 06-HQ10, Class B, 5.448%, 11/12/41 W | | 1,336,155 | 1,240,971 |
| FRB Ser. 18-H3, Class C, 5.025%, 7/15/51 W | | 2,271,437 | 2,024,621 |
| Morgan Stanley Capital I Trust 144A FRB Ser. 12-C4, Class E, 5.336%, 3/15/45 W | | 7,066,000 | 4,982,519 |
| Multifamily Connecticut Avenue Securities Trust 144A | | | |
| FRB Ser. 20-01, Class M10, 6.834%, 3/25/50 | | 568,000 | 530,616 |
| FRB Ser. 19-01, Class M10, 6.334%, 10/25/49 | | 476,068 | 451,409 |
| Ready Capital Mortgage Financing, LLC 144A FRB Ser. 22-FL9, Class A, 5.531%, 6/25/37 | | 3,793,865 | 3,742,033 |
| RIAL Issuer, Ltd. 144A FRB Ser. 22-FL8, Class B, 6.268%, 1/19/37 | | 2,575,000 | 2,555,688 |
| TIAA Real Estate CDO, Ltd. 144A Ser. 03-1A, Class E, 8.00%, 12/28/38 (In default) † | | 4,414,162 | 44 |
| |
Diversified Income Trust 33 |
| | | |
| MORTGAGE-BACKED SECURITIES (41.4%)* cont. | Principal
amount | Value |
| Commercial mortgage-backed securities cont. |
| UBS-Barclays Commercial Mortgage Trust 144A | | | |
| Ser. 12-C2, Class F, 5.00%, 5/10/63 W | | $6,847,000 | $68 |
| Ser. 13-C6, Class E, 3.50%, 4/10/46 | | 7,734,000 | 6,951,110 |
| Wells Fargo Commercial Mortgage Trust FRB Ser. 15-C29, Class D, 4.359%, 6/15/48 W | | 2,716,000 | 2,340,024 |
| Wells Fargo Commercial Mortgage Trust 144A | | | |
| FRB Ser. 13-LC12, Class D, 4.432%, 7/15/46 W | | 11,277,111 | 4,449,341 |
| Ser. 14-LC16, Class D, 3.938%, 8/15/50 | | 11,010,000 | 1,666,571 |
| Ser. 16-C33, Class D, 3.123%, 3/15/59 | | 310,000 | 253,855 |
| Ser. 19-C53, Class D, 2.50%, 10/15/52 | | 250,000 | 163,996 |
| WF-RBS Commercial Mortgage Trust Ser. 14-C21, Class C, 4.234%, 8/15/47 W | | 180,000 | 162,838 |
| WF-RBS Commercial Mortgage Trust 144A | | | |
| FRB Ser. 13-UBS1, Class D, 5.203%, 3/15/46 W | | 1,796,000 | 1,739,211 |
| FRB Ser. 13-UBS1, Class E, 5.203%, 3/15/46 W | | 2,518,000 | 2,415,621 |
| Ser. 11-C3, Class E, 5.00%, 3/15/44 W | | 8,644,000 | 309,455 |
| FRB Ser. 12-C9, Class E, 4.978%, 11/15/45 W | | 265,000 | 262,901 |
| FRB Ser. 13-C15, Class D, 4.671%, 8/15/46 W | | 22,811,996 | 13,743,760 |
| FRB Ser. 12-C10, Class D, 4.534%, 12/15/45 W | | 12,891,000 | 9,639,427 |
| | | 167,631,260 |
| Residential mortgage-backed securities (non-agency) (10.4%) |
| American Home Mortgage Investment Trust FRB Ser. 07-1, Class GA1C, (ICE LIBOR USD 1 Month + 0.19%), 3.274%, 5/25/47 | | 6,822,852 | 4,036,626 |
| BCAP, LLC Trust 144A FRB Ser. 11-RR3, Class 3A6, 3.366%, 11/27/36 W | | 5,428,686 | 4,342,948 |
| Bear Stearns Alt-A Trust | | | |
| FRB Ser. 05-7, Class 21A1, 3.634%, 9/25/35 W | | 1,422,592 | 1,190,884 |
| FRB Ser. 05-8, Class 21A1, 3.339%, 10/25/35 W | | 51,999 | 43,834 |
| Bear Stearns Asset Backed Securities I Trust FRB Ser. 05-HE8, Class M3, (ICE LIBOR USD 1 Month + 1.95%), 5.034%, 8/25/35 | | 309,492 | 297,938 |
| Bear Stearns Mortgage Funding Trust FRB Ser. 06-AR2, Class 2A1, (ICE LIBOR USD 1 Month + 0.23%), 3.544%, 9/25/46 | | 3,644,523 | 2,812,150 |
| Bellemeade Re, Ltd. 144A FRB Ser. 17-1, Class B1, (ICE LIBOR USD 1 Month + 4.75%), 7.834%, 10/25/27 (Bermuda) | | 150,000 | 152,015 |
| Chevy Chase Funding, LLC Mortgage-Backed Certificates 144A FRB Ser. 06-4A, Class A2, (ICE LIBOR USD 1 Month + 0.18%), 3.264%, 11/25/47 | | 2,069,074 | 1,802,316 |
| Citigroup Mortgage Loan Trust 144A Ser. 22-A, Class A1, 6.17%, 9/25/62 | | 206,421 | 204,112 |
| Citigroup Mortgage Loan Trust, Inc. | | | |
| FRB Ser. 07-AMC3, Class A2D, (ICE LIBOR USD 1 Month + 0.35%), 3.434%, 3/25/37 | | 5,585,905 | 4,882,520 |
| FRB Ser. 07-AMC3, Class A2B, (ICE LIBOR USD 1 Month + 0.18%), 3.264%, 3/25/37 | | 960,116 | 839,234 |
| COLT Mortgage Loan Trust 144A Ser. 20-2, Class A3, 3.698%, 3/25/65 W | | 410,000 | 374,448 |
| Countrywide Alternative Loan Trust | | | |
| FRB Ser. 05-38, Class A3, (ICE LIBOR USD 1 Month + 0.70%), 3.784%, 9/25/35 | | 505,964 | 437,697 |
| FRB Ser. 05-59, Class 1A1, (ICE LIBOR USD 1 Month + 0.66%), 3.674%, 11/20/35 | | 10,445,948 | 9,224,518 |
| |
34 Diversified Income Trust |
| | | |
| MORTGAGE-BACKED SECURITIES (41.4%)* cont. | Principal
amount | Value |
| Residential mortgage-backed securities (non-agency) cont. |
| Countrywide Alternative Loan Trust | | | |
| FRB Ser. 05-65CB, Class 2A1, (ICE LIBOR USD 1 Month + 0.43%), 3.509%, 12/25/35 | | $351,779 | $247,848 |
| FRB Ser. 06-OA10, Class 2A1, (ICE LIBOR USD 1 Month + 0.38%), 3.464%, 8/25/46 | | 2,161,854 | 1,754,945 |
| FRB Ser. 06-OA10, Class 3A1, (ICE LIBOR USD 1 Month + 0.38%), 3.464%, 8/25/46 | | 3,795,502 | 3,271,200 |
| FRB Ser. 06-OA10, Class 4A1, (ICE LIBOR USD 1 Month + 0.38%), 3.464%, 8/25/46 | | 7,832,573 | 6,483,657 |
| FRB Ser. 06-OA7, Class 1A1, 2.481%, 6/25/46 W | | 2,136,170 | 1,925,544 |
| FRB Ser. 06-OA10, Class 1A1, (Federal Reserve US 12 Month Cumulative Avg 1 yr CMT + 0.96%), 2.064%, 8/25/46 | | 2,414,685 | 2,215,723 |
| FRB Ser. 06-OA7, Class 1A2, (Federal Reserve US 12 Month Cumulative Avg 1 yr CMT + 0.94%), 2.044%, 6/25/46 | | 261,185 | 226,425 |
| Eagle Re, Ltd. 144A FRB Ser. 20-1, Class B1, (ICE LIBOR USD 1 Month + 2.85%), 5.934%, 1/25/30 | | 686,000 | 619,981 |
| Federal Home Loan Mortgage Corporation | | | |
| Structured Agency Credit Risk Debt FRN Ser. 15-HQA2, Class B, (ICE LIBOR USD 1 Month + 10.50%), 13.584%, 5/25/28 | | 6,314,342 | 6,626,302 |
| Structured Agency Credit Risk Debt FRN Ser. 16-DNA1, Class B, (ICE LIBOR USD 1 Month + 10.00%), 13.084%, 7/25/28 | | 2,087,003 | 2,294,839 |
| Structured Agency Credit Risk Debt FRN Ser. 15-DNA3, Class B, (ICE LIBOR USD 1 Month + 9.35%), 12.434%, 4/25/28 | | 4,563,752 | 4,709,222 |
| Structured Agency Credit Risk Debt FRN Ser. 15-DNA2, Class B, (ICE LIBOR USD 1 Month + 7.55%), 10.634%, 12/25/27 | | 8,037,733 | 8,273,718 |
| Structured Agency Credit Risk Debt FRN Ser. 17-DNA2, Class B1, (ICE LIBOR USD 1 Month + 5.15%), 8.234%, 10/25/29 | | 250,000 | 262,093 |
| Structured Agency Credit Risk Debt FRN Ser. 17-DNA1, Class B1, (ICE LIBOR USD 1 Month + 4.95%), 8.034%, 7/25/29 | | 250,000 | 260,710 |
| Structured Agency Credit Risk Debt FRN Ser. 14-DN1, Class M3, (ICE LIBOR USD 1 Month + 4.50%), 7.584%, 2/25/24 | | 228,942 | 229,487 |
| Seasoned Credit Risk Transfer Trust Ser. 19-3, Class M, 4.75%, 10/25/58 W | | 1,710,000 | 1,541,974 |
| Federal Home Loan Mortgage Corporation 144A | | | |
| Structured Agency Credit Risk Trust FRB Ser. 19-HQA1, Class B2, (ICE LIBOR USD 1 Month + 12.25%), 15.334%, 2/25/49 | | 570,000 | 640,405 |
| Structured Agency Credit Risk Trust FRB Ser. 18-HQA2, Class B2, (ICE LIBOR USD 1 Month + 11.00%), 14.084%, 10/25/48 | | 2,017,000 | 2,221,482 |
| Structured Agency Credit Risk Trust FRB Ser. 19-DNA1, Class B2, (ICE LIBOR USD 1 Month + 10.75%), 13.834%, 1/25/49 | | 111,000 | 118,302 |
| Structured Agency Credit Risk Trust REMICs FRB Ser. 20-DNA5, Class B2, (US 30 Day Average SOFR + 11.50%), 13.781%, 10/25/50 | | 256,000 | 309,257 |
| Structured Agency Credit Risk Trust FRB Ser. 19-DNA2, Class B2, (ICE LIBOR USD 1 Month + 10.50%), 13.584%, 3/25/49 | | 2,996,000 | 3,143,208 |
| Structured Agency Credit Risk Trust REMICs FRB Ser. 22-HQA1, Class B2, (US 30 Day Average SOFR + 11.00%), 13.281%, 3/25/42 | | 4,969,000 | 4,534,213 |
| Structured Agency Credit Risk Trust REMICs FRB Ser. 20-DNA4, Class B2, (ICE LIBOR USD 1 Month + 10.00%), 13.084%, 8/25/50 | | 448,000 | 503,358 |
| Structured Agency Credit Risk Trust REMICs FRB Ser. 20-HQA3, Class B2, (ICE LIBOR USD 1 Month + 10.00%), 13.084%, 7/25/50 | | 3,318,000 | 3,692,380 |
| Structured Agency Credit Risk Trust REMICs FRB Ser. 20-DNA3, Class B2, (ICE LIBOR USD 1 Month + 9.35%), 12.434%, 6/25/50 | | 239,000 | 262,432 |
| |
Diversified Income Trust 35 |
| | | |
| MORTGAGE-BACKED SECURITIES (41.4%)* cont. | Principal
amount | Value |
| Residential mortgage-backed securities (non-agency) cont. |
| Federal Home Loan Mortgage Corporation 144A | | | |
| Structured Agency Credit Risk Trust FRB Ser. 18-DNA3, Class B2, (ICE LIBOR USD 1 Month + 7.75%), 10.834%, 9/25/48 | | $408,000 | $398,310 |
| Structured Agency Credit Risk Trust FRB Ser. 18-HQA2, Class B1, (ICE LIBOR USD 1 Month + 4.25%), 7.334%, 10/25/48 | | 753,000 | 776,767 |
| Structured Agency Credit Risk Trust REMICs FRB Ser. 20-HQA2, Class M2, (ICE LIBOR USD 1 Month + 3.10%), 6.184%, 3/25/50 | | 469,529 | 475,864 |
| Seasoned Credit Risk Transfer Trust Ser. 19-2, Class M, 4.75%, 8/25/58 W | | 5,008,000 | 4,311,047 |
| Seasoned Credit Risk Transfer Trust FRB Ser. 17-2, Class 2, 4.00%, 8/25/56 W | | 192,773 | 187,517 |
| Federal National Mortgage Association | | | |
Connecticut Avenue Securities FRB Ser. 16-C02, Class 1B,
(ICE LIBOR USD 1 Month + 12.25%), 15.334%, 9/25/28 | | 14,082,384 | 15,708,259 |
Connecticut Avenue Securities FRB Ser. 16-C03, Class 1B,
(ICE LIBOR USD 1 Month + 11.75%), 14.834%, 10/25/28 | | 7,687,442 | 8,328,628 |
Connecticut Avenue Securities FRB Ser. 16-C01, Class 1B,
(ICE LIBOR USD 1 Month + 11.75%), 14.834%, 8/25/28 | | 5,407,810 | 5,929,783 |
Connecticut Avenue Securities FRB Ser. 16-C05, Class 2B,
(ICE LIBOR USD 1 Month + 10.75%), 13.834%, 1/25/29 | | 444,247 | 470,074 |
Connecticut Avenue Securities FRB Ser. 16-C04, Class 1B,
(ICE LIBOR USD 1 Month + 10.25%), 13.334%, 1/25/29 | | 148,355 | 153,134 |
Connecticut Avenue Securities FRB Ser. 16-C06, Class 1B,
(ICE LIBOR USD 1 Month + 9.25%), 12.334%, 4/25/29 | | 416,400 | 430,598 |
Connecticut Avenue Securities FRB Ser. 15-C04, Class 1M2,
(ICE LIBOR USD 1 Month + 5.70%), 8.784%, 4/25/28 | | 451,286 | 467,251 |
Connecticut Avenue Securities FRB Ser. 17-C02, Class 2B1,
(ICE LIBOR USD 1 Month + 5.50%), 8.584%, 9/25/29 | | 395,000 | 417,881 |
Connecticut Avenue Securities FRB Ser. 16-C03, Class 1M2,
(ICE LIBOR USD 1 Month + 5.30%), 8.384%, 10/25/28 | | 98,431 | 101,811 |
Connecticut Avenue Securities FRB Ser. 17-C03, Class 1B1,
(ICE LIBOR USD 1 Month + 4.85%), 7.934%, 10/25/29 | | 393,000 | 409,271 |
Connecticut Avenue Securities FRB Ser. 18-C04, Class 2B1,
(ICE LIBOR USD 1 Month + 4.50%), 7.584%, 12/25/30 | | 368,000 | 378,494 |
Connecticut Avenue Securities FRB Ser. 17-C07, Class 2B1,
(ICE LIBOR USD 1 Month + 4.45%), 7.534%, 5/25/30 | | 28,000 | 28,706 |
Connecticut Avenue Securities FRB Ser. 17-C06, Class 2B1,
(ICE LIBOR USD 1 Month + 4.45%), 7.534%, 2/25/30 | | 70,000 | 72,297 |
Connecticut Avenue Securities FRB Ser. 15-C01, Class 1M2,
(ICE LIBOR USD 1 Month + 4.30%), 7.384%, 2/25/25 | | 40,726 | 41,485 |
Connecticut Avenue Securities FRB Ser. 18-C05, Class 1B1,
(ICE LIBOR USD 1 Month + 4.25%), 7.334%, 1/25/31 | | 217,000 | 221,705 |
Connecticut Avenue Securities FRB Ser. 18-C06, Class 2B1,
(ICE LIBOR USD 1 Month + 4.10%), 7.184%, 3/25/31 | | 1,624,000 | 1,608,194 |
Connecticut Avenue Securities FRB Ser. 15-C02, Class 1M2,
(ICE LIBOR USD 1 Month + 4.00%), 7.084%, 5/25/25 | | 161,348 | 164,140 |
Connecticut Avenue Securities FRB Ser. 18-C06, Class 1B1,
(ICE LIBOR USD 1 Month + 3.75%), 6.834%, 3/25/31 | | 313,000 | 309,088 |
Connecticut Avenue Securities FRB Ser. 18-C03, Class 1B1,
(ICE LIBOR USD 1 Month + 3.75%), 6.834%, 10/25/30 | | 500,000 | 506,094 |
Connecticut Avenue Securities FRB Ser. 17-C05, Class 1B1,
(ICE LIBOR USD 1 Month + 3.60%), 6.684%, 1/25/30 | | 320,000 | 317,358 |
| |
36 Diversified Income Trust |
| | | |
| MORTGAGE-BACKED SECURITIES (41.4%)* cont. | Principal
amount | Value |
| Residential mortgage-backed securities (non-agency) cont. |
| Federal National Mortgage Association | | | |
Connecticut Avenue Securities FRB Ser. 17-C04, Class 2M2,
(ICE LIBOR USD 1 Month + 2.85%), 5.934%, 11/25/29 | | $201,564 | $201,563 |
Connecticut Avenue Securities FRB Ser. 18-C06, Class 2M2,
(ICE LIBOR USD 1 Month + 2.10%), 5.184%, 3/25/31 | | 657,225 | 645,552 |
| Federal National Mortgage Association 144A | | | |
| Connecticut Avenue Securities Trust FRB Ser. 19-HRP1, Class B1, (ICE LIBOR USD 1 Month + 9.25%), 12.334%, 11/25/39 | | 4,100,000 | 4,018,046 |
| Connecticut Avenue Securities Trust FRB Ser. 20-SBT1, Class 1B1, (ICE LIBOR USD 1 Month + 6.75%), 9.834%, 2/25/40 | | 1,645,000 | 1,534,349 |
| Connecticut Avenue Securities FRB Ser. 17-C01, Class 1B1, (ICE LIBOR USD 1 Month + 5.75%), 8.834%, 7/25/29 | | 3,761,000 | 4,036,676 |
| Connecticut Avenue Securities Trust FRB Ser. 19-R04, Class 2B1, (ICE LIBOR USD 1 Month + 5.25%), 8.334%, 6/25/39 | | 546,637 | 559,300 |
| Connecticut Avenue Securities Trust FRB Ser. 21-R01, Class 1B2, (US 30 Day Average SOFR + 6.00%), 8.281%, 10/25/41 | | 185,000 | 162,242 |
| Connecticut Avenue Securities Trust FRB Ser. 19-R03, Class 1B1, (ICE LIBOR USD 1 Month + 4.10%), 7.184%, 9/25/31 | | 314,000 | 312,186 |
| Connecticut Avenue Securities Trust FRB Ser. 22-R02, Class 2B1, (US 30 Day Average SOFR + 4.50%), 6.781%, 1/25/42 | | 1,471,000 | 1,299,077 |
| Connecticut Avenue Securities Trust FRB Ser. 20-SBT1, Class 1M2, (ICE LIBOR USD 1 Month + 3.65%), 6.734%, 2/25/40 | | 239,000 | 236,720 |
| Connecticut Avenue Securities Trust FRB Ser. 20-R02, Class 2B1, (ICE LIBOR USD 1 Month + 3.00%), 6.084%, 1/25/40 | | 126,000 | 113,937 |
| Connecticut Avenue Securities Trust FRB Ser. 19-R01, Class 2M2, (ICE LIBOR USD 1 Month + 2.45%), 5.534%, 7/25/31 | | 86,389 | 86,227 |
| Connecticut Avenue Securities Trust FRB Ser. 22-R02, Class 2M2, (US 30 Day Average SOFR + 3.00%), 5.281%, 1/25/42 | | 3,600,000 | 3,286,407 |
| GSAA Home Equity Trust FRB Ser. 06-8, Class 2A2, (ICE LIBOR USD 1 Month + 0.36%), 3.444%, 5/25/36 | | 9,191,437 | 2,529,754 |
| GSR Mortgage Loan Trust FRB Ser. 07-OA1, Class 2A3A, (ICE LIBOR USD 1 Month + 0.31%), 3.394%, 5/25/37 | | 4,185,308 | 3,086,390 |
HarborView Mortgage Loan Trust FRB Ser. 05-2, Class 1A,
(ICE LIBOR USD 1 Month + 0.52%), 3.513%, 5/19/35 | | 10,691,729 | 3,783,389 |
| JPMorgan Alternative Loan Trust FRB Ser. 07-A2, Class 12A1, IO, (ICE LIBOR USD 1 Month + 0.20%), 3.484%, 6/25/37 | | 4,022,519 | 1,751,864 |
Morgan Stanley Re-REMIC Trust 144A FRB Ser. 10-R4, Class 4B,
(ICE LIBOR USD 1 Month + 0.23%), 2.312%, 2/26/37 | | 139,798 | 119,655 |
| Oaktown Re III, Ltd. 144A | | | |
| FRB Ser. 19-1A, Class B1B, (ICE LIBOR USD 1 Month + 4.35%), 7.434%, 7/25/29 (Bermuda) | | 383,000 | 380,868 |
| FRB Ser. 19-1A, Class B1A, (ICE LIBOR USD 1 Month + 3.50%), 6.584%, 7/25/29 (Bermuda) | | 317,000 | 308,283 |
| Structured Asset Mortgage Investments II Trust FRB Ser. 06-AR7, Class A1A, (ICE LIBOR USD 1 Month + 0.21%), 3.504%, 8/25/36 | | 7,500,702 | 6,750,554 |
| Towd Point Mortgage Trust 144A | | | |
| Ser. 19-2, Class A2, 3.75%, 12/25/58 W | | 256,000 | 231,461 |
| Ser. 18-5, Class M1, 3.25%, 7/25/58 W | | 240,000 | 193,362 |
| |
Diversified Income Trust 37 |
| | | |
| MORTGAGE-BACKED SECURITIES (41.4%)* cont. | Principal
amount | Value |
| Residential mortgage-backed securities (non-agency) cont. |
| WaMu Mortgage Pass-Through Certificates Trust | | | |
| FRB Ser. 05-AR13, Class A1C3, (ICE LIBOR USD 1 Month + 0.98%), 4.064%, 10/25/45 | | $100,862 | $94,380 |
| FRB Ser. 05-AR10, Class 1A3, 3.835%, 9/25/35 W | | 112,687 | 101,940 |
| | | 165,047,883 |
| Total mortgage-backed securities (cost $753,111,119) | $658,988,798 |
|
| | | |
| CORPORATE BONDS AND NOTES (15.8%)* | Principal
amount | Value |
| Basic materials (1.4%) |
| Avient Corp. 144A sr. unsec. unsub. notes 7.125%, 8/1/30 | | $160,000 | $147,669 |
| Beacon Roofing Supply, Inc. 144A company guaranty sr. notes 4.50%, 11/15/26 | | 30,000 | 27,293 |
| Big River Steel, LLC/BRS Finance Corp. 144A sr. notes 6.625%, 1/31/29 | | 1,200,000 | 1,104,456 |
| Boise Cascade Co. 144A company guaranty sr. unsec. notes 4.875%, 7/1/30 | | 320,000 | 265,822 |
| Builders FirstSource, Inc. 144A company guaranty sr. unsec. bonds 6.375%, 6/15/32 | | 260,000 | 230,944 |
| Builders FirstSource, Inc. 144A company guaranty sr. unsec. bonds 4.25%, 2/1/32 | | 615,000 | 471,788 |
| BWAY Holding Co. 144A sr. unsec. notes 7.25%, 4/15/25 | | 1,295,000 | 1,139,173 |
| Celanese US Holdings, LLC company guaranty sr. unsec. notes 6.33%, 7/15/29 (Germany) | | 745,000 | 694,358 |
| Celanese US Holdings, LLC company guaranty sr. unsec. notes 6.165%, 7/15/27 (Germany) | | 1,310,000 | 1,239,790 |
| CF Industries, Inc. company guaranty sr. unsec. bonds 4.95%, 6/1/43 | | 4,755,000 | 3,875,325 |
| Commercial Metals Co. sr. unsec. notes 4.375%, 3/15/32 | | 25,000 | 19,750 |
| Commercial Metals Co. sr. unsec. notes 4.125%, 1/15/30 | | 37,000 | 30,378 |
| Freeport-McMoRan, Inc. company guaranty sr. unsec. bonds 4.625%, 8/1/30 (Indonesia) | | 825,000 | 722,888 |
| Freeport-McMoRan, Inc. company guaranty sr. unsec. notes 4.375%, 8/1/28 (Indonesia) | | 50,000 | 45,023 |
| Freeport-McMoRan, Inc. company guaranty sr. unsec. unsub. notes 5.45%, 3/15/43 (Indonesia) | | 2,359,000 | 1,968,114 |
| Herens Holdco SARL 144A company guaranty sr. notes 4.75%, 5/15/28 (Luxembourg) | | 372,000 | 297,600 |
| Kleopatra Holdings 2 SCA company guaranty sr. unsec. notes Ser. REGS, 6.50%, 9/1/26 (Luxembourg) | EUR | 1,290,000 | 797,802 |
| Louisiana-Pacific Corp. 144A sr. unsec. notes 3.625%, 3/15/29 | | $140,000 | 109,990 |
| LSF11 A5 HoldCo, LLC 144A sr. unsec. notes 6.625%, 10/15/29 | | 1,300,000 | 975,000 |
| Mauser Packaging Solutions Holding Co. 144A sr. notes 8.50%, 4/15/24 | | 30,000 | 28,500 |
| Mauser Packaging Solutions Holding Co. 144A sr. notes 5.50%, 4/15/24 | | 15,000 | 14,250 |
| Mercer International, Inc. sr. unsec. notes 5.50%, 1/15/26 (Canada) | | 100,000 | 92,269 |
| Mercer International, Inc. sr. unsec. notes 5.125%, 2/1/29 (Canada) | | 265,000 | 211,173 |
| Novelis Corp. 144A company guaranty sr. unsec. bonds 3.875%, 8/15/31 | | 175,000 | 130,536 |
| |
38 Diversified Income Trust |
| | | |
| CORPORATE BONDS AND NOTES (15.8%)* cont. | Principal
amount | Value |
| Basic materials cont. |
| Novelis Corp. 144A company guaranty sr. unsec. notes 4.75%, 1/30/30 | | $65,000 | $53,300 |
| Novelis Corp. 144A company guaranty sr. unsec. notes 3.25%, 11/15/26 | | 434,000 | 362,273 |
| Olympus Water US Holding Corp. 144A sr. unsec. notes 6.25%, 10/1/29 | | 2,035,000 | 1,393,975 |
| Sylvamo Corp. 144A company guaranty sr. unsec. notes 7.00%, 9/1/29 | | 2,064,000 | 1,775,040 |
| Trinseo Materials Operating SCA/Trinseo Materials Finance, Inc. 144A company guaranty sr. unsec. notes 5.125%, 4/1/29 (Luxembourg) | | 1,420,000 | 837,800 |
| Tronox, Inc. 144A company guaranty sr. unsec. notes 4.625%, 3/15/29 | | 80,000 | 59,200 |
| WR Grace Holdings, LLC 144A company guaranty sr. notes 5.625%, 10/1/24 | | 3,578,000 | 3,479,606 |
| WR Grace Holdings, LLC 144A company guaranty sr. notes 4.875%, 6/15/27 | | 443,000 | 380,816 |
| | | 22,981,901 |
| Capital goods (0.8%) |
| Allison Transmission, Inc. 144A company guaranty sr. unsec. bonds 3.75%, 1/30/31 | | 50,000 | 38,330 |
| Allison Transmission, Inc. 144A company guaranty sr. unsec. notes 4.75%, 10/1/27 | | 332,000 | 292,383 |
| Amsted Industries, Inc. 144A company guaranty sr. unsec. sub. notes 5.625%, 7/1/27 | | 65,000 | 59,800 |
| Amsted Industries, Inc. 144A sr. unsec. bonds 4.625%, 5/15/30 | | 90,000 | 74,493 |
| Clarios Global LP 144A company guaranty sr. notes 6.75%, 5/15/25 | | 59,000 | 57,775 |
| Covanta Holding Corp. 144A company guaranty sr. unsec. notes 4.875%, 12/1/29 | | 805,000 | 650,649 |
| Crown Cork & Seal Co., Inc. company guaranty sr. unsec. bonds 7.375%, 12/15/26 | | 138,000 | 138,000 |
| GFL Environmental, Inc. 144A company guaranty sr. unsec. notes 4.75%, 6/15/29 (Canada) | | 230,000 | 193,200 |
| GFL Environmental, Inc. 144A company guaranty sr. unsec. notes 4.00%, 8/1/28 (Canada) | | 284,000 | 236,709 |
| GFL Environmental, Inc. 144A sr. notes 5.125%, 12/15/26 (Canada) | | 90,000 | 83,812 |
| Granite US Holdings Corp. 144A company guaranty sr. unsec. notes 11.00%, 10/1/27 | | 1,000,000 | 942,708 |
| Howmet Aerospace, Inc. sr. unsec. unsub. notes 3.00%, 1/15/29 | | 454,000 | 370,900 |
| Madison IAQ, LLC 144A sr. notes 4.125%, 6/30/28 | | 465,000 | 373,485 |
| MajorDrive Holdings IV, LLC 144A sr. unsec. notes 6.375%, 6/1/29 | | 1,000,000 | 689,450 |
| Roller Bearing Co. of America, Inc. 144A sr. notes 4.375%, 10/15/29 | | 285,000 | 240,394 |
| Sensata Technologies BV 144A company guaranty sr. unsec. notes 4.00%, 4/15/29 | | 110,000 | 91,025 |
| Sensata Technologies BV 144A company guaranty sr. unsec. unsub. notes 5.875%, 9/1/30 | | 185,000 | 173,098 |
| Staples, Inc. 144A sr. notes 7.50%, 4/15/26 | | 2,275,000 | 1,910,113 |
| Stevens Holding Co., Inc. 144A company guaranty sr. unsec. notes 6.125%, 10/1/26 | | 1,259,000 | 1,230,421 |
| TransDigm, Inc. company guaranty sr. unsec. sub. notes 6.375%, 6/15/26 | | 68,000 | 64,244 |
| |
Diversified Income Trust 39 |
| | | |
| CORPORATE BONDS AND NOTES (15.8%)* cont. | Principal
amount | Value |
| Capital goods cont. |
| TransDigm, Inc. company guaranty sr. unsec. sub. notes 5.50%, 11/15/27 | | $692,000 | $601,832 |
| TransDigm, Inc. company guaranty sr. unsec. sub. notes 4.875%, 5/1/29 | | 1,405,000 | 1,135,669 |
| TransDigm, Inc. company guaranty sr. unsec. sub. notes 4.625%, 1/15/29 | | 940,000 | 756,728 |
| Vertiv Group Corp. 144A company guaranty sr. notes 4.125%, 11/15/28 | | 982,000 | 790,510 |
| Waste Pro USA, Inc. 144A sr. unsec. notes 5.50%, 2/15/26 | | 142,000 | 124,751 |
| WESCO Distribution, Inc. 144A company guaranty sr. unsec. unsub. notes 7.25%, 6/15/28 | | 100,000 | 97,945 |
| WESCO Distribution, Inc. 144A company guaranty sr. unsec. unsub. notes 7.125%, 6/15/25 | | 1,121,000 | 1,121,616 |
| | | 12,540,040 |
| Communication services (1.4%) |
| Altice France SA 144A company guaranty sr. notes 5.50%, 10/15/29 (France) | | 500,000 | 376,192 |
| Altice France SA 144A company guaranty sr. notes 5.50%, 1/15/28 (France) | | 820,000 | 647,800 |
| CCO Holdings, LLC/CCO Holdings Capital Corp. sr. unsec. bonds 4.50%, 5/1/32 | | 1,420,000 | 1,082,992 |
| CCO Holdings, LLC/CCO Holdings Capital Corp. 144A company guaranty sr. unsec. bonds 5.50%, 5/1/26 | | 113,000 | 107,068 |
| CCO Holdings, LLC/CCO Holdings Capital Corp. 144A sr. unsec. bonds 5.375%, 6/1/29 | | 1,614,000 | 1,412,766 |
| CCO Holdings, LLC/CCO Holdings Capital Corp. 144A sr. unsec. bonds 4.75%, 3/1/30 | | 680,000 | 551,650 |
| CCO Holdings, LLC/CCO Holdings Capital Corp. 144A sr. unsec. bonds 4.50%, 8/15/30 | | 45,000 | 35,588 |
| CCO Holdings, LLC/CCO Holdings Capital Corp. 144A sr. unsec. notes 5.00%, 2/1/28 | | 157,000 | 135,375 |
| CCO Holdings, LLC/CCO Holdings Capital Corp. 144A sr. unsec. notes 4.25%, 2/1/31 | | 363,000 | 278,436 |
| Charter Communications Operating, LLC/Charter Communications Operating Capital sr. bonds 3.70%, 4/1/51 | | 700,000 | 424,235 |
| CSC Holdings, LLC sr. unsec. unsub. bonds 5.25%, 6/1/24 | | 280,000 | 259,000 |
| CSC Holdings, LLC 144A company guaranty sr. unsec. notes 5.375%, 2/1/28 | | 2,315,000 | 2,019,838 |
| CSC Holdings, LLC 144A sr. unsec. bonds 5.75%, 1/15/30 | | 858,000 | 609,836 |
| DIRECTV Holdings, LLC/DIRECTV Financing Co., Inc. 144A sr. notes 5.875%, 8/15/27 | | 1,711,000 | 1,475,070 |
| DISH DBS Corp. company guaranty sr. unsec. unsub. notes 5.875%, 11/15/24 | | 1,245,000 | 1,111,163 |
| DISH DBS Corp. 144A company guaranty sr. notes 5.75%, 12/1/28 | | 276,000 | 208,585 |
| DISH DBS Corp. 144A company guaranty sr. notes 5.25%, 12/1/26 | | 345,000 | 282,641 |
| Embarq Corp. sr. unsec. unsub. bonds 7.995%, 6/1/36 | | 2,510,000 | 1,255,000 |
| Frontier Communications Corp. 144A company guaranty sr. notes 5.875%, 10/15/27 | | 945,000 | 846,937 |
| Frontier Communications Corp. 144A notes 6.75%, 5/1/29 | | 1,000,000 | 825,000 |
| IHS Holding, Ltd. company guaranty sr. unsec. notes Ser. REGS, 6.25%, 11/29/28 (Nigeria) | | 5,290,000 | 4,060,075 |
| |
40 Diversified Income Trust |
| | | |
| CORPORATE BONDS AND NOTES (15.8%)* cont. | Principal
amount | Value |
| Communication services cont. |
| Level 3 Financing, Inc. 144A company guaranty sr. unsec. notes 4.625%, 9/15/27 | | $66,000 | $54,620 |
| Sprint Capital Corp. company guaranty sr. unsec. unsub. notes 6.875%, 11/15/28 | | 802,000 | 824,055 |
| Sprint Corp. company guaranty sr. unsec. notes 7.625%, 3/1/26 | | 600,000 | 620,599 |
| Sprint Corp. company guaranty sr. unsec. sub. notes 7.875%, 9/15/23 | | 347,000 | 350,545 |
| T-Mobile USA, Inc. company guaranty sr. notes 3.875%, 4/15/30 | | 45,000 | 39,916 |
| T-Mobile USA, Inc. company guaranty sr. notes 3.75%, 4/15/27 | | 105,000 | 96,898 |
| T-Mobile USA, Inc. company guaranty sr. unsec. bonds 2.875%, 2/15/31 | | 940,000 | 757,490 |
| T-Mobile USA, Inc. company guaranty sr. unsec. notes 5.375%, 4/15/27 | | 22,000 | 21,618 |
| T-Mobile USA, Inc. company guaranty sr. unsec. notes 2.625%, 2/15/29 | | 675,000 | 557,307 |
| T-Mobile USA, Inc. company guaranty sr. unsec. unsub. bonds 4.75%, 2/1/28 | | 448,000 | 422,916 |
| Virgin Media Secured Finance PLC 144A company guaranty sr. bonds 5.00%, 4/15/27 (United Kingdom) | GBP | 100,000 | 96,530 |
| | | 21,847,741 |
| Conglomerates (0.1%) |
| General Electric Co. jr. unsec. sub. FRN (ICE LIBOR USD 3 Month + 3.33%), 6.623%, perpetual maturity | | $1,000,000 | 935,183 |
| | | 935,183 |
| Consumer cyclicals (2.7%) |
| ADT Security Corp. 144A sr. notes 4.125%, 8/1/29 | | 775,000 | 643,250 |
| AMC Entertainment Holdings, Inc. 144A company guaranty notes 10.00% (12.00%), 6/15/26 ‡‡ | | 1,250,000 | 853,125 |
| American Builders & Contractors Supply Co., Inc. 144A sr. notes 4.00%, 1/15/28 | | 45,000 | 39,365 |
| American Builders & Contractors Supply Co., Inc. 144A sr. unsec. notes 3.875%, 11/15/29 | | 655,000 | 512,538 |
| Bath & Body Works, Inc. company guaranty sr. unsec. bonds 6.75%, perpetual maturity | | 49,000 | 40,376 |
| Bath & Body Works, Inc. company guaranty sr. unsec. notes 7.50%, perpetual maturity | | 1,225,000 | 1,120,875 |
| Bath & Body Works, Inc. 144A company guaranty sr. unsec. notes 9.375%, 7/1/25 | | 12,000 | 12,420 |
| Bath & Body Works, Inc. 144A company guaranty sr. unsec. unsub. bonds 6.625%, 10/1/30 | | 695,000 | 604,650 |
| Beasley Mezzanine Holdings, LLC 144A company guaranty sr. notes 8.625%, 2/1/26 | | 1,500,000 | 1,155,000 |
| Block, Inc. sr. unsec. notes 3.50%, 6/1/31 | | 870,000 | 674,524 |
| Boyd Gaming Corp. company guaranty sr. unsec. notes 4.75%, 12/1/27 | | 45,000 | 39,825 |
| Caesars Resort Collection, LLC/CRC Finco, Inc. 144A company guaranty sr. notes 5.75%, 7/1/25 | | 2,495,000 | 2,407,426 |
| Camelot Return Merger Sub, Inc. 144A sr. notes 8.75%, 8/1/28 | | 140,000 | 115,388 |
| Carnival Corp. 144A notes 10.50%, 2/1/26 | | 379,000 | 374,987 |
| Carnival Corp. 144A sr. unsec. notes 5.75%, 3/1/27 | | 2,095,000 | 1,467,653 |
| CDI Escrow Issuer, Inc. 144A sr. unsec. notes 5.75%, 4/1/30 | | 416,000 | 362,961 |
| |
Diversified Income Trust 41 |
| | | |
| CORPORATE BONDS AND NOTES (15.8%)* cont. | Principal
amount | Value |
| Consumer cyclicals cont. |
| Cengage Learning, Inc. 144A sr. unsec. unsub. notes 9.50%, 6/15/24 | | $1,000,000 | $937,500 |
| Cinemark USA, Inc. 144A company guaranty sr. notes 8.75%, 5/1/25 | | 355,000 | 358,888 |
| Diamond Sports Group, LLC/Diamond Sports Finance Co. 144A company guaranty notes 5.375%, 8/15/26 | | 115,000 | 22,891 |
| Entercom Media Corp. 144A company guaranty notes 6.75%, 3/31/29 | | 1,390,000 | 334,847 |
| Entercom Media Corp. 144A company guaranty notes 6.50%, 5/1/27 | | 1,499,000 | 367,255 |
| Ford Motor Credit Co., LLC sr. unsec. unsub. notes 4.271%, 1/9/27 | | 1,034,000 | 904,750 |
| Ford Motor Credit Co., LLC sr. unsec. unsub. notes 4.00%, 11/13/30 | | 2,260,000 | 1,762,800 |
| Full House Resorts, Inc. 144A company guaranty sr. notes 8.25%, 2/15/28 | | 1,295,000 | 1,165,668 |
| Gartner, Inc. 144A company guaranty sr. unsec. bonds 3.75%, 10/1/30 | | 1,165,000 | 952,388 |
| Gartner, Inc. 144A company guaranty sr. unsec. notes 3.625%, 6/15/29 | | 235,000 | 195,638 |
| General Motors Co. sr. unsec. bonds 5.20%, 4/1/45 | | 1,000,000 | 761,421 |
| Hanesbrands, Inc. 144A company guaranty sr. unsec. unsub. notes 4.625%, 5/15/24 | | 70,000 | 66,745 |
| iHeartCommunications, Inc. company guaranty sr. unsec. notes 8.375%, 5/1/27 | | 1,500,000 | 1,260,000 |
| JELD-WEN, Inc. 144A company guaranty sr. sub. notes 6.25%, 5/15/25 | | 26,000 | 24,473 |
| JELD-WEN, Inc. 144A company guaranty sr. unsec. notes 4.875%, 12/15/27 | | 47,000 | 33,605 |
| La Financiere Atalian SASU company guaranty sr. unsec. notes Ser. REGS, 4.00%, 5/15/24 (France) | EUR | 1,400,000 | 1,300,092 |
| Levi Strauss & Co. 144A sr. unsec. sub. bonds 3.50%, 3/1/31 | | $675,000 | 526,500 |
| Masonite International Corp. 144A company guaranty sr. unsec. notes 5.375%, 2/1/28 | | 35,000 | 30,959 |
| Masonite International Corp. 144A company guaranty sr. unsec. notes 3.50%, 2/15/30 | | 880,000 | 672,766 |
| Mattel, Inc. 144A company guaranty sr. unsec. notes 3.75%, 4/1/29 | | 1,045,000 | 878,631 |
| Mattel, Inc. 144A company guaranty sr. unsec. notes 3.375%, 4/1/26 | | 20,000 | 17,849 |
| McGraw-Hill Education, Inc. 144A sr. notes 5.75%, 8/1/28 | | 995,000 | 830,841 |
| McGraw-Hill Education, Inc. 144A sr. unsec. notes 8.00%, 8/1/29 | | 1,000,000 | 820,975 |
| Moody’s Corp. sr. unsec. bonds 3.10%, 11/29/61 | | 500,000 | 304,658 |
| NESCO Holdings II, Inc. 144A company guaranty notes 5.50%, 4/15/29 | | 1,035,000 | 862,662 |
| News Corp. 144A company guaranty sr. unsec. unsub. bonds 5.125%, 2/15/32 | | 77,000 | 67,568 |
| News Corp. 144A sr. unsec. notes 3.875%, 5/15/29 | | 1,050,000 | 891,303 |
| Nielsen Finance, LLC/Nielsen Finance Co. 144A company guaranty sr. unsec. notes 4.50%, 7/15/29 | | 495,000 | 492,810 |
| Prime Security Services Borrower, LLC/Prime Finance, Inc. 144A company guaranty sr. notes 3.375%, 8/31/27 | | 790,000 | 663,735 |
| PulteGroup, Inc. company guaranty sr. unsec. unsub. notes 7.875%, 6/15/32 | | 94,000 | 97,760 |
| Royal Caribbean Cruises, Ltd. 144A company guaranty sr. unsec. unsub. notes 9.25%, 1/15/29 | | 140,000 | 137,950 |
| |
42 Diversified Income Trust |
| | | |
| CORPORATE BONDS AND NOTES (15.8%)* cont. | Principal
amount | Value |
| Consumer cyclicals cont. |
| Sabre GLBL, Inc. 144A company guaranty sr. notes 9.25%, 4/15/25 | | $2,362,000 | $2,261,403 |
| Scotts Miracle-Gro Co. (The) company guaranty sr. unsec. notes 4.50%, 10/15/29 | | 2,148,000 | 1,557,295 |
| Shift4 Payments, LLC/Shift4 Payments Finance Sub, Inc. 144A company guaranty sr. unsec. notes 4.625%, 11/1/26 | | 87,000 | 79,333 |
| Sirius XM Radio, Inc. 144A company guaranty sr. unsec. bonds 3.875%, 9/1/31 | | 2,485,000 | 1,926,969 |
| Sirius XM Radio, Inc. 144A company guaranty sr. unsec. notes 4.00%, 7/15/28 | | 115,000 | 97,817 |
| Spanish Broadcasting System, Inc. 144A sr. notes 9.75%, 3/1/26 | | 1,500,000 | 945,000 |
| Spectrum Brands, Inc. 144A company guaranty sr. unsec. bonds 5.00%, 10/1/29 | | 45,000 | 35,797 |
| Standard Industries, Inc. 144A sr. unsec. bonds 3.375%, 1/15/31 | | 590,000 | 414,948 |
| Standard Industries, Inc. 144A sr. unsec. notes 5.00%, 2/15/27 | | 495,000 | 438,030 |
| Standard Industries, Inc. 144A sr. unsec. notes 4.75%, 1/15/28 | | 145,000 | 122,507 |
| Station Casinos, LLC 144A sr. unsec. notes 4.50%, 2/15/28 | | 1,530,000 | 1,255,773 |
| SugarHouse HSP Gaming Prop. Mezz LP/SugarHouse HSP Gaming Finance Corp. 144A company guaranty sr. unsub. notes 5.875%, 5/15/25 | | 1,340,000 | 1,239,543 |
| Univision Communications, Inc. 144A company guaranty sr. notes 4.50%, 5/1/29 | | 172,000 | 140,261 |
| Univision Communications, Inc. 144A sr. notes 7.375%, 6/30/30 | | 167,000 | 158,650 |
| Victoria’s Secret & Co. 144A sr. unsec. notes 4.625%, 7/15/29 | | 600,000 | 450,000 |
| White Cap Buyer, LLC 144A sr. unsec. notes 6.875%, 10/15/28 | | 1,000,000 | 815,960 |
| Wynn Las Vegas, LLC/Wynn Las Vegas Capital Corp. 144A company guaranty sr. unsec. sub. notes 5.25%, 5/15/27 | | 853,000 | 750,810 |
| Wynn Resorts Finance, LLC/Wynn Resorts Capital Corp. 144A sr. unsec. bonds 5.125%, 10/1/29 | | 2,019,000 | 1,631,756 |
| | | 42,492,143 |
| Consumer staples (0.8%) |
| 1011778 BC ULC/New Red Finance, Inc. 144A company guaranty sr. notes 3.875%, 1/15/28 (Canada) | | 230,000 | 198,950 |
| Albertsons Cos., Inc./Safeway, Inc./New Albertsons LP/Albertsons, LLC 144A company guaranty sr. unsec. notes 4.875%, 2/15/30 | | 580,000 | 490,686 |
| Albertsons Cos., Inc./Safeway, Inc./New Albertsons LP/Albertsons, LLC 144A company guaranty sr. unsec. notes 3.50%, 3/15/29 | | 3,715,000 | 2,994,290 |
| Brand Energy & Infrastructure Services, Inc. 144A sr. unsec. notes 8.50%, 7/15/25 | | 750,000 | 541,875 |
| CDW, LLC/CDW Finance Corp. company guaranty sr. unsec. notes 3.25%, 2/15/29 | | 16,000 | 12,993 |
| Herc Holdings, Inc. 144A company guaranty sr. unsec. notes 5.50%, 7/15/27 | | 1,975,000 | 1,777,500 |
| Hertz Corp. (The) 144A company guaranty sr. unsec. notes 4.625%, 12/1/26 | | 1,245,000 | 1,011,390 |
| KFC Holding Co./Pizza Hut Holdings, LLC/Taco Bell of America, LLC 144A company guaranty sr. unsec. notes 4.75%, 6/1/27 | | 54,000 | 50,164 |
| Lamb Weston Holdings, Inc. 144A company guaranty sr. unsec. notes 4.875%, 5/15/28 | | 695,000 | 630,455 |
| Lamb Weston Holdings, Inc. 144A company guaranty sr. unsec. notes 4.125%, 1/31/30 | | 505,000 | 427,356 |
| |
Diversified Income Trust 43 |
| | | |
| CORPORATE BONDS AND NOTES (15.8%)* cont. | Principal
amount | Value |
| Consumer staples cont. |
| Match Group Holdings II, LLC 144A sr. unsec. bonds 5.00%, 12/15/27 | | $151,000 | $134,768 |
| Match Group Holdings II, LLC 144A sr. unsec. bonds 3.625%, 10/1/31 | | 345,000 | 260,475 |
| Match Group Holdings II, LLC 144A sr. unsec. notes 4.125%, 8/1/30 | | 22,000 | 18,068 |
| Match Group Holdings II, LLC 144A sr. unsec. unsub. notes 4.625%, 6/1/28 | | 840,000 | 733,951 |
| Netflix, Inc. sr. unsec. bonds Ser. REGS, 3.875%, 11/15/29 | EUR | 110,000 | 95,080 |
| Netflix, Inc. sr. unsec. notes 5.875%, 2/15/25 | | $15,000 | 14,988 |
| Netflix, Inc. sr. unsec. notes 4.875%, 4/15/28 | | 80,000 | 74,873 |
| Netflix, Inc. sr. unsec. unsub. notes 5.875%, 11/15/28 | | 2,159,000 | 2,106,709 |
| Netflix, Inc. 144A sr. unsec. bonds 5.375%, 11/15/29 | | 50,000 | 47,000 |
| Newell Brands, Inc. sr. unsec. notes 4.875%, 6/1/25 | | 55,000 | 53,169 |
| Newell Brands, Inc. sr. unsec. unsub. notes 4.45%, 4/1/26 | | 730,000 | 671,600 |
| Yum! Brands, Inc. sr. unsec. bonds 5.375%, 4/1/32 | | 190,000 | 168,461 |
| Yum! Brands, Inc. sr. unsec. sub. bonds 3.625%, 3/15/31 | | 50,000 | 39,960 |
| Yum! Brands, Inc. 144A sr. unsec. bonds 4.75%, 1/15/30 | | 955,000 | 834,584 |
| | | 13,389,345 |
| Energy (4.3%) |
| Antero Midstream Partners LP/Antero Midstream Finance Corp. 144A company guaranty sr. unsec. notes 7.875%, 5/15/26 | | 780,000 | 783,900 |
| Apache Corp. sr. unsec. unsub. notes 5.10%, 9/1/40 | | 3,946,000 | 3,185,468 |
| Apache Corp. sr. unsec. unsub. notes 4.375%, 10/15/28 | | 32,000 | 27,910 |
| Callon Petroleum Co. 144A company guaranty sr. unsec. notes 7.50%, 6/15/30 | | 2,815,000 | 2,464,547 |
| Cenovus Energy, Inc. sr. unsec. bonds 6.75%, 11/15/39 (Canada) | | 32,000 | 31,802 |
| Centennial Resource Production, LLC 144A company guaranty sr. unsec. notes 6.875%, 4/1/27 | | 1,590,000 | 1,538,254 |
| Cheniere Energy Partners LP company guaranty sr. unsec. notes 4.50%, 10/1/29 | | 5,275,000 | 4,644,057 |
| Cheniere Energy Partners LP company guaranty sr. unsec. unsub. notes 4.00%, 3/1/31 | | 1,075,000 | 901,366 |
| Cheniere Energy Partners LP company guaranty sr. unsec. unsub. notes 3.25%, 1/31/32 | | 10,000 | 7,679 |
| Chord Energy Corp. 144A company guaranty sr. unsec. notes 6.375%, 6/1/26 | | 865,000 | 821,750 |
| Comstock Resources, Inc. 144A company guaranty sr. unsec. notes 5.875%, 1/15/30 | | 75,000 | 65,322 |
| Continental Resources, Inc. company guaranty sr. unsec. notes 4.375%, 1/15/28 | | 1,476,000 | 1,324,674 |
| Continental Resources, Inc. company guaranty sr. unsec. unsub. notes 4.50%, 4/15/23 | | 89,000 | 88,554 |
| Continental Resources, Inc. 144A company guaranty sr. unsec. bonds 5.75%, 1/15/31 | | 654,000 | 591,124 |
| DCP Midstream Operating LP company guaranty sr. unsec. notes 5.625%, 7/15/27 | | 50,000 | 48,125 |
| DCP Midstream Operating LP 144A company guaranty sr. unsec. unsub. bonds 6.75%, 9/15/37 | | 41,000 | 39,719 |
| Encino Acquisition Partners Holdings, LLC 144A company guaranty sr. unsec. notes 8.50%, 5/1/28 | | 3,181,000 | 2,934,569 |
| |
44 Diversified Income Trust |
| | | |
| CORPORATE BONDS AND NOTES (15.8%)* cont. | Principal
amount | Value |
| Energy cont. |
| Endeavor Energy Resources LP/EER Finance, Inc. 144A sr. unsec. bonds 5.75%, 1/30/28 | | $1,569,000 | $1,492,307 |
| EnLink Midstream, LLC 144A company guaranty sr. unsec. notes 5.625%, 1/15/28 | | 1,818,000 | 1,699,830 |
| EQT Corp. sr. unsec. notes 5.00%, 1/15/29 | | 145,000 | 135,290 |
| Hess Midstream Operations LP 144A company guaranty sr. unsec. notes 5.125%, 6/15/28 | | 86,000 | 75,305 |
| Hess Midstream Operations LP 144A company guaranty sr. unsec. notes 4.25%, 2/15/30 | | 345,000 | 278,588 |
| Hess Midstream Operations LP 144A company guaranty sr. unsec. sub. notes 5.625%, 2/15/26 | | 392,000 | 372,108 |
| Holly Energy Partners LP/Holly Energy Finance Corp. 144A company guaranty sr. unsec. notes 5.00%, 2/1/28 | | 171,000 | 150,649 |
| Kinetik Holdings LP 144A company guaranty sr. unsec. notes 5.875%, 6/15/30 | | 1,795,000 | 1,643,608 |
| Nabors Industries, Inc. company guaranty sr. unsec. notes 5.75%, 2/1/25 | | 1,500,000 | 1,357,952 |
| Nabors Industries, Inc. 144A company guaranty sr. unsec. notes 9.00%, 2/1/25 | | 922,000 | 917,489 |
| Nabors Industries, Inc. 144A company guaranty sr. unsec. notes 7.375%, 5/15/27 | | 325,000 | 299,959 |
| Occidental Petroleum Corp. sr. unsec. sub. bonds 6.20%, 3/15/40 | | 2,191,000 | 2,119,793 |
| Occidental Petroleum Corp. sr. unsec. sub. notes 6.45%, 9/15/36 | | 8,248,000 | 8,248,000 |
| Occidental Petroleum Corp. sr. unsec. sub. notes 5.875%, 9/1/25 | | 197,000 | 197,596 |
| Ovintiv, Inc. company guaranty sr. unsec. unsub. bonds 7.375%, 11/1/31 | | 1,510,000 | 1,573,016 |
| Ovintiv, Inc. company guaranty sr. unsec. unsub. bonds 6.625%, 8/15/37 | | 830,000 | 812,324 |
| Pertamina Persero PT sr. unsec. unsub. bonds Ser. REGS, 6.00%, 5/3/42 (Indonesia) | | 2,580,000 | 2,263,139 |
| Petrobras Global Finance BV company guaranty sr. unsec. unsub. notes 6.25%, 3/17/24 (Brazil) | | 208,000 | 209,040 |
| Petrobras Global Finance BV company guaranty sr. unsec. unsub. notes 5.60%, 1/3/31 (Brazil) | | 2,024,000 | 1,839,816 |
| Petrobras Global Finance BV company guaranty sr. unsec. unsub. notes 5.299%, 1/27/25 (Brazil) | | 138,000 | 136,965 |
| Petroleos del Peru SA sr. unsec. unsub. bonds Ser. REGS, 4.75%, 6/19/32 (Peru) | | 3,170,000 | 2,239,601 |
| Petroleos Mexicanos company guaranty sr. unsec. unsub. FRB 5.95%, 1/28/31 (Mexico) | | 2,023,000 | 1,366,334 |
| Petroleos Mexicanos company guaranty sr. unsec. unsub. notes 6.84%, 1/23/30 (Mexico) | | 2,870,000 | 2,139,155 |
| Petroleos Mexicanos company guaranty sr. unsec. unsub. notes 6.70%, 2/16/32 (Mexico) | | 7,306,000 | 5,126,073 |
| Petronas Capital, Ltd. company guaranty sr. unsec. bonds Ser. REGS, 4.55%, 4/21/50 (Malaysia) | | 876,000 | 772,598 |
| Petronas Capital, Ltd. company guaranty sr. unsec. unsub. bonds Ser. REGS, 2.48%, 1/28/32 (Malaysia) | | 1,980,000 | 1,623,594 |
| Precision Drilling Corp. 144A company guaranty sr. unsec. notes 7.125%, 1/15/26 (Canada) | | 583,000 | 558,223 |
| Rockcliff Energy II, LLC 144A sr. unsec. notes 5.50%, 10/15/29 | | 1,540,000 | 1,348,387 |
| |
Diversified Income Trust 45 |
| | | |
| CORPORATE BONDS AND NOTES (15.8%)* cont. | Principal
amount | Value |
| Energy cont. |
| SM Energy Co. sr. unsec. notes 6.625%, 1/15/27 | | $88,000 | $84,469 |
| SM Energy Co. sr. unsec. unsub. notes 6.75%, 9/15/26 | | 390,000 | 375,375 |
| SM Energy Co. sr. unsec. unsub. notes 6.50%, 7/15/28 | | 20,000 | 19,006 |
| SM Energy Co. sr. unsec. unsub. notes 5.625%, 6/1/25 | | 1,809,000 | 1,736,640 |
| Southwestern Energy Co. company guaranty sr. unsec. bonds 4.75%, 2/1/32 | | 179,000 | 150,020 |
| Southwestern Energy Co. company guaranty sr. unsec. notes 5.375%, 3/15/30 | | 2,780,000 | 2,504,919 |
| Southwestern Energy Co. company guaranty sr. unsec. notes 5.375%, 2/1/29 | | 2,680,000 | 2,430,224 |
| Transocean Pontus, Ltd. 144A company guaranty sr. notes 6.125%, 8/1/25 (Cayman Islands) | | 386,400 | 360,318 |
| Transocean Poseidon, Ltd. 144A company guaranty sr. notes 6.875%, 2/1/27 | | 59,500 | 54,443 |
| Viper Energy Partners LP 144A company guaranty sr. unsec. notes 5.375%, 11/1/27 | | 30,000 | 27,616 |
| | | 68,238,589 |
| Financials (1.9%) |
| AG Issuer, LLC 144A sr. notes 6.25%, 3/1/28 | | 85,000 | 73,534 |
| Alliant Holdings Intermediate, LLC/Alliant Holdings Co-Issuer 144A sr. notes 4.25%, 10/15/27 | | 25,000 | 21,354 |
| Ally Financial, Inc. company guaranty sr. unsec. notes 8.00%, 11/1/31 | | 375,000 | 393,134 |
| Banca Monte dei Paschi di Siena SpA sr. unsec. unsub. notes Ser. EMTN, 2.625%, 4/28/25 (Italy) | EUR | 1,350,000 | 1,129,675 |
| CNO Financial Group, Inc. sr. unsec. notes 5.25%, 5/30/29 | | $80,000 | 74,498 |
| Cobra AcquisitionCo, LLC 144A company guaranty sr. unsec. notes 6.375%, 11/1/29 | | 2,142,000 | 1,494,045 |
| Credit Suisse Group AG 144A jr. unsec. sub. FRN 7.50%, perpetual maturity (Switzerland) | | 1,245,000 | 1,143,844 |
| Deutsche Bank AG jr. unsec. sub. FRN 6.00%, perpetual maturity (Germany) | | 3,000,000 | 2,250,000 |
| Dresdner Funding Trust I 144A jr. unsec. sub. notes 8.151%, 6/30/31 | | 100,000 | 107,000 |
| Freedom Mortgage Corp. 144A sr. unsec. notes 8.25%, 4/15/25 | | 1,245,000 | 1,028,665 |
| Freedom Mortgage Corp. 144A sr. unsec. notes 8.125%, 11/15/24 | | 886,000 | 775,250 |
| goeasy, Ltd. 144A company guaranty sr. unsec. notes 5.375%, 12/1/24 (Canada) | | 400,000 | 375,000 |
| goeasy, Ltd. 144A company guaranty sr. unsec. notes 4.375%, 5/1/26 (Canada) | | 790,000 | 701,125 |
| Icahn Enterprises LP/Icahn Enterprises Finance Corp. company guaranty sr. unsec. notes 6.25%, 5/15/26 | | 480,000 | 448,579 |
| Icahn Enterprises LP/Icahn Enterprises Finance Corp. company guaranty sr. unsec. notes 5.25%, 5/15/27 | | 1,450,000 | 1,269,490 |
| Icahn Enterprises LP/Icahn Enterprises Finance Corp. company guaranty sr. unsec. sub. notes 4.375%, 2/1/29 | | 980,000 | 788,783 |
| iStar, Inc. sr. unsec. notes 5.50%, 2/15/26 R | | 1,230,000 | 1,237,762 |
| iStar, Inc. sr. unsec. notes 4.75%, 10/1/24 R | | 670,000 | 660,754 |
| iStar, Inc. sr. unsec. notes 4.25%, 8/1/25 R | | 97,000 | 94,095 |
| Itau Unibanco Holding SA/Cayman Islands 144A unsec. sub. FRB 3.875%, 4/15/31 (Brazil) | | 7,050,000 | 6,026,693 |
| |
46 Diversified Income Trust |
| | | |
| CORPORATE BONDS AND NOTES (15.8%)* cont. | Principal
amount | Value |
| Financials cont. |
| Ladder Capital Finance Holdings, LLLP/Ladder Capital Finance Corp. 144A company guaranty sr. unsec. notes 4.75%, 6/15/29 R | | $1,564,000 | $1,170,889 |
| Ladder Capital Finance Holdings, LLLP/Ladder Capital Finance Corp. 144A company guaranty sr. unsec. unsub. notes 5.25%, 10/1/25 R | | 20,000 | 18,400 |
| Ladder Capital Finance Holdings, LLLP/Ladder Capital Finance Corp. 144A sr. unsec. notes 4.25%, 2/1/27 R | | 950,000 | 769,500 |
| Nationstar Mortgage Holdings, Inc. 144A company guaranty sr. unsec. notes 5.75%, 11/15/31 | | 2,020,000 | 1,481,417 |
| Nationstar Mortgage Holdings, Inc. 144A company guaranty sr. unsec. notes 5.50%, 8/15/28 | | 788,000 | 618,773 |
| OneMain Finance Corp. company guaranty sr. unsec. sub. notes 7.125%, 3/15/26 | | 1,045,000 | 941,965 |
| OneMain Finance Corp. company guaranty sr. unsec. unsub. notes 5.375%, 11/15/29 | | 993,000 | 769,575 |
| PennyMac Financial Services, Inc. 144A company guaranty sr. unsec. notes 5.375%, 10/15/25 | | 1,430,000 | 1,222,593 |
| PHH Mortgage Corp. 144A company guaranty sr. notes 7.875%, 3/15/26 | | 1,350,000 | 1,169,826 |
| Service Properties Trust company guaranty sr. unsec. unsub. notes 7.50%, 9/15/25 R | | 35,000 | 32,725 |
| Societe Generale SA 144A jr. unsec. sub. FRN 4.75%, perpetual maturity (France) | | 625,000 | 465,625 |
| Stichting AK Rabobank Certificaten jr. unsec. sub. FRN 6.50%, perpetual maturity (Netherlands) | EUR | 1,517,950 | 1,361,216 |
| VTB Bank OJSC Via VTB Capital SA 144A unsec. sub. bonds 6.95%, 10/17/22 (Russia) (In default) † F | | $200,000 | — |
| | | 30,115,784 |
| Health care (1.3%) |
| 1375209 BC, Ltd. 144A sr. notes 9.00%, 1/30/28 (Canada) | | 181,533 | 180,172 |
| 180 Medical, Inc. 144A company guaranty sr. unsec. notes 3.875%, 10/15/29 | | 300,000 | 253,050 |
| Bausch Health Cos, Inc. 144A company guaranty sr. sub. notes 11.00%, 9/30/28 | | 322,722 | 259,791 |
| Bausch Health Cos, Inc. 144A company guaranty sub. notes 14.00%, 10/15/30 | | 64,545 | 35,177 |
| Bausch Health Cos., Inc. 144A company guaranty sr. notes 6.125%, 2/1/27 | | 423,000 | 291,870 |
| Centene Corp. sr. unsec. bonds 3.00%, 10/15/30 | | 2,410,000 | 1,908,575 |
| Centene Corp. sr. unsec. notes 4.625%, 12/15/29 | | 200,000 | 179,000 |
| Charles River Laboratories International, Inc. 144A company guaranty sr. unsec. notes 4.00%, 3/15/31 | | 675,000 | 543,375 |
| Charles River Laboratories International, Inc. 144A company guaranty sr. unsec. notes 3.75%, 3/15/29 | | 625,000 | 512,500 |
| CHS/Community Health Systems, Inc. 144A company guaranty sr. notes 8.00%, 3/15/26 | | 1,285,000 | 1,112,536 |
| CHS/Community Health Systems, Inc. 144A jr. notes 6.875%, 4/15/29 | | 1,250,000 | 603,797 |
| Elanco Animal Health, Inc. sr. unsec. notes Ser. WI, 6.40%, 8/28/28 | | 1,960,000 | 1,730,268 |
| HCA, Inc. company guaranty sr. unsec. notes 5.375%, 9/1/26 | | 90,000 | 87,192 |
| HCA, Inc. company guaranty sr. unsec. notes 3.50%, 9/1/30 | | 45,000 | 37,157 |
| |
Diversified Income Trust 47 |
| | | |
| CORPORATE BONDS AND NOTES (15.8%)* cont. | Principal
amount | Value |
| Health care cont. |
| Jazz Securities DAC 144A company guaranty sr. unsub. notes 4.375%, 1/15/29 (Ireland) | | $1,978,000 | $1,708,498 |
| Laboratoire Eimer Selarl company guaranty sr. unsec. notes Ser. REGS, 5.00%, 2/1/29 (France) | EUR | 1,405,000 | 982,769 |
| Mallinckrodt International Finance SA/Mallinckrodt CB, LLC 144A company guaranty unsub. notes 10.00%, 4/15/25 (Luxembourg) | | $2,500,000 | 1,500,000 |
| Option Care Health, Inc. 144A company guaranty sr. unsec. notes 4.375%, 10/31/29 | | 225,000 | 190,125 |
| Organon Finance 1, LLC 144A sr. notes 4.125%, 4/30/28 | | 1,315,000 | 1,124,325 |
| Owens & Minor, Inc. 144A sr. unsec. notes 4.50%, 3/31/29 | | 695,000 | 545,662 |
| Service Corp. International sr. unsec. bonds 5.125%, 6/1/29 | | 120,000 | 109,054 |
| Service Corp. International sr. unsec. notes 3.375%, 8/15/30 | | 585,000 | 457,523 |
| Service Corp. International sr. unsec. sub. notes 4.00%, 5/15/31 | | 465,000 | 373,949 |
| Tenet Healthcare Corp. company guaranty sr. notes 4.625%, 7/15/24 | | 23,000 | 22,241 |
| Tenet Healthcare Corp. 144A company guaranty sr. notes 5.125%, 11/1/27 | | 1,125,000 | 1,009,449 |
| Tenet Healthcare Corp. 144A company guaranty sr. notes 4.875%, 1/1/26 | | 840,000 | 780,587 |
| Tenet Healthcare Corp. 144A company guaranty sr. notes 4.25%, 6/1/29 | | 435,000 | 360,289 |
| Tenet Healthcare Corp. 144A company guaranty sr. unsub. notes 6.125%, 6/15/30 | | 700,000 | 641,200 |
| Teva Pharmaceutical Finance Netherlands III BV company guaranty sr. unsec. notes 7.125%, 1/31/25 (Israel) | | 795,000 | 773,857 |
| Teva Pharmaceutical Finance Netherlands III BV company guaranty sr. unsec. notes 6.75%, 3/1/28 (Israel) | | 970,000 | 890,174 |
| Teva Pharmaceutical Finance Netherlands III BV company guaranty sr. unsec. notes 6.00%, 4/15/24 (Israel) | | 650,000 | 630,851 |
| Teva Pharmaceutical Finance Netherlands III BV company guaranty sr. unsec. unsub. notes 5.125%, 5/9/29 (Israel) | | 1,115,000 | 919,830 |
| | | 20,754,843 |
| Technology (0.7%) |
| Arches Buyer, Inc. 144A sr. notes 4.25%, 6/1/28 | | 400,000 | 312,000 |
| Central Parent, Inc./CDK Global, Inc. 144A company guaranty sr. notes 7.25%, 6/15/29 | | 390,000 | 370,771 |
| Crowdstrike Holdings, Inc. company guaranty sr. unsec. notes 3.00%, 2/15/29 | | 2,253,000 | 1,892,520 |
| Imola Merger Corp. 144A sr. notes 4.75%, 5/15/29 | | 1,037,000 | 874,865 |
| Oracle Corp. sr. unsec. bonds 3.60%, 4/1/50 | | 700,000 | 437,992 |
| Picard Midco, Inc. 144A sr. notes. 6.50%, 3/31/29 | | 847,000 | 715,461 |
| Rocket Software, Inc. 144A sr. unsec. notes 6.50%, 2/15/29 | | 2,490,000 | 1,842,600 |
| TTM Technologies, Inc. 144A company guaranty sr. unsec. notes 4.00%, 3/1/29 | | 1,060,000 | 844,025 |
| Twilio, Inc. company guaranty sr. unsec. notes 3.875%, 3/15/31 | | 740,000 | 580,879 |
| Twilio, Inc. company guaranty sr. unsec. notes 3.625%, 3/15/29 | | 945,000 | 763,088 |
| ZoomInfo Technologies, LLC/ZoomInfo Finance Corp. 144A company guaranty sr. unsec. notes 3.875%, 2/1/29 | | 3,008,000 | 2,454,347 |
| | | 11,088,548 |
| |
48 Diversified Income Trust |
| | | |
| CORPORATE BONDS AND NOTES (15.8%)* cont. | Principal
amount | Value |
| Transportation (0.1%) |
| Delta Air Lines, Inc./SkyMiles IP, Ltd. 144A company guaranty sr. notes 4.75%, 10/20/28 | | $150,000 | $139,703 |
| United Airlines, Inc. 144A company guaranty sr. notes 4.625%, 4/15/29 | | 535,000 | 442,681 |
| United Airlines, Inc. 144A company guaranty sr. notes 4.375%, 4/15/26 | | 535,000 | 477,488 |
| | | 1,059,872 |
| Utilities and power (0.3%) |
| Buckeye Partners LP sr. unsec. bonds 5.85%, 11/15/43 | | 924,000 | 684,452 |
| Buckeye Partners LP sr. unsec. notes 3.95%, 12/1/26 | | 23,000 | 20,060 |
| Buckeye Partners LP 144A sr. unsec. notes 4.50%, 3/1/28 | | 35,000 | 29,750 |
| Calpine Corp. 144A company guaranty sr. notes 5.25%, 6/1/26 | | 19,000 | 17,910 |
| Calpine Corp. 144A company guaranty sr. notes 4.50%, 2/15/28 | | 1,135,000 | 999,924 |
| Calpine Corp. 144A sr. unsec. notes 5.00%, 2/1/31 | | 20,000 | 15,891 |
| Energy Transfer LP jr. unsec. sub. FRN 6.625%, perpetual maturity | | 244,000 | 178,120 |
| NRG Energy, Inc. company guaranty sr. unsec. notes 6.625%, 1/15/27 | | 6,000 | 5,876 |
| NRG Energy, Inc. 144A company guaranty sr. notes 3.75%, 6/15/24 | | 135,000 | 129,963 |
| NRG Energy, Inc. 144A company guaranty sr. unsec. bonds 3.875%, 2/15/32 | | 1,770,000 | 1,380,680 |
| NRG Energy, Inc. 144A sr. unsec. bonds 5.25%, 6/15/29 | | 1,046,000 | 915,250 |
| Pacific Gas and Electric Co. company guaranty sr. unsec. unsub. notes 2.95%, 3/1/26 | | 787,000 | 694,294 |
| Vistra Operations Co., LLC 144A company guaranty sr. notes 4.30%, 7/15/29 | | 40,000 | 34,084 |
| Vistra Operations Co., LLC 144A company guaranty sr. unsec. notes 5.50%, 9/1/26 | | 145,000 | 134,488 |
| Vistra Operations Co., LLC 144A company guaranty sr. unsec. sub. notes 5.00%, 7/31/27 | | 60,000 | 54,195 |
| | | 5,294,937 |
| Total corporate bonds and notes (cost $303,709,700) | $250,738,926 |
|
| | | |
FOREIGN GOVERNMENT AND AGENCY
BONDS AND NOTES (8.9%)* | Principal
amount | Value |
| Bahrain (Kingdom of) sr. unsec. notes Ser. REGS, 7.375%, 5/14/30 (Bahrain) | | $1,462,000 | $1,388,900 |
| Brazil (Federal Republic of) sr. unsec. unsub. bonds 8.25%, 1/20/34 (Brazil) | | 2,280,000 | 2,453,517 |
| Colombia (Republic of) sr. unsec. unsub. bonds 7.375%, 9/18/37 (Colombia) | | 990,000 | 856,195 |
| Colombia (Republic of) sr. unsec. unsub. bonds 6.125%, 1/18/41 (Colombia) | | 1,400,000 | 1,019,591 |
| Cordoba (Province of) sr. unsec. unsub. notes Ser. REGS, 6.99%, 6/1/27 (Argentina) | | 2,193,000 | 1,383,064 |
| Costa Rica (Government of) sr. unsec. unsub. notes Ser. REGS, 6.125%, 2/19/31 (Costa Rica) | | 3,145,000 | 2,876,564 |
| Cote d’lvoire (Republic of) sr. unsec. unsub. bonds Ser. REGS, 6.125%, 6/15/33 (Cote d’lvoire) | | 12,715,000 | 9,663,400 |
| Cote d’lvoire (Republic of) sr. unsec. unsub. bonds Ser. REGS, 5.75%, 12/31/32 (Cote d’lvoire) | | 7,184,790 | 6,142,995 |
| |
Diversified Income Trust 49 |
| | | |
FOREIGN GOVERNMENT AND AGENCY
BONDS AND NOTES (8.9%)* cont. | Principal
amount | Value |
| Cote d’lvoire (Republic of) sr. unsec. unsub. bonds Ser. REGS, 5.25%, 3/22/30 (Cote d’lvoire) | EUR | 280,000 | $200,728 |
| Cote d’lvoire (Republic of) sr. unsec. unsub. notes Ser. REGS, 5.375%, 7/23/24 (Cote d’lvoire) | | $4,251,000 | 3,831,214 |
| Cote d’lvoire (Republic of) 144A sr. unsec. unsub. bonds 5.25%, 3/22/30 (Cote d’lvoire) | EUR | 250,000 | 178,729 |
| Development Bank of Mongolia, LLC unsec. notes Ser. REGS, 7.25%, 10/23/23 (Mongolia) | | $4,010,000 | 3,834,563 |
| Dominican (Republic of) sr. unsec. bonds Ser. REGS, 4.875%, 9/23/32 (Dominican Republic) | | 4,929,000 | 3,709,073 |
| Dominican (Republic of) sr. unsec. unsub. bonds Ser. REGS, 6.00%, 2/22/33 (Dominican Republic) | | 1,830,000 | 1,487,162 |
| Dominican (Republic of) sr. unsec. unsub. notes Ser. REGS, 8.625%, 4/20/27 (Dominican Republic) | | 964,000 | 979,665 |
| Dominican (Republic of) sr. unsec. unsub. notes Ser. REGS, 6.875%, 1/29/26 (Dominican Republic) | | 8,703,000 | 8,507,183 |
| Dominican (Republic of) sr. unsec. unsub. notes Ser. REGS, 5.50%, 1/27/25 (Dominican Republic) | | 300,000 | 291,375 |
| Dominican (Republic of) 144A sr. unsec. notes 4.50%, 1/30/30 (Dominican Republic) | | 230,000 | 180,749 |
| Egypt (Arab Republic of) sr. unsec. bonds Ser. REGS, 8.50%, 1/31/47 (Egypt) | | 1,152,000 | 639,372 |
| Egypt (Arab Republic of) sr. unsec. bonds Ser. REGS, 7.30%, 9/30/33 (Egypt) | | 2,240,000 | 1,288,033 |
| Egypt (Arab Republic of) sr. unsec. bonds Ser. REGS, 7.053%, 1/15/32 (Egypt) | | 2,448,000 | 1,471,836 |
| Egypt (Arab Republic of) sr. unsec. notes Ser. REGS, 7.60%, 3/1/29 (Egypt) | | 6,250,000 | 4,351,475 |
| Ghana (Republic of) sr. unsec. bonds Ser. REGS, 8.125%, 3/26/32 (Ghana) | | 1,820,000 | 675,675 |
| Ghana (Republic of) sr. unsec. notes Ser. REGS, 7.625%, 5/16/29 (Ghana) | | 5,190,000 | 1,978,688 |
| Ghana (Republic of) sr. unsec. unsub. notes Ser. REGS, 8.125%, 1/18/26 (Ghana) | | 9,230,000 | 4,811,139 |
| Ghana (Republic of) sr. unsec. unsub. notes Ser. REGS, 7.75%, 4/7/29 (Ghana) | | 1,500,000 | 570,000 |
| Ghana (Republic of) sr. unsec. unsub. notes Ser. REGS, 6.375%, 2/11/27 (Ghana) | | 2,440,000 | 969,900 |
| Guatemala (Republic of) sr. unsec. bonds Ser. REGS, 6.125%, 6/1/50 (Guatemala) | | 706,000 | 575,390 |
| Indonesia (Republic of) sr. unsec. unsub. bonds 2.85%, 2/14/30 (Indonesia) | | 337,000 | 286,868 |
| Indonesia (Republic of) sr. unsec. unsub. notes 4.65%, 9/20/32 (Indonesia) | | 7,335,000 | 6,879,725 |
| Indonesia (Republic of) sr. unsec. unsub. notes 3.85%, 10/15/30 (Indonesia) | | 550,000 | 492,939 |
| Indonesia (Republic of) sr. unsec. unsub. notes 3.55%, 3/31/32 (Indonesia) | | 1,745,000 | 1,512,998 |
| Indonesia (Republic of) sr. unsec. unsub. notes Ser. REGS, 4.125%, 1/15/25 (Indonesia) | | 4,400,000 | 4,311,965 |
| Indonesia (Republic of) 144A sr. unsec. unsub. notes 4.35%, 1/8/27 (Indonesia) | | 9,320,000 | 8,912,297 |
| |
50 Diversified Income Trust |
| | | |
FOREIGN GOVERNMENT AND AGENCY
BONDS AND NOTES (8.9%)* cont. | Principal
amount | Value |
| Indonesia (Republic of) 144A sr. unsec. unsub. notes 3.375%, 4/15/23 (Indonesia) | | $200,000 | $198,000 |
| Jamaica (Government of) sr. unsec. unsub. bonds 8.00%, 3/15/39 (Jamaica) | | 730,000 | 798,213 |
| Jordan (Kingdom of) sr. unsec. notes Ser. REGS, 5.85%, 7/7/30 (Jordan) | | 3,276,000 | 2,661,750 |
| Mongolia (Government of) sr. unsec. notes Ser. REGS, 5.125%, 4/7/26 (Mongolia) | | 3,120,000 | 2,433,572 |
| Mongolia (Government of) sr. unsec. notes Ser. REGS, 4.45%, 7/7/31 (Mongolia) | | 2,097,000 | 1,452,385 |
| Mongolia (Government of) sr. unsec. unsub. notes Ser. REGS, 8.75%, 3/9/24 (Mongolia) | | 1,767,000 | 1,674,193 |
| Morocco (Kingdom of) sr. unsec. bonds Ser. REGS, 3.00%, 12/15/32 (Morocco) | | 5,334,000 | 3,727,052 |
| Morocco (Kingdom of) sr. unsec. unsub. bonds Ser. REGS, 5.50%, 12/11/42 (Morocco) | | 1,479,000 | 1,088,909 |
| Oman (Sultanate of) sr. unsec. notes Ser. REGS, 6.00%, 8/1/29 (Oman) | | 2,447,000 | 2,281,779 |
| Panama (Republic of) sr. unsec. unsub. bonds 3.87%, 7/23/60 (Panama) | | 1,400,000 | 831,250 |
| Panama (Republic of) sr. unsec. unsub. notes 4.00%, 9/22/24 (Panama) | | 1,431,000 | 1,396,162 |
| Paraguay (Republic of) 144A sr. unsec. bonds 3.849%, 6/28/33 (Paraguay) | | 800,000 | 627,000 |
| Philippines (Republic of) sr. unsec. unsub. bonds 4.20%, 3/29/47 (Philippines) | | 924,000 | 715,294 |
| Philippines (Republic of) sr. unsec. unsub. notes 3.75%, 1/14/29 (Philippines) | | 2,790,000 | 2,577,712 |
| Philippines (Republic of) sr. unsec. unsub. notes 3.229%, 3/29/27 (Philippines) | | 830,000 | 773,391 |
| Romania (Government of) sr. unsec. notes Ser. REGS, 3.00%, 2/14/31 (Romania) | | 1,550,000 | 1,094,083 |
| Romania (Government of) unsec. bonds Ser. REGS, 6.00%, 5/25/34 (Romania) | | 860,000 | 723,153 |
| Senegal (Republic of) unsec. bonds Ser. REGS, 6.25%, 5/23/33 (Senegal) | | 4,738,000 | 3,547,578 |
| Serbia (Republic of) sr. unsec. unsub. notes Ser. REGS, 2.125%, 12/1/30 (Serbia) | | 570,000 | 371,929 |
| South Africa (Republic of) sr. unsec. unsub. bonds 7.30%, 4/20/52 (South Africa) | | 457,000 | 345,051 |
| South Africa (Republic of) sr. unsec. unsub. notes 5.875%, 6/22/30 (South Africa) | | 2,420,000 | 2,081,169 |
| Tunisia (Central Bank of) sr. unsec. unsub. notes Ser. REGS, 5.75%, 1/30/25 (Tunisia) | | 10,060,000 | 6,039,540 |
| Ukraine (Government of) sr. unsec. notes Ser. REGS, 6.876%, 5/21/31 (Ukraine) (In default) † | | 2,350,000 | 432,204 |
| United Mexican States sr. unsec. bonds 2.659%, 5/24/31 (Mexico) | | 9,732,000 | 7,461,369 |
| United Mexican States sr. unsec. unsub. bonds 3.25%, 4/16/30 (Mexico) | | 708,000 | 590,301 |
| United Mexican States sr. unsec. unsub. notes 4.15%, 3/28/27 (Mexico) | | 3,680,000 | 3,516,972 |
| |
Diversified Income Trust 51 |
| | | |
FOREIGN GOVERNMENT AND AGENCY
BONDS AND NOTES (8.9%)* cont. | Principal
amount | Value |
| Uruguay (Oriental Republic of) sr. unsec. bonds 5.10%, 6/18/50 (Uruguay) | | $1,200,000 | $1,096,784 |
| Uruguay (Oriental Republic of) sr. unsec. notes 4.50%, 8/14/24 (Uruguay) | | 560,000 | 558,435 |
| Vietnam (Socialist Republic of) sr. unsec. notes Ser. REGS, 4.80%, 11/19/24 (Vietnam) | | 2,350,000 | 2,321,517 |
| Total foreign government and agency bonds and notes (cost $176,949,701) | $142,129,714 |
|
| | | |
| CONVERTIBLE BONDS AND NOTES (4.0%)* | Principal
amount | Value |
| Basic materials (0.1%) |
| Sika AG cv. sr. unsec. notes Ser. REGS, 0.15%, 6/5/25 (Switzerland) | CHF | 640,000 | $768,001 |
| | | 768,001 |
| Capital goods (—%) |
| John Bean Technologies Corp. cv. sr. unsec. notes 0.25%, 5/15/26 | | $193,000 | 159,611 |
| Middleby Corp. (The) cv. sr. unsec. notes 1.00%, 9/1/25 | | 298,000 | 339,870 |
| | | 499,481 |
| Communication services (0.4%) |
| Cable One, Inc. company guaranty cv. sr. unsec. notes 1.125%, 3/15/28 | | 568,000 | 408,960 |
| Cellnex Telecom SA cv. sr. unsec. unsub. notes 0.50%, 7/5/28 (Spain) | EUR | 600,000 | 547,280 |
| DISH Network Corp. cv. sr. unsec. notes 3.375%, 8/15/26 | | $1,439,000 | 990,032 |
| DISH Network Corp. cv. sr. unsec. notes zero %, 12/15/25 | | 379,000 | 248,624 |
| Liberty Broadband Corp. 144A cv. sr. unsec. bonds 1.25%, 9/30/50 | | 692,000 | 653,940 |
| Liberty Media Corp. cv. sr. unsec. bonds 1.375%, 10/15/23 | | 380,000 | 455,050 |
| Liberty Media Corp. cv. sr. unsec. unsub. bonds 0.50%, 12/1/50 | | 845,000 | 874,575 |
| Liberty Media Corp. 144A cv. sr. unsec. unsub. bonds 2.75%, 12/1/49 | | 1,942,000 | 1,750,714 |
| | | 5,929,175 |
| Consumer cyclicals (0.6%) |
| adidas AG 144A cv. sr. unsec. notes 0.05%, 9/12/23 (Germany) | EUR | 600,000 | 572,477 |
| Alarm.com Holdings, Inc. cv. sr. unsec. notes zero %, 1/15/26 | | $134,000 | 109,546 |
| Block, Inc. cv. sr. unsec. notes 0.125%, 3/1/25 | | 227,000 | 205,719 |
| Block, Inc. cv. sr. unsec. sub. notes 0.25%, 11/1/27 | | 568,000 | 406,120 |
| Block, Inc. cv. sr. unsec. sub. notes zero %, 5/1/26 | | 495,000 | 386,349 |
| Booking Holdings, Inc. cv. sr. unsec. notes 0.75%, 5/1/25 | | 784,000 | 941,820 |
| Burlington Stores, Inc. cv. sr. unsec. notes 2.25%, 4/15/25 | | 386,000 | 366,700 |
| DraftKings, Inc. cv. sr. unsec. unsub. notes zero %, 3/15/28 | | 596,000 | 384,681 |
| Expedia Group, Inc. company guaranty cv. sr. unsec. unsub. notes zero %, 2/15/26 | | 651,000 | 563,071 |
| Ford Motor Co. cv. sr. unsec. notes zero %, 3/15/26 | | 1,257,000 | 1,149,527 |
| Liberty Media Corp. 144A cv. sr. unsec. notes 2.25%, 8/15/27 | | 240,000 | 222,120 |
| Liberty TripAdvisor Holdings, Inc. 144A cv. sr. unsec. bonds 0.50%, 6/30/51 | | 951,000 | 676,637 |
| National Vision Holdings, Inc. cv. sr. unsec. sub. notes 2.50%, 5/15/25 | | 36,000 | 44,507 |
| NCL Corp., Ltd. company guaranty cv. sr. unsec. notes 5.375%, 8/1/25 | | 213,000 | 209,061 |
| NCL Corp., Ltd. 144A company guaranty cv. sr. unsec. notes 2.50%, 2/15/27 | | 1,008,000 | 660,240 |
| |
52 Diversified Income Trust |
| | | |
| CONVERTIBLE BONDS AND NOTES (4.0%)* cont. | Principal
amount | Value |
| Consumer cyclicals cont. |
| Nexi SpA cv. sr. unsec. notes Ser. REGS, zero %, 2/24/28 (Italy) | EUR | 600,000 | $409,563 |
| Nexity SA cv. sr. unsec. notes 0.25%, 3/2/25 (Units) (France) | EUR | 2,850 | 158,287 |
| Royal Caribbean Cruises, Ltd. 144A cv. sr. unsec. unsub. notes 6.00%, 8/15/25 | | $926,000 | 975,542 |
| Shift4 Payments, Inc. cv. sr. unsec. sub. notes zero %, 12/15/25 | | 785,000 | 692,763 |
| Vail Resorts, Inc. cv. sr. unsec. sub. notes zero %, 1/1/26 | | 849,000 | 739,160 |
| Winnebago Industries, Inc. cv. sr. unsec. notes 1.50%, 4/1/25 | | 97,000 | 101,426 |
| | | 9,975,316 |
| Consumer staples (0.5%) |
| Airbnb, Inc. cv. sr. unsec. sub. notes zero %, 3/15/26 | | 1,658,000 | 1,372,824 |
| Beauty Health Co. (The) 144A cv. sr. unsec. sub. notes 1.25%, 10/1/26 | | 571,000 | 459,655 |
| Cheesecake Factory, Inc. (The) cv. sr. unsec. sub. notes 0.375%, 6/15/26 | | 179,000 | 138,390 |
| Chegg, Inc. cv. sr. unsec. notes zero %, 9/1/26 | | 808,000 | 609,219 |
| Delivery Hero AG cv. sr. unsec. notes 1.50%, 1/15/28 (Germany) | EUR | 800,000 | 498,127 |
| Etsy, Inc. cv. sr. unsec. notes 0.25%, 6/15/28 | | $1,133,000 | 873,543 |
| Fiverr International, Ltd. cv. sr. unsec. notes zero %, 11/1/25 (Israel) | | 224,000 | 173,891 |
| IAC Financeco 2, Inc. 144A company guaranty cv. sr. unsec. notes 0.875%, 6/15/26 | | 474,000 | 419,016 |
| Lyft, Inc. cv. sr. unsec. notes 1.50%, 5/15/25 | | 421,000 | 358,903 |
| Sea, Ltd. cv. sr. unsec. unsub. notes 0.25%, 9/15/26 (Singapore) | | 485,000 | 335,863 |
| Shake Shack, Inc. cv. sr. unsec. notes zero %, 3/1/28 | | 523,000 | 346,815 |
| Uber Technologies, Inc. cv. sr. unsec. notes zero %, 12/15/25 | | 696,000 | 577,616 |
| Upwork, Inc. cv. sr. unsec. notes 0.25%, 8/15/26 | | 679,000 | 496,553 |
| Wayfair, Inc. cv. sr. unsec. notes 0.625%, 10/1/25 | | 834,000 | 558,782 |
| Zalando SE cv. sr. unsec. notes 0.05%, 8/6/25 (Germany) | EUR | 500,000 | 389,656 |
| Zillow Group, Inc. cv. sr. unsec. notes 2.75%, 5/15/25 | | $223,000 | 202,707 |
| | | 7,811,560 |
| Energy (0.3%) |
| BP Capital Markets PLC company guaranty cv. sr. unsec. unsub. notes 1.00%, 4/28/23 (United Kingdom) | GBP | 300,000 | 346,732 |
| Enphase Energy, Inc. cv. sr. unsec. sub. notes zero %, 3/1/28 | | $662,000 | 785,794 |
| Pioneer Natural Resources Co. cv. sr. unsec. notes 0.25%, 5/15/25 | | 518,000 | 1,121,988 |
| SolarEdge Technologies, Inc. cv. sr. unsec. notes zero %, 9/15/25 (Israel) | | 396,000 | 431,046 |
| TOTAL SA cv. sr. unsec. unsub. notes 0.50%, 12/2/22 (France) | | 800,000 | 795,384 |
| Transocean, Inc. company guaranty cv. sr. unsec. sub. notes 0.50%, 1/30/23 | | 1,277,000 | 1,214,746 |
| | | 4,695,690 |
| Financials (0.1%) |
| Blackstone Mortgage Trust, Inc. cv. sr. unsec. notes 4.75%, 3/15/23 R | | 156,000 | 153,860 |
| SoFi Technologies, Inc. 144A cv. sr. unsec. notes zero %, 10/15/26 | | 997,304 | 677,644 |
| | | 831,504 |
| Health care (0.6%) |
| Alnylam Pharmaceuticals, Inc. 144A cv. sr. unsec. unsub. notes 1.00%, 9/15/27 | | 291,000 | 282,561 |
| Ascendis Pharma A/S 144A cv. sr. unsec. notes 2.25%, 4/1/28 (Denmark) | | 209,000 | 192,302 |
| |
Diversified Income Trust 53 |
| | | |
| CONVERTIBLE BONDS AND NOTES (4.0%)* cont. | Principal
amount | Value |
| Health care cont. |
| BioMarin Pharmaceutical, Inc. cv. sr. unsec. sub. notes 1.25%, 5/15/27 | | $966,000 | $959,334 |
| CONMED Corp. 144A cv. sr. unsec. notes 2.25%, 6/15/27 | | 467,000 | 401,620 |
| DexCom, Inc. cv. sr. unsec. unsub. notes 0.25%, 11/15/25 | | 940,000 | 865,975 |
| Envista Holdings Corp. cv. sr. unsec. notes 2.375%, 6/1/25 | | 150,000 | 246,525 |
| Exact Sciences Corp. cv. sr. unsec. sub. notes 0.375%, 3/1/28 | | 1,500,000 | 948,751 |
| Guardant Health, Inc. cv. sr. unsec. sub. notes zero %, 11/15/27 | | 556,000 | 404,607 |
| Halozyme Therapeutics, Inc. cv. sr. unsec. notes 0.25%, 3/1/27 | | 1,475,000 | 1,248,220 |
| Halozyme Therapeutics, Inc. 144A cv. sr. unsec. notes 1.00%, 8/15/28 | | 99,000 | 92,441 |
| Illumina, Inc. cv. sr. unsec. notes zero %, 8/15/23 | | 362,000 | 345,722 |
| Insulet Corp. cv. sr. unsec. notes 0.375%, 9/1/26 | | 529,000 | 623,427 |
| Integra LifeSciences Holdings Corp. cv. sr. unsec. notes 0.50%, 8/15/25 | | 253,000 | 220,661 |
| Ironwood Pharmaceuticals, Inc. cv. sr. unsec. notes 1.50%, 6/15/26 | | 134,000 | 136,094 |
| Jazz Investments I, Ltd. company guaranty cv. sr. unsec. sub. notes 1.50%, 8/15/24 (Ireland) | | 1,008,000 | 950,670 |
| Neurocrine Biosciences, Inc. cv. sr. unsec. notes 2.25%, 5/15/24 | | 185,000 | 259,555 |
| Novocure, Ltd. cv. sr. unsec. notes zero %, 11/1/25 (Jersey) | | 265,000 | 236,916 |
| Omnicell, Inc. cv. sr. unsec. notes 0.25%, 9/15/25 | | 305,000 | 323,605 |
| Pacira Pharmaceuticals, Inc. cv. sr. unsec. sub. notes 0.75%, 8/1/25 | | 251,000 | 246,294 |
| QIAGEN NV cv. sr. unsec. unsub. notes Ser. REGS, 1.00%, 11/13/24 (Netherlands) | | 400,000 | 415,522 |
| Sarepta Therapeutics, Inc. 144A cv. sr. unsec. unsub. notes 1.25%, 9/15/27 | | 83,000 | 85,449 |
| Tandem Diabetes Care, Inc. 144A cv. sr. unsec. notes 1.50%, 5/1/25 | | 108,000 | 97,146 |
| Teladoc Health, Inc. cv. sr. unsec. sub. notes 1.25%, 6/1/27 | | 628,000 | 459,256 |
| | | 10,042,653 |
| Technology (1.2%) |
| 3D Systems Corp. 144A cv. sr. unsec. notes zero %, 11/15/26 | | 388,000 | 267,332 |
| Akamai Technologies, Inc. cv. sr. unsec. notes 0.375%, 9/1/27 | | 690,000 | 642,045 |
| Akamai Technologies, Inc. cv. sr. unsec. notes 0.125%, 5/1/25 | | 758,000 | 770,128 |
| Bentley Systems, Inc. cv. sr. unsec. sub. notes 0.375%, 7/1/27 | | 844,000 | 635,955 |
| Bill.com Holdings, Inc. cv. sr. unsec. unsub. notes zero %, 4/1/27 | | 821,000 | 640,791 |
| Blackline, Inc. cv. sr. unsec. notes zero %, 3/15/26 | | 123,000 | 99,507 |
| Box, Inc. cv. sr. unsec. notes zero %, 1/15/26 | | 146,000 | 160,746 |
| Ceridian HCM Holding, Inc. cv. sr. unsec. notes 0.25%, 3/15/26 | | 566,000 | 456,480 |
| Cloudflare, Inc. cv. sr. unsec. notes zero %, 8/15/26 | | 488,000 | 379,176 |
| Coupa Software, Inc. cv. sr. unsec. notes 0.375%, 6/15/26 | | 980,000 | 753,131 |
| CyberArk Software, Ltd. cv. sr. unsec. notes zero %, 11/15/24 (Israel) | | 518,000 | 589,225 |
| Datadog, Inc. cv. sr. unsec. notes 0.125%, 6/15/25 | | 229,000 | 271,938 |
| DigitalOcean Holdings, Inc. 144A cv. sr. unsec. notes zero %, 12/1/26 | | 464,000 | 336,400 |
| DocuSign, Inc. cv. sr. unsec. notes zero %, 1/15/24 | | 273,000 | 254,709 |
| Envestnet, Inc. company guaranty cv. sr. unsec. notes 0.75%, 8/15/25 | | 245,000 | 204,881 |
| Everbridge, Inc. cv. sr. unsec. notes zero %, 3/15/26 | | 185,000 | 157,170 |
| Five9, Inc. cv. sr. unsec. notes 0.50%, 6/1/25 | | 341,000 | 309,287 |
| Guidewire Software, Inc. cv. sr. unsec. sub. notes 1.25%, 3/15/25 | | 176,000 | 157,872 |
| HubSpot, Inc. cv. sr. unsec. notes 0.375%, 6/1/25 | | 79,000 | 93,378 |
| |
54 Diversified Income Trust |
| | | |
| CONVERTIBLE BONDS AND NOTES (4.0%)* cont. | Principal
amount | Value |
| Technology cont. |
| Impinj, Inc. 144A cv. sr. unsec. notes 1.125%, 5/15/27 | | $154,000 | $151,731 |
| Lumentum Holdings, Inc. cv. sr. unsec. notes 0.50%, 12/15/26 | | 764,000 | 712,431 |
| MongoDB, Inc. cv. sr. unsec. notes 0.25%, 1/15/26 | | 76,000 | 88,616 |
| Okta, Inc. cv. sr. unsec. notes 0.375%, 6/15/26 | | 1,147,000 | 890,646 |
| ON Semiconductor Corp. cv. sr. unsec. notes zero %, 5/1/27 | | 453,000 | 597,281 |
| Palo Alto Networks, Inc. cv. sr. unsec. notes 0.375%, 6/1/25 | | 531,000 | 897,390 |
| Pegasystems, Inc. 144A cv. sr. unsec. notes 0.75%, 3/1/25 | | 286,000 | 229,873 |
| Perficient, Inc. 144A cv. sr. unsec. notes 0.125%, 11/15/26 | | 456,000 | 337,440 |
| Rapid7, Inc. cv. sr. unsec. notes 0.25%, 3/15/27 | | 167,000 | 126,696 |
| RingCentral, Inc. cv. sr. unsec. notes zero %, 3/1/25 | | 860,000 | 723,475 |
| Shopify, Inc. cv. sr. unsec. notes 0.125%, 11/1/25 (Canada) | | 395,000 | 322,913 |
| Silicon Laboratories, Inc. cv. sr. unsec. notes 0.625%, 6/15/25 | | 158,000 | 187,041 |
| Snap, Inc. cv. sr. unsec. notes zero %, 5/1/27 | | 901,000 | 621,240 |
| Splunk, Inc. cv. sr. unsec. notes 1.125%, 6/15/27 | | 1,440,000 | 1,132,958 |
| Spotify USA, Inc. company guaranty cv. sr. unsec. notes zero %, 3/15/26 | | 1,182,000 | 927,870 |
| Twitter, Inc. cv. sr. unsec. sub. notes zero %, 3/15/26 | | 496,000 | 454,050 |
| Tyler Technologies, Inc. cv. sr. unsec. sub. notes 0.25%, 3/15/26 | | 404,000 | 381,780 |
| Unity Software, Inc. 144A cv. sr. unsec. notes zero %, 11/15/26 | | 670,000 | 485,750 |
| Viavi Solutions, Inc. cv. sr. unsec. unsub. notes 1.00%, 3/1/24 | | 310,000 | 346,736 |
| Wix.com, Ltd. cv. sr. unsec. sub. notes zero %, 8/15/25 (Israel) | | 439,000 | 367,224 |
| Wolfspeed, Inc. 144A cv. sr. unsec. unsub. notes 0.25%, 2/15/28 | | 993,000 | 1,041,161 |
| Yandex NV cv. sr. unsec. notes 0.75%, 10/13/22 (Russia) | | 200,000 | 140,000 |
| Ziff Davis, Inc. 144A cv. sr. unsec. notes 1.75%, 11/1/26 | | 539,000 | 497,767 |
| Zscaler, Inc. cv. sr. unsec. notes 0.125%, 7/1/25 | | 116,000 | 147,726 |
| | | 18,989,946 |
| Transportation (0.1%) |
| American Airlines Group, Inc. company guaranty cv. notes 6.50%, 7/1/25 | | 195,000 | 196,658 |
| Deutsche Post AG cv. sr. unsec. notes 0.05%, 6/30/25 (Germany) | EUR | 400,000 | 366,527 |
| International Consolidated Airlines Group SA cv. sr. unsec. unsub. notes Ser. REGS, 1.125%, 5/18/28 (Spain) | EUR | 600,000 | 347,298 |
| Jet2 PLC company guaranty cv. sr. unsec. unsub. notes Ser. REGS, 1.625%, 6/10/26 (United Kingdom) | GBP | 400,000 | 327,927 |
| JetBlue Airways Corp. cv. sr. unsec. notes 0.50%, 4/1/26 | | $524,000 | 372,040 |
| Southwest Airlines Co. cv. sr. unsec. notes 1.25%, 5/1/25 | | 583,000 | 665,496 |
| | | 2,275,946 |
| Utilities and power (0.1%) |
| NextEra Energy Partners LP 144A company guaranty cv. sr. unsec. notes zero %, 11/15/25 | | 811,000 | 809,343 |
| NRG Energy, Inc. company guaranty cv. sr. unsec. bonds 2.75%, 6/1/48 | | 482,000 | 513,090 |
| | | 1,322,433 |
| Total convertible bonds and notes (cost $76,539,245) | $63,141,705 |
|
| |
Diversified Income Trust 55 |
| | | |
| SENIOR LOANS (1.2%)*c | Principal
amount | Value |
| Adient US, LLC bank term loan FRN Ser. B, (ICE LIBOR USD 3 Month + 3.25%), 6.365%, 4/1/28 | | $69,125 | $65,107 |
| American Airlines, Inc. bank term loan FRN (ICE LIBOR USD 3 Month + 4.75%), 7.46%, 4/20/28 | | 650,000 | 628,550 |
American Axle and Manufacturing, Inc. bank term loan FRN
(ICE LIBOR USD 1 Month + 2.25%), 5.06%, 4/6/24 | | 18,926 | 18,481 |
| AppleCaramel Buyer, LLC bank term loan FRN (CME Term SOFR 3 Month Plus CSA + 0.00%), 6.784%, 10/19/27 | | 78,605 | 73,397 |
| Asurion, LLC bank term loan FRN Ser. B9, (ICE LIBOR USD 1 Month + 3.25%), 6.365%, 7/31/27 | | 355,489 | 299,144 |
| Brand Industrial Services, Inc. bank term loan FRN (ICE LIBOR USD 3 Month + 4.25%), 6.952%, 6/21/24 | | 1,621,967 | 1,407,673 |
| Cengage Learning, Inc. bank term loan FRN Ser. B, (ICE LIBOR USD 3 Month + 4.75%), 7.814%, 6/29/26 | | 1,232,550 | 1,112,956 |
| Clear Channel Outdoor Holdings, Inc. bank term loan FRN Ser. B, (ICE LIBOR USD 3 Month + 3.50%), 6.306%, 8/21/26 | | 1,721,054 | 1,532,271 |
Cornerstone Building Brands, Inc. bank term loan FRN Ser. B,
(ICE LIBOR USD 1 Month + 3.25%), 6.068%, 4/12/28 | | 86 | 76 |
| CQP Holdco LP bank term loan FRN (ICE LIBOR USD 3 Month + 3.75%), 7.424%, 5/27/28 | | 1,091,188 | 1,051,174 |
| Diamond Sports Group, LLC bank term loan FRN (ICE LIBOR USD 3 Month + 3.25%), 5.946%, 8/24/26 | | 72,763 | 13,877 |
| DIRECTV Financing, LLC bank term loan FRN (ICE LIBOR USD 3 Month + 5.00%), 8.115%, 7/22/27 | | 819,000 | 760,957 |
| Elanco Animal Health, Inc. bank term loan FRN Ser. B, (ICE LIBOR USD 3 Month + 1.75%), 4.314%, 2/4/27 | | 1,023,399 | 971,595 |
| Envision Healthcare Corp. bank term loan FRN (US SOFR Compounded Index + 4.25%), 6.83%, 3/31/27 | | 766,268 | 333,327 |
| Envision Healthcare Corp. bank term loan FRN (CME Term SOFR 1 Month + 3.75%), 6.325%, 3/31/27 | | 1,876,270 | 481,582 |
Fertitta Entertainment, LLC/NV bank term loan FRN Ser. B,
(CME Term SOFR 3 Month Plus CSA + 4.00%), 7.034%, 1/12/29 | | 118 | 109 |
| Filtration Group Corp. bank term loan FRN (ICE LIBOR USD 1 Month + 3.50%), 6.621%, 10/19/28 | | 123,750 | 117,201 |
| GFL Environmental, Inc. bank term loan FRN (ICE LIBOR USD 3 Month + 3.00%), 5.806%, 5/31/25 | | 191,386 | 189,066 |
| Global Medical Response, Inc. bank term loan FRN (ICE LIBOR USD 1 Month + 4.25%), 6.814%, 10/2/25 | | 2,120,356 | 1,833,048 |
| Greeneden US Holdings II, LLC bank term loan FRN (ICE LIBOR USD 3 Month + 4.00%), 7.115%, 12/1/27 | | 1,152,450 | 1,094,413 |
| iHeartCommunications, Inc. bank term loan FRN (ICE LIBOR USD 3 Month + 3.25%), 6.365%, 5/1/26 | | 62,412 | 58,473 |
| IRB Holding Corp. bank term loan FRN Ser. B, (CME Term SOFR 3 Month Plus CSA + 3.00%), 6.208%, 12/15/27 | | 88 | 82 |
Klockner-Pentaplast of America, Inc. bank term loan FRN
(ICE LIBOR USD 3 Month + 4.75%), 8.259%, 2/4/26 | | 254,791 | 215,298 |
| One Call Corp. bank term loan FRN Ser. B, (ICE LIBOR USD 1 Month + 5.50%), 7.752%, 4/22/27 | | 785,025 | 573,068 |
| PetSmart, LLC bank term loan FRN Ser. B, (ICE LIBOR USD 3 Month + 3.75%), 6.87%, 1/29/28 | | 438,891 | 414,389 |
| Proofpoint, Inc. bank term loan FRN Ser. B, (ICE LIBOR USD 3 Month + 6.25%), 9.32%, 8/31/29 | | 435,000 | 417,056 |
| |
56 Diversified Income Trust |
| | | |
| SENIOR LOANS (1.2%)*c cont. | Principal
amount | Value |
| Robertshaw Holdings Corp. bank term loan FRN (ICE LIBOR USD 3 Month + 8.00%), 11.125%, 2/28/26 | | $1,002,000 | $601,200 |
| Rocket Software, Inc. bank term loan FRN (ICE LIBOR USD 3 Month + 4.25%), 7.365%, 11/28/25 | | 696,188 | 665,298 |
| Southwestern Energy Co. bank term loan FRN Ser. B, (CME Term SOFR 3 Month Plus CSA + 2.50%), 6.203%, 6/8/27 | | 605,426 | 595,587 |
TAMKO Building Products, Inc. bank term loan FRN Ser. B,
(ICE LIBOR USD 3 Month + 3.00%), 6.078%, 5/3/26 | | 1,424,328 | 1,341,832 |
| Terrier Media Buyer, Inc. bank term loan FRN (ICE LIBOR USD 3 Month + 3.50%), 6.615%, 12/17/26 | | 1,489,912 | 1,391,831 |
| TK Elevator US Newco, Inc. bank term loan FRN Ser. B, (ICE LIBOR USD 3 Month + 3.50%), 6.871%, 7/31/27 | | 495 | 480 |
| United Airlines, Inc. bank term loan FRN Ser. B, (ICE LIBOR USD 3 Month + 3.75%), 6.533%, 4/21/28 | | 1,329,750 | 1,266,773 |
| Werner Finco LP bank term loan FRN Ser. B, (ICE LIBOR USD 3 Month + 4.00%), 7.674%, 7/24/24 | | 38,901 | 35,010 |
| Total senior loans (cost $21,507,713) | $19,560,381 |
|
| | | |
| ASSET-BACKED SECURITIES (1.0%)* | Principal
amount | Value |
| 1Sharpe Mortgage Trust 144A FRB Ser. 20-1, Class NOTE, (ICE LIBOR USD 3 Month + 2.90%), 3.025%, 7/25/24 | | $7,327,274 | $7,308,956 |
| Mello Warehouse Securitization Trust 144A | | | |
| FRB Ser. 21-3, Class E, (ICE LIBOR USD 1 Month + 3.25%), 6.334%, 11/25/55 | | 4,649,000 | 4,336,638 |
| FRB Ser. 21-3, Class D, (ICE LIBOR USD 1 Month + 2.00%), 5.084%, 11/25/55 | | 3,726,000 | 3,477,628 |
| Total asset-backed securities (cost $15,209,730) | $15,123,222 |
|
| | | | |
| PURCHASED SWAP OPTIONS OUTSTANDING (0.8%)* |
Counterparty
Fixed right % to receive or (pay)/
Floating rate index/Maturity date | Expiration
date/strike | | Notional/
contract
amount | Value |
| Bank of America N.A. |
| 0.485/3 month USD-LIBOR-ICE/Jan-25 | Jan-24/0.485 | | $306,920,900 | $49,107 |
| Morgan Stanley & Co. International PLC |
| 3.00/3 month USD-LIBOR-ICE/Feb-73 | Feb-48/3.00 | | 44,214,400 | 4,246,351 |
| 3.00/3 month USD-LIBOR-ICE/Apr-72 | Apr-47/3.00 | | 44,214,400 | 4,073,031 |
| 2.75/3 month USD-LIBOR-ICE/May-73 | May-48/2.75 | | 44,214,400 | 3,712,683 |
| 2.75/3 month USD-LIBOR-ICE/Dec-71 | Dec-46/2.75 | | 10,000,000 | 776,400 |
| Total purchased swap options outstanding (cost $17,131,177) | $12,857,572 |
|
| | | | | |
PURCHASED OPTIONS
OUTSTANDING (—%)*
Counterparty | Expiration
date/strike
price | Notional
amount | | Contract
amount | Value |
| JPMorgan Chase Bank N.A. |
| Uniform Mortgage-Backed Securities 30 yr 5.00% TBA commitments (Call) | Oct-22/$101.00 | $145,945,275 | | $150,000,000 | $150 |
| Total purchased options outstanding (cost $843,750) | $150 |
|
| |
Diversified Income Trust 57 |
| | | | |
| WARRANTS (—%)* | Expiration
date | Strike
price | Warrants | Value |
| Guaranteed Rate, Inc. † F | 3/1/23 | $0.01 | 353 | $11 |
| Total warrants (cost $18) | $11 |
|
| | | |
| SHORT-TERM INVESTMENTS (35.0%)* | Principal amount/
shares | Value |
| Alexandria Real Estate Equities, Inc. commercial paper 3.404%, 10/5/22 | | $5,000,000 | $4,997,761 |
| Alimentation Couche-Tard, Inc. commercial paper 3.455%, 10/7/22 (Canada) | | 5,000,000 | 4,996,690 |
| Alimentation Couche-Tard, Inc. commercial paper 3.405%, 10/4/22 (Canada) | | 5,000,000 | 4,998,117 |
| Amcor Flexibles North America, Inc. commercial paper 3.611%, 10/28/22 | | 5,000,000 | 4,986,544 |
| Arrow Electronics, Inc. commercial paper 3.803%, 10/6/22 | | 5,000,000 | 4,996,910 |
| AT&T, Inc. commercial paper 3.509%, 10/26/22 | | 5,000,000 | 4,987,614 |
| Aviation Capital Group, LLC commercial paper 3.741%, 10/3/22 | | 7,960,000 | 7,957,891 |
| Crown Castle, Inc. commercial paper 4.019%, 11/3/22 | | 5,000,000 | 4,982,108 |
| Crown Castle, Inc. commercial paper 3.942%, 10/20/22 | | 5,000,000 | 4,989,722 |
| Eastman Chemical Co. commercial paper 3.604%, 10/4/22 | | 5,000,000 | 4,998,151 |
| Energy Transfer LP commercial paper 3.701%, 10/3/22 | | 15,000,000 | 14,995,473 |
| Enterprise Products Operating, LLC commercial paper 3.392%, 10/5/22 | | 5,000,000 | 4,997,683 |
| Fidelity National Information Services, Inc. commercial paper 3.505%, 10/5/22 | | 5,000,000 | 4,997,691 |
| Fiserv, Inc. commercial paper 3.404%, 10/5/22 | | 2,500,000 | 2,498,839 |
| Fiserv, Inc. commercial paper 3.352%, 10/6/22 | | 5,000,000 | 4,997,208 |
| Fiserv, Inc. commercial paper 3.305%, 10/3/22 | | 5,000,000 | 4,998,610 |
| FMC Corp. commercial paper 3.551%, 10/3/22 | | 15,000,000 | 14,995,474 |
| General Motors Financial Co., Inc. commercial paper 3.501%, 10/3/22 | | 16,000,000 | 15,995,315 |
| Hawaiian Electric Co., Inc. commercial paper 3.455%, 10/6/22 | | 7,000,000 | 6,995,897 |
| Healthpeak Properties, Inc. commercial paper 3.557%, 10/18/22 | | 5,000,000 | 4,991,348 |
| Hewlett Packard Enterprise Co. commercial paper 3.559%, 10/19/22 | | 1,500,000 | 1,497,312 |
| HP, Inc. commercial paper 3.208%, 10/11/22 | | 6,000,000 | 5,993,840 |
| Hyundai Capital America commercial paper 3.490%, 10/27/22 (South Korea) | | 5,000,000 | 4,986,883 |
| Hyundai Capital America commercial paper 3.403%, 10/7/22 (South Korea) | | 2,500,000 | 2,498,372 |
| Marsh & McLennan Cos., Inc. commercial paper 3.385%, 10/11/22 | | 7,500,000 | 7,492,256 |
| Mercedes-Benz Finance North America, LLC commercial paper 3.480%, 10/26/22 | | 5,000,000 | 4,987,397 |
| Mohawk Industries, Inc. commercial paper 3.555%, 10/13/22 | | 3,500,000 | 3,495,672 |
| Mohawk Industries, Inc. commercial paper 3.106%, 10/4/22 | | 6,000,000 | 5,997,781 |
| Nutrien, Ltd. commercial paper 3.718%, 11/7/22 (Canada) | | 5,000,000 | 4,981,227 |
| ONEOK, Inc. commercial paper 3.755%, 10/12/22 | | 2,000,000 | 1,997,625 |
| ONEOK, Inc. commercial paper 3.589%, 10/11/22 | | 1,500,000 | 1,498,368 |
| Ovintiv, Inc. commercial paper 4.006%, 10/11/22 | | 5,000,000 | 4,994,376 |
| Putnam Short Term Investment Fund Class P 3.11% L | Shares | 125,491,507 | 125,491,507 |
| State Street Institutional U.S. Government Money Market Fund, Premier Class 2.94% P | Shares | 20,431,000 | 20,431,000 |
| |
58 Diversified Income Trust |
| | | |
| SHORT-TERM INVESTMENTS (35.0%)* cont. | Principal
amount | Value |
| Sumitomo Mitsui Trust Bank, Ltd./Singapore commercial paper 2.840%, 10/18/22 (Singapore) | | $9,000,000 | $8,986,190 |
| Suncor Energy, Inc. commercial paper 3.610%, 10/18/22 (Canada) | | 3,425,000 | 3,419,124 |
| Targa Resources Corp. commercial paper 3.801%, 10/3/22 | | 7,500,000 | 7,498,111 |
| TransCanada PipeLines, Ltd. commercial paper 3.563%, 10/28/22 (Canada) | | 5,000,000 | 4,986,369 |
| U.S. Treasury Bills 2.906%, 11/22/22 ∆ § Φ | | 30,000,000 | 29,877,761 |
| U.S. Treasury Bills 2.826%, 11/25/22 ∆ § Φ | | 24,800,000 | 24,697,267 |
| U.S. Treasury Bills 2.806%, 11/15/22 ∆ § Φ | | 19,400,000 | 19,334,365 |
| U.S. Treasury Bills 2.804%, 11/8/22 ∆ § Φ | | 28,500,000 | 28,422,801 |
| U.S. Treasury Bills 2.694%, 11/1/22 # ∆ § Φ | | 16,300,000 | 16,264,958 |
| U.S. Treasury Bills 2.621%, 10/25/22 ∆ § Φ | | 37,900,000 | 37,841,286 |
| U.S. Treasury Bills 2.528%, 10/18/22 ∆ | | 5,800,000 | 5,793,882 |
| UDR, Inc. commercial paper 3.611%, 10/24/22 | | 5,000,000 | 4,988,417 |
| UDR, Inc. commercial paper 2.957%, 10/4/22 | | 5,000,000 | 4,998,151 |
| Vulcan Materials Co. commercial paper 3.457%, 10/12/22 | | 3,237,000 | 3,233,184 |
| Vulcan Materials Co. commercial paper 3.305%, 10/4/22 | | 5,000,000 | 4,998,067 |
| VW Credit, Inc. commercial paper 3.540%, 10/26/22 | | 5,000,000 | 4,987,397 |
| VW Credit, Inc. commercial paper 3.445%, 10/13/22 | | 5,000,000 | 4,993,872 |
| Welltower OP, LLC commercial paper 3.455%, 10/13/22 | | 5,000,000 | 4,993,924 |
| WPP CP, LLC commercial paper 3.455%, 10/3/22 | | 7,500,000 | 7,497,922 |
| Total short-term investments (cost $557,511,393) | $557,511,710 |
|
| |
| TOTAL INVESTMENTS |
| Total investments (cost $3,265,162,979) | $3,020,230,545 |
|
| |
| Key to holding’s currency abbreviations |
| AUD | Australian Dollar |
| BRL | Brazilian Real |
| CAD | Canadian Dollar |
| CHF | Swiss Franc |
| CLP | Chilean Peso |
| CNY | Chinese Yuan (Onshore) |
| COP | Colombian Peso |
| CZK | Czech Koruna |
| EUR | Euro |
| GBP | British Pound |
| HUF | Hungarian Forint |
| ILS | Israeli Shekel |
| INR | Indian Rupee |
| JPY | Japanese Yen |
| KRW | South Korean Won |
| MXN | Mexican Peso |
| MYR | Malaysian Ringgit |
| NOK | Norwegian Krone |
| NZD | New Zealand Dollar |
| PLN | Polish Zloty |
| SEK | Swedish Krona |
| SGD | Singapore Dollar |
| THB | Thai Baht |
| USD/$ | United States Dollar |
| ZAR | South African Rand |
|
| |
Diversified Income Trust 59 |
| |
| Key to holding’s abbreviations |
| bp | Basis Points |
| DAC | Designated Activity Company |
| EMTN | Euro Medium Term Notes |
| FRB | Floating Rate Bonds: The rate shown is the current interest rate at the close of the reporting period. Rates may be subject to a cap or floor. For certain securities, the rate may represent a fixed rate currently in place at the close of the reporting period. |
| FRN | Floating Rate Notes: The rate shown is the current interest rate or yield at the close of the reporting period. Rates may be subject to a cap or floor. For certain securities, the rate may represent a fixed rate currently in place at the close of the reporting period. |
| IFB | Inverse Floating Rate Bonds, which are securities that pay interest rates that vary inversely to changes in the market interest rates. As interest rates rise, inverse floaters produce less current income. The rate shown is the current interest rate at the close of the reporting period. Rates may be subject to a cap or floor. |
| IO | Interest Only |
| LIBOR | London Interbank Offered Rate |
| OJSC | Open Joint Stock Company |
| OTC | Over-the-counter |
| REGS | Securities sold under Regulation S may not be offered, sold or delivered within the United States except pursuant to an exemption from, or in a transaction not subject to, the registration requirements of the Securities Act of 1933. |
| SOFR | Secured Overnight Financing Rate |
| TBA | To Be Announced Commitments |
|
| | | |
| Notes to the fund’s portfolio |
| Unless noted otherwise, the notes to the fund’s portfolio are for the close of the fund’s reporting period, which ran from October 1, 2021 through September 30, 2022 (the reporting period). Within the following notes to the portfolio, references to “Putnam Management” represent Putnam Investment Management, LLC, the fund’s manager, an indirect wholly-owned subsidiary of Putnam Investments, LLC and references to “ASC 820” represent Accounting Standards Codification 820 Fair Value Measurements and Disclosures. |
| * | Percentages indicated are based on net assets of $1,590,934,468. |
| † | This security is non-income-producing. |
| ‡‡ | Income may be received in cash or additional securities at the discretion of the issuer. The rate shown in parenthesis is the rate paid in kind, if applicable. |
| # | This security, in part or in entirety, was pledged and segregated with the broker to cover margin requirements for futures contracts at the close of the reporting period. Collateral at period end totaled $513,867 and is included in Investments in securities on the Statement of assets and liabilities (Notes 1 and 9). |
| ∆ | This security, in part or in entirety, was pledged and segregated with the custodian for collateral on certain derivative contracts at the close of the reporting period. Collateral at period end totaled $112,025,033 and is included in Investments in securities on the Statement of assets and liabilities (Notes 1 and 9). |
| Φ | This security, in part or in entirety, was pledged and segregated with the custodian for collateral on certain TBA commitments at the close of the reporting period. Collateral at period end totaled $7,147,936 and is included in Investments in securities on the Statement of assets and liabilities (Notes 1 and 9). |
| § | This security, in part or in entirety, was pledged and segregated with the custodian for collateral on the initial margin on certain centrally cleared derivative contracts at the close of the reporting period. Collateral at period end totaled $32,548,349 and is included in Investments in securities on the Statement of assets and liabilities (Notes 1 and 9). |
| |
60 Diversified Income Trust |
| | | |
| c | Senior loans are exempt from registration under the Securities Act of 1933, as amended, but contain certain restrictions on resale and cannot be sold publicly. These loans pay interest at rates which adjust periodically. The interest rates shown for senior loans are the current interest rates at the close of the reporting period. Senior loans are also subject to mandatory and/or optional prepayment which cannot be predicted. As a result, the remaining maturity may be substantially less than the stated maturity shown (Notes 1 and 7). |
| F | This security is valued by Putnam Management at fair value following procedures approved by the Trustees. Securities are classified as Level 3 for ASC 820 based on the securities’ valuation inputs (Note 1). |
| i | This security was pledged, or purchased with cash that was pledged, to the fund for collateral on certain derivative contracts (Note 1). |
| L | Affiliated company (Note 5). The rate quoted in the security description is the annualized 7-day yield of the fund at the close of the reporting period. |
| P | This security was pledged, or purchased with cash that was pledged, to the fund for collateral on certain derivative contracts and TBA commitments. The rate quoted in the security description is the annualized 7-day yield of the fund at the close of the reporting period. |
| R | Real Estate Investment Trust. |
| W | The rate shown represents the weighted average coupon associated with the underlying mortgage pools. Rates may be subject to a cap or floor. |
| Unless otherwise noted, the rates quoted in Short-term investments security descriptions represent the weighted average yield to maturity. |
| Debt obligations are considered secured unless otherwise indicated. |
| 144A after the name of an issuer represents securities exempt from registration under Rule 144A of the Securities Act of 1933, as amended. These securities may be resold in transactions exempt from registration, normally to qualified institutional buyers. |
| See Note 1 to the financial statements regarding TBA commitments. |
| The dates shown on debt obligations are the original maturity dates. |
|
| | | | | | |
| FORWARD CURRENCY CONTRACTS at 9/30/22 (aggregate face value $172,403,184) |
| Counterparty | Currency | Contract
type* | Delivery
date | Value | Aggregate
face value | Unrealized
appreciation/
(depreciation) |
| Bank of America N.A. |
| Australian Dollar | Buy | 10/19/22 | $370,796 | $393,659 | $(22,863) |
| British Pound | Sell | 12/21/22 | 88,758 | 91,972 | 3,214 |
| Euro | Sell | 12/21/22 | 234,677 | 240,835 | 6,158 |
| New Zealand Dollar | Sell | 10/19/22 | 39,737 | 43,693 | 3,956 |
| Swedish Krona | Sell | 12/21/22 | 34,473 | 36,457 | 1,984 |
| Barclays Bank PLC |
| Canadian Dollar | Sell | 10/19/22 | 428,984 | 458,320 | 29,336 |
| Citibank, N.A. |
| Euro | Buy | 12/21/22 | 2,719,785 | 2,788,979 | (69,194) |
| Goldman Sachs International |
| Euro | Sell | 12/21/22 | 1,791,136 | 1,837,608 | 46,472 |
| Polish Zloty | Buy | 12/21/22 | 1,396,661 | 1,494,238 | (97,577) |
| Swiss Franc | Buy | 12/21/22 | 10,360,647 | 10,632,815 | (272,168) |
| HSBC Bank USA, National Association |
| Australian Dollar | Sell | 10/19/22 | 519,665 | 559,942 | 40,277 |
| Canadian Dollar | Sell | 10/19/22 | 117,634 | 125,531 | 7,897 |
| Euro | Buy | 12/21/22 | 7,276,457 | 7,205,429 | 71,028 |
| New Zealand Dollar | Sell | 10/19/22 | 88,262 | 97,122 | 8,860 |
| |
Diversified Income Trust 61 |
| | | | | | |
| FORWARD CURRENCY CONTRACTS at 9/30/22 (aggregate face value $172,403,184) cont. |
| Counterparty | Currency | Contract
type* | Delivery
date | Value | Aggregate
face value | Unrealized
appreciation/
(depreciation) |
| HSBC Bank USA, National Association cont. |
| Norwegian Krone | Buy | 12/21/22 | $228,339 | $245,257 | $(16,918) |
| Polish Zloty | Sell | 12/21/22 | 1,396,661 | 1,494,749 | 98,088 |
| Swedish Krona | Buy | 12/21/22 | 70,670 | 76,038 | (5,368) |
| JPMorgan Chase Bank N.A. |
| British Pound | Sell | 12/21/22 | 1,179,903 | 1,222,877 | 42,974 |
| Canadian Dollar | Sell | 10/19/22 | 1,218,399 | 1,285,937 | 67,538 |
| Euro | Sell | 12/21/22 | 133,016 | 137,735 | 4,719 |
| Japanese Yen | Sell | 11/16/22 | 1,786,333 | 1,795,714 | 9,381 |
| Norwegian Krone | Buy | 12/21/22 | 29,950 | 31,515 | (1,565) |
| Swedish Krona | Buy | 12/21/22 | 9,300 | 9,613 | (313) |
| Swiss Franc | Sell | 12/21/22 | 389,655 | 400,540 | 10,885 |
| Morgan Stanley & Co. International PLC |
| Australian Dollar | Sell | 10/19/22 | 34,930 | 34,018 | (912) |
| British Pound | Buy | 12/21/22 | 2,991,846 | 2,792,429 | 199,417 |
| Canadian Dollar | Sell | 10/19/22 | 652,380 | 702,268 | 49,888 |
| Euro | Sell | 12/21/22 | 1,588,209 | 1,620,587 | 32,378 |
| Japanese Yen | Sell | 11/16/22 | 10,762,683 | 11,821,000 | 1,058,317 |
| New Zealand Dollar | Sell | 10/19/22 | 8,923,599 | 9,822,666 | 899,067 |
| Swiss Franc | Sell | 12/21/22 | 31,058 | 31,306 | 248 |
| NatWest Markets PLC |
| Australian Dollar | Buy | 10/19/22 | 23,223 | 24,823 | (1,600) |
| British Pound | Buy | 12/21/22 | 119,052 | 123,444 | (4,392) |
| Euro | Buy | 12/21/22 | 1,386,070 | 1,367,009 | 19,061 |
| State Street Bank and Trust Co. |
| Australian Dollar | Sell | 10/19/22 | 8,880,304 | 9,425,477 | 545,173 |
| British Pound | Sell | 12/21/22 | 418,751 | 426,787 | 8,036 |
| Canadian Dollar | Sell | 10/19/22 | 19,096,018 | 20,403,540 | 1,307,522 |
| Euro | Sell | 12/21/22 | 4,141,058 | 4,255,913 | 114,855 |
| New Zealand Dollar | Sell | 10/19/22 | 431,737 | 488,352 | 56,615 |
| Norwegian Krone | Sell | 12/21/22 | 2,818,665 | 3,117,269 | 298,604 |
| Swedish Krona | Sell | 12/21/22 | 6,068,925 | 6,414,596 | 345,671 |
| Swiss Franc | Buy | 12/21/22 | 11,551,480 | 11,864,591 | (313,111) |
| Toronto-Dominion Bank |
| British Pound | Sell | 12/21/22 | 189,478 | 195,890 | 6,412 |
| Canadian Dollar | Sell | 10/19/22 | 290 | 294 | 4 |
| Euro | Sell | 12/21/22 | 6,794,483 | 6,974,146 | 179,663 |
| Japanese Yen | Buy | 11/16/22 | 59,967 | 66,649 | (6,682) |
| Norwegian Krone | Sell | 12/21/22 | 1,247,114 | 1,379,898 | 132,784 |
| Swedish Krona | Sell | 12/21/22 | 3,331,974 | 3,523,819 | 191,845 |
| Swiss Franc | Sell | 12/21/22 | 786,974 | 808,184 | 21,210 |
| UBS AG |
| Australian Dollar | Buy | 10/19/22 | 43,631 | 46,026 | (2,395) |
| British Pound | Buy | 12/21/22 | 8,472,052 | 8,091,278 | 380,774 |
| Canadian Dollar | Sell | 10/19/22 | 229,404 | 244,687 | 15,283 |
| |
62 Diversified Income Trust |
| | | | | | |
| FORWARD CURRENCY CONTRACTS at 9/30/22 (aggregate face value $172,403,184) cont. |
| Counterparty | Currency | Contract
type* | Delivery
date | Value | Aggregate
face value | Unrealized
appreciation/
(depreciation) |
| UBS AG cont. |
| Japanese Yen | Buy | 11/16/22 | $21,702,953 | $24,127,494 | $(2,424,541) |
| New Zealand Dollar | Buy | 10/19/22 | 354,725 | 385,816 | (31,091) |
| Norwegian Krone | Buy | 12/21/22 | 2,576 | 2,741 | (165) |
| Swedish Krona | Sell | 12/21/22 | 49,397 | 52,231 | 2,834 |
| Swiss Franc | Sell | 12/21/22 | 2,350 | 2,011 | (339) |
| WestPac Banking Corp. |
| Australian Dollar | Sell | 10/19/22 | 1,378,779 | 1,463,642 | 84,863 |
| British Pound | Buy | 12/21/22 | 137,050 | 141,369 | (4,319) |
| Euro | Buy | 12/21/22 | 6,654,071 | 6,841,191 | (187,120) |
| New Zealand Dollar | Sell | 10/19/22 | 502,033 | 552,623 | 50,590 |
| Swiss Franc | Buy | 12/21/22 | 59,050 | 60,545 | (1,495) |
| Unrealized appreciation | 6,453,881 |
| Unrealized (depreciation) | (3,464,128) |
| Total | $2,989,753 |
| * The exchange currency for all contracts listed is the United States Dollar. |
|
| | | | | |
| FUTURES CONTRACTS OUTSTANDING at 9/30/22 |
| Number of
contracts | Notional
amount | Value | Expiration
date | Unrealized
appreciation/
(depreciation) |
| U.S. Treasury Note Ultra 10 yr (Short) | 177 | $20,971,734 | $20,971,734 | Dec-22 | $1,368,399 |
| Unrealized appreciation | | | | 1,368,399 |
| Unrealized (depreciation) | | | | — |
| Total | $1,368,399 |
|
| | | | |
| WRITTEN SWAP OPTIONS OUTSTANDING at 9/30/22 (premiums $87,879,445) |
Counterparty
Fixed Obligation % to receive or (pay)/
Floating rate index/Maturity date | Expiration
date/strike | | Notional/contract
amount | Value |
| Bank of America N.A. |
| 0.985/3 month USD-LIBOR-ICE/Jan-25 | Jan-24/0.985 | | $306,920,900 | $9,336,534 |
| Citibank, N.A. |
| (1.865)/3 month USD-LIBOR-ICE/Oct-39 | Oct-29/1.865 | | 53,655,100 | 1,176,656 |
| 1.865/3 month USD-LIBOR-ICE/Oct-39 | Oct-29/1.865 | | 53,655,100 | 6,970,334 |
| 2.395/3 month USD-LIBOR-ICE/Nov-33 | Nov-23/2.395 | | 16,867,200 | 1,928,090 |
| Goldman Sachs International |
| (1.448)/Sterling Overnight Index Average/Feb-39 | Feb-29/1.448 | GBP | 28,942,000 | 909,673 |
| 1.448/Sterling Overnight Index Average/Feb-39 | Feb-29/1.448 | GBP | 28,942,000 | 4,977,186 |
| JPMorgan Chase Bank N.A. |
| (3.229)/3 month USD-LIBOR-ICE/Nov-33 | Nov-23/3.229 | | $196,939,100 | 4,988,467 |
| 3.229/3 month USD-LIBOR-ICE/Nov-33 | Nov-23/3.229 | | 196,939,100 | 12,617,888 |
| (1.07)/3 month USD-LIBOR-ICE/Mar-32 | Mar-27/1.07 | | 27,236,800 | 169,958 |
| 1.07/3 month USD-LIBOR-ICE/Mar-32 | Mar-27/1.07 | | 27,236,800 | 2,769,983 |
| |
Diversified Income Trust 63 |
| | | | |
| WRITTEN SWAP OPTIONS OUTSTANDING at 9/30/22 (premiums $87,879,445) cont. |
Counterparty
Fixed Obligation % to receive or (pay)/
Floating rate index/Maturity date | Expiration
date/strike | | Notional/contract
amount | Value |
| JPMorgan Chase Bank N.A. cont. |
| (1.667)/6 month EUR-EURIBOR/Feb-36 | Feb-26/1.667 | EUR | 63,672,400 | $1,573,158 |
| 1.667/6 month EUR-EURIBOR/Feb-36 | Feb-26/1.667 | EUR | 63,672,400 | 9,181,226 |
| Morgan Stanley & Co. International PLC |
| (3.00)/3 month USD-LIBOR-ICE/Apr-48 | Apr-23/3.00 | | $44,214,400 | 1,094,306 |
| (3.00)/3 month USD-LIBOR-ICE/Jan-49 | Jan-24/3.00 | | 44,214,400 | 2,267,757 |
| (2.75)/3 month USD-LIBOR-ICE/May-49 | May-25/2.75 | | 44,214,400 | 2,546,307 |
| (2.97)/3 month USD-LIBOR-ICE/Feb-36 | Feb-26/2.97 | | 22,892,700 | 839,246 |
| (3.01)/3 month USD-LIBOR-ICE/Feb-36 | Feb-26/3.01 | | 22,892,700 | 869,007 |
| 3.01/3 month USD-LIBOR-ICE/Feb-36 | Feb-26/3.01 | | 22,892,700 | 1,856,598 |
| 2.97/3 month USD-LIBOR-ICE/Feb-36 | Feb-26/2.97 | | 22,892,700 | 1,894,371 |
| (2.75)/3 month USD-LIBOR-ICE/Dec-47 | Dec-24/2.75 | | 10,000,000 | 489,400 |
| Toronto-Dominion Bank |
| 1.17/3 month USD-LIBOR-ICE/Mar-55 | Mar-25/1.17 | | 5,061,900 | 1,800,568 |
| (1.17)/3 month USD-LIBOR-ICE/Mar-55 | Mar-25/1.17 | | 2,531,000 | 28,626 |
| UBS AG |
| (1.9875)/3 month USD-LIBOR-ICE/Oct-36 | Oct-26/1.9875 | | 62,240,100 | 1,106,007 |
| 1.9875/3 month USD-LIBOR-ICE/Oct-36 | Oct-26/1.9875 | | 62,240,100 | 8,271,086 |
| Total | $79,662,432 |
|
| | | | | |
| WRITTEN OPTIONS OUTSTANDING at 9/30/22 (premiums $843,750) |
| Counterparty | Expiration
date/strike price | Notional
amount | | Contract
amount | Value |
| JPMorgan Chase Bank N.A. |
| Uniform Mortgage-Backed Securities 30 yr 5.00% TBA commitments (Put) | Oct-22/$101.00 | $145,945,275 | | $150,000,000 | $5,530,200 |
| Total | |
|
| | | | | |
| FORWARD PREMIUM SWAP OPTION CONTRACTS OUTSTANDING at 9/30/22 |
Counterparty
Fixed right or obligation % to receive or (pay)/Floating rate index/
Maturity date | Expiration
date/strike | | Notional/contract
amount | Premium
receivable/
(payable) | Unrealized
appreciation/
(depreciation) |
| Bank of America N.A. |
| (1.085)/3 month USD-LIBOR-ICE/Apr-34 (Written) | Apr-24/1.085 | | $373,987,700 | $5,132,981 | $3,874,513 |
| (1.115)/3 month USD-LIBOR-ICE/Jan-26 (Written) | Jan-25/1.115 | | 295,887,000 | 1,246,424 | 819,607 |
| 1.115/3 month USD-LIBOR-ICE/Jan-26 (Written) | Jan-25/1.115 | | 295,887,000 | 1,246,424 | (6,352,694) |
| 2.25/US SOFR/Jan-33 (Purchased) | Jan-23/2.25 | | 271,620,300 | (4,404,296) | (3,943,927) |
| 2.245/US SOFR/Jan-33 (Purchased) | Jan-23/2.245 | | 271,620,300 | (4,427,927) | (3,973,805) |
| 2.415/3 month USD-LIBOR-ICE/Oct-33 (Written) | Oct-23/2.415 | | 224,241,800 | 4,737,108 | (20,897,093) |
| 2.17/3 month USD-LIBOR-ICE/Apr-34 (Purchased) | Apr-24/2.17 | | 186,994,200 | (9,031,820) | (6,617,725) |
| |
64 Diversified Income Trust |
| | | | | |
| FORWARD PREMIUM SWAP OPTION CONTRACTS OUTSTANDING at 9/30/22 cont. |
Counterparty
Fixed right or obligation % to receive or (pay)/Floating rate index/
Maturity date | Expiration
date/strike | | Notional/
contract
amount | Premium
receivable/
(payable) | Unrealized
appreciation/
(depreciation) |
| Bank of America N.A. cont. |
| (1.39)/US SOFR/Dec-26 (Purchased) | Dec-24/1.39 | | $115,832,300 | $(1,332,071) | $3,509,719 |
| 1.39/US SOFR/Dec-26 (Purchased) | Dec-24/1.39 | | 115,832,300 | (1,332,071) | (846,734) |
| (2.35)/3 month USD-LIBOR-ICE/Apr-56 (Purchased) | Apr-26/2.35 | | 99,263,300 | (12,904,229) | 6,850,160 |
| 2.35/3 month USD-LIBOR-ICE/Apr-56 (Purchased) | Apr-26/2.35 | | 99,263,300 | (12,904,229) | (5,235,146) |
| (2.41)/US SOFR/Oct-32 (Written) | Oct-22/2.41 | | 95,066,900 | 1,354,350 | 1,345,197 |
| (2.42)/US SOFR/Oct-32 (Written) | Oct-22/2.42 | | 95,066,900 | 1,351,688 | 1,342,345 |
| (1.29)/3 month USD-LIBOR-ICE/Mar-34 (Written) | Mar-24/1.29 | | 93,496,900 | 1,458,552 | 1,095,784 |
| (2.485)/3 month USD-LIBOR-ICE/Oct-54 (Purchased) | Oct-24/2.485 | | 72,336,100 | (4,365,484) | 8,152,278 |
| 2.29/3 month USD-LIBOR-ICE/Mar-34 (Purchased) | Mar-24/2.29 | | 65,447,700 | (3,219,092) | (2,342,373) |
| (0.925)/3 month USD-LIBOR-ICE/Mar-40 (Purchased) | Mar-30/0.925 | | 54,490,500 | (3,901,520) | 6,729,577 |
| 0.925/3 month USD-LIBOR-ICE/Mar-40 (Purchased) | Mar-30/0.925 | | 54,490,500 | (3,901,520) | (2,346,906) |
| (2.272)/US SOFR/Apr-42 (Written) | Apr-32/2.272 | | 30,980,700 | 2,580,692 | 691,489 |
| 2.272/US SOFR/Apr-42 (Written) | Apr-32/2.272 | | 30,980,700 | 2,580,692 | (952,657) |
| (0.85)/3 month USD-LIBOR-ICE/Mar-40 (Purchased) | Mar-30/0.85 | | 27,749,600 | (2,025,721) | 3,514,209 |
| 0.85/3 month USD-LIBOR-ICE/Mar-40 (Purchased) | Mar-30/0.85 | | 27,749,600 | (2,025,721) | (1,241,240) |
| (1.275)/3 month USD-LIBOR-ICE/Mar-50 (Purchased) | Mar-30/1.275 | | 24,024,100 | (3,129,139) | 3,250,220 |
| 1.275/3 month USD-LIBOR-ICE/Mar-50 (Purchased) | Mar-30/1.275 | | 24,024,100 | (3,129,139) | (1,773,459) |
| (2.46)/US SOFR/Jun-59 (Written) | Jun-29/2.46 | | 9,900,000 | 1,398,870 | (24,255) |
| 2.46/US SOFR/Jun-59 (Written) | Jun-29/2.46 | | 9,900,000 | 1,398,870 | (222,255) |
| (3.073)/US SOFR/Jun-37 (Written) | Jun-27/3.073 | | 7,501,700 | 545,749 | 48,536 |
| 3.073/US SOFR/Jun-37 (Written) | Jun-27/3.073 | | 7,501,700 | 545,749 | (61,814) |
| (3.101)/US SOFR/Jun-39 (Written) | Jun-29/3.101 | | 2,970,700 | 232,012 | 7,249 |
| 3.101/US SOFR/Jun-39 (Written) | Jun-29/3.101 | | 2,970,700 | 232,012 | (19,102) |
| (2.406)/6 month EUR-EURIBOR/Aug-34 (Written) | Aug-24/2.406 | EUR | 16,733,700 | 907,913 | 282,570 |
| 2.406/6 month EUR-EURIBOR/Aug-34 (Written) | Aug-24/2.406 | EUR | 16,733,700 | 907,913 | (791,293) |
| (2.396)/6 month EUR-EURIBOR/Aug-34 (Written) | Aug-24/2.396 | EUR | 8,295,200 | 447,997 | 140,481 |
| 2.396/6 month EUR-EURIBOR/Aug-34 (Written) | Aug-24/2.396 | EUR | 8,295,200 | 447,997 | (398,518) |
| |
Diversified Income Trust 65 |
| | | | | |
| FORWARD PREMIUM SWAP OPTION CONTRACTS OUTSTANDING at 9/30/22 cont. |
Counterparty
Fixed right or obligation % to receive or (pay)/Floating rate index/
Maturity date | Expiration
date/strike | | Notional/
contract
amount | Premium
receivable/
(payable) | Unrealized
appreciation/
(depreciation) |
| Citibank, N.A. |
| (1.90)/3 month USD-LIBOR-ICE/Jun-28 (Purchased) | Jun-26/1.90 | | $166,388,200 | $(2,217,955) | $3,943,400 |
| 1.90/3 month USD-LIBOR-ICE/Jun-28 (Purchased) | Jun-26/1.90 | | 166,388,200 | (2,217,955) | (1,008,312) |
| (1.194)/3 month USD-LIBOR-ICE/Jun-25 (Written) | Jun-23/1.194 | | 166,388,200 | 1,261,223 | 1,194,667 |
| 1.194/3 month USD-LIBOR-ICE/Jun-25 (Written) | Jun-23/1.194 | | 166,388,200 | 1,261,223 | (8,417,579) |
| 1.999/US SOFR/Jan-33 (Purchased) | Jan-23/1.999 | | 161,380,300 | (1,194,214) | (1,102,227) |
| (2.842)/US SOFR/Nov-32 (Written) | Nov-22/2.842 | | 122,192,500 | 1,075,294 | 907,890 |
| 2.394/US SOFR/Sep-33 (Purchased) | Sep-23/2.394 | | 68,289,000 | (826,297) | (17,687) |
| (1.826)/US SOFR/Jan-42 (Purchased) | Jan-32/1.826 | | 55,459,800 | (4,095,706) | 3,134,588 |
| 1.826/US SOFR/Jan-42 (Purchased) | Jan-32/1.826 | | 55,459,800 | (4,095,706) | (1,389,823) |
| (1.724)/US SOFR/Mar-53 (Purchased) | Mar-23/1.724 | | 25,282,600 | (1,907,572) | 4,365,547 |
| 1.724/US SOFR/Mar-53 (Purchased) | Mar-23/1.724 | | 25,282,600 | (1,907,572) | (1,814,785) |
| (1.625)/3 month USD-LIBOR-ICE/Jan-61 (Purchased) | Jan-41/1.625 | | 25,233,100 | (3,721,882) | 934,634 |
| 1.625/3 month USD-LIBOR-ICE/Jan-61 (Purchased) | Jan-41/1.625 | | 25,233,100 | (3,721,882) | (487,756) |
| (1.735)/US SOFR/Mar-53 (Purchased) | Mar-23/1.735 | | 24,981,300 | (1,846,743) | 4,301,030 |
| 1.735/US SOFR/Mar-53 (Purchased) | Mar-23/1.735 | | 24,981,300 | (1,846,743) | (1,752,188) |
| (1.75)/US SOFR/Mar-53 (Purchased) | Mar-23/1.75 | | 24,882,800 | (1,862,478) | 4,194,245 |
| 1.75/US SOFR/Mar-53 (Purchased) | Mar-23/1.75 | | 24,882,800 | (1,862,478) | (1,767,176) |
| (2.795)/US SOFR/Oct-32 (Purchased) | Oct-22/2.795 | | 24,387,300 | (497,501) | 1,049,386 |
| 2.795/US SOFR/Oct-32 (Purchased) | Oct-22/2.795 | | 24,387,300 | (497,501) | (490,672) |
| (1.102)/3 month USD-LIBOR-ICE/Nov-32 (Purchased) | Nov-22/1.102 | | 14,732,300 | (468,119) | 2,861,307 |
| 1.102/3 month USD-LIBOR-ICE/Nov-32 (Purchased) | Nov-22/1.102 | | 14,732,300 | (468,119) | (465,688) |
| (2.689)/3 month USD-LIBOR-ICE/Nov-49 (Purchased) | Nov-24/2.689 | | 11,217,000 | (1,444,189) | 284,351 |
| 2.689/3 month USD-LIBOR-ICE/Nov-49 (Purchased) | Nov-24/2.689 | | 11,217,000 | (1,444,189) | (764,214) |
| (1.177)/3 month USD-LIBOR-ICE/Jul-40 (Written) | Jul-30/1.177 | | 10,633,700 | 806,034 | 460,546 |
| 1.177/3 month USD-LIBOR-ICE/Jul-40 (Written) | Jul-30/1.177 | | 10,633,700 | 806,034 | (1,120,686) |
| (2.427)/3 month USD-LIBOR-ICE/Jun-41 (Purchased) | Jun-31/2.427 | | 9,949,800 | (724,843) | 443,960 |
| 2.427/3 month USD-LIBOR-ICE/Jun-41 (Purchased) | Jun-31/2.427 | | 9,949,800 | (724,843) | (201,483) |
| (0.055)/3 month EUR-EURIBOR/Mar-25 (Written) | Mar-24/0.055 | EUR | 716,475,000 | 2,298,753 | 1,804,606 |
| 0.555/3 month EUR-EURIBOR/Mar-25 (Purchased) | Mar-24/0.555 | EUR | 358,237,500 | (2,259,791) | (1,794,073) |
| |
66 Diversified Income Trust |
| | | | | |
| FORWARD PREMIUM SWAP OPTION CONTRACTS OUTSTANDING at 9/30/22 cont. |
Counterparty
Fixed right or obligation % to receive or (pay)/Floating rate index/
Maturity date | Expiration
date/strike | | Notional/
contract
amount | Premium
receivable/
(payable) | Unrealized
appreciation/
(depreciation) |
| Deutsche Bank AG |
| (1.818)/6 month EUR-EURIBOR/Jul-56 (Written) | Jul-26/1.818 | EUR | 14,401,900 | $2,254,661 | $155,260 |
| 1.818/6 month EUR-EURIBOR/Jul-56 (Written) | Jul-26/1.818 | EUR | 14,401,900 | 2,254,661 | (861,695) |
| Goldman Sachs International |
| 2.41/3 month USD-LIBOR-ICE/Aug-33 (Written) | Aug-23/2.41 | | $88,528,900 | 1,292,522 | (8,860,858) |
| 2.07/3 month USD-LIBOR-ICE/Aug-33 (Written) | Aug-23/2.07 | | 80,380,800 | 1,663,883 | (9,562,904) |
| (2.544)/US SOFR/Nov-32 (Purchased) | Nov-22/2.544 | | 70,787,300 | (1,451,140) | 4,513,398 |
| 2.544/US SOFR/Nov-32 (Purchased) | Nov-22/2.544 | | 70,787,300 | (1,451,140) | (1,422,825) |
| (1.727)/3 month USD-LIBOR-ICE/Jan-55 (Purchased) | Jan-25/1.727 | | 15,897,000 | (2,376,602) | 2,147,367 |
| 1.727/3 month USD-LIBOR-ICE/Jan-55 (Purchased) | Jan-25/1.727 | | 15,897,000 | (1,457,755) | (981,481) |
| (2.8175)/3 month USD-LIBOR-ICE/Mar-47 (Purchased) | Mar-27/2.8175 | | 8,348,800 | (1,054,036) | 144,434 |
| 2.8175/3 month USD-LIBOR-ICE/Mar-47 (Purchased) | Mar-27/2.8175 | | 8,348,800 | (1,054,036) | (343,386) |
| (1.71)/3 month USD-LIBOR-ICE/Dec-56 (Written) | Dec-26/1.71 | | 65,100 | 8,815 | 5,042 |
| 1.71/3 month USD-LIBOR-ICE/Dec-56 (Written) | Dec-26/1.71 | | 65,100 | 8,815 | (9,253) |
| (0.26)/6 month EUR-EURIBOR/Jun-28 (Written) | Jun-26/0.26 | EUR | 233,622,900 | 2,605,303 | 1,444,751 |
| 0.26/6 month EUR-EURIBOR/Jun-28 (Written) | Jun-26/0.26 | EUR | 233,622,900 | 2,605,303 | (10,271,241) |
| (0.555)/6 month EUR-EURIBOR/Mar-40 (Written) | Mar-30/0.555 | EUR | 22,704,300 | 3,428,622 | 862,685 |
| 0.555/6 month EUR-EURIBOR/Mar-40 (Written) | Mar-30/0.555 | EUR | 22,704,300 | 3,428,622 | (2,921,602) |
| JPMorgan Chase Bank N.A. |
| (1.70)/US SOFR/Jan-29 (Written) | Jan-24/1.70 | | $81,387,600 | 1,736,608 | 1,321,735 |
| 1.70/US SOFR/Jan-29 (Written) | Jan-24/1.70 | | 81,387,600 | 1,736,608 | (5,207,179) |
| (1.232)/3 month USD-LIBOR-ICE/Jun-37 (Written) | Jun-27/1.232 | | 39,852,700 | 2,560,536 | 1,723,231 |
| 1.232/3 month USD-LIBOR-ICE/Jun-37 (Written) | Jun-27/1.232 | | 39,852,700 | 2,560,536 | (4,848,878) |
| (1.204)/3 month USD-LIBOR-ICE/Jun-40 (Written) | Jun-30/1.204 | | 31,601,400 | 2,355,884 | 1,332,947 |
| 1.204/3 month USD-LIBOR-ICE/Jun-40 (Written) | Jun-30/1.204 | | 31,601,400 | 2,355,884 | (3,318,147) |
| (1.168)/3 month USD-LIBOR-ICE/Jun-37 (Written) | Jun-27/1.168 | | 29,457,400 | 1,895,584 | 1,290,823 |
| 1.168/3 month USD-LIBOR-ICE/Jun-37 (Written) | Jun-27/1.168 | | 29,457,400 | 1,895,584 | (3,696,020) |
| |
Diversified Income Trust 67 |
| | | | | |
| FORWARD PREMIUM SWAP OPTION CONTRACTS OUTSTANDING at 9/30/22 cont. |
Counterparty
Fixed right or obligation % to receive or (pay)/Floating rate index/
Maturity date | Expiration
date/strike | | Notional/
contract
amount | Premium
receivable/
(payable) | Unrealized
appreciation/
(depreciation) |
| JPMorgan Chase Bank N.A. cont. |
| (2.317)/US SOFR/Apr-42 (Written) | Apr-32/2.317 | | $23,236,600 | $1,968,140 | $518,176 |
| 2.317/US SOFR/Apr-42 (Written) | Apr-32/2.317 | | 23,236,600 | 1,968,140 | (651,090) |
| (2.032)/3 month USD-LIBOR-ICE/Jan-55 (Purchased) | Jan-25/2.032 | | 22,444,300 | (2,592,317) | 2,736,185 |
| 2.032/3 month USD-LIBOR-ICE/Jan-55 (Purchased) | Jan-25/2.032 | | 22,444,300 | (2,592,317) | (1,661,552) |
| (1.81)/US SOFR/Jan-37 (Written) | Jan-27/1.81 | | 13,645,200 | 806,431 | 404,990 |
| 1.81/US SOFR/Jan-37 (Written) | Jan-27/1.81 | | 13,645,200 | 806,431 | (1,050,817) |
| (3.315)/6 month AUD-BBR-BBSW/May-52 (Purchased) | May-32/3.315 | AUD | 38,598,400 | (3,245,771) | 305,902 |
| 3.315/6 month AUD-BBR-BBSW/May-52 (Purchased) | May-32/3.315 | AUD | 38,598,400 | (3,245,771) | (352,319) |
| (1.445)/6 month AUD-BBR-BBSW/Mar-40 (Purchased) | Mar-30/1.445 | AUD | 25,226,900 | (945,635) | 2,188,901 |
| 1.445/6 month AUD-BBR-BBSW/Mar-40 (Purchased) | Mar-30/1.445 | AUD | 25,226,900 | (945,635) | (629,965) |
| (1.692)/6 month AUD-BBR-BBSW/Jan-35 (Purchased) | Jan-25/1.692 | AUD | 19,590,000 | (611,186) | 2,162,556 |
| 1.692/6 month AUD-BBR-BBSW/Jan-35 (Purchased) | Jan-25/1.692 | AUD | 19,590,000 | (611,186) | (506,367) |
| (2.495)/6 month AUD-BBR-BBSW/Nov-46 (Purchased) | Nov-26/2.495 | AUD | 13,662,300 | (849,629) | 1,206,868 |
| 2.495/6 month AUD-BBR-BBSW/Nov-46 (Purchased) | Nov-26/2.495 | AUD | 13,662,300 | (849,629) | (472,960) |
| (1.441)/6 month AUD-BBR-BBSW/Jul-45 (Purchased) | Jul-25/1.441 | AUD | 12,083,500 | (714,644) | 2,010,059 |
| 1.441/6 month AUD-BBR-BBSW/Jul-45 (Purchased) | Jul-25/1.441 | AUD | 12,083,500 | (714,644) | (573,430) |
| (2.50)/6 month AUD-BBR-BBSW/Nov-42 (Written) | Nov-22/2.50 | AUD | 8,470,500 | 305,743 | 269,770 |
| 2.50/6 month AUD-BBR-BBSW/Nov-42 (Written) | Nov-22/2.50 | AUD | 8,470,500 | 305,743 | (1,098,964) |
| (1.921)/6 month EUR-EURIBOR/Oct-48 (Purchased) | Oct-28/1.921 | EUR | 29,488,100 | (3,771,047) | 1,909,122 |
| 1.921/6 month EUR-EURIBOR/Oct-48 (Purchased) | Oct-28/1.921 | EUR | 29,488,100 | (3,771,047) | 70,516 |
| Morgan Stanley & Co. International PLC |
| 2.1075/US SOFR/Jan-33 (Purchased) | Jan-23/2.1075 | | $271,620,300 | (4,087,885) | (3,751,076) |
| 2.195/US SOFR/Jan-33 (Purchased) | Jan-23/2.195 | | 271,620,300 | (4,311,972) | (3,897,751) |
| (2.733)/US SOFR/Jun-33 (Written) | Jun-23/2.733 | | 230,000,000 | 7,975,250 | 5,025,500 |
| 2.733/US SOFR/Jun-33 (Written) | Jun-23/2.733 | | 230,000,000 | 7,975,250 | (9,144,800) |
| (2.39)/3 month USD-LIBOR-ICE/Jun-34 (Written) | Jun-24/2.39 | | 116,296,100 | 6,122,990 | 4,144,793 |
| 2.39/3 month USD-LIBOR-ICE/Jun-34 (Written) | Jun-24/2.39 | | 116,296,100 | 6,122,990 | (7,430,158) |
| (2.36)/US SOFR/Oct-32 (Written) | Oct-22/2.36 | | 95,066,900 | 1,345,197 | 1,335,690 |
| |
68 Diversified Income Trust |
| | | | | |
| FORWARD PREMIUM SWAP OPTION CONTRACTS OUTSTANDING at 9/30/22 cont. |
Counterparty
Fixed right or obligation % to receive or (pay)/Floating rate index/
Maturity date | Expiration
date/strike | | Notional/
contract
amount | Premium
receivable/
(payable) | Unrealized
appreciation/
(depreciation) |
| Morgan Stanley & Co. International PLC cont. |
| (2.27375)/US SOFR/Oct-32 (Written) | Oct-22/2.27375 | | $95,066,900 | $1,276,273 | $1,269,143 |
| (2.5375)/US SOFR/Nov-32 (Purchased) | Nov-22/2.5375 | | 93,705,400 | (1,981,869) | 5,962,475 |
| 2.5375/US SOFR/Nov-32 (Purchased) | Nov-22/2.5375 | | 93,705,400 | (1,981,869) | (1,940,639) |
| (2.509)/US SOFR/Jun-55 (Purchased) | Jun-25/2.509 | | 33,000,000 | (3,667,125) | 1,182,390 |
| 2.509/US SOFR/Jun-55 (Purchased) | Jun-25/2.509 | | 33,000,000 | (3,667,125) | (690,690) |
| 3.27/3 month USD-LIBOR-ICE/Oct-53 (Purchased) | Oct-23/3.27 | | 28,548,700 | (3,257,407) | (891,290) |
| (3.27)/3 month USD-LIBOR-ICE/Oct-53 (Purchased) | Oct-23/3.27 | | 28,548,700 | (3,257,407) | (991,782) |
| (2.3825)/US SOFR/Jul-56 (Purchased) | Jul-26/2.3825 | | 17,896,800 | (2,268,419) | 706,029 |
| 2.3825/US SOFR/Jul-56 (Purchased) | Jul-26/2.3825 | | 17,896,800 | (2,268,419) | (452,789) |
| (2.505)/3 month USD-LIBOR-ICE/Nov-49 (Purchased) | Nov-24/2.505 | | 11,217,000 | (1,718,444) | 253,729 |
| 2.505/3 month USD-LIBOR-ICE/Nov-49 (Purchased) | Nov-24/2.505 | | 11,217,000 | (1,206,949) | (648,455) |
| (2.106)/Sterling Overnight Index Average/Nov-32 (Written) | Nov-22/2.106 | GBP | 77,307,000 | 2,041,854 | 1,864,450 |
| 2.206/Sterling Overnight Index Average/Nov-32 (Written) | Nov-22/2.206 | GBP | 77,307,000 | 2,041,854 | (13,550,063) |
| Toronto-Dominion Bank |
| (1.937)/3 month USD-LIBOR-ICE/Feb-36 (Purchased) | Feb-26/1.937 | | $19,044,700 | (996,038) | 1,741,066 |
| 1.937/3 month USD-LIBOR-ICE/Feb-36 (Purchased) | Feb-26/1.937 | | 19,044,700 | (996,038) | (593,052) |
| (2.405)/3 month USD-LIBOR-ICE/Mar-41 (Purchased) | Mar-31/2.405 | | 9,114,500 | (635,736) | 440,322 |
| 2.405/3 month USD-LIBOR-ICE/Mar-41 (Purchased) | Mar-31/2.405 | | 9,114,500 | (635,736) | (173,722) |
| (2.095)/3 month USD-LIBOR-ICE/Feb-56 (Written) | Feb-26/2.095 | | 8,225,800 | 1,081,693 | 565,524 |
| 2.095/3 month USD-LIBOR-ICE/Feb-56 (Written) | Feb-26/2.095 | | 8,225,800 | 1,081,693 | (808,185) |
| UBS AG |
| (0.87)/3 month USD-LIBOR-ICE/Apr-28 (Purchased) | Apr-27/0.87 | | 157,691,000 | (1,063,626) | 2,983,514 |
| 0.87/3 month USD-LIBOR-ICE/Apr-28 (Purchased) | Apr-27/0.87 | | 157,691,000 | (1,063,626) | (660,725) |
| (0.983)/3 month USD-LIBOR-ICE/Apr-32 (Purchased) | Apr-30/0.983 | | 63,076,400 | (999,761) | 1,788,847 |
| 0.983/3 month USD-LIBOR-ICE/Apr-32 (Purchased) | Apr-30/0.983 | | 63,076,400 | (999,761) | (524,165) |
| (0.8925)/3 month USD-LIBOR-ICE/Apr-28 (Purchased) | Apr-23/0.8925 | | 47,307,400 | (1,002,917) | 5,564,769 |
| 0.8925/3 month USD-LIBOR-ICE/Apr-28 (Purchased) | Apr-23/0.8925 | | 47,307,400 | (1,002,917) | (978,317) |
| |
Diversified Income Trust 69 |
| | | | | |
| FORWARD PREMIUM SWAP OPTION CONTRACTS OUTSTANDING at 9/30/22 cont. |
Counterparty
Fixed right or obligation % to receive or (pay)/Floating rate index/
Maturity date | Expiration
date/strike | | Notional/
contract
amount | Premium
receivable/
(payable) | Unrealized
appreciation/
(depreciation) |
| UBS AG cont. |
| (0.958)/3 month USD-LIBOR-ICE/May-30 (Written) | May-25/0.958 | | $37,845,900 | $1,005,755 | $781,139 |
| 0.958/3 month USD-LIBOR-ICE/May-30 (Written) | May-25/0.958 | | 37,845,900 | 1,005,755 | (3,409,916) |
| (0.902)/3 month USD-LIBOR-ICE/Apr-35 (Purchased) | Apr-25/0.902 | | 18,922,800 | (1,058,731) | 3,015,159 |
| 0.902/3 month USD-LIBOR-ICE/Apr-35 (Purchased) | Apr-25/0.902 | | 18,922,800 | (1,058,731) | (888,047) |
| (1.715)/3 month USD-LIBOR-ICE/Feb-53 (Purchased) | Feb-23/1.715 | | 9,522,400 | (859,397) | 2,018,082 |
| 1.715/3 month USD-LIBOR-ICE/Feb-53 (Purchased) | Feb-23/1.715 | | 9,522,400 | (859,397) | (843,399) |
| (2.00)/6 month AUD-BBR-BBSW/Sep-46 (Purchased) | Sep-36/2.00 | AUD | 21,121,500 | (1,124,193) | 679,031 |
| 2.00/6 month AUD-BBR-BBSW/Sep-46 (Purchased) | Sep-36/2.00 | AUD | 21,121,500 | (1,124,193) | (282,096) |
| (2.70)/6 month AUD-BBR-BBSW/Apr-47 (Purchased) | Apr-37/2.70 | AUD | 10,843,500 | (658,399) | 139,692 |
| 2.70/6 month AUD-BBR-BBSW/Apr-47 (Purchased) | Apr-37/2.70 | AUD | 10,843,500 | (658,399) | (92,804) |
| 3.255/6 month EUR-EURIBOR/Sep-24 (Purchased) | Sep-23/3.255 | EUR | 289,565,700 | (1,863,272) | 98,134 |
| (3.255)/6 month EUR-EURIBOR/Sep-24 (Purchased) | Sep-23/3.255 | EUR | 289,565,700 | (1,863,272) | (258,390) |
| (2.60)/6 month EUR-EURIBOR/Jun-30 (Written) | Jun-25/2.60 | EUR | 26,314,900 | 923,300 | 91,812 |
| (2.65)/6 month EUR-EURIBOR/Jun-30 (Written) | Jun-25/2.65 | EUR | 26,314,900 | 926,655 | 66,022 |
| (2.675)/6 month EUR-EURIBOR/Jun-30 (Written) | Jun-25/2.675 | EUR | 26,314,900 | 923,300 | 53,127 |
| 2.675/6 month EUR-EURIBOR/Jun-30 (Written) | Jun-25/2.675 | EUR | 26,314,900 | 923,300 | (484,077) |
| 2.65/6 month EUR-EURIBOR/Jun-30 (Written) | Jun-25/2.65 | EUR | 26,314,900 | 926,655 | (498,777) |
| 2.60/6 month EUR-EURIBOR/Jun-30 (Written) | Jun-25/2.60 | EUR | 26,314,900 | 923,300 | (528,951) |
| (0.44)/6 month EUR-EURIBOR/Feb-41 (Purchased) | Feb-31/0.44 | EUR | 22,869,000 | (1,794,123) | 3,003,759 |
| 0.44/6 month EUR-EURIBOR/Feb-41 (Purchased) | Feb-31/0.44 | EUR | 22,869,000 | (1,794,123) | (725,725) |
| (1.325)/6 month EUR-EURIBOR/Apr-49 (Purchased) | Apr-29/1.325 | EUR | 15,491,000 | (2,147,726) | 1,477,356 |
| 1.325/6 month EUR-EURIBOR/Apr-49 (Purchased) | Apr-29/1.325 | EUR | 15,491,000 | (2,147,726) | (554,597) |
| (0.43)/6 month EUR-EURIBOR/Aug-39 (Written) | Aug-29/0.43 | EUR | 11,145,900 | 893,551 | 488,938 |
| |
70 Diversified Income Trust |
| | | | | |
| FORWARD PREMIUM SWAP OPTION CONTRACTS OUTSTANDING at 9/30/22 cont. |
Counterparty
Fixed right or obligation % to receive or (pay)/Floating rate index/
Maturity date | Expiration
date/strike | | Notional/contract
amount | Premium
receivable/
(payable) | Unrealized
appreciation/
(depreciation) |
| UBS AG cont. |
| 0.43/6 month EUR-EURIBOR/Aug-39 (Written) | Aug-29/0.43 | EUR | 11,145,900 | $893,551 | $(1,547,429) |
| (0.296)/6 month EUR-EURIBOR/Jan-51 (Purchased) | Jan-31/0.296 | EUR | 7,622,900 | (1,153,465) | 1,316,957 |
| 0.296/6 month EUR-EURIBOR/Jan-51 (Purchased) | Jan-31/0.296 | EUR | 7,622,900 | (1,153,465) | (416,576) |
| Unrealized appreciation | 148,316,258 |
| Unrealized (depreciation) | (197,596,721) |
| Total | $(49,280,463) |
|
| | | |
| TBA SALE COMMITMENTS OUTSTANDING at 9/30/22 (proceeds receivable $486,909,551) |
| Agency | Principal
amount | Settlement
date | Value |
| Government National Mortgage Association, 3.50%, 10/1/52 | $3,000,000 | 10/20/22 | $2,725,495 |
| Uniform Mortgage-Backed Securities, 5.00%, 10/1/52 | 110,000,000 | 10/13/22 | 107,026,535 |
| Uniform Mortgage-Backed Securities, 4.00%, 10/1/52 | 15,000,000 | 10/13/22 | 13,903,122 |
| Uniform Mortgage-Backed Securities, 3.50%, 10/1/52 | 45,000,000 | 10/13/22 | 40,464,833 |
| Uniform Mortgage-Backed Securities, 3.00%, 10/1/52 | 76,000,000 | 10/13/22 | 66,072,500 |
| Uniform Mortgage-Backed Securities, 2.50%, 10/1/52 | 120,000,000 | 10/13/22 | 100,696,872 |
| Uniform Mortgage-Backed Securities, 2.00%, 10/1/52 | 171,000,000 | 10/13/22 | 138,365,727 |
| Total | $469,255,084 |
|
| | | | | | | |
| OTC INTEREST RATE SWAP CONTRACTS OUTSTANDING at 9/30/22 |
Swap counterparty/
Notional amount | Value | Upfront
premium
received
(paid) | Termination
date | Payments
made by fund | Payments
received by fund | Unrealized
appreciation/
(depreciation) |
| JPMorgan Chase Bank N.A. |
| MYR | 38,450,000 | $79,520 E | $— | 12/21/27 | Bank Negara Malaysia Kibor Interbank Offered Rate Fixing 3 month — Quarterly | 3.90% — Quarterly | $(79,520) |
| Morgan Stanley & Co. International PLC |
| | $1,650,000,000 | 25,311,000 | 7,751,295 | 9/21/24 | 3.40% — Annually | US SOFR — Annually | 32,603,217 |
| MYR | 3,910,000 | 4,671 E | — | 12/21/27 | Bank Negara Malaysia Kibor Interbank Offered Rate Fixing 3 month — Quarterly | 3.985% — Quarterly | (4,671) |
| Upfront premium received | 7,751,295 | | Unrealized appreciation | 32,603,217 |
| Upfront premium (paid) | — | | Unrealized (depreciation) | (84,191) |
| Total | $7,751,295 | | Total | $32,519,026 |
| E Extended effective date. |
|
| |
Diversified Income Trust 71 |
| | | | | | | |
| CENTRALLY CLEARED INTEREST RATE SWAP CONTRACTS OUTSTANDING at 9/30/22 |
| Notional amount | Value | Upfront
premium
received
(paid) | Termination
date | Payments
made by fund | Payments
received by fund | Unrealized
appreciation/
(depreciation) |
| | $58,978,200 | $11,270,734 | $2,470,408 | 9/1/32 | 3 month USD-LIBOR-ICE — Quarterly | 1.512% — Semiannually | $(8,877,496) |
| | 178,113,000 | 7,628,580 | 8,605 | 12/23/23 | 0.695% — Annually | US SOFR — Annually | 7,957,523 |
| | 86,795,000 | 9,390,351 | 7,460 | 12/23/26 | 1.085% — Annually | US SOFR — Annually | 9,254,716 |
| | 88,939,000 | 15,824,916 | (23,139) | 12/23/31 | US SOFR — Annually | 1.285% — Annually | (15,562,088) |
| | 4,249,000 | 1,305,208 | (7,566) | 12/23/51 | US SOFR — Annually | 1.437% — Annually | (1,294,048) |
| | 245,670,000 | 10,517,133 | (24,998) | 12/24/23 | 0.697% — Annually | US SOFR — Annually | 10,851,043 |
| | 22,430,000 | 2,418,178 | (3,002) | 12/24/26 | 1.096% — Annually | US SOFR — Annually | 2,353,523 |
| | 73,987,000 | 13,166,727 | (33,029) | 12/24/31 | 1.285% — Annually | US SOFR — Annually | 12,902,212 |
| | 97,957,000 | 30,126,675 | (52,939) | 12/24/51 | 1.435% — Annually | US SOFR — Annually | 29,614,984 |
| | 53,288,000 | 15,492,420 | (8,686) | 12/31/51 | 1.525% — Annually | US SOFR — Annually | 15,188,919 |
| | 16,267,000 | 1,735,201 | (2,158) | 12/31/26 | US SOFR — Annually | 1.135% — Annually | (1,693,361) |
| | 4,269,000 | 737,512 | 76,873 | 12/31/31 | US SOFR — Annually | 1.355% — Annually | (644,082) |
| | 1,150,000 | 296,873 | (34) | 12/31/41 | 1.541% — Annually | US SOFR — Annually | 289,414 |
| | 1,640,000 | 335,429 | (31) | 12/31/34 | 1.4425% — Annually | US SOFR — Annually | 326,516 |
| | 8,319,000 | 411,957 E | (185) | 1/15/47 | 1.724% — Annually | US SOFR — Annually | 411,772 |
| | 30,239,000 | 7,925,642 | (1,031) | 1/21/52 | 1.679% — Annually | US SOFR — Annually | 7,731,890 |
| | 17,690,000 | 4,811,503 | (603) | 1/19/52 | US SOFR — Annually | 1.626% — Annually | (4,716,926) |
| | 18,631,000 | 4,969,074 | (635) | 2/1/52 | 1.6545% — Annually | US SOFR — Annually | 4,856,565 |
| | 85,411,000 | 9,768,456 | (20,776) | 2/15/29 | US SOFR — Annually | 1.681% — Annually | (9,317,010) |
| | 45,432,900 | 10,371,422 | (1,549) | 2/24/52 | US SOFR — Annually | 1.86% — Annually | (10,090,704) |
| | 5,610,000 | 1,383,594 | (192) | 2/29/52 | US SOFR — Annually | 1.762% — Annually | (1,358,903) |
| | 17,713,000 | 2,543,233 | (236) | 2/29/32 | 1.7515% — Annually | US SOFR — Annually | 2,443,973 |
| | 203,565,000 | 17,927,970 | (1,647) | 2/28/27 | 1.675% — Annually | US SOFR — Annually | 16,902,221 |
| | 253,153,000 | 9,678,039 | (959) | 2/29/24 | US SOFR — Annually | 1.47709% — Annually | (8,704,782) |
| |
72 Diversified Income Trust |
| | | | | | | |
| CENTRALLY CLEARED INTEREST RATE SWAP CONTRACTS OUTSTANDING at 9/30/22 cont. |
| Notional amount | Value | Upfront
premium
received
(paid) | Termination
date | Payments
made by fund | Payments
received by fund | Unrealized
appreciation/
(depreciation) |
| | $48,460,000 | $5,416,374 | $(555) | 3/1/29 | US SOFR — Annually | 1.7355% — Annually | $(5,127,387) |
| | 23,697,700 | 3,531,905 | (314) | 3/7/32 | 3 month USD-LIBOR-ICE — Quarterly | 1.9575% — Semiannually | (3,550,978) |
| | 58,205,800 | 9,317,584 | (772) | 3/9/32 | 1.5475% — Annually | US SOFR — Annually | 9,071,349 |
| | 60,350,200 | 9,689,828 | (800) | 3/9/32 | 1.5415% — Annually | US SOFR — Annually | 9,447,726 |
| | 31,816,000 | 4,617,456 | (422) | 3/11/32 | 1.737% — Annually | US SOFR — Annually | 4,479,401 |
| | 210,750,000 | 20,689,328 | 6,069,874 | 3/21/29 | US SOFR — Annually | 1.986% — Annually | (13,745,421) |
| | 19,536,000 | 523,565 | (74) | 4/7/24 | US SOFR — Annually | 2.4485% — Annually | (390,569) |
| | 14,892,000 | 852,865 | (120) | 4/7/27 | US SOFR — Annually | 2.465% — Annually | (750,336) |
| | 24,251,000 | 2,389,936 | (322) | 4/7/23 | 2.3305% — Annually | US SOFR — Annually | 2,247,493 |
| | 9,672,000 | 1,771,040 | (330) | 4/7/52 | US SOFR — Annually | 2.1005% — Annually | (1,724,215) |
| | 39,895,000 | 3,403,841 | (529) | 4/14/32 | 2.4975% — Annually | US SOFR — Annually | 3,082,393 |
| | 42,487,000 | 5,870,429 | (1,449) | 4/14/52 | US SOFR — Annually | 2.3395% — Annually | (5,569,342) |
| | 17,316,000 | 981,471 | (140) | 4/14/27 | 2.483% — Annually | US SOFR — Annually | 865,238 |
| | 13,199,000 | 366,272 | (50) | 4/14/24 | 2.405% — Annually | US SOFR — Annually | 271,147 |
| | 164,401,700 | 8,001,431 | (1,552) | 5/2/27 | US SOFR — Annually | 2.685% — Annually | (6,861,299) |
| | 354,122,500 | 9,419,659 | (1,335) | 5/25/24 | 2.5945% — Annually | US SOFR — Annually | 8,071,282 |
| | 10,251,000 | 1,101,983 | (350) | 5/25/52 | US SOFR — Annually | 2.501% — Annually | (1,059,793) |
| | 10,000,000 | 901,100 | (341) | 6/3/52 | US SOFR — Annually | 2.593% — Annually | (866,428) |
| | 24,055,000 | 1,565,981 | (319) | 6/7/32 | US SOFR — Annually | 2.7565% — Annually | (1,449,674) |
| | 14,864,000 | 1,257,494 | (507) | 6/7/52 | US SOFR — Annually | 2.622% — Annually | (1,204,329) |
| | 232,034,300 | 13,819,963 | (3,077) | 6/8/32 | US SOFR — Annually | 2.825% — Annually | (12,914,451) |
| | 18,018,000 | 3,536,933 | (2,261,505) | 6/22/52 | 2.3075% — Semiannually | 3 month USD-LIBOR-ICE — Quarterly | 1,177,496 |
| | 100,868,000 | 2,342,155 | (380) | 6/10/24 | US SOFR — Annually | 2.833% — Annually | (1,919,979) |
| |
Diversified Income Trust 73 |
| | | | | | | |
| CENTRALLY CLEARED INTEREST RATE SWAP CONTRACTS OUTSTANDING at 9/30/22 cont. |
| Notional amount | Value | Upfront
premium
received
(paid) | Termination
date | Payments
made by fund | Payments
received by fund | Unrealized
appreciation/
(depreciation) |
| | $84,136,000 | $3,728,066 | $(681) | 6/10/27 | 2.8025% — Annually | US SOFR — Annually | $3,384,786 |
| | 314,342,500 | 4,762,289 | (1,185) | 6/15/24 | US SOFR — Annually | 3.3385% — Annually | (3,159,674) |
| | 172,541,000 | 4,841,500 | (1,396) | 6/15/27 | 3.185% — Annually | US SOFR — Annually | 4,031,873 |
| | 17,035,800 | 680,410 | (241) | 9/8/32 | US SOFR — Annually | 3.07% — Annually | (672,093) |
| | 39,700,000 | 1,183,854 | (321) | 6/23/27 | 3.145% — Annually | US SOFR — Annually | 1,044,230 |
| | 18,700,000 | 716,023 | (248) | 6/23/32 | 3.088% — Annually | US SOFR — Annually | 651,386 |
| | 10,400,000 | 497,328 | (355) | 6/23/52 | 2.816% — Annually | US SOFR — Annually | 469,259 |
| | 40,472,100 | 2,300,434 E | (573) | 2/3/33 | 3.13% — Semiannually | 3 month USD-LIBOR-ICE — Quarterly | 2,299,861 |
| | 30,686,000 | 2,091,865 | (407) | 7/15/32 | US SOFR — Annually | 2.723% — Annually | (2,023,219) |
| | 58,398,500 | 4,755,390 E | (827) | 1/31/33 | 2.545% — Annually | US SOFR — Annually | 4,754,563 |
| | 58,398,500 | 4,730,862 E | (827) | 1/31/33 | 2.55% — Annually | US SOFR — Annually | 4,730,036 |
| | 55,003,200 | 4,703,324 E | (779) | 2/1/33 | 2.495% — Annually | US SOFR — Annually | 4,702,545 |
| | 59,328,000 | 5,493,773 | (787) | 8/2/32 | US SOFR — Annually | 2.4275% — Annually | (5,485,997) |
| | 53,780,700 | 4,986,009 E | (762) | 2/1/33 | 2.4075% — Annually | US SOFR — Annually | 4,985,247 |
| | 76,890,000 | 7,416,809 | (1,020) | 8/10/32 | US SOFR — Annually | 2.382% — Annually | (7,399,296) |
| | 5,701,900 | 181,606 E | (112) | 4/1/42 | US SOFR — Annually | 2.63% — Annually | (181,717) |
| | 10,773,800 | 778,192 E | (162) | 3/24/35 | US SOFR — Annually | 2.39% — Annually | (778,354) |
| | 15,903,800 | 1,656,540 | (469) | 8/10/42 | 2.645% — Annually | US SOFR — Annually | 1,650,437 |
| | 26,955,800 | 2,961,364 | (60,098) | 8/10/42 | US SOFR — Annually | 2.605% — Annually | (3,010,193) |
| | 11,050,200 | 1,235,302 | (326) | 8/10/42 | 2.5915% — Annually | US SOFR — Annually | 1,229,797 |
| | 69,370,000 | 3,413,698 E | (652) | 2/6/29 | 2.40% — Annually | US SOFR — Annually | 3,413,046 |
| | 90,803,000 | 7,039,957 | (1,199) | 8/16/32 | US SOFR — Annually | 2.613% — Annually | (7,000,713) |
| | 40,200,000 | 3,203,136 | (567) | 9/7/32 | US SOFR — Annually | 2.59% — Annually | (3,191,926) |
| | 12,332,600 | 108,280 E | (274) | 1/15/47 | 2.49% — Annually | US SOFR — Annually | 108,006 |
| |
74 Diversified Income Trust |
| | | | | | | |
| CENTRALLY CLEARED INTEREST RATE SWAP CONTRACTS OUTSTANDING at 9/30/22 cont. |
| Notional amount | Value | Upfront
premium
received
(paid) | Termination
date | Payments
made by fund | Payments
received by fund | Unrealized
appreciation/
(depreciation) |
| | $3,107,000 | $182,598 | $(41) | 8/25/32 | US SOFR — Annually | 2.8415% — Annually | $(180,780) |
| | 10,180,000 | 430,614 E | (153) | 2/21/35 | 2.785% — Annually | US SOFR — Annually | 430,461 |
| | 210,732,400 | 3,144,127 | (790) | 9/6/24 | US SOFR — Annually | 3.413% — Annually | (2,985,922) |
| | 61,381,700 | 855,661 E | (341) | 1/15/27 | US SOFR — Annually | 2.73% — Annually | (856,002) |
| | 81,485,200 | 3,437,861 | (1,076) | 9/13/32 | 3.043% — Annually | US SOFR — Annually | 3,398,949 |
| | 17,314,400 | 169,162 E | (338) | 1/15/41 | 3.0500% — Annually | US SOFR — Annually | 168,824 |
| | 6,278,200 | 69,500 E | (122) | 1/15/42 | 2.9825% — Annually | US SOFR — Annually | 69,377 |
| | 47,477,000 | 1,102,891 E | (294,536) | 12/21/32 | US SOFR — Annually | 3.265% — Annually | (1,397,427) |
| | 64,900,000 | 659,384 E | (897,814) | 12/21/29 | US SOFR — Annually | 3.50% — Annually | (1,557,198) |
| | 25,832,000 | 770,052 | (878) | 9/26/52 | 2.905% — Annually | US SOFR — Annually | 763,042 |
| | 134,325,000 | 2,129,051 | (1,263) | 9/26/27 | US SOFR — Annually | 3.465% — Annually | (2,087,984) |
| | 12,091,000 | 312,431 | (160) | 9/19/32 | 3.24% — Annually | US SOFR — Annually | 308,086 |
| | 201,111,000 | 162,900 E | (205,801) | 12/21/24 | 4.20% — Annually | US SOFR — Annually | (42,901) |
| | 685,578,000 | 555,318 E | 759,572 | 12/21/24 | US SOFR — Annually | 4.20% — Annually | 204,254 |
| | 669,086,000 | 347,925 E | 1,401,062 | 12/21/27 | 3.80% — Annually | US SOFR — Annually | 1,748,987 |
| | 9,222,000 | 4,795 E | (18,139) | 12/21/27 | US SOFR — Annually | 3.80% — Annually | (22,934) |
| | 294,866,000 | 3,559,033 E | (1,385,225) | 12/21/32 | 3.40% — Annually | US SOFR — Annually | 2,173,808 |
| | 2,337,000 | 28,208 E | 11,063 | 12/21/32 | US SOFR — Annually | 3.40% — Annually | (17,144) |
| | 697,000 | 6,608 E | 5,759 | 12/21/52 | 3.00% — Annually | US SOFR — Annually | 12,366 |
| | 71,919,000 | 681,792 E | (600,111) | 12/21/52 | US SOFR — Annually | 3.00% — Annually | (1,281,903) |
| | 1,370,000 | 20,523 E | (13,794) | 12/21/27 | 3.477% — Annually | US SOFR — Annually | 6,729 |
| | 47,128,000 | 875,167 | (622) | 9/23/32 | 3.3275% — Annually | US SOFR — Annually | 865,282 |
| | 11,571,784 | 188,273 | (393) | 9/28/52 | 2.976% — Annually | US SOFR — Annually | 185,010 |
| | 11,540,500 | 9,002 | (393) | 9/29/52 | 3.0575% — Annually | US SOFR — Annually | 6,649 |
| |
Diversified Income Trust 75 |
| | | | | | | |
| CENTRALLY CLEARED INTEREST RATE SWAP CONTRACTS OUTSTANDING at 9/30/22 cont. |
| Notional amount | Value | Upfront
premium
received
(paid) | Termination
date | Payments
made by fund | Payments
received by fund | Unrealized
appreciation/
(depreciation) |
| | $11,540,500 | $2,424 | $(393) | 9/29/52 | 3.0605% — Annually | US SOFR — Annually | $69 |
| | 2,864,750 | 19,137 | (38) | 9/29/32 | 3.6305% — Annually | US SOFR — Annually | (19,752) |
| | 4,019,250 | 12,299 | (32) | 9/29/27 | US SOFR — Annually | 3.884% — Annually | 13,134 |
| | 2,864,750 | 21,400 | (38) | 9/29/32 | 3.64% — Annually | US SOFR — Annually | (22,017) |
| | 4,019,250 | 14,590 | (32) | 9/29/27 | US SOFR — Annually | 3.8965% — Annually | 15,428 |
| | 2,367,000 | 5,089 | (9) | 9/29/24 | 4.321% — Annually | US SOFR — Annually | (5,667) |
| | 23,841,000 | 238,887 | (315) | 9/29/32 | 3.67061% — Annually | US SOFR — Annually | (244,063) |
| | 28,416,500 | 165,952 | (228) | 9/30/27 | US SOFR — Annually | 3.6865% — Annually | (163,271) |
| | 28,416,500 | 168,510 | (228) | 9/30/27 | US SOFR — Annually | 3.6845% — Annually | (165,831) |
| | 57,719,000 | 90,619 | (217) | 9/30/24 | 4.1255% — Annually | US SOFR — Annually | 88,566 |
| | 42,079,000 | 237,326 | (555) | 9/30/32 | 3.4825% — Annually | US SOFR — Annually | 236,183 |
| | 24,332,000 | 115,820 | (321) | 9/30/32 | 3.493% — Annually | US SOFR — Annually | 115,152 |
| | 4,710,000 | 23,173 | (160) | 10/3/52 | US SOFR — Annually | 3.0355% — Annually | (23,334) |
| | 3,156,000 | 3,093 | (12) | 10/3/24 | US SOFR — Annually | 4.16% — Annually | (3,104) |
| | 23,887,000 | 92,443 | (316) | 10/3/32 | US SOFR — Annually | 3.504% — Annually | (92,758) |
| | 54,458,000 | 194,960 | (438) | 10/4/27 | 3.7375% — Annually | US SOFR — Annually | 194,522 |
| | 13,657,700 | 58,728 E | (193) | 10/3/33 | 3.394% — Annually | US SOFR — Annually | 58,536 |
| | 65,218,000 | 83,479 | (245) | 10/4/24 | US SOFR — Annually | 4.145% — Annually | (83,724) |
| | 40,540,000 | 143,512 | (536) | 10/4/32 | US SOFR — Annually | 3.508% — Annually | (144,047) |
| | 76,340,000 | 229,783 | (615) | 10/4/27 | 3.75% — Annually | US SOFR — Annually | 229,169 |
| | 21,645,000 | 9,004 | (174) | 10/4/27 | 3.826% — Annually | US SOFR — Annually | (9,178) |
| AUD | 1,119,500 | 152,563 E | (11) | 1/30/35 | 1.692% — Semiannually | 6 month AUD-BBR-BBSW — Semiannually | 152,551 |
| AUD | 3,719,600 | 544,918 E | (37) | 3/5/35 | 1.47% — Semiannually | 6 month AUD-BBR-BBSW — Semiannually | 544,881 |
| |
76 Diversified Income Trust |
| | | | | | | |
| CENTRALLY CLEARED INTEREST RATE SWAP CONTRACTS OUTSTANDING at 9/30/22 cont. |
| Notional amount | Value | Upfront
premium
received
(paid) | Termination
date | Payments
made by fund | Payments
received by fund | Unrealized
appreciation/
(depreciation) |
| AUD | 1,399,700 | $209,325 E | $(12) | 3/25/35 | 1.4025% — Semiannually | 6 month AUD-BBR-BBSW — Semiannually | $209,313 |
| AUD | 2,018,200 | 236,772 E | (24) | 3/28/40 | 1.445% — Semiannually | 6 month AUD-BBR-BBSW — Semiannually | 236,748 |
| AUD | 7,680,600 | 982,383 E | (92) | 4/1/40 | 1.1685% — Semiannually | 6 month AUD-BBR-BBSW — Semiannually | 982,290 |
| AUD | 483,400 | 106,392 E | (11) | 7/2/45 | 1.441% — Semiannually | 6 month AUD-BBR-BBSW — Semiannually | 106,381 |
| AUD | 24,600,000 | 2,862,740 | (271) | 4/6/31 | 6 month AUD-BBR-BBSW — Semiannually | 1.87% — Semiannually | (2,776,555) |
| AUD | 12,285,000 | 170,128 E | (53,854) | 12/21/32 | 4.21% — Semiannually | 6 month AUD-BBR-BBSW — Semiannually | 116,274 |
| BRL | 5,230,000 | 24,364 | (4,890) | 1/4/27 | Brazil Cetip DI Interbank Deposit Rate — At maturity | 0.00% — At maturity | (15,922) |
| CAD | 22,781,000 | 23,913 E | 84,509 | 12/21/32 | 3.69% — Semiannually | 3 month CAD-BA-CDOR — Semiannually | 60,596 |
| CHF | 20,132,000 | 117,319 E | 55 | 12/21/32 | Swiss Average Rate Overnight — Annually | 2.01% — Annually | (117,264) |
| CLP | 3,117,280,000 | 61,894 E | 133,656 | 12/21/27 | 7.04% — Semiannually | CLICP (Chilean Pesos Indice Camara Promedio) — Semiannually | 195,550 |
| CNY | 5,790,000 | 5,683 E | — | 12/21/27 | China Fixing Repo Rates 7 day — Quarterly | 2.44% — Quarterly | (5,683) |
| COP | 3,382,660,000 | 7,286 E | 1,165 | 12/21/27 | 10.06% — Quarterly | Colombia IBR Overnight Rate — Quarterly | 8,451 |
| CZK | 35,980,000 | 21,691 E | 3,482 | 12/21/27 | 5.01% — Annually | 6 month CZK-PRIBOR — Semiannually | 25,173 |
| EUR | 7,235,600 | 672,818 E | (277) | 11/29/58 | 1.484% — Annually | 6 month EUR-EURIBOR — Semiannually | 672,540 |
| EUR | 9,840,300 | 2,140,772 | (381) | 2/19/50 | 6 month EUR-EURIBOR — Semiannually | 1.354% — Annually | (2,067,568) |
| |
Diversified Income Trust 77 |
| | | | | | | |
| CENTRALLY CLEARED INTEREST RATE SWAP CONTRACTS OUTSTANDING at 9/30/22 cont. |
| Notional amount | Value | Upfront
premium
received
(paid) | Termination
date | Payments
made by fund | Payments
received by fund | Unrealized
appreciation/
(depreciation) |
| EUR | 10,864,000 | $2,558,431 | $(415) | 3/11/50 | 1.267% — Annually | 6 month EUR-EURIBOR — Semiannually | $2,488,344 |
| EUR | 11,002,000 | 2,705,332 | (420) | 3/12/50 | 1.2115% — Annually | 6 month EUR-EURIBOR — Semiannually | 2,638,913 |
| EUR | 13,678,600 | 3,635,495 | (528) | 3/26/50 | 1.113% — Annually | 6 month EUR-EURIBOR — Semiannually | 3,559,973 |
| EUR | 13,443,000 | 1,580,977 E | (509) | 11/29/58 | 6 month EUR-EURIBOR — Semiannually | 1.343% — Annually | (1,581,487) |
| EUR | 14,233,000 | 3,904,479 | (541) | 2/19/50 | 1.051% — Annually | 6 month EUR-EURIBOR — Semiannually | 3,824,170 |
| EUR | 10,466,600 | 2,598,196 E | (401) | 6/7/54 | 1.054% — Annually | 6 month EUR-EURIBOR — Semiannually | 2,597,795 |
| EUR | 9,550,400 | 2,883,963 | (367) | 2/19/50 | 0.9035% — Annually | 6 month EUR-EURIBOR — Semiannually | 2,838,781 |
| EUR | 8,829,000 | 2,839,436 | (337) | 2/21/50 | 0.80% — Annually | 6 month EUR-EURIBOR — Semiannually | 2,803,475 |
| EUR | 22,091,800 | 7,804,128 E | (840) | 8/8/54 | 0.49% — Annually | 6 month EUR-EURIBOR — Semiannually | 7,803,288 |
| EUR | 12,792,500 | 5,264,659 E | (483) | 6/6/54 | 6 month EUR-EURIBOR — Semiannually | 0.207% — Annually | (5,265,141) |
| EUR | 20,383,200 | 8,716,171 | (766) | 2/19/50 | 0.233% — Annually | 6 month EUR-EURIBOR — Semiannually | 8,704,265 |
| EUR | 70,039,500 | 25,199,242 | (2,643) | 2/19/50 | 6 month EUR-EURIBOR — Semiannually | 0.595% — Annually | (25,006,833) |
| EUR | 8,796,100 | 3,797,382 E | (329) | 3/4/54 | 0.134% — Annually | 6 month EUR-EURIBOR — Semiannually | 3,797,054 |
| EUR | 4,363,500 | 2,186,805 E | (168) | 3/13/54 | — | 0.2275% plus 6 month EUR-EURIBOR — Semiannually | 2,186,636 |
| EUR | 23,312,400 | 4,202,079 E | (494) | 5/13/40 | 6 month EUR-EURIBOR — Semiannually | 0.276% — Annually | (4,202,573) |
| EUR | 10,527,400 | 1,853,930 E | (230) | 6/24/40 | 0.315% — Annually | 6 month EUR-EURIBOR — Semiannually | 1,853,700 |
| |
78 Diversified Income Trust |
| | | | | | | |
| CENTRALLY CLEARED INTEREST RATE SWAP CONTRACTS OUTSTANDING at 9/30/22 cont. |
| Notional amount | Value | Upfront
premium
received
(paid) | Termination
date | Payments
made by fund | Payments
received by fund | Unrealized
appreciation/
(depreciation) |
| EUR | 15,952,000 | $2,898,811 E | $(369) | 1/16/40 | 0.315% — Annually | 6 month EUR-EURIBOR — Semiannually | $2,898,442 |
| EUR | 5,045,400 | 903,603 E | (117) | 3/28/40 | 0.3175% — Annually | 6 month EUR-EURIBOR — Semiannually | 903,486 |
| EUR | 17,295,900 | 6,554,384 | (705) | 5/21/51 | 6 month EUR-EURIBOR — Semiannually | 0.516% — Annually | (6,516,982) |
| EUR | 16,158,000 | 3,491,444 | (277) | 6/14/31 | 0.171% — Annually | 6 month EUR-EURIBOR — Semiannually | 3,486,984 |
| EUR | 15,809,000 | 3,554,854 | (271) | 7/15/31 | 0.0675% — Annually | 6 month EUR-EURIBOR — Semiannually | 3,564,804 |
| EUR | 3,168,200 | 1,303,042 | (127) | 9/14/52 | 6 month EUR-EURIBOR — Semiannually | 0.374% — Annually | (1,304,821) |
| EUR | 43,853,000 | 8,734,446 | (706) | 3/7/32 | 6 month EUR-EURIBOR — Semiannually | 0.60% — Annually | (8,621,921) |
| EUR | 83,000,000 | 4,314,494 | (836) | 7/7/27 | 6 month EUR-EURIBOR — Semiannually | 1.725% — Annually | (4,026,217) |
| EUR | 21,514,400 | 552,854 E | (341) | 2/2/36 | 2.875% — Annually | 6 month EUR-EURIBOR — Semiannually | 552,513 |
| EUR | 23,850,000 | 954,368 | (355) | 9/8/32 | 2.615% — Annually | 6 month EUR-EURIBOR — Semiannually | 934,728 |
| EUR | 189,696,100 | 5,084,684 E | (717) | 6/28/25 | 1.718% — Annually | 6 month EUR-EURIBOR — Semiannually | 5,083,967 |
| EUR | 18,770,000 | 2,942,182 | (647) | 8/29/52 | 6 month EUR-EURIBOR — Semiannually | 1.636% — Annually | (2,932,552) |
| EUR | 56,885,000 | 3,484,942 E | (647) | 9/12/29 | 1.71% — Annually | 6 month EUR-EURIBOR — Semiannually | 3,484,294 |
| EUR | 99,896,000 | 7,071,539 | (958) | 9/2/27 | 6 month EUR-EURIBOR — Semiannually | 1.372% — Annually | (7,059,017) |
| EUR | 6,656,000 | 432,554 E | (228) | 6/6/54 | 2.005% — Annually | 6 month EUR-EURIBOR — Semiannually | 432,327 |
| EUR | 9,833,000 | 525,015 E | (333) | 6/7/54 | 2.065% — Annually | 6 month EUR-EURIBOR — Semiannually | 524,682 |
| EUR | 21,483,000 | 977,346 E | (18,131) | 12/21/32 | 2.624% — Annually | 6 month EUR-EURIBOR — Semiannually | 959,214 |
| |
Diversified Income Trust 79 |
| | | | | | | |
| CENTRALLY CLEARED INTEREST RATE SWAP CONTRACTS OUTSTANDING at 9/30/22 cont. |
| Notional amount | Value | Upfront
premium
received
(paid) | Termination
date | Payments
made by fund | Payments
received by fund | Unrealized
appreciation/
(depreciation) |
| EUR | 1,690,000 | $42,533 E | $(4,755) | 12/21/27 | 2.54% — Annually | 6 month EUR-EURIBOR — Semiannually | $37,778 |
| EUR | 2,290,000 | 37,233 E | (30,924) | 12/21/24 | 2.201% — Annually | 6 month EUR-EURIBOR — Semiannually | 6,310 |
| EUR | 690,000 | 50,109 E | (27,215) | 12/21/32 | 2.301% — Annually | 6 month EUR-EURIBOR — Semiannually | 22,894 |
| EUR | 250,000 | 4,290 E | 7,059 | 12/21/52 | 2.351% — Annually | 6 month EUR-EURIBOR — Semiannually | 11,349 |
| EUR | 870,000 | 33,219 E | (20,170) | 12/21/27 | 2.251% — Annually | 6 month EUR-EURIBOR — Semiannually | 13,049 |
| GBP | 9,933,800 | 2,910,321 | (197) | 5/19/31 | Sterling Overnight Index Average — Annually | 0.754% — Annually | (2,890,250) |
| GBP | 420,542,200 | 17,969,923 | 348,352 | 9/15/23 | Sterling Overnight Index Average — Annually | 0.84% — Annually | (17,821,739) |
| GBP | 420,542,200 | 18,655,476 | 523,113 | 9/15/23 | Sterling Overnight Index Average — Annually | 0.68% — Annually | (18,365,449) |
| GBP | 420,542,200 | 19,341,028 | (816,718) | 9/15/23 | 0.52% — Annually | Sterling Overnight Index Average — Annually | 18,790,315 |
| GBP | 168,216,700 | 6,802,926 | (866) | 9/15/23 | 1.065% — Annually | Sterling Overnight Index Average — Annually | 6,739,755 |
| GBP | 4,333,000 | 423,036 E | (16,880) | 12/21/32 | Sterling Overnight Index Average — Annually | 3.34% — Annually | (439,916) |
| GBP | 57,666,000 | 4,656,466 | (869) | 9/21/32 | 3.522% — Annually | Sterling Overnight Index Average — Annually | 4,624,709 |
| GBP | 10,599,000 | 71,361 E | (225) | 1/14/40 | 3.306% — Annually | Sterling Overnight Index Average — Annually | 71,136 |
| GBP | 5,459,000 | 47,360 E | (116) | 8/20/39 | 3.299% — Annually | Sterling Overnight Index Average — Annually | 47,244 |
| |
80 Diversified Income Trust |
| | | | | | | |
| CENTRALLY CLEARED INTEREST RATE SWAP CONTRACTS OUTSTANDING at 9/30/22 cont. |
| Notional amount | Value | Upfront
premium
received
(paid) | Termination
date | Payments
made by fund | Payments
received by fund | Unrealized
appreciation/
(depreciation) |
| HUF | 1,331,200,000 | $3,516 E | $2,303 | 12/21/27 | 10.69% — Annually | 6 month HUF-BUBOR-National Bank of Hungary — Semiannually | $5,818 |
| ILS | 2,210,000 | 8,081 E | (632) | 12/21/27 | Israeili Shekel 3 month TELIBOR — Quarterly | 3.35% — Annually | (8,713) |
| INR | 50,150,000 | 9,235 E | — | 12/21/27 | 6.60% — Semiannually | INR-FBIL-MIBOR-OIS-Compound — Semiannually | 9,235 |
| JPY | 1,805,778,500 | 1,575,830 E | (513) | 8/29/43 | Bank of Japan Unsecured Overnight Call Rate Expected Index — Annually | 0.343% — Annually | (1,576,343) |
| JPY | 1,690,202,100 | 436,068 | (375,736) | 2/25/31 | 0.003% — Annually | Tokyo Overnight Average Rate — Annually | 59,185 |
| JPY | 732,682,200 | 234,288 E | (119,551) | 8/29/43 | 0.7495% — Annually | Tokyo Overnight Average Rate — Annually | 114,737 |
| JPY | 929,267,100 | 957,775 E | (896,466) | 8/29/43 | 0.194% — Annually | Tokyo Overnight Average Rate — Annually | 61,309 |
| KRW | 1,196,910,000 | 14,607 E | — | 12/21/27 | 3.7485% — Quarterly | 3 month KRW-CD-KSDA-BLOOMBERG — Quarterly | 14,607 |
| MXN | 44,700,000 | 16,979 E | (8,115) | 12/21/27 | Mexico Interbank TIIE 28 Day — 28 Days | 9.06% — 28 Days | (25,094) |
| NOK | 133,815,000 | 45,717 E | 13,605 | 12/21/32 | 3.48% — Annually | 6 month NOK-NIBOR-NIBR — Semiannually | 59,323 |
| NZD | 34,615,000 | 429,871 E | (46,123) | 12/21/32 | 3 month NZD-BBR-FRA — Quarterly | 4.175% — Semiannually | (475,994) |
| PLN | 8,230,000 | 54,724 E | (1,224) | 12/21/27 | 6.20% — Annually | 6 month WIBOR — Semiannually | 53,500 |
| SEK | 223,337,000 | 434,895 E | (49,723) | 12/21/32 | 2.925% — Annually | 3 month SEK-STIBOR-SIDE — Quarterly | 385,171 |
| SGD | 4,850,000 | 30,122 E | (32) | 12/21/27 | 3.305% — Semiannually | Compounded Singapore Overnight Rate Average — Semiannually | 30,089 |
| |
Diversified Income Trust 81 |
| | | | | | | |
| CENTRALLY CLEARED INTEREST RATE SWAP CONTRACTS OUTSTANDING at 9/30/22 cont. |
| Notional amount | Value | Upfront
premium
received
(paid) | Termination
date | Payments
made by fund | Payments
received by fund | Unrealized
appreciation/
(depreciation) |
| THB | 153,250,000 | $50,176 E | $— | 12/21/27 | Thailand Overnight Repo Rate ON — Quarterly | 2.725% — Quarterly | $(50,176) |
| ZAR | 41,420,000 | 34,532 E | (769) | 12/21/27 | 3 month ZAR-JIBAR-SAFEX — Quarterly | 8.58% — Quarterly | (35,301) |
| Total | $3,455,069 | $34,043,312 |
| E Extended effective date. |
|
| | | | | | | |
| OTC TOTAL RETURN SWAP CONTRACTS OUTSTANDING at 9/30/22 |
Swap counterparty/
Notional amount | Value | Upfront
premium
received
(paid) | Termination
date | Payments
received (paid)
by fund | Total return
received by
or paid by fund | Unrealized
appreciation/
(depreciation) |
| Morgan Stanley & Co. International PLC |
| | $13,562,248 | $11,888,200 | $— | 9/29/25 | (0.165%) — Annually | Ephesus Funding DAC, 3.80%, Series 2020−01, 9/22/25 — Annually | $(1,658,774) |
| | 13,597,326 | 13,049,953 | — | 7/17/24 | 3.825% (Secured Overnight Financing Rate minus 0.12%) — Quarterly | Pera Funding DAC, 3.825%, Series 2019−01, 7/10/24 — Quarterly | (541,523) |
| Upfront premium received | — | | Unrealized appreciation | — |
| Upfront premium (paid) | — | | Unrealized (depreciation) | (2,200,297) |
| Total | $— | | Total | $(2,200,297) |
|
| | | | | | | | |
| OTC CREDIT DEFAULT CONTRACTS OUTSTANDING — PROTECTION SOLD at 9/30/22 |
Swap counterparty/
Referenced debt* | Rating*** | Upfront
premium
received
(paid)** | | Notional
amount | Value | Termi-
nation
date | Payments
received
by fund | Unrealized
appreciation/
(depreciation) |
| Bank of America N.A. |
| CMBX NA BBB−.6 Index | B+/P | $39,713 | | $417,179 | $93,740 | 5/11/63 | 300 bp — Monthly | $(53,814) |
| CMBX NA BBB−.6 Index | B+/P | 79,608 | | 948,526 | 213,134 | 5/11/63 | 300 bp — Monthly | (133,042) |
| CMBX NA BBB−.6 Index | B+/P | 163,473 | | 1,901,361 | 427,236 | 5/11/63 | 300 bp — Monthly | (262,792) |
| CMBX NA BBB−.6 Index | B+/P | 155,838 | | 1,963,112 | 441,111 | 5/11/63 | 300 bp — Monthly | (284,271) |
| Citigroup Global Markets, Inc. |
| CMBX NA A.6 Index | A-/P | 1,843 | | 6,915 | 705 | 5/11/63 | 200 bp — Monthly | 1,139 |
| CMBX NA A.6 Index | A-/P | 2,723 | | 11,316 | 1,154 | 5/11/63 | 200 bp — Monthly | 1,572 |
| |
82 Diversified Income Trust |
| | | | | | | | |
| OTC CREDIT DEFAULT CONTRACTS OUTSTANDING — PROTECTION SOLD at 9/30/22 cont. |
Swap counterparty/
Referenced debt* | Rating*** | Upfront
premium
received
(paid)** | | Notional
amount | Value | Termi-
nation
date | Payments
received
by fund | Unrealized
appreciation/
(depreciation) |
| Citigroup Global Markets, Inc. cont. |
| CMBX NA A.6 Index | A-/P | $6,851 | | $33,947 | $3,463 | 5/11/63 | 200 bp — Monthly | $3,400 |
| CMBX NA A.6 Index | A-/P | 9,975 | | 37,719 | 3,847 | 5/11/63 | 200 bp — Monthly | 6,140 |
| CMBX NA A.6 Index | A-/P | 13,865 | | 74,180 | 7,566 | 5/11/63 | 200 bp — Monthly | 6,323 |
| CMBX NA A.6 Index | A-/P | 21,048 | | 74,809 | 7,631 | 5/11/63 | 200 bp — Monthly | 13,443 |
| CMBX NA A.6 Index | A-/P | 33,180 | | 148,989 | 15,197 | 5/11/63 | 200 bp — Monthly | 18,033 |
| CMBX NA BB.11 Index | BB−/P | 877,445 | | 1,553,000 | 345,387 | 11/18/54 | 500 bp — Monthly | 533,352 |
| CMBX NA BB.13 Index | BB−/P | 12,597 | | 126,000 | 34,247 | 12/16/72 | 500 bp — Monthly | (21,545) |
| CMBX NA BB.13 Index | BB−/P | 12,757 | | 140,000 | 38,052 | 12/16/72 | 500 bp — Monthly | (25,179) |
| CMBX NA BB.13 Index | BB−/P | 20,857 | | 221,000 | 60,068 | 12/16/72 | 500 bp — Monthly | (39,027) |
| CMBX NA BB.13 Index | BB−/P | 50,236 | | 551,000 | 149,762 | 12/16/72 | 500 bp — Monthly | (99,066) |
| CMBX NA BB.14 Index | BB/P | 90,124 | | 822,000 | 201,801 | 12/16/72 | 500 bp — Monthly | (110,991) |
| CMBX NA BB.6 Index | CCC+/P | 84,138 | | 159,553 | 64,013 | 5/11/63 | 500 bp — Monthly | 20,260 |
| CMBX NA BB.6 Index | CCC+/P | 2,294,788 | | 12,154,132 | 4,876,238 | 5/11/63 | 500 bp — Monthly | (2,571,162) |
| CMBX NA BB.7 Index | B-/P | 596,583 | | 11,690,000 | 3,897,446 | 1/17/47 | 500 bp — Monthly | (3,291,122) |
| CMBX NA BB.9 Index | B/P | 60,061 | | 295,000 | 96,259 | 9/17/58 | 500 bp — Monthly | (35,951) |
| CMBX NA BB.9 Index | B/P | 381,487 | | 1,868,000 | 609,528 | 9/17/58 | 500 bp — Monthly | (226,484) |
| CMBX NA BBB−.10 Index | BB+/P | 48,888 | | 394,000 | 73,284 | 11/17/59 | 300 bp — Monthly | (24,198) |
| CMBX NA BBB−.10 Index | BB+/P | 94,147 | | 863,000 | 160,518 | 11/17/59 | 300 bp — Monthly | (65,939) |
| CMBX NA BBB−.11 Index | BBB−/P | 197,118 | | 3,147,000 | 514,220 | 11/18/54 | 300 bp — Monthly | (315,529) |
| CMBX NA BBB−.12 Index | BBB−/P | 69,907 | | 441,000 | 80,703 | 8/17/61 | 300 bp — Monthly | (10,575) |
| CMBX NA BBB−.12 Index | BBB−/P | 28,903 | | 693,000 | 126,819 | 8/17/61 | 300 bp — Monthly | (97,570) |
| CMBX NA BBB−.12 Index | BBB−/P | 122,459 | | 2,078,000 | 380,274 | 8/17/61 | 300 bp — Monthly | (256,776) |
| CMBX NA BBB−.13 Index | BBB−/P | 52,918 | | 1,130,000 | 224,531 | 12/16/72 | 300 bp — Monthly | (171,049) |
| |
Diversified Income Trust 83 |
| | | | | | | | |
| OTC CREDIT DEFAULT CONTRACTS OUTSTANDING — PROTECTION SOLD at 9/30/22 cont. |
Swap counterparty/
Referenced debt* | Rating*** | Upfront
premium
received
(paid)** | | Notional
amount | Value | Termi-
nation
date | Payments
received
by fund | Unrealized
appreciation/
(depreciation) |
| Citigroup Global Markets, Inc. cont. |
| CMBX NA BBB−.15 Index | BBB−/P | $26,114 | | $250,000 | $52,850 | 11/18/64 | 300 bp — Monthly | $(26,611) |
| CMBX NA BBB−.15 Index | BBB−/P | 10,025 | | 59,000 | 12,473 | 11/18/64 | 300 bp — Monthly | (2,418) |
| Credit Suisse International |
| CMBX NA BB.7 Index | B-/P | 369,046 | | 2,759,000 | 919,851 | 1/17/47 | 500 bp — Monthly | (548,506) |
| CMBX NA BBB−.7 Index | BB−/P | 1,788,740 | | 24,200,000 | 4,905,340 | 1/17/47 | 300 bp — Monthly | (3,104,500) |
| Deutsche Bank AG |
| CMBX NA BBB−.6 Index | B+/P | 54,693 | | 368,353 | 82,769 | 5/11/63 | 300 bp — Monthly | (27,888) |
| Goldman Sachs International |
| CMBX NA BB.6 Index | CCC+/P | 126,578 | | 281,877 | 113,089 | 5/11/63 | 500 bp — Monthly | 13,727 |
| CMBX NA BB.6 Index | CCC+/P | 664,734 | | 1,227,038 | 492,288 | 5/11/63 | 500 bp — Monthly | 173,485 |
| CMBX NA BB.6 Index | CCC+/P | 657,801 | | 1,517,272 | 608,730 | 5/11/63 | 500 bp — Monthly | 50,355 |
| CMBX NA BB.9 Index | B/P | 1,088,578 | | 2,692,000 | 878,400 | 9/17/58 | 500 bp — Monthly | 212,421 |
| CMBX NA BBB−.13 Index | BBB−/P | 3,957 | | 86,000 | 17,088 | 12/16/72 | 300 bp — Monthly | (13,089) |
| CMBX NA BBB−.14 Index | BBB−/P | 490 | | 17,000 | 3,471 | 12/16/72 | 300 bp — Monthly | (2,973) |
| CMBX NA BBB−.14 Index | BBB−/P | 2,384 | | 43,000 | 8,781 | 12/16/72 | 300 bp — Monthly | (6,376) |
| CMBX NA BBB−.14 Index | BBB−/P | 1,887 | | 65,500 | 13,375 | 12/16/72 | 300 bp — Monthly | (11,456) |
| CMBX NA BBB−.14 Index | BBB−/P | 3,221 | | 66,000 | 13,477 | 12/16/72 | 300 bp — Monthly | (10,223) |
| CMBX NA BBB−.14 Index | BBB−/P | 2,690 | | 71,000 | 14,498 | 12/16/72 | 300 bp — Monthly | (11,772) |
| CMBX NA BBB−.14 Index | BBB−/P | 176,076 | | 1,028,500 | 210,020 | 12/16/72 | 300 bp — Monthly | (33,428) |
| CMBX NA BBB−.14 Index | BBB−/P | 430,255 | | 2,832,000 | 578,294 | 12/16/72 | 300 bp — Monthly | (146,623) |
| CMBX NA BBB−.15 Index | BBB−/P | 41,595 | | 450,000 | 95,130 | 11/18/64 | 300 bp — Monthly | (53,311) |
| CMBX NA BBB−.15 Index | BBB−/P | 40,067 | | 450,000 | 95,130 | 11/18/64 | 300 bp — Monthly | (54,837) |
| CMBX NA BBB−.15 Index | BBB−/P | 28,578 | | 460,000 | 97,244 | 11/18/64 | 300 bp — Monthly | (68,437) |
| CMBX NA BBB−.6 Index | B+/P | 2,885 | | 27,285 | 6,131 | 5/11/63 | 300 bp — Monthly | (3,232) |
| CMBX NA BBB−.6 Index | B+/P | 8,069 | | 68,932 | 15,489 | 5/11/63 | 300 bp — Monthly | (7,384) |
| |
84 Diversified Income Trust |
| | | | | | | | |
| OTC CREDIT DEFAULT CONTRACTS OUTSTANDING — PROTECTION SOLD at 9/30/22 cont. |
Swap counterparty/
Referenced debt* | Rating*** | Upfront
premium
received
(paid)** | | Notional
amount | Value | Termi-
nation
date | Payments
received
by fund | Unrealized
appreciation/
(depreciation) |
| Goldman Sachs International cont. |
| CMBX NA BBB−.6 Index | B+/P | $12,522 | | $85,446 | $19,200 | 5/11/63 | 300 bp — Monthly | $(6,634) |
| CMBX NA BBB−.6 Index | B+/P | 12,549 | | 89,755 | 20,168 | 5/11/63 | 300 bp — Monthly | (7,573) |
| CMBX NA BBB−.6 Index | B+/P | 6,424 | | 93,345 | 20,975 | 5/11/63 | 300 bp — Monthly | (14,503) |
| CMBX NA BBB−.6 Index | B+/P | 16,851 | | 104,115 | 23,395 | 5/11/63 | 300 bp — Monthly | (6,490) |
| CMBX NA BBB−.6 Index | B+/P | 8,498 | | 117,758 | 26,460 | 5/11/63 | 300 bp — Monthly | (17,903) |
| CMBX NA BBB−.6 Index | B+/P | 12,090 | | 118,476 | 26,622 | 5/11/63 | 300 bp — Monthly | (14,471) |
| CMBX NA BBB−.6 Index | B+/P | 12,163 | | 118,476 | 26,622 | 5/11/63 | 300 bp — Monthly | (14,398) |
| CMBX NA BBB−.6 Index | B+/P | 29,106 | | 193,152 | 43,401 | 5/11/63 | 300 bp — Monthly | (14,196) |
| CMBX NA BBB−.6 Index | B+/P | 43,555 | | 207,513 | 46,628 | 5/11/63 | 300 bp — Monthly | (2,967) |
| CMBX NA BBB−.6 Index | B+/P | 24,526 | | 258,493 | 58,083 | 5/11/63 | 300 bp — Monthly | (33,426) |
| CMBX NA BBB−.6 Index | B+/P | 29,842 | | 337,477 | 75,831 | 5/11/63 | 300 bp — Monthly | (45,817) |
| CMBX NA BBB−.6 Index | B+/P | 148,373 | | 389,176 | 87,448 | 5/11/63 | 300 bp — Monthly | 61,123 |
| CMBX NA BBB−.6 Index | B+/P | 78,601 | | 511,960 | 115,037 | 5/11/63 | 300 bp — Monthly | (36,175) |
| CMBX NA BBB−.6 Index | B+/P | 124,294 | | 655,567 | 147,306 | 5/11/63 | 300 bp — Monthly | (22,678) |
| CMBX NA BBB−.6 Index | B+/P | 96,615 | | 664,184 | 149,242 | 5/11/63 | 300 bp — Monthly | (52,288) |
| CMBX NA BBB−.6 Index | B+/P | 98,727 | | 706,548 | 158,761 | 5/11/63 | 300 bp — Monthly | (59,674) |
| CMBX NA BBB−.6 Index | B+/P | 289,000 | | 781,224 | 175,541 | 5/11/63 | 300 bp — Monthly | 113,858 |
| CMBX NA BBB−.6 Index | B+/P | 207,104 | | 968,631 | 217,651 | 5/11/63 | 300 bp — Monthly | (10,053) |
| CMBX NA BBB−.6 Index | B+/P | 157,809 | | 1,012,432 | 227,493 | 5/11/63 | 300 bp — Monthly | (69,167) |
| CMBX NA BBB−.6 Index | B+/P | 74,547 | | 1,059,822 | 238,142 | 5/11/63 | 300 bp — Monthly | (163,054) |
| CMBX NA BBB−.6 Index | B+/P | 183,902 | | 1,181,170 | 265,409 | 5/11/63 | 300 bp — Monthly | (80,904) |
| CMBX NA BBB−.6 Index | B+/P | 243,062 | | 1,186,915 | 266,700 | 5/11/63 | 300 bp — Monthly | (23,031) |
| CMBX NA BBB−.6 Index | B+/P | 222,998 | | 1,474,129 | 331,237 | 5/11/63 | 300 bp — Monthly | (107,486) |
| |
Diversified Income Trust 85 |
| | | | | | | | |
| OTC CREDIT DEFAULT CONTRACTS OUTSTANDING — PROTECTION SOLD at 9/30/22 cont. |
Swap counterparty/
Referenced debt* | Rating*** | Upfront
premium
received
(paid)** | | Notional
amount | Value | Termi-
nation
date | Payments
received
by fund | Unrealized
appreciation/
(depreciation) |
| Goldman Sachs International cont. |
| CMBX NA BBB−.6 Index | B+/P | $251,962 | | $1,621,327 | $364,312 | 5/11/63 | 300 bp — Monthly | $(111,522) |
| CMBX NA BBB−.6 Index | B+/P | 251,962 | | 1,621,327 | 364,312 | 5/11/63 | 300 bp — Monthly | (111,522) |
| CMBX NA BBB−.6 Index | B+/P | 350,890 | | 1,626,353 | 365,442 | 5/11/63 | 300 bp — Monthly | (13,721) |
| CMBX NA BBB−.7 Index | BB−/P | 77,611 | | 1,050,000 | 212,835 | 1/17/47 | 300 bp — Monthly | (134,699) |
| CMBX NA BBB−.7 Index | BB−/P | 398,239 | | 3,442,000 | 697,693 | 1/17/47 | 300 bp — Monthly | (297,733) |
| JPMorgan Securities LLC |
| CMBX NA BB.10 Index | B+/P | 47,420 | | 591,000 | 196,685 | 5/11/63 | 500 bp — Monthly | (148,772) |
| CMBX NA BBB−.12 Index | BBB−/P | 101,523 | | 845,000 | 154,635 | 8/17/61 | 300 bp — Monthly | (52,689) |
| CMBX NA BBB−.13 Index | BBB−/P | 96,491 | | 730,000 | 145,051 | 12/16/72 | 300 bp — Monthly | (48,195) |
| CMBX NA BBB−.8 Index | BB/P | 133,327 | | 855,000 | 147,915 | 10/17/57 | 300 bp — Monthly | (14,161) |
| Merrill Lynch International |
| CMBX NA BB.6 Index | CCC+/P | 1,226 | | 4,559 | 1,829 | 5/11/63 | 500 bp — Monthly | (599) |
| CMBX NA BB.6 Index | CCC+/P | 75,365 | | 512,089 | 205,450 | 5/11/63 | 500 bp — Monthly | (129,651) |
| CMBX NA BBB−.6 Index | B+/P | 1,670,577 | | 4,451,827 | 1,000,326 | 5/11/63 | 300 bp — Monthly | 672,525 |
| Morgan Stanley & Co. International PLC |
| CMBX NA BB.13 Index | BB−/P | 18,044 | | 194,000 | 52,729 | 12/16/72 | 500 bp — Monthly | (34,523) |
| CMBX NA BB.13 Index | BB−/P | 18,179 | | 198,000 | 53,816 | 12/16/72 | 500 bp — Monthly | (35,472) |
| CMBX NA BB.13 Index | BB−/P | 21,553 | | 235,000 | 63,873 | 12/16/72 | 500 bp — Monthly | (42,124) |
| CMBX NA BB.13 Index | BB−/P | 37,958 | | 396,000 | 107,633 | 12/16/72 | 500 bp — Monthly | (69,345) |
| CMBX NA BB.13 Index | BB−/P | 55,679 | | 579,000 | 157,372 | 12/16/72 | 500 bp — Monthly | (101,211) |
| CMBX NA BB.13 Index | BB−/P | 194,713 | | 2,108,000 | 572,954 | 12/16/72 | 500 bp — Monthly | (376,485) |
| CMBX NA BB.13 Index | BB−/P | 278,363 | | 2,973,000 | 808,061 | 12/16/72 | 500 bp — Monthly | (527,221) |
| CMBX NA BB.6 Index | CCC+/P | 5,423 | | 22,793 | 9,145 | 5/11/63 | 500 bp — Monthly | (3,703) |
| CMBX NA BB.6 Index | CCC+/P | 16,168 | | 101,050 | 40,541 | 5/11/63 | 500 bp — Monthly | (24,288) |
| CMBX NA BB.6 Index | CCC+/P | 75,114 | | 134,480 | 53,954 | 5/11/63 | 500 bp — Monthly | 21,275 |
| |
86 Diversified Income Trust |
| | | | | | | | |
| OTC CREDIT DEFAULT CONTRACTS OUTSTANDING — PROTECTION SOLD at 9/30/22 cont. |
Swap counterparty/
Referenced debt* | Rating*** | Upfront
premium
received
(paid)** | | Notional
amount | Value | Termi-
nation
date | Payments
received
by fund | Unrealized
appreciation/
(depreciation) |
| Morgan Stanley & Co. International PLC cont. |
| CMBX NA BB.6 Index | CCC+/P | $103,320 | | $186,905 | $74,986 | 5/11/63 | 500 bp — Monthly | $28,492 |
| CMBX NA BB.6 Index | CCC+/P | 631,813 | | 1,417,742 | 568,798 | 5/11/63 | 500 bp — Monthly | 64,215 |
| CMBX NA BB.8 Index | B-/P | 12,950 | | 35,754 | 13,415 | 10/17/57 | 500 bp — Monthly | (435) |
| CMBX NA BBB−.12 Index | BBB−/P | 50,445 | | 856,000 | 156,648 | 8/17/61 | 300 bp — Monthly | (105,775) |
| CMBX NA BBB−.12 Index | BBB−/P | 126,273 | | 2,941,000 | 538,203 | 8/17/61 | 300 bp — Monthly | (410,459) |
| CMBX NA BBB−.13 Index | BBB−/P | 643 | | 7,000 | 1,391 | 12/16/72 | 300 bp — Monthly | (744) |
| CMBX NA BBB−.13 Index | BBB−/P | 2,834 | | 51,000 | 10,134 | 12/16/72 | 300 bp — Monthly | (7,274) |
| CMBX NA BBB−.13 Index | BBB−/P | 10,328 | | 113,000 | 22,453 | 12/16/72 | 300 bp — Monthly | (12,068) |
| CMBX NA BBB−.14 Index | BBB−/P | 191,879 | | 1,191,000 | 243,202 | 12/16/72 | 300 bp — Monthly | (50,727) |
| CMBX NA BBB−.14 Index | BBB−/P | 254,871 | | 1,549,000 | 316,306 | 12/16/72 | 300 bp — Monthly | (60,661) |
| CMBX NA BBB−.14 Index | BBB−/P | 514,334 | | 3,098,000 | 632,612 | 12/16/72 | 300 bp — Monthly | (116,729) |
| CMBX NA BBB−.15 Index | BBB−/P | 6,701 | | 73,000 | 15,432 | 11/18/64 | 300 bp — Monthly | (8,695) |
| CMBX NA BBB−.15 Index | BBB−/P | 92,486 | | 1,561,000 | 329,995 | 11/18/64 | 300 bp — Monthly | (236,729) |
| CMBX NA BBB−.15 Index | BBB−/P | 249,896 | | 1,585,000 | 335,069 | 11/18/64 | 300 bp — Monthly | (83,037) |
| CMBX NA BBB−.9 Index | BB+/P | 22,233 | | 229,000 | 44,678 | 9/17/58 | 300 bp — Monthly | (22,333) |
| Upfront premium received | 19,733,944 | | | Unrealized appreciation | 2,015,138 |
| Upfront premium (paid) | — | | | Unrealized (depreciation) | (16,425,336) |
| Total | $19,733,944 | | | Total | $(14,410,198) |
| * Payments related to the referenced debt are made upon a credit default event. |
| ** Upfront premium is based on the difference between the original spread on issue and the market spread on day of execution. |
| *** Ratings for an underlying index represent the average of the ratings of all the securities included in that index. The Moody’s, Standard & Poor’s or Fitch ratings are believed to be the most recent ratings available at September 30, 2022. Securities rated by Putnam are indicated by “/P.” The Putnam rating categories are comparable to the Standard & Poor’s classifications. |
|
| |
Diversified Income Trust 87 |
| | | | | | | | |
| OTC CREDIT DEFAULT CONTRACTS OUTSTANDING — PROTECTION PURCHASED at 9/30/22 |
Swap counterparty/
Referenced debt* | | Upfront
premium
received
(paid)** | | Notional
amount | Value | Termi-
nation
date | Payments
(paid)
by fund | Unrealized
appreciation/
(depreciation) |
| Citigroup Global Markets, Inc. |
| CMBX NA A.6 Index | | $(308,747) | | $2,410,860 | $245,908 | 5/11/63 | (200 bp) — Monthly | $(63,644) |
| CMBX NA A.6 Index | | 944 | | 69,151 | 7,053 | 5/11/63 | (200 bp) — Monthly | 7,974 |
| CMBX NA BB.10 Index | | (1,135,828) | | 4,711,000 | 1,567,821 | 11/17/59 | (500 bp) — Monthly | 428,067 |
| CMBX NA BB.10 Index | | (166,877) | | 1,599,000 | 532,147 | 11/17/59 | (500 bp) — Monthly | 363,938 |
| CMBX NA BB.10 Index | | (138,486) | | 1,263,000 | 420,326 | 11/17/59 | (500 bp) — Monthly | 280,788 |
| CMBX NA BB.10 Index | | (304,980) | | 1,196,000 | 398,029 | 11/17/59 | (500 bp) — Monthly | 92,052 |
| CMBX NA BB.11 Index | | (148,735) | | 1,148,000 | 255,315 | 11/18/54 | (500 bp) — Monthly | 105,623 |
| CMBX NA BB.11 Index | | (14,231) | | 279,000 | 62,050 | 11/18/54 | (500 bp) — Monthly | 47,586 |
| CMBX NA BB.11 Index | | (4,098) | | 79,000 | 17,570 | 11/18/54 | (500 bp) — Monthly | 13,406 |
| CMBX NA BB.11 Index | | (2,612) | | 38,000 | 8,451 | 11/18/54 | (500 bp) — Monthly | 5,807 |
| CMBX NA BB.11 Index | | (650) | | 9,000 | 2,002 | 11/18/54 | (500 bp) — Monthly | 1,344 |
| CMBX NA BB.8 Index | | (12,436) | | 34,787 | 13,052 | 10/17/57 | (500 bp) — Monthly | 587 |
| CMBX NA BB.8 Index | | (176) | | 966 | 363 | 10/17/57 | (500 bp) — Monthly | 186 |
| CMBX NA BBB−.10 Index | | (199,963) | | 1,163,000 | 216,318 | 11/17/59 | (300 bp) — Monthly | 15,774 |
| CMBX NA BBB−.10 Index | | (36,331) | | 285,000 | 53,010 | 11/17/59 | (300 bp) — Monthly | 16,537 |
| CMBX NA BBB−.10 Index | | (35,980) | | 155,000 | 28,830 | 11/17/59 | (300 bp) — Monthly | (7,228) |
| CMBX NA BBB−.10 Index | | (25,050) | | 105,000 | 19,530 | 11/17/59 | (300 bp) — Monthly | (5,573) |
| CMBX NA BBB−.10 Index | | (18,118) | | 83,000 | 15,438 | 11/17/59 | (300 bp) — Monthly | (2,722) |
| CMBX NA BBB−.10 Index | | (16,758) | | 77,000 | 14,322 | 11/17/59 | (300 bp) — Monthly | (2,474) |
| CMBX NA BBB−.10 Index | | (3,915) | | 32,000 | 5,952 | 11/17/59 | (300 bp) — Monthly | 2,021 |
| CMBX NA BBB−.10 Index | | (1,275) | | 10,000 | 1,860 | 11/17/59 | (300 bp) — Monthly | 580 |
| CMBX NA BBB−.11 Index | | (182,977) | | 560,000 | 91,504 | 11/18/54 | (300 bp) — Monthly | (91,753) |
| |
88 Diversified Income Trust |
| | | | | | | | |
| OTC CREDIT DEFAULT CONTRACTS OUTSTANDING — PROTECTION PURCHASED at 9/30/22 cont. |
Swap counterparty/
Referenced debt* | | Upfront
premium
received
(paid)** | | Notional
amount | Value | Termi-
nation
date | Payments
(paid)
by fund | Unrealized
appreciation/
(depreciation) |
| Citigroup Global Markets, Inc. cont. |
| CMBX NA BBB−.11 Index | | $(9,714) | | $66,000 | $10,784 | 11/18/54 | (300 bp) — Monthly | $1,037 |
| CMBX NA BBB−.11 Index | | (3,201) | | 10,000 | 1,634 | 11/18/54 | (300 bp) — Monthly | (1,572) |
| CMBX NA BBB−.12 Index | | (546,451) | | 1,636,000 | 299,388 | 8/17/61 | (300 bp) — Monthly | (247,881) |
| CMBX NA BBB−.12 Index | | (503,662) | | 1,449,000 | 265,167 | 8/17/61 | (300 bp) — Monthly | (239,220) |
| CMBX NA BBB−.12 Index | | (319,733) | | 1,417,000 | 259,311 | 8/17/61 | (300 bp) — Monthly | (61,130) |
| CMBX NA BBB−.12 Index | | (273,332) | | 818,000 | 149,694 | 8/17/61 | (300 bp) — Monthly | (124,046) |
| CMBX NA BBB−.12 Index | | (6,402) | | 93,000 | 17,019 | 8/17/61 | (300 bp) — Monthly | 10,570 |
| CMBX NA BBB−.12 Index | | (31,987) | | 91,000 | 16,653 | 8/17/61 | (300 bp) — Monthly | (15,380) |
| CMBX NA BBB−.12 Index | | (2,760) | | 46,000 | 8,418 | 8/17/61 | (300 bp) — Monthly | 5,635 |
| CMBX NA BBB−.12 Index | | (11,274) | | 33,000 | 6,039 | 8/17/61 | (300 bp) — Monthly | (5,251) |
| CMBX NA BBB−.13 Index | | (40,889) | | 803,000 | 159,556 | 12/16/72 | (300 bp) — Monthly | 118,266 |
| CMBX NA BBB−.13 Index | | (35,550) | | 705,000 | 140,084 | 12/16/72 | (300 bp) — Monthly | 104,181 |
| CMBX NA BBB−.13 Index | | (13,627) | | 233,000 | 46,297 | 12/16/72 | (300 bp) — Monthly | 32,554 |
| CMBX NA BBB−.13 Index | | (7,775) | | 142,000 | 28,215 | 12/16/72 | (300 bp) — Monthly | 20,369 |
| CMBX NA BBB−.6 Index | | (1,357,348) | | 4,720,373 | 1,060,668 | 5/11/63 | (300 bp) — Monthly | (299,090) |
| CMBX NA BBB−.6 Index | | (1,221,166) | | 3,832,879 | 861,248 | 5/11/63 | (300 bp) — Monthly | (361,875) |
| CMBX NA BBB−.6 Index | | (1,127,919) | | 2,915,229 | 655,052 | 5/11/63 | (300 bp) — Monthly | (474,355) |
| CMBX NA BBB−.6 Index | | (446,430) | | 1,573,936 | 353,663 | 5/11/63 | (300 bp) — Monthly | (93,570) |
| CMBX NA BBB−.6 Index | | (445,814) | | 1,573,936 | 353,663 | 5/11/63 | (300 bp) — Monthly | (92,954) |
| CMBX NA BBB−.6 Index | | (485,358) | | 1,415,968 | 318,168 | 5/11/63 | (300 bp) — Monthly | (167,913) |
| CMBX NA BBB−.6 Index | | (269,166) | | 778,352 | 174,896 | 5/11/63 | (300 bp) — Monthly | (94,668) |
| CMBX NA BBB−.6 Index | | (95,346) | | 365,481 | 82,124 | 5/11/63 | (300 bp) — Monthly | (13,409) |
| CMBX NA BBB−.7 Index | | (39,813) | | 182,000 | 36,891 | 1/17/47 | (300 bp) — Monthly | (3,012) |
| |
Diversified Income Trust 89 |
| | | | | | | | |
| OTC CREDIT DEFAULT CONTRACTS OUTSTANDING — PROTECTION PURCHASED at 9/30/22 cont. |
Swap counterparty/
Referenced debt* | | Upfront
premium
received
(paid)** | | Notional
amount | Value | Termi-
nation
date | Payments
(paid)
by fund | Unrealized
appreciation/
(depreciation) |
| Citigroup Global Markets, Inc. cont. |
| CMBX NA BBB−.8 Index | | $(492,515) | | $3,147,000 | $544,431 | 10/17/57 | (300 bp) — Monthly | $50,343 |
| CMBX NA BBB−.8 Index | | (491,742) | | 3,111,000 | 538,203 | 10/17/57 | (300 bp) — Monthly | 44,905 |
| CMBX NA BBB−.8 Index | | (490,037) | | 3,088,000 | 534,224 | 10/17/57 | (300 bp) — Monthly | 42,644 |
| CMBX NA BBB−.8 Index | | (322,656) | | 2,065,000 | 357,245 | 10/17/57 | (300 bp) — Monthly | 33,556 |
| CMBX NA BBB−.8 Index | | (203,953) | | 1,425,000 | 246,525 | 10/17/57 | (300 bp) — Monthly | 41,859 |
| CMBX NA BBB−.8 Index | | (100,177) | | 722,000 | 124,906 | 10/17/57 | (300 bp) — Monthly | 24,367 |
| CMBX NA BBB−.8 Index | | (54,667) | | 394,000 | 68,162 | 10/17/57 | (300 bp) — Monthly | 13,297 |
| CMBX NA BBB−.8 Index | | (26,093) | | 196,000 | 33,908 | 10/17/57 | (300 bp) — Monthly | 7,718 |
| CMBX NA BBB−.8 Index | | (22,500) | | 150,000 | 25,950 | 10/17/57 | (300 bp) — Monthly | 3,375 |
| CMBX NA BBB−.9 Index | | (119,951) | | 507,000 | 98,916 | 9/17/58 | (300 bp) — Monthly | (21,289) |
| Credit Suisse International |
| CMBX NA BB.10 Index | | (467,516) | | 3,504,000 | 1,166,131 | 11/17/59 | (500 bp) — Monthly | 695,694 |
| CMBX NA BB.10 Index | | (415,378) | | 3,493,000 | 1,162,470 | 11/17/59 | (500 bp) — Monthly | 744,181 |
| CMBX NA BB.10 Index | | (227,964) | | 1,834,000 | 610,355 | 11/17/59 | (500 bp) — Monthly | 380,863 |
| CMBX NA BBB−.7 Index | | (83,041) | | 1,059,000 | 214,659 | 1/17/47 | (300 bp) — Monthly | 131,089 |
| Goldman Sachs International |
| CMBX NA A.6 Index | | (10,136) | | 96,183 | 9,811 | 5/11/63 | (200 bp) — Monthly | (358) |
| CMBX NA A.6 Index | | (5,070) | | 32,690 | 3,334 | 5/11/63 | (200 bp) — Monthly | (1,747) |
| CMBX NA A.6 Index | | (4,773) | | 29,546 | 3,014 | 5/11/63 | (200 bp) — Monthly | (1,770) |
| CMBX NA A.6 Index | | (3,488) | | 22,631 | 2,308 | 5/11/63 | (200 bp) — Monthly | (1,187) |
| CMBX NA A.6 Index | | (2,713) | | 17,602 | 1,795 | 5/11/63 | (200 bp) — Monthly | (923) |
| CMBX NA A.6 Index | | (2,713) | | 17,602 | 1,795 | 5/11/63 | (200 bp) — Monthly | (923) |
| CMBX NA A.6 Index | | (944) | | 7,544 | 769 | 5/11/63 | (200 bp) — Monthly | (177) |
| CMBX NA A.6 Index | | (872) | | 6,286 | 641 | 5/11/63 | (200 bp) — Monthly | (233) |
| |
90 Diversified Income Trust |
| | | | | | | | |
| OTC CREDIT DEFAULT CONTRACTS OUTSTANDING — PROTECTION PURCHASED at 9/30/22 cont. |
Swap counterparty/
Referenced debt* | | Upfront
premium
received
(paid)** | | Notional
amount | Value | Termi-
nation
date | Payments
(paid)
by fund | Unrealized
appreciation/
(depreciation) |
| Goldman Sachs International cont. |
| CMBX NA A.6 Index | | $(413) | | $3,143 | $321 | 5/11/63 | (200 bp) — Monthly | $(93) |
| CMBX NA A.6 Index | | (407) | | 3,143 | 321 | 5/11/63 | (200 bp) — Monthly | (87) |
| CMBX NA A.6 Index | | (413) | | 3,143 | 321 | 5/11/63 | (200 bp) — Monthly | (93) |
| CMBX NA A.6 Index | | (417) | | 3,143 | 321 | 5/11/63 | (200 bp) — Monthly | (97) |
| CMBX NA A.6 Index | | (245) | | 1,886 | 192 | 5/11/63 | (200 bp) — Monthly | (53) |
| CMBX NA A.6 Index | | (96) | | 629 | 64 | 5/11/63 | (200 bp) — Monthly | (32) |
| CMBX NA BB.10 Index | | (29,639) | | 131,000 | 43,597 | 11/17/59 | (500 bp) — Monthly | 13,849 |
| CMBX NA BB.9 Index | | (78,324) | | 492,000 | 160,540 | 9/17/58 | (500 bp) — Monthly | 81,805 |
| CMBX NA BB.9 Index | | (10,382) | | 65,000 | 21,210 | 9/17/58 | (500 bp) — Monthly | 10,773 |
| CMBX NA BB.9 Index | | (2,380) | | 20,000 | 6,526 | 9/17/58 | (500 bp) — Monthly | 4,129 |
| CMBX NA BB.9 Index | | (505) | | 13,000 | 4,242 | 9/17/58 | (500 bp) — Monthly | 3,726 |
| CMBX NA BBB−.10 Index | | (8,311) | | 38,000 | 7,068 | 11/17/59 | (300 bp) — Monthly | (1,262) |
| CMBX NA BBB−.12 Index | | (7,408) | | 38,000 | 6,954 | 8/17/61 | (300 bp) — Monthly | (473) |
| CMBX NA BBB−.12 Index | | (9,118) | | 27,000 | 4,941 | 8/17/61 | (300 bp) — Monthly | (4,191) |
| CMBX NA BBB−.13 Index | | (2,955) | | 39,000 | 7,749 | 12/16/72 | (300 bp) — Monthly | 4,774 |
| CMBX NA BBB−.6 Index | | (1,816,213) | | 4,785,714 | 1,075,350 | 5/11/63 | (300 bp) — Monthly | (743,306) |
| CMBX NA BBB−.6 Index | | (5,649) | | 16,515 | 3,711 | 5/11/63 | (300 bp) — Monthly | (1,947) |
| CMBX NA BBB−.7 Index | | (410,020) | | 5,000,000 | 1,013,500 | 1/17/47 | (300 bp) — Monthly | 600,980 |
| JPMorgan Securities LLC |
| CMBX NA A.6 Index | | (163) | | 1,257 | 128 | 5/11/63 | (200 bp) — Monthly | (35) |
| CMBX NA A.6 Index | | (162) | | 1,257 | 128 | 5/11/63 | (200 bp) — Monthly | (34) |
| CMBX NA BB.17 Index | | (6,148,112) | | 12,556,000 | 4,186,170 | 1/17/47 | (500 bp) — Monthly | (1,972,404) |
| CMBX NA BB.9 Index | | (1,074,893) | | 2,175,000 | 709,703 | 9/17/58 | (500 bp) — Monthly | (367,003) |
| CMBX NA BBB−.10 Index | | (195,571) | | 1,551,000 | 288,486 | 11/17/59 | (300 bp) — Monthly | 92,140 |
| |
Diversified Income Trust 91 |
| | | | | | | | |
| OTC CREDIT DEFAULT CONTRACTS OUTSTANDING — PROTECTION PURCHASED at 9/30/22 cont. |
Swap counterparty/
Referenced debt* | | Upfront
premium
received
(paid)** | | Notional
amount | Value | Termi-
nation
date | Payments
(paid)
by fund | Unrealized
appreciation/
(depreciation) |
| JPMorgan Securities LLC cont. |
| CMBX NA BBB−.11 Index | | $(22,028) | | $200,000 | $32,680 | 11/18/54 | (300 bp) — Monthly | $10,552 |
| CMBX NA BBB−.12 Index | | (1,802) | | 15,000 | 2,745 | 8/17/61 | (300 bp) — Monthly | 935 |
| CMBX NA BBB−.7 Index | | (4,366,588) | | 18,600,000 | 3,770,220 | 1/17/47 | (300 bp) — Monthly | (605,669) |
| Merrill Lynch International |
| CMBX NA BB.10 Index | | (181,851) | | 3,196,000 | 1,063,629 | 11/17/59 | (500 bp) — Monthly | 879,115 |
| CMBX NA BB.7 Index | | (9,888) | | 57,000 | 19,004 | 1/17/47 | (500 bp) — Monthly | 9,068 |
| CMBX NA BBB−.10 Index | | (10,617) | | 49,000 | 9,114 | 11/17/59 | (300 bp) — Monthly | (1,527) |
| CMBX NA BBB−.7 Index | | (89,077) | | 1,087,000 | 220,335 | 1/17/47 | (300 bp) — Monthly | 130,714 |
| Morgan Stanley & Co. International PLC |
| CMBX NA A.6 Index | | (10,140) | | 65,379 | 6,669 | 5/11/63 | (200 bp) — Monthly | (3,493) |
| CMBX NA A.6 Index | | (3,488) | | 22,631 | 2,308 | 5/11/63 | (200 bp) — Monthly | (1,187) |
| CMBX NA A.6 Index | | (1,931) | | 12,573 | 1,282 | 5/11/63 | (200 bp) — Monthly | (653) |
| CMBX NA A.6 Index | | (1,817) | | 11,944 | 1,218 | 5/11/63 | (200 bp) — Monthly | (603) |
| CMBX NA A.6 Index | | (1,370) | | 10,058 | 1,026 | 5/11/63 | (200 bp) — Monthly | (347) |
| CMBX NA A.6 Index | | (1,178) | | 8,172 | 834 | 5/11/63 | (200 bp) — Monthly | (347) |
| CMBX NA A.6 Index | | (735) | | 5,658 | 577 | 5/11/63 | (200 bp) — Monthly | (160) |
| CMBX NA A.6 Index | | (503) | | 3,772 | 385 | 5/11/63 | (200 bp) — Monthly | (119) |
| CMBX NA BB.10 Index | | (164,027) | | 1,564,000 | 520,499 | 11/17/59 | (500 bp) — Monthly | 355,169 |
| CMBX NA BB.10 Index | | (422,820) | | 1,392,000 | 463,258 | 11/17/59 | (500 bp) — Monthly | 39,278 |
| CMBX NA BB.10 Index | | (37,576) | | 160,000 | 53,248 | 11/17/59 | (500 bp) — Monthly | 15,538 |
| CMBX NA BB.7 Index | | (192,058) | | 996,000 | 332,066 | 1/17/47 | (500 bp) — Monthly | 139,179 |
| CMBX NA BB.7 Index | | (158,631) | | 786,000 | 262,052 | 1/17/47 | (500 bp) — Monthly | 102,767 |
| CMBX NA BB.7 Index | | (131,172) | | 701,000 | 233,713 | 1/17/47 | (500 bp) — Monthly | 101,957 |
| CMBX NA BB.7 Index | | (134,942) | | 671,000 | 223,711 | 1/17/47 | (500 bp) — Monthly | 88,211 |
| |
92 Diversified Income Trust |
| | | | | | | | |
| OTC CREDIT DEFAULT CONTRACTS OUTSTANDING — PROTECTION PURCHASED at 9/30/22 cont. |
Swap counterparty/
Referenced debt* | | Upfront
premium
received
(paid)** | | Notional
amount | Value | Termi-
nation
date | Payments
(paid)
by fund | Unrealized
appreciation/
(depreciation) |
| Morgan Stanley & Co. International PLC cont. |
| CMBX NA BB.9 Index | | $(141,628) | | $1,064,000 | $347,183 | 9/17/58 | (500 bp) — Monthly | $204,669 |
| CMBX NA BB.9 Index | | (128,586) | | 855,000 | 278,987 | 9/17/58 | (500 bp) — Monthly | 149,688 |
| CMBX NA BB.9 Index | | (2,505) | | 71,000 | 23,167 | 9/17/58 | (500 bp) — Monthly | 20,603 |
| CMBX NA BB.9 Index | | (2,339) | | 38,000 | 12,399 | 9/17/58 | (500 bp) — Monthly | 10,029 |
| CMBX NA BB.9 Index | | (2,461) | | 18,000 | 5,873 | 9/17/58 | (500 bp) — Monthly | 3,397 |
| CMBX NA BB.9 Index | | (547) | | 14,000 | 4,568 | 9/17/58 | (500 bp) — Monthly | 4,009 |
| CMBX NA BB.9 Index | | (1,514) | | 10,000 | 3,263 | 9/17/58 | (500 bp) — Monthly | 1,741 |
| CMBX NA BB.9 Index | | (431) | | 7,000 | 2,284 | 9/17/58 | (500 bp) — Monthly | 1,848 |
| CMBX NA BB.9 Index | | (347) | | 7,000 | 2,284 | 9/17/58 | (500 bp) — Monthly | 1,931 |
| CMBX NA BB.9 Index | | (757) | | 5,000 | 1,632 | 9/17/58 | (500 bp) — Monthly | 871 |
| CMBX NA BB.9 Index | | (54) | | 1,000 | 326 | 9/17/58 | (500 bp) — Monthly | 271 |
| CMBX NA BBB−.10 Index | | (288,475) | | 2,338,000 | 434,868 | 11/17/59 | (300 bp) — Monthly | 145,224 |
| CMBX NA BBB−.10 Index | | (144,191) | | 1,665,000 | 309,690 | 11/17/59 | (300 bp) — Monthly | 164,667 |
| CMBX NA BBB−.10 Index | | (160,942) | | 1,269,000 | 236,034 | 11/17/59 | (300 bp) — Monthly | 74,457 |
| CMBX NA BBB−.10 Index | | (166,387) | | 987,000 | 183,582 | 11/17/59 | (300 bp) — Monthly | 16,702 |
| CMBX NA BBB−.10 Index | | (83,477) | | 385,000 | 71,610 | 11/17/59 | (300 bp) — Monthly | (12,060) |
| CMBX NA BBB−.10 Index | | (73,306) | | 339,000 | 63,054 | 11/17/59 | (300 bp) — Monthly | (10,422) |
| CMBX NA BBB−.10 Index | | (17,975) | | 76,000 | 14,136 | 11/17/59 | (300 bp) — Monthly | (3,877) |
| CMBX NA BBB−.10 Index | | (16,090) | | 66,000 | 12,276 | 11/17/59 | (300 bp) — Monthly | (3,847) |
| CMBX NA BBB−.10 Index | | (7,309) | | 61,000 | 11,346 | 11/17/59 | (300 bp) — Monthly | 4,007 |
| CMBX NA BBB−.10 Index | | (8,950) | | 41,000 | 7,626 | 11/17/59 | (300 bp) — Monthly | (1,344) |
| CMBX NA BBB−.10 Index | | (8,954) | | 39,000 | 7,254 | 11/17/59 | (300 bp) — Monthly | (1,720) |
| CMBX NA BBB−.10 Index | | (2,537) | | 20,000 | 3,720 | 11/17/59 | (300 bp) — Monthly | 1,173 |
| |
Diversified Income Trust 93 |
| | | | | | | | |
| OTC CREDIT DEFAULT CONTRACTS OUTSTANDING — PROTECTION PURCHASED at 9/30/22 cont. |
Swap counterparty/
Referenced debt* | | Upfront
premium
received
(paid)** | | Notional
amount | Value | Termi-
nation
date | Payments
(paid)
by fund | Unrealized
appreciation/
(depreciation) |
| Morgan Stanley & Co. International PLC cont. |
| CMBX NA BBB−.11 Index | | $(191,080) | | $1,214,000 | $198,368 | 11/18/54 | (300 bp) — Monthly | $6,681 |
| CMBX NA BBB−.11 Index | | (6,355) | | 112,000 | 18,301 | 11/18/54 | (300 bp) — Monthly | 11,890 |
| CMBX NA BBB−.12 Index | | (221,082) | | 973,000 | 178,059 | 8/17/61 | (300 bp) — Monthly | (43,510) |
| CMBX NA BBB−.12 Index | | (58,425) | | 189,000 | 34,587 | 8/17/61 | (300 bp) — Monthly | (23,932) |
| CMBX NA BBB−.12 Index | | (1,154) | | 28,000 | 5,124 | 8/17/61 | (300 bp) — Monthly | 3,956 |
| CMBX NA BBB−.13 Index | | (5,978) | | 97,000 | 19,274 | 12/16/72 | (300 bp) — Monthly | 13,247 |
| CMBX NA BBB−.6 Index | | (2,066,357) | | 5,352,963 | 1,202,811 | 5/11/63 | (300 bp) — Monthly | (866,279) |
| CMBX NA BBB−.7 Index | | (187,298) | | 2,950,000 | 597,965 | 1/17/47 | (300 bp) — Monthly | 409,192 |
| CMBX NA BBB−.7 Index | | (7,132) | | 70,000 | 14,189 | 1/17/47 | (300 bp) — Monthly | 7,022 |
| CMBX NA BBB−.8 Index | | (276,751) | | 1,779,000 | 307,767 | 10/17/57 | (300 bp) — Monthly | 30,126 |
| CMBX NA BBB−.8 Index | | (35,313) | | 226,000 | 39,098 | 10/17/57 | (300 bp) — Monthly | 3,673 |
| CMBX NA BBB−.8 Index | | (25,906) | | 181,000 | 31,313 | 10/17/57 | (300 bp) — Monthly | 5,316 |
| Upfront premium received | 944 | | | Unrealized appreciation | 7,869,822 |
| Upfront premium (paid) | (33,690,467) | | | Unrealized (depreciation) | (7,169,533) |
| Total | $(33,689,523) | | | Total | $700,289 |
| * Payments related to the referenced debt are made upon a credit default event. |
| ** Upfront premium is based on the difference between the original spread on issue and the market spread on day of execution. |
|
| | | | | | | | |
| CENTRALLY CLEARED CREDIT DEFAULT CONTRACTS OUTSTANDING — PROTECTION SOLD at 9/30/22 |
| Referenced debt* | Rating*** | Upfront
premium
received
(paid)** | | Notional
amount | Value | Termi-
nation
date | Payments
received
by fund | Unrealized
appreciation/
(depreciation) |
| CDX NA HY Series 38 Index | B+/P | $(75,927) | | $19,073,340 | $444,600 | 6/20/27 | 500 bp — Quarterly | $(491,387) |
| Total | $(75,927) | $(491,387) |
| * Payments related to the referenced debt are made upon a credit default event. |
| ** Upfront premium is based on the difference between the original spread on issue and the market spread on day of execution. |
| *** Ratings for an underlying index represent the average of the ratings of all the securities included in that index. The Moody’s, Standard & Poor’s or Fitch ratings are believed to be the most recent ratings available at September 30, 2022. Securities rated by Putnam are indicated by “/P.” The Putnam rating categories are comparable to the Standard & Poor’s classifications. |
|
| |
94 Diversified Income Trust |
| ASC 820 establishes a three-level hierarchy for disclosure of fair value measurements. The valuation hierarchy is based upon the transparency of inputs to the valuation of the fund’s investments. The three levels are defined as follows: |
Level 1: Valuations based on quoted prices for identical securities in active markets.
Level 2: Valuations based on quoted prices in markets that are not active or for which all significant inputs are observable, either directly or indirectly.
Level 3: Valuations based on inputs that are unobservable and significant to the fair value measurement.
| The following is a summary of the inputs used to value the fund’s net assets as of the close of the reporting period: |
|
| | | |
| | Valuation inputs |
| Investments in securities: | Level 1 | Level 2 | Level 3 |
| Asset-backed securities | $— | $15,123,222 | $— |
| Convertible bonds and notes | — | 63,141,705 | — |
| Corporate bonds and notes | — | 250,738,926 | — |
| Foreign government and agency bonds and notes | — | 142,129,714 | — |
| Mortgage-backed securities | — | 658,988,798 | — |
| Purchased options outstanding | — | 150 | — |
| Purchased swap options outstanding | — | 12,857,572 | — |
| Senior loans | — | 19,560,381 | — |
| U.S. government and agency mortgage obligations | — | 1,297,759,018 | — |
| U.S. treasury obligations | — | 2,419,338 | — |
| Warrants | — | — | 11 |
| Short-term investments | 20,431,000 | 537,080,710 | — |
| Totals by level | $20,431,000 | $2,999,799,534 | $11 |
|
| | | |
| | Valuation inputs |
| Other financial instruments: | Level 1 | Level 2 | Level 3 |
| Forward currency contracts | $— | $2,989,753 | $— |
| Futures contracts | 1,368,399 | — | — |
| Written options outstanding | — | (5,530,200) | — |
| Written swap options outstanding | — | (79,662,432) | — |
| Forward premium swap option contracts | — | (49,280,463) | — |
| TBA sale commitments | — | (469,255,084) | — |
| Interest rate swap contracts | — | 55,355,974 | — |
| Total return swap contracts | — | (2,200,297) | — |
| Credit default contracts | — | (169,790) | — |
| Totals by level | $1,368,399 | $(547,752,539) | $— |
| At the start and close of the reporting period, Level 3 investments in securities represented less than 1% of the fund’s net assets and were not considered a significant portion of the fund’s portfolio. |
The accompanying notes are an integral part of these financial statements.
| |
Diversified Income Trust 95 |
Statement of assets and liabilities 9/30/22
| |
| ASSETS | |
| Investment in securities, at value (Notes 1 and 9): | |
| Unaffiliated issuers (identified cost $3,139,671,472) | $2,894,739,038 |
| Affiliated issuers (identified cost $125,491,507) (Note 5) | 125,491,507 |
| Cash | 394,871 |
| Foreign currency (cost $14,285) (Note 1) | 14,247 |
| Interest and other receivables | 17,146,279 |
| Receivable for shares of the fund sold | 1,138,698 |
| Receivable for investments sold | 27,369,588 |
| Receivable for sales of TBA securities (Note 1) | 315,351,406 |
| Receivable for variation margin on futures contracts (Note 1) | 88,237 |
| Receivable for variation margin on centrally cleared swap contracts (Note 1) | 70,480,575 |
| Unrealized appreciation on forward currency contracts (Note 1) | 6,453,881 |
| Unrealized appreciation on forward premium swap option contracts (Note 1) | 148,316,258 |
| Unrealized appreciation on OTC swap contracts (Note 1) | 42,488,177 |
| Premium paid on OTC swap contracts (Note 1) | 33,690,467 |
| Prepaid assets | 36,274 |
| Total assets | 3,683,199,503 |
| |
| LIABILITIES | |
| Payable for investments purchased | 19,302,537 |
| Payable for purchases of TBA securities (Note 1) | 1,170,068,246 |
| Payable for shares of the fund repurchased | 3,462,475 |
| Payable for compensation of Manager (Note 2) | 743,355 |
| Payable for custodian fees (Note 2) | 126,445 |
| Payable for investor servicing fees (Note 2) | 448,648 |
| Payable for Trustee compensation and expenses (Note 2) | 763,727 |
| Payable for administrative services (Note 2) | 6,671 |
| Payable for distribution fees (Note 2) | 537,636 |
| Payable for variation margin on centrally cleared swap contracts (Note 1) | 64,717,671 |
| Unrealized depreciation on forward currency contracts (Note 1) | 3,464,128 |
| Unrealized depreciation on forward premium swap option contracts (Note 1) | 197,596,721 |
| Written options outstanding, at value (premiums $88,723,195) (Note 1) | 85,192,632 |
| TBA sale commitments, at value (proceeds receivable $486,909,551) (Note 1) | 469,255,084 |
| Unrealized depreciation on OTC swap contracts (Note 1) | 25,879,357 |
| Premium received on OTC swap contracts (Note 1) | 27,486,183 |
| Collateral on certain derivative contracts and TBA commitments, at value (Notes 1 and 9) | 22,850,338 |
| Other accrued expenses | 363,181 |
| Total liabilities | 2,092,265,035 |
| | |
| Net assets | $1,590,934,468 |
(Continued on next page)
|
| 96 Diversified Income Trust |
Statement of assets and liabilities cont.
| |
| REPRESENTED BY | |
| Paid-in capital (Unlimited shares authorized) (Notes 1 and 4) | $3,242,392,197 |
| Total distributable earnings (Note 1) | (1,651,457,729) |
| Total — Representing net assets applicable to capital shares outstanding | $1,590,934,468 |
| |
| COMPUTATION OF NET ASSET VALUE AND OFFERING PRICE | |
| Net asset value and redemption price per class A share | |
| ($617,525,862 divided by 110,461,161 shares) | $5.59 |
| Offering price per class A share (100/96.00 of $5.59)* | $5.82 |
| Net asset value and offering price per class B share ($3,614,026 divided by 654,838 shares)** | $5.52 |
| Net asset value and offering price per class C share ($114,681,804 divided by 20,989,307 shares)** | $5.46 |
| Net asset value and redemption price per class M share | |
| ($59,808,276 divided by 10,981,700 shares) | $5.45 |
| Offering price per class M share (100/96.75 of $5.45)† | $5.63 |
| Net asset value, offering price and redemption price per class R share | |
| ($1,860,291 divided by 338,724 shares) | $5.49 |
| Net asset value, offering price and redemption price per class R6 share | |
| ($25,838,921 divided by 4,683,995 shares) | $5.52 |
| Net asset value, offering price and redemption price per class Y share | |
| ($767,605,288 divided by 138,860,328 shares) | $5.53 |
*On single retail sales of less than $100,000. On sales of $100,000 or more the offering price is reduced.
**Redemption price per share is equal to net asset value less any applicable contingent deferred sales charge.
†On single retail sales of less than $50,000. On sales of $50,000 or more the offering price is reduced.
The accompanying notes are an integral part of these financial statements.
|
| Diversified Income Trust 97 |
Statement of operations Year ended 9/30/22
| |
| INVESTMENT INCOME | |
| Interest (net of foreign tax of $17,978) (including interest income of $1,079,443 from investments | |
| in affiliated issuers) (Note 5) | $111,827,892 |
| Total investment income | 111,827,892 |
| |
| EXPENSES | |
| Compensation of Manager (Note 2) | 10,325,369 |
| Investor servicing fees (Note 2) | 2,934,276 |
| Custodian fees (Note 2) | 276,866 |
| Trustee compensation and expenses (Note 2) | 77,668 |
| Distribution fees (Note 2) | 3,751,107 |
| Administrative services (Note 2) | 52,702 |
| Other | 970,113 |
| Total expenses | 18,388,101 |
| Expense reduction (Note 2) | (4,772) |
| Net expenses | 18,383,329 |
| | |
| Net investment income | 93,444,563 |
| |
| REALIZED AND UNREALIZED GAIN (LOSS) | |
| Net realized gain (loss) on: | |
| Securities from unaffiliated issuers (Notes 1 and 3) | (175,496,508) |
| Net increase from payments by affiliates (Note 2) | 763,493 |
| Foreign currency transactions (Note 1) | 103,958 |
| Forward currency contracts (Note 1) | (10,890,927) |
| Futures contracts (Note 1) | 113,648,573 |
| Swap contracts (Note 1) | (179,825,651) |
| Written options (Note 1) | (101,931,875) |
| Total net realized loss | (353,628,937) |
| Change in net unrealized appreciation (depreciation) on: | |
| Securities from unaffiliated issuers and TBA sale commitments | (48,727,288) |
| Assets and liabilities in foreign currencies | (31,389) |
| Forward currency contracts | 10,778,562 |
| Futures contracts | (5,157,418) |
| Swap contracts | 191,486,173 |
| Written options | (75,906,583) |
| Total change in net unrealized appreciation | 72,442,057 |
| | |
| Net loss on investments | (281,186,880) |
| |
| Net decrease in net assets resulting from operations | $(187,742,317) |
The accompanying notes are an integral part of these financial statements.
|
| 98 Diversified Income Trust |
Statement of changes in net assets
| | |
| DECREASE IN NET ASSETS | Year ended 9/30/22 | Year ended 9/30/21 |
| Operations | | |
| Net investment income | $93,444,563 | $109,151,160 |
| Net realized loss on investments | | |
| and foreign currency transactions | (353,628,937) | (17,652,021) |
| Change in net unrealized appreciation of investments | | |
| and assets and liabilities in foreign currencies | 72,442,057 | 2,003,793 |
| Net increase (decrease) in net assets resulting | | |
| from operations | (187,742,317) | 93,502,932 |
| Distributions to shareholders (Note 1): | | |
| From ordinary income | | |
| Net investment income | | |
| Class A | (27,509,438) | (26,576,301) |
| Class B | (170,607) | (259,038) |
| Class C | (5,029,913) | (6,620,739) |
| Class M | (2,652,897) | (2,464,952) |
| Class R | (75,111) | (64,401) |
| Class R6 | (1,258,413) | (1,128,173) |
| Class Y | (39,848,571) | (48,700,361) |
| From return of capital | | |
| Class A | — | (3,674,411) |
| Class B | — | (35,814) |
| Class C | — | (915,377) |
| Class M | — | (340,802) |
| Class R | — | (8,904) |
| Class R6 | — | (155,980) |
| Class Y | — | (6,733,261) |
| Decrease from capital share transactions (Note 4) | (618,360,225) | (549,625,383) |
| Total decrease in net assets | (882,647,492) | (553,800,965) |
| |
| NET ASSETS | | |
| Beginning of year | 2,473,581,960 | 3,027,382,925 |
| End of year | $1,590,934,468 | $2,473,581,960 |
The accompanying notes are an integral part of these financial statements.
|
| Diversified Income Trust 99 |
Financial highlights
(For a common share outstanding throughout the period)
| | | | | | | | | | | | | |
| | INVESTMENT OPERATIONS | LESS DISTRIBUTIONS | RATIOS AND SUPPLEMENTAL DATA |
| | | | | | | | | | | | | Ratio of net | |
| | Net asset | | Net realized | | | | | | | | Ratio | investment | |
| | value, | | and unrealized | Total from | From net | | | Net asset | Total return | Net assets, | of expenses | income (loss) | Portfolio |
| | beginning | Net investment | gain (loss) | investment | investment | From return | Total | value, end | at net asset | end of period | to average | to average | turnover |
| Period ended | of period | income (loss)a | on investments | operations | income | of capital | distributions | of period | value (%)b | (in thousands) | net assets (%)c | net assets (%) | (%)d |
| Class A | | | | | | | | | | | | | |
| September 30, 2022 | $6.41 | .29 | (.87) | (.58) | (.24) | — | (.24) | $5.59 | (9.29) | $617,526 | 1.01 | 4.78 | 1,163 |
| September 30, 2021 | 6.45 | .25 | (.06) | .19 | (.20) | (.03) | (.23) | 6.41 | 2.83 | 817,914 | .97 | 3.80 | 1,277 |
| September 30, 2020 | 6.99 | .25 | (.52) | (.27) | (.27) | — | (.27) | 6.45 | (3.91) | 890,025 | .99 | 3.78 | 1,110 |
| September 30, 2019 | 6.96 | .28 | .06 | .34 | (.31) | — | (.31) | 6.99 | 5.00 | 1,109,333 | .98 | 4.05 | 701 |
| September 30, 2018 | 7.07 | .31 | (.04) | .27 | (.38) | — | (.38) | 6.96 | 3.81 | 1,293,136 | .98 | 4.39 | 580 |
| Class B | | | | | | | | | | | | | |
| September 30, 2022 | $6.33 | .23e | (.85) | (.62) | (.19) | — | (.19) | $5.52 | (9.96) | $3,614 | 1.76 | 3.77e | 1,163 |
| September 30, 2021 | 6.37 | .20 | (.06) | .14 | (.16) | (.02) | (.18) | 6.33 | 2.09 | 7,974 | 1.72 | 2.96 | 1,277 |
| September 30, 2020 | 6.91 | .20 | (.52) | (.32) | (.22) | — | (.22) | 6.37 | (4.67) | 12,991 | 1.74 | 2.99 | 1,110 |
| September 30, 2019 | 6.88 | .23 | .05 | .28 | (.25) | — | (.25) | 6.91 | 4.26 | 19,923 | 1.73 | 3.31 | 701 |
| September 30, 2018 | 6.99 | .25 | (.04) | .21 | (.32) | — | (.32) | 6.88 | 3.05 | 29,465 | 1.73 | 3.65 | 580 |
| Class C | | | | | | | | | | | | | |
| September 30, 2022 | $6.27 | .23 | (.85) | (.62) | (.19) | — | (.19) | $5.46 | (10.04) | $114,682 | 1.76 | 3.97 | 1,163 |
| September 30, 2021 | 6.31 | .20 | (.06) | .14 | (.16) | (.02) | (.18) | 6.27 | 2.13 | 218,082 | 1.72 | 3.05 | 1,277 |
| September 30, 2020 | 6.85 | .20 | (.52) | (.32) | (.22) | — | (.22) | 6.31 | (4.70) | 325,092 | 1.74 | 3.04 | 1,110 |
| September 30, 2019 | 6.82 | .22 | .07 | .29 | (.26) | — | (.26) | 6.85 | 4.31 | 484,676 | 1.73 | 3.33 | 701 |
| September 30, 2018 | 6.94 | .25 | (.04) | .21 | (.33) | — | (.33) | 6.82 | 3.00 | 600,600 | 1.73 | 3.65 | 580 |
| Class M | | | | | | | | | | | | | |
| September 30, 2022 | $6.25 | .26 | (.83) | (.57) | (.23) | — | (.23) | $5.45 | (9.39) | $59,808 | 1.26 | 4.48 | 1,163 |
| September 30, 2021 | 6.30 | .23 | (.06) | .17 | (.19) | (.03) | (.22) | 6.25 | 2.53 | 78,270 | 1.22 | 3.51 | 1,277 |
| September 30, 2020 | 6.84 | .23 | (.51) | (.28) | (.26) | — | (.26) | 6.30 | (4.19) | 86,104 | 1.24 | 3.49 | 1,110 |
| September 30, 2019 | 6.82 | .25 | .06 | .31 | (.29) | — | (.29) | 6.84 | 4.75 | 111,949 | 1.23 | 3.76 | 701 |
| September 30, 2018 | 6.94 | .28 | (.04) | .24 | (.36) | — | (.36) | 6.82 | 3.53 | 118,582 | 1.23 | 4.11 | 580 |
| Class R | | | | | | | | | | | | | |
| September 30, 2022 | $6.31 | .27 | (.86) | (.59) | (.23) | — | (.23) | $5.49 | (9.62) | $1,860 | 1.26 | 4.56 | 1,163 |
| September 30, 2021 | 6.35 | .23 | (.05) | .18 | (.19) | (.03) | (.22) | 6.31 | 2.67 | 2,120 | 1.22 | 3.56 | 1,277 |
| September 30, 2020 | 6.89 | .23 | (.52) | (.29) | (.25) | — | (.25) | 6.35 | (4.18) | 2,120 | 1.24 | 3.52 | 1,110 |
| September 30, 2019 | 6.87 | .25 | .06 | .31 | (.29) | — | (.29) | 6.89 | 4.70 | 2,423 | 1.23 | 3.74 | 701 |
| September 30, 2018 | 6.98 | .29 | (.04) | .25 | (.36) | — | (.36) | 6.87 | 3.64 | 2,404 | 1.23 | 4.13 | 580 |
| Class R6 | | | | | | | | | | | | | |
| September 30, 2022 | $6.33 | .31 | (.86) | (.55) | (.26) | — | (.26) | $5.52 | (8.88) | $25,839 | .66 | 5.23 | 1,163 |
| September 30, 2021 | 6.38 | .27 | (.07) | .20 | (.22) | (.03) | (.25) | 6.33 | 3.07 | 24,944 | .63 | 4.16 | 1,277 |
| September 30, 2020 | 6.92 | .27 | (.52) | (.25) | (.29) | — | (.29) | 6.38 | (3.60) | 36,162 | .64 | 4.14 | 1,110 |
| September 30, 2019 | 6.89 | .30 | .06 | .36 | (.33) | — | (.33) | 6.92 | 5.42 | 17,243 | .64 | 4.38 | 701 |
| September 30, 2018 | 7.00 | .33 | (.04) | .29 | (.40) | — | (.40) | 6.89 | 4.20 | 14,848 | .64 | 4.75 | 580 |
See notes to financial highlights at the end of this section.
The accompanying notes are an integral part of these financial statements.
| |
| 100 Diversified Income Trust | Diversified Income Trust 101 |
Financial highlights cont.
| | | | | | | | | | | | | |
| | INVESTMENT OPERATIONS | LESS DISTRIBUTIONS | RATIOS AND SUPPLEMENTAL DATA |
| | | | | | | | | | | | | Ratio of net | |
| | Net asset | | Net realized | | | | | | | | Ratio | investment | |
| | value, | | and unrealized | Total from | From net | | | Net asset | Total return | Net assets, | of expenses | income (loss) | Portfolio |
| | beginning | Net investment | gain (loss) | investment | investment | From return | Total | value, end | at net asset | end of period | to average | to average | turnover |
| Period ended | of period | income (loss)a | on investments | operations | income | of capital | distributions | of period | value (%)b | (in thousands) | net assets (%)c | net assets (%) | (%)d |
| Class Y | | | | | | | | | | | | | |
| September 30, 2022 | $6.34 | .30 | (.86) | (.56) | (.25) | — | (.25) | $5.53 | (9.04) | $767,605 | .76 | 5.06 | 1,163 |
| September 30, 2021 | 6.38 | .27 | (.07) | .20 | (.21) | (.03) | (.24) | 6.34 | 3.08 | 1,324,278 | .72 | 4.10 | 1,277 |
| September 30, 2020 | 6.91 | .27 | (.52) | (.25) | (.28) | — | (.28) | 6.38 | (3.60) | 1,674,889 | .74 | 4.07 | 1,110 |
| September 30, 2019 | 6.88 | .29 | .06 | .35 | (.32) | — | (.32) | 6.91 | 5.30 | 2,529,128 | .73 | 4.33 | 701 |
| September 30, 2018 | 7.00 | .32 | (.05) | .27 | (.39) | — | (.39) | 6.88 | 3.95 | 2,661,444 | .73 | 4.64 | 580 |
a Per share net investment income (loss) has been determined on the basis of the weighted average number of shares outstanding during the period.
b Total return assumes dividend reinvestment and does not reflect the effect of sales charges.
c Includes amounts paid through expense offset and/or brokerage/service arrangements, if any (Note 2). Also excludes acquired fund fees and expenses, if any.
d Portfolio turnover includes TBA purchase and sale commitments.
e The net investment income ratio and per share amount shown for the period ending may not correspond with the expected class differences for the period due to the timing of subscriptions into the class or redemptions out of the class.
The accompanying notes are an integral part of these financial statements.
| |
| 102 Diversified Income Trust | Diversified Income Trust 103 |
Notes to financial statements 9/30/22
Within the following Notes to financial statements, references to “State Street” represent State Street Bank and Trust Company, references to “the SEC” represent the Securities and Exchange Commission, references to “Putnam Management” represent Putnam Investment Management, LLC, the fund’s manager, an indirect wholly-owned subsidiary of Putnam Investments, LLC and references to “OTC”, if any, represent over-the-counter. Unless otherwise noted, the “reporting period” represents the period from October 1, 2021 through September 30, 2022.
Putnam Diversified Income Trust (the fund) is a Massachusetts business trust, which is registered under the Investment Company Act of 1940, as amended, as a diversified open-end management investment company. The goal of the fund is to seek as high a level of current income as Putnam Management believes is consistent with preservation of capital. The fund invests mainly in bonds that are securitized debt instruments (such as mortgage-backed investments) and other obligations of companies and governments worldwide, are either investment-grade or below-investment-grade in quality (sometimes referred to as “junk bonds”) and have intermediate- to long-term maturities (three years or longer). The fund currently has significant investment exposure to residential and commercial mortgage-backed securities. Putnam Management may consider, among other factors, credit, interest rate and prepayment risks, as well as general market conditions, when deciding whether to buy or sell investments. The fund typically uses to a significant extent derivatives, such as futures, options, certain foreign currency transactions and swap contracts, for both hedging and non-hedging purposes.
The fund offers the following share classes. The expenses for each class of shares may differ based on the distribution and investor servicing fees of each class, which are identified in Note 2.
| | | |
| Share class | Sales charge | Contingent deferred sales charge | Conversion feature |
| | | 1.00% on certain redemptions of shares | |
| Class A | Up to 4.00% | bought with no initial sales charge | None |
| | | | Converts to class A shares |
| Class B* | None | 5.00% phased out over six years | after 8 years |
| | | | Converts to class A shares |
| Class C | None | 1.00% eliminated after one year | after 8 years |
| Class M† | Up to 3.25% | None | None |
| Class R† | None | None | None |
| Class R6† | None | None | None |
| Class Y† | None | None | None |
* Purchases of class B shares are closed to new and existing investors except by exchange from class B shares of another Putnam fund or through dividend and/or capital gains reinvestment.
† Not available to all investors.
In the normal course of business, the fund enters into contracts that may include agreements to indemnify another party under given circumstances. The fund’s maximum exposure under these arrangements is unknown as this would involve future claims that may be, but have not yet been, made against the fund. However, the fund’s management team expects the risk of material loss to be remote.
The fund has entered into contractual arrangements with an investment adviser, administrator, distributor, shareholder servicing agent and custodian, who each provide services to the fund. Unless expressly stated otherwise, shareholders are not parties to, or intended beneficiaries of these contractual arrangements, and these contractual arrangements are not intended to create any shareholder right to enforce them against the service providers or to seek any remedy under them against the service providers, either directly or on behalf of the fund.
Under the fund’s Amended and Restated Agreement and Declaration of Trust, any claims asserted against or on behalf of the Putnam Funds, including claims against Trustees and Officers, must be brought in state and federal courts located within the Commonwealth of Massachusetts.
Note 1: Significant accounting policies
The following is a summary of significant accounting policies consistently followed by the fund in the preparation of its financial statements. The preparation of financial statements is in conformity with accounting principles generally accepted in the United States of America and requires management to make estimates
|
| 104 Diversified Income Trust |
and assumptions that affect the reported amounts of assets and liabilities in the financial statements and the reported amounts of increases and decreases in net assets from operations. Actual results could differ from those estimates. Subsequent events after the Statement of assets and liabilities date through the date that the financial statements were issued have been evaluated in the preparation of the financial statements.
Investment income, realized and unrealized gains and losses and expenses of the fund are borne pro-rata based on the relative net assets of each class to the total net assets of the fund, except that each class bears expenses unique to that class (including the distribution fees applicable to such classes). Each class votes as a class only with respect to its own distribution plan or other matters on which a class vote is required by law or determined by the Trustees. If the fund were liquidated, shares of each class would receive their pro-rata share of the net assets of the fund. In addition, the Trustees declare separate dividends on each class of shares.
Security valuation Portfolio securities and other investments are valued using policies and procedures adopted by the Board of Trustees. The Trustees have formed a Pricing Committee to oversee the implementation of these procedures and have delegated responsibility for valuing the fund’s assets in accordance with these procedures to Putnam Management. Putnam Management has established an internal Valuation Committee that is responsible for making fair value determinations, evaluating the effectiveness of the pricing policies of the fund and reporting to the Pricing Committee.
Investments for which market quotations are readily available are valued at the last reported sales price on their principal exchange, or official closing price for certain markets, and are classified as Level 1 securities under Accounting Standards Codification 820 Fair Value Measurements and Disclosures (ASC 820). If no sales are reported, as in the case of some securities that are traded OTC, a security is valued at its last reported bid price and is generally categorized as a Level 2 security.
Investments in open-end investment companies (excluding exchange-traded funds), if any, which can be classified as Level 1 or Level 2 securities, are valued based on their net asset value. The net asset value of such investment companies equals the total value of their assets less their liabilities and divided by the number of their outstanding shares.
Market quotations are not considered to be readily available for certain debt obligations (including short-term investments with remaining maturities of 60 days or less) and other investments; such investments are valued on the basis of valuations furnished by an independent pricing service approved by the Trustees or dealers selected by Putnam Management. Such services or dealers determine valuations for normal institutional-size trading units of such securities using methods based on market transactions for comparable securities and various relationships, generally recognized by institutional traders, between securities (which consider such factors as security prices, yields, maturities and ratings). These securities will generally be categorized as Level 2.
Many securities markets and exchanges outside the U.S. close prior to the scheduled close of the New York Stock Exchange and therefore the closing prices for securities in such markets or on such exchanges may not fully reflect events that occur after such close but before the scheduled close of the New York Stock Exchange. Accordingly, on certain days, the fund will fair value certain foreign equity securities taking into account multiple factors including movements in the U.S. securities markets, currency valuations and comparisons to the valuation of American Depository Receipts, exchange-traded funds and futures contracts. The foreign equity securities, which would generally be classified as Level 1 securities, will be transferred to Level 2 of the fair value hierarchy when they are valued at fair value. The number of days on which fair value prices will be used will depend on market activity and it is possible that fair value prices will be used by the fund to a significant extent. Securities quoted in foreign currencies, if any, are translated into U.S. dollars at the current exchange rate.
To the extent a pricing service or dealer is unable to value a security or provides a valuation that Putnam Management does not believe accurately reflects the security’s fair value, the security will be valued at fair value by Putnam Management in accordance with policies and procedures approved by the Trustees. Certain investments, including certain restricted and illiquid securities and derivatives, are also valued at fair value following procedures approved by the Trustees. These valuations consider such factors as significant market or specific security events such as interest rate or credit quality changes, various relationships with other securities, discount rates, U.S. Treasury, U.S. swap and credit yields, index levels, convexity exposures, recovery rates, sales and other multiples and resale restrictions. These securities are classified as Level 2 or as Level 3 depending on the priority of the significant inputs.
To assess the continuing appropriateness of fair valuations, the Valuation Committee reviews and affirms the reasonableness of such valuations on a regular basis after considering all relevant information that is reasonably available. Such valuations and procedures are reviewed periodically by the Trustees. Certain securities may be
|
| Diversified Income Trust 105 |
valued on the basis of a price provided by a single source. The fair value of securities is generally determined as the amount that the fund could reasonably expect to realize from an orderly disposition of such securities over a reasonable period of time. By its nature, a fair value price is a good faith estimate of the value of a security in a current sale and does not reflect an actual market price, which may be different by a material amount.
Joint trading account Pursuant to an exemptive order from the SEC, the fund may transfer uninvested cash balances into a joint trading account along with the cash of other registered investment companies and certain other accounts managed by Putnam Management. These balances may be invested in issues of short-term investments having maturities of up to 90 days.
Repurchase agreements The fund, or any joint trading account, through its custodian, receives delivery of the underlying securities, the fair value of which at the time of purchase is required to be in an amount at least equal to the resale price, including accrued interest. Collateral for certain tri-party repurchase agreements is held at the counterparty’s custodian in a segregated account for the benefit of the fund and the counterparty. Putnam Management is responsible for determining that the value of these underlying securities is at all times at least equal to the resale price, including accrued interest. In the event of default or bankruptcy by the other party to the agreement, retention of the collateral may be subject to legal proceedings.
Security transactions and related investment income Security transactions are recorded on the trade date (the date the order to buy or sell is executed). Gains or losses on securities sold are determined on the identified cost basis.
Interest income, net of any applicable withholding taxes, if any, and including amortization and accretion of premiums and discounts on debt securities, is recorded on the accrual basis.
The fund may have earned certain fees in connection with its senior loan purchasing activities. These fees, if any, are treated as market discount and are amortized into income in the Statement of operations.
Stripped securities The fund may invest in stripped securities which represent a participation in securities that may be structured in classes with rights to receive different portions of the interest and principal. Interest-only securities receive all of the interest and principal-only securities receive all of the principal. If the interest-only securities experience greater than anticipated prepayments of principal, the fund may fail to recoup fully its initial investment in these securities. Conversely, principal-only securities increase in value if prepayments are greater than anticipated and decline if prepayments are slower than anticipated. The fair value of these securities is highly sensitive to changes in interest rates.
Foreign currency translation The accounting records of the fund are maintained in U.S. dollars. The fair value of foreign securities, currency holdings, and other assets and liabilities is recorded in the books and records of the fund after translation to U.S. dollars based on the exchange rates on that day. The cost of each security is determined using historical exchange rates. Income and withholding taxes are translated at prevailing exchange rates when earned or incurred. The fund does not isolate that portion of realized or unrealized gains or losses resulting from changes in the foreign exchange rate on investments from fluctuations arising from changes in the market prices of the securities. Such gains and losses are included with the net realized and unrealized gain or loss on investments. Net realized gains and losses on foreign currency transactions represent net realized exchange gains or losses on disposition of foreign currencies, currency gains and losses realized between the trade and settlement dates on securities transactions and the difference between the amount of investment income and foreign withholding taxes recorded on the fund’s books and the U.S. dollar equivalent amounts actually received or paid. Net unrealized appreciation and depreciation of assets and liabilities in foreign currencies arise from changes in the value of assets and liabilities other than investments at the period end, resulting from changes in the exchange rate.
Options contracts The fund uses options contracts to hedge duration and convexity, to isolate prepayment risk and to manage downside risks.
The potential risk to the fund is that the change in value of options contracts may not correspond to the change in value of the hedged instruments. In addition, losses may arise from changes in the value of the underlying instruments if there is an illiquid secondary market for the contracts, if interest or exchange rates move unexpectedly or if the counterparty to the contract is unable to perform. Realized gains and losses on purchased options are included in realized gains and losses on investment securities. If a written call option is exercised, the premium originally received is recorded as an addition to sales proceeds. If a written put option is exercised, the premium originally received is recorded as a reduction to the cost of investments.
|
| 106 Diversified Income Trust |
Exchange-traded options are valued at the last sale price or, if no sales are reported, the last bid price for purchased options and the last ask price for written options. OTC traded options are valued using prices supplied by dealers.
Options on swaps are similar to options on securities except that the premium paid or received is to buy or grant the right to enter into a previously agreed upon interest rate or credit default contract. Forward premium swap option contracts include premiums that have extended settlement dates. The delayed settlement of the premiums is factored into the daily valuation of the option contracts. In the case of interest rate cap and floor contracts, in return for a premium, ongoing payments between two parties are based on interest rates exceeding a specified rate, in the case of a cap contract, or falling below a specified rate in the case of a floor contract.
Written option contracts outstanding at period end, if any, are listed after the fund’s portfolio.
Futures contracts The fund uses futures contracts for hedging treasury term structure risk and for yield curve positioning.
The potential risk to the fund is that the change in value of futures contracts may not correspond to the change in value of the hedged instruments. In addition, losses may arise from changes in the value of the underlying instruments, if there is an illiquid secondary market for the contracts, if interest or exchange rates move unexpectedly or if the counterparty to the contract is unable to perform. With futures, there is minimal counterparty credit risk to the fund since futures are exchange traded and the exchange’s clearinghouse, as counterparty to all exchange traded futures, guarantees the futures against default. Risks may exceed amounts recognized on the Statement of assets and liabilities. When the contract is closed, the fund records a realized gain or loss equal to the difference between the value of the contract at the time it was opened and the value at the time it was closed.
Futures contracts are valued at the quoted daily settlement prices established by the exchange on which they trade. The fund and the broker agree to exchange an amount of cash equal to the daily fluctuation in the value of the futures contract. Such receipts or payments are known as “variation margin.”
Futures contracts outstanding at period end, if any, are listed after the fund’s portfolio.
Forward currency contracts The fund buys and sells forward currency contracts, which are agreements between two parties to buy and sell currencies at a set price on a future date. These contracts are used for hedging currency exposures and to gain exposure to currencies.
The U.S. dollar value of forward currency contracts is determined using current forward currency exchange rates supplied by a quotation service. The fair value of the contract will fluctuate with changes in currency exchange rates. The contract is marked to market daily and the change in fair value is recorded as an unrealized gain or loss. The fund records a realized gain or loss equal to the difference between the value of the contract at the time it was opened and the value at the time it was closed when the contract matures or by delivery of the currency. The fund could be exposed to risk if the value of the currency changes unfavorably, if the counterparties to the contracts are unable to meet the terms of their contracts or if the fund is unable to enter into a closing position. Risks may exceed amounts recognized on the Statement of assets and liabilities.
Forward currency contracts outstanding at period end, if any, are listed after the fund’s portfolio.
Interest rate swap contracts The fund entered into OTC and/or centrally cleared interest rate swap contracts, which are arrangements between two parties to exchange cash flows based on a notional principal amount, for hedging term structure risk, for yield curve positioning and for gaining exposure to rates in various countries.
An OTC and centrally cleared interest rate swap can be purchased or sold with an upfront premium. For OTC interest rate swap contracts, an upfront payment received by the fund is recorded as a liability on the fund’s books. An upfront payment made by the fund is recorded as an asset on the fund’s books. OTC and centrally cleared interest rate swap contracts are marked to market daily based upon quotations from an independent pricing service or market makers. Any change is recorded as an unrealized gain or loss on OTC interest rate swaps. Daily fluctuations in the value of centrally cleared interest rate swaps are settled through a central clearing agent and are recorded in variation margin on the Statement of assets and liabilities and recorded as unrealized gain or loss. Payments, including upfront premiums, received or made are recorded as realized gains or losses at the reset date or the closing of the contract. Certain OTC and centrally cleared interest rate swap contracts may include extended effective dates. Payments related to these swap contracts are accrued based on the terms of the contract.
|
| Diversified Income Trust 107 |
The fund could be exposed to credit or market risk due to unfavorable changes in the fluctuation of interest rates or if the counterparty defaults, in the case of OTC interest rate contracts, or the central clearing agency or a clearing member defaults, in the case of centrally cleared interest rate swap contracts, on its respective obligation to perform under the contract. The fund’s maximum risk of loss from counterparty risk or central clearing risk is the fair value of the contract. This risk may be mitigated for OTC interest rate swap contracts by having a master netting arrangement between the fund and the counterparty and for centrally cleared interest rate swap contracts through the daily exchange of variation margin. There is minimal counterparty risk with respect to centrally cleared interest rate swap contracts due to the clearinghouse guarantee fund and other resources that are available in the event of a clearing member default. Risk of loss may exceed amounts recognized on the Statement of assets and liabilities.
OTC and centrally cleared interest rate swap contracts outstanding, including their respective notional amounts at period end, if any, are listed after the fund’s portfolio.
Total return swap contracts The fund entered into OTC and/or centrally cleared total return swap contracts, which are arrangements to exchange a market-linked return for a periodic payment, both based on a notional principal amount, to hedge sector exposure, for gaining exposure to specific sectors, for hedging inflation and for gaining exposure to inflation.
To the extent that the total return of the security, index or other financial measure underlying the transaction exceeds or falls short of the offsetting interest rate obligation, the fund will receive a payment from or make a payment to the counterparty. OTC and/or centrally cleared total return swap contracts are marked to market daily based upon quotations from an independent pricing service or market maker. Any change is recorded as an unrealized gain or loss on OTC total return swaps. Daily fluctuations in the value of centrally cleared total return swaps are settled through a central clearing agent and are recorded in variation margin on the Statement of assets and liabilities and recorded as unrealized gain or loss. Payments received or made are recorded as realized gains or losses. Certain OTC and/or centrally cleared total return swap contracts may include extended effective dates. Payments related to these swap contracts are accrued based on the terms of the contract. The fund could be exposed to credit or market risk due to unfavorable changes in the fluctuation of interest rates or in the price of the underlying security or index, the possibility that there is no liquid market for these agreements or that the counterparty may default on its obligation to perform. The fund’s maximum risk of loss from counterparty risk or central clearing risk is the fair value of the contract. This risk may be mitigated for OTC total return swap contracts by having a master netting arrangement between the fund and the counterparty and for centrally cleared total return swap contracts through the daily exchange of variation margin. There is minimal counterparty risk with respect to centrally cleared total return swap contracts due to the clearinghouse guarantee fund and other resources that are available in the event of a clearing member default. Risk of loss may exceed amounts recognized on the Statement of assets and liabilities.
OTC and/or centrally cleared total return swap contracts outstanding, including their respective notional amounts at period end, if any, are listed after the fund’s portfolio.
Credit default contracts The fund entered into OTC and/or centrally cleared credit default contracts to hedge credit risk, for gaining liquid exposure to individual names, to hedge market risk and for gaining exposure to specific sectors.
In OTC and centrally cleared credit default contracts, the protection buyer typically makes a periodic stream of payments to a counterparty, the protection seller, in exchange for the right to receive a contingent payment upon the occurrence of a credit event on the reference obligation or all other equally ranked obligations of the reference entity. Credit events are contract specific but may include bankruptcy, failure to pay, restructuring and obligation acceleration. For OTC credit default contracts, an upfront payment received by the fund is recorded as a liability on the fund’s books. An upfront payment made by the fund is recorded as an asset on the fund’s books. Centrally cleared credit default contracts provide the same rights to the protection buyer and seller except the payments between parties, including upfront premiums, are settled through a central clearing agent through variation margin payments. Upfront and periodic payments received or paid by the fund for OTC and centrally cleared credit default contracts are recorded as realized gains or losses at the reset date or close of the contract. The OTC and centrally cleared credit default contracts are marked to market daily based upon quotations from an independent pricing service or market makers. Any change in value of OTC credit default contracts is recorded as an unrealized gain or loss. Daily fluctuations in the value of centrally cleared credit default contracts are recorded in variation margin on the Statement of assets and liabilities and recorded as unrealized gain or loss. Upon the occurrence of a credit event, the difference between the par value and fair value of the reference obligation, net of any proportional amount of the upfront payment, is recorded as a realized gain or loss.
|
| 108 Diversified Income Trust |
In addition to bearing the risk that the credit event will occur, the fund could be exposed to market risk due to unfavorable changes in interest rates or in the price of the underlying security or index or the possibility that the fund may be unable to close out its position at the same time or at the same price as if it had purchased the underlying reference obligations. In certain circumstances, the fund may enter into offsetting OTC and centrally cleared credit default contracts which would mitigate its risk of loss. Risks of loss may exceed amounts recognized on the Statement of assets and liabilities. The fund’s maximum risk of loss from counterparty risk, either as the protection seller or as the protection buyer, is the fair value of the contract. This risk may be mitigated for OTC credit default contracts by having a master netting arrangement between the fund and the counterparty and for centrally cleared credit default contracts through the daily exchange of variation margin. Counterparty risk is further mitigated with respect to centrally cleared credit default swap contracts due to the clearinghouse guarantee fund and other resources that are available in the event of a clearing member default. Where the fund is a seller of protection, the maximum potential amount of future payments the fund may be required to make is equal to the notional amount.
OTC and centrally cleared credit default contracts outstanding, including their respective notional amounts at period end, if any, are listed after the fund’s portfolio.
TBA commitments The fund may enter into TBA (to be announced) commitments to purchase securities for a fixed unit price at a future date beyond customary settlement time. Although the unit price and par amount have been established, the actual securities have not been specified. However, it is anticipated that the amount of the commitments will not significantly differ from the principal amount. The fund holds, and maintains until settlement date, cash or high-grade debt obligations in an amount sufficient to meet the purchase price, or the fund may enter into offsetting contracts for the forward sale of other securities it owns. Income on the securities will not be earned until settlement date.
The fund may also enter into TBA sale commitments to hedge its portfolio positions, to sell mortgage-backed securities it owns under delayed delivery arrangements or to take a short position in mortgage-backed securities. Proceeds of TBA sale commitments are not received until the contractual settlement date. During the time a TBA sale commitment is outstanding, either equivalent deliverable securities or an offsetting TBA purchase commitment deliverable on or before the sale commitment date are held as “cover” for the transaction, or other liquid assets in an amount equal to the notional value of the TBA sale commitment are segregated. If the TBA sale commitment is closed through the acquisition of an offsetting TBA purchase commitment, the fund realizes a gain or loss. If the fund delivers securities under the commitment, the fund realizes a gain or a loss from the sale of the securities based upon the unit price established at the date the commitment was entered into.
TBA commitments, which are accounted for as purchase and sale transactions, may be considered securities themselves, and involve a risk of loss due to changes in the value of the security prior to the settlement date as well as the risk that the counterparty to the transaction will not perform its obligations. Counterparty risk is mitigated by having a master agreement between the fund and the counterparty.
Unsettled TBA commitments are valued at their fair value according to the procedures described under “Security valuation” above. The contract is marked to market daily and the change in fair value is recorded by the fund as an unrealized gain or loss. Based on market circumstances, Putnam Management will determine whether to take delivery of the underlying securities or to dispose of the TBA commitments prior to settlement.
TBA purchase commitments outstanding at period end, if any, are listed within the fund’s portfolio and TBA sale commitments outstanding at period end, if any, are listed after the fund’s portfolio.
Master agreements The fund is a party to ISDA (International Swaps and Derivatives Association, Inc.) Master Agreements that govern OTC derivative and foreign exchange contracts and Master Securities Forward Transaction Agreements that govern transactions involving mortgage-backed and other asset-backed securities that may result in delayed delivery (Master Agreements) with certain counterparties entered into from time to time. The Master Agreements may contain provisions regarding, among other things, the parties’ general obligations, representations, agreements, collateral requirements, events of default and early termination. With respect to certain counterparties, in accordance with the terms of the Master Agreements, collateral pledged to the fund is held in a segregated account by the fund’s custodian and, with respect to those amounts which can be sold or repledged, are presented in the fund’s portfolio.
Collateral pledged by the fund is segregated by the fund’s custodian and identified in the fund’s portfolio. Collateral can be in the form of cash or debt securities issued by the U.S. Government or related agencies or other securities as agreed to by the fund and the applicable counterparty. Collateral requirements are determined based on the fund’s net position with each counterparty.
|
| Diversified Income Trust 109 |
With respect to ISDA Master Agreements, termination events applicable to the fund may occur upon a decline in the fund’s net assets below a specified threshold over a certain period of time. Termination events applicable to counterparties may occur upon a decline in the counterparty’s long-term or short-term credit ratings below a specified level. In each case, upon occurrence, the other party may elect to terminate early and cause settlement of all derivative and foreign exchange contracts outstanding, including the payment of any losses and costs resulting from such early termination, as reasonably determined by the terminating party. Any decision by one or more of the fund’s counterparties to elect early termination could impact the fund’s future derivative activity.
At the close of the reporting period, the fund had a net liability position of $112,604,133 on open derivative contracts subject to the Master Agreements. Collateral pledged by the fund at period end for these agreements totaled $112,025,033 and may include amounts related to unsettled agreements.
Interfund lending The fund, along with other Putnam funds, may participate in an interfund lending program pursuant to an exemptive order issued by the SEC. This program allows the fund to borrow from or lend to other Putnam funds that permit such transactions. Interfund lending transactions are subject to each fund’s investment policies and borrowing and lending limits. Interest earned or paid on the interfund lending transaction will be based on the average of certain current market rates. During the reporting period, the fund did not utilize the program.
Lines of credit The fund participates, along with other Putnam funds, in a $100 million ($317.5 million prior to October 14, 2022) unsecured committed line of credit and a $235.5 million unsecured uncommitted line of credit, both provided by State Street. Borrowings may be made for temporary or emergency purposes, including the funding of shareholder redemption requests and trade settlements. Interest is charged to the fund based on the fund’s borrowing at a rate equal to 1.25% plus the higher of (1) the Federal Funds rate and (2) the Overnight Bank Funding Rate for the committed line of credit and 1.30% plus the higher of (1) the Federal Funds rate and (2) the Overnight Bank Funding Rate for the uncommitted line of credit. A closing fee equal to 0.04% of the committed line of credit and 0.04% of the uncommitted line of credit has been paid by the participating funds. In addition, a commitment fee of 0.21% per annum on any unutilized portion of the committed line of credit is allocated to the participating funds based on their relative net assets and paid quarterly. During the reporting period, the fund had no borrowings against these arrangements.
Federal taxes It is the policy of the fund to distribute all of its taxable income within the prescribed time period and otherwise comply with the provisions of the Internal Revenue Code of 1986, as amended (the Code), applicable to regulated investment companies. It is also the intention of the fund to distribute an amount sufficient to avoid imposition of any excise tax under Section 4982 of the Code.
The fund is subject to the provisions of Accounting Standards Codification 740 Income Taxes (ASC 740). ASC 740 sets forth a minimum threshold for financial statement recognition of the benefit of a tax position taken or expected to be taken in a tax return. The fund did not have a liability to record for any unrecognized tax benefits in the accompanying financial statements. No provision has been made for federal taxes on income, capital gains or unrealized appreciation on securities held nor for excise tax on income and capital gains. Each of the fund’s federal tax returns for the prior three fiscal years remains subject to examination by the Internal Revenue Service.
The fund may also be subject to taxes imposed by governments of countries in which it invests. Such taxes are generally based on either income or gains earned or repatriated. The fund accrues and applies such taxes to net investment income, net realized gains and net unrealized gains as income and/or capital gains are earned. In some cases, the fund may be entitled to reclaim all or a portion of such taxes, and such reclaim amounts, if any, are reflected as an asset on the fund’s books. In many cases, however, the fund may not receive such amounts for an extended period of time, depending on the country of investment.
Under the Regulated Investment Company Modernization Act of 2010, the fund will be permitted to carry forward capital losses incurred for an unlimited period and the carry forwards will retain their character as either short-term or long-term capital losses. At September 30, 2022, the fund had the following capital loss carryovers available, to the extent allowed by the Code, to offset future net capital gain, if any:
| | |
| | Loss carryover | |
| Short-term | Long-term | Total |
| $775,289,500 | $397,773,166 | $1,173,062,666 |
|
| 110 Diversified Income Trust |
Distributions to shareholders Distributions to shareholders from net investment income are recorded by the fund on the ex-dividend date. Distributions from capital gains, if any, are recorded on the ex-dividend date and paid at least annually. The amount and character of income and gains to be distributed are determined in accordance with income tax regulations, which may differ from generally accepted accounting principles. These differences include temporary and/or permanent differences from losses on wash sale transactions, from foreign currency gains and losses, from defaulted bond interest, from income on swap contracts, from interest-only securities and from litigation and/or restitution payments. Reclassifications are made to the fund’s capital accounts to reflect income and gains available for distribution (or available capital loss carryovers) under income tax regulations. At the close of the reporting period, the fund reclassified $20,452,646 to increase undistributed net investment income, $97,158 to increase paid-in capital and $20,549,804 to increase accumulated net realized loss.
Tax cost of investments includes adjustments to net unrealized appreciation (depreciation) which may not necessarily be final tax cost basis adjustments, but closely approximate the tax basis unrealized gains and losses that may be realized and distributed to shareholders. The tax basis components of distributable earnings and the federal tax cost as of the close of the reporting period were as follows:
| |
| Unrealized appreciation | $617,044,128 |
| Unrealized depreciation | (1,190,947,531) |
| Net unrealized depreciation | (573,903,403) |
| Undistributed ordinary income | 95,607,011 |
| Capital loss carryforward | (1,173,062,666) |
| Cost for federal income tax purposes | $3,047,749,808 |
Note 2: Management fee, administrative services and other transactions
The fund pays Putnam Management a management fee (based on the fund’s average net assets and computed and paid monthly) at annual rates that may vary based on the average of the aggregate net assets of all open-end mutual funds sponsored by Putnam Management (excluding net assets of funds that are invested in, or that are invested in by, other Putnam funds to the extent necessary to avoid “double counting” of those assets). Such annual rates may vary as follows:
| | | | |
| 0.700% | of the first $5 billion, | | 0.500% | of the next $50 billion, |
| 0.650% | of the next $5 billion, | | 0.480% | of the next $50 billion, |
| 0.600% | of the next $10 billion, | | 0.470% | of the next $100 billion and |
| 0.550% | of the next $10 billion, | | 0.465% | of any excess thereafter. |
For the reporting period, the management fee represented an effective rate (excluding the impact from any expense waivers in effect) of 0.535% of the fund’s average net assets.
Putnam Management has contractually agreed, through January 30, 2024, to waive fees and/or reimburse the fund’s expenses to the extent necessary to limit the cumulative expenses of the fund, exclusive of brokerage, interest, taxes, investment-related expenses, extraordinary expenses, acquired fund fees and expenses and payments under the fund’s investor servicing contract, investment management contract and distribution plans, on a fiscal year-to-date basis to an annual rate of 0.20% of the fund’s average net assets over such fiscal year-to-date period. During the reporting period, the fund’s expenses were not reduced as a result of this limit.
Putnam Investments Limited (PIL), an affiliate of Putnam Management, is authorized by the Trustees to manage a separate portion of the assets of the fund as determined by Putnam Management from time to time. Putnam Management pays a quarterly sub-management fee to PIL for its services at an annual rate of 0.20% (prior to July 1, 2022, the annual rate was 0.40%) of the average net assets of the portion of the fund managed by PIL.
Putnam Management voluntarily reimbursed the fund $763,493 for a trading error which occurred during the reporting period. The effect of the loss incurred and the reimbursement by Putnam Management of such amounts had no material impact on total return.
The fund reimburses Putnam Management an allocated amount for the compensation and related expenses of certain officers of the fund and their staff who provide administrative services to the fund. The aggregate amount of all such reimbursements is determined annually by the Trustees.
|
| Diversified Income Trust 111 |
Custodial functions for the fund’s assets are provided by State Street. Custody fees are based on the fund’s asset level, the number of its security holdings and transaction volumes.
Putnam Investor Services, Inc., an affiliate of Putnam Management, provides investor servicing agent functions to the fund. Putnam Investor Services, Inc. received fees for investor servicing for class A, class B, class C, class M, class R and class Y shares that included (1) a per account fee for each direct and underlying non-defined contribution account (retail account) of the fund; (2) a specified rate of the fund’s assets attributable to defined contribution plan accounts; and (3) a specified rate based on the average net assets in retail accounts. Putnam Investor Services, Inc. has agreed that the aggregate investor servicing fees for each fund’s retail and defined contribution accounts for these share classes will not exceed an annual rate of 0.25% of the fund’s average assets attributable to such accounts.
Class R6 shares paid a monthly fee based on the average net assets of class R6 shares at an annual rate of 0.05%.
During the reporting period, the expenses for each class of shares related to investor servicing fees were as follows:
| | | | |
| Class A | $1,081,887 | | Class R | 3,057 |
| Class B | 8,415 | | Class R6 | 14,404 |
| Class C | 242,360 | | Class Y | 1,476,961 |
| Class M | 107,192 | | Total | $2,934,276 |
The fund has entered into expense offset arrangements with Putnam Investor Services, Inc. and State Street whereby Putnam Investor Services, Inc.’s and State Street’s fees are reduced by credits allowed on cash balances. For the reporting period, the fund’s expenses were reduced by $4,772 under the expense offset arrangements.
Each Independent Trustee of the fund receives an annual Trustee fee, of which $1,468, as a quarterly retainer, has been allocated to the fund, and an additional fee for each Trustees meeting attended. Trustees also are reimbursed for expenses they incur relating to their services as Trustees.
The fund has adopted a Trustee Fee Deferral Plan (the Deferral Plan) which allows the Trustees to defer the receipt of all or a portion of Trustees fees payable on or after July 1, 1995. The deferred fees remain invested in certain Putnam funds until distribution in accordance with the Deferral Plan.
The fund has adopted an unfunded noncontributory defined benefit pension plan (the Pension Plan) covering all Trustees of the fund who have served as a Trustee for at least five years and were first elected prior to 2004. Benefits under the Pension Plan are equal to 50% of the Trustee’s average annual attendance and retainer fees for the three years ended December 31, 2005. The retirement benefit is payable during a Trustee’s lifetime, beginning the year following retirement, for the number of years of service through December 31, 2006. Pension expense for the fund is included in Trustee compensation and expenses in the Statement of operations. Accrued pension liability is included in Payable for Trustee compensation and expenses in the Statement of assets and liabilities. The Trustees have terminated the Pension Plan with respect to any Trustee first elected after 2003.
The fund has adopted distribution plans (the Plans) with respect to the following share classes pursuant to Rule 12b–1 under the Investment Company Act of 1940. The purpose of the Plans is to compensate Putnam Retail Management Limited Partnership, an indirect wholly-owned subsidiary of Putnam Investments, LLC, for services provided and expenses incurred in distributing shares of the fund. The Plans provide payments by the fund to Putnam Retail Management Limited Partnership at an annual rate of up to the following amounts (Maximum %) of the average net assets attributable to each class. The Trustees have approved payment by the fund at the following annual rate (Approved %) of the average net assets attributable to each class. During the reporting period, the class-specific expenses related to distribution fees were as follows:
| | | |
| | Maximum % | Approved % | Amount |
| Class A | 0.35% | 0.25% | $1,757,276 |
| Class B | 1.00% | 1.00% | 54,952 |
| Class C | 1.00% | 1.00% | 1,580,688 |
| Class M | 1.00% | 0.50% | 348,269 |
| Class R | 1.00% | 0.50% | 9,922 |
| Total | | | $3,751,107 |
|
| 112 Diversified Income Trust |
For the reporting period, Putnam Retail Management Limited Partnership, acting as underwriter, received net commissions of $24,518 and no monies from the sale of class A and class M shares, respectively, and received $269 and $603 in contingent deferred sales charges from redemptions of class B and class C shares, respectively.
A deferred sales charge of up to 1.00% is assessed on certain redemptions of class A shares. For the reporting period, Putnam Retail Management Limited Partnership, acting as underwriter, received $55 on class A redemptions.
Note 3: Purchases and sales of securities
During the reporting period, the cost of purchases and the proceeds from sales, excluding short-term investments, were as follows:
| | |
| | Cost of purchases | Proceeds from sales |
| Investments in securities, including TBA commitments (Long-term) | $23,760,688,107 | $24,065,672,494 |
| U.S. government securities (Long-term) | — | — |
| Total | $23,760,688,107 | $24,065,672,494 |
The fund may purchase or sell investments from or to other Putnam funds in the ordinary course of business, which can reduce the fund’s transaction costs, at prices determined in accordance with SEC requirements and policies approved by the Trustees. During the reporting period, purchases or sales of long-term securities from or to other Putnam funds, if any, did not represent more than 5% of the fund’s total cost of purchases and/or total proceeds from sales.
Note 4: Capital shares
At the close of the reporting period, there were an unlimited number of shares of beneficial interest authorized. Transactions, including, if applicable, direct exchanges pursuant to share conversions, in capital shares were as follows:
| | | | |
| | YEAR ENDED 9/30/22 | YEAR ENDED 9/30/21 |
| Class A | Shares | Amount | Shares | Amount |
| Shares sold | 13,190,640 | $79,686,427 | 22,816,622 | $153,529,073 |
| Shares issued in connection with | | | | |
| reinvestment of distributions | 4,140,396 | 24,877,407 | 4,078,828 | 27,220,249 |
| | 17,331,036 | 104,563,834 | 26,895,450 | 180,749,322 |
| Shares repurchased | (34,443,062) | (209,188,297) | (37,245,609) | (248,475,852) |
| Net decrease | (17,112,026) | $(104,624,463) | (10,350,159) | $(67,726,530) |
| |
| | YEAR ENDED 9/30/22 | YEAR ENDED 9/30/21 |
| Class B | Shares | Amount | Shares | Amount |
| Shares sold | 9,117 | $54,597 | 8,742 | $58,148 |
| Shares issued in connection with | | | | |
| reinvestment of distributions | 27,353 | 162,901 | 40,943 | 270,144 |
| | 36,470 | 217,498 | 49,685 | 328,292 |
| Shares repurchased | (641,757) | (3,854,520) | (828,600) | (5,463,049) |
| Net decrease | (605,287) | $(3,637,022) | (778,915) | $(5,134,757) |
|
| Diversified Income Trust 113 |
| | | | |
| | YEAR ENDED 9/30/22 | YEAR ENDED 9/30/21 |
| Class C | Shares | Amount | Shares | Amount |
| Shares sold | 744,597 | $4,431,252 | 2,452,912 | $16,126,866 |
| Shares issued in connection with | | | | |
| reinvestment of distributions | 771,774 | 4,545,649 | 1,061,390 | 6,935,302 |
| | 1,516,371 | 8,976,901 | 3,514,302 | 23,062,168 |
| Shares repurchased | (15,314,559) | (91,107,398) | (20,209,637) | (132,680,636) |
| Net decrease | (13,798,188) | $(82,130,497) | (16,695,335) | $(109,618,468) |
| |
| | YEAR ENDED 9/30/22 | YEAR ENDED 9/30/21 |
| Class M | Shares | Amount | Shares | Amount |
| Shares sold | — | $— | — | $— |
| Shares issued in connection with | | | | |
| reinvestment of distributions | — | — | — | — |
| | — | — | — | — |
| Shares repurchased | (1,531,890) | (8,966,080) | (1,145,077) | (7,492,113) |
| Net decrease | (1,531,890) | $(8,966,080) | (1,145,077) | $(7,492,113) |
| |
| | YEAR ENDED 9/30/22 | YEAR ENDED 9/30/21 |
| Class R | Shares | Amount | Shares | Amount |
| Shares sold | 20,606 | $122,551 | 87,795 | $583,083 |
| Shares issued in connection with | | | | |
| reinvestment of distributions | 12,371 | 73,007 | 10,855 | 71,314 |
| | 32,977 | 195,558 | 98,650 | 654,397 |
| Shares repurchased | (30,420) | (182,293) | (96,141) | (644,060) |
| Net increase | 2,557 | $13,265 | 2,509 | $10,337 |
| |
| | YEAR ENDED 9/30/22 | YEAR ENDED 9/30/21 |
| Class R6 | Shares | Amount | Shares | Amount |
| Shares sold | 2,965,288 | $18,039,717 | 1,220,574 | $8,098,132 |
| Shares issued in connection with | | | | |
| reinvestment of distributions | 163,900 | 971,483 | 191,070 | 1,260,223 |
| | 3,129,188 | 19,011,200 | 1,411,644 | 9,358,355 |
| Shares repurchased | (2,383,571) | (14,255,753) | (3,142,326) | (20,440,899) |
| Net increase (decrease) | 745,617 | $4,755,447 | (1,730,682) | $(11,082,544) |
| |
| | YEAR ENDED 9/30/22 | YEAR ENDED 9/30/21 |
| Class Y | Shares | Amount | Shares | Amount |
| Shares sold | 48,881,906 | $292,320,580 | 61,121,394 | $405,907,778 |
| Shares issued in connection with | | | | |
| reinvestment of distributions | 5,519,823 | 32,842,999 | 6,792,585 | 44,830,754 |
| | 54,401,729 | 325,163,579 | 67,913,979 | 450,738,532 |
| Shares repurchased | (124,448,434) | (748,934,454) | (121,512,156) | (799,319,840) |
| Net decrease | (70,046,705) | $(423,770,875) | (53,598,177) | $(348,581,308) |
|
| 114 Diversified Income Trust |
Note 5: Affiliated transactions
Transactions during the reporting period with any company which is under common ownership or control were as follows:
| | | | | |
| | | | | | Shares |
| | | | | | outstanding |
| | | | | | and fair |
| | Fair value as | Purchase | Sale | Investment | value as |
| Name of affiliate | of 9/30/21 | cost | proceeds | income | of 9/30/22 |
| Short-term investments | | | | | |
| Putnam Short Term | | | | | |
| Investment Fund** | $223,781,179 | $1,119,908,826 | $1,218,198,498 | $1,079,443 | $125,491,507 |
| Total Short-term | | | | | |
| investments | $223,781,179 | $1,119,908,826 | $1,218,198,498 | $1,079,443 | $125,491,507 |
** Management fees charged to Putnam Short Term Investment Fund have been waived by Putnam Management. There were no realized or unrealized gains or losses during the period.
Note 6: Market, credit and other risks
In the normal course of business, the fund trades financial instruments and enters into financial transactions where risk of potential loss exists due to changes in the market (market risk) or failure of the contracting party to the transaction to perform (credit risk). The fund may be exposed to additional credit risk that an institution or other entity with which the fund has unsettled or open transactions will default. Investments in foreign securities involve certain risks, including those related to economic instability, unfavorable political developments, and currency fluctuations. The fund may invest in higher-yielding, lower-rated bonds that may have a higher rate of default. The fund may invest a significant portion of its assets in securitized debt instruments, including mortgage-backed and asset-backed investments. The yields and values of these investments are sensitive to changes in interest rates, the rate of principal payments on the underlying assets and the market’s perception of the issuers. The market for these investments may be volatile and limited, which may make them difficult to buy or sell.
On July 27, 2017, the United Kingdom’s Financial Conduct Authority (“FCA”), which regulates LIBOR, announced its intention to cease compelling banks to provide the quotations needed to sustain LIBOR after 2021. ICE Benchmark Administration, the administrator of LIBOR, ceased publication of most LIBOR settings on a representative basis at the end of 2021 and is expected to cease publication of a majority of U.S. dollar LIBOR settings on a representative basis after June 30, 2023. In addition, global regulators have announced that, with limited exceptions, no new LIBOR-based contracts should be entered into after 2021. LIBOR has historically been a common benchmark interest rate index used to make adjustments to variable-rate loans. It is used throughout global banking and financial industries to determine interest rates for a variety of financial instruments and borrowing arrangements. Actions by regulators have resulted in the establishment of alternative reference rates to LIBOR in most major currencies. Various financial industry groups have been planning for the transition away from LIBOR, but there are obstacles to converting certain longer-term securities and transactions to new reference rates. Markets are developing slowly and questions around liquidity in these rates and how to appropriately adjust these rates to mitigate any economic value transfer at the time of transition remain a significant concern. Neither the effect of the transition process nor its ultimate success can yet be known. The transition process might lead to increased volatility and illiquidity in markets that rely on LIBOR to determine interest rates. It could also lead to a reduction in the value of some LIBOR-based investments and reduce the effectiveness of related transactions, such as hedges. While some LIBOR-based instruments may contemplate a scenario where LIBOR is no longer available by providing for an alternative rate-setting methodology, not all may have such provisions and there may be significant uncertainty regarding the effectiveness of any such alternative methodologies. Since the usefulness of LIBOR as a benchmark could deteriorate during the transition period, these effects could occur at any time.
Beginning in January 2020, global financial markets have experienced, and may continue to experience, significant volatility resulting from the spread of a virus known as Covid–19. The outbreak of Covid–19 has resulted in travel and border restrictions, quarantines, supply chain disruptions, lower consumer demand, and general market uncertainty. The effects of Covid–19 have adversely affected, and may continue to adversely affect, the global economy, the economies of certain nations, and individual issuers, all of which may negatively impact the fund’s performance.
|
| Diversified Income Trust 115 |
Note 7: Senior loan commitments
Senior loans are purchased or sold on a when-issued or delayed delivery basis and may be settled a month or more after the trade date, which from time to time can delay the actual investment of available cash balances; interest income is accrued based on the terms of the securities. Senior loans can be acquired through an agent, by assignment from another holder of the loan, or as a participation interest in another holder’s portion of the loan. When the fund invests in a loan or participation, the fund is subject to the risk that an intermediate participant between the fund and the borrower will fail to meet its obligations to the fund, in addition to the risk that the borrower under the loan may default on its obligations.
Note 8: Summary of derivative activity
The volume of activity for the reporting period for any derivative type that was held during the period is listed below and was based on an average of the holdings at the end of each fiscal quarter:
| |
| Purchased TBA commitment option contracts (contract amount) | $196,200,000 |
| Purchased currency option contracts (contract amount) | $46,700,000 |
| Purchased swap option contracts (contract amount) | $8,314,500,000 |
| Written TBA commitment option contracts (contract amount) | $196,200,000 |
| Written currency option contracts (contract amount) | $46,700,000 |
| Written swap option contracts (contract amount) | $9,072,300,000 |
| Futures contracts (number of contracts) | 9,000 |
| Forward currency contracts (contract amount) | $1,774,800,000 |
| OTC interest rate swap contracts (notional) | $384,500,000 |
| Centrally cleared interest rate swap contracts (notional) | $8,300,700,000 |
| OTC total return swap contracts (notional) | $27,200,000 |
| Centrally cleared total return swap contracts (notional) | $173,600,000 |
| OTC credit default contracts (notional) | $537,300,000 |
| Centrally cleared credit default contracts (notional) | $4,400,000 |
| Warrants (number of warrants) | 353 |
The following is a summary of the fair value of derivative instruments as of the close of the reporting period:
| | | | |
| Fair value of derivative instruments as of the close of the reporting period | |
| | ASSET DERIVATIVES | LIABILITY DERIVATIVES |
| Derivatives not | | | | |
| accounted for as | Statement of | | Statement of | |
| hedging instruments | assets and | | assets and | |
| under ASC 815 | liabilities location | Fair value | liabilities location | Fair value |
| | | | Payables, Net assets — | |
| Credit contracts | Receivables | $34,389,812 | Unrealized depreciation | $36,759,899* |
| Foreign exchange | | | | |
| contracts | Receivables | 6,453,881 | Payables | 3,464,128 |
| Equity contracts | Investments | 11 | Payables | — |
| | Investments, | | | |
| | Receivables, Net | | | |
| | assets — Unrealized | | Payables, Net assets — | |
| Interest rate contracts | appreciation | 502,877,546* | Unrealized depreciation | 567,768,546* |
| Total | | $543,721,250 | | $607,992,573 |
* Includes cumulative appreciation/depreciation of futures contracts and/or centrally cleared swaps as reported in the fund’s portfolio. Only current day’s variation margin is reported within the Statement of assets and liabilities.
|
| 116 Diversified Income Trust |
The following is a summary of realized and change in unrealized gains or losses of derivative instruments in the Statement of operations for the reporting period (Note 1):
| | | | | |
| Amount of realized gain or (loss) on derivatives recognized in net gain or (loss) on investments |
| Derivatives not | | | | | |
| accounted for as | | | Forward | | |
| hedging instruments | | | currency | | |
| under ASC 815 | Options | Futures | contracts | Swaps | Total |
| Credit contracts | $— | $— | $— | $(40,403,325) | $(40,403,325) |
| Foreign exchange | | | | | |
| contracts | (1,838,372) | — | (10,890,927) | — | $(12,729,299) |
| Interest rate contracts | (25,784,051) | 113,648,573 | — | (139,422,326) | $(51,557,804) |
| Total | $(27,622,423) | $113,648,573 | $(10,890,927) | $(179,825,651) | $(104,690,428) |
| | | | | | |
| Change in unrealized appreciation or (depreciation) on derivatives recognized in net gain or (loss) |
| on investments | | | | | | |
| Derivatives not | | | | | | |
| accounted for as | | | | | | |
| hedging | | | | Forward | | |
| instruments under | | | | currency | | |
| ASC 815 | Warrants | Options | Futures | contracts | Swaps | Total |
| Credit contracts | $— | $— | $— | $— | $69,440,212 | $69,440,212 |
| Foreign exchange | | | | | | |
| contracts | — | (76,108) | — | 10,778,562 | — | $10,702,454 |
| Equity contracts | (7) | — | — | — | — | $(7) |
| Interest rate | | | | | | |
| contracts | — | (66,993,340) | (5,157,418) | — | 122,045,961 | $49,895,203 |
| Total | $(7) | $(67,069,448) | $(5,157,418) | $10,778,562 | $191,486,173 | $130,037,862 |
|
| Diversified Income Trust 117 |
Note 9: Offsetting of financial and derivative assets and liabilities
The following table summarizes any derivatives, repurchase agreements and reverse repurchase agreements, at the end of the reporting period, that are subject to an enforceable master netting agreement or similar agreement. For securities lending transactions or borrowing transactions associated with securities sold short, if any, see Note 1. For financial reporting purposes, the fund does not offset financial assets and financial liabilities that are subject to the master netting agreements in the Statement of assets and liabilities.
| | | | | | | | | | | | | | | | | | | | |
| | Bank of America N.A. | Barclays Bank PLC | Barclays
Capital, Inc. (clearing
broker) | BofA
Securities,
Inc. | Citibank, N.A. | Citigroup
Global
Markets, Inc. | Credit Suisse International | Deutsche
Bank
AG | Goldman
Sachs
International | HSBC Bank USA, National Association | JPMorgan
Chase Bank N.A. | JPMorgan
Securities LLC | Merrill Lynch International | Morgan
Stanley & Co. International
PLC | NatWest
Markets PLC | State Street Bank and
Trust Co. | Toronto- Dominion
Bank | UBS AG | WestPac
Banking Corp. | Total |
| Assets: | | | | | | | | | | | | | | | | | | | | |
| OTC Interest rate | | | | | | | | | | | | | | | | | | | | |
| swap contracts*# | $— | $— | $— | $— | $— | $— | $— | $— | $— | $— | $— | $— | $— | $24,851,922 | $— | $— | $— | $— | $— | $24,851,922 |
| Centrally cleared | | | | | | | | | | | | | | | | | | | | |
| interest rate | | | | | | | | | | | | | | | | | | | | |
| swap contracts§ | — | — | 70,480,575 | — | — | — | — | — | — | — | — | — | — | — | — | — | — | — | — | 70,480,575 |
| OTC Total return | | | | | | | | | | | | | | | | | | | | |
| swap contracts*# | — | — | — | — | — | — | — | — | — | — | — | — | — | — | — | — | — | — | — | — |
| OTC Credit default | | | | | | | | | | | | | | | | | | | | |
| contracts — | | | | | | | | | | | | | | | | | | | | |
| protection sold*# | — | — | — | — | — | — | — | — | — | — | — | — | — | — | — | — | — | — | — | — |
| OTC Credit default | | | | | | | | | | | | | | | | | | | | |
| contracts — | | | | | | | | | | | | | | | | | | | | |
| protection | | | | | | | | | | | | | | | | | | | | |
| purchased*# | — | — | — | — | — | 11,823,224 | 3,145,726 | — | 2,374,688 | — | — | 8,967,801 | 1,308,803 | 6,769,570 | — | — | — | — | — | 34,389,812 |
| Centrally cleared | | | | | | | | | | | | | | | | | | | | |
| credit default | | | | | | | | | | | | | | | | | | | | |
| contracts§ | — | — | — | — | — | — | — | — | — | — | — | — | — | — | — | — | — | — | — | — |
| Futures contracts§ | — | — | — | — | — | — | — | — | — | — | — | 88,237 | — | — | — | — | — | — | — | 88,237 |
| Forward currency | | | | | | | | | | | | | | | | | | | | |
| contracts# | 15,312 | 29,336 | — | — | — | — | — | — | 46,472 | 226,150 | 135,497 | — | — | 2,239,315 | 19,061 | 2,676,476 | 531,918 | 398,891 | 135,453 | 6,453,881 |
| Forward premium | | | | | | | | | | | | | | | | | | | | |
| swap option | | | | | | | | | | | | | | | | | | | | |
| contracts# | 41,653,934 | — | — | — | 29,880,157 | — | — | 155,260 | 9,117,677 | — | 19,451,781 | — | — | 21,744,199 | — | — | 2,746,912 | 23,566,338 | — | 148,316,258 |
| Purchased swap | | | | | | | | | | | | | | | | | | | | |
| options**# | 49,107 | — | — | — | — | — | — | — | — | — | — | — | — | 12,808,465 | — | — | — | — | — | 12,857,572 |
| Purchased | | | | | | | | | | | | | | | | | | | | |
| options**# | — | — | — | — | — | — | — | — | — | — | 150 | — | — | — | — | — | — | — | — | 150 |
| Total Assets | $41,718,353 | $29,336 | $70,480,575 | $— | $29,880,157 | $11,823,224 | $3,145,726 | $155,260 | $11,538,837 | $226,150 | $19,587,428 | $9,056,038 | $1,308,803 | $68,413,471 | $19,061 | $2,676,476 | $3,278,830 | $23,965,229 | $135,453 | $297,438,407 |
| Liabilities: | | | | | | | | | | | | | | | | | | | | |
| OTC Interest rate | | | | | | | | | | | | | | | | | | | | |
| swap contracts*# | $— | $— | $— | $— | $— | $— | $— | $— | $— | $— | $79,520 | $— | $— | $4,671 | $— | $— | $— | $— | $— | $84,191 |
| Centrally cleared | | | | | | | | | | | | | | | | | | | | |
| interest rate swap | | | | | | | | | | | | | | | | | | | | |
| contracts§ | — | — | 64,687,837 | — | — | — | — | — | — | — | — | — | — | — | — | — | — | — | — | 64,687,837 |
| OTC Total return | | | | | | | | | | | | | | | | | | | | |
| swap contracts*# | — | — | — | — | — | — | — | — | — | — | — | — | — | 2,200,297 | — | — | — | — | — | 2,200,297 |
| OTC Credit default | | | | | | | | | | | | | | | | | | | | |
| contracts — | | | | | | | | | | | | | | | | | | | | |
| protection sold*# | 1,172,551 | — | — | — | — | 12,008,567 | 5,810,792 | 82,581 | 8,013,924 | — | — | 642,578 | 1,204,893 | 5,208,256 | — | — | — | — | — | 34,144,142 |
| |
| 118 Diversified Income Trust | Diversified Income Trust 119 |
| | | | | | | | | | | | | | | | | | | | |
| | Bank of
America N.A. | Barclays Bank PLC | Barclays
Capital, Inc. (clearing
broker) | BofA
Securities,
Inc. | Citibank, N.A. | Citigroup
Global
Markets, Inc. | Credit Suisse International | Deutsche
Bank
AG | Goldman
Sachs
International | HSBC Bank USA, National Association | JPMorgan
Chase Bank
N.A. | JPMorgan
Securities LLC | Merrill Lynch International | Morgan
Stanley & Co. International
PLC | NatWest
Markets PLC | State Street Bank and Trust Co. | Toronto- Dominion
Bank | UBS AG | WestPac
Banking Corp. | Total |
| OTC Credit default | | | | | | | | | | | | | | | | | | | | |
| contracts — | | | | | | | | | | | | | | | | | | | | |
| protection | | | | | | | | | | | | | | | | | | | | |
| purchased*# | $— | $— | $— | $— | $— | $— | $— | $— | $— | $— | $— | $— | $— | $— | $— | $— | $— | $— | $— | $— |
| Centrally cleared | | | | | | | | | | | | | | | | | | | | |
| credit default | | | | | | | | | | | | | | | | | | | | |
| contracts§ | — | — | 29,834 | — | — | — | — | — | — | — | — | — | — | — | — | — | — | — | — | 29,834 |
| Futures contracts§ | — | — | — | — | — | — | — | — | — | — | — | — | — | — | — | — | — | — | — | — |
| Forward currency | | | | | | | | | | | | | | | | | | | | |
| contracts# | 22,863 | — | — | — | 69,194 | — | — | — | 369,745 | 22,286 | 1,878 | — | — | 912 | 5,992 | 313,111 | 6,682 | 2,458,531 | 192,934 | 3,464,128 |
| Forward premium | | | | | | | | | | | | | | | | | | | | |
| swap option | | | | | | | | | | | | | | | | | | | | |
| contracts# | 58,040,996 | — | — | — | 22,594,349 | — | — | 861,695 | 34,373,550 | — | 24,067,688 | — | — | 43,389,493 | — | — | 1,574,959 | 12,693,991 | — | 197,596,721 |
| Written swap | | | | | | | | | | | | | | | | | | | | |
| options # | 9,336,534 | — | — | — | 10,075,080 | — | — | — | 5,886,859 | — | 31,300,680 | — | — | 11,856,992 | — | — | 1,829,194 | 9,377,093 | — | 79,662,432 |
| Written options # | — | — | — | — | — | — | — | — | — | — | 5,530,200 | — | — | — | — | — | — | — | — | 5,530,200 |
| Total Liabilities | $68,572,944 | $— | $64,717,671 | $— | $32,738,623 | $12,008,567 | $5,810,792 | $944,276 | $48,644,078 | $22,286 | $60,979,966 | $642,578 | $1,204,893 | $62,660,621 | $5,992 | $313,111 | $3,410,835 | $24,529,615 | $192,934 | $387,399,782 |
| Total Financial | | | | | | | | | | | | | | | | | | | | |
| and Derivative | | | | | | | | | | | | | | | | | | | | |
| Net Assets | $(26,854,591) | $29,336 | $5,762,904 | $— | $(2,858,466) | $(185,343) | $(2,665,066) | $(789,016) | $(37,105,241) | $203,864 | $(41,392,538) | $8,413,460 | $103,910 | $5,752,850 | $13,069 | $2,363,365 | $(132,005) | $(564,386) | $(57,481) | $(89,961,375) |
| Total collateral | | | | | | | | | | | | | | | | | | | | |
| received | | | | | | | | | | | | | | | | | | | | |
| (pledged)†## | $(26,854,591) | $(151,742) | $— | $— | $(2,493,394) | $(185,343) | $(2,665,066) | $(789,016) | $(31,615,004) | $130,000 | $(40,198,940) | $8,297,000 | $103,910 | $5,752,850 | $— | $2,303,566 | $— | $(564,386) | $— | |
| Net amount | $— | $181,078 | $5,762,904 | $— | $(365,072) | $— | $— | $— | $(5,490,237) | $73,864 | $(1,193,598) | $116,460 | $— | $— | $13,069 | $59,799 | $(132,005) | $— | $(57,481) | |
| Controlled | | | | | | | | | | | | | | | | | | | | |
| collateral received | | | | | | | | | | | | | | | | | | | | |
| (including TBA | | | | | | | | | | | | | | | | | | | | |
| commitments)** | $— | $— | $— | $5,755,000 | $— | $— | $— | $— | $— | $130,000 | $— | $8,297,000 | $115,772 | $6,249,000 | $— | $2,303,566 | $— | $— | $— | $22,850,338 |
| Uncontrolled | | | | | | | | | | | | | | | | | | | | |
| collateral received | $— | $— | $— | $— | $— | $— | $— | $— | $— | $— | $— | $— | $— | $— | $— | $— | $— | $— | $— | $— |
| Collateral | | | | | | | | | | | | | | | | | | | | |
| (pledged) | | | | | | | | | | | | | | | | | | | | |
| (including TBA | | | | | | | | | | | | | | | | | | | | |
| commitments)** | $(27,372,579) | $(151,742) | $— | $— | $(2,493,394) | $(4,861,411) | $(2,676,663) | $(985,305) | $(31,615,004) | $— | $(40,198,940) | $(2,503,852) | $— | $— | $— | $— | $— | $(6,314,079) | $— | $(119,172,969) |
* Excludes premiums, if any. Included in unrealized appreciation and depreciation on OTC swap contracts on the Statement of assets and liabilities.
** Included with Investments in securities on the Statement of assets and liabilities.
† Additional collateral may be required from certain brokers based on individual agreements.
# Covered by master netting agreement (Note 1).
##Any over-collateralization of total financial and derivative net assets is not shown. Collateral may include amounts related to unsettled agreements.
§ Includes current day’s variation margin only as reported on the Statement of assets and liabilities, which is not collateralized. Cumulative appreciation/(depreciation) for futures contracts and centrally cleared swap contracts is represented in the tables listed after the fund’s portfolio. Collateral pledged for initial margin on futures contracts and centrally cleared swap contracts, which is not included in the table above, amounted to $513,867 and $32,548,349, respectively.
| |
| 120 Diversified Income Trust | Diversified Income Trust 121 |
Note 10: New accounting pronouncements
In March 2020, the Financial Accounting Standards Board (FASB) issued Accounting Standards Update (ASU) 2020–04, Reference Rate Reform (Topic 848) — Facilitation of the Effects of Reference Rate Reform on Financial Reporting. The amendments in ASU 2020–04 provide optional temporary financial reporting relief from the effect of certain types of contract modifications due to the planned discontinuation of LIBOR and other interbank-offered based reference rates as of the end of 2021. The discontinuation of LIBOR was subsequently extended to June 30, 2023. ASU 2020–04 is effective for certain reference rate-related contract modifications that occur during the period March 12, 2020 through December 31, 2022. The adoption of the guidance will not have a material impact on the fund’s financial statements.
|
| 122 Diversified Income Trust |
Federal tax information (Unaudited)
For the reporting period, pursuant to §871(k) of the Internal Revenue Code, the fund hereby designates $76,453,153 of distributions paid as qualifying to be taxed as interest-related dividends, and no monies to be taxed as short-term capital gain dividends for nonresident alien shareholders.
The Form 1099 that will be mailed to you in January 2023 will show the tax status of all distributions paid to your account in calendar 2022.
|
| Diversified Income Trust 123 |
Shareholder meeting results (Unaudited)
June 29, 2022 special meeting
At the meeting, each of the nominees for Trustees was elected, with all funds of the Trust voting together as a single class, as follows:
| | |
| | Votes for | Votes withheld |
| Liaquat Ahamed | 219,881,495 | 3,427,372 |
| Barbara M. Baumann | 220,201,189 | 3,107,677 |
| Katinka Domotorffy | 220,182,166 | 3,126,701 |
| Catharine Bond Hill | 220,108,394 | 3,200,473 |
| Kenneth R. Leibler | 220,300,463 | 3,008,404 |
| Jennifer Williams Murphy | 220,013,966 | 3,294,901 |
| Marie Pillai | 220,115,752 | 3,193,115 |
| George Putnam, III | 220,360,665 | 2,948,202 |
| Robert L. Reynolds | 220,442,226 | 2,866,641 |
| Manoj P. Singh | 220,180,916 | 3,127,951 |
| Mona K. Sutphen | 220,232,166 | 3,076,700 |
All tabulations are rounded to the nearest whole number.
|
| 124 Diversified Income Trust |

|
| Diversified Income Trust 125 |

* Mr. Reynolds is an “interested person” (as defined in the Investment Company Act of 1940) of the fund and Putnam Investments. He is President and Chief Executive Officer of Putnam Investments, as well as the President of your fund and each of the other Putnam funds.
The address of each Trustee is 100 Federal Street, Boston, MA 02110.
As of September 30, 2022, there were 102 funds in the Putnam fund complex, including 96 Putnam Funds and six funds in Putnam ETF Trust. Each Trustee serves as Trustee of all Putnam Funds. In addition to serving as Trustees of the Putnam Funds, Dr. Hill, Mses. Domotorffy and Sutphen, and Mr. Ahamed serve as Trustees of Putnam ETF Trust. Each Trustee serves for an indefinite term, until his or her resignation, retirement at age 75, removal, or death.
|
| 126 Diversified Income Trust |
Officers
In addition to Robert L. Reynolds, the other officers of the fund are shown below:
| |
| James F. Clark (Born 1974) | Alan G. McCormack (Born 1964) |
| Vice President and Chief Compliance Officer | Vice President and Derivatives Risk Manager |
| Since 2016 | Since 2022 |
| Chief Compliance Officer and Chief Risk Officer, | Head of Quantitative Equities and Risk, |
| Putnam Investments, and Chief Compliance Officer, | Putnam Investments |
| Putnam Management |
| Denere P. Poulack (Born 1968) |
| Nancy E. Florek (Born 1957) | Assistant Vice President, Assistant Clerk, |
| Vice President, Director of Proxy Voting and Corporate | and Assistant Treasurer |
| Governance, Assistant Clerk, and Assistant Treasurer | Since 2004 |
| Since 2000 |
| Janet C. Smith (Born 1965) |
| Michael J. Higgins (Born 1976) | Vice President, Principal Financial Officer, Principal |
| Vice President, Treasurer, and Clerk | Accounting Officer, and Assistant Treasurer |
| Since 2010 | Since 2007 |
| | Head of Fund Administration Services, |
| Jonathan S. Horwitz (Born 1955) | Putnam Investments and Putnam Management |
| Executive Vice President, Principal Executive Officer, | |
| and Compliance Liaison | Stephen J. Tate (Born 1974) |
| Since 2004 | Vice President and Chief Legal Officer |
| | Since 2021 |
| Richard T. Kircher (Born 1962) | General Counsel, Putnam Investments, |
| Vice President and BSA Compliance Officer | Putnam Management, and Putnam Retail Management |
| Since 2019 | |
| Assistant Director, Operational Compliance, Putnam | Mark C. Trenchard (Born 1962) |
| Investments and Putnam Retail Management | Vice President |
| | Since 2002 |
| Martin Lemaire (Born 1984) | Director of Operational Compliance, Putnam |
| Vice President and Derivatives Risk Manager | Investments and Putnam Retail Management |
| Since 2022 | |
| Risk Manager and Risk Analyst, Putnam Investments | |
| |
| Susan G. Malloy (Born 1957) | |
| Vice President and Assistant Treasurer | |
| Since 2007 | |
| Head of Accounting and Middle Office Services, | |
| Putnam Investments and Putnam Management | |
The principal occupations of the officers for the past five years have been with the employers as shown above, although in some cases they have held different positions with such employers. The address of each officer is 100 Federal Street, Boston, MA 02110.
|
| Diversified Income Trust 127 |
Services for shareholders
Investor services
Systematic investment plan Tell us how much you wish to invest regularly — weekly, semimonthly, or monthly — and the amount you choose will be transferred automatically from your checking or savings account. There’s no additional fee for this service, and you can suspend it at any time. This plan may be a great way to save for college expenses or to plan for your retirement.
Please note that regular investing does not guarantee a profit or protect against loss in a declining market. Before arranging a systematic investment plan, consider your financial ability to continue making purchases in periods when prices are low.
Systematic exchange You can make regular transfers from one Putnam fund to another Putnam fund. There are no additional fees for this service, and you can cancel or change your options at any time.
Dividends PLUS You can choose to have the dividend distributions from one of your Putnam funds automatically reinvested in another Putnam fund at no additional charge.
Free exchange privilege You can exchange money between Putnam funds free of charge, as long as they are the same class of shares. A signature guarantee is required if you are exchanging more than $500,000. The fund reserves the right to revise or terminate the exchange privilege.
Reinstatement privilege If you’ve sold Putnam shares or received a check for a dividend or capital gain, you may reinvest the proceeds with Putnam within 90 days of the transaction and they will be reinvested at the fund’s current net asset value — with no sales charge. However, reinstatement of class B shares may have special tax consequences. Ask your financial or tax representative for details.
Check-writing service You have ready access to many Putnam accounts. It’s as simple as writing a check, and there are no special fees or service charges. For more information about the check-writing service, call Putnam or visit our website.
Dollar cost averaging When you’re investing for long-term goals, it’s time, not timing, that counts. Investing on a systematic basis is a better strategy than trying to figure out when the markets will go up or down. This means investing the same amount of money regularly over a long period. This method of investing is called dollar cost averaging. When a fund’s share price declines, your investment dollars buy more shares at lower prices. When it increases, they buy fewer shares. Over time, you will pay a lower average price per share.
For more information
Visit the Individual Investors section at putnam.com A secure section of our website contains complete information on your account, including balances and transactions, updated daily. You may also conduct transactions, such as exchanges, additional investments, and address changes. Log on today to get your password.
Call us toll free at 1-800-225-1581 Ask a helpful Putnam representative or your financial advisor for details about any of these or other services, or see your prospectus.
|
| 128 Diversified Income Trust |
Fund information
Founded over 80 years ago, Putnam Investments was built around the concept that a balance between risk and reward is the hallmark of a well-rounded financial program. We manage funds across income, value, blend, growth, sustainable, asset allocation, absolute return, and global sector categories.
| | |
| Investment Manager | Trustees | Richard T. Kircher |
| Putnam Investment | Kenneth R. Leibler, Chair | Vice President and |
| Management, LLC | Barbara M. Baumann, Vice Chair | BSA Compliance Officer |
| 100 Federal Street | Liaquat Ahamed | |
| Boston, MA 02110 | Katinka Domotorffy | Martin Lemaire |
| | Catharine Bond Hill | Vice President and |
| Investment Sub-Advisor | Jennifer Williams Murphy | Derivatives Risk Manager |
| Putnam Investments Limited | Marie Pillai | |
| 16 St James’s Street | George Putnam, III | Susan G. Malloy |
| London, England SW1A 1ER | Robert L. Reynolds | Vice President and |
| Manoj P. Singh | Assistant Treasurer |
| Marketing Services | Mona K. Sutphen | |
| Putnam Retail Management | | Alan G. McCormack |
| Limited Partnership | Officers | Vice President and |
| 100 Federal Street | Robert L. Reynolds | Derivatives Risk Manager |
| Boston, MA 02110 | President | |
| | | Denere P. Poulack |
| Custodian | James F. Clark | Assistant Vice President, |
| State Street Bank | Vice President, Chief Compliance | Assistant Clerk, and |
| and Trust Company | Officer, and Chief Risk Officer | Assistant Treasurer |
| | | |
| Legal Counsel | Nancy E. Florek | Janet C. Smith |
| Ropes & Gray LLP | Vice President, Director of | Vice President, |
| Proxy Voting and Corporate | Principal Financial Officer, |
| Independent Registered | Governance, Assistant Clerk, | Principal Accounting Officer, |
| Public Accounting Firm | and Assistant Treasurer | and Assistant Treasurer |
| PricewaterhouseCoopers LLP | | |
| | Michael J. Higgins | Stephen J. Tate |
| | Vice President, Treasurer, | Vice President and |
| | and Clerk | Chief Legal Officer |
| | | |
| | Jonathan S. Horwitz | Mark C. Trenchard |
| | Executive Vice President, | Vice President |
| Principal Executive Officer, | |
| | and Compliance Liaison | |
This report is for the information of shareholders of Putnam Diversified Income Trust. It may also be used as sales literature when preceded or accompanied by the current prospectus, the most recent copy of Putnam’s Quarterly Performance Summary, and Putnam’s Quarterly Ranking Summary. For more recent performance, please visit putnam.com. Investors should carefully consider the investment objectives, risks, charges, and expenses of a fund, which are described in its prospectus. For this and other information or to request a prospectus or summary prospectus, call 1-800-225-1581 toll free. Please read the prospectus carefully before investing. The fund’s Statement of Additional Information contains additional information about the fund’s Trustees and is available without charge upon request by calling 1-800-225-1581.

| |
| (a) The fund’s principal executive, financial and accounting officers are employees of Putnam Investment Management, LLC, the Fund’s investment manager. As such they are subject to a comprehensive Code of Ethics adopted and administered by Putnam Investments which is designed to protect the interests of the firm and its clients. The Fund has adopted a Code of Ethics which incorporates the Code of Ethics of Putnam Investments with respect to all of its officers and Trustees who are employees of Putnam Investment Management, LLC. For this reason, the Fund has not adopted a separate code of ethics governing its principal executive, financial and accounting officers. |
| |
| Item 3. Audit Committee Financial Expert: |
| |
| The Funds’ Audit, Compliance and Risk Committee is comprised solely of Trustees who are “independent” (as such term has been defined by the Securities and Exchange Commission (“SEC”) in regulations implementing Section 407 of the Sarbanes-Oxley Act (the “Regulations”)). The Trustees believe that each member of the Audit, Compliance and Risk Committee also possesses a combination of knowledge and experience with respect to financial accounting matters, as well as other attributes, that qualifies him or her for service on the Committee. In addition, the Trustees have determined that each of Dr. Hill and Mr. Singh qualifies as an “audit committee financial expert” (as such term has been defined by the Regulations) based on their review of his or her pertinent experience and education.The SEC has stated, and the funds’ amended and restated agreement and Declaration of Trust provides, that the designation or identification of a person as an audit committee financial expert pursuant to this Item 3 of Form N-CSR does not impose on such person any duties, obligations or liability that are greater than the duties, obligations and liability imposed on such person as a member of the Audit, Compliance and Risk Committee and the Board of Trustees in the absence of such designation or identification. |
| |
| Item 4. Principal Accountant Fees and Services: |
| |
| The following table presents fees billed in each of the last two fiscal years for services rendered to the fund by the fund’s independent auditor: |
| | | | | |
| Fiscal year ended | Audit Fees | Audit-Related Fees | Tax Fees | All Other Fees |
|
|
| | | | | |
| September 30, 2022 | $220,803 | $ — | $14,993 | $ — |
| September 30, 2021 | $195,021 | $ — | $14,295 | $ — |
| |
| For the fiscal years ended September 30, 2022 and September 30, 2021, the fund’s independent auditor billed aggregate non-audit fees in the amounts of $313,276 and $279,194 respectively, to the fund, Putnam Management and any entity controlling, controlled by or under common control with Putnam Management that provides ongoing services to the fund. |
| |
| Audit Fees represent fees billed for the fund’s last two fiscal years relating to the audit and review of the financial statements included in annual reports and registration statements, and other services that are normally provided in connection with statutory and regulatory filings or engagements. |
| |
| Audit-Related Fees represent fees billed in the fund’s last two fiscal years for services traditionally performed by the fund’s auditor, including accounting consultation for proposed transactions or concerning financial accounting and reporting standards and other audit or attest services not required by statute or regulation. |
| |
| Tax Fees represent fees billed in the fund’s last two fiscal years for tax compliance, tax planning and tax advice services. Tax planning and tax advice services include assistance with tax audits, employee benefit plans and requests for rulings or technical advice from taxing authorities. |
| |
| Pre-Approval Policies of the Audit, Compliance and Risk Committee. The Audit, Compliance and Risk Committee of the Putnam funds has determined that, as a matter of policy, all work performed for the funds by the funds’ independent auditors will be pre-approved by the Committee itself and thus will generally not be subject to pre-approval procedures. |
| |
| The Audit, Compliance and Risk Committee also has adopted a policy to pre-approve the engagement by Putnam Management and certain of its affiliates of the funds’ independent auditors, even in circumstances where pre-approval is not required by applicable law. Any such requests by Putnam Management or certain of its affiliates are typically submitted in writing to the Committee and explain, among other things, the nature of the proposed engagement, the estimated fees, and why this work should be performed by that particular audit firm as opposed to another one. In reviewing such requests, the Committee considers, among other things, whether the provision of such services by the audit firm are compatible with the independence of the audit firm. |
| |
| The following table presents fees billed by the fund’s independent auditor for services required to be approved pursuant to paragraph (c)(7)(ii) of Rule 2–01 of Regulation S-X. |
| | | | | |
| Fiscal year ended | Audit-Related Fees | Tax Fees | All Other Fees | Total Non-Audit Fees |
|
|
| September 30, 2022 | $ — | $298,283 | $ — | $ — |
| September 30, 2021 | $ — | $264,899 | $ — | $ — |
| |
| Item 5. Audit Committee of Listed Registrants |
| |
| Item 6. Schedule of Investments: |
| |
| The registrant’s schedule of investments in unaffiliated issuers is included in the report to shareholders in Item 1 above. |
| |
| Item 7. Disclosure of Proxy Voting Policies and Procedures For Closed-End Management Investment Companies: |
| |
| Item 8. Portfolio Managers of Closed-End Investment Companies |
| |
| Item 9. Purchases of Equity Securities by Closed-End Management Investment Companies and Affiliated Purchasers: |
| |
| Item 10. Submission of Matters to a Vote of Security Holders: |
| |
| Item 11. Controls and Procedures: |
| |
| (a) The registrant’s principal executive officer and principal financial officer have concluded, based on their evaluation of the effectiveness of the design and operation of the registrant’s disclosure controls and procedures as of a date within 90 days of the filing date of this report, that the design and operation of such procedures are generally effective to provide reasonable assurance that information required to be disclosed by the registrant in this report is recorded, processed, summarized and reported within the time periods specified in the Commission’s rules and forms. |
| |
| (b) Changes in internal control over financial reporting: Not applicable |
| |
| Item 12. Disclosures of Securities Lending Activities for Closed-End Management Investment Companies: |
| |
| (a)(1) The Code of Ethics of The Putnam Funds, which incorporates the Code of Ethics of Putnam Investments, is filed herewith |
| |
| Pursuant to the requirements of the Securities Exchange Act of 1934 and the Investment Company Act of 1940, the registrant has duly caused this report to be signed on its behalf by the undersigned, thereunto duly authorized. |
| |
| Putnam Diversified Income Trust |
| |
| By (Signature and Title): |
| |
| /s/ Janet C. Smith
Janet C. Smith
Principal Accounting Officer
|
| |
| Pursuant to the requirements of the Securities Exchange Act of 1934 and the Investment Company Act of 1940, this report has been signed below by the following persons on behalf of the registrant and in the capacities and on the dates indicated. |
| |
| By (Signature and Title): |
| |
| /s/ Jonathan S. Horwitz
Jonathan S. Horwitz
Principal Executive Officer
|
| |
| By (Signature and Title): |
| |
| /s/ Janet C. Smith
Janet C. Smith
Principal Financial Officer
|