Exhibit 1
Japan
This description of Japan is dated September 6, 2012 and appears as Exhibit 1 to Japan’s Annual Report on Form 18-K to the U.S. Securities and Exchange Commission for the fiscal year ended March 31, 2012.
THE DELIVERY OF THIS DOCUMENT AT ANY TIME DOES NOT IMPLY THAT THE INFORMATION IS CORRECT AS OF ANY TIME SUBSEQUENT TO ITS DATE. THIS DOCUMENT (OTHERWISE THAN AS PART OF A PROSPECTUS CONTAINED IN A REGISTRATION STATEMENT FILED UNDER THE U.S. SECURITIES ACT OF 1933) DOES NOT CONSTITUTE AN OFFER TO SELL OR THE SOLICITATION OF AN OFFER TO BUY ANY SECURITIES OF OR GUARANTEED BY JAPAN.
TABLE OF CONTENTS
| | | | |
GENERAL | | | 4 | |
Area and Population | | | 4 | |
Government | | | 4 | |
Political Parties | | | 4 | |
Leadership | | | 4 | |
International Organizations | | | 5 | |
THE ECONOMY | | | 7 | |
General | | | 7 | |
Gross Domestic Product and National Income | | | 9 | |
Industry | | | 11 | |
Energy | | | 11 | |
Price Indices | | | 12 | |
Labor | | | 13 | |
FOREIGN TRADE AND BALANCE OF PAYMENTS | | | 17 | |
Foreign Trade | | | 17 | |
Balance of Payments | | | 19 | |
Official Foreign Exchange Reserves | | | 20 | |
Foreign Exchange Rates | | | 20 | |
FINANCIAL SYSTEM | | | 21 | |
The Bank of Japan and Monetary Policy | | | 21 | |
Government Financial Institutions | | | 21 | |
Private Financial Institutions | | | 22 | |
GOVERNMENT FINANCE | | | 23 | |
Revenues, Expenditures and Budgets | | | 23 | |
Tax Structure | | | 26 | |
Fiscal Investment and Loan Program (“Zaito”) | | | 27 | |
DEBT RECORD | | | 28 | |
JAPAN PUBLIC DEBT | | | 28 | |
INTERNAL DEBT | | | 30 | |
Direct Debt of the Japanese Government | | | 30 | |
Debt Guaranteed by the Japanese Government | | | 33 | |
EXTERNAL DEBT | | | 34 | |
Debt Guaranteed by the Japanese Government | | | 34 | |
SUBSCRIPTIONS TO INTERNATIONAL FINANCIAL ORGANIZATIONS | | | 34 | |
-2-
FURTHER INFORMATION
This document appears as an exhibit to Japan’s Annual Report filed with the U.S. Securities and Exchange Commission (the “Commission”) on Form 18-K for the fiscal year ended March 31, 2012. Additional information with respect to Japan is available in such Annual Report, in the other exhibits to such Annual Report and in amendments thereto. Such Annual Report, exhibits and amendments may be inspected and copied at the public reference room maintained by the Commission at: 100 F Street, N.E., Washington, D.C. 20549. Information regarding the operations of the public reference room can be obtained by calling the Commission at 1-800-SEC-0330. The Annual Report and its exhibits and amendments are also available through the Commission’s Internet website at http://www.sec.gov.
In this document all amounts are expressed in Japanese Yen (“¥” or “yen”), except as otherwise specified. The spot buying rate quoted on the Tokyo Foreign Exchange Market on September 5, 2012, as reported by The Bank of Japan at 5:00 p.m., Tokyo time, was ¥78.38=$1.00, and the noon buying rate on August 31, 2012 for cable transfers in New York City payable in yen, as reported by the Federal Reserve Bank of New York, was ¥78.30=$1.00. See “Foreign Trade and Balance of Payments — Foreign Exchange Rates”.
References herein to Japanese fiscal years (“JFYs”) are to 12-month periods commencing in each case on April 1 of the year indicated and ending on March 31 of the following year. References to years not specified as being JFYs are to calendar years.
-3-
Japan
GENERAL
Area and Population
Japan, an archipelago in the western Pacific, consists of four main islands (Hokkaido, Honshu, Kyushu and Shikoku) which are mostly mountainous located in the same approximate range of latitude as the east coast of the United States north of Florida. The total area of Japan is approximately 146,000 square miles, which is slightly less than that of California and about 4% of the United States. It is bordered by the Sea of Japan to the west and north, and by the Pacific Ocean to the east and south.
Japan has a total population of approximately 127.6 million (estimated as of July 1, 2012). It has one of the highest population densities in the world and approximately 23% of its people (estimated as of October 1, 2011) are concentrated in three metropolitan areas (Tokyo, Osaka and Nagoya). Japan’s average annual rate of population decrease during the years 2007-2011 showed a decline rate of 0.04%. Japan’s population decreased 0.2% during the 12 months ended October 1, 2011.
Government
The legislative power in Japan is vested in the Diet, which currently consists of a House of Representatives having 480 members and a House of Councillors having 242 members. Members of both houses are elected by direct universal suffrage, except that some members of each house are elected by proportional representation. The power of the House of Representatives is superior to that of the House of Councillors in respect of approving certain matters including the national budget and electing the Prime Minister.
The executive power is vested in the Cabinet consisting of a Prime Minister, elected by the Diet from among its members, and other Ministers appointed by the Prime Minister, a majority of whom must be members of the Diet. The judicial power is vested in the Supreme Court and such lower courts as are established by law.
Japan’s 47 prefectures, and its cities, towns and villages, have a certain degree of local autonomy through popularly elected legislative bodies and chief executives. The central government exercises its influence on local governments indirectly through financial aid and prescribing standards of local administration.
Political Parties
Members of the House of Representatives are elected for four-year terms unless the House of Representatives is dissolved prior to expiration of their terms. The House of Representatives was dissolved on July 21, 2009 and an election was held on August 30, 2009. Three-hundred members were elected from single-member districts and 180 members were elected through a proportional representation process from 11 regional districts. The House of Councillors currently consists of 242 members who are elected for six- year terms with one-half of the membership being elected every three years. In an election in July 2010, 121 members were elected, of which 48 members were elected through a proportional representation system and 73 members were elected from 47 districts that correspond to the 47 prefectures of Japan. Currently, the House of Councillors consists of 121 members whose term expires in July 2013 and 121 members whose term expires in July 2016.
Leadership
Japan’s current Prime Minister is Yoshihiko Noda, a member of the Democratic Party of Japan and member of the House of Representatives in the Diet. Mr. Noda was formally appointed Prime Minister by the Emperor on September 2, 2011, and Noda succeeded the former Prime Minister Naoto Kan, who is also a member of the Democratic Party of Japan. Kan served as Japan’s 94th Prime Minister from June 8, 2010 through September 2, 2011. Prior to the Kan Administration, Yukio Hatoyama, a member of the Democratic Party of Japan, served as the 93rd Prime Minister from September 16, 2009 through June 8, 2010.
4
The following tables set forth the membership by political party of the House of Representatives as of July 31, 2012 and the House of Councillors as of August 9, 2012.
| | | | |
| | | House of
Representatives | |
Democratic Party of Japan and Club of Independents | | | 249 | |
Liberal Democratic Party | | | 120 | |
People’s Life First • KIZUNA | | | 47 | |
New Komeito | | | 21 | |
Japanese Communist Party | | | 9 | |
Social Democratic Party | | | 6 | |
Your Party | | | 5 | |
People’s New Party and Group of Independents | | | 4 | |
Reform Group of Independents | | | 4 | |
New Party DAICHI - SHINMINSHU | | | 3 | |
The Sunrise Party of Japan | | | 2 | |
Independents | | | 9 | |
Vacancies | | | 1 | |
| | | | |
Total | | | 480 | |
| | | | |
Source: House of Representatives.
| | | | |
| | | House of
Councillors | |
The Democratic Party and The Shin-Ryokufukai | | | 88 | |
Liberal Democratic Party, The Sunrise Party of Japan and Group of Independents | | | 87 | |
New Komeito | | | 19 | |
People’s Life First | | | 12 | |
Your Party | | | 11 | |
Japanese Communist Party | | | 6 | |
Social Democratic Party | | | 4 | |
Green Wind | | | 4 | |
The People’s New Party | | | 3 | |
New Renaissance Party | | | 2 | |
New Party DAICHI-SHINMINSHU | | | 2 | |
Independents | | | 4 | |
Vacancies | | | 0 | |
| | | | |
Total | | | 242 | |
| | | | |
Source: House of Councillors.
International Organizations
Japan is a member of the United Nations and other international organizations, including the International Monetary Fund, International Bank for Reconstruction and Development, International Development Association, International Finance Corporation, International Fund for Agricultural Development, Multilateral Investment Fund, Multilateral Investment Guarantee Agency, Asian Development Bank, African Development Bank, African Development Fund, European Bank for Reconstruction and Development, Inter-American Development Bank and Inter-American Investment Corporation. See “Subscriptions to International Financial Organizations”.
5
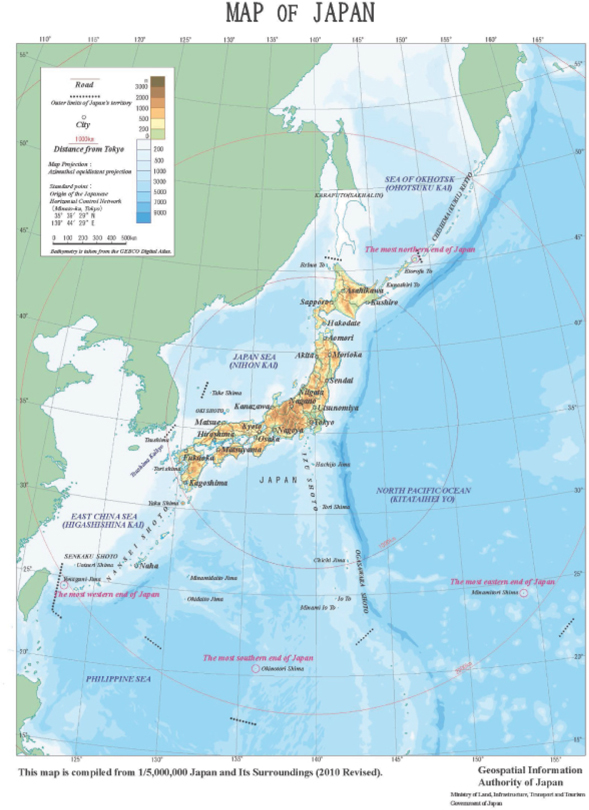
The following is a map of Japan, illustrating its location with respect to neighboring countries:
6
THE ECONOMY
General
Japan has a highly advanced and diversified economy, which has developed in response to changing conditions in Japan and the world. During the era of high economic growth in the 1960s and the early 1970s, the expansion was based on the development of heavy industries consuming large quantities of resources. During the 1980s, there was rapid growth in high value-added industries, such as electronics and precision instruments, which employ high level technology and consume relatively low quantities of resources. The service sector of the economy grew significantly during the 1980s and 1990s.
While the Japanese economy expanded during the period from 2002 to 2007, amidst that expansion, and prior to the global economic crisis of 2008, Japan continued to face several domestic economic difficulties. Among other things, domestic consumption contributed to the economic recovery to a lesser degree than was the case in prior economic growth periods. Also, despite the improving employment environment at the time, the average wage failed to grow appreciably. While those Japanese manufacturing companies with a global competitive edge achieved growth on the back of the favorable world economy, small-to-medium enterprises and the non-manufacturing sectors realized only limited productivity growth and profitability. This in turn caused imbalance in the level of economic recovery among the different regions in Japan. In the longer term, Japan faced a declining population, mass retirement of the baby boomer generation, environmental/energy conservation agenda, and fiscal deficit problem. Against this backdrop, the subprime loan crisis in the United States and increases in the prices of energy and raw materials precipitated weakness in the global economy, causing the Japanese economy to deteriorate. Throughout JFY 2008, the global economy continued to worsen, as the collapse of several major financial institutions in the United States and other factors contributed to a credit tightening, volatility in stock, currency and other markets, loss of consumer confidence and decrease in business and industrial activities on a global basis. The Japanese economy was also adversely affected by these factors, especially as Japan’s export sector was hit by the decline in global demand and appreciation of the yen against other major currencies. After February 2008, Japan had entered a recession. The Japanese economy in JFY 2010 picked up, despite a difficult situation where the unemployment rate remained at a high level. The GDP growth rate at constant prices (real GDP growth) in JFY 2010 turned positive to 3.3%, up from -2.1% in the previous fiscal year. The GDP growth rate at current prices (nominal GDP growth), which more directly reflects people’s sentiment toward the economy, also showed improvement in JFY 2010 to 1.2%, up from -3.2% in JFY 2009 after a decline for two consecutive fiscal years.
On March 11, 2011, just as the Japanese economy was in a transition from the state of stagnation to recovery, the Great East Japan Earthquake (“Earthquake”) struck Japan. As a result, the Japanese economy posted negative growth for the first and second quarter in 2011. Unlike the cases of the Great Hanshin-Awaji Earthquake in 1995 or Hurricane Katrina in 2005, personal consumption declined on a nationwide basis, with consumer sentiment deteriorating sharply after the Earthquake. The Earthquake had a severe impact on production in Japan through the shutdown of damaged factories, disruptions of the supply chains and power supply constraints. In particular, the Earthquake affected Japan’s auto industry which depends on the Tohoku region for the supply of key parts including semiconductors and other electronic components. The supply constraints and the slower growth in corporate earnings in the aftermath of the Earthquake also put downward pressure on capital investment activities. The Earthquake was accompanied by a nuclear power plant accident, which not only caused power supply constraints but also had a chilling effect on certain business activities, such as in the tourism and leisure sectors. Following the Earthquake, the number of visitors to Japan from foreign countries dropped by approximately half from the monthly averages in the prior year. The Earthquake and its aftermath prompted the Government of Japan to compile a series of supplementary budgets to support reconstruction efforts. On May 2, 2011, a first supplementary budget of approximately ¥4 trillion was approved by the Diet to finance reconstruction relating to damages from the Earthquake and tsunami. The budget was aimed at disaster relief, including providing temporary housing, rebuilding of facilities and disaster assistance loans. On July 25, 2011, the Japanese government approved a second supplementary budget of approximately ¥2 trillion aimed at further disaster relief, including increasing the Contingency Reserve for Recovery from the Great East Japan Earthquake. On November 21, 2011, the Japanese government approved the third supplementary budget of approximately ¥12 trillion aimed at disaster relief, including provision of emergency support to people affected by the disaster and reconstruction of public utilities and facilities. On February 8, 2012, the Japanese government approved the fourth supplementary budget of approximately ¥2.5 trillion aimed at meeting additional financial demand of utmost necessity and urgency.
7
The Earthquake and the nuclear disaster in Fukushima were followed by a severe flooding that occurred at the end of July in Thailand, Japan’s sixth largest trading country in both export and import. With approximately 90% of Japan’s Thailand-bound export being intermediary materials for cars and electronics, the suspended operations of the local factories has suppressed the export of these goods and thereby adversely affect the Japanese economy.
Thus, JFY 2011 started in a very challenging environment, with the Earthquake seriously crippling the economy and posting negative growth for the first quarter. Over time, the government and the people joined forces in an all-out effort to rebuild the social and economic infrastructure, facilitating a rapid recovery of the supply chains and helping the economy on a track to a gradual recovery. Since the summer of 2011, however, the rapid appreciation in yen, the reduced external demand due to the Thai flooding (as described above) and deceleration in the world economy stemming from the European sovereign debt crisis kept such recovery to a modest level. The real GDP marked a negative growth by 0.0% during JFY 2011, with the nominal GDP posting a negative growth by 2.0%. Consumer prices have remained stable since the Earthquake, although households’ expected inflation rate has risen due to a rise in crude oil prices and the post-Earthquake supply constraints. The Cabinet Office of the Government of Japan currently expects the Japanese economy to recover moderately during JFY 2012, posting real GDP growth of 2.2% and the nominal GDP growth of 2.0%.
The Japanese economy faces certain challenges. The strong yen may also lead to the Japanese companies’ relocation overseas and local procurement of manufacturing materials, resulting in loss of employment in Japan. Further challenges for the Japanese economy include, as further described herein, an increased dependence on LNG and other energy imports as a result of the nuclear accident at the Fukushima Daiichi Nuclear Plant and suspension of operations at other nuclear power plants and, over the long term, demographic challenges, such as an aging workforce and population decrease, and the high levels of public debt and associated debt servicing payments.
Quantitative Impact of Declining Global Demand and Yen Appreciation
The recent global uncertainty may adversely affect the global economic environment as well as the currency exchange rates, which in turn may negatively affect Japan’s economy. The following tables illustrate quantitative impact on Japan’s economy in cases of declining world demand and appreciation in yen according to The ESRI Short-Run Macroeconometric Model of the Japanese Economy (January 2011):
Downward pressure on the business activities if the global demand decreases by 1%
| | | | | | |
| | | Export | | Capital investment | | GDP |
First year | | (0.4) | | (0.1) | | (0.1) |
Second year | | (0.6) | | (0.1) | | (0.1) |
(Note) Difference ratio (%) from the standard case.
Downward pressure on the business activities by yen appreciation (increase against the dollar by 10%)
| | | | | | |
| | | Export | | Capital investment | | GDP |
First year | | (1.7) | | 0.0 | | (0.2) |
Second year | | (2.1) | | (0.2) | | (0.4) |
(Note) Difference ratio (%) from the standard case.
(Companies’ anticipated foreign exchange rate: FY2011 ¥82.59/dollar (researched in June) source: Bank of Japan, TANKAN)
8
Gross Domestic Product and National Income
The following table sets forth information pertaining to Japan’s gross domestic product for JFY 2007 through JFY 2011.
Gross Domestic Product
| | | | | | | | | | | | | | | | | | | | | | | | |
| | | JFY 2007 | | | JFY 2008 | | | JFY 2009 | | | JFY 2010 | | | JFY 2011 | | | Percentage
of
JFY 2011
GDP | |
Total Consumption | | | | | | | | | | | | | | | | | | | | | | | | |
Private sectors | | ¥ | 294,728 | | | ¥ | 288,105 | | | ¥ | 284,237 | | | ¥ | 284,182 | | | ¥ | 284,952 | | | | 60.6 | % |
Public sectors | | | 93,256 | | | | 92,895 | | | | 94,244 | | | | 95,784 | | | | 97,181 | | | | 20.7 | |
| | | | | | | | | | | | | | | | | | | | | | | | |
| | | 387,983 | | | | 381,000 | | | | 378,481 | | | | 379,967 | | | | 382,133 | | | | 81.3 | |
| | | | | | |
Total Gross Capital Formation | | | | | | | | | | | | | | | | | | | | | | | | |
Private sectors | | | | | | | | | | | | | | | | | | | | | | | | |
Producers’ Durable Equipment | | | 76,832 | | | | 71,015 | | | | 60,771 | | | | 62,030 | | | | 62,117 | | | | 13.2 | |
Residential Construction | | | 16,354 | | | | 16,528 | | | | 12,642 | | | | 12,997 | | | | 13,560 | | | | 2.9 | |
Public sectors | | | 22,083 | | | | 21,200 | | | | 22,829 | | | | 21,443 | | | | 22,242 | | | | 4.7 | |
| | | | | | | | | | | | | | | | | | | | | | | | |
| | | 115,269 | | | | 108,743 | | | | 96,241 | | | | 96,470 | | | | 97,919 | | | | 20.8 | |
| | | | | | |
Additions to Business Inventories | | | | | | | | | | | | | | | | | | | | | | | | |
Private sectors | | | 1,658 | | | | 1,341 | | | | (5,144 | ) | | | (1,305 | ) | | | (3,738 | ) | | | -0.8 | |
Public sectors | | | 52 | | | | 55 | | | | (33 | ) | | | (76 | ) | | | 47 | | | | 0.0 | |
| | | | | | | | | | | | | | | | | | | | | | | | |
| | | 1,710 | | | | 1,396 | | | | (5,177 | ) | | | (1,380 | ) | | | (3,691 | ) | | | -0.8 | |
| | | | | | |
Net Exports of Goods and Services | | | 8,062 | | | | (1,619 | ) | | | 4,316 | | | | 4,300 | | | | (6,380 | ) | | | -1.4 | |
| | | | | | | | | | | | | | | | | | | | | | | | |
Nominal Gross Domestic Expenditures | | ¥ | 513,023 | | | ¥ | 489,520 | | | ¥ | 473,862 | | | ¥ | 479,356 | | | ¥ | 469,981 | | | | 100.0 | % |
| | | | | | | | | | | | | | | | | | | | | | | | |
Real Gross Domestic Expenditures(a) | | ¥ | 525,470 | | | ¥ | 505,803 | | | ¥ | 495,422 | | | ¥ | 511,725 | | | ¥ | 511,527 | | | | | |
| | | | | | | | | | | | | | | | | | | | | | | | |
Surplus of the Nation on Current Account | | | | | | | | | | | | | | | | | | | | | | | | |
Exports of Goods and Services and Other Receipts from Abroad | | | 26,710 | | | | 23,202 | | | | 18,434 | | | | 18,641 | | | | 20,595 | | | | | |
Less: Imports of Goods and Services and Other Payments Abroad | | | (8,981 | ) | | | (7,929 | ) | | | (5,364 | ) | | | (5,383 | ) | | | (5,806 | ) | | | | |
| | | | | | | | | | | | | | | | | | | | | | | | |
| | | 17,730 | | | | 15,272 | | | | 13,070 | | | | 13,259 | | | | 14,789 | | | | | |
| | | | | | | | | | | | | | | | | | | | | | | | |
Gross National Income | | ¥ | 530,753 | | | ¥ | 504,792 | | | ¥ | 486,932 | | | ¥ | 492,615 | | | ¥ | 484,770 | | | | | |
Percentage Changes of GDP from Previous Year | | | | | | | | | | | | | | | | | | | | | | | | |
At Nominal Prices | | | 0.8 | % | | | -4.6 | % | | | -3.2 | % | | | 1.2 | % | | | -2.0 | % | | | | |
At Real Prices(a) | | | 1.8 | | | | -3.7 | | | | -2.1 | | | | 3.3 | | | | -0.0 | | | | | |
Deflator | | | -1.0 | | | | -0.9 | | | | -1.2 | | | | -2.1 | | | | -1.9 | | | | | |
| (a) | Real prices are based on calendar year 2000. |
Source: Economic and Social Research Institute, Cabinet Office.
9
The following table sets forth information pertaining to Japan’s gross domestic product, as seasonally adjusted, for each of the eight quarters ended June 30, 2012.
| | | | | | | | | | | | | | | | | | | | | | | | | | | | | | | | |
| | | Quarterly Gross Domestic Product(a) | |
| | | JFY 2010 | | | JFY 2011 | | | JFY 2012 | |
| | | Second
Quarter | | | Third
Quarter | | | Fourth
Quarter | | | First
Quarter | | | Second
Quarter | | | Third
Quarter | | | Fourth
Quarter | | | First
Quarter | |
Nominal Gross Domestic Expenditures(b) | | ¥ | 483,894 | | | ¥ | 481,133 | | | ¥ | 469,758 | | | ¥ | 463,338 | | | ¥ | 470,751 | | | ¥ | 469,525 | | | ¥ | 476,054 | | | ¥ | 475,396 | |
| | | | | | | | | | | | | | | | | | | | | | | | | | | | | | | | |
Real Gross Domestic Expenditures(b)(c) | | ¥ | 515,332 | | | ¥ | 515,357 | | | ¥ | 505,071 | | | ¥ | 502,694 | | | ¥ | 511,781 | | | ¥ | 512,188 | | | ¥ | 519,076 | | | ¥ | 520,836 | |
| | | | | | | | | | | | | | | | | | | | | | | | | | | | | | | | |
Percentage Changes of GDP from the Previous Quarter At Nominal Prices(d) | | | 0.1% | | | | -0.6 % | | | | -2.4% | | | | -1.4% | | | | 1.6% | | | | -0.3 % | | | | 1.4% | | | | -0.1% | |
At Real Prices(c)(d) | | | 0.8 | | | | 0.0 | | | | -2.0 | | | | -0.5 | | | | 1.8 | | | | 0.1 | | | | 1.3 | | | | 0.3 | |
Deflator(d) | | | -0.6 | | | | -0.6 | | | | -0.4 | | | | -0.9 | | | | -0.2 | | | | -0.3 | | | | 0.0 | | | | -0.5 | |
| (a) | Quarterly GDP financial data are subject to change. |
| (b) | Numbers are based on seasonally-adjusted GDP figures. |
| (c) | Real prices are based on calendar year 2005. |
| (d) | Percentage changes are based on seasonally-adjusted GDP figures. |
Source: Economic and Social Research Institute, Cabinet Office.
Per Capita Gross Domestic Product
The following table indicates per capita gross domestic product for the last five years:
| | | | |
| | | Per Capita GDP |
Fiscal Year | | Amount
(in thousands of yen) | | Year-on-year change (%) |
2006 | | 3,981 | | 0.6 |
2007 | | 4,008 | | 0.7 |
2008 | | 3,822 | | (4.6) |
2009 | | 3,700 | | (3.2) |
2010 | | 3,742 | | 1.1 |
National Income
The following table sets forth national income for calendar year 2006 through calendar year 2010.
| | | | | | | | | | | | | | | | | | | | |
| | | National Income | |
| | | 2006 | | | 2007 | | | 2008 | | | 2009 | | | 2010 | |
| | | (yen amounts in billions) | |
| | | | | |
Domestic Factor Income | | | | | | | | | | | | | | | | | | | | |
Net Income from Abroad | | ¥ | 360,923 | | | ¥ | 364,908 | | | ¥ | 350,438 | | | ¥ | 327,146 | | | ¥ | 335,258 | |
| | | 14,399 | | | | 17,198 | | | | 16,511 | | | | 12,629 | | | | 12,257 | |
| | | | | | | | | | | | | | | | | | | | |
National Income at Factor Cost | | ¥ | 375,323 | | | ¥ | 382,106 | | | ¥ | 366,949 | | | ¥ | 339,775 | | | ¥ | 347,515 | |
| | | | | | | | | | | | | | | | | | | | |
Percentage Changes of Income at Factor Cost from Previous Year | | | 0.4 | % | | | 1.8 | % | | | -4.0 | % | | | -7.4 | % | | | 2.3 | % |
Source: Economic and Social Research Institute, Cabinet Office.
10
Industry
The following table sets forth the proportion of gross domestic product contributed by major industrial sectors of the economy for calendar year 2006 through calendar year 2010.
GDP by Industrial Sectors (at nominal prices)
| | | | | | | | | | | | | | | | | | | | |
| | | 2006 | | | 2007 | | | 2008 | | | 2009 | | | 2010 | |
Industry | | | | | | | | | | | | | | | | | | | | |
Agriculture, Forestry and Fisheries | | | 1.2% | | | | 1.1% | | | | 1.1% | | | | 1.2% | | | | 1.2% | |
Mining | | | 0.1 | | | | 0.1 | | | | 0.1 | | | | 0.1 | | | | 0.1 | |
Manufacturing | | | 19.8 | | | | 20.2 | | | | 19.7 | | | | 17.7 | | | | 19.4 | |
Construction | | | 5.8 | | | | 5.7 | | | | 5.6 | | | | 5.7 | | | | 5.5 | |
Electric Power Generation, Gas and Water | | | 2.2 | | | | 2.0 | | | | 1.9 | | | | 2.4 | | | | 2.3 | |
Wholesale and Retail Trade | | | 14.2 | | | | 13.6 | | | | 14.0 | | | | 13.6 | | | | 13.4 | |
Finance and Insurance | | | 6.0 | | | | 6.0 | | | | 5.0 | | | | 5.0 | | | | 4.9 | |
Real Estate | | | 10.9 | | | | 10.9 | | | | 11.2 | | | | 12.1 | | | | 11.8 | |
Transportation and Communication | | | 5.0 | | | | 5.2 | | | | 5.1 | | | | 4.9 | | | | 4.9 | |
Services | | | 17.9 | | | | 18.3 | | | | 18.9 | | | | 19.4 | | | | 19.1 | |
| | | | | | | | | | | | | | | | | | | | |
Total | | | 88.4 | | | | 88.4 | | | | 88.0 | | | | 87.6 | | | | 87.9 | |
Public Services | | | | | | | | | | | | | | | | | | | | |
Electric Power Generation, Gas and Water | | | 0.6 | | | | 0.6 | | | | 0.6 | | | | 0.7 | | | | 0.6 | |
Services | | | 2.4 | | | | 2.4 | | | | 2.4 | | | | 2.5 | | | | 2.4 | |
Public Administration | | | 5.9 | | | | 5.9 | | | | 6.1 | | | | 6.4 | | | | 6.1 | |
| | | | | | | | | | | | | | | | | | | | |
Total | | | 9.0 | | | | 8.9 | | | | 9.2 | | | | 9.6 | | | | 9.2 | |
Non-Profit Services | | | 2.0 | | | | 1.9 | | | | 2.0 | | | | 2.1 | | | | 2.1 | |
| | | | | | | | | | | | | | | | | | | | |
Total | | | 99.3% | | | | 99.3% | | | | 99.1% | | | | 99.2% | | | | 99.1% | |
| | | | | | | | | | | | | | | | | | | | |
Source: Economic and Social Research Institute, Cabinet Office, Annual Report on National Accounts.
Energy
The following table sets forth the total amounts of primary energy supplied and the percentages supplied by different sources for JFY 2006 through JFY 2010.
| | | | | | | | | | | | |
| | | Sources of Primary Energy Supplied |
JFY | | Total Primary
Energy
Supplied (peta-
joule) | | Oil | | Coal | | Nuclear | | Natural
Gas | | Other |
2006 | | 23,773 | | 47.0 | | 20.5 | | 11.2 | | 15.1 | | 6.1 |
2007 | | 23,855 | | 47.0 | | 21.3 | | 9.7 | | 16.3 | | 5.7 |
2008 | | 23,218 | | 46.4 | | 21.4 | | 9.7 | | 16.7 | | 5.8 |
2009 | | 21,743 | | 45.2 | | 20.3 | | 11.1 | | 17.4 | | 6.0 |
2010 | | 23,123 | | 43.7 | | 21.6 | | 10.8 | | 17.3 | | 6.6 |
Source: Agency for Natural Resources and Energy, Ministry of Economy, Trade and Industry, Report on Energy Supply and Demand.
During JFY 2011, largely due to the effects of the Earthquake, the import of LNG increased significantly as the demand increased for power generation at thermal power stations. See “Foreign Trade and Balance of Payments—Foreign Trade”.
11
The table below sets forth information regarding crude oil imports for JFY 2007 through JFY 2011.
| | | | | | | | | | | | | | | | | | | | |
| | | JFY 2007 | | | JFY 2008 | | | JFY 2009 | | | JFY 2010 | | | JFY 2011 | |
Volume of imports (thousand kilo-liters per day) | | | 666 | | | | 638 | | | | 583 | | | | 589 | | | | 575 | |
Cost of imports (c.i.f. in billions of yen) | | ¥ | 13,693 | | | ¥ | 13,640 | | | ¥ | 8,587 | | | ¥ | 9,756 | | | ¥ | 11,894 | |
Average price (c.i.f. in yen kilo-liters) | | ¥ | 56,335 | | | ¥ | 58,541 | | | ¥ | 40,374 | | | ¥ | 45,373 | | | ¥ | 56,678 | |
Source: Customs and Tariff Bureau, Ministry of Finance.
Japan has historically depended on oil for most of its energy requirements and almost all its oil is imported, mostly from the Middle East. Oil price movements thus have a major impact on the domestic economy. Recently, as the demand for oil in emerging economies such as China and India has expanded and the geopolitical tension in the Middle East worsened, crude oil prices increased significantly.
Japan has worked to reduce its dependence on oil by encouraging energy conservation and the use of alternative fuels. In addition, a restructuring of industry, with emphasis shifting from primary industries to processing and assembly type industries and from manufacturing industry to service industry, has also contributed to the reduction of oil consumption.
The following table sets forth information relating to total electric power generating capacity and electric power generation for JFY 2006 through JFY 2010.
| | | | | | | | | | | | | | | | | | | | |
| | | JFY 2006 | | | JFY 2007 | | | JFY 2008 | | | JFY 2009 | | | JFY 2010 | |
Electric power generating capacity (a): | | | (megawatts) | |
Fossil Fuel | | | 176,350 | | | | 176,412 | | | | 179,324 | | | | 181,736 | | | | 182,381 | |
Nuclear | | | 49,467 | | | | 49,467 | | | | 47,935 | | | | 48,847 | | | | 48,960 | |
Hydro-electric | | | 47,375 | | | | 47,637 | | | | 47,949 | | | | 47,966 | | | | 48,111 | |
Other | | | 1,796 | | | | 2,072 | | | | 2,302 | | | | 2,549 | | | | 2,863 | |
| | | | | | | | | | | | | | | | | | | | |
Total | | | 274,988 | | | | 275,588 | | | | 277,511 | | | | 281,099 | | | | 282,315 | |
| | | | | | | | | | | | | | | | | | | | |
Electric power generation: | | | (gigawatt-hour) | |
Fossil Fuel | | | 755,084 | | | | 841,289 | | | | 798,930 | | | | 742,522 | | | | 771,339 | |
Nuclear | | | 303,426 | | | | 263,832 | | | | 258,128 | | | | 279,750 | | | | 288,230 | |
Hydro-electric | | | 97,340 | | | | 84,234 | | | | 83,504 | | | | 83,832 | | | | 90,681 | |
Other | | | 5,260 | | | | 5,676 | | | | 5,708 | | | | 6,518 | | | | 6,670 | |
| | | | | | | | | | | | | | | | | | | | |
Total | | | 1,161,110 | | | | 1,195,032 | | | | 1,146,269 | | | | 1,112,622 | | | | 1,156,921 | |
| | | | | | | | | | | | | | | | | | | | |
| (a) | At the end of fiscal year — March 31. |
Source: Handbook of Electric Power Industry, Agency for Natural Resources and Energy, Ministry of Economy, Trade and Industry.
Price Indices
The table below sets forth information concerning changes in Japan’s wholesale and consumer price indices for the periods indicated.
| | | | | | | | | | | | | | | | |
| | | Corporate Goods Price
Index(a) | | | Consumer Price
Index(b) | |
| | | Index(c) | | | Annual %
Change | | | Index | | | Annual %
Change | |
2007 | | | 101.1 | | | | 1.8 | | | | 100.7 | | | | 0.0 | |
2008 | | | 105.7 | | | | 4.6 | | | | 102.1 | | | | 1.4 | |
2009 | | | 100.1 | | | | -5.2 | | | | 100.7 | | | | -1.4 | |
2010 | | | 100.0 | | | | -0.1 | | | | 100.0 | | | | -0.7 | |
2011 | | | 101.5 | | | | 1.5 | | | | 99.7 | | | | -0.3 | |
| (a) | All commodities. Calendar year 2010=100. Source: Domestic Corporate Goods Price Index, Bank of Japan. |
| (b) | General index. Calendar year 2010=100. Source: Consumer Price Index, Statistics Bureau, Ministry of Internal Affairs and Communications. |
| (c) | Indices are calculated using the monthly averages. |
12
Labor
The number of employees had been on an upward trend from 2004 to 2007, but has decreased since 2008. In 2009, the average employment was estimated at 62.8 million, of which 25.4% were employed in mining, manufacturing and construction, 4.2% were employed in agriculture, forestry and fisheries, and 70.5% in services and other sectors. In 2010, the average employment was estimated at 62.6 million, of which 24.8% were employed in mining, manufacturing and construction, 4.0% were employed in agriculture, forestry and fisheries, and 71.2% were employed in services and other sectors. The unemployment rate (seasonally adjusted) in Japan gradually increased from 2008 to the middle of 2009, but has gradually decreased since the end of 2009. It ranged between 4.2% and 4.9% during 2011. (Note: Due to the impact of the Great East Japan Earthquake, it has become difficult to conduct a labor search in the following prefectures, Iwate, Miyagi and Fukushima. For this reason, the nationwide unemployment rate for the period between March 2011 and August 2011 does not account for these three prefectures.) The seasonally adjusted unemployment rate was 4.5% for March, 4.6% for April, 4.4% for May and 4.3% for June in 2012, the most recent four months for which statistics are available.
The following table indicates unemployment statistics for Japan for each of the last five years:
| | |
Calendar Year | | Unemployment Rate (%) |
2007 | | 3.9 |
2008 | | 4.0 |
2009 | | 5.1 |
2010 | | 5.1 |
2011 | | 4.6 |
(Note) From the Ministry of Internal Affairs and Communications “Labor Force Survey”. The unemployment rate for CY 2011 is based on an estimate with respect to Iwate, Miyagi and Fukushima Prefectures.
The table below sets forth information regarding wage index (total cash earnings (nominal)) and industrial production index (manufacturing and mining) for the periods indicated.
| | | | | | | | | | | | | | | | |
| | | Wage Index(a) | | | Industrial
Production Index(b) | |
| | | Index(c) | | | Annual %
Change | | | Index | | | Annual
%
Change | |
2007 | | | 103.9 | | | | -1.0 | | | | 107.4 | | | | 2.8 | |
2008 | | | 103.6 | | | | -0.3 | | | | 103.8 | | | | -3.4 | |
2009 | | | 99.5 | | | | -3.9 | | | | 81.1 | | | | -21.9 | |
2010 | | | 100.0 | | | | 0.5 | | | | 94.4 | | | | 16.4 | |
2011 | | | 99.8 | | | | -0.2 | | | | 92.2 | | | | -2.3 | |
| (a) | Calendar year 2010=100. Source: Monthly Labor Survey, Ministry of Health, Labor and Welfare. |
| (b) | Calendar year 2005=100. Source: Ministry of Economy, Trade and Industry. |
| (c) | Indices are calculated using the monthly averages. |
13
Aging Workforce and Population Decrease
One of the risks that the Japanese economy bears is the issue of the aging of the population accompanied with an overall population decrease. Aging and population decrease placed downward pressure on economic growth. The negative impact can be reduced by enhancing productivity and competitiveness through the further opening of the Japanese economy to the world. Aging and population decrease have an impact not only on the macro growth rate but also on spending patterns (such as the older generations spending more than younger generations on service consumption) and, consequently, the country’s economic structure.
The impact of the aging and shrinking population on Japan’s fiscal structure looms as a long-term risk. Social security benefit payments under the current system will increase. The ratio of pensions to national income are expected to remain at the same level, but that of welfare including medical benefits and nursing-care benefits is expected to increase. Aging and population decrease will thus modify the Japanese revenue structure. Furthermore, amid increasing capital mobility, it is imperative for Japan to foster an environment attractive to business enterprises. Under these circumstances, it has become more and more difficult to impose additional tax burdens on the income of individuals and corporations. The effects of the aging and shrinkage of the population would also be prominent in Japan’s regional economies.
14
The following table indicates the age distribution of Japan’s population:
Population and Percentage distribution by Age (5-Year Age Group)
| | | | | | | | | | | | | | | | | | | | |
| | | Both sex | |
Age groups | | 1995* | | | 2000* | | | 2005* | | | 2010* | | | 2011 | |
| | | Population (Thousand persons) | |
Total | | | 125,570 | | | | 126,926 | | | | 127,768 | | | | 128,057 | | | | 127,799 | |
| | | | | |
0 – 4 years old | | | 6,001 | | | | 5,915 | | | | 5,599 | | | | 5,308 | | | | 5,303 | |
5 – 9 | | | 6,547 | | | | 6,033 | | | | 5,950 | | | | 5,598 | | | | 5,490 | |
10 – 14 | | | 7,485 | | | | 6,558 | | | | 6,036 | | | | 5,933 | | | | 5,912 | |
15 – 19 | | | 8,567 | | | | 7,502 | | | | 6,593 | | | | 6,093 | | | | 6,075 | |
20 – 24 | | | 9,907 | | | | 8,438 | | | | 7,381 | | | | 6,525 | | | | 6,370 | |
| | | | | |
25 – 29 | | | 8,799 | | | | 9,809 | | | | 8,314 | | | | 7,391 | | | | 7,219 | |
30 – 34 | | | 8,136 | | | | 8,794 | | | | 9,795 | | | | 8,421 | | | | 8,093 | |
35 – 39 | | | 7,830 | | | | 8,130 | | | | 8,772 | | | | 9,864 | | | | 9,712 | |
40 – 44 | | | 9,015 | | | | 7,814 | | | | 8,113 | | | | 8,809 | | | | 9,315 | |
45 – 49 | | | 10,630 | | | | 8,932 | | | | 7,755 | | | | 8,093 | | | | 7,966 | |
| | | | | |
50 – 54 | | | 8,932 | | | | 10,461 | | | | 8,828 | | | | 7,700 | | | | 7,639 | |
55 – 59 | | | 7,962 | | | | 8,750 | | | | 10,294 | | | | 8,728 | | | | 8,320 | |
60 – 64 | | | 7,483 | | | | 7,750 | | | | 8,577 | | | | 10,112 | | | | 10,632 | |
65 – 69 | | | 6,402 | | | | 7,118 | | | | 7,460 | | | | 8,272 | | | | 7,861 | |
70 – 74 | | | 4,699 | | | | 5,910 | | | | 6,661 | | | | 7,018 | | | | 7,184 | |
| | | | | |
75 – 79 | | | 3,292 | | | | 4,157 | | | | 5,280 | | | | 5,992 | | | | 6,143 | |
80 – 84 | | | 2,303 | | | | 2,619 | | | | 3,423 | | | | 4,376 | | | | 4,494 | |
85 – 89 | | | 1,138 | | | | 1,535 | | | | 1,855 | | | | 2,454 | | | | 2,625 | |
90 – 94 | | | 368 | | | | 571 | | | | 843 | | | | 1,029 | | | | 1,082 | |
95 – 99 | | | 69 | | | | 119 | | | | 212 | | | | 298 | | | | 317 | |
| | | | | |
100 and over | | | 6 | | | | 12 | | | | 25 | | | | 44 | | | | 47 | |
| | | | | |
Regrouped | | | | | | | | | | | | | | | | | | | | |
0 – 14 years old | | | 20,033 | | | | 18,505 | | | | 17,585 | | | | 16,839 | | | | 16,705 | |
15 – 64 | | | 87,260 | | | | 86,380 | | | | 84,422 | | | | 81,735 | | | | 81,342 | |
65 and over | | | 18,277 | | | | 22,041 | | | | 25,761 | | | | 29,484 | | | | 29,752 | |
65 – 74 years old | | | 11,101 | | | | 13,028 | | | | 14,122 | | | | 15,290 | | | | 15,044 | |
75 and over | | | 7,175 | | | | 9,012 | | | | 11,639 | | | | 14,194 | | | | 14,708 | |
15
| | | | | | | | | | | | | | | | | | | | |
| | | Both sex | |
Age groups | | 1995* | | | 2000* | | | 2005* | | | 2010* | | | 2011 | |
| | | Percentage distribution (%) | |
Total | | | 100.00 | | | | 100.00 | | | | 100.00 | | | | 100.00 | | | | 100.00 | |
| | | | | |
0 – 4 years old | | | 4.78 | | | | 4.66 | | | | 4.38 | | | | 4.15 | | | | 4.15 | |
5 – 9 | | | 5.21 | | | | 4.75 | | | | 4.66 | | | | 4.37 | | | | 4.30 | |
10 – 14 | | | 5.96 | | | | 5.17 | | | | 4.72 | | | | 4.63 | | | | 4.63 | |
15 – 19 | | | 6.82 | | | | 5.91 | | | | 5.16 | | | | 4.76 | | | | 4.75 | |
20 – 24 | | | 7.89 | | | | 6.65 | | | | 5.78 | | | | 5.10 | | | | 4.98 | |
| | | | | |
25 – 29 | | | 7.01 | | | | 7.73 | | | | 6.51 | | | | 5.77 | | | | 5.65 | |
30 – 34 | | | 6.48 | | | | 6.93 | | | | 7.67 | | | | 6.58 | | | | 6.33 | |
35 – 39 | | | 6.24 | | | | 6.41 | | | | 6.87 | | | | 7.70 | | | | 7.60 | |
40 – 44 | | | 7.18 | | | | 6.16 | | | | 6.35 | | | | 6.88 | | | | 7.29 | |
45 – 49 | | | 8.47 | | | | 7.04 | | | | 6.07 | | | | 6.32 | | | | 6.23 | |
| | | | | |
50 – 54 | | | 7.11 | | | | 8.24 | | | | 6.91 | | | | 6.01 | | | | 5.98 | |
55 – 59 | | | 6.34 | | | | 6.89 | | | | 8.06 | | | | 6.82 | | | | 6.51 | |
60 – 64 | | | 5.96 | | | | 6.11 | | | | 6.71 | | | | 7.90 | | | | 8.32 | |
65 – 69 | | | 5.10 | | | | 5.61 | | | | 5.84 | | | | 6.46 | | | | 6.15 | |
70 – 74 | | | 3.74 | | | | 4.66 | | | | 5.21 | | | | 5.48 | | | | 5.62 | |
| | | | | |
75 – 79 | | | 2.62 | | | | 3.28 | | | | 4.13 | | | | 4.68 | | | | 4.81 | |
80 – 84 | | | 1.83 | | | | 2.06 | | | | 2.68 | | | | 3.42 | | | | 3.52 | |
85 – 89 | | | 0.91 | | | | 1.21 | | | | 1.45 | | | | 1.92 | | | | 2.05 | |
90 – 94 | | | 0.29 | | | | 0.45 | | | | 0.66 | | | | 0.80 | | | | 0.85 | |
95 – 99 | | | 0.05 | | | | 0.09 | | | | 0.17 | | | | 0.23 | | | | 0.25 | |
| | | | | |
100 and over | | | 0.00 | | | | 0.01 | | | | 0.02 | | | | 0.03 | | | | 0.04 | |
| | | | | |
Regrouped | | | | | | | | | | | | | | | | | | | | |
0 – 14 years old | | | 15.95 | | | | 14.58 | | | | 13.76 | | | | 13.15 | | | | 13.07 | |
15 – 64 | | | 69.49 | | | | 68.06 | | | | 66.07 | | | | 63.83 | | | | 63.65 | |
65 and over | | | 14.56 | | | | 17.36 | | | | 20.16 | | | | 23.02 | | | | 23.28 | |
65 – 74 years old | | | 8.84 | | | | 10.26 | | | | 11.05 | | | | 11.94 | | | | 11.77 | |
75 and over | | | 5.71 | | | | 7.10 | | | | 9.11 | | | | 11.08 | | | | 11.51 | |
(Note) * Statistics Bureau, Ministry of Internal Affairs and Communications, “Population Census”. (Unknown age population is included after being prorated to each age population.)
16
FOREIGN TRADE AND BALANCE OF PAYMENTS
Foreign Trade
Japan is one of the leading trading nations of the world, ranking fourth to China, United States and Germany in merchandise exports and ranking fourth to the United States, China and Germany in merchandise imports among the IMF member countries in 2011.
The trade surplus decreased from ¥10,796 billion in 2007 to trade deficit ¥2,565 billion in 2011 as exports decreased and imports increased. This is Japan’s first trade deficit in 31 years. The primary reasons for the trade deficit include the decline in export due to the effects of the Earthquake and Thailand’s flood and increased imports of LNG. Imports of LNG increased as the demand increased for power generation at thermal power stations after the nuclear accident at the Fukushima Daiichi Nuclear Plant caused suspension of operations at other nuclear plants, resulting in reduced energy supply. In light of the need for a stable supply of energy, it is currently expected that the increase in the import of LNG will continue for the foreseeable future. With commodity prices steadily rising after the collapse of Lehman Brothers in 2008, Japan’s dependence on imports for a large part of its fuel needs (including crude oil and LNG) is expected to result in a further increase in Japan’s overall imports.
The following tables set forth information relating to foreign trade for the years indicated. In these tables exports are stated on an f.o.b. basis and imports on a c.i.f. basis. Monetary figures are based on actual movements of goods as calculated by the Ministry of Finance. (This method of computation differs from that used in calculating balance of payments, in which both exports and imports are stated on an f.o.b. basis.)
Foreign Trade of Japan
| | | | | | | | | | | | | | | | | | | | | | | | | | | | |
| | | Value Index (a) | | | Quantum Index (a) | | | Unit Value(a) Index | | | Terms of
Trade(b) | |
| | | Exports | | | Imports | | | Exports | | | Imports | | | Exports | | | Imports | | | Index | |
2007 | | | 127.8 | | | | 128.4 | | | | 112.9 | | | | 103.7 | | | | 113.2 | | | | 123.9 | | | | 91.4 | |
2008 | | | 123.4 | | | | 138.6 | | | | 111.2 | | | | 103.0 | | | | 111.0 | | | | 134.6 | | | | 82.5 | |
2009 | | | 82.5 | | | | 90.4 | | | | 81.6 | | | | 88.2 | | | | 101.1 | | | | 102.5 | | | | 98.6 | |
2010 | | | 102.7 | | | | 106.7 | | | | 101.4 | | | | 100.5 | | | | 101.3 | | | | 106.2 | | | | 95.4 | |
2011 | | | 99.8 | | | | 119.6 | | | | 98.4 | | | | 103.7 | | | | 101.5 | | | | 115.4 | | | | 88.0 | |
| (a) | Calendar year 2005=100. |
| (b) | Unit value index of exports divided by unit value index of imports, multiplied by 100. |
Source: Japan Tariff Association, Ministry of Finance.
17
Composition of Japan’s Exports and Imports
| | | | | | | | | | | | | | | | | | | | | | | | | | | | | | | | | | | | | | | | |
| | | 2007 | | | 2008 | | | 2009 | | | 2010 | | | 2011 | |
| | | (yen amounts in billions) | |
JAPAN’S EXPORTS | | | | | | | | | | | | | | | | | | | | | | | | | | | | | | | | | | | | | | | | |
Textile Products | | ¥ | 1,033 | | | | 1.2 | % | | ¥ | 941 | | | | 1.3 | % | | ¥ | 715 | | | | 1.3 | % | | ¥ | 783 | | | | 1.2 | % | | ¥ | 812 | | | | 1.2 | % |
Metals and Metal Products | | | 6,719 | | | | 8.0 | | | | 7,152 | | | | 8.8 | | | | 4,725 | | | | 8.7 | | | | 5,993 | | | | 8.9 | | | | 5,997 | | | | 9.1 | |
Machinery and Equipment: | | | | | | | | | | | | | | | | | | | | | | | | | | | | | | | | | | | | | | | | |
Ships | | | 1,751 | | | | 2.1 | | | | 1,995 | | | | 2.5 | | | | 2,018 | | | | 3.7 | | | | 2,242 | | | | 3.3 | | | | 2,046 | | | | 3.1 | |
Motor Vehicles | | | 14,317 | | | | 17.1 | | | | 13,736 | | | | 17.0 | | | | 6,693 | | | | 12.4 | | | | 9,174 | | | | 13.6 | | | | 8,204 | | | | 12.5 | |
TV and Radio Receivers | | | 291 | | | | 0.3 | | | | 216 | | | | 0.3 | | | | 104 | | | | 0.2 | | | | 110 | | | | 0.2 | | | | 101 | | | | 0.2 | |
Motorcycles | | | 739 | | | | 0.9 | | | | 597 | | | | 0.7 | | | | 296 | | | | 0.5 | | | | 274 | | | | 0.4 | | | | 266 | | | | 0.4 | |
Scientific and Optical Instruments | | | 2,090 | | | | 2.5 | | | | 2,024 | | | | 2.5 | | | | 1,578 | | | | 2.9 | | | | 2,014 | | | | 3.0 | | | | 2,109 | | | | 3.2 | |
Other(1) | | | 37,424 | | | | 44.6 | | | | 34,916 | | | | 43.1 | | | | 23,247 | | | | 42.9 | | | | 29,516 | | | | 43.8 | | | | 28,916 | | | | 44.1 | |
| | | | | | | | | | | | | | | | | | | | | | | | | | | | | | | | | | | | | | | | |
Total Machinery and Equipment | | | 56,614 | | | | 67.5 | | | | 53,484 | | | | 66.0 | | | | 33,936 | | | | 62.6 | | | | 43,330 | | | | 64.3 | | | | 41,642 | | | | 63.5 | |
Chemicals | | | 7,745 | | | | 9.2 | | | | 7,269 | | | | 9.0 | | | | 5,780 | | | | 10.7 | | | | 6,925 | | | | 10.3 | | | | 6,798 | | | | 10.4 | |
Foods and Beverages | | | 417 | | | | 0.5 | | | | 403 | | | | 0.5 | | | | 366 | | | | 0.7 | | | | 406 | | | | 0.6 | | | | 359 | | | | 0.5 | |
Other Exports(2) | | | 11,403 | | | | 13.6 | | | | 11,768 | | | | 14.5 | | | | 8,650 | | | | 16.0 | | | | 9,963 | | | | 14.8 | | | | 9,938 | | | | 15.2 | |
| | | | | | | | | | | | | | | | | | | | | | | | | | | | | | | | | | | | | | | | |
Grand Total | | ¥ | 83,931 | | | | 100.0 | % | | ¥ | 81,018 | | | | 100.0 | % | | ¥ | 54,171 | | | | 100.0 | % | | ¥ | 67,400 | | | | 100.0 | % | | ¥ | 65,546 | | | | 100.0 | % |
| | | | | | | | | | | | | | | | | | | | | | | | | | | | | | | | | | | | | | | | |
| | | | | | | | | | | | | | | | | | | | | | | | | | | | | | | | | | | | | | | | |
| | | 2007 | | | 2008 | | | 2009 | | | 2010 | | | 2011 | |
| | | (yen amounts in billions) | |
JAPAN’S IMPORTS | | | | | | | | | | | | | | | | | | | | | | | | | | | | | | | | | | | | | | | | |
Foods and Beverages | | ¥ | 6,041 | | | | 8.3 | % | | ¥ | 6,212 | | | | 7.9 | % | | ¥ | 4,999 | | | | 9.7 | % | | ¥ | 5,199 | | | | 8.6 | % | | ¥ | 5,854 | | | | 8.6 | % |
Raw Materials | | | 5,670 | | | | 7.8 | | | | 5,538 | | | | 7.0 | | | | 3,395 | | | | 6.6 | | | | 4,766 | | | | 7.8 | | | | 5,270 | | | | 7.7 | |
Chemicals | | | 5,471 | | | | 7.5 | | | | 5,737 | | | | 7.3 | | | | 4,583 | | | | 8.9 | | | | 5,379 | | | | 8.9 | | | | 6,098 | | | | 9.0 | |
Mineral Fuels: | | | | | | | | | | | | | | | | | | | | | | | | | | | | | | | | | | | | | | | | |
Petroleum | | | 12,279 | | | | 16.8 | | | | 16,262 | | | | 20.6 | | | | 7,564 | | | | 14.7 | | | | 9,406 | | | | 15.5 | | | | 11,415 | | | | 16.8 | |
Coal | | | 1,740 | | | | 2.4 | | | | 3,051 | | | | 3.9 | | | | 2,057 | | | | 4.0 | | | | 2,111 | | | | 3.5 | | | | 2,459 | | | | 3.6 | |
Other(3) | | | 6,187 | | | | 8.5 | | | | 8,346 | | | | 10.6 | | | | 4,581 | | | | 8.9 | | | | 5,881 | | | | 9.7 | | | | 7,942 | | | | 11.7 | |
| | | | | | | | | | | | | | | | | | | | | | | | | | | | | | | | | | | | | | | | |
Total Mineral Fuel | | | 20,206 | | | | 27.6 | | | | 27,658 | | | | 35.0 | | | | 14,202 | | | | 27.6 | | | | 17,398 | | | | 28.6 | | | | 21,816 | | | | 32.0 | |
Machinery and Equipment | | | 20,239 | | | | 27.7 | | | | 18,736 | | | | 23.7 | | | | 13,518 | | | | 26.2 | | | | 16,070 | | | | 26.4 | | | | 16,176 | | | | 23.7 | |
Other Imports(4) | | | 15,508 | | | | 21.2 | | | | 15,072 | | | | 19.1 | | | | 10,803 | | | | 21.0 | | | | 11,952 | | | | 19.7 | | | | 12,897 | | | | 18.9 | |
| | | | | | | | | | | | | | | | | | | | | | | | | | | | | | | | | | | | | | | | |
Grand Total | | ¥ | 73,136 | | | | 100.0 | % | | ¥ | 78,955 | | | | 100.0 | % | | ¥ | 51,499 | | | | 100.0 | % | | ¥ | 60,765 | | | | 100.0 | % | | ¥ | 68,111 | | | | 100.0 | % |
| | | | | | | | | | | | | | | | | | | | | | | | | | | | | | | | | | | | | | | | |
| (1) | This category includes general machinery, electronic components including semiconductors and electronic equipment including electronic circuit. |
| (2) | This category includes raw materials, mineral fuels and vehicle parts. |
| (3) | This category includes liquid natural gas and petroleum products. |
| (4) | This category includes clothing and accessories thereof, non-ferrous metal and scientific and optical instruments. |
Source: The Summary Report on Trade of Japan, Japan Tariff Association, Ministry of Finance.
Geographic Distribution of Japan’s Exports and Imports
| | | | | | | | | | | | | | | | | | | | | | | | | | | | | | | | | | | | | | | | |
| | | 2007 | | | 2008 | | | 2009 | | | 2010 | | | 2011 | |
| | | (yen amounts in billions) | |
JAPAN’S EXPORTS | | | | | | | | | | | | | | | | | | | | | | | | | | | | | | | | | | | | | | | | |
Asia | | ¥ | 40,400 | | | | 48.1 | % | | ¥ | 39,966 | | | | 49.3 | % | | ¥ | 29,338 | | | | 54.2 | % | | ¥ | 37,827 | | | | 56.1 | % | | ¥ | 36,686 | | | | 56.0 | % |
China | | | 12,839 | | | | 15.3 | | | | 12,950 | | | | 16.0 | | | | 10,236 | | | | 18.9 | | | | 13,086 | | | | 19.4 | | | | 12,902 | | | | 19.7 | |
(Asia NIES) | | | 18,796 | | | | 22.4 | | | | 17,885 | | | | 22.1 | | | | 12,717 | | | | 23.5 | | | | 15,968 | | | | 23.7 | | | | 14,917 | | | | 22.8 | |
(ASEAN) | | | 10,241 | | | | 12.2 | | | | 10,726 | | | | 13.2 | | | | 7,499 | | | | 13.8 | | | | 9,882 | | | | 14.7 | | | | 9,799 | | | | 14.9 | |
Oceania | | | 2,104 | | | | 2.5 | | | | 2,200 | | | | 2.7 | | | | 1,409 | | | | 2.6 | | | | 1,796 | | | | 2.7 | | | | 1,778 | | | | 2.7 | |
Australia | | | 1,669 | | | | 2.0 | | | | 1,793 | | | | 2.2 | | | | 1,135 | | | | 2.1 | | | | 1,392 | | | | 2.1 | | | | 1,418 | | | | 2.2 | |
North America | | | 18,135 | | | | 21.6 | | | | 15,331 | | | | 18.9 | | | | 9,456 | | | | 17.5 | | | | 11,191 | | | | 16.6 | | | | 10,727 | | | | 16.4 | |
U.S.A. | | | 16,896 | | | | 20.1 | | | | 14,214 | | | | 17.5 | | | | 8,733 | | | | 16.1 | | | | 10,374 | | | | 15.4 | | | | 10,018 | | | | 15.3 | |
Canada | | | 1,238 | | | | 1.5 | | | | 1,116 | | | | 1.4 | | | | 723 | | | | 1.3 | | | | 817 | | | | 1.2 | | | | 709 | | | | 1.1 | |
Central and South America | | | 4,130 | | | | 4.9 | | | | 4,247 | | | | 5.2 | | | | 3,085 | | | | 5.7 | | | | 3,874 | | | | 5.7 | | | | 3,528 | | | | 5.4 | |
Western Europe | | | 12,329 | | | | 14.7 | | | | 11,445 | | | | 14.1 | | | | 7,077 | | | | 13.1 | | | | 8,004 | | | | 11.9 | | | | 8,150 | | | | 12.4 | |
EU | | | 12,398 | | | | 14.8 | | | | 11,430 | | | | 14.1 | | | | 6,749 | | | | 12.5 | | | | 7,616 | | | | 11.3 | | | | 7,619 | | | | 11.6 | |
Central and Eastern Europe, Russia etc. | | | 2,389 | | | | 2.8 | | | | 2,932 | | | | 3.6 | | | | 905 | | | | 1.7 | | | | 1,435 | | | | 2.1 | | | | 1,670 | | | | 2.5 | |
Russia | | | 1,265 | | | | 1.5 | | | | 1,714 | | | | 2.1 | | | | 307 | | | | 0.6 | | | | 703 | | | | 1.0 | | | | 941 | | | | 1.4 | |
Middle East | | | 3,078 | | | | 3.7 | | | | 3,508 | | | | 4.3 | | | | 2,013 | | | | 3.7 | | | | 2,216 | | | | 3.3 | | | | 1,955 | | | | 3.0 | |
Africa | | | 1,365 | | | | 1.6 | | | | 1,389 | | | | 1.7 | | | | 886 | | | | 1.6 | | | | 1,057 | | | | 1.6 | | | | 1,053 | | | | 1.6 | |
| | | | | | | | | | | | | | | | | | | | | | | | | | | | | | | | | | | | | | | | |
Total | | ¥ | 83,931 | | | | 100.0 | % | | | 81,018 | | | | 100.0 | % | | ¥ | 54,171 | | | | 100.0 | % | | ¥ | 67,400 | | | | 100.0 | % | | ¥ | 65,546 | | | | 100.0 | % |
| | | | | | | | | | | | | | | | | | | | | | | | | | | | | | | | | | | | | | | | |
18
| | | | | | | | | | | | | | | | | | | | | | | | | | | | | | | | | | | | | | | | |
| | | 2007 | | | 2008 | | | 2009 | | | 2010 | | | 2011 | |
| | | (yen amounts in billions) | |
JAPAN’S IMPORTS | | | | | | | | | | | | | | | | | | | | | | | | | | | | | | | | | | | | | | | | |
Asia | | ¥ | 31,564 | | | | 43.2 | % | | ¥ | 32,034 | | | | 40.6 | % | | ¥ | 22,989 | | | | 44.6 | % | | ¥ | 27,511 | | | | 45.3 | % | | ¥ | 30,391 | | | | 44.6 | % |
China | | | 15,035 | | | | 20.6 | | | | 14,830 | | | | 18.8 | | | | 11,436 | | | | 22.2 | | | | 13,413 | | | | 22.1 | | | | 14,642 | | | | 21.5 | |
(Asia NIES) | | | 6,543 | | | | 8.9 | | | | 6,288 | | | | 8.0 | | | | 4,435 | | | | 8.6 | | | | 5,377 | | | | 8.8 | | | | 5,836 | | | | 8.6 | |
(ASEAN) | | | 10,239 | | | | 14.0 | | | | 11,076 | | | | 14.0 | | | | 7,268 | | | | 14.1 | | | | 8,844 | | | | 14.6 | | | | 9,951 | | | | 14.6 | |
Oceania | | | 4,189 | | | | 5.7 | | | | 5,378 | | | | 6.8 | | | | 3,542 | | | | 6.9 | | | | 4,327 | | | | 7.1 | | | | 4,893 | | | | 7.2 | |
Australia | | | 3,673 | | | | 5.0 | | | | 4,922 | | | | 6.2 | | | | 3,242 | | | | 6.3 | | | | 3,948 | | | | 6.5 | | | | 4,514 | | | | 6.6 | |
North America | | | 9,530 | | | | 13.0 | | | | 9,371 | | | | 11.9 | | | | 6,378 | | | | 12.4 | | | | 6,876 | | | | 11.3 | | | | 6,970 | | | | 10.2 | |
U.S.A. | | | 8,349 | | | | 11.4 | | | | 8,040 | | | | 10.2 | | | | 5,512 | | | | 10.7 | | | | 5,911 | | | | 9.7 | | | | 5,931 | | | | 8.7 | |
Canada | | | 1,174 | | | | 1.6 | | | | 1,323 | | | | 1.7 | | | | 858 | | | | 1.7 | | | | 958 | | | | 1.6 | | | | 1,032 | | | | 1.5 | |
Central and South America | | | 2,842 | | | | 3.9 | | | | 2,863 | | | | 3.6 | | | | 1,878 | | | | 3.6 | | | | 2,485 | | | | 4.1 | | | | 2,772 | | | | 4.1 | |
Western Europe | | | 8,299 | | | | 11.3 | | | | 7,999 | | | | 10.1 | | | | 6,137 | | | | 11.9 | | | | 6,419 | | | | 10.6 | | | | 7,031 | | | | 10.3 | |
EU | | | 7,663 | | | | 10.5 | | | | 7,292 | | | | 9.2 | | | | 5,518 | | | | 10.7 | | | | 5,821 | | | | 9.6 | | | | 6,411 | | | | 9.4 | |
Central and Eastern Europe Russia etc. | | | 1,602 | | | | 2.2 | | | | 1,784 | | | | 2.3 | | | | 1,085 | | | | 2.1 | | | | 1,729 | | | | 2.8 | | | | 1,855 | | | | 2.7 | |
Russia | | | 1,242 | | | | 1.7 | | | | 1,389 | | | | 1.8 | | | | 826 | | | | 1.6 | | | | 1,412 | | | | 2.3 | | | | 1,514 | | | | 2.2 | |
Middle East | | | 13,370 | | | | 18.3 | | | | 17,351 | | | | 22.0 | | | | 8,640 | | | | 16.8 | | | | 10,387 | | | | 17.1 | | | | 12,832 | | | | 18.8 | |
Africa | | | 1,736 | | | | 2.4 | | | | 2,172 | | | | 2.8 | | | | 849 | | | | 1.6 | | | | 1,031 | | | | 1.7 | | | | 1,366 | | | | 2.0 | |
| | | | | | | | | | | | | | | | | | | | | | | | | | | | | | | | | | | | | | | | |
Total | | ¥ | 73,136 | | | | 100.0 | % | | ¥ | 78,955 | | | | 100.0 | % | | ¥ | 51,499 | | | | 100.0 | % | | ¥ | 60,765 | | | | 100.0 | % | | ¥ | 68,111 | | | | 100.0 | % |
| | | | | | | | | | | | | | | | | | | | | | | | | | | | | | | | | | | | | | | | |
Source: The Summary Report on Trade of Japan, Japan Tariff Association, Ministry of Finance.
Balance of Payments
In 2007, the Current Account surplus expanded to ¥24,934 billion due to a substantial increase in the Trade Balance. In 2008, the Current Account surplus significantly decreased to ¥16,662 billion due to a substantial decrease in the Balance on Goods and Services as well as Trade Balance. In 2009, the Current Account surplus further decreased to ¥13,736 billion due to a substantial decrease in exports and imports. In 2010, the Current Account surplus increased to ¥17,888 billion due to a substantial increase in the Trade Balance. In 2011, the Current Account surplus significantly decreased to ¥9,551 billion due to a substantial decrease in the Balance on Goods and Services.
Balance of Payments of Japan
| | | | | | | | | | | | | | | | | | | | |
| | | 2007 | | | 2008 | | | 2009 | | | 2010 | | | 2011 | |
| | | (in billions) | |
Current Account | | | ¥ 24,934 | | | | ¥ 16,662 | | | | ¥ 13,736 | | | | ¥ 17,888 | | | | ¥ 9,551 | |
Balance on Goods and Services | | | 9,825 | | | | 1,890 | | | | 2,125 | | | | 6,565 | | | | (3,378) | |
Trade Balance | | | 12,322 | | | | 4,028 | | | | 4,038 | | | | 7,979 | | | | (1,617) | |
Exports (f.o.b.) | | | 79,725 | | | | 77,335 | | | | 50,857 | | | | 63,922 | | | | 62,725 | |
Imports (f.o.b.) | | | 67,403 | | | | 73,307 | | | | 46,819 | | | | 55,943 | | | | 64,341 | |
Services | | | (2,497) | | | | (2,138) | | | | (1,913) | | | | (1,414) | | | | (1,762) | |
Income | | | 16,467 | | | | 16,123 | | | | 12,774 | | | | 12,415 | | | | 14,038 | |
Current Transfers | | | (1,358) | | | | (1,352) | | | | (1,164) | | | | (1,092) | | | | (1,110) | |
Capital and Financial Account (a) | | | (22,538) | | | | (18,390) | | | | (12,645) | | | | (11,998) | | | | 6,266 | |
Balance on Financial Account | | | (22,065) | | | | (17,831) | | | | (12,179) | | | | (11,564) | | | | 6,238 | |
Assets | | | (31,752) | | | | 8,158 | | | | 27,953 | | | | (4,694) | | | | 7,315 | |
Liabilities | | | 9,687 | | | | (25,989) | | | | (40,133) | | | | (6,869) | | | | (1,078) | |
Capital Account | | | (473) | | | | (558) | | | | (465) | | | | (434) | | | | 28 | |
Changes in Reserve Assets (b) | | | (4,297) | | | | (3,200) | | | | (2,527) | | | | (3,793) | | | | (13,790) | |
Errors and Omissions | | | 1,902 | | | | 4,928 | | | | 1,436 | | | | (2,098) | | | | (2,027) | |
| (a) | Numbers in parentheses indicate outflows of capital resulting from either increases in assets or decreases in liabilities. |
| (b) | Parenthesis for change in Reserve Assets represents an increase in reserve assets. |
Source: Balance of Payments Monthly, Ministry of Finance.
19
Official Foreign Exchange Reserves
The following table shows the breakdown of Japan’s official foreign exchange reserves as of the end of the years indicated.
Official Foreign Exchange Reserves(a)
| | | | | | | | | | | | | | | | | | | | |
As of December 31, | | Gold(b) | | | Foreign
Exchange | | | IMF Reserve
Position | | | Special Drawing
Rights | | | Total | |
| | | (in millions) | |
2007 | | $ | 20,580 | | | $ | 947,987 | | | $ | 1,395 | | | $ | 3,034 | | | $ | 973,365 | |
2008 | | | 21,281 | | | | 1,003,300 | | | | 2,659 | | | | 3,033 | | | | 1,030,647 | |
2009 | | | 27,161 | | | | 996,552 | | | | 4,313 | | | | 20,968 | | | | 1,049,397 | |
2010 | | | 34,695 | | | | 1,035,817 | | | | 4,608 | | | | 20,626 | | | | 1,096,185 | |
2011 | | | 37,666 | | | | 1,220,785 | | | | 17,181 | | | | 19,745 | | | | 1,295,841 | |
| (a) | The foreign exchange reserves, which are officially recorded in U.S. dollars by the Ministry of Finance, do not include: (i) net balance of bilateral accounts between the Bank of Japan and foreign central banks, and (ii) foreign exchange holdings of commercial banks. |
| (b) | Until 1999, gold was valued at SDR 35 per ounce. Since 2000, the valuation of gold has been changed to reflect marked-to-market values. |
Source: International Reserves/Foreign Currency Liquidity, Ministry of Finance.
Foreign Exchange Rates
The following table sets forth the high, low and average daily interbank rate for the U.S. dollar in the Tokyo foreign exchange market for the years indicated.
| | | | | | | | | | | | | | | | | | | | |
| | | 2007 | | | 2008 | | | 2009 | | | 2010 | | | 2011 | |
Average (Central Rate) | | ¥ | 117.77 | | | ¥ | 103.39 | | | ¥ | 93.61 | | | ¥ | 87.75 | | | ¥ | 79.76 | |
High | | | 124.14 | | | | 110.48 | | | | 101.24 | | | | 94.70 | | | | 85.53 | |
Low | | | 107.29 | | | | 87.19 | | | | 84.82 | | | | 80.24 | | | | 75.52 | |
Source: Foreign Exchange, Bank of Japan.
20
FINANCIAL SYSTEM
The Bank of Japan and Monetary Policy
The Bank of Japan (“BOJ”), with 55% of its capital owned by the government, is the central bank and sole issuing bank, as well as the depository and fiscal agent for the government. As of July 31, 2012, the BOJ had total assets of ¥145,495 billion.
One of the missions of the BOJ is to contribute to the sound development of the national economy, through the pursuit of price stability. In order to fulfill this mission, the BOJ controls the overall volume of money in the economy and uncollateralized overnight call rate on a daily basis through market operations, along with monetary policy decided at the BOJ Policy Board Meetings. From March 2001 to March 2006, in order to fight deflation and revive the Japanese economy, the BOJ had implemented the quantitative easing policy by conducting money market operations to adjust the outstanding balance of the current accounts at the BOJ. And in March 2006, the BOJ announced the exit from the quantitative easing policy and the return to monetary policy that targets policy interest rate (uncollateralized overnight call rate). At the same time, the BOJ decided to encourage the rate to remain at effectively zero percent. Then, the BOJ increased the policy interest rate to 0.25% in July 2006, and to 0.5% in February 2007. Since the fall of 2008, however, when the turmoil in global financial markets intensified, the BOJ implemented various monetary policy measures including reductions in the policy interest rate. It decreased the policy interest rate to 0.3% in October 2008, and further to 0.1% in December 2008. Furthermore, in October 2010, in order to further enhance monetary easing, the BOJ implemented a comprehensive monetary easing policy, which included the establishment of an Asset Purchase Program to purchase financial assets, including risk assets, as well as to provide loans. In March 2011, February 2012 and April 2012, the BOJ increased the amount of purchases of financial assets and loans under the Program to ¥40 trillion, ¥65 trillion and ¥70 trillion, respectively. Moreover, in February 2012, the BOJ decided to pursue powerful monetary easing by conducting its virtually zero interest rate policy and by implementing the Asset Purchase Program, with the aim of achieving the goal of 1 percent inflation. In addition, the BOJ has implemented a series of emergency loans to financial institutions in order to support liquidity in the Earthquake-affected regions, including a ¥117 billion facility that became available on July 26, 2012. The total amount of lending made under this emergency facility amounts to approximately ¥725 billion as of July 26, 2012.
The following table sets forth the principal economic indicators relating to monetary policy from 2007 through 2011.
| | | | | | | | | | | | | | | | | | | | | | |
| | | Current
Account
Balances(a) | | | Monetary Base | | Money Stock | | Loan and Bills
Discounts Domestically
Licensed Banks |
| | | | | | Total(b) | | | Annual%
Change | | Total(b) | | | Annual%
Change | | Total (b) | | | Annual%
Change |
| | | | | | (yen amounts in billions) |
2007 | | | 8,684 | | | | 88,631 | | | -6.9 | | | 719,581 | | | 1.6 | | | 417,639 | | | 0.5 |
2008 | | | 8,166 | | | | 88,762 | | | 0.2 | | | 734,600 | | | 2.1 | | | 436,848 | | | 4.6 |
2009 | | | 12,922 | | | | 93,919 | | | 5.8 | | | 754,492 | | | 2.7 | | | 428,567 | | | -1.9 |
2010 | | | 16,765 | | | | 98,429 | | | 4.8 | | | 775,391 | | | 2.8 | | | 420,417 | | | -1.9 |
2011 | | | 29,622 | | | | 113,415 | | | 15.2 | | | 796,710 | | | 2.8 | | | 425,858 | | | 1.3 |
| (a) | Average amounts outstanding. |
Source: Bank of Japan Statistics, Bank of Japan.
Government Financial Institutions
The activities of private institutions are supplemented by a number of financial institutions under government supervision, the appointment of whose senior officials is subject to approval by the government and whose funds are supplied principally or partially by the government. Among these are Japan Finance Corporation (“JFC”), the successor to National Life Finance Corporation (“NLFC”), Japan Finance Corporation for Small and Medium Enterprise (“JASME”), and Agriculture, Forestry and Fisheries Finance Corporation (“AFC”), whose main purposes are to contribute to the improvement of the quality of the national life. They also include Japan Bank for International Cooperation (“JBIC”) and The Okinawa Development Finance Corporation (“ODFC”), whose purposes are to supplement private financing in their respective fields of activity, and Development Bank of Japan Inc. (“DBJ”) and The Shoko Chukin Bank (“SCB”), which will be privatized.
21
The central government has been steadily promoting reform of governmental financial institutions. The “Outline of Administrative Reforms” decided by the cabinet on December 1, 2000, requires that the businesses and organizational forms of all special public institutions, which include governmental financial institutions, undergo a thorough review. Pursuant to the Act on Promotion of Administrative Reform for Realization of small and Efficient Government (the “Administrative Reform Promotion Act”), which was enacted on May 26, 2006, (1) the former Development Bank of Japan was succeeded to by DBJ as of October 1, 2008, which is currently wholly owned by the Japanese government and would be privatized, (2) the international financial operations of JBIC, together with the functions of NLFC, JASME, AFC were transferred to JFC as of October 1, 2008, and the overseas economic cooperation operations of JBIC were transferred to the Japan International Cooperation Agency, and (3) as of October 1, 2008, Japan Finance Corporation for Municipal Enterprises was succeeded by Japan Finance Organization for Municipalities, which is funded by local governments. Each of these measures was implemented through individual laws that were enacted in 2007, pursuant to which these successor institutions were formed on October 1, 2008.
With regard to (1) above, as originally enacted, the Development Bank of Japan Inc. Act (Act No. 85 of 2007), as amended (the “DBJ Act”), contemplated full privatization of DBJ over a period of five to seven years from its establishment on October 1, 2008. During that time period, the DBJ Act (as originally enacted) provided that the Japanese government would dispose of all of the common stock of DBJ that it currently owns (the “full privatization”), and that steps would be taken to abolish the DBJ Act promptly after the full privatization. On June 26, 2009, the Japanese Diet approved the Act for Partial Amendment of the Development Bank of Japan Inc. Act (Act No. 67 of 2009) (the “Amendment Act”), which, as part of the Japanese government’s response to economic and financial crises, enables the Japanese government to strengthen DBJ’s financial base through capital injections up to the end of March 2012. In addition, under the Amendment Act, the targeted timing for the full privatization of DBJ has been extended to approximately five to seven years from April 1, 2012. Further, the Amendment Act provides that the Japanese government is to review the organization of DBJ, including the way of the Japanese government’s holding of the DBJ shares, by the end of fiscal year 2011, and until such time, the Japanese government shall not be disposing of the DBJ’s shares held by it. Additionally, on May 2, 2011, in order to address the Great East Japan Earthquake of March 11, 2011, the Japanese Diet approved the Act for Extraordinary Expenditure and Assistance to Cope with the Great East Earthquake (Act No. 40 of 2011) (the “Extraordinary Expenditure Act”). The Extraordinary Expenditure Act enables to the Japanese government to strengthen DBJ’s financial base through capital injection through March 2015 so that DBJ can smoothly implement its crisis response operations. In addition, under Extraordinary Expenditure Act, the targeted timing for the full privatization of DBJ has been extended to approximately five to seven years from April 1, 2015. Further, the Extraordinary Expenditure Act provides that the Japanese government is to review the organization of DBJ, including the way of the Japanese government’s holding of the DBJ’s shares by the end of fiscal year 2014, and until such time, the Japanese government shall not dispose of the DBJ’s shares held by it.
With regard to (2) above, The Japan Bank for International Cooperation Act (the “JBIC Act”) was passed into law on April 28, 2011 to spin off the Japan Bank for International Cooperation Operations from the domestic financial operations of the Japan Finance Corporation. Pursuant to the JBIC Act, Japan Bank for International Cooperation was newly established on April 1, 2012.
Private Financial Institutions
According to the Financial Services Agency, the private banking system included five city banks and 107 local banks (including the Saitama Resona Bank), as of April 1, 2012, whose business corresponds roughly to that of commercial banks in the United States, as well as three major trust banks.
22
There are also credit associations, credit cooperative associations, labor credit associations and the national federations of each of such associations, which are engaged mainly in making small business loans. Agricultural cooperatives, prefectural credit federations of such cooperatives and The Norinchukin Bank operate in the field of agricultural credit.
GOVERNMENT FINANCE
Revenues, Expenditures and Budgets
The responsibility for the preparation of the budget and the administration of government finances rests with the Ministry of Finance. The fiscal year commences on April 1, and the Cabinet usually submits the budget to the Diet for its decision in the preceding January. Supplementary budgets revising the original budget may be submitted to the Diet from time to time during the fiscal year.
The government endorsed “Fiscal Management Strategy” on June 22, 2010, and in its strategy the government set up the following targets for advancing fiscal consolidation.
| | • | | Halving the primary deficit (of both central and local governments) in percent of GDP by JFY 2015. |
| | • | | Achieving a primary surplus (of both central and local governments) by JFY 2020. |
| | • | | Achieving stable reduction in the amount of public debt relative to GDP from JFY 2021. |
The fiscal and financial operations of the government and its agencies are budgeted and recorded in the following three sets of accounts:
| | • | | General Account. The general account is used primarily to record operations in basic areas of governmental activity. |
| | • | | Special Accounts. The accounts of the central government consist of the general account and special accounts. Special accounts can be set up to carry out specific projects, to manage specific funds, and for other purposes. Special accounts can be set up when the government (i) implements a specific program such as insurance and public works, (ii) possesses and manages special funds such as Fiscal Loan Program Funds and Foreign Exchange Funds, and (iii) uses a certain revenue to secure a special expenditure and thus needs to deal with such revenue and expenditure on a separate basis from the general revenue and expenditure such as Local Allocation and Local Transfer Tax and Government Bonds Consolidation Funds. As of April 1, 2012, the government has 18 special accounts. |
| | • | | Government-Affiliated Agencies. The government-affiliated agencies are government-owned corporations which consist of three financial corporations. |
The settlement of accounts for revenues and expenditures is made by the Ministry of Finance, based on reports submitted by the respective Ministers. The settlement of accounts is required by law to be audited annually in detail by the Board of Audit, an organ independent of the Cabinet, and submitted by the Cabinet to the Diet in the following fiscal year.
23
The following tables set forth information with respect to the General Account, the Special Accounts and the Government Affiliated Agencies for JFY 2006 through JFY 2011, and the budget for JFY 2012.
Summary of Consolidated General and Special Accounts(a)
| | | | | | | | | | | | | | | | | | | | | | | | | | | | |
| | | JFY
2006 | | | JFY
2007 | | | JFY
2008 | | | JFY
2009 | | | JFY
2010 | | | JFY 2011
(Provisional
results as of
December 31,
2011) | | | JFY 2012
Initial
Budget | |
| | | (in billions) | |
REVENUES | | | | | | | | | | | | | | | | | | | | | | | | | | | | |
Total Revenues, General Account | | ¥ | 84,413 | | | ¥ | 84,553 | | | ¥ | 89,208 | | | ¥ | 107,114 | | | ¥ | 100,535 | | | ¥ | 110,680 | | | ¥ | 90,334 | |
Total Revenues, Special Accounts | | | 501,536 | | | | 395,920 | | | | 387,740 | | | | 377,893 | | | | 386,985 | | | | 428,153 | | | | 408,395 | |
Less: Inter-Account Transactions(c) | | | 282,768 | | | | 233,244 | | | | 240,977 | | | | 238,727 | | | | 241,815 | | | | 262,444 | | | | 257,686 | |
| | | | | | | | | | | | | | | | | | | | | | | | | | | | |
Total Consolidated Revenues | | ¥ | 303,181 | | | ¥ | 247,230 | | | ¥ | 235,971 | | | ¥ | 246,280 | | | ¥ | 245,704 | | | ¥ | 276,390 | | | ¥ | 241,043 | |
| | | | | | | | | | | | | | | | | | | | | | | | | | | | |
EXPENDITURES | | | | | | | | | | | | | | | | | | | | | | | | | | | | |
Total Expenditures, General Account | | ¥ | 81,445 | | | ¥ | 81,843 | | | ¥ | 84,697 | | | ¥ | 100,973 | | | ¥ | 95,312 | | | ¥ | 110,529 | | | ¥ | 90,334 | |
Total Expenditures, Special Accounts | | | 450,580 | | | | 353,283 | | | | 359,198 | | | | 348,060 | | | | 345,074 | | | | 397,018 | | | | 394,094 | |
Less: Inter-Account Transactions(c) | | | 281,102 | | | | 231,611 | | | | 239,115 | | | | 236,323 | | | | 239,158 | | | | 259,720 | | | | 255,663 | |
| | | | | | | | | | | | | | | | | | | | | | | | | | | | |
Total Consolidated Expenditures | | ¥ | 250,923 | | | ¥ | 203,515 | | | ¥ | 204,781 | | | ¥ | 212,710 | | | ¥ | 201,228 | | | ¥ | 247,826 | | | ¥ | 228,766 | |
| | | | | | | | | | | | | | | | | | | | | | | | | | | | |
Surplus of Consolidated Revenues over Consolidated Expenditures | | ¥ | 52,258 | | | ¥ | 43,715 | | | ¥ | 31,190 | | | ¥ | 33,570 | | | ¥ | 44,476 | | | ¥ | 28,564 | | | ¥ | 12,277 | |
| (a) | Because of the manner in which the government accounts are kept, it is not practicable to show a consolidation of the Government Affiliated Agencies with the General and Special Accounts. |
| (b) | Inter-Account Transactions include transfers between the General Account and the Special Accounts, transfers between the Special Accounts, and transfers between sub-accounts of the Special Accounts. |
Source: Budget, Ministry of Finance.
24
General Account
| | | | | | | | | | | | | | | | | | | | | | | | | | | | |
| | | JFY
2006 | | | JFY
2007 | | | JFY
2008 | | | JFY
2009 | | | JFY
2010 | | | JFY 2011
Revised
Budget(a) | | | JFY 2012
Initial
Budget | |
| | | (in billions) | |
REVENUES | | | | | | | | | | | | | | | | | | | | | | | | | | | | |
Tax and Stamp Revenues | | ¥ | 49,069 | | | ¥ | 51,018 | | | ¥ | 44,267 | | | ¥ | 38,733 | | | ¥ | 41,487 | | | ¥ | 42,030 | | | ¥ | 42,346 | |
Carried-over Surplus | | | 3,481 | | | | 2,967 | | | | 2,711 | | | | 4,511 | | | | 6,141 | | | | 2,011 | | | | — | |
Government Bond Issues | | | 27,470 | | | | 25,382 | | | | 33,168 | | | | 51,955 | | | | 42,303 | | | | 55,848 | | | | 44,244 | |
Income from Operation | | | 16 | | | | 16 | | | | 16 | | | | 15 | | | | 15 | | | | 16 | | | | 17 | |
Gains from Deposition of Assets | | | 275 | | | | 294 | | | | 248 | | | | 145 | | | | 785 | | | | 310 | | | | 152 | |
Miscellaneous Receipts | | | 4,102 | | | | 4,876 | | | | 8,080 | | | | 11,755 | | | | 9,803 | | | | 7,296 | | | | 3,575 | |
Receipt of the Settlement Adjustment Fund | | | — | | | | — | | | | — | | | | — | | | | — | | | | — | | | | — | |
| | | | | | | | | | | | | | | | | | | | | | | | | | | | |
Total Revenues | | ¥ | 84,413 | | | ¥ | 84,553 | | | ¥ | 89,208 | | | ¥ | 107,114 | | | ¥ | 100,535 | | | ¥ | 107,510 | | | ¥ | 90,334 | |
| | | | | | | | | | | | | | | | | | | | | | | | | | | | |
EXPENDITURES | | | | | | | | | | | | | | | | | | | | | | | | | | | | |
Local Allocation Tax Grants, etc. | | ¥ | 16,701 | | | ¥ | 14,932 | | | ¥ | 15,679 | | | ¥ | 16,573 | | | ¥ | 18,790 | | | ¥ | 19,451 | | | ¥ | 16,594 | |
National Debt Service | | | 18,037 | | | | 19,290 | | | | 19,166 | | | | 18,445 | | | | 19,544 | | | | 20,269 | | | | 21,944 | |
Social Security | | | 20,555 | | | | 21,141 | | | | 22,562 | | | | 28,716 | | | | 28,249 | | | | 29,882 | | | | 26,390 | |
Public Works | | | 7,709 | | | | 7,257 | | | | 6,921 | | | | 8,353 | | | | 5,803 | | | | 7,827 | | | | 4,573 | |
Education and Science | | | 5,331 | | | | 5,458 | | | | 5,487 | | | | 6,158 | | | | 6,051 | | | | 6,405 | | | | 5,406 | |
National Defense | | | 4,817 | | | | 4,758 | | | | 4,803 | | | | 4,811 | | | | 4,670 | | | | 5,113 | | | | 4,714 | |
Former Military Personnel Pensions | | | 992 | | | | 941 | | | | 856 | | | | 781 | | | | 709 | | | | 643 | | | | 571 | |
Economic Assistance | | | 784 | | | | 787 | | | | 800 | | | | 801 | | | | 746 | | | | 640 | | | | 522 | |
Food Supply | | | 610 | | | | 674 | | | | 1,051 | | | | 1,036 | | | | 1,122 | | | | 1,697 | | | | 1,104 | |
Energy | | | 471 | | | | 866 | | | | 868 | | | | 994 | | | | 845 | | | | 997 | | | | 820 | |
Promotion of SMEs | | | 240 | | | | 418 | | | | 1,074 | | | | 2,915 | | | | 830 | | | | 2,199 | | | | 180 | |
Transfer to the Industrial Investment Special Account | | | 48 | | | | 20 | | | | — | | | | — | | | | — | | | | — | | | | — | |
Financial Aid upon Repayment of Public Investments in Connection with the Structural Reform | | | — | | | | — | | | | — | | | | — | | | | — | | | | — | | | | — | |
Miscellaneous | | | 5,152 | | | | 5,301 | | | | 5,431 | | | | 11,391 | | | | 7,235 | | | | 11,472 | | | | 6,255 | |
Contingencies | | | — | | | | — | | | | — | | | | — | | | | — | | | | 350 | | | | 350 | |
Emergency Stimulus Package | | | — | | | | — | | | | — | | | | — | | | | — | | | | — | | | | — | |
Contingencies for Economic Crisis Response and Regional Revitalization(b) | | | — | | | | — | | | | — | | | | — | | | | — | | | | — | | | | 910 | |
Contingencies for Restoration and Reconstruction from the Great East Japan Earthquake(c) | | | — | | | | — | | | | — | | | | — | | | | — | | | | 566 | | | | — | |
Refund to the Settlement Adjustment Fund | | | — | | | | — | | | | — | | | | — | | | | — | | | | — | | | | — | |
Carryback of settlement deficit compensation for JFY 2008 | | | — | | | | — | | | | — | | | | — | | | | 718 | | | | — | | | | — | |
| | | | | | | | | | | | | | | | | | | | | | | | | | | | |
Total Expenditures | | ¥ | 81,445 | | | ¥ | 81,843 | | | ¥ | 84,697 | | | ¥ | 100,973 | | | ¥ | 95,312 | | | ¥ | 107,510 | | | ¥ | 90,334 | |
| | | | | | | | | | | | | | | | | | | | | | | | | | | | |
Surplus of Revenues over Expenditures | | ¥ | 2,967 | | | ¥ | 2,711 | | | ¥ | 4,511 | | | ¥ | 6,141 | | | ¥ | 5,222 | | | ¥ | — | | | ¥ | — | |
| (a) | As of the date of this Annual Report on Form 18-K, details for the provisional results for JFY 2011 General Accounts are not available. |
| (b) | Newly established effective JFY 2010. |
| (c) | Newly established effective JFY 2011. |
Source: Budget, Ministry of Finance.
25
Special Accounts
| | | | | | | | | | | | | | | | | | | | | | | | | | | | | | | | | | | | | | | | | | | | | | | | | | | | | | | | |
| | | JFY
2006 | | | JFY
2007 | | | JFY
2008 | | | JFY
2009 | | | JFY
2010 | | | JFY 2011
Revised Budget(a) | | | JFY 2012
Initial Budget | |
| | | Rev. | | | Exp. | | | Rev. | | | Exp. | | | Rev. | | | Exp. | | | Rev. | | | Exp. | | | Rev. | | | Exp. | | | Rev. | | | Exp. | | | Rev. | | | Exp. | |
| | | (in billions) | |
Fiscal Loan Program Funds(b) | | ¥ | 70,869 | | | ¥ | 68,029 | | | ¥ | 39,010 | | | ¥ | 36,526 | | | | — | | | | — | | | | — | | | | — | | | | — | | | | — | | | | — | | | | — | | | | — | | | | — | |
Fiscal Investment and Loan Program(b) | | | — | | | | — | | | | — | | | | — | | | ¥ | 42,834 | | | ¥ | 40,457 | | | ¥ | 39,299 | | | ¥ | 37,749 | | | ¥ | 29,351 | | | ¥ | 28,079 | | | ¥ | 39,899 | | | ¥ | 39,089 | | | ¥ | 35,987 | | | ¥ | 35,398 | |
Government Bonds Consolidation Fund | | | 256,326 | | | | 221,424 | | | | 205,113 | | | | 176,778 | | | | 194,752 | | | | 178,284 | | | | 186,333 | | | | 165,602 | | | | 201,934 | | | | 171,204 | | | | 207,958 | | | | 195,958 | | | | 209,592 | | | | 197,592 | |
Foreign Exchange Fund | | | 3,911 | | | | 379 | | | | 4,553 | | | | 627 | | | | 3,925 | | | | 549 | | | | 3,106 | | | | 183 | | | | 3,470 | | | | 489 | | | | 2,389 | | | | 1,605 | | | | 2,207 | | | | 1,589 | |
Local Allocation and Local Transfer Tax | | | 74,822 | | | | 72,795 | | | | 51,366 | | | | 50,214 | | | | 51,207 | | | | 50,577 | | | | 52,214 | | | | 51,435 | | | | 55,315 | | | | 53,421 | | | | 56,930 | | | | 55,720 | | | | 54,560 | | | | 53,767 | |
Measures for Petroleum and the Advancement of Energy Demand and Supply Structure(c) | | | 2,266 | | | | 1,971 | | | | — | | | | — | | | | — | | | | — | | | | — | | | | — | | | | — | | | | — | | | | — | | | | — | | | | — | | | | — | |
Measure for Energy(c) | | | — | | | | — | | | | 2,764 | | | | 2,402 | | | | 2,673 | | | | 2,382 | | | | 2,650 | | | | 2,361 | | | | 2,509 | | | | 2,238 | | | | 2,387 | | | | 2,387 | | | | 7,425 | | | | 7,425 | |
Welfare Insurances(d) | | | 45,383 | | | | 44,117 | | | | — | | | | — | | | | — | | | | — | | | | — | | | | — | | | | — | | | | — | | | | — | | | | — | | | | — | | | | — | |
Seamen’s Insurances | | | 69 | | | | 63 | | | | 68 | | | | 63 | | | | 67 | | | | 63 | | | | 55 | | | | 48 | | | | — | | | | — | | | | — | | | | — | | | | — | | | | — | |
National Advanced Medical Center(e) | | | 197 | | | | 184 | | | | 160 | | | | 145 | | | | 170 | | | | 152 | | | | 208 | | | | 167 | | | | — | | | | — | | | | — | | | | — | | | | — | | | | — | |
National Pensions(d) | | | 25,240 | | | | 23,904 | | | | — | | | | — | | | | — | | | | — | | | | — | | | | — | | | | — | | | | — | | | | — | | | | — | | | | — | | | | — | |
Pensions(d) | | | — | | | | — | | | | 71,863 | | | | 69,731 | | | | 72,520 | | | | 70,305 | | | | 75,649 | | | | 74,612 | | | | 79,184 | | | | 75,936 | | | | 79,303 | | | | 79,303 | | | | 80,469 | | | | 80,469 | |
Foodstuff Control(f) | | | 2,291 | | | | 2,264 | | | | — | | | | — | | | | — | | | | — | | | | — | | | | — | | | | — | | | | — | | | | — | | | | — | | | | — | | | | — | |
Stable Supply of Foodstuff(f) | | | — | | | | — | | | | 2,617 | | | | 2,542 | | | | 2,739 | | | | 2,642 | | | | 2,387 | | | | 2,231 | | | | 2,064 | | | | 1,880 | | | | 2,787 | | | | 2,760 | | | | 2,545 | | | | 2,527 | |
Agricultural Mutual Aid Reinsurance | | | 109 | | | | 62 | | | | 107 | | | | 47 | | | | 93 | | | | 43 | | | | 103 | | | | 62 | | | | 108 | | | | 81 | | | | 104 | | | | 100 | | | | 122 | | | | 119 | |
National Forest Service | | | 427 | | | | 413 | | | | 472 | | | | 473 | | | | 459 | | | | 451 | | | | 498 | | | | 488 | | | | 458 | | | | 457 | | | | 471 | | | | 471 | | | | 463 | | | | 463 | |
National Land Improvement(g) | | | 521 | | | | 487 | | | | 575 | | | | 481 | | | | — | | | | — | | | | — | | | | — | | | | — | | | | — | | | | — | | | | — | | | | — | | | | — | |
Trade Reinsurance | | | 787 | | | | 5 | | | | 853 | | | | 56 | | | | 219 | | | | 65 | | | | 148 | | | | 61 | | | | 91 | | | | 59 | | | | 171 | | | | 171 | | | | 188 | | | | 188 | |
Compensation Reinsurance for Motor Vehicle Damages(h) | | | 168 | | | | 104 | | | | 140 | | | | 72 | | | | — | | | | — | | | | — | | | | — | | | | — | | | | — | | | | — | | | | — | | | | — | | | | — | |
Automobile Safety(h) | | | — | | | | — | | | | — | | | | — | | | | 144 | | | | 72 | | | | 131 | | | | 63 | | | | 124 | | | | 58 | | | | 117 | | | | 60 | | | | 116 | | | | 54 | |
Infrastructure Development(i) | | | — | | | | — | | | | — | | | | — | | | | 7,220 | | | | 6,039 | | | | 7,131 | | | | 5,809 | | | | 4,698 | | | | 4,195 | | | | 3,818 | | | | 3,818 | | | | 3,651 | | | | 3,651 | |
Harbor Improvement(i) | | | 374 | | | | 339 | | | | 360 | | | | 319 | | | | — | | | | — | | | | — | | | | — | | | | — | | | | — | | | | — | | | | — | | | | — | | | | — | |
Airport Improvement(i) | | | 578 | | | | 464 | | | | 663 | | | | 555 | | | | — | | | | — | | | | — | | | | — | | | | — | | | | — | | | | — | | | | — | | | | — | | | | — | |
Labor Insurance | | | 8,984 | | | | 7,110 | | | | 7,849 | | | | 6,542 | | | | 7,935 | | | | 6,753 | | | | 7,237 | | | | 6,869 | | | | 7,112 | | | | 6,703 | | | | 7,615 | | | | 7,574 | | | | 6,833 | | | | 6,826 | |
Road Construction and Improvement(i) | | | 4,787 | | | | 3,877 | | | | 4,595 | | | | 3,812 | | | | — | | | | — | | | | — | | | | — | | | | — | | | | — | | | | — | | | | — | | | | — | | | | — | |
Reconstruction from the Great East Japan Earthquake | | | — | | | | — | | | | — | | | | — | | | | — | | | | — | | | | — | | | | — | | | | — | | | | — | | | | — | | | | — | | | | 3,775 | | | | 3,775 | |
Others | | | 3,427 | | | | 2,588 | | | | 2,791 | | | | 1,897 | | | | 782 | | | | 363 | | | | 743 | | | | 318 | | | | 566 | | | | 274 | | | | 418 | | | | 216 | | | | 459 | | | | 439 | |
| | | | | | | | | | | | | | | | | | | | | | | | | | | | | | | | | | | | | | | | | | | | | | | | | | | | | | | | |
Total Revenues and Expenditures(j) | | ¥ | 501,536 | | | ¥ | 450,580 | | | ¥ | 395,920 | | | ¥ | 353,283 | | | ¥ | 387,740 | | | ¥ | 359,198 | | | ¥ | 377,893 | | | ¥ | 348,060 | | | ¥ | 386,985 | | | ¥ | 345,074 | | | ¥ | 404,367 | | | ¥ | 389,232 | | | ¥ | 408,395 | | | ¥ | 390,520 | |
| | | | | | | | | | | | | | | | | | | | | | | | | | | | | | | | | | | | | | | | | | | | | | | | | | | | | | | | |
| (a) | As of the date of this Annual Report on Form 18-K, details for the provisional results for JFY 2011 Special Accounts are not available. |
| (b) | The account was combined with certain miscellaneous account under the new account name of “Fiscal Investment and Loan Program” effective JFY 2008. |
| (c) | The account of “Measures for Petroleum and the Advancement of Energy Demand and Supply Structure” was incorporated in the newly established account of “Measures for Energy” effective JFY 2007. |
| (d) | The accounts of “Welfare Insurance” and “National Pensions” have been combined under the new account name of “Pensions” effective JFY 2007. |
| (e) | Account abolished as of March 31, 2010. |
| (f) | The account of “Foodstuff Control” was combined with certain miscellaneous accounts under the new account name of “Stable Supply of Foodstuff” effective JFY 2007. |
| (g) | Account abolished effective JFY 2008. |
| (h) | The account of “Compensation Reinsurance for Motor Vehicle Damages” was combined with certain miscellaneous accounts under the new account name of “Automobile Safety” effective JFY 2008. |
| (i) | The accounts were combined under the new account name of “Infrastructure Development” effective JFY 2008. |
| (j) | Without adjustment for inter-account transactions. Total Revenues and Expenditures may differ from the actual totals of the listed accounts due to rounding. |
Source: Budget, Ministry of Finance.
Government Affiliated Agencies
| | | | | | | | | | | | | | | | | | | | | | | | | | | | | | | | | | | | | | | | | | | | | | | | | | | | | | | | |
| | | JFY 2006 | | | JFY 2007 | | | JFY 2008 | | | JFY 2009 | | | JFY 2010 | | | JFY 2011
Revised
Budget (a) | | | JFY 2012
Initial Budget | |
| | | Rev. | | | Exp. | | | Rev. | | | Exp. | | | Rev. | | | Exp. | | | Rev. | | | Exp. | | | Rev. | | | Exp. | | | Rev. | | | Exp. | | | Rev. | | | Exp. | |
| | | (in billions) | |
Total | | ¥ | 4,503 | | | ¥ | 3,793 | | | ¥ | 2,604 | | | ¥ | 2,065 | | | ¥ | 1,825 | | | ¥ | 1,785 | | | ¥ | 1,277 | | | ¥ | 1,530 | | | ¥ | 1,204 | | | ¥ | 1,406 | | | ¥ | 1,846 | | | ¥ | 2,614 | | | ¥ | 1,913 | | | ¥ | 2,703 | |
| (a) | As of the date of this Annual Report on Form 18-K, details for the provisional results for JFY 2011 are not available. |
Source: Budget, Ministry of Finance.
26
Tax Structure
The central government derives tax revenues (including stamp revenues) through taxes on income, consumption and property, etc. The taxes on income, consumption and property (including stamp revenues, etc.) account for 54.1%, 40.5% and 5.4%, respectively, of the total central government taxes and stamp revenues in the JFY 2012 budget.
The individual national income tax is progressive, with rates currently ranging from 5% to 40% of taxable income, and the local taxes are a 10% single rate. Interest income is generally taxed at the rate of 20%, including both national and local taxes, separately from other types of income, and subject to certain exemptions. The corporate tax is based on a rate of 25.5% except that, for small and medium corporations, the first ¥8 million of income is taxed at 15%. In addition, individuals and corporations are subject to local income taxation.
Comprehensive Reform of Social Security and Tax Japan’s fiscal conditions face challenges, with its tax revenues covering less than half of its expenditures, and with the ratio of long-term outstanding debt of central and local governments to gross domestic product expected to reach 195% at the end of JFY 2012. See also “Japan’s Public Debt” below. The Government of Japan seeks to tackle these fiscal challenges through the “comprehensive reform of social security and tax”, which was approved by the Diet in August 2012, and thereby maintain the market’s and the international community’s confidence in Japan and build the foundation for stable economic growth. In the reform, the government would set aside consumption tax revenues for social security payments, and, on the condition that the economic situation improve, gradually increase the consumption tax rate to 8% in April 2014 and to 10% in October 2015. In addition, as to the review of individual income and inheritance taxes, the government would take necessary legislative measures in FY 2012.
Fiscal Investment and Loan Program (“Zaito”)
The Fiscal Investment and Loan Program is formulated at the same pace as the General Account budget. The plan details the allocation of public funds to various special accounts, government affiliated agencies, local governments, public corporations and other public institutions.
The Fiscal Investment and Loan Program system was fundamentally changed on April 1, 2001 from a scheme with compulsory deposit of Postal Savings and Pension Reserves into a fund-raising scheme to raise in the financial markets only the necessary amount of funds for Fiscal Investment and Loan Program agencies’ projects.
Under the Zaito plan, funds are lent to government-related entities such as public corporations, government affiliated agencies, special accounts and local governments. The total funds allocated under the initial plan for JFY 2012 is ¥17,648 billion. The sources of funds for the plan in JFY 2012 are the Fiscal Loans (¥13,524 billion), the Industrial Investments (¥180 billion), Government-Guaranteed domestic bonds (¥3,582 billion) and Government-Guaranteed foreign bonds (¥362 billion).
The following table shows the uses of funds allocated under the initial plan for the periods indicated.
| | | | | | | | | | | | | | | | | | | | |
| | | JFY 2008 | | | JFY 2009 | | | JFY 2010 | | | JFY 2011 | | | JFY 2012 | |
| | | (in billions) | |
Housing | | ¥ | 862 | | | ¥ | 686 | | | ¥ | 604 | | | ¥ | 578 | | | ¥ | 923 | |
Living Environment | | | 2,745 | | | | 2,937 | | | | 3,128 | | | | 2,725 | | | | 2,713 | |
Social Welfare | | | 557 | | | | 541 | | | | 506 | | | | 550 | | | | 743 | |
Education | | | 873 | | | | 861 | | | | 1,135 | | | | 1,176 | | | | 1,232 | |
Small and Medium-sized Businesses | | | 2,934 | | | | 4,227 | | | | 5,673 | | | | 3,627 | | | | 4,323 | |
Agriculture, Forestry and Fisheries | | | 368 | | | | 425 | | | | 404 | | | | 345 | | | | 373 | |
National Land Preservation and Reconstruction in the Event of Disaster | | | 247 | | | | 262 | | | | 243 | | | | 180 | | | | 645 | |
Road Construction | | | 2,967 | | | | 2,490 | | | | 2,426 | | | | 2,248 | | | | 2,813 | |
Transportation and Communications | | | 406 | | | | 451 | | | | 436 | | | | 408 | | | | 384 | |
Regional Development | | | 401 | | | | 424 | | | | 441 | | | | 467 | | | | 447 | |
Industry/Technology | | | 323 | | | | 1,310 | | | | 1,907 | | | | 625 | | | | 2,015 | |
Trade/Economic Cooperation | | | 1,186 | | | | 1,249 | | | | 1,454 | | | | 1,978 | | | | 1,039 | |
| | | | | | | | | | | | | | | | | | | | |
Total | | ¥ | 13,869 | | | ¥ | 15,863 | | | ¥ | 18,357 | | | ¥ | 14,906 | | | ¥ | 17,648 | |
| | | | | | | | | | | | | | | | | | | | |
27
DEBT RECORD
There has been no default in the payment of interest or principal of any internal Japanese government obligation since the establishment of the modern Japanese state in 1868 or of any external Japanese government obligation within a period of 20 years prior hereto.
JAPAN PUBLIC DEBT
The following table summarizes, as of the dates indicated, the outstanding direct internal and external funded and floating debt of Japan. The term “floating debt” is used herein to mean all debt with maturities of one year or less from the date of issue. All other debt is classified as “funded debt.” Detailed debt tables are presented below.
Japan’s fiscal conditions are extremely severe, with outstanding government bonds expected to reach nearly 709 trillion yen at the end of JFY 2012. The amount of public bonds issued by the Japanese government as a percentage of its general account total revenues was 51.9% under the revised budget for JFY 2011 and 49.0% under the initial budget for JFY 2012. The government endorsed the “Fiscal Management Strategy” on June 22, 2010 and subsequently, the National Policy Unit of the Cabinet Secretariat released the “FY 2011 Review of Progress of Fiscal Management Strategy” on January 21, 2011 and the “FY 2012 Review of Progress of Fiscal Management Strategy” on January 24, 2012. According to these reviews, the amount of the government bond issuances in the JFY 2012 initial budget is ¥44,244 billion and falls below the JFY 2011 budget’s level of ¥44,298 billion. Moreover, the government developed fiscal consolidation targets to (i) halve the primary deficit (of both central and local governments) as a percentage of GDP by JFY 2015, (ii) achieve a primary surplus (of both central and local governments) by JFY 2020, and (iii) achieve a stable reduction in the amount of public debt relative to GDP from JFY 2021. According to the Cabinet Office’s projections, (i) the primary balance of national and local governments in JFY 2012 is projected to improve by approximately 1.5 percentage points of GDP compared to JFY 2011; and (ii) the public debt-to-GDP ratio in JFY 2012 is projected to increase to 185% compared to 182% in JFY 2011.
Summary of Japan’s Public Debt
| | | | | | | | | | | | |
| | | Funded | | | Floating | |
At the end of JFY | | Internal | | | External | | | Internal | |
| | | (in billions) | | | (in thousands) | | | (in billions) | |
2007 | | ¥ | 671,148 | | | | — | | | ¥ | 178,091 | |
2008 | | | 669,810 | | | | — | | | | 176,687 | |
2009 | | | 696,190 | | | | — | | | | 186,733 | |
2010 | | | 737,325 | | | | — | | | | 187,034 | |
2011 | | | 758,202 | | | | — | | | | 201,748 | |
As of March 31, 2012 Japan had guaranteed payment of principal and interest of various internal yen obligations in the aggregate principal amount of ¥44,259 billion and of various external obligations aggregating the equivalent of ¥3,649 billion.
The following table sets forth the aggregate annual payments of principal in respect of the direct internal funded debt of Japan outstanding as of March 31, 2012 for the periods indicated.
28
Principal Payments on Direct Funded Debt of Japan
| | | | |
JFY | | Internal | |
| | | (in billions) | |
2013 | | ¥ | 187,426 | |
2014 | | | 106,865 | |
2015 | | | 72,126 | |
2016 | | | 73,574 | |
2017 to 2052 | | | 440,582 | |
Total | | ¥ | 880,573 | |
29
INTERNAL DEBT
Direct Debt of the Japanese Government
Funded Debt
| | | | | | | | | | | | |
Title and Interest Rate | | Year of Issue | | | Year of Maturity | | | Principal Amounts
Outstanding as of
March 31, 2012
(in millions) | |
1. Bonds | | | | | | | | | | | | |
Interest-Bearing Treasury Bond — 40 years, 4 Series (2.2-2.4%) | | | 2007-2012 | | | | 2048-2051 | | | ¥ | 4,924,100 | |
Interest-Bearing Treasury Bond — 30 years, 36 Series (1.1-2.9%) | | | 1999-2012 | | | | 2029-2042 | | | | 38,587,125 | |
Interest-Bearing Treasury Bond — 20 years, 116 Series (0.8-5.9%) | | | 1992-2012 | | | | 2012-2032 | | | | 131,875,370 | |
Interest-Bearing Treasury Bond — 15 years, 41 Series (variable rate) | | | 2000-2008 | | | | 2015-2023 | | | | 37,015,900 | |
Interest-Bearing Treasury Bond — 10 years, 83 Series (0.5-2.0%) | | | 2002-2012 | | | | 2012-2022 | | | | 294,701,618 | |
Interest-Bearing Treasury Bond for Individual Investors — 10 years, 37 Series (variable rate) | | | 2003-2012 | | | | 2013-2022 | | | | 13,943,500 | |
Inflation-Indexed Bonds —10 years, 16 Series (0.5-1.4%) | | | 2004-2008 | | | | 2014-2018 | | | | 3,816,875 | |
Interest-Bearing Treasury Bond — 5 years, 40 Series (0.3-1.5%) | | | 2007-2012 | | | | 2012-2017 | | | | 137,679,107 | |
Interest-Bearing Treasury Bond for Individual Investors — 5 years, 20 Series (0.23-1.5%) | | | 2007-2012 | | | | 2012-2017 | | | | 7,596,629 | |
Interest-Bearing Treasury Bond for Individual Investors — 3 years, 21 Series (0.11-0.32%) | | | 2010-2012 | | | | 2013-2015 | | | | 1,334,283 | |
Interest-Bearing Treasury Bond — 2 years, 24 Series (0.1-0.2%) | | | 2010-2012 | | | | 2012-2014 | | | | 67,493,074 | |
6% Bereaved Family Treasury Bond, 9 Series | | | 2003-2011 | | | | 2012-2020 | | | | 5 | |
6% Repatriation Treasury Bond, 8 Series | | | 2002-2009 | | | | 2012-2019 | | | | 0 | |
Non-interest Special Benefit Treasury Bond, 1 Series | | | 2003 | | | | 2013 | | | | 1 | |
Non-interest Repatriation Special Benefit Treasury Bond, 7 Series | | | 2002-2009 | | | | 2012-2019 | | | | 0 | |
Non-interest Special Benefit Treasury Bond IV, 2 Series | | | 2003-2006 | | | | 2013-2016 | | | | 7 | |
Non-interest Special Benefit Treasury Bond X, 2 Series | | | 2003-2006 | | | | 2013-2016 | | | | 87 | |
Non-interest Special Benefit Treasury Bond XIII, 1 Series | | | 2011 | | | | 2016 | | | | 174 | |
Non-interest Special Benefit Treasury Bond XVII, 7 Series | | | 2002-2010 | | | | 2012-2020 | | | | 1,040 | |
Non-interest Special Benefit Treasury Bond XXII, 7 Series | | | 2003-2011 | | | | 2013-2021 | | | | 65,625 | |
Non-interest Special Benefit Treasury Bond XXIII, 1 Series | | | 2006 | | | | 2016 | | | | 7,022 | |
Non-interest Special Benefit Treasury Bond XXIV, 1 Series | | | 2008 | | | | 2012 | | | | 20 | |
Non-interest Special Benefit Treasury Bond XXV, 1 Series | | | 2011 | | | | 2016 | | | | 4 | |
Non-interest Treasury Bond for Special Condolence VIII, 1 Series | | | 2005 | | | | 2015 | | | | 202,160 | |
Non-interest Treasury Bond for Special Condolence IX, 1 Series | | | 2009 | | | | 2015 | | | | 6,446 | |
Government Bonds converted from The Japan Expressway Holding and Debt Repayment Agency Bonds | | | 2009 | | | | 2013-2015 | | | | 725,355 | |
| | | | | | | | | | | | |
Total Bonds | | | | | | | | | | ¥ | 739,975,527 | |
| | | | | | | | | | | | |
30
| | | | | | | | | | | | |
Title and Interest Rate | | Year of Issue | | | Year of Maturity | | | Principal Amounts
Outstanding as of
March 31, 2012
(in millions) | |
2. Borrowings | | | | | | | | | | | | |
Former Temporary Military Expenditure(a) | | | 1943-1945 | | | | | | | ¥ | 41,422 | |
Allotment of Local Allocation and Local Transfer Tax | | | 2007 | | | | 2037 | | | | 14,597,037 | |
Former Government-Operated Land Improvement Project | | | 2008 | | | | 2012-2029 | | | | 245,655 | |
Japan Expressway Holding and Debt Repayment Agency | | | 2009 | | | | 2012-2023 | | | | 754,555 | |
Former National Centers for Advanced and Specialized Medical Care | | | 2010 | | | | 2012-2035 | | | | 100,251 | |
SA for Fiscal Investment and Loan Program (1.1%) | | | 1998 | | | | 2013 | | | | 801 | |
SA for Energy Policy (0.8-1.9%) | | | 2004-2012 | | | | 2017-2025 | | | | 229,436 | |
SA for Stable Food Supply (0.9-1.3%) | | | 2009-2012 | | | | 2022-2025 | | | | 46,101 | |
SA for National Forest Service (0.315-1.7%) | | | 1996-2012 | | | | 2012-2033 | | | | 1,276,186 | |
SA for Social Infrastructures Improvement (0.0-4.75%) | | | 1993-2011 | | | | 2012-2041 | | | | 935,300 | |
| | | | | | | | | | | | |
Total Borrowings | | | | | | | | | | ¥ | 18,226,744 | |
| | | | | | | | | | | | |
Total Direct Internal Funded Debt | | | | | | | | | | ¥ | 758,202,270 | |
| | | | | | | | | | | | |
| (a) | Represents borrowings by the government from special corporations of currencies of areas under Japanese control during World War II. The maturity of such borrowings and other matters relating to such borrowings remain undetermined. |
Floating Debt
| | | | | | | | | | |
Title | | Interest | | | Year of Maturity | | Principal Amounts
Outstanding as of
March 31, 2012
(in millions) | |
1. Bonds | | | | | | | | | | |
Treasury Discount Bills | | | | | | | | | | |
Treasury Financing Bills | | | Non-interest bearing | | | 2012 | | ¥ | 0 | |
Food Financing Bills | | | Non-interest bearing | | | 2012 | | | 276,000 | |
Foreign Exchange Fund Financing Bills | | | Non-interest bearing | | | 2012 | | | 115,086,990 | |
Fiscal Loan Fund Financing Bills | | | Non-interest bearing | | | 2012 | | | 0 | |
Petroleum Financing Bills | | | Non-interest bearing | | | 2012 | | | 1,140,700 | |
Nuclear Damage Liability Facilitation Financing Bills | | | Non-interest bearing | | | 2012 | | | 363,600 | |
Treasury Bills, 12 Series | | | Non-interest bearing | | | 2012-2013 | | | 41,812,070 | |
Note in Substitution for Currency of the International Monetary Fund | | | Non-interest bearing | | | Payable on demand | | | 1,598,777 | |
Note in Substitution for Currency of the International Development Association | | | Non-interest bearing | | | Payable on demand | | | 47,241 | |
Note in Substitution for Currency of the Asian Development Bank | | | Non-interest bearing | | | Payable on demand | | | 11,050 | |
Note for Contribution to the Special Funds of the Asian Development Bank | | | Non-interest bearing | | | Payable on demand | | | 111,444 | |
Note in Substitution for Currency of the African Development Fund | | | Non-interest bearing | | | Payable on demand | | | 47,576 | |
Note in Substitution for Currency of the Multilateral Investment Fund of the Inter-American Development Bank | | | Non-interest bearing | | | Payable on demand | | | 4,779 | |
31
| | | | | | | | |
Title | | Interest | | Year of Maturity | | Principal Amounts
Outstanding as of
March 31, 2012
(in millions) | |
Note in Substitution for Currency of the International Fund for Agricultural Development | | Non-interest bearing | | Payable on demand | | | 3,188 | |
Note in Substitution for Currency of the Global Environment Facility Trust Fund of the International Bank for Reconstruction and Development | | Non-interest bearing | | Payable on demand | | | 24,749 | |
Note in Substitution for Currency of the Climate Investment Funds of the International Bank for Reconstruction and Development | | Non-interest bearing | | Payable on demand | | | 23,164 | |
Note in Substitution for Currency of the Multilateral Investment Guarantee Agency | | Non-interest bearing | | Payable on demand | | | 721 | |
Note in Substitution for Currency of the Common Fund for Commodities (First Account) | | Non-interest bearing | | Payable on demand | | | 1,523 | |
Government Bonds issued to Development Bank of Japan | | Non-interest bearing | | Payable on demand | | | 1,343,830 | |
Government Bonds issued to Nuclear Damage Liability Facilitation Fund | | Non-interest bearing | | Payable on demand | | | 4,336,400 | |
| | | | | | | | |
Total Bonds | | | | | | ¥ | 166,233,802 | |
| | | | | | | | |
2. Borrowings | | | | | | | | |
Special Account for Local Allocation Tax | | 0.108-0.4% | | 2012 | | ¥ | 33,517,295 | |
Special Account for Pension | | 0.4% | | 2012 | | | 1,479,228 | |
Special Account for Energy Policy | | 0.115-0.116% | | 2012 | | | 517,700 | |
| | | | | | | | |
Total Borrowings | | | | | | ¥ | 35,514,224 | |
Total Direct Internal Floating Debt | | | | | | ¥ | 201,748,025 | |
| | | | | | | | |
Total Direct Internal Debt | | | | | | ¥ | 959,950,296 | |
| | | | | | | | |
32
Debt Guaranteed by the Japanese Government
| | | | | | | | | | | | | | | | |
Title | | Interest | | | Year of Issue | | | Year of
Maturity | | | Principal
Amounts
Outstanding as of
March 31, 2012
(in millions) | |
1. Bonds Issued by Government-Affiliated Corporations | | | | | | | | | | | | | | | | |
| | | | |
Japan Finance Corporation | | | 0.20-1.80% | | | | 2002-2011 | | | | 2012-2021 | | | ¥ | 1,766,000 | |
Deposit Insurance Corporation of Japan | | | 0.10-1.10% | | | | 2005-2012 | | | | 2012-2016 | | | | 1,930,000 | |
Banks’ Shareholdings Purchase Corporation | | | 0.10% | | | | 2011-2012 | | | | 2013-2014 | | | | 200,000 | |
Urban Renaissance Agency | | | 0.10-1.30% | | | | 2008-2011 | | | | 2012-2015 | | | | 950,000 | |
Japan Expressway Holding and Debt Repayment Agency | | | 0.10-2.70% | | | | 2002-2012 | | | | 2012-2049 | | | | 20,692,785 | |
Japan Housing Finance Agency | | | 0.20-0.50% | | | | 2009-2010 | | | | 2012-2013 | | | | 95,000 | |
Kansai International Airport Co., Ltd. | | | 0.50-2.40% | | | | 2002-2012 | | | | 2012-2028 | | | | 376,080 | |
Narita International Airport Corporation | | | 0.60-1.60% | | | | 2002-2006 | | | | 2012-2016 | | | | 86,563 | |
East Nippon Expressway Co., Ltd. | | | 1.30-2.00% | | | | 2005-2009 | | | | 2015-2019 | | | | 260,000 | |
Metropolitan Expressway Co., Ltd. | | | 1.30-1.80% | | | | 2006-2010 | | | | 2016-2020 | | | | 88,300 | |
Central Nippon Expressway Co., Ltd. | | | 1.20-1.90% | | | | 2007-2009 | | | | 2017-2019 | | | | 250,000 | |
West Nippon Expressway Co., Ltd. | | | 1.30-1.90% | | | | 2005-2010 | | | | 2015-2020 | | | | 290,400 | |
Hanshin Expressway Co., Ltd. | | | 1.30-1.70% | | | | 2007-2010 | | | | 2017-2020 | | | | 34,160 | |
Development Bank of Japan | | | 0.40-2.20% | | | | 2003-2012 | | | | 2013-2024 | | | | 1,163,000 | |
Organization for Promoting Urban Development | | | 0.80-1.40% | | | | 2003-2005 | | | | 2013-2015 | | | | 2,005 | |
Central Japan International Airport Co., Ltd. | | | 0.40-1.40% | | | | 2003-2012 | | | | 2013-2022 | | | | 194,110 | |
Japan Finance Organization for Municipalities | | | 0.40-2.20% | | | | 2002-2012 | | | | 2012-2022 | | | | 9,122,050 | |
| | | | | | | | | | | | | | | | |
Total | | | | | | | | | | | | | | ¥ | 37,500,454 | |
| | | | | | | | | | | | | | | | |
| | | | |
2. Borrowings of Government-Affiliated Corporations | | | | | | | | | | | | | | | | |
| | | | |
Deposit Insurance Corporation of Japan | | | 0.110-0.145% | | | | 2011-2012 | | | | 2012-2013 | | | ¥ | 907,800 | |
Banks’ Shareholdings Purchase Corporation | | | 0.108-0.150% | | | | 2011-2012 | | | | 2012-2013 | | | | 350,000 | |
Enterprise Turnaround Initiative Corporation of Japan | | | 0.120-0.128% | | | | 2011-2012 | | | | 2012 | | | | 387,000 | |
Incorporated Administrative Agency—Farmers Pension Fund | | | 0.328-1.664% | | | | 2007-2012 | | | | 2012-2017 | | | | 409,100 | |
Incorporated Administrative Agency—Agriculture, Forestry and Fisheries Credit Foundations | | | 0.263-1.343% | | | | 2008-2011 | | | | 2012-2015 | | | | 11,063 | |
Japan Railway Construction, Transport and Technology Agency | | | 0.110-0.126% | | | | 2011-2012 | | | | 2012-2013 | | | | 54,055 | |
Organization for Environment Improvement around Airport | | | 1.070% | | | | 2009 | | | | 2013 | | | | 92 | |
Japan Oil, Gas and Metals National Corporation | | | 0.118-0.579% | | | | 2009-2012 | | | | 2012-2014 | | | | 604,778 | |
Environmental Restoration and Conservation Agency of Japan | | | 0.258-0.407% | | | | 2010-2011 | | | | 2013-2014 | | | | 8,000 | |
Japan Environmental Safety Corporation | | | 0.243-1.621% | | | | 2008-2012 | | | | 2012-2016 | | | | 114,700 | |
Innovation Network Corporation of Japan | | | 0.107-0.129% | | | | 2011-2012 | | | | 2012-2013 | | | | 219,000 | |
Organization for Promoting Urban Development | | | 0.145-0.348% | | | | 2012 | | | | 2013-2016 | | | | 44,200 | |
| | | | | | | | | | | | | | | | |
Total | | | | | | | | | | | | | | ¥ | 3,109,788 | |
Total Internal Debt Guaranteed by the Japanese Government | | | | | | | | | | | | | | ¥ | 40,610,242 | |
| | | | | | | | | | | | | | | | |
33
EXTERNAL DEBT
Debt Guaranteed by the Japanese Government
| | | | | | | | | | | | | | | | |
| | | Interest | | | Year of Loan | | | Year of
Maturity | | | Principal
Amounts
Outstanding as of
March 31, 2011
(in thousands) | |
Japan Finance Corporation | | | 1.500-5.250% | | | | 2004-2012 | | | | 2012-2019 | | | $ | 18,900,000 | |
| | | 4.375-4.500% | | | | 2003-2004 | | | | 2013-2014 | | | € | 1,250,000 | |
Japan Expressway Holding and Debt Repayment Agency | | | 4.625% | | | | 2003 | | | | 2013 | | | $ | 550,000 | |
Development Bank of Japan | | | 1.500-5.125% | | | | 2005-2012 | | | | 2014-2017 | | | $ | 4,950,000 | |
| | | 4.750% | | | | 2007 | | | | 2027 | | | € | 700,000 | |
| | | 1.050-2.300% | | | | 1998-2007 | | | | 2012-2028 | | | ¥ | 505,000,000 | |
Japan Finance Organization for Municipalities | | | 4.000-5.000% | | | | 2005-2011 | | | | 2015-2021 | | | $ | 3,200,000 | |
| | | 5.750% | | | | 1999 | | | | 2019 | | | £ | 150,000 | |
| | | 4.500% | | | | 2004 | | | | 2014 | | | € | 900,000 | |
| | | 1.350-2.000% | | | | 2003-2008 | | | | 2013-2018 | | | ¥ | 325,000,000 | |
| | | | | | | | | | | | | | | | |
| | | |
Totals by currency | | | | | | | | | | | $ | 27,600,000 | |
| | | | | | | | | | | | | | £ | 150,000 | |
| | | | | | | | | | | | | | € | 2,850,000 | |
| | | | | | | | | | | | | | ¥ | 830,000,000 | |
SUBSCRIPTIONS TO INTERNATIONAL FINANCIAL ORGANIZATIONS
The following table sets forth information relating to Japan’s obligations to contribute to the capital and financing requirements of international financing organizations in which it participates as of March 31, 2011.
| | | | |
Organization | | Subscription
Amount | |
| | | (in millions) | |
International Monetary Fund | | $ | 21,107(a) | |
International Bank for Reconstruction and Development | | | 19,109(b) | |
International Development Association | | | 40,355(c) | |
International Finance Corporation | | | 141(d) | |
Multilateral Investment Guarantee Agency | | | 97(e) | |
International Fund for Agricultural Development | | | 444(f) | |
Asian Development Bank | | | 25,434(g) | |
African Development Bank | | | 5,322(h) | |
African Development Fund | | | 3,795(i) | |
European Bank for Reconstruction and Development | | | 3,299(j) | |
Inter-American Development Bank | | | 5,050(k) | |
Inter-American Investment Corporation | | | 24(l) | |
Multilateral Investment Fund | | | 570(m) | |
| (a) | Equivalent of SDR13,312.8 million as of March 31, 2011. |
| (b) | As stated in IBRD Financial Statements as of June 30, 2011. |
| (c) | As stated in IDA Financial Statements as of June 30, 2011. |
| (d) | As stated in IFC Financial Statements as of June 30, 2011. |
34
| (e) | As stated in MIGA Financial Statements as of June 30, 2011. |
| (f) | As stated in IFAD Financial Statements as of December 31, 2011. |
| (g) | As stated in ADB Financial Statements as of December 31, 2011. |
| (h) | As stated in AfDB Financial Statements as of December 31, 2011. Equivalent of UA 3,467 million. |
| (i) | As stated in AfDF Financial Statements as of December 31, 2011. Equivalent of UA 2,472 million. |
| (j) | As stated in EBRD Financial Statements as of December 31, 2011. Equivalent of € 2,557 million. |
| (k) | As stated in IDB Financial Statements as of December 31, 2011. |
| (l) | As stated in IIC Financial Statements as of December 31, 2011. |
| (m) | As stated in MIF Financial Statements as of December 31, 2011. |
35