Franklin Templeton Variable Insurance Products Trust
Filed: 26 Apr 21, 12:00am

April 26, 2021
Filed via EDGAR
Elena Stojic, Esq.
U.S. Securities and Exchange Commission
100 F Street, N.E.
Washington, D.C. 20549
Subject: Franklin Templeton Variable Insurance Products Trust (the “Registrant”), on behalf of its series Franklin DynaTech VIP Fund (formerly Franklin FlexCap Growth VIP Fund) (the “DynaTech Fund”) and Templeton Developing Markets VIP Fund (the “Developing Markets Fund” and together with the DynaTech Fund, the “Funds)
File Nos. 811-05583; 033-23493
Dear Ms. Stojic:
On behalf of the Fund, submitted herewith under the EDGAR system are the Fund’s responses to the comments of the staff (the “Staff”) of the U.S. Securities and Exchange Commission (the “Commission”) that you provided via telephone to Amy Fitzsimmons on April 12, 2021 with regard to Amendment No. 108 to the Registrant’s registration statement filed with the Commission on February 3, 2021 under the Securities Act of 1933, as amended, and the Investment Company Act of 1940, as amended (the “Registration Statement”). Each comment from the Staff is summarized below, followed by the applicable Fund’s response to the comment. Terms not defined herein have the meaning set forth for that term in the Registration Statement.
1. Comment: Please provide in the Registrant’s response to the Staff the completed fee tables, expense examples and performance information for the Funds.
Response: The completed fee tables, expense examples and performance tables for the Funds are included in Exhibit A.
2. Comment: For the Developing Markets Fund, please supplementally explain whether the change in diversification is expected to result in a change to the Fund’s portfolio.
Response: The change in the diversification status of the Developing Markets Fund is not expected to result in a change to the Fund’s portfolio.
3. Comment: For the Developing Markets Fund, if the Fund typically expects to have material allocations to one or more countries or sectors, please disclose the percentage allocation to each as of a recent date.
Response: The Registrant has not included the percentage allocations of the particular countries and sectors in which the Developing Markets Fund is currently focused as the Fund is
U.S. Securities and Exchange Commission
April 26, 2021
Page 2
not necessarily expected to preserve its focus in such countries and sectors, but rather the Fund’s focus on specific countries and sectors will vary with market conditions.
4. Comment: For the DynaTech Fund, please state supplementally why the Fund’s management fee changed.
Response: The Fund’s investment manager lowered the management fee for the Fund so that it is in-line with the Franklin retail fund that follows the same strategy.
5. Comment: For the DynaTech Fund, in the “Fund Details – Principal Investment Policies and Practices” section, please explain further how market appreciation would cause the Fund’s investment in a particular industry or sector to become a significant aspect of its portfolio.
Response: The requested disclosure has been added.
6. Comment: For the DynaTech Fund, in the “Fund Details – Principal Investment Policies and Practices” section, please remove references to “industry” when describing the Fund’s investment practices in light of the Fund’s concentration policy to not concentrate in an industry.
Response: The Fund’s disclosure has been revised as requested.
7. Comment: For the DynaTech Fund, in the “Fund Details – Principal Investment Policies and Practices – Portfolio Selection” section, please expand the disclosure to include additional insight into the data and analysis the investment manager uses when making decisions to buy, hold or sell positions.
Response: The following disclosure was added to the DynaTech Fund’s prospectus:
[The investment manager’s] research may include among other things consideration of cash flows, income statements, balances sheets and notes and its analysis typically includes forecasts of multiple possible future outcomes.
8. Comment: For the DynaTech Fund, in the “Fund Details – Principal Investment Policies and Practices” section, if the Fund intends to invest principally in emerging markets, please include strategy disclosure.
Response: The applicable strategy disclosure has been added.
Please do not hesitate to contact Jacqueline Edwards at (212) 812-4142, or in her absence, Amy Fitzsimmons at (215) 564-8711, if you have any questions or wish to discuss any of the responses presented above.
Very truly yours,
/s/ Steven J. Gray
Steven J. Gray Co-Secretary and Vice President
EXHIBIT A
Franklin DynaTech VIP Fund (formerly, Franklin Flex Cap Growth VIP Fund)
Class 2:
Fees and Expenses of the Fund
This table describes the fees and expenses that you may pay if you buy and hold shares of the Fund. The table and the example do not include any fees or sales charges imposed by variable insurance contracts, qualified retirement plans or funds of funds. If they were included, your costs would be higher.
Annual Fund Operating Expenses
(expenses that you pay each year as a percentage of the value of your investment)
| Class 2 |
Management fees1 | 0.60% |
Distribution and service (12b-1) fees | 0.25% |
Other expenses | 0.09% |
Total annual Fund operating expenses1 | 0.94% |
1. Management fees of the fund have been restated to reflect current fiscal year fees as a result of a decrease in the Fund’s contractual management fee rate effective on May 1, 2021. If the management fees were not restated to reflect such decrease in fees, the amounts shown above would be greater. Consequently, the Fund’s total annual fund operating expenses differ from the ratio of expenses to average net assets shown in the Financial Highlights.
Example
This Example is intended to help you compare the cost of investing in the Fund with the cost of investing in other mutual funds. The Example assumes that you invest $10,000 in the Fund for the time periods indicated and then redeem all of your shares at the end of the period. The Example also assumes that your investment has a 5% return each year and that the Fund's operating expenses remain the same. Although your actual costs may be higher or lower, based on these assumptions your costs would be:
| 1 Year | 3 Years | 5 Years | 10 Years |
Class 2 | $ 95 | $ 298 | $ 517 | $ 1,149 |
Performance
The following bar chart and table provide some indication of the risks of investing in the Fund. The bar chart shows changes in the Fund's performance from year to year for Class 2 shares. The table shows how the Fund's average annual returns for 1 year, 5 years, 10 years or since inception, as applicable, compare with those of a broad measure of market performance. The Fund's past performance is not necessarily an indication of how the Fund will perform in the future. On May 1, 2021, the Fund's investment strategies changed. The performance below prior to May 1, 2021 is attributable to the Fund's performance before the strategy changes.
The inclusion of the S&P 500® Index shows how the Fund's performance compares to a group of securities in an additional leading stock index.
Performance reflects all Fund expenses but does not include any fees or sales charges imposed by variable insurance contracts, qualified plans or funds of funds. If they had been included, the returns
shown below would be lower. Investors should consult the variable insurance contract prospectus, or the disclosure documents for qualified plans or funds of funds for more information.
Annual Total Returns
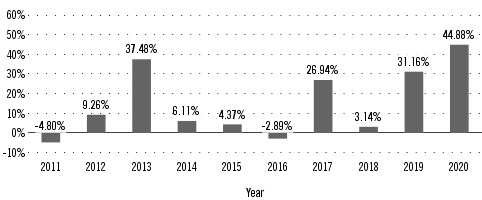
Best Quarter: | Q2'20 | 27.30% |
Worst Quarter: | Q3'11 | -16.74% |
As of March 31, 2021, the Fund's year-to-date return was -0.37%. | ||
Average Annual Total Returns
For the periods ended December 31, 2020
| 1 Year | 5 Years | 10 Years |
Franklin DynaTech VIP Fund - Class 2 | 44.88% | 19.30% | 14.36% |
Russell 1000 Growth Index (index reflects no deduction for fees, expenses or taxes)1 | 38.49% | 20.99% | 17.21% |
S&P 500 Index (index reflects no deduction for fees, expenses or taxes) | 18.40% | 15.21% | 13.88% |
Russell 3000 Growth Index (index reflects no deduction for fees, expenses or taxes)1 | 38.26% | 20.66% | 16.93% |
1. The Russell 1000 Growth Index is replacing the Russell 3000 Growth Index as the Fund’s primary benchmark because the investment manager believes the Russell 1000 Growth Index provides a better comparison to the Fund's investments.
No one index is representative of the Fund's portfolio.
Class 4:
Fees and Expenses of the Fund
This table describes the fees and expenses that you may pay if you buy and hold shares of the Fund. The table and the example do not include any fees or sales charges imposed by variable insurance contracts, qualified retirement plans or funds of funds. If they were included, your costs would be higher.
Annual Fund Operating Expenses
(expenses that you pay each year as a percentage of the value of your investment)
| Class 4 |
Management fees1 | 0.60% |
Distribution and service (12b-1) fees | 0.35% |
Other expenses | 0.09% |
Total annual Fund operating expenses1 | 1.04% |
1. Management fees of the fund have been restated to reflect current fiscal year fees as a result of a decrease in the Fund’s contractual management fee rate effective on May 1, 2021. If the management fees were not restated to reflect such decrease in fees, the amounts shown above would be greater. Consequently, the Fund’s total annual fund operating expenses differ from the ratio of expenses to average net assets shown in the Financial Highlights.
Example
This Example is intended to help you compare the cost of investing in the Fund with the cost of investing in other mutual funds. The Example assumes that you invest $10,000 in the Fund for the time periods indicated and then redeem all of your shares at the end of the period. The Example also assumes that your investment has a 5% return each year and that the Fund's operating expenses remain the same. Although your actual costs may be higher or lower, based on these assumptions your costs would be:
| 1 Year | 3 Years | 5 Years | 10 Years |
Class 4 | $ 106 | $ 329 | $ 571 | $ 1,265 |
Performance
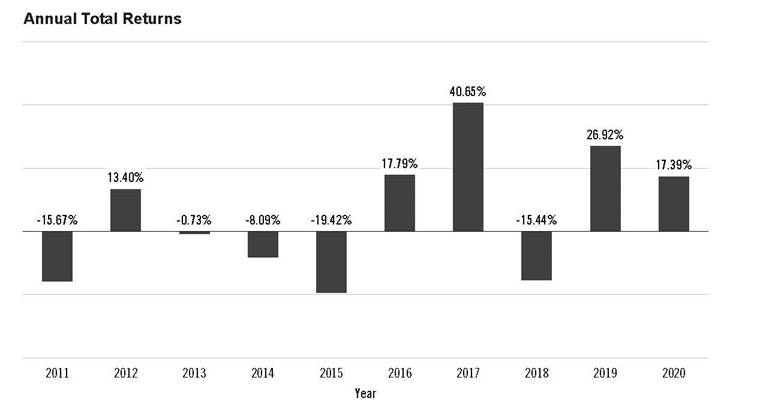
The following bar chart and table provide some indication of the risks of investing in the Fund. The bar chart shows changes in the Fund's performance from year to year for Class 4 shares. The table shows how the Fund's average annual returns for 1 year, 5 years, 10 years or since inception, as applicable, compare with those of a broad measure of market performance. The Fund's past performance is not necessarily an indication of how the Fund will perform in the future. On May 1, 2021, the Fund's investment strategies changed. The performance below prior to May 1, 2021 is attributable to the Fund's performance before the strategy changes.
The inclusion of the S&P 500® Index shows how the Fund's performance compares to a group of securities in an additional leading stock index.
Performance reflects all Fund expenses but does not include any fees or sales charges imposed by variable insurance contracts, qualified plans or funds of funds. If they had been included, the returns shown below would be lower. Investors should consult the variable insurance contract prospectus, or the disclosure documents for qualified plans or funds of funds for more information.
Annual Total Returns

Best Quarter: | Q2'20 | 27.26% |
Worst Quarter: | Q3'11 | -16.69% |
As of March 31, 2021, the Fund's year-to-date return was -0.38%. | ||
Average Annual Total Returns
For the periods ended December 31, 2020
| 1 Year | 5 Years | 10 Years |
Franklin DynaTech VIP Fund - Class 4 | 44.71% | 19.18% | 14.25% |
Russell 1000 Growth Index (index reflects no deduction for fees, expenses or taxes)1 | 38.49% | 20.99% | 17.21% |
S&P 500 Index (index reflects no deduction for fees, expenses or taxes) | 18.40% | 15.21% | 13.88% |
Russell 3000 Growth Index (index reflects no deduction for fees, expenses or taxes)1 | 38.26% | 20.66% | 16.93% |
1. The Russell 1000 Growth Index is replacing the Russell 3000 Growth Index as the Fund’s primary benchmark because the investment manager believes the Russell 1000 Growth Index provides a better comparison to the Fund's investments.
No one index is representative of the Fund's portfolio.
Templeton Developing Markets VIP Fund:
Class 1:
Fees and Expenses of the Fund
This table describes the fees and expenses that you may pay if you buy and hold shares of the Fund. The table and the example do not include any fees or sales charges imposed by variable insurance contracts, qualified retirement plans or funds of funds. If they were included, your costs would be higher.
Annual Fund Operating Expenses
(expenses that you pay each year as a percentage of the value of your investment)
| Class 1 |
Management fees | 1.05% |
Distribution and service (12b-1) fees | None |
Other expenses | 0.14% |
Total annual Fund operating expenses | 1.19% |
Example
This Example is intended to help you compare the cost of investing in the Fund with the cost of investing in other mutual funds. The Example assumes that you invest $10,000 in the Fund for the time periods indicated and then redeem all of your shares at the end of the period. The Example also assumes that your investment has a 5% return each year and that the Fund's operating expenses remain the same. Although your actual costs may be higher or lower, based on these assumptions your costs would be:
| 1 Year | 3 Years | 5 Years | 10 Years |
Class 1 | $ 121 | $ 378 | $ 654 | $ 1,443 |
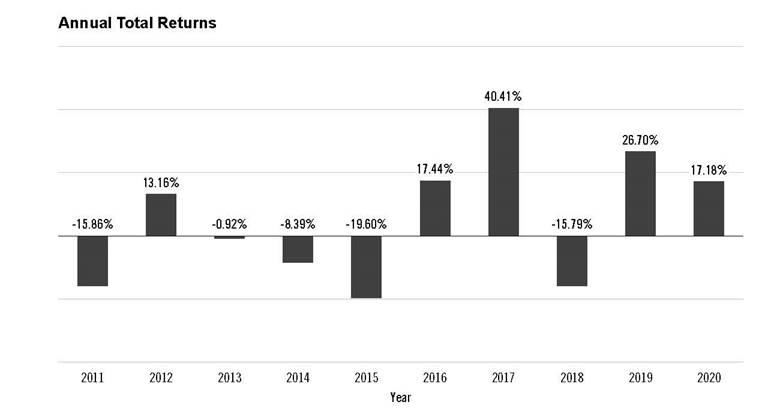
Performance
The following bar chart and table provide some indication of the risks of investing in the Fund. The bar chart shows changes in the Fund's performance from year to year for Class 1 shares. The table shows how the Fund's average annual returns for 1 year, 5 years, 10 years or since inception, as applicable, compare with those of a broad measure of market performance. The Fund's past performance is not necessarily an indication of how the Fund will perform in the future.
Performance reflects all Fund expenses but does not include any fees or sales charges imposed by variable insurance contracts, qualified plans or funds of funds. If they had been included, the returns shown below would be lower. Investors should consult the variable insurance contract prospectus, or the disclosure documents for qualified plans or funds of funds for more information.
Best Quarter: | Q2'20 | 19.93% |
Worst Quarter: | Q1'20 | -25.65% |
As of March 31, 2021, the Fund's year-to-date return was 5.88%. | ||
Average Annual Total Returns
For the periods ended December 31, 2020
| 1 Year | 5 Years | 10 Years |
Templeton Developing Markets VIP Fund - Class 1 | 17.39% | 15.85% | 3.91% |
MSCI Emerging Markets Index-NR (index reflects no deduction for fees, expenses or taxes but are net of dividend tax withholding)1 | 18.31% | 12.80% | 3.63% |
MSCI Emerging Markets Index (index reflects no deduction for fees, expenses or taxes)1 | 18.69% | 13.21% | 4.00% |
1. The MSCI Emerging Markets Index-NR is replacing the MSCI Emerging Markets Index as the Fund’s benchmark because the investment manager believes the MSCI Emerging Markets Index-NR provides a more consistent basis for comparison relative to the Fund's peers.
Class 2:
Fees and Expenses of the Fund
This table describes the fees and expenses that you may pay if you buy and hold shares of the Fund. The table and the example do not include any fees or sales charges imposed by variable insurance contracts, qualified retirement plans or funds of funds. If they were included, your costs would be higher.
Annual Fund Operating Expenses
(expenses that you pay each year as a percentage of the value of your investment)
| Class 2 |
Management fees | 1.05% |
Distribution and service (12b-1) fees | 0.25% |
Other expenses | 0.14% |
Total annual Fund operating expenses | 1.44% |
Example
This Example is intended to help you compare the cost of investing in the Fund with the cost of investing in other mutual funds. The Example assumes that you invest $10,000 in the Fund for the time periods indicated and then redeem all of your shares at the end of the period. The Example also assumes that your investment has a 5% return each year and that the Fund's operating expenses remain the same. Although your actual costs may be higher or lower, based on these assumptions your costs would be:
| 1 Year | 3 Years | 5 Years | 10 Years |
Class 2 | $ 147 | $ 456 | $ 787 | $ 1,724 |
Performance
The following bar chart and table provide some indication of the risks of investing in the Fund. The bar chart shows changes in the Fund's performance from year to year for Class 2 shares. The table shows how the Fund's average annual returns for 1 year, 5 years, 10 years or since inception, as applicable, compare with those of a broad measure of market performance. The Fund's past performance is not necessarily an indication of how the Fund will perform in the future.
Performance reflects all Fund expenses but does not include any fees or sales charges imposed by variable insurance contracts, qualified plans or funds of funds. If they had been included, the returns shown below would be lower. Investors should consult the variable insurance contract prospectus, or the disclosure documents for qualified plans or funds of funds for more information.
Best Quarter: | Q2'20 | 19.74% |
Worst Quarter: | Q1'20 | -25.68% |
As of March 31, 2021, the Fund's year-to-date return was 5.76%. | ||
Average Annual Total Returns
For the periods ended December 31, 2020
| 1 Year | 5 Years | 10 Years |
Templeton Developing Markets VIP Fund - Class 2 | 17.18% | 15.57% | 3.66% |
MSCI Emerging Markets Index-NR (index reflects no deduction for fees, expenses or taxes but are net of dividend tax withholding)1 | 18.31% | 12.80% | 3.63% |
MSCI Emerging Markets Index (index reflects no deduction for fees, expenses or taxes)1 | 18.69% | 13.21% | 4.00% |
1. The MSCI Emerging Markets Index-NR is replacing the MSCI Emerging Markets Index as the Fund’s benchmark because the investment manager believes the MSCI Emerging Markets Index-NR provides a more consistent basis for comparison relative to the Fund's peers.
Class 4:
Fees and Expenses of the Fund
This table describes the fees and expenses that you may pay if you buy and hold shares of the Fund. The table and the example do not include any fees or sales charges imposed by variable insurance contracts, qualified retirement plans or funds of funds. If they were included, your costs would be higher.
Annual Fund Operating Expenses
(expenses that you pay each year as a percentage of the value of your investment)
| Class 4 |
Management fees | 1.05% |
Distribution and service (12b-1) fees | 0.35% |
Other expenses | 0.14% |
Total annual Fund operating expenses | 1.54% |
Example
This Example is intended to help you compare the cost of investing in the Fund with the cost of investing in other mutual funds. The Example assumes that you invest $10,000 in the Fund for the time periods indicated and then redeem all of your shares at the end of the period. The Example also assumes that your investment has a 5% return each year and that the Fund's operating expenses remain the same. Although your actual costs may be higher or lower, based on these assumptions your costs would be:
| 1 Year | 3 Years | 5 Years | 10 Years |
Class 4 | $ 157 | $ 486 | $ 839 | $ 1,834 |
Performance
The following bar chart and table provide some indication of the risks of investing in the Fund. The bar chart shows changes in the Fund's performance from year to year for Class 4 shares. The table shows how the Fund's average annual returns for 1 year, 5 years, 10 years or since inception, as applicable, compare with those of a broad measure of market performance. The Fund's past performance is not necessarily an indication of how the Fund will perform in the future.
Performance reflects all Fund expenses but does not include any fees or sales charges imposed by variable insurance contracts, qualified plans or funds of funds. If they had been included, the returns shown below would be lower. Investors should consult the variable insurance contract prospectus, or the disclosure documents for qualified plans or funds of funds for more information.
Annual Total Returns
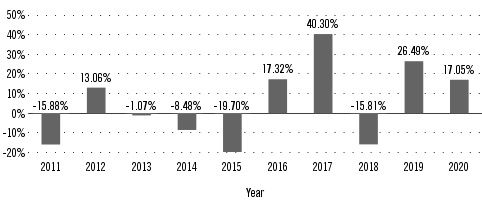
Best Quarter: | Q2'20 | 19.76% |
Worst Quarter: | Q1'20 | -25.72% |
As of March 31, 2021, the Fund's year-to-date return was 5.72%. | ||
Average Annual Total Returns
For the periods ended December 31, 2020
| 1 Year | 5 Years | 10 Years |
Templeton Developing Markets VIP Fund - Class 4 | 17.05% | 15.46% | 3.56% |
MSCI Emerging Markets Index-NR (index reflects no deduction for fees, expenses or taxes but are net of dividend tax withholding)1 | 18.31% | 12.80% | 3.63% |
MSCI Emerging Markets Index (index reflects no deduction for fees, expenses or taxes)1 | 18.69% | 13.21% | 4.00% |
1. The MSCI Emerging Markets Index-NR is replacing the MSCI Emerging Markets Index as the Fund’s benchmark because the investment manager believes the MSCI Emerging Markets Index-NR provides a more consistent basis for comparison relative to the Fund's peers.