UNITED STATES
SECURITIES AND EXCHANGE COMMISSION
Washington, D.C. 20549
FORM N-CSRS
CERTIFIED SHAREHOLDER REPORT OF REGISTERED
MANAGEMENT INVESTMENT COMPANIES
Investment Company Act file number 811-05583
Franklin Templeton Variable Insurance Products Trust
(Exact name of registrant as specified in charter)
One Franklin Parkway, San Mateo, CA 94403-1906
(Address of principal executive offices) (Zip code)
Craig S. Tyle, One Franklin Parkway, San Mateo, CA 94403-1906
(Name and address of agent for service)
Registrant’s telephone number, including area code: (650) 312-2000
Date of fiscal year end: 12/31
Date of reporting period: 06/30/11
| Item 1. | Reports to Stockholders. |

JUNE 30, 2011
FRANKLIN TEMPLETON
VARIABLE INSURANCE PRODUCTS TRUST
SEMIANNUAL
REPORT

FRANKLIN TEMPLETON VARIABLE INSURANCE
PRODUCTS TRUST SEMIANNUAL REPORT
TABLEOF CONTENTS
| i | ||||
| TD-1 | ||||
| TD-8 | ||||
| TF-1 | ||||
| TGB-1 | ||||
| I-1 | ||||
| SI-1 |
*Not part of the semiannual report
NOT FDIC INSURED | MAY LOSE VALUE | NO BANK GUARANTEE
MASTER CLASS 3
IMPORTANT NOTESTOPERFORMANCE INFORMATION
Performance data is historical and cannot predict or guarantee future results. Principal value and investment return will fluctuate with market conditions, and you may have a gain or loss when you withdraw your money. Inception dates of the funds may have preceded the effective dates of the subaccounts, contracts, or their availability in all states.
When reviewing the index comparisons, please keep in mind that indexes have a number of inherent performance differentials over the funds. First, unlike the funds, which must hold a minimum amount of cash to maintain liquidity, indexes do not have a cash component. Second, the funds are actively managed and, thus, are subject to management fees to cover salaries of securities analysts or portfolio managers in addition to other expenses. Indexes are unmanaged and do not include any commissions or other expenses typically associated with investing in securities. Third, indexes often contain a different mix of securities than the fund to which they are compared. Additionally, please remember that indexes are simply a measure of performance and cannot be invested in directly.
i
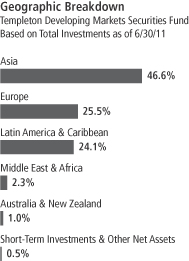
TEMPLETON DEVELOPING MARKETS SECURITIES FUND
We are pleased to bring you Templeton Developing Markets Securities Fund’s semiannual report for the period ended June 30, 2011.
Performance Summary as of 6/30/11
Templeton Developing Markets Securities Fund – Class 3 delivered a +1.13% total return for the six-month period ended 6/30/11.
Performance reflects the Fund’s Class 3 operating expenses, but does not include any contract fees, expenses or sales charges. If they had been included, performance would be lower. These charges and deductions, particularly for variable life policies, can have a significant effect on contract values and insurance benefits. See the contract prospectus for a complete description of these expenses, including sales charges.
Templeton Developing Markets Securities Fund Class 3
Performance data represent past performance, which does not guarantee future results. Investment return and principal value will fluctuate, and you may have a gain or loss when you sell your shares.
Current performance may differ from figures shown.
TD-1
Fund Goal and Main Investments: Franklin Templeton Developing Markets Securities Fund seeks long-term capital appreciation. The Fund normally invests at least 80% of its net assets in emerging market investments.
Performance Overview
You can find the Fund’s six-month total return in the Performance Summary. In comparison, the MSCI Emerging Markets Index generated a +1.03% total return, and the Standard & Poor’s International Finance Corporation Investable Composite Index posted a +0.70% total return for the same period.1 Please note that index performance numbers are for reference and we do not attempt to track an index but rather undertake investments on the basis of fundamental research.
Economic and Market Overview
During the first six months of 2011, global markets experienced heightened volatility. Although the year started on a positive note, markets quickly declined following political instability and riots in the Middle East and North Africa. Investors grew increasingly worried that contagion from the region could spread further and subsequently derail the global economic recovery. On the economic front, rising inflationary pressures and the implementation of monetary tightening measures in some emerging markets further fueled slower global economic growth concerns. The correction in stock prices was, however, short-lived as investors focused on the long-term opportunities and prospects of the wider emerging market asset class. This led investment into emerging markets to turn positive in April, after two consecutive months of net outflows.
Markets, however, fell again in May as focus shifted to debt restructuring issues in the eurozone. Investors adopted a more risk-averse position over Greece’s credit rating downgrade and concerns the debt crisis could spread to larger economies such as Spain. The postponed disbursement of European Union (EU) funds to Greece coupled with that country’s political uncertainty further heightened market volatility in June. However, the survival of Prime Minister George Papandreou in a vote of confidence, the passing of austerity measures in Greece and the EU’s promises of a second bailout in July led markets to turn around. Within this environment, emerging markets ended the first half of the year with a slightly positive return.
1. Source: © 2011 Morningstar. One cannot invest directly in an index, and an index is not representative of the Fund’s portfolio. Please see Index Descriptions following the Fund Summaries.
Fund Risks: The Fund’s investments in stocks may offer the potential for long-term gains but can be subject to short-term price fluctuations. Investing in emerging or developing markets is subject to all the risks of foreign investing generally as well as additional, heightened risks, including currency fluctuations, economic instability, market volatility, political and social instability, the relatively smaller size and lesser liquidity of these markets, and less government supervision and regulation of business and industry practices. The Fund may have significant investments in one or more countries or in particular sectors or industries from time to time, and may carry greater risk of adverse developments in a country, sector or industry than a fund that invests more broadly. Smaller and midsize company securities can increase the risk of greater price fluctuations, particularly over the short term. The manager applies various techniques and analyses in making investment decisions for the Fund, but there can be no guarantee that these decisions will produce the desired results. The Fund’s prospectus also includes a description of the main investment risks.
TD-2
Investment Strategy
We employ a fundamental research, value-oriented, long-term investment approach. We focus on the market price of a company’s securities relative to our evaluation of its long-term earnings, asset value and cash flow potential. We also consider a company’s profit and loss outlook, balance sheet strength, cash flow trends and asset value in relation to the current price. Our analysis considers the company’s corporate governance behavior as well as its position in its sector, the economic framework and political environment. We invest in securities without regard to benchmark comparisons.
Manager’s Discussion
During the six-month reporting period, key contributors to Fund performance included Astra International, Indonesia’s leading car and motorcycle company, Gazprom, a major Russian global gas producer, and President Chain Store, operator of leading, global convenience store chain 7-Eleven in Taiwan. Astra recorded significantly higher net income in the first quarter of 2011 due to greater domestic demand for motor vehicles and higher profits from its heavy equipment and palm oil businesses. The company profited from Indonesia’s robust economic growth, higher incomes and affordable credit. Gazprom benefited from higher earnings due to strong demand and expectations of greater European demand in 2011. In our analysis, Gazprom is well positioned to gain from the long-term trend in rising commodity prices and supply shocks in regions such as the Middle East. President Chain Store also showed solid corporate results, superior brand franchise and higher domestic demand, which supported its share price performance. Our analysis indicates a strong growth outlook for President Chain Store as it could be a beneficiary of Taiwan’s domestic recovery and rising Chinese tourism.
In contrast, three notable detractors were from India. The Indian market was one of the worst emerging market performers in the first half of 2011. The major domestic factors leading to the market correction were concerns of easing gross domestic product growth, higher inflation and interest rates, as well as uncertainty surrounding the implementation of a tax policy on Mauritius fund flows into India’s stock market. Weighing on Fund performance were Hindalco Industries, a major Indian producer of aluminum, Sesa Goa, India’s leading iron ore producer, and Infosys, one of the top information technology consulting companies in India. Weakening commodity prices during the period also adversely affected the share prices of Hindalco and Sesa Goa, while a stronger
TD-3
Indian rupee impacted Infosys. Taking a longer term view, however, our analysis shows Hindalco and Sesa Goa could benefit from global demand for metals supporting higher commodity prices. In addition, in our view Infosys is well positioned to benefit from the outsourcing trend of services to Indian consulting companies.
It is also important to recognize the effect of currency movements on the Fund’s performance. In general, if the value of the U.S. dollar goes up compared with a foreign currency, an investment traded in that foreign currency will go down in value because it will be worth fewer U.S. dollars. This can have a negative effect on Fund performance. Conversely, when the U.S. dollar weakens in relation to a foreign currency, an investment traded in that foreign currency will increase in value, which can contribute to Fund performance. For the six months ended June 30, 2011, the U.S. dollar declined in value relative to most currencies. As a result, the Fund’s performance was positively affected by the portfolio’s predominant investment in securities with non-U.S. currency exposure. However, one cannot expect the same result in future periods.
During the past six months, we increased the Fund’s holdings in Singapore, Australia, Indonesia and Thailand as we searched for attractive investment opportunities. We added to our holdings in construction, Internet software and services, industrial machinery, and industrial conglomerates companies. Key purchases included Australia’s BHP Billiton, a major diversified natural resources company with significant sales in emerging markets, SembCorp Marine, Singapore’s premier global marine and offshore engineering group, and Tencent Holdings, China’s leading provider of Internet and mobile phone value-added services.
Conversely, the Fund reduced its investments in Brazil, India, Mexico, South Africa and China via China H shares to focus on attractively valued stocks within our investment universe.2 We trimmed our holdings primarily in catalog retail, marine, wireless telecommunication services, coal and consumable fuels, and diversified metals and mining companies. In addition, we identified and reduced several holdings that had reached their target prices by the end of the reporting period including Brazilian cosmetics company Natura Cosmeticos, Russian wireless service provider Mobile Telesystems, and Chinese coal producer China Coal Energy. The Fund eliminated its positions in China Coal Energy and Mobile Telesystems by period-end.
2. “China-H” denotes shares of China-incorporated, Hong Kong Stock Exchange-listed companies with most businesses in China.
Top 10 Holdings
Templeton Developing Markets
Securities Fund
6/30/11
| Company Sector/Industry, Country | % of Total Net Assets | |||
| Vale SA, ADR, pfd., A | 6.5% | |||
| Metals & Mining, Brazil | ||||
| Tata Consultancy Services Ltd. | 6.4% | |||
| IT Services, India | ||||
AmBev (Companhia de Bebidas das Americas), ord. & IDR | 4.9% | |||
| Beverages, Brazil | ||||
| Norilsk Nickel (Mining and Metallurgical Co. Norilsk Nickel), ADR | 4.5% | |||
| Metals & Mining, Russia | ||||
| Itau Unibanco Holding SA, ADR | 4.3% | |||
| Commercial Banks, Brazil | ||||
| Gazprom, ADR | 4.1% | |||
| Oil, Gas & Consumable Fuels, Russia | ||||
| PT Astra International Tbk | 3.7% | |||
| Automobiles, Indonesia | ||||
| LUKOIL Holdings, ADR | 3.2% | |||
| Oil, Gas & Consumable Fuels, Russia | ||||
| Sberbank RF | 2.9% | |||
| Commercial Banks, Russia | ||||
| President Chain Store Corp. | 2.7% | |||
| Food & Staples Retailing, Taiwain | ||||
The dollar value, number of shares or principal amount, and names of all portfolio holdings are listed in the Fund’s Statement of Investments.
TD-4
Thank you for your participation in Templeton Developing Markets Securities Fund. We look forward to serving your future investment needs.
The foregoing information reflects our analysis, opinions and portfolio holdings as of June 30, 2011, the end of the reporting period. The way we implement our main investment strategies and the resulting portfolio holdings may change depending on factors such as market and economic conditions. These opinions may not be relied upon as investment advice or an offer for a particular security. The information is not a complete analysis of every aspect of any market, country, industry, security or the Fund. Statements of fact are from sources considered reliable, but the investment manager makes no representation or warranty as to their completeness or accuracy. Although historical performance is no guarantee of future results, these insights may help you understand our investment management philosophy.
Top 10 Countries
Templeton Developing Markets
Securities Fund
6/30/11
| % of Total Net Assets | ||||
| Brazil | 21.3% | |||
| Russia | 17.6% | |||
| India | 14.6% | |||
| China | 11.3% | |||
| Indonesia | 6.7% | |||
| Thailand | 4.2% | |||
| U.K. | 4.1% | |||
| Turkey | 3.5% | |||
| Taiwan | 3.0% | |||
| Hong Kong | 2.2% | |||
TD-5
Fund Expenses
As an investor in a variable insurance contract (Contract) that indirectly provides for investment in an underlying mutual fund, you can incur transaction and/or ongoing expenses at both the Fund level and the Contract level.
| • | Transaction expenses can include sales charges (loads) on purchases, redemption fees, surrender fees, transfer fees and premium taxes. |
| • | Ongoing expenses can include management fees, distribution and service (12b-1) fees, contract fees, annual maintenance fees, mortality and expense risk fees and other fees and expenses. All mutual funds and Contracts have some types of ongoing expenses. |
The expenses shown in the table are meant to highlight ongoing expenses at the Fund level only and do not include ongoing expenses at the Contract level, or transaction expenses at either the Fund or Contract levels. While the Fund does not have transaction expenses, if the transaction and ongoing expenses at the Contract level were included, the expenses shown below would be higher. You should consult your Contract prospectus or disclosure document for more information.
The table shows Fund-level ongoing expenses and can help you understand these expenses and compare them with those of other mutual funds offered through the Contract. The table assumes a $1,000 investment held for the six months indicated. Please refer to the Fund prospectus for additional information on operating expenses.
Actual Fund Expenses
The first line (Actual) of the table provides actual account values and expenses. The “Ending Account Value” is derived from the Fund’s actual return, which includes the effect of ongoing Fund expenses, but does not include the effect of ongoing Contract expenses.
You can estimate the Fund-level expenses you incurred during the period by following these steps. Of course, your account value and expenses will differ from those in this illustration:
| 1. | Divide your account value by $1,000. |
If an account had an $8,600 value, then $8,600 ÷ $1,000 = 8.6.
| 2. | Multiply the result by the number under the heading “Fund-Level Expenses Incurred During Period.” |
If Fund-Level Expenses Incurred During Period were $7.50, then 8.6 x $7.50 = $64.50.
In this illustration, the estimated expenses incurred this period at the Fund level are $64.50.
Templeton Developing Markets Securities Fund Class 3
TD-6
Hypothetical Example for Comparison with Other Mutual Funds
Information in the second line (Hypothetical) of the table can help you compare ongoing expenses of the Fund with those of other mutual funds offered through the Contract. This information may not be used to estimate the actual ending account balance or expenses you incurred during the period. The hypothetical “Ending Account Value” is based on the Fund’s actual expense ratio and an assumed 5% annual rate of return before expenses, which does not represent the Fund’s actual return. The figure under the heading “Fund-Level Expenses Incurred During Period” shows the hypothetical expenses your account would have incurred under this scenario. You can compare this figure with the 5% hypothetical examples that appear in shareholder reports of other funds offered through a Contract.
| Class 3 | Beginning Account Value 1/1/11 | Ending Account Value 6/30/11 | Fund-Level Expenses Incurred During Period* 1/1/11–6/30/11 | |||||||||
Actual | $ | 1,000 | $ | 1,011.30 | $ | 8.38 | ||||||
Hypothetical (5% return before expenses) | $ | 1,000 | $ | 1,016.46 | $ | 8.40 | ||||||
*Expenses are calculated using the most recent six-month annualized expense ratio for the Fund’s Class 3 shares (1.68%), which does not include any ongoing expenses of the Contract for which the Fund is an investment option, multiplied by the average account value over the period, multiplied by 181/365 to reflect the one-half year period.
TD-7
SUPPLEMENT DATED JULY 15, 2011
TOTHE PROSPECTUS
DATED MAY 1, 2011
OF
TEMPLETON DEVELOPING MARKETS SECURITIES FUND – CLASS 3
(a series of Franklin Templeton Variable Insurance Products Trust (the “Trust”)).
The prospectus is amended as follows:
1. On page TD-S1 of the Fund Summary, under “Fees and Expenses of the Fund,” the “Annual Fund Operating Expenses” table and “Example” are replaced with the following:
| ANNUAL FUND OPERATING EXPENSES | (expenses that you pay each year as a percentage of the value of your investment) | |||
| Class 3 | ||||
Management fees1 | 1.11% | |||
Distribution and service (12b-1) fees | 0.25% | |||
Other expenses | 0.26% | |||
|
| |||
Acquired fund fees and expenses1 | 0.01% | |||
|
| |||
Total annual Fund operating expenses | 1.63% | |||
|
| |||
Fee waiver and/or expense reimbursement1 | -0.01% | |||
|
| |||
Total annual Fund operating expenses after fee waiver | 1.62% | |||
|
| |||
| 1. | Restated to reflect the decrease in the investment management fee effective May 1, 2011. The investment manager has contractually agreed in advance to reduce its fee as a result of the Fund’s investment in a Franklin Templeton money fund (acquired fund) for at least the next 12-month period. Contractual fee waiver and/or expense reimbursement agreement may not be terminated during the term set forth above. Total annual Fund operating expenses differ from the ratio of expenses to average net assets shown in the Financial Highlights, which do not reflect the decrease in management fee and the acquired fund fees and expenses. |
| 2. | Total annual Fund operating expenses differ from the ratio of expenses to average net assets shown in the Financial Highlights, which reflect the operating expenses of the Fund and do not include acquired fund fees and expenses. |
Example
This Example is intended to help you compare the cost of investing in the Fund with the cost of investing in other mutual funds. The Example assumes that you invest $10,000 in the Fund for the time periods indicated and then redeem all of your shares at the end of the period. The Example also assumes that your investment has a 5% return each year and that the Fund’s operating expenses remain the same. The Example reflects adjustments made to the Fund’s operating expenses due to the fee waiver and/or expense reimbursement by the investment manager and/or administrator for the 1 Year numbers only. Although your actual costs may be higher or lower, based on these assumptions your costs would be:
| 1 Year | 3 Years | 5 Years | 10 Years | |||||||||||||
Class 3 | $ | 165 | $ | 513 | $ | 886 | $ | 1,933 | ||||||||
TD-8
2. The text under the heading “Portfolio Turnover” on page TD-S1 of the Fund Summary is replaced with the following:
The Fund pays transaction costs, such as commissions, when it buys and sells securities (or “turns over” its portfolio). A higher portfolio turnover rate may indicate higher transaction costs and may result in higher taxes when Fund shares are held in a taxable account. These costs, which are not reflected in annual fund operating expenses or in the example, affect the Fund’s performance. During the most recent fiscal year, the Fund’s portfolio turnover rate was 24.41% of the average value of its portfolio.
Please keep this supplement for future reference.
TD-9
Franklin Templeton Variable Insurance Products Trust
Financial Highlights
Templeton Developing Markets Securities Fund
Six Months (unaudited) | Year Ended December 31, | |||||||||||||||||||||||
| Class 1 | 2010 | 2009 | 2008 | 2007 | 2006 | |||||||||||||||||||
| ||||||||||||||||||||||||
Per share operating performance | ||||||||||||||||||||||||
(for a share outstanding throughout the period) | ||||||||||||||||||||||||
Net asset value, beginning of period | $ | 11.40 | $ | 9.86 | $ | 6.11 | $ | 16.16 | $ | 13.92 | $ | 10.99 | ||||||||||||
|
| |||||||||||||||||||||||
Income from investment operationsa: | ||||||||||||||||||||||||
Net investment incomeb | 0.08 | 0.09 | 0.12 | 0.16 | 0.32 | 0.24 | ||||||||||||||||||
Net realized and unrealized gains (losses) | 0.05 | 1.63 | 4.02 | (7.40 | ) | 3.51 | 2.84 | |||||||||||||||||
|
| |||||||||||||||||||||||
Total from investment operations | 0.13 | 1.72 | 4.14 | (7.24 | ) | 3.83 | 3.08 | |||||||||||||||||
|
| |||||||||||||||||||||||
Less distributions from: | ||||||||||||||||||||||||
Net investment income | (0.13 | ) | (0.18 | ) | (0.36 | ) | (0.37 | ) | (0.38 | ) | (0.15 | ) | ||||||||||||
Net realized gains | — | — | (0.03 | ) | (2.44 | ) | (1.21 | ) | — | |||||||||||||||
|
| |||||||||||||||||||||||
Total distributions | (0.13 | ) | (0.18 | ) | (0.39 | ) | (2.81 | ) | (1.59 | ) | (0.15 | ) | ||||||||||||
|
| |||||||||||||||||||||||
Redemption feesc | — | — | — | — | — | — | ||||||||||||||||||
|
| |||||||||||||||||||||||
Net asset value, end of period | $ | 11.40 | $ | 11.40 | $ | 9.86 | $ | 6.11 | $ | 16.16 | $ | 13.92 | ||||||||||||
|
| |||||||||||||||||||||||
Total returnd | 1.20% | 17.83% | 73.32% | (52.62)% | 29.09% | 28.43% | ||||||||||||||||||
Ratios to average net assetse | ||||||||||||||||||||||||
Expenses | 1.43% | 1.49% | f | 1.45% | f | 1.52% | f | 1.48% | f | 1.47% | f | |||||||||||||
Net investment income | 1.47% | 0.87% | 1.64% | 1.52% | 2.07% | 1.93% | ||||||||||||||||||
Supplemental data | ||||||||||||||||||||||||
Net assets, end of period (000’s) | $ | 309,910 | $ | 347,242 | $ | 325,927 | $ | 234,213 | $ | 753,843 | $ | 749,120 | ||||||||||||
Portfolio turnover rate | 4.70% | 24.41% | 56.58% | g | 75.11% | g | 98.32% | 53.65% | ||||||||||||||||
aThe amount shown for a share outstanding throughout the period may not correlate with the Statement of Operations for the period due to the timing of sales and repurchases of the Fund shares in relation to income earned and/or fluctuating market value of the investments of the Fund.
bBased on average daily shares outstanding.
cAmount rounds to less than $0.01 per share.
dTotal return does not include fees, charges or expenses imposed by the variable annuity and life insurance contracts for which the Franklin Templeton Variable Insurance Products Trust serves as an underlying investment vehicle. Total return is not annualized for periods less than one year.
eRatios are annualized for periods less than one year.
fBenefit of expense reduction rounds to less than 0.01%.
gExcludes the value of portfolio securities delivered as a result of redemptions in-kind.
The accompanying notes are an integral part of these financial statements.
TD-10
Franklin Templeton Variable Insurance Products Trust
Financial Highlights (continued)
Templeton Developing Markets Securities Fund
Six Months (unaudited) | Year Ended December 31, | |||||||||||||||||||||||
| Class 2 | 2010 | 2009 | 2008 | 2007 | 2006 | |||||||||||||||||||
| ||||||||||||||||||||||||
Per share operating performance | ||||||||||||||||||||||||
(for a share outstanding throughout the period) | ||||||||||||||||||||||||
Net asset value, beginning of period | $ | 11.30 | $ | 9.78 | $ | 6.04 | $ | 15.99 | $ | 13.79 | $ | 10.90 | ||||||||||||
|
| |||||||||||||||||||||||
Income from investment operationsa: | ||||||||||||||||||||||||
Net investment incomeb | 0.07 | 0.06 | 0.11 | 0.15 | 0.27 | 0.20 | ||||||||||||||||||
Net realized and unrealized gains (losses) | 0.05 | 1.62 | 3.98 | (7.33 | ) | 3.49 | 2.82 | |||||||||||||||||
|
| |||||||||||||||||||||||
Total from investment operations | 0.12 | 1.68 | 4.09 | (7.18 | ) | 3.76 | 3.02 | |||||||||||||||||
|
| |||||||||||||||||||||||
Less distributions from: | ||||||||||||||||||||||||
Net investment income | (0.10 | ) | (0.16 | ) | (0.32 | ) | (0.33 | ) | (0.35 | ) | (0.13 | ) | ||||||||||||
Net realized gains | — | — | (0.03 | ) | (2.44 | ) | (1.21 | ) | — | |||||||||||||||
|
| |||||||||||||||||||||||
Total distributions | (0.10 | ) | (0.16 | ) | (0.35 | ) | (2.77 | ) | (1.56 | ) | (0.13 | ) | ||||||||||||
|
| |||||||||||||||||||||||
Redemption feesc | — | — | — | — | — | — | ||||||||||||||||||
|
| |||||||||||||||||||||||
Net asset value, end of period | $ | 11.32 | $ | 11.30 | $ | 9.78 | $ | 6.04 | $ | 15.99 | $ | 13.79 | ||||||||||||
|
| |||||||||||||||||||||||
Total returnd | 1.12% | 17.58% | 72.59% | (52.70)% | 28.78% | 28.09% | ||||||||||||||||||
Ratios to average net assetse | ||||||||||||||||||||||||
Expenses | 1.68% | 1.74% | f | 1.70% | f | 1.77% | f | 1.73% | f | 1.72% | f | |||||||||||||
Net investment income | 1.22% | 0.62% | 1.39% | 1.27% | 1.82% | 1.68% | ||||||||||||||||||
Supplemental data | ||||||||||||||||||||||||
Net assets, end of period (000’s) | $ | 366,156 | $ | 392,546 | $ | 435,947 | $ | 264,186 | $ | 1,090,549 | $ | 857,514 | ||||||||||||
Portfolio turnover rate | 4.70% | 24.41% | 56.58% | g | 75.11% | g | 98.32% | 53.65% | ||||||||||||||||
aThe amount shown for a share outstanding throughout the period may not correlate with the Statement of Operations for the period due to the timing of sales and repurchases of the Fund shares in relation to income earned and/or fluctuating market value of the investments of the Fund.
bBased on average daily shares outstanding.
cAmount rounds to less than $0.01 per share.
dTotal return does not include fees, charges or expenses imposed by the variable annuity and life insurance contracts for which the Franklin Templeton Variable Insurance Products Trust serves as an underlying investment vehicle. Total return is not annualized for periods less than one year.
eRatios are annualized for periods less than one year.
fBenefit of expense reduction rounds to less than 0.01%.
gExcludes the value of portfolio securities delivered as a result of redemptions in-kind.
The accompanying notes are an integral part of these financial statements.
TD-11
Franklin Templeton Variable Insurance Products Trust
Financial Highlights (continued)
Templeton Developing Markets Securities Fund
Six Months (unaudited) | Year Ended December 31, | |||||||||||||||||||||||
| Class 3 | 2010 | 2009 | 2008 | 2007 | 2006 | |||||||||||||||||||
| ||||||||||||||||||||||||
Per share operating performance | ||||||||||||||||||||||||
(for a share outstanding throughout the period) | ||||||||||||||||||||||||
Net asset value, beginning of period | $ | 11.23 | $ | 9.73 | $ | 6.02 | $ | 15.96 | $ | 13.78 | $ | 10.90 | ||||||||||||
|
| |||||||||||||||||||||||
Income from investment operationsa: | ||||||||||||||||||||||||
Net investment incomeb | 0.07 | 0.06 | 0.10 | 0.11 | 0.24 | 0.20 | ||||||||||||||||||
Net realized and unrealized gains (losses) | 0.05 | 1.60 | 3.97 | (7.27 | ) | 3.52 | 2.83 | |||||||||||||||||
|
| |||||||||||||||||||||||
Total from investment operations | 0.12 | 1.66 | 4.07 | (7.16 | ) | 3.76 | 3.03 | |||||||||||||||||
|
| |||||||||||||||||||||||
Less distributions from: | ||||||||||||||||||||||||
Net investment income | (0.10 | ) | (0.16 | ) | (0.33 | ) | (0.34 | ) | (0.37 | ) | (0.15 | ) | ||||||||||||
Net realized gains | — | — | (0.03 | ) | (2.44 | ) | (1.21 | ) | — | |||||||||||||||
|
| |||||||||||||||||||||||
Total distributions | (0.10 | ) | (0.16 | ) | (0.36 | ) | (2.78 | ) | (1.58 | ) | (0.15 | ) | ||||||||||||
|
| |||||||||||||||||||||||
Redemption feesc | — | — | — | — | — | — | ||||||||||||||||||
|
| |||||||||||||||||||||||
Net asset value, end of period | $ | 11.25 | $ | 11.23 | $ | 9.73 | $ | 6.02 | $ | 15.96 | $ | 13.78 | ||||||||||||
|
| |||||||||||||||||||||||
Total returnd | 1.13% | 17.51% | 72.63% | (52.67)% | 28.70% | 28.17% | ||||||||||||||||||
Ratios to average net assetse | ||||||||||||||||||||||||
Expenses | 1.68% | 1.74% | f | 1.70% | f | 1.77% | f | 1.73% | f | 1.72% | f | |||||||||||||
Net investment income | 1.22% | 0.62% | 1.39% | 1.27% | 1.82% | 1.68% | ||||||||||||||||||
Supplemental data | ||||||||||||||||||||||||
Net assets, end of period (000’s) | $ | 60,517 | $ | 66,484 | $ | 66,718 | $ | 32,953 | $ | 100,961 | $ | 43,372 | ||||||||||||
Portfolio turnover rate | 4.70% | 24.41% | 56.58% | g | 75.11% | g | 98.32% | 53.65% | ||||||||||||||||
aThe amount shown for a share outstanding throughout the period may not correlate with the Statement of Operations for the period due to the timing of sales and repurchases of the Fund shares in relation to income earned and/or fluctuating market value of the investments of the Fund.
bBased on average daily shares outstanding.
cAmount rounds to less than $0.01 per share.
dTotal return does not include fees, charges or expenses imposed by the variable annuity and life insurance contracts for which the Franklin Templeton Variable Insurance Products Trust serves as an underlying investment vehicle. Total return is not annualized for periods less than one year.
eRatios are annualized for periods less than one year.
fBenefit of expense reduction rounds to less than 0.01%.
gExcludes the value of portfolio securities delivered as a result of redemptions in-kind.
The accompanying notes are an integral part of these financial statements.
TD-12
Franklin Templeton Variable Insurance Products Trust
Financial Highlights (continued)
Templeton Developing Markets Securities Fund
Six Months (unaudited) | Year Ended December 31, | |||||||||||||||
| Class 4 | 2010 | 2009 | 2008a | |||||||||||||
| ||||||||||||||||
Per share operating performance | ||||||||||||||||
(for a share outstanding throughout the period) | ||||||||||||||||
Net asset value, beginning of period | $ | 11.30 | $ | 9.80 | $ | 6.09 | $ | 14.88 | ||||||||
|
| |||||||||||||||
Income from investment operationsb: | ||||||||||||||||
Net investment income (loss)c | 0.06 | 0.05 | 0.09 | (0.33 | ) | |||||||||||
Net realized and unrealized gains (losses) | 0.06 | 1.61 | 4.00 | (5.65 | ) | |||||||||||
|
| |||||||||||||||
Total from investment operations | 0.12 | 1.66 | 4.09 | (5.98 | ) | |||||||||||
|
| |||||||||||||||
Less distributions from: | ||||||||||||||||
Net investment income | (0.10 | ) | (0.16 | ) | (0.35 | ) | (0.37 | ) | ||||||||
Net realized gains | — | — | (0.03 | ) | (2.44 | ) | ||||||||||
|
| |||||||||||||||
Total distributions | (0.10 | ) | (0.16 | ) | (0.38 | ) | (2.81 | ) | ||||||||
|
| |||||||||||||||
Redemption feesd | — | — | — | — | ||||||||||||
|
| |||||||||||||||
Net asset value, end of period | $ | 11.32 | $ | 11.30 | $ | 9.80 | $ | 6.09 | ||||||||
|
| |||||||||||||||
Total returne | 1.08% | 17.41% | 72.45% | (48.66)% | ||||||||||||
Ratios to average net assetsf | ||||||||||||||||
Expenses | 1.78% | 1.84% | g | 1.80% | g | 1.87% | g | |||||||||
Net investment income | 1.12% | 0.52% | 1.29% | 1.17% | ||||||||||||
Supplemental data | ||||||||||||||||
Net assets, end of period (000’s) | $ | 33,809 | $ | 37,198 | $ | 26,362 | $ | 7,208 | ||||||||
Portfolio turnover rate | 4.70% | 24.41% | 56.58% | h | 75.11% | h | ||||||||||
aFor the period February 29, 2008 (effective date) to December 31, 2008.
bThe amount shown for a share outstanding throughout the period may not correlate with the Statement of Operations for the period due to the timing of sales and repurchases of the Fund shares in relation to income earned and/or fluctuating market value of the investments of the Fund.
cBased on average daily shares outstanding.
dAmount rounds to less than $0.01 per share.
eTotal return does not include fees, charges or expenses imposed by the variable annuity and life insurance contracts for which the Franklin Templeton Variable Insurance Products Trust serves as an underlying investment vehicle. Total return is not annualized for periods less than one year.
fRatios are annualized for periods less than one year.
gBenefit of expense reduction rounds to less than 0.01%.
hExcludes the value of portfolio securities delivered as a result of redemptions in-kind.
The accompanying notes are an integral part of these financial statements.
TD-13
Franklin Templeton Variable Insurance Products Trust
Statement of Investments, June 30, 2011 (unaudited)
| Templeton Developing Markets Securities Fund | Industry | Shares | Value | |||||||
Common Stocks 89.6% | ||||||||||
Australia 1.0% | ||||||||||
BHP Billiton Ltd. | Metals & Mining | 166,062 | $ | 7,800,118 | ||||||
|
| |||||||||
Brazil 11.8% | ||||||||||
Companhia de Bebidas das Americas (AmBev) | Beverages | 1,356,585 | 37,358,324 | |||||||
Companhia de Bebidas das Americas (AmBev), IDR | Beverages | 5,765 | 158,759 | |||||||
Itau Unibanco Holding SA, ADR | Commercial Banks | 1,419,474 | 33,428,613 | |||||||
aItausa - Investimentos Itau SA, IDR | Commercial Banks | 10,108 | 77,682 | |||||||
Natura Cosmeticos SA | Personal Products | 277,532 | 6,931,857 | |||||||
Souza Cruz SA | Tobacco | 995,350 | 12,659,804 | |||||||
|
| |||||||||
| 90,615,039 | ||||||||||
|
| |||||||||
China 11.3% | ||||||||||
bAluminum Corp. of China Ltd., H | Metals & Mining | 6,214,000 | 5,238,390 | |||||||
Anta Sports Products Ltd. | Textiles, Apparel & Luxury Goods | 2,131,000 | 3,800,980 | |||||||
Changsha Zoomlion Heavy Industry Science and Technology Development Co. Ltd., H | Machinery | 2,475,720 | 4,708,537 | |||||||
CNOOC Ltd. | Oil, Gas & Consumable Fuels | 7,181,000 | 16,794,963 | |||||||
Golden Eagle Retail Group Ltd. | Multiline Retail | 1,234,000 | 3,139,808 | |||||||
Great Wall Motor Co. Ltd., H | Automobiles | 3,354,000 | 5,516,908 | |||||||
Guangzhou Automobile Group Co. Ltd., H | Automobiles | 9,006,396 | 10,995,054 | |||||||
Inner Mongolia Yitai Coal Co. Ltd., B | Oil, Gas & Consumable Fuels | 1,019,967 | 5,959,667 | |||||||
PetroChina Co. Ltd., H | Oil, Gas & Consumable Fuels | 13,880,000 | 20,262,383 | |||||||
Tencent Holdings Ltd. | Internet Software & Services | 130,600 | 3,547,896 | |||||||
Travelsky Technology Ltd., H | IT Services | 1,967,000 | 1,238,577 | |||||||
Yantai Changyu Pioneer Wine Co. Ltd., B | Beverages | 532,200 | 5,954,102 | |||||||
|
| |||||||||
| 87,157,265 | ||||||||||
|
| |||||||||
Hong Kong 2.2% | ||||||||||
Dairy Farm International Holdings Ltd. | Food & Staples Retailing | 1,014,733 | 8,320,811 | |||||||
VTech Holdings Ltd. | Communications Equipment | 724,000 | 8,624,641 | |||||||
|
| |||||||||
| 16,945,452 | ||||||||||
|
| |||||||||
India 14.6% | ||||||||||
Coal India Ltd. | Oil, Gas & Consumable Fuels | 759,353 | 6,676,453 | |||||||
Grasim Industries Ltd. | Chemicals | 40,253 | 1,888,184 | |||||||
Hindalco Industries Ltd. | Metals & Mining | 1,732,548 | 7,026,466 | |||||||
Infosys Ltd. | IT Services | 238,290 | 15,523,288 | |||||||
National Aluminium Co. Ltd. | Metals & Mining | 2,244,416 | 4,163,963 | |||||||
Oil & Natural Gas Corp. Ltd. | Oil, Gas & Consumable Fuels | 1,826,624 | 11,212,271 | |||||||
Sesa Goa Ltd. | Metals & Mining | 1,076,310 | 6,804,411 | |||||||
Tata Chemicals Ltd. | Chemicals | 1,172,718 | 9,773,526 | |||||||
Tata Consultancy Services Ltd. | IT Services | 1,857,283 | 49,120,412 | |||||||
|
| |||||||||
| 112,188,974 | ||||||||||
|
| |||||||||
Indonesia 6.7% | ||||||||||
PT Astra International Tbk | Automobiles | 3,806,000 | 28,201,633 | |||||||
PT Bank Central Asia Tbk | Commercial Banks | 15,933,532 | 14,212,268 | |||||||
PT Bank Rakyat Indonesia (Persero) Tbk | Commercial Banks | 12,208,000 | 9,252,259 | |||||||
|
| |||||||||
| 51,666,160 | ||||||||||
|
| |||||||||
Mexico 1.9% | ||||||||||
America Movil SAB de CV, L, ADR | Wireless Telecommunication Services | 189,267 | 10,197,706 | |||||||
Kimberly Clark de Mexico SAB de CV, A | Household Products | 650,871 | 4,280,546 | |||||||
|
| |||||||||
| 14,478,252 | ||||||||||
|
| |||||||||
TD-14
Franklin Templeton Variable Insurance Products Trust
Statement of Investments, June 30, 2011 (unaudited) (continued)
| Templeton Developing Markets Securities Fund | Industry | Shares | Value | |||||||
Common Stocks (continued) | ||||||||||
Nigeria 0.1% | ||||||||||
Nigerian Breweries PLC | Beverages | 1,586,265 | $ | 900,790 | ||||||
|
| |||||||||
Pakistan 1.7% | ||||||||||
MCB Bank Ltd. | Commercial Banks | 2,533,287 | 5,858,502 | |||||||
Oil & Gas Development Co. Ltd. | Oil, Gas & Consumable Fuels | 4,258,312 | 7,571,432 | |||||||
|
| |||||||||
| 13,429,934 | ||||||||||
|
| |||||||||
Qatar 0.1% | ||||||||||
Industries Qatar | Industrial Conglomerates | 10,230 | 382,624 | |||||||
|
| |||||||||
Russia 17.6% | ||||||||||
aGazprom, ADR | Oil, Gas & Consumable Fuels | 1,703,600 | 24,787,380 | |||||||
aGazprom, ADR (London Stock Exchange) | Oil, Gas & Consumable Fuels | 470,200 | 6,860,218 | |||||||
cLUKOIL Holdings, ADR | Oil, Gas & Consumable Fuels | 75,208 | 4,794,510 | |||||||
cLUKOIL Holdings, ADR (London Stock Exchange) | Oil, Gas & Consumable Fuels | 317,168 | 20,156,027 | |||||||
aMining and Metallurgical Co. Norilsk Nickel, ADR | Metals & Mining | 1,316,100 | 34,310,727 | |||||||
Sberbank RF | Commercial Banks | 6,061,420 | 22,306,026 | |||||||
TNK-BP | Oil, Gas & Consumable Fuels | 5,340,274 | 16,759,500 | |||||||
dUralkali, GDR, Reg S | Chemicals | 122,196 | 5,489,655 | |||||||
|
| |||||||||
| 135,464,043 | ||||||||||
|
| |||||||||
Singapore 1.9% | ||||||||||
Keppel Corp. Ltd. | Industrial Conglomerates | 790,557 | 7,131,297 | |||||||
SembCorp Marine Ltd. | Machinery | 1,778,000 | 7,671,904 | |||||||
|
| |||||||||
| 14,803,201 | ||||||||||
|
| |||||||||
South Africa 1.2% | ||||||||||
Remgro Ltd. | Diversified Financial Services | 504,061 | 8,319,511 | |||||||
Tiger Brands Ltd. | Food Products | 25,250 | 737,529 | |||||||
|
| |||||||||
| 9,057,040 | ||||||||||
|
| |||||||||
South Korea 1.2% | ||||||||||
SK Innovation Co. Ltd. | Oil, Gas & Consumable Fuels | 48,967 | 9,201,390 | |||||||
|
| |||||||||
Sweden 0.5% | ||||||||||
Oriflame Cosmetics SA, SDR | Personal Products | 75,287 | 3,705,108 | |||||||
|
| |||||||||
Taiwan 3.0% | ||||||||||
President Chain Store Corp. | Food & Staples Retailing | 3,628,075 | 20,912,910 | |||||||
Uni-President China Holdings Ltd. | Food Products | 3,767,000 | 2,333,272 | |||||||
|
| |||||||||
| 23,246,182 | ||||||||||
|
| |||||||||
Thailand 4.2% | ||||||||||
Kasikornbank PCL, fgn. | Commercial Banks | 2,759,300 | 11,220,316 | |||||||
PTT Exploration and Production PCL, fgn. | Oil, Gas & Consumable Fuels | 2,021,223 | 11,243,628 | |||||||
PTT PCL, fgn. | Oil, Gas & Consumable Fuels | 938,100 | 10,223,276 | |||||||
|
| |||||||||
| 32,687,220 | ||||||||||
|
| |||||||||
Turkey 3.5% | ||||||||||
Akbank TAS | Commercial Banks | 2,712,311 | 12,532,240 | |||||||
Tupras-Turkiye Petrol Rafinerileri AS | Oil, Gas & Consumable Fuels | 600,504 | 14,724,039 | |||||||
|
| |||||||||
| 27,256,279 | ||||||||||
|
| |||||||||
United Arab Emirates 1.0% | ||||||||||
Emaar Properties PJSC | Real Estate Management & Development | 8,942,377 | 7,352,567 | |||||||
|
| |||||||||
TD-15
Franklin Templeton Variable Insurance Products Trust
Statement of Investments, June 30, 2011 (unaudited) (continued)
| Templeton Developing Markets Securities Fund | Industry | Shares | Value | |||||||
Common Stocks (continued) | ||||||||||
United Kingdom 4.1% | ||||||||||
Anglo American PLC | Metals & Mining | 316,849 | $ | 15,691,092 | ||||||
Antofagasta PLC | Metals & Mining | 704,479 | 15,755,166 | |||||||
|
| |||||||||
| 31,446,258 | ||||||||||
|
| |||||||||
Vietnam 0.0%† | ||||||||||
Petrovietnam Fertilizer and Chemical JSC | Chemicals | 217,810 | 343,883 | |||||||
|
| |||||||||
Total Common Stocks (Cost $399,485,124) | 690,127,779 | |||||||||
|
| |||||||||
Preferred Stocks 10.6% | ||||||||||
Brazil 9.5% | ||||||||||
Banco Bradesco SA, ADR, pfd. | Commercial Banks | 582,431 | 11,934,011 | |||||||
Itausa - Investimentos Itau SA, pfd. | Commercial Banks | 1,018,810 | 7,823,197 | |||||||
Petroleo Brasileiro SA, ADR, pfd. | Oil, Gas & Consumable Fuels | 130,588 | 4,006,440 | |||||||
Vale SA, ADR, pfd., A | Metals & Mining | 1,717,475 | 49,738,076 | |||||||
|
| |||||||||
| 73,501,724 | ||||||||||
|
| |||||||||
Chile 1.1% | ||||||||||
Embotelladora Andina SA, pfd., A | Beverages | 1,918,947 | 8,212,034 | |||||||
|
| |||||||||
Total Preferred Stocks (Cost $34,455,712) | 81,713,758 | |||||||||
|
| |||||||||
Total Investments before Short Term Investments | 771,841,537 | |||||||||
|
| |||||||||
eInvestments from Cash Collateral Received for Loaned Securities | ||||||||||
Money Market Funds 0.5% | ||||||||||
United States 0.5% | ||||||||||
fBNY Mellon Overnight Government Fund, 0.05% | 4,194,000 | 4,194,000 | ||||||||
|
| |||||||||
Total Investments (Cost $438,134,836) 100.7% | 776,035,537 | |||||||||
Other Assets, less Liabilities (0.7)% | (5,643,547 | ) | ||||||||
|
| |||||||||
Net Assets 100.0% | $ | 770,391,990 | ||||||||
|
| |||||||||
See Abbreviations on page TD-27.
†Rounds to less than 0.1% of net assets.
aNon-income producing.
bA portion or all of the security is on loan at June 30, 2011. See Note 1(c).
cAt June 30,2011, pursuant to the Fund’s policies and the requirements of applicable securities law, the Fund may be restricted from trading these securities for a limited or extended period of time due to ownership limits and/or potential possession of material non-public information.
dSecurity was purchased pursuant to Regulation S under the Securities Act of 1933, which exempts from registration securities offered and sold outside of the United States. Such a security cannot be sold in the United States without either an effective registration statement filed pursuant to the Securities Act of 1933, or pursuant to an exemption from registration. This security has been deemed liquid under guidelines approved by the Trust’s Board of Trustees. At June 30, 2011, the value of this security was $5,489,655, representing 0.71% of net assets.
eSee Note 1(c) regarding securities on loan.
fThe rate shown is the annualized seven-day yield at period end.
The accompanying notes are an integral part of these financial statements.
TD-16
Franklin Templeton Variable Insurance Products Trust
Financial Statements
Statement of Assets and Liabilities
June 30, 2011 (unaudited)
| Templeton Developing Markets Securities Fund | ||||
Assets: | ||||
Investments in securities: | ||||
Cost | $ | 438,134,836 | ||
|
| |||
Value (includes securities loaned in the amount of $3,928,371) | $ | 776,035,537 | ||
Foreign currency, at value (cost $407,859) | 407,864 | |||
Receivables: | ||||
Investment securities sold | 1,460,083 | |||
Capital shares sold | 120,371 | |||
Dividends and interest | 2,622,298 | |||
Foreign tax | 51,726 | |||
Other assets | 217 | |||
|
| |||
Total assets | 780,698,096 | |||
|
| |||
Liabilities: | ||||
Payables: | ||||
Investment securities purchased | 1,357,869 | |||
Capital shares redeemed | 2,367,420 | |||
Affiliates | 974,341 | |||
Funds advanced by custodian | 1,058,070 | |||
Payable upon return of securities loaned | 4,194,000 | |||
Accrued expenses and other liabilities | 354,406 | |||
|
| |||
Total liabilities | 10,306,106 | |||
|
| |||
Net assets, at value | $ | 770,391,990 | ||
|
| |||
Net assets consist of: | ||||
Paid-in capital | $ | 587,441,133 | ||
Distributions in excess of net investment income | (2,379,872 | ) | ||
Net unrealized appreciation (depreciation) | 337,901,879 | |||
Accumulated net realized gain (loss) | (152,571,150 | ) | ||
|
| |||
Net assets, at value | $ | 770,391,990 | ||
|
| |||
The accompanying notes are an integral part of these financial statements.
TD-17
Franklin Templeton Variable Insurance Products Trust
Financial Statements (continued)
Statement of Assets and Liabilities (continued)
June 30, 2011 (unaudited)
| Templeton Developing Markets Securities Fund | ||||
Class 1: | ||||
Net assets, at value | $ | 309,910,041 | ||
|
| |||
Shares outstanding | 27,178,783 | |||
|
| |||
Net asset value and maximum offering price per share | $ | 11.40 | ||
|
| |||
Class 2: | ||||
Net assets, at value | $ | 366,155,982 | ||
|
| |||
Shares outstanding | 32,339,010 | |||
|
| |||
Net asset value and maximum offering price per share | $ | 11.32 | ||
|
| |||
Class 3: | ||||
Net assets, at value | $ | 60,517,340 | ||
|
| |||
Shares outstanding | 5,377,835 | |||
|
| |||
Net asset value and maximum offering price per sharea | $ | 11.25 | ||
|
| |||
Class 4: | ||||
Net assets, at value | $ | 33,808,627 | ||
|
| |||
Shares outstanding | 2,985,862 | |||
|
| |||
Net asset value and maximum offering price per share | $ | 11.32 | ||
|
| |||
aRedemption price is equal to net asset value less redemption fees retained by the Fund.
The accompanying notes are an integral part of these financial statements.
TD-18
Franklin Templeton Variable Insurance Products Trust
Financial Statements (continued)
Statement of Operations
for the six months ended June 30, 2011 (unaudited)
| Templeton Developing Markets Securities Fund | ||||
Investment income: | ||||
Dividends (net of foreign taxes of $1,214,070) | $ | 11,485,071 | ||
Interest | 22,148 | |||
Income from securities loaned | 14,616 | |||
|
| |||
Total investment income | 11,521,835 | |||
|
| |||
Expenses: | ||||
Management fees (Note 3a) | 4,718,273 | |||
Administrative fees (Note 3b) | 533,743 | |||
Distribution fees: (Note 3c) | ||||
Class 2 | 465,234 | |||
Class 3 | 77,298 | |||
Class 4 | 63,919 | |||
Unaffiliated transfer agent fees | 1,447 | |||
Custodian fees (Note 4) | 270,747 | |||
Reports to shareholders | 112,393 | |||
Professional fees | 28,299 | |||
Trustees’ fees and expenses | 1,631 | |||
Other | 14,673 | |||
|
| |||
Total expenses | 6,287,657 | |||
|
| |||
Net investment income | 5,234,178 | |||
|
| |||
Realized and unrealized gains (losses): | ||||
Net realized gain (loss) from: | ||||
Investments | 20,407,170 | |||
Foreign currency transactions | 127,417 | |||
|
| |||
Net realized gain (loss) | 20,534,587 | |||
|
| |||
Net change in unrealized appreciation (depreciation) on: | ||||
Investments | (18,382,970 | ) | ||
Translation of other assets and liabilities denominated in foreign currencies | 19,816 | |||
Change in deferred taxes on unrealized appreciation | 53,321 | |||
|
| |||
Net change in unrealized appreciation (depreciation) | (18,309,833 | ) | ||
|
| |||
Net realized and unrealized gain (loss) | 2,224,754 | |||
|
| |||
Net increase (decrease) in net assets resulting from operations | $ | 7,458,932 | ||
|
| |||
The accompanying notes are an integral part of these financial statements.
TD-19
Franklin Templeton Variable Insurance Products Trust
Financial Statements (continued)
Statements of Changes in Net Assets
| Templeton Developing Markets Securities Fund | ||||||||
| Six Months Ended June 30, 2011 (unaudited) | Year Ended December 31, 2010 | |||||||
Increase (decrease) in net assets: | ||||||||
Operations: | ||||||||
Net investment income | $ | 5,234,178 | $ | 5,592,076 | ||||
Net realized gain (loss) from investments and foreign currency transactions | 20,534,587 | 49,761,078 | ||||||
Net change in unrealized appreciation (depreciation) on investments, translation of other assets and liabilities denominated in foreign currencies and deferred taxes | (18,309,833 | ) | 68,457,067 | |||||
Net increase (decrease) in net assets resulting from operations | 7,458,932 | 123,810,221 | ||||||
Distributions to shareholders from: | ||||||||
Net investment income: | ||||||||
Class 1 | (3,575,470 | ) | (5,483,924 | ) | ||||
Class 2 | (3,331,863 | ) | (5,656,521 | ) | ||||
Class 3 | (556,039 | ) | (947,886 | ) | ||||
Class 4 | (314,405 | ) | (471,295 | ) | ||||
Total distributions to shareholders | (7,777,777 | ) | (12,559,626 | ) | ||||
Capital share transactions: (Note 2) | ||||||||
Class 1 | (37,035,335 | ) | (22,233,537 | ) | ||||
Class 2 | (26,553,617 | ) | (97,764,544 | ) | ||||
Class 3 | (5,886,229 | ) | (9,001,736 | ) | ||||
Class 4 | (3,309,847 | ) | 6,238,252 | |||||
Total capital share transactions | (72,785,028 | ) | (122,761,565 | ) | ||||
Redemption fees | 25,916 | 26,367 | ||||||
Net increase (decrease) in net assets | (73,077,957 | ) | (11,484,603 | ) | ||||
Net assets: | ||||||||
Beginning of period | 843,469,947 | 854,954,550 | ||||||
End of period | $ | 770,391,990 | $ | 843,469,947 | ||||
Undistributed net investment income (distributions in excess of net investment income) included in net assets: | ||||||||
End of period | $ | (2,379,872 | ) | $ | 163,727 | |||
The accompanying notes are an integral part of these financial statements.
TD-20
Franklin Templeton Variable Insurance Products Trust
Notes to Financial Statements (unaudited)
Templeton Developing Market Securities Fund
1. ORGANIZATION AND SIGNIFICANT ACCOUNTING POLICIES
Franklin Templeton Variable Insurance Products Trust (Trust) is registered under the Investment Company Act of 1940, as amended, (1940 Act) as an open-end investment company, consisting of twenty separate funds. The Templeton Developing Markets Securities (Fund) is included in this report. The financial statements of the remaining funds in the Trust are presented separately. Shares of the Fund are generally sold only to insurance company separate accounts to fund the benefits of variable life insurance policies or variable annuity contracts. The Fund offers four classes of shares: Class 1, Class 2, Class 3, and Class 4. Each class of shares differs by its distribution fees, voting rights on matters affecting a single class and its exchange privilege.
The following summarizes the Fund’s significant accounting policies.
a. Financial Instrument Valuation
The Fund’s investments in securities and other financial instruments are carried at fair value daily. Fair value is the price that would be received to sell an asset or paid to transfer a liability in an orderly transaction between market participants on the measurement date. Under procedures approved by the Trust’s Board of Trustees, the Fund may utilize independent pricing services, quotations from securities and financial instrument dealers, and other market sources to determine fair value.
Equity securities listed on an exchange or on the NASDAQ National Market System are valued at the last quoted sale price or the official closing price of the day, respectively. Foreign equity securities are valued as of the close of trading on the foreign stock exchange on which the security is primarily traded, or the NYSE, whichever is earlier. The value is then converted into its U.S. dollar equivalent at the foreign exchange rate in effect at the close of the NYSE on the day that the value of the security is determined. Over-the-counter securities are valued within the range of the most recent quoted bid and ask prices. Securities that trade in multiple markets or on multiple exchanges are valued according to the broadest and most representative market. Certain equity securities are valued based upon fundamental characteristics or relationships to similar securities. Investments in non-registered money market funds are valued at the closing net asset value.
The Fund has procedures to determine the fair value of securities and other financial instruments for which market prices are not readily available or which may not be reliably priced. Under these procedures, the Fund primarily employs a market-based approach which may use related or comparable assets or liabilities, recent transactions, market multiples, book values, and other relevant information for the investment to determine the fair value of the investment. The Fund may also use an income-based valuation approach in which the anticipated future cash flows of the investment are discounted to calculate fair value. Discounts may also be applied due to the nature or duration of any restrictions on the disposition of the investments. Due to the inherent uncertainty of valuations of such investments, the fair values may differ significantly from the values that would have been used had an active market existed.
Trading in securities on foreign securities stock exchanges and over-the-counter markets may be completed before the daily close of business on the NYSE. Occasionally, events occur between the time at which trading in a foreign security is completed and the close of the NYSE that might call into question the reliability of the value of a portfolio security held by the Fund. As a result, differences may arise between the value of the Fund’s portfolio securities as determined at the foreign market close and the latest indications of value at the close of the NYSE. In order to minimize the potential for these differences, the investment manager monitors price movements following the close of trading in foreign stock markets through a series of country specific market proxies (such as baskets of American Depository Receipts, futures contracts and exchange traded funds). These price movements are measured against established trigger thresholds for each specific market proxy to assist in determining if an event has occurred that may call into question the reliability of the values of the foreign securities held by the Fund. If such an event occurs, the securities may be valued using fair value procedures, which may include the use of independent pricing services.
b. Foreign Currency Translation
Portfolio securities and other assets and liabilities denominated in foreign currencies are translated into U.S. dollars based on the exchange rate of such currencies against U.S. dollars on the date of valuation. The Fund may enter into foreign currency
TD-21
Franklin Templeton Variable Insurance Products Trust
Notes to Financial Statements (unaudited) (continued)
Templeton Developing Market Securities Fund
1. ORGANIZATION AND SIGNIFICANT ACCOUNTING POLICIES (continued)
b. Foreign Currency Translation (continued)
exchange contracts to facilitate transactions denominated in a foreign currency. Purchases and sales of securities, income and expense items denominated in foreign currencies are translated into U.S. dollars at the exchange rate in effect on the transaction date. Portfolio securities and assets and liabilities denominated in foreign currencies contain risks that those currencies will decline in value relative to the U.S. dollar. Occasionally, events may impact the availability or reliability of foreign exchange rates used to convert the U.S. dollar equivalent value. If such an event occurs, the foreign exchange rate will be valued at fair value using procedures established and approved by the Trust’s Board of Trustees.
The Fund does not separately report the effect of changes in foreign exchange rates from changes in market prices on securities held. Such changes are included in net realized and unrealized gain or loss from investments on the Statement of Operations.
Realized foreign exchange gains or losses arise from sales of foreign currencies, currency gains or losses realized between the trade and settlement dates on securities transactions and the difference between the recorded amounts of dividends, interest, and foreign withholding taxes and the U.S. dollar equivalent of the amounts actually received or paid. Net unrealized foreign exchange gains and losses arise from changes in foreign exchange rates on foreign denominated assets and liabilities other than investments in securities held at the end of the reporting period.
c. Securities Lending
The Fund participates in an agency based security lending program. The Fund receives cash collateral against the loaned securities in an amount equal to at least 102% of the market value of the loaned securities. Collateral is maintained over the life of the loan in an amount not less than 100% of the market value of loaned securities, as determined at the close of Fund business each day; any additional collateral required due to changes in security values is delivered to the Fund on the next business day. The collateral is invested in a non-registered money fund managed by the Fund’s custodian on the Fund’s behalf. The Fund receives income from the investment of cash collateral, in addition to lending fees and rebates paid by the borrower. The Fund bears the market risk with respect to the collateral investment, securities loaned, and the risk that the agent may default on its obligations to the Fund. The securities lending agent has agreed to indemnify the Fund in the event of default by a third party borrower.
d. Income and Deferred Taxes
It is the Fund’s policy to qualify as a regulated investment company under the Internal Revenue Code. The Fund intends to distribute to shareholders substantially all of its taxable income and net realized gains to relieve it from federal income and excise taxes. As a result, no provision for U.S. federal income taxes is required. The Fund files U.S. income tax returns as well as tax returns in certain other jurisdictions. The Fund records a provision for taxes in its financial statements including penalties and interest, if any, for a tax position taken on a tax return (or expected to be taken) when it fails to meet the more likely than not (a greater than 50% probability) threshold and based on the technical merits, the tax position may not be sustained upon examination by the tax authorities. As of June 30, 2011, and for all open tax years, the Fund has determined that no provision for income tax is required in the Fund’s financial statements. Open tax years are those that remain subject to examination and are based on each tax jurisdiction statute of limitation.
The Fund may be subject to foreign taxation related to income received, capital gains on the sale of securities and certain foreign currency transactions in the foreign jurisdictions in which it invests. Foreign taxes, if any, are recorded based on the tax regulations and rates that exist in the foreign markets in which the Fund invests. When a capital gain tax is determined to apply the Fund records an estimated deferred tax liability for unrealized gains on these securities in an amount that would be payable if the securities were disposed of on the valuation date.
TD-22
Franklin Templeton Variable Insurance Products Trust
Notes to Financial Statements (unaudited) (continued)
Templeton Developing Market Securities Fund
1. ORGANIZATION AND SIGNIFICANT ACCOUNTING POLICIES (continued)
e. Security Transactions, Investment Income, Expenses and Distributions
Security transactions are accounted for on trade date. Realized gains and losses on security transactions are determined on a specific identification basis. Estimated expenses are accrued daily. Dividend income is recorded on the ex-dividend date except that certain dividends from foreign securities are recognized as soon as the Fund is notified of the ex-dividend date. Distributions to shareholders are recorded on the ex-dividend date and are determined according to income tax regulations (tax basis). Distributable earnings determined on a tax basis may differ from earnings recorded in accordance with accounting principles generally accepted in the United States of America. These differences may be permanent or temporary. Permanent differences are reclassified among capital accounts to reflect their tax character. These reclassifications have no impact on net assets or the results of operations. Temporary differences are not reclassified, as they may reverse in subsequent periods.
Common expenses incurred by the Trust are allocated among the funds based on the ratio of net assets of each fund to the combined net assets of the Trust. Fund specific expenses are charged directly to the fund that incurred the expense.
Realized and unrealized gains and losses and net investment income, not including class specific expenses, are allocated daily to each class of shares based upon the relative proportion of net assets of each class. Differences in per share distributions, by class, are generally due to differences in class specific expenses.
f. Accounting Estimates
The preparation of financial statements in accordance with accounting principles generally accepted in the United States of America requires management to make estimates and assumptions that affect the reported amounts of assets and liabilities at the date of the financial statements and the amounts of income and expenses during the reporting period. Actual results could differ from those estimates.
g. Redemption Fees
Redemptions and exchanges of interests in an insurance company subaccount that invests in Class 3 shares of the Fund will be subject to a 1.0% short term trading fee if the interest in the subaccount has been held for less than 60 days. Such fees are retained by the Fund and accounted for as an addition to paid-in capital, allocated to each class of shares based upon the relative proportion of net assets of each class.
h. Guarantees and Indemnifications
Under the Trust’s organizational documents, its officers and trustees are indemnified by the Trust against certain liabilities arising out of the performance of their duties to the Trust. Additionally, in the normal course of business, the Trust, on behalf of the Fund, enters into contracts with service providers that contain general indemnification clauses. The Trust’s maximum exposure under these arrangements is unknown as this would involve future claims that may be made against the Trust that have not yet occurred. Currently, the Trust expects the risk of loss to be remote.
TD-23
Franklin Templeton Variable Insurance Products Trust
Notes to Financial Statements (unaudited) (continued)
Templeton Developing Market Securities Fund
2. SHARES OF BENEFICIAL INTEREST
At June 30, 2011, there were an unlimited number of shares authorized (without par value). Transactions in the Fund’s shares were as follows:
| Six Months Ended June 30, 2011 | Year Ended December 31, 2010 | |||||||||||||||
| Class 1 Shares: | Shares | Amount | Shares | Amount | ||||||||||||
Shares sold | 1,842,420 | $ | 20,496,589 | 4,235,745 | $ | 44,045,245 | ||||||||||
Shares issued in reinvestment of distributions | 324,453 | 3,575,470 | 603,956 | 5,483,924 | ||||||||||||
Shares redeemed | (5,450,810 | ) | (61,107,394 | ) | (7,418,014 | ) | (71,762,706 | ) | ||||||||
Net increase (decrease) | (3,283,937 | ) | $ | (37,035,335 | ) | (2,578,313 | ) | $ | (22,233,537 | ) | ||||||
Class 2 Shares: | ||||||||||||||||
Shares sold | 3,188,055 | $ | 35,975,742 | 9,770,557 | $ | 97,538,996 | ||||||||||
Shares issued in reinvestment of distributions | 304,558 | 3,331,863 | 627,805 | 5,656,521 | ||||||||||||
Shares redeemed | (5,885,349 | ) | (65,861,222 | ) | (20,231,375 | ) | (200,960,061 | ) | ||||||||
Net increase (decrease) | (2,392,736 | ) | $ | (26,553,617 | ) | (9,833,013 | ) | $ | (97,764,544 | ) | ||||||
Class 3 Shares: | ||||||||||||||||
Shares sold | 637,604 | $ | 7,230,771 | 1,343,547 | $ | 13,467,640 | ||||||||||
Shares issued in reinvestment of distributions | 51,154 | 556,039 | 105,791 | 947,886 | ||||||||||||
Shares redeemed | (1,228,743 | ) | (13,673,039 | ) | (2,390,224 | ) | (23,417,262 | ) | ||||||||
Net increase (decrease) | (539,985 | ) | $ | (5,886,229 | ) | (940,886 | ) | $ | (9,001,736 | ) | ||||||
Class 4 Shares: | ||||||||||||||||
Shares sold | 327,116 | $ | 3,668,307 | 1,189,893 | $ | 11,893,157 | ||||||||||
Shares issued on reinvestment of distributions | 28,739 | 314,405 | 52,250 | 471,295 | ||||||||||||
Shares redeemed | (660,667 | ) | (7,292,559 | ) | (641,932 | ) | (6,126,200 | ) | ||||||||
Net increase (decrease) | (304,812 | ) | $ | (3,309,847 | ) | 600,211 | $ | 6,238,252 | ||||||||
3. TRANSACTIONS WITH AFFILIATES
Franklin Resources, Inc. is the holding company for various subsidiaries that together are referred to as Franklin Templeton Investments. Certain officers and trustees of the Fund are also officers and/or directors of the following subsidiaries:
| Subsidiary | Affiliation | |
Templeton Asset Management Ltd. (TAML) | Investment manager | |
Franklin Templeton Services, LLC (FT Services) | Administrative manager | |
Franklin Templeton Distributors, Inc. (Distributors) | Principal underwriter | |
Franklin Templeton Investor Services, LLC (Investor Services) | �� | Transfer agent |
TD-24
Franklin Templeton Variable Insurance Products Trust
Notes to Financial Statements (unaudited) (continued)
Templeton Developing Market Securities Fund
3. TRANSACTIONS WITH AFFILIATES (continued)
a. Management Fees
Effective May 1, 2011, the Fund pays an investment management fee to TAML based on the average daily net assets of the Fund as follows:
| Annualized Fee Rate | Net Assets | |
| 1.100% | Up to and including $1 billion | |
| 1.050% | Over $1 billion, up to and including $5 billion | |
| 1.000% | Over $5 billion, up to and including $10 billion | |
| 0.950% | Over $10 billion, up to and including $15 billion | |
| 0.900% | Over $15 billion, up to and including $20 billion | |
| 0.850% | In excess of $20 billion |
Prior to May 1, 2011, the Fund paid an investment management fee to TAML based on the average daily net assets of the Fund as follows:
| Annualized Fee Rate | Net Assets | |
| 1.250% | Up to and including $500 million | |
| 1.200% | Over $500 million, up to and including $3 billion | |
| 1.150% | Over $3 billion, up to and including $4 billion | |
| 1.100% | Over $4 billion, up to and including $15 billion | |
| 1.050% | Over $15 billion, up to and including $20 billion | |
| 1.000% | In excess of $20 billion |
b. Administrative Fees
The Fund pays an administrative fee to FT Services based on the Fund’s average daily net assets as follows:
| Annualized Fee Rate | Net Assets | |
| 0.150% | Up to and including $200 million | |
| 0.135% | Over $200 million, up to and including $700 million | |
| 0.100% | Over $700 million, up to and including $1.2 billion | |
| 0.075% | In excess of $1.2 billion |
c. Distribution Fees
The Trust’s Board of Trustees has adopted distribution plans for Class 2, Class 3, and Class 4 shares pursuant to Rule 12b-1 under the 1940 Act. Under the Fund’s compensation distribution plans, the Fund pays Distributors for costs incurred in connection with the servicing, sale and distribution of the Fund’s shares up to 0.25%, 0.35%, and 0.35% per year of its average daily net assets of Class 2, Class 3, and Class 4, respectively. The Board of Trustees has agreed to limit the current rate to 0.25% per year for Class 3.
d. Transfer Agent Fees
Investor Services, under terms of an agreement, performs shareholder servicing for the Fund and is not paid by the Fund for the services.
4. EXPENSE OFFSET ARRANGEMENT
The Fund has entered into an arrangement with its custodian whereby credits realized as a result of uninvested cash balances are used to reduce a portion of the Fund’s custodian expenses. During the period ended June 30, 2011, there were no credits earned.
TD-25
Franklin Templeton Variable Insurance Products Trust
Notes to Financial Statements (unaudited) (continued)
Templeton Developing Market Securities Fund
5. INCOME TAXES
For tax purposes, capital losses may be carried over to offset future capital gains, if any. At December 31, 2010, the Fund had tax basis capital losses of $166,405,957 expiring in 2017.
Under the Regulated Investment Company Modernization Act of 2010, the Fund will be permitted to carry forward capital losses incurred in taxable years beginning after December 22, 2010 for an unlimited period. Post-enactment capital loss carryforwards will retain their character as either short-term or long-term capital losses rather than being considered short-term as under previous law. Any post-enactment capital losses generated will be required to be utilized prior to the losses incurred in pre-enactment tax years.
At June 30, 2011, the cost of investments and net unrealized appreciation (depreciation) for income tax purposes were as follows:
Cost of investments | $ | 452,361,264 | ||
|
| |||
Unrealized appreciation | $ | 332,029,941 | ||
Unrealized depreciation | (8,355,668 | ) | ||
|
| |||
Net unrealized appreciation (depreciation) | $ | 323,674,273 | ||
|
| |||
Net investment income differs for financial statement and tax purposes primarily due to differing treatments of foreign currency transactions, passive foreign investment company shares, and corporate actions.
Net realized gains (losses) differ for financial statement and tax purposes primarily due to differing treatments of wash sales, foreign currency transactions, passive foreign investment company shares, and corporate actions.
6. INVESTMENT TRANSACTIONS
Purchases and sales of investments (excluding short term securities) for the period ended June 30, 2011, aggregated $37,796,019 and $100,495,194, respectively.
7. CONCENTRATION OF RISK
Investing in foreign securities may include certain risks and considerations not typically associated with investing in U.S. securities, such as fluctuating currency values and changing local and regional economic, political and social conditions, which may result in greater market volatility. In addition, certain foreign securities may not be as liquid as U.S. securities.
8. CREDIT FACILITY
The Fund, together with other U.S. registered and foreign investment funds (collectively, Borrowers), managed by Franklin Templeton Investments, are borrowers in a joint syndicated senior unsecured credit facility totaling $750 million (Global Credit Facility) which matures on January 20, 2012. This Global Credit Facility provides a source of funds to the Borrowers for temporary and emergency purposes, including the ability to meet future unanticipated or unusually large redemption requests.
Under the terms of the Global Credit Facility, the Fund shall, in addition to interest charged on any borrowings made by the Fund and other costs incurred by the Fund, pay its share of fees and expenses incurred in connection with the implementation and maintenance of the Global Credit Facility, based upon its relative share of the aggregate net assets of all of the Borrowers, including an annual commitment fee of 0.08% based upon the unused portion of the Global Credit Facility, which is reflected in other expenses on the Statement of Operations. During the period ended June 30, 2011, the Fund did not use the Global Credit Facility.
TD-26
Franklin Templeton Variable Insurance Products Trust
Notes to Financial Statements (unaudited) (continued)
Templeton Developing Market Securities Fund
9. FAIR VALUE MEASUREMENTS
The Fund follows a fair value hierarchy that distinguishes between market data obtained from independent sources (observable inputs) and the Fund’s own market assumptions (unobservable inputs). These inputs are used in determining the value of the Fund’s investments and are summarized in the following fair value hierarchy:
| • | Level 1 – quoted prices in active markets for identical securities |
| • | Level 2 – other significant observable inputs (including quoted prices for similar securities, interest rates, prepayment speed, credit risk, etc.) |
| • | Level 3 – significant unobservable inputs (including the Fund’s own assumptions in determining the fair value of investments) |
The inputs or methodology used for valuing securities are not an indication of the risk associated with investing in those securities.
For movements between the levels within the fair value hierarchy, the Fund has adopted a policy of recognizing the transfers as of the date of the underlying event which caused the movement.
The following is a summary of the inputs used as of June 30, 2011, in valuing the Fund’s assets carried at fair value:
| Level 1 | Level 2 | Level 3 | Total | |||||||||||||
|
| |||||||||||||||
Assets: | ||||||||||||||||
Investments in Securities: | ||||||||||||||||
Equity Investmentsa,b | $ | 771,841,537 | $ | — | $ | — | $ | 771,841,537 | ||||||||
Short Term Investments | — | 4,194,000 | — | 4,194,000 | ||||||||||||
|
| |||||||||||||||
Total Investments in Securities | $ | 771,841,537 | $ | 4,194,000 | $ | — | $ | 776,035,537 | ||||||||
|
| |||||||||||||||
aIncludes common and preferred stocks.
bFor detailed country descriptions, see the accompanying Statement of Investments.
10. NEW ACCOUNTING PRONOUNCEMENTS
In May 2011, the Financial Accounting Standards Board (FASB) issued Accounting Standards Update (ASU) No. 2011-04, Fair Value Measurement (Topic 820): Amendments to Achieve Common Fair Value Measurement and Disclosure Requirements in U.S. GAAP and International Financial Reporting Standards (IFRS). The amendments in the ASU will improve the comparability of fair value measurements presented and disclosed in financial statements prepared in accordance with U.S. GAAP and IFRS and include new guidance for certain fair value measurement principles and disclosure requirements. The ASU is effective for interim and annual periods beginning after December 15, 2011. The Fund is currently evaluating the impact, if any, of applying this provision.
11. SUBSEQUENT EVENTS
The Fund has evaluated subsequent events through the issuance of the financial statements and determined that no events have occurred that require disclosure.
ABBREVIATIONS | ||||
| Selected Portfolio | ||||
| ADR - American Depository Receipt | ||||
| GDR - Global Depository Receipt | ||||
| IDR - International Depository Receipt | ||||
| SDR - Swedish Depository Receipt |
TD-27
Franklin Templeton Variable Insurance Products Trust
Tax Designation (unaudited)
Templeton Developing Markets Securities Fund
At December 31, 2010, more than 50% of the Fund’s total assets were invested in securities of foreign issuers. In most instances, foreign taxes were withheld from income paid to the Fund on these investments. As shown in the table below, the Fund designates to shareholders the foreign source income and foreign taxes paid, pursuant to Section 853 of the Internal Revenue Code. This designation will allow shareholders of record on June 14, 2011, to treat their proportionate share of foreign taxes paid by the Fund as having been paid directly by them. The shareholder shall consider these amounts as foreign taxes paid in the tax year in which they receive the Fund distribution.
The following table provides a detailed analysis of foreign tax paid and foreign source income as designated by the Fund, to Class 1, Class 2, Class 3, and Class 4 shareholders of record.
| Class | Foreign Tax Paid Per Share | Foreign Source Income Per Share | ||||||
Class 1 | $ | 0.0279 | $ | 0.1512 | ||||
Class 2 | $ | 0.0279 | $ | 0.1247 | ||||
Class 3 | $ | 0.0279 | $ | 0.1255 | ||||
Class 4 | $ | 0.0279 | $ | 0.1215 | ||||
Foreign Tax Paid Per Share (Column 1) is the amount per share available to you, as a tax credit (assuming you held your shares in the Fund for a minimum of 16 days during the 31-day period beginning 15 days before the ex-dividend date of the Fund’s distribution to which the foreign taxes relate), or, as a tax deduction.
Foreign Source Income Per Share (Column 2) is the amount per share of income dividends attributable to foreign securities held by the Fund, plus any foreign taxes withheld on these dividends.
TD-28
TEMPLETON FOREIGN SECURITIES FUND
We are pleased to bring you Templeton Foreign Securities Fund’s semiannual report for the period ended June 30, 2011.
Performance Summary as of 6/30/11
Templeton Foreign Securities Fund – Class 3 delivered a +6.03% total return for the six-month period ended 6/30/11.
Performance reflects the Fund’s Class 3 operating expenses, but does not include any contract fees, expenses or sales charges. If they had been included, performance would be lower. These charges and deductions, particularly for variable life policies, can have a significant effect on contract values and insurance benefits. See the contract prospectus for a complete description of these expenses, including sales charges.
Templeton Foreign Securities Fund – Class 3
Performance data represent past performance, which does not guarantee future results. Investment return and principal value will fluctuate, and you may have a gain or loss when you sell your shares.
Current performance may differ from figures shown.
TF-1
Fund Goal and Main Investments: Templeton Foreign Securities Fund seeks long-term capital growth. The Fund normally invests at least 80% of its net assets in investments of issuers located outside the U.S., including those in emerging markets.
Performance Overview
You can find the Fund’s six-month total return in the Performance Summary. The Fund outperformed its benchmark, the MSCI Europe, Australasia, Far East (EAFE) Index, which produced a +5.35% total return for the same period.1 Please note, index performance information is provided for reference and we do not attempt to track the index but rather undertake investments on the basis of fundamental research.
Economic and Market Overview
Global stock markets rose in the first half of 2011, though the positive momentum from the previous year waned as European sovereign debt turmoil escalated and signs emerged of an economic slowdown. Furthermore, geopolitical unrest sweeping the Middle East and North Africa roiled oil markets, and a devastating earthquake and tsunami in Japan severely disrupted global supply chains during the period. While the market recovered from these interferences, economic growth concerns persisted. Officials at the U.S. Federal Reserve Board (Fed) cut their growth forecast for the world’s largest economy, and manufacturing slowed in most major regions of the world. Japan’s earthquake, an early surge in commodity prices and a fading inventory restocking cycle were all blamed for declining economic leading indicators. Nascent monetary policy tightening in most parts of the world was also thought to inhibit growth and cool the commodities rally. Asian and emerging market policymakers tightened aggressively as inflation reached post-crisis highs in many regions, while the European Central Bank raised interest rates for the first time in two years, deviating from the extraordinarily accommodative path of the Fed, which undertook a second round of quantitative easing during the reporting period.
Amid concerns of sustained accommodative monetary policy and declining economic growth rates in the U.S., politicians debated whether to raise the nation’s debt ceiling. Sovereign debt concerns continued to plague Europe, with Greece, Ireland, Portugal and Spain subject to rating downgrades in the first half of 2011. At period-end,
1. Source: © 2011 Morningstar. One cannot invest directly in an index, and an index is not representative of the Fund’s portfolio. Please see Index Descriptions following the Fund Summaries.
Fund Risks: The Fund’s investments in stocks may offer the potential for long-term gains but can be subject to short-term price fluctuations. Foreign investing, especially in emerging or developing markets, involves additional risks, including currency fluctuations, economic instability, market volatility, and political and social instability. The Fund may have significant investments in one or more countries or in particular sectors, such as technology and financial services, from time to time, and may carry greater risk of adverse developments in a country or sector than a fund that invests more broadly. Smaller and midsize company securities can increase the risk of greater price fluctuations, particularly over the short term. The manager applies various techniques and analyses in making investment decisions for the Fund, but there can be no guarantee that these decisions will produce the desired results. The Fund’s prospectus also includes a description of the main investment risks.
TF-2
European politicians were working to pass painful austerity budgets despite fierce popular resistance, and discussions were ongoing about restructuring debt payments of the region’s most troubled sovereigns. Despite these challenges, continued corporate profit strength and still favorable economic growth prospects in some regions of the world supported stock prices. Equity market leadership rotated toward defensive sectors as risk aversion increased, buoying even U.S. Treasuries toward period-end as near-term demand for perceived safe havens outweighed longer term concerns about the deteriorating U.S. credit profile. The dollar ultimately declined, however, against most currencies, broadly reflecting divergent interest rate and/or economic growth expectations.
Investment Strategy
Our investment philosophy is bottom up, value oriented and long term. In choosing investments, we generally focus on the market price of a company’s securities relative to our evaluation of the company’s potential long-term earnings, asset value and cash flow. Among factors we consider are a company’s historical value measures, including price/earnings ratio, profit margins and liquidation value. We do in-depth research to construct a bargain list from which we buy.
Manager’s Discussion
During the six months under review, our stock selection in the financials sector benefited the Fund’s performance relative to the benchmark MSCI EAFE Index.2 Within the sector, overweighted positions in diversified financial services company ING Groep (Netherlands), life assurance and pension products provider Aviva (U.K.) and insurance and asset management company AXA (France) delivered strong returns. Our overweighting and stock selection in the health care sector also aided performance, and major contributors included relatively large positions in pharmaceutical companies Merck KGaA (Germany), Roche Holding (Switzerland) and Sanofi (France).3 Other positions that helped relative results included telecommunication and Internet services provider China Telecom4 (China) in the telecommunication services sector and business software solutions company SAP (Germany) in the information technology sector.5
2. The financials sector comprises capital markets, commercial banks, diversified financial services, insurance, and real estate management and development in the SOI.
3. The health care sector comprises life sciences tools and services and pharmaceuticals in the SOI.
4. Not an index component.
5. The telecommunication services sector comprises diversified telecommunication services and wireless telecommunication services in the SOI. The information technology sector comprises communications equipment; computers and peripherals; electronic equipment, instruments and components; semiconductors and semiconductor equipment; and software in the SOI.
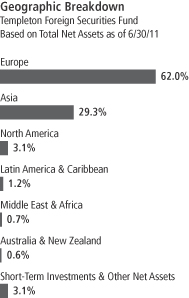
TF-3
In contrast, our overweighted allocation in the information technology sector detracted from relative performance, largely due to positions in electronic manufacturing services provider Flextronics International4 (Singapore), electronics and microchip maker Samsung Electronics4 (South Korea), and video game hardware and software manufacturer Nintendo (Japan). Stock selection in the industrials sector also hindered relative results, largely due to our position in Hays4 (U.K.), a provider of business-to-business services including distribution, recruitment and office support.6 Other key detractors were commercial bank KB Financial Group4 (South Korea) and oil and gas producer Reliance Industries4 (India).
It is also important to recognize the effect of currency movements on the Fund’s performance. In general, if the value of the U.S. dollar goes up compared with a foreign currency, an investment traded in that foreign currency will go down in value because it will be worth fewer U.S. dollars. This can have a negative effect on Fund performance. Conversely, when the U.S. dollar weakens in relation to a foreign currency, an investment traded in that foreign currency will increase in value, which can contribute to Fund performance. For the six months ended June 30, 2011, the U.S. dollar declined in value relative to most currencies. As a result, the Fund’s performance was positively affected by the portfolio’s investment predominantly in securities with non-U.S. currency exposure. However, one cannot expect the same result in future periods.
From a geographic perspective, our stock selection in Europe boosted the Fund’s relative performance, as our investments in France, the Netherlands, Norway, Russia4 and the U.K. generally outperformed. Our decision to underweight Japan and our stock selection in Asia were also beneficial, particularly stocks in China4 and Hong Kong. In contrast, the Fund’s overweighting and stock selection in North America hindered results due to the underperformance of our investments in Canada4 and Bermuda.
Thank you for your participation in Templeton Foreign Securities Fund. We look forward to serving your future investment needs.
6. The industrials sector comprises aerospace and defense, commercial services and supplies, electrical equipment, industrial conglomerates, and professional services in the SOI.
The foregoing information reflects our analysis, opinions and portfolio holdings as of June 30, 2011, the end of the reporting period. The way we implement our main investment strategies and the resulting portfolio holdings may change depending on factors such as market and economic conditions. These opinions may not be relied upon as investment advice or an offer for a particular security. The information is not a complete analysis of every aspect of any market, country, industry, security or the Fund. Statements of fact are from sources considered reliable, but the investment manager makes no representation or warranty as to their completeness or accuracy. Although historical performance is no guarantee of future results, these insights may help you understand our investment management philosophy.
Top 10 Holdings
Templeton Foreign Securities Fund
6/30/11
| Company Sector/Industry, Country | % of Total Net Assets | |||
| Sanofi | 3.2% | |||
| Pharmaceuticals, France | ||||
| Vodafone Group PLC | 2.8% | |||
| Wireless Telecommunication Services, U.K. | ||||
| Roche Holding AG | 2.7% | |||
| Pharmaceuticals, Switzerland | ||||
| ING Groep NV | 2.5% | |||
| Diversified Financial Services, Netherlands | ||||
| Taiwan Semiconductor Manufacturing Co. Ltd. | 2.4% | |||
| Semiconductors & Semiconductor Equipment, Taiwan | ||||
| Samsung Electronics Co. Ltd. | 2.4% | |||
| Semiconductors & Semiconductor Equipment, South Korea | ||||
| Aviva PLC | 2.3% | |||
| Insurance, U.K. | ||||
| Statoil ASA | 2.2% | |||
| Oil, Gas & Consumable Fuels, Norway | ||||
| Tesco PLC | 2.1% | |||
| Food & Staples Retailing, U.K. | ||||
| GlaxoSmithKline PLC | 2.1% | |||
| Pharmaceuticals, U.K. | ||||
The dollar value, number of shares or principal amount, and names of all portfolio holdings are listed in the Fund’s Statement of Investments (SOI).
TF-4
Fund Expenses
As an investor in a variable insurance contract (Contract) that indirectly provides for investment in an underlying mutual fund, you can incur transaction and/or ongoing expenses at both the Fund level and the Contract level.
| • | Transaction expenses can include sales charges (loads) on purchases, redemption fees, surrender fees, transfer fees and premium taxes. |
| • | Ongoing expenses can include management fees, distribution and service (12b-1) fees, contract fees, annual maintenance fees, mortality and expense risk fees and other fees and expenses. All mutual funds and Contracts have some types of ongoing expenses. |
The expenses shown in the table are meant to highlight ongoing expenses at the Fund level only and do not include ongoing expenses at the Contract level, or transaction expenses at either the Fund or Contract levels. While the Fund does not have transaction expenses, if the transaction and ongoing expenses at the Contract level were included, the expenses shown below would be higher. You should consult your Contract prospectus or disclosure document for more information.
The table shows Fund-level ongoing expenses and can help you understand these expenses and compare them with those of other mutual funds offered through the Contract. The table assumes a $1,000 investment held for the six months indicated. Please refer to the Fund prospectus for additional information on operating expenses.
Actual Fund Expenses
The first line (Actual) of the table provides actual account values and expenses. The “Ending Account Value” is derived from the Fund’s actual return, which includes the effect of ongoing Fund expenses, but does not include the effect of ongoing Contract expenses.
You can estimate the Fund-level expenses you incurred during the period by following these steps. Of course, your account value and expenses will differ from those in this illustration:
| 1. | Divide your account value by $1,000. |
If an account had an $8,600 value, then $8,600 ÷ $1,000 = 8.6.
| 2. | Multiply the result by the number under the heading “Fund-Level Expenses Incurred During Period.” |
If Fund-Level Expenses Incurred During Period were $7.50, then 8.6 x $7.50 = $64.50.
In this illustration, the estimated expenses incurred this period at the Fund level are $64.50.
Templeton Foreign Securities Fund – Class 3
TF-5
Hypothetical Example for Comparison with Other Mutual Funds
Information in the second line (Hypothetical) of the table can help you compare ongoing expenses of the Fund with those of other mutual funds offered through the Contract. This information may not be used to estimate the actual ending account balance or expenses you incurred during the period. The hypothetical “Ending Account Value” is based on the Fund’s actual expense ratio and an assumed 5% annual rate of return before expenses, which does not represent the Fund’s actual return. The figure under the heading “Fund-Level Expenses Incurred During Period” shows the hypothetical expenses your account would have incurred under this scenario. You can compare this figure with the 5% hypothetical examples that appear in shareholder reports of other funds offered through a Contract.
| Class 3 | Beginning Account Value 1/1/11 | Ending Account Value 6/30/11 | Fund-Level Expenses Incurred During Period* 1/1/11–6/30/11 | |||||||||
Actual | $ | 1,000 | $ | 1,060.30 | $ | 5.26 | ||||||
Hypothetical (5% return before expenses) | $ | 1,000 | $ | 1,019.69 | $ | 5.16 | ||||||
*Expenses are calculated using the most recent six-month annualized expense ratio for the Fund’s Class 3 shares (1.03%), which does not include any ongoing expenses of the Contract for which the Fund is an investment option, multiplied by the average account value over the period, multiplied by 181/365 to reflect the one-half year period.
TF-6
Franklin Templeton Variable Insurance Products Trust
Financial Highlights
Templeton Foreign Securities Fund
Six Months (unaudited) | Year Ended December 31, | |||||||||||||||||||||||
| Class 1 | 2010 | 2009 | 2008 | 2007 | 2006 | |||||||||||||||||||
Per share operating performance | ||||||||||||||||||||||||
(for a share outstanding throughout the period) | ||||||||||||||||||||||||
Net asset value, beginning of period | $ | 14.54 | $ | 13.68 | $ | 10.95 | $ | 20.57 | $ | 19.00 | $ | 15.84 | ||||||||||||
Income from investment operationsa: | ||||||||||||||||||||||||
Net investment incomeb | 0.30 | 0.28 | 0.25 | 0.45 | 0.45 | 0.46 | ||||||||||||||||||
Net realized and unrealized gains (losses) | 0.59 | 0.86 | 3.39 | (8.01 | ) | 2.46 | 2.94 | |||||||||||||||||
Total from investment operations | 0.89 | 1.14 | 3.64 | (7.56 | ) | 2.91 | 3.40 | |||||||||||||||||
Less distributions from: | ||||||||||||||||||||||||
Net investment income | (0.28 | ) | (0.28 | ) | (0.43 | ) | (0.45 | ) | (0.44 | ) | (0.24 | ) | ||||||||||||
Net realized gains | — | — | (0.48 | ) | (1.61 | ) | (0.90 | ) | — | |||||||||||||||
Total distributions | (0.28 | ) | (0.28 | ) | (0.91 | ) | (2.06 | ) | (1.34 | ) | (0.24 | ) | ||||||||||||
Redemption feesc | — | — | — | — | — | — | ||||||||||||||||||
Net asset value, end of period | $ | 15.15 | $ | 14.54 | $ | 13.68 | $ | 10.95 | $ | 20.57 | $ | 19.00 | ||||||||||||
Total returnd | 6.16% | 8.67% | 37.34% | (40.23)% | 15.79% | 21.70% | ||||||||||||||||||
Ratios to average net assetse | ||||||||||||||||||||||||
Expenses | 0.78% | 0.78% | f | 0.78% | f | 0.77% | f | 0.75% | f | 0.75% | f | |||||||||||||
Net investment income | 3.98% | 2.10% | 2.28% | 2.82% | 2.22% | 2.63% | ||||||||||||||||||
Supplemental data | ||||||||||||||||||||||||
Net assets, end of period (000’s) | $ | 319,477 | $ | 321,282 | $ | 318,173 | $ | 262,725 | $ | 531,377 | $ | 594,991 | ||||||||||||
Portfolio turnover rate | 11.67% | 19.16% | 22.50% | 18.27% | 26.74% | 18.97% | g | |||||||||||||||||
aThe amount shown for a share outstanding throughout the period may not correlate with the Statement of Operations for the period due to the timing of sales and repurchases of the Fund shares in relation to income earned and/or fluctuating market value of the investments of the Fund.
bBased on average daily shares outstanding.
cAmount rounds to less than $0.01 per share.
dTotal return does not include fees, charges or expenses imposed by the variable annuity and life insurance contracts for which the Franklin Templeton Variable Insurance Products Trust serves as an underlying investment vehicle. Total return is not annualized for periods less than one year.
eRatios are annualized for periods less than one year.
fBenefit of expense reduction rounds to less than 0.01%.
gExcludes the value of portfolio securities delivered as a result of redemption in-kind.
The accompanying notes are an integral part of these financial statements.
TF-7
Franklin Templeton Variable Insurance Products Trust
Financial Highlights (continued)
Templeton Foreign Securities Fund
Six Months (unaudited) | Year Ended December 31, | |||||||||||||||||||||||
| Class 2 | 2010 | 2009 | 2008 | 2007 | 2006 | |||||||||||||||||||
Per share operating performance | ||||||||||||||||||||||||
(for a share outstanding throughout the period) | ||||||||||||||||||||||||
Net asset value, beginning of period | $ | 14.29 | $ | 13.45 | $ | 10.76 | $ | 20.25 | $ | 18.73 | $ | 15.63 | ||||||||||||
Income from investment operationsa: | ||||||||||||||||||||||||
Net investment incomeb | 0.28 | 0.25 | 0.22 | 0.40 | 0.38 | 0.40 | ||||||||||||||||||
Net realized and unrealized gains (losses) | 0.57 | 0.84 | 3.34 | (7.89 | ) | 2.44 | 2.91 | |||||||||||||||||
Total from investment operations | 0.85 | 1.09 | 3.56 | (7.49 | ) | 2.82 | 3.31 | |||||||||||||||||
Less distributions from: | ||||||||||||||||||||||||
Net investment income | (0.24 | ) | (0.25 | ) | (0.39 | ) | (0.39 | ) | (0.40 | ) | (0.21 | ) | ||||||||||||
Net realized gains | — | — | (0.48 | ) | (1.61 | ) | (0.90 | ) | — | |||||||||||||||
Total distributions | (0.24 | ) | (0.25 | ) | (0.87 | ) | (2.00 | ) | (1.30 | ) | (0.21 | ) | ||||||||||||
Redemption feesc | — | — | — | — | — | — | ||||||||||||||||||
Net asset value, end of period | $ | 14.90 | $ | 14.29 | $ | 13.45 | $ | 10.76 | $ | 20.25 | $ | 18.73 | ||||||||||||
Total returnd | 6.02% | 8.41% | 37.04% | (40.38)% | 15.46% | 21.44% | ||||||||||||||||||
Ratios to average net assetse | ||||||||||||||||||||||||
Expenses | 1.03% | 1.03% | f | 1.03% | f | 1.02% | f | 1.00% | f | 1.00% | f | |||||||||||||
Net investment income | 3.73% | 1.85% | 2.03% | 2.57% | 1.97% | 2.38% | ||||||||||||||||||
Supplemental data | ||||||||||||||||||||||||
Net assets, end of period (000’s) | $ | 2,065,643 | $ | 2,090,757 | $ | 2,010,268 | $ | 1,702,038 | $ | 3,255,154 | $ | 2,941,374 | ||||||||||||
Portfolio turnover rate | 11.67% | 19.16% | 22.50% | 18.27% | 26.74% | 18.97% | g | |||||||||||||||||
aThe amount shown for a share outstanding throughout the period may not correlate with the Statement of Operations for the period due to the timing of sales and repurchases of the Fund shares in relation to income earned and/or fluctuating market value of the investments of the Fund.
bBased on average daily shares outstanding.
cAmount rounds to less than $0.01 per share.
dTotal return does not include fees, charges or expenses imposed by the variable annuity and life insurance contracts for which the Franklin Templeton Variable Insurance Products Trust serves as an underlying investment vehicle. Total return is not annualized for periods less than one year.
eRatios are annualized for periods less than one year.
fBenefit of expense reduction rounds to less than 0.01%.
gExcludes the value of portfolio securities delivered as a result of redemption in-kind.
The accompanying notes are an integral part of these financial statements.
TF-8
Franklin Templeton Variable Insurance Products Trust
Financial Highlights (continued)
Templeton Foreign Securities Fund
Six Months (unaudited) | Year Ended December 31, | |||||||||||||||||||||||
| Class 3 | 2010 | 2009 | 2008 | 2007 | 2006 | |||||||||||||||||||
| ||||||||||||||||||||||||
Per share operating performance | ||||||||||||||||||||||||
(for a share outstanding throughout the period) | ||||||||||||||||||||||||
Net asset value, beginning of period | $ | 14.24 | $ | 13.37 | $ | 10.70 | $ | 20.18 | $ | 18.68 | $ | 15.60 | ||||||||||||
|
| |||||||||||||||||||||||
Income from investment operationsa: | ||||||||||||||||||||||||
Net investment incomeb | 0.27 | 0.25 | 0.25 | 0.39 | 0.37 | 0.37 | ||||||||||||||||||
Net realized and unrealized gains (losses) | 0.58 | 0.84 | 3.30 | (7.84 | ) | 2.45 | 2.94 | |||||||||||||||||
|
| |||||||||||||||||||||||
Total from investment operations | 0.85 | 1.09 | 3.55 | (7.45 | ) | 2.82 | 3.31 | |||||||||||||||||
|
| |||||||||||||||||||||||
Less distributions from: | ||||||||||||||||||||||||
Net investment income | (0.24 | ) | (0.22 | ) | (0.40 | ) | (0.42 | ) | (0.42 | ) | (0.23 | ) | ||||||||||||
Net realized gains | — | — | (0.48 | ) | (1.61 | ) | (0.90 | ) | — | |||||||||||||||
|
| |||||||||||||||||||||||
Total distributions | (0.24 | ) | (0.22 | ) | (0.88 | ) | (2.03 | ) | (1.32 | ) | (0.23 | ) | ||||||||||||
|
| |||||||||||||||||||||||
Redemption feesc | — | — | — | — | — | — | ||||||||||||||||||
|
| |||||||||||||||||||||||
Net asset value, end of period | $ | 14.85 | $ | 14.24 | $ | 13.37 | $ | 10.70 | $ | 20.18 | $ | 18.68 | ||||||||||||
|
| |||||||||||||||||||||||
Total returnd | 6.03% | 8.41% | 37.20% | (40.39)% | 15.45% | 21.46% | ||||||||||||||||||
Ratios to average net assetse | ||||||||||||||||||||||||
Expenses | 1.03% | 1.03% | f | 1.03% | f | 1.02% | f | 1.00% | f | 1.00% | f | |||||||||||||
Net investment income | 3.73% | 1.85% | 2.03% | 2.57% | 1.97% | 2.38% | ||||||||||||||||||
Supplemental data | ||||||||||||||||||||||||
Net assets, end of period (000’s) | $ | 108,767 | $ | 108,766 | $ | 115,364 | $ | 271,061 | $ | 313,505 | $ | 150,417 | ||||||||||||
Portfolio turnover rate | 11.67% | 19.16% | 22.50% | 18.27% | 26.74% | 18.97% | g | |||||||||||||||||
aThe amount shown for a share outstanding throughout the period may not correlate with the Statement of Operations for the period due to the timing of sales and repurchases of the Fund shares in relation to income earned and/or fluctuating market value of the investments of the Fund.
bBased on average daily shares outstanding.
cAmount rounds to less than $0.01 per share.
dTotal return does not include fees, charges or expenses imposed by the variable annuity and life insurance contracts for which the Franklin Templeton Variable Insurance Products Trust serves as an underlying investment vehicle. Total return is not annualized for periods less than one year.
eRatios are annualized for periods less than one year.
fBenefit of expense reduction rounds to less than 0.01%.
gExcludes the value of portfolio securities delivered as a result of redemption in-kind.
The accompanying notes are an integral part of these financial statements.
TF-9
Franklin Templeton Variable Insurance Products Trust
Financial Highlights (continued)
Templeton Foreign Securities Fund
Six Months (unaudited) | Year Ended December 31, | |||||||||||||||
| Class 4 | 2010 | 2009 | 2008 | |||||||||||||
Per share operating performance | ||||||||||||||||
(for a share outstanding throughout the period) | ||||||||||||||||
Net asset value, beginning of period | $ | 14.43 | $ | 13.59 | $ | 10.91 | $ | 18.90 | ||||||||
Income from investment operationsb: | ||||||||||||||||
Net investment incomec | 0.28 | 0.17 | 0.21 | 0.15 | ||||||||||||
Net realized and unrealized gains (losses) | 0.57 | 0.92 | 3.37 | (6.08 | ) | |||||||||||
Total from investment operations | 0.85 | 1.09 | 3.58 | (5.93 | ) | |||||||||||
Less distributions from: | ||||||||||||||||
Net investment income | (0.25 | ) | (0.25 | ) | (0.42 | ) | (0.45 | ) | ||||||||
Net realized gains | — | — | (0.48 | ) | (1.61 | ) | ||||||||||
Total distributions | (0.25 | ) | (0.25 | ) | (0.90 | ) | (2.06 | ) | ||||||||
Redemption feesd | — | — | — | — | ||||||||||||
Net asset value, end of period | $ | 15.03 | $ | 14.43 | $ | 13.59 | $ | 10.91 | ||||||||
Total returne | 5.97% | 8.38% | 36.84% | (35.15)% | ||||||||||||
Ratios to average net assetsf | ||||||||||||||||
Expenses | 1.13% | 1.13% | g | 1.13% | g | 1.12% | g | |||||||||
Net investment income | 3.63% | 1.75% | 1.93% | 2.47% | ||||||||||||
Supplemental data | ||||||||||||||||
Net assets, end of period (000’s) | $ | 363,438 | $ | 305,505 | $ | 48,501 | $ | 14,287 | ||||||||
Portfolio turnover rate | 11.67% | 19.16% | 22.50% | 18.27% | ||||||||||||
aFor the period February 29, 2008 (effective date) to December 31, 2008.
bThe amount shown for a share outstanding throughout the period may not correlate with the Statement of Operations for the period due to the timing of sales and repurchases of the Fund shares in relation to income earned and/or fluctuating market value of the investments of the Fund.
cBased on average daily shares outstanding.
dAmount rounds to less than $0.01 per share.
eTotal return does not include fees, charges or expenses imposed by the variable annuity and life insurance contracts for which the Franklin Templeton Variable Insurance Products Trust serves as an underlying investment vehicle. Total return is not annualized for periods less than one year.
fRatios are annualized for periods less than one year.
gBenefit of expense reduction rounds to less than 0.01%.
The accompanying notes are an integral part of these financial statements.
TF-10
Franklin Templeton Variable Insurance Products Trust
Statement of Investments, June 30, 2011 (unaudited)
| Templeton Foreign Securities Fund | Country | Shares/Units | Value | |||||||
Common Stocks and Other Equity Interests 95.7% | ||||||||||
Aerospace & Defense 0.7% | ||||||||||
BAE Systems PLC | United Kingdom | 3,909,200 | $ | 19,985,429 | ||||||
Automobiles 1.8% | ||||||||||
aMazda Motor Corp. | Japan | 5,453,000 | 14,292,069 | |||||||
Toyota Motor Corp., ADR | Japan | 440,460 | 36,302,713 | |||||||
| 50,594,782 | ||||||||||
Capital Markets 2.7% | ||||||||||
Credit Suisse Group AG | Switzerland | 748,380 | 29,105,645 | |||||||
KKR & Co., LP | United States | 1,155,000 | 18,849,600 | |||||||
Nomura Holdings Inc. | Japan | 5,636,100 | 27,723,689 | |||||||
| 75,678,934 | ||||||||||
Commercial Banks 6.4% | ||||||||||
BNP Paribas | France | 430,520 | 33,232,480 | |||||||
DBS Group Holdings Ltd. | Singapore | 2,993,520 | 35,728,245 | |||||||
HSBC Holdings PLC | United Kingdom | 1,865,200 | 18,468,039 | |||||||
KB Financial Group Inc., ADR | South Korea | 1,220,681 | 58,348,552 | |||||||
UniCredit SpA | Italy | 10,439,019 | �� | 22,101,690 | ||||||
United Overseas Bank Ltd. | Singapore | 985,000 | 15,781,812 | |||||||
| 183,660,818 | ||||||||||
Commercial Services & Supplies 1.4% | ||||||||||
Downer EDI Ltd. | Australia | 4,000,712 | 15,874,345 | |||||||
G4S PLC | United Kingdom | 5,045,810 | 22,646,113 | |||||||
| 38,520,458 | ||||||||||
Communications Equipment 0.8% | ||||||||||
Telefonaktiebolaget LM Ericsson, B, ADR | Sweden | 1,675,840 | 24,098,579 | |||||||
Computers & Peripherals 1.8% | ||||||||||
Compal Electronics Inc. | Taiwan | 28,536,431 | 34,879,677 | |||||||
Lite-On Technology Corp. | Taiwan | 11,743,407 | 15,414,024 | |||||||
| 50,293,701 | ||||||||||
Construction Materials 0.5% | ||||||||||
CRH PLC | Ireland | 659,820 | 14,610,917 | |||||||
Containers & Packaging 0.7% | ||||||||||
Rexam PLC | United Kingdom | 3,021,290 | 18,559,043 | |||||||
Diversified Financial Services 2.5% | ||||||||||
aING Groep NV | Netherlands | 5,880,644 | 72,392,633 | |||||||
Diversified Telecommunication Services 9.2% | ||||||||||
China Telecom Corp. Ltd., H | China | 69,378,357 | 44,845,072 | |||||||
France Telecom SA | France | 2,164,143 | 46,023,641 | |||||||
Singapore Telecommunications Ltd. | Singapore | 20,651,000 | 53,128,030 | |||||||
Telefonica SA, ADR | Spain | 1,813,382 | 44,409,725 | |||||||
Telekom Austria AG | Austria | 1,711,400 | 21,839,724 | |||||||
Telenor ASA | Norway | 3,226,804 | 52,396,604 | |||||||
| 262,642,796 | ||||||||||
Electric Utilities 2.0% | ||||||||||
E.ON AG | Germany | 917,590 | 26,127,180 | |||||||
Iberdrola SA | Spain | 3,537,921 | 31,485,979 | |||||||
| 57,613,159 | ||||||||||
TF-11
Franklin Templeton Variable Insurance Products Trust
Statement of Investments, June 30, 2011 (unaudited) (continued)
| Templeton Foreign Securities Fund | Country | Shares/Units | Value | |||||||
Common Stocks and Other Equity Interests (continued) | ||||||||||
Electronic Equipment, Instruments & Components 1.1% | ||||||||||
aFlextronics International Ltd. | Singapore | 4,961,670 | $ | 31,853,921 | ||||||
Energy Equipment & Services 1.1% | ||||||||||
Aker Solutions ASA | Norway | 1,617,940 | 32,252,821 | |||||||
Food & Staples Retailing 2.1% | ||||||||||
Tesco PLC | United Kingdom | 9,326,670 | 60,169,114 | |||||||
Food Products 0.9% | ||||||||||
Nestle SA | Switzerland | 407,850 | 25,345,103 | |||||||
Hotels, Restaurants & Leisure 0.8% | ||||||||||
bAutogrill SpA | Italy | 1,655,033 | 21,720,418 | |||||||
Industrial Conglomerates 3.5% | ||||||||||
Hutchison Whampoa Ltd. | Hong Kong | 3,794,709 | 40,961,937 | |||||||
Koninklijke Philips Electronics NV | Netherlands | 801,670 | 20,588,616 | |||||||
Siemens AG | Germany | 285,414 | 39,133,596 | |||||||
| 100,684,149 | ||||||||||
Insurance 11.1% | ||||||||||
ACE Ltd. | United States | 377,449 | 24,843,693 | |||||||
aAIA Group Ltd. | Hong Kong | 11,111,000 | 38,551,354 | |||||||
Aviva PLC | United Kingdom | 9,269,960 | 65,319,042 | |||||||
AXA SA | France | 2,547,968 | 57,899,647 | |||||||
Muenchener Rueckversicherungs-Gesellschaft AG | Germany | 249,150 | 38,063,471 | |||||||
NKSJ Holdings Inc. | Japan | 4,218,000 | 27,716,564 | |||||||
PartnerRe Ltd. | Bermuda | 196,480 | 13,527,648 | |||||||
aSwiss Re Ltd. | Switzerland | 917,340 | 51,507,637 | |||||||
| 317,429,056 | ||||||||||
Life Sciences Tools & Services 0.5% | ||||||||||
Lonza Group AG | Switzerland | 175,440 | 13,729,724 | |||||||
Media 2.1% | ||||||||||
Reed Elsevier NV | Netherlands | 2,017,693 | 27,079,738 | |||||||
Vivendi SA | France | 1,178,959 | 32,782,874 | |||||||
| 59,862,612 | ||||||||||
Metals & Mining 0.5% | ||||||||||
POSCO | South Korea | 34,202 | 14,873,222 | |||||||
Multi-Utilities 0.9% | ||||||||||
GDF Suez | France | 697,431 | 25,522,165 | |||||||
Multiline Retail 0.5% | ||||||||||
Marks & Spencer Group PLC | United Kingdom | 2,350,320 | 13,641,541 | |||||||
Oil, Gas & Consumable Fuels 10.7% | ||||||||||
BP PLC | United Kingdom | 4,406,715 | 32,423,127 | |||||||
Gazprom, ADR | Russia | 2,623,000 | 38,164,650 | |||||||
Reliance Industries Ltd. | India | 998,145 | 20,074,724 | |||||||
Royal Dutch Shell PLC, B | United Kingdom | 1,292,973 | 46,124,114 | |||||||
Sasol, ADR | South Africa | 372,840 | 19,719,508 | |||||||
Statoil ASA | Norway | 2,455,740 | 62,193,686 | |||||||
Talisman Energy Inc. | Canada | 1,506,600 | 30,955,501 | |||||||
Total SA, B | France | 979,926 | 56,671,066 | |||||||
| 306,326,376 | ||||||||||
TF-12
Franklin Templeton Variable Insurance Products Trust
Statement of Investments, June 30, 2011 (unaudited) (continued)
| Templeton Foreign Securities Fund | Country | Shares/Units | Value | |||||||
Common Stocks and Other Equity Interests (continued) | ||||||||||
Pharmaceuticals 10.3% | ||||||||||
GlaxoSmithKline PLC | United Kingdom | 2,772,585 | $ | 59,370,410 | ||||||
Merck KGaA | Germany | 405,300 | 44,069,182 | |||||||
Novartis AG | Switzerland | 360,330 | 22,070,641 | |||||||
Roche Holding AG | Switzerland | 468,100 | 78,332,148 | |||||||
Sanofi | France | 1,127,925 | 90,681,019 | |||||||
| 294,523,400 | ||||||||||
Professional Services 1.4% | ||||||||||
Adecco SA | Switzerland | 318,420 | 20,412,510 | |||||||
Hays PLC | United Kingdom | 11,353,070 | 18,776,268 | |||||||
| 39,188,778 | ||||||||||
Real Estate Management & Development 1.0% | ||||||||||
Cheung Kong (Holdings) Ltd. | Hong Kong | 1,973,922 | 28,866,556 | |||||||
Semiconductors & Semiconductor Equipment 5.9% | ||||||||||
Infineon Technologies AG | Germany | 1,103,225 | 12,387,575 | |||||||
Samsung Electronics Co. Ltd. | South Korea | 89,088 | 68,965,968 | |||||||
Siliconware Precision Industries Co. | Taiwan | 14,515,000 | 18,623,514 | |||||||
Taiwan Semiconductor Manufacturing Co. Ltd. | Taiwan | 27,781,526 | 69,650,370 | |||||||
| 169,627,427 | ||||||||||
Software 2.8% | ||||||||||
Nintendo Co. Ltd. | Japan | 166,400 | 31,148,972 | |||||||
SAP AG, ADR | Germany | 370,760 | 22,486,594 | |||||||
Trend Micro Inc. | Japan | 868,100 | 26,839,338 | |||||||
| 80,474,904 | ||||||||||
Specialty Retail 2.8% | ||||||||||
Kingfisher PLC | United Kingdom | 11,166,186 | 47,892,834 | |||||||
USS Co. Ltd. | Japan | 431,520 | 33,393,821 | |||||||
| 81,286,655 | ||||||||||
Textiles, Apparel & Luxury Goods 0.2% | ||||||||||
Yue Yuen Industrial Holdings Ltd. | Hong Kong | 2,093,000 | 6,643,377 | |||||||
Trading Companies & Distributors 0.8% | ||||||||||
Itochu Corp. | Japan | 2,102,500 | 21,754,953 | |||||||
Wireless Telecommunication Services 4.2% | ||||||||||
China Mobile Ltd. | China | 2,340,000 | 21,680,728 | |||||||
Mobile TeleSystems, ADR | Russia | 914,865 | 17,400,732 | |||||||
Vodafone Group PLC, ADR | United Kingdom | 2,996,800 | 80,074,496 | |||||||
| 119,155,956 | ||||||||||
Total Common Stocks and Other Equity Interests | 2,733,583,477 | |||||||||
Preferred Stocks (Cost $2,178,441) 1.2% | ||||||||||
Metals & Mining 1.2% | ||||||||||
Vale SA, ADR, pfd., A | Brazil | 1,210,222 | 35,048,029 | |||||||
Total Investments before Short Term Investments | 2,768,631,506 | |||||||||
TF-13
Franklin Templeton Variable Insurance Products Trust
Statement of Investments, June 30, 2011 (unaudited) (continued)
| Templeton Foreign Securities Fund | Country | Shares/Units | Value | |||||||
Short Term Investments 3.3% | ||||||||||
Money Market Funds (Cost $80,534,394) 2.8% | ||||||||||
a,cInstitutional Fiduciary Trust Money Market Portfolio | United States | 80,534,394 | $ | 80,534,394 | ||||||
dInvestments from Cash Collateral Received for Loaned Securities | ||||||||||
Money Market Funds 0.5% | ||||||||||
eBNY Mellon Overnight Government Fund, 0.05% | United States | 12,457,015 | 12,457,015 | |||||||
Total Investments (Cost $2,494,165,699) 100.2% | 2,861,622,915 | |||||||||
Other Assets, less Liabilities (0.2)% | (4,297,400 | ) | ||||||||
Net Assets 100.0% | $ | 2,857,325,515 | ||||||||
See Abbreviations on page TF-25.
aNon-income producing.
bA portion or all of the security is on loan at June 30, 2011. See Note 1(c).
cSee Note 7 regarding investments in the Institutional Fiduciary Trust Money Market Portfolio.
dSee Note 1(c) regarding securities on loan.
eThe rate shown is the annualized seven-day yield at period end.
The accompanying notes are an integral part of these financial statements.
TF-14
Franklin Templeton Variable Insurance Products Trust
Financial Statements
Statement of Assets and Liabilities
June 30, 2011 (unaudited)
| Templeton Foreign Securities Fund | ||||
Assets: | ||||
Investments in securities: | ||||
Cost - Unaffiliated issuers | $ | 2,413,631,305 | ||
Cost - Sweep Money Fund (Note 7) | 80,534,394 | |||
|
| |||
Total cost of investments | $ | 2,494,165,699 | ||
|
| |||
Value - Unaffiliated issuers | $ | 2,781,088,521 | ||
Value - Sweep Money Fund (Note 7) | 80,534,394 | |||
|
| |||
Total value of investments (includes securities loaned in the amount $12,018,634) | 2,861,622,915 | |||
Cash | 1,652,499 | |||
Receivables: | ||||
Capital shares sold | 596,367 | |||
Dividends | 13,192,332 | |||
Other assets | 724 | |||
|
| |||
Total assets | 2,877,064,837 | |||
|
| |||
Liabilities: | ||||
Payables: | ||||
Capital shares redeemed | 3,838,837 | |||
Affiliates | 2,836,079 | |||
Payable upon return of securities loaned | 12,457,015 | |||
Accrued expenses and other liabilities | 607,391 | |||
|
| |||
Total liabilities | 19,739,322 | |||
|
| |||
Net assets, at value | $ | 2,857,325,515 | ||
|
| |||
Net assets consist of: | ||||
Paid-in capital | $ | 2,609,256,192 | ||
Undistributed net investment income | 53,463,787 | |||
Net unrealized appreciation (depreciation) | 367,819,795 | |||
Accumulated net realized gain (loss) | (173,214,259 | ) | ||
|
| |||
Net assets, at value | $ | 2,857,325,515 | ||
|
| |||
The accompanying notes are an integral part of these financial statements.
TF-15
Franklin Templeton Variable Insurance Products Trust
Financial Statements (continued)
Statement of Assets and Liabilities (continued)
June 30, 2011 (unaudited)
| Templeton Foreign Securities Fund | ||||
Class 1: | ||||
Net assets, at value | $ | 319,476,897 | ||
Shares outstanding | 21,085,114 | |||
Net asset value and maximum offering price per share | $ | 15.15 | ||
Class 2: | ||||
Net assets, at value | $ | 2,065,643,225 | ||
Shares outstanding | 138,608,418 | |||
Net asset value and maximum offering price per share | $ | 14.90 | ||
Class 3: | ||||
Net assets, at value | $ | 108,767,171 | ||
Shares outstanding | 7,324,953 | |||
Net asset value and maximum offering price per sharea | $ | 14.85 | ||
Class 4: | ||||
Net assets, at value | $ | 363,438,222 | ||
Shares outstanding | 24,182,943 | |||
Net asset value and maximum offering price per share | $ | 15.03 | ||
aRedemption price is equal to net asset value less redemption fees retained by the fund.
The accompanying notes are an integral part of these financial statements.
TF-16
Franklin Templeton Variable Insurance Products Trust
Financial Statements (continued)
Statement of Operations
for the six months ended June 30, 2011 (unaudited)
| Templeton Foreign Securities Fund | ||||
Investment income: | ||||
Dividends (net of foreign taxes of $7,409,801) | $ | 65,444,900 | ||
Income from securities loaned | 3,193,310 | |||
|
| |||
Total investment income | 68,638,210 | |||
|
| |||
Expenses: | ||||
Management fees (Note 3a) | 9,160,229 | |||
Administrative fees (Note 3b) | 1,366,364 | |||
Distribution fees: (Note 3c) | ||||
Class 2 | 2,640,889 | |||
Class 3 | 138,214 | |||
Class 4 | 589,614 | |||
Unaffiliated transfer agent fees | 3,174 | |||
Custodian fees (Note 4) | 284,486 | |||
Reports to shareholders | 321,977 | |||
Professional fees | 37,595 | |||
Trustees’ fees and expenses | 5,121 | |||
Other | 29,049 | |||
|
| |||
Total expenses | 14,576,712 | |||
|
| |||
Net investment income | 54,061,498 | |||
|
| |||
Realized and unrealized gains (losses): | ||||
Net realized gain (loss) from: | ||||
Investments | 92,741,145 | |||
Foreign currency transactions | 214,920 | |||
|
| |||
Net realized gain (loss) | 92,956,065 | |||
|
| |||
Net change in unrealized appreciation (depreciation) on: | ||||
Investments | 21,751,629 | |||
Translation of other assets and liabilities denominated in foreign currencies | 173,398 | |||
|
| |||
Net change in unrealized appreciation (depreciation) | 21,925,027 | |||
|
| |||
Net realized and unrealized gain (loss) | 114,881,092 | |||
|
| |||
Net increase (decrease) in net assets resulting from operations | $ | 168,942,590 | ||
|
| |||
The accompanying notes are an integral part of these financial statements.
TF-17
Franklin Templeton Variable Insurance Products Trust
Financial Statements (continued)
Statements of Changes in Net Assets
| Templeton Foreign Securities Fund | ||||||||
| Six Months Ended June 30, 2011 (unaudited) | Year Ended December 31, 2010 | |||||||
Increase (decrease) in net assets: | ||||||||
Operations: | ||||||||
Net investment income | $ | 54,061,498 | $ | 47,212,887 | ||||
Net realized gain (loss) from investments and foreign currency transactions | 92,956,065 | 35,915,484 | ||||||
Net change in unrealized appreciation (depreciation) on investments and translation of other assets and liabilities denominated in foreign currencies | 21,925,027 | 171,263,300 | ||||||
Net increase (decrease) in net assets resulting from operations | 168,942,590 | 254,391,671 | ||||||
Distributions to shareholders from: | ||||||||
Net investment income: | ||||||||
Class 1 | (5,782,491 | ) | (6,186,591 | ) | ||||
Class 2 | (33,309,204 | ) | (35,909,578 | ) | ||||
Class 3 | (1,749,311 | ) | (1,738,264 | ) | ||||
Class 4 | (5,966,192 | ) | (1,159,055 | ) | ||||
Total distributions to shareholders | (46,807,198 | ) | (44,993,488 | ) | ||||
Capital share transactions: (Note 2) | ||||||||
Class 1 | (15,547,422 | ) | (16,391,025 | ) | ||||
Class 2 | (116,087,783 | ) | (56,686,127 | ) | ||||
Class 3 | (4,751,771 | ) | (13,133,254 | ) | ||||
Class 4 | 45,264,268 | 210,807,534 | ||||||
Total capital share transactions | (91,122,708 | ) | 124,597,128 | |||||
Redemption fees | 2,672 | 9,228 | ||||||
Net increase (decrease) in net assets | 31,015,356 | 334,004,539 | ||||||
Net assets: | ||||||||
Beginning of period | 2,826,310,159 | 2,492,305,620 | ||||||
End of period | $ | 2,857,325,515 | $ | 2,826,310,159 | ||||
Undistributed net investment income included in net assets: | ||||||||
End of period | $ | 53,463,787 | $ | 46,209,487 | ||||
The accompanying notes are an integral part of these financial statements.
TF-18
Franklin Templeton Variable Insurance Products Trust
Notes to Financial Statements (unaudited)
Templeton Foreign Securities Fund
1. ORGANIZATION AND SIGNIFICANT ACCOUNTING POLICIES
Franklin Templeton Variable Insurance Products Trust (Trust) is registered under the Investment Company Act of 1940, as amended, (1940 Act) as an open-end investment company, consisting of twenty separate funds. The Templeton Foreign Securities Fund (Fund) is included in this report. The financial statements of the remaining funds in the Trust are presented separately. Shares of the Fund are generally sold only to insurance company separate accounts to fund the benefits of variable life insurance policies or variable annuity contracts. The Fund offers four classes of shares: Class 1, Class 2, Class 3, and Class 4.
The following summarizes the Fund’s significant accounting policies.
a. Financial Instrument Valuation
The Fund’s investments in securities and other financial instruments are carried at fair value daily. Fair value is the price that would be received to sell an asset or paid to transfer a liability in an orderly transaction between market participants on the measurement date. Under procedures approved by the Trust’s Board of Trustees, the Fund may utilize independent pricing services, quotations from securities and financial instrument dealers, and other market sources to determine fair value.
Equity securities listed on an exchange or on the NASDAQ National Market System are valued at the last quoted sale price or the official closing price of the day, respectively. Foreign equity securities are valued as of the close of trading on the foreign stock exchange on which the security is primarily traded, or the NYSE, whichever is earlier. The value is then converted into its U.S. dollar equivalent at the foreign exchange rate in effect at the close of the NYSE on the day that the value of the security is determined. Over-the-counter securities are valued within the range of the most recent quoted bid and ask prices. Securities that trade in multiple markets or on multiple exchanges are valued according to the broadest and most representative market. Certain equity securities are valued based upon fundamental characteristics or relationships to similar securities. Investments in open-end mutual funds and non-registered money market funds are valued at the closing net asset value.
The Fund has procedures to determine the fair value of securities and other financial instruments for which market prices are not readily available or which may not be reliably priced. Under these procedures, the Fund primarily employs a market-based approach which may use related or comparable assets or liabilities, recent transactions, market multiples, book values, and other relevant information for the investment to determine the fair value of the investment. The Fund may also use an income-based valuation approach in which the anticipated future cash flows of the investment are discounted to calculate fair value. Discounts may also be applied due to the nature or duration of any restrictions on the disposition of the investments. Due to the inherent uncertainty of valuations of such investments, the fair values may differ significantly from the values that would have been used had an active market existed.
Trading in securities on foreign securities stock exchanges and over-the-counter markets may be completed before the daily close of business on the NYSE. Occasionally, events occur between the time at which trading in a foreign security is completed and the close of the NYSE that might call into question the reliability of the value of a portfolio security held by the Fund. As a result, differences may arise between the value of the Fund’s portfolio securities as determined at the foreign market close and the latest indications of value at the close of the NYSE. In order to minimize the potential for these differences, the investment manager monitors price movements following the close of trading in foreign stock markets through a series of country specific market proxies (such as baskets of American Depository Receipts, futures contracts and exchange traded funds). These price movements are measured against established trigger thresholds for each specific market proxy to assist in determining if an event has occurred that may call into question the reliability of the values of the foreign securities held by the Fund. If such an event occurs, the securities may be valued using fair value procedures, which may include the use of independent pricing services.
b. Foreign Currency Translation
Portfolio securities and other assets and liabilities denominated in foreign currencies are translated into U.S. dollars based on the exchange rate of such currencies against U.S. dollars on the date of valuation. The Fund may enter into foreign currency
TF-19
Franklin Templeton Variable Insurance Products Trust
Notes to Financial Statements (unaudited) (continued)
Templeton Foreign Securities Fund
1. ORGANIZATION AND SIGNIFICANT ACCOUNTING POLICIES (continued)
b. Foreign Currency Translation (continued)
exchange contracts to facilitate transactions denominated in a foreign currency. Purchases and sales of securities, income and expense items denominated in foreign currencies are translated into U.S. dollars at the exchange rate in effect on the transaction date. Portfolio securities and assets and liabilities denominated in foreign currencies contain risks that those currencies will decline in value relative to the U.S. dollar. Occasionally, events may impact the availability or reliability of foreign exchange rates used to convert the U.S. dollar equivalent value. If such an event occurs, the foreign exchange rate will be valued at fair value using procedures established and approved by the Trust’s Board of Trustees.
The Fund does not separately report the effect of changes in foreign exchange rates from changes in market prices on securities held. Such changes are included in net realized and unrealized gain or loss from investments on the Statement of Operations.
Realized foreign exchange gains or losses arise from sales of foreign currencies, currency gains or losses realized between the trade and settlement dates on securities transactions and the difference between the recorded amounts of dividends, interest, and foreign withholding taxes and the U.S. dollar equivalent of the amounts actually received or paid. Net unrealized foreign exchange gains and losses arise from changes in foreign exchange rates on foreign denominated assets and liabilities other than investments in securities held at the end of the reporting period.
c. Securities Lending
The Fund participates in an agency based security lending program. The Fund receives cash collateral against the loaned securities in an amount equal to at least 102% of the market value of the loaned securities. Collateral is maintained over the life of the loan in an amount not less than 100% of the market value of loaned securities, as determined at the close of Fund business each day; any additional collateral required due to changes in security values is delivered to the Fund on the next business day. The collateral is invested in a money market fund managed by the Fund’s custodian on the Fund’s behalf. The Fund receives income from the investment of cash collateral, in addition to lending fees and rebates paid by the borrower. The Fund bears the market risk with respect to the collateral investment, securities loaned, and the risk that the agent may default on its obligations to the Fund. The securities lending agent has agreed to indemnify the Fund in the event of default by a third party borrower.
d. Income Taxes
It is the Fund’s policy to qualify as a regulated investment company under the Internal Revenue Code. The Fund intends to distribute to shareholders substantially all of its taxable income and net realized gains to relieve it from federal income and excise taxes. As a result, no provision for U.S. federal income taxes is required. The Fund files U.S. income tax returns as well as tax returns in certain other jurisdictions. The Fund records a provision for taxes in its financial statements including penalties and interest, if any, for a tax position taken on a tax return (or expected to be taken) when it fails to meet the more likely than not (a greater than 50% probability) threshold and based on the technical merits, the tax position may not be sustained upon examination by the tax authorities. As of June 30, 2011, and for all open tax years, the Fund has determined that no provision for income tax is required in the Fund’s financial statements. Open tax years are those that remain subject to examination and are based on each tax jurisdiction statute of limitation.
The Fund may be subject to foreign taxation related to income received, capital gains on the sale of securities and certain foreign currency transactions in the foreign jurisdictions in which it invests. Foreign taxes, if any, are recorded based on the tax regulations and rates that exist in the foreign markets in which the Fund invests. When a capital gain tax is determined to apply the Fund records an estimated deferred tax liability for unrealized gains on these securities in an amount that would be payable if the securities were disposed of on the valuation date.
TF-20
Franklin Templeton Variable Insurance Products Trust
Notes to Financial Statements (unaudited) (continued)
Templeton Foreign Securities Fund
1. ORGANIZATION AND SIGNIFICANT ACCOUNTING POLICIES (continued)
e. Security Transactions, Investment Income, Expenses and Distributions
Security transactions are accounted for on trade date. Realized gains and losses on security transactions are determined on a specific identification basis. Estimated expenses are accrued daily. Dividend income is recorded on the ex-dividend date except that certain dividends from foreign securities are recognized as soon as the Fund is notified of the ex-dividend date. Distributions to shareholders are recorded on the ex-dividend date and are determined according to income tax regulations (tax basis). Distributable earnings determined on a tax basis may differ from earnings recorded in accordance with accounting principles generally accepted in the United States of America. These differences may be permanent or temporary. Permanent differences are reclassified among capital accounts to reflect their tax character. These reclassifications have no impact on net assets or the results of operations. Temporary differences are not reclassified, as they may reverse in subsequent periods.
Common expenses incurred by the Trust are allocated among the funds based on the ratio of net assets of each fund to the combined net assets of the Trust. Fund specific expenses are charged directly to the fund that incurred the expense.
Realized and unrealized gains and losses and net investment income, not including class specific expenses, are allocated daily to each class of shares based upon the relative proportion of net assets of each class. Differences in per share distributions, by class, are generally due to differences in class specific expenses.
f. Accounting Estimates
The preparation of financial statements in accordance with accounting principles generally accepted in the United States of America requires management to make estimates and assumptions that affect the reported amounts of assets and liabilities at the date of the financial statements and the amounts of income and expenses during the reporting period. Actual results could differ from those estimates.
g. Redemption Fees
Redemptions and exchanges of interests in an insurance company subaccount that invests in Class 3 shares of the Fund will be subject to a 1.0% short term trading fee if the interest in the subaccount has been held for less than 60 days. Such fees are retained by the Fund and accounted for as an addition to paid-in capital, allocated to each class of shares based upon the relative proportion of net assets of each class.
h. Guarantees and Indemnifications
Under the Trust’s organizational documents, its officers and trustees are indemnified by the Trust against certain liabilities arising out of the performance of their duties to the Trust. Additionally, in the normal course of business, the Trust, on behalf of the Fund, enters into contracts with service providers that contain general indemnification clauses. The Trust’s maximum exposure under these arrangements is unknown as this would involve future claims that may be made against the Trust that have not yet occurred. Currently, the Trust expects the risk of loss to be remote.
TF-21
Franklin Templeton Variable Insurance Products Trust
Notes to Financial Statements (unaudited) (continued)
Templeton Foreign Securities Fund
2. SHARES OF BENEFICIAL INTEREST
At June 30, 2011, there were an unlimited number of shares authorized (without par value). Transactions in the Fund’s shares were as follows:
| Six Months Ended June 30, 2011 | Year Ended December 31, 2010 | |||||||||||||||
| Class 1 Shares: | Shares | Amount | Shares | Amount | ||||||||||||
Shares sold | 360,037 | $ | 5,500,124 | 1,834,739 | $ | 24,009,210 | ||||||||||
Shares issued in reinvestment of distributions | 392,832 | 5,782,491 | 500,533 | 6,186,591 | ||||||||||||
Shares redeemed | (1,757,208 | ) | (26,830,037 | ) | (3,507,687 | ) | (46,586,826 | ) | ||||||||
| ||||||||||||||||
Net increase (decrease) | (1,004,339 | ) | $ | (15,547,422 | ) | (1,172,415 | ) | $ | (16,391,025 | ) | ||||||
| ||||||||||||||||
Class 2 Shares: | ||||||||||||||||
Shares sold | 6,101,254 | $ | 91,105,850 | 24,359,823 | $ | 304,453,001 | ||||||||||
Shares issued in reinvestment of distributions | 2,300,359 | 33,309,203 | 2,950,664 | 35,909,578 | ||||||||||||
Shares redeemed | (16,069,753 | ) | (240,502,836 | ) | (30,526,296 | ) | (397,048,706 | ) | ||||||||
| ||||||||||||||||
Net increase (decrease) | (7,668,140 | ) | $ | (116,087,783 | ) | (3,215,809 | ) | $ | (56,686,127 | ) | ||||||
| ||||||||||||||||
Class 3 Shares: | ||||||||||||||||
Shares sold | 366,841 | $ | 5,465,038 | 488,049 | $ | 6,145,010 | ||||||||||
Shares issued in reinvestment of distributions | 121,227 | 1,749,311 | 143,421 | 1,738,264 | ||||||||||||
Shares redeemed | (800,456 | ) | (11,966,120 | ) | (1,625,745 | ) | (21,016,528 | ) | ||||||||
| ||||||||||||||||
Net increase (decrease) | (312,388 | ) | $ | (4,751,771 | ) | (994,275 | ) | $ | (13,133,254 | ) | ||||||
| ||||||||||||||||
Class 4 Shares: | ||||||||||||||||
Shares sold | 4,488,433 | $ | 67,795,298 | 19,836,996 | $ | 240,414,850 | ||||||||||
Shares issued on reinvestment of distributions | 408,643 | 5,966,192 | 94,309 | 1,159,055 | ||||||||||||
Shares redeemed | (1,885,338 | ) | (28,497,222 | ) | (2,328,115 | ) | (30,766,371 | ) | ||||||||
| ||||||||||||||||
Net increase (decrease) | 3,011,738 | $ | 45,264,268 | 17,603,190 | $ | 210,807,534 | ||||||||||
| ||||||||||||||||
3. TRANSACTIONS WITH AFFILIATES
Franklin Resources, Inc. is the holding company for various subsidiaries that together are referred to as Franklin Templeton Investments. Certain officers and trustees of the Fund are also officers, and/or directors of the following subsidiaries:
| Subsidiary | Affiliation | |
Templeton Investment Counsel, LLC (TIC) | Investment manager | |
Franklin Templeton Services, LLC (FT Services) | Administrative manager | |
Franklin Templeton Distributors, Inc. (Distributors) | Principal underwriter | |
Franklin Templeton Investor Services, LLC (Investor Services) | Transfer agent |
a. Management Fees
The Fund pays an investment management fee to TIC based on the average daily net assets of the Fund as follows:
| Annualized Fee Rate | Net Assets | |
| 0.750% | Up to and including $200 million | |
| 0.675% | Over $200 million, up to and including $1.3 billion | |
| 0.600% | Over $1.3 billion, up to and including $10 billion | |
| 0.580% | Over $10 billion, up to and including $15 billion | |
| 0.560% | Over $15 billion, up to and including $20 billion | |
| 0.540% | In excess of $20 billion |
TF-22
Franklin Templeton Variable Insurance Products Trust
Notes to Financial Statements (unaudited) (continued)
Templeton Foreign Securities Fund
3. TRANSACTIONS WITH AFFILIATES (continued)
b. Administrative Fees
The Fund pays an administrative fee to FT Services based on the Fund’s average daily net assets as follows:
| Fee Rate | Net Assets | |
| 0.150% | Up to and including $200 million | |
| 0.135% | Over $200 million, up to and including $700 million | |
| 0.100% | Over $700 million, up to and including $1.2 billion | |
| 0.075% | In excess of $1.2 billion |
c. Distribution Fees
The Trust’s Board of Trustees has adopted distribution plans for Class 2, Class 3, and Class 4 shares pursuant to Rule 12b-1 under the 1940 Act. Under the Fund’s compensation distribution plans, the Fund pays Distributors for costs incurred in connection with the servicing, sale and distribution of the Fund’s shares up to 0.25%, 0.35%, and 0.35% per year of its average daily net assets of Class 2, Class 3, and Class 4, respectively. The Board of Trustees has agreed to limit the current rate to 0.25% per year for Class 3.
e. Transfer Agent Fees
Investor Services, under terms of an agreement, performs shareholder servicing for the Fund and is not paid by the Fund for the services.
4. EXPENSE OFFSET ARRANGEMENT
The Fund has entered into an arrangement with its custodian whereby credits realized as a result of uninvested cash balances are used to reduce a portion of the Fund’s custodian expenses. During the period ended June 30, 2011, there were no credits earned.
5. INCOME TAXES
For tax purposes, capital losses may be carried over to offset future capital gains, if any. At December 31, 2010, the Fund had tax basis capital losses of $265,728,291 expiring in 2017.
Under the Regulated Investment Company Modernization Act of 2010, the Fund will be permitted to carry forward capital losses incurred in taxable years beginning after December 22, 2010 for an unlimited period. Post-enactment capital loss carryforwards will retain their character as either short-term or long-term capital losses rather than being considered short-term as under previous law. Any post-enactment capital losses generated will be required to be utilized prior to the losses incurred in pre-enactment tax years.
At June 30, 2011, the cost of investments and net unrealized appreciation (depreciation) for income tax purposes were as follows:
Cost of investments | $ | 2,494,607,736 | ||
|
| |||
Unrealized appreciation | $ | 512,240,125 | ||
Unrealized depreciation | (145,224,946 | ) | ||
|
| |||
Net unrealized appreciation (depreciation) | $ | 367,015,179 | ||
|
| |||
TF-23
Franklin Templeton Variable Insurance Products Trust
Notes to Financial Statements (unaudited) (continued)
Templeton Foreign Securities Fund
5. INCOME TAXES (continued)
Net investment income differs for financial statement and tax purposes primarily due to differing treatments of foreign currency transactions and pass-through entity income.
Net realized gains (losses) differ for financial statement and tax purposes primarily due to differing treatments of wash sales, foreign currency transactions and pass-through entity income.
6. INVESTMENT TRANSACTIONS
Purchases and sales of investments (excluding short term securities) for the period ended June 30, 2011, aggregated $332,560,124 and $427,908,723, respectively.
7. INVESTMENTS IN INSTITUTIONAL FIDUCIARY TRUST MONEY MARKET PORTFOLIO
The Fund invests in the Institutional Fiduciary Trust Money Market Portfolio (Sweep Money Fund), an open-end investment company managed by Franklin Advisers, Inc. (an affiliate of the investment manager). Management fees paid by the Fund are reduced on assets invested in the Sweep Money Fund, in an amount not to exceed the management and administrative fees paid by the Sweep Money Fund.
8. CONCENTRATION OF RISK
Investing in foreign securities may include certain risks and considerations not typically associated with investing in U.S. securities, such as fluctuating currency values and changing local and regional economic, political and social conditions, which may result in greater market volatility. In addition, certain foreign securities may not be as liquid as U.S. securities.
9. CREDIT FACILITY
The Fund, together with other U.S. registered and foreign investment funds (collectively, Borrowers), managed by Franklin Templeton Investments, are borrowers in a joint syndicated senior unsecured credit facility totaling $750 million (Global Credit Facility) which matures on January 20, 2012. This Global Credit Facility provides a source of funds to the Borrowers for temporary and emergency purposes, including the ability to meet future unanticipated or unusually large redemption requests.
Under the terms of the Global Credit Facility, the Fund shall, in addition to interest charged on any borrowings made by the Fund and other costs incurred by the Fund, pay its share of fees and expenses incurred in connection with the implementation and maintenance of the Global Credit Facility, based upon its relative share of the aggregate net assets of all of the Borrowers, including an annual commitment fee of 0.08% based upon the unused portion of the Global Credit Facility, which is reflected in other expenses on the Statement of Operations. During the period ended June 30, 2011, the Fund did not use the Global Credit Facility.
10. FAIR VALUE MEASUREMENTS
The Fund follows a fair value hierarchy that distinguishes between market data obtained from independent sources (observable inputs) and the Fund’s own market assumptions (unobservable inputs). These inputs are used in determining the value of the Fund’s investments and are summarized in the following fair value hierarchy:
| • | Level 1 – quoted prices in active markets for identical securities |
| • | Level 2 – other significant observable inputs (including quoted prices for similar securities, interest rates, prepayment speed, credit risk, etc.) |
TF-24
Franklin Templeton Variable Insurance Products Trust
Notes to Financial Statements (unaudited) (continued)
Templeton Foreign Securities Fund
10. FAIR VALUE MEASUREMENTS (continued)
| • | Level 3 – significant unobservable inputs (including the Fund’s own assumptions in determining the fair value of investments) |
The inputs or methodology used for valuing securities are not an indication of the risk associated with investing in those securities.
For movements between the levels within the fair value hierarchy, the Fund has adopted a policy of recognizing the transfers as of the date of the underlying event which caused the movement.
The following is a summary of the inputs used as of June 30, 2011, in valuing the Fund’s assets and liabilities carried at fair value:
| Level 1 | Level 2 | Level 3 | Total | |||||||||||||
|
| |||||||||||||||
Assets: | ||||||||||||||||
Investments in Securities | ||||||||||||||||
Equity Investmentsa,b | $ | 2,768,631,506 | $ | — | $ | — | $ | 2,768,631,506 | ||||||||
Short Term Investments | 80,534,394 | 12,457,015 | — | 92,991,409 | ||||||||||||
|
| |||||||||||||||
Total Investments in Securities | $ | 2,849,165,900 | $ | 12,457,015 | $ | — | $ | 2,861,622,915 | ||||||||
|
| |||||||||||||||
aIncludes common and preferred stock as well as other equity investments.
bFor detailed industry descriptions, see the accompanying Statement of Investments.
11. NEW ACCOUNTING PRONOUNCEMENTS
In May 2011, the Financial Accounting Standards Board (FASB) issued Accounting Standards Update (ASU) No. 2011-04, Fair Value Measurement (Topic 820): Amendments to Achieve Common Fair Value Measurement and Disclosure Requirements in U.S. GAAP and International Financial Reporting Standards (IFRS). The amendments in the ASU will improve the comparability of fair value measurements presented and disclosed in financial statements prepared in accordance with U.S. GAAP and IFRS and include new guidance for certain fair value measurement principles and disclosure requirements. The ASU is effective for interim and annual periods beginning after December 15, 2011. The Fund is currently evaluating the impact, if any, of applying this provision.
12. SUBSEQUENT EVENTS
The Fund has evaluated subsequent events through the issuance of the financial statements and determined that no events have occurred that require disclosure.
ABBREVIATIONS | ||||
| Selected Portfolio | ||||
| ADR - American Depository Receipt |
TF-25
Franklin Templeton Variable Insurance Products Trust
Tax Designation (unaudited)
Templeton Foreign Securities Fund
At December 31, 2010, more than 50% of the Fund’s total assets were invested in securities of foreign issuers. In most instances, foreign taxes were withheld from income paid to the Fund on these investments. As shown in the table below, the Fund designates to shareholders the foreign source income and foreign taxes paid, pursuant to Section 853 of the Internal Revenue Code (Code). This designation will allow shareholders of record on June 14, 2011, to treat their proportionate share of foreign taxes paid by the Fund as having been paid directly by them. The shareholder shall consider these amounts as foreign taxes paid in the tax year in which they receive the Fund distribution.
The following table provides a detailed analysis of foreign tax paid, and foreign source income as designated by the Fund, to Class 1 , Class 2, Class 3, and Class 4 shareholders of record.
| Class | Foreign Tax Paid Per Share | Foreign Source Income Per Share | ||||||
Class 1 | $ | 0.0382 | $ | 0.3182 | ||||
Class 2 | $ | 0.0382 | $ | 0.2831 | ||||
Class 3 | $ | 0.0382 | $ | 0.2821 | ||||
Class 4 | $ | 0.0382 | $ | 0.2942 | ||||
Foreign Tax Paid Per Share (Column 1) is the amount per share available to you, as a tax credit (assuming you held your shares in the Fund for a minimum of 16 days during the 3 1-day period beginning 15 days before the ex-dividend date of the Fund’s distribution to which the foreign taxes relate), or, as a tax deduction.
Foreign Source Income Per Share (Column 2) is the amount per share of income dividends attributable to foreign securities held by the Fund, plus any foreign taxes withheld on these dividends.
TF-26
TEMPLETON GLOBAL BOND SECURITIES FUND
We are pleased to bring you Templeton Global Bond Securities Fund’s semiannual report for the period ended June 30, 2011.
Performance Summary as of 6/30/11
Templeton Global Bond Securities Fund – Class 3 delivered a +5.29% total return for the six-month period ended 6/30/11.
Performance reflects the Fund’s Class 3 operating expenses, but does not include any contract fees, expenses or sales charges. If they had been included, performance would be lower. These charges and deductions, particularly for variable life policies, can have a significant effect on contract values and insurance benefits. See the contract prospectus for a complete description of these expenses, including sales charges.
Templeton Global Bond Securities Fund – Class 3
Performance data represent past performance, which does not guarantee future results. Investment return and principal value will fluctuate, and you may have a gain or loss when you sell your shares. Current performance may differ from figures shown.
TGB-1
Fund Goal and Main Investments: Templeton Global Bond Securities Fund seeks high current income, consistent with preservation of capital, with capital appreciation as a secondary consideration. The Fund normally invests at least 80% of its net assets in bonds, which include debt securities of any maturity, such as bonds, notes, bills and debentures.
Performance Overview
You can find the Fund’s six-month total return in the Performance Summary. The Fund outperformed its benchmarks, the J.P. Morgan Global Government Bond Index, which posted a +3.89% total return in U.S. dollar terms, and the Citigroup World Government Bond Index, which produced a +4.00% total return for the same period.1
Economic and Market Overview
The global economy continued to experience a healthy recovery during the first half of 2011 despite weaker economic activity toward the end of the period. During the reporting period, many policymakers in developing economies continued to tighten policy in response to growth and rising commodity prices. In contrast, the G-3 (U.S., eurozone and Japan) struggled with economic growth that was not as robust as in previous recoveries. Labor markets remained weak, and concerns regarding public sector balances led to periods of market volatility. Worries over sovereign risks in the eurozone, combined with political unrest in the Middle East and the earthquake in Japan, also contributed to periods of high volatility in financial markets.
Global growth was solid in the first quarter of 2011. Many developing economies closed their output gaps and without policy action would have been at risk of overheating. This prompted many policymakers in these economies to continue raising interest rates, tightening fiscal policies and implementing regulations to keep growth at sustainable levels. Many countries increasingly used currency appreciation to try to control inflation from commodity and other import prices. The recovery was not as strong within the G-3. Even as parts of the eurozone, particularly Germany, showed relatively strong recoveries, Greece and, more broadly, southern Europe continued to lag with contractions in several economic indicators.
1. Source: © 2011 Morningstar. One cannot invest directly in an index, and an index is not representative of the Fund’s portfolio. Please see Index Descriptions following the Fund Summaries.
Fund Risks: Because the Fund invests in bonds and other debt obligations, its share price and yield will be affected by interest rate movements. Bond prices generally move in the opposite direction of interest rates. Thus, as prices of bonds in the Fund adjust to a rise in interest rates, the Fund’s share price may decline. High yield, lower rated (junk) bonds generally have greater price swings and higher default risks than investment-grade bonds. Foreign investing, especially in emerging or developing markets, involves additional risks, including currency fluctuations, economic instability, market volatility, and political and social instability. The Fund’s investment in certain hedging and derivative instruments may involve a small investment relative to the risk assumed. As a nondiversified fund, the Fund may be more sensitive to economic, business, political or other changes affecting similar issuers or securities, which may result in greater fluctuation in the value of the Fund’s shares. The manager applies various techniques and analyses in making investment decisions for the Fund, but there can be no guarantee that these decisions will produce the desired results. The Fund’s prospectus also includes a description of the main investment risks.
TGB-2
In early 2011, risk assets and commodities experienced periods of volatility in response to global events. Commodity prices, particularly for energy, rose in the first quarter due to unrest in the Middle East and North Africa. Regimes throughout the region faced unprecedented popular uprisings that brought down governments in Tunisia and Egypt and sparked violent confrontations in Libya, Yemen and elsewhere in the region. The March earthquake in Japan led to risk aversion globally and a disruption of supply chains. The disaster prompted Japanese policymakers to ease monetary policy.
Economic activity slowed in the second quarter, which relieved some of the upward pressure on commodity prices. This slowdown showed signs of being more transitory, reflecting in part supply-chain disruptions resulting from the earthquake in Japan. Early signs from Japan indicated that activity started slowly recovering late in the period. In the U.S., housing and consumer confidence data worsened, and already sluggish labor markets showed signs of further weakness. Many other countries experienced slowdowns in activity as well, particularly within manufacturing sectors. However, even though manufacturing numbers were lower in most economies, they remained solidly in expansionary territory, particularly in many of the countries that were quick to recover from the crisis. In many emerging markets, moderating economic growth helped policymakers who had tightened fiscal and monetary policies to prevent overheating. Despite higher interest rates in the eurozone and the planned end of quantitative easing in the U.S., the G-3 continued to supply liquidity to governments and the financial sector.
In the period’s second half, investors exhibited heightened risk aversion as attention returned to highly indebted eurozone nations. Portugal became the third eurozone country to seek official aid from the International Monetary Fund (IMF) and European Union (EU), and the EU struggled to agree upon a coordinated course of action to provide continued assistance to Greece. The period ended with Greece’s government winning a vote of confidence and gaining parliamentary approval for budget cuts, which were needed for disbursement of the next round of funds from the EU and IMF.
Investment Strategy
We allocate the Fund’s assets among issuers, geographic regions, and currencies based upon our assessment of relative interest rates among currencies, our outlook for changes in interest rates and currencies, and
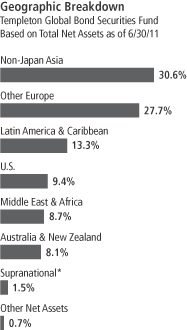
*The Fund’s supranational investments were denominated in the Mexican peso, Norwegian krone and U.S. dollar.
TGB-3
credit risks. In considering these factors, we may evaluate a country’s changing market, economic and political conditions, such as inflation rate, growth prospects, global trade patterns and government policies. We seek to manage the Fund’s exposure to various currencies and may utilize forward currency exchange contracts.
Manager’s Discussion
The Fund’s total return was influenced by various factors, including interest rate developments, currency movements and exposure to sovereign debt markets. During the period under review, each of these sources of return benefited absolute and relative results.
Interest Rate Strategy
The Fund’s duration exposure was a major contributor to relative performance during the six months under review. Although the prospect of higher interest rates is generally a challenge for many fixed income investors, the Fund was somewhat cushioned from rising yields with an average duration of less than half that of the benchmark index, no exposure to U.S. Treasuries or Japanese government bonds, and minimal exposure to eurozone government bonds. Actively managed global fixed income investing in a rising interest rate environment can also offer an opportunity to pursue relatively high yields without taking much duration or credit risk. We favored short maturity bonds in places like Australia, Israel and South Korea where yields between about 3% and 5% were available on bonds with less than two years of duration and strong creditworthiness, in our assessment.
This strategy contributed to relative performance over the period because of some select, overweighted exposures. In addition, long duration, local government bonds in Indonesia, Mexico and Brazil were significant contributors.
Currency Strategy
The Fund’s diverse, actively managed currency exposure provided strong returns during the period. Global currency markets increasingly reflected the underlying strengths of their respective economies. The U.S. dollar fell 5.62% against its major trading partners over the period, a broad-based decline against most currencies outside the Middle East and Africa.2 In the Americas, we concentrated the Fund’s currency exposure in a few emerging Latin American economies, which benefited relative performance. The Chilean peso, Mexican peso and Brazilian
2. Source: Federal Reserve H10 Report.
What is a forward currency exchange contract?
A forward currency exchange contract is an agreement between the Fund and a counterparty to buy or sell a foreign currency for a specific exchange rate on a future date.
What is duration?
Duration is a measure of a bond’s price sensitivity to interest rate changes. In general, a portfolio of securities with a lower duration can be expected to be less sensitive to interest rate changes than a portfolio with a higher duration.
TGB-4
real each appreciated against the U.S. dollar as their domestically led recoveries outpaced that of the U.S. In addition, these economies benefited from high prices for the commodities they exported.
The Fund’s exposure to Asia-Pacific region currencies also contributed to results. The currencies of emerging Asian economies and those of more developed economies, such as South Korea and Australia, appreciated as the region again had the world’s strongest growth. Although China’s economy led, with robust domestic demand despite steps by policymakers to tighten policy, the country’s demand and investment had a positive impact throughout the region. For example, Australia was one of the first developed economies to recover from the global financial crisis not only because it had not gone through a housing bubble and had much better government finances, but also because it has close links with China, which is Australia’s largest trading partner. Chinese demand supported prices for Australia’s commodity exports, and the Australian dollar appreciated against the U.S. dollar. The Fund experienced similar benefits from currencies of regional emerging market countries closely integrated with China, such as Malaysia and Indonesia.
The Fund’s European currency exposure was a major detractor from relative performance. The Fund’s significantly underweighted euro exposure, through the use of forward currency exchange contracts, detracted from relative performance, but this was partially offset by overweighted exposure to currencies from non-eurozone European countries such as the Norwegian krone, Swedish krona and Polish zloty.
Global Sovereign Debt Strategy
Sovereign credit exposure benefited performance as the broadly supportive risk environment led to yield spread tightening in most credits. Despite sovereign credits’ significant tightening since the financial crisis, we found opportunities we considered attractive as we felt relative fundamentals continued to favor emerging markets. The enhanced resilience of such economies and the significant challenges facing highly indebted non-eurozone European countries drove a reevaluation of traditional perceptions of sovereign risk. This situation, in conjunction with developed economies’ low interest rates, brought new investors to the asset class and pushed credit spreads lower for some of the largest, traditional emerging markets. We were selective in our sovereign credit exposure as the period progressed, but we managed to benefit from these positions. Specifically, exposures in Hungary and Indonesia were
Currency Breakdown
Templeton Global Bond Securities Fund
6/30/11
| % of Total Net Assets | ||||
Americas | 53.1% | |||
U.S. Dollar | 35.5% | |||
Mexican Peso | 7.7% | |||
Chilean Peso | 5.8% | |||
Brazilian Real | 3.9% | |||
Peruvian Nuevo Sol | 0.2% | |||
Asia Pacific | 38.0% | |||
South Korean Won | 14.1% | |||
Malaysian Ringgit | 10.8% | |||
Australian Dollar | 10.5% | |||
Indonesian Rupiah | 6.2% | |||
Philippine Peso | 4.9% | |||
Indian Rupee | 4.3% | |||
Singapore Dollar | 4.1% | |||
Sri Lankan Rupee | 1.6% | |||
Japanese Yen* | -18.5% | |||
Middle East & Africa | 5.8% | |||
New Israeli Shekel | 4.2% | |||
Egyptian Pound | 1.6% | |||
Europe | 3.1% | |||
Swedish Krona | 9.5% | |||
Polish Zloty | 9.4% | |||
Norwegian Krone | 7.7% | |||
British Pound | 5.8% | |||
Euro* | -29.3% | |||
*Holding is a negative percentage because of the Fund’s holdings of forward currency exchange contracts.
The dollar value, number of shares or principal amount, and names of all portfolio holdings are listed in the Fund’s Statement of Investments.
TGB-5
top contributing sovereign credit positions, and positions in Russia, Lithuania and Venezuela also helped performance.
Thank you for your participation in Templeton Global Bond Securities Fund. We look forward to serving your future investment needs.
The foregoing information reflects our analysis, opinions and portfolio holdings as of June 30, 2011, the end of the reporting period. The way we implement our main investment strategies and the resulting portfolio holdings may change depending on factors such as market and economic conditions. These opinions may not be relied upon as investment advice or an offer for a particular security. The information is not a complete analysis of every aspect of any market, country, industry, security or the Fund. Statements of fact are from sources considered reliable, but the investment manager makes no representation or warranty as to their completeness or accuracy. Although historical performance is no guarantee of future results, these insights may help you understand our investment management philosophy.
TGB-6
Fund Expenses
As an investor in a variable insurance contract (Contract) that indirectly provides for investment in an underlying mutual fund, you can incur transaction and/or ongoing expenses at both the Fund level and the Contract level.
| • | Transaction expenses can include sales charges (loads) on purchases, redemption fees, surrender fees, transfer fees and premium taxes. |
| • | Ongoing expenses can include management fees, distribution and service (12b-1) fees, contract fees, annual maintenance fees, mortality and expense risk fees and other fees and expenses. All mutual funds and Contracts have some types of ongoing expenses. |
The expenses shown in the table are meant to highlight ongoing expenses at the Fund level only and do not include ongoing expenses at the Contract level, or transaction expenses at either the Fund or Contract levels. While the Fund does not have transaction expenses, if the transaction and ongoing expenses at the Contract level were included, the expenses shown below would be higher. You should consult your Contract prospectus or disclosure document for more information.
The table shows Fund-level ongoing expenses and can help you understand these expenses and compare them with those of other mutual funds offered through the Contract. The table assumes a $1,000 investment held for the six months indicated. Please refer to the Fund prospectus for additional information on operating expenses.
Actual Fund Expenses
The first line (Actual) of the table provides actual account values and expenses. The “Ending Account Value” is derived from the Fund’s actual return, which includes the effect of ongoing Fund expenses, but does not include the effect of ongoing Contract expenses.
You can estimate the Fund-level expenses you incurred during the period by following these steps. Of course, your account value and expenses will differ from those in this illustration:
| 1. | Divide your account value by $1,000. |
If an account had an $8,600 value, then $8,600 ÷ $1,000 = 8.6.
| 2. | Multiply the result by the number under the heading “Fund-Level Expenses Incurred During Period.” |
If Fund-Level Expenses Incurred During Period were $7.50, then 8.6 x $7.50 = $64.50.
In this illustration, the estimated expenses incurred this period at the Fund level are $64.50.
Templeton Global Bond Securities Fund – Class 3
TGB-7
Hypothetical Example for Comparison with Other Mutual Funds
Information in the second line (Hypothetical) of the table can help you compare ongoing expenses of the Fund with those of other mutual funds offered through the Contract. This information may not be used to estimate the actual ending account balance or expenses you incurred during the period. The hypothetical “Ending Account Value” is based on the Fund’s actual expense ratio and an assumed 5% annual rate of return before expenses, which does not represent the Fund’s actual return. The figure under the heading “Fund-Level Expenses Incurred During Period” shows the hypothetical expenses your account would have incurred under this scenario. You can compare this figure with the 5% hypothetical examples that appear in shareholder reports of other funds offered through a Contract.
| Class 3 | Beginning Account Value 1/1/11 | Ending Account Value 6/30/11 | Fund-Level Expenses Incurred During Period* 1/1/11–6/30/11 | |||||||||
Actual | $ | 1,000 | $ | 1,052.90 | $ | 4.07 | ||||||
Hypothetical (5% return before expenses) | $ | 1,000 | $ | 1,020.83 | $ | 4.01 | ||||||
*Expenses are calculated using the most recent six-month annualized expense ratio for the Fund’s Class 3 shares (0.80%), which does not include any ongoing expenses of the Contract for which the Fund is an investment option, multiplied by the average account value over the period, multiplied by 181/365 to reflect the one-half year period.
TGB-8
Franklin Templeton Variable Insurance Products Trust
Financial Highlights
Templeton Global Bond Securities Fund
Six Months (unaudited) | Year Ended December 31, | |||||||||||||||||||||||
| Class 1 | 2010 | 2009 | 2008 | 2007 | 2006 | |||||||||||||||||||
| ||||||||||||||||||||||||
Per share operating performance | ||||||||||||||||||||||||
(for a share outstanding throughout the period) | ||||||||||||||||||||||||
Net asset value, beginning of period | $ | 19.94 | $ | 17.72 | $ | 17.42 | $ | 17.00 | $ | 15.73 | $ | 14.36 | ||||||||||||
|
| |||||||||||||||||||||||
Income from investment operationsa: | ||||||||||||||||||||||||
Net investment incomeb | 0.48 | 1.00 | 0.99 | 0.80 | 0.77 | 0.61 | ||||||||||||||||||
Net realized and unrealized gains (losses) | 0.60 | 1.58 | 2.01 | 0.27 | 0.97 | 1.24 | ||||||||||||||||||
|
| |||||||||||||||||||||||
Total from investment operations | 1.08 | 2.58 | 3.00 | 1.07 | 1.74 | 1.85 | ||||||||||||||||||
|
| |||||||||||||||||||||||
Less distributions from: | ||||||||||||||||||||||||
Net investment income and net foreign currency gains | (1.15 | ) | (0.31 | ) | (2.70 | ) | (0.65 | ) | (0.47 | ) | (0.48 | ) | ||||||||||||
Net realized gains | (0.13 | ) | (0.05 | ) | — | — | — | — | ||||||||||||||||
|
| |||||||||||||||||||||||
Total distributions | (1.28 | ) | (0.36 | ) | (2.70 | ) | (0.65 | ) | (0.47 | ) | (0.48 | ) | ||||||||||||
|
| |||||||||||||||||||||||
Redemption feesc | — | — | — | — | — | — | ||||||||||||||||||
|
| |||||||||||||||||||||||
Net asset value, end of period | $ | 19.74 | $ | 19.94 | $ | 17.72 | $ | 17.42 | $ | 17.00 | $ | 15.73 | ||||||||||||
|
| |||||||||||||||||||||||
Total returnd | 5.43% | 14.71% | 18.98% | 6.46% | 11.27% | 13.14% | ||||||||||||||||||
Ratios to average net assetse | ||||||||||||||||||||||||
Expenses before expense reduction | 0.55% | 0.55% | 0.54% | 0.58% | 0.64% | 0.80% | ||||||||||||||||||
Expenses net of expense reduction | 0.55% | 0.55% | f | 0.54% | f | 0.58% | f | 0.64% | f | 0.72% | ||||||||||||||
Net investment income | 4.72% | 5.27% | 5.73% | 4.66% | 4.70% | 4.09% | ||||||||||||||||||
Supplemental data | ||||||||||||||||||||||||
Net assets, end of period (000’s) | $ | 291,254 | $ | 272,232 | $ | 195,662 | $ | 220,588 | $ | 137,700 | $ | 75,843 | ||||||||||||
Portfolio turnover rate | 23.86% | 8.77% | 20.84% | 28.46% | 47.33% | 30.65% | ||||||||||||||||||
aThe amount shown for a share outstanding throughout the period may not correlate with the Statement of Operations for the period due to the timing of sales and repurchases of the Fund shares in relation to income earned and/or fluctuating market value of the investments of the Fund.
bBased on average daily shares outstanding.
cAmount rounds to less than $0.01 per share.
dTotal return does not include fees, charges or expenses imposed by the variable annuity and life insurance contracts for which the Franklin Templeton Variable Insurance Products Trust serves as an underlying investment vehicle. Total return is not annualized for periods less than one year.
eRatios are annualized for periods less than one year.
fBenefit of expense reduction rounds to less than 0.01%.
The accompanying notes are an integral part of these financial statements.
TGB-9
Franklin Templeton Variable Insurance Products Trust
Financial Highlights (continued)
Templeton Global Bond Securities Fund
| Six Months Ended June 30, 2011 (unaudited) | Year Ended December 31, | |||||||||||||||||||||||
| Class 2 | 2010 | 2009 | 2008 | 2007 | 2006 | |||||||||||||||||||
| ||||||||||||||||||||||||
Per share operating performance | ||||||||||||||||||||||||
(for a share outstanding throughout the period) | ||||||||||||||||||||||||
Net asset value, beginning of period | $ | 19.49 | $ | 17.34 | $ | 17.10 | $ | 16.72 | $ | 15.50 | $ | 14.19 | ||||||||||||
|
| |||||||||||||||||||||||
Income from investment operationsa: | ||||||||||||||||||||||||
Net investment incomeb | 0.44 | 0.93 | 0.93 | 0.74 | 0.72 | 0.57 | ||||||||||||||||||
Net realized and unrealized gains (losses) | 0.59 | 1.54 | 1.98 | 0.27 | 0.96 | 1.21 | ||||||||||||||||||
|
| |||||||||||||||||||||||
Total from investment operations | 1.03 | 2.47 | 2.91 | 1.01 | 1.68 | 1.78 | ||||||||||||||||||
|
| |||||||||||||||||||||||
Less distributions from: | ||||||||||||||||||||||||
Net investment income and net foreign currency gains | (1.11 | ) | (0.27 | ) | (2.67 | ) | (0.63 | ) | (0.46 | ) | (0.47 | ) | ||||||||||||
Net realized gains | (0.13 | ) | (0.05 | ) | — | — | — | — | ||||||||||||||||
|
| |||||||||||||||||||||||
Total distributions | (1.24 | ) | (0.32 | ) | (2.67 | ) | (0.63 | ) | (0.46 | ) | (0.47 | ) | ||||||||||||
|
| |||||||||||||||||||||||
Redemption feesc | — | — | — | — | — | — | ||||||||||||||||||
|
| |||||||||||||||||||||||
Net asset value, end of period | $ | 19.28 | $ | 19.49 | $ | 17.34 | $ | 17.10 | $ | 16.72 | $ | 15.50 | ||||||||||||
|
| |||||||||||||||||||||||
Total returnd | 5.30% | 14.45% | 18.68% | 6.21% | 11.00% | 12.77% | ||||||||||||||||||
Ratios to average net assetse | ||||||||||||||||||||||||
Expenses before expense reduction | 0.80% | 0.80% | 0.79% | 0.83% | 0.89% | 1.05% | ||||||||||||||||||
Expenses net of expense reduction | 0.80% | 0.80% | f | 0.79% | f | 0.83% | f | 0.89% | f | 0.97% | ||||||||||||||
Net investment income | 4.47% | 5.02% | 5.48% | 4.41% | 4.45% | 3.84% | ||||||||||||||||||
Supplemental data | ||||||||||||||||||||||||
Net assets, end of period (000’s) | $ | 1,757,266 | $ | 1,490,794 | $ | 1,262,783 | $ | 793,881 | $ | 480,649 | $ | 205,768 | ||||||||||||
Portfolio turnover rate | 23.86% | 8.77% | 20.84% | 28.46% | 47.33% | 30.65% | ||||||||||||||||||
aThe amount shown for a share outstanding throughout the period may not correlate with the Statement of Operations for the period due to the timing of sales and repurchases of the Fund shares in relation to income earned and/or fluctuating market value of the investments of the Fund.
bBased on average daily shares outstanding.
cAmount rounds to less than $0.01 per share.
dTotal return does not include fees, charges or expenses imposed by the variable annuity and life insurance contracts for which the Franklin Templeton Variable Insurance Products Trust serves as an underlying investment vehicle. Total return is not annualized for periods less than one year.
eRatios are annualized for periods less than one year.
fBenefit of expense reduction rounds to less than 0.01%.
The accompanying notes are an integral part of these financial statements.
TGB-10
Franklin Templeton Variable Insurance Products Trust
Financial Highlights (continued)
Templeton Global Bond Securities Fund
Six Months (unaudited) | Year Ended December 31, | |||||||||||||||||||||||
| Class 3 | 2010 | 2009 | 2008 | 2007 | 2006 | |||||||||||||||||||
| ||||||||||||||||||||||||
Per share operating performance | ||||||||||||||||||||||||
(for a share outstanding throughout the period) | ||||||||||||||||||||||||
Net asset value, beginning of period | $ | 19.48 | $ | 17.33 | $ | 17.08 | $ | 16.70 | $ | 15.49 | $ | 14.18 | ||||||||||||
|
| |||||||||||||||||||||||
Income from investment operationsa: | ||||||||||||||||||||||||
Net investment incomeb | 0.44 | 0.93 | 0.93 | 0.74 | 0.72 | 0.58 | ||||||||||||||||||
Net realized and unrealized gains (losses) | 0.58 | 1.54 | 1.98 | 0.27 | 0.95 | 1.21 | ||||||||||||||||||
|
| |||||||||||||||||||||||
Total from investment operations | 1.02 | 2.47 | 2.91 | 1.01 | 1.67 | 1.79 | ||||||||||||||||||
|
| |||||||||||||||||||||||
Less distributions from: | ||||||||||||||||||||||||
Net investment income and net foreign currency gains | (1.10 | ) | (0.27 | ) | (2.66 | ) | (0.63 | ) | (0.46 | ) | (0.48 | ) | ||||||||||||
Net realized gains | (0.13 | ) | (0.05 | ) | — | — | — | — | ||||||||||||||||
|
| |||||||||||||||||||||||
Total distributions | (1.23 | ) | (0.32 | ) | (2.66 | ) | (0.63 | ) | (0.46 | ) | (0.48 | ) | ||||||||||||
|
| |||||||||||||||||||||||
Redemption feesc | — | — | — | — | — | — | ||||||||||||||||||
|
| |||||||||||||||||||||||
Net asset value, end of period | $ | 19.27 | $ | 19.48 | $ | 17.33 | $ | 17.08 | $ | 16.70 | $ | 15.49 | ||||||||||||
|
| |||||||||||||||||||||||
Total returnd | 5.29% | 14.38% | 18.69% | 6.21% | 11.03% | 12.84% | ||||||||||||||||||
Ratios to average net assetse | ||||||||||||||||||||||||
Expenses before expense reduction | 0.80% | 0.80% | 0.79% | 0.83% | 0.89% | 1.05% | ||||||||||||||||||
Expenses net of expense reduction | 0.80% | 0.80% | f | 0.79% | f | 0.83% | f | 0.89% | f | 0.97% | ||||||||||||||
Net investment income | 4.47% | 5.02% | 5.48% | 4.41% | 4.45% | 3.84% | ||||||||||||||||||
Supplemental data | ||||||||||||||||||||||||
Net assets, end of period (000’s) | $ | 202,111 | $ | 183,380 | $ | 143,264 | $ | 128,155 | $ | 91,162 | $ | 35,572 | ||||||||||||
Portfolio turnover rate | 23.86% | 8.77% | 20.84% | 28.46% | 47.33% | 30.65% | ||||||||||||||||||
aThe amount shown for a share outstanding throughout the period may not correlate with the Statement of Operations for the period due to the timing of sales and repurchases of the Fund shares in relation to income earned and/or fluctuating market value of the investments of the Fund.
bBased on average daily shares outstanding.
cAmount rounds to less than $0.01 per share.
dTotal return does not include fees, charges or expenses imposed by the variable annuity and life insurance contracts for which the Franklin Templeton Variable Insurance Products Trust serves as an underlying investment vehicle. Total return is not annualized for periods less than one year.
eRatios are annualized for periods less than one year.
fBenefit of expense reduction rounds to less than 0.01%.
The accompanying notes are an integral part of these financial statements.
TGB-11
Franklin Templeton Variable Insurance Products Trust
Financial Highlights (continued)
Templeton Global Bond Securities Fund
Six Months (unaudited) | Year Ended December 31, | |||||||||||||||
| Class 4 | 2010 | 2009 | 2008a | |||||||||||||
| ||||||||||||||||
Per share operating performance | ||||||||||||||||
(for a share outstanding throughout the period) | ||||||||||||||||
Net asset value, beginning of period | $ | 19.78 | $ | 17.61 | $ | 17.37 | $ | 18.00 | ||||||||
|
| |||||||||||||||
Income from investment operationsb: | ||||||||||||||||
Net investment incomec | 0.44 | 0.93 | 0.93 | 0.66 | ||||||||||||
Net realized and unrealized gains (losses) | 0.60 | 1.56 | 2.00 | (0.64 | ) | |||||||||||
|
| |||||||||||||||
Total from investment operations | 1.04 | 2.49 | 2.93 | 0.02 | ||||||||||||
|
| |||||||||||||||
Less distributions from: | ||||||||||||||||
Net investment income and net foreign currency gains | (1.09 | ) | (0.27 | ) | (2.69 | ) | (0.65 | ) | ||||||||
Net realized gains | (0.13 | ) | (0.05 | ) | — | — | ||||||||||
|
| |||||||||||||||
Total distributions | (1.22 | ) | (0.32 | ) | (2.69 | ) | (0.65 | ) | ||||||||
|
| |||||||||||||||
Redemption feesd | — | — | — | — | ||||||||||||
|
| |||||||||||||||
Net asset value, end of period | $ | 19.60 | $ | 19.78 | $ | 17.61 | $ | 17.37 | ||||||||
|
| |||||||||||||||
Total returne | 5.27% | 14.28% | 18.58% | 0.26% | ||||||||||||
Ratios to average net assetsf | ||||||||||||||||
Expensesg | 0.90% | 0.90% | 0.89% | 0.93% | ||||||||||||
Net investment income | 4.37% | 4.92% | 5.38% | 4.31% | ||||||||||||
Supplemental data | ||||||||||||||||
Net assets, end of period (000’s) | $ | 165,765 | $ | 150,891 | $ | 108,910 | $ | 43,069 | ||||||||
Portfolio turnover rate | 23.86% | 8.77% | 20.84% | 28.46% | ||||||||||||
aFor the period February 29, 2008 (effective date) to December 31, 2008.
bThe amount shown for a share outstanding throughout the period may not correlate with the Statement of Operations for the period due to the timing of sales and repurchases of the Fund shares in relation to income earned and/or fluctuating market value of the investments of the Fund.
cBased on average daily shares outstanding.
dAmount rounds to less than $0.01 per share.
eTotal return does not include fees, charges or expenses imposed by the variable annuity and life insurance contracts for which the Franklin Templeton Variable Insurance Products Trust serves as an underlying investment vehicle. Total return is not annualized for periods less than one year.
fRatios are annualized for periods less than one year.
gBenefit of expense reduction rounds to less than 0.01%.
The accompanying notes are an integral part of these financial statements.
TGB-12
Franklin Templeton Variable Insurance Products Trust
Statement of Investments, June 30, 2011 (unaudited)
| Templeton Global Bond Securities Fund | Principal Amount* | Value | ||||||
Foreign Government and Agency Securities 72.4% | ||||||||
Argentina 1.1% | ||||||||
a,bGovernment of Argentina, senior bond, FRN, 0.467%, 8/03/12 | 107,485,000 | $ | 26,328,451 | |||||
|
| |||||||
Australia 8.1% | ||||||||
Government of Australia, senior bond, 123, 5.75%, 4/15/12 | 43,700,000 | AUD | 47,238,602 | |||||
New South Wales Treasury Corp., | ||||||||
6.00%, 5/01/12 | 10,590,000 | AUD | 11,464,037 | |||||
6.00%, 5/01/12 (London Exchange) | 13,180,000 | AUD | 14,268,508 | |||||
5.50%, 8/01/13 | 3,710,000 | AUD | 4,019,727 | |||||
senior note, 5.50%, 3/01/17 | 32,225,000 | AUD | 34,922,470 | |||||
Queensland Treasury Corp., | ||||||||
6.00%, 8/14/13 | 24,450,000 | AUD | 26,807,013 | |||||
6.00%, 9/14/17 | 13,160,000 | AUD | 14,635,719 | |||||
senior note, 6.00%, 8/21/13 | 7,830,000 | AUD | 8,554,686 | |||||
Western Australia Treasury Corp., | ||||||||
5.50%, 7/17/12 | 26,480,000 | AUD | 28,576,621 | |||||
8.00%, 6/15/13 | 4,350,000 | AUD | 4,928,672 | |||||
|
| |||||||
| 195,416,055 | ||||||||
|
| |||||||
Brazil 3.9% | ||||||||
Nota Do Tesouro Nacional, | ||||||||
10.00%, 1/01/12 | 38,245 | c BRL | 24,208,266 | |||||
10.00%, 1/01/14 | 7,100 | c BRL | 4,297,700 | |||||
10.00%, 1/01/17 | 22,490 | c BRL | 13,037,005 | |||||
dIndex Linked, 6.00%, 5/15/15 | 29,822 | c BRL | 38,343,544 | |||||
dIndex Linked, 6.00%, 5/15/45 | 10,825 | c BRL | 14,664,632 | |||||
|
| |||||||
| 94,551,147 | ||||||||
|
| |||||||
Hungary 2.3% | ||||||||
Government of Hungary, senior note, | ||||||||
3.50%, 7/18/16 | 1,055,000 | EUR | 1,410,996 | |||||
4.375%, 7/04/17 | 5,380,000 | EUR | 7,260,557 | |||||
5.75%, 6/11/18 | 13,795,000 | EUR | 19,837,680 | |||||
6.25%, 1/29/20 | 6,420,000 | 6,791,012 | ||||||
3.875%, 2/24/20 | 3,120,000 | EUR | 3,890,817 | |||||
6.375%, 3/29/21 | 14,820,000 | 15,672,150 | ||||||
|
| |||||||
| 54,863,212 | ||||||||
|
| |||||||
Indonesia 7.8% | ||||||||
Government of Indonesia, | ||||||||
FR20, 14.275%, 12/15/13 | 14,267,000,000 | IDR | 1,968,277 | |||||
FR31, 11.00%, 11/15/20 | 167,351,000,000 | IDR | 24,017,345 | |||||
FR34, 12.80%, 6/15/21 | 207,810,000,000 | IDR | 32,874,752 | |||||
FR35, 12.90%, 6/15/22 | 66,582,000,000 | IDR | 10,555,031 | |||||
FR36, 11.50%, 9/15/19 | 30,075,000,000 | IDR | 4,363,356 | |||||
FR37, 12.00%, 9/15/26 | 8,230,000,000 | IDR | 1,260,909 | |||||
FR39, 11.75%, 8/15/23 | 5,491,000,000 | IDR | 818,147 | |||||
FR40, 11.00%, 9/15/25 | 61,856,000,000 | IDR | 8,834,014 | |||||
FR42, 10.25%, 7/15/27 | 88,574,000,000 | IDR | 11,923,380 | |||||
FR43, 10.25%, 7/15/22 | 68,340,000,000 | IDR | 9,305,721 | |||||
FR44, 10.00%, 9/15/24 | 4,454,000,000 | IDR | 593,296 | |||||
FR46, 9.50%, 7/15/23 | 226,780,000,000 | IDR | 29,392,162 | |||||
FR47, 10.00%, 2/15/28 | 61,737,000,000 | IDR | 8,102,043 | |||||
FR48, 9.00%, 9/15/18 | 16,920,000,000 | IDR | 2,156,928 | |||||
FR49, 9.00%, 9/15/13 | 35,030,000,000 | IDR | 4,326,153 | |||||
esenior bond, 144A, 8.50%, 10/12/35 | 9,119,000 | 12,244,309 | ||||||
TGB-13
Franklin Templeton Variable Insurance Products Trust
Statement of Investments, June 30, 2011 (unaudited) (continued)
| Templeton Global Bond Securities Fund | Principal Amount* | Value | ||||||
Foreign Government and Agency Securities (continued) | ||||||||
Indonesia (continued) | ||||||||
Government of Indonesia (continued) | ||||||||
esenior bond, 144A, 6.625%, 2/17/37 | 2,240,000 | $ | 2,480,509 | |||||
esenior bond, 144A, 7.75%, 1/17/38 | 10,980,000 | 13,682,178 | ||||||
esenior note, 144A, 11.625%, 3/04/19 | 6,410,000 | 9,448,981 | ||||||
|
| |||||||
| 188,347,491 | ||||||||
|
| |||||||
Iraq 0.3% | ||||||||
Government of Iraq, | ||||||||
e144A, 5.80%, 1/15/28 | 5,055,000 | 4,593,681 | ||||||
fReg S, 5.80%, 1/15/28 | 3,440,000 | 3,126,065 | ||||||
|
| |||||||
| 7,719,746 | ||||||||
|
| |||||||
Israel 0.1% | ||||||||
Government of Israel, 5.00%, 3/31/13 | 8,880,000 | ILS | 2,699,202 | |||||
|
| |||||||
Lithuania 1.6% | ||||||||
eGovernment of Lithuania, 144A, | ||||||||
6.75%, 1/15/15 | 19,480,000 | 21,507,381 | ||||||
7.375%, 2/11/20 | 12,690,000 | 14,677,127 | ||||||
6.125%, 3/09/21 | 3,240,000 | 3,450,503 | ||||||
|
| |||||||
| 39,635,011 | ||||||||
|
| |||||||
Malaysia 2.5% | ||||||||
Government of Malaysia, senior bond, | ||||||||
3.833%, 9/28/11 | 3,860,000 | MYR | 1,283,078 | |||||
2.711%, 2/14/12 | 720,000 | MYR | 238,654 | |||||
3.718%, 6/15/12 | 50,265,000 | MYR | 16,785,613 | |||||
2.509%, 8/27/12 | 24,825,000 | MYR | 8,184,925 | |||||
3.702%, 2/25/13 | 23,300,000 | MYR | 7,798,034 | |||||
3.461%, 7/31/13 | 12,600,000 | MYR | 4,199,207 | |||||
3.814%, 2/15/17 | 18,885,000 | MYR | 6,316,184 | |||||
4.24%, 2/07/18 | 44,360,000 | MYR | 15,119,304 | |||||
|
| |||||||
| 59,924,999 | ||||||||
|
| |||||||
Mexico 7.0% | ||||||||
Government of Mexico, | ||||||||
M, 9.00%, 6/20/13 | 2,982,300 | g MXN | 27,274,261 | |||||
M 10, 8.00%, 12/17/15 | 726,000 | g MXN | 6,656,088 | |||||
M 10, 7.25%, 12/15/16 | 250,000 | g MXN | 2,226,173 | |||||
M 10, 7.75%, 12/14/17 | 4,473,000 | g MXN | 40,829,938 | |||||
MI10, 9.00%, 12/20/12 | 265,000 | g MXN | 2,392,585 | |||||
MI10, 8.00%, 12/19/13 | 9,939,900 | g MXN | 89,976,954 | |||||
|
| |||||||
| 169,355,999 | ||||||||
|
| |||||||
Norway 0.4% | ||||||||
Government of Norway, 6.50%, 5/15/13 | 49,400,000 | NOK | 9,815,980 | |||||
|
| |||||||
Peru 0.2% | ||||||||
Government of Peru, 7.84%, 8/12/20 | 11,090,000 | PEN | 4,458,325 | |||||
|
| |||||||
Philippines 0.3% | ||||||||
Government of the Philippines, senior bond, | ||||||||
5.75%, 2/21/12 | 134,520,000 | PHP | 3,146,481 | |||||
5.25%, 1/07/13 | 61,770,000 | PHP | 1,440,547 | |||||
8.75%, 3/03/13 | 160,310,000 | PHP | 3,945,013 | |||||
|
| |||||||
| 8,532,041 | ||||||||
|
| |||||||
TGB-14
Franklin Templeton Variable Insurance Products Trust
Statement of Investments, June 30, 2011 (unaudited) (continued)
| Templeton Global Bond Securities Fund | Principal Amount* | Value | ||||||
Foreign Government and Agency Securities (continued) | ||||||||
Poland 8.3% | ||||||||
Government of Poland, | ||||||||
4.75%, 4/25/12 | 58,025,000 | PLN | $ | 21,170,440 | ||||
5.25%, 4/25/13 | 18,510,000 | PLN | 6,804,502 | |||||
5.00%, 10/24/13 | 6,190,000 | PLN | 2,263,671 | |||||
5.75%, 4/25/14 | 92,590,000 | PLN | 34,434,723 | |||||
6.25%, 10/24/15 | 44,730,000 | PLN | 16,958,651 | |||||
5.75%, 9/23/22 | 48,750,000 | PLN | 17,633,593 | |||||
senior note, 6.375%, 7/15/19 | 27,200,000 | 31,060,088 | ||||||
Strip, 7/25/12 | 4,110,000 | PLN | 1,426,931 | |||||
Strip, 10/25/12 | 79,825,000 | PLN | 27,374,268 | |||||
Strip, 1/25/13 | 88,905,000 | PLN | 30,130,519 | |||||
Strip, 7/25/13 | 37,390,000 | PLN | 12,376,994 | |||||
|
| |||||||
| 201,634,380 | ||||||||
|
| |||||||
Qatar 0.6% | ||||||||
eGovernment of Qatar, senior note, 144A, 6.55%, 4/09/19 | 12,060,000 | 14,039,408 | ||||||
|
| |||||||
Russia 3.0% | ||||||||
eGovernment of Russia, 144A, 7.50%, 3/31/30 | 61,274,005 | 72,216,011 | ||||||
|
| |||||||
South Africa 1.6% | ||||||||
Government of South Africa, | ||||||||
5.25%, 5/16/13 | 3,590,000 | EUR | 5,423,235 | |||||
4.50%, 4/05/16 | 1,874,000 | EUR | 2,782,886 | |||||
6.875%, 5/27/19 | 21,215,000 | 25,264,413 | ||||||
senior note, 6.50%, 6/02/14 | 805,000 | 902,506 | ||||||
senior note, 5.875%, 5/30/22 | 3,485,000 | 3,866,995 | ||||||
|
| |||||||
| 38,240,035 | ||||||||
|
| |||||||
South Korea 13.3% | ||||||||
The Export-Import Bank of Korea, senior note, 4.625%, 2/20/17 | 230,000 | EUR | 341,388 | |||||
KDICB Redemption Fund Bond, senior bond, | ||||||||
07-1, 5.57%, 9/14/12 | 6,600,000,000 | KRW | 6,312,309 | |||||
08-1, 5.28%, 2/15/13 | 880,000,000 | KRW | 842,612 | |||||
Korea Treasury Bond, | ||||||||
4.75%, 12/10/11 | 77,103,490,000 | KRW | 72,693,949 | |||||
5.25%, 9/10/12 | 28,539,000,000 | KRW | 27,257,941 | |||||
5.25%, 3/10/13 | 6,483,790,000 | KRW | 6,223,576 | |||||
5.00%, 9/10/16 | 2,806,000,000 | KRW | 2,741,708 | |||||
senior bond, 4.00%, 6/10/12 | 132,027,650,000 | KRW | 124,248,898 | |||||
senior bond, 4.25%, 12/10/12 | 23,404,000,000 | KRW | 22,124,379 | |||||
senior bond, 3.75%, 6/10/13 | 47,488,000,000 | KRW | 44,545,905 | |||||
senior bond, 3.00%, 12/10/13 | 15,159,610,000 | KRW | 13,955,855 | |||||
|
| |||||||
| 321,288,520 | ||||||||
|
| |||||||
Sri Lanka 1.5% | ||||||||
Government of Sri Lanka, | ||||||||
A, 12.00%, 7/15/11 | 115,200,000 | LKR | 1,054,044 | |||||
A, 6.90%, 8/01/12 | 14,600,000 | LKR | 132,514 | |||||
A, 8.50%, 1/15/13 | 694,400,000 | LKR | 6,415,882 | |||||
A, 13.50%, 2/01/13 | 674,300,000 | LKR | 6,678,215 | |||||
A, 7.00%, 3/01/14 | 43,380,000 | LKR | 384,754 | |||||
A, 11.25%, 7/15/14 | 773,000,000 | LKR | 7,610,181 | |||||
A, 11.75%, 3/15/15 | 8,520,000 | LKR | 85,107 | |||||
TGB-15
Franklin Templeton Variable Insurance Products Trust
Statement of Investments, June 30, 2011 (unaudited) (continued)
| Templeton Global Bond Securities Fund | Principal Amount* | Value | ||||||
Foreign Government and Agency Securities (continued) | ||||||||
Sri Lanka (continued) | ||||||||
Government of Sri Lanka (continued) | ||||||||
A, 6.50%, 7/15/15 | 106,480,000 | LKR | $ | 899,970 | ||||
A, 11.00%, 8/01/15 | 1,349,700,000 | LKR | 13,237,198 | |||||
B, 6.60%, 6/01/14 | 56,800,000 | LKR | 496,377 | |||||
|
| |||||||
| 36,994,242 | ||||||||
|
| |||||||
hSupranational 1.5% | ||||||||
Corporacion Andina De Fomento, 8.125%, 6/04/19 | 9,880,000 | 12,022,972 | ||||||
European Investment Bank, senior note, 4.50%, 5/15/13 | 33,700,000 | NOK | 6,395,768 | |||||
Inter-American Development Bank, senior note, 7.50%, 12/05/24 | 200,000,000 | MXN | 17,346,965 | |||||
|
| |||||||
| 35,765,705 | ||||||||
|
| |||||||
Sweden 3.4% | ||||||||
Government of Sweden, 5.50%, 10/08/12 | 481,950,000 | SEK | 79,373,882 | |||||
Kommuninvest I Sverige AB, senior note, 1.75%, 10/08/12 | 24,400,000 | SEK | 3,809,541 | |||||
|
| |||||||
| 83,183,423 | ||||||||
|
| |||||||
Ukraine 0.7% | ||||||||
eGovernment of Ukraine, senior note, 144A, 7.95%, 2/23/21 | 16,330,000 | 17,030,067 | ||||||
|
| |||||||
United Arab Emirates 0.6% | ||||||||
eEmirate of Abu Dhabi, 144A, 6.75%, 4/08/19 | 11,840,000 | 14,060,000 | ||||||
|
| |||||||
United Kingdom 0.6% | ||||||||
United Kingdom Treasury Bond, 5.00%, 3/07/12 | 8,752,000 | GBP | 14,466,090 | |||||
|
| |||||||
Venezuela 1.1% | ||||||||
Government of Venezuela, 10.75%, 9/19/13 | 13,570,000 | 13,539,466 | ||||||
Petroleos de Venezuela SA, senior bond, zero cpn., 7/10/11 | 12,205,000 | 12,190,720 | ||||||
|
| |||||||
| 25,730,186 | ||||||||
|
| |||||||
Vietnam 0.6% | ||||||||
eGovernment of Vietnam, 144A, 6.75%, 1/29/20 | 13,110,000 | 13,691,756 | ||||||
|
| |||||||
Total Foreign Government and Agency Securities (Cost $1,521,804,537) | 1,749,987,482 | |||||||
|
| |||||||
Municipal Bonds 1.5% | ||||||||
United States 1.5% | ||||||||
Alabama State University Revenue, General Tuition and Fee, Assured Guaranty, 5.00%, 9/01/29 | 175,000 | 182,119 | ||||||
Bay Area Toll Authority Toll Bridge Revenue, Build America Bonds, Series S1, 6.793%, 4/01/30 | 3,460,000 | 3,722,441 | ||||||
Bexar County Revenue, Venue Project, Refunding, Series A, BHAC Insured, 5.25%, 8/15/47 | 1,450,000 | 1,519,064 | ||||||
California State GO, | ||||||||
7.625%, 3/01/40 | 1,320,000 | 1,520,917 | ||||||
Refunding, 5.125%, 4/01/33 | 4,725,000 | 4,736,624 | ||||||
Refunding, 5.00%, 4/01/38 | 1,985,000 | 1,908,458 | ||||||
Various Purpose, 6.00%, 4/01/38 | 11,650,000 | 12,373,465 | ||||||
Illinois Municipal Electricity Agency Power Supply Revenue, Series A, BHAC Insured, 5.00%, 2/01/35 | 2,155,000 | 2,143,104 | ||||||
Los Angeles Community College District GO, Election of 2008, Series D, 6.68%, 8/01/36 | 1,700,000 | 1,703,859 | ||||||
Los Angeles USD, GO, Series KRY, 5.25%, 7/01/26 | 765,000 | 813,417 | ||||||
North Carolina Eastern Municipal Power Agency Power System Revenue, Refunding, Series A, Assured Guaranty, 5.25%, 1/01/19 | 2,400,000 | 2,672,736 | ||||||
Philadelphia GO, Refunding, Series A, Assured Guaranty, 5.00%, 8/01/24 | 500,000 | 505,940 | ||||||
Tarrant County Cultural Education Facilities Finance Corp. Revenue, Christus Health, Refunding, Series A, Assured Guaranty, 6.25%, 7/01/28 | 1,500,000 | 1,653,240 | ||||||
|
| |||||||
Total Municipal Bonds (Cost $33,788,334) | 35,455,384 | |||||||
|
| |||||||
Total Investments before Short Term Investments (Cost $1,555,592,871) | 1,785,442,866 | |||||||
|
| |||||||
TGB-16
Franklin Templeton Variable Insurance Products Trust
Statement of Investments, June 30, 2011 (unaudited) (continued)
| Templeton Global Bond Securities Fund | Principal Amount* | Value | ||||||
Short Term Investments 25.4% | ||||||||
Foreign Government and Agency Securities 17.5% | ||||||||
Egypt 1.6% | ||||||||
iEgypt Treasury Bills, 7/12/11 - 2/21/12 | 240,250,000 | EGP | $ | 39,368,126 | ||||
|
| |||||||
Israel 3.9% | ||||||||
Government of Israel, 4.00%, 3/30/12 | 26,865,000 | ILS | 7,922,671 | |||||
iIsrael Treasury Bills, 7/06/11 - 5/02/12 | 302,472,900 | ILS | 87,626,797 | |||||
|
| |||||||
| 95,549,468 | ||||||||
|
| |||||||
Malaysia 4.4% | ||||||||
iBank of Negara Monetary Note, 7/28/11 - 3/29/12 | 317,655,000 | MYR | 104,011,563 | |||||
iMalaysia Treasury Bills, 7/08/11 - 3/23/12 | 3,780,000 | MYR | 1,236,553 | |||||
|
| |||||||
| 105,248,116 | ||||||||
|
| |||||||
Norway 2.3% | ||||||||
iNorway Treasury Bills, | ||||||||
12/21/11 | 68,140,000 | NOK | 12,487,659 | |||||
3/21/12 | 240,230,000 | NOK | 43,799,206 | |||||
|
| |||||||
| 56,286,865 | ||||||||
|
| |||||||
Philippines 0.2% | ||||||||
iPhilippine Treasury Bills, 7/13/11 - 2/22/12 | 175,620,000 | PHP | 4,015,686 | |||||
|
| |||||||
Poland 0.1% | ||||||||
Government of Poland, Strip, 1/25/12 | 5,580,000 | PLN | 1,983,578 | |||||
|
| |||||||
Sri Lanka 0.1% | ||||||||
iSri Lanka Treasury Bills, 7/08/11 - 2/17/12 | 188,660,000 | LKR | 1,668,879 | |||||
|
| |||||||
Sweden 1.2% | ||||||||
iSweden Treasury Bills, | ||||||||
9/21/11 | 166,200,000 | SEK | 26,173,896 | |||||
12/21/11 | 16,190,000 | SEK | 2,536,848 | |||||
|
| |||||||
| 28,710,744 | ||||||||
|
| |||||||
United Kingdom 3.7% | ||||||||
iUnited Kingdom Treasury Bills, | ||||||||
7/25/11 | 22,170,000 | GBP | 35,568,890 | |||||
8/01/11 - 8/08/11 | 7,181,000 | GBP | 11,519,434 | |||||
United Kingdom Treasury Note, | ||||||||
9.00%, 7/12/11 | 4,320,000 | GBP | 6,950,848 | |||||
3.25%, 12/07/11 | 18,942,000 | GBP | 30,766,335 | |||||
5.25%, 6/07/12 | 3,277,000 | GBP | 5,482,644 | |||||
|
| |||||||
| 90,288,151 | ||||||||
|
| |||||||
Total Foreign Government and Agency Securities (Cost $420,348,381) | 423,119,613 | |||||||
|
| |||||||
Total Investments before Repurchase Agreements (Cost $1,975,941,252) | 2,208,562,479 | |||||||
|
| |||||||
TGB-17
Franklin Templeton Variable Insurance Products Trust
Statement of Investments, June 30, 2011 (unaudited) (continued)
| Templeton Global Bond Securities Fund | Principal Amount* | Value | ||||||
Repurchase Agreements (Cost $191,085,986) 7.9% | ||||||||
United States 7.9% | ||||||||
jJoint Repurchase Agreement, 0.005%, 7/01/11 (Maturity Value $191,086,013) | 191,085,986 | $ | 191,085,986 | |||||
Barclays Capital Inc. (Maturity Value $16,374,161) | ||||||||
BNP Paribas Securities Corp. (Maturity Value $43,663,154) | ||||||||
Credit Suisse Securities (USA) LLC (Maturity Value $32,746,410) | ||||||||
Deutsche Bank Securities Inc. (Maturity Value $21,892,725) | ||||||||
HSBC Securities (USA) Inc. (Maturity Value $16,374,160) | ||||||||
Merrill Lynch, Pierce, Fenner & Smith Inc. (Maturity Value $10,914,833) | ||||||||
Morgan Stanley & Co. LLC (Maturity Value $16,374,160) | ||||||||
UBS Securities LLC (Maturity Value $32,746,410) | ||||||||
Collateralized by U.S. Government Agency Securities, 0.75% - 5.375%, 10/15/11 - 9/13/19; iU.S. Government Agency Discount Notes, 9/28/11 – 12/28/11; iU.S. Treasury Bills, 8/04/11 - 8/25/11; U.S. Treasury Bonds, 7.25% 11.25%, 2/15/15 - 5/15/16; and U.S. Treasury Notes, 0.375% - 5.00%, 7/31/11 - 6/30/16 (valued at $195,394,959) | ||||||||
|
| |||||||
Total Investments (Cost $2,167,027,238) 99.3% | 2,399,648,465 | |||||||
Other Assets, less Liabilities 0.7% | 16,747,886 | |||||||
|
| |||||||
Net Assets 100.0% | $ | 2,416,396,351 | ||||||
|
| |||||||
See Abbreviations on page TGB-38.
*The principal amount is stated in U.S. dollars unless otherwise indicated.
aThe coupon rate shown represents the rate at period end.
bThe principal amount is stated in original face, and scheduled paydowns are reflected in the market price on ex-date.
cPrincipal amount is stated in 1,000 Brazilian Real Units.
dRedemption price at maturity is adjusted for inflation. See Note 1(f).
eSecurity was purchased pursuant to Rule 144A under the Securities Act of 1933 and may be sold in transactions exempt from registration only to qualified institutional buyers or in a public offering registered under the Securities Act of 1933. These securities have been deemed liquid under guidelines approved by the Trust’s Board of Trustees. At June 30, 2011, the aggregate value of these securities was $213,121,911, representing 8.82% of net assets.
fSecurity was purchased pursuant to Regulation S under the Securities Act of 1933, which exempts from registration securities offered and sold outside of the United States. Such a security cannot be sold in the United States without either an effective registration statement filed pursuant to the Securities Act of 1933, or pursuant to an exemption from registration. This security has been deemed liquid under guidelines approved by the Trust’s Board of Trustees. At June 30, 2011, the value of this security was $3,126,065, representing 0.13% of net assets.
gPrincipal amount is stated in 100 Mexican Peso Units.
hA supranational organization is an entity formed by two or more central governments through international treaties.
iThe security is traded on a discount basis with no stated coupon rate.
jSee Note 1(c) regarding joint repurchase agreement.
TGB-18
Franklin Templeton Variable Insurance Products Trust
Statement of Investments, June 30, 2011 (unaudited) (continued)
| Templeton Global Bond Securities Fund |
At June 30, 2011, the Fund had the following forward exchange contracts outstanding. See Note 1(d).
Forward Exchange Contracts
| Currency | Counterparty | Type | Quantity | Contract Amount* | Settlement Date | Unrealized Appreciation | Unrealized Depreciation | |||||||||||||||||||||||||
Indian Rupee | DBAB | Buy | 79,423,000 | 1,637,588 | 7/11/11 | $ | 138,334 | $ | — | |||||||||||||||||||||||
Indian Rupee | JPHQ | Buy | 127,745,000 | 2,632,289 | 7/12/11 | 223,592 | — | |||||||||||||||||||||||||
Indian Rupee | DBAB | Buy | 40,128,000 | 829,948 | 7/12/11 | 67,158 | — | |||||||||||||||||||||||||
Malaysian Ringgit | DBAB | Buy | 18,006,622 | 5,559,659 | 7/12/11 | 398,222 | — | |||||||||||||||||||||||||
Malaysian Ringgit | DBAB | Buy | 13,610,000 | 4,207,760 | 7/13/11 | 295,053 | — | |||||||||||||||||||||||||
Indian Rupee | CITI | Buy | 19,711,000 | 408,349 | 7/18/11 | 31,818 | — | |||||||||||||||||||||||||
Malaysian Ringgit | DBAB | Buy | 11,455,000 | 2,778,014 | EUR | 7/18/11 | — | (238,133 | ) | |||||||||||||||||||||||
Malaysian Ringgit | DBAB | Buy | 2,637,000 | 813,763 | 7/18/11 | 58,338 | — | |||||||||||||||||||||||||
Indian Rupee | JPHQ | Buy | 19,711,000 | 407,673 | 7/20/11 | 32,329 | — | |||||||||||||||||||||||||
Malaysian Ringgit | DBAB | Buy | 12,933,000 | 3,082,647 | EUR | 7/20/11 | — | (191,288 | ) | |||||||||||||||||||||||
Malaysian Ringgit | DBAB | Buy | 4,160,000 | 1,279,252 | 7/20/11 | 96,318 | — | |||||||||||||||||||||||||
Malaysian Ringgit | DBAB | Buy | 16,628,000 | 3,962,661 | EUR | 7/25/11 | — | (246,243 | ) | |||||||||||||||||||||||
Malaysian Ringgit | DBAB | Buy | 5,058,000 | 1,555,111 | 7/25/11 | 116,747 | — | |||||||||||||||||||||||||
Malaysian Ringgit | JPHQ | Buy | 16,628,000 | 3,979,799 | EUR | 7/27/11 | — | (271,608 | ) | |||||||||||||||||||||||
Malaysian Ringgit | JPHQ | Buy | 5,318,000 | 1,638,526 | 7/27/11 | 119,000 | — | |||||||||||||||||||||||||
Malaysian Ringgit | HSBC | Buy | 3,005,000 | 926,268 | 7/29/11 | 66,688 | — | |||||||||||||||||||||||||
Malaysian Ringgit | HSBC | Buy | 6,100,000 | 1,897,297 | 8/08/11 | 116,772 | — | |||||||||||||||||||||||||
Malaysian Ringgit | JPHQ | Buy | 1,100,000 | 341,827 | 8/09/11 | 21,337 | — | |||||||||||||||||||||||||
South Korean Won | HSBC | Buy | 21,363,430,000 | 19,122,297 | 8/09/11 | 847,880 | — | |||||||||||||||||||||||||
Polish Zloty | DBAB | Buy | 59,155,000 | 14,545,119 | EUR | 8/12/11 | 403,203 | — | ||||||||||||||||||||||||
New Zealand Dollar | HSBC | Sell | 2,945,715 | 2,217,269 | 8/15/11 | — | (214,954 | ) | ||||||||||||||||||||||||
New Zealand Dollar | HSBC | Buy | 2,945,715 | 2,325,348 | 8/15/11 | 106,876 | — | |||||||||||||||||||||||||
Japanese Yen | UBSW | Sell | 758,781,000 | 8,929,251 | 8/18/11 | — | (498,508 | ) | ||||||||||||||||||||||||
Japanese Yen | DBAB | Sell | 461,885,000 | 5,435,540 | 8/18/11 | — | (303,324 | ) | ||||||||||||||||||||||||
Japanese Yen | JPHQ | Sell | 377,047,000 | 4,414,037 | 8/18/11 | — | (270,726 | ) | ||||||||||||||||||||||||
Japanese Yen | HSBC | Sell | 375,298,000 | 4,415,946 | 8/19/11 | — | (247,113 | ) | ||||||||||||||||||||||||
Euro | UBSW | Sell | 6,270,000 | 8,074,004 | 8/22/11 | — | (1,004,168 | ) | ||||||||||||||||||||||||
Euro | UBSW | Buy | 6,270,000 | 8,938,199 | 8/22/11 | 139,974 | — | |||||||||||||||||||||||||
Japanese Yen | BZWS | Sell | 376,247,000 | 4,429,249 | 8/22/11 | — | (245,686 | ) | ||||||||||||||||||||||||
Japanese Yen | DBAB | Sell | 376,727,000 | 4,440,441 | 8/22/11 | — | (240,458 | ) | ||||||||||||||||||||||||
Japanese Yen | MSCO | Sell | 300,000,000 | 3,531,739 | 8/22/11 | — | (195,814 | ) | ||||||||||||||||||||||||
Euro | UBSW | Sell | 6,274,000 | 8,065,980 | 8/23/11 | — | (1,017,696 | ) | ||||||||||||||||||||||||
Euro | UBSW | Buy | 6,274,000 | 8,943,587 | 8/23/11 | 140,089 | — | |||||||||||||||||||||||||
Japanese Yen | FBCO | Sell | 746,218,000 | 8,779,035 | 8/23/11 | — | (492,911 | ) | ||||||||||||||||||||||||
Japanese Yen | CITI | Sell | 751,731,000 | 8,864,439 | 8/23/11 | — | (476,008 | ) | ||||||||||||||||||||||||
Japanese Yen | DBAB | Sell | 371,821,000 | 4,391,829 | 8/23/11 | — | (228,141 | ) | ||||||||||||||||||||||||
Indian Rupee | HSBC | Buy | 143,891,000 | 2,979,171 | 8/24/11 | 211,095 | — | |||||||||||||||||||||||||
Indian Rupee | DBAB | Buy | 124,700,000 | 2,577,511 | 8/24/11 | 187,264 | — | |||||||||||||||||||||||||
Japanese Yen | JPHQ | Sell | 750,133,000 | 8,840,695 | 8/24/11 | — | (479,952 | ) | ||||||||||||||||||||||||
Japanese Yen | BZWS | Sell | 747,636,000 | 8,833,546 | 8/24/11 | — | (456,075 | ) | ||||||||||||||||||||||||
Euro | BZWS | Sell | 7,656,600 | 9,689,427 | 8/25/11 | — | (1,395,315 | ) | ||||||||||||||||||||||||
Japanese Yen | DBAB | Sell | 685,950,000 | 8,081,836 | 8/25/11 | — | (441,368 | ) | ||||||||||||||||||||||||
Japanese Yen | BZWS | Sell | 337,439,000 | 3,976,420 | 8/25/11 | — | (216,395 | ) | ||||||||||||||||||||||||
United States Dollar | CITI | Buy | 7,760,297 | 6,137,727 | EUR | 8/25/11 | — | (1,125,517 | ) | |||||||||||||||||||||||
Euro | UBSW | Sell | 9,307,428 | 11,777,806 | 8/26/11 | — | (1,696,475 | ) | ||||||||||||||||||||||||
Euro | HSBC | Sell | 8,279,000 | 10,443,296 | 8/26/11 | — | (1,542,138 | ) | ||||||||||||||||||||||||
Euro | UBSW | Buy | 9,307,428 | 13,266,808 | 8/26/11 | 207,472 | — | |||||||||||||||||||||||||
Japanese Yen | HSBC | Sell | 2,493,199,000 | 29,825,345 | 8/26/11 | — | (1,153,841 | ) | ||||||||||||||||||||||||
Japanese Yen | UBSW | Sell | 937,086,000 | 11,163,361 | 8/26/11 | — | (480,379 | ) | ||||||||||||||||||||||||
Japanese Yen | JPHQ | Sell | 751,903,000 | 8,880,234 | 8/26/11 | — | (462,519 | ) | ||||||||||||||||||||||||
Swedish Krona | UBSW | Buy | 30,000,000 | 3,154,541 | EUR | 8/26/11 | 159,389 | — | ||||||||||||||||||||||||
TGB-19
Franklin Templeton Variable Insurance Products Trust
Statement of Investments, June 30, 2011 (unaudited) (continued)
| Templeton Global Bond Securities Fund |
Forward Exchange Contracts (continued)
| Currency | Counterparty | Type | Quantity | Contract Amount* | Settlement Date | Unrealized Appreciation | Unrealized Depreciation | |||||||||||||||||||||||||
United States Dollar | UBSW | Buy | 16,993,151 | 13,425,892 | EUR | 8/26/11 | $ | — | $ | (2,443,392 | ) | |||||||||||||||||||||
United States Dollar | HSBC | Buy | 14,772,566 | 11,710,875 | EUR | 8/26/11 | — | (2,181,163 | ) | |||||||||||||||||||||||
United States Dollar | JPHQ | Buy | 11,099,031 | 8,794,794 | EUR | 8/26/11 | — | (1,633,115 | ) | |||||||||||||||||||||||
Euro | JPHQ | Sell | 4,095,317 | 5,170,338 | 8/29/11 | — | (757,853 | ) | ||||||||||||||||||||||||
Euro | JPHQ | Sell | 2,095,000 | 2,647,452 | 8/29/11 | — | (385,173 | ) | ||||||||||||||||||||||||
Malaysian Ringgit | JPHQ | Buy | 8,340,000 | 2,611,555 | 8/29/11 | 137,564 | — | |||||||||||||||||||||||||
Japanese Yen | BZWS | Sell | 890,300,000 | 10,574,388 | 8/30/11 | — | (488,290 | ) | ||||||||||||||||||||||||
Indian Rupee | DBAB | Buy | 88,183,000 | 1,811,855 | 9/01/11 | 140,338 | — | |||||||||||||||||||||||||
Japanese Yen | JPHQ | Sell | 372,662,000 | 4,392,527 | 9/01/11 | — | (238,155 | ) | ||||||||||||||||||||||||
Indian Rupee | DBAB | Buy | 25,000,000 | 511,876 | 9/27/11 | 39,063 | — | |||||||||||||||||||||||||
Japanese Yen | JPHQ | Sell | 172,207,000 | 2,055,712 | 9/30/11 | — | (84,564 | ) | ||||||||||||||||||||||||
Philippine Peso | HSBC | Buy | 49,600,000 | 1,097,709 | 9/30/11 | 37,262 | — | |||||||||||||||||||||||||
Philippine Peso | HSBC | Buy | 39,700,000 | 878,562 | 10/03/11 | 29,669 | — | |||||||||||||||||||||||||
Philippine Peso | HSBC | Buy | 156,866,000 | 3,480,806 | 10/04/11 | 107,601 | — | |||||||||||||||||||||||||
Philippine Peso | DBAB | Buy | 195,560,000 | 4,346,164 | 10/04/11 | 127,392 | — | |||||||||||||||||||||||||
Euro | UBSW | Sell | 6,370,000 | 8,714,670 | 10/05/11 | — | (496,604 | ) | ||||||||||||||||||||||||
Philippine Peso | HSBC | Buy | 233,867,000 | 5,225,144 | 10/05/11 | 124,307 | — | |||||||||||||||||||||||||
Philippine Peso | DBAB | Buy | 233,811,000 | 5,220,977 | 10/05/11 | 127,193 | — | |||||||||||||||||||||||||
Philippine Peso | JPHQ | Buy | 61,767,000 | 1,379,836 | 10/06/11 | 32,910 | — | |||||||||||||||||||||||||
Philippine Peso | DBAB | Buy | 191,936,000 | 4,314,526 | 10/07/11 | 75,141 | — | |||||||||||||||||||||||||
Philippine Peso | JPHQ | Buy | 76,627,000 | 1,729,768 | 10/11/11 | 22,202 | — | |||||||||||||||||||||||||
Philippine Peso | DBAB | Buy | 153,588,000 | 3,468,642 | 10/11/11 | 42,935 | — | |||||||||||||||||||||||||
Philippine Peso | CITI | Buy | 76,826,000 | 1,737,044 | 10/11/11 | 19,476 | — | |||||||||||||||||||||||||
Philippine Peso | HSBC | Buy | 153,878,000 | 3,469,706 | 10/11/11 | 48,502 | — | |||||||||||||||||||||||||
Malaysian Ringgit | DBAB | Buy | 11,434,805 | 3,645,721 | 10/12/11 | 111,926 | — | |||||||||||||||||||||||||
Philippine Peso | DBAB | Buy | 45,732,000 | 1,037,807 | 10/12/11 | 7,714 | — | |||||||||||||||||||||||||
Malaysian Ringgit | DBAB | Buy | 4,934,783 | 1,573,040 | 10/13/11 | 48,488 | — | |||||||||||||||||||||||||
Philippine Peso | HSBC | Buy | 76,252,000 | 1,717,581 | 10/13/11 | 25,554 | — | |||||||||||||||||||||||||
Philippine Peso | JPHQ | Buy | 194,374,000 | 4,386,190 | 10/13/11 | 57,237 | — | |||||||||||||||||||||||||
Euro | HSBC | Sell | 3,762,000 | 5,229,932 | 10/17/11 | — | (207,973 | ) | ||||||||||||||||||||||||
Philippine Peso | JPHQ | Buy | 108,152,000 | 2,463,767 | 10/17/11 | 7,867 | — | |||||||||||||||||||||||||
Euro | HSBC | Sell | 3,753,000 | 5,264,333 | 10/18/11 | — | (160,389 | ) | ||||||||||||||||||||||||
Norwegian Krone | BZWS | Buy | 30,824,000 | 3,765,775 | EUR | 10/18/11 | 229,421 | — | ||||||||||||||||||||||||
Euro | HSBC | Sell | 5,054,000 | 7,058,416 | 10/19/11 | — | (246,584 | ) | ||||||||||||||||||||||||
Norwegian Krone | BZWS | Buy | 30,949,000 | 3,765,727 | EUR | 10/19/11 | 252,258 | — | ||||||||||||||||||||||||
Philippine Peso | HSBC | Buy | 154,149,000 | 3,493,699 | 10/19/11 | 28,593 | — | |||||||||||||||||||||||||
Philippine Peso | DBAB | Buy | 41,880,000 | 950,954 | 10/19/11 | 6,001 | — | |||||||||||||||||||||||||
Philippine Peso | JPHQ | Buy | 84,061,000 | 1,894,460 | 10/21/11 | 26,039 | — | |||||||||||||||||||||||||
Philippine Peso | DBAB | Buy | 167,411,000 | 3,771,877 | 10/21/11 | 52,877 | — | |||||||||||||||||||||||||
Chilean Peso | CITI | Buy | 921,291,798 | 1,849,984 | 10/25/11 | 93,014 | — | |||||||||||||||||||||||||
Indian Rupee | DBAB | Buy | 208,500,000 | 4,488,698 | 10/26/11 | 82,925 | — | |||||||||||||||||||||||||
Indian Rupee | HSBC | Buy | 213,392,000 | 4,601,941 | 10/26/11 | 76,944 | — | |||||||||||||||||||||||||
Philippine Peso | HSBC | Buy | 154,149,000 | 3,489,745 | 10/26/11 | 30,702 | — | |||||||||||||||||||||||||
Philippine Peso | DBAB | Buy | 165,158,000 | 3,744,145 | 10/26/11 | 27,724 | — | |||||||||||||||||||||||||
Philippine Peso | JPHQ | Buy | 82,631,000 | 1,873,634 | 10/26/11 | 13,488 | — | |||||||||||||||||||||||||
Indian Rupee | DBAB | Buy | 440,314,000 | 9,473,193 | 10/27/11 | 179,558 | — | |||||||||||||||||||||||||
Indian Rupee | HSBC | Buy | 317,880,000 | 6,876,055 | 10/27/11 | 92,646 | — | |||||||||||||||||||||||||
Norwegian Krone | BZWS | Buy | 61,766,000 | 7,531,521 | EUR | 10/27/11 | 476,346 | — | ||||||||||||||||||||||||
Philippine Peso | HSBC | Buy | 40,030,000 | 911,637 | 10/27/11 | 2,497 | — | |||||||||||||||||||||||||
Chilean Peso | BZWS | Buy | 199,342,000 | 393,568 | 10/28/11 | 26,704 | — | |||||||||||||||||||||||||
Chilean Peso | DBAB | Buy | 398,486,000 | 787,133 | 10/28/11 | 52,994 | — | |||||||||||||||||||||||||
Philippine Peso | DBAB | Buy | 146,355,000 | 3,332,312 | 10/28/11 | 9,635 | — | |||||||||||||||||||||||||
Philippine Peso | HSBC | Buy | 26,680,000 | 607,745 | 10/28/11 | 1,480 | — | |||||||||||||||||||||||||
TGB-20
Franklin Templeton Variable Insurance Products Trust
Statement of Investments, June 30, 2011 (unaudited) (continued)
| Templeton Global Bond Securities Fund |
Forward Exchange Contracts (continued)
| Currency | Counterparty | Type | Quantity | Contract Amount* | Settlement Date | Unrealized Appreciation | Unrealized Depreciation | |||||||||||||||||||||||||
Philippine Peso | HSBC | Buy | 52,110,000 | 1,185,126 | 10/31/11 | $ | 4,514 | $ | — | |||||||||||||||||||||||
Philippine Peso | DBAB | Buy | 26,150,000 | 607,843 | 11/04/11 | — | (11,033 | ) | ||||||||||||||||||||||||
Norwegian Krone | UBSW | Buy | 47,173,200 | 5,682,902 | EUR | 11/07/11 | 459,839 | — | ||||||||||||||||||||||||
Japanese Yen | CITI | Sell | 341,992,119 | 4,230,534 | 11/08/11 | — | (21,620 | ) | ||||||||||||||||||||||||
Japanese Yen | BZWS | Sell | 335,950,000 | 4,156,254 | 11/10/11 | — | (20,861 | ) | ||||||||||||||||||||||||
Japanese Yen | BZWS | Sell | 429,663,000 | 5,357,394 | 11/14/11 | 14,857 | — | |||||||||||||||||||||||||
Japanese Yen | UBSW | Sell | 340,600,700 | 4,246,521 | 11/14/11 | 11,407 | — | |||||||||||||||||||||||||
Philippine Peso | DBAB | Buy | 48,500,000 | 1,126,545 | 11/14/11 | — | (20,477 | ) | ||||||||||||||||||||||||
Japanese Yen | DBAB | Sell | 796,770,000 | 9,733,480 | 11/16/11 | — | (173,961 | ) | ||||||||||||||||||||||||
Japanese Yen | JPHQ | Sell | 397,873,000 | 4,862,190 | 11/16/11 | — | (85,164 | ) | ||||||||||||||||||||||||
Euro | UBSW | Sell | 4,794,427 | 6,494,531 | 11/17/11 | — | (428,839 | ) | ||||||||||||||||||||||||
Japanese Yen | BZWS | Sell | 986,239,000 | 11,990,310 | 11/17/11 | — | (273,210 | ) | ||||||||||||||||||||||||
Japanese Yen | UBSW | Sell | 317,836,000 | 3,860,044 | 11/17/11 | — | (92,130 | ) | ||||||||||||||||||||||||
Japanese Yen | HSBC | Sell | 207,909,000 | 2,515,231 | 11/17/11 | — | (70,041 | ) | ||||||||||||||||||||||||
Euro | DBAB | Sell | 933,877 | 1,259,295 | 11/18/11 | — | (89,222 | ) | ||||||||||||||||||||||||
Japanese Yen | BZWS | Sell | 1,107,834,000 | 13,360,275 | 11/21/11 | — | (415,801 | ) | ||||||||||||||||||||||||
Norwegian Krone | MSCO | Buy | 15,002,870 | 1,807,891 | EUR | 11/25/11 | 143,432 | — | ||||||||||||||||||||||||
Euro | DBAB | Sell | 1,300,570 | 1,737,236 | 11/28/11 | — | (140,183 | ) | ||||||||||||||||||||||||
Japanese Yen | BOFA | Sell | 859,147,000 | 10,376,172 | 11/28/11 | — | (308,214 | ) | ||||||||||||||||||||||||
Norwegian Krone | UBSW | Buy | 75,812,000 | 9,179,975 | EUR | 11/28/11 | 658,946 | — | ||||||||||||||||||||||||
Norwegian Krone | MSCO | Buy | 23,130,000 | 2,781,921 | EUR | 11/28/11 | 228,268 | — | ||||||||||||||||||||||||
Japanese Yen | BZWS | Sell | 1,251,786,000 | 15,116,363 | 11/29/11 | — | (451,056 | ) | ||||||||||||||||||||||||
Japanese Yen | CITI | Sell | 310,702,000 | 3,754,253 | 11/29/11 | — | (109,689 | ) | ||||||||||||||||||||||||
Japanese Yen | DBAB | Sell | 770,370,000 | 9,205,042 | 12/01/11 | — | (375,604 | ) | ||||||||||||||||||||||||
Norwegian Krone | UBSW | Buy | 23,030,000 | 2,791,515 | EUR | 12/01/11 | 195,542 | — | ||||||||||||||||||||||||
Euro | DBAB | Sell | 5,440,000 | 7,078,800 | 12/02/11 | — | (773,029 | ) | ||||||||||||||||||||||||
Euro | HSBC | Sell | 2,155,292 | 2,824,079 | 12/06/11 | — | (286,365 | ) | ||||||||||||||||||||||||
Euro | UBSW | Sell | 1,343,551 | 1,789,315 | 12/07/11 | — | (149,590 | ) | ||||||||||||||||||||||||
Euro | BZWS | Sell | 5,095,000 | 6,732,533 | 12/12/11 | — | (618,983 | ) | ||||||||||||||||||||||||
Malaysian Ringgit | JPHQ | Buy | 13,361,013 | 4,220,289 | 12/16/11 | 150,165 | — | |||||||||||||||||||||||||
Japanese Yen | CITI | Sell | 286,112,008 | 3,445,887 | 12/28/11 | — | (113,323 | ) | ||||||||||||||||||||||||
Japanese Yen | BZWS | Sell | 285,057,504 | 3,434,883 | 12/28/11 | — | (111,209 | ) | ||||||||||||||||||||||||
Japanese Yen | JPHQ | Sell | 285,510,329 | 3,463,124 | 12/28/11 | — | (88,602 | ) | ||||||||||||||||||||||||
Swedish Krona | DBAB | Buy | 136,332,733 | 15,020,408 | EUR | 1/05/12 | — | (346,212 | ) | |||||||||||||||||||||||
Euro | CITI | Sell | 5,040,000 | 6,519,290 | 1/10/12 | — | (745,917 | ) | ||||||||||||||||||||||||
Japanese Yen | BZWS | Sell | 277,330,000 | 3,353,446 | 1/10/12 | — | (97,146 | ) | ||||||||||||||||||||||||
Japanese Yen | UBSW | Sell | 138,650,000 | 1,676,805 | 1/10/12 | — | (48,304 | ) | ||||||||||||||||||||||||
Japanese Yen | CITI | Sell | 138,680,000 | 1,677,960 | 1/10/12 | — | (47,523 | ) | ||||||||||||||||||||||||
Euro | UBSW | Sell | 13,846,000 | 17,922,609 | 1/11/12 | — | (2,035,853 | ) | ||||||||||||||||||||||||
Euro | DBAB | Sell | 9,460,000 | 12,259,119 | 1/11/12 | — | (1,377,097 | ) | ||||||||||||||||||||||||
Euro | BZWS | Sell | 1,726,000 | 2,233,444 | 1/11/12 | — | (254,517 | ) | ||||||||||||||||||||||||
Japanese Yen | DBAB | Sell | 139,110,000 | 1,682,491 | 1/12/12 | — | (48,391 | ) | ||||||||||||||||||||||||
Japanese Yen | HSBC | Sell | 139,250,000 | 1,687,572 | 1/12/12 | — | (45,051 | ) | ||||||||||||||||||||||||
Chilean Peso | MSCO | Buy | 2,254,600,000 | 4,442,999 | 1/13/12 | 270,034 | — | |||||||||||||||||||||||||
Euro | JPHQ | Sell | 937,000 | 1,211,775 | 1/13/12 | — | (138,782 | ) | ||||||||||||||||||||||||
Japanese Yen | BZWS | Sell | 394,150,000 | 4,771,792 | 1/13/12 | — | (132,503 | ) | ||||||||||||||||||||||||
Japanese Yen | HSBC | Sell | 397,130,000 | 4,811,539 | 1/13/12 | — | (129,835 | ) | ||||||||||||||||||||||||
Japanese Yen | UBSW | Sell | 313,510,000 | 3,797,176 | 1/13/12 | — | (103,739 | ) | ||||||||||||||||||||||||
Philippine Peso | JPHQ | Buy | 374,905,000 | 8,515,730 | 1/13/12 | — | (1,816 | ) | ||||||||||||||||||||||||
Philippine Peso | HSBC | Buy | 60,160,000 | 1,367,801 | 1/17/12 | — | (1,920 | ) | ||||||||||||||||||||||||
Euro | DBAB | Sell | 4,856,000 | 6,438,109 | 1/18/12 | — | (559,960 | ) | ||||||||||||||||||||||||
Philippine Peso | DBAB | Buy | 66,125,000 | 1,484,121 | 1/18/12 | 17,101 | — | |||||||||||||||||||||||||
Philippine Peso | HSBC | Buy | 115,942,000 | 2,602,806 | 1/18/12 | 29,401 | — | |||||||||||||||||||||||||
Philippine Peso | DBAB | Buy | 41,372,000 | 931,592 | 1/19/12 | 7,612 | — | |||||||||||||||||||||||||
Philippine Peso | JPHQ | Buy | 165,119,000 | 3,670,535 | 1/19/12 | 77,906 | — | |||||||||||||||||||||||||
British Pound | BZWS | Buy | 906,238 | 1,435,872 | 1/24/12 | 14,768 | — | |||||||||||||||||||||||||
TGB-21
Franklin Templeton Variable Insurance Products Trust
Statement of Investments, June 30, 2011 (unaudited) (continued)
| Templeton Global Bond Securities Fund |
Forward Exchange Contracts (continued)
| Currency | Counterparty | Type | Quantity | Contract Amount* | Settlement Date | Unrealized Appreciation | Unrealized Depreciation | |||||||||||||||||||||||||
British Pound | DBAB | Buy | 903,679 | 1,430,452 | 1/24/12 | $ | 16,092 | $ | — | |||||||||||||||||||||||
British Pound | CITI | Buy | 603,463 | 953,634 | 1/24/12 | 12,345 | — | |||||||||||||||||||||||||
British Pound | DBAB | Buy | 474,519 | 755,031 | 1/26/12 | 4,523 | — | |||||||||||||||||||||||||
Japanese Yen | BZWS | Sell | 1,079,470,000 | 13,122,660 | 1/26/12 | — | (311,326 | ) | ||||||||||||||||||||||||
Japanese Yen | UBSW | Sell | 944,420,000 | 11,488,596 | 1/26/12 | — | (264,695 | ) | ||||||||||||||||||||||||
Japanese Yen | DBAB | Sell | 897,860,782 | 10,935,263 | 1/26/12 | — | (238,599 | ) | ||||||||||||||||||||||||
Philippine Peso | HSBC | Buy | 154,149,000 | 3,423,251 | 1/26/12 | 74,703 | — | |||||||||||||||||||||||||
British Pound | MSCO | Buy | 358,395 | 564,198 | 1/27/12 | 9,471 | — | |||||||||||||||||||||||||
British Pound | JPHQ | Buy | 119,423 | 190,002 | 1/27/12 | 1,154 | — | |||||||||||||||||||||||||
British Pound | BZWS | Buy | 601,378 | 945,862 | 1/27/12 | 16,740 | — | |||||||||||||||||||||||||
Chilean Peso | DBAB | Buy | 2,227,910,000 | 4,404,290 | 1/27/12 | 245,542 | — | |||||||||||||||||||||||||
Euro | CITI | Sell | 4,998,400 | 6,758,487 | 1/27/12 | — | (442,597 | ) | ||||||||||||||||||||||||
Japanese Yen | HSBC | Sell | 1,162,462,488 | 14,183,290 | 1/27/12 | — | (283,738 | ) | ||||||||||||||||||||||||
British Pound | JPHQ | Buy | 237,230 | 373,367 | 1/30/12 | 6,342 | — | |||||||||||||||||||||||||
Chilean Peso | DBAB | Buy | 5,127,860,000 | 10,218,932 | 1/30/12 | 479,687 | — | |||||||||||||||||||||||||
Chilean Peso | JPHQ | Buy | 675,370,000 | 1,337,102 | 1/30/12 | 71,971 | — | |||||||||||||||||||||||||
British Pound | MSCO | Buy | 116,956 | 185,153 | 1/31/12 | 2,043 | — | |||||||||||||||||||||||||
Chilean Peso | DBAB | Buy | 3,093,470,000 | 6,161,677 | 1/31/12 | 291,716 | — | |||||||||||||||||||||||||
Euro | DBAB | Sell | 31,205,000 | 42,438,800 | 1/31/12 | — | (2,511,449 | ) | ||||||||||||||||||||||||
British Pound | CITI | Buy | 391,619 | 619,451 | 2/01/12 | 7,355 | — | |||||||||||||||||||||||||
British Pound | MSCO | Buy | 450,886 | 710,738 | 2/01/12 | 10,927 | — | |||||||||||||||||||||||||
British Pound | BZWS | Buy | 48,594 | 76,617 | 2/01/12 | 1,160 | — | |||||||||||||||||||||||||
Euro | UBSW | Sell | 5,540,000 | 7,543,763 | 2/01/12 | — | (436,238 | ) | ||||||||||||||||||||||||
Philippine Peso | HSBC | Buy | 99,500,000 | 2,237,354 | 2/03/12 | 19,433 | — | |||||||||||||||||||||||||
Philippine Peso | DBAB | Buy | 155,800,000 | 3,505,772 | 2/03/12 | 27,972 | — | |||||||||||||||||||||||||
Indian Rupee | JPHQ | Buy | 21,500,000 | 445,873 | 2/06/12 | 17,790 | — | |||||||||||||||||||||||||
Philippine Peso | HSBC | Buy | 84,800,000 | 1,916,384 | 2/06/12 | 6,647 | — | |||||||||||||||||||||||||
Philippine Peso | JPHQ | Buy | 60,500,000 | 1,362,613 | 2/07/12 | 9,280 | — | |||||||||||||||||||||||||
Singapore Dollar | DBAB | Buy | 6,207,000 | 4,860,459 | 2/07/12 | 196,972 | — | |||||||||||||||||||||||||
Singapore Dollar | HSBC | Buy | 6,206,000 | 4,860,284 | 2/07/12 | 196,331 | — | |||||||||||||||||||||||||
Australian Dollar | UBSW | Buy | 10,557,970 | 10,238,591 | 2/08/12 | 766,009 | — | |||||||||||||||||||||||||
Australian Dollar | MSCO | Buy | 10,560,886 | 10,268,877 | 2/08/12 | 738,762 | — | |||||||||||||||||||||||||
Euro | CITI | Sell | 6,572,000 | 8,878,181 | 2/08/12 | — | (586,100 | ) | ||||||||||||||||||||||||
Euro | UBSW | Sell | 4,929,000 | 6,676,084 | 2/08/12 | — | (422,126 | ) | ||||||||||||||||||||||||
Euro | HSBC | Sell | 1,200,000 | 1,621,680 | 2/08/12 | — | (106,430 | ) | ||||||||||||||||||||||||
Norwegian Krone | UBSW | Buy | 72,121,400 | 9,100,722 | EUR | 2/08/12 | 55,835 | — | ||||||||||||||||||||||||
Singapore Dollar | DBAB | Buy | 12,363,000 | 9,721,129 | 2/08/12 | 352,238 | — | |||||||||||||||||||||||||
Australian Dollar | BZWS | Buy | 3,351,000 | 265,734,300 | JPY | 2/09/12 | 184,611 | — | ||||||||||||||||||||||||
Australian Dollar | CITI | Buy | 3,351,000 | 265,901,850 | JPY | 2/09/12 | 182,525 | — | ||||||||||||||||||||||||
Australian Dollar | DBAB | Buy | 3,351,000 | 265,995,678 | JPY | 2/09/12 | 181,357 | — | ||||||||||||||||||||||||
Euro | BZWS | Sell | 800,000 | 1,078,400 | 2/09/12 | — | (73,634 | ) | ||||||||||||||||||||||||
Euro | HSBC | Sell | 600,000 | 806,880 | 2/09/12 | — | (57,146 | ) | ||||||||||||||||||||||||
Euro | JPHQ | Sell | 300,000 | 405,840 | 2/09/12 | — | (26,173 | ) | ||||||||||||||||||||||||
Euro | DBAB | Sell | 180,000 | 242,431 | 2/09/12 | — | (16,776 | ) | ||||||||||||||||||||||||
Norwegian Krone | UBSW | Buy | 100,802,700 | 12,673,686 | EUR | 2/09/12 | 143,790 | — | ||||||||||||||||||||||||
Norwegian Krone | DBAB | Buy | 144,025,000 | 18,112,935 | EUR | 2/09/12 | 198,229 | — | ||||||||||||||||||||||||
Polish Zloty | DBAB | Buy | 17,528,000 | 4,407,896 | EUR | 2/09/12 | — | (93,595 | ) | |||||||||||||||||||||||
Singapore Dollar | BZWS | Buy | 1,717,028 | 1,347,894 | 2/09/12 | 51,148 | — | |||||||||||||||||||||||||
Chilean Peso | DBAB | Buy | 1,145,000,000 | 2,326,290 | 2/10/12 | 59,624 | — | |||||||||||||||||||||||||
Euro | BZWS | Sell | 612,000 | 829,872 | 2/10/12 | — | (51,404 | ) | ||||||||||||||||||||||||
Japanese Yen | HSBC | Sell | 413,563,000 | 5,052,077 | 2/10/12 | — | (95,791 | ) | ||||||||||||||||||||||||
Japanese Yen | MSCO | Sell | 394,373,000 | 4,826,319 | 2/10/12 | — | (82,680 | ) | ||||||||||||||||||||||||
Polish Zloty | BZWS | Buy | 17,528,000 | 4,405,238 | EUR | 2/10/12 | — | (90,106 | ) | |||||||||||||||||||||||
Chilean Peso | DBAB | Buy | 1,058,220,000 | 2,149,980 | 2/13/12 | 54,354 | — | |||||||||||||||||||||||||
TGB-22
Franklin Templeton Variable Insurance Products Trust
Statement of Investments, June 30, 2011 (unaudited) (continued)
| Templeton Global Bond Securities Fund |
Forward Exchange Contracts (continued)
| Currency | Counterparty | Type | Quantity | Contract Amount* | Settlement Date | Unrealized Appreciation | Unrealized Depreciation | |||||||||||||||||||||||||
Chilean Peso | BZWS | Buy | 1,142,900,000 | 2,319,196 | 2/13/12 | $ | 61,531 | $ | — | |||||||||||||||||||||||
Euro | UBSW | Sell | 657,000 | 892,055 | 2/13/12 | — | (53,925 | ) | ||||||||||||||||||||||||
Singapore Dollar | HSBC | Buy | 6,117,200 | 4,803,595 | 2/13/12 | 180,846 | — | |||||||||||||||||||||||||
British Pound | BZWS | Buy | 2,562,230 | 4,082,606 | 2/14/12 | 17,637 | — | |||||||||||||||||||||||||
Chilean Peso | DBAB | Buy | 1,130,600,000 | 2,305,465 | 2/14/12 | 49,374 | — | |||||||||||||||||||||||||
Chilean Peso | MSCO | Buy | 1,963,430,000 | 4,038,733 | 2/14/12 | 50,743 | — | |||||||||||||||||||||||||
Malaysian Ringgit | DBAB | Buy | 97,443,480 | 31,603,632 | 2/14/12 | 148,378 | — | |||||||||||||||||||||||||
Polish Zloty | DBAB | Buy | 17,528,000 | 4,365,194 | EUR | 2/14/12 | — | (33,811 | ) | |||||||||||||||||||||||
Singapore Dollar | HSBC | Buy | 4,404,400 | 3,458,582 | 2/14/12 | 130,251 | — | |||||||||||||||||||||||||
Japanese Yen | JPHQ | Sell | 144,920,000 | 1,765,595 | 2/15/12 | — | (38,439 | ) | ||||||||||||||||||||||||
Japanese Yen | DBAB | Sell | 123,057,280 | 1,497,958 | 2/15/12 | — | (33,917 | ) | ||||||||||||||||||||||||
Chilean Peso | MSCO | Buy | 3,554,470,000 | 7,382,077 | 2/16/12 | 19,574 | — | |||||||||||||||||||||||||
Euro | JPHQ | Sell | 1,971,000 | 2,636,410 | 2/16/12 | — | (201,240 | ) | ||||||||||||||||||||||||
Euro | UBSW | Sell | 1,971,000 | 2,637,533 | 2/16/12 | — | (200,117 | ) | ||||||||||||||||||||||||
Euro | DBAB | Sell | 2,038,000 | 2,734,629 | 2/17/12 | — | (199,381 | ) | ||||||||||||||||||||||||
Malaysian Ringgit | HSBC | Buy | 4,899,000 | 1,582,569 | 2/17/12 | 13,474 | — | |||||||||||||||||||||||||
Singapore Dollar | DBAB | Buy | 7,334,000 | 5,736,544 | 2/17/12 | 239,518 | — | |||||||||||||||||||||||||
Singapore Dollar | HSBC | Buy | 7,334,000 | 5,736,724 | 2/17/12 | 239,338 | — | |||||||||||||||||||||||||
Singapore Dollar | BZWS | Buy | 4,886,000 | 3,824,209 | 2/17/12 | 157,117 | — | |||||||||||||||||||||||||
Chilean Peso | DBAB | Buy | 1,455,470,000 | 3,009,657 | 2/21/12 | 19,424 | — | |||||||||||||||||||||||||
Chilean Peso | JPHQ | Buy | 1,055,800,000 | 2,167,411 | 2/21/12 | 29,889 | — | |||||||||||||||||||||||||
Euro | UBSW | Sell | 2,038,000 | 2,728,495 | 2/21/12 | — | (205,118 | ) | ||||||||||||||||||||||||
Chilean Peso | JPHQ | Buy | 1,792,000,000 | 3,719,772 | 2/22/12 | 9,263 | — | |||||||||||||||||||||||||
Japanese Yen | HSBC | Sell | 385,460,000 | 4,651,662 | 2/22/12 | — | (147,199 | ) | ||||||||||||||||||||||||
Chilean Peso | DBAB | Buy | 1,435,490,000 | 2,965,643 | 2/23/12 | 21,179 | — | |||||||||||||||||||||||||
Japanese Yen | JPHQ | Sell | 385,700,000 | 4,652,313 | 2/23/12 | — | (149,604 | ) | ||||||||||||||||||||||||
Singapore Dollar | DBAB | Buy | 9,547,000 | 7,468,688 | 2/24/12 | 310,949 | — | |||||||||||||||||||||||||
Chilean Peso | DBAB | Buy | 2,094,920,000 | 4,297,757 | 2/27/12 | 59,167 | — | |||||||||||||||||||||||||
Chilean Peso | CITI | Buy | 2,285,090,000 | 4,709,098 | 2/27/12 | 43,332 | — | |||||||||||||||||||||||||
Chilean Peso | MSCO | Buy | 2,254,540,000 | 4,646,859 | 2/27/12 | 42,034 | — | |||||||||||||||||||||||||
Euro | DBAB | Sell | 5,346,000 | 7,284,299 | 2/27/12 | — | (409,470 | ) | ||||||||||||||||||||||||
Singapore Dollar | DBAB | Buy | 5,952,000 | 4,667,869 | 2/27/12 | 182,370 | — | |||||||||||||||||||||||||
Chilean Peso | JPHQ | Buy | 593,800,000 | 1,223,069 | 2/28/12 | 11,751 | — | |||||||||||||||||||||||||
Chilean Peso | MSCO | Buy | 1,559,200,000 | 3,181,392 | 2/28/12 | 60,997 | — | |||||||||||||||||||||||||
Chilean Peso | DBAB | Buy | 790,050,000 | 1,632,200 | 2/29/12 | 10,540 | — | |||||||||||||||||||||||||
Chilean Peso | BZWS | Buy | 2,006,200,000 | 4,086,779 | 2/29/12 | 84,683 | — | |||||||||||||||||||||||||
Euro | DBAB | Sell | 3,252,140 | 4,444,049 | 2/29/12 | — | (235,996 | ) | ||||||||||||||||||||||||
Singapore Dollar | DBAB | Buy | 5,960,000 | 4,668,212 | 2/29/12 | 188,604 | — | |||||||||||||||||||||||||
Chilean Peso | BZWS | Buy | 1,004,500,000 | 2,043,328 | 3/01/12 | 45,078 | — | |||||||||||||||||||||||||
Chilean Peso | DBAB | Buy | 1,253,970,000 | 2,553,390 | 3/01/12 | 53,676 | — | |||||||||||||||||||||||||
Euro | DBAB | Sell | 1,530,900 | 2,087,306 | 3/01/12 | — | (115,686 | ) | ||||||||||||||||||||||||
Japanese Yen | UBSW | Sell | 447,200,000 | 5,501,021 | 3/01/12 | — | (67,111 | ) | ||||||||||||||||||||||||
Japanese Yen | JPHQ | Sell | 401,100,000 | 4,934,793 | 3/01/12 | — | (59,343 | ) | ||||||||||||||||||||||||
Japanese Yen | HSBC | Sell | 400,800,000 | 4,932,923 | 3/01/12 | — | (57,477 | ) | ||||||||||||||||||||||||
Chilean Peso | DBAB | Buy | 1,253,970,000 | 2,553,390 | 3/02/12 | 53,381 | — | |||||||||||||||||||||||||
Chilean Peso | DBAB | Buy | 1,328,230,000 | 2,706,255 | 3/05/12 | 53,952 | — | |||||||||||||||||||||||||
Euro | DBAB | Sell | 1,536,000 | 2,099,251 | 3/05/12 | — | (110,780 | ) | ||||||||||||||||||||||||
Chilean Peso | DBAB | Buy | 1,320,220,000 | 2,682,556 | 3/07/12 | 60,385 | — | |||||||||||||||||||||||||
Euro | UBSW | Sell | 6,915,000 | 9,567,248 | 3/08/12 | — | (381,197 | ) | ||||||||||||||||||||||||
Euro | MSCO | Sell | 5,225,000 | 7,228,526 | 3/08/12 | — | (288,556 | ) | ||||||||||||||||||||||||
Euro | HSBC | Sell | 1,844,000 | 2,548,408 | 3/08/12 | — | (104,511 | ) | ||||||||||||||||||||||||
Chilean Peso | DBAB | Buy | 1,284,460,000 | 2,629,396 | 3/09/12 | 38,645 | — | |||||||||||||||||||||||||
TGB-23
Franklin Templeton Variable Insurance Products Trust
Statement of Investments, June 30, 2011 (unaudited) (continued)
| Templeton Global Bond Securities Fund |
Forward Exchange Contracts (continued)
| Currency | Counterparty | Type | Quantity | Contract Amount* | Settlement Date | Unrealized Appreciation | Unrealized Depreciation | |||||||||||||||||||||||||
Chilean Peso | MSCO | Buy | 662,100,000 | 1,346,279 | 3/12/12 | $ | 28,548 | $ | — | |||||||||||||||||||||||
Chilean Peso | DBAB | Buy | 2,600,220,000 | 5,301,695 | 3/15/12 | 95,740 | — | |||||||||||||||||||||||||
Australian Dollar | CITI | Buy | 16,742,000 | 15,737,313 | 3/19/12 | 1,626,031 | — | |||||||||||||||||||||||||
Japanese Yen | CITI | Sell | 407,702,000 | 5,074,644 | 3/19/12 | — | (2,977 | ) | ||||||||||||||||||||||||
Japanese Yen | MSCO | Sell | 244,700,000 | 3,044,896 | 3/19/12 | — | (2,659 | ) | ||||||||||||||||||||||||
Japanese Yen | UBSW | Sell | 330,530,000 | 4,114,396 | 3/19/12 | — | (2,106 | ) | ||||||||||||||||||||||||
Singapore Dollar | DBAB | Buy | 7,978,100 | 6,254,047 | 3/19/12 | 248,064 | — | |||||||||||||||||||||||||
Singapore Dollar | JPHQ | Buy | 11,426,000 | 8,934,240 | 3/19/12 | 377,892 | — | |||||||||||||||||||||||||
Singapore Dollar | HSBC | Buy | 9,120,000 | 7,147,559 | 3/19/12 | 285,194 | — | |||||||||||||||||||||||||
Australian Dollar | DBAB | Buy | 8,192,166 | 7,679,992 | 3/21/12 | 814,094 | — | |||||||||||||||||||||||||
Chilean Peso | JPHQ | Buy | 1,065,000,000 | 2,137,481 | 3/21/12 | 71,706 | — | |||||||||||||||||||||||||
Singapore Dollar | DBAB | Buy | 8,589,700 | 6,700,757 | 3/21/12 | 299,889 | — | |||||||||||||||||||||||||
Singapore Dollar | HSBC | Buy | 6,864,000 | 5,360,615 | 3/21/12 | 233,577 | — | |||||||||||||||||||||||||
Australian Dollar | DBAB | Buy | 537,776 | 503,606 | 3/22/12 | 53,920 | — | |||||||||||||||||||||||||
Japanese Yen | UBSW | Sell | 242,774,840 | 3,005,643 | 3/23/12 | — | (18,104 | ) | ||||||||||||||||||||||||
Euro | DBAB | Sell | 2,736,000 | 3,829,333 | 3/26/12 | — | (104,485 | ) | ||||||||||||||||||||||||
British Pound | MSCO | Buy | 2,852,773 | 4,545,238 | 3/29/12 | 17,152 | — | |||||||||||||||||||||||||
British Pound | DBAB | Buy | 2,853,149 | 4,545,238 | 3/29/12 | 17,753 | — | |||||||||||||||||||||||||
British Pound | BZWS | Buy | 5,722,896 | 9,090,477 | 3/30/12 | 61,902 | — | |||||||||||||||||||||||||
Chilean Peso | DBAB | Buy | 1,252,750,000 | 2,510,018 | 3/30/12 | 85,978 | — | |||||||||||||||||||||||||
New Israeli Shekel | MSCO | Buy | 9,296,110 | 2,596,996 | 3/30/12 | 100,186 | — | |||||||||||||||||||||||||
British Pound | FBCO | Buy | 3,431,879 | 5,454,285 | 4/02/12 | 33,904 | — | |||||||||||||||||||||||||
Chilean Peso | DBAB | Buy | 1,330,940,000 | 2,656,408 | 4/02/12 | 100,674 | — | |||||||||||||||||||||||||
Euro | DBAB | Sell | 3,712,000 | 5,214,432 | 4/04/12 | — | (121,000 | ) | ||||||||||||||||||||||||
Euro | DBAB | Sell | 2,488,000 | 3,482,304 | 4/05/12 | — | (93,690 | ) | ||||||||||||||||||||||||
Euro | HSBC | Sell | 8,692,000 | 12,212,434 | 4/10/12 | — | (278,369 | ) | ||||||||||||||||||||||||
Euro | DBAB | Sell | 7,243,000 | 10,201,041 | 4/10/12 | — | (207,482 | ) | ||||||||||||||||||||||||
Euro | UBSW | Sell | 4,346,000 | 6,102,436 | 4/10/12 | — | (142,966 | ) | ||||||||||||||||||||||||
Indian Rupee | DBAB | Buy | 159,915,000 | 3,413,340 | 4/11/12 | 5,233 | — | |||||||||||||||||||||||||
Euro | UBSW | Sell | 3,907,000 | 5,569,722 | 4/12/12 | — | (44,425 | ) | ||||||||||||||||||||||||
Indian Rupee | DBAB | Buy | 342,913,000 | 7,346,037 | 4/13/12 | — | (17,113 | ) | ||||||||||||||||||||||||
Chilean Peso | MSCO | Buy | 2,645,530,000 | 5,374,363 | 4/16/12 | 97,204 | — | |||||||||||||||||||||||||
Euro | HSBC | Sell | 6,919,000 | 9,915,481 | 4/16/12 | — | (25,357 | ) | ||||||||||||||||||||||||
Indian Rupee | JPHQ | Buy | 230,330,000 | 4,921,581 | 4/16/12 | — | (535 | ) | ||||||||||||||||||||||||
Indian Rupee | JPHQ | Buy | 226,092,000 | 4,802,294 | 4/18/12 | 27,101 | — | |||||||||||||||||||||||||
Indian Rupee | DBAB | Buy | 79,271,000 | 1,678,404 | 4/19/12 | 14,655 | — | |||||||||||||||||||||||||
Indian Rupee | JPHQ | Buy | 112,941,000 | 2,396,880 | 4/19/12 | 15,298 | — | |||||||||||||||||||||||||
Malaysian Ringgit | JPHQ | Buy | 4,069,213 | 1,329,330 | 4/19/12 | — | (8,965 | ) | ||||||||||||||||||||||||
Chilean Peso | MSCO | Buy | 2,370,410,000 | 4,788,707 | 4/20/12 | 111,619 | — | |||||||||||||||||||||||||
Japanese Yen | UBSW | Sell | 261,900,000 | 3,188,653 | 4/20/12 | — | (74,801 | ) | ||||||||||||||||||||||||
Japanese Yen | CITI | Sell | 261,800,000 | 3,189,299 | 4/20/12 | — | (72,909 | ) | ||||||||||||||||||||||||
Euro | DBAB | Sell | 4,545,000 | 6,425,948 | 4/23/12 | — | (102,462 | ) | ||||||||||||||||||||||||
Malaysian Ringgit | JPHQ | Buy | 11,659,000 | 3,812,498 | 4/23/12 | — | (30,472 | ) | ||||||||||||||||||||||||
Indian Rupee | DBAB | Buy | 160,601,000 | 3,410,512 | 4/26/12 | 16,835 | — | |||||||||||||||||||||||||
Chilean Peso | JPHQ | Buy | 1,501,938,000 | 3,045,910 | 4/27/12 | 56,563 | — | |||||||||||||||||||||||||
Indian Rupee | JPHQ | Buy | 136,582,000 | 2,896,755 | 4/27/12 | 17,675 | — | |||||||||||||||||||||||||
Chilean Peso | CITI | Buy | 2,420,966,000 | 4,976,292 | 4/30/12 | 22,864 | — | |||||||||||||||||||||||||
Indian Rupee | JPHQ | Buy | 113,782,000 | 2,415,754 | 4/30/12 | 11,330 | — | |||||||||||||||||||||||||
Indian Rupee | DBAB | Buy | 71,377,981 | 1,505,547 | 4/30/12 | 17,016 | — | |||||||||||||||||||||||||
Swedish Krona | BZWS | Buy | 122,773,200 | 13,607,901 | EUR | 4/30/12 | — | (485,468 | ) | |||||||||||||||||||||||
Euro | MSCO | Sell | 1,259,000 | 1,851,970 | 5/07/12 | 44,434 | — | |||||||||||||||||||||||||
Euro | DBAB | Sell | 2,045,000 | 2,991,017 | 5/07/12 | 55,026 | — | |||||||||||||||||||||||||
Euro | BZWS | Sell | 1,259,000 | 1,850,818 | 5/07/12 | 43,282 | — | |||||||||||||||||||||||||
Euro | FBCO | Sell | 1,731,000 | 2,537,646 | 5/07/12 | 52,463 | — | |||||||||||||||||||||||||
Euro | UBSW | Sell | 629,000 | 902,238 | 5/09/12 | — | (750 | ) | ||||||||||||||||||||||||
Euro | DBAB | Sell | 1,259,000 | 1,816,422 | 5/09/12 | 9,012 | — | |||||||||||||||||||||||||
TGB-24
Franklin Templeton Variable Insurance Products Trust
Statement of Investments, June 30, 2011 (unaudited) (continued)
| Templeton Global Bond Securities Fund |
Forward Exchange Contracts (continued)
| Currency | Counterparty | Type | Quantity | Contract Amount* | Settlement Date | Unrealized Appreciation | Unrealized Depreciation | |||||||||||||||||||||||||
Japanese Yen | CITI | Sell | 733,721,000 | 9,128,949 | 5/10/12 | $ | — | $ | (16,784 | ) | ||||||||||||||||||||||
Chilean Peso | MSCO | Buy | 1,150,200,000 | 2,368,958 | 5/11/12 | 3,176 | — | |||||||||||||||||||||||||
Japanese Yen | UBSW | Sell | 733,361,000 | 9,122,540 | 5/11/12 | — | (18,859 | ) | ||||||||||||||||||||||||
Japanese Yen | DBAB | Sell | 490,555,000 | 6,101,962 | 5/11/12 | — | (12,843 | ) | ||||||||||||||||||||||||
Euro | DBAB | Sell | 1,812,000 | 2,538,521 | 5/18/12 | — | (61,955 | ) | ||||||||||||||||||||||||
Euro | DBAB | Sell | 2,642,000 | 3,691,346 | 5/21/12 | — | (99,901 | ) | ||||||||||||||||||||||||
Euro | UBSW | Sell | 1,812,000 | 2,531,002 | �� | 5/21/12 | — | (69,203 | ) | |||||||||||||||||||||||
Chilean Peso | MSCO | Buy | 420,740,000 | 852,512 | 5/22/12 | 14,127 | — | |||||||||||||||||||||||||
Indian Rupee | DBAB | Buy | 217,594,000 | 4,559,807 | 6/01/12 | 64,766 | — | |||||||||||||||||||||||||
Indian Rupee | HSBC | Buy | 251,448,000 | 5,326,160 | 6/04/12 | 16,094 | — | |||||||||||||||||||||||||
Euro | DBAB | Sell | 785,200 | 1,123,692 | 6/06/12 | — | (2,435 | ) | ||||||||||||||||||||||||
Euro | UBSW | Sell | 1,057,200 | 1,517,505 | 6/07/12 | 1,331 | — | |||||||||||||||||||||||||
Euro | DBAB | Sell | 2,033,100 | 2,927,969 | 6/07/12 | 12,216 | — | |||||||||||||||||||||||||
Indian Rupee | DBAB | Buy | 160,277,000 | 3,379,945 | 6/07/12 | 24,130 | — | |||||||||||||||||||||||||
Indian Rupee | HSBC | Buy | 42,784,000 | 908,558 | 6/08/12 | 15 | — | |||||||||||||||||||||||||
Polish Zloty | DBAB | Buy | 30,704,000 | 7,583,856 | EUR | 6/08/12 | — | (34,251 | ) | |||||||||||||||||||||||
Polish Zloty | CITI | Buy | 5,990,000 | 1,480,328 | EUR | 6/08/12 | — | (7,836 | ) | |||||||||||||||||||||||
Euro | DBAB | Sell | 16,210,600 | 23,377,407 | 6/11/12 | 132,358 | — | |||||||||||||||||||||||||
Indian Rupee | DBAB | Buy | 43,392,000 | 921,078 | 6/11/12 | 92 | — | |||||||||||||||||||||||||
Swedish Krona | MSCO | Buy | 55,369,800 | 6,074,660 | EUR | 6/11/12 | — | (137,303 | ) | |||||||||||||||||||||||
Swedish Krona | DBAB | Buy | 41,300,000 | 4,531,649 | EUR | 6/11/12 | — | (103,269 | ) | |||||||||||||||||||||||
Euro | DBAB | Sell | 6,935,000 | 9,949,645 | 6/13/12 | 5,954 | — | |||||||||||||||||||||||||
Indian Rupee | HSBC | Buy | 108,000,000 | 2,292,994 | 6/13/12 | — | (780 | ) | ||||||||||||||||||||||||
Swedish Krona | MSCO | Buy | 27,990,100 | 3,064,681 | EUR | 6/13/12 | — | (60,806 | ) | |||||||||||||||||||||||
Swedish Krona | BZWS | Buy | 24,372,000 | 2,664,986 | EUR | 6/13/12 | — | (47,866 | ) | |||||||||||||||||||||||
Euro | DBAB | Sell | 1,448,000 | 2,068,989 | 6/14/12 | — | (7,141 | ) | ||||||||||||||||||||||||
Swedish Krona | MSCO | Buy | 21,992,000 | 2,398,444 | EUR | 6/14/12 | — | (34,237 | ) | |||||||||||||||||||||||
Indian Rupee | DBAB | Buy | 108,614,000 | 2,300,657 | 6/18/12 | 3,278 | — | |||||||||||||||||||||||||
Indian Rupee | DBAB | Buy | 98,937,000 | 2,087,719 | 6/20/12 | 10,468 | — | |||||||||||||||||||||||||
Indian Rupee | JPHQ | Buy | 79,054,000 | 1,669,567 | 6/22/12 | 6,573 | — | |||||||||||||||||||||||||
Indian Rupee | DBAB | Buy | 119,627,000 | 2,538,773 | 6/25/12 | — | (3,249 | ) | ||||||||||||||||||||||||
Indian Rupee | HSBC | Buy | 80,337,000 | 1,702,416 | 6/27/12 | — | (40 | ) | ||||||||||||||||||||||||
Malaysian Ringgit | JPHQ | Buy | 14,772,000 | 4,766,853 | 6/29/12 | 2,817 | — | |||||||||||||||||||||||||
Swedish Krona | UBSW | Buy | 302,991,000 | 32,586,637 | EUR | 6/29/12 | 168,310 | — | ||||||||||||||||||||||||
|
| |||||||||||||||||||||||||||||||
Unrealized appreciation (depreciation) |
| 22,618,204 | (48,338,114 | ) | ||||||||||||||||||||||||||||
|
| |||||||||||||||||||||||||||||||
Net unrealized appreciation (depreciation) |
| $ | (25,719,910 | ) | ||||||||||||||||||||||||||||
|
| |||||||||||||||||||||||||||||||
*In U.S. dollars unless otherwise indicated.
At June 30, 2011, the Fund had the following interest rate swap contracts outstanding. See Note 1(d).
Interest Rate Swap Contracts
| Counterparty | Pay/Receive Floating Rate | Fixed Rate | Floating Rate | Notional Amount* | Expiration Date | Unrealized Appreciation | Unrealized Depreciation | |||||||||||||||||||
JPHQ | Receive | 3.558% | 3-month USD BBA LIBOR | 3,240,000 | 3/4/21 | $ | — | $ | (98,040 | ) | ||||||||||||||||
DBAB | Receive | 3.523% | 3-month USD BBA LIBOR | 14,630,000 | 3/28/21 | — | (487,771 | ) | ||||||||||||||||||
CITI | Receive | 4.347% | 3-month USD BBA LIBOR | 7,460,000 | 2/25/41 | — | (462,306 | ) | ||||||||||||||||||
JPHQ | Receive | 4.349% | 3-month USD BBA LIBOR | 7,460,000 | 2/25/41 | — | (384,750 | ) | ||||||||||||||||||
JPHQ | Receive | 4.320% | 3-month USD BBA LIBOR | 5,600,000 | 2/28/41 | — | (325,694 | ) | ||||||||||||||||||
JPHQ | Receive | 4.299% | 3-month USD BBA LIBOR | 1,870,000 | 3/1/41 | — | (98,769 | ) | ||||||||||||||||||
|
| |||||||||||||||||||||||||
Unrealized appreciation (depreciation) |
| — | (1,857,330 | ) | ||||||||||||||||||||||
|
| |||||||||||||||||||||||||
Net unrealized appreciation (depreciation) |
| $ | (1,857,330 | ) | ||||||||||||||||||||||
|
| |||||||||||||||||||||||||
*In U.S. Dollars unless otherwise indicated.
The accompanying notes are an integral part of these financial statements.
TGB-25
Franklin Templeton Variable Insurance Products Trust
Financial Statements
Statement of Assets and Liabilities
June 30, 2011 (unaudited)
| Templeton Global Bond Securities Fund | ||||
Assets: | ||||
Investments in securities: | ||||
Cost - Unaffiliated issuers | $ | 1,975,941,252 | ||
Cost - Repurchase agreements | 191,085,986 | |||
|
| |||
Total cost of investments | $ | 2,167,027,238 | ||
|
| |||
Value - Unaffiliated issuers | $ | 2,208,562,479 | ||
Value - Repurchase agreements | 191,085,986 | |||
|
| |||
Total value of investments | 2,399,648,465 | |||
Foreign currency, at value (cost $10,874,041) | 10,923,473 | |||
Receivables: | ||||
Capital shares sold | 1,573,669 | |||
Interest | 27,020,047 | |||
Due from brokers | 11,917,000 | |||
Unrealized appreciation on forward exchange contracts | 22,618,204 | |||
Other assets | 537 | |||
|
| |||
Total assets | 2,473,701,395 | |||
|
| |||
Liabilities: | ||||
Payables: | ||||
Capital shares redeemed | 4,199,569 | |||
Affiliates | 1,787,119 | |||
Unrealized depreciation on forward exchange contracts | 48,338,114 | |||
Unrealized depreciation on swap contracts | 1,857,330 | |||
Accrued expenses and other liabilities | 1,122,912 | |||
|
| |||
Total liabilities | 57,305,044 | |||
|
| |||
Net assets, at value | $ | 2,416,396,351 | ||
|
| |||
Net assets consist of: | ||||
Paid-in capital | $ | 2,113,086,314 | ||
Undistributed net investment income | 22,804,966 | |||
Net unrealized appreciation (depreciation) | 205,708,999 | |||
Accumulated net realized gain (loss) | 74,796,072 | |||
|
| |||
Net assets, at value | $ | 2,416,396,351 | ||
|
| |||
The accompanying notes are an integral part of these financial statements.
TGB-26
Franklin Templeton Variable Insurance Products Trust
Financial Statements (continued)
Statement of Assets and Liabilities (continued)
June 30, 2011 (unaudited)
| Templeton Global Bond Securities Fund | ||||
Class 1: | ||||
Net assets, at value | $ | 291,254,073 | ||
|
| |||
Shares outstanding | 14,753,773 | |||
|
| |||
Net asset value and maximum offering price per share | $ | 19.74 | ||
|
| |||
Class 2: | ||||
Net assets, at value | $ | 1,757,266,464 | ||
|
| |||
Shares outstanding | 91,154,316 | |||
|
| |||
Net asset value and maximum offering price per share | $ | 19.28 | ||
|
| |||
Class 3: | ||||
Net assets, at value | $ | 202,111,008 | ||
|
| |||
Shares outstanding | 10,485,915 | |||
|
| |||
Net asset value and maximum offering price per sharea | $ | 19.27 | ||
|
| |||
Class 4: | ||||
Net assets, at value | $ | 165,764,806 | ||
|
| |||
Shares outstanding | 8,458,875 | |||
|
| |||
Net asset value and maximum offering price per share | $ | 19.60 | ||
|
| |||
aRedemption price is equal to net asset value less redemption fees retained by the Fund.
The accompanying notes are an integral part of these financial statements.
TGB-27
Franklin Templeton Variable Insurance Products Trust
Financial Statements (continued)
Statement of Operations
for the six months ended June 30, 2011 (unaudited)
| Templeton Global Bond Securities Fund | ||||
Investment income: | ||||
Interest (net of foreign taxes of $2,283,349) | $ | 58,283,832 | ||
|
| |||
Expenses: | ||||
Management fees (Note 3a) | 5,098,431 | |||
Distribution fees: (Note 3c) | ||||
Class 2 | 1,991,157 | |||
Class 3 | 234,378 | |||
Class 4 | 275,327 | |||
Unaffiliated transfer agent fees | 1,662 | |||
Custodian fees (Note 4) | 646,579 | |||
Reports to shareholders | 239,989 | |||
Professional fees | 35,786 | |||
Trustees' fees and expenses | 3,877 | |||
Other | 21,717 | |||
|
| |||
Total expenses | 8,548,903 | |||
|
| |||
Net investment income | 49,734,929 | |||
|
| |||
Realized and unrealized gains (losses): | ||||
Net realized gain (loss) from: | ||||
Investments | 40,892,757 | |||
Foreign currency transactions | 34,658,636 | |||
Futures contracts | 3,393 | |||
Swap contracts | (464,772 | ) | ||
|
| |||
Net realized gain (loss) | 75,090,014 | |||
|
| |||
Net change in unrealized appreciation (depreciation) on: | ||||
Investments | 39,232,551 | |||
Translation of other assets and liabilities denominated in foreign currencies | (47,662,121 | ) | ||
|
| |||
Net change in unrealized appreciation (depreciation) | (8,429,570 | ) | ||
|
| |||
Net realized and unrealized gain (loss) | 66,660,444 | |||
|
| |||
Net increase (decrease) in net assets resulting from operations | $ | 116,395,373 | ||
|
| |||
The accompanying notes are an integral part of these financial statements.
TGB-28
Franklin Templeton Variable Insurance Products Trust
Financial Statements (continued)
Statements of Changes in Net Assets
| Templeton Global Bond Securities Fund | ||||||||
| Six Months Ended June 30, 2011 (unaudited) | Year Ended December 31, 2010 | |||||||
| ||||||||
Increase (decrease) in net assets: | ||||||||
Operations: | ||||||||
Net investment income | $ | 49,734,929 | $ | 93,415,601 | ||||
Net realized gain (loss) from investments, foreign currency transactions, futures contracts and swap contracts | 75,090,014 | 26,725,973 | ||||||
Net change in unrealized appreciation (depreciation) on investments and translation of other assets and liabilities denominated in foreign currencies | (8,429,570 | ) | 123,023,722 | |||||
| ||||||||
Net increase (decrease) in net assets resulting from operations | 116,395,373 | 243,165,296 | ||||||
| ||||||||
Distributions to shareholders from: | ||||||||
Net investment income and net foreign currency gains: | ||||||||
Class 1 | (15,683,467 | ) | (3,860,853 | ) | ||||
Class 2 | (93,946,669 | ) | (17,334,382 | ) | ||||
Class 3 | (10,753,201 | ) | (2,167,994 | ) | ||||
Class 4 | (8,615,701 | ) | (1,885,595 | ) | ||||
Net realized gains: | ||||||||
Class 1 | (1,762,080 | ) | (610,541 | ) | ||||
Class 2 | (10,925,216 | ) | (3,135,836 | ) | ||||
Class 3 | (1,252,885 | ) | (394,847 | ) | ||||
Class 4 | (1,020,280 | ) | (338,834 | ) | ||||
| ||||||||
Total distributions to shareholders | (143,959,499 | ) | (29,728,882 | ) | ||||
| ||||||||
Capital share transactions (Note 2) | ||||||||
Class 1 | 21,845,503 | 48,911,860 | ||||||
Class 2 | 287,500,724 | 75,615,219 | ||||||
Class 3 | 20,981,651 | 21,722,929 | ||||||
Class 4 | 16,329,709 | 26,968,281 | ||||||
| ||||||||
Total capital share transactions | 346,657,587 | 173,218,289 | ||||||
| ||||||||
Redemption fees | 5,389 | 23,708 | ||||||
| ||||||||
Net increase (decrease) in net assets | 319,098,850 | 386,678,411 | ||||||
Net assets: | ||||||||
Beginning of period | 2,097,297,501 | 1,710,619,090 | ||||||
| ||||||||
End of period | $ | 2,416,396,351 | $ | 2,097,297,501 | ||||
| ||||||||
Undistributed net investment income included in net assets: | ||||||||
End of period | $ | 22,804,966 | $ | 102,069,075 | ||||
| ||||||||
The accompanying notes are an integral part of these financial statements.
TGB-29
Franklin Templeton Variable Insurance Products Trust
Notes to Financial Statements (unaudited)
Templeton Global Bond Securities Fund
1. ORGANIZATION AND SIGNIFICANT ACCOUNTING POLICIES
Franklin Templeton Variable Insurance Products Trust (Trust) is registered under the Investment Company Act of 1940, as amended, (1940 Act) as an open-end investment company, consisting of twenty separate funds. The Templeton Global Bond Securities Fund (Fund) is included in this report. The financial statements of the remaining funds in the Trust are presented separately. Shares of the Fund are generally sold only to insurance company separate accounts to fund the benefits of variable life insurance policies or variable annuity contracts. The Fund offers four classes of shares: Class 1, Class 2, Class 3, and Class 4. Each class of shares differs by its distribution fees, voting rights on matters affecting a single class and its exchange privilege.
The following summarizes the Fund's significant accounting policies.
a. Financial Instrument Valuation
The Fund's investments in securities and other financial instruments are carried at fair value daily. Fair value is the price that would be received to sell an asset or paid to transfer a liability in an orderly transaction between market participants on the measurement date. Under procedures approved by the Trust's Board of Trustees, the Fund may utilize independent pricing services, quotations from securities and financial instrument dealers, and other market sources to determine fair value.
Debt securities generally trade in the over-the-counter market rather than on a securities exchange. The Fund's pricing services use multiple valuation techniques to determine fair value. In instances where sufficient market activity exists, the pricing services may utilize a market-based approach through which quotes from market makers are used to determine fair value. In instances where sufficient market activity may not exist or is limited, the pricing services also utilize proprietary valuation models which may consider market characteristics such as benchmark yield curves, option-adjusted spreads, credit spreads, estimated default rates, coupon rates, anticipated timing of principal repayments, underlying collateral, and other unique security features in order to estimate the relevant cash flows, which are then discounted to calculate the fair value. Securities denominated in a foreign currency are converted into their U.S. dollar equivalent at the foreign exchange rate in effect at the close of the NYSE on the date that the values of the foreign debt securities are determined. Repurchase agreements are valued at cost, which approximates market value.
Certain derivative financial instruments (derivatives) trade in the over-the-counter market. The Fund’s pricing services use various techniques including industry standard option pricing models and proprietary discounted cash flow models to determine the fair value of those instruments. The Fund’s net benefit or obligation under the derivative contract, as measured by the fair market value of the contract, is included in net assets.
The Fund has procedures to determine the fair value of securities and other financial instruments for which market prices are not readily available or which may not be reliably priced. Under these procedures, the Fund primarily employs a market-based approach which may use related or comparable assets or liabilities, recent transactions, market multiples, book values, and other relevant information for the investment to determine the fair value of the investment. The Fund may also use an income-based valuation approach in which the anticipated future cash flows of the investment are discounted to calculate fair value. Discounts may also be applied due to the nature or duration of any restrictions on the disposition of the investments. Due to the inherent uncertainty of valuations of such investments, the fair values may differ significantly from the values that would have been used had an active market existed.
Trading in securities on foreign securities stock exchanges and over-the-counter markets may be completed before the daily close of business on the NYSE. Occasionally, events occur between the time at which trading in a foreign security is completed and the close of the NYSE that might call into question the reliability of the value of a portfolio security held by the Fund. As a result, differences may arise between the value of the Fund’s portfolio securities as determined at the foreign market close and the latest indications of value at the close of the NYSE. In order to minimize the potential for these differences, the investment manager monitors price movements following the close of trading in foreign stock markets through a series of country specific market proxies (such as baskets of American Depository Receipts, futures contracts and exchange traded funds). These price movements
TGB-30
Franklin Templeton Variable Insurance Products Trust
Notes to Financial Statements (unaudited) (continued)
Templeton Global Bond Securities Fund
1. ORGANIZATION AND SIGNIFICANT ACCOUNTING POLICIES (continued)
a. Financial Instrument Valuation (continued)
are measured against established trigger thresholds for each specific market proxy to assist in determining if an event has occurred that may call into question the reliability of the values of the foreign securities held by the Fund. If such an event occurs, the securities may be valued using fair value procedures, which may include the use of independent pricing services.
b. Foreign Currency Translation
Portfolio securities and other assets and liabilities denominated in foreign currencies are translated into U.S. dollars based on the exchange rate of such currencies against U.S. dollars on the date of valuation. The Fund may enter into foreign currency exchange contracts to facilitate transactions denominated in a foreign currency. Purchases and sales of securities, income and expense items denominated in foreign currencies are translated into U.S. dollars at the exchange rate in effect on the transaction date. Portfolio securities and assets and liabilities denominated in foreign currencies contain risks that those currencies will decline in value relative to the U.S. dollar. Occasionally, events may impact the availability or reliability of foreign exchange rates used to convert the U.S. dollar equivalent value. If such an event occurs, the foreign exchange rate will be valued at fair value using procedures established and approved by the Trust’s Board of Trustees.
The Fund does not separately report the effect of changes in foreign exchange rates from changes in market prices on securities held. Such changes are included in net realized and unrealized gain or loss from investments on the Statement of Operations.
Realized foreign exchange gains or losses arise from sales of foreign currencies, currency gains or losses realized between the trade and settlement dates on securities transactions and the difference between the recorded amounts of dividends, interest, and foreign withholding taxes and the U.S. dollar equivalent of the amounts actually received or paid. Net unrealized foreign exchange gains and losses arise from changes in foreign exchange rates on foreign denominated assets and liabilities other than investments in securities held at the end of the reporting period.
c. Joint Repurchase Agreement
The Fund enters into a joint repurchase agreement whereby its uninvested cash balance is deposited into a joint cash account with other funds managed by the investment manager or an affiliate of the investment manager and is used to invest in one or more repurchase agreements. The value and face amount of the joint repurchase agreement are allocated to the funds based on their pro-rata interest. A repurchase agreement is accounted for as a loan by the fund to the seller, collateralized by securities which are delivered to the fund’s custodian. The market value, including accrued interest, of the initial collateralization is required to be at least 102% of the dollar amount invested by the funds, with the value of the underlying securities marked to market daily to maintain coverage of at least 100%. The joint repurchase agreement held by the Fund at period end had been entered into on June 30, 2011.
d. Derivative Financial Instruments
The Fund invested in derivatives in order to manage risk or gain exposure to various other investments or markets. Derivatives are financial contracts based on an underlying or notional amount, require no initial investment or an initial net investment that is smaller than would normally be required to have a similar response to changes in market factors, and require or permit net settlement. Derivatives contain various risks including the potential inability of the counterparty to fulfill their obligations under the terms of the contract, the potential for an illiquid secondary market, and/or the potential for market movements which expose the Fund to gains or losses in excess of the amounts shown on the Statement of Assets and Liabilities. Realized gain and loss and unrealized appreciation and depreciation on these contracts for the period are included in the Statement of Operations.
TGB-31
Franklin Templeton Variable Insurance Products Trust
Notes to Financial Statements (unaudited) (continued)
Templeton Global Bond Securities Fund
1. ORGANIZATION AND SIGNIFICANT ACCOUNTING POLICIES (continued)
d. Derivative Financial Instruments (continued)
The Fund entered into futures contracts primarily to manage interest rate and/or foreign exchange rate risk. A futures contract is an agreement between the Fund and a counterparty to buy or sell an underlying financial instrument for a specified price on a future date. Required initial margin deposits of cash or securities are pledged by the Fund. Subsequent payments, known as variation margin, are made or received by the Fund, depending on fluctuations in the value of the underlying security. Such variation margin is accounted for as unrealized appreciation or depreciation until the contract is closed, at which time the gains or losses are realized.
The Fund entered into forward exchange contracts primarily to manage and/or gain exposure to certain foreign currencies. A forward exchange contract is an agreement between the Fund and a counterparty to buy or sell a foreign currency for a specific exchange rate on a future date. Pursuant to the terms of the forward exchange contracts, cash or securities may be required to be deposited as collateral. Unrestricted cash may be invested according to the Fund’s investment objectives.
The Fund entered into interest rate swap contracts primarily to manage interest rate risk. An interest rate swap is an agreement between the Fund and a counterparty to exchange cash flows based on the difference between two interest rates, applied to a notional principal amount. Over the term of the contract, contractually required payments to be paid and to be received are accrued daily and recorded as unrealized depreciation and appreciation until the payments are made, at which time they are realized. Pursuant to the terms of the interest rate swap contract, cash or securities may be required to be deposited as collateral. Unrestricted cash may be invested according to the Fund’s investment objectives.
See Note 9 regarding other derivative information.
e. Income Taxes
It is the Fund's policy to qualify as a regulated investment company under the Internal Revenue Code. The Fund intends to distribute to shareholders substantially all of its taxable income and net realized gains to relieve it from federal income and excise taxes. As a result, no provision for U.S. federal income taxes is required. The Fund files U.S. income tax returns as well as tax returns in certain other jurisdictions. The Fund records a provision for taxes in its financial statements including penalties and interest, if any, for a tax position taken on a tax return (or expected to be taken) when it fails to meet the more likely than not (a greater than 50% probability) threshold and based on the technical merits, the tax position may not be sustained upon examination by the tax authorities. As of June 30, 2011, and for all open tax years, the Fund has determined that no provision for income tax is required in the Fund's financial statements. Open tax years are those that remain subject to examination and are based on each tax jurisdiction statute of limitation.
The Fund may be subject to foreign taxation related to income received, capital gains on the sale of securities and certain foreign currency transactions in the foreign jurisdictions in which it invests. Foreign taxes, if any, are recorded based on the tax regulations and rates that exist in the foreign markets in which the Fund invests. When a capital gain tax is determined to apply the Fund records an estimated deferred tax liability for unrealized gains on these securities in an amount that would be payable if the securities were disposed of on the valuation date.
f. Security Transactions, Investment Income, Expenses and Distributions
Security transactions are accounted for on trade date. Realized gains and losses on security transactions are determined on a specific identification basis. Interest income and estimated expenses are accrued daily. Amortization of premium and accretion of discount on debt securities are included in interest income. Distributions to shareholders are recorded on the ex-dividend date and are determined according to income tax regulations (tax basis). Distributable earnings determined on a tax basis may differ from earnings recorded in accordance with accounting principles generally accepted in the United States of America. These differences may be permanent or temporary. Permanent differences are reclassified among capital accounts to reflect their tax character. These reclassifications have no impact on net assets or the results of operations. Temporary differences are not reclassified, as they may reverse in subsequent periods.
TGB-32
Franklin Templeton Variable Insurance Products Trust
Notes to Financial Statements (unaudited) (continued)
Templeton Global Bond Securities Fund
1. ORGANIZATION AND SIGNIFICANT ACCOUNTING POLICIES (continued)
f. Security Transactions, Investment Income, Expenses and Distributions (continued)
Common expenses incurred by the Trust are allocated among the funds based on the ratio of net assets of each fund to the combined net assets of the Trust. Fund specific expenses are charged directly to the fund that incurred the expense.
Realized and unrealized gains and losses and net investment income, not including class specific expenses, are allocated daily to each class of shares based upon the relative proportion of net assets of each class. Differences in per share distributions, by class, are generally due to differences in class specific expenses.
Inflation-indexed bonds are adjusted for inflation through periodic increases or decreases in the security's interest accruals, face amount, or principal redemption value, by amounts corresponding to the rate of inflation as measured by an index. Any increase or decrease in the face amount or principal redemption value will be included as interest income on the Statement of Operations.
g. Accounting Estimates
The preparation of financial statements in accordance with accounting principles generally accepted in the United States of America requires management to make estimates and assumptions that affect the reported amounts of assets and liabilities at the date of the financial statements and the amounts of income and expenses during the reporting period. Actual results could differ from those estimates.
h. Redemption Fees
Redemptions and exchanges of interests in an insurance company subaccount that invests in Class 3 shares of the Fund will be subject to a 1.0% short term trading fee if the interest in the subaccount has been held for less than 60 days. Such fees are retained by the Fund and accounted for as an addition to paid-in capital, allocated to each class of shares based upon the relative proportion of net assets of each class.
i. Guarantees and Indemnifications
Under the Trust's organizational documents, its officers and trustees are indemnified by the Trust against certain liabilities arising out of the performance of their duties to the Trust. Additionally, in the normal course of business, the Trust, on behalf of the Fund, enters into contracts with service providers that contain general indemnification clauses. The Trust's maximum exposure under these arrangements is unknown as this would involve future claims that may be made against the Trust that have not yet occurred. Currently, the Trust expects the risk of loss to be remote.
2. SHARES OF BENEFICIAL INTEREST
At June 30, 2011, there were an unlimited number of shares authorized (without par value). Transactions in the Fund's shares were as follows:
| Six Months Ended June 30, 2011 | Year Ended December 31, 2010 | |||||||||||||||
| Class 1 Shares: | Shares | Amount | Shares | Amount | ||||||||||||
Shares sold | 1,183,367 | $ | 24,027,973 | 4,522,323 | $ | 85,300,049 | ||||||||||
Shares issued in reinvestment of distributions | 889,172 | 17,445,546 | 243,806 | 4,471,394 | ||||||||||||
Shares redeemed | (972,226 | ) | (19,628,016 | ) | (2,152,653 | ) | (40,859,583 | ) | ||||||||
| ||||||||||||||||
Net increase (decrease) | 1,100,313 | $ | 21,845,503 | 2,613,476 | $ | 48,911,860 | ||||||||||
| ||||||||||||||||
TGB-33
Franklin Templeton Variable Insurance Products Trust
Notes to Financial Statements (unaudited) (continued)
Templeton Global Bond Securities Fund
2. SHARES OF BENEFICIAL INTEREST (continued)
| Six Months Ended June 30, 2011 | Year Ended December 31, 2010 | |||||||||||||||
| Class 2 Shares: | Shares | Amount | Shares | Amount | ||||||||||||
Shares sold | 13,321,166 | $ | 264,665,255 | 23,116,184 | $ | 432,400,311 | ||||||||||
Shares issued in reinvestment of distributions | 5,473,480 | 104,871,884 | 1,140,402 | 20,470,218 | ||||||||||||
Shares redeemed | (4,143,657 | ) | (82,036,415 | ) | (20,598,509 | ) | (377,255,310 | ) | ||||||||
| ||||||||||||||||
Net increase (decrease) | 14,650,989 | $ | 287,500,724 | 3,658,077 | $ | 75,615,219 | ||||||||||
| ||||||||||||||||
Class 3 Shares: | ||||||||||||||||
Shares sold | 1,078,647 | $ | 21,430,695 | 2,390,123 | $ | 44,722,862 | ||||||||||
Shares issued in reinvestment of distributions | 626,622 | 12,006,087 | 142,856 | 2,562,841 | ||||||||||||
Shares redeemed | (632,520 | ) | (12,455,131 | ) | (1,387,144 | ) | (25,562,774 | ) | ||||||||
| ||||||||||||||||
Net increase (decrease) | 1,072,749 | $ | 20,981,651 | 1,145,835 | $ | 21,722,929 | ||||||||||
| ||||||||||||||||
Class 4 Shares: | ||||||||||||||||
Shares sold | 678,360 | $ | 13,617,725 | 1,871,353 | $ | 34,938,015 | ||||||||||
Shares issued on reinvestment of distributions | 494,660 | 9,635,982 | 122,020 | 2,224,429 | ||||||||||||
Shares redeemed | (342,579 | ) | (6,923,998 | ) | (549,061 | ) | (10,194,163 | ) | ||||||||
| ||||||||||||||||
Net increase (decrease) | 830,441 | $ | 16,329,709 | 1,444,312 | $ | 26,968,281 | ||||||||||
| ||||||||||||||||
3. TRANSACTIONS WITH AFFILIATES
Franklin Resources, Inc. is the holding company for various subsidiaries that together are referred to as Franklin Templeton Investments. Certain officers and trustees of the Fund are also officers and/or directors of the following subsidiaries:
| Subsidiary | Affiliation | |
Franklin Advisers, Inc. (Advisers) | Investment manager | |
Franklin Templeton Services, LLC (FT Services) | Administrative manager | |
Franklin Templeton Distributors, Inc. (Distributors) | Principal underwriter | |
Franklin Templeton Investor Services, LLC (Investor Services) | Transfer agent |
a. Management Fees
The Fund pays an investment management fee to Advisers based on the average daily net assets of the Fund as follows:
| Annualized Fee Rate | Net Assets | |
| 0.625% | Up to and including $100 million | |
| 0.500% | Over $100 million, up to and including $250 million | |
| 0.450% | Over $250 million, up to and including $7.5 billion | |
| 0.440% | Over $7.5 billion, up to and including $10 billion | |
| 0.430% | Over $10 billion, up to and including $12.5 billion | |
| 0.420% | Over $12.5 billion, up to and including $15 billion | |
| 0.400% | In excess of $15 billion |
b. Administrative Fees
Under an agreement with Advisers, FT Services provides administrative services to the Fund. The fee is paid by Advisers based on average daily net assets, and is not an additional expense of the Fund.
TGB-34
Franklin Templeton Variable Insurance Products Trust
Notes to Financial Statements (unaudited) (continued)
Templeton Global Bond Securities Fund
3. TRANSACTIONS WITH AFFILIATES (continued)
c. Distribution Fees
The Trust's Board of Trustees has adopted distribution plans for Class 2, Class 3, and Class 4 shares pursuant to Rule 12b-1 under the 1940 Act. Under the Fund's compensation distribution plans, the Fund pays Distributors for costs incurred in connection with the servicing, sale and distribution of the Fund's shares up to 0.25%, 0.35%, and 0.35% per year of its average daily net assets of Class 2, Class 3, and Class 4, respectively. The Board of Trustees has agreed to limit the current rate to 0.25% per year for Class 3.
d. Transfer Agent Fees
Investor Services, under terms of an agreement, performs shareholder servicing for the Fund and is not paid by the Fund for the services.
4. EXPENSE OFFSET ARRANGEMENT
The Fund has entered into an arrangement with its custodian whereby credits realized as a result of uninvested cash balances are used to reduce a portion of the Fund’s custodian expenses. During the period ended June 30, 2011, there were no credits earned.
5. INCOME TAXES
For tax purposes, realized capital losses occurring subsequent to October 31 may be deferred and treated as occurring on the first day of the following fiscal year. At December 31, 2010, the Fund deferred realized capital losses of $1,905,817.
At June 30, 2011, the cost of investments and net unrealized appreciation (depreciation) for income tax purposes were as follows:
Cost of investments | $ | 2,177,035,599 | ||
|
| |||
Unrealized appreciation | $ | 234,025,218 | ||
Unrealized depreciation | (11,412,352 | ) | ||
|
| |||
Net unrealized appreciation (depreciation) | $ | 222,612,866 | ||
|
| |||
Net investment income differs for financial statement and tax purposes primarily due to differing treatments of foreign currency transactions, bond discounts and premiums, swaps, tax straddles, and inflation related adjustments on foreign securities.
Net realized gains (losses) differ for financial statement and tax purposes primarily due to differing treatments of foreign currency transactions, financial futures transactions, bond discounts and premiums, swaps, and tax straddles.
6. INVESTMENT TRANSACTIONS
Purchases and sales of investments (excluding short term securities) for the period ended June 30, 2011, aggregated $484,979,649 and $421,746,627, respectively.
7. CREDIT RISK
At June 30, 2011, the Fund had 15.40% of its portfolio invested in high yield or other securities rated below investment grade. These securities may be more sensitive to economic conditions causing greater price volatility and are potentially subject to a greater risk of loss due to default than higher rated securities.
TGB-35
Franklin Templeton Variable Insurance Products Trust
Notes to Financial Statements (unaudited) (continued)
Templeton Global Bond Securities Fund
8. CONCENTRATION OF RISK
Investing in foreign securities may include certain risks and considerations not typically associated with investing in U.S. securities, such as fluctuating currency values and changing local and regional economic, political and social conditions, which may result in greater market volatility. In addition, certain foreign securities may not be as liquid as U.S. securities.
9. OTHER DERIVATIVE INFORMATION
At June 30, 2011, the Fund has invested in derivative contracts which are reflected on the Statement of Assets and Liabilities as follows:
| Asset Derivatives | Liability Derivatives | |||||||||||
| Derivative Contracts Not Accounted for as Hedging Instruments | Statement of Assets and Liabilities Location | Fair Value Amount | Statement of Assets and Liabilities Location | Fair Value Amount | ||||||||
Interest rate contracts | Unrealized appreciation on swap contracts | $ | — | Unrealized depreciation on swap contracts | $ | 1,857,330 | ||||||
Foreign exchange contracts | Unrealized appreciation on forward exchange contracts | 22,618,204 | Unrealized depreciation on forward exchange contracts | 48,338,114 | ||||||||
For the period ended June 30, 2011, the effect of derivative contracts on the Fund’s Statement of Operations was as follows:
| Derivative Contracts Not Accounted for as Hedging Instruments | Statement of Operations Locations | Realized Gain (Loss) for the Period | Change in Unrealized Appreciation (Depreciation) for the Period | |||||||
Interest rate contracts | Net realized gain (loss) from futures and swap contracts / Net change in unrealized appreciation (depreciation) on investments | $ | (461,379 | ) | $ | (1,860,382 | ) | |||
Foreign exchange contracts | Net realized gain (loss) from foreign currency transactions / Net change in unrealized appreciation (depreciation) on translation of other assets and liabilities denominated in foreign currencies | 31,169,870 | (47,228,665 | ) | ||||||
For the period ended June 30, 2011, the average month end market value of derivatives represented 2.95% of average month end net assets. The average month end number of open derivative contracts for the period was 381.
See Note 1(d) regarding derivative financial instruments.
10. CREDIT FACILITY
The Fund, together with other U.S. registered and foreign investment funds (collectively, Borrowers), managed by Franklin Templeton Investments, are borrowers in a joint syndicated senior unsecured credit facility totaling $750 million (Global Credit Facility) which matures on January 20, 2012. This Global Credit Facility provides a source of funds to the Borrowers for temporary and emergency purposes, including the ability to meet future unanticipated or unusually large redemption requests.
Under the terms of the Global Credit Facility, the Fund shall, in addition to interest charged on any borrowings made by the Fund and other costs incurred by the Fund, pay its share of fees and expenses incurred in connection with the implementation
TGB-36
Franklin Templeton Variable Insurance Products Trust
Notes to Financial Statements (unaudited) (continued)
Templeton Global Bond Securities Fund
10. CREDIT FACILITY (continued)
and maintenance of the Global Credit Facility, based upon its relative share of the aggregate net assets of all of the Borrowers, including an annual commitment fee of 0.08% based upon the unused portion of the Global Credit Facility, which is reflected in other expenses on the Statement of Operations. During the period ended June 30, 2011, the Fund did not use the Global Credit Facility.
11. FAIR VALUE MEASUREMENTS
The Fund follows a fair value hierarchy that distinguishes between market data obtained from independent sources (observable inputs) and the Fund’s own market assumptions (unobservable inputs). These inputs are used in determining the value of the Fund’s investments and are summarized in the following fair value hierarchy:
| • | Level 1 – quoted prices in active markets for identical securities |
| • | Level 2 – other significant observable inputs (including quoted prices for similar securities, interest rates, prepayment speed, credit risk, etc.) |
| • | Level 3 – significant unobservable inputs (including the Fund’s own assumptions in determining the fair value of investments) |
The inputs or methodology used for valuing securities are not an indication of the risk associated with investing in those securities.
For movements between the levels within the fair value hierarchy, the Fund has adopted a policy of recognizing the transfers as of the date of the underlying event which caused the movement.
The following is a summary of the inputs used as of June 30, 2011, in valuing the Fund’s assets and liabilities carried at fair value:
| Level 1 | Level 2 | Level 3 | Total | |||||||||||||
|
| |||||||||||||||
Assets: | ||||||||||||||||
Investments in Securities: | ||||||||||||||||
Foreign Government and Agency Securities | $ | — | $ | 1,737,796,762 | $ | — | 1,737,796,762 | |||||||||
Corporate Bonds | 12,190,720 | 12,190,720 | ||||||||||||||
Municipal Bonds | — | 35,455,384 | — | 35,455,384 | ||||||||||||
Short Term Investments | — | 614,205,599 | — | 614,205,599 | ||||||||||||
|
| |||||||||||||||
Total Investments in Securities | $ | — | $ | 2,399,648,465 | $ | — | 2,399,648,465 | |||||||||
|
| |||||||||||||||
Forward Exchange Contracts | — | 22,618,204 | — | 22,618,204 | ||||||||||||
Liabilities: | ||||||||||||||||
Swaps | — | 1,857,330 | — | 1,857,330 | ||||||||||||
Forward Exchange Contracts | — | 48,338,114 | — | 48,338,114 | ||||||||||||
12. NEW ACCOUNTING PRONOUNCEMENTS
In May 2011, the Financial Accounting Standards Board (FASB) issued Accounting Standards Update (ASU) No. 2011-04, Fair Value Measurement (Topic 820): Amendments to Achieve Common Fair Value Measurement and Disclosure Requirements in U.S. GAAP and International Financial Reporting Standards (IFRS). The amendments in the ASU will improve the comparability of fair value measurements presented and disclosed in financial statements prepared in accordance with U.S. GAAP and IFRS and include new guidance for certain fair value measurement principles and disclosure requirements. The ASU is effective for interim and annual periods beginning after December 15, 2011. The Fund is currently evaluating the impact, if any, of applying this provision.
TGB-37
Franklin Templeton Variable Insurance Products Trust
Notes to Financial Statements (unaudited) (continued)
Templeton Global Bond Securities Fund
13. SUBSEQUENT EVENTS
The Fund has evaluated subsequent events through the issuance of the financial statements and determined that no events have occurred that require disclosure.
ABBREVIATIONS | ||||
| Counterparty | Currency | Selected Portfolio | ||
| BOFA - Bank of America Corp. | AUD - Australian Dollar | BHAC - Berkshire Hathaway Assurance Corp. | ||
| BZWS - Barclays Bank PLC | BRL - Brazilian Real | FRN - Floating Rate Note | ||
| CITI - Citigroup, Inc. | EGP - Egyptian Pound | GO - General Obligation | ||
| DBAB - Deutsche Bank AG | EUR - Euro | USD - Unified/Union School District | ||
| FBCO - Credit Suisse Group AG | GBP - British Pound | |||
| HSBC - HSBC Bank USA, N.A. | IDR - Indonesian Rupiah | |||
| JPHQ - JP Morgan Chase & Co. | ILS - New Israeli Shekel | |||
| MSCO - Morgan Stanley | KRW - South Korean Won | |||
| UBSW - UBS AG | LKR - Sri Lankan Rupee | |||
| MXN - Mexican Peso | ||||
| MYR - Malaysian Ringgit | ||||
| NOK - Norwegian Krone | ||||
| PEN - Peruvian Nuevo Sol | ||||
| PHP - Philippine Peso | ||||
| PLN - Polish Zloty | ||||
| SEK - Swedish Krona |
TGB-38
Franklin Templeton Variable Insurance Products Trust
Tax Designation (unaudited)
Templeton Global Bond Securities Fund
At December 31, 2010, more than 50% of the Fund’s total assets were invested in securities of foreign issuers. In most instances, foreign taxes were withheld from income paid to the Fund on these investments. As shown in the table below, the Fund designates to shareholders the foreign source income and foreign taxes paid, pursuant to Section 853 of the Internal Revenue Code. This designation will allow shareholders of record on June 14, 2011, to treat their proportionate share of foreign taxes paid by the Fund as having been paid directly by them. The shareholder shall consider these amounts as foreign taxes paid in the tax year in which they receive the Fund distribution.
The following table provides a detailed analysis of foreign tax paid and foreign source income as designated by the Fund, to Class 1, Class 2, Class 3, and Class 4 shareholders of record.
| Class | Foreign Tax Paid Per Share | Foreign Source Income Per Share | ||||||
Class 1 | $ | 0.0148 | $ | 0.9287 | ||||
Class 2 | $ | 0.0148 | $ | 0.8980 | ||||
Class 3 | $ | 0.0148 | $ | 0.8963 | ||||
Class 4 | $ | 0.0148 | $ | 0.8823 | ||||
Foreign Tax Paid Per Share (Column 1) is the amount per share available to you, as a tax credit (assuming you held your shares in the Fund for a minimum of 16 days during the 31-day period beginning 15 days before the ex-dividend date of the Fund’s distribution to which the foreign taxes relate), or, as a tax deduction.
Foreign Source Income Per Share (Column 2) is the amount per share of income dividends attributable to foreign securities held by the Fund, plus any foreign taxes withheld on these dividends.
TGB-39
INDEX DESCRIPTIONS
The indexes are unmanaged and include reinvested distributions.
For indexes sourced by Morningstar: © 2011 Morningstar. All Rights Reserved. The information contained herein: (1) is proprietary to Morningstar and/or its content providers; (2) may not be copied or distributed; and (3) is not warranted to be accurate, complete or timely. Neither Morningstar nor its content providers are responsible for any damages or losses arising from any use of this information.
Russell® is a trademark and RussellTM is a servicemark of the Frank Russell Company.
Barclays Capital (BC) U.S. Aggregate Index is a market capitalization-weighted index representing the U.S. investment-grade, fixed-rate, taxable bond market with index components for government and corporate, mortgage pass-through and asset-backed securities. All issues included are SEC registered, taxable, dollar denominated and nonconvertible, must have at least one year to final maturity and must be rated investment grade (Baa3/BBB-/BBB- or higher) using the middle rating of Moody’s, Standard & Poor’s and Fitch, respectively. STANDARD & POOR’S®, S&P® and S&P 500® are registered trademarks of Standard & Poor’s Financial Services LLC. Standard & Poor’s does not sponsor, endorse, sell or promote any S&P index-based product.
Barclays Capital (BC) U.S. Government Index: Intermediate Component is the intermediate component of the BC U.S. Government Index, which includes public obligations of the U.S. Treasury with at least one year to final maturity and publicly issued debt of U.S. government agencies, quasi-federal corporations, and corporate or foreign debt guaranteed by the U.S. government.
Citigroup World Government Bond Index is a market capitalization-weighted index consisting of investment-grade world government bond markets.
Credit Suisse (CS) High Yield Index is designed to mirror the investable universe of the U.S. dollar-denominated high yield debt market.
FTSE EPRA/NAREIT Developed Index is a free float-adjusted index designed to measure the performance of publicly traded real estate securities in the North American, European and Asian real estate markets. FTSE® is a trademark of London Stock Exchange Plc and The Financial Times Limited and is used by FTSE under license. All rights in and to the FTSE MPF Index series (including currency adjusted indices) are vested in FTSE. All information is provided for information purposes only. Every effort is made to ensure that all information given in this publication is accurate, but no responsibility or liability can be accepted by FTSE for any errors or for any loss arising from use of this publication.
J.P. Morgan (JPM) Global Government Bond Index (GGBI) tracks total returns for liquid, fixed-rate, domestic government bonds with maturities greater than one year issued by developed countries globally.
Lipper Multi-Sector Income Funds Classification Average is calculated by averaging the total returns of all funds within the Lipper Multi-Sector Income Funds classification in the Lipper Open-End underlying funds universe. Lipper Multi-Sector Income Funds are defined as funds that seek current income by allocating assets among different fixed income securities sectors (not primarily in one sector except for defensive purposes), including U.S. and foreign governments, with a significant portion rated below investment grade. For the six-month period ended 6/30/11, there were 189 funds in this category. Lipper calculations do not include contract fees, expenses or sales charges, and may have been different if such charges had been considered.
Lipper VIP Equity Income Funds Classification Average is an equally weighted average calculation of performance figures for all funds within the Lipper Equity Income Funds classification in the Lipper VIP underlying funds universe. Lipper Equity Income Funds seek relatively high current income and growth of income through investing 60% or more of their portfolios in equities. For the six-month period ended 6/30/11, there were 65 funds in this category. Lipper calculations do not include contract fees, expenses or sales charges, and may have been different if such charges had been considered.
Lipper VIP General U.S. Government Funds Classification Average is an equally weighted average calculation of performance figures for all funds within the Lipper General U.S. Government Funds classification in the Lipper VIP underlying funds universe. Lipper General U.S. Government Funds invest primarily in U.S. government and agency issues. For the six-month period ended 6/30/11, there were 75 funds in this category. Lipper calculations do not include contract fees, expenses or sales charges, and may have been different if such charges had been considered.
Lipper VIP High Current Yield Funds Classification Average is an equally weighted average calculation of performance figures for all funds within the Lipper High Current Yield Funds Classification in the Lipper VIP underlying funds universe. Lipper High Current Yield Funds aim at high (relative) current yield from fixed income securities, have no quality or maturity
I-1
restrictions, and tend to invest in lower grade debt issues. For the six-month period ended 6/30/11, there were 122 funds in this category. Lipper calculations do not include contract fees, expenses or sales charges, and may have been different if such charges had been considered.
MSCI Emerging Markets (EM) Index is a free float-adjusted, market capitalization-weighted index designed to measure equity market performance in global emerging markets.
MSCI Europe, Australasia, Far East (EAFE) Index is a free float-adjusted, market capitalization-weighted index designed to measure equity market performance in global developed markets excluding the U.S. and Canada.
MSCI Europe, Australasia, Far East (EAFE) Index Net Return (Local Currency) is a free float-adjusted, market capitalization-weighted index designed to measure equity market performance of global developed markets excluding the U.S. and Canada. The index is calculated in local currency and includes reinvested daily net dividends.
MSCI World Index is a free float-adjusted, market capitalization-weighted index designed to measure equity market performance in global developed markets.
Russell 1000® Growth Index is market capitalization weighted and measures performance of those Russell 1000 Index companies with higher price-to-book ratios and higher forecasted growth values.
Russell 1000 Index is market capitalization weighted and measures performance of the largest companies in the Russell 3000 Index, which represents the majority of the U.S. market’s total capitalization.
Russell 1000 Value Index is market capitalization weighted and measures performance of those Russell 1000 Index companies with lower price-to-book ratios and lower forecasted growth values.
Russell 2500™ Index is market capitalization weighted and measures performance of the smallest companies in the Russell 3000 Index, which represent a modest amount of the Russell 3000 Index’s total market capitalization.
Russell 2500 Value Index is market capitalization weighted and measures performance of those Russell 2500 Index companies with lower price-to-book ratios and lower forecasted growth values.
Russell 3000® Growth Index is market capitalization weighted and measures performance of those Russell 3000 Index companies with higher price-to-book ratios and higher forecasted growth values.
Russell 3000 Index is market capitalization weighted and measures performance of the largest U.S. companies based on total market capitalization and represents the majority of the investable U.S. equity market.
Russell Midcap® Growth Index is market capitalization weighted and measures performance of those Russell Midcap Index companies with higher price-to-book ratios and higher forecasted growth values.
Russell Midcap Index is market capitalization weighted and measures performance of the smallest companies in the Russell 1000 Index, which represent a modest amount of the Russell 1000 Index’s total market capitalization.
Standard & Poor’s 500 Index (S&P 500) is a market capitalization-weighted index of 500 stocks designed to measure total U.S. equity market performance.
Standard & Poor’s Global REIT Index is designed to measure performance of the investable universe of publicly traded real estate investment trusts. Index constituents generally derive the majority of their revenue from real estate development, management, rental, and/or direct investment in physical property and with local REIT or property trust tax status.
Standard & Poor’s/International Finance Corporation Investable (S&P/IFCI) Composite Index is a free float-adjusted, market capitalization-weighted index designed to measure equity performance in global emerging markets.
I-2
Franklin Templeton Variable Insurance Products Trust
Shareholder Information
Board Review of Investment Management Agreement
At a meeting held April 19, 2011, the Board of Trustees (Board), including a majority of non-interested or independent Trustees, approved renewal of the investment management agreement for each of the separate funds within the Trust (Fund(s)). In reaching this decision, the Board took into account information furnished throughout the year at regular Board meetings, as well as information prepared specifically in connection with the annual renewal review process. Information furnished and discussed throughout the year included investment performance reports and related financial information for each Fund, as well as periodic reports on expenses, shareholder services, legal, compliance, pricing, brokerage commissions and execution and other services provided by the Investment Manager (Manager) and its affiliates. Information furnished specifically in connection with the renewal process included reports prepared by Lipper, Inc. (Lipper), an independent organization, as well as additional material, including a Fund profitability analysis prepared by management. The Lipper reports compared a Fund’s investment performance and expenses with those of other mutual funds deemed comparable to the Fund as selected by Lipper. The Fund profitability analysis discussed the profitability to Franklin Templeton Investments from its overall U.S. fund operations, as well as on an individual fund-by-fund basis. Additional material accompanying such profitability analysis included information on a fund-by-fund basis listing portfolio managers and other accounts they manage, as well as information on management fees charged by the Manager and its affiliates to U.S. mutual funds and other accounts, including management’s explanation of differences where relevant. Such material also included a memorandum prepared by management describing project initiatives and capital investments relating to the services provided to the Funds by the Franklin Templeton Investments organization, as well as a memorandum relating to economies of scale.
In considering such materials, the independent Trustees received assistance and advice from and met separately with independent counsel. While the investment management agreements for all Funds were considered at the same Board meeting, the Board dealt with each Fund separately. In approving continuance of the investment management agreement for each Fund, the Board, including a majority of independent Trustees, determined that the existing management fee structure was fair and reasonable and that continuance of the investment management agreement was in the best interests of each Fund and its shareholders. While attention was given to all information furnished, the following discusses some primary factors relevant to the Board’s decision.
NATURE, EXTENT AND QUALITY OF SERVICE. The Board was satisfied with the nature and quality of the overall services provided by the Manager and its affiliates to the Funds and their shareholders. In addition to investment performance and expenses discussed later, the Board’s opinion was based, in part, upon periodic reports furnished it showing that the investment policies and restrictions for each Fund were consistently complied with as well as other reports periodically furnished the Board covering matters such as the compliance of portfolio managers and other management personnel with the code of ethics adopted throughout the Franklin Templeton fund complex, the adherence to fair value pricing procedures established by the Board, and the accuracy of net asset value calculations. Favorable consideration was given to management’s continuous efforts and expenditures in establishing back-up systems and recovery procedures to function in the event of a natural disaster, it being noted that such systems and procedures had functioned smoothly during the Florida hurricanes and blackouts experienced in previous years. Among other factors taken into account by the Board were the Manager’s best execution trading policies, including a favorable report by an independent portfolio trading analytical firm. Consideration was also given to the experience of each Fund’s portfolio management team, the number of accounts managed and general method of compensation. In this latter respect, the Board noted that a primary factor in management’s determination of a portfolio manager’s bonus compensation was the relative investment performance of the funds he or she managed and that a portion of such bonus was required to be invested in a predesignated list of funds within such person’s fund management area so as to be aligned with the interests of shareholders. Particular attention was given to management’s conservative approach and diligent risk management procedures, including continuous monitoring of counterparty credit risk and attention given to derivatives and other complex instruments. The Board also took into account, among other things, management’s efforts in establishing a global credit facility for the benefit of the Funds and other accounts managed by Franklin Templeton Investments to provide a source of cash for temporary and emergency purposes or to meet unusual redemption requests as well as the strong financial position of the Manager’s parent company and its commitment to the mutual fund business as evidenced by its subsidization of money market funds.
INVESTMENT PERFORMANCE. The Board placed significant emphasis on the investment performance of each of the Funds in view of its importance to shareholders. While consideration was given to performance reports and discussions with portfolio
SI-1
Franklin Templeton Variable Insurance Products Trust
Shareholder Information (continued)
Board Review of Investment Management Agreement (continued)
managers at Board meetings throughout the year, particular attention in assessing performance was given to the Lipper reports furnished for the agreement renewals of all Funds. The Lipper reports prepared for each of the individual Funds showed the investment performance of Class 1 shares for those having such class of shares and Class 2 shares for those Funds that did not have Class 1 shares, in comparison to a performance universe selected by Lipper. Comparative performance for each Fund was shown for the one-year period ended January 31, 2011, and previous periods ended that date of up to 10 years unless otherwise noted. Performance was shown on a total return basis for each Fund and in certain cases, as indicated, on an income return basis as well. The following summarizes the performance results for each of the Funds and the Board’s view of such performance.
Franklin Flex Cap Growth Securities Fund – The performance universe for this Fund, which has been in operation for only five full years, consisted of the Fund and all multi-cap growth funds underlying variable insurance products as selected by Lipper. The Lipper report showed the Fund’s comparative total return for the one-year period to be in the second-lowest quintile of its performance universe, and on an annualized basis to be in the middle quintile of such universe for its previous three- and five-year periods. In discussing the one-year performance, management pointed out that it largely reflected portfolio stock selections within the health care, consumer discretionary, materials and financials sectors and discussed steps being taken to improve performance. The Board found the Fund’s performance as set forth in the Lipper report to be acceptable and did not warrant any change in portfolio management, noting that the Fund’s actual total return for the one-year period as shown in the Lipper report exceeded 23%.
Franklin Global Real Estate Securities Fund – The performance universe for this Fund consisted of the Fund and all real estate funds underlying variable insurance products as selected by Lipper. The Lipper report showed the Fund’s total return to be in the second-lowest quintile of such universe for the one-year period, and on an annualized basis to also be in the lowest quintile of such universe for the previous three-, five- and 10-year periods. The Board noted that on May 1, 2007, the Fund had changed portfolio managers and also had adopted a global investment mandate and that management had taken steps to improve the Fund’s performance, including the appointment of an additional portfolio manager in 2010. The Board intends to continue monitoring the Fund’s results, but was satisfied with the efforts being made by management to improve performance.
Franklin Growth and Income Securities Fund – The performance universe for this Fund consisted of the Fund and all equity income funds underlying variable insurance products as selected by Lipper. The Lipper report showed the Fund’s income return during the one-year period to be in the highest or best performing quintile of its performance universe, and on an annualized basis in each of the previous three-, five- and 10-year periods to also be in the highest quintile of such universe. The Lipper report showed the Fund’s total return for the one-year period to also be in the highest quintile of its performance universe, and on an annualized basis for the previous three-year period to be in the second-highest quintile of such universe, and for each of the previous five- and 10-year periods to be in the middle quintile of such performance universe. The Board was satisfied with the Fund’s performance as shown in the Lipper report.
Franklin High Income Securities Fund – The performance universe for this Fund consisted of the Fund and all high current yield funds underlying variable insurance products as selected by Lipper. The Lipper report showed the Fund’s income return for the one-year period to be in the second-lowest quintile of such universe, and on an annualized basis to also be in the second-lowest quintile for the previous three- and five-year periods, but to be in the highest quintile of such universe for the previous 10-year period. The Lipper report showed the Fund’s total return to be in the middle quintile of its performance universe for the one-year period, and, on an annualized basis to be in the second-highest quintile of such universe for the previous three-year period, and to be in the middle quintile of such universe for each of the previous five- and 10-year periods. In discussing the Fund’s performance with the Board, management pointed out, among other things, the Fund’s somewhat higher quality, lower risk bias, including its underweighted positioning at the start of 2010 in the financials industry, which was a top performer during the first quarter of 2010. The Board believed the Fund’s performance was acceptable and did not warrant any change in portfolio management, noting the Fund’s actual income and total returns for the one-year period as shown in the Lipper report were 7.36% and 15%, respectively, and that its income return for each of the one-year and annualized three- and five-year periods was in each case within 68 basis points or less of the performance universe median.
SI-2
Franklin Templeton Variable Insurance Products Trust
Shareholder Information (continued)
Board Review of Investment Management Agreement (continued)
Franklin Income Securities Fund – The performance universe for this Fund consisted of the Fund and all mixed-asset target allocation moderate funds underlying variable insurance products as selected by Lipper. The Lipper report showed the Fund’s income return to be in the highest or best performing quintile of such universe for the one-year period and to also be in the highest quintile of such universe for each of the previous three-, five- and 10-year periods on an annualized basis. The Lipper report showed the Fund’s total return to be in the second-highest quintile of its performance universe for the one-year period and on an annualized basis to be in the highest quintile of such universe for each of the previous three-, five- and 10-year periods. The Board was satisfied with the Fund’s performance as shown in the Lipper report.
Franklin Large Cap Growth Securities Fund – The performance universe for this Fund consisted of the Fund and all large-cap core funds underlying variable insurance products as selected by Lipper. The Lipper report showed the Fund’s comparative total return to be in the second-lowest quintile of such universe for the one-year period, but on an annualized basis to be in the highest or best performing quintile of such universe for the previous three-year period, the second-highest quintile of such universe for the previous five-year period, and the second-lowest quintile of such universe for the previous 10-year period. In reviewing the Fund’s one-year performance, management pointed out, among other things, that it reflected the Fund’s overweighted position in the health care industry and discussed with the Board steps being taken to position the Fund to benefit from a continuing recovery of the U.S. economy. The Board believed the Fund’s overall performance as set forth in the Lipper report to be acceptable, noting that its one-year return exceeded 18%.
Franklin Large Cap Value Securities Fund – The performance universe for this Fund, which has been in operation for only five full years, consisted of the Fund and all large-cap value funds underlying variable insurance products as selected by Lipper. The Lipper report showed the Fund’s total return to be in the upper half of such universe for the one-year period and to be in the second-highest quintile of such universe on an annualized basis for its previous three- and five-year periods. The Board was satisfied with the Fund’s performance as set forth in the Lipper report.
Franklin Rising Dividends Securities Fund – The performance universe for this Fund consisted of the Fund and all multi-cap core funds underlying variable insurance products as selected by Lipper. The Lipper report showed the Fund’s comparative total return to be in the upper half of the performance universe for the one-year period, and on an annualized basis to be in the highest or second-highest quintile of such universe for each of the three-, five- and 10-year periods. The Board was satisfied with the Fund’s performance as set forth in the Lipper report.
Franklin Small Cap Value Securities Fund – The performance universe for this Fund consisted of the Fund and all small-cap value funds underlying variable insurance products as selected by Lipper. The Lipper report showed the Fund’s total return for the one-year period to be in the highest or best performing quintile of such performance universe, and on an annualized basis to be in the middle quintile of such universe for each of the previous three- and 10-year periods, and the second-highest quintile for the previous five-year period. The Board found the Fund’s performance as set forth in the Lipper report to be satisfactory.
Franklin Small-Mid Cap Growth Securities Fund – The performance universe for this Fund consisted of the Fund and all mid-cap growth funds underlying variable insurance products as selected by Lipper. The Lipper report showed the Fund’s total return for the one-year period to be in the upper half of such universe, and on an annualized basis to be in the second-highest performing quintile of such universe for the previous three-year period, and to be in the middle quintile of such universe for each of the previous five- and 10-year periods. The Board found the Fund’s investment performance as set forth in the Lipper report to be satisfactory.
Franklin Strategic Income Securities Fund – The performance universe for this Fund consisted of the Fund and all general bond funds underlying variable insurance products as selected by Lipper. The Lipper report showed the Fund’s income return to be in the second-highest quintile of such performance universe for the one-year period, and on an annualized basis to also be in the second-highest quintiles of such universe during the previous three- and five-year periods, and in the lowest quintile of such universe for the previous 10-year period. The Lipper report showed the Fund’s total return to be in the second-highest quintile of such universe during the one-year period, and on an annualized basis to be in either the highest or second-highest quintile of such universe for each of the previous three-, five- and 10-year periods. The Board was satisfied with the Fund’s performance as shown in the Lipper report.
SI-3
Franklin Templeton Variable Insurance Products Trust
Shareholder Information (continued)
Board Review of Investment Management Agreement (continued)
Franklin Templeton VIP Founding Funds Allocation Fund – The performance universe for this Fund consisted of the Fund and all mixed-asset target allocation growth funds underlying variable insurance products as selected by Lipper. The Fund has been in existence for only three full years and the Lipper report showed its income return to be in the highest quintile of such performance universe for the one-year period, and to be in the second-highest quintile of such universe for each of the previous two years. The Lipper report showed the Fund’s total return for the one-year period to be in the second-lowest quintile of such universe and to be in the highest quintile of such universe for the previous year and lowest quintile of such universe for the year before that. The Fund’s performance, which reflects those of the three underlying funds in which it invests, was discussed with management and the Board believed that no change in investment strategy or portfolio management was warranted, noting the Fund’s short period of operations, as well as the fact that the Fund’s total return for the one-year period was nearly 16% as shown in the Lipper report.
Franklin U.S. Government Fund – The performance universe for this Fund consisted of the Fund and all general U.S. government funds underlying variable insurance products as selected by Lipper. The Lipper report showed the Fund’s income return for the one-year period to be in the second-highest quintile of such universe and on an annualized basis to be in the highest or second-highest quintile of such universe for each of the previous three-, five- and 10-year periods. The Lipper report showed the Fund’s total return to also be in the second-highest quintile of such universe for the one-year period, as well as for each of the previous three-, five- and 10-year periods on an annualized basis. The Board was satisfied with the Fund’s performance as shown in the Lipper report.
Mutual Global Discovery Securities Fund – The performance universe for this Fund consisted of the Fund and all global core funds underlying variable insurance products as selected by Lipper. The Lipper report showed the Fund’s total return to be in the lowest quintile of such universe for the one-year period, but on an annualized basis to be in the highest or best performing quintile of such universe for each of the previous three-, five- and 10-year periods. In discussing the Fund’s performance during the one-year period, management explained that it reflected the Fund’s relatively high cash position, which hurt performance in a rising market, as well as other factors such as the Fund’s portfolio being underweighted in the materials and energy sectors. The Board found the Fund’s overall performance as set forth in the Lipper report to be satisfactory, noting the Fund’s total return for the one-year period exceeded 15%.
Mutual International Securities Fund – The performance universe for this Fund consisted of the Fund and all other international core funds underlying variable insurance products as selected by Lipper. The Fund has been in existence for one full year at the date of the Lipper report, which showed its total return during such year to be in the highest or best performing quintile of such universe. The Board was pleased with such performance, but did not believe it to be particularly meaningful in view of the Fund’s short period of operations.
Mutual Shares Securities Fund – The performance universe for this Fund consisted of the Fund and all large-cap value funds underlying variable insurance products as selected by Lipper. The Lipper report showed the Fund’s income return for the one-year period to be in the highest or best performing quintile of such universe, and on an annualized basis to be in the second-highest quintile for each of the previous three-, five- and 10-year periods. The Lipper report showed the Fund’s total return for the one-year period to be in the lowest quintile of the performance universe, but on an annualized basis to be in the upper half of such universe for the previous three-year period, the second-highest quintile of such universe for the previous five-year period, and the highest quintile of such universe for the previous 10-year period. In discussing the Fund’s total return for the one-year period, management explained that it reflected the Fund’s relatively high cash position, which hurt performance in a rising market, as well as other factors, such as the Fund’s portfolio being underweighted in certain sectors such as industrials, energy, and high-multiple technology stocks. The Board was satisfied with the Fund’s overall performance as shown in the Lipper report, noting that its total return for the one-year period exceeded 15%.
Templeton Developing Markets Securities Fund – The performance universe for this Fund consisted of the Fund and all emerging markets funds underlying variable insurance products as selected by Lipper. The Lipper report showed the Fund’s comparative total return for the one-year period to be in the second-lowest quintile of such performance universe and on an annualized basis to be in the highest quintile of such universe during the previous three-year period, and the second-lowest
SI-4
Franklin Templeton Variable Insurance Products Trust
Shareholder Information (continued)
Board Review of Investment Management Agreement (continued)
quintile of such universe during each of the previous five- and 10-year periods. The Board had discussed with management steps being taken to improve the Fund’s investment portfolio process and noted that investment flexibility had been limited by significant net redemptions during the one-year period. The Board also noted that the Fund’s total return as shown in the Lipper report for the one-year period exceeded 20% and was within 90 basis points of the performance universe median during such period. While intending to continuously monitor future performance, the Board believed the Fund’s performance as set forth in the Lipper report did not warrant any change in portfolio management or overall investment approach.
Templeton Foreign Securities Fund – The performance universe for this Fund consisted of the Fund and all international core funds underlying variable insurance products as selected by Lipper. The Lipper report showed the Fund’s comparative total return for the one-year period to be in the second-highest quintile of such performance universe and on an annualized basis to be in the highest or best performing quintile of such universe in each of the previous three- and five-year periods, and the second-highest quintile of such universe for the previous 10-year period. The Board was satisfied with the Fund’s investment performance as set forth in the Lipper report.
Templeton Global Bond Securities Fund – The performance universe for this Fund consisted of the Fund and all global income funds underlying variable insurance products as selected by Lipper. The Lipper report showed the Fund’s income return for the one-year period to be in the second-lowest quintile of such performance universe, but on an annualized basis to be in the highest or best performing quintile of such universe for each of the previous three-, five- and 10-year periods. The Lipper report showed the Fund’s total return for the one-year period to be in the highest or best performing quintile of its performance universe and on an annualized basis to also be in the highest quintile of such universe during each of the previous three-, five- and 10-year periods. Management discussed the Fund’s income return for the one-year period, pointing out that underperformance was primarily due to mark to market losses on currency forwards held in the Fund’s portfolio during the prior year that offset regular income such as bond coupons. The Board was satisfied with the Fund’s performance as set forth in the Lipper report, noting such explanation of one-year income return performance.
Templeton Growth Securities Fund – The performance universe for this Fund consisted of the Fund and all global value funds underlying variable insurance products as selected by Lipper. The Lipper report showed the Fund’s total return for the one-year period to be in the middle quintile of such performance universe and on an annualized basis to be in the middle quintiles of such universe for each of the previous three- and five-year periods, and to be in the second-highest quintile of such universe for the previous 10-year period. The Board noted steps taken by management to improve performance, including changes in the Fund’s portfolio managers that had taken place in recent years and found the Fund’s performance as shown in the Lipper report to be acceptable.
COMPARATIVE EXPENSES. Consideration was given to expense comparison information contained in the Lipper reports furnished for each Fund that compared its management fees and total expense ratio with those of a group of other funds selected by Lipper as its appropriate Lipper expense group. Lipper expense data is based upon information taken from each fund’s most recent annual report, which reflects historical asset levels that may be quite different from those currently existing, particularly in a period of market volatility. While recognizing such inherent limitation and the fact that expense ratios generally increase as assets decline and decrease as assets grow, the Board believed the independent analysis conducted by Lipper to be an appropriate measure of comparative expenses. In reviewing comparative costs, Lipper provides information on each Fund’s contractual investment management fee rate in comparison with the contractual investment management fee rate that would have been charged by other funds within its Lipper expense group assuming they were similar in size to the Fund, as well as the actual total expense ratio of the Fund in comparison with those of its Lipper expense group. The Lipper contractual investment management fee analysis includes administrative charges at the fund level as being part of a management fee, and actual total expenses, for comparative consistency, are shown by Lipper for the same class of shares for all funds within a particular Lipper expense group. The results of such comparisons showed that both the contractual investment management fee rates and actual total expense ratios of the following Funds were in the least expensive quintile of their respective Lipper expense group: Franklin Income Securities Fund, Franklin Small Cap Value Securities Fund, Franklin Growth and Income Securities Fund, Franklin High Income Securities Fund, Franklin Strategic Income Securities Fund, Templeton Global Bond Securities Fund and Franklin U.S. Government Fund. The Board was satisfied with the comparative contractual investment management fees and expenses of these
SI-5
Franklin Templeton Variable Insurance Products Trust
Shareholder Information (continued)
Board Review of Investment Management Agreement (continued)
Funds as shown in their Lipper reports. The contractual investment management fee rates and actual total expense ratio of each of Franklin Rising Dividends Securities Fund, Franklin Small-Mid Cap Growth Securities Fund and Franklin Templeton VIP Founding Funds Allocation Fund were below the medians of their Lipper expense groups. The contractual investment management fee rate of Templeton Foreign Securities Fund was at the median of its Lipper expense group, but its actual total expense ratio was below the median of such group. The Board was satisfied with the comparative contractual investment management fees and expenses of these Funds as shown in their Lipper reports. The contractual investment management fee rates for Mutual International Securities Fund, Templeton Growth Securities Fund, Franklin Global Real Estate Securities Fund and Franklin Large Cap Value Securities Fund were in the most expensive quintiles of their Lipper expense groups, but in each case their actual total expense ratios were at or below the medians of such groups. The Board was satisfied with the comparative expenses of these Funds as shown in their Lipper reports, noting that, with the exception of Templeton Growth Securities Fund, the expenses of these Funds were subsidized through fee waivers. The contractual investment management fee rate and actual total expense ratio of Franklin Flex Cap Growth Securities Fund were both within 20 basis points above the median of its Lipper expense group, while its actual total expense ratio, excluding 12b-1 fees, was below the median of such expenses for the expense group. The Board found the comparative expenses of this Fund as shown in its Lipper report to be acceptable, noting its expenses were subsidized through fee waivers. The contractual investment management fee rate and actual expense ratio for Franklin Large Cap Growth Securities Fund were in each case above, but within 10 basis points of the medians of its Lipper expense group. The Board found the comparative expenses of this Fund as shown in its Lipper reports to be acceptable. The contractual investment management fee rate and actual total expense ratio of Templeton Developing Markets Securities Fund were each in the most expensive quintile of its Lipper expense group. While acknowledging cost factors relating to the Fund’s operations, such as the quality and experience of its portfolio managers and research staff and the depth of its physical presence and coverage in developing markets geographical areas, the Board believed it appropriate to reduce the Fund’s investment management fee and negotiated with the Manager downward revisions in such fee as discussed under “Economies of Scale.” The contractual investment management fee rates and total expense ratios of both Mutual Global Discovery Securities Fund and Mutual Shares Securities Fund were in the most expensive quintiles of their Lipper expense groups, but the actual total expense ratio of Mutual Global Discovery Securities Fund was within 11 basis points of its expense group median, and the actual total expense ratio of Mutual Shares Securities Fund was within nine basis points of its expense group median. In discussing these comparative expenses, management stated its view that the expenses of these Funds were at an appropriate level in view of their superior investment performance, the quality and experience of their portfolio managers and the research-driven, fundamental value strategy employed in their portfolio selections. The Board found the comparative expenses of these Funds to be acceptable noting the points raised by management.
MANAGEMENT PROFITABILITY. The Board also considered the level of profits realized by the Manager and its affiliates in connection with the operation of each Fund. In this respect, the Board reviewed the Fund profitability analysis that addresses the overall profitability of Franklin Templeton’s U.S. fund business, as well as its profits in providing management and other services to each of the individual funds during the 12-month period ended September 30, 2010, being the most recent fiscal year-end for Franklin Resources, Inc., the Manager’s parent. In reviewing the analysis, specific attention was given to the methodology followed in allocating costs to each Fund, it being recognized that allocation methodologies are inherently subjective and various allocation methodologies may each be reasonable while producing different results. In this respect, the Board noted that, while being continuously refined and reflecting changes in the Manager’s own cost accounting, the allocation methodology was consistent with that followed in profitability report presentations for the Funds made in prior years and that the Funds’ independent registered public accounting firm had been engaged by the Manager to review the reasonableness of the allocation methodologies solely for use by the Funds’ Board in reference to the profitability analysis. In reviewing and discussing such analysis, management discussed with the Board its belief that costs incurred in establishing the infrastructure necessary for the type of mutual fund operations conducted by the Manager and its affiliates may not be fully reflected in the expenses allocated to each Fund in determining its profitability, as well as the fact that the level of profits, to a certain extent, reflected operational cost savings and efficiencies initiated by management. The Board also took into account management’s expenditures in improving shareholder services provided the Funds, as well as the need to meet additional regulatory and compliance requirements resulting from the Sarbanes-Oxley Act and recent SEC and other regulatory requirements. In addition, the Board considered a third-party study comparing the profitability of the Manager’s parent on an overall basis to other publicly held managers broken
SI-6
Franklin Templeton Variable Insurance Products Trust
Shareholder Information (continued)
Board Review of Investment Management Agreement (continued)
down to show profitability from management operations exclusive of distribution expenses, as well as profitability including distribution expenses. The Board also considered the extent to which the Manager and its affiliates might derive ancillary benefits from Fund operations, including potential benefits resulting from allocation of fund brokerage and the use of commission dollars to pay for research. Based upon its consideration of all these factors, the Board determined that the level of profits realized by the Manager and its affiliates from providing services to each Fund was not excessive in view of the nature, quality and extent of services provided.
ECONOMIES OF SCALE. The Board also considered whether economies of scale are realized by the Manager as the Funds grow larger and the extent to which this is reflected in the level of management fees charged. While recognizing that any precise determination is inherently subjective, the Board noted that based upon the Fund profitability analysis, it appears that as some funds get larger, at some point economies of scale do result in the Manager realizing a larger profit margin on management services provided such a fund. The Board also noted that economies of scale are shared with a fund and its shareholders through management fee breakpoints so that as a fund grows in size, its effective management fee rate declines. In the case of Franklin Templeton VIP Founding Funds Allocation Fund, the management fees of the underlying funds in which it invests have management fee breakpoints that extend beyond their existing asset sizes, and in the case of each of the other Funds, their management fees contain breakpoints that extend beyond their existing asset sizes. To the extent economies of scale may be realized by the Manager and its affiliates, the Board believed the schedule of investment management fees provides a sharing of benefits for each Fund and its shareholders. The current management advisory fee schedule for Templeton Developing Markets Securities Fund, reflecting reductions implemented effective May 1, 2010, provides a rate of 1.25% on the first $500 million of Fund net assets; 1.20% on the next $2.5 billion of Fund net assets; 1.15% on the next $1 billion of Fund net assets; 1.10% on the next $11 billion of Fund net assets; 1.05% on the next $5 billion of Fund net assets; and 1.00% on net assets in excess of $20 billion. The Board negotiated with management downward revisions in such fee effective May 1, 2011, so as to be at a rate of 1.10% on the first $1 billion of Fund net assets; 1.05% on the next $4 billion of Fund net assets; 1.00% on the next $5 billion of Fund net assets; 0.95% on the next $5 billion of Fund net assets; 0.90% on the next $5 billion of Fund net assets; and 0.85% on Fund net assets in excess of $20 billion. The Fund is also charged a separate fee for administrative services that starts at 0.15% on the first $200 million of Fund net assets, and declines through breakpoints to a fixed rate of 0.075% after net assets reach the $1.2 billion level. At the end of 2010, the Fund’s net assets were approximately $843 million, and to the extent economies of scale may be realized by the Manager and its affiliates, the Board believes the schedules of management advisory and administrative fees provide a sharing of benefits with this Fund and its shareholders.
Proxy Voting Policies and Procedures
The Trust’s investment manager has established Proxy Voting Policies and Procedures (Policies) that the Trust uses to determine how to vote proxies relating to portfolio securities. Shareholders may view the Trust’s complete Policies online at franklintempleton.com. Alternatively, shareholders may request copies of the Policies free of charge by calling the Proxy Group collect at (954) 527-7678 or by sending a written request to: Franklin Templeton Companies, LLC, 300 S.E. 2nd Street, Fort Lauderdale, FL 33301, Attention: Proxy Group. Copies of the Trust’s proxy voting records are also made available online at franklintempleton.com and posted on the U.S. Securities and Exchange Commission’s website at sec.gov and reflect the most recent 12-month period ended June 30.
Quarterly Statement of Investments
The Trust files a complete statement of investments with the U.S. Securities and Exchange Commission for the first and third quarters for each fiscal year on Form N-Q. Shareholders may view the filed Form N-Q by visiting the Commission’s website at sec.gov. The filed form may also be viewed and copied at the Commission’s Public Reference Room in Washington, DC. Information regarding the operations of the Public Reference Room may be obtained by calling (800) SEC-0330.
SI-7
| VALUE | BLEND | GROWTH | SECTOR | GLOBAL | INTERNATIONAL | HYBRID | ASSET ALLOCATION | FIXED INCOME |
 | < GAIN FROM OUR PERSPECTIVE® > |
Semiannual Report
FRANKLIN TEMPLETON
VARIABLE INSURANCE PRODUCTS TRUST
Investment Managers
Franklin Advisers, Inc.
Franklin Advisory Services, LLC
Franklin Mutual Advisers, LLC
Franklin Templeton Institutional, LLC
Templeton Asset Management, Ltd.
Templeton Global Advisors Limited
Templeton Investment Counsel, LLC
Fund Administrator
Franklin Templeton Services, LLC
Distributor
Franklin Templeton Distributors, Inc.
Franklin Templeton Variable Insurance Products Trust (FTVIP) shares are not offered to the public; they are offered and sold only to: (1) insurance company separate accounts (Separate Account) to serve as the underlying investment vehicle for variable contracts; (2) certain qualified plans; and (3) other mutual funds (funds of funds).
Authorized for distribution to investors in Separate Accounts only when accompanied or preceded by the current prospectus for the applicable contract, which includes the Separate Account and the FTVIP prospectuses. Investors should carefully consider a fund’s investment goals, risks, charges and expenses before investing. The prospectus contains this and other information; please read it carefully before investing.
To ensure the highest quality of service, telephone calls to or from our service departments may be monitored, recorded and accessed. These calls can be identified by the presence of a regular beeping tone.
| © 2011 Franklin Templeton Investments. All rights reserved. | FTVIP S 08/11 |
| Item 2. | Code of Ethics. |
| (a) | The Registrant has adopted a code of ethics that applies to its principal executive officers and principal financial and accounting officer. |
| (c) | N/A |
| (d) | N/A |
| (f) | Pursuant to Item 12(a)(1), the Registrant is attaching as an exhibit a copy of its code of ethics that applies to its principal executive officers and principal financial and accounting officer. |
| Item 3. | Audit Committee Financial Expert. |
| (a) | (1) The Registrant has an audit committee financial expert serving on its audit committee. |
| (2) | The audit committee financial expert is John B. Wilson and he is “Independent” as defined under the relevant Securities and Exchange Commission Rules and Releases. |
| Item 4. | Principal Accountant Fees and Services. N/A |
| Item 5. | Audit Committee of Listed Registrants. N/A |
| Item 6. | Schedule of Investments. N/A |
| Item 7. | Disclosure of Proxy Voting Policies and Procedures for Closed-End Management Investment Companies. N/A |
| Item 8. | Portfolio Managers of Closed-End Management Investment Companies. N/A |
| Item 9. | Purchases of Equity Securities by Closed-End Management Investment Companies and Affiliated Purchasers. N/A |
| Item 10. | Submission of Matters to a vote of Security Holders. |
There have been no changes to the procedures by which shareholders may recommend nominees to the Registrant’s Board of Trustees that would require disclosure herein.
| Item 11. | Controls and Procedures. |
(a) Evaluation of Disclosure Controls and Procedures. The Registrant maintains disclosure controls and procedures that are designed to ensure that information required to be disclosed in the Registrant’s filings under the Securities Exchange Act of 1934 and the Investment Company Act of 1940 is recorded, processed, summarized and reported within the periods specified in the rules and forms of the Securities and Exchange Commission. Such information is accumulated and communicated to the Registrant’s management, including its principal executive officer and principal financial officer, as appropriate, to allow timely decisions regarding required disclosure. The Registrant’s management, including the principal executive officer and the principal financial officer, recognizes that any set of controls and procedures, no matter how well designed and operated, can provide only reasonable assurance of achieving the desired control objectives.
Within 90 days prior to the filing date of this Shareholder Report on Form N-CSR, the Registrant had carried out an evaluation, under the supervision and with the participation of the Registrant’s management, including the Registrant’s principal executive officer and the Registrant’s principal financial officer, of the effectiveness of the design and operation of the Registrant’s disclosure controls and procedures. Based on such evaluation, the Registrant’s principal executive officer and principal financial officer concluded that the Registrant’s disclosure controls and procedures are effective.
(b) Changes in Internal Controls. There have been no significant changes in the Registrant’s internal controls or in other factors that could significantly affect the internal controls subsequent to the date of their evaluation in connection with the preparation of this Shareholder Report on Form N-CSR.
| Item 12. | Exhibits. |
(a) (1) Code of Ethics
(a) (2) Certifications pursuant to Section 302 of the Sarbanes-Oxley Act of 2002 of Laura F. Fergerson, Chief Executive Officer - Finance and Administration, and Gaston Gardey, Chief Financial Officer and Chief Accounting Officer
(b) Certifications pursuant to Section 906 of the Sarbanes-Oxley Act of 2002 of Laura F. Fergerson, Chief Executive Officer - Finance and Administration, and Gaston Gardey, Chief Financial Officer and Chief Accounting Officer
SIGNATURES
Pursuant to the requirements of the Securities Exchange Act of 1934 and the Investment Company Act of 1940, the registrant has duly caused this report to be signed on its behalf by the undersigned, thereunto duly authorized.
FRANKLIN TEMPLETON VARIABLE INSURANCE PRODUCTS TRUST
| By | /s/ LAURA F. FERGERSON | |
| Laura F. Fergerson | ||
| Chief Executive Officer – | ||
| Finance and Administration | ||
| Date August 25, 2011 | ||
Pursuant to the requirements of the Securities Exchange Act of 1934 and the Investment Company Act of 1940, this report has been signed below by the following persons on behalf of the registrant and in the capacities and on the dates indicated.
| By | /s/ LAURA F. FERGERSON | |
| Laura F. Fergerson | ||
| Chief Executive Officer – | ||
| Finance and Administration | ||
| Date August 25, 2011 | ||
| By | /s/ GASTON GARDEY | |
| Gaston Gardey | ||
| Chief Financial Officer and | ||
| Chief Accounting Officer | ||
| Date August 25, 2011 | ||