UNITED STATES
SECURITIES AND EXCHANGE COMMISSION
Washington, DC 20549
FORMN-CSRS
CERTIFIED SHAREHOLDER REPORT OF REGISTERED
MANAGEMENT INVESTMENT COMPANIES
Investment Company Act file number811-05583
Franklin Templeton Variable Insurance Products Trust
(Exact name of registrant as specified in charter)
One Franklin Parkway, San Mateo, CA 94403-1906
(Address of principal executive offices) (Zip code)
Craig S. Tyle, One Franklin Parkway, San Mateo, CA 94403-1906
(Name and address of agent for service)
Registrant’s telephone number, including area code: (650)312-2000
Date of fiscal year end: 12/31
Date of reporting period: 06/30/19
| Item 1. | Reports to Stockholders. |
SEMIANNUAL REPORT FRANKLIN TEMPLETON VARIABLE INSURANCE PRODUCTS TRUST June 30, 2019
Internet Delivery of Shareholder Reports: Effective January 1, 2021, as permitted by regulations adopted by the SEC, you may not be receiving paper copies of the Fund’s annual or semiannual shareholder reports by mail, unless you specifically request them from the insurance company that offers your variable annuity or variable life insurance contract or your financial intermediary. Instead of delivering paper copies of the report, the insurance company may choose to make the reports available on a website, and will notify you by mail each time a shareholder report is posted and provide you with a website link to access the report. Instructions for requesting paper copies will be provided by your insurance company.
If you already elected to receive shareholder reports electronically, you will not be affected by this change and you need not take any action. You may elect to receive shareholder reports and other communications from the insurance company or your financial intermediary electronically by following the instructions provided by the insurance company or by contacting your financial intermediary.
You may elect to receive all future Fund shareholder reports in paper free of charge from the insurance company. You can inform the insurance company or your financial intermediary that you wish to continue receiving paper copies of your shareholder reports by following the instructions provided by the insurance company or by contacting your financial intermediary. Your election to receive reports in paper will apply to all portfolio companies available under your contract with the insurance company.
This notice is not legally a part of the shareholder report.
Franklin Templeton Variable Insurance
Products Trust Semiannual Report
Table of Contents
*Not part of the annual report. Retain for your records.
| | | | |
Not FDIC Insured | May Lose Value | No Bank Guarantee | | | | |
MASTER CLASS – 2
FRANKLIN TEMPLETON VARIABLE INSURANCE PRODUCTS TRUST
Important Notes to
Performance Information
Performance data is historical and cannot predict or guarantee future results. Principal value and investment return will fluctuate with market conditions, and you may have a gain or loss when you withdraw your money. Inception dates of the funds may have preceded the effective dates of the subaccounts, contracts or their availability in all states.
When reviewing the index comparisons, please keep in mind that indexes have a number of inherent performance differentials over the funds. First, unlike the funds, which must hold a minimum amount of cash to maintain liquidity,
indexes do not have a cash component. Second, the funds are actively managed and, thus, are subject to management fees to cover salaries of securities analysts or portfolio managers in addition to other expenses. Indexes are unmanaged and do not include any commissions or other expenses typically associated with investing in securities. Third, indexes often contain a different mix of securities than the fund to which they are compared. Additionally, please remember that indexes are simply a measure of performance and cannot be invested in directly.
Franklin Allocation VIP Fund
(Formerly, Franklin Founding Funds Allocation VIP Fund)
This semiannual report for Franklin Allocation VIP Fund covers the period ended June 30, 2019. As previously communicated, effective May 1, 2019, the Fund changed its name to Franklin Allocation VIP Fund and changed from a fund of funds that invested fixed percentages in three underlying funds to an actively managed fund that invests in a variety of equity and fixed income investments.
Class 2 Performance Summary as of June 30, 2019
The Fund’s Class 2 Shares posted a +12.99% total return* for thesix-month period ended June 30, 2019.
*On May 1, 2019, the Fund’s investment strategies changed. Performance prior to May 1, 2019, is attributable to the Fund’s performance before the strategy change. The Fund has an expense reduction and a fee waiver associated with any investments in a Franklin Templeton money fund and/or other Franklin Templeton fund, contractually guaranteed through 4/30/20. Fund investment results reflect the expense reduction and fee waiver; without these reductions, the results would have been lower.
Performance reflects the Fund’s Class 2 operating expenses, but doesnotinclude any contract fees, expenses or sales charges. If they had been included, performance would be lower. These charges and deductions, particularly for variable life policies, can have a significant effect on contract values and insurance benefits. See the contract prospectus for a complete description of these expenses, including sales charges.
Performance data represent past performance, which does not guarantee future results. Investment return and principal value will fluctuate, and you may have a gain or loss when you sell your shares. Current performance may differ from figures shown.
FRANKLIN ALLOCATION VIP FUND
Fund Goal and Main Investments
The Fund seeks capital appreciation, with income as a secondary goal. Under normal market conditions, the Fund allocates approximately 60% of its assets to the equity asset class and 40% of its assets to the fixed income asset class by allocating the Fund’s assets among various sleeves (investment strategies).
Fund Risks
All investments involve risks, including possible loss of principal. Because the Fund invests in underlying funds, and the Fund’s performance is directly related to the performance of the underlying funds held by it, the ability of the Fund to achieve its investment goals is directly related to the ability of the underlying funds to meet their investment goals. Additionally, because these underlying funds may engage in a variety of investment strategies involving certain risks, the Fund may be subject to these same risks. Stock prices fluctuate, sometimes rapidly and dramatically, due to factors affecting individual companies, particular industries or sectors, or general market conditions. Bonds are affected by changes in interest rates and the creditworthiness of their issuers. Bond prices generally move in the opposite direction of interest rates. Thus, as prices of bonds adjust to a rise in interest rates, the Fund’s share price may decline. Higher yielding, lower rated corporate bonds entail a greater degree of credit risk compared to investment-grade securities. Foreign investing carries additional risks such as currency and market volatility and political or social instability, risks that are heightened in developing countries. Value securities may not increase in price as anticipated or may decline further in value. The Fund’s prospectus also includes a description of the main investment risks.
Performance Overview
You can find the Fund’ssix-month total return in the Performance Summary. In comparison, one of the Fund’s benchmarks, the Standard & Poor’s® 500 Index (S&P 500®) posted a +18.54% total return. The Fund’s new benchmarks, the Bloomberg Barclays U.S. Aggregate Index posted a +6.11% total return; the MSCI World ex USA Index posted a +17.38% total return; and the Linked Allocation VIP Fund Benchmark (Blended Benchmark) posted a +12.63% total
Portfolio Composition
Based on Total Net Assets as of 6/30/19
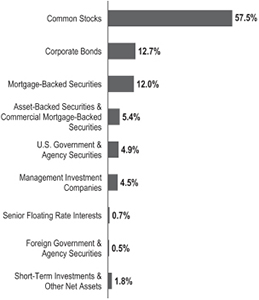
return.1,2 One of the Fund’s old benchmarks, the MSCI World Index posted a +17.38% total return for the same period.1 The Fund changed from a fund that invested fixed percentages in three underlying funds to an actively managed fund that invests in a variety of equity and fixed income investments; its benchmarks also changed.
Economic and Market Overview
The global economy expanded during the six months ended June 30, 2019, despite weakness in certain regions. Global developed and emerging market stocks were aided by upbeat economic data in some regions, encouraging corporate earnings reports and periods of optimism about a potential U.S.-China trade deal. Further supporting markets were the U.S. Federal Reserve’s (Fed’s) patient approach to its monetary policy in 2019 and recent indication it will act as appropriate to sustain U.S. economic expansion.
However, markets reflected concerns about political uncertainties in the U.S. and the European Union,
1. Source: Morningstar.
2. Source: Factset. The Fund’s blended benchmark was calculated internally and rebalanced monthly and was composed of 40% S&P 500, 40% Bloomberg Barclays U.S. Aggregate Bond Index and 20% MSCI World ex USA Index.
One cannot invest directly in an index, and an index is not representative of the Fund’s portfolio. Please see Index Descriptions following the Fund Summaries.
The dollar value, number of shares or principal amount, and names of all portfolio holdings are listed in the Fund’s Statement of Investments (SOI).
FRANKLIN ALLOCATION VIP FUND
geopolitical risks in certain regions, and the impact of U.S. trade disputes with China and other trading partners on global growth and corporate earnings. In this environment, global developed and emerging stocks, as measured by the MSCI All Country World Index, posted a +16.60% total return for thesix-month period.1
The U.S. economy grew during the six months ended June 30, 2019. After moderating for two consecutive quarters, the economy grew significantly faster in 2019’s first quarter, driven by growth in consumer spending, inventory investment, exports, business investment, and state and local government spending. However, the economy moderated again in the second quarter, due to weakness in inventory investment, exports, business investment and housing investment. The unemployment rate decreased from 3.9% in December 2018 to 3.7% atperiod-end.3 However, the economy moderated again in the second quarter, due to weakness in inventory investment, exports, business investment and housing investment. The annual inflation rate, as measured by the Consumer Price Index, decreased from 1.9% in December 2018 to 1.6% atperiod-end.3
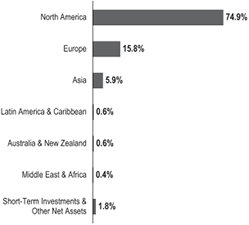
Geographic Composition
Based on Total Net Assets as of 6/30/19
The Fed held its target range for the federal funds rate unchanged, at 2.25%–2.50%, during the reporting period. In March, the Fed mentioned it would end its balance sheet normalization program by the end of September 2019. In June, the Fed indicated increased uncertainties around its views on economic activity and the labor market. With
market-based inflation measures remaining low recently, the market has interpreted the Fed’s recent statements to mean it will likely cut rates in 2019’s second half to foster continued economic growth while attempting to achieve its inflation objective.
In Europe, the U.K.’s quarterly gross domestic product (GDP) growth accelerated in 2019’s first quarter. The Bank of England left its key policy rate unchanged during the period. The eurozone’s quarterly GDP accelerated in 2019’s first quarter. However, the bloc’s annual inflation rate decreased during the period. The European Central Bank (ECB) kept its benchmark interest rate unchanged during the period. In June, the ECB mentioned it would leave interest rates unchanged through the first half of 2020, provided details of its new stimulus, and indicated its openness to cut rates or increase stimulus.
In Asia, Japan’s quarterly GDP growth accelerated in 2019’s first quarter. In June, the Bank of Japan also left its benchmark interest rate unchanged, while continuing its stimulus measures, and expressed its openness to cut interest rates or increase stimulus.
In larger emerging markets, Brazil’s quarterly GDP growth contracted in 2019’s first quarter. The Central Bank of Brazil left its benchmark interest rate unchanged during the period. Russia’s annual GDP growth moderated in 2019’s first quarter. The Bank of Russia cut its key rate once during the period. China’s annual GDP growth rate stabilized in 2019’s first quarter. The People’s Bank of China left its benchmark interest rate unchanged, but it took measures to improve financial liquidity to mitigate the effects of the U.S.-China trade dispute and support economic growth. Overall, global emerging market stocks, as measured by the MSCI Emerging Markets Index, posted a +10.78% total return during thesix-month period.1
Investment Strategy
The Fund seeks to achieve its investment goals by allocating its assets among the broad asset classes of equity and fixed income investments through a variety of investment strategies or “sleeves” managed by the investment manager or its affiliates, which include Franklin U.S. Smart Beta Equity Strategy, Franklin Total Return Strategy, Franklin Growth Strategy, Templeton Foreign Strategy, Franklin International Growth Strategy, Franklin U.S. Government Securities Strategy, Franklin Rising Dividends Strategy, Franklin Investment Grade Corporate Strategy and Templeton Global
3. Source: U.S. Bureau of Labor Statistics.
See www.franklintempletondatasources.com for additional data provider information.
FRANKLIN ALLOCATION VIP FUND
Bond VIP Fund Strategy. The Fund is structured as a multi-manager fund (meaning the Fund’s assets are managed by multiplesub-advisors), with the investment manager having overall responsibility for the Fund’s investments. Allocation to each sleeve will generally not exceed 20% and will vary with market conditions. However, under normal market conditions, no sleeve constitutes a majority of the Fund’s assets.
Manager’s Discussion
From January 1, 2019, through the date of the investment strategy change on May 1, 2019, the Fund’s performance can be attributed largely to its allocation among the underlying funds and their investments in domestic and foreign equities, fixed income securities, and short-term investments and other net assets. For the period after the investment strategy change through June 30, 2019, the Fund’s performance can be attributed largely to its allocation among the underlying sleeves and their investments in domestic and foreign equities, fixed income securities, and short-term investments and other net assets. The allocation to the sleeves did not change over the period.
| | |
| Top 10 Holdings | | |
| 6/30/19 | | |
| |
Company
Sector/Industry | | % of Total
Net Assets |
| |
Templeton Global Bond VIP Fund Diversified Financials | | 4.0% |
| |
Microsoft Corp. Software & Services | | 1.1% |
| |
Apple Inc. Technology Hardware & Equipment | | 0.7% |
| |
Amazon.com Inc. Retailing | | 0.6% |
| |
Linde PLC (United Kingdom) Materials | | 0.6% |
| |
Texas Instruments Inc. Semiconductors & Semiconductor Equipment | | 0.5% |
| |
Mastercard Inc. Software & Services | | 0.5% |
| |
Roper Technologies Inc. Capital Goods | | 0.5% |
| |
Union Pacific Corp. Transportation | | 0.5% |
| |
NIKE Inc. Consumer Durables & Apparel | | 0.5% |
For the period before the investment strategy change, Franklin Income VIP Fund – Class 1 and Franklin Mutual
Shares VIP Fund – Class 1 underperformed the S&P 500. Templeton Growth VIP Fund – Class 1 underperformed the MSCI World Index. For the period after the investment strategy change, the Franklin Growth Strategy outperformed the S&P 500, the Franklin Rising Dividends Strategy outperformed the S&P 500, the Templeton Foreign Strategy underperformed the MSCI All Country World ex U.S.A. Index, the Franklin International Growth Strategy underperformed the MSCI EAFE Index , the U.S. Smart Beta Equity Strategy outperformed the Russell 1000® Index, the Franklin U.S. Government Securities Strategy underperformed the Bloomberg Barclays U.S. Government Index: Intermediate Component, the Investment-Grade Corporate Strategy outperformed the Bloomberg Barclays U.S. Corporate Index: Investment-Grade Component.
Thank you for your participation in Franklin Allocation VIP Fund. We look forward to serving your future investment needs.
|
The foregoing information reflects our analysis, opinions and portfolio holdings as of June 30, 2019, the end of the reporting period. The way we implement our main investment strategies and the resulting portfolio holdings may change depending on factors such as market and economic conditions. These opinions may not be relied upon as investment advice or an offer for a particular security. The information is not a complete analysis of every aspect of any market, country, industry, security or the Fund. Statements of fact are from sources considered reliable, but the investment manager makes no representation or warranty as to their completeness or accuracy. Although historical performance is no guarantee of future results, these insights may help you understand our investment management philosophy. |
FRANKLIN ALLOCATION VIP FUND
Class 2 Fund Expenses
As an investor in a variable insurance contract (Contract) that indirectly provides for investment in an underlying mutual fund, you can incur transaction and/or ongoing expenses at both the Fund level and the Contract Level: (1) transaction expenses can include sales charges (loads) on purchases, surrender fees, transfer fees and premium taxes; and (2) ongoing expenses can include management fees, distribution and service(12b-1) fees, contract fees, annual maintenance fees, mortality and expense risk fees and other fees and expenses. All mutual funds and Contracts have some types of ongoing expenses. The table below shows Fund-level ongoing expenses and can help you understand these costs and compare them with those of other mutual funds offered through the Contract. The table assumes a $1,000 investment held for the six months indicated. Please refer to the Fund prospectus for additional information on operating expenses.
Actual Fund Expenses
The table below provides information about the actual account values and actual expenses in the columns under the heading “Actual.” In these columns the Fund’s actual return, which includes the effect of ongoing Fund expenses but does not include the effect of ongoing Contract expenses, is used to calculate the “Ending Account Value.” You can estimate the Fund-level expenses you paid during the period by following these steps (ofcourse, your account value and expenses will differ from those in this illustration):Divide your account value by $1,000 (ifyour account had an $8,600 value, then $8,600÷ $1,000 = 8.6). Then multiply the result by the number under the headings “Actual” and “Fund-Level Expenses Paid During Period” (ifFund-Level Expenses Paid During Period were $ 7.50, then 8.6 x $ 7.50 = $64.50). In this illustration, the estimated expenses paid this period at the Fund level are $64.50.
Hypothetical Example for Comparison with Other Mutual Funds
Under the heading “Hypothetical” in the table, information is provided about hypothetical account values and hypothetical expenses based on the Fund’s actual expense ratio and an assumed rate of return of 5% per year before expenses, which is not the Fund’s actual return. This information may not be used to estimate the actual ending account balance or expenses you paid for the period, but it can help you compare ongoing costs of investing in the Fund with those of other mutual funds offered through the Contract. To do so, compare this 5% hypothetical example with the 5% hypothetical examples that appear in the shareholder reports of other funds offered through the Contract.
Please note that expenses shown in the table are meant to highlight ongoing costs at the Fund level only and do not reflect any ongoing expenses at the Contract level, or transaction expenses at either the Fund or Contract levels. In addition, while the Fund does not have transaction expenses, if the transaction and ongoing expenses at the Contract level were included, the expenses shown below would be higher. You should consult your Contract prospectus or disclosure document for more information.
| | | | | | | | | | | | | | | | | | |
| | | | | | | Actual
(actual return after expenses) | | | | Hypothetical
(5% annual return before expenses) | | | | |
Share Class | | Beginning
Account
Value 1/1/19 | | | | Ending
Account
Value 6/30/19 | | Fund-Level
Expenses
Paid During
Period
1/1/19–6/30/191,2 | | | | Ending
Account
Value 6/30/19 | | Fund-Level
Expenses
Paid During Period
1/1/19–6/30/191,2 | | | | Net
Annualized
Expense
Ratio2 |
Class 2 | | $1,000 | | | | $1,129.90 | | $2.59 | | | | $1,022.36 | | $2.46 | | | | 0.49% |
1. Expenses are equal to the annualized expense ratio for thesix-month period as indicated above—in the far right column—multiplied by the simple average account value over the period indicated, and then multiplied by 181/365 to reflect theone-half year period.
2. Reflects expenses after fee waivers and expense reimbursements. Does not include acquired fund fees and expenses from 1/1/2019 to 4/30/2019 and includes acquired fees and expenses from 5/1/2019 to 6/30/2019.
Effective 5/01/2019, the expense waiver changed and the new annualized net expense ratio was 0.82%. Had such expense waiver been in effect for the full period, the expenses paid would have been $4.33 based upon the Fund’s actual performance and $4.11 based upon a hypothetical 5% return.
FRANKLIN TEMPLETON VARIABLE INSURANCE PRODUCTS TRUST
Financial Highlights
Franklin Allocation VIP Fund
| | | | | | | | | | | | | | | | | | | | | | | | |
| | |
| | | Six Months Ended June 30, 2019 (unaudited) | | | Year Ended December 31, | |
| | | 2018 | | | 2017 | | | 2016 | | | 2015 | | | 2014 | |
| |
| | | | | | |
| Class 1 | | | | | | | | | | | | | | | | | | | | | | | | |
| | | | | | |
Per share operating performance
(for a share outstanding throughout the period) | | | | | | | | | | | | | | | | | | | | | | | | |
| | | | | | |
Net asset value, beginning of period | | | $ 6.37 | | | | $ 7.44 | | | | $ 7.13 | | | | $ 6.80 | | | | $ 7.47 | | | | $ 7.47 | |
| | | | |
| | | | | | |
| Income from investment operationsa: | | | | | | | | | | | | | | | | | | | | | | | | |
| | | | | | |
Net investment incomeb,c | | | 0.05 | | | | 0.23 | | | | 0.21 | | | | 0.21 | | | | 0.26 | | | | 0.22 | |
| | | | | | |
Net realized and unrealized gains (losses) | | | 0.77 | | | | (0.89 | ) | | | 0.63 | | | | 0.64 | | | | (0.68 | ) | | | 0.02 | |
| | | | |
| | | | | | |
Total from investment operations | | | 0.82 | | | | (0.66 | ) | | | 0.84 | | | | 0.85 | | | | (0.42 | ) | | | 0.24 | |
| | | | |
| | | | | | |
Less distributions from: | | | | | | | | | | | | | | | | | | | | | | | | |
| | | | | | |
Net investment income | | | (0.27 | ) | | | (0.24 | ) | | | (0.22 | ) | | | (0.29 | ) | | | (0.24 | ) | | | (0.23) | |
| | | | | | |
Net realized gains | | | (0.46 | ) | | | (0.17 | ) | | | (0.31 | ) | | | (0.23 | ) | | | (0.01 | ) | | | (0.01) | |
| | | | |
| | | | | | |
Total distributions | | | (0.73 | ) | | | (0.41 | ) | | | (0.53 | ) | | | (0.52 | ) | | | (0.25 | ) | | | (0.24) | |
| | | | |
| | | | | | |
Net asset value, end of period | | | $ 6.46 | | | | $ 6.37 | | | | $ 7.44 | | | | $ 7.13 | | | | $ 6.80 | | | | $ 7.47 | |
| | | | |
| | | | | | |
Total returnd | | | 13.04% | | | | (9.34)% | | | | 12.17% | | | | 13.43% | | | | (5.93)% | | | | 3.05% | |
| | | | | | |
| Ratios to average net assetse | | | | | | | | | | | | | | | | | | | | | | | | |
| | | | | | |
Expenses before waiver and payments by affiliatesf | | | 0.27% | | | | 0.12% | | | | 0.12% | | | | 0.11% | | | | 0.11% | | | | 0.11% | |
| | | | | | |
Expenses net of waiver and payments by affiliatesf | | | 0.24% | | | | 0.10% | | | | 0.10% | | | | 0.10% | | | | 0.10% | | | | 0.10% | |
| | | | | | |
Net investment incomec | | | 1.36% | | | | 3.13% | | | | 2.75% | | | | 3.09% | | | | 3.51% | | | | 2.88% | |
| | | | | | |
| Supplemental data | | | | | | | | | | | | | | | | | | | | | | | | |
| | | | | | |
Net assets, end of period (000’s) | | | $1,139 | | | | $984 | | | | $1,047 | | | | $1,025 | | | | $1,083 | | | | $1,114 | |
| | | | | | |
Portfolio turnover rate | | | 130.55% | | | | 2.23% | | | | 1.28% | | | | 0.10% | | | | 0.26% | | | | 4.80% | |
| | | | | | |
Portfolio turnover rate excluding mortgage dollar rolls | | | 128.50% | g | | | 2.23% | | | | 1.28% | | | | 0.10% | | | | 0.26% | | | | 4.80% | |
aThe amount shown for a share outstanding throughout the period may not correlate with the Statement of Operations for the period due to the timing of sales and repurchases of the Fund’s shares in relation to income earned and/or fluctuating fair value of the investments of the Fund.
bBased on average daily shares outstanding.
cRecognition of net investment income by the Fund is affected by the timing of declaration of dividends by the Underlying Funds and exchange traded funds in which the Fund invests.
dTotal return does not include fees, charges or expenses imposed by the variable annuity and life insurance contracts for which Franklin Templeton Variable Insurance Products Trust serves as an underlying investment vehicle. Total return is not annualized for periods less than one year.
eRatios are annualized for periods less than one year.
fDoes not include expenses of the Underlying Funds and exchange traded funds in which the Fund invests. The weighted average indirect expenses of the Underlying Funds and exchange traded funds was 0.39% for the period ended June 30, 2019.
gSee Note 1(e) regarding mortgage dollar rolls.
| | | | |
| | | |
FFA-6 | | Semiannual Report | The accompanying notes are an integral part of these financial statements. | | |
FRANKLIN TEMPLETON VARIABLE INSURANCE PRODUCTS TRUST
FINANCIAL HIGHLIGHTS
Franklin Allocation VIP Fund(continued)
| | | | | | | | | | | | | | | | | | | | | | | | |
| | |
| | | Six Months Ended June 30, 2019 (unaudited) | | | Year Ended December 31, | |
| | | 2018 | | | 2017 | | | 2016 | | | 2015 | | | 2014 | |
| |
| | | | | | |
| Class 2 | | | | | | | | | | | | | | | | | | | | | | | | |
| | | | | | |
Per share operating performance (for a share outstanding throughout the period) | | | | | | | | | | | | | | | | | | | | | | | | |
| | | | | | |
Net asset value, beginning of period | | | $ 6.32 | | | | $ 7.39 | | | | $ 7.08 | | | | $ 6.75 | | | | $ 7.42 | | | | $ 7.42 | |
| | | | |
| | | | | | |
| Income from investment operationsa: | | | | | | | | | | | | | | | | | | | | | | | | |
| | | | | | |
Net investment incomeb,c | | | 0.04 | | | | 0.21 | | | | 0.18 | | | | 0.19 | | | | 0.24 | | | | 0.20 | |
| | | | | | |
Net realized and unrealized gains (losses) | | | 0.77 | | | | (0.89 | ) | | | 0.64 | | | | 0.64 | | | | (0.68 | ) | | | 0.02 | |
| | | | |
| | | | | | |
Total from investment operations | | | 0.81 | | | | (0.68 | ) | | | 0.82 | | | | 0.83 | | | | (0.44 | ) | | | 0.22 | |
| | | | |
| | | | | | |
Less distributions from: | | | | | | | | | | | | | | | | | | | | | | | | |
| | | | | | |
Net investment income | | | (0.25 | ) | | | (0.22 | ) | | | (0.20 | ) | | | (0.27 | ) | | | (0.22 | ) | | | (0.21) | |
| | | | | | |
Net realized gains | | | (0.46 | ) | | | (0.17 | ) | | | (0.31 | ) | | | (0.23 | ) | | | (0.01 | ) | | | (0.01) | |
| | | | |
| | | | | | |
Total distributions | | | (0.71 | ) | | | (0.39 | ) | | | (0.51 | ) | | | (0.50 | ) | | | (0.23 | ) | | | (0.22) | |
| | | | |
| | | | | | |
Net asset value, end of period | | | $ 6.42 | | | | $ 6.32 | | | | $ 7.39 | | | | $ 7.08 | | | | $ 6.75 | | | | $ 7.42 | |
| | | | |
| | | | | | |
Total returnd | | | 12.99% | | | | (9.65)% | | | | 11.98% | | | | 13.18% | | | | (6.21)% | | | | 2.85% | |
| | | | | | |
| Ratios to average net assetse | | | | | | | | | | | | | | | | | | | | | | | | |
| | | | | | |
Expenses before waiver and payments by affiliatesf | | | 0.52% | | | | 0.37% | | | | 0.37% | | | | 0.36% | | | | 0.36% | | | | 0.36% | |
| | | | | | |
Expenses net of waiver and payments by affiliatesf | | | 0.49% | | | | 0.35% | | | | 0.35% | | | | 0.35% | | | | 0.35% | | | | 0.35% | |
| | | | | | |
Net investment incomec | | | 1.11% | | | | 2.88% | | | | 2.50% | | | | 2.84% | | | | 3.26% | | | | 2.63% | |
| | | | | | |
| Supplemental data | | | | | | | | | | | | | | | | | | | | | | | | |
| | | | | | |
Net assets, end of period (000’s) | | | $415,902 | | | | $390,300 | | | | $480,402 | | | | $474,669 | | | | $480,715 | | | | $557,704 | |
| | | | | | |
Portfolio turnover rate | | | 130.55% | | | | 2.23% | | | | 1.28% | | | | 0.10% | | | | 0.26% | | | | 4.80% | |
| | | | | | |
Portfolio turnover rate excluding mortgage dollar rolls | | | 128.50% | g | | | 2.23% | | | | 1.28% | | | | 0.10% | | | | 0.26% | | | | 4.80% | |
aThe amount shown for a share outstanding throughout the period may not correlate with the Statement of Operations for the period due to the timing of sales and repurchases of the Fund’s shares in relation to income earned and/or fluctuating fair value of the investments of the Fund.
bBased on average daily shares outstanding.
cRecognition of net investment income by the Fund is affected by the timing of declaration of dividends by the Underlying Funds and exchange traded funds in which the Fund invests.
dTotal return does not include fees, charges or expenses imposed by the variable annuity and life insurance contracts for which Franklin Templeton Variable Insurance Products Trust serves as an underlying investment vehicle. Total return is not annualized for periods less than one year.
eRatios are annualized for periods less than one year.
fDoes not include expenses of the Underlying Funds and exchange traded funds in which the Fund invests. The weighted average indirect expenses of the Underlying Funds and exchange traded funds was 0.39% for the period ended June 30, 2019.
gSee Note 1(e) regarding mortgage dollar rolls.
| | | | | | |
| | | |
| | The accompanying notes are an integral part of these financial statements. | Semiannual Report | | | FFA-7 | |
FRANKLIN TEMPLETON VARIABLE INSURANCE PRODUCTS TRUST
FINANCIAL HIGHLIGHTS
Franklin Allocation VIP Fund(continued)
| | | | | | | | | | | | | | | | | | | | | | | | |
| | |
| | | Six Months Ended June 30, 2019 (unaudited) | | | Year Ended December 31, | |
| | | 2018 | | | 2017 | | | 2016 | | | 2015 | | | 2014 | |
| |
| | | | | | |
| Class 4 | | | | | | | | | | | | | | | | | | | | | | | | |
| | | | | | |
Per share operating performance
(for a share outstanding throughout the period) | | | | | | | | | | | | | | | | | | | | | | | | |
| | | | | | |
Net asset value, beginning of period | | | $ 6.46 | | | | $ 7.53 | | | | $ 7.21 | | | | $ 6.87 | | | | $ 7.54 | | | | $ 7.54 | |
| | | | |
| | | | | | |
| Income from investment operationsa: | | | | | | | | | | | | | | | | | | | | | | | | |
| | | | | | |
Net investment incomeb,c | | | 0.03 | | | | 0.20 | | | | 0.18 | | | | 0.19 | | | | 0.23 | | | | 0.20 | |
| | | | | | |
Net realized and unrealized gains (losses) | | | 0.79 | | | | (0.89 | ) | | | 0.64 | | | | 0.64 | | | | (0.68 | ) | | | 0.02 | |
| | | | |
| | | | | | |
Total from investment operations | | | 0.82 | | | | (0.69 | ) | | | 0.82 | | | | 0.83 | | | | (0.45 | ) | | | 0.22 | |
| | | | |
| | | | | | |
Less distributions from: | | | | | | | | | | | | | | | | | | | | | | | | |
| | | | | | |
Net investment income | | | (0.24 | ) | | | (0.21 | ) | | | (0.19 | ) | | | (0.26 | ) | | | (0.21 | ) | | | (0.21) | |
| | | | | | |
Net realized gains | | | (0.46 | ) | | | (0.17 | ) | | | (0.31 | ) | | | (0.23 | ) | | | (0.01 | ) | | | (0.01) | |
| | | | |
| | | | | | |
Total distributions | | | (0.70 | ) | | | (0.38 | ) | | | (0.50 | ) | | | (0.49 | ) | | | (0.22 | ) | | | (0.22) | |
| | | | |
| | | | | | |
Net asset value, end of period | | | $ 6.58 | | | | $ 6.46 | | | | $ 7.53 | | | | $ 7.21 | | | | $ 6.87 | | | | $ 7.54 | |
| | | | |
| | | | | | |
Total returnd | | | 12.87% | | | | (9.58)% | | | | 11.78% | | | | 12.92% | | | | (6.24)% | | | | 2.75% | |
| | | | | | |
| Ratios to average net assetse | | | | | | | | | | | | | | | | | | | | | | | | |
| | | | | | |
Expenses before waiver and payments by affiliatesf | | | 0.62% | | | | 0.47% | | | | 0.47% | | | | 0.46% | | | | 0.46% | | | | 0.46% | |
| | | | | | |
Expenses net of waiver and payments by affiliatesf | | | 0.59% | | | | 0.45% | | | | 0.45% | | | | 0.45% | | | | 0.45% | | | | 0.45% | |
| | | | | | |
Net investment incomec | | | 1.01% | | | | 2.78% | | | | 2.40% | | | | 2.74% | | | | 3.16% | | | | 2.53% | |
| | | | | | |
| Supplemental data | | | | | | | | | | | | | | | | | | | | | | | | |
| | | | | | |
Net assets, end of period (000’s) | | | $408,472 | | | | $393,385 | | | | $528,862 | | | | $530,403 | | | | $550,825 | | | | $702,324 | |
| | | | | | |
Portfolio turnover rate | | | 130.55% | | | | 2.23% | | | | 1.28% | | | | 0.10% | | | | 0.26% | | | | 4.80% | |
| | | | | | |
Portfolio turnover rate excluding mortgage dollar rolls | | | 128.50% | g | | | 2.23% | | | | 1.28% | | | | 0.10% | | | | 0.26% | | | | 4.80% | |
aThe amount shown for a share outstanding throughout the period may not correlate with the Statement of Operations for the period due to the timing of sales and repurchases of the Fund’s shares in relation to income earned and/or fluctuating fair value of the investments of the Fund.
bBased on average daily shares outstanding.
cRecognition of net investment income by the Fund is affected by the timing of declaration of dividends by the Underlying Funds and exchange traded funds in which the Fund invests.
dTotal return does not include fees, charges or expenses imposed by the variable annuity and life insurance contracts for which Franklin Templeton Variable Insurance Products Trust serves as an underlying investment vehicle. Total return is not annualized for periods less than one year.
eRatios are annualized for periods less than one year.
fDoes not include expenses of the Underlying Funds and exchange traded funds in which the Fund invests. The weighted average indirect expenses of the Underlying Funds and exchange traded funds was 0.39% for the period ended June 30, 2019.
gSee Note 1(e) regarding mortgage dollar rolls.
| | | | |
| | | |
FFA-8 | | Semiannual Report | The accompanying notes are an integral part of these financial statements. | | |
FRANKLIN TEMPLETON VARIABLE INSURANCE PRODUCTS TRUST
Statement of Investments, June 30, 2019 (unaudited)
Franklin Allocation VIP Fund
| | | | | | | | | | |
| | | Country | | Shares | | | Value | |
| |
| | | |
Common Stocks 57.5% | | | | | | | | | | |
Automobiles & Components 0.6% | | | | | | | | | | |
Aptiv PLC | | United States | | | 26,000 | | | $ | 2,101,579 | |
BorgWarner Inc. | | United States | | | 11,694 | | | | 490,914 | |
Cie Generale des Etablissements Michelin SCA | | France | | | 7,087 | | | | 898,742 | |
Ford Motor Co. | | United States | | | 49,009 | | | | 501,362 | |
Gentex Corp. | | United States | | | 7,242 | | | | 178,226 | |
Lear Corp. | | United States | | | 1,609 | | | | 224,086 | |
Sumitomo Rubber Industries Ltd. | | Japan | | | 56,200 | | | | 649,464 | |
Thor Industries Inc. | | United States | | | 1,287 | | | | 75,225 | |
| | | | | | | | | | |
| | | |
| | | | | | | | | 5,119,598 | |
| | | | | | | | | | |
Banks 2.7% | | | | | | | | | | |
Bangkok Bank PCL, fgn | | Thailand | | | 46,100 | | | | 298,921 | |
Bangkok Bank PCL, NVDR | | Thailand | | | 23,800 | | | | 152,773 | |
Bank of Ireland Group PLC | | Ireland | | | 184,044 | | | | 961,623 | |
Barclays PLC | | United Kingdom | | | 428,479 | | | | 815,132 | |
BNP Paribas SA | | France | | | 56,661 | | | | 2,690,295 | |
FinecoBank Banca Fineco SpA | | Italy | | | 190,000 | | | | 2,118,975 | |
Hana Financial Group Inc. | | South Korea | | | 36,260 | | | | 1,172,165 | |
HSBC Holdings PLC (GBP Traded) | | United Kingdom | | | 192,145 | | | | 1,602,931 | |
HSBC Holdings PLC (HKD Traded) | | United Kingdom | | | 16,000 | | | | 132,716 | |
ING Groep NV | | Netherlands | | | 171,468 | | | | 1,987,541 | |
Kasikornbank PCL, fgn | | Thailand | | | 100,800 | | | | 622,405 | |
KB Financial Group Inc. | | South Korea | | | 62,761 | | | | 2,487,244 | |
KBC Groep NV | | Belgium | | | 30,000 | | | | 1,965,841 | |
People’s United Financial Inc. | | United States | | | 8,691 | | | | 145,835 | |
Shinhan Financial Group Co. Ltd. | | South Korea | | | 21,953 | | | | 851,980 | |
Standard Chartered PLC | | United Kingdom | | | 299,437 | | | | 2,715,888 | |
Sumitomo Mitsui Financial Group Inc., ADR | | Japan | | | 209,200 | | | | 1,476,952 | |
| | | | | | | | | | |
| | | |
| | | | | | | | | 22,199,217 | |
| | | | | | | | | | |
Capital Goods 6.2% | | | | | | | | | | |
3M Co. | | United States | | | 12,027 | | | | 2,084,760 | |
Allegion PLC | | United States | | | 4,995 | | | | 552,197 | |
Allison Transmission Holdings Inc. | | United States | | | 965 | | | | 44,728 | |
AMETEK Inc. | | United States | | | 4,953 | | | | 449,930 | |
BAE Systems PLC | | United Kingdom | | | 158,378 | | | | 996,409 | |
The Boeing Co. | | United States | | | 9,974 | | | | 3,630,636 | |
BWX Technologies Inc. | | United States | | | 14,545 | | | | 757,794 | |
CAE Inc. | | Canada | | | 47,000 | | | | 1,263,501 | |
Carlisle Cos. Inc. | | United States | | | 3,300 | | | | 463,353 | |
Caterpillar Inc. | | United States | | | 3,957 | | | | 539,300 | |
CK Hutchison Holdings Ltd. | | Hong Kong | | | 179,500 | | | | 1,769,231 | |
Compagnie de Saint-Gobain | | France | | | 26,493 | | | | 1,032,314 | |
Cummins Inc. | | United States | | | 3,862 | | | | 661,715 | |
Deere & Co. | | United States | | | 3,589 | | | | 594,733 | |
Donaldson Co. Inc. | | United States | | | 8,800 | | | | 447,568 | |
Dover Corp. | | United States | | | 9,800 | | | | 981,960 | |
Emerson Electric Co. | | United States | | | 24,482 | | | | 1,633,439 | |
FRANKLIN TEMPLETON VARIABLE INSURANCE PRODUCTS TRUST
STATEMENT OF INVESTMENTS (UNAUDITED)
Franklin Allocation VIP Fund(continued)
| | | | | | | | | | |
| | | Country | | Shares | | | Value | |
| |
| | | |
Common Stocks(continued) | | | | | | | | | | |
Capital Goods(continued) | | | | | | | | | | |
Fastenal Co. | | United States | | | 17,704 | | | $ | 576,973 | |
Ferguson PLC | | United Kingdom | | | 34,000 | | | | 2,417,985 | |
Fortive Corp. | | United States | | | 3,817 | | | | 311,162 | |
General Dynamics Corp. | | United States | | | 13,184 | | | | 2,397,115 | |
Graco Inc. | | United States | | | 4,265 | | | | 214,018 | |
Honeywell International Inc. | | United States | | | 13,800 | | | | 2,409,342 | |
Huntington Ingalls Industries Inc. | | United States | | | 3,218 | | | | 723,213 | |
Illinois Tool Works Inc. | | United States | | | 7,173 | | | | 1,081,760 | |
Ingersoll-Rand PLC | | United States | | | 7,870 | | | | 996,893 | |
Johnson Controls International PLC | | United States | | | 24,400 | | | | 1,007,964 | |
Lockheed Martin Corp. | | United States | | | 7,666 | | | | 2,786,898 | |
MSC Industrial Direct Co. Inc., A | | United States | | | 1,046 | | | | 77,676 | |
MTU Aero Engines AG | | Germany | | | 11,000 | | | | 2,619,871 | |
Northrop Grumman Corp. | | United States | | | 7,858 | | | | 2,538,998 | |
nVent Electric PLC | | United States | | | 15,800 | | | | 391,682 | |
Pentair PLC | | United States | | | 14,500 | | | | 539,400 | |
Raytheon Co. | | United States | | | 14,005 | | | | 2,435,189 | |
Rockwell Automation Inc. | | United States | | | 3,540 | | | | 579,958 | |
Roper Technologies Inc. | | United States | | | 10,800 | | | | 3,955,608 | |
Sinopec Engineering Group Co. Ltd. | | China | | | 751,500 | | | | 636,820 | |
Snap-on Inc. | | United States | | | 402 | | | | 66,587 | |
Stanley Black & Decker Inc. | | United States | | | 5,402 | | | | 781,183 | |
Toro Co. | | United States | | | 3,460 | | | | 231,474 | |
United Technologies Corp. | | United States | | | 16,377 | | | | 2,132,285 | |
Vestas Wind Systems AS | | Denmark | | | 5,751 | | | | 496,637 | |
W.W. Grainger Inc. | | United States | | | 3,129 | | | | 839,292 | |
aWABCO Holdings Inc. | | United States | | | 402 | | | | 53,305 | |
Watsco Inc. | | United States | | | 724 | | | | 118,396 | |
| | | | | | | | | | |
| | | |
| | | | | | | | | 51,321,252 | |
| | | | | | | | | | |
Commercial & Professional Services 1.1% | | | | | | | | | | |
Cintas Corp. | | United States | | | 6,753 | | | | 1,602,419 | |
aCopart Inc. | | United States | | | 5,150 | | | | 384,911 | |
Equifax Inc. | | United States | | | 3,896 | | | | 526,895 | |
Experian PLC | | United Kingdom | | | 85,000 | | | | 2,573,427 | |
aIHS Markit Ltd. | | United States | | | 25,509 | | | | 1,625,434 | |
Matthews International Corp., A | | United States | | | 7,900 | | | | 275,315 | |
Republic Services Inc. | | United States | | | 1,300 | | | | 112,632 | |
Robert Half International Inc. | | United States | | | 4,023 | | | | 229,351 | |
Rollins Inc. | | United States | | | 4,587 | | | | 164,536 | |
Verisk Analytics Inc. | | United States | | | 10,757 | | | | 1,575,470 | |
| | | | | | | | | | |
| | | |
| | | | | | | | | 9,070,390 | |
| | | | | | | | | | |
Consumer Durables & Apparel 1.0% | | | | | | | | | | |
aCapri Holdings Ltd. | | United States | | | 4,828 | | | | 167,435 | |
Carter’s Inc. | | United States | | | 1,207 | | | | 117,731 | |
Garmin Ltd. | | United States | | | 3,621 | | | | 288,956 | |
Hasbro Inc. | | United States | | | 3,299 | | | | 348,638 | |
aKontoor Brands Inc. | | United States | | | 1,322 | | | | 37,042 | |
FRANKLIN TEMPLETON VARIABLE INSURANCE PRODUCTS TRUST
STATEMENT OF INVESTMENTS (UNAUDITED)
Franklin Allocation VIP Fund(continued)
| | | | | | | | | | |
| | | Country | | Shares | | | Value | |
| |
| | | |
Common Stocks(continued) | | | | | | | | | | |
Consumer Durables & Apparel(continued) | | | | | | | | | | |
Leggett & Platt Inc. | | United States | | | 3,621 | | | $ | 138,938 | |
aLululemon Athletica Inc. | | United States | | | 2,736 | | | | 493,055 | |
NIKE Inc., B | | United States | | | 44,031 | | | | 3,696,402 | |
Panasonic Corp., ADR | | Japan | | | 170,700 | | | | 1,414,762 | |
Polaris Industries Inc. | | United States | | | 1,770 | | | | 161,477 | |
Ralph Lauren Corp. | | United States | | | 643 | | | | 73,038 | |
Tapestry Inc. | | United States | | | 8,771 | | | | 278,304 | |
VF Corp. | | United States | | | 9,254 | | | | 808,337 | |
| | | | | | | | | | |
| | | |
| | | | | | | | | 8,024,115 | |
| | | | | | | | | | |
Consumer Services 1.3% | | | | | | | | | | |
Carnival Corp. | | United States | | | 17,695 | | | | 823,702 | |
Choice Hotels International Inc. | | United States | | | 1,046 | | | | 91,013 | |
Darden Restaurants Inc. | | United States | | | 3,862 | | | | 470,121 | |
Domino’s Pizza Inc. | | United States | | | 1,207 | | | | 335,884 | |
Graham Holdings Co., B | | United States | | | 568 | | | | 391,937 | |
aGrand Canyon Education Inc. | | United States | | | 643 | | | | 75,244 | |
H&R Block Inc. | | United States | | | 6,840 | | | | 200,412 | |
Las Vegas Sands Corp. | | United States | | | 6,679 | | | | 394,662 | |
McDonald’s Corp. | | United States | | | 12,318 | | | | 2,557,956 | |
Six Flags Entertainment Corp. | | United States | | | 1,046 | | | | 51,965 | |
Starbucks Corp. | | United States | | | 18,428 | | | | 1,544,819 | |
aTAL Education Group, ADR | | China | | | 70,000 | | | | 2,667,000 | |
Wyndham Destinations Inc. | | United States | | | 965 | | | | 42,364 | |
Yum! Brands Inc. | | United States | | | 10,864 | | | | 1,202,319 | |
| | | | | | | | | | |
| | | |
| | | | | | | | | 10,849,398 | |
| | | | | | | | | | |
Diversified Financials 1.5% | | | | | | | | | | |
American Express Co. | | United States | | | 4,310 | | | | 532,026 | |
aBerkshire Hathaway Inc., B | | United States | | | 1,999 | | | | 426,127 | |
BlackRock Inc. | | United States | | | 1,610 | | | | 755,573 | |
The Charles Schwab Corp. | | United States | | | 21,421 | | | | 860,910 | |
Chimera Investment Corp. | | United States | | | 4,828 | | | | 91,104 | |
Deutsche Boerse AG | | Germany | | | 18,000 | | | | 2,545,635 | |
Evercore Inc. | | United States | | | 563 | | | | 49,865 | |
FactSet Research Systems Inc. | | United States | | | 965 | | | | 276,530 | |
Flow Traders | | Netherlands | | | 31,438 | | | | 917,811 | |
Intercontinental Exchange Inc. | | United States | | | 10,030 | | | | 861,978 | |
Invesco Ltd. | | United States | | | 3,058 | | | | 62,567 | |
Lazard Ltd., A | | United States | | | 3,540 | | | | 121,741 | |
MarketAxess Holdings Inc. | | United States | | | 885 | | | | 284,457 | |
Morningstar Inc. | | United States | | | 482 | | | | 69,716 | |
MSCI Inc. | | United States | | | 1,931 | | | | 461,104 | |
Navient Corp. | | United States | | | 2,011 | | | | 27,450 | |
S&P Global Inc. | | United States | | | 5,391 | | | | 1,228,016 | |
Santander Consumer USA Holdings Inc. | | United States | | | 2,575 | | | | 61,697 | |
SEI Investments Co. | | United States | | | 2,253 | | | | 126,393 | |
State Street Corp. | | United States | | | 2,700 | | | | 151,362 | |
T. Rowe Price Group Inc. | | United States | | | 6,437 | | | | 706,203 | |
FRANKLIN TEMPLETON VARIABLE INSURANCE PRODUCTS TRUST
STATEMENT OF INVESTMENTS (UNAUDITED)
Franklin Allocation VIP Fund(continued)
| | | | | | | | | | |
| | | Country | | Shares | | | Value | |
| |
| | | |
Common Stocks(continued) | | | | | | | | | | |
Diversified Financials(continued) | | | | | | | | | | |
UBS Group AG | | Switzerland | | | 112,597 | | | $ | 1,337,626 | |
| | | | | | | | | | |
| | | |
| | | | | | | | | 11,955,891 | |
| | | | | | | | | | |
Energy 2.7% | | | | | | | | | | |
aApergy Corp. | | United States | | | 8,000 | | | | 268,320 | |
BP PLC | | United Kingdom | | | 446,496 | | | | 3,110,713 | |
Cabot Oil & Gas Corp., A | | United States | | | 24,348 | | | | 559,030 | |
Chevron Corp. | | United States | | | 7,800 | | | | 970,632 | |
Cimarex Energy Co. | | United States | | | 724 | | | | 42,955 | |
Concho Resources Inc. | | United States | | | 4,340 | | | | 447,801 | |
The Drilling Co. of 1972 AS | | Denmark | | | 1,670 | | | | 129,717 | |
Eni SpA | | Italy | | | 124,395 | | | | 2,065,558 | |
EOG Resources Inc. | | United States | | | 6,600 | | | | 614,856 | |
Exxon Mobil Corp. | | United States | | | 22,451 | | | | 1,720,420 | |
Husky Energy Inc. | | Canada | | | 80,300 | | | | 760,850 | |
John Wood Group PLC | | United Kingdom | | | 420,000 | | | | 2,410,873 | |
Occidental Petroleum Corp. | | United States | | | 11,700 | | | | 588,276 | |
Phillips 66 | | United States | | | 5,472 | | | | 511,851 | |
Royal Dutch Shell PLC, B | | United Kingdom | | | 67,820 | | | | 2,222,964 | |
SBM Offshore NV | | Netherlands | | | 64,376 | | | | 1,242,696 | |
Schlumberger Ltd. | | United States | | | 14,700 | | | | 584,178 | |
Tenaris SA | | Italy | | | 53,565 | | | | 700,906 | |
Total SA | | France | | | 40,836 | | | | 2,287,563 | |
Valero Energy Corp. | | United States | | | 10,300 | | | | 881,783 | |
| | | | | | | | | | |
| | | |
| | | | | | | | | 22,121,942 | |
| | | | | | | | | | |
Food & Staples Retailing 0.8% | | | | | | | | | | |
Casey’s General Stores Inc. | | United States | | | 885 | | | | 138,051 | |
Costco Wholesale Corp. | | United States | | | 5,311 | | | | 1,403,485 | |
The Kroger Co. | | United States | | | 6,518 | | | | 141,506 | |
Seven & I Holdings Co. Ltd., ADR | | Japan | | | 52,600 | | | | 887,362 | |
aSprouts Farmers Market Inc. | | United States | | | 1,770 | | | | 33,435 | |
Sysco Corp. | | United States | | | 13,680 | | | | 967,450 | |
Walgreens Boots Alliance Inc. | | United States | | | 16,968 | | | | 927,641 | |
Walmart Inc. | | United States | | | 21,154 | | | | 2,337,305 | |
| | | | | | | | | | |
| | | |
| | | | | | | | | 6,836,235 | |
| | | | | | | | | | |
Food, Beverage & Tobacco 2.0% | | | | | | | | | | |
Altria Group Inc. | | United States | | | 22,452 | | | | 1,063,102 | |
Archer-Daniels-Midland Co. | | United States | | | 7,564 | | | | 308,611 | |
Brown-Forman Corp., A | | United States | | | 1,609 | | | | 88,495 | |
Brown-Forman Corp., B | | United States | | | 11,709 | | | | 649,030 | |
Bunge Ltd. | | United States | | | 11,000 | | | | 612,810 | |
The Coca-Cola Co. | | United States | | | 24,384 | | | | 1,241,633 | |
Constellation Brands Inc., A | | United States | | | 3,910 | | | | 770,035 | |
Ezaki Glico Co. Ltd. | | Japan | | | 5,300 | | | | 235,949 | |
Flowers Foods Inc. | | United States | | | 4,587 | | | | 106,740 | |
General Mills Inc. | | United States | | | 16,175 | | | | 849,511 | |
The Hershey Co. | | United States | | | 4,667 | | | | 625,518 | |
FRANKLIN TEMPLETON VARIABLE INSURANCE PRODUCTS TRUST
STATEMENT OF INVESTMENTS (UNAUDITED)
Franklin Allocation VIP Fund(continued)
| | | | | | | | | | |
| | | Country | | Shares | | | Value | |
| |
| | | |
Common Stocks(continued) | | | | | | | | | | |
Food, Beverage & Tobacco(continued) | | | | | | | | | | |
Hormel Foods Corp. | | United States | | | 8,208 | | | $ | 332,752 | |
Ingredion Inc. | | United States | | | 1,689 | | | | 139,326 | |
The J. M. Smucker Co. | | United States | | | 1,529 | | | | 176,126 | |
Kellogg Co. | | United States | | | 2,092 | | | | 112,068 | |
Kirin Holdings Co. Ltd. | | Japan | | | 12,900 | | | | 277,993 | |
Lamb Weston Holdings Inc. | | United States | | | 5,455 | | | | 345,629 | |
McCormick & Co. Inc. | | United States | | | 6,700 | | | | 1,038,567 | |
Mondelez International Inc., A | | United States | | | 10,656 | | | | 574,358 | |
| aMonster Beverage Corp. | | United States | | | 26,347 | | | | 1,681,729 | |
PepsiCo Inc. | | United States | | | 22,778 | | | | 2,986,879 | |
Philip Morris International Inc. | | United States | | | 14,163 | | | | 1,112,220 | |
Suntory Beverage & Food Ltd. | | Japan | | | 19,800 | | | | 860,351 | |
Tyson Foods Inc. | | United States | | | 7,323 | | | | 591,259 | |
| | | | | | | | | | |
| | | |
| | | | | | | | | 16,780,691 | |
| | | | | | | | | | |
Health Care Equipment & Services 3.8% | | | | | | | | | | |
Abbott Laboratories | | United States | | | 24,020 | | | | 2,020,082 | |
| aABIOMED Inc. | | United States | | | 1,452 | | | | 378,232 | |
Baxter International Inc. | | United States | | | 2,790 | | | | 228,501 | |
Becton, Dickinson and Co. | | United States | | | 9,143 | | | | 2,304,127 | |
| aCentene Corp. | | United States | | | 3,807 | | | | 199,639 | |
Cerner Corp. | | United States | | | 5,874 | | | | 430,564 | |
Chemed Corp. | | United States | | | 241 | | | | 86,962 | |
Cochlear Ltd. | | Australia | | | 19,000 | | | | 2,758,635 | |
CVS Health Corp. | | United States | | | 7,300 | | | | 397,777 | |
Danaher Corp. | | United States | | | 7,487 | | | | 1,070,042 | |
DENTSPLY SIRONA Inc. | | United States | | | 4,900 | | | | 285,964 | |
| aEdwards Lifesciences Corp. | | United States | | | 2,887 | | | | 533,344 | |
Encompass Health Corp. | | United States | | | 1,287 | | | | 81,544 | |
GN Store Nord A/S | | Denmark | | | 45,000 | | | | 2,099,287 | |
| aHaemonetics Corp. | | United States | | | 7,214 | | | | 868,133 | |
HCA Holdings Inc. | | United States | | | 3,460 | | | | 467,688 | |
| aIntuitive Surgical Inc. | | United States | | | 5,383 | | | | 2,823,653 | |
| aLaboratory Corp. of America Holdings | | United States | | | 3,613 | | | | 624,688 | |
| aLivaNova PLC | | United Kingdom | | | 36,000 | | | | 2,590,560 | |
Medtronic PLC | | United States | | | 18,500 | | | | 1,801,715 | |
Quest Diagnostics Inc. | | United States | | | 6,448 | | | | 656,471 | |
ResMed Inc. | | United States | | | 3,862 | | | | 471,280 | |
Sinopharm Group Co. Ltd., H | | China | | | 227,200 | | | | 799,780 | |
Stryker Corp. | | United States | | | 15,274 | | | | 3,140,029 | |
Teleflex Inc. | | United States | | | 3,587 | | | | 1,187,835 | |
UnitedHealth Group Inc. | | United States | | | 4,345 | | | | 1,060,224 | |
Universal Health Services Inc., B | | United States | | | 643 | | | | 83,841 | |
| aVarian Medical Systems Inc. | | United States | | | 4,659 | | | | 634,230 | |
West Pharmaceutical Services Inc. | | United States | | | 9,400 | | | | 1,176,410 | |
| | | | | | | | | | |
| | | |
| | | | | | | | | 31,261,237 | |
| | | | | | | | | | |
FRANKLIN TEMPLETON VARIABLE INSURANCE PRODUCTS TRUST
STATEMENT OF INVESTMENTS (UNAUDITED)
Franklin Allocation VIP Fund(continued)
| | | | | | | | | | |
| | | Country | | Shares | | | Value | |
| |
| | | |
Common Stocks(continued) | | | | | | | | | | |
Household & Personal Products 0.9% | | | | | | | | | | |
Church & Dwight Co. Inc. | | United States | | | 7,081 | | | $ | 517,338 | |
Clorox Co. | | United States | | | 4,345 | | | | 665,263 | |
Colgate-Palmolive Co. | | United States | | | 31,114 | | | | 2,229,940 | |
Estee Lauder Cos. Inc., A | | United States | | | 6,518 | | | | 1,193,511 | |
Kimberly-Clark Corp. | | United States | | | 2,977 | | | | 396,775 | |
Nu Skin Enterprises Inc., A | | United States | | | 1,448 | | | | 71,415 | |
The Procter & Gamble Co. | | United States | | | 22,756 | | | | 2,495,195 | |
| | | | | | | | | | |
| | | |
| | | | | | | | | 7,569,437 | |
| | | | | | | | | | |
Insurance 0.6% | | | | | | | | | | |
Aflac Inc. | | United States | | | 19,775 | | | | 1,083,868 | |
American National Insurance Co. | | United States | | | 241 | | | | 28,069 | |
Assured Guaranty Ltd. | | United States | | | 804 | | | | 33,832 | |
Erie Indemnity Co., A | | United States | | | 4,343 | | | | 1,104,338 | |
Everest Re Group Ltd. | | United States | | | 563 | | | | 139,162 | |
Marsh & McLennan Cos. Inc. | | United States | | | 11,668 | | | | 1,163,883 | |
Mercury General Corp. | | United States | | | 804 | | | | 50,250 | |
The Progressive Corp. | | United States | | | 11,507 | | | | 919,755 | |
| | | | | | | | | | |
| | | |
| | | | | | | | | 4,523,157 | |
| | | | | | | | | | |
Materials 3.9% | | | | | | | | | | |
Air Products and Chemicals Inc. | | United States | | | 13,665 | | | | 3,093,346 | |
Alamos Gold Inc., A | | Canada | | | 229,900 | | | | 1,390,895 | |
Albemarle Corp. | | United States | | | 26,465 | | | | 1,863,401 | |
Avery Dennison Corp. | | United States | | | 1,770 | | | | 204,754 | |
| aAxalta Coating Systems Ltd. | | United States | | | 24,143 | | | | 718,737 | |
Celanese Corp. | | United States | | | 8,901 | | | | 959,528 | |
CRH PLC | | Ireland | | | 20,944 | | | | 683,114 | |
Eastman Chemical Co. | | United States | | | 1,850 | | | | 143,985 | |
Ecolab Inc. | | United States | | | 11,001 | | | | 2,172,037 | |
Huntsman Corp. | | United States | | | 1,770 | | | | 36,179 | |
International Flavors & Fragrances Inc. | | United States | | | 2,896 | | | | 420,181 | |
Johnson Matthey PLC | | United Kingdom | | | 36,353 | | | | 1,536,882 | |
Koninklijke DSM NV | | Netherlands | | | 22,000 | | | | 2,718,663 | |
Linde PLC | | United Kingdom | | | 22,735 | | | | 4,565,188 | |
Lotte Chemical Corp. | | South Korea | | | 4,358 | | | | 951,125 | |
LyondellBasell Industries NV, A | | United States | | | 10,622 | | | | 914,873 | |
Martin Marietta Materials Inc. | | United States | | | 2,841 | | | | 653,742 | |
NewMarket Corp. | | United States | | | 241 | | | | 96,627 | |
Nucor Corp. | | United States | | | 5,500 | | | | 303,050 | |
Packaging Corp. of America | | United States | | | 1,529 | | | | 145,744 | |
Sealed Air Corp. | | United States | | | 2,011 | | | | 86,031 | |
Sonoco Products Co. | | United States | | | 2,655 | | | | 173,478 | |
Steel Dynamics Inc. | | United States | | | 1,689 | | | | 51,008 | |
Sumitomo Metal Mining Co. Ltd. | | Japan | | | 38,700 | | | | 1,155,401 | |
Symrise AG | | Germany | | | 22,500 | | | | 2,165,017 | |
Taiheiyo Cement Corp. | | Japan | | | 21,900 | | | | 662,159 | |
Umicore SA | | Belgium | | | 76,000 | | | | 2,436,497 | |
FRANKLIN TEMPLETON VARIABLE INSURANCE PRODUCTS TRUST
STATEMENT OF INVESTMENTS (UNAUDITED)
Franklin Allocation VIP Fund(continued)
| | | | | | | | | | |
| | | |
| | | Country | | Shares | | | Value | |
| | | |
Common Stocks(continued) | | | | | | | | | | |
Materials(continued) | | | | | | | | | | |
Wheaton Precious Metals Corp. | | Canada | | | 90,000 | | | $ | 2,176,217 | |
| | | | | | | | | | |
| | | |
| | | | | | | | | 32,477,859 | |
| | | | | | | | | | |
Media & Entertainment 2.2% | | | | | | | | | | |
| aAlphabet Inc., A | | United States | | | 2,311 | | | | 2,502,351 | |
| aAMC Networks Inc., A | | United States | | | 804 | | | | 43,810 | |
Ascential PLC | | United Kingdom | | | 467,885 | | | | 2,116,507 | |
| aBaidu Inc., ADR | | China | | | 9,600 | | | | 1,126,656 | |
Cable One Inc. | | United States | | | 571 | | | | 668,635 | |
Cinemark Holdings Inc. | | United States | | | 804 | | | | 29,024 | |
Comcast Corp., A | | United States | | | 37,203 | | | | 1,572,943 | |
CyberAgent Inc. | | Japan | | | 70,000 | | | | 2,535,244 | |
| aElectronic Arts Inc. | | United States | | | 4,324 | | | | 437,848 | |
| aFacebook Inc., A | | United States | | | 5,408 | | | | 1,043,744 | |
| aIAC/InterActiveCorp. | | United States | | | 2,167 | | | | 471,388 | |
The Interpublic Group of Cos. Inc. | | United States | | | 5,150 | | | | 116,339 | |
John Wiley & Sons Inc., A | | United States | | | 4,243 | | | | 194,584 | |
Match Group Inc. | | United States | | | 885 | | | | 59,534 | |
Omnicom Group Inc. | | United States | | | 5,552 | | | | 454,986 | |
SES SA, IDR | | Luxembourg | | | 67,868 | | | | 1,060,891 | |
Viacom Inc., B | | United States | | | 4,989 | | | | 149,022 | |
The Walt Disney Co. | | United States | | | 22,974 | | | | 3,208,089 | |
| | | | | | | | | | |
| | | |
| | | | | | | | | 17,791,595 | |
| | | | | | | | | | |
Pharmaceuticals, Biotechnology & Life Sciences 5.7% | | | | | | | | | | |
AbbVie Inc. | | United States | | | 21,989 | | | | 1,599,040 | |
Agilent Technologies Inc. | | United States | | | 9,233 | | | | 689,428 | |
| aAlkermes PLC | | United States | | | 70,000 | | | | 1,577,800 | |
Amgen Inc. | | United States | | | 13,045 | | | | 2,403,933 | |
Astellas Pharma Inc., ADR | | Japan | | | 69,600 | | | | 989,712 | |
AstraZeneca PLC, ADR | | United Kingdom | | | 14,409 | | | | 594,804 | |
Bayer AG | | Germany | | | 25,713 | | | | 1,781,387 | |
| aBiogen Inc. | | United States | | | 7,273 | | | | 1,700,936 | |
Bristol-Myers Squibb Co. | | United States | | | 22,613 | | | | 1,025,500 | |
| aCatalent Inc. | | United States | | | 24,353 | | | | 1,320,176 | |
CSL Ltd. | | Australia | | | 16,000 | | | | 2,414,708 | |
| aElanco Animal Health Inc. | | United States | | | 10,878 | | | | 367,676 | |
Eli Lilly & Co. | | United States | | | 19,385 | | | | 2,147,664 | |
| aExelixis Inc. | | United States | | | 5,230 | | | | 111,765 | |
Gilead Sciences Inc. | | United States | | | 21,747 | | | | 1,469,227 | |
| aGW Pharmaceuticals PLC, ADR | | United Kingdom | | | 600 | | | | 103,434 | |
Hikma Pharmaceuticals PLC | | United Kingdom | | | 100,000 | | | | 2,186,854 | |
| aIllumina Inc. | | United States | | | 3,751 | | | | 1,380,931 | |
Johnson & Johnson | | United States | | | 26,090 | | | | 3,633,815 | |
Merck & Co. Inc. | | United States | | | 22,696 | | | | 1,903,060 | |
Merck KGaA | | Germany | | | 10,543 | | | | 1,102,215 | |
| aMettler-Toledo International Inc. | | United States | | | 3,689 | | | | 3,098,760 | |
| aNeurocrine Biosciences Inc. | | United States | | | 3,506 | | | | 296,012 | |
Pfizer Inc. | | United States | | | 55,746 | | | | 2,414,917 | |
FRANKLIN TEMPLETON VARIABLE INSURANCE PRODUCTS TRUST
STATEMENT OF INVESTMENTS (UNAUDITED)
Franklin Allocation VIP Fund(continued)
| | | | | | | | | | |
| | | |
| | | Country | | Shares | | | Value | |
| | | |
Common Stocks(continued) | | | | | | | | | | |
Pharmaceuticals, Biotechnology & Life Sciences(continued) | | | | | | | | | | |
Roche Holding AG | | Switzerland | | | 10,125 | | | $ | 2,847,899 | |
Sanofi | | France | | | 26,276 | | | | 2,267,574 | |
Santen Pharmaceutical Co. Ltd. | | Japan | | | 140,000 | | | | 2,317,752 | |
Takeda Pharmaceutical Co. Ltd., ADR | | Japan | | | 82,400 | | | | 1,458,480 | |
aTeva Pharmaceutical Industries Ltd., ADR | | Israel | | | 110,800 | | | | 1,022,684 | |
aUnited Therapeutics Corp. | | United States | | | 1,368 | | | | 106,786 | |
aWaters Corp. | | United States | | | 4,414 | | | | 950,069 | |
| | | | | | | | | | |
| | | |
| | | | | | | | | 47,284,998 | |
| | | | | | | | | | |
Real Estate 1.0% | | | | | | | | | | |
American Tower Corp. | | United States | | | 5,778 | | | | 1,181,312 | |
CK Asset Holdings Ltd. | | Hong Kong | | | 97,800 | | | | 765,534 | |
EPR Properties | | United States | | | 1,770 | | | | 132,024 | |
Equinix Inc. | | United States | | | 1,434 | | | | 723,152 | |
Gaming and Leisure Properties Inc. | | United States | | | 4,587 | | | | 178,801 | |
Kimco Realty Corp. | | United States | | | 8,288 | | | | 153,162 | |
Mitsui Fudosan Co. Ltd. | | Japan | | | 46,700 | | | | 1,131,550 | |
National Retail Properties Inc. | | United States | | | 4,748 | | | | 251,692 | |
OMEGA Healthcare Investors Inc. | | United States | | | 6,035 | | | | 221,786 | |
Public Storage | | United States | | | 4,828 | | | | 1,149,885 | |
Realty Income Corp. | | United States | | | 8,369 | | | | 577,210 | |
Senior Housing Properties Trust | | United States | | | 6,518 | | | | 53,904 | |
Simon Property Group Inc. | | United States | | | 5,633 | | | | 899,928 | |
Spirit Realty Capital Inc. | | United States | | | 2,736 | | | | 116,718 | |
STORE Capital Corp. | | United States | | | 4,506 | | | | 149,554 | |
Ventas Inc. | | United States | | | 2,736 | | | | 187,006 | |
VEREIT Inc. | | United States | | | 28,166 | | | | 253,776 | |
WP Carey Inc. | | United States | | | 2,736 | | | | 222,108 | |
| | | | | | | | | | |
| | | |
| | | | | | | | | 8,349,102 | |
| | | | | | | | | | |
Retailing 3.7% | | | | | | | | | | |
Advance Auto Parts Inc. | | United States | | | 482 | | | | 74,295 | |
aAlibaba Group Holding Ltd., ADR | | China | | | 3,443 | | | | 583,416 | |
aAmazon.com Inc. | | United States | | | 2,506 | | | | 4,745,437 | |
aAutoZone Inc. | | United States | | | 402 | | | | 441,987 | |
Best Buy Co. Inc. | | United States | | | 7,323 | | | | 510,633 | |
aboohoo Group PLC | | United Kingdom | | | 735,000 | | | | 1,976,036 | |
Dick’s Sporting Goods Inc. | | United States | | | 2,414 | | | | 83,597 | |
Dollar General Corp. | | United States | | | 4,828 | | | | 652,552 | |
Expedia Group Inc. | | United States | | | 2,521 | | | | 335,369 | |
Foot Locker Inc. | | United States | | | 4,184 | | | | 175,393 | |
The Gap Inc. | | United States | | | 19,645 | | | | 353,021 | |
Genuine Parts Co. | | United States | | | 4,104 | | | | 425,092 | |
The Home Depot Inc. | | United States | | | 6,840 | | | | 1,422,515 | |
aJust Eat PLC | | United Kingdom | | | 230,000 | | | | 1,825,553 | |
Kingfisher PLC | | United Kingdom | | | 393,321 | | | | 1,073,421 | |
Kohl’s Corp. | | United States | | | 5,311 | | | | 252,538 | |
L Brands Inc. | | United States | | | 7,242 | | | | 189,016 | |
Lowe’s Cos. Inc. | | United States | | | 13,037 | | | | 1,315,564 | |
FRANKLIN TEMPLETON VARIABLE INSURANCE PRODUCTS TRUST
STATEMENT OF INVESTMENTS (UNAUDITED)
Franklin Allocation VIP Fund(continued)
| | | | | | | | | | |
| | | Country | | Shares | | | Value | |
| |
| | | |
Common Stocks(continued) | | | | | | | | | | |
Retailing(continued) | | | | | | | | | | |
Macy’s Inc. | | United States | | | 8,128 | | | $ | 174,427 | |
aMercadoLibre Inc. | | Argentina | | | 3,900 | | | | 2,385,903 | |
aThe Michaels Cos. Inc. | | United States | | | 2,494 | | | | 21,698 | |
Nordstrom Inc. | | United States | | | 3,460 | | | | 110,236 | |
aO’Reilly Automotive Inc. | | United States | | | 2,414 | | | | 891,539 | |
Penske Automotive Group Inc. | | United States | | | 563 | | | | 26,630 | |
Pool Corp. | | United States | | | 965 | | | | 184,315 | |
Ross Stores Inc. | | United States | | | 25,937 | | | | 2,570,875 | |
Target Corp. | | United States | | | 19,517 | | | | 1,690,367 | |
Tiffany & Co. | | United States | | | 10,675 | | | | 999,607 | |
The TJX Cos. Inc. | | United States | | | 25,108 | | | | 1,327,711 | |
Tractor Supply Co. | | United States | | | 3,540 | | | | 385,152 | |
aUlta Beauty Inc. | | United States | | | 1,689 | | | | 585,897 | |
aUrban Outfitters Inc. | | United States | | | 2,092 | | | | 47,593 | |
Williams-Sonoma Inc. | | United States | | | 2,736 | | | | 177,840 | |
Zozo Inc. | | Japan | | | 140,000 | | | | 2,621,592 | |
| | | | | | | | | | |
| | | |
| | | | | | | | | 30,636,817 | |
| | | | | | | | | | |
Semiconductors & Semiconductor Equipment 2.6% | | | | | | | | | | |
Analog Devices Inc. | | United States | | | 18,400 | | | | 2,076,808 | |
Applied Materials Inc. | | United States | | | 24,303 | | | | 1,091,448 | |
ASML Holding NV, N.Y. shs | | Netherlands | | | 4,650 | | | | 966,874 | |
Infineon Technologies AG | | Germany | | | 135,000 | | | | 2,386,532 | |
Intel Corp. | | United States | | | 32,733 | | | | 1,566,929 | |
KLA-Tencor Corp. | | United States | | | 3,701 | | | | 437,458 | |
Lam Research Corp. | | United States | | | 3,219 | | | | 604,657 | |
Maxim Integrated Products Inc. | | United States | | | 7,323 | | | | 438,062 | |
aMicron Technology Inc. | | United States | | | 21,728 | | | | 838,484 | |
Monolithic Power Systems | | United States | | | 3,188 | | | | 432,867 | |
NVIDIA Corp. | | United States | | | 11,154 | | | | 1,831,821 | |
NXP Semiconductors NV | | Netherlands | | | 16,300 | | | | 1,591,043 | |
Skyworks Solutions Inc. | | United States | | | 5,713 | | | | 441,443 | |
Taiwan Semiconductor Manufacturing Co. Ltd. | | Taiwan | | | 187,000 | | | | 1,442,734 | |
Texas Instruments Inc. | | United States | | | 38,842 | | | | 4,457,508 | |
Xilinx Inc. | | United States | | | 7,323 | | | | 863,528 | |
| | | | | | | | | | |
| | | |
| | | | | | | | | 21,468,196 | |
| | | | | | | | | | |
Software & Services 6.6% | | | | | | | | | | |
Accenture PLC, A | | United States | | | 19,884 | | | | 3,673,967 | |
aAdobe Inc. | | United States | | | 6,013 | | | | 1,771,730 | |
aAdyen NV | | Netherlands | | | 2,035 | | | | 1,569,934 | |
Amdocs Ltd. | | United States | | | 4,104 | | | | 254,817 | |
aAspen Technology Inc. | | United States | | | 643 | | | | 79,912 | |
aAutodesk Inc. | | United States | | | 5,697 | | | | 928,041 | |
Automatic Data Processing Inc. | | United States | | | 13,396 | | | | 2,214,761 | |
Broadridge Financial Solutions Inc. | | United States | | | 3,540 | | | | 451,987 | |
Cognizant Technology Solutions Corp., A | | United States | | | 7,484 | | | | 474,411 | |
aFortinet Inc. | | United States | | | 1,931 | | | | 148,359 | |
International Business Machines Corp. | | United States | | | 9,978 | | | | 1,375,966 | |
FRANKLIN TEMPLETON VARIABLE INSURANCE PRODUCTS TRUST
STATEMENT OF INVESTMENTS (UNAUDITED)
Franklin Allocation VIP Fund(continued)
| | | | | | | | | | |
| | | Country | | Shares | | | Value | |
| |
| | | |
Common Stocks(continued) | | | | | | | | | | |
| | | |
Software & Services(continued) | | | | | | | | | | |
aInterXion Holding NV | | Netherlands | | | 37,000 | | | $ | 2,815,330 | |
Intuit Inc. | | United States | | | 12,895 | | | | 3,369,850 | |
Jack Henry & Associates Inc. | | United States | | | 2,253 | | | | 301,722 | |
Keywords Studios PLC | | Ireland | | | 95,000 | | | | 2,201,776 | |
Mastercard Inc., A | | United States | | | 16,157 | | | | 4,274,011 | |
Microsoft Corp. | | United States | | | 67,359 | | | | 9,023,453 | |
Oracle Corp. | | United States | | | 13,300 | | | | 757,701 | |
Paychex Inc. | | United States | | | 10,139 | | | | 834,338 | |
aPTC Inc. | | United States | | | 5,403 | | | | 484,973 | |
The Sage Group PLC | | United Kingdom | | | 280,000 | | | | 2,853,222 | |
asalesforce.com Inc. | | United States | | | 3,964 | | | | 601,458 | |
SAP SE | | Germany | | | 20,000 | | | | 2,745,720 | |
aServiceNow Inc. | | United States | | | 7,151 | | | | 1,963,450 | |
aShopify Inc., A | | Canada | | | 9,500 | | | | 2,851,425 | |
Sophos Group PLC | | United Kingdom | | | 480,000 | | | | 2,405,996 | |
aTwilio Inc., A | | United States | | | 2,840 | | | | 387,234 | |
aTyler Technologies Inc. | | United States | | | 1,229 | | | | 265,489 | |
aVeriSign Inc. | | United States | | | 2,816 | | | | 588,995 | |
Visa Inc., A | | United States | | | 14,954 | | | | 2,595,267 | |
VMware Inc., A | | United States | | | 2,011 | | | | 336,259 | |
Western Union Co. | | United States | | | 6,357 | | | | 126,441 | |
| | | | | | | | | | |
| | | | | | | | | 54,727,995 | |
| | | | | | | | | | |
Technology Hardware & Equipment 2.2% | | | | | | | | | | |
Amphenol Corp., A | | United States | | | 6,508 | | | | 624,378 | |
Apple Inc. | | United States | | | 30,685 | | | | 6,073,175 | |
Cisco Systems Inc. | | United States | | | 46,733 | | | | 2,557,697 | |
Cognex Corp. | | United States | | | 6,103 | | | | 292,822 | |
aF5 Networks Inc. | | United States | | | 2,011 | | | | 292,862 | |
HP Inc. | | United States | | | 49,170 | | | | 1,022,244 | |
aKeysight Technologies Inc. | | United States | | | 4,588 | | | | 412,048 | |
Motorola Solutions Inc. | | United States | | | 4,023 | | | | 670,755 | |
NetApp Inc. | | United States | | | 5,794 | | | | 357,490 | |
Samsung Electronics Co. Ltd. | | South Korea | | | 82,146 | | | | 3,337,132 | |
TE Connectivity Ltd. | | United States | | | 13,418 | | | | 1,285,176 | |
aTrimble Inc. | | United States | | | 19,388 | | | | 874,593 | |
Ubiquiti Networks Inc. | | United States | | | 241 | | | | 31,692 | |
aViaSat Inc. | | United States | | | 4,982 | | | | 402,645 | |
| | | | | | | | | | |
| | | |
| | | | | | | | | 18,234,709 | |
| | | | | | | | | | |
Telecommunication Services 1.0% | | | | | | | | | | |
AT&T Inc. | | United States | | | 39,433 | | | | 1,321,400 | |
China Mobile Ltd. | | China | | | 142,500 | | | | 1,297,834 | |
Singapore Telecommunications Ltd. | | Singapore | | | 609,500 | | | | 1,576,390 | |
Telefonica Deutschland Holding AG | | Germany | | | 248,243 | | | | 693,402 | |
Verizon Communications Inc. | | United States | | | 20,360 | | | | 1,163,167 | |
Vodafone Group PLC | | United Kingdom | | | 1,011,010 | | | | 1,660,381 | |
| | | | | | | | | | |
| | | |
| | | | | | | | | 7,712,574 | |
| | | | | | | | | | |
FRANKLIN TEMPLETON VARIABLE INSURANCE PRODUCTS TRUST
STATEMENT OF INVESTMENTS (UNAUDITED)
Franklin Allocation VIP Fund(continued)
| | | | | | | | | | |
| | | Country | | Shares | | | Value | |
| |
| | | |
Common Stocks(continued) | | | | | | | | | | |
Transportation 1.9% | | | | | | | | | | |
A.P. Moeller-Maersk AS, B | | Denmark | | | 829 | | | $ | 1,028,011 | |
Alaska Air Group Inc. | | United States | | | 26,597 | | | | 1,699,814 | |
C.H. Robinson Worldwide Inc. | | United States | | | 4,345 | | | | 366,501 | |
Canadian National Railway Co. | | Canada | | | 7,104 | | | | 656,978 | |
Canadian Pacific Railway Ltd. | | Canada | | | 3,572 | | | | 840,277 | |
Copa Holdings SA | | Panama | | | 643 | | | | 62,738 | |
Delta Air Lines Inc. | | United States | | | 15,209 | | | | 863,111 | |
DSV AS | | Denmark | | | 28,000 | | | | 2,748,911 | |
Expeditors International of Washington Inc. | | United States | | | 4,748 | | | | 360,183 | |
J.B. Hunt Transport Services Inc. | | United States | | | 6,205 | | | | 567,199 | |
Kansas City Southern | | United States | | | 5,340 | | | | 650,519 | |
Landstar System Inc. | | United States | | | 1,046 | | | | 112,958 | |
aLyft Inc., A | | United States | | | 2,125 | | | | 139,634 | |
Norfolk Southern Corp. | | United States | | | 1,600 | | | | 318,928 | |
aRyanair Holdings PLC, ADR | | Ireland | | | 1,675 | | | | 107,434 | |
Schneider National Inc., B | | United States | | | 804 | | | | 14,665 | |
Southwest Airlines Co. | | United States | | | 13,278 | | | | 674,257 | |
aUber Technologies Inc. | | United States | | | 4,838 | | | | 224,386 | |
Union Pacific Corp. | | United States | | | 22,498 | | | | 3,804,637 | |
United Parcel Service Inc., B | | United States | | | 5,800 | | | | 598,966 | |
| | | | | | | | | | |
| | | |
| | | | | | | | | 15,840,107 | |
| | | | | | | | | | |
Utilities 1.5% | | | | | | | | | | |
Alliant Energy Corp. | | United States | | | 5,391 | | | | 264,590 | |
Ameren Corp. | | United States | | | 1,931 | | | | 145,037 | |
American Water Works Co. Inc. | | United States | | | 5,059 | | | | 586,844 | |
Atmos Energy Corp. | | United States | | | 2,575 | | | | 271,817 | |
Consolidated Edison Inc. | | United States | | | 7,886 | | | | 691,444 | |
DTE Energy Co. | | United States | | | 4,989 | | | | 637,993 | |
E.ON SE | | Germany | | | 106,983 | | | | 1,161,627 | |
Evergy Inc. | | United States | | | 2,092 | | | | 125,834 | |
Eversource Energy | | United States | | | 6,116 | | | | 463,348 | |
Exelon Corp. | | United States | | | 26,476 | | | | 1,269,259 | |
Hawaiian Electric Industries Inc. | | United States | | | 2,655 | | | | 115,625 | |
aKorea Electric Power Corp. | | South Korea | | | 30,261 | | | | 668,288 | |
NextEra Energy Inc. | | United States | | | 10,360 | | | | 2,122,350 | |
OGE Energy Corp. | | United States | | | 4,426 | | | | 188,371 | |
Pinnacle West Capital Corp. | | United States | | | 3,138 | | | | 295,254 | |
PPL Corp. | | United States | | | 5,794 | | | | 179,672 | |
Public Service Enterprise Group Inc. | | United States | | | 15,209 | | | | 894,593 | |
The Southern Co. | | United States | | | 7,806 | | | | 431,516 | |
UGI Corp. | | United States | | | 1,287 | | | | 68,739 | |
Veolia Environnement SA | | France | | | 46,867 | | | | 1,141,274 | |
WEC Energy Group Inc. | | United States | | | 5,391 | | | | 449,448 | |
| | | | | | | | | | |
| | | |
| | | | | | | | | 12,172,923 | |
| | | | | | | | | | |
| | | |
Total Common Stocks (Cost $475,243,276) | | | | | | | | | 474,329,435 | |
| | | | | | | | | | |
FRANKLIN TEMPLETON VARIABLE INSURANCE PRODUCTS TRUST
STATEMENT OF INVESTMENTS (UNAUDITED)
Franklin Allocation VIP Fund(continued)
| | | | | | | | | | |
| | | Country | | Shares | | | Value | |
| |
| | | |
Management Investment Companies 4.5% | | | | | | | | | | |
Diversified Financials 4.5% | | | | | | | | | | |
aAltaba Inc. | | United States | | | 12,169 | | | $ | 844,164 | |
Invesco Senior Loan ETF | | United States | | | 125,000 | | | | 2,832,500 | |
bTempleton Global Bond VIP Fund, Class 1 | | United States | | | 1,978,020 | | | | 33,329,645 | |
| | | | | | | | | | |
| | | |
Total Management Investment Companies
(Cost $39,550,794) | | | | | | | | | 37,006,309 | |
| | | | | | | | | | |
| | | |
| | | |
| Principal
Amount |
* | | | | |
| | | | | | | | | | |
Corporate Bonds 12.7% | | | | | | | | | | |
Banks 2.5% | | | | | | | | | | |
cAkbank T.A.S., senior note, 144A, 5.125%, 3/31/25 | | Turkey | | | 200,000 | | | | 184,936 | |
Bank of America Corp., sub. bond, 4.183%, 11/25/27 | | United States | | | 2,600,000 | | | | 2,760,307 | |
Barclays PLC, senior note, 3.932% to 5/07/24, FRN thereafter, 5/07/25 | | United Kingdom | | | 1,100,000 | | | | 1,120,977 | |
BB&T Corp., sub. bond, 3.875%, 3/19/29 | | United States | | | 2,000,000 | | | | 2,139,893 | |
cBPCE SA, sub. note, 144A, 5.15%, 7/21/24 | | France | | | 1,400,000 | | | | 1,510,852 | |
Citigroup Inc., senior note, 3.352% to 4/24/24, FRN thereafter, 4/24/25 | | United States | | | 2,300,000 | | | | 2,376,437 | |
Credit Suisse Group Funding Guernsey Ltd., senior note, 3.80%, 9/15/22 | | Switzerland | | | 2,300,000 | | | | 2,385,548 | |
HSBC Holdings PLC, senior note, 4.30%, 3/08/26 | | United Kingdom | | | 2,100,000 | | | | 2,249,783 | |
JPMorgan Chase & Co., senior bond, 3.54% to 5/01/27, FRN thereafter, 5/01/28 | | United States | | | 1,350,000 | | | | 1,405,747 | |
Regions Financial Corp., senior note, 3.80%, 8/14/23 | | United States | | | 2,200,000 | | | | 2,302,350 | |
cStandard Chartered PLC, senior note, 144A, 4.05%, 4/12/26 | | United Kingdom | | | 1,800,000 | | | | 1,865,214 | |
| | | | | | | | | | |
| | | |
| | | | | | | | | 20,302,044 | |
| | | | | | | | | | |
Capital Goods 0.8% | | | | | | | | | | |
cBeacon Roofing Supply Inc., senior note, 144A, 4.875%, 11/01/25 | | United States | | | 200,000 | | | | 198,750 | |
Caterpillar Financial Services Corp., senior note, I, 2.65%, 5/17/21 | | United States | | | 1,800,000 | | | | 1,816,252 | |
General Electric Co., senior bond, 4.125%, 10/09/42 | | United States | | | 1,300,000 | | | | 1,198,635 | |
cHarsco Corp., senior note, 144A, 5.75%, 7/31/27 | | United States | | | 200,000 | | | | 208,772 | |
Lockheed Martin Corp., senior bond, 3.55%, 1/15/26 | | United States | | | 1,800,000 | | | | 1,914,299 | |
United Technologies Corp., senior bond, 4.50%, 6/01/42 | | United States | | | 800,000 | | | | 904,815 | |
cVertiv Group Corp., senior note, 144A, 9.25%, 10/15/24 | | United States | | | 200,000 | | | | 192,500 | |
| | | | | | | | | | |
| | | |
| | | | | | | | | 6,434,023 | |
| | | | | | | | | | |
Commercial & Professional Services 0.0%† | | | | | | | | | | |
cWest Corp., senior note, 144A, 8.50%, 10/15/25 | | United States | | | 300,000 | | | | 264,000 | |
| | | | | | | | | | |
Consumer Services 0.3% | | | | | | | | | | |
cAscend Learning LLC, senior note, 144A, 6.875%, 8/01/25 | | United States | | | 300,000 | | | | 306,750 | |
Marriott International Inc., senior note, 3.60%, 4/15/24 | | United States | | | 1,100,000 | | | | 1,146,746 | |
cStars Group Holdings BV/Stars Group U.S.Co-Borrower LLC, senior note, 144A, 7.00%, 7/15/26 | | Canada | | | 300,000 | | | | 318,000 | |
cWynn Las Vegas LLC/Wynn Las Vegas Capital Corp., senior bond, 144A, 5.25%, 5/15/27 | | United States | | | 300,000 | | | | 301,500 | |
| | | | | | | | | | |
| | | |
| | | | | | | | | 2,072,996 | |
| | | | | | | | | | |
Diversified Financials 1.2% | | | | | | | | | | |
cAshtead Capital Inc., second lien, 144A, 4.125%, 8/15/25 | | United Kingdom | | | 850,000 | | | | 860,359 | |
Capital One Financial Corp., senior note, 3.75%, 3/09/27 | | United States | | | 1,100,000 | | | | 1,136,059 | |
DY9 Leasing LLC, secured bond, 2.372%, 3/19/27 | | United States | | | 773,055 | | | | 780,672 | |
FRANKLIN TEMPLETON VARIABLE INSURANCE PRODUCTS TRUST
STATEMENT OF INVESTMENTS (UNAUDITED)
Franklin Allocation VIP Fund(continued)
| | | | | | | | | | |
| | | Country | |
| Principal
Amount |
* | | | Value | |
Corporate Bonds(continued) | | | | | | | | | | |
Diversified Financials(continued) | | | | | | | | | | |
cFirstCash Inc., senior note, 144A, 5.375%, 6/01/24 | | United States | | | 200,000 | | | $ | 206,500 | |
The Goldman Sachs Group Inc., senior note, 3.50%, 1/23/25 | | United States | | | 1,900,000 | | | | 1,965,975 | |
Morgan Stanley, senior bond, 3.591% to 7/22/27, FRN thereafter, 7/22/28 | | United States | | | 2,300,000 | | | | 2,395,720 | |
Private Export Funding Corp., secured bond, 2.80%, 5/15/22 | | United States | | | 1,600,000 | | | | 1,645,460 | |
Springleaf Finance Corp., senior note, 6.625%, 1/15/28 | | United States | | | 100,000 | | | | 105,250 | |
cUBS Group Funding Switzerland AG, senior note, 144A, 4.125%, 9/24/25 | | Switzerland | | | 950,000 | | | | 1,017,768 | |
| | | | | | | | | | |
| | | |
| | | | | | | | | 10,113,763 | |
| | | | | | | | | | |
Energy 1.4% | | | | | | | | | | |
cAker BP ASA, senior note, 144A, 4.75%, 6/15/24 | | Norway | | | 200,000 | | | | 206,000 | |
Baker Hughes a GE Co. LLC/Baker HughesCo-obligator Inc., senior bond, 4.08%, 12/15/47 | | United States | | | 900,000 | | | | 872,768 | |
cCalifornia Resources Corp., secured note, second lien, 144A, 8.00%, 12/15/22 | | United States | | | 200,000 | | | | 151,750 | |
Canadian Natural Resources Ltd., senior bond, 3.90%, 2/01/25 | | Canada | | | 1,350,000 | | | | 1,409,027 | |
Cheniere Corpus Christi Holdings LLC, senior secured note, first lien, 5.875%, 3/31/25 | | United States | | | 200,000 | | | | 223,250 | |
Cheniere Energy Partners LP, senior secured note, first lien, 5.25%, 10/01/25 | | United States | | | 200,000 | | | | 207,500 | |
Energy Transfer Operating LP, senior bond, 6.05%, 6/01/41 | | United States | | | 700,000 | | | | 784,444 | |
Enterprise Products Operating LLC, senior bond, 6.125%, 10/15/39 | | United States | | | 700,000 | | | | 863,969 | |
Kinder Morgan Inc., senior bond, 5.55%, 6/01/45 | | United States | | | 800,000 | | | | 926,394 | |
MPLX LP, senior bond, 5.50%, 2/15/49 | | United States | | | 425,000 | | | | 481,555 | |
Oceaneering International Inc., senior note, 4.65%, 11/15/24 | | United States | | | 200,000 | | | | 197,000 | |
Reliance Industries Ltd., senior note, 2.06%, 1/15/26 | | United States | | | 875,000 | | | | 875,976 | |
cSchlumberger Holdings Corp., senior note, 144A, 3.75%, 5/01/24 | | United States | | | 1,800,000 | | | | 1,878,982 | |
Valero Energy Corp., senior bond, 4.00%, 4/01/29 | | United States | | | 1,000,000 | | | | 1,047,338 | |
The Williams Cos. Inc., senior note, 4.125%, 11/15/20 | | United States | | | 1,350,000 | | | | 1,374,624 | |
| | | | | | | | | | |
| | | |
| | | | | | | | | 11,500,577 | |
| | | | | | | | | | |
Food & Staples Retailing 0.3% | | | | | | | | | | |
cAramark Services Inc., senior bond, 144A, 5.00%, 2/01/28 | | United States | | | 300,000 | | | | 309,375 | |
cCK Hutchison International 19 Ltd., senior note, 144A, 3.25%, 4/11/24 | | Hong Kong | | | 1,275,000 | | | | 1,307,863 | |
The Kroger Co., senior bond, 5.40%, 1/15/49 | | United States | | | 550,000 | | | | 611,546 | |
| | | | | | | | | | |
| | | |
| | | | | | | | | 2,228,784 | |
| | | | | | | | | | |
Food, Beverage & Tobacco 0.8% | | | | | | | | | | |
Anheuser-Busch InBev Worldwide Inc., senior bond, 5.80%, 1/23/59 | | Belgium | | | 1,400,000 | | | | 1,755,082 | |
Bunge Ltd. Finance Corp., senior note, 4.35%, 3/15/24 | | United States | | | 700,000 | | | | 730,421 | |
Coca-Cola Femsa SAB de CV, senior note, 3.875%, 11/26/23 | | Mexico | | | 1,500,000 | | | | 1,574,475 | |
cImperial Brands Finance PLC, senior note, 144A, 4.25%, 7/21/25 | | United Kingdom | | | 585,000 | | | | 612,934 | |
Kraft Heinz Foods Co., senior bond, 6.50%, 2/09/40 | | United States | | | 700,000 | | | | 819,399 | |
Reynolds American Inc., senior bond, 5.85%, 8/15/45 | | United Kingdom | | | 650,000 | | | | 701,234 | |
Tyson Foods Inc., senior bond, 5.10%, 9/28/48 | | United States | | | 690,000 | | | | 779,392 | |
| | | | | | | | | | |
| | | |
| | | | | | | | | 6,972,937 | |
| | | | | | | | | �� | |
FRANKLIN TEMPLETON VARIABLE INSURANCE PRODUCTS TRUST
STATEMENT OF INVESTMENTS (UNAUDITED)
Franklin Allocation VIP Fund(continued)
| | | | | | | | | | |
| | | Country | |
| Principal
Amount |
* | | | Value | |
| | | |
Corporate Bonds(continued) | | | | | | | | | | |
Health Care Equipment & Services 0.6% | | | | | | | | | | |
Abbott Laboratories, senior bond, 3.75%, 11/30/26 | | United States | | | 1,200,000 | | | $ | 1,297,972 | |
Anthem Inc., senior bond, 5.10%, 1/15/44 | | United States | | | 600,000 | | | | 690,076 | |
cCentene Corp., senior note, 144A, 5.375%, 6/01/26 | | United States | | | 300,000 | | | | 316,125 | |
CHS/Community Health Systems Inc., senior secured note, first lien, 6.25%, 3/31/23 | | United States | | | 100,000 | | | | 96,625 | |
Cigna Corp., senior bond, 3.05%, 10/15/27 | | United States | | | 850,000 | | | | 841,568 | |
CVS Health Corp., senior bond, 5.30%, 12/05/43 | | United States | | | 1,050,000 | | | | 1,138,764 | |
cMEDNAX Inc., senior note, 144A, 6.25%, 1/15/27 | | United States | | | 200,000 | | | | 197,250 | |
| | | | | | | | | | |
| | | |
| | | | | | | | | 4,578,380 | |
| | | | | | | | | | |
Insurance 0.8% | | | | | | | | | | |
Aflac Inc., senior bond, 4.75%, 1/15/49 | | United States | | | 700,000 | | | | 827,895 | |
The Allstate Corp., senior bond, 4.20%, 12/15/46 | | United States | | | 700,000 | | | | 783,556 | |
Marsh & McLennan Cos. Inc., senior note, 3.875%, 3/15/24 | | United States | | | 2,000,000 | | | | 2,121,938 | |
MetLife Inc., junior sub. bond, 6.40%, 12/15/66 | | United States | | | 700,000 | | | | 801,500 | |
cMetropolitan Life Global Funding I, secured note, 144A, 3.60%, 1/11/24 | | United States | | | 1,800,000 | | | | 1,897,914 | |
| | | | | | | | | | |
| | | |
| | | | | | | | | 6,432,803 | |
| | | | | | | | | | |
Materials 0.6% | | | | | | | | | | |
cArdagh Packaging Finance PLC/Ardagh MP Holdings USA Inc., senior note, 144A, 6.00%, 2/15/25 | | Luxembourg | | | 200,000 | | | | 207,750 | |
cBWAY Holding Co., senior note, 144A, 7.25%, 4/15/25 | | United States | | | 200,000 | | | | 193,500 | |
cCemex SAB de CV, senior secured bond, first lien, 144A, 5.70%, 1/11/25 | | Mexico | | | 200,000 | | | | 207,743 | |
The Chemours Co., senior note, 5.375%, 5/15/27 | | United States | | | 200,000 | | | | 191,500 | |
cFirst Quantum Minerals Ltd., senior note, 144A, 7.25%, 4/01/23 | | Zambia | | | 300,000 | | | | 293,250 | |
cFMG Resources (August 2006) Pty. Ltd., senior note, 144A, 5.125%, 5/15/24 | | Australia | | | 200,000 | | | | 208,188 | |
Freeport-McMoRan Inc., senior bond, 3.875%, 3/15/23 | | United States | | | 200,000 | | | | 200,500 | |
cGlencore Funding LLC, senior note, 144A, 4.625%, 4/29/24 | | Switzerland | | | 1,350,000 | | | | 1,428,328 | |
International Paper Co., senior bond, 3.80%, 1/15/26 | | United States | | | 1,100,000 | | | | 1,148,330 | |
cNew Gold Inc., senior note, 144A, 6.375%, 5/15/25 | | Canada | | | 200,000 | | | | 167,000 | |
cNorthwest Acquisitions ULC/Dominion Finco Inc., secured note, second lien, 144A, 7.125%, 11/01/22 | | Canada | | | 100,000 | | | | 69,250 | |
cOI European Group BV, senior note, 144A, 4.00%, 3/15/23 | | United States | | | 300,000 | | | | 302,625 | |
cPlastipak Holdings Inc., senior note, 144A, 6.25%, 10/15/25 | | United States | | | 200,000 | | | | 182,000 | |
cReynolds Group Issuer Inc./Reynolds Group Issuer LLC/Reynolds Group | | | | | | | | | | |
Issuer Luxembourg SA, senior secured note, first lien, 144A, 5.125%, 7/15/23 | | United States | | | 300,000 | | | | 306,375 | |
cSunCoke Energy Partners LP/SunCoke Energy Partners Finance Corp., senior note, 144A, 7.50%, 6/15/25 | | United States | | | 200,000 | | | | 196,000 | |
| | | | | | | | | | |
| | | |
| | | | | | | | | 5,302,339 | |
| | | | | | | | | | |
Media & Entertainment 0.5% | | | | | | | | | | |
cCCO Holdings LLC/CCO Holdings Capital Corp., senior bond, 144A, 5.00%, 2/01/28 | | United States | | | 300,000 | | | | 307,110 | |
Charter Communications Operating LLC / Charter Communications Operating Capital, senior secured note, first lien, 4.50%, 2/01/24 | | United States | | | 700,000 | | | | 745,560 | |
Comcast Corp., senior bond, 4.049%, 11/01/52 | | United States | | | 1,350,000 | | | | 1,433,848 | |
cCSC Holdings LLC, senior bond, 144A, 5.375%, 2/01/28 | | United States | | | 300,000 | | | | 312,375 | |
FRANKLIN TEMPLETON VARIABLE INSURANCE PRODUCTS TRUST
STATEMENT OF INVESTMENTS (UNAUDITED)
Franklin Allocation VIP Fund(continued)
| | | | | | | | | | |
| | | Country | |
| Principal
Amount |
* | | | Value | |
| | | |
Corporate Bonds(continued) | | | | | | | | | | |
Media & Entertainment(continued) | | | | | | | | | | |
cTencent Holdings Ltd., senior note, 144A, 3.595%, 1/19/28 | | China | | | 1,200,000 | | | $ | 1,225,098 | |
| | | | | | | | | | |
| | | |
| | | | | | | | | 4,023,991 | |
| | | | | | | | | | |
Pharmaceuticals, Biotechnology & Life Sciences 0.5% | | | | | | | | | | |
Allergan Funding SCS, senior bond, 4.85%, 6/15/44 | | United States | | | 550,000 | | | | 571,453 | |
AstraZeneca PLC, senior bond, 4.375%, 11/16/45 | | United Kingdom | | | 1,000,000 | | | | 1,115,335 | |
cBausch Health Cos. Inc., senior bond, 144A, 6.125%, 4/15/25 | | United States | | | 200,000 | | | | 204,500 | |
Biogen Inc., senior bond, 5.20%, 9/15/45 | | United States | | | 700,000 | | | | 787,137 | |
Celgene Corp., senior bond, 4.625%, 5/15/44 | | United States | | | 600,000 | | | | 684,304 | |
Gilead Sciences Inc., senior bond, 4.80%, 4/01/44 | | United States | | | 700,000 | | | | 797,956 | |
| | | | | | | | | | |
| | | |
| | | | | | | | | 4,160,685 | |
| | | | | | | | | | |
Real Estate 0.0%† | | | | | | | | | | |
American Tower Corp., senior bond, 3.60%, 1/15/28 | | United States | | | 200,000 | | | | 203,678 | |
| | | | | | | | | | |
Retailing 0.3% | | | | | | | | | | |
Alibaba Group Holding Ltd., senior bond, 4.20%, 12/06/47 | | China | | | 1,100,000 | | | | 1,148,708 | |
AutoZone Inc., senior note, 3.75%, 4/18/29 | | United States | | | 500,000 | | | | 520,126 | |
Dollar Tree Inc., senior note, 4.00%, 5/15/25 | | United States | | | 450,000 | | | | 469,204 | |
cParty City Holdings Inc., senior note, 144A, 6.625%, 8/01/26 | | United States | | | 200,000 | | | | 194,500 | |
cPetSmart Inc., senior note, 144A, 7.125%, 3/15/23 | | United States | | | 100,000 | | | | 94,250 | |
| | | | | | | | | | |
| | | |
| | | | | | | | | 2,426,788 | |
| | | | | | | | | | |
Semiconductors & Semiconductor Equipment 0.0%† | | | | | | | | | | |
Qorvo Inc., senior note, 5.50%, 7/15/26 | | United States | | | 300,000 | | | | 318,240 | |
| | | | | | | | | | |
Software & Services 0.3% | | | | | | | | | | |
Microsoft Corp., senior note, 2.65%, 11/03/22 | | United States | | | 2,700,000 | | | | 2,759,972 | |
| | | | | | | | | | |
Technology Hardware & Equipment 0.2% | | | | | | | | | | |
cDell International LLC/EMC Corp., senior secured bond, first lien, 144A, 6.02%, 6/15/26 | | United States | | | 700,000 | | | | 772,551 | |
Tech Data Corp., senior bond, 4.95%, 2/15/27 | | United States | | | 700,000 | | | | 732,880 | |
cTempo Acquisition LLC/Tempo Acquisition Finance Corp., senior note, 144A, 6.75%, 6/01/25 | | United States | | | 300,000 | | | | 310,500 | |
| | | | | | | | | | |
| | | |
| | | | | | | | | 1,815,931 | |
| | | | | | | | | | |
Telecommunication Services 0.2% | | | | | | | | | | |
AT&T Inc., senior bond, 4.85%, 7/15/45 | | United States | | | 300,000 | | | | 320,674 | |
Telefonica Emisiones SA, senior bond, 5.52%, 3/01/49 | | Spain | | | 800,000 | | | | 924,704 | |
| | | | | | | | | | |
| | | |
| | | | | | | | | 1,245,378 | |
| | | | | | | | | | |
Transportation 0.2% | | | | | | | | | | |
CSX Corp., senior bond, 4.75%, 11/15/48 | | United States | | | 800,000 | | | | 932,083 | |
Fedex Corp., senior bond, 5.10%, 1/15/44 | | United States | | | 550,000 | | | | 605,361 | |
cKazakhstan Temir Zholy Finance BV, senior bond, 144A, 6.95%, 7/10/42 | | Kazakhstan | | | 250,000 | | | | 310,701 | |
cMexico City Airport Trust, secured bond, 144A, 5.50%, 7/31/47 | | Mexico | | | 200,000 | | | | 199,594 | |
| | | | | | | | | | |
| | | |
| | | | | | | | | 2,047,739 | |
| | | | | | | | | | |
FRANKLIN TEMPLETON VARIABLE INSURANCE PRODUCTS TRUST
STATEMENT OF INVESTMENTS (UNAUDITED)
Franklin Allocation VIP Fund(continued)
| | | | | | | | | | |
| | | Country | |
| Principal
Amount |
* | | | Value | |
| | | |
Corporate Bonds(continued) | | | | | | | | | | |
Utilities 1.2% | | | | | | | | | | |
Dominion Energy Inc., senior note, 4.25%, 6/01/28 | | United States | | | 1,750,000 | | | $ | 1,905,399 | |
Duke Energy Corp., senior bond, 3.75%, 4/15/24 | | United States | | | 1,350,000 | | | | 1,425,454 | |
cElectricite de France SA, senior note, 144A, 4.50%, 9/21/28 | | France | | | 1,600,000 | | | | 1,755,408 | |
cEnel Finance International NV, senior note, 144A, 4.25%, 9/14/23 | | Italy | | | 1,400,000 | | | | 1,471,344 | |
Georgia Power Co., senior bond, 4.30%, 3/15/42 | | United States | | | 1,400,000 | | | | 1,485,032 | |
Public Service Enterprise Group Inc., senior note, 2.875%, 6/15/24 | | United States | | | 1,000,000 | | | | 1,010,483 | |
cState Grid Overseas Investment 2016 Ltd., senior note, 144A, 3.50%, 5/04/27 | | China | | | 400,000 | | | | 414,246 | |
cTalen Energy Supply LLC, senior secured note, 144A, 7.25%, 5/15/27 | | United States | | | 300,000 | | | | 308,250 | |
| | | | | | | | | | |
| | | |
| | | | | | | | | 9,775,616 | |
| | | | | | | | | | |
| | | |
Total Corporate Bonds (Cost $101,651,625) | | | | | | | | | 104,980,664 | |
| | | | | | | | | | |
| | | |
d,e Senior Floating Rate Interests 0.7% | | | | | | | | | | |
Automobiles & Components 0.0%† | | | | | | | | | | |
f,gAdient US LLC, Initial Term Loans, TBD, 5/06/24 | | United States | | | 40,000 | | | | 39,067 | |
Allison Transmission Inc., Initial Term Loans, 4.475%,(2-month USD LIBOR + 2.00%), 3/29/26 | | United States | | | 200,000 | | | | 200,833 | |
| | | | | | | | | | |
| | | |
| | | | | | | | | 239,900 | |
| | | | | | | | | | |
Capital Goods 0.2% | | | | | | | | | | |
fAECOM, Term B Loans, 4.152%,(1-month USD LIBOR + 1.75%), 3/13/25 | | United States | | | 199,448 | | | | 198,900 | |
fDelos Finance S.A.R.L. (AerCap), New Loans, 4.08%,(3-month USD LIBOR + 1.75%), 10/06/23 | | Luxembourg | | | 166,667 | | | | 166,736 | |
fFlying Fortress Holdings LLC (ILFC), New Loan, 4.08%,(3-month USD LIBOR + 1.75%), 10/30/22 | | United States | | | 200,000 | | | | 200,107 | |
Navistar Inc., Tranche B Term Loan, 5.91%,(1-month USD LIBOR + 3.50%), 11/06/24 | | United States | | | 300,000 | | | | 300,125 | |
fRBS Global Inc. (Rexnord), Term B Loan, 4.402%,(1-month USD LIBOR + 2.00%), 8/21/24 | | United States | | | 300,000 | | | | 300,063 | |
Resideo Funding Inc., Tranche B Term Loans, 4.330%,(3-month USD LIBOR + 2.00%), 10/25/25 | | United States | | | 200,000 | | | | 200,165 | |
| | | | | | | | | | |
| | | |
| | | | | | | | | 1,366,096 | |
| | | | | | | | | | |
Commercial & Professional Services 0.0%† | | | | | | | | | | |
Nielsen Finance LLC,Class B-4 Term Loans, 4.411%,(1-month USD LIBOR + 2.00%), 10/04/23 | | United States | | | 200,000 | | | | 198,357 | |
fUnited Rentals North America Inc., Initial Term Loans, 4.152%,(1-month USD LIBOR + 1.75%), 10/31/25 | | United States | | | 199,497 | | | | 199,729 | |
| | | | | | | | | | |
| | | |
| | | | | | | | | 398,086 | |
| | | | | | | | | | |
Consumer Services 0.1% | | | | | | | | | | |
Avis Budget Car Rental LLC, Tranche B Term Loans, 4.41%,(1-month USD LIBOR + 2.00%), 2/13/25 | | United States | | | 200,000 | | | | 199,813 | |
f,gHilton Worldwide Finance LLC, SeriesB-2 Term Loans, TBD, 10/25/23 | | United States | | | 200,000 | | | | 200,337 | |
KFC Holding Co./Pizza Hut Holdings LLC/Taco Bell of America LLC (Yum Brands), Term Loan B, 4.132%,(1-month USD LIBOR + 1.75%), 4/03/25 | | United States | | | 200,000 | | | | 199,890 | |
FRANKLIN TEMPLETON VARIABLE INSURANCE PRODUCTS TRUST
STATEMENT OF INVESTMENTS (UNAUDITED)
Franklin Allocation VIP Fund(continued)
| | | | | | | | | | |
| | | Country | |
| Principal
Amount |
* | | | Value | |
| | | |
d,eSenior Floating Rate Interests (continued) | | | | | | | | | | |
Consumer Services (continued) | | | | | | | | | | |
fLas Vegas Sands LLC, Term B Loans, 4.152%,(1-month USD LIBOR + 1.75%), 3/27/25 | | United States | | | 200,000 | | | $ | 198,841 | |
| | | | | | | | | | |
| | | |
| | | | | | | | | 798,881 | |
| | | | | | | | | | |
Food & Staples Retailing 0.0%† | | | | | | | | | | |
Aramark Corp., U.S. TermB-3 Loan, 4.08%,(3-month USD LIBOR + 1.75%), 3/11/25 | | United States | | | 200,000 | | | | 199,687 | |
fU.S. Foods Inc., Initial Term Loans, 4.402%,(1-month USD LIBOR + 2.00%), 6/27/23 | | United States | | | 200,000 | | | | 198,964 | |
| | | | | | | | | | |
| | | |
| | | | | | | | | 398,651 | |
| | | | | | | | | | |
Food, Beverage & Tobacco 0.0%† | | | | | | | | | | |
fJBS USA Lux SA, Term Loan, 4.902%,(1-month USD LIBOR + 2.50%), 5/01/26 | | United States | | | 221,515 | | | | 221,408 | |
| | | | | | | | | | |
Health Care Equipment & Services 0.1% | | | | | | | | | | |
DaVita Healthcare Partners Inc., Tranche B Term Loan, 5.135%,(1-week USD LIBOR + 2.75%), 6/24/21 | | United States | | | 200,000 | | | | 200,125 | |
fHCA Inc., Term Loan B11, 4.08%,(3-month USD LIBOR + 1.75%), 3/18/23 | | United States | | | 199,495 | | | | 199,786 | |
| | | | | | | | | | |
| | | |
| | | | | | | | | 399,911 | |
| | | | | | | | | | |
Materials 0.1% | | | | | | | | | | |
fAxalta Coating Systems U.S. Holdings Inc., TermB-3 Dollar Loan, 4.08%,(3-month USD LIBOR + 1.75%), 6/01/24 | | United States | | | 199,495 | | | | 197,438 | |
fCrown Americas LLC, Dollar Term B Loan, 4.401%,(1-month USD LIBOR + 2.00%), 4/03/25 | | United States | | | 200,000 | | | | 201,363 | |
| | | | | | | | | | |
| | | |
| | | | | | | | | 398,801 | |
| | | | | | | | | | |
Media & Entertainment 0.1% | | | | | | | | | | |
Charter Communications Operating LLC, Term B Loan, 4.33%,(3-month USD LIBOR + 2.00%), 4/30/25 | | United States | | | 200,000 | | | | 200,000 | |
Gray Television Inc., Term C Loan, 4.931%,(1-month USD LIBOR + 2.50%), 1/02/26 | | United States | | | 300,000 | | | | 300,075 | |
f,gNexstar Broadcasting Inc., TermB-4 Loan, TBD, 7/31/26 | | United States | | | 12,226 | | | | 12,198 | |
| | | | | | | | | | |
| | | |
| | | | | | | | | 512,273 | |
| | | | | | | | | | |
Software & Services 0.0%† | | | | | | | | | | |
fCarbonite Inc., Initial Term Loan, 6.152%,(1-month USD LIBOR + 3.75%), 3/26/26 | | United States | | | 11,765 | | | | 11,811 | |
| | | | | | | | | | |
Technology Hardware & Equipment 0.1% | | | | | | | | | | |
fCDW LLC, Term B Loan, 4.16%,(1-month USD LIBOR + 1.75%), 8/17/23 | | United States | | | 199,486 | | | | 199,673 | |
CommScope Inc., Initial Term Loans, 5.652%,(1-month USD LIBOR + 3.25%), 4/04/26 | | United States | | | 300,000 | | | | 300,038 | |
Western Digital Corp., U.S. TermB-4 Loan, 4.152%,(1-month USD LIBOR + 1.75%), 4/29/23 | | United States | | | 200,000 | | | | 196,050 | |
| | | | | | | | | | |
| | | |
| | | | | | | | | 695,761 | |
| | | | | | | | | | |
FRANKLIN TEMPLETON VARIABLE INSURANCE PRODUCTS TRUST
STATEMENT OF INVESTMENTS (UNAUDITED)
Franklin Allocation VIP Fund(continued)
| | | | | | | | | | | | | | |
| | | Country | |
| Principal
Amount |
* | | | | | | | Value | |
| |
| | | | |
d,e Senior Floating Rate Interests (continued) | | | | | | | | | | | | | | |
Telecommunication Services 0.0%† | | | | | | | | | | | | | | |
fGlobal Tel*Link Corp., First Lien Term Loan, 6.652%,(1-month USD LIBOR + 4.25%), 11/29/25 | | United States | | | 39,900 | | | | | | | $ | 38,613 | |
fSecurus Technologies Holdings Inc., Initial Term Loan, 6.83%,(3-month USD LIBOR + 4.50%), 11/01/24 | | United States | | | 29,924 | | | | | | | | 27,929 | |
| | | | | | | | | | | | | | |
| | | | |
| | | | | | | | | | | | | 66,542 | |
| | | | | | | | | | | | | | |
Transportation 0.0%† | | | | | | | | | | | | | | |
Air Canada, Term Loan, 4.428%,(1-month USD LIBOR + 2.00%), 10/06/23 | | Canada | | | 200,000 | | | | | | | | 200,000 | |
fXPO Logistics Inc., Refinanced Term Loan, 4.40%,(1-month USD LIBOR + 2.00%), 2/24/25 | | United States | | | 200,000 | | | | | | | | 198,682 | |
| | | | | | | | | | | | | | |
| | | | |
| | | | | | | | | | | | | 398,682 | |
| | | | | | | | | | | | | | |
Utilities 0.0%† | | | | | | | | | | | | | | |
f,gNRG Energy Inc., Term Loan B, TBD, 6/30/23 | | United States | | | 200,000 | | | | | | | | 200,146 | |
| | | | | | | | | | | | | | |
| | | | |
Total Senior Floating Rate Interests (Cost $6,125,691) | | | | | | | | | | | | | 6,106,949 | |
| | | | | | | | | | | | | | |
| | | | |
Foreign Government and Agency Securities 0.5% | | | | | | | | | | | | | | |
cAngolan Government International Bond, senior note, 144A, 8.25%, 5/09/28 | | Angola | | | 300,000 | | | | | | | | 321,762 | |
hBanque Centrale de Tunisie International Bond, senior note, Reg S, 5.625%, 2/17/24 | | Tunisia | | | 300,000 | | | | EUR | | | | 339,844 | |
cDominican Republic, senior note, 144A, 8.90%, 2/15/23 | | Dominican Republic | | | 14,600,000 | | | | DOP | | | | 288,262 | |
Government of Colombia, | | | | | | | | | | | | | | |
senior bond, 9.85%, 6/28/27 | | Colombia | | | 1,000,000,000 | | | | COP | | | | 392,753 | |
senior bond, 5.00%, 6/15/45 | | Colombia | | | 300,000 | | | | | | | | 331,971 | |
cGovernment of Gabon, 144A, 6.375%, 12/12/24 | | Gabon | | | 400,000 | | | | | | | | 396,842 | |
cGovernment of Indonesia, senior bond, 144A, 4.35%, 1/08/27 | | Indonesia | | | 300,000 | | | | | | | | 320,762 | |
cGovernment of Iraq, 144A, 5.80%, 1/15/28 | | Iraq | | | 400,000 | | | | | | | | 395,282 | |
Government of Mexico, senior note, 4.15%, 3/28/27 | | Mexico | | | 200,000 | | | | | | | | 209,700 | |
Government of South Africa, senior bond, 7.00%, 2/28/31 | | South Africa | | | 5,500,000 | | | | ZAR | | | | 334,511 | |
cGovernment of Ukraine, senior bond, 144A, 7.375%, 9/25/32 | | Ukraine | | | 400,000 | | | | | | | | 393,594 | |
iGovernment of Uruguay, senior bond, Index Linked, 3.70%, 6/26/37 | | Uruguay | | | 9,963,196 | | | | UYU | | | | 281,654 | |
| | | | | | | | | | | | | | |
| | | | |
Total Foreign Government and Agency Securities
(Cost $3,894,913) | | | | | | | | | | | | | 4,006,937 | |
| | | | | | | | | | | | | | |
| | | | |
U.S. Government and Agency Securities 4.9% | | | | | | | | | | | | | | |
Federal Agricultural Mortgage Corp., 2.90%, 1/03/22 | | United States | | | 800,000 | | | | | | | | 821,383 | |
FFCB, | | | | | | | | | | | | | | |
3.17%, 3/07/28 | | United States | | | 800,000 | | | | | | | | 854,825 | |
senior bond, 2.86%, 7/11/28 | | United States | | | 800,000 | | | | | | | | 835,607 | |
FHLB, 2.625%, 9/12/25 | | United States | | | 1,600,000 | | | | | | | | 1,655,154 | |
Hashemite Kingdom of Jordan Government AID Bond, senior note, 2.578%, 6/30/22 | | United States | | | 800,000 | | | | | | | | 818,095 | |
Israel Government Agency for International Development Bond, 5.50%, 9/18/23 | | United States | | | 1,110,000 | | | | | | | | 1,268,934 | |
TVA, 5.88%, 4/01/36 | | United States | | | 630,000 | | | | | | | | 868,671 | |
FRANKLIN TEMPLETON VARIABLE INSURANCE PRODUCTS TRUST
STATEMENT OF INVESTMENTS (UNAUDITED)
Franklin Allocation VIP Fund(continued)
| | | | | | | | | | | | | | |
| | | Country | | Principal
Amount* | | | | | | Value | |
| |
| | | | |
U.S. Government and Agency Securities (continued) | | | | | | | | | | | | | | |
U.S. Treasury Bond, | | | | | | | | | | | | | | |
3.125%, 2/15/42 | | United States | | | 6,450,000 | | | | | | | $ | 7,207,749 | |
2.50%, 2/15/46 | | United States | | | 840,000 | | | | | | | | 834,652 | |
3.00%, 2/15/49 | | United States | | | 3,060,000 | | | | | | | | 3,356,557 | |
iIndex Linked, 2.00%, 1/15/26 | | United States | | | 514,926 | | | | | | | | 573,195 | |
iIndex Linked, 1.75%, 1/15/28 | | United States | | | 792,744 | | | | | | | | 889,206 | |
iIndex Linked, 3.625%, 4/15/28 | | United States | | | 710,872 | | | | | | | | 913,079 | |
U.S. Treasury Note, | | | | | | | | | | | | | | |
1.125%, 6/30/21 | | United States | | | 4,400,000 | | | | | | | | 4,345,687 | |
2.375%, 8/15/24 | | United States | | | 1,680,000 | | | | | | | | 1,728,562 | |
2.25%, 8/15/27 | | United States | | | 420,000 | | | | | | | | 429,975 | |
2.625%, 2/15/29 | | United States | | | 8,100,000 | | | | | | | | 8,538,064 | |
iIndex Linked, 0.125%, 7/15/24 | | United States | | | 1,721,676 | | | | | | | | 1,719,392 | |
iIndex Linked, 0.375%, 7/15/25 | | United States | | | 2,909,032 | | | | | | | | 2,942,275 | |
| | | | | | | | | | | | | | |
| | | | |
Total U.S. Government and Agency Securities
(Cost $39,061,770) | | | | | | | | | | | | | 40,601,062 | |
| | | | | | | | | | | | | | |
| | | | |
Asset-Backed Securities and Commercial Mortgage- Backed Securities 5.4% | | | | | | | | | | | | | | |
| | | | |
Diversified Financials 5.4% | | | | | | | | | | | | | | |
c,jAtrium XII, 12A, CR, 144A, FRN, 4.242%,(3-month USD LIBOR + 1.65%), 4/22/27 | | United States | | | 1,240,000 | | | | | | | | 1,224,773 | |
c,kAtrium XIII,2017-13A, A1, 144A, FRN, 3.772%, 11/21/30 | | United States | | | 1,410,000 | | | | | | | | 1,404,684 | |
c,kBlueMountain CLO XXII Ltd.,2018-1A, B, 144A, FRN, 4.283%, 7/30/30 | | United States | | | 1,200,000 | | | | | | | | 1,197,564 | |
c,kBlueMountain CLO XXIII Ltd.,2018-23A, D, 144A, FRN, 5.492%, 10/20/31 | | United States | | | 800,000 | | | | | | | | 776,000 | |
c,jBlueMountain Fuji U.S. CLO III Ltd.,2017-3A, A2, 144A, FRN, 3.747%,(3-month USD LIBOR + 1.15%), 1/15/30 | | United States | | | 1,000,000 | | | | | | | | 973,800 | |
cBRAVO Residential Funding Trust,2019-1, A1C, 144A, 3.50%, 3/25/58 | | United States | | | 948,573 | | | | | | | | 969,386 | |
cBWAY Mortgage Trust, 2013-1515, C, 144A, 3.454%, 3/10/33 | | United States | | | 750,000 | | | | | | | | 787,224 | |
c,j Carlyle Global Market Strategies CLO Ltd., | | | | | | | | | | | | | | |
2014-4RA, C, 144A, FRN, 5.497%,(3-month USD LIBOR + 2.90%), 7/15/30 | | United States | | | 440,000 | | | | | | | | 420,732 | |
2015-2A, A1R, 144A, FRN, 3.362%,(3-month USD LIBOR + 0.78%), 4/27/27 | | United States | | | 1,000,000 | | | | | | | | 997,260 | |
c,kCARLYLE US CLO Ltd.,2017-4A, A1, 144A, FRN, 3.777%, 1/15/30 | | United States | | | 1,000,000 | | | | | | | | 998,780 | |
c,kCent CLO,2018-28A, C, 144A, FRN, 5.985%, 11/07/30 | | United States | | | 750,000 | | | | | | | | 738,750 | |
c,kCIM Trust, 2019-INV2, A3, 144A, FRN, 4.00%, 5/25/49 | | United States | | | 723,910 | | | | | | | | 740,991 | |
c,kCOMM Mortgage Trust, 2014-277P, A, 144A, FRN, 3.611%, 8/10/49 | | United States | | | 1,000,000 | | | | | | | | 1,061,606 | |
c,jDryden 41 Senior Loan Fund,2015-41A, AR, 144A, FRN, 3.567%,(3-month USD LIBOR + 0.97%), 4/15/31 | | United States | | | 1,000,000 | | | | | | | | 989,530 | |
c,jDryden 42 Senior Loan Fund,2016-42A, CR, 144A, FRN, 4.647%,(3-month USD LIBOR + 2.05%), 7/15/30 | | United States | | | 900,000 | | | | | | | | 879,345 | |
c,jDryden 50 Senior Loan Fund,2017-50A, A1, 144A, FRN, 3.817%,(3-month USD LIBOR + 1.22%), 7/15/30 | | United States | | | 1,880,000 | | | | | | | | 1,876,372 | |
FRANKLIN TEMPLETON VARIABLE INSURANCE PRODUCTS TRUST
STATEMENT OF INVESTMENTS (UNAUDITED)
Franklin Allocation VIP Fund(continued)
| | | | | | | | | | | | | | | | |
| | | | |
| | | Country | | | Principal
Amount* | | | | | | Value | |
Asset-Backed Securities and Commercial Mortgage-Backed
Securities(continued) | | | | | | | | | | | | | |
Diversified Financials(continued) | | | | | | | | | | | | | | | | |
FHLMC Structured Agency Credit Risk Debt Notes, | | | | | | | | | | | | | | | | |
j2016-DNA2, M3, FRN, 7.054%,(1-month USD LIBOR + 4.65%), 10/25/28 | | | United States | | | | 1,000,000 | | | | | | | $ | 1,080,950 | |
k2017-DNA2, M2, FRN, 5.854%, 10/25/29 | | | United States | | | | 1,000,000 | | | | | | | | 1,070,460 | |
j2017-DNA3, M2, FRN, 4.904%,(1-month USD LIBOR + 2.50%), 3/25/30 | | | United States | | | | 1,000,000 | | | | | | | | 1,023,610 | |
FNMA Connecticut Avenue Securities, | | | | | | | | | | | | | | | | |
j2013-C01, M2, FRN, 7.654%,(1-month USD LIBOR + 5.25%), 10/25/23 | | | United States | | | | 863,390 | | | | | | | | 959,832 | |
j2014-C01, M2, FRN, 6.804%,(1-month USD LIBOR + 4.40%), 1/25/24 | | | United States | | | | 1,000,000 | | | | | | | | 1,093,893 | |
j2014-C03, 1M2, FRN, 5.404%,(1-month USD LIBOR + 3.00%), 7/25/24 | | | United States | | | | 1,446,690 | | | | | | | | 1,518,150 | |
j2014-C04, 2M2, FRN, 7.404%,(1-month USD LIBOR + 5.00%), 11/25/24 | | | United States | | | | 1,242,541 | | | | | | | | 1,361,168 | |
k2016-C02, 1M2, FRN, 8.404%, 9/25/28 | | | United States | | | | 948,333 | | | | | | | | 1,049,068 | |
k2016-C04, 1M2, FRN, 6.654%, 1/25/29 | | | United States | | | | 1,000,000 | | | | | | | | 1,074,795 | |
j2017-C01, 1M2, FRN, 5.954%,(1-month USD LIBOR + 3.55%), 7/25/29 | | | United States | | | | 1,000,000 | | | | | | | | 1,059,460 | |
k2017-C03, 1M2, FRN, 5.404%, 10/25/29 | | | United States | | | | 1,000,000 | | | | | | | | 1,044,765 | |
k2017-C05, 1M2, FRN, 4.604%, 1/25/30 | | | United States | | | | 1,000,000 | | | | | | | | 1,010,418 | |
c,jLCM XXV Ltd., 25A, B2, 144A, FRN, 4.242%,(3-month USD LIBOR + 1.65%), 7/20/30 | | | United States | | | | 1,200,000 | | | | | | | | 1,194,624 | |
c,l,mMadison Park Euro Funding XIV DAC, 14A, A1N, 144A, FRN, 7/15/32 | | | Ireland | | | | 250,000 | | | | EUR | | | | 284,213 | |
c,jMadison Park Funding XI Ltd.,2013-11, CR, 144A, FRN, 4.792%,(3-month USD LIBOR + 2.20%), 7/23/29 | | | United States | | | | 1,000,000 | | | | | | | | 993,730 | |
c,kMadison Park Funding XXIX Ltd.,2018-29A, B, 144A, FRN, 4.351%, 10/18/30 | | | United States | | | | 1,500,000 | | | | | | | | 1,499,970 | |
c,jMadison Park Funding XXVI Ltd.,2017-26A, AR, 144A, FRN, 3.782%,(3-month USD LIBOR + 1.20%), 7/29/30 | | | United States | | | | 2,350,000 | | | | | | | | 2,352,068 | |
c,kMill City Mortgage Loan Trust,2018-2, A1, 144A, FRN, 3.50%, 5/25/58 | | | United States | | | | 1,247,021 | | | | | | | | 1,277,763 | |
c,kNeuberger Berman CLO XVIII Ltd.,2014-18A, CR2, 144A, FRN, 5.592%, 10/21/30 | | | United States | | | | 800,000 | | | | | | | | 778,576 | |
c,kOctagon Investment Partners18-R Ltd.,2018-18A, A1A, 144A, FRN, 3.561%, 4/16/31 | | | United States | | | | 1,000,000 | | | | | | | | 989,500 | |
c,kOctagon Investment Partners 28 Ltd.,2016-1A, BR, 144A, FRN, 4.381%, 10/24/30 | | | United States | | | | 1,200,000 | | | | | | | | 1,201,764 | |
c,jOctagon Investment Partners XVI Ltd.,2013-1A, CR, 144A, FRN, 4.438%,(3-month USD LIBOR + 1.85%), 7/17/30 | | | United States | | | | 850,000 | | | | | | | | 823,540 | |
c,k Towd Point Mortgage Trust, | | | | | | | | | | | | | | | | |
2015-5, A1B, 144A, FRN, 2.75%, 5/25/55 | | | United States | | | | 785,540 | | | | | | | | 789,071 | |
2018-1, A1, 144A, FRN, 3.00%, 1/25/58 | | | United States | | | | 1,429,085 | | | | | | | | 1,447,577 | |
2018-3, A1, 144A, FRN, 3.75%, 5/25/58 | | | United States | | | | 1,070,337 | | | | | | | | 1,116,239 | |
| | | | | | | | | | | | | | | | |
| | | | |
Total Asset-Backed Securities and Commercial
Mortgage-Backed Securities (Cost $44,296,777) | | | | | | | | | | | | | | | 44,132,001 | |
| | | | | | | | | | | | | | | | |
FRANKLIN TEMPLETON VARIABLE INSURANCE PRODUCTS TRUST
STATEMENT OF INVESTMENTS (UNAUDITED)
Franklin Allocation VIP Fund(continued)
| | | | | | | | | | | | | | | | |
| | | | |
| | | Country | | | Principal
Amount* | | | | | | Value | |
Mortgage-Backed Securities 12.0% | | | | | | | | | | | | | | | | |
| | | | |
Federal Home Loan Mortgage Corp. (FHLMC) Fixed Rate 1.5% | | | | | | | | | | | | | | | | |
| | | | |
nFHLMC Gold 30 Year, 3.00%, 6/01/49 | | | United States | | | | 5,700,000 | | | | | | | $ | 5,746,467 | |
| | | | |
FHLMC Gold 30 Year, 3.50%, 5/01/49 | | | United States | | | | 6,519,759 | | | | | | | | 6,669,322 | |
| | | | | | | | | | | | | | | | |
| | | | |
| | | | | | | | | | | | | | | 12,415,789 | |
| | | | | | | | | | | | | | | | |
| | | | |
Federal National Mortgage Association (FNMA) Fixed Rate 4.7% | | | | | | | | | | | | | | | | |
| | | | |
FNMA 30 Year, 3.00%, 5/01/49 | | | United States | | | | 6,247,012 | | | | | | | | 6,303,406 | |
| | | | |
FNMA 30 Year, 3.50%, 6/01/49 | | | United States | | | | 7,269,727 | | | | | | | | 7,442,321 | |
| | | | |
nFNMA 30 Year, 3.50%, 7/01/49 | | | United States | | | | 2,050,000 | | | | | | | | 2,095,324 | |
| | | | |
nFNMA 30 Year, 4.00%, 6/01/49 | | | United States | | | | 3,100,000 | | | | | | | | 3,203,475 | |
| | | | |
FNMA 30 Year, 4.00%, 6/01/49 | | | United States | | | | 11,440,668 | | | | | | | | 11,848,369 | |
| | | | |
FNMA 30 Year, 4.50%, 1/01/49 | | | United States | | | | 7,303,322 | | | | | | | | 7,651,879 | |
| | | | | | | | | | | | | | | | |
| | | | |
| | | | | | | | | | | | | | | 38,544,774 | |
| | | | | | | | | | | | | | | | |
| | | | |
Government National Mortgage Association (GNMA) Fixed Rate 5.8% | | | | | | | | | | | | | | | | |
| | | | |
GNMA II SF 30 Year, 3.00%, 9/20/47 | | | United States | | | | 2,960,894 | | | | | | | | 3,028,842 | |
| | | | |
GNMA II SF 30 Year, 3.00%, 11/20/47 - 5/20/49 | | | United States | | | | 1,786,080 | | | | | | | | 1,827,068 | |
| | | | |
GNMA II SF 30 Year, 3.50%, 4/20/49 | | | United States | | | | 12,733,895 | | | | | | | | 13,159,184 | |
| | | | |
GNMA II SF 30 Year, 3.50%, 5/20/49 | | | United States | | | | 12,973,706 | | | | | | | | 13,407,005 | |
| | | | |
GNMA II SF 30 Year, 4.00%, 5/20/49 | | | United States | | | | 7,783,595 | | | | | | | | 8,104,889 | |
| | | | |
GNMA II SF 30 Year, 4.50%, 5/20/49 | | | United States | | | | 5,187,832 | | | | | | | | 5,439,513 | |
| | | | |
GNMA II SF 30 Year, 5.00%, 3/20/49 | | | United States | | | | 2,976,941 | | | | | | | | 3,127,345 | |
| | | | | | | | | | | | | | | | |
| | | | |
| | | | | | | | | | | | | | | 48,093,846 | |
| | | | | | | | | | | | | | | | |
| | | | |
Total Mortgage-Backed Securities (Cost $98,201,518) | | | | | | | | | | | | | | | 99,054,409 | |
| | | | | | | | | | | | | | | | |
| | | | |
Total Investments before Short Term Investments
(Cost $808,026,364) | | | | | | | | | | | | | | | 810,217,766 | |
| | | | | | | | | | | | | | | | |
| | | | |
| | | | | | Shares | | | | | | | |
Short Term Investments (Cost $23,981,648) 2.9% | | | | | | | | | | | | | | | | |
| | | | |
Money Market Funds 2.9% | | | | | | | | | | | | | | | | |
| | | | |
b,oInstitutional Fiduciary Trust Money Market Portfolio, 2.05% | | | United States | | | | 23,981,648 | | | | | | | | 23,981,648 | |
| | | | | | | | | | | | | | | | |
| | | | |
Total Investments (Cost $832,008,012) 101.1% | | | | | | | | | | | | | | | 834,199,414 | |
| | | | |
Other Assets, less Liabilities (1.1)% | | | | | | | | | | | | | | | (8,686,335 | ) |
| | | | | | | | | | | | | | | | |
| | | | |
Net Assets 100.0% | | | | | | | | | | | | | | $ | 825,513,079 | |
| | | | | | | | | | | | | | | | |
FRANKLIN TEMPLETON VARIABLE INSURANCE PRODUCTS TRUST
STATEMENT OF INVESTMENTS (UNAUDITED)
Franklin Allocation VIP Fund(continued)
†Rounds to less than 0.1% of net assets.
*The principal amount is stated in U.S. dollars unless otherwise indicated.
aNon-income producing.
bSee Note 3(e) regarding investments in affiliated management investment companies.
cSecurity was purchased pursuant to Rule 144A under the Securities Act of 1933 and may be sold in transactions exempt from registration only to qualified institutional buyers or in a public offering registered under the Securities Act of 1933. These securities have been deemed liquid under guidelines approved by the Trust’s Board of Trustees. At June 30, 2019, the aggregate value of these securities was $58,858,466, representing 7.1% of net assets.
dThe coupon rate shown represents the rate at period end.
eSee Note 1(f) regarding senior floating rate interests.
fSecurity purchased on a delayed delivery basis. See Note 1(c).
gA portion or all of the security represents an unsettled loan commitment. The coupon rate isto-be determined (TBD) at the time of settlement and will be based upon a reference index/floor plus a spread.
hSecurity was purchased pursuant to Regulation S under the Securities Act of 1933, which exempts from registration securities offered and sold outside of the United States. Such a security cannot be sold in the United States without either an effective registration statement filed pursuant to the Securities Act of 1933, or pursuant to an exemption from registration. This security has been deemed liquid under guidelines approved by the Trust’s Board of Trustees. At June 30, 2019, the value of this security was $339,844, representing less than 0.1% of net assets.
iPrincipal amount of security is adjusted for inflation. See Note 1(h).
jThe coupon rate shown represents the rate inclusive of any caps or floors, if applicable, in effect at period end.
kAdjustable rate security with an interest rate that is not based on a published reference index and spread. The rate is based on the structure of the agreement and current market conditions. The coupon rate shown represents the rate at period end.
lSecurity purchased on a when-issued basis. See Note 1(c).
mThe coupon rate will be determined at time of issue.
nSecurity purchased on ato-be-announced (TBA) basis. See Note 1(c).
oThe rate shown is the annualizedseven-day effective yield at period end.
At June 30, 2019, the Fund had the following futures contracts outstanding. See Note 1(d).
Futures Contracts
| | | | | | | | | | | | | | | | | | | | |
| | | | | |
| Description | | Type | | | Number of
Contracts | | | Notional
Amount* | | | Expiration
Date | | | Value/
Unrealized
Appreciation
(Depreciation) | |
| |
| | | | | |
| Equity Contracts | | | | | | | | | | | | | | | | | | | | |
| | | | | |
S&P 500E-Mini | | | Long | | | | 9 | | | | $ 1,324,890 | | | | 9/20/19 | | | | $ 14,172 | |
| | | | | | | | | | | | | | | | | | | | |
| | | | | |
| Interest Rate Contracts | | | | | | | | | | | | | | | | | | | | |
| | | | | |
Australian 3 Yr. Bond | | | Long | | | | 67 | | | | 5,408,413 | | | | 9/16/19 | | | | 6,064 | |
| | | | | |
Australian 10 Yr. Bond | | | Long | | | | 19 | | | | 1,915,869 | | | | 9/16/19 | | | | 9,326 | |
| | | | | |
Canada 10 Yr. Bond | | | Long | | | | 11 | | | | 1,200,405 | | | | 9/19/19 | | | | (4,970 | ) |
| | | | | |
CME Ultra Long Term U.S. Treasury Bond | | | Long | | | | 7 | | | | 1,242,938 | | | | 9/19/19 | | | | 14,646 | |
| | | | | |
U.S. Treasury 2 Yr. Note | | | Long | | | | 5 | | | | 1,075,898 | | | | 9/30/19 | | | | 892 | |
| | | | | |
U.S. Treasury 5 Yr. Note | | | Long | | | | 163 | | | | 19,259,469 | | | | 9/30/19 | | | | 218,824 | |
| | | | | |
U.S. Treasury 10 Yr. Note | | | Long | | | | 7 | | | | 895,781 | | | | 9/19/19 | | | | 7,567 | |
| | | | | |
U.S. Treasury 10 Yr. Note | | | Short | | | | 28 | | | | 3,583,125 | | | | 9/19/19 | | | | (77,913 | ) |
| | | | | |
U.S. Treasury 30 Yr. Bond | | | Long | | | | 11 | | | | 1,711,531 | | | | 9/19/19 | | | | 23,359 | |
| | | | | | | | | | | | | | | | | | | | |
| | | | | |
| | | | | | | | | | | $36,293,429 | | | | | | | | $197,795 | |
| | | | | | | | | | | | | | | | | | | | |
| | | | | |
Total Futures Contracts | | | | | | | | | | | $37,618,319 | | | | | | | | $211,967 | |
| | | | | | | | | | | | | | | | | | | | |
*As of period end.
FRANKLIN TEMPLETON VARIABLE INSURANCE PRODUCTS TRUST
STATEMENT OF INVESTMENTS (UNAUDITED)
Franklin Allocation VIP Fund(continued)
At June 30, 2019, the Fund had the following forward exchange contracts outstanding. See Note 1(d).
Forward Exchange Contracts
| | | | | | | | | | | | | | | | | | | | | | | | | | | | |
| Currency | | Counterpartya | | | Type | | | Quantity | | | Contract
Amount | | | Settlement
Date | | | Unrealized
Appreciation | | | Unrealized
Depreciation | |
| |
| | | | | | |
| OTC Forward Exchange Contracts | | | | | | | | | | | | | | | | | | | | | | | | | |
| | | | | | | |
Mexican Peso | | | JPHQ | | | | Buy | | | | 6,950,000 | | | | $360,384 | | | | 8/08/19 | | | | $ — | | | | $ (1,006 | ) |
| | | | | | | |
Canadian Dollar | | | JPHQ | | | | Sell | | | | 830,000 | | | | 620,670 | | | | 9/18/19 | | | | — | | | | (13,983 | ) |
| | | | | | | |
Euro | | | JPHQ | | | | Sell | | | | 588,336 | | | | 666,978 | | | | 9/18/19 | | | | — | | | | (6,276 | ) |
| | | | | | | |
Norwegian Krone | | | JPHQ | | | | Buy | | | | 5,110,000 | | | | 585,835 | | | | 9/18/19 | | | | 14,343 | | | | — | |
| | | | | | | |
Swedish Krona | | | JPHQ | | | | Sell | | | | 5,530,000 | | | | 583,580 | | | | 9/18/19 | | | | — | | | | (15,493 | ) |
| | | | | | | |
Chinese Yuan Renminbi | | | JPHQ | | | | Sell | | | | 1,845,000 | | | | 273,637 | | | | 9/27/19 | | | | 5,305 | | | | — | |
| | | | | | | |
Chinese Yuan Renminbi | | | JPHQ | | | | Sell | | | | 3,250,000 | | | | 470,074 | | | | 9/27/19 | | | | — | | | | (2,598 | ) |
| | | | | | | |
South Korean Won | | | JPHQ | | | | Sell | | | | 467,500,000 | | | | 403,243 | | | | 9/27/19 | | | | — | | | | (1,865 | ) |
| | | | | | | |
Australian Dollar | | | JPHQ | | | | Sell | | | | 530,000 | | | | 365,218 | | | | 10/11/19 | | | | — | | | | (7,940 | ) |
| | | | | | | |
Australian Dollar | | | JPHQ | | | | Sell | | | | 570,000 | | | | 403,325 | | | | 10/11/19 | | | | 2,004 | | | | — | |
| | | | | | | |
Turkish Lira | | | JPHQ | | | | Buy | | | | 1,380,000 | | | | 221,633 | | | | 10/18/19 | | | | 3,140 | | | | — | |
| | | | | | | |
Indonesian Rupiah | | | JPHQ | | | | Buy | | | | 4,950,000,000 | | | | 337,953 | | | | 12/16/19 | | | | 4,885 | | | | — | |
| | | | | | | | | | | | | | | | | | | | | | | | |
| | | | | |
Total Forward Exchange Contracts | | | | | | | | | | | | | | | | $ 29,677 | | | | $ (49,161 | ) |
| | | | | | | | | | | | | | | | | | | | | | | | |
| | | | | |
Net unrealized appreciation (depreciation) | | | | | | | | | | | | | | | | | | | | $ (19,484 | ) |
| | | | | | | | | | | | | | | | | | | | | | | | | | | | |
aMay be comprised of multiple contracts with the same counterparty, currency and settlement date.
FRANKLIN TEMPLETON VARIABLE INSURANCE PRODUCTS TRUST
STATEMENT OF INVESTMENTS (UNAUDITED)
Franklin Allocation VIP Fund(continued)
At June 30, 2019, the Fund had the following credit default swap contracts outstanding. See Note 1(d).
Credit Default Swap Contracts
| | | | | | | | | | | | | | | | | | | | | | | | | | | | | | | | | | | | |
| Description | | Periodic
Payment Rate
Received
(Paid) | | | Payment
Frequency | | | Counter-
party | | | Maturity
Date | | | Notional
Amounta | | | Value | | | Unamortized
Upfront
Payments
(Receipts) | | | Unrealized
Appreciation
(Depreciation) | | | Ratingb | |
| | | | | | | |
Centrally Cleared Swap Contracts | | | | | | | | | | | | | | | | | | | | | | | | | | | | | |
| | | | | | | |
Contracts to Sell Protectionc,d | | | | | | | | | | | | | | | | | | | | | | | | | | | | | |
| | | | | | | | | |
Traded Index | | | | | | | | | | | | | | | | | | | | | | | | | | | | | | | | | | | | |
| | | | | | | | | |
CDX.NA.HY.32 | | | 5.00 | % | | | Quarterly | | | | | | | | 6/20/24 | | | | $2,160,000 | | | | $165,667 | | | | $ 159,371 | | | | $ 6,296 | | |
| Non- Investment
Grade |
|
CDX.NA.IG.32 | | | 1.00 | % | | | Quarterly | | | | | | | | 6/20/24 | | | | 1,200,000 | | | | 25,999 | | | | 23,474 | | | | 2,525 | | | | Investment Grade | |
| | | | | | | | | | | | | | | | | | | | | | | | | | | | |
Total Centrally Cleared Swap Contracts | | | | | | | | | | | | | | | | $191,666 | | | | $ 182,845 | | | | $ 8,821 | | | | | |
| | | | | | | | | | | | | | | | | | | | | | | | | | | | |
| | | | | | | | |
OTC Swap Contracts | | | | | | | | | | | | | | | | | | | | | | | | | | | | | | | | | |
| | | | | | | |
Contracts to Sell Protectionc,d | | | | | | | | | | | | | | | | | | | | | | | | | | | | | |
| | | | | | | | |
Single Name | | | | | | | | | | | | | | | | | | | | | | | | | | | | | | | | | |
| | | | | | | | | |
Government of Argentina | | | 5.00 | % | | | Quarterly | | | | JPHQ | | | | 6/20/23 | | | | $ 550,000 | | | | $ (79,486 | ) | | | $ (116,349 | ) | | | $36,863 | | | | B | |
| | | | | | | | | |
Government of Russia | | | 1.00 | % | | | Quarterly | | | | CITI | | | | 6/20/24 | | | | 300,000 | | | | (1,857 | ) | | | (4,085) | | | | 2,228 | | | | BBB- | |
| | | | | | | | | |
Traded Index | | | | | | | | | | | | | | | | | | | | | | | | | | | | | | | | | | | | |
| | | | | | | | | |
eCitibank Bespoke Phoenix,5-7% Tranche | | | 2.90 | % | | | Quarterly | | | | CITI | | | | 12/20/21 | | | | 250,000 | | | | 2,606 | | | | — | | | | 2,606 | | |
| Non- Investment
Grade |
|
| | | | | | | | | | | | | | | | | | | | | | | | | | | | |
Total OTC Swap Contracts | | | | | | | | | | | | | | | | $ (78,737 | ) | | | $ (120,434 | ) | | | $41,697 | | | | | |
| | | | | | | | | | | | | | | | | | | | | | | | | | | | |
| | | | | | | |
Total Credit Default Swap Contracts | | | | | | | | | | | | | | | | $112,929 | | | | $ 62,411 | | | | $50,518 | | | | | |
| | | | | | | | | | | | | | | | | | | | | | | | | | | | |
aFor contracts to sell protection, the notional amount is equal to the maximum potential amount of the future payments and no recourse provisions have been entered into in association with the contracts.
bBased on Standard and Poor’s (S&P) Rating for single name swaps and internal ratings for index swaps. Internal ratings based on mapping into equivalent ratings from external vendors.
cPerformance triggers for settlement of contract include default, bankruptcy or restructuring for single name swaps and failure to pay or bankruptcy of the underlying securities for traded index swaps.
dThe fund enters contracts to sell protection to create a long credit position.
eRepresents a custom index comprised of a basket of underlying issuers.
At June 30, 2019, the Fund had the following total return swap contracts outstanding. See Note 1(d).
Total Return Swap Contracts
| | | | | | | | | | | | | | | | | | | | | | | | |
| | | | | | |
| Underlying Instruments | | Financing Rate | | | Payment
Frequency | | | Counter-
party | | | Maturity
Date | | | Notional
Value | | | Value/
Unrealized
Appreciation
(Depreciation) | |
| |
| | | | | | |
OTC Swap Contracts | | | | | | | | | | | | | | | | | | | | | | | | |
Longa | | | | | | | | | | | | | | | | | | | | | | | | |
Markit iBoxx USD Liquid Leveraged Loan Index | | | 3-month USD LIBOR | | | | Quarterly | | | | JPHQ | | | | 12/20/19 | | | | $4,500,000 | | | | $(41,475 | ) |
| | | | | | | | | | | | | | | | | | | | | | | | |
aThe Fund receives the total return on the underlying instrument and pays a variable financing rate.
See Note 7 regarding other derivative information.
See Abbreviations on pageFFA-49.
| | | | |
| | | |
FFA-32 | | Semiannual Report | The accompanying notes are an integral part of these financial statements. | | |
FRANKLIN TEMPLETON VARIABLE INSURANCE PRODUCTS TRUST
FINANCIAL STATEMENTS
Statement of Assets and Liabilities
June 30, 2019 (unaudited)
| | | | |
| |
| | | Franklin
Allocation
VIP Fund | |
Assets: | | | | |
Investments in securities: | | | | |
Cost - Unaffiliated issuers | | | $ 772,265,729 | |
Cost -Non-controlled affiliates (Note 3e) | | | 59,742,283 | |
| | | | |
| |
Value - Unaffiliated issuers | | | $776,888,121 | |
Value -Non-controlled affiliates (Note 3e) | | | 57,311,293 | |
Cash | | | 48,778 | |
Foreign currency, at value (cost $1,693,138) | | | 1,693,353 | |
Receivables: | | | | |
Investment securities sold | | | 6,084,633 | |
Capital shares sold | | | 121,970 | |
Dividends and interest | | | 2,672,361 | |
Deposits with brokers for: | | | | |
Futures contracts | | | 278,158 | |
Centrally cleared swap contracts | | | 141,789 | |
Variation margin on futures contracts | | | 7,458 | |
Variation margin on centrally cleared swap contracts | | | 4,555 | |
Unrealized appreciation on OTC forward exchange contracts | | | 29,677 | |
Unrealized appreciation on OTC swap contracts | | | 41,697 | |
Other assets | | | 38,662 | |
| | | | |
| |
Total assets | | | 845,362,505 | |
| | | | |
| |
Liabilities: | | | | |
Payables: | | | | |
Investment securities purchased | | | 18,336,405 | |
Capital shares redeemed | | | 552,856 | |
Management fees | | | 328,014 | |
Distribution fees | | | 408,628 | |
Trustees’ fees and expenses | | | 1,191 | |
OTC swap contracts (upfront receipts $125,215) | | | 120,434 | |
Unrealized depreciation on OTC forward exchange contracts | | | 49,161 | |
Unrealized depreciation on OTC swap contracts | | | 41,475 | |
Deferred tax | | | 309 | |
Accrued expenses and other liabilities | | | 10,953 | |
| | | | |
| |
Total liabilities | | | 19,849,426 | |
| | | | |
| |
Net assets, at value | | | $825,513,079 | |
| | | | |
Net assets consist of: | | | | |
Paid-in capital | | | $621,568,623 | |
Total distributable earnings (loss) | | | 203,944,456 | |
| | | | |
| |
Net assets, at value | | | $825,513,079 | |
| | | | |
| | | | | | |
| | | |
| | The accompanying notes are an integral part of these financial statements. | Semiannual Report | | | FFA-33 | |
FRANKLIN TEMPLETON VARIABLE INSURANCE PRODUCTS TRUST
FINANCIAL STATEMENTS
Statement of Assets and Liabilities(continued)
June 30, 2019 (unaudited)
| | | | |
| |
| | | Franklin
Allocation
VIP Fund | |
| |
| Class 1: | | | | |
Net assets, at value | | | $ 1,138,635 | |
| | | | |
Shares outstanding | | | 176,153 | |
| | | | |
Net asset value and maximum offering price per share | | | $6.46 | |
| | | | |
| Class 2: | | | | |
Net assets, at value | | | $415,902,294 | |
| | | | |
Shares outstanding | | | 64,791,246 | |
| | | | |
Net asset value and maximum offering price per share | | | $6.42 | |
| | | | |
| Class 4: | | | | |
Net assets, at value | | | $408,472,150 | |
| | | | |
Shares outstanding | | | 62,104,869 | |
| | | | |
Net asset value and maximum offering price per share | | | $6.58 | |
| | | | |
| | | | |
| | | |
FFA-34 | | Semiannual Report | The accompanying notes are an integral part of these financial statements. | | |
FRANKLIN TEMPLETON VARIABLE INSURANCE PRODUCTS TRUST
FINANCIAL STATEMENTS
Statement of Operations
for the six months ended June 30, 2019 (unaudited)
| | | | |
| |
| | | Franklin
Allocation
VIP Fund | |
Investment income: | | | | |
Dividends: (net of foreign taxes)* | | | | |
Unaffiliated issuers | | | $ 2,474,960 | |
Non-controlled affiliates (Note 3e) | | | 2,528,859 | |
Interest: (net of foreign taxes)~ | | | | |
Unaffiliated issuers | | | 1,554,491 | |
| | | | |
Total investment income | | | 6,558,310 | |
| | | | |
Expenses: | | | | |
Management fees (Note 3a) | | | 748,057 | |
Administrative fees (Note 3b) | | | 272,591 | |
Distribution fees: (Note 3c) | | | | |
Class 2 | | | 512,155 | |
Class 4 | | | 712,082 | |
Custodian fees (Note 4) | | | 359 | |
Reports to shareholders | | | 36,502 | |
Professional fees | | | 46,763 | |
Trustees’ fees and expenses | | | 3,701 | |
Other | | | 9,590 | |
| | | | |
Total expenses | | | 2,341,800 | |
Expenses waived/paid by affiliates (Note 3e and 3f) | | | (138,572 | ) |
| | | | |
Net expenses | | | 2,203,228 | |
| | | | |
Net investment income | | | 4,355,082 | |
| | | | |
Realized and unrealized gains (losses): | | | | |
Net realized gain (loss) from: | | | | |
Investments: | | | | |
Unaffiliated issuers | | | 302,456 | |
Controlled affiliates (Note 3e) | | | 82,811,056 | |
Non-controlled affiliates (Note 3e) | | | 153,335,293 | |
Foreign currency transactions | | | (57,395 | ) |
Forward exchange contracts | | | 1,333 | |
Futures contracts | | | 44,513 | |
Swap contracts | | | (46,642 | ) |
| | | | |
Net realized gain (loss) | | | 236,390,614 | |
| | | | |
Net change in unrealized appreciation (depreciation) on: | | | | |
Investments: | | | | |
Unaffiliated issuers | | | 4,622,392 | |
Controlled affiliates (Note 3e) | | | (56,876,879 | ) |
Non-controlled affiliates (Note 3e) | | | (89,551,617 | ) |
Translation of other assets and liabilities denominated in foreign currencies | | | (929 | ) |
Forward exchange contracts | | | (19,484 | ) |
Futures contracts | | | 211,967 | |
Swap contracts | | | 9,043 | |
Change in deferred taxes on unrealized appreciation | | | (309 | ) |
| | | | |
Net change in unrealized appreciation (depreciation) | | | (141,605,816 | ) |
| | | | |
| |
Net realized and unrealized gain (loss) | | | 94,784,798 | |
| | | | |
Net increase (decrease) in net assets resulting from operations | | | $ 99,139,880 | |
| | | | |
| |
*Foreign taxes withheld on dividends | | | $ 151,060 | |
~Foreign taxes withheld on interest | | | $ 4,313 | |
| | | | | | |
| | | |
| | The accompanying notes are an integral part of these financial statements. | Semiannual Report | | | FFA-35 | |
FRANKLIN TEMPLETON VARIABLE INSURANCE PRODUCTS TRUST
FINANCIAL STATEMENTS
Statements of Changes in Net Assets
| | | | | | | | |
| |
| | | Franklin Allocation VIP Fund | |
| | |
| | | Six Months Ended
June 30, 2019
(unaudited) | | | Year Ended
December 31, 2018 | |
| | |
Increase (decrease) in net assets: | | | | | | | | |
Operations: | | | | | | | | |
Net investment income | | | $ 4,355,082 | | | | $ 26,188,755 | |
Net realized gain (loss) | | | 236,390,614 | | | | 57,368,194 | |
Net change in unrealized appreciation (depreciation) | | | (141,605,816 | ) | | | (166,306,372 | ) |
| | | | |
| | |
Net increase (decrease) in net assets resulting from operations | | | 99,139,880 | | | | (82,749,423 | ) |
| | | | |
Distributions to shareholders: | | | | | | | | |
Class 1 | | | (114,944 | ) | | | (60,348 | ) |
Class 2 | | | (41,503,915 | ) | | | (24,442,861 | ) |
Class 4 | | | (39,405,922 | ) | | | (24,951,975 | ) |
| | | | |
| | |
Total distributions to shareholders | | | (81,024,781 | ) | | | (49,455,184 | ) |
| | | | |
| | |
Capital share transactions: (Note 2) | | | | | | | | |
Class 1 | | | 140,911 | | | | 99,087 | |
Class 2 | | | 17,474,659 | | | | (25,472,556 | ) |
Class 4 | | | 5,113,540 | | | | (68,063,868 | ) |
| | | | |
| | |
Total capital share transactions | | | 22,729,110 | | | | (93,437,337 | ) |
| | | | |
| | |
Net increase (decrease) in net assets | | | 40,844,209 | | | | (225,641,944 | ) |
Net assets: | | | | | | | | |
Beginning of period | | | 784,668,870 | | | | 1,010,310,814 | |
| | | | |
| | |
End of period | | | $ 825,513,079 | | | | $ 784,668,870 | |
| | | | |
| | | | |
| | | |
FFA-36 | | Semiannual Report | The accompanying notes are an integral part of these financial statements. | | |
FRANKLIN TEMPLETON VARIABLE INSURANCE PRODUCTS TRUST
Notes to Financial Statements (unaudited)
Franklin Allocation VIP Fund
1. Organization and Significant Accounting Policies
Franklin Templeton Variable Insurance Products Trust (Trust) is registered under the Investment Company Act of 1940 (1940 Act) as anopen-end management investment company, consisting of eighteen separate funds and applies the specialized accounting and reporting guidance in U.S. Generally Accepted Accounting Principles (U.S. GAAP). Franklin Allocation VIP Fund (Fund) is included in this report. The Fund invests in other funds of the Trust (Underlying Funds). Shares of the Fund are generally sold only to insurance company separate accounts to fund the benefits of variable life insurance policies or variable annuity contracts. The Fund offers three classes of shares: Class 1, Class 2, and Class 4. Each class of shares may differ by its distribution fees, voting rights on matters affecting a single class and its exchange privilege.
The accounting policies of the Underlying Funds are outlined in their respective shareholder reports. A copy of the Underlying Funds’ shareholder reports is available on the U.S. Securities and Exchange Commission (SEC) website at sec.gov. The Underlying Funds’ shareholder reports are not covered by this report.
Effective May 1, 2019, the Fund repositioned to a direct investment fund with an actively managed dynamic allocation strategy, which involved modifying the Fund’s principal investment strategies and changing the name of the Fund from Franklin Founding Funds Allocation VIP Fund to Franklin Allocation VIP Fund.
The following summarizes the Fund’s significant accounting policies.
a. Financial Instrument Valuation
The Fund’s investments in financial instruments are carried at fair value daily. Fair value is the price that would be received to sell an asset or paid to transfer a liability in an orderly transaction between market participants on the measurement date. The Fund calculates the net asset value (NAV) per share each business day as of 4 p.m. Eastern time or the regularly scheduled close of the New York Stock Exchange (NYSE), whichever is earlier. Under compliance policies and procedures approved by the Trust’s Board of Trustees (the Board), the Fund’s administrator has responsibility for oversight of valuation, including leading the cross-functional
Valuation Committee (VC). The Fund may utilize independent pricing services, quotations from securities and financial instrument dealers, and other market sources to determine fair value.
Investments in the Underlying Funds are valued at their closing NAV each trading day. Exchange traded funds listed on an exchange or on the NASDAQ National Market System are valued at the last quoted sale price or the official closing price of the day, respectively.
Equity securities and derivative financial instruments listed on an exchange or on the NASDAQ National Market System are valued at the last quoted sale price or the official closing price of the day, respectively. Foreign equity securities are valued as of the close of trading on the foreign stock exchange on which the security is primarily traded, or as of 4 p.m. Eastern time. The value is then converted into its U.S. dollar equivalent at the foreign exchange rate in effect at 4 p.m. Eastern time on the day that the value of the security is determined.Over-the-counter (OTC) securities are valued within the range of the most recent quoted bid and ask prices. Securities that trade in multiple markets or on multiple exchanges are valued according to the broadest and most representative market. Certain equity securities are valued based upon fundamental characteristics or relationships to similar securities.
Debt securities generally trade in the OTC market rather than on a securities exchange. The Fund’s pricing services use multiple valuation techniques to determine fair value. In instances where sufficient market activity exists, the pricing services may utilize a market-based approach through which quotes from market makers are used to determine fair value. In instances where sufficient market activity may not exist or is limited, the pricing services also utilize proprietary valuation models which may consider market characteristics such as benchmark yield curves, credit spreads, estimated default rates, anticipated market interest rate volatility, coupon rates, anticipated timing of principal repayments, underlying collateral, and other unique security features in order to estimate the relevant cash flows, which are then discounted to calculate the fair value. Securities denominated in a foreign currency are converted into their U.S. dollar equivalent at the foreign exchange rate in effect at 4 p.m. Eastern time on the date that the values of the foreign debt securities are determined.
FRANKLIN TEMPLETON VARIABLE INSURANCE PRODUCTS TRUST
NOTES TO FINANCIAL STATEMENTS (UNAUDITED)
Franklin Allocation VIP Fund(continued)
1. Organization and Significant Accounting Policies(continued)
a. Financial Instrument Valuation(continued)
Certain derivative financial instruments are centrally cleared or trade in the OTC market. The Fund’s pricing services use various techniques including industry standard option pricing models and proprietary discounted cash flow models to determine the fair value of those instruments. The Fund’s net benefit or obligation under the derivative contract, as measured by the fair value of the contract, is included in net assets.
The Fund has procedures to determine the fair value of financial instruments for which market prices are not reliable or readily available. Under these procedures, the Fund primarily employs a market-based approach which may use related or comparable assets or liabilities, recent transactions, market multiples, book values, and other relevant information for the investment to determine the fair value of the investment. An income-based valuation approach may also be used in which the anticipated future cash flows of the investment are discounted to calculate fair value. Discounts may also be applied due to the nature or duration of any restrictions on the disposition of the investments. Due to the inherent uncertainty of valuations of such investments, the fair values may differ significantly from the values that would have been used had an active market existed.
Trading in securities on foreign securities stock exchanges and OTC markets may be completed before 4 p.m. Eastern time. In addition, trading in certain foreign markets may not take place on every Fund’s business day. Occasionally, events occur between the time at which trading in a foreign security is completed and 4 p.m. Eastern time that might call into question the reliability of the value of a portfolio security held by the Fund. As a result, differences may arise between the value of the Fund’s portfolio securities as determined at the foreign market close and the latest indications of value at 4 p.m. Eastern time. In order to minimize the potential for these differences, the VC monitors price movements following the close of trading in foreign stock markets through a series of country specific market proxies (such as baskets of American Depositary Receipts, futures contracts and exchange traded funds). These price movements are measured against established trigger thresholds for each specific market proxy to assist in determining if an event has occurred that may call into question the reliability of the values of the foreign securities held by the Fund. If such an
event occurs, the securities may be valued using fair value procedures, which may include the use of independent pricing services.
When the last day of the reporting period is anon-business day, certain foreign markets may be open on those days that the Fund’s NAV is not calculated, which could result in differences between the value of the Fund’s portfolio securities on the last business day and the last calendar day of the reporting period. Any significant security valuation changes due to an open foreign market are adjusted and reflected by the Fund for financial reporting purposes.
b. Foreign Currency Translation
Portfolio securities and other assets and liabilities denominated in foreign currencies are translated into U.S. dollars based on the exchange rate of such currencies against U.S. dollars on the date of valuation. The Fund may enter into foreign currency exchange contracts to facilitate transactions denominated in a foreign currency. Purchases and sales of securities, income and expense items denominated in foreign currencies are translated into U.S. dollars at the exchange rate in effect on the transaction date. Portfolio securities and assets and liabilities denominated in foreign currencies contain risks that those currencies will decline in value relative to the U.S. dollar. Occasionally, events may impact the availability or reliability of foreign exchange rates used to convert the U.S. dollar equivalent value. If such an event occurs, the foreign exchange rate will be valued at fair value using procedures established and approved by the Board.
The Fund does not separately report the effect of changes in foreign exchange rates from changes in market prices on securities held. Such changes are included in net realized and unrealized gain or loss from investments in the Statement of Operations.
Realized foreign exchange gains or losses arise from sales of foreign currencies, currency gains or losses realized between the trade and settlement dates on securities transactions and the difference between the recorded amounts of dividends, interest, and foreign withholding taxes and the U.S. dollar equivalent of the amounts actually received or paid. Net unrealized foreign exchange gains and losses arise from changes in foreign exchange rates on foreign denominated assets and liabilities other than investments in securities held at the end of the reporting period.
FRANKLIN TEMPLETON VARIABLE INSURANCE PRODUCTS TRUST
NOTES TO FINANCIAL STATEMENTS (UNAUDITED)
Franklin Allocation VIP Fund(continued)
c. Securities Purchased on a When-Issued or Delayed Delivery and TBA Basis
The Fund purchases securities on a when-issued or delayed delivery andto-be-announced (TBA) basis, with payment and delivery scheduled for a future date. These transactions are subject to market fluctuations and are subject to the risk that the value at delivery may be more or less than the trade date purchase price. Although the Fund will generally purchase these securities with the intention of holding the securities, it may sell the securities before the settlement date. Sufficient assets have been segregated for these securities.
d. Derivative Financial Instruments
The Fund invested in derivative financial instruments in order to manage risk or gain exposure to various other investments or markets. Derivatives are financial contracts based on an underlying or notional amount, require no initial investment or an initial net investment that is smaller than would normally be required to have a similar response to changes in market factors, and require or permit net settlement. Derivatives contain various risks including the potential inability of the counterparty to fulfill their obligations under the terms of the contract, the potential for an illiquid secondary market, and/or the potential for market movements which expose the Fund to gains or losses in excess of the amounts shown in the Statement of Assets and Liabilities. Realized gain and loss and unrealized appreciation and depreciation on these contracts for the period are included in the Statement of Operations.
Derivative counterparty credit risk is managed through a formal evaluation of the creditworthiness of all potential counterparties. The Fund attempts to reduce its exposure to counterparty credit risk on OTC derivatives, whenever possible, by entering into International Swaps and Derivatives Association (ISDA) master agreements with certain counterparties. These agreements contain various provisions, including but not limited to collateral requirements, events of default, or early termination. Termination events applicable to the counterparty include certain deteriorations in the credit quality of the counterparty. Termination events applicable to the Fund include failure of the Fund to maintain certain net asset levels and/or limit the decline in net assets over various periods of time. In the event of default or early termination, the ISDA master agreement gives thenon-defaulting party the right to net andclose-out all transactions traded, whether or not arising under the ISDA agreement, to one net amount payable by one counterparty to the other. However, absent an
event of default or early termination, OTC derivative assets and liabilities are presented gross and not offset in the Statement of Assets and Liabilities. Early termination by the counterparty may result in an immediate payment by the Fund of any net liability owed to that counterparty under the ISDA agreement.
Collateral requirements differ by type of derivative. Collateral or initial margin requirements are set by the broker or exchange clearing house for exchange traded and centrally cleared derivatives. Initial margin deposited is held at the exchange and can be in the form of cash and/or securities. For OTC derivatives traded under an ISDA master agreement, posting of collateral is required by either the Fund or the applicable counterparty if the total net exposure of all OTC derivatives with the applicable counterparty exceeds the minimum transfer amount, which typically ranges from $100,000 to $250,000, and can vary depending on the counterparty and the type of the agreement. Generally, collateral is determined at the close of Fund business each day and any additional collateral required due to changes in derivative values may be delivered by the Fund or the counterparty the next business day, or within a few business days. Collateral pledged and/or received by the Fund for OTC derivatives, if any, is held in segregated accounts with the Fund’s custodian/counterparty broker and can be in the form of cash and/or securities. Unrestricted cash may be invested according to the Fund’s investment objectives. To the extent that the amounts due to the Fund from its counterparties are not subject to collateralization or are not fully collateralized, the Fund bears the risk of loss from counterpartynon-performance.
The Fund entered into exchange traded futures contracts primarily to manage and/or gain exposure to interest rate and equity price. A futures contract is an agreement between the Fund and a counterparty to buy or sell an asset at a specified price on a future date. Required initial margins are pledged by the Fund, and the daily change in fair value is accounted for as a variation margin payable or receivable in the Statement of Assets and Liabilities.
The Fund entered into OTC forward exchange contracts primarily to manage and/or gain exposure to certain foreign currencies. A forward exchange contract is an agreement between the Fund and a counterparty to buy or sell a foreign currency at a specific exchange rate on a future date.
FRANKLIN TEMPLETON VARIABLE INSURANCE PRODUCTS TRUST
NOTES TO FINANCIAL STATEMENTS (UNAUDITED)
Franklin Allocation VIP Fund(continued)
1. Organization and Significant Accounting Policies(continued)
d. Derivative Financial Instruments(continued)
The Fund entered into credit default swap contracts primarily to manage and/or gain exposure to credit risk. A credit default swap is an agreement between the Fund and a counterparty whereby the buyer of the contract receives credit protection and the seller of the contract guarantees the credit worthiness of a referenced debt obligation. These agreements may be privately negotiated in theover-the-counter market (OTC credit default swaps) or may be executed in a multilateral trade facility platform, such as a registered exchange (centrally cleared credit default swaps). The underlying referenced debt obligation may be a single issuer of corporate or sovereign debt, a credit index, a basket of issuers or indices, or a tranche of a credit index or basket of issuers or indices. In the event of a default of the underlying referenced debt obligation, the buyer is entitled to receive the notional amount of the credit default swap contract from the seller in exchange for the referenced debt obligation, a net settlement amount equal to the notional amount of the credit default swap less the recovery value of the referenced debt obligation, or other agreed upon amount. For centrally cleared credit default swaps, required initial margins are pledged by the Fund, and the daily change in fair value is accounted for as a variation margin payable or receivable in the Statement of Assets and Liabilities. Over the term of the contract, the buyer pays the seller a periodic stream of payments, provided that no event of default has occurred. Such periodic payments are accrued daily as an unrealized appreciation or depreciation until the payments are made, at which time they are realized. Upfront payments and receipts are reflected in the Statement of Assets and Liabilities and represent compensating factors between stated terms of the credit default swap agreement and prevailing market conditions (credit spreads and other relevant factors). These upfront payments and receipts are amortized over the term of the contract as a realized gain or loss in the Statement of Operations.
The Fund entered into OTC total return swap contracts primarily to manage and/or gain exposure to credit and other market risk of an underlying instrument such as a stock, bond, index or basket of securities or indices. A total return swap is an agreement between the Fund and a counterparty to exchange a return linked to an underlying instrument for a floating or fixed rate payment, both based upon a notional amount. Over the term of the contract, contractually required
payments to be paid or received are accrued daily and recorded as unrealized appreciation or depreciation until the payments are made, at which time they are recognized as realized gain or loss.
See Note 7 regarding other derivative information.
e. Mortgage Dollar Rolls
The Fund enters into mortgage dollar rolls, typically on a TBA basis. Mortgage dollar rolls are agreements between the Fund and a financial institution where the Fund sells (or buys) mortgage-backed securities for delivery on a specified date and simultaneously contracts to repurchase (or sell) substantially similar (same type, coupon, and maturity) securities at a future date and at a predetermined price. Gains or losses are realized on the initial sale, and the difference between the repurchase price and the sale price is recorded as an unrealized gain or loss to the Fund upon entering into the mortgage dollar roll. In addition, the Fund may invest the cash proceeds that are received from the initial sale. During the period between the sale and repurchase, the Fund is not entitled to principal and interest paid on the mortgage backed securities. Transactions in mortgage dollar rolls are accounted for as purchases and sales and may result in an increase to the Fund’s portfolio turnover rate. The risks of mortgage dollar roll transactions include the potential inability of the counterparty to fulfill its obligations.
f. Senior Floating Rate Interests
The Fund invests in senior secured corporate loans that pay interest at rates which are periodically reset by reference to a base lending rate plus a spread. These base lending rates are generally the prime rate offered by a designated U.S. bank or the London InterBank Offered Rate (LIBOR). Senior secured corporate loans often require prepayment of principal from excess cash flows or at the discretion of the borrower. As a result, actual maturity may be substantially less than the stated maturity. Senior secured corporate loans in which the Fund invests are generally readily marketable, but may be subject to certain restrictions on resale.
g. Income and Deferred Taxes
It is the Fund’s policy to qualify as a regulated investment company under the Internal Revenue Code. The Fund intends to distribute to shareholders substantially all of its
FRANKLIN TEMPLETON VARIABLE INSURANCE PRODUCTS TRUST
NOTES TO FINANCIAL STATEMENTS (UNAUDITED)
Franklin Allocation VIP Fund(continued)
taxable income and net realized gains to relieve it from federal income and if applicable, excise taxes. As a result, no provision for U.S. federal income taxes is required.
The Fund may be subject to foreign taxation related to income received, capital gains on the sale of securities and certain foreign currency transactions in the foreign jurisdictions in which it invests. Foreign taxes, if any, are recorded based on the tax regulations and rates that exist in the foreign markets in which the Fund invests. When a capital gain tax is determined to apply, the Fund records an estimated deferred tax liability in an amount that would be payable if the securities were disposed of on the valuation date.
The Fund may recognize an income tax liability related to its uncertain tax positions under U.S. GAAP when the uncertain tax position has a less than 50% probability that it will be sustained upon examination by the tax authorities based on its technical merits. As of June 30, 2019, the Fund has determined that no tax liability is required in its financial statements related to uncertain tax positions for any open tax years (or expected to be taken in future tax years). Open tax years are those that remain subject to examination and are based on the statute of limitations in each jurisdiction in which the Fund invests.
h. Security Transactions, Investment Income, Expenses and Distributions
Security transactions are accounted for on trade date. Realized gains and losses on security transactions are determined on a specific identification basis. Interest income and estimated expenses are accrued daily. Amortization of premium and accretion of discount on debt securities are included in interest income. Paydown gains and losses are recorded as an adjustment to interest income. Dividend income, capital gain distributions by Underlying Funds and ETFs are recorded on theex-dividend date except for certain dividends from securities where the dividend rate is not available. In such cases, the dividend is recorded as soon as the information is received by the Fund. Distributions to shareholders are recorded on theex-dividend date. Distributable earnings are determined according to income tax regulations (tax basis) and may differ from earnings recorded in accordance with U.S. GAAP. These differences may be permanent or temporary. Permanent differences are reclassified among capital accounts to reflect their tax
character. These reclassifications have no impact on net assets or the results of operations. Temporary differences are not reclassified, as they may reverse in subsequent periods.
Common expenses incurred by the Trust are allocated among the Funds based on the ratio of net assets of each Fund to the combined net assets of the Trust or based on the ratio of number of shareholders of each Fund to the combined number of shareholders of the Trust. Fund specific expenses are charged directly to the Fund that incurred the expense.
The Fund indirectly bears its proportionate share of expenses from the Underlying Funds. Since the Underlying Funds have varied expense levels and the Fund may own different proportions of the Underlying Funds at different times, the amount of expenses incurred indirectly by the Fund will vary.
Realized and unrealized gains and losses and net investment income, excluding class specific expenses, are allocated daily to each class of shares based upon the relative proportion of net assets of each class. Differences in per share distributions by class are generally due to differences in class specific expenses.
Inflation-indexed bonds are adjusted for inflation through periodic increases or decreases in the security’s interest accruals, face amount, or principal redemption value, by amounts corresponding to the rate of inflation as measured by an index. Any increase or decrease in the face amount or principal redemption value will be included as interest income in the Statement of Operations.
i. Accounting Estimates
The preparation of financial statements in accordance with U.S. GAAP requires management to make estimates and assumptions that affect the reported amounts of assets and liabilities at the date of the financial statements and the amounts of income and expenses during the reporting period. Actual results could differ from those estimates.
j. Guarantees and Indemnifications
Under the Trust’s organizational documents, its officers and trustees are indemnified by the Trust against certain liabilities arising out of the performance of their duties to the Trust. Additionally, in the normal course of business, the Trust, on behalf of the Fund, enters into contracts with service providers that contain general indemnification clauses. The Trust’s maximum exposure under these arrangements is
FRANKLIN TEMPLETON VARIABLE INSURANCE PRODUCTS TRUST
NOTES TO FINANCIAL STATEMENTS (UNAUDITED)
Franklin Allocation VIP Fund(continued)
1. Organization and Significant Accounting Policies(continued)
j. Guarantees and Indemnifications(continued)
unknown as this would involve future claims that may be made against the Trust that have not yet occurred. Currently, the Trust expects the risk of loss to be remote.
2. Shares of Beneficial Interest
At June 30, 2019, there were an unlimited number of shares authorized (without par value). Transactions in the Fund’s shares were as follows:
| | | | | | | | | | | | | | | | | | | | |
| | | |
| | | Six Months Ended June 30, 2019 | | | | | | Year Ended December 31, 2018 | |
| | | | |
| | | | | |
| | | Shares | | | Amount | | | | | | Shares | | | Amount | |
| |
| | | | | |
| Class 1 Shares: | | | | | | | | | | | | | | | | | | | | |
Shares sold | | | 8,946 | | | $ | 62,501 | | | | | | | | 17,451 | | | $ | 125,360 | |
Shares issued in reinvestment of distributions | | | 18,101 | | | | 114,944 | | | | | | | | 8,536 | | | | 60,348 | |
Shares redeemed | | | (5,329 | ) | | | (36,534 | ) | | | | | | | (12,205 | ) | | | (86,621) | |
| | | | |
| | | | | |
Net increase (decrease) | | | 21,718 | | | $ | 140,911 | | | | | | | | 13,782 | | | $ | 99,087 | |
| | | | |
| | | | | |
| Class 2 Shares: | | | | | | | | | | | | | | | | | | | | |
Shares sold | | | 1,098,654 | | | $ | 7,545,389 | | | | | | | | 4,193,705 | | | $ | 28,329,864 | |
Shares issued in reinvestment of distributions | | | 6,577,483 | | | | 41,503,915 | | | | | | | | 3,476,936 | | | | 24,442,861 | |
Shares redeemed | | | (4,614,006 | ) | | | (31,574,645 | ) | | | | | | | (10,985,773 | ) | | | (78,245,281) | |
| | | | |
| | | | | |
Net increase (decrease) | | | 3,062,131 | | | $ | 17,474,659 | | | | | | | | (3,315,132 | ) | | $ | (25,472,556) | |
| | | | |
| Class 4 Shares: | | | | | | | | | | | | | | | | | | | | |
Shares sold | | | 434,567 | | | $ | 3,007,997 | | | | | | | | 1,130,901 | | | $ | 8,277,821 | |
Shares issued in reinvestment of distributions | | | 6,099,988 | | | | 39,405,922 | | | | | | | | 3,475,205 | | | | 24,951,975 | |
Shares redeemed | | | (5,352,130 | ) | | | (37,300,379 | ) | | | | | | | (13,897,304 | ) | | | (101,293,664) | |
| | | | |
Net increase (decrease) | | | 1,182,425 | | | $ | 5,113,540 | | | | | | | | (9,291,198 | ) | | $ | (68,063,868) | |
| | | | |
3. Transactions with Affiliates
Franklin Resources, Inc. is the holding company for various subsidiaries that together are referred to as Franklin Templeton. Certain officers and/or trustees of the Fund are also officers and directors of the following subsidiaries:
| | |
| |
| Subsidiary | | Affiliation |
Franklin Advisers, Inc. (Advisers) | | Investment Manager |
Templeton Global Advisors Limited (Global Advisors) | | Investment Manager |
Franklin Templeton Institutional, LLC (FT Institutional) | | Investment Manager |
Franklin Templeton Services, LLC (FT Services) | | Administrative manager |
Franklin Templeton Distributors, Inc. (Distributors) | | Principal underwriter |
Franklin Templeton Investor Services, LLC (Investor Services) | | Transfer agent |
FRANKLIN TEMPLETON VARIABLE INSURANCE PRODUCTS TRUST
NOTES TO FINANCIAL STATEMENTS (UNAUDITED)
Franklin Allocation VIP Fund(continued)
a. Management Fees
Effective May 1, 2019, the Fund pays an investment management fee to Advisers of 0.55% per year of the average daily net assets of the Fund.
Effective May 1, 2019, under a subadvisory agreement, Global Advisors and FT Institutional, affiliates of Advisers, provide subadvisory services to the Fund. The subadvisory fee is paid by Advisers based on the Fund’s average daily net assets, and is not an additional expense of the Fund.
b. Administrative Fees
Effective May 1, 2019, under an agreement with Advisers, FT Services provides administrative services to the Fund. The fee is paid by Advisers based on the Fund’s average daily net assets, and is not an additional expense of the Fund.
Prior to May 1, 2019, the Fund paid FT Services for administrative services. The Fund paid administrative fees of 0.10% per year of the average daily net assets of the Fund.
c. Distribution Fees
The Board has adopted distribution plans for Class 2 and Class 4 shares pursuant to Rule12b-1 under the 1940 Act. Under the Fund’s compensation distribution plans, the Fund pays Distributors for costs incurred in connection with the servicing, sale and distribution of the Fund’s shares up to 0.35% per year of its average daily net assets of each class. The Board has agreed to limit the current rate to 0.25% per year for Class 2. The plan year, for purposes of monitoring compliance with the maximum annual plan rates, is February 1 through January 31.
d. Transfer Agent Fees
Investor Services, under terms of an agreement, performs shareholder servicing for the Fund and is not paid by the Fund for the services.
e. Investments in Affiliated Management Investment Companies
The Fund invests in one or more affiliated management investment companies for purposes other than exercising a controlling influence over the management or policies. Management fees paid by the Fund are waived on assets invested in the affiliated management investment companies, as noted in the Statement of Operations, in an amount not to exceed the management and administrative fees paid directly or indirectly by each affiliate. During the period ended June 30, 2019, the Fund held investments in affiliated management investment companies as follows:
| | | | | | | | | | | | | | | | | | | | | | | | | | | | | | | | |
| | | Value at
Beginning of Period | | | Purchases | | | Sales | | | Realized Gain
(Loss) | | | Net Change in
Unrealized
Appreciation
(Depreciation) | | | Value at
End of
Period | | | Number of
Shares
Held at End
of Period | | | Dividend
Income | |
| |
| Controlled Affiliates | | | | | | | | | | | | | | | | | | | | | | | | | | | | | | | | |
Templeton Growth VIP Fund, Class 1 | | $ | 259,507,605 | | | $ | — | | | $ | (285,441,782 | ) | | $ | 82,811,056 | | | $ | (56,876,879 | ) | | $ | — | | | | — | | | $ | — | |
| | | | | | | | | | | | |
| Non-Controlled Affiliates | | | | | | | | | | | | | | | | | | | | | | | | | | | | | | | | |
Franklin Income VIP Fund, Class 1 | | | 260,563,549 | | | | 700,000 | | | | (290,767,442 | ) | | | 62,950,179 | | | | (33,446,286 | ) | | | — | | | | — | | | | — | |
Franklin Mutual Shares VIP Fund, Class 1 | | | 262,865,813 | | | | 600,000 | | | | (300,176,586 | ) | | | 90,385,114 | | | | (53,674,341 | ) | | | — | | | | — | | | | — | |
Institutional Fiduciary Trust Money Market Portfolio, 2.05% | | | — | | | | 292,991,384 | | | | (269,009,736 | ) | | | — | | | | — | | | | 23,981,648 | | | | 23,981,648 | | | | 212,257 | |
FRANKLIN TEMPLETON VARIABLE INSURANCE PRODUCTS TRUST
NOTES TO FINANCIAL STATEMENTS (UNAUDITED)
Franklin Allocation VIP Fund(continued)
3. Transactions with Affiliates(continued)
e. Investments in Affiliated Management Investment Companies(continued)
| | | | | | | | | | | | | | | | | | | | | | | | | | | | | | | | |
| | | Value at
Beginning of
Period | | | Purchases | | | Sales | | | Realized Gain (Loss) | | | Net Change in
Unrealized
Appreciation
(Depreciation) | | | Value at End of Period | | | Number of
Shares Held at End
of Period | | | Dividend
Income | |
| |
| Non-Controlled Affiliates(continued) | | | | | | | | | | | | | | | | | | | | | | | | | | | | | | | | |
Templeton Global Bond VIP Fund, Class 1 | | $ | — | | | $ | 35,760,635 | | | $ | — | | | $ | — | | | $ | (2,430,990 | ) | | $ | 33,329,645 | | | | 1,978,020 | | | $ | 2,316,602 | |
| | | | | | | | | | | | |
| | | | | | | | |
TotalNon-Controlled Affiliates | | $ | 523,429,362 | | | $ | 330,052,019 | | | $ | (859,953,764) | | | $ | 153,335,293 | | | $ | (89,551,617 | ) | | $ | 57,311,293 | | | | | | | $ | 2,528,859 | |
| | | | | | | | | | | | |
Total Affiliated Securities | | $ | 782,936,967 | | | $ | 330,052,019 | | | $ | (1,145,395,546) | | | $ | 236,146,349 | | | $ | (146,428,496 | ) | | $ | 57,311,293 | | | | | | | $ | 2,528,859 | |
| | | | | | | | | | | | |
f. Waiver and Expense Reimbursements
Effective May 1, 2019, Advisers has contractually agreed in advance to waive or limit its fees and to assume as its own expense certain expenses otherwise payable by the Fund so that the expenses (including acquired fund fees and expenses but excluding distribution fees, and certainnon-routine expenses or costs, including those relating to litigation, indemnification, reorganizations, and liquidations) for each class of the Fund do not exceed 0.57%, based on the average net assets of each class until April 30, 2020. Total expenses waived or paid are not subject to recapture subsequent to the Fund’s fiscal year end.
Prior to May 1, 2019, expenses (excluding certain fees and expenses as previously disclosed) for the Fund was limited to 0.10% based on the average net assets of the Fund.
4. Expense Offset Arrangement
The Fund has entered into an arrangement with its custodian whereby credits realized as a result of uninvested cash balances are used to reduce a portion of the Fund’s custodian expenses. During the period ended June 30, 2019, there were no credits earned.
5. Income Taxes
At June 30, 2019, the cost of investments and net unrealized appreciation (depreciation) for income tax purposes were as follows:
| | | | |
Cost of investments | | $ | 871,304,931 | |
| | | | |
Unrealized appreciation | | $ | 21,265,916 | |
Unrealized depreciation | | | (58,102,744) | |
| | | | |
Net unrealized appreciation (depreciation) | | $ | (36,836,828) | |
| | | | |
Differences between income and/or capital gains as determined on a book basis and a tax basis are primarily due to differing treatments of short term capital gains distributions from Underlying Funds and wash sales.
6. Investment Transactions
Purchases and sales of investments (excluding short term securities) for the period ended June 30, 2019, aggregated $1,065,348,430 and $1,135,012,871, respectively.
FRANKLIN TEMPLETON VARIABLE INSURANCE PRODUCTS TRUST
NOTES TO FINANCIAL STATEMENTS (UNAUDITED)
Franklin Allocation VIP Fund(continued)
7. Other Derivative Information
At June 30, 2019, investments in derivative contracts are reflected in the Statement of Assets and Liabilities as follows:
| | | | | | | | | | | | |
| | | Asset Derivatives | | | Liability Derivatives | |
| | | | | | |
| | | | |
Derivative Contracts Not Accounted for as Hedging Instruments | | Statement of Assets and Liabilities Location | | Fair Value | | | Statement of Assets and Liabilities
Location | | Fair Value | |
| | | | |
Interest rate contracts | | Variation margin on futures contracts | |
| $280,678a
|
| | Variation margin on futures contracts | |
| $ 82,883
| a
|
| | Unrealized appreciation on OTC swap contracts | | | — | | | Unrealized depreciation on OTC swap contracts | | | 41,475 | |
Foreign exchange contracts | | Unrealized appreciation on OTC forward exchange contracts | | | 29,677 | | | Unrealized depreciation on OTC forward exchange contracts | | | 49,161 | |
Credit contracts | | Variation margin on centrally cleared swap contracts | | | 8,821a | | | Variation margin on centrally cleared swap contracts | | | — | |
| | OTC swap contracts (upfront payments) | | | — | | | OTC swap contracts (upfront receipts) | | | 120,434 | |
| | Unrealized appreciation on OTC swap contracts | | | 41,697 | | | Unrealized depreciation on OTC swap contracts | | | — | |
Equity contracts | | Variation margin on futures contracts | | | 14,172a | | | Variation margin on futures contracts | | | — | |
| | | | | | | | | | | | |
Totals | | | | | $375,045 | | | | | | $293,953 | |
| | | | | | | | | | | | |
aThis amount reflects the cumulative appreciation (depreciation) of futures contracts and centrally cleared swap contracts as reported in the Statement of Investments. Only the variation margin receivable/payable at period end is separately reported within the Statement of Assets and Liabilities.
For the period ended June 30, 2019, the effect of derivative contracts in the Statement of Operations was as follows:
| | | | | | | | | | | | |
| | | | |
Derivative Contracts Not Accounted for as Hedging Instruments | | Statement of
Operations Location | | Net Realized
Gain (Loss) for
the Period | | | Statement of Operations Location | | Net Change in
Unrealized
Appreciation
(Depreciation)
for the Period | |
| | | | |
| | Net realized gain (loss) from: | | | | | | Net change in unrealized
appreciation (depreciation) on: | | | | |
| | | | |
Interest rate contracts | | Futures contracts | | $ | 44,513 | | | Futures contracts | | | $197,795 | |
| | Swap contracts | | | — | | | Swap contracts | | | (41,475 | ) |
| | | | |
Foreign exchange contracts | | Forward exchange contracts | | | 1,333 | | | Forward exchange contracts | | | (19,484 | ) |
| | | | |
Credit contracts | | Swap contracts | | | (46,642 | ) | | Swap contracts | | | 50,518 | |
| | | | |
Equity contracts | | Futures contracts | | | — | | | Futures contracts | | | 14,172 | |
| | | | | | | | | | | | |
| | | | |
Totals | | | | $ | (796 | ) | | | | | $201,526 | |
| | | | | | | | | | | | |
For the period ended June 30, 2019, the average month end notional amount of futures contracts and swap contracts represented $9,987,637 and $8,347,143, respectively. The average month end contract value of forward exchange contracts was $1,586,381.
FRANKLIN TEMPLETON VARIABLE INSURANCE PRODUCTS TRUST
NOTES TO FINANCIAL STATEMENTS (UNAUDITED)
Franklin Allocation VIP Fund(continued)
7. Other Derivative Information(continued)
At June 30, 2019, OTC derivative assets and liabilities are as follows:
| | | | | | | | |
| |
| | | Gross Amounts of
Assets and Liabilities Presented
in the Statement of Assets and Liabilities | |
| | |
| | | Assetsa | | | Liabilitiesa | |
| | |
| Derivatives | | | | | | | | |
Forward exchange contracts | | | $29,677 | | | | $ 49,161 | |
Swap contracts | | | 41,697 | | | | 161,909 | |
| | | | |
| | |
Total | | | $71,374 | | | | $211,070 | |
| | | | |
aAbsent an event of default or early termination, OTC derivative assets and liabilities are presented gross and not offset in the Statement of Assets and Liabilities.
At June 30, 2019, OTC derivative assets, which may be offset against OTC derivative liabilities and collateral received from the counterparty, are as follows:
| | | | | | | | | | | | | | | | | | | | |
| | | | | | Amounts Not Offset in the Statement of Assets and Liabilities | | | | |
| | | Gross
Amounts of
Assets Presented in
the Statement of
Assets and Liabilities | | | Financial
Instruments
Available for
Offset | | | Financial
Instruments
Collateral
Received | | | Cash
Collateral
Received | | | Net Amount
(Not less
than zero) | |
| | | | | |
| Counterparty | | | | | | | | | | | | | | | | | | | | |
CITI | | | $ 4,834 | | | | $ (4,085 | ) | | | $ — | | | | $ — | | | | $ 749 | |
JPHQ | | | 66,540 | | | | (66,540 | ) | | | — | | | | — | | | | — | |
| | | | |
Total | | | $71,374 | | | | $(70,625 | ) | | | $ — | | | | $ — | | | | $ 749 | |
| | | | |
At June 30, 2019, OTC derivative liabilities, which may be offset against OTC derivative assets and collateral pledged to the counterparty, are as follows:
| | | | | | | | | | | | | | | | | | | | |
| | | | | | Amounts Not Offset in the
Statement of Assets and Liabilities | | | | |
| | | Gross
Amounts of
Liabilities Presented in
the Statement of Assets and Liabilities | | | Financial
Instruments
Available for
Offset | | | Financial
Instruments
Collateral
Pledged | | | Cash
Collateral
Pledged | | | Net Amount
(Not less
than zero) | |
| | | | | |
| Counterparty | | | | | | | | | | | | | | | | | | | | |
CITI | | | $ 4,085 | | | | $ (4,085 | ) | | | $ — | | | | $ — | | | | $ — | |
JPHQ | | | 206,985 | | | | (66,540 | ) | | | — | | | | — | | | | 140,445 | |
| | | | |
Total | | | $211,070 | | | | $(70,625 | ) | | | $ — | | | | $ — | | | | $140,445 | |
| | | | |
See Note 1(d) regarding derivative financial instruments.
See Abbreviations on pageFFA-49.
FRANKLIN TEMPLETON VARIABLE INSURANCE PRODUCTS TRUST
NOTES TO FINANCIAL STATEMENTS (UNAUDITED)
Franklin Allocation VIP Fund(continued)
8. Credit Facility
The Fund, together with other U.S. registered and foreign investment funds (collectively, Borrowers), managed by Franklin Templeton, are borrowers in a joint syndicated senior unsecured credit facility totaling $2 billion (Global Credit Facility) which matures on February 7, 2020. This Global Credit Facility provides a source of funds to the Borrowers for temporary and emergency purposes, including the ability to meet future unanticipated or unusually large redemption requests.
Under the terms of the Global Credit Facility, the Fund shall, in addition to interest charged on any borrowings made by the Fund and other costs incurred by the Fund, pay its share of fees and expenses incurred in connection with the implementation and maintenance of the Global Credit Facility, based upon its relative share of the aggregate net assets of all of the Borrowers, including an annual commitment fee of 0.15% based upon the unused portion of the Global Credit Facility. These fees are reflected in other expenses in the Statement of Operations. During the period ended June 30, 2019, the Fund did not use the Global Credit Facility.
9. Fair Value Measurements
The Fund follows a fair value hierarchy that distinguishes between market data obtained from independent sources (observable inputs) and the Fund’s own market assumptions (unobservable inputs). These inputs are used in determining the value of the Fund’s financial instruments and are summarized in the following fair value hierarchy:
| | • | | Level 1 – quoted prices in active markets for identical financial instruments |
| | • | | Level 2 – other significant observable inputs (including quoted prices for similar financial instruments, interest rates, prepayment speed, credit risk, etc.) |
| | • | | Level 3 – significant unobservable inputs (including the Fund’s own assumptions in determining the fair value of financial instruments) |
The input levels are not necessarily an indication of the risk or liquidity associated with financial instruments at that level.
FRANKLIN TEMPLETON VARIABLE INSURANCE PRODUCTS TRUST
NOTES TO FINANCIAL STATEMENTS (UNAUDITED)
Franklin Allocation VIP Fund(continued)
9. Fair Value Measurements(continued)
A summary of inputs used as of June 30, 2019, in valuing the Fund’s assets and liabilities carried at fair value, is as follows:
| | | | | | | | | | | | | | | | |
| | | | |
| | | Level 1 | | | Level 2 | | | Level 3 | | | Total | |
| | | | |
| Assets: | | | | | | | | | | | | | | | | |
Investments in Securities:a | | | | | | | | | | | | | | | | |
Equity Investmentsb | | $ | 511,335,744 | | | $ | — | | | $ | — | | | $ | 511,335,744 | |
Corporate Bonds | | | — | | | | 104,980,664 | | | | — | | | | 104,980,664 | |
Senior Floating Rate Interests | | | — | | | | 6,106,949 | | | | — | | | | 6,106,949 | |
Foreign Government and Agency Securities | | | — | | | | 4,006,937 | | | | — | | | | 4,006,937 | |
U.S. Government and Agency Securities | | | — | | | | 40,601,062 | | | | — | | | | 40,601,062 | |
Asset-Backed Securities and CommercialMortgage-Backed Securities | | | — | | | | 44,132,001 | | | | — | | | | 44,132,001 | |
Mortgage-Backed Securities | | | — | | | | 99,054,409 | | | | — | | | | 99,054,409 | |
Short Term Investments | | | 23,981,648 | | | | — | | | | — | | | | 23,981,648 | |
| | | | |
Total Investments in Securities | | $ | 535,317,392 | | | $ | 298,882,022 | | | $ | — | | | $ | 834,199,414 | |
| | | | |
Other Financial Instruments: | | | | | | | | | | | | | | | | |
Futures Contracts | | $ | 294,850 | | | $ | — | | | $ | — | | | $ | 294,850 | |
Forward Exchange Contracts | | | — | | | | 29,677 | | | | — | | | | 29,677 | |
Swap Contracts | | | — | | | | 50,518 | | | | — | | | | 50,518 | |
| | | | |
Total Other Financial Instruments | | $ | 294,850 | | | $ | 80,195 | | | $ | — | | | $ | 375,045 | |
| | | | |
| | | | |
| Liabilities: | | | | | | | | | | | | | | | | |
Other Financial Instruments: | | | | | | | | | | | | | | | | |
Futures Contracts | | $ | 82,883 | | | $ | — | | | $ | — | | | $ | 82,883 | |
Forward Exchange Contracts | | | — | | | | 49,161 | | | | — | | | | 49,161 | |
Swap Contracts | | | — | | | | 41,475 | | | | — | | | | 41,475 | |
| | | | |
Total Other Financial Instruments | | $ | 82,883 | | | $ | 90,636 | | | $ | — | | | $ | 173,519 | |
| | | | |
aFor detailed categories, see the accompanying Statement of Investments.
bIncludes common stocks and management investment companies.
10. Subsequent Events
The Fund has evaluated subsequent events through the issuance of the financial statements and determined that no events have occurred that require disclosure.
FRANKLIN TEMPLETON VARIABLE INSURANCE PRODUCTS TRUST
NOTES TO FINANCIAL STATEMENTS (UNAUDITED)
Franklin Allocation VIP Fund(continued)
Abbreviations
| | | | | | | | | | |
| Counterparty | | Currency | | Selected Portfolio |
| | | | | |
| CITI | | Citigroup, Inc. | | COP | | Colombian Peso | | ADR | | American Depositary Receipt |
| | | | | |
| JPHQ | | JP Morgan Chase & Co. | | DOP | | Dominican Peso | | CLO | | Collateralized Loan Obligations |
| | | | | |
| | | | EUR | | Euro | | ETF | | Exchange Traded Fund |
| | | | | |
| | | | GBP | | British Pound | | FFCB | | Federal Farm Credit Bank |
| | | | | |
| | | | HKD | | Hong Kong Dollar | | FHLB | | Federal Home Loan Bank |
| | | | | |
| | | | USD | | United States Dollar | | FRN | | Floating Rate Note |
| | | | | |
| | | | UYU | | Uruguayan Peso | | IDR | | International Depository Receipt |
| | | | | |
| | | | ZAR | | South African Rand | | LIBOR | | London InterBank Offered Rate |
| | | | | |
| | | | | | | | SF | | Single Family |
| | |
| Index | | |
| |
| CDX.NA.HY.Series number | | CDX North America High Yield Index |
| |
| CDX.NA.IG.Series number | | CDX North America Investment Grade Index |
FRANKLIN TEMPLETON VARIABLE INSURANCE PRODUCTS TRUST
Tax Information (unaudited)
Franklin Allocation VIP Fund
During the fiscal year ended December 31, 2018, the Fund, a qualified fund of funds under Section 852(g)(2) of Internal Revenue Code, received an allocation of foreign taxes paid from one or more of its underlying funds. As shown in the table below, the Fund hereby reports to shareholders the foreign source income and foreign taxes paid by underlying funds, pursuant to Section 853 of the Internal Revenue Code. This written statement will allow shareholders of record on June 13, 2019, to treat their proportionate share of foreign taxes paid by the underlying funds as having been paid directly by them. The shareholder shall consider these amounts as foreign taxes paid in the tax year in which they receive the Fund distribution.
The following table provides a detailed analysis of foreign tax paid and foreign source as reported by the Fund to shareholders of record.
| | | | | | | | |
| Class | | Foreign Tax Paid
Per Share | | | Foreign Source
Income Per Share | |
| | |
Class 1 | | | $0.0054 | | | | $0.0526 | |
| | |
Class 2 | | | $0.0054 | | | | $0.0526 | |
| | |
Class 4 | | | $0.0054 | | | | $0.0526 | |
Foreign Tax Paid Per Share is the amount per share available to you, as a tax credit (assuming you held your shares in the Fund for a minimum of 16 days during the31-day period beginning 15 days before theex-dividend date of the Fund’s distribution to which the foreign taxes relate), or, as a tax deduction.
Foreign Source Income Per Share is the amount per share of income dividends attributable to foreign securities held by the Fund, plus any foreign taxes withheld on these dividends.
Franklin Flex Cap Growth VIP Fund
This semiannual report for Franklin Flex Cap Growth VIP Fund covers the period ended June 30, 2019.
Class 2 Performance Summary as of June 30, 2019
The Fund’s Class 2 Shares posted a +24.98% total return* for thesix-month period ended June 30, 2019.
*The Fund has an expense reduction and a fee waiver associated with any investments it makes in a Franklin Templeton money fund and/or other Franklin Templeton fund, contractually guaranteed through 4/30/20. Fund investment results reflect the expense reduction and fee waiver; without these reductions, the results would have been lower.
Performance reflects the Fund’s Class 2 operating expenses, but doesnotinclude any contract fees, expenses or sales charges. If they had been included, performance would be lower. These charges and deductions, particularly for variable life policies, can have a significant effect on contract values and insurance benefits. See the contract prospectus for a complete description of these expenses, including sales charges.
Performance data represent past performance, which does not guarantee future results. Investment return and principal value will fluctuate, and you may have a gain or loss when you sell your shares. Current performance may differ from figures shown.
FRANKLIN FLEX CAP GROWTH VIP FUND
Fund Goal and Main Investments
The Fund seeks capital appreciation. Under normal market conditions, the Fund invests predominantly in equity securities of companies that the investment manager believes have the potential for capital appreciation.
Fund Risks
All investments involve risks, including possible loss of principal. Growth stock prices reflect projections of future earnings or revenues, and can, therefore, fall dramatically if the company fails to meet those projections. To the extent the Fund focuses on particular countries, regions, industries, sectors or types of investment from time to time, it may be subject to greater risk of adverse developments in such areas of focus than a fund that invests in a wider variety of countries, regions, industries, sectors or investments. Smaller, midsized and relatively new or unseasoned companies can be particularly sensitive to changing economic conditions, and their prospects for growth are less certain than those of larger, more established companies. Historically, these securities have experienced more price volatility than larger-company stocks, especially over the short term. Foreign securities involve special risks, including currency fluctuations and economic and political uncertainties. The Fund is actively managed but there is no guarantee that the manager’s investment decisions will produce the desired results. The Fund’s prospectus also includes a description of the main investment risks.
Performance Overview
You can find the Fund’ssix-month total return in the Performance Summary. In comparison, the Russell 3000® Growth Index posted a +21.41% total return, the Russell 1000® Growth Index posted a +21.49% total return, and the Standard & Poor’s® 500 Index (S&P 500®) posted a +18.54% total return for the same period.1
Economic and Market Overview
The U.S. economy grew during the six months ended June 30, 2019. After moderating for two consecutive quarters, the economy grew significantly faster in 2019’s first quarter, driven by growth in consumer spending, inventory investment, exports, business investment, and state and
Portfolio Composition
Based on Total Net Assets as of 6/30/19
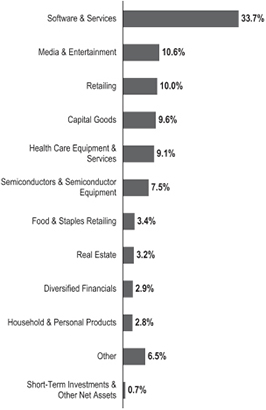
local government spending. However, the economy moderated again in the second quarter, due to weakness in inventory investment, exports, business investment and housing investment. The manufacturing and services sectors expanded during the period. The unemployment rate decreased from 3.9% in December 2018 to 3.7% atperiod-end.2 The annual inflation rate, as measured by the Consumer Price Index, decreased from 1.9% in December 2018 to 1.6% atperiod-end.2
The U.S. Federal Reserve (Fed) held its target range for the federal funds rate unchanged, at 2.25%–2.50%, during the reporting period. In March, the Fed mentioned it would end its balance sheet normalization program by the end of
1. Source: Morningstar. One cannot invest directly in an index, and an index is not representative of the Fund’s portfolio. Please see Index Descriptions following the Fund Summaries.
2. Source: Bureau of Labor Statistics.
The dollar value, number of shares or principal amount, and names of all portfolio holdings are listed in the Fund’s Statement of Investments (SOI).
FRANKLIN FLEX CAP GROWTH VIP FUND
September 2019. In June, the Fed indicated increased uncertainties around its views on economic activity and the labor market. With market-based inflation measures remaining low in recent months, the market has interpreted the Fed’s recent statements to mean it will likely cut rates in 2019’s second half to foster continued economic growth while attempting to achieve its inflation objective.
U.S. equity markets overall rose during the period, benefiting from upbeat economic data and U.S. corporate earnings. However, markets reflected concerns about tighter regulation of technology companies, U.S. political uncertainties, and the impact of U.S. trade disputes with China and other trading partners on global growth and corporate earnings. These concerns were partially alleviated in 2019’s first four months by easing trade tensions and optimism about a potential U.S.-China trade deal. Furthermore, markets benefited from the Fed’s indications of a patient approach to its monetary policy decisions. The broad U.S. stock market, as measured by the S&P 500, rallied in 2019’s first four months, reaching a newall-time high in April 2019. After declining in May due to escalating trade tensions, stocks reached anotherall-time high in June amid investor optimism about potential interest-rate cuts. Overall, the S&P 500 posted a +18.54% total return for thesix-month period.1
Investment Strategy
We use fundamental,bottom-up research to seek companies meeting our criteria of growth potential, quality and valuation. In seeking sustainable growth characteristics, we look for companies we believe can produce sustainable earnings and cash flow growth, evaluating the long-term market opportunity and competitive structure of an industry to target leaders and emerging leaders. We define quality companies as those with strong and improving competitive positions in attractive markets. We also believe important attributes of quality are experienced and talented management teams as well as financial strength reflected in the capital structure, gross and operating margins, free cash flow generation and returns on capital employed. Our valuation analysis includes a range of potential outcomes based on an assessment of multiple scenarios. In assessing value, we consider whether security prices fully reflect the balance of the sustainable growth opportunities relative to business and financial risks.
| | | | |
| Top 10 Holdings | | | | |
| 6/30/19 | | | |
| |
Company
Sector/Industry | | % of Total
Net Assets | |
Amazon.com Inc.
Retailing | | | 7.6% | |
Microsoft Corp.
Software & Services | | | 7.3% | |
Mastercard Inc.
Software & Services | | | 7.2% | |
ServiceNow Inc.
Software & Services | | | 5.3% | |
Alphabet Inc.
Media & Entertainment | | | 5.0% | |
salesforce.com Inc.
Software & Services | | | 4.3% | |
The Boeing Co.
Capital Goods | | | 3.7% | |
Visa Inc.
Software & Services | | | 3.5% | |
Xilinx Inc.
Semiconductors & Semiconductor Equipment | | | 3.2% | |
American Tower Corp.
Real Estate | | | 3.2% | |
Manager’s Discussion
During the six months ended June 30, 2019, all sectors represented in the Fund’s portfolio posted positive returns and contributed to absolute performance. Relative to the Russell 3000® Growth Index, stock selection and an overweighting in the information technology (IT) sector contributed significantly to the Fund’s performance.3 Stock selection and an underweighting in the health care sector, as well as stock selection in the consumer staples sector, also contributed to relative performance.4
Within the IT sector, our investments in cloud-based enterprise workflow management provider ServiceNow, financial technology company Mastercard and programmable chipmaker Xilinx contributed to relative results. ServiceNow, which enables companies to become more automated and efficient, continues to execute well in its large addressable market. A leader in enabling digital transformation, the company is becoming a multi-platform growth business with a strong product line, in our analysis. The recently introduced pro version of a core offering comes at a
3. The IT sector comprises semiconductors and semiconductor equipment and software and services in the SOI.
4. The health care sector comprises health care equipment and services and pharmaceuticals, biotechnology and life sciences in the SOI. The consumer staples sector comprises food and staples retailing; food, beverage and tobacco; and household and personal products in the SOI
FRANKLIN FLEX CAP GROWTH VIP FUND
price premium we believe could drive revenue and billings growth. Mastercard continues to perform very well, exceeding expectations and announcing several growth initiatives, partnerships, acquisition of capabilities that expand its global network, investment in emerging regions and expansion into new payment flows. The company has shown an ability to both invest for the long term and deliver solidquarter-to-quarter execution, which we believe is supported by a strong organic growth profile. Xilinx has benefited from its deployment of wireless 5G technology and the growth of its data center business. We like Xilinx’s competitive position and business model, and we believe that data center and artificial intelligence trends can drive growth for years to come.
In the health care sector, our positions in veterinary products and services provider IDEXX Laboratories and medical equipment and services company Danaher (not part of the index) aided relative results.
In the consumer staples sector, our holding in Estee Lauder, a manufacturer of skin care, makeup, fragrance and hair care products, supported relative results.
Other notable contributors to relative results included our positions in streaming subscription service company Netflix and software and engineered products company Roper Technologies.
In contrast, stock selection in the energy and communication services sectors, as well as a lack of exposure to the materials sector, detracted from the Fund’s relative performance.5
Most of the Fund’s investments posted positive returns during thesix-month period. However, positive returns from several holdings lagged the benchmark index, and our overweighted positions hurt relative performance. These holdings included oil and natural gas company Concho Resources in the energy sector and Google-parent Alphabet in the communication services sector. Alphabet continued to benefit from the shift toward online spending, Google’s innovation in its advertising businesses and Google Cloud’s strong growth momentum.
Other key detractors with positive returns that lagged the benchmark index included cloud-based customer relationship management company salesforce.com, pharmaceuticals firm Elanco Animal Health, robotic surgery systems manufacturer Intuitive Surgical and medical technology company Becton, Dickinson and Co. The only
key detractor that posted negative returns for the period was electric automobile manufacturer Tesla. Salesforce.com continued to drive digital transformations, aided by its 2018 acquisition of Mulesoft, which has been key to unlocking data from legacy systems to make digital transformation easier. Elanco benefited from robust growth in companion animal therapeutics and the performance of the new products it launched over the past few years. In our analysis, the company is well-positioned in the animal health industry, which is seeing increased demand for animal protein and growth in companion animal demand and spending.
Thank you for your participation in Franklin Flex Cap Growth VIP Fund. We look forward to serving your future investment needs.
The foregoing information reflects our analysis, opinions and portfolio holdings as of June 30, 2019, the end of the reporting period. The way we implement our main investment strategies and the resulting portfolio holdings may change depending on factors such as market and economic conditions. These opinions may not be relied upon as investment advice or an offer for a particular security. The information is not a complete analysis of every aspect of any market, state, industry, security or the Fund. Statements of fact are from sources considered reliable, but the investment manager makes no representation or warranty as to their completeness or accuracy. Although historical performance is no guarantee of future results, these insights may help you understand our investment management philosophy.
5. The communication services sector comprises media and entertainment in the SOI.
FRANKLIN FLEX CAP GROWTH VIP FUND
Class 2 Fund Expenses
As an investor in a variable insurance contract (Contract) that indirectly provides for investment in an underlying mutual fund, you can incur transaction and/or ongoing expenses at both the Fund level and the Contract Level: (1) transaction expenses can include sales charges (loads) on purchases, surrender fees, transfer fees and premium taxes; and (2) ongoing expenses can include management fees, distribution and service(12b-1) fees, contract fees, annual maintenance fees, mortality and expense risk fees and other fees and expenses. All mutual funds and Contracts have some types of ongoing expenses. The table below shows Fund-level ongoing expenses and can help you understand these costs and compare them with those of other mutual funds offered through the Contract. The table assumes a $1,000 investment held for the six months indicated. Please refer to the Fund prospectus for additional information on operating expenses.
Actual Fund Expenses
The table below provides information about the actual account values and actual expenses in the columns under the heading “Actual.” In these columns the Fund’s actual return, which includes the effect of ongoing Fund expenses but does not include the effect of ongoing Contract expenses, is used to calculate the “Ending Account Value.” You can estimate the Fund-level expenses you paid during the period by following these steps (of course, your account value and expenses will differ from those in this illustration): Divide your account value by $1,000 (if your account had an $8,600 value, then $8,600÷ $1,000 =8.6). Then multiply the result by the number under the headings “Actual” and “Fund-Level Expenses Paid During Period” (if Fund-Level Expenses Paid During Period were $ 7.50, then 8.6 x $ 7.50 = $64.50). In this illustration, the estimated expenses paid this period at the Fund level are $64.50.
Hypothetical Example for Comparison with Other Mutual Funds
Under the heading “Hypothetical” in the table, information is provided about hypothetical account values and hypothetical expenses based on the Fund’s actual expense ratio and an assumed rate of return of 5% per year before expenses, which is not the Fund’s actual return. This information may not be used to estimate the actual ending account balance or expenses you paid for the period, but it can help you compare ongoing costs of investing in the Fund with those of other mutual funds offered through the Contract. To do so, compare this 5% hypothetical example with the 5% hypothetical examples that appear in the shareholder reports of other funds offered through the Contract.
Please note that expenses shown in the table are meant to highlight ongoing costs at the Fund level only and do not reflect any ongoing expenses at the Contract level, or transaction expenses at either the Fund or Contract levels. In addition, while the Fund does not have transaction expenses, if the transaction and ongoing expenses at the Contract level were included, the expenses shown below would be higher. You should consult your Contract prospectus or disclosure document for more information.
| | | | | | | | | | | | |
| | | | | Actual | | Hypothetical | | |
| | | | | (actual return after expenses) | | (5% annual return before expenses) | | |
Share Class | | Beginning
Account
Value 1/1/19 | | Ending
Account
Value 6/30/19 | | Fund-Level
Expenses Paid During
Period
1/1/19–6/30/191, 2 | | Ending Account Value 6/30/19 | | Fund-Level
Expenses Paid During Period 1/1/19–6/30/191,2 | | Net
Annualized
Expense
Ratio2 |
| | | | | | |
Class 2 | | $1,000 | | $1,249.80 | | $5.36 | | $1,020.03 | | $4.81 | | 0.96% |
1. Expenses are equal to the annualized expense ratio for thesix-month period as indicated above—in the far right column—multiplied by the simple average account value over the period indicated, and then multiplied by 181/365 to reflect theone-half year period.
2. Reflects expenses after fee waivers and expense reimbursements. Does not include any ongoing expenses of the Contract for which the Fund is an investment option or acquired fund fees and expenses.
| | | | | | |
| | | |
| | . Semiannual Report | | | FFC-5 | |
FRANKLIN TEMPLETON VARIABLE INSURANCE PRODUCTS TRUST
Financial Highlights
Franklin Flex Cap Growth VIP Fund
| | | | | | | | | | | | | | | | | | | | | | | | |
| | | Six Months Ended
June 30, 2019 (unaudited) | | | Year Ended December 31, | |
| | | 2018 | | | 2017 | | | 2016 | | | 2015 | | | 2014 | |
| |
| | | | | | |
Class 2 | | | | | | | | | | | | | | | | | | | | | | | | |
| | | | | | |
Per share operating performance
(for a share outstanding throughout the period) | | | | | | | | | | | | | | | | | | | | | | | | |
| | | | | | |
Net asset value, beginning of period | | | $ 6.46 | | | | $ 7.46 | | | | $ 5.89 | | | | $ 7.09 | | | | $ 16.61 | | | | $18.11 | |
| | | | |
| | | | | | |
| Income from investment operationsa: | | | | | | | | | | | | | | | | | | | | | | | | |
| | | | | | |
Net investment income (loss)b | | | (0.01) | | | | (0.02) | | | | (0.01) | | | | (0.03) | | | | (0.06) | | | | (0.08) | |
| | | | | | |
Net realized and unrealized gains (losses) | | | 1.62 | | | | 0.42 | | | | 1.60 | | | | (0.20) | | | | 1.00 | | | | 1.09 | |
| | | | |
| | | | | | |
Total from investment operations | | | 1.61 | | | | 0.40 | | | | 1.59 | | | | (0.23) | | | | 0.94 | | | | 1.01 | |
| | | | |
| | | | | | |
| Less distributions from: | | | | | | | | | | | | | | | | | | | | | | | | |
| | | | | | |
Net realized gains | | | (0.38) | | | | (1.40) | | | | (0.02) | | | | (0.97) | | | | (10.46) | | | | (2.51) | |
| | | | |
| | | | | | |
Net asset value, end of period | | | $ 7.69 | | | | $ 6.46 | | | | $ 7.46 | | | | $ 5.89 | | | | $ 7.09 | | | | $16.61 | |
| | | | |
| | | | | | |
Total returnc | | | 24.98% | | | | 3.14% | | | | 26.94% | | | | (2.89)% | | | | 4.37% | | | | 6.11% | |
| | | | | | |
| Ratios to average net assetsd | | | | | | | | | | | | | | | | | | | | | | | | |
| | | | | | |
Expenses before waiver and payments by affiliates | | | 1.32% | | | | 1.30% | | | | 1.35% | | | | 1.36% | | | | 1.33% | | | | 1.20% | |
| | | | | | |
Expenses net of waiver and payments by affiliates | | | 0.96% | | | | 0.96% | e | | | 0.96% | | | | 0.96% | | | | 0.96% | | | | 0.95% | |
| | | | | | |
Net investment income (loss) | | | (0.17)% | | | | (0.20)% | | | | (0.20)% | | | | (0.44)% | | | | (0.62)% | | | | (0.46)% | |
| | | | | | |
| Supplemental data | | | | | | | | | | | | | | | | | | | | | | | | |
| | | | | | |
Net assets, end of period (000’s) | | | $95,382 | | | | $69,233 | | | | $81,084 | | | | $73,337 | | | | $82,901 | | | | $93,354 | |
| | | | | | |
Portfolio turnover rate | | | 6.82% | | | | 15.17% | | | | 52.12% | | | | 17.76% | | | | 88.15% | | | | 52.83% | |
aThe amount shown for a share outstanding throughout the period may not correlate with the Statement of Operations for the period due to the timing of sales and repurchases of the Fund’s shares in relation to income earned and/or fluctuating fair value of the investments of the Fund.
bBased on average daily shares outstanding.
cTotal return does not include fees, charges or expenses imposed by the variable annuity and life insurance contracts for which Franklin Templeton Variable Insurance Products Trust serves as an underlying investment vehicle. Total return is not annualized for periods less than one year.
dRatios are annualized for periods less than one year.
eBenefit of expense reduction rounds to less than 0.01%.
| | | | |
| | | |
FFC-6 | | Semiannual Report | The accompanying notes are an integral part of these financial statements. | | |
FRANKLIN TEMPLETON VARIABLE INSURANCE PRODUCTS TRUST
FINANCIAL HIGHLIGHTS
Franklin Flex Cap Growth VIP Fund(continued)
| | | | | | | | | | | | | | | | | | | | | | | | |
| | | Six Months Ended
June 30, 2019 (unaudited) | | | Year Ended December 31, | |
| | | 2018 | | | 2017 | | | 2016 | | | 2015 | | | 2014 | |
| |
| | | | | | |
Class 4 | | | | | | | | | | | | | | | | | | | | | | | | |
| | | | | | |
Per share operating performance
(for a share outstanding throughout the period) | | | | | | | | | | | | | | | | | | | | | | | | |
| | | | | | |
Net asset value, beginning of period | | | $ 6.20 | | | | $ 7.21 | | | | $ 5.70 | | | | $ 6.90 | | | | $ 16.44 | | | | $17.96 | |
| | | | |
| | | | | | |
| Income from investment operationsa: | | | | | | | | | | | | | | | | | | | | | | | | |
| | | | | | |
Net investment income (loss)b | | | (0.01) | | | | (0.02) | | | | (0.02) | | | | (0.03) | | | | (0.07) | | | | (0.10) | |
| | | | | | |
Net realized and unrealized gains (losses) | | | 1.54 | | | | 0.41 | | | | 1.55 | | | | (0.20) | | | | 0.99 | | | | 1.09 | |
| | | | |
| | | | | | |
Total from investment operations | | | 1.53 | | | | 0.39 | | | | 1.53 | | | | (0.23) | | | | 0.92 | | | | 0.99 | |
| | | | |
| | | | | | |
| Less distributions from: | | | | | | | | | | | | | | | | | | | | | | | | |
| | | | | | |
Net realized gains | | | (0.38) | | | | (1.40) | | | | (0.02) | | | | (0.97) | | | | (10.46) | | | | (2.51) | |
| | | | |
| | | | | | |
Net asset value, end of period | | | $ 7.35 | | | | $ 6.20 | | | | $ 7.21 | | | | $ 5.70 | | | | $ 6.90 | | | | $16.44 | |
| | | | |
| | | | | | |
Total returnc | | | 24.91% | | | | 3.10% | | | | 26.78% | | | | (2.98)% | | | | 4.32% | | | | 5.98% | |
| | | | | | |
| Ratios to average net assetsd | | | | | | | | | | | | | | | | | | | | | | | | |
| | | | | | |
Expenses before waiver and payments by affiliates | | | 1.42% | | | | 1.40% | | | | 1.45% | | | | 1.46% | | | | 1.43% | | | | 1.30% | |
| | | | | | |
Expenses net of waiver and payments by affiliates | | | 1.06% | | | | 1.06% | e | | | 1.06% | | | | 1.06% | | | | 1.06% | | | | 1.05% | |
| | | | | | |
Net investment income (loss) | | | (0.27)% | | | | (0.30)% | | | | (0.30)% | | | | (0.54)% | | | | (0.72)% | | | | (0.56)% | |
| | | | | | |
| Supplemental data | | | | | | | | | | | | | | | | | | | | | | | | |
| | | | | | |
Net assets, end of period (000’s) | | | $32,498 | | | | $29,681 | | | | $30,112 | | | | $27,163 | | | | $34,479 | | | | $31,355 | |
| | | | | | |
Portfolio turnover rate | | | 6.82% | | | | 15.17% | | | | 52.12% | | | | 17.76% | | | | 88.15% | | | | 52.83% | |
aThe amount shown for a share outstanding throughout the period may not correlate with the Statement of Operations for the period due to the timing of sales and repurchases of the Fund’s shares in relation to income earned and/or fluctuating fair value of the investments of the Fund.
bBased on average daily shares outstanding.
cTotal return does not include fees, charges or expenses imposed by the variable annuity and life insurance contracts for which Franklin Templeton Variable Insurance Products Trust serves as an underlying investment vehicle. Total return is not annualized for periods less than one year.
dRatios are annualized for periods less than one year.
eBenefit of expense reduction rounds to less than 0.01%.
| | | | | | |
| | | |
| | The accompanying notes are an integral part of these financial statements. | Semiannual Report | | | FFC-7 | |
FRANKLIN TEMPLETON VARIABLE INSURANCE PRODUCTS TRUST
Statement of Investments, June 30, 2019 (unaudited)
Franklin Flex Cap Growth VIP Fund
| | | | | | | | |
| | | Shares | | | Value | |
| |
Common Stocks 99.3% | | | | | | | | |
Automobiles & Components 0.3% | | | | | | | | |
aTesla Inc. | | | 1,980 | | | $ | 442,451 | |
| | | | | | | | |
| | |
Capital Goods 9.6% | | | | | | | | |
The Boeing Co. | | | 12,870 | | | | 4,684,809 | |
Fortive Corp. | | | 39,590 | | | | 3,227,377 | |
Raytheon Co. | | | 12,860 | | | | 2,236,097 | |
Roper Technologies Inc. | | | 5,940 | | | | 2,175,584 | |
| | | | | | | | |
| | | | | | | 12,323,867 | |
| | | | | | | | |
| | |
Consumer Durables & Apparel 1.3% | | | | | | | | |
NIKE Inc., B | | | 19,800 | | | | 1,662,210 | |
| | | | | | | | |
| | |
Consumer Services 0.0%† | | | | | | | | |
aLuckin Coffee Inc., ADR (China) | | | 200 | | | | 3,898 | |
| | | | | | | | |
| | |
Diversified Financials 2.9% | | | | | | | | |
CME Group Inc. | | | 9,900 | | | | 1,921,689 | |
Intercontinental Exchange Inc. | | | 19,790 | | | | 1,700,752 | |
Tradeweb Markets Inc. | | | 2,870 | | | | 125,735 | |
| | | | | | | | |
| | |
| | | | | | | 3,748,176 | |
| | | | | | | | |
Energy 0.8% | | | | | | | | |
Concho Resources Inc. | | | 9,890 | | | | 1,020,450 | |
| | | | | | | | |
| | |
Food & Staples Retailing 3.4% | | | | | | | | |
Costco Wholesale Corp. | | | 14,850 | | | | 3,924,261 | |
aGrocery Outlet Holding Corp. | | | 12,420 | | | | 408,370 | |
| | | | | | | | |
| | |
| | | | | | | 4,332,631 | |
| | | | | | | | |
| | |
Food, Beverage & Tobacco 1.7% | | | | | | | | |
a,bBeyond Meat Inc. | | | 1,390 | | | | 223,345 | |
Constellation Brands Inc., A | | | 9,910 | | | | 1,951,676 | |
| | | | | | | | |
| | |
| | | | | | | 2,175,021 | |
| | | | | | | | |
| | |
Health Care Equipment & Services 9.1% | | | | | | | | |
aAlcon Inc. (Switzerland) | | | 24,750 | | | | 1,535,737 | |
Becton, Dickinson and Co. | | | 9,900 | | | | 2,494,899 | |
Danaher Corp. | | | 19,790 | | | | 2,828,387 | |
aIDEXX Laboratories Inc. | | | 9,890 | | | | 2,723,014 | |
aIntuitive Surgical Inc. | | | 3,960 | | | | 2,077,218 | |
| | | | | | | | |
| | |
| | | | | | | 11,659,255 | |
| | | | | | | | |
| | |
Household & Personal Products 2.8% | | | | | | | | |
Estee Lauder Cos. Inc., A | | | 19,800 | | | | 3,625,578 | |
| | | | | | | | |
| | |
Media & Entertainment 10.6% | | | | | | | | |
aAlphabet Inc., C | | | 5,940 | | | | 6,420,605 | |
aCharter Communications Inc., A | | | 4,956 | | | | 1,958,512 | |
aElectronic Arts Inc. | | | 12,860 | | | | 1,302,204 | |
aNetflix Inc. | | | 9,880 | | | | 3,629,121 | |
aPinterest Inc., A | | | 8,030 | | | | 218,577 | |
| | | | | | | | |
| | |
| | | | | | 13,529,019 | |
| | | | | | | | |
FRANKLIN TEMPLETON VARIABLE INSURANCE PRODUCTS TRUST
STATEMENT OF INVESTMENTS (UNAUDITED)
Franklin Flex Cap Growth VIP Fund(continued)
| | | | | | | | |
| | | Shares | | | Value | |
| |
| | |
Common Stocks(continued) | | | | | | | | |
| | |
Pharmaceuticals, Biotechnology & Life Sciences 2.0% | | | | | | | | |
aElanco Animal Health Inc. | | | 74,250 | | | $ | 2,509,650 | |
| | | | | | | | |
| | |
Real Estate 3.2% | | | | | | | | |
American Tower Corp. | | | 19,790 | | | | 4,046,065 | |
| | | | | | | | |
| | |
Retailing 10.0% | | | | | | | | |
aAlibaba Group Holding Ltd., ADR (China) | | | 9,890 | | | | 1,675,860 | |
aAmazon.com Inc. | | | 5,120 | | | | 9,695,386 | |
aBooking Holdings Inc. | | | 590 | | | | 1,106,079 | |
aChewy Inc., A | | | 590 | | | | 20,650 | |
aThe RealReal Inc. | | | 4,310 | | | | 124,559 | |
| | |
a,bRevolve Group Inc. | | | 2,870 | | | | 99,015 | |
| | | | | | | | |
| | |
| | | | | | | 12,721,549 | |
| | | | | | | | |
Semiconductors & Semiconductor Equipment 7.5% | | | | | | | | |
Analog Devices Inc. | | | 34,640 | | | | 3,909,817 | |
NVIDIA Corp. | | | 9,890 | | | | 1,624,234 | |
Xilinx Inc. | | | 34,640 | | | | 4,084,749 | |
| | | | | | | | |
| | |
| | | | | | | 9,618,800 | |
| | | | | | | | |
Software & Services 33.7% | | | | | | | | |
aAdobe Inc. | | | 9,890 | | | | 2,914,089 | |
aCrowdstrike Holdings Inc., A | | | 3,170 | | | | 216,479 | |
aElastic NV | | | 1,570 | | | | 117,216 | |
aFastly Inc. | | | 400 | | | | 8,112 | |
Mastercard Inc., A | | | 34,600 | | | | 9,152,738 | |
Microsoft Corp. | | | 69,290 | | | | 9,282,089 | |
| | |
a,bPagerduty Inc. | | | 1,180 | | | | 55,519 | |
aPayPal Holdings Inc. | | | 19,790 | | | | 2,265,163 | |
asalesforce.com Inc. | | | 36,630 | | | | 5,557,870 | |
aServiceNow Inc. | | | 24,740 | | | | 6,792,862 | |
Visa Inc., A | | | 26,200 | | | | 4,547,011 | |
aWorkday Inc., A | | | 9,900 | | | | 2,035,242 | |
| | |
a,bZoom Video Communications Inc., A | | | 1,390 | | | | 123,418 | |
| | | | | | | | |
| | |
| | | | | | | 43,067,808 | |
| | | | | | | | |
Transportation 0.4% | | | | | | | | |
| | |
a,bLyft Inc., A | | | 2,480 | | | | 162,961 | |
aUber Technologies Inc. | | | 7,550 | | | | 350,169 | |
| | | | | | | | |
| | |
| | | | | | | 513,130 | |
| | | | | | | | |
| | |
Total Common Stocks (Cost $65,676,016) | | | | | | | 126,999,558 | |
| | | | | | | | |
| | |
Short Term Investments 0.5% | | | | | | | | |
| | |
Money Market Funds (Cost $686) 0.0%† | | | | | | | | |
| | |
c,dInstitutional Fiduciary Trust Money Market Portfolio, 2.05% | | | 686 | | | | 686 | |
| | | | | | | | |
FRANKLIN TEMPLETON VARIABLE INSURANCE PRODUCTS TRUST
STATEMENT OF INVESTMENTS (UNAUDITED)
Franklin Flex Cap Growth VIP Fund(continued)
| | | | | | | | |
| | |
| | | Shares | | | Value | |
Short Term Investments(continued) | | | | | | | | |
| | | | | | | | |
| | |
eInvestments from Cash Collateral Received for Loaned Securities 0.5% | | | | | | | | |
Money Market Funds (Cost $637,700) 0.5% | | | | | | | | |
c,dInstitutional Fiduciary Trust Money Market Portfolio, 2.05% | | | 637,700 | | | $ | 637,700 | |
| | | | | | | | |
| | |
Total Investments (Cost $66,314,402) 99.8% | | | | | | | 127,637,944 | |
Other Assets, less Liabilities 0.2% | | | | | | | 242,041 | |
| | | | | | | | |
| | |
Net Assets 100.0% | | | | | | $ | 127,879,985 | |
| | | | | | | | |
See Abbreviations on pageFFC-19.
†Rounds to less than 0.1% of net assets.
aNon-income producing.
bA portion or all of the security is on loan at June 30, 2019. See Note 1(b).
cSee Note 3(e) regarding investments in affiliated management investment companies.
dThe rate shown is the annualizedseven-day effective yield at period end.
eSee Note 1(b) regarding securities on loan.
| | | | |
| | | |
FFC-10 | | Semiannual Report | The accompanying notes are an integral part of these financial statements. | | |
FRANKLIN TEMPLETON VARIABLE INSURANCE PRODUCTS TRUST
FINANCIAL STATEMENTS
Statement of Assets and Liabilities
June 30, 2019 (unaudited)
| | | | |
| |
| | | Franklin Flex
Cap Growth
VIP Fund | |
| |
Assets: | | | | |
Investments in securities: | | | | |
Cost - Unaffiliated issuers | | | $ 65,676,016 | |
Cost -Non-controlled affiliates (Note 3e) | | | 638,386 | |
| | | | |
Value - Unaffiliated issuers+ | | | $126,999,558 | |
Value -Non-controlled affiliates (Note 3e) | | | 638,386 | |
Cash | | | 1,135,122 | |
Receivables: | | | | |
Investment securities sold | | | 5,374 | |
Capital shares sold | | | 1,189 | |
Dividends | | | 37,140 | |
Other assets | | | 75 | |
| | | | |
| |
Total assets | | | 128,816,844 | |
| | | | |
| |
Liabilities: | | | | |
Payables: | | | | |
Investment securities purchased | | | 90,000 | |
Capital shares redeemed | | | 52,389 | |
Management fees | | | 64,802 | |
Distribution fees | | | 57,549 | |
Trustees’ fees and expenses | | | 67 | |
Payable upon return of securities loaned | | | 637,700 | |
Accrued expenses and other liabilities | | | 34,352 | |
| | | | |
| |
Total liabilities | | | 936,859 | |
| | | | |
| |
Net assets, at value | | | $127,879,985 | |
| | | | |
Net assets consist of: | | | | |
Paid-in capital | | | $ 64,770,665 | |
Total distributable earnings (loss) | | | 63,109,320 | |
| | | | |
| |
Net assets, at value | | | $127,879,985 | |
| | | | |
| |
| Class 2: | | | | |
Net assets, at value | | | $ 95,381,928 | |
| | | | |
Shares outstanding | | | 12,409,286 | |
| | | | |
Net asset value and maximum offering price per share | | | $7.69 | |
| | | | |
| |
| Class 4: | | | | |
Net assets, at value | | | $ 32,498,057 | |
| | | | |
Shares outstanding | | | 4,419,229 | |
| | | | |
Net asset value and maximum offering price per share | | | $7.35 | |
| | | | |
| |
| | | | |
+Includes securities loaned | | | $ 620,349 | |
| | | | | | |
| | | |
| | The accompanying notes are an integral part of these financial statements. | Semiannual Report | | | FFC-11 | |
FRANKLIN TEMPLETON VARIABLE INSURANCE PRODUCTS TRUST
FINANCIAL STATEMENTS
Statement of Operations
for the six months ended June 30, 2019 (unaudited)
| | | | |
| |
| | | Franklin Flex
Cap Growth
VIP Fund | |
| |
Investment income: | | | | |
Dividends: | | | | |
Unaffiliated issuers | | | $ 378,138 | |
Non-controlled affiliates (Note 3e) | | | 58,193 | |
Income from securities loaned: | | | | |
Unaffiliated issuers (net of fees and rebates) | | | 24,330 | |
Non-controlled affiliates (Note 3e) | | | 7,489 | |
| | | | |
| |
Total investment income | | | 468,150 | |
| | | | |
Expenses: | | | | |
Management fees (Note 3a) | | | 581,802 | |
Distribution fees: (Note 3c) | | | | |
Class 2 | | | 108,648 | |
Class 4 | | | 55,232 | |
Custodian fees (Note 4) | | | 1,367 | |
Reports to shareholders | | | 23,477 | |
Professional fees | | | 20,267 | |
Trustees’ fees and expenses | | | 452 | |
Other | | | 4,629 | |
| | | | |
| |
Total expenses | | | 795,874 | |
| |
Expenses waived/paid by affiliates (Note 3e and 3f) | | | (212,142 | ) |
| | | | |
| |
Net expenses | | | 583,732 | |
| | | | |
| |
Net investment income (loss) | | | (115,582 | ) |
| | | | |
Realized and unrealized gains (losses): | | | | |
Net realized gain (loss) from: | | | | |
Investments: | | | | |
Unaffiliated issuers | | | 1,921,559 | |
| | | | |
Net change in unrealized appreciation (depreciation) on: | | | | |
Investments: | | | | |
Unaffiliated issuers | | | 23,283,920 | |
| | | | |
| |
Net realized and unrealized gain (loss) | | | 25,205,479 | |
| | | | |
| |
Net increase (decrease) in net assets resulting from operations | | | $25,089,897 | |
| | | | |
| | | | |
| | | |
FFC-12 | | Semiannual Report | The accompanying notes are an integral part of these financial statements. | | |
FRANKLIN TEMPLETON VARIABLE INSURANCE PRODUCTS TRUST
FINANCIAL STATEMENTS
Statements of Changes in Net Assets
| | | | | | | | |
| |
| | | Franklin Flex Cap
Growth VIP Fund | |
| | |
| | | Six Months Ended
June 30, 2019
(unaudited) | | | Year Ended
December 31, 2018 | |
| | |
Increase (decrease) in net assets: | | | | | | | | |
Operations: | | | | | | | | |
Net investment income (loss) | | | $ (115,582 | ) | | | $ (278,068 | ) |
Net realized gain (loss) | | | 1,921,559 | | | | 6,194,237 | |
Net change in unrealized appreciation (depreciation) | | | 23,283,920 | | | | (2,119,037 | ) |
| | | | |
| | |
Net increase (decrease) in net assets resulting from operations | | | 25,089,897 | | | | 3,797,132 | |
| | | | |
Distributions to shareholders: | | | | | | | | |
Class 2 | | | (4,527,604 | ) | | | (15,220,091 | ) |
Class 4 | | | (1,613,765 | ) | | | (5,742,189 | ) |
| | | | |
| | |
Total distributions to shareholders | | | (6,141,369 | ) | | | (20,962,280 | ) |
| | | | |
| | |
Capital share transactions: (Note 2) | | | | | | | | |
Class 2 | | | 12,618,948 | | | | 414,873 | |
Class 4 | | | (2,602,278 | ) | | | 4,469,506 | |
| | | | |
| | |
Total capital share transactions | | | 10,016,670 | | | | 4,884,379 | |
| | | | |
Net increase (decrease) in net assets | | | 28,965,198 | | | | (12,280,769 | ) |
Net assets: | | | | | | | | |
Beginning of period | | | 98,914,787 | | | | 111,195,556 | |
| | | | |
| | |
End of period | | | $127,879,985 | | | | $ 98,914,787 | |
| | | | |
| | | | | | |
| | | |
| | The accompanying notes are an integral part of these financial statements. | Semiannual Report | | | FFC-13 | |
FRANKLIN TEMPLETON VARIABLE INSURANCE PRODUCTS TRUST
Notes to Financial Statements (unaudited)
Franklin Flex Cap Growth VIP Fund
1. Organization and Significant Accounting Policies
Franklin Templeton Variable Insurance Products Trust (Trust) is registered under the Investment Company Act of 1940 (1940 Act) as anopen-end management investment company, consisting of eighteen separate funds and applies the specialized accounting and reporting guidance in U.S. Generally Accepted Accounting Principles (U.S. GAAP). Franklin Flex Cap Growth VIP Fund (Fund) is included in this report. Shares of the Fund are generally sold only to insurance company separate accounts to fund the benefits of variable life insurance policies or variable annuity contracts. The Fund offers two classes of shares: Class 2 and Class 4. Each class of shares may differ by its distribution fees, voting rights on matters affecting a single class and its exchange privilege.
The following summarizes the Fund’s significant accounting policies.
a. Financial Instrument Valuation
The Fund’s investments in financial instruments are carried at fair value daily. Fair value is the price that would be received to sell an asset or paid to transfer a liability in an orderly transaction between market participants on the measurement date. The Fund calculates the net asset value (NAV) per share each business day as of 4 p.m. Eastern time or the regularly scheduled close of the New York Stock Exchange (NYSE), whichever is earlier. Under compliance policies and procedures approved by the Trust’s Board of Trustees (the Board), the Fund’s administrator has responsibility for oversight of valuation, including leading the cross-functional Valuation Committee (VC). The Fund may utilize independent pricing services, quotations from securities and financial instrument dealers, and other market sources to determine fair value.
Equity securities listed on an exchange or on the NASDAQ National Market System are valued at the last quoted sale price or the official closing price of the day, respectively. Foreign equity securities are valued as of the close of trading on the foreign stock exchange on which the security is primarily traded, or as of 4 p.m. Eastern time. The value is then converted into its U.S. dollar equivalent at the foreign exchange rate in effect at 4 p.m. Eastern time on the day that the value of the security is determined.Over-the-counter (OTC) securities are valued within the range of the most recent quoted bid and ask prices. Securities that trade in multiple markets or on multiple exchanges are valued
according to the broadest and most representative market. Certain equity securities are valued based upon fundamental characteristics or relationships to similar securities.
Investments inopen-end mutual funds are valued at the closing NAV.
The Fund has procedures to determine the fair value of financial instruments for which market prices are not reliable or readily available. Under these procedures, the Fund primarily employs a market-based approach which may use related or comparable assets or liabilities, recent transactions, market multiples, book values, and other relevant information for the investment to determine the fair value of the investment. An income-based valuation approach may also be used in which the anticipated future cash flows of the investment are discounted to calculate fair value. Discounts may also be applied due to the nature or duration of any restrictions on the disposition of the investments. Due to the inherent uncertainty of valuations of such investments, the fair values may differ significantly from the values that would have been used had an active market existed.
Trading in securities on foreign securities stock exchanges and OTC markets may be completed before 4 p.m. Eastern time. In addition, trading in certain foreign markets may not take place on every Fund’s business day. Occasionally, events occur between the time at which trading in a foreign security is completed and 4 p.m. Eastern time that might call into question the reliability of the value of a portfolio security held by the Fund. As a result, differences may arise between the value of the Fund’s portfolio securities as determined at the foreign market close and the latest indications of value at 4 p.m. Eastern time. In order to minimize the potential for these differences, the VC monitors price movements following the close of trading in foreign stock markets through a series of country specific market proxies (such as baskets of American Depositary Receipts, futures contracts and exchange traded funds). These price movements are measured against established trigger thresholds for each specific market proxy to assist in determining if an event has occurred that may call into question the reliability of the values of the foreign securities held by the Fund. If such an event occurs, the securities may be valued using fair value procedures, which may include the use of independent pricing services.
FRANKLIN TEMPLETON VARIABLE INSURANCE PRODUCTS TRUST
NOTES TO FINANCIAL STATEMENTS (UNAUDITED)
Franklin Flex Cap Growth VIP Fund(continued)
When the last day of the reporting period is anon-business day, certain foreign markets may be open on those days that the Fund’s NAV is not calculated, which could result in differences between the value of the Fund’s portfolio securities on the last business day and the last calendar day of the reporting period. Any significant security valuation changes due to an open foreign market are adjusted and reflected by the Fund for financial reporting purposes.
b. Securities Lending
The Fund participates in an agency based securities lending program to earn additional income. The Fund receives cash collateral against the loaned securities in an amount equal to at least 102% of the fair value of the loaned securities. Collateral is maintained over the life of the loan in an amount not less than 100% of the fair value of loaned securities, as determined at the close of Fund business each day; any additional collateral required due to changes in security values is delivered to the Fund on the next business day. The collateral is deposited into a joint cash account with other funds and is used to invest in a money market fund managed by Franklin Advisers, Inc., an affiliate of the Fund. The Fund may receive income from the investment of cash collateral, in addition to lending fees and rebates paid by the borrower. Income from securities loaned, net of fees paid to the securities lending agent and/or third-party vendor, is reported separately in the Statement of Operations. The Fund bears the market risk with respect to the collateral investment, securities loaned, and the risk that the agent may default on its obligations to the Fund. If the borrower defaults on its obligation to return the securities loaned, the Fund has the right to repurchase the securities in the open market using the collateral received. The securities lending agent has agreed to indemnify the Fund in the event of default by a third party borrower.
c. Income and Deferred Taxes
It is the Fund’s policy to qualify as a regulated investment company under the Internal Revenue Code. The Fund intends to distribute to shareholders substantially all of its taxable income and net realized gains to relieve it from federal income and if applicable, excise taxes. As a result, no provision for U.S. federal income taxes is required.
The Fund may be subject to foreign taxation related to income received, capital gains on the sale of securities and certain foreign currency transactions in the foreign jurisdictions in which it invests. Foreign taxes, if any, are
recorded based on the tax regulations and rates that exist in the foreign markets in which the Fund invests. When a capital gain tax is determined to apply, the Fund records an estimated deferred tax liability in an amount that would be payable if the securities were disposed of on the valuation date.
The Fund may recognize an income tax liability related to its uncertain tax positions under U.S. GAAP when the uncertain tax position has a less than 50% probability that it will be sustained upon examination by the tax authorities based on its technical merits. As of June 30, 2019, the Fund has determined that no tax liability is required in its financial statements related to uncertain tax positions for any open tax years (or expected to be taken in future tax years). Open tax years are those that remain subject to examination and are based on the statute of limitations in each jurisdiction in which the Fund invests.
d. Security Transactions, Investment Income, Expenses and Distributions
Security transactions are accounted for on trade date. Realized gains and losses on security transactions are determined on a specific identification basis. Estimated expenses are accrued daily. Dividend income is recorded on theex-dividend date except for certain dividends from securities where the dividend rate is not available. In such cases, the dividend is recorded as soon as the information is received by the Fund. Distributions to shareholders are recorded on theex-dividend date. Distributable earnings are determined according to income tax regulations (tax basis) and may differ from earnings recorded in accordance with U.S. GAAP. These differences may be permanent or temporary. Permanent differences are reclassified among capital accounts to reflect their tax character. These reclassifications have no impact on net assets or the results of operations. Temporary differences are not reclassified, as they may reverse in subsequent periods.
Common expenses incurred by the Trust are allocated among the Funds based on the ratio of net assets of each Fund to the combined net assets of the Trust or based on the ratio of number of shareholders of each Fund to the combined number of shareholders of the Trust. Fund specific expenses are charged directly to the Fund that incurred the expense.
Realized and unrealized gains and losses and net investment income, excluding class specific expenses, are allocated daily to each class of shares based upon the relative proportion of
FRANKLIN TEMPLETON VARIABLE INSURANCE PRODUCTS TRUST
NOTES TO FINANCIAL STATEMENTS (UNAUDITED)
Franklin Flex Cap Growth VIP Fund(continued)
1. Organization and Significant Accounting Policies(continued)
d. Security Transactions, Investment Income, Expenses and Distributions(continued)
net assets of each class. Differences in per share distributions by class are generally due to differences in class specific expenses.
e. Accounting Estimates
The preparation of financial statements in accordance with U.S. GAAP requires management to make estimates and assumptions that affect the reported amounts of assets and liabilities at the date of the financial statements and the amounts of income and expenses during the reporting period. Actual results could differ from those estimates.
f. Guarantees and Indemnifications
Under the Trust’s organizational documents, its officers and trustees are indemnified by the Trust against certain liabilities arising out of the performance of their duties to the Trust. Additionally, in the normal course of business, the Trust, on behalf of the Fund, enters into contracts with service providers that contain general indemnification clauses. The Trust’s maximum exposure under these arrangements is unknown as this would involve future claims that may be made against the Trust that have not yet occurred. Currently, the Trust expects the risk of loss to be remote.
2. Shares of Beneficial Interest
At June 30, 2019, there were an unlimited number of shares authorized (without par value). Transactions in the Fund’s shares were as follows:
| | | | | | | | | | | | | | | | |
| | |
| | | Six Months Ended June 30, 2019 | | | Year Ended December 31, 2018 | |
| | | | |
| | | | |
| | | Shares | | | Amount | | | Shares | | | Amount | |
| |
| | | | |
| Class 2 Shares: | | | | | | | | | | | | | | | | |
Shares sold | | | 2,714,443 | | | $ | 20,070,664 | | | | 2,321,138 | | | $ | 17,811,401 | |
Shares issued in reinvestment of distributions | | | 606,105 | | | | 4,527,604 | | | | 2,079,248 | | | | 15,220,091 | |
Shares redeemed | | | (1,625,580 | ) | | | (11,979,320 | ) | | | (4,549,773 | ) | | | (32,616,619) | |
| | | | |
| | | | |
Net increase (decrease) | | | 1,694,968 | | | $ | 12,618,948 | | | | (149,387 | ) | | $ | 414,873 | |
| | | | |
| Class 4 Shares: | | | | | | | | | | | | | | | | |
Shares sold | | | 232,995 | | | $ | 1,678,368 | | | | 1,392,557 | | | $ | 10,306,262 | |
Shares issued in reinvestment of distributions | | | 226,018 | | | | 1,613,765 | | | | 816,812 | | | | 5,742,189 | |
Shares redeemed | | | (827,911 | ) | | | (5,894,411 | ) | | | (1,595,007 | ) | | | (11,578,945) | |
| | | | |
| | | | |
Net increase (decrease) | | | (368,898 | ) | | $ | (2,602,278 | ) | | | 614,362 | | | $ | 4,469,506 | |
| | | | |
3. Transactions with Affiliates
Franklin Resources, Inc. is the holding company for various subsidiaries that together are referred to as Franklin Templeton. Certain officers and trustees of the Fund are also officers and/or directors of the following subsidiaries:
| | |
| |
| Subsidiary | | Affiliation |
Franklin Advisers, Inc. (Advisers) | | Investment manager |
Franklin Templeton Services, LLC (FT Services) | | Administrative manager |
Franklin Templeton Distributors, Inc. (Distributors) | | Principal underwriter |
Franklin Templeton Investor Services, LLC (Investor Services) | | Transfer agent |
FRANKLIN TEMPLETON VARIABLE INSURANCE PRODUCTS TRUST
NOTES TO FINANCIAL STATEMENTS (UNAUDITED)
Franklin Flex Cap Growth VIP Fund(continued)
a. Management Fees
The Fund pays an investment management fee to Advisers based on the average daily net assets of the Fund as follows:
| | | | |
| Annualized Fee Rate | | Net Assets | | |
| | |
| 1.000% | | Up to and including $100 million | | |
| | |
| 0.900% | | Over $100 million, up to and including $250 million | | |
| | |
| 0.850% | | Over $250 million, up to and including $10 billion | | |
| | |
| 0.800% | | Over $10 billion, up to and including $12.5 billion | | |
| | |
| 0.775% | | Over $12.5 billion, up to and including $15 billion | | |
| | |
| 0.750% | | In excess of $15 billion | | |
For the period ended June 30, 2019, the annualized gross effective investment management fee rate was 0.982% of the Fund’s average daily net assets.
b. Administrative Fees
Under an agreement with Advisers, FT Services provides administrative services to the Fund. The fee is paid by Advisers based on the Fund’s average daily net assets, and is not an additional expense of the Fund.
c. Distribution Fees
The Board has adopted distribution plans for Class 2 and Class 4 shares pursuant to Rule12b-1 under the 1940 Act. Under the Fund’s compensation distribution plans, the Fund pays Distributors for costs incurred in connection with the servicing, sale and distribution of the Fund’s shares up to 0.35% per year of its average daily net assets of Class 2 and Class 4, respectively. The Board has agreed to limit the current rate to 0.25% per year for Class 2. The plan year, for purposes of monitoring compliance with the maximum annual plan rates, is February 1 through January 31.
d. Transfer Agent Fees
Investor Services, under terms of an agreement, performs shareholder servicing for the Fund and is not paid by the Fund for the services.
e. Investments in Affiliated Management Investment Companies
The Fund invests in one or more affiliated management investment companies for purposes other than exercising a controlling influence over the management or policies. Management fees paid by the Fund are waived on assets invested in the affiliated management investment companies, as noted in the Statement of Operations, in an amount not to exceed the management and administrative fees paid directly or indirectly by each affiliate. During the period ended June 30, 2019, the Fund held investments in affiliated management investment companies as follows:
| | | | | | | | | | | | | | | | | | | | | | | | | | | | | | | | |
| | | Value at
Beginning
of Period | | | Purchases | | | Sales | | | Realized
Gain (Loss) | | | Net Change in
Unrealized
Appreciation
(Depreciation) | | | Value at
End of
Period | | | Number of
Shares
Held at End
of Period | | | Investment
Income | |
| |
| | | | | | | | |
| Non-Controlled Affiliates | | | | | | | | | | | | | | | | | | | | | | | | | | | | | | | | |
| | | | | | | | | | | | | | | | | | | | | | | | | | | | | | | Dividends | |
Institutional Fiduciary Trust Money Market Portfolio, 2.05% | | | $ 639 | | | $ | 22,071,025 | | | $ | (22,070,978 | ) | | | $ — | | | | $ — | | | $ | 686 | | | | 686 | | | | $58,193 | |
FRANKLIN TEMPLETON VARIABLE INSURANCE PRODUCTS TRUST
NOTES TO FINANCIAL STATEMENTS (UNAUDITED)
Franklin Flex Cap Growth VIP Fund(continued)
3. Transactions with Affiliates(continued)
e. Investments in Affiliated Management Investment Companies(continued)
| | | | | | | | | | | | | | | | | | | | | | | | | | | | | | | | |
| | | Value at
Beginning
of Period | | | Purchases | | | Sales | | | Realized
Gain (Loss) | | | Net Change in
Unrealized
Appreciation
(Depreciation) | | | Value at
End of
Period | | | Number of
Shares
Held at End
of Period | | | Investment
Income | |
| |
| | | | | | |
| Non-Controlled Affiliates(continued) | | | | | | | | | | | | | | | | | | | | | | | | | |
| | | | | | | | | | | | | | | | | | | | | | | | | | | | | |
| Income from
securities
loaned |
|
| | | | | | | | | | | | |
Institutional Fiduciary Trust Money Market Portfolio, 2.05% | | | $107,250 | | | $ | 6,404,390 | | | $ | (5,873,940) | | | | $ — | | | | $ — | | | $ | 637,700 | | | | 637,700 | | | | $ 7,489 | |
| | | | | | | | | | | | |
| | | | | | | | |
Total Affiliated Securities | | | $107,889 | | | $ | 28,475,415 | | | $ | (27,944,918 | ) | | | $ — | | | | $ — | | | $ | 638,386 | | | | | | | | $ 65,682 | |
| | | | | | | | | | | | |
f. Waiver and Expense Reimbursements
Advisers have contractually agreed in advance to waive or limit its fees and to assume as its own expense certain expenses otherwise payable by the Fund so that the expenses (excluding distribution fees and acquired fund fees and expenses and certainnon-routine expenses or costs, including those relating to litigation, indemnification, reorganizations, and liquidations) for each class of the Fund does not exceed 0.71% based on the average net assets of each class until April 30, 2020. Total expenses waived or paid are not subject to recapture subsequent to the Fund’s fiscal year end.
4. Expense Offset Arrangement
The Fund has entered into an arrangement with its custodian whereby credits realized as a result of uninvested cash balances are used to reduce a portion of the Fund’s custodian expenses. During the period ended June 30, 2019, there were no credits earned.
5. Income Taxes
At June 30, 2019, the cost of investments and net unrealized appreciation (depreciation) for income tax purposes were as follows:
| | | | |
Cost of investments | | | $66,333,636 | |
| | | | |
| |
Unrealized appreciation | | | $61,856,322 | |
Unrealized depreciation | | | (552,014 | ) |
| | | | |
| |
Net unrealized appreciation (depreciation) | | | $61,304,308 | |
| | | | |
Differences between income and/or capital gains as determined on a book basis and a tax basis are primarily due to differing treatment of passive foreign investment company shares.
6. Investment Transactions
Purchases and sales of investments (excluding short term securities) for the period ended June 30, 2019, aggregated $13,682,051 and $7,710,514, respectively.
FRANKLIN TEMPLETON VARIABLE INSURANCE PRODUCTS TRUST
NOTES TO FINANCIAL STATEMENTS (UNAUDITED)
Franklin Flex Cap Growth VIP Fund(continued)
At June 30, 2019, in connection with securities lending transactions, the Fund loaned equity investments and received $637,700 of cash collateral. The gross amount of recognized liability for such transactions is included in payable upon return of securities loaned in the Statement of Assets and Liabilities. The agreements can be terminated at any time.
7. Credit Facility
The Fund, together with other U.S. registered and foreign investment funds (collectively, Borrowers), managed by Franklin Templeton, are borrowers in a joint syndicated senior unsecured credit facility totaling $2 billion (Global Credit Facility) which matures on February 7, 2020. This Global Credit Facility provides a source of funds to the Borrowers for temporary and emergency purposes, including the ability to meet future unanticipated or unusually large redemption requests.
Under the terms of the Global Credit Facility, the Fund shall, in addition to interest charged on any borrowings made by the Fund and other costs incurred by the Fund, pay its share of fees and expenses incurred in connection with the implementation and maintenance of the Global Credit Facility, based upon its relative share of the aggregate net assets of all of the Borrowers, including an annual commitment fee of 0.15% based upon the unused portion of the Global Credit Facility. These fees are reflected in other expenses in the Statement of Operations. During the period ended June 30, 2019, the Fund did not use the Global Credit Facility.
8. Fair Value Measurements
The Fund follows a fair value hierarchy that distinguishes between market data obtained from independent sources (observable inputs) and the Fund’s own market assumptions (unobservable inputs). These inputs are used in determining the value of the Fund’s financial instruments and are summarized in the following fair value hierarchy:
| | • | Level 1 – quoted prices in active markets for identical financial instruments |
| | • | Level 2 – other significant observable inputs (including quoted prices for similar financial instruments, interest rates, prepayment speed, credit risk, etc.) |
| | • | Level 3 – significant unobservable inputs (including the Fund’s own assumptions in determining the fair value of financial instruments) |
The input levels are not necessarily an indication of the risk or liquidity associated with financial instruments at that level.
At June 30, 2019, all of the Fund’s investments in financial instruments carried at fair value were valued using Level 1 inputs. For detailed categories, see the accompanying Statement of Investments.
9. Subsequent Events
The Fund has evaluated subsequent events through the issuance of the financial statements and determined that no events have occurred that require disclosure.
Abbreviations
| | |
|
| Selected Portfolio |
| |
| ADR | | American Depositary Receipt |
This page intentionally left blank.
Franklin Global Real Estate VIP Fund
This semiannual report for Franklin Global Real Estate VIP Fund covers the period ended June 30, 2019.
Class 2 Performance Summary as of June 30, 2019
The Fund’s Class 2 Shares posted a +15.31% total return* for thesix-month period ended June 30, 2019.
*The Fund has an expense reduction contractually guaranteed through 4/30/20. Fund investment results reflect the expense reduction; without this reduction, the results would have been lower.
Performance reflects the Fund’s Class 2 operating expenses, but doesnotinclude any contract fees, expenses or sales charges. If they had been included, performance would be lower. These charges and deductions, particularly for variable life policies, can have a significant effect on contract values and insurance benefits. See the contract prospectus for a complete description of these expenses, including sales charges.
Performance data represent past performance, which does not guarantee future results. Investment return and principal value will fluctuate, and you may have a gain or loss when you sell your shares. Current performance may differ from figures shown.
FRANKLIN GLOBAL REAL ESTATE VIP FUND
Fund Goal and Main Investments
The Fund seeks high total return. Under normal market conditions, the Fund invests at least 80% of its net assets in investments of companies located anywhere in the world that operate in the real estate sector, including: real estate investment trusts (REITs) and similar REIT-like entities domiciled outside the U.S.; companies qualifying under U.S. federal tax law as REITs; and companies that derive at least half of their assets or revenues from the ownership, management, development or sale of residential or commercial real estate (such as real estate operating or service companies).
|
What is a REIT? A REIT is a type of real estate company that is dedicated to owning and usually operating income-producing real estate properties such as apartments, hotels, industrial properties, office buildings or shopping centers. Equity REITs generally receive income from rents received, are generally operated by experienced property management teams and typically concentrate on a specific geographic region or property type. |
Fund Risks
All investments involve risks, including possible loss of principal. The Fund concentrates in real estate securities, which involve special risks, such as declines in the value of real estate and increased susceptibility to adverse economic or regulatory developments affecting the sector. The Fund’s investments in REITs involve additional risks; since REITs typically are invested in a limited number of projects or in a particular market segment, they are more susceptible to adverse developments affecting a single project or market segment than more broadly diversified investments. Foreign investing, especially in emerging markets, involves additional risks such as currency and market volatility, as well as political and social instability. The Fund is actively managed but there is no guarantee that the manager’s investment decisions will produce the desired results. The Fund’s prospectus also includes a description of the main investment risks.
Performance Overview
You can find the Fund’ssix-month total return in the Performance Summary. In comparison, the FTSE
Portfolio Composition
Based on Total Net Assets as of 6/30/19
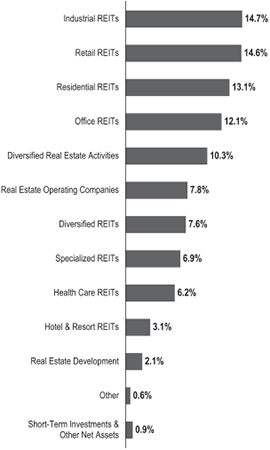
EPRA/NAREIT Developed Index posted a +15.09% total return for the same period.1
Economic and Market Overview
The global economy expanded during the six months ended June 30, 2019, despite weakness in certain regions. Global developed and emerging market stocks were aided by upbeat economic data in some regions, encouraging corporate earnings reports and periods of optimism about a potential U.S.-China trade deal. Further supporting markets were the U.S. Federal Reserve’s (Fed’s) patient approach to
1. Source: Morningstar. One cannot invest directly in an index, and an index is not representative of the Fund’s portfolio. Please see Index Descriptions following the Fund Summaries.
The dollar value, number of shares or principal amount, and names of all portfolio holdings are listed in the Fund’s Statement of Investments (SOI).
FRANKLIN GLOBAL REAL ESTATE VIP FUND
its monetary policy in 2019 and recent indication it will act as appropriate to sustain U.S. economic expansion.
However, markets reflected concerns about political uncertainties in the U.S. and the European Union, geopolitical risks in certain regions, and the impact of U.S. trade disputes with China and other trading partners on global growth and corporate earnings. In this environment, global developed and emerging market stocks, as measured by the MSCI All Country World Index, posted a +16.60% total return for thesix-month period.1
The U.S. economy grew during the six months ended June 30, 2019. After moderating for two consecutive quarters, the economy grew significantly faster in 2019’s first quarter, driven by growth in consumer spending, inventory investment, exports, business investment, and state and local government spending. However, the economy moderated again in the second quarter, due to weakness in inventory investment, exports, business investment and housing investment. The unemployment rate decreased from 3.9% in December 2018 to 3.7% atperiod-end.1 The annual inflation rate, as measured by the Consumer Price Index, decreased from 1.9% in December 2018 to 1.6% atperiod-end.2
The (Fed) held its target range for the federal funds rate unchanged, at 2.25%–2.50%, during the reporting period. In March, the Fed mentioned it would end its balance sheet normalization program by the end of September 2019. In June, the Fed indicated increased uncertainties around its views on economic activity and the labor market. With market-based inflation measures remaining low recently, the market has interpreted the Fed’s recent statements to mean it will likely cut rates in 2019’s second half to foster continued economic growth while attempting to achieve its inflation objective.
In Europe, the U.K.’s quarterly gross domestic product (GDP) growth accelerated in 2019’s first quarter. The Bank of England left its key policy rate unchanged during the period. The eurozone’s quarterly GDP accelerated in 2019’s first quarter. However, the bloc’s annual inflation rate decreased during the period. The European Central Bank (ECB) kept its benchmark interest rate unchanged during the period. In June, the ECB mentioned it would leave interest rates unchanged through the first half of 2020, provided details of its new stimulus, and indicated its openness to cut rates or increase stimulus.
Top 10 Countries
6/30/19
| | |
| |
| | | % of Total
Net Assets |
| |
U.S. | | 53.0% |
| |
Japan | | 10.8% |
| |
Hong Kong | | 8.0% |
| |
Australia | | 5.8% |
| |
U.K. | | 5.3% |
| |
Germany | | 4.0% |
| |
Singapore | | 3.2% |
| |
France | | 2.9% |
| |
Sweden | | 2.7% |
| |
Canada | | 2.2% |
In Asia, Japan’s quarterly GDP growth accelerated in 2019’s first quarter. In June, the Bank of Japan also left its benchmark interest rate unchanged, while continuing its stimulus measures, and expressed its openness to cut interest rates or increase stimulus.
In larger emerging markets, Brazil’s quarterly GDP growth contracted in 2019’s first quarter. The Central Bank of Brazil left its benchmark interest rate unchanged during the period. Russia’s annual GDP growth moderated in 2019’s first quarter. The Bank of Russia cut its key rate once during the reporting period. China’s annual GDP growth rate stabilized in 2019’s first quarter. The People’s Bank of China left its benchmark interest rate unchanged, but it took measures to improve financial liquidity to mitigate the effects of the U.S.-China trade dispute and support economic growth. Overall global, emerging market stocks, as measured by the MSCI Emerging Markets Index, posted a +10.78% total return during thesix-month period.1
Investment Strategy
We seek to limit price volatility by investing across markets and property types. When selecting investments for the Fund’s portfolio, we apply a“bottom-up” stock selection process that incorporates macro-level views in the evaluation process. Our portfolio construction process combinesbottom-up analysis of individual stock and real estate market fundamentals andtop-down macro overlays to provide country/regional, property type, and company size perspectives in identifying international/local cyclical and thematic trends that highlight investment opportunities.
2. Source: U.S. Bureau of Labor Statistics.
FRANKLIN GLOBAL REAL ESTATE VIP FUND
Manager’s Discussion
During the six months under review, key contributors to the Fund’s performance relative to the FTSE EPRA/NAREIT Developed Index included an overweighting and security selection in the industrial property sector.3 Shares of Rexford Industrial Realty, a small-capitalization industrial REIT based in Los Angeles, performed well during the reporting period. Like its peers among industrial REITs, Rexford benefited from existing strong fundamentals in this group, with healthy and steady tenant demand for warehouse/distribution space both from traditional and increasingly importante-commerce businesses. We like the company’s focused and unique strategy to grow via accretive acquisitions in its core market, infill Southern California where ownership of warehouses remains highly fragmented and the company does not face strong competition on its target acquisitions from larger industrial players. We also think this core market remains less susceptible to anypick-up in supply given lack of available land and difficulty of getting construction permits. Rexford’s recent core results remained strong with increased occupancy, above average same storenet-operating-income growth and double-digit rent spreads. For all these reasons, we believe Rexford’s earnings growth will continue to accelerate with strong internal and external growth (acquisitions) over the next 12 to 24 months.
Stock selection and an underweighting in the retail property sector also enhanced results, as did security selection in the office space sector, led by an underweighted investment in SL Green Realty (not held atperiod-end) as shares in the Manhattan office landlord underperformed over the reporting period.4 Similar to other New York City-centric office REITs, the stock has been under pressure for some time due to prevailing negative investor sentiment for Manhattan office fundamentals which we do not expect to improve meaningfully over the next 12 months, especially with supply deliveries in the near term. Additionally, despite strong leasing statistics, we do not expect positive net effective rent growth (after concessions and tenant improvements) for Manhattan office space. Despite the stock’s attractive valuation compared to current private asset values (based on recent transactions), we expect the stock will remain an underperformer. We also grew increasingly concerned about the company’s above average leverage metrics and near-term lease expirations in this environment.
A significant underweighting in Macerich (not held atperiod-end) also supported Fund relative returns as shares
Top 10 Holdings
6/30/19
| | |
| |
Company
Sector/Industry, Country | | % of Total
Net Assets |
| |
Prologis Inc. Industrial REITs, U.S. | | 4.5% |
| |
Simon Property Group Inc. Retail REITs, U.S. | | 3.6% |
| |
AvalonBay Communities Inc. Residential REITs, U.S. | | 2.9% |
| |
Equity Residential Residential REITs, U.S. | | 2.8% |
| |
Welltower Inc. Health Care REITs, U.S. | | 2.6% |
| |
Goodman Group Industrial REITs, Australia | | 2.5% |
| |
Sun Hung Kai Properties Ltd. Diversified Real Estate Activities, Hong Kong | | 2.4% |
| |
Mitsui Fudosan Co. Ltd. Diversified Real Estate Activities, Japan | | 2.4% |
| |
Mitsubishi Estate Co. Ltd. Diversified Real Estate Activities, Japan | | 2.2% |
| |
Segro PLC Industrial REITs, U.K. | | 2.1% |
in the company underperformed over the reporting period. Macerich is an owner of predominantlyA-quality regional malls in the U.S. with a significant presence on the West Coast, Arizona, Chicago and the Metro New York to Washington D.C. corridor. While we acknowledged the relatively high-quality nature of the company’s retail property portfolio, the outlook for the entire regional mall segment had eroded due to apick-up in retailer bankruptcy activity (including company liquidations) in the U.S. in early 2019, notably Gymboree, Payless Shoes and Charlotte Russe, among others (these companies are not held by the Fund). Furthermore, rationalization continued to occur in the department store category as well as store closing programs announced by larger retailer holding companies including GAP and L Brands (these companies are not held by the Fund). In addition to the associated downtime (as retailers vacate) and required capital expenditure in order tore-tenant, Macerich’s ability to absorb these pressures has been an increasing concern given its elevated leverage and the high payout ratio on its dividend, not to mention its relatively high exposure to weak department store chains,
3. Industrial property holdings are in industrial REITs in the SOI.
4. Retail property holdings are in retail REITs in the SOI. Office holdings are in office REITs in the SOI.
FRANKLIN GLOBAL REAL ESTATE VIP FUND
such as Sears and JC Penney (these companies are not held by the Fund). We have since exited the stock entirely.
Conversely, stock selection in the residential sector detracted from relative Fund performance5. Shares of Berlin apartment landlord Deutsche Wohnen underperformed during the reporting period. Overall, German residential stocks faced significant pressure after Berlin’s local government agreed on a five-year rent freeze and a draft law is expected in October on the matter. The draft law is questionable, in our view, as residential law is federal and governed by the German Civil Code. Deutsche Wohnen’s Berlin exposure by value is one of the highest in the sector. Overall, the Berlin residential market screened well with itssupply-and-demand mismatch, which had put upward pressure on rents, as vacancy in the market had decreased sharply. New supply in the market forlow-to-middle income housing is limited as portfolio valuations remain much below replacement costs. Berlin still offers low average rent levels compared to other larger western German cities and major cities in Europe. As of the first quarter report 2019, management saw a significant rent reversionary potential in the overall portfolio. We lowered our allocation to Deutsche Wohnen during the reporting period, as the political headwinds for the Berlin residential market created a high level of uncertainty for future rental growth and the potential impact to values.
Within the storage property sector, Public Storage, one of the largest REITs and the largest public storage REIT, performed well during the reporting period and the Fund’s underweight position dampened overall performance.6 Following several years of very strong fundamentals, storage revenue growth, albeit being stable, has been steadily declining toward a more normal (historical average) level. Nevertheless, recent results, came in better-than (low level) investor expectations. Despite better-than-expected results, and subsequent outperformance of storage REITs post first quarter results, we remain cautious on fundamentals over the next12-18 months as we expect to see increased supply deliveries and thus softer operating trends.
An underweighted investment in health care REIT Ventas (not held atperiod-end) also hampered relative results. Shares of Ventas, one of the largest health care REITs, performed well during the reporting period as the stock surged following the company’s recently held investor day, which successfully laid out a more visible earnings growth story and changed the prevailing negative investor sentiment for the company causing subsequent upgrades by several
key analysts. Ventas has a diversified business profile and is active on different health care segments including life-science, hospitals and medical office segments. Overall, our outlook for health care real estate operating trends remain unfavorable given above-average senior housing supply and ongoing issues in the skilled nursing segment. The company has been active on the external growth front lately especially in life-science, but given its large size, we do not expect significant additional earnings accretion following recently completed acquisitions.
Thank you for your participation in Franklin Global Real Estate VIP Fund. We look forward to serving your future investment needs.
The foregoing information reflects our analysis, opinions and portfolio holdings as of June 30, 2019, the end of the reporting period. The way we implement our main investment strategies and the resulting portfolio holdings may change depending on factors such as market and economic conditions. These opinions may not be relied upon as investment advice or an offer for a particular security. The information is not a complete analysis of every aspect of any market, country, industry, security or the Fund.
Statements of fact are from sources considered reliable, but the investment manager makes no representation or warranty as to their completeness or accuracy. Although historical performance is no guarantee of future results, these insights may help you understand our investment management philosophy.
5. Residential holdings are in real estate operating companies and residential REITs in the SOI.
6. Storage property holdings are in specialized REITs in the SOI.
FRANKLIN GLOBAL REAL ESTATE VIP FUND
Class 2 Fund Expenses
As an investor in a variable insurance contract (Contract) that indirectly provides for investment in an underlying mutual fund, you can incur transaction and/or ongoing expenses at both the Fund level and the Contract Level: (1) transaction expenses can include sales charges (loads) on purchases, surrender fees, transfer fees and premium taxes; and (2) ongoing expenses can include management fees, distribution and service(12b-1) fees, contract fees, annual maintenance fees, mortality and expense risk fees and other fees and expenses. All mutual funds and Contracts have some types of ongoing expenses. The table below shows Fund-level ongoing expenses and can help you understand these costs and compare them with those of other mutual funds offered through the Contract. The table assumes a $1,000 investment held for the six months indicated. Please refer to the Fund prospectus for additional information on operating expenses.
Actual Fund Expenses
The table below provides information about the actual account values and actual expenses in the columns under the heading “Actual.” In these columns the Fund’s actual return, which includes the effect of ongoing Fund expenses but does not include the effect of ongoing Contract expenses, is used to calculate the “Ending Account Value.” You can estimate the Fund-level expenses you paid during the period by following these steps (ofcourse, your account value and expenses will differ from those in this illustration):Divide your account value by $1,000 (ifyour account had an $8,600 value, then $8,600÷ $1,000 = 8.6). Then multiply the result by the number under the headings “Actual” and “Fund-Level Expenses Paid During Period” (ifFund-Level Expenses Paid During Period were $ 7.50, then 8.6 x $ 7.50 = $64.50). In this illustration, the estimated expenses paid this period at the Fund level are $64.50.
Hypothetical Example for Comparison with Other Mutual Funds
Under the heading “Hypothetical” in the table, information is provided about hypothetical account values and hypothetical expenses based on the Fund’s actual expense ratio and an assumed rate of return of 5% per year before expenses, which is not the Fund’s actual return. This information may not be used to estimate the actual ending account balance or expenses you paid for the period, but it can help you compare ongoing costs of investing in the Fund with those of other mutual funds offered through the Contract. To do so, compare this 5% hypothetical example with the 5% hypothetical examples that appear in the shareholder reports of other funds offered through the Contract.
Please note that expenses shown in the table are meant to highlight ongoing costs at the Fund level only and do not reflect any ongoing expenses at the Contract level, or transaction expenses at either the Fund or Contract levels. In addition, while the Fund does not have transaction expenses, if the transaction and ongoing expenses at the Contract level were included, the expenses shown below would be higher. You should consult your Contract prospectus or disclosure document for more information.
| | | | | | | | | | | | |
| | | | | Actual
(actual return after expenses) | | Hypothetical
(5% annual return before expenses) | | |
Share Class | | Beginning
Account
Value 1/1/19 | | Ending
Account
Value 6/30/19 | | Fund-Level
Expenses Paid During
Period 1/1/19–6/30/191,2 | | Ending Account Value 6/30/19 | | Fund-Level
Expenses Paid During Period 1/1/19–6/30/191,2 | | Net
Annualized
Expense
Ratio2 |
| | | | | | |
Class 2 | | $1,000 | | $1,153.10 | | $7.15 | | $1,018.15 | | $6.71 | | 1.34% |
1. Expenses are equal to the annualized expense ratio for thesix-month period as indicated above—in the far right column—multiplied by the simple average account value over the period indicated, and then multiplied by 181/365 to reflect theone-half year period.
2. Reflects expenses after fee waivers and expense reimbursements. Does not include any ongoing expenses of the Contract for which the Fund is an investment option or acquired fund fees and expenses.
FGR P1 P2 05/19
SUPPLEMENT DATED MAY 1, 2019
TO THE PROSPECTUSES
DATED MAY 1, 2019
OF
FRANKLIN GLOBAL REAL ESTATE VIP FUND
(a series of Franklin Templeton Variable Insurance Products Trust)
The prospectuses are amended as follows:
I. The “Fund Summary – Annual Fund Operating Expenses” table on pageFGR-S1 in the Fund’s Class 1 prospectus is replaced with the following:
Annual Fund Operating Expenses
(expenses that you pay each year as a percentage of the value of your investment)
| | | | |
| | | | Class 1 | |
| |
Management fees | | | 1.05% | |
| |
Distribution and service(12b-1) fees | | | None | |
| |
Other expenses | | | 0.10% | |
| |
Total annual Fund operating expenses | | | 1.15% | |
| |
Fee waiver and/or expense reimbursement1 | | | -0.15% | |
| |
Total annual Fund operating expenses after fee waiver and/or expense reimbursement1 | | | 1.00% | |
1. The investment manager has contractually agreed to waive or assume certain expenses so that common expenses (excluding Rule12b-1 fees, acquired fund fees and expenses and certainnon-routine expenses) do not exceed 1.00% until April 30, 2020. Contractual fee waiver and/or expense reimbursement agreements may not be changed or terminated during the time period set forth above.
II. The “Fund Summary – Example” table on pageFGR-S1 in the Fund’s Class 1 prospectus is replaced with the following:
Example
This Example is intended to help you compare the cost of investing in the Fund with the cost of investing in other mutual funds. The Example assumes that you invest $10,000 in the Fun for the time periods indicated and then redeem all of your shares at the end of the period. The Example also assumes that your investment has a 5% return each year and that the Fund’s operating expenses remain the same. The Example reflects adjustments made to the Fund’s operating expenses due to the fee waivers and/or expense reimbursements by management for the 1 Year numbers only.
Although your actual costs may be higher or lower, based on these assumptions your costs would be:
| | | | | | | | | | | | | | | | |
| | | 1 Year | | | 3 Years | | | 5 Years | | | 10 Years | |
| | | | |
Class 1 | | | $102 | | | | $350 | | | | $618 | | | | $1,384 | |
III. The “Fund Summary – Annual Fund Operating Expenses” table on pageFGR-S1 in the Fund’s Class 2 prospectus is replaced with the following:
Annual Fund Operating Expenses=
(expenses that you pay each year as a percentage of the value of your investment)
| | | | |
| | | | Class 2 | |
| |
Management fees | | | 1.05% | |
| |
Distribution and service(12b-1) fees | | | 0.25% | |
| |
Other expenses | | | 0.10% | |
| |
Total annual Fund operating expenses | | | 1.40% | |
| |
Fee waiver and/or expense reimbursement1 | | | -0.15% | |
| |
Total annual Fund operating expenses after fee waiver and/or expense reimbursement1 | | | 1.25% | |
1. The investment manager has contractually agreed to waive or assume certain expenses so that common expenses (excluding Rule12b-1 fees, acquired fund fees and expenses and certainnon-routine expenses) do not exceed 1.00% until April 30, 2020. Contractual fee waiver and/or expense reimbursement agreements may not be changed or terminated during the time period set forth above.
IV. The “Fund Summary – Example” table on pageFGR-S1 in the Fund’s Class 2 prospectus is replaced with the following:
Example
This Example is intended to help you compare the cost of investing in the Fund with the cost of investing in other mutual funds. The Example assumes that you invest $10,000 in the Fund for the time periods indicated and then redeem all of your shares at the end of the period. The Example also assumes that your investment has a 5% return each year and that the Fund’s operating expenses remain the same. The Example reflects adjustments made to the Fund’s operating expenses due to the fee waivers and/or expense reimbursements by management for the 1 Year numbers only. Although your actual costs may be higher or lower, based on these assumptions your costs would be:
| | | | | | | | | | | | | | | | |
| | | 1 Year | | | 3 Years | | | 5 Years | | | 10 Years | |
| | | | |
Class 2 | | | $127 | | | | $428 | | | | $752 | | | | $1,667 | |
Please keep this supplement with your prospectus for future reference.
FRANKLIN TEMPLETON VARIABLE INSURANCE PRODUCTS TRUST
Financial Highlights
Franklin Global Real Estate VIP Fund
| | | | | | | | | | | | | | | | | | | | | | | | |
| | | Six Months Ended
June 30, 2019 (unaudited) | | | Year Ended December 31, | |
| | | 2018 | | | 2017 | | | 2016 | | | 2015 | | | 2014 | |
| |
| | | | | | |
| Class 1 | | | | | | | | | | | | | | | | | | | | | | | | |
| | | | | | |
Per share operating performance
(for a share outstanding throughout the period) | | | | | | | | | | | | | | | | | | | | | | | | |
| | | | | | |
Net asset value, beginning of period | | | $15.41 | | | | $16.96 | | | | $15.83 | | | | $15.93 | | | | $16.36 | | | | $14.29 | |
| | | | |
| | | | | | |
| Income from investment operationsa: | | | | | | | | | | | | | | | | | | | | | | | | |
| | | | | | |
Net investment incomeb | | | 0.14 | | | | 0.33 | | | | 0.17 | | | | 0.30c | | | | 0.24 | | | | 0.26 | |
| | | | | | |
Net realized and unrealized gains (losses) | | | 2.24 | | | | (1.41 | ) | | | 1.52 | | | | (0.16 | ) | | | (0.12 | ) | | | 1.92 | |
| | | | |
| | | | | | |
Total from investment operations | | | 2.38 | | | | (1.08 | ) | | | 1.69 | | | | 0.14 | | | | 0.12 | | | | 2.18 | |
| | | | |
Less distributions from: | | | | | | | | | | | | | | | | | | | | | | | | |
| | | | | | |
Net investment income | | | (0.50 | ) | | | (0.47 | ) | | | (0.56 | ) | | | (0.24 | ) | | | (0.55 | ) | | | (0.11) | |
| | | | | | |
Net realized gains | | | (0.36 | ) | | | — | | | | — | | | | — | | | | — | | | | — | |
| | | | |
| | | | | | |
Total distributions | | | (0.86 | ) | | | (0.47 | ) | | | (0.56 | ) | | | (0.24 | ) | | | (0.55 | ) | | | (0.11) | |
| | | | |
| | | | | | |
Net asset value, end of period | | | $16.93 | | | | $15.41 | | | | $16.96 | | | | $15.83 | | | | $15.93 | | | | $16.36 | |
| | | | |
| | | | | | |
Total returnd | | | 15.39% | | | | (6.52)% | | | | 10.76% | | | | 0.81% | | | | 0.83% | | | | 15.27% | |
| | | |
| Ratios to average net assetse | | | | | | | | | | | | | |
| | | | | | |
Expenses before waiver and payments by affiliates | | | 1.14% | | | | 1.15% | | | | 1.14% | | | | 1.11% | | | | 1.11% | | | | 1.10% | |
| | | | | | |
Expenses net of waiver and payments by affiliates | | | 1.09% | f | | | 1.15%f | | | | 1.14% | g | | | 1.11%g | | | | 1.11% | | | | 1.10%f | |
| | | | | | |
Net investment income | | | 1.56% | | | | 1.92% | | | | 1.04% | | | | 1.99%c | | | | 1.49% | | | | 1.66% | |
| | | |
| Supplemental data | | | | | | | | | | | | | |
| | | | | | |
Net assets, end of period (000’s) | | | $1,000 | | | | $878 | | | | $819 | | | | $821 | | | | $32,161 | | | | $35,686 | |
| | | | | | |
Portfolio turnover rate | | | 20.02% | | | | 17.78% | | | | 22.18% | | | | 28.53% | h | | | 23.35% | | | | 16.67% | |
aThe amount shown for a share outstanding throughout the period may not correlate with the Statement of Operations for the period due to the timing of sales and repurchases of the Fund’s shares in relation to income earned and/or fluctuating fair value of the investments of the Fund.
bBased on average daily shares outstanding.
cNet investment income per share includes approximately $0.06 per share related to income received in the form of special dividends in connection with certain Fund holdings. Excluding this amount, the ratio of net investment income to average net assets would have been 1.59%.
dTotal return does not include fees, charges or expenses imposed by the variable annuity and life insurance contracts for which Franklin Templeton Variable Insurance Products Trust serves as an underlying investment vehicle. Total return is not annualized for periods less than one year.
eRatios are annualized for periods less than one year.
fBenefit of expense reduction rounds to less than 0.01%.
gBenefit of waiver and payments by affiliates rounds to less than 0.01%.
hExcludes the value of portfolio securities delivered as a result of a redemptionin-kind.
| | | | | | |
| | | |
| | The accompanying notes are an integral part of these financial statements. | Semiannual Report | | | FGR-9 | |
FRANKLIN TEMPLETON VARIABLE INSURANCE PRODUCTS TRUST
FINANCIAL HIGHLIGHTS
Franklin Global Real Estate VIP Fund(continued)
| | | | | | | | | | | | | | | | | | | | | | | | |
| | | Six Months Ended
June 30, 2019 (unaudited) | | | Year Ended December 31, | |
| | | 2018 | | | 2017 | | | 2016 | | | 2015 | | | 2014 | |
| |
| | | | | | |
Class 2 | | | | | | | | | | | | | | | | | | | | | | | | |
| | | | | | |
Per share operating performance
(for a share outstanding throughout the period) | | | | | | | | | | | | | | | | | | | | | | | | |
| | | | | | |
Net asset value, beginning of period | | | $15.00 | | | | $16.52 | | | | $15.42 | | | | $15.52 | | | | $15.95 | | | | $13.93 | |
| | | | |
| | | | | | |
| Income from investment operationsa: | | | | | | | | | | | | | | | | | | | | | | | | |
| | | | | | |
Net investment incomeb | | | 0.11 | | | | 0.27 | | | | 0.13 | | | | 0.28c | | | | 0.20 | | | | 0.21 | |
| | | | | | |
Net realized and unrealized gains (losses) | | | 2.20 | | | | (1.36 | ) | | | 1.47 | | | | (0.19 | ) | | | (0.12 | ) | | | 1.88 | |
| | | | |
| | | | | | |
Total from investment operations | | | 2.31 | | | | (1.09 | ) | | | 1.60 | | | | 0.09 | | | | 0.08 | | | | 2.09 | |
| | | | |
| | | | | | |
Less distributions from: | | | | | | | | | | | | | | | | | | | | | | | | |
| | | | | | |
Net investment income | | | (0.46 | ) | | | (0.43 | ) | | | (0.50 | ) | | | (0.19 | ) | | | (0.51 | ) | | | (0.07) | |
| | | | | | |
Net realized gains | | | (0.36 | ) | | | — | | | | — | | | | — | | | | — | | | | — | |
| | | | |
| | | | | | |
Total distributions | | | (0.82 | ) | | | (0.43 | ) | | | (0.50 | ) | | | (0.19 | ) | | | (0.51 | ) | | | (0.07) | |
| | | | |
| | | | | | |
Net asset value, end of period | | | $16.49 | | | | $15.00 | | | | $16.52 | | | | $15.42 | | | | $15.52 | | | | $15.95 | |
| | | | |
| | | | | | |
Total returnd | | | 15.31% | | | | (6.77)% | | | | 10.47% | | | | 0.54% | | | | 0.57% | | | | 15.01% | |
| | | | | | |
| Ratios to average net assetse | | | | | | | | | | | | | | | | | | | | | | | | |
| | | | | | |
Expenses before waiver and payments by affiliates | | | 1.39% | | | | 1.40% | | | | 1.39% | | | | 1.36% | | | | 1.36% | | | | 1.35% | |
| | | | | | |
Expenses net of waiver and payments by affiliates | | | 1.34% | f | | | 1.40% | f | | | 1.39% | g | | | 1.36% | g | | | 1.36% | | | | 1.35%f | |
| | | | | | |
Net investment income | | | 1.31% | | | | 1.67% | | | | 0.79% | | | | 1.74%c | | | | 1.24% | | | | 1.41% | |
| | | | | | |
| Supplemental data | | | | | | | | | | | | | | | | | | | | | | | | |
| | | | | | |
Net assets, end of period (000’s) | | | $157,620 | | | | $146,408 | | | | $183,532 | | | | $193,707 | | | | $287,473 | | | | $333,554 | |
| | | | | | |
Portfolio turnover rate | | | 20.02% | | | | 17.78% | | | | 22.18% | | | | 28.53% | h | | | 23.35% | | | | 16.67% | |
aThe amount shown for a share outstanding throughout the period may not correlate with the Statement of Operations for the period due to the timing of sales and repurchases of the Fund’s shares in relation to income earned and/or fluctuating fair value of the investments of the Fund.
bBased on average daily shares outstanding.
cNet investment income per share includes approximately $0.06 per share related to income received in the form of special dividends in connection with certain Fund holdings. Excluding this amount, the ratio of net investment income to average net assets would have been 1.34%.
dTotal return does not include fees, charges or expenses imposed by the variable annuity and life insurance contracts for which Franklin Templeton Variable Insurance Products Trust serves as an underlying investment vehicle. Total return is not annualized for periods less than one year.
eRatios are annualized for periods less than one year.
fBenefit of expense reduction rounds to less than 0.01%.
gBenefit of waiver and payments by affiliates rounds to less than 0.01%.
hExcludes the value of portfolio securities delivered as a result of a redemptionin-kind.
| | | | |
| | | |
FGR-10 | | Semiannual Report | The accompanying notes are an integral part of these financial statements. | | |
FRANKLIN TEMPLETON VARIABLE INSURANCE PRODUCTS TRUST
Statement of Investments, June 30, 2019 (unaudited)
Franklin Global Real Estate VIP Fund
| | | | | | | | | | |
| | | Country | | Shares | | | Value | |
| |
| | | |
Common Stocks 99.1% | | | | | | | | | | |
Diversified Real Estate Activities 10.3% | | | | | | | | | | |
CapitaLand Ltd. | | Singapore | | | 749,095 | | | $ | 1,954,041 | |
Mitsubishi Estate Co. Ltd. | | Japan | | | 190,956 | | | | 3,550,981 | |
Mitsui Fudosan Co. Ltd. | | Japan | | | 155,478 | | | | 3,767,263 | |
New World Development Co. Ltd. | | Hong Kong | | | 1,335,585 | | | | 2,089,162 | |
Nomura Real Estate Holdings Inc. | | Japan | | | 52,500 | | | | 1,127,713 | |
Sun Hung Kai Properties Ltd. | | Hong Kong | | | 226,671 | | | | 3,844,512 | |
| | | | | | | | | | |
| | | |
| | | | | | | | | 16,333,672 | |
| | | | | | | | | | |
Diversified REITs 7.6% | | | | | | | | |
Gecina SA | | France | | | 16,712 | | | | 2,500,273 | |
GPT Group | | Australia | | | 497,329 | | | | 2,146,966 | |
Hulic REIT Inc. | | Japan | | | 846 | | | | 1,468,064 | |
Kenedix Office Investment Corp. | | Japan | | | 257 | | | | 1,837,757 | |
Land Securities Group PLC | | United Kingdom | | | 145,010 | | | | 1,534,383 | |
Premier Investment Corp. | | Japan | | | 954 | | | | 1,254,658 | |
VEREIT Inc. | | United States | | | 151,200 | | | | 1,362,312 | |
| | | | | | | | | | |
| | | |
| | | | | | | | | 12,104,413 | |
| | | | | | | | | | |
Health Care REITs 6.2% | | | | | | | | |
CareTrust REIT Inc. | | United States | | | 47,100 | | | | 1,120,038 | |
HCP Inc. | | United States | | | 101,989 | | | | 3,261,608 | |
Physicians Realty Trust | | United States | | | 73,800 | | | | 1,287,072 | |
Welltower Inc. | | United States | | | 50,976 | | | | 4,156,073 | |
| | | | | | | | | | |
| | | |
| | | | | | | | | 9,824,791 | |
| | | | | | | | | | |
Hotel & Resort REITs 3.1% | | | | | | | | |
Host Hotels & Resorts Inc. | | United States | | | 127,006 | | | | 2,314,049 | |
MGM Growth Properties LLC, A | | United States | | | 41,400 | | | | 1,268,910 | |
Ryman Hospitality Properties Inc. | | United States | | | 16,900 | | | | 1,370,421 | |
| | | | | | | | | | |
| | | |
| | | | | | | | | 4,953,380 | |
| | | | | | | | | | |
| | |
Hotels, Resorts & Cruise Lines 0.6% | | | | | | | | |
Hilton Worldwide Holdings Inc. | | United States | | | 9,414 | | | | 920,124 | |
| | | | | | | | | | |
| | |
Industrial REITs 14.7% | | | | | | | | |
Americold Realty Trust | | United States | | | 52,200 | | | | 1,692,324 | |
First Industrial Realty Trust Inc. | | United States | | | 64,253 | | | | 2,360,655 | |
GLPJ-REIT | | Japan | | | 1,333 | | | | 1,518,201 | |
Goodman Group | | Australia | | | 367,478 | | | | 3,877,006 | |
Mapletree Logistics Trust | | Singapore | | | 1,109,971 | | | | 1,304,160 | |
Prologis Inc. | | United States | | | 89,469 | | | | 7,166,467 | |
Rexford Industrial Realty Inc. | | United States | | | 52,874 | | | | 2,134,523 | |
Segro PLC | | United Kingdom | | | 358,034 | | | | 3,320,112 | |
| | | | | | | | | | |
| | | |
| | | | | | | | | 23,373,448 | |
| | | | | | | | | | |
Office REITs 12.1% | | | | | | | | |
Alexandria Real Estate Equities Inc. | | United States | | | 20,421 | | | | 2,881,199 | |
Boston Properties Inc. | | United States | | | 23,485 | | | | 3,029,565 | |
Cousins Properties Inc. | | United States | | | 34,175 | | | | 1,236,110 | |
Derwent London PLC | | United Kingdom | | | 39,200 | | | | 1,551,208 | |
Dexus | | Australia | | | 291,219 | | | | 2,653,387 | |
FRANKLIN TEMPLETON VARIABLE INSURANCE PRODUCTS TRUST
STATEMENT OF INVESTMENTS (UNAUDITED)
Franklin Global Real Estate VIP Fund(continued)
| | | | | | | | | | |
| | | Country | | Shares | | | Value | |
| |
| | | |
Common Stocks(continued) | | | | | | | | | | |
Office REITs(continued) | | | | | | | | | | |
Highwoods Properties Inc. | | United States | | | 30,910 | | | $ | 1,276,583 | |
Ichigo Office REIT Investment | | Japan | | | 1,066 | | | | 1,011,424 | |
Inmobiliaria Colonial SA | | Spain | | | 179,176 | | | | 1,995,205 | |
Kilroy Realty Corp. | | United States | | | 27,244 | | | | 2,010,880 | |
ORIX JREIT Inc. | | Japan | | | 834 | | | | 1,520,723 | |
| | | | | | | | | | |
| | | |
| | | | | | | | | 19,166,284 | |
| | | | | | | | | | |
Real Estate Development 2.1% | | | | | | | | |
CK Asset Holdings Ltd. | | Hong Kong | | | 413,127 | | | | 3,233,773 | |
| | | | | | | | | | |
| | |
Real Estate Operating Companies 7.8% | | | | | | | | |
ADO Properties SA | | Germany | | | 12,516 | | | | 517,644 | |
Aroundtown SA | | Germany | | | 270,113 | | | | 2,225,087 | |
Deutsche Wohnen AG | | Germany | | | 55,165 | | | | 2,023,792 | |
Fabege AB | | Sweden | | | 128,997 | | | | 1,941,366 | |
Hemfosa Fastigheter AB | | Sweden | | | 133,183 | | | | 1,258,554 | |
Hufvudstaden AB, A | | Sweden | | | 63,960 | | | | 1,087,593 | |
Swire Properties Ltd. | | Hong Kong | | | 412,400 | | | | 1,665,511 | |
Vonovia SE | | Germany | | | 34,045 | | | | 1,625,571 | |
| | | | | | | | | | |
| | | |
| | | | | | | | | 12,345,118 | |
| | | | | | | | | | |
Residential REITs 13.1% | | | | | | | | |
American Homes 4 Rent, A | | United States | | | 85,100 | | | | 2,068,781 | |
AvalonBay Communities Inc. | | United States | | | 22,289 | | | | 4,528,679 | |
Camden Property Trust | | United States | | | 30,200 | | | | 3,152,578 | |
Canadian Apartment Properties REIT | | Canada | | | 53,175 | | | | 1,963,384 | |
Equity Lifestyle Properties Inc. | | United States | | | 22,358 | | | | 2,712,920 | |
Equity Residential | | United States | | | 58,533 | | | | 4,443,825 | |
Unite Group PLC | | United Kingdom | | | 156,057 | | | | 1,931,309 | |
| | | | | | | | | | |
| | | |
| | | | | | | | | 20,801,476 | |
| | | | | | | | | | |
Retail REITs 14.6% | | | | | | | | |
Brixmor Property Group Inc. | | United States | | | 93,100 | | | | 1,664,628 | |
CapitaLand Mall Trust | | Singapore | | | 935,800 | | | | 1,818,699 | |
Link REIT | | Hong Kong | | | 147,337 | | | | 1,810,558 | |
Realty Income Corp. | | United States | | | 43,117 | | | | 2,973,779 | |
Regency Centers Corp. | | United States | | | 31,639 | | | | 2,111,587 | |
Retail Properties of America Inc., A | | United States | | | 112,000 | | | | 1,317,120 | |
Scentre Group | | Australia | | | 246,939 | | | | 665,621 | |
Simon Property Group Inc. | | United States | | | 36,126 | | | | 5,771,490 | |
SmartCentres REIT | | Canada | | | 60,230 | | | | 1,527,191 | |
Spirit Realty Capital Inc. | | United States | | | 33,300 | | | | 1,420,578 | |
Unibail-Rodamco-Westfield | | France | | | 13,938 | | | | 2,087,634 | |
| | | | | | | | | | |
| | | |
| | | | | | | | | 23,168,885 | |
| | | | | | | | | | |
Specialized REITs 6.9% | | | | | | | | |
American Tower Corp. | | United States | | | 8,100 | | | | 1,656,045 | |
Coresite Realty Corp. | | United States | | | 7,769 | | | | 894,756 | |
CubeSmart | | United States | | | 68,793 | | | | 2,300,438 | |
Digital Realty Trust Inc. | | United States | | | 28,168 | | | | 3,317,909 | |
FRANKLIN TEMPLETON VARIABLE INSURANCE PRODUCTS TRUST
STATEMENT OF INVESTMENTS (UNAUDITED)
Franklin Global Real Estate VIP Fund(continued)
| | | | | | | | | | | | |
| | | | | Country | | Shares | | | Value | |
| | | |
| | Common Stocks(continued) | | | | | | | | |
| | | Specialized REITs(continued) | | | | | | | | |
| | Public Storage | | United States | | | 11,644 | | | $ | 2,773,251 | |
| | | | | | | | | | | | |
| | | | |
| | | | | | | | | | | 10,942,399 | |
| | | | | | | | | | | | |
| | | | |
| | Total Common Stocks (Cost $100,998,947) | | | | | | | | | 157,167,763 | |
| | | | | | | | | | | | |
| | | | |
| | | | | | | Principal
Amount | | | | |
| | Short Term Investments (Cost $931,155) 0.6% | | | | | | | | | | |
| | | |
| | | Repurchase Agreements 0.6% | | | | | | |
| | aJoint Repurchase Agreement, 2.451%, 7/01/19 (Maturity Value $931,346)
BNP Paribas Securities Corp. (Maturity Value $692,512)
Deutsche Bank Securities Inc. (Maturity Value $204,207)
HSBC Securities (USA) Inc. (Maturity Value $34,627)
Collateralized by U.S. Government Agency Securities, 4.00% - 4.50%, 7/15/40 - 3/20/49;
U.S. Treasury Bonds, 8.00%, 11/15/21; U.S. Treasury Notes, 1.50% - 3.125%, 5/15/21 - 8/15/26;
U.S. Treasury Notes, Index Linked, 0.875%, 1/15/29; and U.S. Treasury Strips, 8/15/22 - 6/15/35
(valued at $954,073) | | United States | | $ | 931,155 | | | | 931,155 | |
| | | | | | | | | | | | |
| | | |
| | Total Investments (Cost $101,930,102) 99.7% | | | | | | | 158,098,918 | |
| | | |
| | Other Assets, less Liabilities 0.3% | | | | | | | 520,875 | |
| | | | | | | | | | | | |
| | | |
| | Net Assets 100.0% | | | | | | $ | 158,619,793 | |
| | | | | | | | | | | | |
See Abbreviations on pageFGR-23.
aSee Note 1(c) regarding joint repurchase agreement.
| | | | |
| | | |
| | The accompanying notes are an integral part of these financial statements. | Semiannual Report | | FGR-13 |
FRANKLIN TEMPLETON VARIABLE INSURANCE PRODUCTS TRUST
FINANCIAL STATEMENTS
Statement of Assets and Liabilities
June 30, 2019 (unaudited)
| | | | |
| |
| | | Franklin Global
Real Estate VIP Fund | |
| |
Assets: | | | | |
Investments in securities: | | | | |
Cost - Unaffiliated issuers | | | $100,998,947 | |
Cost - Unaffiliated repurchase agreements | | | 931,155 | |
| | | | |
Value - Unaffiliated issuers | | | $157,167,763 | |
Value - Unaffiliated repurchase agreements | | | 931,155 | |
Cash | | | 32,309 | |
Receivables: | | | | |
Investment securities sold | | | 1,293,457 | |
Capital shares sold | | | 3,871 | |
Dividends | | | 848,695 | |
European Union tax reclaims | | | 102,138 | |
Other assets | | | 114 | |
| | | | |
Total assets | | | 160,379,502 | |
| | | | |
Liabilities: | | | | |
Payables: | | | | |
Investment securities purchased | | | 1,414,365 | |
Capital shares redeemed | | | 79,309 | |
Management fees | | | 119,517 | |
Distribution fees | | | 66,452 | |
Trustees’ fees and expenses | | | 140 | |
Accrued expenses and other liabilities | | | 79,926 | |
| | | | |
| |
Total liabilities | | | 1,759,709 | |
| | | | |
| |
Net assets, at value | | | $158,619,793 | |
| | | | |
Net assets consist of: | | | | |
Paid-in capital | | | $102,855,337 | |
Total distributable earnings (loss) | | | 55,764,456 | |
| | | | |
| |
Net assets, at value | | | $158,619,793 | |
| | | | |
Class 1: | | | | |
Net assets, at value | | | $ 999,802 | |
| | | | |
Shares outstanding | | | 59,040 | |
| | | | |
Net asset value and maximum offering price per share | | | $16.93 | |
| | | | |
Class 2: | | | | |
Net assets, at value | | | $157,619,991 | |
| | | | |
Shares outstanding | | | 9,557,898 | |
| | | | |
Net asset value and maximum offering price per share | | | $16.49 | |
| | | | |
| | | | |
| | | |
FGR-14 | | Semiannual Report | The accompanying notes are an integral part of these financial statements. | | |
FRANKLIN TEMPLETON VARIABLE INSURANCE PRODUCTS TRUST
FINANCIAL STATEMENTS
Statement of Operations
for the six months ended June 30, 2019 (unaudited)
| | | | |
| | | Franklin Global
Real Estate VIP Fund | |
| |
| |
Investment income: | | | | |
Dividends: (net of foreign taxes)* | | | | |
Unaffiliated issuers | | | $ 2,087,803 | |
Interest: | | | | |
Unaffiliated issuers | | | 6,657 | |
| | | | |
Total investment income | | | 2,094,460 | |
| | | | |
Expenses: | | | | |
Management fees (Note 3a) | | | 830,084 | |
Distribution fees: (Note 3c) | | | | |
Class 2 | | | 196,528 | |
Custodian fees (Note 4) | | | 5,099 | |
Reports to shareholders | | | 25,469 | |
Professional fees | | | 32,276 | |
Trustees’ fees and expenses | | | 644 | |
Other | | | 5,916 | |
| | | | |
Total expenses | | | 1,096,016 | |
Expense reductions (Note 4) | | | (19 | ) |
Expenses waived/paid by affiliates (Note 3e) | | | (37,174 | ) |
| | | | |
Net expenses | | | 1,058,823 | |
| | | | |
Net investment income | | | 1,035,637 | |
| | | | |
Realized and unrealized gains (losses): | | | | |
Net realized gain (loss) from: | | | | |
Investments: | | | | |
Unaffiliated issuers | | | 5,967,899 | |
Realized gain distributions from REITs | | | 466,789 | |
Foreign currency transactions | | | (5,085 | ) |
| | | | |
Net realized gain (loss) | | | 6,429,603 | |
| | | | |
Net change in unrealized appreciation (depreciation) on: | | | | |
Investments: | | | | |
Unaffiliated issuers | | | 14,775,925 | |
Translation of other assets and liabilities denominated in foreign currencies | | | (3,636 | ) |
| | | | |
Net change in unrealized appreciation (depreciation) | | | 14,772,289 | |
| | | | |
| |
Net realized and unrealized gain (loss) | | | 21,201,892 | |
| | | | |
| |
Net increase (decrease) in net assets resulting from operations | | | $22,237,529 | |
| | | | |
| | | | |
| |
*Foreign taxes withheld on dividends | | $ | 134,132 | |
| | | | |
| | | |
| | The accompanying notes are an integral part of these financial statements. | Semiannual Report | | FGR-15 |
FRANKLIN TEMPLETON VARIABLE INSURANCE PRODUCTS TRUST
FINANCIAL STATEMENTS
Statements of Changes in Net Assets
| | | | | | | | |
| | | Franklin Global Real Estate VIP Fund | |
| | | Six Months Ended
June 30, 2019
(unaudited) | | | Year Ended
December 31, 2018 | |
| |
| | |
Increase (decrease) in net assets: | | | | | | | | |
Operations: | | | | | | | | |
Net investment income | | | $ 1,035,637 | | | | $ 2,794,772 | |
Net realized gain (loss) | | | 6,429,603 | | | | 8,338,498 | |
Net change in unrealized appreciation (depreciation) | | | 14,772,289 | | | | (22,351,453 | ) |
| | | | |
| | |
Net increase (decrease) in net assets resulting from operations | | | 22,237,529 | | | | (11,218,183 | ) |
| | | | |
| | |
Distributions to shareholders: | | | | | | | | |
Class 1 | | | (48,761 | ) | | | (26,319 | ) |
Class 2 | | | (7,479,667 | ) | | | (4,381,023 | ) |
| | | | |
Total distributions to shareholders | | | (7,528,428 | ) | | | (4,407,342 | ) |
| | | | |
Capital share transactions: (Note 2) | | | | | | | | |
Class 1 | | | 34,256 | | | | 146,852 | |
Class 2 | | | (3,410,049 | ) | | | (21,586,275 | ) |
| | | | |
Total capital share transactions | | | (3,375,793 | ) | | | (21,439,423 | ) |
| | | | |
| | |
Net increase (decrease) in net assets | | | 11,333,308 | | | | (37,064,948 | ) |
| | |
Net assets: | | | | | | | | |
Beginning of period | | | 147,286,485 | | | | 184,351,433 | |
| | | | |
End of period | | | $158,619,793 | | | | $147,286,485 | |
| | | | |
| | | | |
| | | |
FGR-16 | | Semiannual Report | The accompanying notes are an integral part of these financial statements. | | |
FRANKLIN TEMPLETON VARIABLE INSURANCE PRODUCTS TRUST
Notes to Financial Statements (unaudited)
Franklin Global Real Estate VIP Fund
1. Organization and Significant Accounting Policies
Franklin Templeton Variable Insurance Products Trust (Trust) is registered under the Investment Company Act of 1940 (1940 Act) as anopen-end management investment company, consisting of eighteen separate funds and applies the specialized accounting and reporting guidance in U.S. Generally Accepted Accounting Principles (U.S. GAAP). Franklin Global Real Estate VIP Fund (Fund) is included in this report. Shares of the Fund are generally sold only to insurance company separate accounts to fund the benefits of variable life insurance policies or variable annuity contracts. At June 30, 2019, 84.1% of the Fund’s shares were held through one insurance company. Investment activities of these insurance company separate accounts could have a material impact on the Fund. The Fund offers two classes of shares: Class 1 and Class 2. Each class of shares may differ by its distribution fees, voting rights on matters affecting a single class and its exchange privilege.
The following summarizes the Fund’s significant accounting policies.
a. Financial Instrument Valuation
The Fund’s investments in financial instruments are carried at fair value daily. Fair value is the price that would be received to sell an asset or paid to transfer a liability in an orderly transaction between market participants on the measurement date. The Fund calculates the net asset value (NAV) per share each business day as of 4 p.m. Eastern time or the regularly scheduled close of the New York Stock Exchange (NYSE), whichever is earlier. Under compliance policies and procedures approved by the Trust’s Board of Trustees (the Board), the Fund’s administrator has responsibility for oversight of valuation, including leading the cross-functional Valuation Committee (VC). The Fund may utilize independent pricing services, quotations from securities and financial instrument dealers, and other market sources to determine fair value.
Equity securities listed on an exchange or on the NASDAQ National Market System are valued at the last quoted sale price or the official closing price of the day, respectively. Foreign equity securities are valued as of the close of trading on the foreign stock exchange on which the security is primarily traded, or as of 4 p.m. Eastern time. The value is then converted into its U.S. dollar equivalent at the foreign exchange rate in effect at 4 p.m. Eastern time on the day that the value of the security is determined.Over-the-counter
(OTC) securities are valued within the range of the most recent quoted bid and ask prices. Securities that trade in multiple markets or on multiple exchanges are valued according to the broadest and most representative market. Certain equity securities are valued based upon fundamental characteristics or relationships to similar securities.
Investments in repurchase agreements are valued at cost, which approximates fair value.
The Fund has procedures to determine the fair value of financial instruments for which market prices are not reliable or readily available. Under these procedures, the Fund primarily employs a market-based approach which may use related or comparable assets or liabilities, recent transactions, market multiples, book values, and other relevant information for the investment to determine the fair value of the investment. An income-based valuation approach may also be used in which the anticipated future cash flows of the investment are discounted to calculate fair value. Discounts may also be applied due to the nature or duration of any restrictions on the disposition of the investments. Due to the inherent uncertainty of valuations of such investments, the fair values may differ significantly from the values that would have been used had an active market existed.
Trading in securities on foreign securities stock exchanges and OTC markets may be completed before 4 p.m. Eastern time. In addition, trading in certain foreign markets may not take place on every Fund’s business day. Occasionally, events occur between the time at which trading in a foreign security is completed and 4 p.m. Eastern time that might call into question the reliability of the value of a portfolio security held by the Fund. As a result, differences may arise between the value of the Fund’s portfolio securities as determined at the foreign market close and the latest indications of value at 4 p.m. Eastern time. In order to minimize the potential for these differences, the VC monitors price movements following the close of trading in foreign stock markets through a series of country specific market proxies (such as baskets of American Depositary Receipts, futures contracts and exchange traded funds). These price movements are measured against established trigger thresholds for each specific market proxy to assist in determining if an event has occurred that may call into question the reliability of the values of the foreign securities held by the Fund. If such an event occurs, the securities may be valued using fair value procedures, which may include the use of independent pricing services.
FRANKLIN TEMPLETON VARIABLE INSURANCE PRODUCTS TRUST
NOTES TO FINANCIAL STATEMENTS (UNAUDITED)
Franklin Global Real Estate VIP Fund(continued)
1. Organization and Significant Accounting Policies(continued)
a. Financial Instrument Valuation(continued)
When the last day of the reporting period is anon-business day, certain foreign markets may be open on those days that the Fund’s NAV is not calculated, which could result in differences between the value of the Fund’s portfolio securities on the last business day and the last calendar day of the reporting period. Any significant security valuation changes due to an open foreign market are adjusted and reflected by the Fund for financial reporting purposes.
b. Foreign Currency Translation
Portfolio securities and other assets and liabilities denominated in foreign currencies are translated into U.S. dollars based on the exchange rate of such currencies against U.S. dollars on the date of valuation. The Fund may enter into foreign currency exchange contracts to facilitate transactions denominated in a foreign currency. Purchases and sales of securities, income and expense items denominated in foreign currencies are translated into U.S. dollars at the exchange rate in effect on the transaction date. Portfolio securities and assets and liabilities denominated in foreign currencies contain risks that those currencies will decline in value relative to the U.S. dollar. Occasionally, events may impact the availability or reliability of foreign exchange rates used to convert the U.S. dollar equivalent value. If such an event occurs, the foreign exchange rate will be valued at fair value using procedures established and approved by the Board.
The Fund does not separately report the effect of changes in foreign exchange rates from changes in market prices on securities held. Such changes are included in net realized and unrealized gain or loss from investments in the Statement of Operations.
Realized foreign exchange gains or losses arise from sales of foreign currencies, currency gains or losses realized between the trade and settlement dates on securities transactions and the difference between the recorded amounts of dividends, interest, and foreign withholding taxes and the U.S. dollar equivalent of the amounts actually received or paid. Net unrealized foreign exchange gains and losses arise from changes in foreign exchange rates on foreign denominated assets and liabilities other than investments in securities held at the end of the reporting period.
c. Joint Repurchase Agreement
The Fund enters into a joint repurchase agreement whereby its uninvested cash balance is deposited into a joint cash account with other funds managed by the investment manager or an affiliate of the investment manager and is used to invest in one or more repurchase agreements. The value and face amount of the joint repurchase agreement are allocated to the funds based on theirpro-rata interest. A repurchase agreement is accounted for as a loan by the Fund to the seller, collateralized by securities which are delivered to the Fund’s custodian. The fair value, including accrued interest, of the initial collateralization is required to be at least 102% of the dollar amount invested by the funds, with the value of the underlying securities marked to market daily to maintain coverage of at least 100%. Repurchase agreements are subject to the terms of Master Repurchase Agreements (MRAs) with approved counterparties (sellers). The MRAs contain various provisions, including but not limited to events of default and maintenance of collateral for repurchase agreements. In the event of default by either the seller or the Fund, certain MRAs may permit thenon-defaulting party to net andclose-out all transactions, if any, traded under such agreements. The Fund may sell securities it holds as collateral and apply the proceeds towards the repurchase price and any other amounts owed by the seller to the Fund in the event of default by the seller. This could involve costs or delays in addition to a loss on the securities if their value falls below the repurchase price owed by the seller. The joint repurchase agreement held by the Fund at period end, as indicated in the Statement of Investments, had been entered into on June 28, 2019.
d. Income and Deferred Taxes
It is the Fund’s policy to qualify as a regulated investment company under the Internal Revenue Code. The Fund intends to distribute to shareholders substantially all of its taxable income and net realized gains to relieve it from federal income and if applicable, excise taxes. As a result, no provision for U.S. federal income taxes is required.
The Fund may be subject to foreign taxation related to income received, capital gains on the sale of securities and certain foreign currency transactions in the foreign jurisdictions in which it invests. Foreign taxes, if any, are recorded based on the tax regulations and rates that exist in the foreign markets in which the Fund invests. When a capital
FRANKLIN TEMPLETON VARIABLE INSURANCE PRODUCTS TRUST
NOTES TO FINANCIAL STATEMENTS (UNAUDITED)
Franklin Global Real Estate VIP Fund(continued)
gain tax is determined to apply, the Fund records an estimated deferred tax liability in an amount that would be payable if the securities were disposed of on the valuation date.
As a result of several court cases, in certain countries across the European Union, the Fund filed additional tax reclaims for previously withheld taxes on dividends earned in those countries (EU reclaims). These additional filings are subject to various administrative proceedings by the local jurisdictions’ tax authorities within the European Union, as well as a number of related judicial proceedings. Income recognized, if any, for EU reclaims is reflected as other income in the Statement of Operations and any related receivable, if any, is reflected as European Union tax reclaims in the Statement of Assets and Liabilities. When uncertainty exists as to the ultimate resolution of these proceedings, the likelihood of receipt of these EU reclaims, and the potential timing of payment, no amounts are reflected in the financial statements. For U.S. income tax purposes, when EU reclaims are received by the Fund and the Fund previously passed foreign tax credit on to its shareholders, the Fund must either amend historic tax reporting to shareholders or enter into a closing agreement with the Internal Revenue Service (IRS) in order to pay the associated tax liability on behalf of the Fund’s shareholders.
The Fund may recognize an income tax liability related to its uncertain tax positions under U.S. GAAP when the uncertain tax position has a less than 50% probability that it will be sustained upon examination by the tax authorities based on its technical merits. As of June 30, 2019, the Fund has determined that no tax liability is required in its financial statements related to uncertain tax positions for any open tax years (or expected to be taken in future tax years). Open tax years are those that remain subject to examination and are based on the statute of limitations in each jurisdiction in which the Fund invests.
e. Security Transactions, Investment Income, Expenses and Distributions
Security transactions are accounted for on trade date. Realized gains and losses on security transactions are determined on a specific identification basis. Interest income and estimated expenses are accrued daily. Dividend income and realized gain distributions are recorded on theex-dividend date except for certain dividends from securities where the dividend rate is not available. In such cases, the
dividend is recorded as soon as the information is received by the Fund. Distributions to shareholders are recorded on theex-dividend date. Distributable earnings are determined according to income tax regulations (tax basis) and may differ from earnings recorded in accordance with U.S. GAAP. These differences may be permanent or temporary. Permanent differences are reclassified among capital accounts to reflect their tax character. These reclassifications have no impact on net assets or the results of operations. Temporary differences are not reclassified, as they may reverse in subsequent periods.
Common expenses incurred by the Trust are allocated among the Funds based on the ratio of net assets of each Fund to the combined net assets of the Trust or based on the ratio of number of shareholders of each Fund to the combined number of shareholders of the Trust. Fund specific expenses are charged directly to the Fund that incurred the expense.
Realized and unrealized gains and losses and net investment income, excluding class specific expenses, are allocated daily to each class of shares based upon the relative proportion of net assets of each class. Differences in per share distributions by class are generally due to differences in class specific expenses.
Distributions received by the Fund from certain securities may be a return of capital (ROC). Such distributions reduce the cost basis of the securities, and any distributions in excess of the cost basis are recognized as capital gains. For U.S. Real Estate Investment Trust (REIT) securities, the Fund records ROC estimates, if any, on theex-dividend date and are adjusted once actual tax designations are known.
f. Accounting Estimates
The preparation of financial statements in accordance with U.S. GAAP requires management to make estimates and assumptions that affect the reported amounts of assets and liabilities at the date of the financial statements and the amounts of income and expenses during the reporting period. Actual results could differ from those estimates.
g. Guarantees and Indemnifications
Under the Trust’s organizational documents, its officers and trustees are indemnified by the Trust against certain liabilities arising out of the performance of their duties to the Trust. Additionally, in the normal course of business, the Trust, on behalf of the Fund, enters into contracts with service
FRANKLIN TEMPLETON VARIABLE INSURANCE PRODUCTS TRUST
NOTES TO FINANCIAL STATEMENTS (UNAUDITED)
Franklin Global Real Estate VIP Fund(continued)
1. Organization and Significant Accounting
Policies(continued)
g. Guarantees and Indemnifications(continued)
providers that contain general indemnification clauses. The Trust’s maximum exposure under these arrangements is unknown as this would involve future claims that may be made against the Trust that have not yet occurred. Currently, the Trust expects the risk of loss to be remote.
2. Shares of Beneficial Interest
At June 30, 2019, there were an unlimited number of shares authorized (without par value). Transactions in the Fund’s shares were as follows:
| | | | | | | | | | | | | | | | | | | | |
| | | |
| | | Six Months Ended
June 30, 2019 | | | | | | Year Ended
December 31, 2018 | |
| | | | |
| | | | | |
| | | Shares | | | Amount | | | | | | Shares | | | Amount | |
| | | | | |
| Class 1 Shares: | | | | | | | | | | | | | | | | | | | | |
Shares sold | | | 488 | | | $ | 8,377 | | | | | | | | 9,088 | | | $ | 153,008 | |
Shares issued in reinvestment of distributions | | | 2,856 | | | | 48,761 | | | | | | | | 1,610 | | | | 26,319 | |
Shares redeemed | | | (1,313 | ) | | | (22,882 | ) | | | | | | | (2,003 | ) | | | (32,475) | |
| | | | |
| | | | | |
Net increase (decrease) | | | 2,031 | | | $ | 34,256 | | | | | | | | 8,695 | | | $ | 146,852 | |
| | | | |
| | | | | |
| Class 2 Shares: | | | | | | | | | | | | | | | | | | | | |
Shares sold | | | 112,984 | | | $ | 1,929,197 | | | | | | | | 144,050 | | | $ | 2,286,461 | |
Shares issued in reinvestment of distributions | | | 449,770 | | | | 7,479,667 | | | | | | | | 274,845 | | | | 4,381,023 | |
Shares redeemed | | | (764,280 | ) | | | (12,818,913 | ) | | | | | | | (1,771,140 | ) | | | (28,253,759) | |
| | | | |
| | | | | |
Net increase (decrease) | | | (201,526 | ) | | $ | (3,410,049 | ) | | | | | | | (1,352,245 | ) | | $ | (21,586,275) | |
| | | | |
3. Transactions with Affiliates
Franklin Resources, Inc. is the holding company for various subsidiaries that together are referred to as Franklin Templeton. Certain officers and trustees of the Fund are also officers and/or directors of the following subsidiaries:
| | |
| |
| Subsidiary | | Affiliation |
| |
Franklin Templeton Institutional, LLC (FT Institutional) | | Investment manager |
| |
Franklin Templeton Services, LLC (FT Services) | | Administrative manager |
| |
Franklin Templeton Distributors, Inc. (Distributors) | | Principal underwriter |
| |
Franklin Templeton Investor Services, LLC (Investor Services) | | Transfer agent |
FRANKLIN TEMPLETON VARIABLE INSURANCE PRODUCTS TRUST
NOTES TO FINANCIAL STATEMENTS (UNAUDITED)
Franklin Global Real Estate VIP Fund(continued)
a. Management Fees
The Fund pays an investment management fee to FT Institutional based on the average daily net assets of the Fund as follows:
| | | | |
| | |
| Annualized Fee Rate | | Net Assets | | |
| | |
1.050% | | Up to and including $500 million | | |
| | |
0.950% | | Over $500 million, up to and including $1 billion | | |
| | |
0.900% | | Over $1 billion, up to and including $1.5 billion | | |
| | |
0.850% | | Over $1.5 billion, up to and including $6.5 billion | | |
| | |
0.830% | | Over $6.5 billion, up to and including $11.5 billion | | |
| | |
0.810% | | Over $11.5 billion, up to and including $16.5 billion | | |
| | |
0.790% | | Over $16.5 billion, up to and including $19 billion | | |
| | |
0.780% | | Over $19 billion, up to and including $21.5 billion | | |
| | |
0.770% | | In excess of $21.5 billion | | |
b. Administrative Fees
Under an agreement with FT Institutional, FT Services provides administrative services to the Fund. The fee is paid by FT Institutional based on the Fund’s average daily net assets, and is not an additional expense of the Fund.
c. Distribution Fees
The Board has adopted a distribution plan for Class 2 shares pursuant to Rule12b-1 under the 1940 Act. Under the Fund’s compensation distribution plan, the Fund pays Distributors for costs incurred in connection with the servicing, sale and distribution of the Fund’s shares up to 0.35% per year of its average daily net assets. The Board has agreed to limit the current rate to 0.25% per year for Class 2. The plan year, for purposes of monitoring compliance with the maximum annual plan rates, is February 1 through January 31.
d. Transfer Agent Fees
Investor Services, under terms of an agreement, performs shareholder servicing for the Fund and is not paid by the Fund for the services.
e. Waiver and Expense Reimbursements
Effective May 1, 2019, FT Institutional has contractually agreed in advance to waive or limit its fees and to assume as its own expense certain expenses otherwise payable by the Fund so that the expenses (excluding distribution fees and acquired fund fees and expenses and certainnon-routine expenses or costs, including those relating to litigation, indemnification, reorganizations, and liquidations) for each class of the Fund do not exceed 1.00% based on the average net assets of each class until April 30, 2020. Total expenses waived or paid are not subject to recapture subsequent to the Fund’s fiscal year end.
4. Expense Offset Arrangement
The Fund has entered into an arrangement with its custodian whereby credits realized as a result of uninvested cash balances are used to reduce a portion of the Fund’s custodian expenses. During the period ended June 30, 2019, the custodian fees were reduced as noted in the Statement of Operations.
FRANKLIN TEMPLETON VARIABLE INSURANCE PRODUCTS TRUST
NOTES TO FINANCIAL STATEMENTS (UNAUDITED)
Franklin Global Real Estate VIP Fund (continued)
5. Income Taxes
At June 30, 2019, the cost of investments and net unrealized appreciation (depreciation) for income tax purposes were as follows:
| | | | |
Cost of investments | | | $109,893,031 | |
| | | | |
| |
Unrealized appreciation | | | $ 57,003,852 | |
Unrealized depreciation | | | (8,797,965) | |
| | | | |
| |
Net unrealized appreciation (depreciation) | | | $ 48,205,887 | |
| | | | |
Differences between income and/or capital gains as determined on a book basis and a tax basis are primarily due to differing treatment of passive foreign investment company shares.
6. Investment Transactions
Purchases and sales of investments (excluding short term securities) for the period ended June 30, 2019, aggregated $27,351,972 and $37,505,821, respectively.
7. Concentration of Risk
The Fund invests a large percentage of its total assets in REIT securities. Such concentration may subject the Fund to special risks associated with real estate securities. These securities may be more sensitive to economic or regulatory developments due to a variety of factors such as local, regional, national and global economic conditions, interest rates and tax considerations.
8. Credit Facility
The Fund, together with other U.S. registered and foreign investment funds (collectively, Borrowers), managed by Franklin Templeton, are borrowers in a joint syndicated senior unsecured credit facility totaling $2 billion (Global Credit Facility) which matures on February 7, 2020. This Global Credit Facility provides a source of funds to the Borrowers for temporary and emergency purposes, including the ability to meet future unanticipated or unusually large redemption requests.
Under the terms of the Global Credit Facility, the Fund shall, in addition to interest charged on any borrowings made by the Fund and other costs incurred by the Fund, pay its share of fees and expenses incurred in connection with the implementation and maintenance of the Global Credit Facility, based upon its relative share of the aggregate net assets of all of the Borrowers, including an annual commitment fee of 0.15% based upon the unused portion of the Global Credit Facility. These fees are reflected in other expenses in the Statement of Operations. During the period ended June 30, 2019, the Fund did not use the Global Credit Facility.
9. Fair Value Measurements
The Fund follows a fair value hierarchy that distinguishes between market data obtained from independent sources (observable inputs) and the Fund’s own market assumptions (unobservable inputs). These inputs are used in determining the value of the Fund’s financial instruments and are summarized in the following fair value hierarchy:
| | • | | Level 1 – quoted prices in active markets for identical financial instruments |
| | • | | Level 2 – other significant observable inputs (including quoted prices for similar financial instruments, interest rates, prepayment speed, credit risk, etc.) |
FRANKLIN TEMPLETON VARIABLE INSURANCE PRODUCTS TRUST
NOTES TO FINANCIAL STATEMENTS (UNAUDITED)
Franklin Global Real Estate VIP Fund(continued)
| | • | | Level 3 – significant unobservable inputs (including the Fund’s own assumptions in determining the fair value of financial instruments) |
The input levels are not necessarily an indication of the risk or liquidity associated with financial instruments at that level.
A summary of inputs used as of June 30, 2019, in valuing the Fund’s assets carried at fair value, is as follows:
| | | | | | | | | | | | | | | | |
| | | | |
| | | Level 1 | | | Level 2 | | | Level 3 | | | Total | |
| |
| | | | |
| Assets: | | | | | | | | | | | | | | | | |
Investments in Securities:a | | | | | | | | | | | | | | | | |
Equity Investments | | | $ 157,167,763 | | | | $ — | | | | $ — | | | | $ 157,167,763 | |
Short Term Investments | | | — | | | | 931,155 | | | | — | | | | 931,155 | |
| | | | |
Total Investments in Securities | | | $ 157,167,763 | | | | $ 931,155 | | | | $ — | | | | $ 158,098,918 | |
| | | | |
aFor detailed categories, see the accompanying Statement of Investments.
10. Subsequent Events
The Fund has evaluated subsequent events through the issuance of the financial statements and determined that no events have occurred that require disclosure.
Abbreviations
| | |
| Selected Portfolio |
|
| |
| REIT | | Real Estate Investment Trust |
This page intentionally left blank.
Franklin Growth and Income VIP Fund
This semiannual report for Franklin Growth and Income VIP Fund covers the period ended June 30, 2019.
Class 2 Performance Summary as of June 30, 2019
The Fund’s Class 2 Shares posted a +14.84% total return* for thesix-month period ended June 30, 2019.
*The Fund has an expense reduction contractually guaranteed through 4/30/20. Fund investment results reflect the expense reduction and fee waiver; without these reductions, the results would have been lower.
Performance reflects the Fund’s Class 2 operating expenses, but doesnotinclude any contract fees, expenses or sales charges. If they had been included, performance would be lower. These charges and deductions, particularly for variable life policies, can have a significant effect on contract values and insurance benefits. See the contract prospectus for a complete description of these expenses, including sales charges.
Performance data represent past performance, which does not guarantee future results. Investment return and principal value will fluctuate, and you may have a gain or loss when you sell your shares. Current performance may differ from figures shown.
FRANKLIN GROWTH AND INCOME VIP FUND
Fund Goal and Main Investments
The Fund seeks capital appreciation with current income as a secondary goal. Under normal market conditions, the Fund invests predominantly in equity securities, including common stock, preferred stock and securities convertible into common stocks.
Fund Risks
All investments involve risks, including possible loss of principal. Stock prices fluctuate, sometimes rapidly and dramatically, due to factors affecting individual companies, particular industries or sectors, or general market conditions. Growth stock prices reflect projections of future earnings or revenues, and can, therefore, fall dramatically if the company fails to meet those projections. Value securities may not increase in price as anticipated or may decline further if other investors fail to recognize the company’s value or favor investing in faster growing companies. Because the Fund can only distribute what it earns, the Fund’s distributions to shareholders may decline when prevailing interest rates fall, when dividend income from investments in stocks decline, or when the Fund experiences defaults on debt securities it holds. To the extent the Fund focuses on particular countries, regions, industries, sectors or types of investment from time to time, it may be subject to greater risks of adverse developments in such areas of focus than a fund that invests in a wider variety of countries, regions, industries, sectors or investments. Special risks are associated with foreign investing, including currency exchange rates and policies, country or government specific issues, less favorable trading practices or regulation and greater price volatility; investments in emerging markets typically involve heightened risks related to the same factors. Common stocks with higher dividend yields can be sensitive to interest-rate movements. The Fund is actively managed but there is no guarantee that the manager’s investment decisions will produce the desired results. The Fund’s prospectus also includes a description of the main investment risks.
Performance Overview
You can find the Fund’ssix-month total return in the Performance Summary. In comparison, the Fund’s benchmark, the Standard & Poor’s® 500 Index (S&P 500®) posted a +18.54% total return.1
Portfolio Composition
Based on Total Net Assets as of 6/30/19
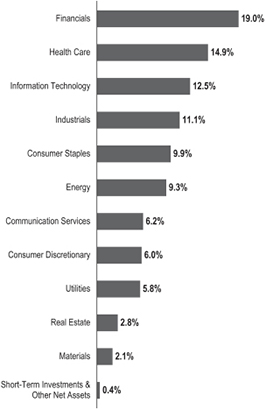
Economic and Market Overview
The U.S. economy grew during the six months ended June 30, 2019. After moderating for two consecutive quarters, the economy grew significantly faster in 2019’s first quarter, driven by growth in consumer spending, inventory investment, exports, business investment, and state and local government spending. However, the economy moderated again in the second quarter, due to weakness in inventory investment, exports, business investment and housing investment. The manufacturing and services sectors expanded during the period. The unemployment rate decreased from 3.9% in December 2018 to 3.7% atperiod-end.2 The annual inflation rate, as measured by the
1. Source: Morningstar. One cannot invest directly in an index, and an index is not representative of the Fund’s portfolio. Please see Index Descriptions following the Fund Summaries.
2. Source: Bureau of Labor Statistics.
The dollar value, number of shares or principal amount, and names of all portfolio holdings are listed in the Fund’s Statement of Investments (SOI).
FRANKLIN GROWTH AND INCOME VIP FUND
Consumer Price Index, decreased from 1.9% in December 2018 to 1.6% atperiod-end.2
The U.S. Federal Reserve (Fed) held its target range for the federal funds rate unchanged, at 2.25%–2.50%, during the reporting period. In March, the Fed mentioned it would end its balance sheet normalization program by the end of September 2019. In June, the Fed indicated increased uncertainties around its views on economic activity and the labor market. With market-based inflation measures remaining low in recent months, the market has interpreted the Fed’s recent statements to mean it will likely cut rates in 2019’s second half to foster continued economic growth while attempting to achieve its inflation objective.
U.S. equity markets overall rose during the period, benefiting from upbeat economic data and U.S. corporate earnings. However, markets reflected concerns about tighter regulation of technology companies, U.S. political uncertainties, and the impact of U.S. trade disputes with China and other trading partners on global growth and corporate earnings. These concerns were partially alleviated in 2019’s first four months by easing trade tensions and optimism about a potential U.S.-China trade deal. Furthermore, markets benefited from the Fed’s indications of a patient approach to its monetary policy decisions. The broad U.S. stock market, as measured by the S&P 500, rallied in 2019’s first four months, reaching a newall-time high in April 2019. After declining in May due to escalating trade tensions, stocks reached anotherall-time high in June amid investor optimism about potential interest-rate cuts. Overall, the S&P 500 posted a +18.54% total return for thesix-month period.1
Investment Strategy
We seek to invest in a broadly diversified portfolio of equity securities that we consider to be financially strong, with a focus on “blue chip” companies. We apply abottom-up approach to investing in individual securities. We will assess the market price of a company’s securities relative to our evaluation of the company’s long-term earnings, asset value and cash flow potential. We also consider a company’s price/earnings ratio, return on capital, profit margins, balance sheet and liquidation value. We consider dividend yield and the opportunity for dividend growth in selecting stocks for the Fund because we believe that, over time, dividend income can contribute significantly to total return and can be a more consistent source of investment return than capital appreciation. We seek to take advantage of price dislocations that result from the market’s short-term focus and choose to invest in those companies that, in our opinion, offer the besttrade-off between growth opportunity, business and financial risk, and valuation.
| | | | |
| Top 10 Holdings | | | |
| 6/30/19 | | | |
| |
Company
Sector/Industry | | % of Total
Net Assets | |
| |
JPMorgan Chase & Co. Financials | | | 4.1% | |
| |
Microsoft Corp. Information Technology | | | 3.9% | |
| |
Bank of America Corp. Financials | | | 2.9% | |
| |
The Procter & Gamble Co. Consumer Staples | | | 2.6% | |
| |
Chevron Corp. Energy | | | 2.5% | |
| |
The Coca-Cola Co. Consumer Staples | | | 2.4% | |
| |
Merck & Co. Inc. Health Care | | | 2.3% | |
| |
PepsiCo Inc. Consumer Staples | | | 2.3% | |
| |
Wells Fargo & Co. Financials | | | 2.3% | |
| |
Johnson & Johnson Health Care | | | 2.2% | |
Manager’s Discussion
During the period under review, all sectors contributed to Fund performance, led by financials, information technology (IT) and industrials.
In the financials sector, banks and leading banking companies JPMorgan Chase and Bank of America were top contributors. JPMorgan Chase benefited in the first half of 2019 from double-digit growth in credit card sales, merchant processing volumes and client investment assets. The company also experienced growth in credit card loans and new deposits and increased its dividend and share repurchases. Bank of America reported better-than-expected fourth-quarter 2018 and first-quarter 2019 earnings due to improved investment banking income, strong expense management and good credit trends.
In the IT sector, information software and services firm Microsoft is a beneficiary of strong sales execution, a positive enterprise IT spending environment, its status as a critical partner to IT departments in this time of digital transformation, and a large installed base that is successfully moving to higher-value cloud andService-as-a-Software deployments. The company saw sustained strength in its enterprise cloud computing platform Azure, solid growth in
FRANKLIN GROWTH AND INCOME VIP FUND
its traditional server products and particularly strong growth in commercial bookings. Furthermore, the company continued to expand gross profit margins and control operational expenses. Networking firm Cisco Systems also boosted performance.
In the industrials sector, global security and aerospace company Lockheed Martin and freight railroad operator Norfolk Southern were notable contributors. In other sectors, branded consumer packaged goods provider Procter & Gamble also aided results.
Although no sectors detracted from performance, in the materials sector, which contributed least to performance, key detractors included specialty materials and chemicals company DuPont de Nemours and chemicals products producer Dow. DuPont experienced reduced earnings due to Midwest flooding that affected its agriculture division, margin compression in key value chains, sluggish auto and smartphone market conditions and investor fears about potential environmental liabilities. These factors were partially offset by stronger pricing in the company’s higher margin specialty products and agriculture divisions.
Other leading individual detractors were petroleum and chemical products company Occidental Petroleum, industrial technology company 3M, pharmaceuticals company Bristol-Meyers Squibb (not held atperiod-end) and managed care company UnitedHealth Group. Shares of Occidental declined surrounding its acquisition of Anadarko Petroleum after a bidding war with Chevron, which increased the acquisition price. Occidental’s decision to keep Anadarko’s Gulf of Mexico assets despite selling other unwanted assets also concerned some investors. Weaker first-quarter earnings also disappointed investors. Shares of 3M declined amid below-expected first-quarter 2019 results driven by lower profits across segments and slightly lower overall sales. Increased inventories as well as higher inventories of auto and electronics customers in China also concerned investors. A lower share buyback and worries about environmental product liability risks further depressed the stock.
Thank you for your participation in Franklin Growth and Income VIP Fund. We look forward to serving your future investment needs.
The foregoing information reflects our analysis, opinions and portfolio holdings as of June 30, 2019, the end of the reporting period. The way we implement our main investment strategies and the resulting portfolio holdings may change depending on factors such as market and economic conditions. These opinions may not be relied upon as investment advice or an offer for a particular security. The information is not a complete analysis of every aspect of any market, country, industry, security or the Fund. Statements of fact are from sources considered reliable, but the investment manager makes no representation or warranty as to their completeness or accuracy. Although historical performance is no guarantee of future results, these insights may help you understand our investment management philosophy.
FRANKLIN GROWTH AND INCOME VIP FUND
Class 2 Fund Expenses
As an investor in a variable insurance contract (Contract) that indirectly provides for investment in an underlying mutual fund, you can incur transaction and/or ongoing expenses at both the Fund level and the Contract Level: (1) transaction expenses can include sales charges (loads) on purchases, surrender fees, transfer fees and premium taxes; and (2) ongoing expenses can include management fees, distribution and service(12b-1) fees, contract fees, annual maintenance fees, mortality and expense risk fees and other fees and expenses. All mutual funds and Contracts have some types of ongoing expenses. The table below shows Fund-level ongoing expenses and can help you understand these costs and compare them with those of other mutual funds offered through the Contract. The table assumes a $1,000 investment held for the six months indicated. Please refer to the Fund prospectus for additional information on operating expenses.
Actual Fund Expenses
The table below provides information about the actual account values and actual expenses in the columns under the heading “Actual.” In these columns the Fund’s actual return, which includes the effect of ongoing Fund expenses but does not include the effect of ongoing Contract expenses, is used to calculate the “Ending Account Value.” You can estimate the Fund-level expenses you paid during the period by following these steps (ofcourse, your account value and expenses will differ from those in this illustration):Divide your account value by $1,000 (ifyour account had an $8,600 value, then $8,600÷ $1,000 = 8.6). Then multiply the result by the number under the headings “Actual” and “Fund-Level Expenses Paid During Period” (ifFund-Level Expenses Paid During Period were $ 7.50, then 8.6 x $ 7.50 = $64.50). In this illustration, the estimated expenses paid this period at the Fund level are $64.50.
Hypothetical Example for Comparison with Other Mutual Funds
Under the heading “Hypothetical” in the table, information is provided about hypothetical account values and hypothetical expenses based on the Fund’s actual expense ratio and an assumed rate of return of 5% per year before expenses, which is not the Fund’s actual return. This information may not be used to estimate the actual ending account balance or expenses you paid for the period, but it can help you compare ongoing costs of investing in the Fund with those of other mutual funds offered through the Contract. To do so, compare this 5% hypothetical example with the 5% hypothetical examples that appear in the shareholder reports of other funds offered through the Contract.
Please note that expenses shown in the table are meant to highlight ongoing costs at the Fund level only and do not reflect any ongoing expenses at the Contract level, or transaction expenses at either the Fund or Contract levels. In addition, while the Fund does not have transaction expenses, if the transaction and ongoing expenses at the Contract level were included, the expenses shown below would be higher. You should consult your Contract prospectus or disclosure document for more information.
| | | | | | | | | | | | |
| | | | | Actual
(actual return after expenses) | | Hypothetical
(5% annual return before expenses) | | |
Share Class | | Beginning
Account
Value 1/1/19 | | Ending
Account
Value 6/30/19 | | Fund-Level
Expenses
Paid During
Period
1/1/19–6/30/191,2 | | Ending Account Value 6/30/19 | | Fund-Level
Expenses Paid During Period 1/1/19–6/30/191,2 | | Net Annualized
Expense
Ratio2 |
| | | | | | |
Class 2 | | $1,000 | | $1,148.40 | | $4.47 | | $1,020.63 | | $4.21 | | 0.84% |
1. Expenses are equal to the annualized expense ratio for thesix-month period as indicated above—in the far right column—multiplied by the simple average account value over the period indicated, and then multiplied by 181/365 to reflect theone-half year period.
2. Reflects expenses after fee waivers and expense reimbursements. Does not include any ongoing expenses of the Contract for which the Fund is an investment option or acquired fund fees and expenses.
FRANKLIN TEMPLETON VARIABLE INSURANCE PRODUCTS TRUST
Financial Highlights
Franklin Growth and Income VIP Fund
| | | | | | | | | | | | | | | | | | | | | | | | |
| | |
| | | Six Months Ended
June 30, 2019 (unaudited) | | | Year Ended December 31, | |
| | | 2018 | | | 2017 | | | 2016 | | | 2015 | | | 2014 | |
| |
| | | | | | |
| Class 1 | | | | | | | | | | | | | | | | | | | | | | | | |
| | | | | | |
Per share operating performance
(for a share outstanding throughout the period) | | | | | | | | | | | | | | | | | | | | | | | | |
| | | | | | |
Net asset value, beginning of period | | | $14.80 | | | | $16.32 | | | | $15.97 | | | | $15.94 | | | | $17.02 | | | | $15.97 | |
| | | | |
| | | | | | |
| Income from investment operationsa: | | | | | | | | | | | | | | | | | | | | | | | | |
| | | | | | |
Net investment incomeb | | | 0.17 | | | | 0.31 | | | | 0.35 | | | | 0.40 | | | | 0.45 | | | | 0.53c | |
| | | | | | |
Net realized and unrealized gains (losses) | | | 2.02 | | | | (0.97 | ) | | | 2.04 | | | | 1.33 | | | | (0.54 | ) | | | 0.95 | |
| | | | |
| | | | | | |
Total from investment operations | | | 2.19 | | | | (0.66 | ) | | | 2.39 | | | | 1.73 | | | | (0.09 | ) | | | 1.48 | |
| | | | |
| | | | | | |
| Less distributions from: | | | | | | | | | | | | | | | | | | | | | | | | |
| | | | | | |
Net investment income | | | (0.41 | ) | | | (0.43 | ) | | | (1.03 | ) | | | (0.46 | ) | | | (0.61 | ) | | | (0.43) | |
| | | | | | |
Net realized gains | | | (0.88 | ) | | | (0.43 | ) | | | (1.01 | ) | | | (1.24 | ) | | | (0.38 | ) | | | — | |
| | | | |
| | | | | | |
Total distributions | | | (1.29 | ) | | | (0.86 | ) | | | (2.04 | ) | | | (1.70 | ) | | | (0.99 | ) | | | (0.43) | |
| | | | |
| | | | | | |
Net asset value, end of period | | | $15.70 | | | | $14.80 | | | | $16.32 | | | | $15.97 | | | | $15.94 | | | | $17.02 | |
| | | | |
| | | | | | |
Total returnd | | | 15.06% | | | | (4.37)% | | | | 16.15% | | | | 11.86% | | | | (0.62)% | | | | 9.40% | |
| | | | | | |
| Ratios to average net assetse | | | | | | | | | | | | | | | | | | | | | | | | |
| | | | | | |
Expenses before waiver and payments by affiliates | | | 0.73% | | | | 0.73% | | | | 0.72% | | | | 0.59% | | | | 0.58% | | | | 0.57% | |
| | | | | | |
Expenses net of waiver and payments by affiliates | | | 0.59%f | | | | 0.59%f | | | | 0.59%f | | | | 0.59% | f,g | | | 0.58% | | | | 0.57%f | |
| | | | | | |
Net investment income | | | 2.14% | | | | 1.96% | | | | 2.21% | | | | 2.38% | | | | 2.74% | | | | 3.26%c | |
| | | | | | |
Supplemental data | | | | | | | | | | | | | | | | | | | | | | | | |
| | | | | | |
| Net assets, end of period (000’s) | | | $34,881 | | | | $31,479 | | | | $35,865 | | | | $29,829 | | | | $144,663 | | | | $168,961 | |
| | | | | | |
Portfolio turnover rate | | | 13.00% | | | | 24.29% | | | | 33.91% | | | | 40.59% | h | | | 48.81% | | | | 20.54% | |
aThe amount shown for a share outstanding throughout the period may not correlate with the Statement of Operations for the period due to the timing of sales and repurchases of the Fund’s shares in relation to income earned and/or fluctuating fair value of the investments of the Fund.
bBased on average daily shares outstanding.
cNet investment income per share includes approximately $0.12 per share related to income received in the form of special dividends in connection with certain Fund holdings. Excluding this amount, the ratio of net investment income to average net assets would have been 2.53%.
dTotal return does not include fees, charges or expenses imposed by the variable annuity and life insurance contracts for which Franklin Templeton Variable Insurance Products Trust serves as an underlying investment vehicle. Total return is not annualized for periods less than one year.
eRatios are annualized for periods less than one year.
fBenefit of expense reduction rounds to less than 0.01%.
gBenefit of waiver and payments by affiliates rounds to less than 0.01%.
hExcludes the value of portfolio securities delivered as a result of a redemptionin-kind.
| | | | |
| | | |
FGI-6 | | Semiannual Report | The accompanying notes are an integral part of these financial statements. | | |
FRANKLIN TEMPLETON VARIABLE INSURANCE PRODUCTS TRUST
FINANCIAL HIGHLIGHTS
Franklin Growth and Income VIP Fund(continued)
| | | | | | | | | | | | | | | | | | | | | | | | |
| | | Six Months Ended
June 30, 2019 (unaudited) | | | Year Ended December 31, | |
| | | 2018 | | | 2017 | | | 2016 | | | 2015 | | | 2014 | |
| |
| | | | | | |
| Class 2 | | | | | | | | | | | | | | | | | | | | | | | | |
| | | | | | |
Per share operating performance (for a share outstanding throughout the period) | | | | | | | | | | | | | | | | | | | | | | | | |
| | | | | | |
Net asset value, beginning of period | | | $14.51 | | | | $16.02 | | | | $15.69 | | | | $15.68 | | | | $16.76 | | | | $15.73 | |
| | | | |
| | | | | | |
| Income from investment operationsa: | | | | | | | | | | | | | | | | | | | | | | | | |
| | | | | | |
Net investment incomeb | | | 0.15 | | | | 0.27 | | | | 0.31 | | | | 0.30 | | | | 0.40 | | | | 0.48c | |
| | | | | | |
Net realized and unrealized gains (losses) | | | 1.98 | | | | (0.96 | ) | | | 2.00 | | | | 1.37 | | | | (0.54 | ) | | | 0.94 | |
| | | | |
| | | | | | |
Total from investment operations | | | 2.13 | | | | (0.69 | ) | | | 2.31 | | | | 1.67 | | | | (0.14 | ) | | | 1.42 | |
| | | | |
| | | | | | |
| Less distributions from: | | | | | | | | | | | | | | | | | | | | | | | | |
| | | | | | |
Net investment income | | | (0.37 | ) | | | (0.39 | ) | | | (0.97 | ) | | | (0.42 | ) | | | (0.56 | ) | | | (0.39) | |
| | | | | | |
Net realized gains | | | (0.88 | ) | | | (0.43 | ) | | | (1.01 | ) | | | (1.24 | ) | | | (0.38 | ) | | | — | |
| | | | |
| | | | | | |
Total distributions | | | (1.25 | ) | | | (0.82 | ) | | | (1.98 | ) | | | (1.66 | ) | | | (0.94 | ) | | | (0.39) | |
| | | | |
| | | | | | |
Net asset value, end of period | | | $15.39 | | | | $14.51 | | | | $16.02 | | | | $15.69 | | | | $15.68 | | | | $16.76 | |
| | | | |
| | | | | | |
Total returnd | | | 14.84% | | | | (4.58)% | | | | 15.85% | | | | 11.62% | | | | (0.91)% | | | | 9.14% | |
| | | | | | |
| Ratios to average net assetse | | | | | | | | | | | | | | | | | | | | | | | | |
| | | | | | |
Expenses before waiver and payments by affiliates | | | 0.98% | | | | 0.98% | | | | 0.97% | | | | 0.84% | | | | 0.83% | | | | 0.82% | |
| | | | | | |
Expenses net of waiver and payments by affiliates | | | 0.84%f | | | | 0.84%f | | | | 0.84%f | | | | 0.84% | f,g | | | 0.83% | | | | 0.82%f | |
| | | | | | |
Net investment income | | | 1.89% | | | | 1.71% | | | | 1.96% | | | | 2.13% | | | | 2.49% | | | | 3.01%c | |
| | | | | | |
Supplemental data | | | | | | | | | | | | | | | | | | | | | | | | |
| | | | | | |
| Net assets, end of period (000’s) | | | $68,018 | | | | $61,855 | | | | $74,105 | | | | $69,474 | | | | $124,691 | | | | $138,191 | |
| | | | | | |
Portfolio turnover rate | | | 13.00% | | | | 24.29% | | | | 33.91% | | | | 40.59% | h | | | 48.81% | | | | 20.54% | |
aThe amount shown for a share outstanding throughout the period may not correlate with the Statement of Operations for the period due to the timing of sales and repurchases of the Fund’s shares in relation to income earned and/or fluctuating fair value of the investments of the Fund.
bBased on average daily shares outstanding.
cNet investment income per share includes approximately $0.12 per share related to income received in the form of special dividends in connection with certain Fund holdings. Excluding this amount, the ratio of net investment income to average net assets would have been 2.28%.
dTotal return does not include fees, charges or expenses imposed by the variable annuity and life insurance contracts for which Franklin Templeton Variable Insurance Products Trust serves as an underlying investment vehicle. Total return is not annualized for periods less than one year.
eRatios are annualized for periods less than one year.
fBenefit of expense reduction rounds to less than 0.01%.
gBenefit of waiver and payments by affiliates rounds to less than 0.01%.
hExcludes the value of portfolio securities delivered as a result of a redemptionin-kind.
| | | | | | |
| | | |
| | The accompanying notes are an integral part of these financial statements. | Semiannual Report | | | FGI-7 | |
FRANKLIN TEMPLETON VARIABLE INSURANCE PRODUCTS TRUST
Statement of Investments, June 30, 2019 (unaudited)
Franklin Growth and Income VIP Fund
| | | | | | | | | | |
| | | |
| | | Country | | Shares | | | Value | |
| | | |
Common Stocks 87.0% | | | | | | | | | | |
Communication Services 5.0% | | | | | | | | | | |
Comcast Corp., A | | United States | | | 36,200 | | | $ | 1,530,536 | |
Rogers Communications Inc., B | | Canada | | | 15,444 | | | | 826,563 | |
TELUS Corp. | | Canada | | | 20,900 | | | | 772,490 | |
Verizon Communications Inc. | | United States | | | 34,610 | | | | 1,977,269 | |
| | | | | | | | | | |
| | | |
| | | | | | | | | 5,106,858 | |
| | | | | | | | | | |
Consumer Discretionary 3.6% | | | | | | | | | | |
aAmazon.com Inc. | | United States | | | 100 | | | | 189,363 | |
Las Vegas Sands Corp. | | United States | | | 9,300 | | | | 549,537 | |
Lowe’s Cos. Inc. | | United States | | | 5,748 | | | | 580,031 | |
McDonald’s Corp. | | United States | | | 7,600 | | | | 1,578,216 | |
Target Corp. | | United States | | | 9,580 | | | | 829,724 | |
| | | | | | | | | | |
| | | |
| | | | | | | | | 3,726,871 | |
| | | | | | | | | | |
Consumer Staples 9.9% | | | | | | | | | | |
The Coca-Cola Co. | | United States | | | 48,000 | | | | 2,444,160 | |
Nestle SA | | Switzerland | | | 8,300 | | | | 859,028 | |
PepsiCo Inc. | | United States | | | 17,898 | | | | 2,346,965 | |
The Procter & Gamble Co. | | United States | | | 24,500 | | | | 2,686,425 | |
Walmart Inc. | | United States | | | 16,600 | | | | 1,834,134 | |
| | | | | | | | | | |
| | | |
| | | | | | | | | 10,170,712 | |
| | | | | | | | | | |
Energy 8.7% | | | | | | | | | | |
Chevron Corp. | | United States | | | 20,868 | | | | 2,596,814 | |
Exxon Mobil Corp. | | United States | | | 19,777 | | | | 1,515,511 | |
Occidental Petroleum Corp. | | United States | | | 23,700 | | | | 1,191,636 | |
ONEOK Inc. | | United States | | | 10,900 | | | | 750,029 | |
Royal Dutch Shell PLC, A, ADR | | United Kingdom | | | 24,113 | | | | 1,569,033 | |
Suncor Energy Inc. | | Canada | | | 42,182 | | | | 1,314,391 | |
| | | | | | | | | | |
| | | |
| | | | | | | | | 8,937,414 | |
| | | | | | | | | | |
Financials 17.2% | | | | | | | | | | |
Arthur J. Gallagher & Co. | | United States | | | 9,166 | | | | 802,850 | |
Bank of America Corp. | | United States | | | 65,500 | | | | 1,899,500 | |
BB&T Corp. | | United States | | | 38,876 | | | | 1,909,978 | |
BlackRock Inc. | | United States | | | 1,961 | | | | 920,297 | |
JPMorgan Chase & Co. | | United States | | | 37,400 | | | | 4,181,320 | |
MetLife Inc. | | United States | | | 35,500 | | | | 1,763,285 | |
Morgan Stanley | | United States | | | 50,637 | | | | 2,218,407 | |
U.S. Bancorp | | United States | | | 32,455 | | | | 1,700,642 | |
Wells Fargo & Co. | | United States | | | 49,350 | | | | 2,335,242 | |
| | | | | | | | | | |
| | | |
| | | | | | | | | 17,731,521 | |
| | | | | | | | | | |
Health Care 12.2% | | | | | | | | | | |
Baxter International Inc. | | United States | | | 14,800 | | | | 1,212,120 | |
Eli Lilly & Co. | | United States | | | 4,337 | | | | 480,496 | |
HCA Holdings Inc. | | United States | | | 3,900 | | | | 527,163 | |
Johnson & Johnson | | United States | | | 16,565 | | | | 2,307,173 | |
Medtronic PLC | | United States | | | 19,781 | | | | 1,926,472 | |
Merck & Co. Inc. | | United States | | | 29,000 | | | | 2,431,650 | |
FRANKLIN TEMPLETON VARIABLE INSURANCE PRODUCTS TRUST
STATEMENT OF INVESTMENTS (UNAUDITED)
Franklin Growth and Income VIP Fund(continued)
| | | | | | | | | | |
| | | |
| | | Country | | Shares | | | Value | |
| | | |
Common Stocks(continued) | | | | | | | | | | |
Health Care(continued) | | | | | | | | | | |
Pfizer Inc. | | United States | | | 51,163 | | | $ | 2,216,381 | |
UnitedHealth Group Inc. | | United States | | | 6,100 | | | | 1,488,461 | |
| | | | | | | | | | |
| | | |
| | | | | | | | | 12,589,916 | |
| | | | | | | | | | |
Industrials 10.6% | | | | | | | | | | |
3M Co. | | United States | | | 6,800 | | | | 1,178,712 | |
Emerson Electric Co. | | United States | | | 11,000 | | | | 733,920 | |
Illinois Tool Works Inc. | | United States | | | 3,611 | | | | 544,575 | |
Lockheed Martin Corp. | | United States | | | 4,169 | | | | 1,515,598 | |
Norfolk Southern Corp. | | United States | | | 7,100 | | | | 1,415,243 | |
Raytheon Co. | | United States | | | 8,616 | | | | 1,498,150 | |
Republic Services Inc. | | United States | | | 21,780 | | | | 1,887,019 | |
Stanley Black & Decker Inc. | | United States | | | 4,832 | | | | 698,756 | |
United Technologies Corp. | | United States | | | 11,234 | | | | 1,462,667 | |
| | | | | | | | | | |
| | | |
| | | | | | | | | 10,934,640 | |
| | | | | | | | | | |
Information Technology 9.7% | | | | | | | | | | |
Analog Devices Inc. | | United States | | | 3,900 | | | | 440,193 | |
Apple Inc. | | United States | | | 5,632 | | | | 1,114,685 | |
Broadcom Inc. | | United States | | | 715 | | | | 205,820 | |
Cisco Systems Inc. | | United States | | | 27,589 | | | | 1,509,946 | |
Intel Corp. | | United States | | | 14,057 | | | | 672,909 | |
Microsoft Corp. | | United States | | | 29,776 | | | | 3,988,793 | |
Oracle Corp. | | United States | | | 12,629 | | | | 719,474 | |
Texas Instruments Inc. | | United States | | | 11,496 | | | | 1,319,281 | |
| | | | | | | | | | |
| | | |
| | | | | | | | | 9,971,101 | |
| | | | | | | | | | |
Materials 1.5% | | | | | | | | | | |
BASF SE | | Germany | | | 3,537 | | | | 257,025 | |
aCorteva Inc. | | United States | | | 5,991 | | | | 177,154 | |
Dow Inc. | | United States | | | 7,024 | | | | 346,354 | |
DuPont de Nemours Inc. | | United States | | | 5,991 | | | | 449,744 | |
International Paper Co. | | United States | | | 7,520 | | | | 325,766 | |
| | | | | | | | | | |
| | | |
| | | | | | | | | 1,556,043 | |
| | | | | | | | | | |
Real Estate 2.8% | | | | | | | | | | |
Equity Residential | | United States | | | 13,000 | | | | 986,960 | |
Host Hotels & Resorts Inc. | | United States | | | 60,941 | | | | 1,110,345 | |
Prologis Inc. | | United States | | | 9,300 | | | | 744,930 | |
| | | | | | | | | | |
| | | |
| | | | | | | | | 2,842,235 | |
| | | | | | | | | | |
Utilities 5.8% | | | | | | | | | | |
Duke Energy Corp. | | United States | | | 20,200 | | | | 1,782,448 | |
NextEra Energy Inc. | | United States | | | 11,054 | | | | 2,264,523 | |
Xcel Energy Inc. | | United States | | | 31,196 | | | | 1,855,850 | |
| | | | | | | | | | |
| | | |
| | | | | | | | | 5,902,821 | |
| | | | | | | | | | |
| | | |
Total Common Stocks (Cost $59,249,522) | | | | | | | | | 89,470,132 | |
| | | | | | | | | | |
FRANKLIN TEMPLETON VARIABLE INSURANCE PRODUCTS TRUST
STATEMENT OF INVESTMENTS (UNAUDITED)
Franklin Growth and Income VIP Fund(continued)
| | | | | | | | | | |
| | | |
| | | Country | | Shares | | | Value | |
| | | |
bEquity-Linked Securities 9.7% | | | | | | | | | | |
Communication Services 1.2% | | | | | | | | | | |
cGoldman Sachs International into Alphabet Inc., 5.00%, A, 144A | | United States | | | 1,100 | | | $ | 1,204,336 | |
| | | | | | | | | | |
| | | |
Consumer Discretionary 2.4% | | | | | | | | | | |
cCitigroup Global Markets Holdings Inc. into Amazon.com Inc., 6.50%, 144A | | United States | | | 750 | | | | 1,344,375 | |
cWells Fargo Bank National Assn. into Dollar General Corp., 6.50%, 144A | | United States | | | 9,000 | | | | 1,079,454 | |
| | | | | | | | | | |
| | | |
| | | | | | | | | 2,423,829 | |
| | | | | | | | | | |
| | | |
Energy 0.6% | | | | | | | | | | |
cCitigroup Global Markets Holdings Inc. into Anadarko Petroleum Corp., 8.00%, 144A | | United States | | | 11,000 | | | | 623,128 | |
| | | | | | | | | | |
| | | |
Financials 1.8% | | | | | | | | | | |
cGoldman Sachs International into The Charles Schwab Corp., 7.00%, 144A | | United States | | | 19,000 | | | | 786,445 | |
cMorgan Stanley BV into Bank of America Corp., 6.50%, 144A | | United States | | | 38,000 | | | | 1,110,304 | |
| | | | | | | | | | |
| | | |
| | | | | | | | | 1,896,749 | |
| | | | | | | | | | |
| | | |
Health Care 0.9% | | | | | | | | | | |
cGoldman Sachs International into HCA Holdings Inc., 6.00%, 144A | | United States | | | 6,400 | | | | 877,782 | |
| | | | | | | | | | |
| | | |
Information Technology 2.8% | | | | | | | | | | |
cBarclays Bank PLC into Broadcom Inc., 10.00%, 144A | | United States | | | 2,900 | | | | 839,384 | |
cGoldman Sachs International into Intel Corp., 8.00%, 144A | | United States | | | 10,700 | | | | 515,326 | |
cMerrill Lynch International & Co. CV into Analog Devices Inc., 7.00%, 144A | | United States | | | 11,000 | | | | 1,082,706 | |
cMerrill Lynch International & Co. CV into Cisco System Inc., 7.00%, 144A | | United States | | | 9,000 | | | | 477,340 | |
| | | | | | | | | | |
| | | |
| | | | | | | | | 2,914,756 | |
| | | | | | | | | | |
| | | |
Total Equity-Linked Securities (Cost $9,528,488) | | | | | | | | | 9,940,580 | |
| | | | | | | | | | |
| | | |
Convertible Preferred Stocks 2.9% | | | | | | | | | | |
Health Care 1.8% | | | | | | | | | | |
Becton Dickinson and Co., 6.125%, cvt. pfd., A | | United States | | | 30,500 | | | | 1,888,255 | |
| | | | | | | | | | |
| | | |
Industrials 0.5% | | | | | | | | | | |
Fortive Corp., 5.00%, cvt. pfd., A | | United States | | | 510 | | | | 522,704 | |
| | | | | | | | | | |
| | | |
Materials 0.6% | | | | | | | | | | |
International Flavors & Fragrances Inc., 6.00%, cvt. pfd | | United States | | | 11,582 | | | | 623,343 | |
| | | | | | | | | | |
| | | |
Total Convertible Preferred Stocks (Cost $2,728,780) | | | | | | | | | 3,034,302 | |
| | | | | | | | | | |
| | | |
Total Investments before Short Term Investments
(Cost $71,506,790) | | | | | | | | | 102,445,014 | |
| | | | | | | | | | |
FRANKLIN TEMPLETON VARIABLE INSURANCE PRODUCTS TRUST
STATEMENT OF INVESTMENTS (UNAUDITED)
Franklin Growth and Income VIP Fund(continued)
| | | | | | | | | | |
| | | |
| | | Country | | Principal
Amount | | | Value | |
| | | |
Short Term Investments (Cost $467,179) 0.4% | | | | | | | | | | |
| | | |
Repurchase Agreements 0.4% | | | | | | | | | | |
| | | |
dJoint Repurchase Agreement, 2.451%, 7/01/19 (Maturity Value $467,275)
BNP Paribas Securities Corp. (Maturity Value $347,447)
Deutsche Bank Securities Inc. (Maturity Value $102,455)
HSBC Securities (USA) Inc. (Maturity Value $17,373)
Collateralized by U.S. Government Agency Securities, 4.00% - 4.50%, 7/15/40 - 3/20/49;
U.S. Treasury Bonds, 8.00%, 11/15/21; U.S. Treasury Notes, 1.50% - 3.125%, 5/15/21 - 8/15/26;
U.S. Treasury Notes, Index Linked, 0.875%, 1/15/29; and U.S. Treasury Strips, 8/15/22 - 6/15/35
(valued at $478,677) | | United States | | $ | 467,179 | | | $ | 467,179 | |
| | | | | | | | | | |
Total Investments (Cost $71,973,969) 100.0% | | | | | | | | | 102,912,193 | |
Other Assets, less Liabilities (0.0)%† | | | | | | | | | (13,755 | ) |
| | | | | | | | | | |
Net Assets 100.0% | | | | | | | | $ | 102,898,438 | |
| | | | | | | | | | |
See Abbreviations on pageFGI-21.
†Rounds to less than 0.1% of net assets.
aNon-income producing.
bSee Note 1(d) regarding equity-linked securities.
cSecurity was purchased pursuant to Rule 144A under the Securities Act of 1933 and may be sold in transactions exempt from registration only to qualified institutional buyers or in a public offering registered under the Securities Act of 1933. These securities have been deemed liquid under guidelines approved by the Trust’s Board of Trustees. At June 30, 2019 , the aggregate value of these securities was $9,940,580, representing 9.7% of net assets.
dSee Note 1(c) regarding joint repurchase agreement.
| | | | | | |
| | | |
| | The accompanying notes are an integral part of these financial statements. | Semiannual Report | | | FGI-11 | |
FRANKLIN TEMPLETON VARIABLE INSURANCE PRODUCTS TRUST
FINANCIAL STATEMENTS
Statement of Assets and Liabilities
June 30, 2019 (unaudited)
| | | | |
| |
| | | Franklin Growth
and Income VIP Fund | |
| |
| |
Assets: | | | | |
Investments in securities: | | | | |
Cost - Unaffiliated issuers | | | $ 71,506,790 | |
Cost - Unaffiliated repurchase agreements | | | 467,179 | |
| | | | |
| |
Value - Unaffiliated issuers | | | $102,445,014 | |
Value - Unaffiliated repurchase agreements | | | 467,179 | |
Receivables: | | | | |
Capital shares sold | | | 21,664 | |
Dividends and interest | | | 138,217 | |
Other assets | | | 70 | |
| | | | |
| |
Total assets | | | 103,072,144 | |
| | | | |
Liabilities: | | | | |
Payables: | | | | |
Capital shares redeemed | | | 42,103 | |
Management fees | | | 39,602 | |
Distribution fees | | | 28,092 | |
Trustees’ fees and expenses | | | 73 | |
Reports to shareholders | | | 42,980 | |
Professional fees | | | 14,102 | |
Accrued expenses and other liabilities | | | 6,754 | |
| | | | |
| |
Total liabilities | | | 173,706 | |
| | | | |
| |
Net assets, at value | | | $102,898,438 | |
| | | | |
| |
Net assets consist of: | | | | |
Paid-in capital | | | $ 68,499,726 | |
Total distributable earnings (loss) | | | 34,398,712 | |
| | | | |
| |
Net assets, at value | | | $102,898,438 | |
| | | | |
| |
| Class 1: | | | | |
Net assets, at value | | | $ 34,880,691 | |
| | | | |
Shares outstanding | | | 2,222,100 | |
| | | | |
Net asset value and maximum offering price per share | | | $15.70 | |
| | | | |
| Class 2: | | | | |
Net assets, at value | | | $ 68,017,747 | |
| | | | |
Shares outstanding | | | 4,419,448 | |
| | | | |
Net asset value and maximum offering price per share | | | $15.39 | |
| | | | |
| | | | |
| | | |
FGI-12 | | Semiannual Report | The accompanying notes are an integral part of these financial statements. | | |
FRANKLIN TEMPLETON VARIABLE INSURANCE PRODUCTS TRUST
FINANCIAL STATEMENTS
Statement of Operations
for the six months ended June 30, 2019 (unaudited)
| | | | |
| |
| | | Franklin Growth
and Income VIP Fund | |
| |
| |
Investment income: | | | | |
Dividends: (net of foreign taxes)* | | | | |
Unaffiliated issuers | | | $ 1,356,861 | |
Interest: | | | | |
Unaffiliated issuers | | | 6,378 | |
| | | | |
| |
Total investment income | | | 1,363,239 | |
| | | | |
Expenses: | | | | |
Management fees (Note 3a) | | | 311,406 | |
Distribution fees: (Note 3c) Class 2 | | | 82,699 | |
Custodian fees (Note 4) | | | 605 | |
Reports to shareholders | | | 24,572 | |
Professional fees | | | 21,365 | |
Trustees’ fees and expenses | | | 412 | |
Other | | | 6,849 | |
| | | | |
| |
Total expenses | | | 447,908 | |
Expense reductions (Note 4) | | | (471 | ) |
Expenses waived/paid by affiliates (Note 3e) | | | (69,829 | ) |
| | | | |
| |
Net expenses | | | 377,608 | |
| | | | |
| |
Net investment income | | | 985,631 | |
| | | | |
Realized and unrealized gains (losses): | | | | |
Net realized gain (loss) from: | | | | |
Investments: | | | | |
Unaffiliated issuers | | | 2,492,717 | |
Foreign currency transactions | | | 143 | |
| | | | |
| |
Net realized gain (loss) | | | 2,492,860 | |
| | | | |
Net change in unrealized appreciation (depreciation) on: | | | | |
Investments: | | | | |
Unaffiliated issuers | | | 10,307,718 | |
Translation of other assets and liabilities denominated in foreign currencies | | | 462 | |
| | | | |
| |
Net change in unrealized appreciation (depreciation) | | | 10,308,180 | |
| | | | |
| |
Net realized and unrealized gain (loss) | | | 12,801,040 | |
| | | | |
| |
Net increase (decrease) in net assets resulting from operations | | | $13,786,671 | |
| | | | |
| |
*Foreign taxes withheld on dividends | | | $ 24,141 | |
| | | | | | |
| | | |
| | The accompanying notes are an integral part of these financial statements. | Semiannual Report | | | FGI-13 | |
FRANKLIN TEMPLETON VARIABLE INSURANCE PRODUCTS TRUST
FINANCIAL STATEMENTS
Statements of Changes in Net Assets
| | | | | | | | |
| |
| | | Franklin
Growth and Income
VIP Fund | |
| | |
| | | Six Months Ended
June 30, 2019
(unaudited) | | | Year Ended
December 31, 2018 | |
| |
| | |
Increase (decrease) in net assets: | | | | | | | | |
Operations: | | | | | | | | |
Net investment income | | | $ 985,631 | | | | $ 1,900,960 | |
Net realized gain (loss) | | | 2,492,860 | | | | 6,062,177 | |
Net change in unrealized appreciation (depreciation) | | | 10,308,180 | | | | (12,184,627 | ) |
| | | | |
| | |
Net increase (decrease) in net assets resulting from operations | | | 13,786,671 | | | | (4,221,490 | ) |
| | | | |
| | |
Distributions to shareholders: | | | | | | | | |
Class 1 | | | (2,665,418 | ) | | | (1,845,139 | ) |
Class 2 | | | (5,148,061 | ) | | | (3,639,656 | ) |
| | | | |
| | |
Total distributions to shareholders | | | (7,813,479 | ) | | | (5,484,795 | ) |
| | | | |
| | |
Capital share transactions: (Note 2) | | | | | | | | |
Class 1 | | | 1,379,615 | | | | (1,177,234 | ) |
Class 2 | | | 2,211,199 | | | | (5,751,247 | ) |
| | | | |
| | |
Total capital share transactions | | | 3,590,814 | | | | (6,928,481 | ) |
| | | | |
| | |
Net increase (decrease) in net assets | | | 9,564,006 | | | | (16,634,766 | ) |
Net assets: | | | | | | | | |
Beginning of period | | | 93,334,432 | | | | 109,969,198 | |
| | | | |
| | |
End of period | | | $102,898,438 | | | | $ 93,334,432 | |
| | | | |
| | | | |
| | | |
FGI-14 | | Semiannual Report | The accompanying notes are an integral part of these financial statements. | | |
FRANKLIN TEMPLETON VARIABLE INSURANCE PRODUCTS TRUST
Notes to Financial Statements (unaudited)
Franklin Growth and Income VIP Fund
1. Organization and Significant Accounting Policies
Franklin Templeton Variable Insurance Products Trust (Trust) is registered under the Investment Company Act of 1940 (1940 Act) as anopen-end management investment company, consisting of eighteen separate funds and applies the specialized accounting and reporting guidance in U.S. Generally Accepted Accounting Principles (U.S. GAAP). Franklin Growth and Income VIP Fund (Fund) is included in this report. Shares of the Fund are generally sold only to insurance company separate accounts to fund the benefits of variable life insurance policies or variable annuity contracts. The Fund offers two classes of shares: Class 1 and Class 2. Each class of shares may differ by its distribution fees, voting rights on matters affecting a single class and its exchange privilege.
The following summarizes the Fund’s significant accounting policies.
a. Financial Instrument Valuation
The Fund’s investments in financial instruments are carried at fair value daily. Fair value is the price that would be received to sell an asset or paid to transfer a liability in an orderly transaction between market participants on the measurement date. The Fund calculates the net asset value (NAV) per share each business day as of 4 p.m. Eastern time or the regularly scheduled close of the New York Stock Exchange (NYSE), whichever is earlier. Under compliance policies and procedures approved by the Trust’s Board of Trustees (the Board), the Fund’s administrator has responsibility for oversight of valuation, including leading the cross-functional Valuation Committee (VC). The Fund may utilize independent pricing services, quotations from securities and financial instrument dealers, and other market sources to determine fair value.
Equity securities listed on an exchange or on the NASDAQ National Market System are valued at the last quoted sale price or the official closing price of the day, respectively. Foreign equity securities are valued as of the close of trading on the foreign stock exchange on which the security is primarily traded, or as of 4 p.m. Eastern time. The value is then converted into its U.S. dollar equivalent at the foreign exchange rate in effect at 4 p.m. Eastern time on the day that the value of the security is determined.Over-the-counter (OTC) securities are valued within the range of the most recent quoted bid and ask prices. Securities that trade in multiple markets or on multiple exchanges are valued
according to the broadest and most representative market. Certain equity securities are valued based upon fundamental characteristics or relationships to similar securities.
Investments in repurchase agreements are valued at cost, which approximates fair value.
The Fund has procedures to determine the fair value of financial instruments for which market prices are not reliable or readily available. Under these procedures, the Fund primarily employs a market-based approach which may use related or comparable assets or liabilities, recent transactions, market multiples, book values, and other relevant information for the investment to determine the fair value of the investment. An income-based valuation approach may also be used in which the anticipated future cash flows of the investment are discounted to calculate fair value. Discounts may also be applied due to the nature or duration of any restrictions on the disposition of the investments. Due to the inherent uncertainty of valuations of such investments, the fair values may differ significantly from the values that would have been used had an active market existed.
Trading in securities on foreign securities stock exchanges and OTC markets may be completed before 4 p.m. Eastern time. In addition, trading in certain foreign markets may not take place on every Fund’s business day. Occasionally, events occur between the time at which trading in a foreign security is completed and 4 p.m. Eastern time that might call into question the reliability of the value of a portfolio security held by the Fund. As a result, differences may arise between the value of the Fund’s portfolio securities as determined at the foreign market close and the latest indications of value at 4 p.m. Eastern time. In order to minimize the potential for these differences, the VC monitors price movements following the close of trading in foreign stock markets through a series of country specific market proxies (such as baskets of American Depositary Receipts, futures contracts and exchange traded funds). These price movements are measured against established trigger thresholds for each specific market proxy to assist in determining if an event has occurred that may call into question the reliability of the values of the foreign securities held by the Fund. If such an event occurs, the securities may be valued using fair value procedures, which may include the use of independent pricing services.
FRANKLIN TEMPLETON VARIABLE INSURANCE PRODUCTS TRUST
NOTES TO FINANCIAL STATEMENTS (UNAUDITED)
Franklin Growth and Income VIP Fund(continued)
1. Organization and Significant Accounting
Policies(continued)
a. Financial Instrument Valuation(continued)
When the last day of the reporting period is anon-business day, certain foreign markets may be open on those days that the Fund’s NAV is not calculated, which could result in differences between the value of the Fund’s portfolio securities on the last business day and the last calendar day of the reporting period. Any significant security valuation changes due to an open foreign market are adjusted and reflected by the Fund for financial reporting purposes.
b. Foreign Currency Translation
Portfolio securities and other assets and liabilities denominated in foreign currencies are translated into U.S. dollars based on the exchange rate of such currencies against U.S. dollars on the date of valuation. The Fund may enter into foreign currency exchange contracts to facilitate transactions denominated in a foreign currency. Purchases and sales of securities, income and expense items denominated in foreign currencies are translated into U.S. dollars at the exchange rate in effect on the transaction date. Portfolio securities and assets and liabilities denominated in foreign currencies contain risks that those currencies will decline in value relative to the U.S. dollar. Occasionally, events may impact the availability or reliability of foreign exchange rates used to convert the U.S. dollar equivalent value. If such an event occurs, the foreign exchange rate will be valued at fair value using procedures established and approved by the Board.
The Fund does not separately report the effect of changes in foreign exchange rates from changes in market prices on securities held. Such changes are included in net realized and unrealized gain or loss from investments in the Statement of Operations.
Realized foreign exchange gains or losses arise from sales of foreign currencies, currency gains or losses realized between the trade and settlement dates on securities transactions and the difference between the recorded amounts of dividends, interest, and foreign withholding taxes and the U.S. dollar equivalent of the amounts actually received or paid. Net unrealized foreign exchange gains and losses arise from changes in foreign exchange rates on foreign denominated assets and liabilities other than investments in securities held at the end of the reporting period.
c. Joint Repurchase Agreement
The Fund enters into a joint repurchase agreement whereby its uninvested cash balance is deposited into a joint cash account with other funds managed by the investment manager or an affiliate of the investment manager and is used to invest in one or more repurchase agreements. The value and face amount of the joint repurchase agreement are allocated to the funds based on theirpro-rata interest. A repurchase agreement is accounted for as a loan by the Fund to the seller, collateralized by securities which are delivered to the Fund’s custodian. The fair value, including accrued interest, of the initial collateralization is required to be at least 102% of the dollar amount invested by the funds, with the value of the underlying securities marked to market daily to maintain coverage of at least 100%. Repurchase agreements are subject to the terms of Master Repurchase Agreements (MRAs) with approved counterparties (sellers). The MRAs contain various provisions, including but not limited to events of default and maintenance of collateral for repurchase agreements. In the event of default by either the seller or the Fund, certain MRAs may permit thenon-defaulting party to net andclose-out all transactions, if any, traded under such agreements. The Fund may sell securities it holds as collateral and apply the proceeds towards the repurchase price and any other amounts owed by the seller to the Fund in the event of default by the seller. This could involve costs or delays in addition to a loss on the securities if their value falls below the repurchase price owed by the seller. The joint repurchase agreement held by the Fund at period end, as indicated in the Statement of Investments, had been entered into on June 28, 2019.
d. Equity-Linked Securities
The Fund invests in equity-linked securities. Equity-linked securities are hybrid financial instruments that generally combine both debt and equity characteristics into a single note form. Income received from equity-linked securities is recorded as realized gains in the Statement of Operations and may be based on the performance of an underlying equity security, an equity index, or an option position. The risks of investing in equity-linked securities include unfavorable price movements in the underlying security and the credit risk of the issuing financial institution. There may be no guarantee of a return of principal with equity-linked securities and the appreciation potential may be limited. Equity-linked securities may be more volatile and less liquid than other investments held by the Fund.
FRANKLIN TEMPLETON VARIABLE INSURANCE PRODUCTS TRUST
NOTES TO FINANCIAL STATEMENTS (UNAUDITED)
Franklin Growth and Income VIP Fund(continued)
e. Income and Deferred Taxes
It is the Fund’s policy to qualify as a regulated investment company under the Internal Revenue Code. The Fund intends to distribute to shareholders substantially all of its taxable income and net realized gains to relieve it from federal income and if applicable, excise taxes. As a result, no provision for U.S. federal income taxes is required.
The Fund may be subject to foreign taxation related to income received, capital gains on the sale of securities and certain foreign currency transactions in the foreign jurisdictions in which it invests. Foreign taxes, if any, are recorded based on the tax regulations and rates that exist in the foreign markets in which the Fund invests. When a capital gain tax is determined to apply, the Fund records an estimated deferred tax liability in an amount that would be payable if the securities were disposed of on the valuation date.
The Fund may recognize an income tax liability related to its uncertain tax positions under U.S. GAAP when the uncertain tax position has a less than 50% probability that it will be sustained upon examination by the tax authorities based on its technical merits. As of June 30, 2019, the Fund has determined that no tax liability is required in its financial statements related to uncertain tax positions for any open tax years (or expected to be taken in future tax years). Open tax years are those that remain subject to examination and are based on the statute of limitations in each jurisdiction in which the Fund invests.
f. Security Transactions, Investment Income, Expenses and Distributions
Security transactions are accounted for on trade date. Realized gains and losses on security transactions are determined on a specific identification basis. Interest income and estimated expenses are accrued daily. Dividend income and capital gain distributions are recorded on theex-dividend date except for certain dividends from securities where the dividend rate is not available. In such cases, the dividend is recorded as soon as the information is received by the Fund. Distributions to shareholders are recorded on theex-dividend date. Distributable earnings are determined according to
income tax regulations (tax basis) and may differ from earnings recorded in accordance with U.S. GAAP. These differences may be permanent or temporary. Permanent differences are reclassified among capital accounts to reflect their tax character. These reclassifications have no impact on net assets or the results of operations. Temporary differences are not reclassified, as they may reverse in subsequent periods.
Common expenses incurred by the Trust are allocated among the Funds based on the ratio of net assets of each Fund to the combined net assets of the Trust or based on the ratio of number of shareholders of each Fund to the combined number of shareholders of the Trust. Fund specific expenses are charged directly to the Fund that incurred the expense.
Realized and unrealized gains and losses and net investment income, excluding class specific expenses, are allocated daily to each class of shares based upon the relative proportion of net assets of each class. Differences in per share distributions by class are generally due to differences in class specific expenses.
g. Accounting Estimates
The preparation of financial statements in accordance with U.S. GAAP requires management to make estimates and assumptions that affect the reported amounts of assets and liabilities at the date of the financial statements and the amounts of income and expenses during the reporting period. Actual results could differ from those estimates.
h. Guarantees and Indemnifications
Under the Trust’s organizational documents, its officers and trustees are indemnified by the Trust against certain liabilities arising out of the performance of their duties to the Trust. Additionally, in the normal course of business, the Trust, on behalf of the Fund, enters into contracts with service providers that contain general indemnification clauses. The Trust’s maximum exposure under these arrangements is unknown as this would involve future claims that may be made against the Trust that have not yet occurred. Currently, the Trust expects the risk of loss to be remote.
FRANKLIN TEMPLETON VARIABLE INSURANCE PRODUCTS TRUST
NOTES TO FINANCIAL STATEMENTS (UNAUDITED)
Franklin Growth and Income VIP Fund(continued)
2. Shares of Beneficial Interest
At June 30, 2019, there were an unlimited number of shares authorized (without par value). Transactions in the Fund’s shares were as follows:
| | | | | | | | | | | | | | | | | | | | |
| | | |
| | | Six Months Ended
June 30, 2019 | | | | | | Year Ended
December 31, 2018 | |
| | | | | |
| | | Shares | | | Amount | | | | | | Shares | | | Amount | |
| | | | | |
| Class 1 Shares: | | | | | | | | | | | | | | | | | | | | |
Shares sold | | | 45,108 | | | $ | 720,434 | | | | | | | | 84,856 | | | $ | 1,355,363 | |
Shares issued in reinvestment of distributions | | | 172,296 | | | | 2,665,418 | | | | | | | | 117,600 | | | | 1,845,139 | |
Shares redeemed | | | (122,875 | ) | | | (2,006,237 | ) | | | | | | | (272,261 | ) | | | (4,377,736) | |
| | | | |
| | | | | |
Net increase (decrease) | | | 94,529 | | | $ | 1,379,615 | | | | | | | | (69,805 | ) | | $ | (1,177,234) | |
| | | | |
| | | | | |
| Class 2 Shares: | | | | | | | | | | | | | | | | | | | | |
Shares sold | | | 75,031 | | | $ | 1,165,948 | | | | | | | | 100,573 | | | $ | 1,575,307 | |
Shares issued in reinvestment of distributions | | | 339,358 | | | | 5,148,061 | | | | | | | | 236,188 | | | | 3,639,656 | |
Shares redeemed. | | | (258,269 | ) | | | (4,102,810 | ) | | | | | | | (699,174 | ) | | | (10,966,210) | |
| | | | |
| | | | | |
Net increase (decrease) | | | 156,120 | | | $ | 2,211,199 | | | | | | | | (362,413 | ) | | $ | (5,751,247) | |
| | | | |
3. Transactions with Affiliates
Franklin Resources, Inc. is the holding company for various subsidiaries that together are referred to as Franklin Templeton. Certain officers and trustees of the Fund are also officers and/or directors of the following subsidiaries:
| | |
| |
| Subsidiary | | Affiliation |
Franklin Advisers, Inc. (Advisers) | | Investment manager |
Franklin Templeton Services, LLC (FT Services) | | Administrative manager |
Franklin Templeton Distributors, Inc. (Distributors) | | Principal underwriter |
Franklin Templeton Investor Services, LLC (Investor Services) | | Transfer agent |
a. Management Fees
The Fund pays an investment management fee to Advisers based on the average daily net assets of the Fund as follows:
| | |
| |
| Annualized Fee Rate | | Net Assets |
0.625% | | Up to and including $100 million |
0.500% | | Over $100 million, up to and including $250 million |
0.450% | | Over $250 million, up to and including $7.5 billion |
0.440% | | Over $7.5 billion, up to and including $10 billion |
0.430% | | Over $10 billion, up to and including $12.5 billion |
0.420% | | Over $12.5 billion, up to and including $15 billion |
0.400% | | In excess of $15 billion |
For the period ended June 30, 2019, the annualized gross effective investment management fee rate was 0.623% of the Fund’s average daily net assets.
FRANKLIN TEMPLETON VARIABLE INSURANCE PRODUCTS TRUST
NOTES TO FINANCIAL STATEMENTS (UNAUDITED)
Franklin Growth and Income VIP Fund(continued)
b. Administrative Fees
Under an agreement with Advisers, FT Services provides administrative services to the Fund. The fee is paid by Advisers based on the Fund’s average daily net assets, and is not an additional expense of the Fund.
c. Distribution Fees
The Board has adopted a distribution plan for Class 2 shares pursuant to Rule12b-1 under the 1940 Act. Under the Fund’s compensation distribution plan, the Fund pays Distributors for costs incurred in connection with the servicing, sale and distribution of the Fund’s shares up to 0.35% per year of its average daily net assets. The Board has agreed to limit the current rate to 0.25% per year for Class 2. The plan year, for purposes of monitoring compliance with the maximum annual plan rate, is February 1 through January 31.
d. Transfer Agent Fees
Investor Services, under terms of an agreement, performs shareholder servicing for the Fund and is not paid by the Fund for the services.
e. Waiver and Expense Reimbursements
Advisers has contractually agreed in advance to waive or limit its fees and to assume as its own expense certain expenses otherwise payable by the Fund so that the expenses (excluding distribution fees, acquired fund fees and expenses and certainnon-routine expenses or costs, including those relating to litigation, indemnification, reorganisation and liquidations) for each class of the Fund do not exceed 0.59% based on the average net assets of each class until April 30, 2020. Total expenses waived or paid are not subject to recapture subsequent to the Fund’s fiscal year end.
4. Expense Offset Arrangement
The Fund has entered into an arrangement with its custodian whereby credits realized as a result of uninvested cash balances are used to reduce a portion of the Fund’s custodian expenses. During the period ended June 30, 2019, the custodian fees were reduced as noted in the Statement of Operations.
5. Income Taxes
At June 30, 2019, the cost of investments and net unrealized appreciation (depreciation) for income tax purposes were as follows:
| | | | |
Cost of investments | | $ | 71,930,751 | |
| | | | |
| |
Unrealized appreciation | | $ | 31,844,396 | |
Unrealized depreciation | | | (862,954) | |
| | | | |
| |
Net unrealized appreciation (depreciation) | | $ | 30,981,442 | |
| | | | |
Differences between income and/or capital gains as determined on a book basis and a tax basis are primarily due to differing treatments of equity linked securities and bond discounts and premiums.
6. Investment Transactions
Purchases and sales of investments (excluding short term securities) for the period ended June 30, 2019, aggregated $12,974,248 and $16,032,960, respectively.
| | | | | | |
| | | |
| | Semiannual Report �� | | | FGI-19 | |
FRANKLIN TEMPLETON VARIABLE INSURANCE PRODUCTS TRUST
NOTES TO FINANCIAL STATEMENTS (UNAUDITED)
Franklin Growth and Income VIP Fund(continued)
7. Credit Facility
The Fund, together with other U.S. registered and foreign investment funds (collectively, Borrowers), managed by Franklin Templeton, are borrowers in a joint syndicated senior unsecured credit facility totaling $2 billion (Global Credit Facility) which matures on February 7, 2020. This Global Credit Facility provides a source of funds to the Borrowers for temporary and emergency purposes, including the ability to meet future unanticipated or unusually large redemption requests.
Under the terms of the Global Credit Facility, the Fund shall, in addition to interest charged on any borrowings made by the Fund and other costs incurred by the Fund, pay its share of fees and expenses incurred in connection with the implementation and maintenance of the Global Credit Facility, based upon its relative share of the aggregate net assets of all of the Borrowers, including an annual commitment fee of 0.15% based upon the unused portion of the Global Credit Facility. These fees are reflected in other expenses in the Statement of Operations. During the period ended June 30, 2019, the Fund did not use the Global Credit Facility.
8. Fair Value Measurements
The Fund follows a fair value hierarchy that distinguishes between market data obtained from independent sources (observable inputs) and the Fund’s own market assumptions (unobservable inputs). These inputs are used in determining the value of the Fund’s financial instruments and are summarized in the following fair value hierarchy:
| | • | | Level 1 – quoted prices in active markets for identical financial instruments |
| | • | | Level 2 – other significant observable inputs (including quoted prices for similar financial instruments, interest rates, prepayment speed, credit risk, etc.) |
| | • | | Level 3 – significant unobservable inputs (including the Fund’s own assumptions in determining the fair value of financial instruments) |
The input levels are not necessarily an indication of the risk or liquidity associated with financial instruments at that level.
A summary of inputs used as of June 30, 2019, in valuing the Fund’s assets carried at fair value, is as follows:
| | | | | | | | | | | | | | | | |
| | | | |
| | | Level 1 | | | Level 2 | | | Level 3 | | | Total | |
| |
| | | | |
| Assets: | | | | | | | | | | | | | | | | |
| | | | |
Investments in Securities:a | | | | | | | | | | | | | | | | |
| | | | |
Equity Investmentsb | | $ | 92,504,434 | | | $ | — | | | $ | — | | | $ | 92,504,434 | |
| | | | |
Equity-Linked Securities | | | — | | | | 9,940,580 | | | | — | | | | 9,940,580 | |
| | | | |
Short Term Investments | | | — | | | | 467,179 | | | | — | | | | 467,179 | |
| | | | |
| | | | |
Total Investments in Securities | | $ | 92,504,434 | | | $ | 10,407,759 | | | $ | — | | | $ | 102,912,193 | |
| | | | |
aFor detailed categories, see the accompanying Statement of Investments.
bIncludes common and convertible preferred stocks.
9. Subsequent Events
The Fund has evaluated subsequent events through the issuance of the financial statements and determined that no events have occurred that require disclosure.
FRANKLIN TEMPLETON VARIABLE INSURANCE PRODUCTS TRUST
NOTES TO FINANCIAL STATEMENTS (UNAUDITED)
Franklin Growth and Income VIP Fund(continued)
Abbreviations
| | |
|
| Selected Portfolio |
| |
| ADR | | American Depositary Receipt |
This page intentionally left blank.
Franklin Income VIP Fund
This semiannual report for Franklin Income VIP Fund covers the period ended June 30, 2019.
Class 2 Performance Summary as of June 30, 2019
The Fund’s Class 2 Shares posted a +11.10% total return* for thesix-month period ended June 30, 2019.
*The Fund has a fee waiver associated with any investment it makes in a Franklin Templeton money fund and/or other Franklin Templeton fund, contractually guaranteed through 4/30/20. Fund investment results reflect the fee waiver; without this waiver, the results would have been lower.
Performance reflects the Fund’s Class 2 operating expenses, but doesnotinclude any contract fees, expenses or sales charges. If they had been included, performance would be lower. These charges and deductions, particularly for variable life policies, can have a significant effect on contract values and insurance benefits. See the contract prospectus for a complete description of these expenses, including sales charges.
Performance data represent past performance, which does not guarantee future results. Investment return and principal value will fluctuate, and you may have a gain or loss when you sell your shares. Current performance may differ from figures shown.
FRANKLIN INCOME VIP FUND
Fund Goal and Main Investments
The Fund seeks to maximize income, while maintaining prospects for capital appreciation. Under normal market conditions, the Fund invests in a diversified portfolio of debt and equity securities.
Fund Risks
All investments involve risks, including possible loss of principal. Stock prices fluctuate, sometimes rapidly and dramatically, due to factors affecting individual companies, particular industries or sectors, or general market conditions. The Fund’s portfolio includes a substantial portion of higher yielding, lower rated corporate bonds because of the relatively higher yields they offer. The Fund’s share price and yield will be affected by interest rate movements. Bond prices generally move in the opposite direction of interest rates. Thus, as prices of bonds in the Fund adjust to a rise in interest rates, the Fund’s share price may decline. Changes in the financial strength of a bond issuer or in a bond’s credit rating may affect its value. Foreign investing carries additional risks such as currency and market volatility and political or social instability, risks that are heightened in developing countries. The Fund is actively managed but there is no guarantee that the manager’s investment decisions will produce the desired results. The Fund’s prospectus also includes a description of the main investment risks.
Performance Overview
You can find the Fund’ssix-month total return in the Performance Summary. In comparison, the Fund’s primary benchmark, the Standard & Poor’s® 500 Index (S&P 500®), posted an +18.54% total return.1 The Fund’s new secondary benchmark, the Blended 50% MSCI USA High Dividend Yield Index + 25% Bloomberg Barclays High Yield Very Liquid Index + 25% Bloomberg Barclays US Aggregate Index posted a +10.58% total return (Blended Benchmark).2 The Fund’s old secondary benchmark, the Bloomberg Barclays U.S. Aggregate Bond Index posted a +6.11% total return.1 We believe the new second benchmark’s composition more accurately reflects the Fund’s holdings.
| | | | |
| Portfolio Composition | | | | |
| 6/30/19 | | | | |
| |
| | | % of Total
Net Assets | |
| Equity* | | | 46.5% | |
| Financials | | | 7.6% | |
| Health Care | | | 6.1% | |
| Information Technology | | | 5.9% | |
| Energy | | | 5.5% | |
| Utilities | | | 5.5% | |
| Communication Services | | | 3.7% | |
| Consumer Discretionary | | | 3.6% | |
| Materials | | | 3.4% | |
| Consumer Staples | | | 3.2% | |
| Industrials | | | 1.5% | |
| Real Estate | | | 0.5% | |
| Fixed Income** | | | 48.5% | |
| Health Care | | | 14.6% | |
| Financials | | | 12.9% | |
| Energy | | | 6.5% | |
| Communication Services | | | 5.0% | |
| Consumer Discretionary | | | 2.7% | |
| Materials | | | 1.7% | |
| Industrials | | | 1.6% | |
| Utilities | | | 1.1% | |
| Consumer Staples | | | 1.1% | |
| Information Technology | | | 0.7% | |
| Real Estate | | | 0.6% | |
| Short-Term Investments & Other Net Assets | | | 5.0% | |
*Includes convertible bonds.
**Includes senior floating rate interests and index-linked notes.
Economic and Market Overview
The U.S. economy grew during the six months ended June 30, 2019. After moderating for two consecutive quarters, the economy grew significantly faster in 2019’s first quarter, driven by growth in consumer spending, inventory investment, exports, business investment, and state and local government spending. However, the economy moderated again in the second quarter, due to weakness in
1. Source: Morningstar.
2. Source: Factset. The Fund’s blended benchmark was calculated internally and rebalanced monthly. One cannot invest directly in an index, and an index is not representative of the Fund’s portfolio. Please see Index Descriptions following the Fund Summaries.
The dollar value, number of shares or principal amount, and names of all portfolio holdings are listed in the Fund’s Statement of Investments (SOI).
FRANKLIN INCOME VIP FUND
inventory investment, exports, business investment and housing investment. The manufacturing and services sectors expanded during the period. The unemployment rate decreased from 3.9% in December 2018 to 3.7% atperiod-end.3 The annual inflation rate, as measured by the Consumer Price Index, decreased from 1.9% in December 2018 to 1.6% atperiod-end.3
The U.S. Federal Reserve (Fed) held its target range for the federal funds rate unchanged, at 2.25%–2.50%, during the reporting period. In March, the Fed mentioned it would end its balance sheet normalization program by the end of September 2019. In June, the Fed indicated increased uncertainties around its views on economic activity and the labor market. With market-based inflation measures remaining low in recent months, the market has interpreted the Fed’s recent statements to mean it will likely cut rates in 2019’s second half to foster continued economic growth while attempting to achieve its inflation objective.
The10-year Treasury yield, which moves inversely to its price, decreased during the period. The yield rose at some points during 2019’s first quarter amid several better-than-expected U.S. economic reports and optimism about a potential U.S.-China trade deal. However, concerns about political uncertainties in the U.S., slower domestic and global economic growth, and the Fed’s patient approach to its monetary policy decisions weighed on the Treasury yield. Nearperiod-end, the10-year yield reached multi-year lows and fell below certain short-term yields, due to weaker economic data and escalating U.S. trade tensions with China and Mexico. Overall, the10-year Treasury yield declined from 2.69% at the beginning of the period to 2.00% atperiod-end.
Investment Strategy
In analyzing debt and equity securities, we consider such factors as a company’s experience and managerial strength; responsiveness to changes in interest rates and business conditions; debt maturity schedules and borrowing requirements; changing financial condition and market recognition of the change; and a security’s relative value based on such factors as anticipated cash flow, interest or dividend coverage, asset coverage and earnings. When choosing investments for the Fund, we apply abottom-up, value oriented, long-term approach, focusing on the market price of a company’s securities relative to the investment manager’s evaluation of the company’s long-term earnings, asset value and cash flow potential.
3. Source: Bureau of Labor Statistics.
| | | | |
| Top Five Equity Holdings | | | | |
| 6/30/19 | | | | |
| |
Company Sector/Industry | | % of Total
Net Assets | |
Wells Fargo & Co.
Financials | | | 2.1% | |
The Southern Co.
Utilities | | | 1.7% | |
JPMorgan Chase & Co.
Banks | | | 1.6% | |
Dominion Energy Inc.
Utilities | | | 1.6% | |
Verizon Communications Inc.
Communication Services | | | 1.3% | |
Manager’s Discussion
The Fund outperformed during thesix-month period driven by strong performance across both equity and fixed income holdings. Asset allocation was relatively stable during thesix-month period and ended with 48.5% in fixed income, 46.5% in equity and 5.0% in cash.
Fixed income holdings benefited from the sharp decline in interest rates during the period as well as the stabilization and then decline in credit spreads following the turbulence experienced at the end of 2018. This was true across most credit ratings categories and corporate sectors.
Health care bonds were significant positive contributors, especially those in the hospital services sector including Tenet Healthcare and Community Health Systems, where improvements in operations and focus on balance sheet improvements drove total return.
Energy sector corporate bond holdings were weak, especially Weatherford International as the company seeks a broader recapitalization of its balance sheet necessitated at least in part by the deteriorating upstream oil and gas fundamental outlook.
While our Treasury holdings benefited performance during periods of elevated market volatility, the generally shorter duration of our positioning lagged the broader market move amid the sharp decline in longer-term interest rates.
The Fund had positive performance from all sectors across the equity asset class with top contributors to performance in utilities, consumer discretionary and information technology.
FRANKLIN INCOME VIP FUND
| | | | |
Top Five Fixed Income Holdings and Senior Floating Rate Interests* | | | | |
| 6/30/19 | | | | |
| |
Company Sector/Industry | | % of Total
Net Assets | |
U.S. Treasury Note
Financials | | | 7.0% | |
CHS/Community Health Systems Inc.
Health Care | | | 4.8% | |
Tenet Healthcare Corp.
Health Care | | | 2.8% | |
Chesapeake Energy Corp. Energy | | | 2.6% | |
Bausch Health Cos. Inc.
Health Care | | | 1.8% | |
*Does not include convertible bonds.
Utilities including Southern Co. and Sempra Energy benefited from the decline in interest rates and heightened investor interest in stable businesses amid prospects for weakening economic growth and uncertainty related to trade tensions.
Consumer discretionary holdings, including Target and Ford Motor, had better-than-expected earnings as the macro backdrop improved due in part to the dovish pivot by the Federal Reserve.
Technology and financial sector exposures round out the list of top contributors, especially JP Morgan Chase, Bank of America, Apple and Texas Instruments.
Energy sector equity positions were the leading detractors, including the convertible securities of Weatherford International and the common equity investments in Occidental Petroleum and Halliburton.
Thank you for your participation in Franklin Income VIP Fund. We look forward to serving your future investment needs.
The foregoing information reflects our analysis, opinions and portfolio holdings as of June 30, 2019, the end of the reporting period. The way we implement our main investment strategies and the resulting portfolio holdings may change depending on factors such as market and economic conditions. These opinions may not be relied upon as investment advice or an offer for a particular security. The information is not a complete analysis of every aspect of any market, country, industry, security or the Fund. Statements of fact are from sources considered reliable, but the investment manager makes no representation or warranty as to their completeness or accuracy. Although historical performance is no guarantee of future results, these insights may help you understand our investment management philosophy.
FRANKLIN INCOME VIP FUND
Class 2 Fund Expenses
As an investor in a variable insurance contract (Contract) that indirectly provides for investment in an underlying mutual fund, you can incur transaction and/or ongoing expenses at both the Fund level and the Contract Level: (1) transaction expenses can include sales charges (loads) on purchases, surrender fees, transfer fees and premium taxes; and (2) ongoing expenses can include management fees, distribution and service(12b-1) fees, contract fees, annual maintenance fees, mortality and expense risk fees and other fees and expenses. All mutual funds and Contracts have some types of ongoing expenses. The table below shows Fund-level ongoing expenses and can help you understand these costs and compare them with those of other mutual funds offered through the Contract. The table assumes a $1,000 investment held for the six months indicated. Please refer to the Fund prospectus for additional information on operating expenses.
Actual Fund Expenses
The table below provides information about the actual account values and actual expenses in the columns under the heading “Actual.” In these columns the Fund’s actual return, which includes the effect of ongoing Fund expenses but does not include the effect of ongoing Contract expenses, is used to calculate the “Ending Account Value.” You can estimate the Fund-level expenses you paid during the period by following these steps (of course, your account value and expenses will differ from those in this illustration): Divide your account value by $1,000 (ifyour account had an $8,600 value, then $8,600÷$1,000 = 8.6). Then multiply the result by the number under the headings “Actual” and “Fund-Level Expenses Paid During Period” (ifFund-Level Expenses Paid During Period were $ 7.50, then 8.6 x $ 7.50 = $64.50). In this illustration, the estimated expenses paid this period at the Fund level are $64.50.
Hypothetical Example for Comparison with Other Mutual Funds
Under the heading “Hypothetical” in the table, information is provided about hypothetical account values and hypothetical expenses based on the Fund’s actual expense ratio and an assumed rate of return of 5% per year before expenses, which is not the Fund’s actual return. This information may not be used to estimate the actual ending account balance or expenses you paid for the period, but it can help you compare ongoing costs of investing in the Fund with those of other mutual funds offered through the Contract. To do so, compare this 5% hypothetical example with the 5% hypothetical examples that appear in the shareholder reports of other funds offered through the Contract.
Please note that expenses shown in the table are meant to highlight ongoing costs at the Fund level only and do not reflect any ongoing expenses at the Contract level, or transaction expenses at either the Fund or Contract levels. In addition, while the Fund does not have transaction expenses, if the transaction and ongoing expenses at the Contract level were included, the expenses shown below would be higher. You should consult your Contract prospectus or disclosure document for more information.
| | | | | | | | | | | | | | | | | | |
| | | | | | | Actual
(actual return after expenses) | | | | Hypothetical
(5% annual return before expenses) | | | | |
Share Class | | Beginning
Account
Value 1/1/19 | | | | Ending
Account
Value 6/30/19 | | Fund-Level
Expenses
Paid During
Period
1/1/19–6/30/191, 2 | | | | Ending
Account
Value 6/30/19 | | Fund-Level
Expenses
Paid During
Period
1/1/19–6/30/191, 2 | | | | Net
Annualized
Expense
Ratio2 |
Class 2 | | $1,000 | | | | $1,111.00 | | $3.72 | | | | $1,021.27 | | $3.56 | | | | 0.71% |
1. Expenses are equal to the annualized expense ratio for thesix-month period as indicated above—in the far right column—multiplied by the simple average account value over the period indicated, and then multiplied by 181/365 to reflect theone-half year period.
2. Reflects expenses after fee waivers and expense reimbursements. Does not include any ongoing expenses of the Contract for which the Fund is an investment option or acquired fund fees and expenses.
FRANKLIN TEMPLETON VARIABLE INSURANCE PRODUCTS TRUST
Financial Highlights
Franklin Income VIP Fund
| | | | | | | | | | | | | | | | | | | | | | | | |
| | |
| | | Six Months Ended
June 30, 2019 (unaudited) | | | Year Ended December 31, | |
| | | 2018 | | | 2017 | | | 2016 | | | 2015 | | | 2014 | |
| |
| | | | | | |
| Class 1 | | | | | | | | | | | | | | | | | | | | | | | | |
| | | | | | |
Per share operating performance
(for a share outstanding throughout the period) | | | | | | | | | | | | | | | | | | | | | | | | |
| | | | | | |
Net asset value, beginning of period | | | $15.26 | | | | $16.72 | | | | $15.87 | | | | $14.64 | | | | $16.48 | | | | $16.53 | |
| | | | |
| | | | | | |
| Income from investment operationsa: | | | | | | | | | | | | | | | | | | | | | | | | |
| | | | | | |
Net investment incomeb | | | 0.39 | | | | 0.71 | | | | 0.69 | | | | 0.67 | | | | 0.71 | | | | 0.72 | |
| | | | | | |
Net realized and unrealized gains (losses) | | | 1.31 | | | | (1.35 | ) | | | 0.87 | | | | 1.34 | | | | (1.78 | ) | | | 0.11 | |
| | | | |
| | | | | | |
| Total from investment operations | | | 1.70 | | | | (0.64 | ) | | | 1.56 | | | | 2.01 | | | | (1.07 | ) | | | 0.83 | |
| | | | |
| | | | | | |
| Less distributions from: | | | | | | | | | | | | | | | | | | | | | | | | |
| | | | | | |
Net investment income | | | (0.91 | ) | | | (0.82 | ) | | | (0.71 | ) | | | (0.78 | ) | | | (0.77 | ) | | | (0.88) | |
| | | | | | |
Net realized gains | | | (0.26 | ) | | | — | | | | — | | | | — | | | | — | | | | — | |
| | | | |
| | | | | | |
Total distributions | | | (1.17 | ) | | | (0.82 | ) | | | (0.71 | ) | | | (0.78 | ) | | | (0.77 | ) | | | (0.88) | |
| | | | |
| | | | | | |
Net asset value, end of period | | | $15.79 | | | | $15.26 | | | | $16.72 | | | | $15.87 | | | | $14.64 | | | | $16.48 | |
| | | | |
| | | | | | |
Total returnc | | | 11.28% | | | | (4.09)% | | | | 9.94% | | | | 14.33% | | | | (6.84)% | | | | 4.92% | |
| | | | | | |
| Ratios to average net assetsd | | | | | | | | | | | | | | | | | | | | | | | | |
| | | | | | |
Expenses before waiver and payments by affiliates | | | 0.47% | | | | 0.47% | | | | 0.47% | | | | 0.47% | | | | 0.46% | | | | 0.47% | |
| | | | | | |
Expenses net of waiver and payments by affiliatese | | | 0.46% | | | | 0.45% | | | | 0.45% | | | | 0.44% | | | | 0.46%f | | | | 0.47% | |
| | | | | | |
Net investment income | | | 4.55% | | | | 4.33% | | | | 4.22% | | | | 4.47% | | | | 4.47% | | | | 4.26% | |
| | | | | | |
| Supplemental data | | | | | | | | | | | | | | | | | | | | | | | | |
| | | | | | |
Net assets, end of period (000’s) | | | $384,807 | | | | $612,657 | | | | $735,149 | | | | $696,227 | | | | $604,228 | | | | $714,664 | |
| | | | | | |
Portfolio turnover rate | | | 10.42% | | | | 43.22% | | | | 20.96% | | | | 39.03% | | | | 31.53% | | | | 24.77% | |
aThe amount shown for a share outstanding throughout the period may not correlate with the Statement of Operations for the period due to the timing of sales and repurchases of the Fund’s shares in relation to income earned and/or fluctuating fair value of the investments of the Fund.
bBased on average daily shares outstanding.
cTotal return does not include fees, charges or expenses imposed by the variable annuity and life insurance contracts for which Franklin Templeton Variable Insurance Products Trust serves as an underlying investment vehicle. Total return is not annualized for periods less than one year.
dRatios are annualized for periods less than one year.
eBenefit of expense reduction rounds to less than 0.01%.
fBenefit of waiver and payments by affiliates rounds to less than 0.01%.
| | | | |
| | | |
FI-6 | | Semiannual Report | The accompanying notes are an integral part of these financial statements. | | |
FRANKLIN TEMPLETON VARIABLE INSURANCE PRODUCTS TRUST
FINANCIAL HIGHLIGHTS
Franklin Income VIP Fund(continued)
| | | | | | | | | | | | | | | | | | | | | | | | |
| | |
| | | Six Months Ended
June 30, 2019 (unaudited) | | | Year Ended December 31, | |
| | | 2018 | | | 2017 | | | 2016 | | | 2015 | | | 2014 | |
| |
| | | | | | |
| Class 2 | | | | | | | | | | | | | | | | | | | | | | | | |
| | | | | | |
Per share operating performance
(for a share outstanding throughout the period) | | | | | | | | | | | | | | | | | | | | | | | | |
| | | | | | |
Net asset value, beginning of period | | | $14.74 | | | | $16.17 | | | | $15.38 | | | | $14.20 | | | | $16.00 | | | | $16.07 | |
| | | | |
| | | | | | |
| Income from investment operationsa: | | | | | | | | | | | | | | | | | | | | | | | | |
| | | | | | |
Net investment incomeb | | | 0.34 | | | | 0.65 | | | | 0.63 | | | | 0.61 | | | | 0.65 | | | | 0.66 | |
| | | | | | |
Net realized and unrealized gains (losses) | | | 1.28 | | | | (1.30 | ) | | | 0.83 | | | | 1.31 | | | | (1.73 | ) | | | 0.11 | |
| | | | |
| | | | | | |
| Total from investment operations | | | 1.62 | | | | (0.65 | ) | | | 1.46 | | | | 1.92 | | | | (1.08 | ) | | | 0.77 | |
| | | | |
| | | | | | |
| Less distributions from: | | | | | | | | | | | | | | | | | | | | | | | | |
| | | | | | |
Net investment income | | | (0.87 | ) | | | (0.78 | ) | | | (0.67 | ) | | | (0.74 | ) | | | (0.72 | ) | | | (0.84) | |
| | | | | | |
Net realized gains | | | (0.26 | ) | | | — | | | | — | | | | — | | | | — | | | | — | |
| | | | |
| | | | | | |
Total distributions | | | (1.13 | ) | | | (0.78 | ) | | | (0.67 | ) | | | (0.74 | ) | | | (0.72 | ) | | | (0.84) | |
| | | | |
| | | | | | |
Net asset value, end of period | | | $15.23 | | | | $14.74 | | | | $16.17 | | | | $15.38 | | | | $14.20 | | | | $16.00 | |
| | | | |
| | | | | | |
Total returnc | | | 11.10% | | | | (4.30)% | | | | 9.67% | | | | 14.02% | | | | (7.05)% | | | | 4.62% | |
| | | | | | |
| Ratios to average net assetsd | | | | | | | | | | | | | | | | | | | | | | | | |
| | | | | | |
Expenses before waiver and payments by affiliates | | | 0.72% | | | | 0.72% | | | | 0.72% | | | | 0.72% | | | | 0.71% | | | | 0.72% | |
| | | | | | |
Expenses net of waiver and payments by affiliatese | | | 0.71% | | | | 0.70% | | | | 0.70% | | | | 0.69% | | | | 0.71%f | | | | 0.72% | |
| | | | | | |
Net investment income | | | 4.30% | | | | 4.08% | | | | 3.97% | | | | 4.22% | | | | 4.22% | | | | 4.01% | |
| | | | | | |
| Supplemental data | | | | | | | | | | | | | | | | | | | | | | | | |
| | | | | | |
Net assets, end of period (000’s) | | | $4,366,594 | | | | $4,086,652 | | | | $5,041,498 | | | | $5,088,556 | | | | $4,907,599 | | | | $6,022,804 | |
| | | | | | |
Portfolio turnover rate | | | 10.42% | | | | 43.22% | | | | 20.96% | | | | 39.03% | | | | 31.53% | | | | 24.77% | |
aThe amount shown for a share outstanding throughout the period may not correlate with the Statement of Operations for the period due to the timing of sales and repurchases of the Fund’s shares in relation to income earned and/or fluctuating fair value of the investments of the Fund.
bBased on average daily shares outstanding.
cTotal return does not include fees, charges or expenses imposed by the variable annuity and life insurance contracts for which Franklin Templeton Variable Insurance Products Trust serves as an underlying investment vehicle. Total return is not annualized for periods less than one year.
dRatios are annualized for periods less than one year.
eBenefit of expense reduction rounds to less than 0.01%.
fBenefit of waiver and payments by affiliates rounds to less than 0.01%.
| | | | | | |
| | | |
| | The accompanying notes are an integral part of these financial statements. | Semiannual Report | | | FI-7 | |
FRANKLIN TEMPLETON VARIABLE INSURANCE PRODUCTS TRUST
FINANCIAL HIGHLIGHTS
Franklin Income VIP Fund(continued)
| | | | | | | | | | | | | | | | | | | | | | | | |
| | |
| | | Six Months Ended
June 30, 2019 (unaudited) | | | Year Ended December 31, | |
| | | 2018 | | | 2017 | | | 2016 | | | 2015 | | | 2014 | |
| |
| | | | | | |
| Class 4 | | | | | | | | | | | | | | | | | | | | | | | | |
| | | | | | |
Per share operating performance
(for a share outstanding throughout the period) | | | | | | | | | | | | | | | | | | | | | | | | |
| | | | | | |
Net asset value, beginning of period | | | $15.08 | | | | $16.53 | | | | $15.71 | | | | $14.49 | | | | $16.31 | | | | $16.36 | |
| | | | |
| | | | | | |
| Income from investment operationsa: | | | | | | | | | | | | | | | | | | | | | | | | |
| | | | | | |
Net investment incomeb | | | 0.33 | | | | 0.64 | | | | 0.62 | | | | 0.61 | | | | 0.65 | | | | 0.66 | |
| | | | | | |
Net realized and unrealized gains (losses) | | | 1.32 | | | | (1.33 | ) | | | 0.85 | | | | 1.33 | | | | (1.76 | ) | | | 0.11 | |
| | | | |
| | | | | | |
| Total from investment operations | | | 1.65 | | | | (0.69 | ) | | | 1.47 | | | | 1.94 | | | | (1.11 | ) | | | 0.77 | |
| | | | |
| | | | | | |
| Less distributions from: | | | | | | | | | | | | | | | | | | | | | | | | |
| | | | | | |
Net investment income | | | (0.85 | ) | | | (0.76 | ) | | | (0.65 | ) | | | (0.72 | ) | | | (0.71 | ) | | | (0.82) | |
| | | | | | |
Net realized gains | | | (0.26 | ) | | | — | | | | — | | | | — | | | | — | | | | — | |
| | | | |
| | | | | | |
Total distributions | | | (1.11 | ) | | | (0.76 | ) | | | (0.65 | ) | | | (0.72 | ) | | | (0.71 | ) | | | (0.82) | |
| | | | |
| | | | | | |
Net asset value, end of period | | | $15.62 | | | | $15.08 | | | | $16.53 | | | | $15.71 | | | | $14.49 | | | | $16.31 | |
| | | | |
| | | | | | |
Total returnc | | | 11.07% | | | | (4.42)% | | | | 9.55% | | | | 13.87% | | | | (7.15)% | | | | 4.52% | |
| | | | | | |
| Ratios to average net assetsd | | | | | | | | | | | | | | | | | | | | | | | | |
| | | | | | |
Expenses before waiver and payments by affiliates | | | 0.82% | | | | 0.82% | | | | 0.82% | | | | 0.82% | | | | 0.81% | | | | 0.82% | |
| | | | | | |
Expenses net of waiver and payments by affiliatese | | | 0.81% | | | | 0.80% | | | | 0.80% | | | | 0.79% | | | | 0.81%f | | | | 0.82% | |
| | | | | | |
Net investment income | | | 4.20% | | | | 3.98% | | | | 3.87% | | | | 4.12% | | | | 4.12% | | | | 3.91% | |
| | | | | | |
| Supplemental data | | | | | | | | | | | | | | | | | | | | | | | | |
| | | | | | |
Net assets, end of period (000’s) | | | $317,776 | | | | $294,700 | | | | $335,217 | | | | $309,935 | | | | $306,023 | | | | $378,545 | |
| | | | | | |
Portfolio turnover rate | | | 10.42% | | | | 43.22% | | | | 20.96% | | | | 39.03% | | | | 31.53% | | | | 24.77% | |
aThe amount shown for a share outstanding throughout the period may not correlate with the Statement of Operations for the period due to the timing of sales and repurchases of the Fund’s shares in relation to income earned and/or fluctuating fair value of the investments of the Fund.
bBased on average daily shares outstanding.
cTotal return does not include fees, charges or expenses imposed by the variable annuity and life insurance contracts for which Franklin Templeton Variable Insurance Products Trust serves as an underlying investment vehicle. Total return is not annualized for periods less than one year.
dRatios are annualized for periods less than one year.
eBenefit of expense reduction rounds to less than 0.01%.
fBenefit of waiver and payments by affiliates rounds to less than 0.01%.
| | | | |
| | | |
FI-8 | | Semiannual Report | The accompanying notes are an integral part of these financial statements. | | |
FRANKLIN TEMPLETON VARIABLE INSURANCE PRODUCTS TRUST
Statement of Investments, June 30, 2019 (unaudited)
Franklin Income VIP Fund
| | | | | | | | | | | | |
| | | Country | | Shares | | | | | Value | |
| |
| | | | |
Common Stocks 39.0% | | | | | | | | | | | | |
Communication Services 1.8% | | | | | | | | | | | | |
BCE Inc. | | Canada | | | 466,000 | | | | | $ | 21,198,152 | |
Verizon Communications Inc. | | United States | | | 1,200,000 | | | | | | 68,556,000 | |
| | | | | | | | | | | | |
| | | | | | | | | | | 89,754,152 | |
| | | | | | | | | | | | |
Consumer Discretionary 2.7% | | | | | | | | | | | | |
Ford Motor Co. | | United States | | | 3,903,000 | | | | | | 39,927,690 | |
General Motors Co. | | United States | | | 1,425,000 | | | | | | 54,905,250 | |
Target Corp. | | United States | | | 500,000 | | | | | | 43,305,000 | |
| | | | | | | | | | | | |
| | | | | | | | | | | 138,137,940 | |
| | | | | | | | | | | | |
Consumer Staples 3.2% | | | | | | | | | | | | |
Anheuser-Busch InBev SA/NV, ADR | | Belgium | | | 300,000 | | | | | | 26,553,000 | |
The Coca-Cola Co. | | United States | | | 245,600 | | | | | | 12,505,952 | |
PepsiCo Inc. | | United States | | | 300,000 | | | | | | 39,339,000 | |
Philip Morris International Inc. | | United States | | | 350,000 | | | | | | 27,485,500 | |
The Procter & Gamble Co. | | United States | | | 500,000 | | | | | | 54,825,000 | |
| | | | | | | | | | | | |
| | | | | | | | | | | 160,708,452 | |
| | | | | | | | | | | | |
Energy 5.0% | | | | | | | | | | | | |
Baker Hughes a GE Co., A | | United States | | | 795,000 | | | | | | 19,580,850 | |
Chevron Corp. | | United States | | | 400,000 | | | | | | 49,776,000 | |
Exxon Mobil Corp. | | United States | | | 500,000 | | | | | | 38,315,000 | |
Halliburton Co. | | United States | | | 839,165 | | | | | | 19,082,612 | |
Occidental Petroleum Corp. | | United States | | | 500,000 | | | | | | 25,140,000 | |
Royal Dutch Shell PLC, A, ADR | | United Kingdom | | | 900,000 | | | | | | 58,563,000 | |
Schlumberger Ltd. | | United States | | | 225,000 | | | | | | 8,941,500 | |
TC Energy Corp. | | Canada | | | 350,000 | | | | | | 17,332,000 | |
The Williams Cos. Inc. | | United States | | | 600,000 | | | | | | 16,824,000 | |
| | | | | | | | | | | | |
| | | | | | | | | | | 253,554,962 | |
| | | | | | | | | | | | |
Financials 5.6% | | | | | | | | | | | | |
Bank of America Corp. | | United States | | | 715,000 | | | | | | 20,735,000 | |
Barclays PLC | | United Kingdom | | | 12,500,000 | | | | | | 23,779,813 | |
JPMorgan Chase & Co. | | United States | | | 600,000 | | | | | | 67,080,000 | |
MetLife Inc. | | United States | | | 1,095,108 | | | | | | 54,394,015 | |
Morgan Stanley | | United States | | | 250,000 | | | | | | 10,952,500 | |
Wells Fargo & Co. | | United States | | | 2,200,000 | | | | | | 104,104,000 | |
| | | | | | | | | | | | |
| | | | | | | | | | | 281,045,328 | |
| | | | | | | | | | | | |
Health Care 5.7% | | | | | | | | | | | | |
AstraZeneca PLC | | United Kingdom | | | 700,000 | | | | | | 57,231,565 | |
Bristol-Myers Squibb Co. | | United States | | | 1,000,000 | | | | | | 45,350,000 | |
CVS Health Corp. | | United States | | | 750,000 | | | | | | 40,867,500 | |
Johnson & Johnson | | United States | | | 230,000 | | | | | | 32,034,400 | |
Merck & Co. Inc. | | United States | | | 700,000 | | | | | | 58,695,000 | |
Pfizer Inc. | | United States | | | 1,300,000 | | | | | | 56,316,000 | |
| | | | | | | | | | | | |
| | | | | | | | | | | 290,494,465 | |
| | | | | | | | | | | | |
FRANKLIN TEMPLETON VARIABLE INSURANCE PRODUCTS TRUST
STATEMENT OF INVESTMENTS (UNAUDITED)
Franklin Income VIP Fund(continued)
| | | | | | | | | | |
| | | Country | | Shares | | | Value | |
| |
| | | |
Common Stocks(continued) | | | | | | | | | | |
Industrials 1.5% | | | | | | | | | | |
3M Co. | | United States | | | 250,000 | | | $ | 43,335,000 | |
aCummins Inc. | | United States | | | 200,000 | | | | 34,268,000 | |
| | | | | | | | | | |
| | | |
| | | | | | | | | 77,603,000 | |
| | | | | | | | | | |
| | | |
Information Technology 5.3% | | | | | | | | | | |
Apple Inc. | | United States | | | 309,783 | | | | 61,312,251 | |
aApplied Materials Inc. | | United States | | | 286,000 | | | | 12,844,260 | |
Intel Corp. | | United States | | | 1,099,307 | | | | 52,623,826 | |
International Business Machines Corp. | | United States | | | 109,976 | | | | 15,165,691 | |
Lam Research Corp. | | United States | | | 70,000 | | | | 13,148,800 | |
Microchip Technology Inc. | | United States | | | 150,000 | | | | 13,005,000 | |
aMicrosoft Corp. | | United States | | | 285,500 | | | | 38,245,580 | |
Texas Instruments Inc. | | United States | | | 520,000 | | | | 59,675,200 | |
| | | | | | | | | | |
| | | |
| | | | | | | | | 266,020,608 | |
| | | | | | | | | | |
| | | |
Materials 2.2% | | | | | | | | | | |
BASF SE | | Germany | | | 700,000 | | | | 50,867,218 | |
Dow Inc. | | United States | | | 249,166 | | | | 12,286,375 | |
Rio Tinto PLC, ADR | | Australia | | | 800,000 | | | | 49,872,000 | |
| | | | | | | | | | |
| | | |
| | | | | | | | | 113,025,593 | |
| | | | | | | | | | |
| | | |
Real Estate 0.5% | | | | | | | | | | |
Host Hotels & Resorts Inc. | | United States | | | 1,500,000 | | | | 27,330,000 | |
| | | | | | | | | | |
| | | |
Utilities 5.5% | | | | | | | | | | |
Dominion Energy Inc. | | United States | | | 1,036,638 | | | | 80,152,850 | |
Duke Energy Corp. | | United States | | | 577,500 | | | | 50,958,600 | |
Sempra Energy | | United States | | | 275,000 | | | | 37,796,000 | |
The Southern Co. | | United States | | | 1,560,000 | | | | 86,236,800 | |
Xcel Energy Inc. | | United States | | | 400,000 | | | | 23,796,000 | |
| | | | | | | | | | |
| | | |
| | | | | | | | | 278,940,250 | |
| | | | | | | | | | |
| | | |
Total Common Stocks (Cost $1,657,780,113) | | | | | | | | | 1,976,614,750 | |
| | | | | | | | | | |
| | | |
bEquity-Linked Securities 5.0% | | | | | | | | | | |
Communication Services 1.9% | | | | | | | | | | |
cGoldman Sachs International into Alphabet Inc., 7.00%, A, 144A | | United States | | | 35,000 | | | | 38,594,008 | |
cRoyal Bank of Canada into Alphabet Inc., 6.00%, A, 144A | | Belgium | | | 10,000 | | | | 10,984,473 | |
cRoyal Bank of Canada into Comcast Corp., 7.00%, A, 144A | | United States | | | 1,270,000 | | | | 49,641,984 | |
| | | | | | | | | | |
| | | |
| | | | | | | | | 99,220,465 | |
| | | | | | | | | | |
Consumer Discretionary 0.9% | | | | | | | | | | |
cJP Morgan Chase Financial Co. LLC into Amazon.com Inc., 9.00%, 144A | | United States | | | 25,000 | | | | 45,196,215 | |
| | | | | | | | | | |
| | | |
Financials 0.4% | | | | | | | | | | |
cCredit Suisse AG into Bank of America Corp., 7.00%, 144A | | United States | | | 750,000 | | | | 22,157,759 | |
| | | | | | | | | | |
| | | |
Information Technology 0.6% | | | | | | | | | | |
cCredit Suisse AG London into Analog Devices Inc., 7.50%, 144A | | United States | | | 260,000 | | | | 28,541,434 | |
| | | | | | | | | | |
FRANKLIN TEMPLETON VARIABLE INSURANCE PRODUCTS TRUST
STATEMENT OF INVESTMENTS (UNAUDITED)
Franklin Income VIP Fund (continued)
| | | | | | | | | | | | | | |
| | | Country | | Shares | | | | | | Value | |
| |
| | | | |
bEquity-Linked Securities(continued) | | | | | | | | | | | | | | |
Materials 1.2% | | | | | | | | | | | | | | |
cUBS AG London into DowDuPont Inc., 6.50%, 144A | | United States | | | 850,000 | | | | | | | $ | 44,215,481 | |
cUBS AG London into Newmont Goldcorp Corp., 8.00%, cvt. pfd., 144A | | United States | | | 435,000 | | | | | | | | 16,231,323 | |
| | | | | | | | | | | | | | |
| | | | |
| | | | | | | | | | | | | 60,446,804 | |
| | | | | | | | | | | | | | |
| | | | |
Total Equity-Linked Securities (Cost $255,253,648) | | | | | | | | | | | | | 255,562,677 | |
| | | | | | | | | | | | | | |
| | |
Convertible Preferred Stocks 1.3% | | | | | | | | | |
Financials 1.3% | | | | | | | | | | | | | | |
Bank of America Corp., 7.25%, cvt. pfd., L | | United States | | | 34,600 | | | | | | | | 47,471,200 | |
dFNMA, 5.375%, cvt. pfd | | United States | | | 475 | | | | | | | | 19,237,500 | |
| | | | | | | | | | | | | | |
| | |
Total Convertible Preferred Stocks (Cost $65,397,102) | | | | | | | | 66,708,700 | |
| | | | | | | | | | | | | | |
| | | |
Preferred Stocks (Cost $15,000,000) 0.3% | | | | | | | | | | | | |
Financials 0.3% | | | | | | | | | | | | | | |
JPMorgan Chase & Co., 6.00%, pfd., EE | | United States | | | 600,000 | | | | | | | | 16,290,000 | |
| | | | | | | | | | | | | | |
| | | | |
| | | | | Units | | | | | | | |
| | | | | | | | | | | | | | |
eIndex-Linked Notes (Cost $14,054,540) 0.3% | | | | | | | | | |
Financials 0.3% | | | | | | | | | | | | | | |
c,fMorgan Stanley Finance LLC, senior note, 144A, 6.98%, 10/03/19 | | United States | | | 106,000 | | | | | | | | 14,167,960 | |
| | | | | | | | | | | | | | |
| | | | |
| | | | | Principal
Amount* | | | | | | | |
| | | | | | | | | | | | | | |
Convertible Bonds 0.9% | | | | | | | | | | | | |
Energy 0.5% | | | | | | | | | | | | | | |
Chesapeake Energy Corp., cvt., senior note, 5.50%, 9/15/26 | | United States | | | 10,000,000 | | | | | | | | 8,006,785 | |
gWeatherford International Ltd., cvt., senior note, 5.875%, 7/01/21 | | United States | | | 35,000,000 | | | | | | | | 18,112,500 | |
| | | | | | | | | | | | | | |
| | | | | | | | | | | | | 26,119,285 | |
| | | | | | | | | | | | | | |
Health Care 0.4% | | | | | | | | | | | | | | |
cBayer Capital Corp. BV, cvt., junior sub. note, 144A, 5.625%, 11/22/19 | | Germany | | | 25,000,000 | | | | EUR | | | | 21,845,356 | |
| | | | | | | | | | | | | | |
| | | |
Total Convertible Bonds (Cost $67,852,716) | | | | | | | | | | | 47,964,641 | |
| | | | | | | | | | | | | | |
| | | |
Corporate Bonds 38.5% | | | | | | | | | | | | |
Communication Services 4.9% | | | | | | | | | | | | |
AMC Entertainment Holdings Inc., senior sub. note, 5.875%, 11/15/26 | | United States | | | 5,600,000 | | | | | | | | 5,040,000 | |
AT&T Inc., senior bond, 4.125%, 2/17/26 | | United States | | | 12,000,000 | | | | | | | | 12,770,319 | |
CCO Holdings LLC/CCO Holdings Capital Corp., | | | | | | | | | | | | | | |
senior bond, 5.125%, 2/15/23 | | United States | | | 10,000,000 | | | | | | | | 10,183,000 | |
senior bond, 5.75%, 1/15/24 | | United States | | | 9,000,000 | | | | | | | | 9,223,875 | |
csenior bond, 144A, 5.50%, 5/01/26 | | United States | | | 10,000,000 | | | | | | | | 10,490,500 | |
DISH DBS Corp., | | | | | | | | | | | | | | |
senior bond, 5.875%, 7/15/22 | | United States | | | 27,000,000 | | | | | | | | 27,506,250 | |
senior bond, 5.00%, 3/15/23 | | United States | | | 21,000,000 | | | | | | | | 20,370,000 | |
senior note, 5.875%, 11/15/24 | | United States | | | 9,400,000 | | | | | | | | 8,930,000 | |
FRANKLIN TEMPLETON VARIABLE INSURANCE PRODUCTS TRUST
STATEMENT OF INVESTMENTS (UNAUDITED)
Franklin Income VIP Fund(continued)
| | | | | | | | | | | | |
| | | |
| | | Country | | | Principal
Amount* | | | Value | |
| | | |
Corporate Bonds (continued) | | | | | | | | | | | | |
| | | |
Communication Services(continued) | | | | | | | | | | | | |
Netflix Inc., senior bond, 4.875%, 4/15/28 | | | United States | | | | 24,000,000 | | | | $ 24,870,000 | |
c Sirius XM Radio Inc., senior bond, 144A, 6.00%, 7/15/24 | | | United States | | | | 4,000,000 | | | | 4,126,000 | |
Sprint Communications Inc., | | | | | | | | | | | | |
senior bond, 11.50%, 11/15/21 | | | United States | | | | 30,000,000 | | | | 34,800,000 | |
senior note, 7.00%, 8/15/20 | | | United States | | | | 7,500,000 | | | | 7,790,625 | |
senior note, 6.00%, 11/15/22 | | | United States | | | | 6,300,000 | | | | 6,583,500 | |
Sprint Corp., | | | | | | | | | | | | |
senior bond, 7.875%, 9/15/23 | | | United States | | | | 12,500,000 | | | | 13,625,000 | |
senior bond, 7.125%, 6/15/24 | | | United States | | | | 8,200,000 | | | | 8,714,960 | |
senior note, 7.625%, 3/01/26 | | | United States | | | | 7,500,000 | | | | 8,013,750 | |
cSprint Spectrum Co. LLC, senior secured bond, first lien, 144A, 5.152%, 9/20/29 | | | United States | | | | 16,000,000 | | | | 16,520,000 | |
c Univision Communications Inc., | | | | | | | | | | | | |
senior secured note, first lien, 144A, 5.125%, 5/15/23 | | | United States | | | | 15,000,000 | | | | 14,737,500 | |
senior secured note, first lien, 144A, 5.125%, 2/15/25 | | | United States | | | | 7,140,000 | | | | 6,818,700 | |
| | | | | | | | | | | | |
| | | |
| | | | | | | | | | | 251,113,979 | |
| | | | | | | | | | | | |
| | | |
Consumer Discretionary 1.8% | | | | | | | | | | | | |
c24 Hour Holdings III LLC, senior note, 144A, 8.00%, 6/01/22 | | | United States | | | | 6,300,000 | | | | 6,237,000 | |
Ford Motor Co., senior note, 4.346%, 12/08/26 | | | United States | | | | 18,500,000 | | | | 18,663,740 | |
General Motors Co., senior bond, 5.15%, 4/01/38 | | | United States | | | | 16,000,000 | | | | 15,824,682 | |
cGolden Nugget Inc., senior note, 144A, 6.75%, 10/15/24 | | | United States | | | | 5,000,000 | | | | 5,162,500 | |
c Shea Homes LP/Shea Homes Funding Corp., | | | | | | | | | | | | |
senior bond, 144A, 6.125%, 4/01/25 | | | United States | | | | 10,000,000 | | | | 10,144,900 | |
senior note, 144A, 5.875%, 4/01/23 | | | United States | | | | 10,000,000 | | | | 10,250,000 | |
c Wynn Las Vegas LLC/Wynn Las Vegas Capital Corp., | | | | | | | | | | | | |
senior bond, 144A, 5.50%, 3/01/25 | | | United States | | | | 13,200,000 | | | | 13,665,960 | |
senior bond, 144A, 5.25%, 5/15/27 | | | United States | | | | 10,000,000 | | | | 10,050,000 | |
| | | | | | | | | | | | |
| | | |
| | | | | | | | | | | 89,998,782 | |
| | | | | | | | | | | | |
| | | |
Consumer Staples 1.1% | | | | | | | | | | | | |
BAT Capital Corp., | | | | | | | | | | | | |
senior note, 3.222%, 8/15/24 | | | United Kingdom | | | | 10,000,000 | | | | 10,088,195 | |
senior note, 3.557%, 8/15/27 | | | United Kingdom | | | | 20,000,000 | | | | 19,920,216 | |
Kraft Heinz Foods Co., senior bond, 4.625%, 1/30/29 | | | United States | | | | 13,000,000 | | | | 13,992,901 | |
c Post Holdings Inc., | | | | | | | | | | | | |
senior bond, 144A, 5.00%, 8/15/26 | | | United States | | | | 7,500,000 | | | | 7,631,250 | |
senior bond, 144A, 5.625%, 1/15/28 | | | United States | | | | 2,500,000 | | | | 2,578,125 | |
| | | | | | | | | | | | |
| | | |
| | | | | | | | | | | 54,210,687 | |
| | | | | | | | | | | | |
| | | |
Energy 6.5% | | | | | | | | | | | | |
cAscent Resources Utica Holdings LLC/ARU Finance Corp., senior note, 144A,
10.00%, 4/01/22 | | | United States | | | | 3,200,000 | | | | 3,403,680 | |
Calumet Specialty Products Partners LP/Calumet Finance Corp., | | | | | | | | | | | | |
senior note, 6.50%, 4/15/21 | | | United States | | | | 34,000,000 | | | | 33,915,000 | |
senior note, 7.625%, 1/15/22 | | | United States | | | | 8,000,000 | | | | 7,780,000 | |
senior note, 7.75%, 4/15/23 | | | United States | | | | 2,000,000 | | | | 1,920,000 | |
FRANKLIN TEMPLETON VARIABLE INSURANCE PRODUCTS TRUST
STATEMENT OF INVESTMENTS (UNAUDITED)
Franklin Income VIP Fund(continued)
| | | | | | | | | | | | |
| | | |
| | | Country | | | Principal
Amount* | | | Value | |
| | | |
Corporate Bonds(continued) | | | | | | | | | | | | |
| | | |
Energy(continued) | | | | | | | | | | | | |
| | | |
Chesapeake Energy Corp., | | | | | | | | | | | | |
| | | |
senior bond, 8.00%, 6/15/27 | | | United States | | | | 26,000,000 | | | | $ 22,863,880 | |
| | | |
senior note, 4.875%, 4/15/22 | | | United States | | | | 5,000,000 | | | | 4,750,000 | |
| | | |
senior note, 5.75%, 3/15/23 | | | United States | | | | 5,000,000 | | | | 4,712,500 | |
| | | |
senior note, 7.00%, 10/01/24 | | | United States | | | | 20,000,000 | | | | 18,025,000 | |
| | | |
senior note, 8.00%, 1/15/25 | | | United States | | | | 47,500,000 | | | | 44,056,250 | |
| | | |
senior note, 7.50%, 10/01/26 | | | United States | | | | 10,000,000 | | | | 8,950,000 | |
| | | |
csenior note, 144A, 8.00%, 3/15/26 | | | United States | | | | 29,715,000 | | | | 27,114,937 | |
| | | |
cCNX Resources Corp., senior note, 144A, 7.25%, 3/14/27 | | | United States | | | | 8,000,000 | | | | 6,880,000 | |
| | | |
HighPoint Operating Corp., | | | | | | | | | | | | |
| | | |
senior bond, 7.00%, 10/15/22 | | | United States | | | | 17,937,000 | | | | 17,398,890 | |
| | | |
senior note, 8.75%, 6/15/25 | | | United States | | | | 26,600,000 | | | | 25,669,000 | |
| | | |
Kinder Morgan Inc., | | | | | | | | | | | | |
| | | |
senior bond, 7.75%, 1/15/32 | | | United States | | | | 22,000,000 | | | | 30,142,870 | |
| | | |
csenior secured bond, first lien, 144A, 5.625%, 11/15/23 | | | United States | | | | 6,400,000 | | | | 7,088,520 | |
| | | |
g Weatherford International Ltd., | | | | | | | | | | | | |
| | | |
senior bond, 4.50%, 4/15/22 | | | United States | | | | 11,900,000 | | | | 6,158,250 | |
| | | |
senior note, 5.125%, 9/15/20 | | | United States | | | | 22,500,000 | | | | 11,643,750 | |
| | | |
senior note, 7.75%, 6/15/21 | | | United States | | | | 47,500,000 | | | | 25,293,750 | |
| | | |
senior note, 8.25%, 6/15/23 | | | United States | | | | 37,500,000 | | | | 19,781,250 | |
| | | |
| | | | | | | | | | | | |
| | | |
| | | | | | | | | | | 327,547,527 | |
| | | |
| | | | | | | | | | | | |
| | | |
Financials 5.0% | | | | | | | | | | | | |
| | | |
Bank of America Corp., | | | | | | | | | | | | |
| | | |
hjunior sub. bond, AA, 6.10% to 3/17/25, FRN thereafter, Perpetual | | | United States | | | | 8,000,000 | | | | 8,645,720 | |
| | | |
hjunior sub. bond, X, 6.25% to 9/05/24, FRN thereafter, Perpetual | | | United States | | | | 6,000,000 | | | | 6,532,500 | |
| | | |
senior bond, 3.419% to 12/20/27, FRN thereafter, 12/20/28 | | | United States | | | | 10,000,000 | | | | 10,306,413 | |
| | | |
Capital One Financial Corp., senior sub. note, 4.20%, 10/29/25 | | | United States | | | | 15,500,000 | | | | 16,286,742 | |
| | | |
Citigroup Inc., | | | | | | | | | | | | |
| | | |
hjunior sub. bond, 5.90% to 2/15/23, FRN thereafter, Perpetual | | | United States | | | | 12,500,000 | | | | 12,964,425 | |
| | | |
hjunior sub. bond, 5.95% to 1/30/23, FRN thereafter, Perpetual | | | United States | | | | 4,500,000 | | | | 4,601,250 | |
| | | |
hjunior sub. bond, M, 6.30% to 5/15/24, FRN thereafter, Perpetual | | | United States | | | | 15,800,000 | | | | 16,423,547 | |
| | | |
hjunior sub. bond, O, 5.875% to 3/27/20, FRN thereafter, Perpetual | | | United States | | | | 25,000,000 | | | | 25,227,375 | |
| | | |
hjunior sub. bond, Q, 5.95% to 8/15/20, FRN thereafter, Perpetual | | | United States | | | | 10,000,000 | | | | 10,285,350 | |
| | | |
sub. bond, 4.125%, 7/25/28 | | | United States | | | | 18,500,000 | | | | 19,561,907 | |
| | | |
The Goldman Sachs Group Inc., senior note, 3.272% to 9/29/24, FRN thereafter, 9/29/25 | | | United States | | | | 15,500,000 | | | | 15,865,862 | |
| | | |
HSBC Holdings PLC, senior note, 4.292% to 9/12/25, FRN thereafter, 9/12/26 | | | United Kingdom | | | | 28,500,000 | | | | 30,315,593 | |
| | | |
h JPMorgan Chase & Co., | | | | | | | | | | | | |
| | | |
ijunior sub. bond, FRN, 6.053%,(3-month USD LIBOR + 3.47%), Perpetual | | | United States | | | | 28,692,000 | | | | 28,672,776 | |
| | | |
junior sub. bond, R, 6.00% to 8/01/23, FRN thereafter, Perpetual | | | United States | | | | 3,200,000 | | | | 3,366,288 | |
| | | |
junior sub. bond, V, 5.00% to 7/30/19, FRN thereafter, Perpetual | | | United States | | | | 10,000,000 | | | | 9,980,500 | |
FRANKLIN TEMPLETON VARIABLE INSURANCE PRODUCTS TRUST
STATEMENT OF INVESTMENTS (UNAUDITED)
Franklin Income VIP Fund(continued)
| | | | | | | | | | | | |
| | | |
| | | Country | | | Principal
Amount* | | | Value | |
| | | |
Corporate Bonds(continued) | | | | | | | | | | | | |
| | | |
Financials(continued) | | | | | | | | | | | | |
| | | |
hMorgan Stanley, junior sub. bond, 5.55% to 7/15/20, FRN thereafter, Perpetual | | | United States | | | | 7,300,000 | | | | $ 7,381,979 | |
| | | |
Prudential Financial Inc., junior sub. bond, 5.70% to 9/15/28, FRN thereafter, 9/15/48 | | | United States | | | | 17,000,000 | | | | 18,291,660 | |
| | | |
hWells Fargo & Co., junior sub. bond, S, 5.90% to 6/15/24, FRN thereafter, Perpetual | | | United States | | | | 6,600,000 | | | | 6,909,969 | |
| | | | | | | | | | | | |
| | | | | | | | | | | 251,619,856 | |
| | | | | | | | | | | | |
| | | |
Health Care 14.1% | | | | | | | | | | | | |
| | | |
Allergan Funding SCS, senior bond, 3.80%, 3/15/25 | | | United States | | | | 17,000,000 | | | | 17,637,152 | |
| | | |
cBausch Health Cos. Inc., | | | | | | | | | | | | |
| | | |
senior bond, 144A, 6.125%, 4/15/25 | | | United States | | | | 9,400,000 | | | | 9,611,500 | |
| | | |
senior note, 144A, 5.50%, 3/01/23 | | | United States | | | | 15,000,000 | | | | 15,176,250 | |
| | | |
senior note, 144A, 5.875%, 5/15/23 | | | United States | | | | 14,500,000 | | | | 14,722,865 | |
| | | |
senior note, 144A, 9.00%, 12/15/25 | | | United States | | | | 5,000,000 | | | | 5,605,250 | |
| | | |
senior note, first lien, 144A, 7.00%, 3/15/24 | | | United States | | | | 4,500,000 | | | | 4,792,950 | |
| | | |
senior secured note, first lien, 144A, 6.50%, 3/15/22 | | | United States | | | | 3,000,000 | | | | 3,112,500 | |
| | | |
senior secured note, first lien, 144A, 5.50%, 11/01/25 | | | United States | | | | 35,000,000 | | | | 36,618,750 | |
| | | |
cBayer U.S. Finance II LLC, senior note, 144A, 4.25%, 12/15/25 | | | Germany | | | | 15,000,000 | | | | 15,874,447 | |
| | | |
c Bristol-Myers Squibb Co., | | | | | | | | | | | | |
| | | |
senior bond, 144A, 3.40%, 7/26/29 | | | United States | | | | 8,000,000 | | | | 8,374,348 | |
| | | |
senior bond, 144A, 4.25%, 10/26/49 | | | United States | | | | 8,000,000 | | | | 8,818,573 | |
| | | |
CHS/Community Health Systems Inc., | | | | | | | | | | | | |
| | | |
senior note, 6.875%, 2/01/22 | | | United States | | | | 130,000,000 | | | | 88,400,000 | |
| | | |
csenior note, 144A, 8.125%, 6/30/24 | | | United States | | | | 42,388,000 | | | | 31,896,970 | |
| | | |
csenior note, 144A, 11.00% to 6/22/19, 9.875% thereafter, 6/30/23 | | | United States | | | | 101,596,000 | | | | 83,144,134 | |
| | | |
senior secured note, first lien, 6.25%, 3/31/23 | | | United States | | | | 39,000,000 | | | | 37,683,750 | |
| | | |
cCigna Corp., senior secured note, 144A, 3.75%, 7/15/23 | | | United States | | | | 20,000,000 | | | | 20,825,639 | |
| | | |
CVS Health Corp., | | | | | | | | | | | | |
| | | |
senior bond, 4.30%, 3/25/28 | | | United States | | | | 8,000,000 | | | | 8,438,637 | |
| | | |
senior bond, 5.05%, 3/25/48 | | | United States | | | | 3,900,000 | | | | 4,154,286 | |
| | | |
senior note, 4.10%, 3/25/25 | | | United States | | | | 5,100,000 | | | | 5,379,654 | |
| | | |
DaVita Inc., | | | | | | | | | | | | |
| | | |
senior bond, 5.125%, 7/15/24 | | | United States | | | | 5,000,000 | | | | 5,014,000 | |
| | | |
senior bond, 5.00%, 5/01/25 | | | United States | | | | 4,000,000 | | | | 3,964,000 | |
| | | |
c Endo DAC/Endo Finance LLC/Endo Finco Inc., | | | | | | | | | | | | |
| | | |
senior bond, 144A, 6.00%, 2/01/25 | | | United States | | | | 7,600,000 | | | | 5,130,000 | |
| | | |
senior note, 144A, 6.00%, 7/15/23 | | | United States | | | | 15,000,000 | | | | 10,875,000 | |
| | | |
HCA Inc., | | | | | | | | | | | | |
| | | |
senior bond, 5.875%, 5/01/23 | | | United States | | | | 7,500,000 | | | | 8,174,100 | |
| | | |
senior note, 7.50%, 2/15/22 | | | United States | | | | 25,000,000 | | | | 27,625,000 | |
| | | |
senior secured note, first lien, 5.00%, 3/15/24 | | | United States | | | | 10,400,000 | | | | 11,336,955 | |
| | | |
Horizon Pharma USA Inc., senior note, 6.625%, 5/01/23 | | | United States | | | | 2,842,000 | | | | 2,929,036 | |
| | | |
Mallinckrodt International Finance SA, senior bond, 4.75%, 4/15/23 | | | United States | | | | 1,000,000 | | | | 710,000 | |
| | | |
c Mallinckrodt International Finance SA/Mallinckrodt CB LLC, | | | | | | | | | | | | |
| | | |
senior note, 144A, 4.875%, 4/15/20 | | | United States | | | | 20,200,000 | | | | 19,568,750 | |
| | | |
senior note, 144A, 5.75%, 8/01/22 | | | United States | | | | 24,000,000 | | | | 20,520,000 | |
| | | |
senior note, 144A, 5.625%, 10/15/23 | | | United States | | | | 14,300,000 | | | | 10,850,125 | |
| | | |
senior note, 144A, 5.50%, 4/15/25 | | | United States | | | | 10,000,000 | | | | 6,750,000 | |
FRANKLIN TEMPLETON VARIABLE INSURANCE PRODUCTS TRUST
STATEMENT OF INVESTMENTS (UNAUDITED)
Franklin Income VIP Fund(continued)
| | | | | | | | | | | | | | |
| | | Country | | Principal
Amount* | | | | | | Value | |
| |
| | | | |
Corporate Bonds(continued) | | | | | | | | | | | | | | |
Health Care(continued) | | | | | | | | | | | | | | |
Mylan NV, senior note, 3.95%, 6/15/26 | | United States | | | 13,600,000 | | | | | | | $ | 13,136,240 | |
cPar Pharmaceutical Inc., senior secured note, 144A, 7.50%, 4/01/27 | | United States | | | 8,500,000 | | | | | | | | 8,372,500 | |
Tenet Healthcare Corp., | | | | | | | | | | | | | | |
secured note, second lien, 5.125%, 5/01/25 | | United States | | | 2,500,000 | | | | | | | | 2,518,750 | |
senior note, 8.125%, 4/01/22 | | United States | | | 27,600,000 | | | | | | | | 29,083,500 | |
senior note, 6.75%, 6/15/23 | | United States | | | 58,200,000 | | | | | | | | 58,636,500 | |
senior note, 7.00%, 8/01/25 | | United States | | | 12,175,000 | | | | | | | | 12,197,280 | |
csenior note, second lien, 144A, 6.25%, 2/01/27 | | United States | | | 29,000,000 | | | | | | | | 29,906,250 | |
senior secured note, first lien, 4.50%, 4/01/21 | | United States | | | 7,000,000 | | | | | | | | 7,131,250 | |
| | | | | | | | | | | | | | |
| | | | |
| | | | | | | | | | | | | 714,696,891 | |
| | | | | | | | | | | | | | |
| | | | |
Industrials 1.0% | | | | | | | | | | | | | | |
cTransDigm Inc., senior secured note, 144A, 6.25%, 3/15/26 | | United States | | | 14,000,000 | | | | | | | | 14,682,500 | |
United Rentals North America Inc., senior bond, 4.875%, 1/15/28 | | United States | | | 20,000,000 | | | | | | | | 20,450,000 | |
United Technologies Corp., senior note, 3.95%, 8/16/25 | | United States | | | 15,000,000 | | | | | | | | 16,181,635 | |
| | | | | | | | | | | | | | |
| | | | |
| | | | | | | | | | | | | 51,314,135 | |
| | | | | | | | | | | | | | |
| | | | |
Information Technology 0.7% | | | | | | | | | | | | | | |
cCommScope Inc., senior bond, 144A, 5.50%, 6/15/24 | | United States | | | 10,000,000 | | | | | | | | 9,512,500 | |
cDell International LLC/EMC Corp., senior secured note, first lien, 144A, 5.45%, 6/15/23 | | United States | | | 21,100,000 | | | | | | | | 22,756,092 | |
NCR Corp., senior note, 6.375%, 12/15/23 | | United States | | | 4,212,000 | | | | | | | | 4,354,155 | |
| | | | | | | | | | | | | | |
| | | | |
| | | | | | | | | | | | | 36,622,747 | |
| | | | | | | | | | | | | | |
| | | | |
Materials 1.7% | | | | | | | | | | | | | | |
c BWAY Holding Co., | | | | | | | | | | | | | | |
secured note, 144A, 5.50%, 4/15/24 | | United States | | | 10,000,000 | | | | | | | | 10,043,750 | |
senior note, 144A, 7.25%, 4/15/25 | | United States | | | 23,000,000 | | | | | | | | 22,252,500 | |
cCemex Finance LLC, senior secured note, first lien, 144A, 6.00%, 4/01/24 | | Mexico | | | 14,700,000 | | | | | | | | 15,167,680 | |
DuPont de Nemours Inc.senior note, 4.493%, 11/15/25 | | United States | | | 15,000,000 | | | | | | | | 16,601,333 | |
cFMG Resources (August 2006) Pty. Ltd., senior note, 144A, 5.125%, 5/15/24 | | Australia | | | 6,700,000 | | | | | | | | 6,974,298 | |
cSyngenta Finance NV, senior note, 144A, 4.441%, 4/24/23 | | Switzerland | | | 16,500,000 | | | | | | | | 17,112,315 | |
| | | | | | | | | | | | | | |
| | | | |
| | | | | | | | | | | | | 88,151,876 | |
| | | | | | | | | | | | | | |
| | | | |
Real Estate 0.6% | | | | | | | | | | | | | | |
Equinix Inc., senior bond, 5.375%, 5/15/27 | | United States | | | 11,000,000 | | | | | | | | 11,819,170 | |
Iron Mountain Inc., senior sub. bond, 5.75%, 8/15/24 | | United States | | | 18,000,000 | | | | | | | | 18,227,520 | |
| | | | | | | | | | | | | | |
| | | | |
| | | | | | | | | | | | | 30,046,690 | |
| | | | | | | | | | | | | | |
| | | | |
Utilities 1.1% | | | | | | | | | | | | | | |
Calpine Corp., | | | | | | | | | | | | | | |
| | | | |
senior note, 5.375%, 1/15/23 | | United States | | | 20,000,000 | | | | | | | | 20,275,000 | |
| | | | |
senior note, 5.50%, 2/01/24 | | United States | | | 16,375,000 | | | | | | | | 16,272,656 | |
Ferrellgas LP/Ferrellgas Finance Corp., | | | | | | | | | | | | | | |
| | | | |
senior note, 6.50%, 5/01/21 | | United States | | | 9,500,000 | | | | | | | | 8,668,750 | |
| | | | |
senior note, 6.75%, 6/15/23 | | United States | | | 5,000,000 | | | | | | | | 4,412,500 | |
Vistra Energy Corp., senior note, 5.875%, 6/01/23 | | United States | | | 8,000,000 | | | | | | | | 8,210,000 | |
| | | | | | | | | | | | | | |
| | | | |
| | | | | | | | | | | | | 57,838,906 | |
| | | | | | | | | | | | | | |
| | | | |
Total Corporate Bonds (Cost $1,980,284,294) | | | | | | | | | | | | | 1,953,162,076 | |
| | | | | | | | | | | | | | |
FRANKLIN TEMPLETON VARIABLE INSURANCE PRODUCTS TRUST
STATEMENT OF INVESTMENTS (UNAUDITED)
Franklin Income VIP Fund(continued)
| | | | | | | | | | | | | | |
| | | Country | | Principal
Amount* | | | | | | Value | |
| |
i,j Senior Floating Rate Interests 2.1% | | | | | | | | | | | | | | |
Communication Services 0.1% | | | | | | | | | | | | | | |
Securus Technologies Holdings Inc., Second Lien Initial Loan, 10.58%,(3-month USD LIBOR + 8.25%), 11/01/25 | | United States | | | 6,000,000 | | | | | | | $ | 5,560,002 | |
| | | | | | | | | | | | | | |
| | | | |
Consumer Discretionary 0.9% | | | | | | | | | | | | | | |
24 Hour Fitness Worldwide Inc., Term Loan, 5.902%,(1-month USD LIBOR + 3.50%), 5/30/25 | | United States | | | 13,860,000 | | | | | | | | 13,820,153 | |
Belk Inc., Closing Date Term Loan, 7.285%,(3-month USD LIBOR + 4.75%), 12/12/22 | | United States | | | 19,082,783 | | | | | | | | 15,480,907 | |
Stars Group Holdings BV, Stars Group (US), USD Term Loan, 5.83%,(3-month USD LIBOR + 3.50%), 7/10/25 | | United States | | | 17,841,958 | | | | | | | | 17,868,007 | |
| | | | | | | | | | | | | | |
| | | | |
| | | | | | | | | | | | | 47,169,067 | |
| | | | | | | | | | | | | | |
| | | | |
Health Care 0.5% | | | | | | | | | | | | | | |
Amneal Pharmaceuticals LLC, Initial Term Loans, 5.938%,(1-month USD LIBOR + 3.50%), 5/04/25 | | United States | | | 24,744,222 | | | | | | | | 24,630,894 | |
| | | | | | | | | | | | | | |
| | | | |
Industrials 0.6% | | | | | | | | | | | | | | |
Commercial Barge Line Co., Initial Term Loan, 11.152%,(1-month USD LIBOR + 8.75%), 11/12/20 | | United States | | | 4,433,823 | | | | | | | | 3,070,423 | |
Vertiv Group Corp., Term B Loans, 6.33%,(3-month USD LIBOR + 4.00%), 11/30/23 | | United States | | | 8,574,569 | | | | | | | | 8,161,815 | |
West Corp., Term B Loans, 6.522%,(3-month USD LIBOR + 4.00%), 10/10/24 | | United States | | | 17,373,104 | | | | | | | | 16,240,238 | |
| | | | | | | | | | | | | | |
| | | | |
| | | | | | | | | | | | | 27,472,476 | |
| | | | | | | | | | | | | | |
| | | | |
Total Senior Floating Rate Interests (Cost $109,804,793) | | | | | | | | | | | | | 104,832,439 | |
| | | | | | | | | | | | | | |
| | | | |
U.S. Government and Agency Securities 7.6% | | | | | | | | | | | | | | |
U.S. Treasury Bond, 3.00%, 2/15/49 | | United States | | | 25,000,000 | | | | | | | | 27,422,852 | |
U.S. Treasury Note, 2.25%, 3/31/20 | | United States | | | 50,000,000 | | | | | | | | 50,085,937 | |
2.50%, 5/31/20 | | United States | | | 75,000,000 | | | | | | | | 75,338,379 | |
2.50%, 6/30/20 | | United States | | | 50,000,000 | | | | | | | | 50,258,789 | |
2.375%, 3/15/21 | | United States | | | 75,000,000 | | | | | | | | 75,722,168 | |
2.75%, 4/30/23 | | United States | | | 25,000,000 | | | | | | | | 25,930,176 | |
2.75%, 5/31/23 | | United States | | | 50,000,000 | | | | | | | | 51,898,437 | |
2.875%, 5/31/25 | | United States | | | 25,000,000 | | | | | | | | 26,461,426 | |
| | | | | | | | | | | | | | |
| | | | |
Total U.S. Government and Agency Securities
(Cost $375,256,437) | | | | | | | | | | | | | 383,118,164 | |
| | | | | | | | | | | | | | |
| | | | | Shares | | | | | | | | | |
| | | | | | | | | | | | | | |
| | | | |
Escrows and Litigation Trusts (Cost $62,602) 0.0% | | | | | | | | | | | | | | |
d,k Motors Liquidation Co., Escrow Account, cvt. pfd., C | | United States | | | 1,400,000 | | | | | | | | — | |
| | | | | | | | | | | | | | |
| | | | |
Total Investments before Short Term Investments
(Cost $4,540,746,245) | | | | | | | | | | | | | 4,818,421,407 | |
| | | | | | | | | | | | | | |
FRANKLIN TEMPLETON VARIABLE INSURANCE PRODUCTS TRUST
STATEMENT OF INVESTMENTS (UNAUDITED)
Franklin Income VIP Fund(continued)
| | | | | | | | | | | | | | |
| | | Country | | Shares | | | | | | Value | |
| |
Short Term Investments (Cost $175,824,178) 3.5% | | | | | | | | | | | | | | |
| | | | |
Money Market Funds 3.5% | | | | | | | | | | | | | | |
l,mInstitutional Fiduciary Trust Money Market Portfolio, 2.05% | | United States | | | 175,824,178 | | | | | | | $ | 175,824,178 | |
| | | | | | | | | | | | | | |
| | | | |
Total Investments (Cost $4,716,570,423) 98.5% | | | | | | | | | | | | | 4,994,245,585 | |
Options Written (0.0)%† | | | | | | | | | | | | | (1,245,510 | ) |
Other Assets, less Liabilities 1.5% | | | | | | | | | | | | | 76,177,821 | |
| | | | | | | | | | | | | | |
| | | | |
Net Assets 100.0% | | | | | | | | | | | | $ | 5,069,177,896 | |
| | | | | | | | | | | | | | |
| | | Number of
Contracts | | Notional
Amount* | | | | | | | |
| | | | | | | | | | | | | | |
| | | | |
nOptions Written (0.0)%† | | | | | | | | | | | | | | |
Calls - Exchange-Traded | | | | | | | | | | | | | | |
Applied Materials Inc., September Strike Price $52.50, Expires 9/20/19 | | 2,860 | | | 286,000 | | | | | | | | (188,760 | ) |
Cummins Inc., August Strike Price $180.00, Expires 8/16/19 | | 1,000 | | | 100,000 | | | | | | | | (225,000 | ) |
Microsoft Corp., July Strike Price $135.00, Expires 7/19/19 | | 2,855 | | | 285,500 | | | | | | | | (713,750 | ) |
| | | | | | | | | | | | | | |
| | | | |
| | | | | | | | | | | | | (1,127,510 | ) |
| | | | | | | | | | | | | | |
| | | | |
Puts - Exchange-Traded | | | | | | | | | | | | | | |
CVS Health Corp., July Strike Price $52.50, Expires 7/19/19 | | 2,000 | | | 200,000 | | | | | | | | (118,000 | ) |
| | | | | | | | | | | | | | |
| | | | |
Total Options Written (Premiums received $1,273,962) | | | | | | | | | | | | $ | (1,245,510 | ) |
| | | | | | | | | | | | | | |
See Abbreviations on pageFI-30.
†Rounds to less than 0.1% of net assets.
*The principal/notional amount is stated in U.S. dollars unless otherwise indicated.
aA portion or all of the security is held in connection with written option contracts open at period end.
bSee Note 1(e) regarding equity-linked securities.
cSecurity was purchased pursuant to Rule 144A under the Securities Act of 1933 and may be sold in transactions exempt from registration only to qualified institutional buyers or in a public offering registered under the Securities Act of 1933. These securities have been deemed liquid under guidelines approved by the Trust’s Board of Trustees. At June 30, 2019, the aggregate value of these securities was $943,524,001, representing 18.7% of net assets.
dNon-income producing.
eSee Note 1(d) regarding index-linked notes.
fSecurity pays a fixed 2.00% coupon rate and a variable coupon based on the distribution of the Morgan Stanley Custom Enhanced SPX B DT Index 20 Delta. The coupon rate shown represents the combined rate at period end. Cash payment at maturity or upon early redemption is based on the performance of the Morgan Stanley Custom Enhanced SPX B Index 20 Delta.
gSee Note 7 regarding defaulted securities.
hPerpetual security with no stated maturity date.
iThe coupon rate shown represents the rate at period end.
jSee Note 1(g) regarding senior floating rate interests.
kFair valued using significant unobservable inputs. See Note 10 regarding fair value measurements.
lSee Note 3(e) regarding investments in affiliated management investment companies.
mThe rate shown is the annualizedseven-day effective yield at period end.
nSee Note 1(c) regarding written options.
| | | | | | |
| | | |
| | The accompanying notes are an integral part of these financial statements. | Semiannual Report | | | FI-17 | |
FRANKLIN TEMPLETON VARIABLE INSURANCE PRODUCTS TRUST
NOTES TO FINANCIAL STATEMENTS (UNAUDITED)
Statement of Assets and Liabilities
June 30, 2019 (unaudited)
| | | | |
| | | Franklin Income VIP Fund | |
| |
| |
Assets: | | | | |
Investments in securities: | | | | |
Cost - Unaffiliated issuers | | | $4,540,746,245 | |
Cost -Non-controlled affiliates (Note 3e) | | | 175,824,178 | |
| | | | |
| |
Value - Unaffiliated issuers | | | $4,818,421,407 | |
Value -Non-controlled affiliates (Note 3e) | | | 175,824,178 | |
Cash | | | 802,666 | |
Receivables: | | | | |
Investment securities sold | | | 35,399,357 | |
Capital shares sold | | | 2,258,191 | |
Dividends and interest | | | 44,890,050 | |
Other assets | | | 3,693 | |
| | | | |
| |
Total assets | | | 5,077,599,542 | |
| | | | |
Liabilities: | | | | |
Payables: | | | | |
Capital shares redeemed | | | 2,898,404 | |
Management fees | | | 1,823,829 | |
Distribution fees | | | 1,994,439 | |
Trustees’ fees and expenses | | | 6,072 | |
Options written, at value (premiums received $1,273,962) | | | 1,245,510 | |
Accrued expenses and other liabilities | | | 453,392 | |
| | | | |
| |
Total liabilities | | | 8,421,646 | |
| | | | |
| |
Net assets, at value | | | $5,069,177,896 | |
| | | | |
Net assets consist of: | | | | |
Paid-in capital | | | $4,652,292,846 | |
Total distributable earnings (loss) | | | 416,885,050 | |
| | | | |
| |
Net assets, at value | | | $5,069,177,896 | |
| | | | |
Class 1: | | | | |
Net assets, at value | | | $ 384,806,951 | |
| | | | |
Shares outstanding | | | 24,365,461 | |
| | | | |
Net asset value and maximum offering price per share | | | $15.79 | |
| | | | |
Class 2: | | | | |
Net assets, at value | | | $4,366,594,448 | |
| | | | |
Shares outstanding | | | 286,708,752 | |
| | | | |
Net asset value and maximum offering price per share | | | $15.23 | |
| | | | |
Class 4: | | | | |
Net assets, at value | | | $ 317,776,497 | |
| | | | |
Shares outstanding | | | 20,339,646 | |
| | | | |
Net asset value and maximum offering price per share | | | $15.62 | |
| | | | |
| | | | |
| | | |
FI-18 | | Semiannual Report | The accompanying notes are an integral part of these financial statements. | | |
FRANKLIN TEMPLETON VARIABLE INSURANCE PRODUCTS TRUST
NOTES TO FINANCIAL STATEMENTS (UNAUDITED)
Statement of Operations
for the six months ended June 30, 2019 (unaudited)
| | | | |
| | | Franklin
Income VIP Fund | |
| |
| |
Investment income: | | | | |
Dividends: (net of foreign taxes)* | | | | |
Unaffiliated issuers | | | $ 41,689,831 | |
Non-controlled affiliates (Note 3e) | | | 1,403,664 | |
Interest: | | | | |
Unaffiliated issuers | | | 86,550,126 | |
Income from securities loaned: | | | | |
Unaffiliated issuers (net of fees and rebates) | | | 5,933 | |
Non-controlled affiliates (Note 3e) | | | 15,410 | |
| | | | |
| |
Total investment income | | | 129,664,964 | |
| | | | |
Expenses: | | | | |
Management fees (Note 3a) | | | 11,773,668 | |
Distribution fees: (Note 3c) | | | | |
Class 2 | | | 5,396,749 | |
Class 4 | | | 538,362 | |
Custodian fees (Note 4) | | | 30,264 | |
Reports to shareholders | | | 235,139 | |
Professional fees | | | 63,455 | |
Trustees’ fees and expenses | | | 21,773 | |
Other | | | 55,668 | |
| | | | |
| |
Total expenses | | | 18,115,078 | |
Expense reductions (Note 4) | | | (25,029 | ) |
Expenses waived/paid by affiliates (Note 3e) | | | (238,706 | ) |
| | | | |
| |
Net expenses | | | 17,851,343 | |
| | | | |
| |
Net investment income | | | 111,813,621 | |
| | | | |
Realized and unrealized gains (losses): | | | | |
Net realized gain (loss) from: | | | | |
Investments: | | | | |
Unaffiliated issuers | | | 32,330,998 | |
Realized gain distributions from REITs | | | 3,984 | |
Foreign currency transactions | | | (158,710 | ) |
| | | | |
| |
Net realized gain (loss) | | | 32,176,272 | |
| | | | |
Net change in unrealized appreciation (depreciation) on: | | | | |
Investments: | | | | |
Unaffiliated issuers | | | 407,169,707 | |
Translation of other assets and liabilities denominated in foreign currencies | | | (19,451 | ) |
Written options | | | 28,452 | |
| | | | |
| |
Net change in unrealized appreciation (depreciation) | | | 407,178,708 | |
| | | | |
| |
Net realized and unrealized gain (loss) | | | 439,354,980 | |
| | | | |
| |
Net increase (decrease) in net assets resulting from operations | | | $551,168,601 | |
| | | | |
| |
*Foreign taxes withheld on dividends | | | $ 957,292 | |
| | | | | | |
| | | |
| | The accompanying notes are an integral part of these financial statements. | Semiannual Report | | | FI-19 | |
FRANKLIN TEMPLETON VARIABLE INSURANCE PRODUCTS TRUST
NOTES TO FINANCIAL STATEMENTS (UNAUDITED)
Statements of Changes in Net Assets
| | | | | | | | |
| | | Franklin Income VIP Fund | |
| | |
| | | Six Months Ended
June 30, 2019
(unaudited) | | | Year Ended
December 31, 2018 | |
| |
| | |
Increase (decrease) in net assets: | | | | | | | | |
Operations: | | | | | | | | |
Net investment income | | | $ 111,813,621 | | | | $ 235,338,694 | |
Net realized gain (loss) | | | 32,176,272 | | | | 351,140,755 | |
Net change in unrealized appreciation (depreciation) | | | 407,178,708 | | | | (809,608,127 | ) |
| | | | |
| | |
Net increase (decrease) in net assets resulting from operations | | | 551,168,601 | | | | (223,128,678 | ) |
| | | | |
Distributions to shareholders: | | | | | | | | |
Class 1 | | | (26,604,329 | ) | | | (34,377,723 | ) |
Class 2 | | | (301,656,285 | ) | | | (227,495,537 | ) |
Class 4 | | | (21,101,452 | ) | | | (14,948,805 | ) |
| | | | |
Total distributions to shareholders | | | (349,362,066 | ) | | | (276,822,065 | ) |
| | | | |
Capital share transactions: (Note 2) | | | | | | | | |
Class 1 | | | (270,269,053 | ) | | | (62,663,457 | ) |
Class 2 | | | 131,519,747 | | | | (543,422,123 | ) |
Class 4 | | | 12,111,032 | | | | (11,817,756 | ) |
| | | | |
Total capital share transactions | | | (126,638,274 | ) | | | (617,903,336 | ) |
| | | | |
| | |
Net increase (decrease) in net assets | | | 75,168,261 | | | | (1,117,854,079 | ) |
Net assets: | | | | | | | | |
Beginning of period | | | 4,994,009,635 | | | | 6,111,863,714 | |
| | | | |
| | |
End of period | | | $5,069,177,896 | | | | $ 4,994,009,635 | |
| | | | |
| | | | |
| | | |
FI-20 | | Semiannual Report | The accompanying notes are an integral part of these financial statements. | | |
FRANKLIN TEMPLETON VARIABLE INSURANCE PRODUCTS TRUST
Notes to Financial Statements (unaudited)
Franklin Income VIP Fund
1. Organization and Significant Accounting Policies
Franklin Templeton Variable Insurance Products Trust (Trust) is registered under the Investment Company Act of 1940 (1940 Act) as anopen-end management investment company, consisting of eighteen separate funds and applies the specialized accounting and reporting guidance in U.S. Generally Accepted Accounting Principles (U.S. GAAP). Franklin Income VIP Fund (Fund) is included in this report. Shares of the Fund are generally sold only to insurance company separate accounts to fund the benefits of variable life insurance policies or variable annuity contracts. The Fund offers three classes of shares: Class 1, Class 2 and Class 4. Each class of shares may differ by its distribution fees, voting rights on matters affecting a single class and its exchange privilege.
The following summarizes the Fund’s significant accounting policies.
a. Financial Instrument Valuation
The Fund’s investments in financial instruments are carried at fair value daily. Fair value is the price that would be received to sell an asset or paid to transfer a liability in an orderly transaction between market participants on the measurement date. The Fund calculates the net asset value (NAV) per share each business day as of 4 p.m. Eastern time or the regularly scheduled close of the New York Stock Exchange (NYSE), whichever is earlier. Under compliance policies and procedures approved by the Trust’s Board of Trustees (the Board), the Fund’s administrator has responsibility for oversight of valuation, including leading the cross-functional Valuation Committee (VC). The Fund may utilize independent pricing services, quotations from securities and financial instrument dealers, and other market sources to determine fair value.
Equity securities and derivative financial instruments listed on an exchange or on the NASDAQ National Market System are valued at the last quoted sale price or the official closing price of the day, respectively. Foreign equity securities are valued as of the close of trading on the foreign stock exchange on which the security is primarily traded, or as of 4 p.m. Eastern time. The value is then converted into its U.S. dollar equivalent at the foreign exchange rate in effect at 4 p.m. Eastern time on the day that the value of the security is determined.Over-the-counter (OTC) securities are valued within the range of the most recent quoted bid and ask prices. Securities that trade in multiple markets or on multiple
exchanges are valued according to the broadest and most representative market. Certain equity securities are valued based upon fundamental characteristics or relationships to similar securities.
Debt securities generally trade in the OTC market rather than on a securities exchange. The Fund’s pricing services use multiple valuation techniques to determine fair value. In instances where sufficient market activity exists, the pricing services may utilize a market-based approach through which quotes from market makers are used to determine fair value. In instances where sufficient market activity may not exist or is limited, the pricing services also utilize proprietary valuation models which may consider market characteristics such as benchmark yield curves, credit spreads, estimated default rates, anticipated market interest rate volatility, coupon rates, anticipated timing of principal repayments, underlying collateral, and other unique security features in order to estimate the relevant cash flows, which are then discounted to calculate the fair value. Securities denominated in a foreign currency are converted into their U.S. dollar equivalent at the foreign exchange rate in effect at 4 p.m. Eastern time on the date that the values of the foreign debt securities are determined.
Investments inopen-end mutual funds are valued at the closing NAV.
The Fund has procedures to determine the fair value of financial instruments for which market prices are not reliable or readily available. Under these procedures, the Fund primarily employs a market-based approach which may use related or comparable assets or liabilities, recent transactions, market multiples, book values, and other relevant information for the investment to determine the fair value of the investment. An income-based valuation approach may also be used in which the anticipated future cash flows of the investment are discounted to calculate fair value. Discounts may also be applied due to the nature or duration of any restrictions on the disposition of the investments. Due to the inherent uncertainty of valuations of such investments, the fair values may differ significantly from the values that would have been used had an active market existed.
Trading in securities on foreign securities stock exchanges and OTC markets may be completed before 4 p.m. Eastern time. In addition, trading in certain foreign markets may not take place on every Fund’s business day. Occasionally, events occur between the time at which trading in a foreign
FRANKLIN TEMPLETON VARIABLE INSURANCE PRODUCTS TRUST
NOTES TO FINANCIAL STATEMENTS (UNAUDITED)
Franklin Income VIP Fund(continued)
1. Organization and Significant Accounting Policies(continued)
a. Financial Instrument Valuation(continued)
security is completed and 4 p.m. Eastern time that might call into question the reliability of the value of a portfolio security held by the Fund. As a result, differences may arise between the value of the Fund’s portfolio securities as determined at the foreign market close and the latest indications of value at 4 p.m. Eastern time. In order to minimize the potential for these differences, the VC monitors price movements following the close of trading in foreign stock markets through a series of country specific market proxies (such as baskets of American Depositary Receipts, futures contracts and exchange traded funds). These price movements are measured against established trigger thresholds for each specific market proxy to assist in determining if an event has occurred that may call into question the reliability of the values of the foreign securities held by the Fund. If such an event occurs, the securities may be valued using fair value procedures, which may include the use of independent pricing services.
When the last day of the reporting period is anon-business day, certain foreign markets may be open on those days that the Fund’s NAV is not calculated, which could result in differences between the value of the Fund’s portfolio securities on the last business day and the last calendar day of the reporting period. Any significant security valuation changes due to an open foreign market are adjusted and reflected by the Fund for financial reporting purposes.
b. Foreign Currency Translation
Portfolio securities and other assets and liabilities denominated in foreign currencies are translated into U.S. dollars based on the exchange rate of such currencies against U.S. dollars on the date of valuation. The Fund may enter into foreign currency exchange contracts to facilitate transactions denominated in a foreign currency. Purchases and sales of securities, income and expense items denominated in foreign currencies are translated into U.S. dollars at the exchange rate in effect on the transaction date. Portfolio securities and assets and liabilities denominated in foreign currencies contain risks that those currencies will decline in value relative to the U.S. dollar. Occasionally, events may impact the availability or reliability of foreign exchange rates used to convert the U.S. dollar equivalent
value. If such an event occurs, the foreign exchange rate will be valued at fair value using procedures established and approved by the Board.
The Fund does not separately report the effect of changes in foreign exchange rates from changes in market prices on securities held. Such changes are included in net realized and unrealized gain or loss from investments in the Statement of Operations.
Realized foreign exchange gains or losses arise from sales of foreign currencies, currency gains or losses realized between the trade and settlement dates on securities transactions and the difference between the recorded amounts of dividends, interest, and foreign withholding taxes and the U.S. dollar equivalent of the amounts actually received or paid. Net unrealized foreign exchange gains and losses arise from changes in foreign exchange rates on foreign denominated assets and liabilities other than investments in securities held at the end of the reporting period.
c. Derivative Financial Instruments
The Fund invested in derivative financial instruments in order to manage risk or gain exposure to various other investments or markets. Derivatives are financial contracts based on an underlying or notional amount, require no initial investment or an initial net investment that is smaller than would normally be required to have a similar response to changes in market factors, and require or permit net settlement. Derivatives contain various risks including the potential inability of the counterparty to fulfill their obligations under the terms of the contract, the potential for an illiquid secondary market, and/or the potential for market movements which expose the Fund to gains or losses in excess of the amounts shown in the Statement of Assets and Liabilities. Realized gain and loss and unrealized appreciation and depreciation on these contracts for the period are included in the Statement of Operations.
Collateral requirements differ by type of derivative. Collateral or initial margin requirements are set by the broker or exchange clearing house for exchange traded and centrally cleared derivatives. Initial margin deposited is held at the exchange and can be in the form of cash and/or securities.
The Fund purchased or wrote exchange traded option contracts primarily to gain exposure to equity price risk. An option is a contract entitling the holder to purchase or sell a specific amount of shares or units of an asset or notional
FRANKLIN TEMPLETON VARIABLE INSURANCE PRODUCTS TRUST
NOTES TO FINANCIAL STATEMENTS (UNAUDITED)
Franklin Income VIP Fund(continued)
amount of a swap (swaption), at a specified price. When an option is purchased or written, an amount equal to the premium paid or received is recorded as an asset or liability, respectively. Upon exercise of an option, the acquisition cost or sales proceeds of the underlying investment is adjusted by any premium received or paid. Upon expiration of an option, any premium received or paid is recorded as a realized gain or loss. Upon closing an option other than through expiration or exercise, the difference between the premium received or paid and the cost to close the position is recorded as a realized gain or loss.
See Note 8 regarding other derivative information.
d. Index-Linked Notes
The Fund invests in index-linked notes. Index-linked notes are senior, unsecured, subordinated debt securities issued by a financial institution, and the value is based on the price movements of the underlying index. Index-linked notes are designed to provide investors access to the returns of various market benchmarks and intended to replicate the economic effects that would apply had the Fund directly purchased the underlying referenced asset or basket of assets. The risks of investing in index-linked notes include unfavorable price movements in the underlying index and the credit risk of the issuing financial institution. There may be no guarantee of a return of principal with index-linked notes and the appreciation potential may be limited. Index-linked notes may be more volatile and less liquid than other investments held by the Fund.
e. Equity-Linked Securities
The Fund invests in equity-linked securities. Equity-linked securities are hybrid financial instruments that generally combine both debt and equity characteristics into a single note form. Income received from equity-linked securities is recorded as realized gains in the Statement of Operations and may be based on the performance of an underlying equity security, an equity index, or an option position. The risks of investing in equity-linked securities include unfavorable price movements in the underlying security and the credit risk of the issuing financial institution. There may be no guarantee of a return of principal with equity-linked securities and the appreciation potential may be limited. Equity-linked securities may be more volatile and less liquid than other investments held by the Fund.
f. Securities Lending
The Fund participates in an agency based securities lending program to earn additional income. The Fund receives cash collateral against the loaned securities in an amount equal to at least 102% of the fair value of the loaned securities. Collateral is maintained over the life of the loan in an amount not less than 100% of the fair value of loaned securities, as determined at the close of Fund business each day; any additional collateral required due to changes in security values is delivered to the Fund on the next business day. The collateral is deposited into a joint cash account with other funds and is used to invest in a money market fund managed by Franklin Advisers, Inc., an affiliate of the Fund, and/or a joint repurchase agreement. The Fund may receive income from the investment of cash collateral, in addition to lending fees and rebates paid by the borrower. Income from securities loaned, net of fees paid to the securities lending agent and/or third-party vendor, is reported separately in the Statement of Operations. The Fund bears the market risk with respect to the collateral investment, securities loaned, and the risk that the agent may default on its obligations to the Fund. If the borrower defaults on its obligation to return the securities loaned, the Fund has the right to repurchase the securities in the open market using the collateral received. The securities lending agent has agreed to indemnify the Fund in the event of default by a third party borrower. At June 30, 2019, the Fund had no securities on loan.
g. Senior Floating Rate Interests
The Fund invests in senior secured corporate loans that pay interest at rates which are periodically reset by reference to a base lending rate plus a spread. These base lending rates are generally the prime rate offered by a designated U.S. bank or the London InterBank Offered Rate (LIBOR). Senior secured corporate loans often require prepayment of principal from excess cash flows or at the discretion of the borrower. As a result, actual maturity may be substantially less than the stated maturity. Senior secured corporate loans in which the Fund invests are generally readily marketable, but may be subject to certain restrictions on resale.
h. Income and Deferred Taxes
It is the Fund’s policy to qualify as a regulated investment company under the Internal Revenue Code. The Fund intends to distribute to shareholders substantially all of its
FRANKLIN TEMPLETON VARIABLE INSURANCE PRODUCTS TRUST
NOTES TO FINANCIAL STATEMENTS (UNAUDITED)
Franklin Income VIP Fund(continued)
1. Organization and Significant Accounting Policies(continued)
h. Income and Deferred Taxes(continued)
taxable income and net realized gains to relieve it from federal income and if applicable, excise taxes. As a result, no provision for U.S. federal income taxes is required.
The Fund may be subject to foreign taxation related to income received, capital gains on the sale of securities and certain foreign currency transactions in the foreign jurisdictions in which it invests. Foreign taxes, if any, are recorded based on the tax regulations and rates that exist in the foreign markets in which the Fund invests. When a capital gain tax is determined to apply, the Fund records an estimated deferred tax liability in an amount that would be payable if the securities were disposed of on the valuation date.
As a result of several court cases, in certain countries across the European Union, the Fund filed additional tax reclaims for previously withheld taxes on dividends earned in those countries (EU reclaims). These additional filings are subject to various administrative proceedings by the local jurisdictions’ tax authorities within the European Union, as well as a number of related judicial proceedings. Income recognized, if any, for EU reclaims is reflected as other income in the Statement of Operations and any related receivable, if any, is reflected as European Union tax reclaims in the Statement of Assets and Liabilities. When uncertainty exists as to the ultimate resolution of these proceedings, the likelihood of receipt of these EU reclaims, and the potential timing of payment, no amounts are reflected in the financial statements. For U.S. income tax purposes, when EU reclaims are received by the Fund and the Fund previously passed foreign tax credit on to its shareholders, the Fund must either amend historic tax reporting to shareholders or enter into a closing agreement with the Internal Revenue Service (IRS) in order to pay the associated tax liability on behalf of the Fund’s shareholders.
The Fund may recognize an income tax liability related to its uncertain tax positions under U.S. GAAP when the uncertain tax position has a less than 50% probability that it will be sustained upon examination by the tax authorities based on its technical merits. As of June 30, 2019, the Fund has determined that no tax liability is required in its financial statements related to uncertain tax positions for any open tax years (or expected to be taken in future tax years). Open tax
years are those that remain subject to examination and are based on the statute of limitations in each jurisdiction in which the Fund invests.
i. Security Transactions, Investment Income, Expenses and Distributions
Security transactions are accounted for on trade date. Realized gains and losses on security transactions are determined on a specific identification basis. Interest income and estimated expenses are accrued daily. Amortization of premium and accretion of discount on debt securities are included in interest income. Facility fees are recognized as income over the expected term of the loan. Dividend income is recorded on theex-dividend date except for certain dividends from securities where the dividend rate is not available. In such cases, the dividend is recorded as soon as the information is received by the Fund. Distributions to shareholders are recorded on theex-dividend date.
Distributable earnings are determined according to income tax regulations (tax basis) and may differ from earnings recorded in accordance with U.S. GAAP. These differences may be permanent or temporary. Permanent differences are reclassified among capital accounts to reflect their tax character. These reclassifications have no impact on net assets or the results of operations. Temporary differences are not reclassified, as they may reverse in subsequent periods.
Common expenses incurred by the Trust are allocated among the Funds based on the ratio of net assets of each Fund to the combined net assets of the Trust or based on the ratio of number of shareholders of each Fund to the combined number of shareholders of the Trust. Fund specific expenses are charged directly to the Fund that incurred the expense.
Realized and unrealized gains and losses and net investment income, excluding class specific expenses, are allocated daily to each class of shares based upon the relative proportion of net assets of each class. Differences in per share distributions by class are generally due to differences in class specific expenses.
j. Accounting Estimates
The preparation of financial statements in accordance with U.S. GAAP requires management to make estimates and assumptions that affect the reported amounts of assets and liabilities at the date of the financial statements and the amounts of income and expenses during the reporting period. Actual results could differ from those estimates.
FRANKLIN TEMPLETON VARIABLE INSURANCE PRODUCTS TRUST
NOTES TO FINANCIAL STATEMENTS (UNAUDITED)
Franklin Income VIP Fund(continued)
k. Guarantees and Indemnifications
Under the Trust’s organizational documents, its officers and trustees are indemnified by the Trust against certain liabilities arising out of the performance of their duties to the Trust. Additionally, in the normal course of business, the Trust, on behalf of the Fund, enters into contracts with service
providers that contain general indemnification clauses. The Trust’s maximum exposure under these arrangements is unknown as this would involve future claims that may be made against the Trust that have not yet occurred. Currently, the Trust expects the risk of loss to be remote.
2. Shares of Beneficial Interest
At June 30, 2019, there were an unlimited number of shares authorized (without par value). Transactions in the Fund’s shares were as follows:
| | | | | | | | | | | | | | | | |
| | | Six Months Ended June 30, 2019 | | | Year Ended December 31, 2018 | |
| | | Shares | | | Amount | | | Shares | | | Amount | |
| | | | |
| Class 1 Shares: | | | | | | | | | | | | | | | | |
Shares sold | | | 806,551 | | | $ | 13,154,961 | | | | 1,947,322 | | | | $ 31,806,598 | |
Shares issued in reinvestment of distributions | | | 1,709,790 | | | | 26,604,329 | | | | 2,128,651 | | | | 34,377,723 | |
Shares redeemed | | | (18,292,504 | ) | | | (310,028,343 | ) | | | (7,908,010) | | | | (128,847,778) | |
Net increase (decrease) | | | (15,776,163 | ) | | $ | (270,269,053 | ) | | | (3,832,037) | | | | $ (62,663,457) | |
| | | | |
| Class 2 Shares: | | | | | | | | | | | | | | | | |
Shares sold | | | 11,147,845 | | | $ | 175,850,953 | | | | 11,659,052 | | | | $ 185,115,657 | |
Shares issued in reinvestment of distributions | | | 20,097,021 | | | | 301,656,285 | | | | 14,573,705 | | | | 227,495,537 | |
Shares redeemed | | | (21,839,655 | ) | | | (345,987,491 | ) | | | (60,726,257) | | | | (956,033,317) | |
Net increase (decrease) | | | 9,405,211 | | | $ | 131,519,747 | | | | (34,493,500) | | | | $(543,422,123) | |
| | | | |
| Class 4 Shares: | | | | | | | | | | | | | | | | |
Shares sold | | | 1,437,622 | | | $ | 23,391,101 | | | | 2,953,880 | | | | $ 48,028,259 | |
Shares issued in reinvestment of distributions | | | 1,370,224 | | | | 21,101,452 | | | | 934,885 | | | | 14,948,805 | |
Shares redeemed | | | (2,005,393 | ) | | | (32,381,521 | ) | | | (4,625,977) | | | | (74,794,820) | |
| | | | |
Net increase (decrease) | | | 802,453 | | | $ | 12,111,032 | | | | (737,212) | | | | $ (11,817,756) | |
3. Transactions with Affiliates
Franklin Resources, Inc. is the holding company for various subsidiaries that together are referred to as Franklin Templeton. Certain officers and trustees of the Fund are also officers and/or directors of the following subsidiaries:
| | | | |
| Subsidiary | | Affiliation | | |
| Franklin Advisers, Inc. (Advisers) | | Investment manager | | |
| Franklin Templeton Services, LLC (FT Services) | | Administrative manager | | |
| Franklin Templeton Distributors, Inc. (Distributors) | | Principal underwriter | | |
| Franklin Templeton Investor Services, LLC (Investor Services) | | Transfer agent | | |
FRANKLIN TEMPLETON VARIABLE INSURANCE PRODUCTS TRUST
NOTES TO FINANCIAL STATEMENTS (UNAUDITED)
Franklin Income VIP Fund(continued)
3. Transactions with Affiliates(continued)
a. Management Fees
The Fund pays an investment management fee to Advisers based on the average daily net assets of the Fund as follows:
| | | | |
| Annualized Fee Rate | | Net Assets | | |
| 0.625% | | Up to and including $100 million | | |
| 0.500% | | Over $100 million, up to and including $250 million | | |
| 0.450% | | Over $250 million, up to and including $7.5 billion | | |
| 0.440% | | Over $7.5 billion, up to and including $10 billion | | |
| 0.430% | | Over $10 billion, up to and including $12.5 billion | | |
| 0.420% | | Over $12.5 billion, up to and including $15 billion | | |
| 0.400% | | In excess of $15 billion | | |
For the period ended June 30, 2019, the annualized gross effective investment management fee rate was 0.455% of the Fund’s average daily net assets.
b. Administrative Fees
Under an agreement with Advisers, FT Services provides administrative services to the Fund. The fee is paid by Advisers based on the Fund’s average daily net assets, and is not an additional expense of the Fund.
c. Distribution Fees
The Board has adopted distribution plans for Class 2 and Class 4 shares pursuant to Rule12b-1 under the 1940 Act. Under the Fund’s compensation distribution plans, the Fund pays Distributors for costs incurred in connection with the servicing, sale and distribution of the Fund’s shares up to 0.35% per year of its average daily net assets of each class. The Board has agreed to limit the current rate to 0.25% per year for Class 2. The plan year, for purposes of monitoring compliance with the maximum annual plan rates, is February 1 through January 31.
d. Transfer Agent Fees
Investor Services, under terms of an agreement, performs shareholder servicing for the Fund and is not paid by the Fund for the services.
e. Investments in Affiliated Management Investment Companies
The Fund invests in one or more affiliated management investment companies for purposes other than exercising a controlling influence over the management or policies. Management fees paid by the Fund are waived on assets invested in the affiliated management investment companies, as noted in the Statement of Operations, in an amount not to exceed the management and administrative fees paid directly or indirectly by each affiliate. During the period ended June 30, 2019, the Fund held investments in affiliated management investment companies as follows:
FRANKLIN TEMPLETON VARIABLE INSURANCE PRODUCTS TRUST
NOTES TO FINANCIAL STATEMENTS (UNAUDITED)
Franklin Income VIP Fund(continued)
| | | | | | | | | | | | | | | | | | | | | | | | | | | | | | | | |
| | | Value at
Beginning of Period | | | Purchases | | | Sales | | | Realized
Gain (Loss) | | | Net Change in
Unrealized
Appreciation
(Depreciation) | | | Value at End of
Period | | | Number of
Shares
Held at End
of Period | | | Investment
Income | |
| | | | | | | |
| Non-Controlled Affiliates | | | | | | | | | | | | | | | | | | | | | | | | | | | | | |
| | | | | | | | | | | | | | | | | | | | | | | | | | | | | | | Dividends | |
| | | | | | | | | | | | |
Institutional Fiduciary Trust Money Market Portfolio, 2.05% | | | $157,193,174 | | | | $716,743,287 | | | | $(698,112,283 | ) | | | $ — | | | | $ — | | | | $175,824,178 | | | | 175,824,178 | | | | $1,403,664 | |
| | | | | | | | |
| | | | | | | | | | | | | | | | | | | | | | | | | | | | | |
| Income from
securities
loaned |
|
| | | | | | | | | | | | |
Institutional Fiduciary Trust Money Market Portfolio, 2.05% | | | 1,099,000 | | | | 38,311,000 | | | | (39,410,000 | ) | | | — | | | | — | | | | — | | | | — | | | | 15,410 | |
| | | | | | | | | | | | |
| | | | | | | | |
Total Affiliated Securities | | | $158,292,174 | | | | $755,054,287 | | | | $(737,522,283 | ) | | | $ — | | | | $ — | | | | $175,824,178 | | | | | | | | $1,419,074 | |
| | | | | | | | | | | | |
4. Expense Offset Arrangement
The Fund has entered into an arrangement with its custodian whereby credits realized as a result of uninvested cash balances are used to reduce a portion of the Fund’s custodian expenses. During the period ended June 30, 2019, the custodian fees were reduced as noted in the Statement of Operations.
5. Income Taxes
At June 30, 2019, the cost of investments and net unrealized appreciation (depreciation) for income tax purposes were as follows:
| | | | |
| |
Cost of investments | | $ | 4,719,657,003 | |
| |
| | | | |
| |
Unrealized appreciation | | $ | 582,809,046 | |
| |
Unrealized depreciation | | | (309,465,974) | |
| |
| | | | |
| |
Net unrealized appreciation (depreciation) | | $ | 273,343,072 | |
| | | | |
Differences between income and/or capital gains as determined on a book basis and a tax basis are primarily due to differing treatments of bond discounts and premiums and equity-linked securities.
6. Investment Transactions
Purchases and sales of investments (excluding short term securities) for the period ended June 30, 2019, aggregated $521,769,403 and $936,269,985 respectively.
7. Credit Risk and Defaulted Securities
At June 30, 2019, the Fund had 33.6% of its portfolio invested in high yield, senior secured floating rate loans, or other securities rated below investment grade and unrated securities, if any. These securities may be more sensitive to economic conditions causing greater price volatility and are potentially subject to a greater risk of loss due to default than higher rated securities.
FRANKLIN TEMPLETON VARIABLE INSURANCE PRODUCTS TRUST
NOTES TO FINANCIAL STATEMENTS (UNAUDITED)
Franklin Income VIP Fund(continued)
7. Credit Risk and Defaulted Securities(continued)
The Fund held defaulted securities and/or other securities for which the income has been deemed uncollectible. At June 30, 2019, the aggregate value of these securities was $80,989,500, representing 1.6% of the Fund’s net assets. The Fund discontinues accruing income on securities for which income has been deemed uncollectible and provides an estimate for losses on interest receivable. The securities have been identified in the accompanying Statement of Investments.
8. Other Derivative Information
At June 30, 2019, investments in derivative contracts are reflected in the Statement of Assets and Liabilities as follows:
| | | | | | | | | | | | | | | | |
| | | |
| | | Asset Derivatives | | | | | | Liability Derivatives | |
| | | | | |
Derivative Contracts Not Accounted for as Hedging Instruments | | Statement of Assets and Liabilities Location | | Fair Value | | | | | | Statement of Assets and Liabilities Location | | Fair Value | |
| | | | | |
Equity contracts | | Investments in securities, at value | | | $ — | | | | | | | Options written, at value | | | $1,245,510 | |
| | | | | | | | | | | | | | | | |
For the period ended June 30, 2019, the effect of derivative contracts in the Statement of Operations was as follows:
| | | | | | | | | | | | | | | | |
| | | | | |
Derivative Contracts Not Accounted for as Hedging Instruments | | Statement of Operations Location | | Net Realized
Gain (Loss) for
the Period | | | | | | Statement of Operations Location | | Net Change in
Unrealized
Appreciation
(Depreciation)
for the Period | |
| | | | | |
| | Net realized gain (loss) from: | | | | | | | | | | Net change in unrealized | | | | |
| | | | | | | | | | | | appreciation (depreciation) on: | | | | |
| | | | | |
Equity contracts | | Written options | | | $ — | | | | | | | Written options | | | $28,452 | |
| | | | | | | | | | | | | | | | |
For the period ended June 30, 2019, the average month end notional amount of options represented 124,500 shares.
See Note 1(c) regarding derivative financial instruments.
9. Credit Facility
The Fund, together with other U.S. registered and foreign investment funds (collectively, Borrowers), managed by Franklin Templeton, are borrowers in a joint syndicated senior unsecured credit facility totaling $2 billion (Global Credit Facility) which matures on February 7, 2020. This Global Credit Facility provides a source of funds to the Borrowers for temporary and emergency purposes, including the ability to meet future unanticipated or unusually large redemption requests.
Under the terms of the Global Credit Facility, the Fund shall, in addition to interest charged on any borrowings made by the Fund and other costs incurred by the Fund, pay its share of fees and expenses incurred in connection with the implementation and maintenance of the Global Credit Facility, based upon its relative share of the aggregate net assets of all of the Borrowers, including an annual commitment fee of 0.15% based upon the unused portion of the Global Credit Facility. These fees are reflected in other expenses in the Statement of Operations. During the period ended June 30, 2019, the Fund did not use the Global Credit Facility.
FRANKLIN TEMPLETON VARIABLE INSURANCE PRODUCTS TRUST
NOTES TO FINANCIAL STATEMENTS (UNAUDITED)
Franklin Income VIP Fund(continued)
10. Fair Value Measurements
The Fund follows a fair value hierarchy that distinguishes between market data obtained from independent sources (observable inputs) and the Fund’s own market assumptions (unobservable inputs). These inputs are used in determining the value of the Fund’s financial instruments and are summarized in the following fair value hierarchy:
| | • | | Level 1 – quoted prices in active markets for identical financial instruments |
| | • | | Level 2 – other significant observable inputs (including quoted prices for similar financial instruments, interest rates, prepayment speed, credit risk, etc.) |
| | • | | Level 3 – significant unobservable inputs (including the Fund’s own assumptions in determining the fair value of financial instruments) |
The input levels are not necessarily an indication of the risk or liquidity associated with financial instruments at that level.
A summary of inputs used as of June 30, 2019, in valuing the Fund’s assets and liabilities carried at fair value, is as follows:
| | | | | | | | | | | | | | | | |
| | | | |
| | | Level 1 | | | Level 2 | | | Level 3 | | | Total | |
| | | | |
| Assets: | | | | | | | | | | | | | | | | |
| | | | |
Investments in Securities:a | | | | | | | | | | | | | | | | |
| | | | |
Equity Investments:b | | | | | | | | | | | | | | | | |
| | | | |
Financials | | | $ 344,806,528 | | | | $ 19,237,500 | | | | $ — | | | | $ 364,044,028 | |
| | | | |
All Other Equity Investments | | | 1,695,569,422 | | | | — | | | | — | | | | 1,695,569,422 | |
| | | | |
Equity-Linked Securities | | | — | | | | 255,562,677 | | | | — | | | | 255,562,677 | |
| | | | |
Index-Linked Notes | | | — | | | | 14,167,960 | | | | — | | | | 14,167,960 | |
| | | | |
Convertible Bonds | | | — | | | | 47,964,641 | | | | — | | | | 47,964,641 | |
| | | | |
Corporate Bonds | | | — | | | | 1,953,162,076 | | | | — | | | | 1,953,162,076 | |
| | | | |
Senior Floating Rate Interests | | | — | | | | 104,832,439 | | | | — | | | | 104,832,439 | |
| | | | |
U.S. Government and Agency Securities | | | — | | | | 383,118,164 | | | | — | | | | 383,118,164 | |
| | | | |
Escrows and Litigation Trusts | | | — | | | | — | | | | — | c | | | — | |
| | | | |
Short Term Investments | | | 175,824,178 | | | | — | | | | — | | | | 175,824,178 | |
| | | | |
| | | | |
Total Investments in Securities | | | $ 2,216,200,128 | | | | $ 2,778,045,457 | | | | $ — | | | | $ 4,994,245,585 | |
| | | | |
| | | | |
| Liabilities: | | | | | | | | | | | | | | | | |
| | | | |
Other Financial Instruments: | | | | | | | | | | | | | | | | |
| | | | |
Options Written | | | $ 1,245,510 | | | | $ — | | | | $ — | | | | $ 1,245,510 | |
| | | | |
aFor detailed categories, see the accompanying Statement of Investments.
bIncludes common, preferred and convertible preferred stocks.
cIncludes securities determined to have no value at June 30, 2019.
A reconciliation of assets in which Level 3 inputs are used in determining fair value is presented when there are significant Level 3 financial instruments at the beginning and/or end of the period.
11. Subsequent Events
The Fund has evaluated subsequent events through the issuance of the financial statements and determined that no events have occurred that require disclosure.
FRANKLIN TEMPLETON VARIABLE INSURANCE PRODUCTS TRUST
NOTES TO FINANCIAL STATEMENTS (UNAUDITED)
Franklin Income VIP Fund(continued)
Abbreviations
| | | | | | |
| |
| Currency | | Selected Portfolio |
| | | |
| EUR | | Euro | | ADR | | American Depositary Receipt |
| | | |
| USD | | United States Dollar | | FNMA | | Federal National Mortgage Association |
| | | |
| | | | FRN | | Floating Rate Note |
| | | |
| | | | LIBOR | | London InterBank Offered Rate |
Franklin Large Cap Growth VIP Fund
This semiannual report for Franklin Large Cap Growth VIP Fund covers the period ended June 30, 2019.
Class 2 Performance Summary as of June 30, 2019
The Fund’s Class 2 Shares posted a +26.44% total return for thesix-month period ended June 30, 2019.
Performance reflects the Fund’s Class 2 operating expenses, but doesnotinclude any contract fees, expenses or sales charges. If they had been included, performance would be lower. These charges and deductions, particularly for variable life policies, can have a significant effect on contract values and insurance benefits. See the contract prospectus for a complete description of these expenses, including sales charges.
Performance data represent past performance, which does not guarantee future results. Investment return and principal value will fluctuate, and you may have a gain or loss when you sell your shares. Current performance may differ from figures shown.
FRANKLIN LARGE CAP GROWTH VIP FUND
Fund Goal and Main Investments
The Fund seeks capital appreciation. Under normal market conditions, the Fund invests at least 80% of its net assets in investments of large-capitalization companies. For this Fund, large-capitalization companies are those with market capitalization values within those of the top 50% of companies in the Russell 1000® Index at the time of purchase.1
Fund Risks
All investments involve risks, including possible loss of principal. Stock prices fluctuate, sometimes rapidly and dramatically, due to factors affecting individual companies, particular industries or sectors, or general market conditions. Growth stock prices reflect projections of future earnings or revenues, and can, therefore, fall dramatically if the company fails to meet those projections. The Fund may focus on particular sectors of the market from time to time, which can carry greater risks of adverse developments in such sectors. Investments in foreign securities may involve special risks including currency fluctuations and economic and political uncertainty. Smaller or midsized companies can be particularly sensitive to changing economic conditions, and their prospects for growth are less certain than those of larger, more established companies. The Fund is actively managed but there is no guarantee that the manager’s investment decisions will produce the desired results. The Fund’s prospectus also includes a description of the main investment risks.
Performance Overview
You can find the Fund’ssix-month total return in the Performance Summary. In comparison, the Fund’s benchmark, the Standard & Poor’s® 500 Index (S&P 500®), posted a +18.54% total return.2
Economic and Market Overview
The U.S. economy grew during the six months ended June 30, 2019. After moderating for two consecutive quarters, the economy grew significantly faster in 2019’s first quarter, driven by growth in consumer spending, inventory investment, exports, business investment, and state and
Portfolio Composition
Based on Total Net Assets as of 6/30/19
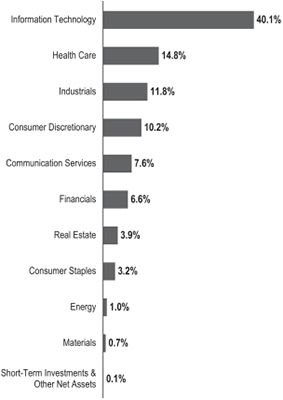
local government spending. However, the economy moderated again in the second quarter, due to weakness in inventory investment, exports, business investment and housing investment. The manufacturing and services sectors expanded during the period. The unemployment rate decreased from 3.9% in December 2018 to 3.7% atperiod-end.3 The annual inflation rate, as measured by the Consumer Price Index, decreased from 1.9% in December 2018 to 1.6% atperiod-end.3
The U.S. Federal Reserve (Fed) held its target range for the federal funds rate unchanged, at 2.25%–2.50%, during the reporting period. In March, the Fed mentioned it would end its balance sheet normalization program by the end of September 2019. In June, the Fed indicated increased uncertainties around its views on economic activity and the
1. Please see Index Descriptions following the Fund Summaries.
2. Source: Morningstar. One cannot invest directly in an index, and an index is not representative of the Fund’s portfolio. Please see Index Descriptions following the Fund Summaries.
3. Source: Bureau of Labor Statistics.
The dollar value, number of shares or principal amount, and names of all portfolio holdings are listed in the Fund’s Statement of Investments (SOI).
FRANKLIN LARGE CAP GROWTH VIP FUND
labor market. With market-based inflation measures remaining low in recent months, the market has interpreted the Fed’s recent statements to mean it will likely cut rates in 2019’s second half to foster continued economic growth while attempting to achieve its inflation objective.
U.S. equity markets overall rose during the period, benefiting from upbeat economic data and U.S. corporate earnings. However, markets reflected concerns about tighter regulation of technology companies, U.S. political uncertainties, and the impact of U.S. trade disputes with China and other trading partners on global growth and corporate earnings. These concerns were partially alleviated in 2019’s first four months by easing trade tensions and optimism about a potential U.S.-China trade deal. Furthermore, markets benefited from the Fed’s indications of a patient approach to its monetary policy decisions. The broad U.S. stock market, as measured by the S&P 500, rallied in 2019’s first four months, reaching a newall-time high in April 2019. After declining in May due to escalating trade tensions, stocks reached anotherall-time high in June amid investor optimism about potential interest-rate cuts. Overall, the S&P 500 posted a +18.54% total return for thesix-month period.2
Investment Strategy
We are a research driven, fundamental investor, pursuing a growth strategy. As abottom-up investor focusing primarily on individual securities, we seek companies that have identifiable drivers of future earnings growth and that present, in our opinion, the besttrade-off between that potential earnings growth, business and financial risk, and valuation.
Manager’s Discussion
Looking back on the key factors affecting the Fund’s returns during the six months under review, we would like to remind shareholders that our investment strategy is primarilybottom-up and driven by individual stock selection. However, we recognize that a sector-based discussion can be a helpful way to organize a portfolio review of key performance drivers. We employed our long-held strategy:bottom-up, individual company, fundamental research aimed at opportunistically finding what we believed to be outstanding large-capitalization companies across all sectors, at valuations we believed understated their fair worth, with future growth potential being a key driver of estimated worth.
During the period under review, all sectors represented in the Fund’s portfolio posted positive returns and contributed to absolute performance, as well as to performance relative to the S&P 500. An overweighting and stock selection in the
| | |
| Top 10 Holdings | | |
| 6/30/19 | | |
| |
Company Sector/Industry | | % of Total
Net Assets |
Amazon.com Inc. | | 7.7% |
| Consumer Discretionary | | |
Mastercard Inc. | | 6.1% |
| Information Technology | | |
Microsoft Corp. | | 5.7% |
| Information Technology | | |
Visa Inc. | | 4.9% |
| Information Technology | | |
Alphabet Inc. | | 3.4% |
| Communication Services | | |
ServiceNow Inc. | | 3.3% |
| Information Technology | | |
SBA Communications Corp. | | 2.7% |
| Real Estate | | |
CoStar Group Inc. | | 2.7% |
| Industrials | | |
Apple Inc. | | 2.5% |
| Information Technology | | |
Adobe Inc. | | 2.4% |
| Information Technology | | |
information technology (IT) sector contributed significantly to the Fund’s relative performance. Other notable contributors included stock selection in the health care and industrials sectors.
In the IT sector, our investments in financial technology companies Mastercard and Visa, as well as cloud-based enterprise workflow management provider ServiceNow (not part of the index), boosted relative results. Mastercard continues to perform very well, exceeding expectations and announcing several growth initiatives, partnerships, acquisition of capabilities that expand its global network, investment in emerging regions and expansion into new payment flows. The company has shown an ability to both invest for the long term and deliver solidquarter-to-quarter execution, which we believe is supported by a strong organic growth profile. ServiceNow, which enables companies to become more automated and efficient, continues to execute well in its large addressable market. A leader in enabling digital transformation, the company is becoming a multi-platform growth business with a strong product line, in our analysis. The recently introduced pro version of a core offering comes at a price premium we believe could drive revenue and billings growth.
FRANKLIN LARGE CAP GROWTH VIP FUND
In the health care sector, our positions in cloud-based life sciences software solutions provider Veeva Systems (not part of the index) and precision oncology company Guardant Health (not part of the index) contributed to relative results.
In the industrials sector, commercial real estate information, analytics and marketing services company CoStar Group (not part of the index) performed well as all business segments exhibited strong growth. We expect CoStar to continue to achieve robust growth with the help of its Apartments.com and LoopNet.com businesses, which concentrate on apartment rental listings and commercial property marketplaces, respectively.
Other notable contributors to relative results included our position in MSCI, a provider of investment decision support tools, including indexes and portfolio risk and performance analytics.
In contrast, key individual detractors from relative results included our holdings in biotechnology firm Heron Therapeutics (not part of the index), medical devices manufacturer ABIOMED and frozen potato products company Lamb Weston Holdings. Heron’s shares fell after the company announced the U.S. Food and Drug Administration (FDA) said it was unable to approve the new drug application forHTX-011 for the management of postoperative pain, citing the need for additional information. However, the FDA did not mention any issues withHTX-011’s safety or efficacy. ABIOMED’s shares declined after an FDA investigation suggested higher mortality rates of patients using the firm’s Impella RP heart pump. ABIOMED is beginning a launch of Impella CP, its most widely used pump model, in Japan, which could support growth. Lamb Weston’s shares declined due to investor concerns about modestly higher capacity coming online. However, the company continued to see strong growth, driven by robust sales trends and strong pricing power.
Other key detractors included our positions in health care coverage and services firm UnitedHealth Group, government-sponsored health care programs and services provider Centene (not held atperiod-end), education technology company 2U (not part of the index) and financial services firm Charles Schwab.
Thank you for your participation in Franklin Large Cap Growth VIP Fund. We look forward to serving your future investment needs.
The foregoing information reflects our analysis, opinions and portfolio holdings as of June 30, 2019, the end of the reporting period. The way we implement our main investment strategies and the resulting portfolio holdings may change depending on factors such as market and economic conditions. These opinions may not be relied upon as investment advice or an offer for a particular security. The information is not a complete analysis of every aspect of any market, country, industry, security or the Fund. Statements of fact are from sources considered reliable, but the investment manager makes no representation or warranty as to their completeness or accuracy. Although historical performance is no guarantee of future results, these insights may help you understand our investment management philosophy.
FRANKLIN LARGE CAP GROWTH VIP FUND
Class 2 Fund Expenses
As an investor in a variable insurance contract (Contract) that indirectly provides for investment in an underlying mutual fund, you can incur transaction and/or ongoing expenses at both the Fund level and the Contract Level: (1) transaction expenses can include sales charges (loads) on purchases, surrender fees, transfer fees and premium taxes; and (2) ongoing expenses can include management fees, distribution and service(12b-1) fees, contract fees, annual maintenance fees, mortality and expense risk fees and other fees and expenses. All mutual funds and Contracts have some types of ongoing expenses. The table below shows Fund-level ongoing expenses and can help you understand these costs and compare them with those of other mutual funds offered through the Contract. The table assumes a $1,000 investment held for the six months indicated. Please refer to the Fund prospectus for additional information on operating expenses.
Actual Fund Expenses
The table below provides information about the actual account values and actual expenses in the columns under the heading “Actual.” In these columns the Fund’s actual return, which includes the effect of ongoing Fund expenses but does not include the effect of ongoing Contract expenses, is used to calculate the “Ending Account Value.” You can estimate the Fund-level expenses you paid during the period by following these steps (of course, your account value and expenses will differ from those in this illustration): Divide your account value by $1,000 (if your account had an $8,600 value, then $8,600÷ $1,000 =8.6). Then multiply the result by the number under the headings “Actual” and “Fund-Level Expenses Paid During Period” (if Fund-Level Expenses Paid During Period were $ 7.50, then 8.6 x $ 7.50 = $64.50). In this illustration, the estimated expenses paid this period at the Fund level are $64.50.
Hypothetical Example for Comparison with Other Mutual Funds
Under the heading “Hypothetical” in the table, information is provided about hypothetical account values and hypothetical expenses based on the Fund’s actual expense ratio and an assumed rate of return of 5% per year before expenses, which is not the Fund’s actual return. This information may not be used to estimate the actual ending account balance or expenses you paid for the period, but it can help you compare ongoing costs of investing in the Fund with those of other mutual funds offered through the Contract. To do so, compare this 5% hypothetical example with the 5% hypothetical examples that appear in the shareholder reports of other funds offered through the Contract.
Please note that expenses shown in the table are meant to highlight ongoing costs at the Fund level only and do not reflect any ongoing expenses at the Contract level, or transaction expenses at either the Fund or Contract levels. In addition, while the Fund does not have transaction expenses, if the transaction and ongoing expenses at the Contract level were included, the expenses shown below would be higher. You should consult your Contract prospectus or disclosure document for more information.
| | | | | | | | | | | | |
| | | | | Actual
(actual return after expenses) | | Hypothetical
(5% annual return before expenses) | | |
Share Class | | Beginning
Account
Value 1/1/19 | | Ending
Account
Value 6/30/19 | | Fund-Level
Expenses
Paid During
Period
1/1/19–6/30/191, 2 | | Ending Account Value 6/30/19 | | Fund-Level
Expenses Paid During Period 1/1/19–6/30/191, 2 | | Net
Annualized
Expense
Ratio2 |
| | | | | | |
Class 2 | | $1,000 | | $1,264.40 | | $6.12 | | $1,019.39 | | $5.46 | | 1.09% |
1. Expenses are equal to the annualized expense ratio for thesix-month period as indicated above—in the far right column—multiplied by the simple average account value over the period indicated, and then multiplied by 181/365 to reflect theone-half year period.
2. Reflects expenses after fee waivers and expense reimbursements. Does not include any ongoing expenses of the Contract for which the Fund is an investment option or acquired fund fees and expenses.
FRANKLIN TEMPLETON VARIABLE INSURANCE PRODUCTS TRUST
Financial Highlights
Franklin Large Cap Growth VIP Fund
| | | | | | | | | | | | | | | | | | | | | | | | |
| | |
| | | Six Months Ended June 30, 2019 (unaudited) | | | Year Ended December 31, | |
| | | 2018 | | | 2017 | | | 2016 | | | 2015 | | | 2014 | |
| |
| | | | | | |
| Class 1 | | | | | | | | | | | | | | | | | | | | | | | | |
| | | | | | |
Per share operating performance
(for a share outstanding throughout the period) | | | | | | | | | | | | | | | | | | | | | | | | |
| | | | | | |
Net asset value, beginning of period | | | $19.19 | | | | $20.93 | | | | $17.85 | | | | $18.42 | | | | $23.26 | | | | $20.91 | |
| | | | |
| | | | | | |
| Income from investment operationsa: | | | | | | | | | | | | | | | | | | | | | | | | |
| | | | | | |
Net investment income (loss)b | | | (0.03 | ) | | | (0.04 | ) | | | (0.03 | ) | | | (0.04 | ) | | | (0.06 | ) | | | 0.11 | |
| | | | | | |
Net realized and unrealized gains (losses) | | | 5.07 | | | | 0.03 | | | | 4.91 | | | | (0.26 | ) | | | 1.56 | | | | 2.54 | |
| | | | |
| | | | | | |
Total from investment operations | | | 5.04 | | | | (0.01 | ) | | | 4.88 | | | | (0.30 | ) | | | 1.50 | | | | 2.65 | |
| | | | |
| | | | | | |
Less distributions from: | | | | | | | | | | | | | | | | | | | | | | | | |
| | | | | | |
Net investment income | | | — | | | | — | | | | (0.20 | ) | | | — | | | | (0.13 | ) | | | (0.30) | |
| | | | | | |
Net realized gains | | | (2.91 | ) | | | (1.73 | ) | | | (1.60 | ) | | | (0.27 | ) | | | (6.21 | ) | | | — | |
| | | | |
| | | | | | |
Total distributions | | | (2.91 | ) | | | (1.73 | ) | | | (1.80 | ) | | | (0.27 | ) | | | (6.34 | ) | | | (0.30) | |
| | | | |
| | | | | | |
Net asset value, end of period | | | $21.32 | | | | $19.19 | | | | $20.93 | | | | $17.85 | | | | $18.42 | | | | $23.26 | |
| | | | |
| | | | | | |
Total returnc | | | 26.60% | | | | (1.24)% | | | | 28.38% | | | | (1.49)% | | | | 5.89% | | | | 12.74% | |
| | | | | | |
| Ratios to average net assetsd | | | | | | | | | | | | | | | | | | | | | | | | |
| | | | | | |
Expenses | | | 0.84% | e | | | 0.85% | e | | | 0.87% | e | | | 0.80% | e | | | 0.78% | | | | 0.79% | |
| | | | | | |
Net investment income (loss) | | | (0.26)% | | | | (0.17)% | | | | (0.14)% | | | | (0.19)% | | | | (0.27)% | | | | 0.50% | |
| | | | | | |
Supplemental data | | | | | | | | | | | | | | | | | | | | | | | | |
| | | | | | |
| Net assets, end of period (000’s) | | | $1,305 | | | | $1,040 | | | | $1,092 | | | | $883 | | | | $47,864 | | | | $54,971 | |
| | | | | | |
Portfolio turnover rate | | | 8.62% | | | | 21.93% | | | | 24.96% | | | | 36.26%f | | | | 23.23% | | | | 93.53% | |
aThe amount shown for a share outstanding throughout the period may not correlate with the Statement of Operations for the period due to the timing of sales and repurchases of the Fund’s shares in relation to income earned and/or fluctuating fair value of the investments of the Fund.
bBased on average daily shares outstanding.
cTotal return does not include fees, charges or expenses imposed by the variable annuity and life insurance contracts for which Franklin Templeton Variable Insurance Products Trust serves as an underlying investment vehicle. Total return is not annualized for periods less than one year.
dRatios are annualized for periods less than one year.
eBenefit of expense reduction rounds to less than 0.01%.
fExcludes the value of portfolio securities delivered as a result of redemptionin-kind.
| | | | |
| | | |
FLG-6 | | Semiannual Report | The accompanying notes are an integral part of these financial statements. | | |
FRANKLIN TEMPLETON VARIABLE INSURANCE PRODUCTS TRUST
FINANCIAL HIGHLIGHTS
Franklin Large Cap Growth VIP Fund(continued)
| | | | | | | | | | | | | | | | | | | | | | | | |
| | |
| | | Six Months Ended June 30, 2019
(unaudited) | | | Year Ended December 31, | |
| | | 2018 | | | 2017 | | | 2016 | | | 2015 | | | 2014 | |
| |
| | | | | | |
| Class 2 | | | | | | | | | | | | | | | | | | | | | | | | |
| | | | | | |
Per share operating performance
(for a share outstanding throughout the period) | | | | | | | | | | | | | | | | | | | | | | | | |
| | | | | | |
Net asset value, beginning of period | | | $18.70 | | | | $20.48 | | | | $17.48 | | | | $18.09 | | | | $22.94 | | | | $20.62 | |
| | | | |
| | | | | | |
| Income from investment operationsa: | | | | | | | | | | | | | | | | | | | | | | | | |
| | | | | | |
Net investment income (loss)b | | | (0.05 | ) | | | (0.09 | ) | | | (0.08 | ) | | | (0.08 | ) | | | (0.11 | ) | | | 0.06 | |
| | | | | | |
Net realized and unrealized gains (losses) | | | 4.93 | | | | 0.04 | | | | 4.81 | | | | (0.26 | ) | | | 1.54 | | | | 2.50 | |
| | | | |
| | | | | | |
Total from investment operations | | | 4.88 | | | | (0.05 | ) | | | 4.73 | | | | (0.34 | ) | | | 1.43 | | | | 2.56 | |
| | | | |
| | | | | | |
Less distributions from: | | | | | | | | | | | | | | | | | | | | | | | | |
| | | | | | |
Net investment income | | | — | | | | — | | | | (0.13 | ) | | | — | | | | (0.07 | ) | | | (0.24) | |
| | | | | | |
Net realized gains | | | (2.91 | ) | | | (1.73 | ) | | | (1.60 | ) | | | (0.27 | ) | | | (6.21 | ) | | | — | |
| | | | |
| | | | | | |
Total distributions | | | (2.91 | ) | | | (1.73 | ) | | | (1.73 | ) | | | (0.27 | ) | | | (6.28 | ) | | | (0.24) | |
| | | | |
| | | | | | |
Net asset value, end of period | | | $20.67 | | | | $18.70 | | | | $20.48 | | | | $17.48 | | | | $18.09 | | | | $22.94 | |
| | | | |
| | | | | | |
Total returnc | | | 26.44% | | | | (1.47)% | | | | 28.11% | | | | (1.79)% | | | | 5.62% | | | | 12.46% | |
| | | | | | |
| Ratios to average net assetsd | | | | | | | | | | | | | | | | | | | | | | | | |
| | | | | | |
Expenses | | | 1.09% | e | | | 1.10% | e | | | 1.12% | e | | | 1.05% | e | | | 1.03% | | | | 1.04% | |
| | | | | | |
Net investment income (loss) | | | (0.51)% | | | | (0.42)% | | | | (0.39)% | | | | (0.44)% | | | | (0.52)% | | | | 0.25% | |
| | | | | | |
Supplemental data | | | | | | | | | | | | | | | | | | | | | | | | |
| | | | | | |
| Net assets, end of period (000’s) | | | $116,502 | | | | $100,435 | | | | $118,875 | | | | $113,028 | | | | $223,807 | | | | $256,098 | |
| | | | | | |
Portfolio turnover rate | | | 8.62% | | | | 21.93% | | | | 24.96% | | | | 36.26% | f | | | 23.23% | | | | 93.53% | |
aThe amount shown for a share outstanding throughout the period may not correlate with the Statement of Operations for the period due to the timing of sales and repurchases of the Fund’s shares in relation to income earned and/or fluctuating fair value of the investments of the Fund.
bBased on average daily shares outstanding.
cTotal return does not include fees, charges or expenses imposed by the variable annuity and life insurance contracts for which Franklin Templeton Variable Insurance Products Trust serves as an underlying investment vehicle. Total return is not annualized for periods less than one year.
dRatios are annualized for periods less than one year.
eBenefit of expense reduction rounds to less than 0.01%.
fExcludes the value of portfolio securities delivered as a result of redemptionin-kind.
| | | | | | |
| | | |
| | The accompanying notes are an integral part of these financial statements. | Semiannual Report | | | FLG-7 | |
FRANKLIN TEMPLETON VARIABLE INSURANCE PRODUCTS TRUST
Statement of Investments, June 30, 2019 (unaudited)
Franklin Large Cap Growth VIP Fund
| | | | | | | | |
| | | Shares | | | Value | |
| |
| | |
Common Stocks 99.9% | | | | | | | | |
Communication Services 7.6% | | | | | | | | |
aAlphabet Inc., A | | | 3,276 | | | $ | 3,547,253 | |
aAlphabet Inc., C | | | 399 | | | | 431,283 | |
aFacebook Inc., A | | | 6,063 | | | | 1,170,159 | |
aLiberty Broadband Corp., C | | | 11,649 | | | | 1,214,059 | |
aNetflix Inc. | | | 2,871 | | | | 1,054,575 | |
aPinterest Inc., A | | | 7,600 | | | | 206,872 | |
The Walt Disney Co. | | | 9,556 | | | | 1,334,400 | |
| | | | | | | | |
| | |
| | | | | | | 8,958,601 | |
| | | | | | | | |
Consumer Discretionary 10.2% | | | | | | | | |
aAlibaba Group Holding Ltd., ADR (China) | | | 3,369 | | | | 570,877 | |
aAmazon.com Inc. | | | 4,819 | | | | 9,125,403 | |
Aptiv PLC | | | 9,176 | | | | 741,696 | |
aLevi Strauss & Co., A | | | 24,521 | | | | 511,998 | |
aUnder Armour Inc., A | | | 43,865 | | | | 1,111,978 | |
| | | | | | | | |
| | |
| | | | | | | 12,061,952 | |
| | | | | | | | |
Consumer Staples 3.2% | | | | | | | | |
aBeyond Meat Inc. | | | 1,300 | | | | 208,884 | |
Constellation Brands Inc., A | | | 5,709 | | | | 1,124,331 | |
Lamb Weston Holdings Inc. | | | 18,080 | | | | 1,145,549 | |
aMonster Beverage Corp. | | | 10,706 | | | | 683,364 | |
aNomad Foods Ltd. (United Kingdom) | | | 28,351 | | | | 605,577 | |
| | | | | | | | |
| | |
| | | | | | | 3,767,705 | |
| | | | | | | | |
Energy 1.0% | | | | | | | | |
Diamondback Energy Inc. | | | 10,305 | | | | 1,122,936 | |
| | | | | | | | |
Financials 6.6% | | | | | | | | |
The Charles Schwab Corp. | | | 26,225 | | | | 1,053,983 | |
Intercontinental Exchange Inc. | | | 15,385 | | | | 1,322,187 | |
MarketAxess Holdings Inc. | | | 3,390 | | | | 1,089,614 | |
MSCI Inc. | | | 8,515 | | | | 2,033,297 | |
S&P Global Inc. | | | 7,237 | | | | 1,648,516 | |
aSVB Financial Group | | | 2,428 | | | | 545,304 | |
Tradeweb Markets Inc. | | | 2,800 | | | | 122,668 | |
| | | | | | | | |
| | |
| | | | | | | 7,815,569 | |
| | | | | | | | |
Health Care 14.8% | | | | | | | | |
aABIOMED Inc. | | | 2,221 | | | | 578,548 | |
aArray BioPharma Inc. | | | 8,886 | | | | 411,688 | |
aEdwards Lifesciences Corp. | | | 10,022 | | | | 1,851,464 | |
aElanco Animal Health Inc. | | | 15,960 | | | | 539,448 | |
aGuardant Health Inc. | | | 7,833 | | | | 676,223 | |
aGW Pharmaceuticals PLC, ADR (United Kingdom) | | | 6,769 | | | | 1,166,908 | |
aHeron Therapeutics Inc. | | | 39,434 | | | | 733,078 | |
aIDEXX Laboratories Inc. | | | 2,680 | | | | 737,885 | |
aIllumina Inc. | | | 3,524 | | | | 1,297,361 | |
aIntuitive Surgical Inc. | | | 2,120 | | | | 1,112,046 | |
FRANKLIN TEMPLETON VARIABLE INSURANCE PRODUCTS TRUST
STATEMENT OF INVESTMENTS (UNAUDITED)
Franklin Large Cap Growth VIP Fund(continued)
| | | | | | | | |
| | | Shares | | | Value | |
| |
| | |
Common Stocks(continued) | | | | | | | | |
Health Care(continued) | | | | | | | | |
aNevro Corp. | | | 14,984 | | | $ | 971,413 | |
aPTC Therapeutics Inc. | | | 7,689 | | | | 346,005 | |
aSage Therapeutics Inc. | | | 3,881 | | | | 710,572 | |
UnitedHealth Group Inc. | | | 10,656 | | | | 2,600,171 | |
aVeeva Systems Inc. | | | 12,554 | | | | 2,035,129 | |
West Pharmaceutical Services Inc. | | | 12,809 | | | | 1,603,046 | |
| | | | | | | | |
| | |
| | | | | | | 17,370,985 | |
| | | | | | | | |
Industrials 11.8% | | | | | | | | |
The Boeing Co. | | | 3,306 | | | | 1,203,417 | |
aCoStar Group Inc. | | | 5,703 | | | | 3,159,804 | |
Honeywell International Inc. | | | 7,344 | | | | 1,282,189 | |
aIHS Markit Ltd. | | | 20,484 | | | | 1,305,240 | |
Raytheon Co. | | | 9,825 | | | | 1,708,371 | |
Rockwell Automation Inc. | | | 4,906 | | | | 803,750 | |
Roper Technologies Inc. | | | 3,957 | | | | 1,449,291 | |
Stanley Black & Decker Inc. | | | 4,888 | | | | 706,854 | |
aUnivar Inc. | | | 27,801 | | | | 612,734 | |
Verisk Analytics Inc. | | | 11,395 | | | | 1,668,912 | |
| | | | | | | | |
| | |
| | | | | | | 13,900,562 | |
| | | | | | | | |
Information Technology 40.1% | | | | | | | | |
a2U Inc. | | | 11,422 | | | | 429,924 | |
aAdobe Inc. | | | 9,700 | | | | 2,858,105 | |
Analog Devices Inc. | | | 9,065 | | | | 1,023,167 | |
Apple Inc. | | | 14,770 | | | | 2,923,278 | |
aAutodesk Inc. | | | 7,461 | | | | 1,215,397 | |
aBlack Knight Inc. | | | 9,837 | | | | 591,696 | |
aCrowdstrike Holdings Inc., A | | | 3,000 | | | | 204,870 | |
aDocuSign Inc. | | | 5,366 | | | | 266,744 | |
aFiserv Inc. | | | 10,977 | | | | 1,000,663 | |
aGuidewire Software Inc. | | | 5,985 | | | | 606,759 | |
aInterXion Holding NV (Netherlands) | | | 17,512 | | | | 1,332,488 | |
Intuit Inc. | | | 1,186 | | | | 309,937 | |
Mastercard Inc., A | | | 27,358 | | | | 7,237,012 | |
Microsoft Corp. | | | 50,208 | | | | 6,725,864 | |
Monolithic Power Systems | | | 7,092 | | | | 962,952 | |
NVIDIA Corp. | | | 6,658 | | | | 1,093,443 | |
aPayPal Holdings Inc. | | | 14,442 | | | | 1,653,031 | |
aPTC Inc. | | | 5,972 | | | | 536,047 | |
asalesforce.com Inc. | | | 11,050 | | | | 1,676,617 | |
aServiceNow Inc. | | | 14,143 | | | | 3,883,244 | |
aSlack Technologies Inc. | | | 8,800 | | | | 330,000 | |
aTwilio Inc., A | | | 10,437 | | | | 1,423,085 | |
Visa Inc., A | | | 33,357 | | | | 5,789,107 | |
Xilinx Inc. | | | 13,985 | | | | 1,649,111 | |
aZendesk Inc. | | | 17,442 | | | | 1,552,861 | |
| | | | | | | | |
| | |
| | | | | | | 47,275,402 | |
| | | | | | | | |
FRANKLIN TEMPLETON VARIABLE INSURANCE PRODUCTS TRUST
STATEMENT OF INVESTMENTS (UNAUDITED)
Franklin Large Cap Growth VIP Fund(continued)
| | | | | | | | |
| | | Shares | | | Value | |
| |
| | |
Common Stocks(continued) | | | | | | | | |
Materials 0.7% | | | | | | | | |
aIngevity Corp. | | | 7,639 | | | $ | 803,394 | |
| | | | | | | | |
Real Estate 3.9% | | | | | | | | |
American Tower Corp. | | | 6,584 | | | | 1,346,099 | |
aSBA Communications Corp., A | | | 14,309 | | | | 3,217,235 | |
| | | | | | | | |
| | |
| | | | | | | 4,563,334 | |
| | | | | | | | |
| | |
Total Common Stocks (Cost $56,848,468) | | | | | | | 117,640,440 | |
| | | | | | | | |
| | |
| | | Principal
Amount | | | | |
| | | | | | | | |
Short Term Investments (Cost $234,182) 0.2% | | | | | | | | |
| | |
Repurchase Agreements 0.2% | | | | | | | | |
bJoint Repurchase Agreement, 2.451%, 7/01/19 (Maturity Value $234,230) | | | | | | | | |
BNP Paribas Securities Corp. (Maturity Value $174,164) | | | | | | | | |
Deutsche Bank Securities Inc. (Maturity Value $51,357) | | | | | | | | |
HSBC Securities (USA) Inc. (Maturity Value $8,709) | | | | | | | | |
Collateralized by U.S. Government Agency Securities, 4.00% - 4.50%, 7/15/40 - 3/20/49; U.S. Treasury Bonds, 8.00%, 11/15/21; U.S. Treasury Notes, 1.50% - 3.125%, 5/15/21 - 8/15/26; U.S. Treasury Notes, Index Linked, 0.875%, 1/15/29; and U.S. Treasury Strips, 8/15/22 - 6/15/35 (valued at $239,946) | | | $234,182 | | | | 234,182 | |
| | | | | | | | |
| | |
Total Investments (Cost $57,082,650) 100.1% | | | | | | | 117,874,622 | |
Other Assets, less Liabilities (0.1)% | | | | | | | (67,635 | ) |
| | | | | | | | |
| | |
Net Assets 100.0% | | | | | | $ | 117,806,987 | |
| | | | | | | | |
See Abbreviations on pageFLG-19.
aNon-income producing.
bSee Note 1(c) regarding joint repurchase agreement.
| | | | |
| | | |
FLG-10 | | Semiannual Report | The accompanying notes are an integral part of these financial statements. | | |
FRANKLIN TEMPLETON VARIABLE INSURANCE PRODUCTS TRUST
FINANCIAL STATEMENTS
Statement of Assets and Liabilities
June 30, 2019 (unaudited)
| | | | |
| |
| | | Franklin Large
Cap Growth VIP Fund | |
| |
Assets: | | | | |
Investments in securities: | | | | |
Cost - Unaffiliated issuers | | $ | 56,848,468 | |
Cost - Unaffiliated repurchase agreements | | | 234,182 | |
| | | | |
Value - Unaffiliated issuers | | $ | 117,640,440 | |
Value - Unaffiliated repurchase agreements | | | 234,182 | |
Cash | | | 182,687 | |
Receivables: | | | | |
Dividends | | | 8,894 | |
Other assets | | | 79 | |
| | | | |
| |
Total assets | | | 118,066,282 | |
| | | | |
Liabilities: | | | | |
Payables: | | | | |
Capital shares redeemed | | | 81,314 | |
Management fees | | | 70,554 | |
Distribution fees | | | 47,833 | |
Trustees’ fees and expenses | | | 92 | |
Reports to shareholders | | | 44,374 | |
Accrued expenses and other liabilities | | | 15,128 | |
| | | | |
| |
Total liabilities | | | 259,295 | |
| | | | |
| |
Net assets, at value | | $ | 117,806,987 | |
| | | | |
Net assets consist of: | | | | |
Paid-in capital | | $ | 51,609,876 | |
Total distributable earnings (loss) | | | 66,197,111 | |
| | | | |
| |
Net assets, at value | | $ | 117,806,987 | |
| | | | |
| Class 1: | | | | |
Net assets, at value | | $ | 1,305,354 | |
| | | | |
Shares outstanding | | | 61,219 | |
| | | | |
Net asset value and maximum offering price per share | | $ | 21.32 | |
| | | | |
| Class 2: | | | | |
Net assets, at value | | $ | 116,501,633 | |
| | | | |
Shares outstanding | | | 5,636,443 | |
| | | | |
Net asset value and maximum offering price per share | | | $20.67 | |
| | | | |
| | | | | | |
| | | |
| | The accompanying notes are an integral part of these financial statements. | Semiannual Report | | | FLG-11 | |
FRANKLIN TEMPLETON VARIABLE INSURANCE PRODUCTS TRUST
FINANCIAL STATEMENTS
Statement of Operations
for the six months ended June 30, 2019 (unaudited)
| | | | |
| |
| | | Franklin Large Cap Growth VIP Fund | |
| |
Investment income: | | | | |
Dividends: | | | | |
Unaffiliated issuers | | | $ 309,912 | |
Interest: | | | | |
Unaffiliated issuers | | | 18,270 | |
| | | | |
| |
Total investment income | | | 328,182 | |
| | | | |
Expenses: | | | | |
Management fees (Note 3a) | | | 426,492 | |
Distribution fees: (Note 3c) | | | | |
Class 2 | | | 140,927 | |
Custodian fees (Note 4) | | | 574 | |
Reports to shareholders | | | 22,844 | |
Professional fees | | | 20,371 | |
Trustees’ fees and expenses | | | 467 | |
Other | | | 6,391 | |
| | | | |
| |
Total expenses | | | 618,066 | |
Expense reductions (Note 4) | | | (96 | ) |
| | | | |
| |
Net expenses | | | 617,970 | |
| | | | |
| |
Net investment income (loss) | | | (289,788 | ) |
| | | | |
Realized and unrealized gains (losses): | | | | |
Net realized gain (loss) from: | | | | |
Investments: | | | | |
Unaffiliated issuers | | | 5,734,212 | |
| | | | |
Net change in unrealized appreciation (depreciation) on: | | | | |
Investments: | | | | |
Unaffiliated issuers | | | 21,059,253 | |
| | | | |
| |
Net realized and unrealized gain (loss) | | | 26,793,465 | |
| | | | |
| |
Net increase (decrease) in net assets resulting from operations | | | $26,503,677 | |
| | | | |
| | | | |
| | | |
FLG-12 | | Semiannual Report | The accompanying notes are an integral part of these financial statements. | | |
FRANKLIN TEMPLETON VARIABLE INSURANCE PRODUCTS TRUST
FINANCIAL STATEMENTS
Statements of Changes in Net Assets
| | | | | | | | |
| | | Franklin Large Cap Growth VIP Fund | |
| | |
| | | Six Months Ended
June 30, 2019
(unaudited) | | | Year Ended
December 31, 2018 | |
| |
| | |
Increase (decrease) in net assets: | | | | | | | | |
Operations: | | | | | | | | |
Net investment income (loss) | | $ | (289,788 | ) | | $ | (511,818 | ) |
Net realized gain (loss) | | | 5,734,212 | | | | 14,550,257 | |
Net change in unrealized appreciation (depreciation) | | | 21,059,253 | | | | (13,910,632 | ) |
| | | | |
| | |
Net increase (decrease) in net assets resulting from operations | | | 26,503,677 | | | | 127,807 | |
| | | | |
Distributions to shareholders: | | | | | | | | |
Class 1 | | | (156,170 | ) | | | (89,524 | ) |
Class 2 | | | (14,406,046 | ) | | | (9,610,684 | ) |
| | | | |
| | |
Total distributions to shareholders | | | (14,562,216 | ) | | | (9,700,208 | ) |
| | | | |
Capital share transactions: (Note 2) | | | | | | | | |
Class 1 | | | 145,684 | | | | 44,632 | |
Class 2 | | | 4,244,167 | | | | (8,964,036 | ) |
| | | | |
| | |
Total capital share transactions | | | 4,389,851 | | | | (8,919,404 | ) |
| | | | |
| | |
Net increase (decrease) in net assets | | | 16,331,312 | | | | (18,491,805 | ) |
Net assets: | | | | | | | | |
Beginning of period | | | 101,475,675 | | | | 119,967,480 | |
| | | | |
| | |
End of period | | $ | 117,806,987 | | | $ | 101,475,675 | |
| | | | |
| | | | | | |
| | | |
| | The accompanying notes are an integral part of these financial statements. | Semiannual Report | | | FLG-13 | |
FRANKLIN TEMPLETON VARIABLE INSURANCE PRODUCTS TRUST
Notes to Financial Statements (unaudited)
Franklin Large Cap Growth VIP Fund
1. Organization and Significant Accounting Policies
Franklin Templeton Variable Insurance Products Trust (Trust) is registered under the Investment Company Act of 1940 (1940 Act) as anopen-end management investment company, consisting of eighteen separate funds and applies the specialized accounting and reporting guidance in U.S. Generally Accepted Accounting Principles (U.S. GAAP). Franklin Large Cap Growth VIP Fund (Fund) is included in this report. Shares of the Fund are generally sold only to insurance company separate accounts to fund the benefits of variable life insurance policies or variable annuity contracts. At June 30, 2019, 69.9% of the Fund’s shares were held through one insurance company. Investment activities of these insurance company separate accounts could have a material impact on the Fund. The Fund offers two classes of shares: Class 1 and Class 2. Each class of shares may differ by its distribution fees, voting rights on matters affecting a single class and its exchange privilege.
The following summarizes the Fund’s significant accounting policies.
a. Financial Instrument Valuation
The Fund’s investments in financial instruments are carried at fair value daily. Fair value is the price that would be received to sell an asset or paid to transfer a liability in an orderly transaction between market participants on the measurement date. The Fund calculates the net asset value (NAV) per share each business day as of 4 p.m. Eastern time or the regularly scheduled close of the New York Stock Exchange (NYSE), whichever is earlier. Under compliance policies and procedures approved by the Trust’s Board of Trustees (the Board), the Fund’s administrator has responsibility for oversight of valuation, including leading the cross-functional Valuation Committee (VC). The Fund may utilize independent pricing services, quotations from securities and financial instrument dealers, and other market sources to determine fair value.
Equity securities listed on an exchange or on the NASDAQ National Market System are valued at the last quoted sale price or the official closing price of the day, respectively. Foreign equity securities are valued as of the close of trading on the foreign stock exchange on which the security is primarily traded, or as of 4 p.m. Eastern time. The value is then converted into its U.S. dollar equivalent at the foreign exchange rate in effect at 4 p.m. Eastern time on the day that the value of the security is determined.Over-the-counter
(OTC) securities are valued within the range of the most recent quoted bid and ask prices. Securities that trade in multiple markets or on multiple exchanges are valued according to the broadest and most representative market. Certain equity securities are valued based upon fundamental characteristics or relationships to similar securities.
Investments in repurchase agreements are valued at cost, which approximates fair value.
The Fund has procedures to determine the fair value of financial instruments for which market prices are not reliable or readily available. Under these procedures, the Fund primarily employs a market-based approach which may use related or comparable assets or liabilities, recent transactions, market multiples, book values, and other relevant information for the investment to determine the fair value of the investment. An income-based valuation approach may also be used in which the anticipated future cash flows of the investment are discounted to calculate fair value. Discounts may also be applied due to the nature or duration of any restrictions on the disposition of the investments. Due to the inherent uncertainty of valuations of such investments, the fair values may differ significantly from the values that would have been used had an active market existed.
Trading in securities on foreign securities stock exchanges and OTC markets may be completed before 4 p.m. Eastern time. In addition, trading in certain foreign markets may not take place on every Fund’s business day. Occasionally, events occur between the time at which trading in a foreign security is completed and 4 p.m. Eastern time that might call into question the reliability of the value of a portfolio security held by the Fund. As a result, differences may arise between the value of the Fund’s portfolio securities as determined at the foreign market close and the latest indications of value at 4 p.m. Eastern time. In order to minimize the potential for these differences, the VC monitors price movements following the close of trading in foreign stock markets through a series of country specific market proxies (such as baskets of American Depositary Receipts, futures contracts and exchange traded funds). These price movements are measured against established trigger thresholds for each specific market proxy to assist in determining if an event has occurred that may call into question the reliability of the values of the foreign securities held by the Fund. If such an event occurs, the securities may be valued using fair value procedures, which may include the use of independent pricing services.
FRANKLIN TEMPLETON VARIABLE INSURANCE PRODUCTS TRUST
NOTES TO FINANCIAL STATEMENTS (UNAUDITED)
Franklin Large Cap Growth VIP Fund(continued)
When the last day of the reporting period is anon-business day, certain foreign markets may be open on those days that the Fund’s NAV is not calculated, which could result in differences between the value of the Fund’s portfolio securities on the last business day and the last calendar day of the reporting period. Any significant security valuation changes due to an open foreign market are adjusted and reflected by the Fund for financial reporting purposes.
b. Foreign Currency Translation
Portfolio securities and other assets and liabilities denominated in foreign currencies are translated into U.S. dollars based on the exchange rate of such currencies against U.S. dollars on the date of valuation. The Fund may enter into foreign currency exchange contracts to facilitate transactions denominated in a foreign currency. Purchases and sales of securities, income and expense items denominated in foreign currencies are translated into U.S. dollars at the exchange rate in effect on the transaction date. Portfolio securities and assets and liabilities denominated in foreign currencies contain risks that those currencies will decline in value relative to the U.S. dollar. Occasionally, events may impact the availability or reliability of foreign exchange rates used to convert the U.S. dollar equivalent value. If such an event occurs, the foreign exchange rate will be valued at fair value using procedures established and approved by the Board.
The Fund does not separately report the effect of changes in foreign exchange rates from changes in market prices on securities held. Such changes are included in net realized and unrealized gain or loss from investments in the Statement of Operations.
Realized foreign exchange gains or losses arise from sales of foreign currencies, currency gains or losses realized between the trade and settlement dates on securities transactions and the difference between the recorded amounts of dividends, interest, and foreign withholding taxes and the U.S. dollar equivalent of the amounts actually received or paid. Net unrealized foreign exchange gains and losses arise from changes in foreign exchange rates on foreign denominated assets and liabilities other than investments in securities held at the end of the reporting period.
c. Joint Repurchase Agreement
The Fund enters into a joint repurchase agreement whereby its uninvested cash balance is deposited into a joint cash account with other funds managed by the investment manager or an affiliate of the investment manager and is used to invest in one or more repurchase agreements. The value and face amount of the joint repurchase agreement are allocated to the funds based on theirpro-rata interest. A repurchase agreement is accounted for as a loan by the Fund to the seller, collateralized by securities which are delivered to the Fund’s custodian. The fair value, including accrued interest, of the initial collateralization is required to be at least 102% of the dollar amount invested by the funds, with the value of the underlying securities marked to market daily to maintain coverage of at least 100%. Repurchase agreements are subject to the terms of Master Repurchase Agreements (MRAs) with approved counterparties (sellers). The MRAs contain various provisions, including but not limited to events of default and maintenance of collateral for repurchase agreements. In the event of default by either the seller or the Fund, certain MRAs may permit thenon-defaulting party to net andclose-out all transactions, if any, traded under such agreements. The Fund may sell securities it holds as collateral and apply the proceeds towards the repurchase price and any other amounts owed by the seller to the Fund in the event of default by the seller. This could involve costs or delays in addition to a loss on the securities if their value falls below the repurchase price owed by the seller. The joint repurchase agreement held by the Fund at period end, as indicated in the Statement of Investments, had been entered into on June 28, 2019.
d. Income and Deferred Taxes
It is the Fund’s policy to qualify as a regulated investment company under the Internal Revenue Code. The Fund intends to distribute to shareholders substantially all of its taxable income and net realized gains to relieve it from federal income and if applicable, excise taxes. As a result, no provision for U.S. federal income taxes is required.
The Fund may be subject to foreign taxation related to income received, capital gains on the sale of securities and certain foreign currency transactions in the foreign jurisdictions in which it invests. Foreign taxes, if any, are recorded based on the tax regulations and rates that exist in the foreign markets in which the Fund invests. When a capital
FRANKLIN TEMPLETON VARIABLE INSURANCE PRODUCTS TRUST
NOTES TO FINANCIAL STATEMENTS (UNAUDITED)
Franklin Large Cap Growth VIP Fund(continued)
1. Organization and Significant Accounting
Policies(continued)
d. Income and Deferred Taxes(continued)
gain tax is determined to apply, the Fund records an estimated deferred tax liability in an amount that would be payable if the securities were disposed of on the valuation date.
The Fund may recognize an income tax liability related to its uncertain tax positions under U.S. GAAP when the uncertain tax position has a less than 50% probability that it will be sustained upon examination by the tax authorities based on its technical merits. As of June 30, 2019, the Fund has determined that no tax liability is required in its financial statements related to uncertain tax positions for any open tax years (or expected to be taken in future tax years). Open tax years are those that remain subject to examination and are based on the statute of limitations in each jurisdiction in which the Fund invests.
e. Security Transactions, Investment Income, Expenses and Distributions
Security transactions are accounted for on trade date. Realized gains and losses on security transactions are determined on a specific identification basis. Interest income and estimated expenses are accrued daily. Dividend income is recorded on theex-dividend date except for certain dividends from securities where the dividend rate is not available. In such cases, the dividend is recorded as soon as the information is received by the Fund. Distributions to shareholders are recorded on theex-dividend date. Distributable earnings are determined according to income tax regulations (tax basis) and may differ from earnings recorded in accordance with U.S. GAAP. These differences may be permanent or temporary. Permanent differences are reclassified among capital accounts to reflect their tax character. These reclassifications have no impact on net assets or the results of operations. Temporary differences are not reclassified, as they may reverse in subsequent periods.
Common expenses incurred by the Trust are allocated among the Funds based on the ratio of net assets of each Fund to the combined net assets of the Trust or based on the ratio of number of shareholders of each Fund to the combined number of shareholders of the Trust. Fund specific expenses are charged directly to the Fund that incurred the expense.
Realized and unrealized gains and losses and net investment income, excluding class specific expenses, are allocated daily to each class of shares based upon the relative proportion of net assets of each class. Differences in per share distributions by class are generally due to differences in class specific expenses.
f. Accounting Estimates
The preparation of financial statements in accordance with U.S. GAAP requires management to make estimates and assumptions that affect the reported amounts of assets and liabilities at the date of the financial statements and the amounts of income and expenses during the reporting period. Actual results could differ from those estimates.
g. Guarantees and Indemnifications
Under the Trust’s organizational documents, its officers and trustees are indemnified by the Trust against certain liabilities arising out of the performance of their duties to the Trust. Additionally, in the normal course of business, the Trust, on behalf of the Fund, enters into contracts with service providers that contain general indemnification clauses. The Trust’s maximum exposure under these arrangements is unknown as this would involve future claims that may be made against the Trust that have not yet occurred. Currently, the Trust expects the risk of loss to be remote.
FRANKLIN TEMPLETON VARIABLE INSURANCE PRODUCTS TRUST
NOTES TO FINANCIAL STATEMENTS (UNAUDITED)
Franklin Large Cap Growth VIP Fund(continued)
2. Shares of Beneficial Interest
At June 30, 2019, there were an unlimited number of shares authorized (without par value). Transactions in the Fund’s shares were as follows:
| | | | | | | | | | | | | | | | | | | | |
| | | |
| | | Six Months Ended
June 30, 2019 | | | | | | Year Ended December 31, 2018 | |
| | | | |
| | | | | |
| | | Shares | | | Amount | | | | | | Shares | | | Amount |
| |
| | | | | |
| Class 1 Shares: | | | | | | | | | | | | | | | | | | | | |
Shares issued in reinvestment of distributions | | | 7,497 | | | $ | 156,170 | | | | | | | | 3,993 | | | $ | 89,524 | |
Shares redeemed | | | (480 | ) | | | (10,486 | ) | | | | | | | (1,981 | ) | | | (44,892) | |
| | | | |
| | | | | |
Net increase (decrease) | | | 7,017 | | | $ | 145,684 | | | | | | | | 2,012 | | | $ | 44,632 | |
| | | | |
| | | | | |
| Class 2 Shares: | | | | | | | | | | | | | | | | | | | | |
Shares sold | | | 164,664 | | | $ | 3,284,261 | | | | | | | | 542,097 | | | $ | 11,784,792 | |
Shares issued in reinvestment of distributions | | | 713,171 | | | | 14,406,046 | | | | | | | | 439,446 | | | | 9,610,684 | |
Shares redeemed | | | (612,981 | ) | | | (13,446,140 | ) | | | | | | | (1,413,745 | ) | | | (30,359,512) | |
| | | | |
| | | | | |
Net increase (decrease) | | | 264,854 | | | $ | 4,244,167 | | | | | | | | (432,202 | ) | | $ | (8,964,036) | |
| | | | |
3. Transactions with Affiliates
Franklin Resources, Inc. is the holding company for various subsidiaries that together are referred to as Franklin Templeton. Certain officers and trustees of the Fund are also officers and/or directors of the following subsidiaries:
| | |
| |
| Subsidiary | | Affiliation |
Franklin Advisers, Inc. (Advisers) | | Investment manager |
Franklin Templeton Services, LLC (FT Services) | | Administrative manager |
Franklin Templeton Distributors, Inc. (Distributors) | | Principal underwriter |
Franklin Templeton Investor Services, LLC (Investor Services) | | Transfer agent |
a. Management Fees
The Fund pays an investment management fee to Advisers based on the average daily net assets of the Fund as follows:
| | |
| |
| Annualized Fee Rate | | Net Assets |
0.750% | | Up to and including $500 million |
0.625% | | Over $500 million, up to and including $1 billion |
0.500% | | In excess of $1 billion |
b. Administrative Fees
Under an agreement with Advisers, FT Services provides administrative services to the Fund. The fee is paid by Advisers based on the Fund’s average daily net assets, and is not an additional expense of the Fund.
FRANKLIN TEMPLETON VARIABLE INSURANCE PRODUCTS TRUST
NOTES TO FINANCIAL STATEMENTS (UNAUDITED)
Franklin Large Cap Growth VIP Fund(continued)
3. Transactions with Affiliates(continued)
c. Distribution Fees
The Board has adopted a distribution plan for Class 2 shares pursuant to Rule12b-1 under the 1940 Act. Under the Fund’s compensation distribution plan, the Fund pays Distributors for costs incurred in connection with the servicing, sale and distribution of the Fund’s shares up to 0.35% per year of its average daily net assets. The Board has agreed to limit the current rate to 0.25% per year for Class 2. The plan year, for purposes of monitoring compliance with the maximum annual plan rate, is February 1 through January 31.
d. Transfer Agent Fees
Investor Services, under terms of an agreement, performs shareholder servicing for the Fund and is not paid by the Fund for the services.
4. Expense Offset Arrangement
The Fund has entered into an arrangement with its custodian whereby credits realized as a result of uninvested cash balances are used to reduce a portion of the Fund’s custodian expenses. During the period ended June 30, 2019, the custodian fees were reduced as noted in the Statement of Operations.
5. Income Taxes
At June 30, 2019, the cost of investments and net unrealized appreciation (depreciation) for income tax purposes were as follows:
| | | | |
Cost of investments | | $ | 57,121,474 | |
| | | | |
| |
Unrealized appreciation | | $ | 62,042,002 | |
Unrealized depreciation | | | (1,288,854) | |
| | | | |
| |
Net unrealized appreciation (depreciation) | | $ | 60,753,148 | |
| | | | |
Differences between income and/or capital gains as determined on a book basis and a tax basis are primarily due to differing treatment of wash sales.
6. Investment Transactions
Purchases and sales of investments (excluding short term securities) for the period ended June 30, 2019, aggregated $9,727,172 and $18,096,964, respectively.
7. Credit Facility
The Fund, together with other U.S. registered and foreign investment funds (collectively, Borrowers), managed by Franklin Templeton, are borrowers in a joint syndicated senior unsecured credit facility totaling $2 billion (Global Credit Facility) which matures on February 7, 2020. This Global Credit Facility provides a source of funds to the Borrowers for temporary and emergency purposes, including the ability to meet future unanticipated or unusually large redemption requests.
Under the terms of the Global Credit Facility, the Fund shall, in addition to interest charged on any borrowings made by the Fund and other costs incurred by the Fund, pay its share of fees and expenses incurred in connection with the implementation and maintenance of the Global Credit Facility, based upon its relative share of the aggregate net assets of all of the
FRANKLIN TEMPLETON VARIABLE INSURANCE PRODUCTS TRUST
NOTES TO FINANCIAL STATEMENTS (UNAUDITED)
Franklin Large Cap Growth VIP Fund(continued)
Borrowers, including an annual commitment fee of 0.15% based upon the unused portion of the Global Credit Facility. These fees are reflected in other expenses in the Statement of Operations. During the period ended June 30, 2019, the Fund did not use the Global Credit Facility.
8. Fair Value Measurements
The Fund follows a fair value hierarchy that distinguishes between market data obtained from independent sources
(observable inputs) and the Fund’s own market assumptions (unobservable inputs). These inputs are used in determining the value of the Fund’s financial instruments and are summarized in the following fair value hierarchy:
| | • | | Level 1 – quoted prices in active markets for identical financial instruments |
| | • | | Level 2 – other significant observable inputs (including quoted prices for similar financial instruments, interest rates, prepayment speed, credit risk, etc.) |
| | • | | Level 3 – significant unobservable inputs (including the Fund’s own assumptions in determining the fair value of financial instruments) |
The input levels are not necessarily an indication of the risk or liquidity associated with financial instruments at that level.
A summary of inputs used as of June 30, 2019, in valuing the Fund’s assets carried at fair value, is as follows:
| | | | | | | | | | | | | | | | | | | | | | | | | | | | |
| | | Level 1 | | | | | | Level 2 | | | | | | Level 3 | | | | | | Total | |
| | | | | | | |
| Assets: | | | | | | | | | | | | | | | | | | | | | | | | | | | | |
Investments in Securities:a | | | | | | | | | | | | | | | | | | | | | | | | | | | | |
Equity Investments | | $ | 117,640,440 | | | | | | | $ | — | | | | | | | $ | — | | | | | | | $ | 117,640,440 | |
Short Term Investments | | | — | | | | | | | | 234,182 | | | | | | | | — | | | | | | | | 234,182 | |
| | | | |
| | | | | | | |
Total Investments in Securities | | $ | 117,640,440 | | | | | | | $ | 234,182 | | | | | | | $ | — | | | | | | | $ | 117,874,622 | |
| | | | |
aFor detailed categories, see the accompanying Statement of Investments.
9. Subsequent Events
The Fund has evaluated subsequent events through the issuance of the financial statements and determined that no events have occurred that require disclosure.
Abbreviations
|
Selected Portfolio |
|
| ADR American Depositary Receipt |
This page intentionally left blank.
Franklin Mutual Global Discovery VIP Fund
This semiannual report for Franklin Mutual Global Discovery VIP Fund covers the period ended June 30, 2019.
Class 2 Performance Summary as of June 30, 2019
The Fund’s Class 2 Shares posted a +14.56% total return* for thesix-month period ended June 30, 2019.
*The Fund has a fee waiver associated with any investment it makes in a Franklin Templeton money fund and/or other Franklin Templeton fund, contractually guaranteed through 4/30/20. Fund investment results reflect the fee waiver; without this waiver, the results would have been lower.
Performance reflects the Fund’s Class 2 operating expenses, but doesnotinclude any contract fees, expenses or sales charges. If they had been included, performance would be lower. These charges and deductions, particularly for variable life policies, can have a significant effect on contract values and insurance benefits. See the contract prospectus for a complete description of these expenses, including sales charges.
Performance data represent past performance, which does not guarantee future results. Investment return and principal value will fluctuate, and you may have a gain or loss when you sell your shares. Current performance may differ from figures shown.
FRANKLIN MUTUAL GLOBAL DISCOVERY VIP FUND
Fund Goal and Main Investments
The Fund seeks capital appreciation. Under normal market conditions, the Fund invests primarily in U.S. and foreign equity securities that the investment manager believes are available at market prices less than their intrinsic value. The equity securities in which the Fund invests are primarily common stock. To a lesser extent, the Fund also invests in merger arbitrage securities and the debt and equity of distressed companies. The Fund may invest substantially and potentially up to 100% of its assets in foreign securities, which may include sovereign debt and participations in foreign government debt.
Fund Risks
All investments involve risks, including possible loss of principal. Value securities may not increase in price as anticipated, or may decline further in value. The Fund’s investments in foreign securities involve more risks than U.S. securities, including political and economic developments, trading practices, availability of information, limited markets, and currency exchange fluctuations and policies. Because the Fund may invest at least a significant portion of its assets in companies in a specific region, including Europe, the Fund is subject to greater risks of adverse developments in that region and/or the surrounding regions than a fund that is more broadly diversified geographically. Securities issued by smaller and midsize companies may be more volatile in price than those of larger companies, involve substantial risks and should be considered speculative. Derivatives involve costs and can create economic leverage in the Fund’s portfolio which may result in significant volatility and cause the Fund to participate in losses (as well as gains) in an amount that exceeds the Fund’s initial investment. The Fund’s investments in companies engaged in mergers, reorganizations or liquidations also involve special risks as pending deals may not be completed on time or on favorable terms, as well as lower-rated bonds, which entail higher credit risk. The Fund is actively managed but there is no guarantee that the manager’s investment decisions will produce the desired results. The Fund’s prospectus also includes a description of the main investment risks.
Geographic Composition*
Based on Total Net Assets as of 6/30/19
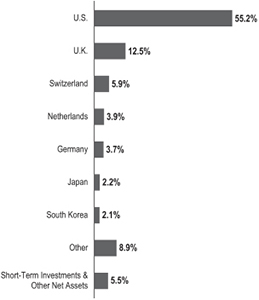
*Figures are stated as a percentage of total and may not equal 100% or may be negative due to rounding, use of any derivatives, unsettled trades or other factors.
Performance Overview
You can find the Fund’ssix-month total return in the Performance Summary. In comparison, the Fund’s benchmark, the MSCI World Index posted a +17.38% total return for the same period.1
Economic and Market Overview
The global economy expanded during the six months ended June 30, 2019, despite weakness in certain regions. Global developed and emerging market stocks were aided by upbeat economic data in some regions, encouraging corporate earnings reports and periods of optimism about a potential U.S.-China trade deal. Further supporting markets were the U.S. Federal Reserve’s (Fed’s) patient approach to its monetary policy in 2019 and recent indication it will act as appropriate to sustain U.S. economic expansion.
However, markets reflected concerns about political uncertainties in the U.S. and the European Union,
1. Source: Morningstar. One cannot invest directly in an index, and an index is not representative of the Fund’s portfolio. Please see Index Descriptions following the Fund Summaries.
The dollar value, number of shares or principal amount, and names of all portfolio holdings are listed in the Fund’s Statement of Investments (SOI).
FRANKLIN MUTUAL GLOBAL DISCOVERY VIP FUND
geopolitical risks in certain regions, and the impact of U.S. trade disputes with China and other trading partners on global growth and corporate earnings. In this environment, global developed and emerging market stocks, as measured by the MSCI All Country World Index, posted a +16.60% total return for thesix-month period.1
The U.S. economy grew during the six months ended June 30, 2019. After moderating for two consecutive quarters, the economy grew significantly faster in 2019’s first quarter, driven by growth in consumer spending, inventory investment, exports, business investment, and state and local government spending. However, the economy moderated again in the second quarter, due to weakness in inventory investment, exports, business investment and housing investment. The unemployment rate decreased from 3.9% in December 2018 to 3.7% atperiod-end.2 The annual inflation rate, as measured by the Consumer Price Index, decreased from 1.9% in December 2018 to 1.6% atperiod-end.2
The Fed held its target range for the federal funds rate unchanged, at 2.25%–2.50%, during the reporting period. In March, the Fed mentioned it would end its balance sheet normalization program by the end of September 2019. In June, the Fed indicated increased uncertainties around its views on economic activity and the labor market. With market-based inflation measures remaining low recently, the market has interpreted the Fed’s recent statements to mean it will likely cut rates in 2019’s second half to foster continued economic growth while attempting to achieve its inflation objective.
In Europe, the U.K.’s quarterly gross domestic product (GDP) growth accelerated in 2019’s first quarter. The Bank of England left its key policy rate unchanged during the period. The eurozone’s quarterly GDP accelerated in 2019’s first quarter. However, the bloc’s annual inflation rate decreased during the period. The European Central Bank (ECB) kept its benchmark interest rate unchanged during the period. In June, the ECB mentioned it would leave interest rates unchanged through the first half of 2020, provided details of its new stimulus, and indicated its openness to cut rates or increase stimulus.
In Asia, Japan’s quarterly GDP growth accelerated in 2019’s first quarter. In June, the Bank of Japan also left its benchmark interest rate unchanged, while continuing its stimulus measures, and expressed its openness to cut interest rates or increase stimulus.
In larger emerging markets, Brazil’s quarterly GDP growth contracted in 2019’s first quarter. The Central Bank of Brazil left its benchmark interest rate unchanged during the period. Russia’s annual GDP growth moderated in 2019’s first quarter. The Bank of Russia cut its key rate once during the period. China’s annual GDP growth rate stabilized in 2019’s first quarter. The People’s Bank of China left its benchmark interest rate unchanged, but it took measures to improve financial liquidity to mitigate the effects of the U.S.-China trade dispute and support economic growth. Overall, global emerging market stocks, as measured by the MSCI Emerging Markets Index, posted a +10.78% total return during thesix-month period.1
Investment Strategy
At Franklin Mutual Advisors, we are committed to our distinctive value approach to investing. Our major investment strategy is investing in undervalued stocks. When selecting undervalued equities, we are attracted to what we believe are fundamentally strong companies with healthy balance sheets, high-quality assets, substantial free cash flow and shareholder-oriented management teams and whose stocks are trading at discounts to our assessment of the companies’ intrinsic or business value. We also look for asset-rich companies whose shares may be trading at depressed levels due to concerns over short-term earnings disappointments, litigation, management strategy or other perceived negatives. While the vast majority of our undervalued equity investments are made in publicly traded companies globally, we may invest occasionally in privately held companies as well.
We complement this more traditional investment strategy with two others. One is distressed investing, which is complex and can take many forms. The most common distressed investment the Fund undertakes is the purchase of financially troubled or bankrupt companies’ debt at a substantial discount to face value. After the financially distressed company is reorganized, often in bankruptcy court, the old debt is typically replaced with new securities issued by the financially stronger company.
The other piece of our investment strategy is participating in arbitrage situations, another highly specialized field. When companies announce proposed mergers or takeovers, commonly referred to as “deals,” the target company may trade at a discount to the bid it ultimately accepts. One form of arbitrage involves purchasing the target company’s stock when it is trading below the value we believe it would receive
2. Source: U.S. Bureau of Labor Statistics.
FRANKLIN MUTUAL GLOBAL DISCOVERY VIP FUND
in a deal. In keeping with our commitment to a relatively conservative investment approach, we typically focus our arbitrage efforts on announced deals, and eschew rumored deals or other situations we consider relatively risky.
In addition, it is our practice to hedge the Fund’s currency exposure when we deem it advantageous for our shareholders.
|
What is meant by “hedge”? To hedge an investment is to take a position intended to offset potential losses/gains that may be incurred by a companion financial instrument. |
Manager’s Discussion
Franklin Mutual Series has long analyzed companies in many ways beyond just looking at the numbers. We analyze the way a company is run and how decisions are made at the executive and board levels. We look at the sustainability of a company, including the relationships with employees and customers, as well as the environmental impacts of a company’s business. In many ways this is common sense. A company that takes advantage of customers and unsustainably produces environmental waste is worth less than one that does not do these things. Similarly, a company that iswell-run and responsive to shareholders is worth more than one whose executives manage the company for their private benefit. However, disclosure has been limited on many relevant issues, and there are disagreements about which things should be measured and how they should be measured.
This type of analysis is labeled ESG analysis, where ESG stands for environmental, social, and governance factors. Many firms, including Franklin Templeton, are incorporating ESG factors in their investment research. In addition, there are other bodies such as the Sustainable Accounting Standards Board that are working on standardizing metrics for companies and industries to improve their reporting on these factors, particularly in the environmental and social areas. As a result, ESG analysis is improving across the market, and Franklin Mutual Series analysts are better able to analyzenon-traditional factors, including greenhouse gas emissions, water consumption, energy usage, talent management, diversity and inclusion, executive compensation, and enterprise risk management, to name a few. ESG investing should not be confused with social or exclusionary types of investing, but should rather be viewed as an additional tool analysts and portfolio managers use in the investment process to identify and measurenon-traditional, potential business risks and opportunities at a company.
| | | | |
| Top 10 Sectors/Industries | | | | |
| 6/30/19 | | | | |
| |
| | | % of Total
Net Assets | |
| |
| Oil, Gas & Consumable Fuels | | | 11.9% | |
| |
| Banks | | | 11.5% | |
| |
| Insurance | | | 9.2% | |
| |
| Pharmaceuticals | | | 7.8% | |
| |
| Media | | | 5.0% | |
| |
| Technology Hardware, Storage & Peripherals | | | 4.2% | |
| |
| Software | | | 4.2% | |
| |
| Entertainment | | | 3.4% | |
| |
| Automobiles | | | 3.3% | |
| |
| Health Care Equipment & Supplies | | | 3.2% | |
Today, Franklin Mutual Series analysts review and analyze ESG reports produced by third parties or the companies themselves to assess potential risks that could have an impact on shareholder value. In addition, we have discussions with management teams around ESG risks, how they deal with them and the potential impact on stakeholders. Our discussions have included issues such as water consumption in mining, the impact of changing carbon dioxide emission standards on the automotive industry and discussions with boards and management teams around management pay. Although more work needs to be done to standardize data from companies within industries so that comparisons can be relevant, the identification and discussion of ESG risk factors is an input we consider in helping frame the potential negative events individual companies or industries may face. In our view, solid ESG ratings are an output of fundamentally good business practices, not an input. As the data and information regarding ESG risk factors continue to evolve, we believe the increased information will highlight additional risk factors to enterprises and help us make more informed investment decisions going forward.
Mergers and Acquisitions
Merger and acquisition (M&A) activity remained healthy in the first half of 2019. The health care sector led the way, with pharmaceuticals megamergers among the biggest transactions. The pending acquisitions of Celgene and Allergan (not a Fund holding), each worth almost $90 billion, exemplify this strength. Large deals have also been announced in the defense, oil and gas exploration and production, and diversified financial services industries, underlying the broad strength of the M&A boom. In addition, U.S. and foreign regulators appear to be more amenable to deals, leading markets to expect fewer regulatory surprises.
FRANKLIN MUTUAL GLOBAL DISCOVERY VIP FUND
We are closely monitoring the U.S.-China trade conflict, becauseflare-ups could potentially impact pending and future deals. We expect M&A activity to remain strong for as long as the equity markets remain strong, as has been the historical pattern.
Credit Markets
Opportunities to invest in mispriced risk across global fixed income markets remained limited in the first half of 2019. The low interest-rate environment kept credit widely available, and default rates are still at historically low levels. Debt covenant terms, which include restrictions on the borrower’s financial activities, remain loose or nonexistent. In such an environment, we believe it is prudent to focus our efforts on investing in short-term mispriced risk and catalyst-driven credit opportunities.
On the restructuring side, Cumulus Media and iHeartMedia, two long-term distressed credit positions, emerged from bankruptcy or had reached a confirmable restructuring agreement in 2018, reducing further the purely distressed portion of the credit holdings within the Funds. PG&E, which recently filed for bankruptcy, became a new distressed credit position. We are hopeful more opportunities may emerge as the business and economic cycles elongate amid persistent uncertainties. We will continue to seek to invest across the capital structures of companies that avail themselves of opportunities to bolster liquidity through internally generated free cash flow and corporate actions, including asset sales and debt refinancing.
Fund Performance
Turning to Fund performance, top positive contributors included Walt Disney, Novartis and Kinder Morgan.
The stock of U.S.-based diversified international family entertainment and media enterprise Walt Disney surged following an investor event outlining the strategy and expectations for its new streaming service. The breadth and depth of content, the price point, and the technology and user interface supporting it have increased optimism about the service. Market expectations for the service’s growth and profitability rose significantly on the back of this event.
In March, Switzerland-based drug maker Novartis announced the official process and dates for itstax-free spinoff of the eye care device and consumer products business of Alcon (not a Fund holding), and the U.S. Food and Drug Administration approved Mayzent, the first oral drug to treat secondary progressive multiple sclerosis. In May, Novartis won U.S. regulatory approval for gene therapy that treats spinal muscular atrophy and announced the
| | | | |
| Top 10 Holdings | | | |
| 6/30/19 | | | |
| |
Company
Sector/Industry, Country | | % of Total
Net Assets | |
| |
The Walt Disney Co. Entertainment, U.S. | | | 3.4% | |
| |
Medtronic PLC Health Care Equipment & Supplies, U.S. | | | 3.2% | |
| |
Novartis AG Pharmaceuticals, Switzerland | | | 3.2% | |
| |
Royal Dutch Shell PLC Oil, Gas & Consumable Fuels, U.K. | | | 2.4% | |
| |
Charter Communications Inc. Media, U.S. | | | 2.4% | |
| |
GlaxoSmithKline PLC Pharmaceuticals, U.K. | | | 2.4% | |
| |
Citizens Financial Group Inc. Banks, U.S. | | | 2.1% | |
| |
Samsung Electronics Co. Ltd. Technology Hardware, Storage & Peripherals, South Korea | | | 2.1% | |
| |
Citigroup Inc. Banks, U.S. | | | 2.1% | |
| |
Kinder Morgan Inc. Oil, Gas & Consumable Fuels, U.S. | | | 2.1% | |
purchase of a dry eye drug from a Japanese drug company. We believe Novartis is continuing to position itself as a more focused and innovation-driven drug company, and that the market does not fully appreciate the many innovative products it has in development.
Shares of U.S.-based energy company Kinder Morgan rose in early 2019, as the energy sector rebounded from weak performance in the fourth quarter of 2018. In addition, U.S. pipeline companies have benefited from increased volumes of U.S. crude oil, natural gas and natural gas liquids, along with limited pipeline supply. We believe conditions are likely to remain favorable for the energy sector if commodity prices hold up, most notably if crude oil prices remain above US$50 per barrel.
During the period under review, Fund investments that detracted from performance included Walgreens Boots Alliance, CVS Health and Imperial Brands.
Shares of U.S.-based Walgreens Boots Alliance did not keep up with the market rebound in January and February. In March, the stock price fell when the chief financial officer cited negative industry trends in drug prices and pharmacy benefit manager (PBM) reimbursement rates, as well as the company’s limited success offsetting those challenges by
FRANKLIN MUTUAL GLOBAL DISCOVERY VIP FUND
increasing its volume of drug sales or renegotiating with PBMs. These pressures and weakness in both its U.S. and U.K. stores resulted in a cut to full-year guidance in April. However, Walgreens is reducing costs throughout the enterprise, and within the front end of the store, it is attempting to reduce exposure to lower margin categories, which we believe can help boost growth and profitability over the longer term.
In January, the chief executive officer of U.S.-based CVS Health, an integrated pharmacy health care provider, highlighted probable headwinds for 2019, and in February the company detailed the financial drag from those headwinds. Possible negative factors included: higher costs from increased investments in its workforce, which could have a year-over-year drag on earnings through the first half of 2019; greater price competition in nursing care; and lower-than-expected branded drug price increases.
Shares of U.K. tobacco company Imperial Brands traded lower after the company reported below-expected first-half fiscal 2019 revenues amid concerns about stricter U.S. regulation and waning tobacco product distribution at large U.S. drugstores. The U.S. has considered banning menthol cigarettes and enacting stricter regulation ofe-cigarettes and vaping products, particularly flavors more prone to attract underaged consumers. Tobacco companies were pressured by recent Nielsen industry data suggesting deteriorating U.S. industry volumes. The industry urged investors to use more reliable data sources, as Nielsen does not measure a number of tobacco distribution channels.
During the period, the Fund held currency forwards and futures seeking to hedge most of the currency risk of the portfolio’snon-U.S. dollar investments. The hedges had a positive overall impact on the Fund’s performance because of the appreciation of the U.S. dollar versus the hedged currencies.
| | |
What is a currency forward? | | |
| |
A currency forward is a direct agreement between the Fund and a counterparty to buy or sell a foreign currency in exchange for another currency at a specific exchange rate on a future date. | | |
| | |
What is a future? | | |
| |
A future is an agreement between the Fund and a counterparty made through a U.S. or foreign futures exchange to buy or sell an underlying instrument or asset at a specific price on a future date. | | |
Thank you for your participation in Franklin Mutual Global Discovery VIP Fund. We look forward to serving your future investment needs.
The foregoing information reflects our analysis, opinions and portfolio holdings as of June 30, 2019, the end of the reporting period. The way we implement our main investment strategies and the resulting portfolio holdings may change depending on factors such as market and economic conditions. These opinions may not be relied upon as investment advice or an offer for a particular security. The information is not a complete analysis of every aspect of any market, country, industry, security or the Fund. Statements of fact are from sources considered reliable, but the investment manager makes no representation or warranty as to their completeness or accuracy. Although historical performance is no guarantee of future results, these insights may help you understand our investment management philosophy.
FRANKLIN MUTUAL GLOBAL DISCOVERY VIP FUND
Class 2 Fund Expenses
As an investor in a variable insurance contract (Contract) that indirectly provides for investment in an underlying mutual fund, you can incur transaction and/or ongoing expenses at both the Fund level and the Contract Level: (1) transaction expenses can include sales charges (loads) on purchases, surrender fees, transfer fees and premium taxes; and (2) ongoing expenses can include management fees, distribution and service(12b-1) fees, contract fees, annual maintenance fees, mortality and expense risk fees and other fees and expenses. All mutual funds and Contracts have some types of ongoing expenses. The table below shows Fund-level ongoing expenses and can help you understand these costs and compare them with those of other mutual funds offered through the Contract. The table assumes a $1,000 investment held for the six months indicated. Please refer to the Fund prospectus for additional information on operating expenses.
Actual Fund Expenses
The table below provides information about the actual account values and actual expenses in the columns under the heading “Actual.” In these columns the Fund’s actual return, which includes the effect of ongoing Fund expenses but does not include the effect of ongoing Contract expenses, is used to calculate the “Ending Account Value.” You can estimate the Fund-level expenses you paid during the period by following these steps (of course, your account value and expenses will differ from those in this illustration): Divide your account value by $1,000 (if your account had an $8,600 value, then $8,600÷ $1,000 =8.6). Then multiply the result by the number under the headings “Actual” and “Fund-Level Expenses Paid During Period” (if Fund-Level Expenses Paid During Period were $ 7.50, then 8.6 x $ 7.50 = $64.50). In this illustration, the estimated expenses paid this period at the Fund level are $64.50.
Hypothetical Example for Comparison with Other Mutual Funds
Under the heading “Hypothetical” in the table, information is provided about hypothetical account values and hypothetical expenses based on the Fund’s actual expense ratio and an assumed rate of return of 5% per year before expenses, which is not the Fund’s actual return. This information may not be used to estimate the actual ending account balance or expenses you paid for the period, but it can help you compare ongoing costs of investing in the Fund with those of other mutual funds offered through the Contract. To do so, compare this 5% hypothetical example with the 5% hypothetical examples that appear in the shareholder reports of other funds offered through the Contract.
Please note that expenses shown in the table are meant to highlight ongoing costs at the Fund level only and do not reflect any ongoing expenses at the Contract level, or transaction expenses at either the Fund or Contract levels. In addition, while the Fund does not have transaction expenses, if the transaction and ongoing expenses at the Contract level were included, the expenses shown below would be higher. You should consult your Contract prospectus or disclosure document for more information.
| | | | | | | | | | | | | | | | | | |
| | | | | | | Actual
(actual return after expenses) | | | | Hypothetical
(5% annual return before expenses) | | | | |
Share Class | | Beginning
Account
Value 1/1/19 | | | | Ending
Account
Value 6/30/19 | | Fund-Level
Expenses
Paid During
Period
1/1/19–6/30/191, 2 | | | | Ending
Account
Value 6/30/19 | | Fund-Level
Expenses
Paid During
Period
1/1/19–6/30/191, 2 | | | | Net
Annualized
Expense
Ratio2 |
| | | | | | | | | | | | |
Class 2 | | $1,000 | | | | $1,145.60 | | $6.28 | | | | $1,018.94 | | $5.91 | | | | 1.18% |
1. Expenses are equal to the annualized expense ratio for thesix-month period as indicated above—in the far right column—multiplied by the simple average account value over the period indicated, and then multiplied by 181/365 to reflect theone-half year period.
2. Reflects expenses after fee waivers and expense reimbursements. Does not include any ongoing expenses of the Contract for which the Fund is an investment option or acquired fund fees and expenses.
FRANKLIN TEMPLETON VARIABLE INSURANCE PRODUCTS TRUST
Financial Highlights
Franklin Mutual Global Discovery VIP Fund
| | | | | | | | | | | | | | | | | | | | | | | | |
| | |
| | | Six Months Ended
June 30, 2019 (unaudited) | | | Year Ended December 31, | |
| | | 2018 | | | 2017 | | | 2016 | | | 2015 | | | 2014 | |
| |
| | | | | | |
| Class 1 | | | | | | | | | | | | | | | | | | | | | | | | |
| | | | | | |
Per share operating performance
(for a share outstanding throughout the period) | | | | | | | | | | | | | | | | | | | | | | | | |
| | | | | | |
Net asset value, beginning of period | | | $17.47 | | | | $20.38 | | | | $20.22 | | | | $19.85 | | | | $22.61 | | | | $23.31 | |
| | | | |
| | | | | | |
| Income from investment operationsa: | | | | | | | | | | | | | | | | | | | | | | | | |
| | | | | | |
Net investment incomeb | | | 0.27 | | | | 0.36 | | | | 0.47 | | | | 0.41 | | | | 0.37 | | | | 0.68c | |
| | | | | | |
Net realized and unrealized gains (losses) | | | 2.30 | | | | (2.50 | ) | | | 1.29 | | | | 1.92 | | | | (1.17 | ) | | | 0.76 | |
| | | | |
| | | | | | |
Total from investment operations | | | 2.57 | | | | (2.14 | ) | | | 1.76 | | | | 2.33 | | | | (0.80 | ) | | | 1.44 | |
| | | | |
| | | | | | |
Less distributions from: | | | | | | | | | | | | | | | | | | | | | | | | |
| | | | | | |
Net investment income | | | — | | | | (0.52 | ) | | | (0.42 | ) | | | (0.39 | ) | | | (0.69 | ) | | | (0.57) | |
| | | | | | |
Net realized gains | | | — | | | | (0.25 | ) | | | (1.18 | ) | | | (1.57 | ) | | | (1.27 | ) | | | (1.57) | |
| | | | |
| | | | | | |
Total distributions | | | — | | | | (0.77 | ) | | | (1.60 | ) | | | (1.96 | ) | | | (1.96 | ) | | | (2.14) | |
| | | | |
| | | | | | |
Net asset value, end of period | | | $20.04 | | | | $17.47 | | | | $20.38 | | | | $20.22 | | | | $19.85 | | | | $22.61 | |
| | | | |
| | | | | | |
Total returnd | | | 14.71% | | | | (11.01)% | | | | 8.99% | | | | 12.32% | | | | (3.39)% | | | | 5.98% | |
| | | | | | |
| Ratios to average net assetse | | | | | | | | | | | | | | | | | | | | | | | | |
| | | | | | |
Expensesf,g | | | 0.93% | h | | | 0.96% | h | | | 1.01% | h | | | 1.01% | h | | | 1.02% | h | | | 1.00% | |
| | | | | | |
Expenses incurred in connection with securities sold short | | | 0.01% | | | | 0.01% | | | | —% | | | | 0.01% | | | | 0.02% | | | | 0.03% | |
| | | | | | |
Net investment income | | | 2.76% | | | | 1.81% | | | | 2.29% | | | | 2.10% | | | | 1.71% | | | | 2.85% | c |
| | | | | | |
| Supplemental data | | | | | | | | | | | | | | | | | | | | | | | | |
| | | | | | |
Net assets, end of period (000’s) | | | $3,729 | | | | $3,282 | | | | $3,189 | | | | $3,084 | | | | $2,632 | | | | $2,313 | |
| | | | | | |
Portfolio turnover rate | | | 10.94% | | | | 29.84% | | | | 17.49% | | | | 17.54% | | | | 21.88% | | | | 22.18% | |
aThe amount shown for a share outstanding throughout the period may not correlate with the Statement of Operations for the period due to the timing of sales and repurchases of the Fund’s shares in relation to income earned and/or fluctuating fair value of the investments of the Fund.
bBased on average daily shares outstanding.
cNet investment income per share includes approximately $0.34 per share related to income received in the form of special dividends in connection with certain Fund holdings. Excluding this amount, the ratio of net investment income to average net assets would have been 1.40%.
dTotal return does not include fees, charges or expenses imposed by the variable annuity and life insurance contracts for which Franklin Templeton Variable Insurance Products Trust serves as an underlying investment vehicle. Total return is not annualized for periods less than one year.
eRatios are annualized for periods less than one year.
fIncludes dividend and/or interest expense on securities sold short and security borrowing fees, if any. See below for the ratios of such expenses to average net assets for the periods presented. See Note 1(d).
gBenefit of expense reduction rounds to less than 0.01%.
hBenefit of waiver and payments by affiliates rounds to less than 0.01%.
| | | | |
| | | |
MGD-8 | | Semiannual Report | The accompanying notes are an integral part of these financial statements. | | |
FRANKLIN TEMPLETON VARIABLE INSURANCE PRODUCTS TRUST
FINANCIAL HIGHLIGHTS
Franklin Mutual Global Discovery VIP Fund(continued)
| | | | | | | | | | | | | | | | | | | | | | | | |
| | |
| | | Six Months Ended
June 30, 2019 (unaudited) | | | Year Ended December 31, | |
| | | 2018 | | | 2017 | | | 2016 | | | 2015 | | | 2014 | |
| |
| | | | | | |
| Class 2 | | | | | | | | | | | | | | | | | | | | | | | | |
| | | | | | |
Per share operating performance (for a share outstanding throughout the period) | | | | | | | | | | | | | | | | | | | | | | | | |
| | | | | | |
Net asset value, beginning of period | | | $16.96 | | | | $19.80 | | | | $19.69 | | | | $19.37 | | | | $22.11 | | | | $22.84 | |
| | | | |
| | | | | | |
| Income from investment operationsa: | | | | | | | | | | | | | | | | | | | | | | | | |
| | | | | | |
Net investment incomeb | | | 0.23 | | | | 0.30 | | | | 0.41 | | | | 0.35 | | | | 0.32 | | | | 0.60c | |
| | | | | | |
Net realized and unrealized gains (losses) | | | 2.24 | | | | (2.42 | ) | | | 1.25 | | | | 1.87 | | | | (1.16 | ) | | | 0.75 | |
| | | | |
| | | | | | |
Total from investment operations | | | 2.47 | | | | (2.12 | ) | | | 1.66 | | | | 2.22 | | | | (0.84 | ) | | | 1.35 | |
| | | | |
| | | | | | |
Less distributions from: | | | | | | | | | | | | | | | | | | | | | | | | |
| | | | | | |
Net investment income | | | — | | | | (0.47 | ) | | | (0.37 | ) | | | (0.33 | ) | | | (0.63 | ) | | | (0.51) | |
| | | | | | |
Net realized gains | | | — | | | | (0.25 | ) | | | (1.18 | ) | | | (1.57 | ) | | | (1.27 | ) | | | (1.57) | |
| | | | |
| | | | | | |
Total distributions | | | — | | | | (0.72 | ) | | | (1.55 | ) | | | (1.90 | ) | | | (1.90 | ) | | | (2.08) | |
| | | | |
| | | | | | |
Net asset value, end of period | | | $19.43 | | | | $16.96 | | | | $19.80 | | | | $19.69 | | | | $19.37 | | | | $22.11 | |
| | | | |
| | | | | | |
Total returnd | | | 14.56% | | | | (11.22)% | | | | 8.71% | | | | 12.06% | | | | (3.65)% | | | | 5.71% | |
| | | | | | |
| Ratios to average net assetse | | | | | | | | | | | | | | | | | | | | | | | | |
| | | | | | |
Expensesf,g | | | 1.18% | h | | | 1.21% | h | | | 1.26% | h | | | 1.26% | h | | | 1.27% | h | | | 1.25% | |
| | | | | | |
Expenses incurred in connection with securities sold short | | | 0.01% | | | | 0.01% | | | | —% | | | | 0.01% | | | | 0.02% | | | | 0.03% | |
| | | | | | |
Net investment income | | | 2.51% | | | | 1.56% | | | | 2.04% | | | | 1.85% | | | | 1.46% | | | | 2.60% | c |
| | | | | | |
| Supplemental data | | | | | | | | | | | | | | | | | | | | | | | | |
| | | | | | |
Net assets, end of period (000’s) | | | $535,270 | | | | $500,607 | | | | $631,179 | | | | $630,397 | | | | $629,366 | | | | $685,711 | |
| | | | | | |
Portfolio turnover rate | | | 10.94% | | | | 29.84% | | | | 17.49% | | | | 17.54% | | | | 21.88% | | | | 22.18% | |
aThe amount shown for a share outstanding throughout the period may not correlate with the Statement of Operations for the period due to the timing of sales and repurchases of the Fund’s shares in relation to income earned and/or fluctuating fair value of the investments of the Fund.
bBased on average daily shares outstanding.
cNet investment income per share includes approximately $0.34 per share related to income received in the form of special dividends in connection with certain Fund holdings. Excluding this amount, the ratio of net investment income to average net assets would have been 1.15%.
dTotal return does not include fees, charges or expenses imposed by the variable annuity and life insurance contracts for which Franklin Templeton Variable Insurance Products Trust serves as an underlying investment vehicle. Total return is not annualized for periods less than one year.
eRatios are annualized for periods less than one year.
fIncludes dividend and/or interest expense on securities sold short and security borrowing fees, if any. See below for the ratios of such expenses to average net assets for the periods presented. See Note 1(d).
gBenefit of expense reduction rounds to less than 0.01%.
hBenefit of waiver and payments by affiliates rounds to less than 0.01%.
| | | | | | |
| | | |
| | The accompanying notes are an integral part of these financial statements. | Semiannual Report | | | MGD-9 | |
FRANKLIN TEMPLETON VARIABLE INSURANCE PRODUCTS TRUST
FINANCIAL HIGHLIGHTS
Franklin Mutual Global Discovery VIP Fund(continued)
| | | | | | | | | | | | | | | | | | | | | | | | |
| | |
| | | Six Months Ended
June 30, 2019 (unaudited) | | | Year Ended December 31, | |
| | | 2018 | | | 2017 | | | 2016 | | | 2015 | | | 2014 | |
| |
| | | | | | |
| Class 4 | | | | | | | | | | | | | | | | | | | | | | | | |
| | | | | | |
Per share operating performance (for a share outstanding throughout the period) | | | | | | | | | | | | | | | | | | | | | | | | |
| | | | | | |
Net asset value, beginning of period | | | $17.30 | | | | $20.17 | | | | $20.02 | | | | $19.66 | | | | $22.39 | | | | $23.10 | |
| | | | |
| | | | | | |
| Income from investment operationsa: | | | | | | | | | | | | | | | | | | | | | | | | |
| | | | | | |
Net investment incomeb | | | 0.23 | | | | 0.29 | | | | 0.40 | | | | 0.34 | | | | 0.30 | | | | 0.61c | |
| | | | | | |
Net realized and unrealized gains (losses) | | | 2.28 | | | | (2.47 | ) | | | 1.27 | | | | 1.89 | | | | (1.17 | ) | | | 0.73 | |
| | | | |
| | | | | | |
Total from investment operations | | | 2.51 | | | | (2.18 | ) | | | 1.67 | | | | 2.23 | | | | (0.87 | ) | | | 1.34 | |
| | | | |
| | | | | | |
Less distributions from: | | | | | | | | | | | | | | | | | | | | | | | | |
| | | | | | |
Net investment income | | | — | | | | (0.44 | ) | | | (0.34 | ) | | | (0.30 | ) | | | (0.59 | ) | | | (0.48) | |
| | | | | | |
Net realized gains | | | — | | | | (0.25 | ) | | | (1.18 | ) | | | (1.57 | ) | | | (1.27 | ) | | | (1.57) | |
| | | | |
| | | | | | |
Total distributions | | | — | | | | (0.69 | ) | | | (1.52 | ) | | | (1.87 | ) | | | (1.86 | ) | | | (2.05) | |
| | | | |
| | | | | | |
Net asset value, end of period | | | $19.81 | | | | $17.30 | | | | $20.17 | | | | $20.02 | | | | $19.66 | | | | $22.39 | |
| | | | |
| | | | | | |
Total returnd | | | 14.51% | | | | (11.31)% | | | | 8.61% | | | | 11.91% | | | | (3.74)% | | | | 5.60% | |
| | | | | | |
| Ratios to average net assetse | | | | | | | | | | | | | | | | | | | | | | | | |
| | | | | | |
Expensesf,g | | | 1.28% | h | | | 1.31% | h | | | 1.36% | h | | | 1.36% | h | | | 1.37% | h | | | 1.35% | |
| | | | | | |
Expenses incurred in connection with securities sold short | | | 0.01% | | | | 0.01% | | | | —% | | | | 0.01% | | | | 0.02% | | | | 0.03% | |
| | | | | | |
Net investment income | | | 2.41% | | | | 1.46% | | | | 1.94% | | | | 1.75% | | | | 1.36% | | | | 2.50% | c |
| | | | | | |
| Supplemental data | | | | | | | | | | | | | | | | | | | | | | | | |
| | | | | | |
Net assets, end of period (000’s) | | | $31,288 | | | | $30,094 | | | | $41,713 | | | | $45,262 | | | | $49,054 | | | | $59,961 | |
| | | | | | |
Portfolio turnover rate | | | 10.94% | | | | 29.84% | | | | 17.49% | | | | 17.54% | | | | 21.88% | | | | 22.18% | |
aThe amount shown for a share outstanding throughout the period may not correlate with the Statement of Operations for the period due to the timing of sales and repurchases of the Fund’s shares in relation to income earned and/or fluctuating fair value of the investments of the Fund.
bBased on average daily shares outstanding.
cNet investment income per share includes approximately $0.34 per share related to income received in the form of special dividends in connection with certain Fund holdings. Excluding this amount, the ratio of net investment income to average net assets would have been 1.05%.
dTotal return does not include fees, charges or expenses imposed by the variable annuity and life insurance contracts for which Franklin Templeton Variable Insurance Products Trust serves as an underlying investment vehicle. Total return is not annualized for periods less than one year.
eRatios are annualized for periods less than one year.
fIncludes dividend and/or interest expense on securities sold short and security borrowing fees, if any. See below for the ratios of such expenses to average net assets for the periods presented. See Note 1(d).
gBenefit of expense reduction rounds to less than 0.01%.
hBenefit of waiver and payments by affiliates rounds to less than 0.01%.
| | | | |
| | | |
MGD-10 | | Semiannual Report | The accompanying notes are an integral part of these financial statements. | | |
FRANKLIN TEMPLETON VARIABLE INSURANCE PRODUCTS TRUST
Statement of Investments, June 30, 2019 (unaudited)
Franklin Mutual Global Discovery VIP Fund
| | | | | | | | | | |
| | | |
| | | Country | | Shares/
Units/
Warrants | | | Value | |
| | | |
Common Stocks and Other Equity Interests 91.8% | | | | | | | | | | |
Aerospace & Defense 0.9% | | | | | | | | | | |
BAE Systems PLC | | United Kingdom | | | 847,691 | | | $ | 5,333,106 | |
| | | | | | | | | | |
Auto Components 0.3% | | | | | | | | | | |
a,b,cInternational Automotive Components Group Brazil LLC | | Brazil | | | 424,073 | | | | 10,890 | |
Toyo Tire Corp. | | Japan | | | 138,565 | | | | 1,821,059 | |
| | | | | | | | | | |
| | | |
| | | | | | | | | 1,831,949 | |
| | | | | | | | | | |
Automobiles 1.3% | | | | | | | | | | |
General Motors Co. | | United States | | | 198,100 | | | | 7,632,793 | |
| | | | | | | | | | |
| | | |
Banks 11.5% | | | | | | | | | | |
Barclays PLC | | United Kingdom | | | 18,505 | | | | 35,204 | |
CIT Group Inc. | | United States | | | 108,969 | | | | 5,725,231 | |
Citigroup Inc. | | United States | | | 170,950 | | | | 11,971,629 | |
Citizens Financial Group Inc. | | United States | | | 345,523 | | | | 12,217,693 | |
First Horizon National Corp. | | United States | | | 353,473 | | | | 5,277,352 | |
ING Groep NV | | Netherlands | | | 440,135 | | | | 5,101,747 | |
JPMorgan Chase & Co. | | United States | | | 72,586 | | | | 8,115,115 | |
Standard Chartered PLC | | United Kingdom | | | 827,197 | | | | 7,502,662 | |
Wells Fargo & Co. | | United States | | | 209,020 | | | | 9,890,826 | |
| | | | | | | | | | |
| | | |
| | | | | | | | | 65,837,459 | |
| | | | | | | | | | |
Biotechnology 1.4% | | | | | | | | | | |
aCelgene Corp. | | United States | | | 83,100 | | | | 7,681,764 | |
| | | | | | | | | | |
| | | |
Building Products 1.5% | | | | | | | | | | |
Johnson Controls International PLC | | United States | | | 206,500 | | | | 8,530,515 | |
| | | | | | | | | | |
Capital Markets 1.7% | | | | | | | | | | |
Credit Suisse Group AG | | Switzerland | | | 499,643 | | | | 5,989,371 | |
Deutsche Bank AG | | Germany | | | 207,029 | | | | 1,595,747 | |
Guotai Junan Securities Co. Ltd. | | China | | | 1,275,797 | | | | 2,273,266 | |
| | | | | | | | | | |
| | | |
| | | | | | | | | 9,858,384 | |
| | | | | | | | | | |
Chemicals 1.4% | | | | | | | | | | |
BASF SE | | Germany | | | 113,111 | | | | 8,219,488 | |
| | | | | | | | | | |
Communications Equipment 1.0% | | | | | | | | | | |
Cisco Systems Inc. | | United States | | | 100,180 | | | | 5,482,851 | |
| | | | | | | | | | |
Construction Materials 1.0% | | | | | | | | | | |
LafargeHolcim Ltd., B | | Switzerland | | | 121,811 | | | | 5,946,777 | |
| | | | | | | | | | |
Consumer Finance 1.4% | | | | | | | | | | |
Ally Financial Inc. | | United States | | | 32,830 | | | | 1,017,402 | |
Capital One Financial Corp. | | United States | | | 76,488 | | | | 6,940,521 | |
| | | | | | | | | | |
| | | |
| | | | | | | | | 7,957,923 | |
| | | | | | | | | | |
Containers & Packaging 1.0% | | | | | | | | | | |
International Paper Co. | | United States | | | 134,900 | | | | 5,843,868 | |
| | | | | | | | | | |
Diversified Financial Services 1.0% | | | | | | | | | | |
Voya Financial Inc. | | United States | | | 101,650 | | | | 5,621,245 | |
| | | | | | | | | | |
FRANKLIN TEMPLETON VARIABLE INSURANCE PRODUCTS TRUST
STATEMENT OF INVESTMENTS (UNAUDITED)
Franklin Mutual Global Discovery VIP Fund(continued)
| | | | | | | | | | |
| | | |
| | | Country | | Shares/
Units/
Warrants | | | Value | |
| | | |
Common Stocks and Other Equity Interests(continued) | | | | | | | | | | |
Diversified Telecommunication Services 1.0% | | | | | | | | | | |
Koninklijke KPN NV | | Netherlands | | | 1,862,967 | | | $ | 5,718,368 | |
| | | | | | | | | | |
Electric Utilities 1.8% | | | | | | | | | | |
Enel SpA | | Italy | | | 1,435,057 | | | | 10,017,070 | |
| | | | | | | | | | |
Energy Equipment & Services 1.2% | | | | | | | | | | |
Baker Hughes a GE Co., A | | United States | | | 274,264 | | | | 6,755,122 | |
| | | | | | | | | | |
Entertainment 3.4% | | | | | | | | | | |
The Walt Disney Co. | | United States | | | 137,500 | | | | 19,200,500 | |
| | | | | | | | | | |
Food & Staples Retailing 1.0% | | | | | | | | | | |
Walgreens Boots Alliance Inc. | | United States | | | 102,904 | | | | 5,625,762 | |
| | | | | | | | | | |
Food Products 0.9% | | | | | | | | | | |
The Kraft Heinz Co. | | United States | | | 165,900 | | | | 5,149,536 | |
| | | | | | | | | | |
Health Care Equipment & Supplies 3.2% | | | | | | | | | | |
Medtronic PLC | | United States | | | 190,110 | | | | 18,514,813 | |
| | | | | | | | | | |
Health Care Providers & Services 1.4% | | | | | | | | | | |
CVS Health Corp. | | United States | | | 148,791 | | | | 8,107,622 | |
| | | | | | | | | | |
Hotels, Restaurants & Leisure 2.2% | | | | | | | | | | |
Accor SA | | France | | | 186,049 | | | | 7,984,495 | |
Sands China Ltd. | | China | | | 916,400 | | | | 4,381,322 | |
| | | | | | | | | | |
| | | |
| | | | | | | | | 12,365,817 | |
| | | | | | | | | | |
Independent Power & Renewable Electricity Producers 0.5% | | | | | | | | | | |
Vistra Energy Corp. | | United States | | | 117,933 | | | | 2,670,003 | |
| | | | | | | | | | |
Industrial Conglomerates 1.2% | | | | | | | | | | |
General Electric Co. | | United States | | | 624,350 | | | | 6,555,675 | |
| | | | | | | | | | |
Insurance 9.2% | | | | | | | | | | |
aAlleghany Corp. | | United States | | | 2,730 | | | | 1,859,430 | |
American International Group Inc. | | United States | | | 177,333 | | | | 9,448,302 | |
China Pacific Insurance Group Co. Ltd., H | | China | | | 1,523,508 | | | | 5,957,793 | |
Chubb Ltd. | | United States | | | 49,566 | | | | 7,300,576 | |
The Hartford Financial Services Group Inc. | | United States | | | 192,796 | | | | 10,742,593 | |
NN Group NV | | Netherlands | | | 280,241 | | | | 11,278,157 | |
RSA Insurance Group PLC | | United Kingdom | | | 501,149 | | | | 3,670,952 | |
T&D Holdings Inc. | | Japan | | | 199,721 | | | | 2,166,330 | |
| | | | | | | | | | |
| | | |
| | | | | | | | | 52,424,133 | |
| | | | | | | | | | |
IT Services 1.4% | | | | | | | | | | |
Cognizant Technology Solutions Corp., A | | United States | | | 126,860 | | | | 8,041,655 | |
| | | | | | | | | | |
| | | |
Machinery 0.4% | | | | | | | | | | |
CNH Industrial NV | | United Kingdom | | | 239,035 | | | | 2,450,614 | |
| | | | | | | | | | |
Media 5.0% | | | | | | | | | | |
aCharter Communications Inc., A | | United States | | | 34,286 | | | | 13,549,141 | |
aClear Channel Outdoor Holdings Inc. | | United States | | | 206,569 | | | | 975,006 | |
aCumulus Media Inc., A | | United States | | | 8,189 | | | | 151,906 | |
aCumulus Media Inc., B | | United States | | | 13,384 | | | | 248,273 | |
FRANKLIN TEMPLETON VARIABLE INSURANCE PRODUCTS TRUST
STATEMENT OF INVESTMENTS (UNAUDITED)
Franklin Mutual Global Discovery VIP Fund(continued)
| | | | | | | | | | |
| | | |
| | | Country | | Shares/
Units/
Warrants | | | Value | |
| | | |
Common Stocks and Other Equity Interests(continued) | | | | | | | | | | |
Media(continued) | | | | | | | | | | |
aDISH Network Corp., A | | United States | | | 139,003 | | | $ | 5,339,105 | |
a,b,ciHeartMedia Inc., A | | United States | | | 95,199 | | | | 1,381,841 | |
a,b,ciHeartMedia Inc., B | | United States | | | 1,606 | | | | 23,312 | |
aLiberty Global PLC, C | | United Kingdom | | | 263,900 | | | | 7,001,267 | |
| | | | | | | | | | |
| | | |
| | | | | | | | | 28,669,851 | |
| | | | | | | | | | |
Metals & Mining 0.0%† | | | | | | | | | | |
Warrior Met Coal Inc. | | United States | | | 3,221 | | | | 84,132 | |
| | | | | | | | | | |
| | | |
Oil, Gas & Consumable Fuels 11.9% | | | | | | | | | | |
Anadarko Petroleum Corp. | | United States | | | 92,025 | | | | 6,493,284 | |
BP PLC | | United Kingdom | | | 884,587 | | | | 6,162,869 | |
Caltex Australia Ltd. | | Australia | | | 33,324 | | | | 578,947 | |
Canadian Natural Resources Ltd. | | Canada | | | 287,800 | | | | 7,758,899 | |
Crescent Point Energy Corp. | | Canada | | | 670,900 | | | | 2,217,978 | |
JXTG Holdings Inc. | | Japan | | | 897,639 | | | | 4,449,066 | |
Kinder Morgan Inc. | | United States | | | 571,770 | | | | 11,938,558 | |
Occidental Petroleum Corp. | | United States | | | 61,000 | | | | 3,067,080 | |
Plains All American Pipeline LP | | United States | | | 195,500 | | | | 4,760,425 | |
Royal Dutch Shell PLC, A (EUR Traded) | | United Kingdom | | | 237,549 | | | | 7,753,353 | |
Royal Dutch Shell PLC, A (GBP Traded) | | United Kingdom | | | 179,410 | | | | 5,861,228 | |
The Williams Cos. Inc. | | United States | | | 234,501 | | | | 6,575,408 | |
| | | | | | | | | | |
| | | |
| | | | | | | | | 67,617,095 | |
| | | | | | | | | | |
Pharmaceuticals 7.8% | | | | | | | | | | |
Eli Lilly & Co. | | United States | | | 54,384 | | | | 6,025,203 | |
GlaxoSmithKline PLC | | United Kingdom | | | 670,728 | | | | 13,429,337 | |
Merck & Co. Inc. | | United States | | | 83,452 | | | | 6,997,450 | |
Novartis AG, ADR | | Switzerland | | | 199,302 | | | | 18,198,266 | |
| | | | | | | | | | |
| | | |
| | | | | | | | | 44,650,256 | |
| | | | | | | | | | |
Semiconductors & Semiconductor Equipment 0.7% | | | | | | | | | | |
aRenesas Electronics Corp. | | Japan | | | 791,797 | | | | 3,928,876 | |
| | | | | | | | | | |
| | | |
Software 4.2% | | | | | | | | | | |
aAvaya Holdings Corp., wts., 12/15/22 | | United States | | | 5,179 | | | | 5,179 | |
aCheck Point Software Technologies Ltd. | | Israel | | | 85,267 | | | | 9,857,718 | |
aRed Hat Inc. | | United States | | | 34,900 | | | | 6,552,824 | |
Symantec Corp. | | United States | | | 334,461 | | | | 7,277,871 | |
| | | | | | | | | | |
| | | |
| | | | | | | | | 23,693,592 | |
| | | | | | | | | | |
Specialty Retail 0.7% | | | | | | | | | | |
Dufry AG | | Switzerland | | | 44,773 | | | | 3,791,112 | |
| | | | | | | | | | |
| | | |
Technology Hardware, Storage & Peripherals 4.2% | | | | | | | | | | |
Hewlett Packard Enterprise Co. | | United States | | | 376,580 | | | | 5,629,871 | |
Samsung Electronics Co. Ltd. | | South Korea | | | 297,113 | | | | 12,070,039 | |
Western Digital Corp. | | United States | | | 132,012 | | | | 6,277,171 | |
| | | | | | | | | | |
| | | |
| | | | | | | | | 23,977,081 | |
| | | | | | | | | | |
FRANKLIN TEMPLETON VARIABLE INSURANCE PRODUCTS TRUST
STATEMENT OF INVESTMENTS (UNAUDITED)
Franklin Mutual Global Discovery VIP Fund(continued)
| | | | | | | | | | | | |
| | | |
| | | Country | | | Shares/
Units/
Warrants | | | Value | |
| | | |
Common Stocks and Other Equity Interests(continued) | | | | | | | | | | | | |
Tobacco 3.1% | | | | | | | | | | | | |
Altria Group Inc. | | | United States | | | | 107,584 | | | $ | 5,094,102 | |
British American Tobacco PLC | | | United Kingdom | | | | 224,633 | | | | 7,842,146 | |
British American Tobacco PLC, ADR | | | United Kingdom | | | | 83,985 | | | | 2,928,557 | |
Imperial Brands PLC | | | United Kingdom | | | | 66,232 | | | | 1,553,368 | |
| | | | | | | | | | | | |
| | | |
| | | | | | | | | | | 17,418,173 | |
| | | | | | | | | | | | |
Total Common Stocks and Other Equity Interests
(Cost $447,606,420) | | | | | | | | | | | 523,204,980 | |
| | | | | | | | | | | | |
| | | |
Preferred Stocks (Cost $12,172,905) 2.0% | | | | | | | | | | | | |
Automobiles 2.0% | | | | | | | | | | | | |
dVolkswagen AG, 3.279%, pfd | | | Germany | | | | 67,454 | | | | 11,366,263 | |
| | | | | | | | | | | | |
| | | |
| | | | | | Principal
Amount | | | | |
Corporate Notes 0.9% | | | | | | | | | | | | |
Frontier Communications Corp., | | | | | | | | | | | | |
senior note, 10.50%, 9/15/22 | | | United States | | | $ | 3,610,000 | | | | 2,463,825 | |
senior note, 11.00%, 9/15/25 | | | United States | | | | 4,065,000 | | | | 2,540,625 | |
| | | | | | | | | | | | |
| | | |
Total Corporate Notes (Cost $7,070,694) | | | | | | | | | | | 5,004,450 | |
| | | | | | | | | | | | |
| | | |
Corporate Bonds and Notes in Reorganization 0.1% | | | | | | | | | | | | |
b,c,eBroadband Ventures III LLC, secured promissory note, 5.00%, 2/01/12 | | | United States | | | | 595 | | | | — | |
ePacific Gas & Electric Co., | | | | | | | | | | | | |
senior bond, 3.75%, 8/15/42 | | | United States | | | | 225,000 | | | | 204,750 | |
senior bond, 4.45%, 4/15/42 | | | United States | | | | 167,000 | | | | 160,738 | |
senior bond, 4.00%, 12/01/46 | | | United States | | | | 295,000 | | | | 269,187 | |
senior bond, 3.95%, 12/01/47 | | | United States | | | | 151,000 | | | | 136,466 | |
| | | | | | | | | | | | |
| | | |
Total Corporate Bonds and Notes in Reorganization
(Cost $631,884) | | | | | | | | | | | 771,141 | |
| | | | | | | | | | | | |
| | | |
| | | | | | Shares | | | | |
| | | |
Companies in Liquidation 0.0%† | | | | | | | | | | | | |
a,b,fAvaya Holdings Corp., Contingent Distribution | | | United States | | | | 1,270,000 | | | | — | |
a,b,fAvaya Inc., Contingent Distribution | | | United States | | | | 1,668,000 | | | | — | |
a,b,fiHeartCommunications Inc., Contingent Distribution | | | United States | | | | 9,103,035 | | | | — | |
a,bNewPage Corp., Litigation Trust | | | United States | | | | 4,854,000 | | | | — | |
a,b,fTribune Media, Litigation Trust, Contingent Distribution | | | United States | | | | 57,569 | | | | — | |
a,fVistra Energy Corp., Litigation Trust, Contingent Distribution | | | United States | | | | 5,912,263 | | | | 8,869 | |
| | | | | | | | | | | | |
| | | |
Total Companies in Liquidation (Cost $185,917) | | | | | | | | | | | 8,869 | |
| | | | | | | | | | | | |
| | | |
Total Investments before Short Term Investments
(Cost $467,667,820) | | | | | | | | | | | 540,355,703 | |
| | | | | | | | | | | | |
FRANKLIN TEMPLETON VARIABLE INSURANCE PRODUCTS TRUST
STATEMENT OF INVESTMENTS (UNAUDITED)
Franklin Mutual Global Discovery VIP Fund(continued)
| | | | | | | | | | | | |
| | | Country | | | Principal
Amount | | | Value | |
| | | |
Short Term Investments 4.6% | | | | | | | | | | | | |
| | | |
U.S. Government and Agency Securities 4.6% | | | | | | | | | | | | |
gFHLB, 7/01/19 | | | United States | | | $ | 4,400,000 | | | $ | 4,400,000 | |
gU.S. Treasury Bill, | | | | | | | | | | | | |
7/02/19 - 9/12/19 | | | United States | | | | 18,000,000 | | | | 17,975,601 | |
h10/17/19 - 10/31/19 | | | United States | | | | 4,000,000 | | | | 3,974,625 | |
| | | | | | | | | | | | |
| | | |
Total U.S. Government and Agency Securities
(Cost $26,339,194) | | | | | | | | | | | 26,350,226 | |
| | | | | | | | | | | | |
| | | |
Total Investments (Cost $494,007,014) 99.4% | | | | | | | | | | | 566,705,929 | |
Securities Sold Short (0.3)% | | | | | | | | | | | (1,428,525 | ) |
Other Assets, less Liabilities 0.9% | | | | | | | | | | | 5,009,872 | |
| | | | | | | | | | | | |
| | | |
Net Assets 100.0% | | | | | | | | | | $ | 570,287,276 | |
| | | | | | | | | | | | |
| | | |
| | | | | | Shares | | | | |
iSecurities Sold Short (Proceeds $1,511,775) (0.3)% | | | | | | | | | | | | |
Common Stocks (0.3)% | | | | | | | | | | | | |
Pharmaceuticals (0.3)% | | | | | | | | | | | | |
Bristol-Myers Squibb Co. | | | United States | | | | 31,500 | | | | (1,428,525 | ) |
| | | | | | | | | | | | |
†Rounds to less than 0.1% of net assets.
aNon-income producing.
bFair valued using significant unobservable inputs. See Note 12 regarding fair value measurements.
cSee Note 9 regarding restricted securities.
dVariable rate security. The rate shown represents the yield at period end.
eSee Note 7 regarding credit risk and defaulted securities.
fContingent distributions represent the right to receive additional distributions, if any, during the reorganization of the underlying company. Shares represent total underlying principal of debt securities.
gThe security was issued on a discount basis with no stated coupon rate.
hA portion or all of the security has been segregated as collateral for securities sold short and open forward exchange contracts. At June 30, 2019, the aggregate value of these securities pledged amounted to $1,734,754, representing 0.3% of net assets.
iSee Note 1(d) regarding securities sold short.
FRANKLIN TEMPLETON VARIABLE INSURANCE PRODUCTS TRUST
STATEMENT OF INVESTMENTS (UNAUDITED)
Franklin Mutual Global Discovery VIP Fund(continued)
At June 30, 2019, the Fund had the following futures contracts outstanding. See Note 1(c).
Futures Contracts
| | | | | | | | | | | | | | | | | | | | |
| | | | | |
| Description | | Type | | | Number of
Contracts | | | Notional
Amount* | | | Expiration
Date | | | Value/
Unrealized
Appreciation
(Depreciation) | |
| | | | | |
| Currency Contracts | | | | | | | | | | | | | | | | | | | | |
EUR/USD | | | Short | | | | 181 | | | | $25,897,706 | | | | 9/16/19 | | | | $(80,476 | ) |
GBP/USD | | | Short | | | | 139 | | | | 11,075,694 | | | | 9/16/19 | | | | 10,422 | |
| | | | | | | | | | | | | | | | | | | | |
| | | | | |
Total Futures Contracts | | | | | | | | | | | | | | | | | | | $(70,054 | ) |
| | | | | | | | | | | | | | | | | | | | |
*As of period end.
At June 30, 2019, the Fund had the following forward exchange contracts outstanding. See Note 1(c).
Forward Exchange Contracts
| | | | | | | | | | | | | | | | | | | | | | | | |
| | | | | | | |
| Currency | | Counterpartya | | Type | | Quantity | | | Contract
Amount | | | Settlement
Date | | | Unrealized
Appreciation | | | Unrealized
Depreciation | |
| |
| | | | | | |
| OTC Forward Exchange Contracts | | | | | | | | | | | | | | | | | | | | | | |
Euro | | BOFA | | Buy | | | 586,727 | | | $ | 658,750 | | | | 7/15/19 | | | $ | 9,246 | | | | $ — | |
Euro | | BOFA | | Sell | | | 273,866 | | | | 311,079 | | | | 7/15/19 | | | | — | | | | (721 | ) |
Euro | | HSBK | | Buy | | | 1,687,916 | | | | 1,894,824 | | | | 7/15/19 | | | | 26,888 | | | | — | |
Euro | | HSBK | | Sell | | | 38,373,289 | | | | 43,092,627 | | | | 7/15/19 | | | | — | | | | (595,786 | ) |
Euro | | UBSW | | Buy | | | 845,118 | | | | 950,349 | | | | 7/15/19 | | | | 11,827 | | | | — | |
Euro | | UBSW | | Sell | | | 1,873,932 | | | | 2,116,358 | | | | 7/15/19 | | | | — | | | | (17,135 | ) |
Swiss Franc | | HSBK | | Buy | | | 71,836 | | | | 71,600 | | | | 7/15/19 | | | | 2,090 | | | | — | |
Swiss Franc | | HSBK | | Sell | | | 86,420 | | | | 87,178 | | | | 7/15/19 | | | | — | | | | (1,473 | ) |
Swiss Franc | | UBSW | | Sell | | | 5,708,155 | | | | 5,705,187 | | | | 7/15/19 | | | | — | | | | (150,338 | ) |
British Pound | | BOFA | | Buy | | | 853,441 | | | | 1,081,763 | | | | 7/16/19 | | | | 3,073 | | | | — | |
British Pound | | HSBK | | Buy | | | 220,557 | | | | 277,911 | | | | 7/16/19 | | | | 2,447 | | | | — | |
British Pound | | SSBT | | Sell | | | 10,987,586 | | | | 13,914,843 | | | | 7/16/19 | | | | — | | | | (51,843 | ) |
British Pound | | UBSW | | Buy | | | 67,858 | | | | 86,346 | | | | 7/16/19 | | | | — | | | | (89 | ) |
British Pound | | UBSW | | Buy | | | 1,324,792 | | | | 1,673,923 | | | | 7/16/19 | | | | 10,064 | | | | — | |
British Pound | | UBSW | | Sell | | | 311,205 | | | | 396,023 | | | | 7/16/19 | | | | 440 | | | | — | |
South Korean Won | | HSBK | | Sell | | | 13,162,454,649 | | | | 11,165,537 | | | | 7/19/19 | | | | — | | | | (218,237 | ) |
South Korean Won | | UBSW | | Sell | | | 356,186,851 | | | | 301,649 | | | | 7/19/19 | | | | — | | | | (6,406 | ) |
Australian Dollar | | HSBK | | Sell | | | 711,357 | | | | 495,172 | | | | 8/26/19 | | | | — | | | | (5,130 | ) |
Japanese Yen | | UBSW | | Sell | | | 226,566,498 | | | | 2,113,822 | | | | 8/26/19 | | | | 2,993 | | | | — | |
| | | | | | | | | | | | | | | | | | | | |
| | | | | | | |
Total Forward Exchange Contracts | | | | | | | | | | | | | | | | | | $ | 69,068 | | | | $ (1,047,158 | ) |
| | | | | | | | | | | | | | | | | | | | |
| | | | | | |
Net unrealized appreciation (depreciation) | | | | | | | | | | | | | | | | | | | | | $ (978,090 | ) |
| | | | | | | | | | | | | | | | | | | | | | | | |
aMay be comprised of multiple contracts with the same counterparty, currency and settlement date.
See Note 10 regarding other derivative information.
See Abbreviations on pageMGD-30.
| | | | |
| | |
| MGD-16 | | Semiannual Report | The accompanying notes are an integral part of these financial statements. |
FRANKLIN TEMPLETON VARIABLE INSURANCE PRODUCTS TRUST
FINANCIAL STATEMENTS
Statement of Assets and Liabilities
June 30, 2019 (unaudited)
| | | | |
| |
| | | Franklin Mutual
Global Discovery
VIP Fund | |
| |
Assets: | | | | |
Investments in securities: | | | | |
Cost - Unaffiliated issuers | | | $494,007,014 | �� |
| | | | |
| |
Value - Unaffiliated issuers | | | $566,705,929 | |
Cash | | | 90,379 | |
Foreign currency, at value (cost $311,989) | | | 312,108 | |
Receivables: | | | | |
Investment securities sold | | | 2,603,324 | |
Capital shares sold | | | 62,434 | |
Dividends and interest | | | 1,713,820 | |
European Union tax reclaims | | | 322,621 | |
Deposits with brokers for: | | | | |
Securities sold short | | | 1,605,165 | |
Futures contracts | | | 688,050 | |
Unrealized appreciation on OTC forward exchange contracts | | | 69,068 | |
Other assets | | | 403 | |
| | | | |
| |
Total assets | | | 574,173,301 | |
| | | | |
| |
Liabilities: | | | | |
Payables: | | | | |
Investment securities purchased | | | 138,517 | |
Capital shares redeemed | | | 418,662 | |
Management fees | | | 402,967 | |
Distribution fees | | | 239,462 | |
Trustees’ fees and expenses | | | 649 | |
Variation margin on futures contracts | | | 45,275 | |
Securities sold short, at value (proceeds $1,511,775) | | | 1,428,525 | |
Unrealized depreciation on OTC forward exchange contracts | | | 1,047,158 | |
Accrued expenses and other liabilities | | | 164,810 | |
| | | | |
| |
Total liabilities | | | 3,886,025 | |
| | | | |
| |
Net assets, at value | | | $570,287,276 | |
| | | | |
Net assets consist of: | | | | |
Paid-in capital | | | $422,378,765 | |
Total distributable earnings (loss) | | | 147,908,511 | |
| | | | |
| |
Net assets, at value | | | $570,287,276 | |
| | | | |
Class 1: | | | | |
Net assets, at value | | | $ 3,729,349 | |
| | | | |
Shares outstanding | | | 186,084 | |
| | | | |
Net asset value and maximum offering price per share | | | $20.04 | |
| | | | |
Class 2: | | | | |
Net assets, at value | | | $535,270,286 | |
| | | | |
Shares outstanding | | | 27,546,874 | |
| | | | |
Net asset value and maximum offering price per share | | | $19.43 | |
| | | | |
Class 4: | | | | |
Net assets, at value | | | $ 31,287,641 | |
| | | | |
Shares outstanding | | | 1,579,268 | |
| | | | |
Net asset value and maximum offering price per share | | | $19.81 | |
| | | | |
| | | | | | |
| | | |
| | The accompanying notes are an integral part of these financial statements. | Semiannual Report | | | MGD-17 | |
FRANKLIN TEMPLETON VARIABLE INSURANCE PRODUCTS TRUST
FINANCIAL STATEMENTS
Statement of Operations
for the six months ended June 30, 2019 (unaudited)
| | | | |
| |
| | | Franklin Mutual
Global Discovery
VIP Fund | |
| |
Investment income: | | | | |
Dividends: (net of foreign taxes)* | | | | |
Unaffiliated issuers | | | $ 9,364,286 | |
Interest: | | | | |
Unaffiliated issuers | | | 931,676 | |
Income from securities loaned: | | | | |
Unaffiliated issuers (net of fees and rebates) | | | 98,044 | |
Non-controlled affiliates (Note 3e) | | | 19,652 | |
| | | | |
| |
Total investment income | | | 10,413,658 | |
| | | | |
Expenses: | | | | |
Management fees (Note 3a) | | | 2,468,235 | |
Distribution fees: (Note 3c) | | | | |
Class 2 | | | 661,084 | |
Class 4 | | | 54,711 | |
Custodian fees (Note 4) | | | 19,358 | |
Reports to shareholders | | | 63,233 | |
Professional fees | | | 42,197 | |
Trustees’ fees and expenses | | | 2,390 | |
Dividends on securities sold short | | | 12,915 | |
Other | | | 12,415 | |
| | | | |
Total expenses | | | 3,336,538 | |
Expense reductions (Note 4) | | | (1,671 | ) |
Expenses waived/paid by affiliates (Note 3e) | | | (3,346 | ) |
| | | | |
| |
Net expenses | | | 3,331,521 | |
| | | | |
| |
Net investment income | | | 7,082,137 | |
| | | | |
Realized and unrealized gains (losses): | | | | |
Net realized gain (loss) from: | | | | |
Investments: | | | | |
Unaffiliated issuers | | | 2,703,290 | |
Foreign currency transactions | | | 78,183 | |
Forward exchange contracts | | | 1,799,809 | |
Futures contracts | | | 825,508 | |
Securities sold short | | | 92,578 | |
| | | | |
| |
Net realized gain (loss) | | | 5,499,368 | |
| | | | |
Net change in unrealized appreciation (depreciation) on: | | | | |
Investments: | | | | |
Unaffiliated issuers | | | 64,894,263 | |
Translation of other assets and liabilities denominated in foreign currencies | | | (12,639 | ) |
Forward exchange contracts | | | 198,721 | |
Futures contracts | | | (97,085 | ) |
Securities sold short | | | (995,825 | ) |
| | | | |
| |
Net change in unrealized appreciation (depreciation) | | | 63,987,435 | |
| | | | |
| |
Net realized and unrealized gain (loss) | | | 69,486,803 | |
| | | | |
| |
Net increase (decrease) in net assets resulting from operations | | | $76,568,940 | |
| | | | |
| |
*Foreign taxes withheld on dividends | | | $ 566,017 | |
| | | | |
| | | |
MGD-18 | | Semiannual Report | The accompanying notes are an integral part of these financial statements. | | |
FRANKLIN TEMPLETON VARIABLE INSURANCE PRODUCTS TRUST
FINANCIAL STATEMENTS
Statements of Changes in Net Assets
| | | | | | | | |
| | | Franklin Mutual Global Discovery VIP Fund | |
| | |
| | | Six Months Ended
June 30, 2019
(unaudited) | | | Year Ended
December 31, 2018 | |
| |
Increase (decrease) in net assets: | | | | | | | | |
Operations: | | | | | | | | |
Net investment income | | | $ 7,082,137 | | | | $ 9,851,636 | |
Net realized gain (loss) | | | 5,499,368 | | | | 54,878,424 | |
Net change in unrealized appreciation (depreciation) | | | 63,987,435 | | | | (132,139,062 | ) |
| | | | |
| | |
Net increase (decrease) in net assets resulting from operations | | | 76,568,940 | | | | (67,409,002 | ) |
| | | | |
| | |
Distributions to shareholders: | | | | | | | | |
Class 1 | | | — | | | | (139,418 | ) |
Class 2 | | | — | | | | (21,021,401 | ) |
Class 4 | | | — | | | | (1,188,087 | ) |
| | | | |
| | |
Total distributions to shareholders | | | — | | | | (22,348,906 | ) |
| | | | |
| | |
Capital share transactions: (Note 2) | | | | | | | | |
Class 1 | | | (37,599 | ) | | | 642,511 | |
Class 2 | | | (37,165,968 | ) | | | (46,304,313 | ) |
Class 4 | | | (3,061,109 | ) | | | (6,678,610 | ) |
| | | | |
| | |
Total capital share transactions | | | (40,264,676 | ) | | | (52,340,412 | ) |
| | | | |
| | |
Net increase (decrease) in net assets | | | 36,304,264 | | | | (142,098,320 | ) |
Net assets: | | | | | | | | |
Beginning of period | | | 533,983,012 | | | | 676,081,332 | |
| | | | |
| | |
End of period | | | $570,287,276 | | | | $ 533,983,012 | |
| | | | |
| | | | | | |
| | | |
| | The accompanying notes are an integral part of these financial statements. | Semiannual Report | | | MGD-19 | |
FRANKLIN TEMPLETON VARIABLE INSURANCE PRODUCTS TRUST
Notes to Financial Statements (unaudited)
Franklin Mutual Global Discovery VIP Fund
1. Organization and Significant Accounting Policies
Franklin Templeton Variable Insurance Products Trust (Trust) is registered under the Investment Company Act of 1940 (1940 Act) as anopen-end management investment company, consisting of eighteen separate funds and applies the specialized accounting and reporting guidance in U.S. Generally Accepted Accounting Principles (U.S. GAAP). Franklin Mutual Global Discovery VIP Fund (Fund) is included in this report. Shares of the Fund are generally sold only to insurance company separate accounts to fund the benefits of variable life insurance policies or variable annuity contracts. At June 30, 2019, 44.8% of the Fund’s shares were held through one insurance company. Investment activities of these insurance company separate accounts could have a material impact on the Fund. The Fund offers three classes of shares: Class 1, Class 2, and Class 4. Each class of shares may differ by its distribution fees, voting rights on matters affecting a single class and its exchange privilege.
The following summarizes the Fund’s significant accounting policies.
a. Financial Instrument Valuation
The Fund’s investments in financial instruments are carried at fair value daily. Fair value is the price that would be received to sell an asset or paid to transfer a liability in an orderly transaction between market participants on the measurement date. The Fund calculates the net asset value (NAV) per share each business day as of 4 p.m. Eastern time or the regularly scheduled close of the New York Stock Exchange (NYSE), whichever is earlier. Under compliance policies and procedures approved by the Trust’s Board of Trustees (the Board), the Fund’s administrator has responsibility for oversight of valuation, including leading the cross-functional Valuation Committee (VC). The Fund may utilize independent pricing services, quotations from securities and financial instrument dealers, and other market sources to determine fair value.
Equity securities and derivative financial instruments listed on an exchange or on the NASDAQ National Market System are valued at the last quoted sale price or the official closing price of the day, respectively. Foreign equity securities are valued as of the close of trading on the foreign stock exchange on which the security is primarily traded, or as of 4 p.m. Eastern time. The value is then converted into its U.S. dollar equivalent at the foreign exchange rate in effect at 4 p.m. Eastern time on the day that the value of the security is
determined.Over-the-counter (OTC) securities are valued within the range of the most recent quoted bid and ask prices. Securities that trade in multiple markets or on multiple exchanges are valued according to the broadest and most representative market. Certain equity securities are valued based upon fundamental characteristics or relationships to similar securities.
Debt securities generally trade in the OTC market rather than on a securities exchange. The Fund’s pricing services use multiple valuation techniques to determine fair value. In instances where sufficient market activity exists, the pricing services may utilize a market-based approach through which quotes from market makers are used to determine fair value. In instances where sufficient market activity may not exist or is limited, the pricing services also utilize proprietary valuation models which may consider market characteristics such as benchmark yield curves, credit spreads, estimated default rates, anticipated market interest rate volatility, coupon rates, anticipated timing of principal repayments, underlying collateral, and other unique security features in order to estimate the relevant cash flows, which are then discounted to calculate the fair value.
Investments inopen-end mutual funds are valued at the closing NAV.
Certain derivative financial instruments trade in the OTC market. The Fund’s pricing services use various techniques including industry standard option pricing models and proprietary discounted cash flow models to determine the fair value of those instruments. The Fund’s net benefit or obligation under the derivative contract, as measured by the fair value of the contract, is included in net assets.
The Fund has procedures to determine the fair value of financial instruments for which market prices are not reliable or readily available. Under these procedures, the Fund primarily employs a market-based approach which may use related or comparable assets or liabilities, recent transactions, market multiples, book values, and other relevant information for the investment to determine the fair value of the investment. An income-based valuation approach may also be used in which the anticipated future cash flows of the investment are discounted to calculate fair value. Discounts may also be applied due to the nature or duration of any restrictions on the disposition of the investments. Due to the
FRANKLIN TEMPLETON VARIABLE INSURANCE PRODUCTS TRUST
FINANCIAL STATEMENTS
Franklin Mutual Global Discovery VIP Fund(continued)
inherent uncertainty of valuations of such investments, the fair values may differ significantly from the values that would have been used had an active market existed.
Trading in securities on foreign securities stock exchanges and OTC markets may be completed before 4 p.m. Eastern time. In addition, trading in certain foreign markets may not take place on every Fund’s business day. Occasionally, events occur between the time at which trading in a foreign security is completed and 4 p.m. Eastern time that might call into question the reliability of the value of a portfolio security held by the Fund. As a result, differences may arise between the value of the Fund’s portfolio securities as determined at the foreign market close and the latest indications of value at 4 p.m. Eastern time. In order to minimize the potential for these differences, the VC monitors price movements following the close of trading in foreign stock markets through a series of country specific market proxies (such as baskets of American Depositary Receipts, futures contracts and exchange traded funds). These price movements are measured against established trigger thresholds for each specific market proxy to assist in determining if an event has occurred that may call into question the reliability of the values of the foreign securities held by the Fund. If such an event occurs, the securities may be valued using fair value procedures, which may include the use of independent pricing services.
When the last day of the reporting period is anon-business day, certain foreign markets may be open on those days that the Fund’s NAV is not calculated, which could result in differences between the value of the Fund’s portfolio securities on the last business day and the last calendar day of the reporting period. Any significant security valuation changes due to an open foreign market are adjusted and reflected by the Fund for financial reporting purposes.
b. Foreign Currency Translation
Portfolio securities and other assets and liabilities denominated in foreign currencies are translated into U.S. dollars based on the exchange rate of such currencies against U.S. dollars on the date of valuation. The Fund may enter into foreign currency exchange contracts to facilitate transactions denominated in a foreign currency. Purchases and sales of securities, income and expense items denominated in foreign currencies are translated into U.S. dollars at the exchange rate in effect on the transaction date. Portfolio securities and assets and liabilities denominated in
foreign currencies contain risks that those currencies will decline in value relative to the U.S. dollar. Occasionally, events may impact the availability or reliability of foreign exchange rates used to convert the U.S. dollar equivalent value. If such an event occurs, the foreign exchange rate will be valued at fair value using procedures established and approved by the Board.
The Fund does not separately report the effect of changes in foreign exchange rates from changes in market prices on securities held. Such changes are included in net realized and unrealized gain or loss from investments in the Statement of Operations.
Realized foreign exchange gains or losses arise from sales of foreign currencies, currency gains or losses realized between the trade and settlement dates on securities transactions and the difference between the recorded amounts of dividends, interest, and foreign withholding taxes and the U.S. dollar equivalent of the amounts actually received or paid. Net unrealized foreign exchange gains and losses arise from changes in foreign exchange rates on foreign denominated assets and liabilities other than investments in securities held at the end of the reporting period.
c. Derivative Financial Instruments
The Fund invested in derivative financial instruments in order to manage risk or gain exposure to various other investments or markets. Derivatives are financial contracts based on an underlying or notional amount, require no initial investment or an initial net investment that is smaller than would normally be required to have a similar response to changes in market factors, and require or permit net settlement. Derivatives contain various risks including the potential inability of the counterparty to fulfill their obligations under the terms of the contract, the potential for an illiquid secondary market, and/or the potential for market movements which expose the Fund to gains or losses in excess of the amounts shown in the Statement of Assets and Liabilities. Realized gain and loss and unrealized appreciation and depreciation on these contracts for the period are included in the Statement of Operations.
Derivative counterparty credit risk is managed through a formal evaluation of the creditworthiness of all potential counterparties. The Fund attempts to reduce its exposure to counterparty credit risk on OTC derivatives, whenever possible, by entering into International Swaps and Derivatives Association (ISDA) master agreements with certain
FRANKLIN TEMPLETON VARIABLE INSURANCE PRODUCTS TRUST
FINANCIAL STATEMENTS
Franklin Mutual Global Discovery VIP Fund(continued)
1. Organization and Significant Accounting
Policies(continued)
c. Derivative Financial Instruments(continued)
counterparties. These agreements contain various provisions, including but not limited to collateral requirements, events of default, or early termination. Termination events applicable to the counterparty include certain deteriorations in the credit quality of the counterparty. Termination events applicable to the Fund include failure of the Fund to maintain certain net asset levels and/or limit the decline in net assets over various periods of time. In the event of default or early termination, the ISDA master agreement gives thenon-defaulting party the right to net andclose-out all transactions traded, whether or not arising under the ISDA agreement, to one net amount payable by one counterparty to the other. However, absent an event of default or early termination, OTC derivative assets and liabilities are presented gross and not offset in the Statement of Assets and Liabilities. Early termination by the counterparty may result in an immediate payment by the Fund of any net liability owed to that counterparty under the ISDA agreement. At June 30, 2019, the Fund had OTC derivatives in a net liability position of $989,688 and the aggregate value of collateral pledged for such contracts was $879,972.
Collateral requirements differ by type of derivative. Collateral or initial margin requirements are set by the broker or exchange clearing house for exchange traded and centrally cleared derivatives. Initial margin deposited is held at the exchange and can be in the form of cash and/or securities. For OTC derivatives traded under an ISDA master agreement, posting of collateral is required by either the Fund or the applicable counterparty if the total net exposure of all OTC derivatives with the applicable counterparty exceeds the minimum transfer amount, which typically ranges from $100,000 to $250,000, and can vary depending on the counterparty and the type of the agreement. Generally, collateral is determined at the close of Fund business each day and any additional collateral required due to changes in derivative values may be delivered by the Fund or the counterparty the next business day, or within a few business days. Collateral pledged and/or received by the Fund for OTC derivatives, if any, is held in segregated accounts with the Fund’s custodian/counterparty broker and can be in the form of cash and/or securities. Unrestricted cash may be invested according to the Fund’s investment objectives. To the extent that the amounts due to the Fund from its counterparties are
not subject to collateralization or are not fully collateralized, the Fund bears the risk of loss from counterpartynon-performance.
The Fund entered into exchange traded futures contracts primarily to manage exposure to certain foreign currencies. A futures contract is an agreement between the Fund and a counterparty to buy or sell an asset at a specified price on a future date. Required initial margins are pledged by the Fund, and the daily change in fair value is accounted for as a variation margin payable or receivable in the Statement of Assets and Liabilities.
The Fund entered into OTC forward exchange contracts primarily to manage exposure to certain foreign currencies. A forward exchange contract is an agreement between the Fund and a counterparty to buy or sell a foreign currency at a specific exchange rate on a future date.
See Note 10 regarding other derivative information.
d. Securities Sold Short
The Fund is engaged in selling securities short, which obligates the Fund to replace a borrowed security with the same security at current fair value. The Fund incurs a loss if the price of the security increases between the date of the short sale and the date on which the Fund replaces the borrowed security. The Fund realizes a gain if the price of the security declines between those dates. Gains are limited to the price at which the Fund sold the security short, while losses are potentially unlimited in size.
The Fund is required to establish a margin account with the broker lending the security sold short. While the short sale is outstanding, the broker retains the proceeds of the short sale to the extent necessary to meet margin requirements until the short position is closed out. A deposit must also be maintained with the Fund’s custodian/counterparty broker consisting of cash and/or securities having a value equal to a specified percentage of the value of the securities sold short. The Fund is obligated to pay fees for borrowing the securities sold short and is required to pay the counterparty any dividends and/or interest due on securities sold short. Such dividends and/or interest and any security borrowing fees are recorded as an expense to the Fund.
FRANKLIN TEMPLETON VARIABLE INSURANCE PRODUCTS TRUST
FINANCIAL STATEMENTS
Franklin Mutual Global Discovery VIP Fund(continued)
e. Securities Lending
The Fund participates in an agency based securities lending program to earn additional income. The Fund receives cash collateral against the loaned securities in an amount equal to at least 102% of the fair value of the loaned securities. Collateral is maintained over the life of the loan in an amount not less than 100% of the fair value of loaned securities, as determined at the close of Fund business each day; any additional collateral required due to changes in security values is delivered to the Fund on the next business day. The collateral is deposited into a joint cash account with other funds and is used to invest in a money market fund managed by Franklin Advisers, Inc., an affiliate of the Fund. The Fund may receive income from the investment of cash collateral, in addition to lending fees and rebates paid by the borrower. Income from securities loaned, net of fees paid to the securities lending agent and/or third-party vendor, is reported separately in the Statement of Operations. The Fund bears the market risk with respect to the collateral investment, securities loaned, and the risk that the agent may default on its obligations to the Fund. If the borrower defaults on its obligation to return the securities loaned, the Fund has the right to repurchase the securities in the open market using the collateral received. The securities lending agent has agreed to indemnify the Fund in the event of default by a third party borrower. At June 30, 2019, the Fund had no securities on loan.
f. Income and Deferred Taxes
It is the Fund’s policy to qualify as a regulated investment company under the Internal Revenue Code. The Fund intends to distribute to shareholders substantially all of its taxable income and net realized gains to relieve it from federal income and if applicable, excise taxes. As a result, no provision for U.S. federal income taxes is required.
The Fund may be subject to foreign taxation related to income received, capital gains on the sale of securities and certain foreign currency transactions in the foreign jurisdictions in which it invests. Foreign taxes, if any, are recorded based on the tax regulations and rates that exist in the foreign markets in which the Fund invests. When a capital gain tax is determined to apply, the Fund records an estimated deferred tax liability in an amount that would be payable if the securities were disposed of on the valuation date.
As a result of several court cases, in certain countries across the European Union, the Fund filed additional tax reclaims for previously withheld taxes on dividends earned in those countries (EU reclaims). These additional filings are subject to various administrative proceedings by the local jurisdictions’ tax authorities within the European Union, as well as a number of related judicial proceedings. Income recognized, if any, for EU reclaims is reflected as other income in the Statement of Operations and any related receivable, if any, is reflected as European Union tax reclaims in the Statement of Assets and Liabilities. When uncertainty exists as to the ultimate resolution of these proceedings, the likelihood of receipt of these EU reclaims, and the potential timing of payment, no amounts are reflected in the financial statements. For U.S. income tax purposes, when EU reclaims are received by the Fund and the Fund previously passed foreign tax credit on to its shareholders, the Fund must either amend historic tax reporting to shareholders or enter into a closing agreement with the Internal Revenue Service (IRS) in order to pay the associated tax liability on behalf of the Fund’s shareholders.
The Fund may recognize an income tax liability related to its uncertain tax positions under U.S. GAAP when the uncertain tax position has a less than 50% probability that it will be sustained upon examination by the tax authorities based on its technical merits. As of June 30, 2019, the Fund has determined that no tax liability is required in its financial statements related to uncertain tax positions for any open tax years (or expected to be taken in future tax years). Open tax years are those that remain subject to examination and are based on the statute of limitations in each jurisdiction in which the Fund invests.
g. Security Transactions, Investment Income, Expenses and Distributions
Security transactions are accounted for on trade date. Realized gains and losses on security transactions are determined on a specific identification basis. Interest income and estimated expenses are accrued daily. Amortization of premium and accretion of discount on debt securities are included in interest income. Dividend income and dividends declared on securities sold short are recorded on theex-dividend date except for certain dividends from securities where the dividend rate is not available. In such cases, the dividend is recorded as soon as the information is received by the Fund. Distributions to shareholders are recorded on theex-dividend date. Distributable earnings are determined
FRANKLIN TEMPLETON VARIABLE INSURANCE PRODUCTS TRUST
FINANCIAL STATEMENTS
Franklin Mutual Global Discovery VIP Fund(continued)
1. Organization and Significant Accounting Policies(continued)
g. Security Transactions, Investment Income, Expenses and Distributions(continued)
according to income tax regulations (tax basis) and may differ from earnings recorded in accordance with U.S. GAAP. These differences may be permanent or temporary. Permanent differences are reclassified among capital accounts to reflect their tax character. These reclassifications have no impact on net assets or the results of operations. Temporary differences are not reclassified, as they may reverse in subsequent periods.
Common expenses incurred by the Trust are allocated among the Funds based on the ratio of net assets of each Fund to the combined net assets of the Trust or based on the ratio of number of shareholders of each Fund to the combined number of shareholders of the Trust. Fund specific expenses are charged directly to the Fund that incurred the expense.
Realized and unrealized gains and losses and net investment income, excluding class specific expenses, are allocated daily to each class of shares based upon the relative proportion of net assets of each class. Differences in per share distributions by class are generally due to differences in class specific expenses.
h. Accounting Estimates
The preparation of financial statements in accordance with U.S. GAAP requires management to make estimates and assumptions that affect the reported amounts of assets and liabilities at the date of the financial statements and the amounts of income and expenses during the reporting period. Actual results could differ from those estimates.
i. Guarantees and Indemnifications
Under the Trust’s organizational documents, its officers and trustees are indemnified by the Trust against certain liabilities arising out of the performance of their duties to the Trust. Additionally, in the normal course of business, the Trust, on behalf of the Fund, enters into contracts with service providers that contain general indemnification clauses. The Trust’s maximum exposure under these arrangements is unknown as this would involve future claims that may be made against the Trust that have not yet occurred. Currently, the Trust expects the risk of loss to be remote.
2. Shares of Beneficial Interest
At June 30, 2019, there were an unlimited number of shares authorized (without par value). Transactions in the Fund’s shares were as follows:
| | | | | | | | | | | | | | | | | | | | |
| | | |
| | | Six Months Ended June 30, 2019 | | | | | | Year Ended December 31, 2018 | |
| | | | |
| | | | | |
| | | Shares | | | Amount | | | | | | Shares | | | Amount | |
| |
| | | | | |
| Class 1 Shares: | | | | | | | | | | | | | | | | | | | | |
Shares sold | | | 16,009 | | | $ | 302,324 | | | | | | | | 45,098 | | | $ | 915,165 | |
Shares issued in reinvestment of distributions | | | — | | | | — | | | | | | | | 6,995 | | | | 139,418 | |
Shares redeemed | | | (17,849 | ) | | | (339,923 | ) | | | | | | | (20,687 | ) | | | (412,072) | |
| | | | |
| | | | | |
Net increase (decrease) | | | (1,840 | ) | | $ | (37,599 | ) | | | | | | | 31,406 | | | $ | 642,511 | |
| | | | |
| | | | | |
| Class 2 Shares: | | | | | | | | | | | | | | | | | | | | |
Shares sold | | | 385,494 | | | $ | 7,069,719 | | | | | | | | 1,060,981 | | | $ | 20,521,165 | |
Shares issued in reinvestment of distributions | | | — | | | | — | | | | | | | | 1,085,816 | | | | 21,021,401 | |
Shares redeemed | | | (2,363,724 | ) | | | (44,235,687 | ) | | | | | | | (4,500,413 | ) | | | (87,846,879) | |
| | | | |
| | | | | |
Net increase (decrease) | | | (1,978,230 | ) | | $ | (37,165,968 | ) | | | | | | | (2,353,616 | ) | | $ | (46,304,313) | |
| | | | |
FRANKLIN TEMPLETON VARIABLE INSURANCE PRODUCTS TRUST
FINANCIAL STATEMENTS
Franklin Mutual Global Discovery VIP Fund(continued)
| | | | | | | | | | | | | | | | | | | | |
| | | |
| | | Six Months Ended
June 30, 2019 | | | | | | Year Ended
December 31, 2018 | |
| | | | |
| | | | | |
| | | Shares | | | Amount | | | | | | Shares | | | Amount | |
| |
| | | | | |
| Class 4 Shares: | | | | | | | | | | | | | | | | | | | | |
Shares sold | | | 17,902 | | | $ | 339,554 | | | | | | | | 49,992 | | | $ | 917,196 | |
Shares issued in reinvestment of distributions | | | — | | | | — | | | | | | | | 60,157 | | | | 1,188,087 | |
Shares redeemed | | | (178,614 | ) | | | (3,400,663) | | | | | | | | (438,307 | ) | | | (8,783,893) | |
| | | | |
| | | | | |
Net increase (decrease) | | | (160,712 | ) | | $ | (3,061,109) | | | | | | | | (328,158 | ) | | $ | (6,678,610) | |
| | | | |
3. Transactions with Affiliates
Franklin Resources, Inc. is the holding company for various subsidiaries that together are referred to as Franklin Templeton. Certain officers and trustees of the Fund are also officers and/or directors of the following subsidiaries:
| | |
| |
| Subsidiary | | Affiliation |
Franklin Mutual Advisers, LLC (Franklin Mutual) | | Investment manager |
Franklin Templeton Services, LLC (FT Services) | | Administrative manager |
Franklin Templeton Distributors, Inc. (Distributors) | | Principal underwriter |
Franklin Templeton Investor Services, LLC (Investor Services) | | Transfer agent |
a. Management Fees
The Fund pays an investment management fee to Franklin Mutual based on the average daily net assets of the Fund as follows:.
| | |
| |
| Annualized Fee Rate | | Net Assets |
0.875% | | Up to and including $4 billion |
0.845% | | Over $4 billion, up to and including $7 billion |
0.825% | | Over $7 billion, up to and including $10 billion |
0.805% | | Over $10 billion, up to and including $13 billion |
0.785% | | Over $13 billion, up to and including $16 billion |
0.765% | | Over $16 billion, up to and including $19 billion |
0.745% | | Over $19 billion, up to and including $22 billion |
0.725% | | Over $22 billion, up to and including $25 billion |
0.705% | | Over $25 billion, up to and including $28 billion |
0.685% | | In excess of $28 billion |
b. Administrative Fees
Under an agreement with Franklin Mutual, FT Services provides administrative services to the Fund. The fee is paid by Franklin Mutual based on the Fund’s average daily net assets, and is not an additional expense of the Fund.
FRANKLIN TEMPLETON VARIABLE INSURANCE PRODUCTS TRUST
FINANCIAL STATEMENTS
Franklin Mutual Global Discovery VIP Fund(continued)
3. Transactions with Affiliates(continued)
c. Distribution Fees
The Board has adopted distribution plans for Class 2 and Class 4 shares pursuant to Rule12b-1 under the 1940 Act. Under the Fund’s compensation distribution plans, the Fund pays Distributors for costs incurred in connection with the servicing, sale and distribution of the Fund’s shares up to 0.35% per year of its average daily net assets of each class. The Board has agreed to limit the current rate to 0.25% per year for Class 2. The plan year, for purposes of monitoring compliance with the maximum annual plan rates, is February 1 through January 31.
d. Transfer Agent Fees
Investor Services, under terms of an agreement, performs shareholder servicing for the Fund and is not paid by the Fund for the services.
e. Investments in Affiliated Management Investment Companies
The Fund invests in one or more affiliated management investment companies for purposes other than exercising a controlling influence over the management or policies. Management fees paid by the Fund are waived on assets invested in the affiliated management investment companies, as noted in the Statement of Operations, in an amount not to exceed the management and administrative fees paid directly or indirectly by each affiliate. During the period ended June 30, 2019, the Fund held investments in affiliated management investment companies as follows:
| | | | | | | | | | | | | | | | | | | | | | | | | | | | | | | | |
| | | | | | | | |
| | | Value at
Beginning
of Period | | | Purchases | | | Sales | | | Realized
Gain (Loss) | | | Net Change in
Unrealized
Appreciation
(Depreciation) | | | Value at
at End
of Period | | | Number of Shares
Held at End of
Period | | | Income
from
securities
loaned | |
| Non-Controlled Affiliates | | | | | | | | | | | | | | | | | | | | | | | | | | | | | | | | |
Institutional Fiduciary Trust Money Market Portfolio, 2.05% | | | $ — | | | $ | 53,814,000 | | | $ | (53,814,000 | ) | | | $ — | | | | $ — | | | | $ — | | | | — | | | | $19,652 | |
| | | | | | | | | | | | |
f. Interfund Transactions
The Fund engaged in purchases and sales of investments with funds or other accounts that have common investment managers (or affiliated investment managers), directors, trustees or officers. During the period ended June 30, 2019, these purchase and sale transactions aggregated $0 and $790,777, respectively.
4. Expense Offset Arrangement
The Fund has entered into an arrangement with its custodian whereby credits realized as a result of uninvested cash balances are used to reduce a portion of the Fund’s custodian expenses. During the period ended June 30, 2019, the custodian fees were reduced as noted in the Statement of Operations.
FRANKLIN TEMPLETON VARIABLE INSURANCE PRODUCTS TRUST
FINANCIAL STATEMENTS
Franklin Mutual Global Discovery VIP Fund(continued)
5. Income Taxes
At June 30, 2019, the cost of investments and net unrealized appreciation (depreciation) for income tax purposes were as follows:
| | | | |
Cost of investments | | $ | 494,081,707 | |
| | | | |
| |
Unrealized appreciation | | $ | 115,048,792 | |
Unrealized depreciation | | | (44,900,449) | |
| | | | |
| |
Net unrealized appreciation (depreciation) | | $ | 70,148,343 | |
| | | | |
Differences between income and/or capital gains as determined on a book basis and a tax basis are primarily due to differing treatment of foreign currency transactions.
6. Investment Transactions
Purchases and sales of investments (excluding short term securities and securities sold short) for the period ended June 30, 2019, aggregated $58,116,128 and $88,995,715, respectively.
7. Credit Risk and Defaulted Securities
The Fund may purchase thepre-default or defaulted debt of distressed companies. Distressed companies are financially troubled and could be or are already involved in financial restructuring or bankruptcy. Risks associated with purchasing these securities include the possibility that the bankruptcy or other restructuring process takes longer than expected, or that distributions in restructuring are less than anticipated, either or both of which may result in unfavorable consequences to the Fund. If it becomes probable that the income on debt securities, including those of distressed companies, will not be collected, the Fund discontinues accruing income and recognizes an adjustment for uncollectible interest.
At June 30, 2019, the aggregate long value of distressed company securities for which interest recognition has been discontinued was $771,141, representing 0.1% of the Fund’s net assets. For information as to specific securities, see the accompanying Statement of Investments.
8. Concentration of Risk
Investing in foreign securities may include certain risks and considerations not typically associated with investing in U.S. securities, such as fluctuating currency values and changing local and regional economic, political and social conditions, which may result in greater market volatility. Current political and financial uncertainty surrounding the European Union may increase market volatility and the economic risk of investing in securities in Europe. In addition, certain foreign securities may not be as liquid as U.S. securities.
9. Restricted Securities
The Fund invests in securities that are restricted under the Securities Act of 1933 (1933 Act). Restricted securities are often purchased in private placement transactions, and cannot be sold without prior registration unless the sale is pursuant to an exemption under the 1933 Act. Disposal of these securities may require greater effort and expense, and prompt sale at an acceptable price may be difficult. The Fund may have registration rights for restricted securities. The issuer generally incurs all registration costs.
FRANKLIN TEMPLETON VARIABLE INSURANCE PRODUCTS TRUST
FINANCIAL STATEMENTS
Franklin Mutual Global Discovery VIP Fund(continued)
9. Restricted Securities(continued)
At June 30, 2019, investments in restricted securities, excluding securities exempt from registration under the 1933 Act deemed to be liquid, were as follows:
| | | | | | | | | | | | | | |
Principal
Amount/
Shares | | Issuer | | Acquisition Date | | | Cost | | | Value | |
| |
| | | | |
595 | | Broadband Ventures III LLC, secured promissory note, 5.00%, 2/01/12 | | | 7/01/10 - 11/30/12 | | | $ | 595 | | | $ | — | |
| | | | |
95,199 | | iHeartMedia Inc., A | | | 3/28/11 - 12/19/13 | | | | 2,253,730 | | | | 1,381,841 | |
| | | | |
1,606 | | iHeartMedia Inc., B | | | 3/28/11 - 12/19/13 | | | | 38,020 | | | | 23,312 | |
424,073 | | International Automotive Components Group Brazil LLC | | | 4/13/06 - 12/26/08 | | | | 281,629 | | | | 10,890 | |
| | | | |
| | Total Restricted Securities(Value is 0.2% of Net Assets) | | | | | | $ | 2,573,974 | | | $ | 1,416,043 | |
10. Other Derivative Information
At June 30, 2019, investments in derivative contracts are reflected in the Statement of Assets and Liabilities as follows:
| | | | | | | | | | | | | | | | |
| | | Asset Derivatives | | | | | | Liability Derivatives | |
| | | | | | | | | | |
| | | | | |
Derivative Contracts
Not Accounted for as
Hedging Instruments | | Statement of
Assets and Liabilities
Location | | Fair Value | | | | | | Statement of
Assets and Liabilities
Location | | Fair Value | |
| |
| | | | | |
Foreign exchange contracts | | Variation margin on futures | | $ | 10,422 | a | | | | | | Variation margin on futures | | $ | 80,476 | a |
| | contracts | | | | | | | | | | contracts | | | | |
| | | | | |
| | Unrealized appreciation on OTC | | | 69,068 | | | | | | | Unrealized depreciation on OTC | | | 1,047,158 | |
| | forward exchange contracts | | | | | | | | | | forward exchange contracts | | | | |
| | | | | | | | | | | | | | | | |
Totals | | | | $ | 79,490 | | | | | | | | | $ | 1,127,634 | |
| | | | | | | | | | | | | | | | |
aThis amount reflects the cumulative appreciation (depreciation) of futures contracts as reported in the Statement of Investments. Only the variation margin receivable/ payable at period end is separately reported within the Statement of Assets and Liabilities. Prior variation margin movements were recorded to cash upon receipt or payment.
For the period ended June 30, 2019, the effect of derivative contracts in the Statement of Operations was as follows:
| | | | | | | | | | | | | | | | |
Derivative Contracts
Not Accounted for as
Hedging Instruments | | Statement of
Operations Location | | Net Realized
Gain (Loss) for
the Period | | | | | | Statement of
Operations Location | | Net Change in
Unrealized
Appreciation
(Depreciation)
for the Period | |
| | | | | |
| | Net realized gain (loss) from: | | | | | | | | | | Net change in unrealized appreciation (depreciation) on: | | | | |
| | | | | |
Foreign exchange contracts | | Forward exchange contracts | | | $1,799,809 | | | | | | | Forward exchange contracts | | | $198,721 | |
| | | | | |
| | Futures contracts | | | 825,508 | | | | | | | Futures contracts | | | (97,085) | |
| | | | | | | | | | | | | | | | |
Totals | | | | | $2,625,317 | | | | | | | | | | $101,636 | |
| | | | | | | | | | | | | | | | |
For the period ended June 30, 2019, the average month end notional amount of futures contracts represented $37,798,371. The average month end contract value of forward exchange contracts was $89,235,299.
See Note 1(c) regarding derivative financial instruments.
FRANKLIN TEMPLETON VARIABLE INSURANCE PRODUCTS TRUST
FINANCIAL STATEMENTS
Franklin Mutual Global Discovery VIP Fund(continued)
11. Credit Facility
The Fund, together with other U.S. registered and foreign investment funds (collectively, Borrowers), managed by Franklin Templeton, are borrowers in a joint syndicated senior unsecured credit facility totaling $2 billion (Global Credit Facility) which matures on February 7, 2020. This Global Credit Facility provides a source of funds to the Borrowers for temporary and emergency purposes, including the ability to meet future unanticipated or unusually large redemption requests.
Under the terms of the Global Credit Facility, the Fund shall, in addition to interest charged on any borrowings made by the Fund and other costs incurred by the Fund, pay its share of fees and expenses incurred in connection with the implementation and maintenance of the Global Credit Facility, based upon its relative share of the aggregate net assets of all of the Borrowers, including an annual commitment fee of 0.15% based upon the unused portion of the Global Credit Facility. These fees are reflected in other expenses in the Statement of Operations. During the period ended June 30, 2019, the Fund did not use the Global Credit Facility.
12. Fair Value Measurements
The Fund follows a fair value hierarchy that distinguishes between market data obtained from independent sources (observable inputs) and the Fund’s own market assumptions (unobservable inputs). These inputs are used in determining the value of the Fund’s financial instruments and are summarized in the following fair value hierarchy:
| | • | Level 1 – quoted prices in active markets for identical financial instruments |
| | • | Level 2 – other significant observable inputs (including quoted prices for similar financial instruments, interest rates, prepayment speed, credit risk, etc.) |
| | • | Level 3 – significant unobservable inputs (including the Fund’s own assumptions in determining the fair value of financial instruments) |
The input levels are not necessarily an indication of the risk or liquidity associated with financial instruments at that level.
A summary of inputs used as of June 30, 2019, in valuing the Fund’s assets and liabilities carried at fair value, is as follows:
| | | | | | | | | | | | | | | | |
| | | Level 1 | | | Level 2 | | | Level 3 | | | Total | |
| |
| | | | |
| Assets: | | | | | | | | | | | | | | | | |
Investments in Securities:a | | | | | | | | | | | | | | | | |
Equity Investments:b | | | | | | | | | | | | | | | | |
Auto Components | | $ | 1,821,059 | | | $ | — | | | $ | 10,890 | | | $ | 1,831,949 | |
Media | | | 27,264,698 | | | | — | | | | 1,405,153 | | | | 28,669,851 | |
All Other Equity Investments | | | 504,069,443 | | | | — | | | | — | | | | 504,069,443 | |
Corporate Notes | | | — | | | | 5,004,450 | | | | — | | | | 5,004,450 | |
Corporate Bonds and Notes in Reorganization | | | — | | | | 771,141 | | | | — | c | | | 771,141 | |
Companies in Liquidation | | | — | | | | 8,869 | | | | — | c | | | 8,869 | |
Short Term Investments | | | 21,950,226 | | | | 4,400,000 | | | | — | | | | 26,350,226 | |
| | | | |
| | | | |
Total Investments in Securities | | $ | 555,105,426 | | | $ | 10,184,460 | | | $ | 1,416,043 | | | $ | 566,705,929 | |
| | | | |
Other Financial Instruments: | | | | | | | | | | | | | | | | |
Futures Contracts | | $ | 10,422 | | | $ | — | | | $ | — | | | $ | 10,422 | |
Forward Exchange Contracts | | | — | | | | 69,068 | | | | — | | | | 69,068 | |
| | | | |
| | | | |
Total Other Financial Instruments | | $ | 10,422 | | | $ | 69,068 | | | $ | — | | | $ | 79,490 | |
| | | | |
FRANKLIN TEMPLETON VARIABLE INSURANCE PRODUCTS TRUST
FINANCIAL STATEMENTS
Franklin Mutual Global Discovery VIP Fund(continued)
12. Fair Value Measurements(continued)
| | | | | | | | | | | | | | | | |
| | | Level 1 | | | Level 2 | | | Level 3 | | | Total | |
| |
| | | | |
| Liabilities: | | | | | | | | | | | | | | | | |
Other Financial Instruments: | | | | | | | | | | | | | | | | |
Securities Sold Short | | $ | 1,428,525 | | | $ | — | | | $ | — | | | $ | 1,428,525 | |
Futures Contracts | | | 80,476 | | | | — | | | | — | | | | 80,476 | |
Forward Exchange Contracts | | | — | | | | 1,047,158 | | | | — | | | | 1,047,158 | |
| | | | |
| | | | |
Total Other Financial Instruments | | $ | 1,509,001 | | | $ | 1,047,158 | | | $ | — | | | $ | 2,556,159 | |
| | | | |
aFor detailed categories, see the accompanying Statement of Investments.
bIncludes common and preferred stocks as well as other equity interests.
cIncludes securities determined to have no value at June 30, 2019.
A reconciliation of assets in which Level 3 inputs are used in determining fair value is presented when there are significant Level 3 financial instruments at the beginning and/or end of the period.
13. Subsequent Events
The Fund has evaluated subsequent events through the issuance of the financial statements and determined that no events have occurred that require disclosure.
Abbreviations
| | | | | | | | | | |
| Counterparty | | Currency | | Selected Portfolio |
| | | | | |
BOFA | | Bank of America Corp. | | EUR | | Euro | | ADR | | American Depositary Receipt |
HSBK | | HSBC Bank PLC | | GBP | | British Pound | | FHLB | | Federal Home Loan Bank |
SSBT | | State Street Bank and Trust Co., N.A. | | USD | | United States Dollar | | | | |
UBSW | | UBS AG | | | | | | | | |
Franklin Mutual Shares VIP Fund
This semiannual report for Franklin Mutual Shares VIP Fund covers the period ended June 30, 2019.
Class 2 Performance Summary as of June 30, 2019
The Fund’s Class 2 Shares posted a +13.33% total return* for thesix-month period ended June 30, 2019.
*The Fund has a fee waiver associated with any investment it makes in a Franklin Templeton money fund and/or other Franklin Templeton fund, contractually guaranteed through 4/30/20. Fund investment results reflect the fee waiver; without these reductions, the results would have been lower.
Performance reflects the Fund’s Class 2 operating expenses, but doesnotinclude any contract fees, expenses or sales charges. If they had been included, performance would be lower. These charges and deductions, particularly for variable life policies, can have a significant effect on contract values and insurance benefits. See the contract prospectus for a complete description of these expenses, including sales charges.
Performance data represent past performance, which does not guarantee future results. Investment return and principal value will fluctuate, and you may have a gain or loss when you sell your shares. Current performance may differ from figures shown.
FRANKLIN MUTUAL SHARES VIP FUND
Fund Goal and Main Investments
The Fund seeks capital appreciation, with income as a secondary goal, by investing primarily in equity securities of companies the Fund’s investment manager believes are available at market prices less than their intrinsic value. The equity securities in which the Fund invests are primarily common stock. To a lesser extent, the Fund also invests in merger arbitrage securities and the debt and equity of distressed companies. The Fund may invest up to 35% of its assets in foreign securities, which may include sovereign debt and participations in foreign government debt.
Fund Risks
All investments involve risks, including possible loss of principal. Value securities may not increase in price as anticipated or may decline further in value. The Fund’s investments in foreign securities involve more risks than investing in U.S. securities, including currency exchange rates and policies, country or government specific issues, less favorable trading practices regulation and greater price volatility. Securities issued by smaller and midsize companies may be more volatile in price than those of larger companies, involve substantial risks and should be considered speculative. Derivatives involve costs and can create economic leverage in the Fund’s portfolio which may result in significant volatility and cause the Fund to participate in losses (as well as gains) in an amount that exceeds the Fund’s initial investment. The Fund may also invest in companies engaged in mergers, reorganizations or liquidations, which involve special risks as pending deals may not be completed on time or on favorable terms, as well as lower-rated bonds, which entail higher credit risk. To the extent that the Fund focuses on particular countries, regions, industries, sectors or types of investment from time to time, the Fund may be subject to greater risks of adverse developments in such areas of focus than a fund that invests in a wider variety of countries, regions, industries, sectors or investments. The Fund is actively managed but there is no guarantee that the manager’s investment decisions will produce the desired results. The Fund’s prospectus also includes a description of the main investment risks.
Geographic Composition*
Based on Total Net Assets as of 6/30/19
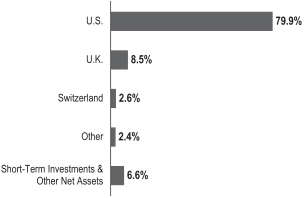
*Figures are stated as a percentage of total and may not equal 100% or may be negative due to rounding, use of any derivatives, unsettled trades or other factors.
Performance Overview
You can find the Fund’ssix-month total return in the Performance Summary. In comparison, the Fund’s benchmark, the Standard & Poor’s® 500 Index (S&P 500®), posted a +18.54% total return for the period under review.1
Economic and Market Overview
The global economy expanded during the six months ended June 30, 2019, despite weakness in certain regions. Global developed and emerging market stocks were aided by upbeat economic data in some regions, encouraging corporate earnings reports and periods of optimism about a potential U.S.-China trade deal. Further supporting markets were the U.S. Federal Reserve’s (Fed’s) patient approach to its monetary policy in 2019 and recent indication it will act as appropriate to sustain U.S. economic expansion.
However, markets reflected concerns about political uncertainties in the U.S. and the European Union, geopolitical risks in certain regions, and the impact of U.S. trade disputes with China and other trading partners on global growth and corporate earnings. In this environment, global developed and emerging market stocks, as measured by the MSCI All Country World Index, posted a +16.60% total return for thesix-month period.1
The U.S. economy grew during the six months ended June 30, 2019. After moderating for two consecutive
1. Source: Morningstar. One cannot invest directly in an index, and an index is not representative of the Fund’s portfolio. Please see Index Descriptions following the Fund Summaries.
The dollar value, number of shares or principal amount, and names of all portfolio holdings are listed in the Fund’s Statement of Investments (SOI).
FRANKLIN MUTUAL SHARES VIP FUND
quarters, the economy grew significantly faster in 2019’s first quarter, driven by growth in consumer spending, inventory investment, exports, business investment, and state and local government spending. However, the economy moderated again in the second quarter, due to weakness in inventory investment, exports, business investment and housing investment. The unemployment rate decreased from 3.9% in December 2018 to 3.7% atperiod-end.2 The annual inflation rate, as measured by the Consumer Price Index, decreased from 1.9% in December 2018 to 1.6% atperiod-end.2
The Fed held its target range for the federal funds rate unchanged, at 2.25%–2.50%, during the reporting period. In March, the Fed mentioned it would end its balance sheet normalization program by the end of September 2019. In June, the Fed indicated increased uncertainties around its views on economic activity and the labor market. With market-based inflation measures remaining low recently, the market has interpreted the Fed’s recent statements to mean it will likely cut rates in 2019’s second half to foster continued economic growth while attempting to achieve its inflation objective.
In Europe, the U.K.’s quarterly gross domestic product (GDP) growth accelerated in 2019’s first quarter. The Bank of England left its key policy rate unchanged during the period. The eurozone’s quarterly GDP accelerated in 2019’s first quarter. However, the bloc’s annual inflation rate decreased during the period. The European Central Bank (ECB) kept its benchmark interest rate unchanged during the period. In June, the ECB mentioned it would leave interest rates unchanged through the first half of 2020, provided details of its new stimulus, and indicated its openness to cut rates or increase stimulus.
In Asia, Japan’s quarterly GDP growth accelerated in 2019’s first quarter. In June, the Bank of Japan also left its benchmark interest rate unchanged, while continuing its stimulus measures, and expressed its openness to cut interest rates or increase stimulus.
In larger emerging markets, Brazil’s quarterly GDP growth contracted in 2019’s first quarter. The Central Bank of Brazil left its benchmark interest rate unchanged during the period. Russia’s annual GDP growth moderated in 2019’s first quarter. The Bank of Russia cut its key rate once during the period. China’s annual GDP growth rate stabilized in 2019’s first quarter. The People’s Bank of China left its benchmark interest rate unchanged, but it took measures to improve
Top 10 Sectors/Industries
6/30/19
| | | | |
| | | % of Total
Net Assets | |
| |
Banks | | | 10.6% | |
| |
Oil, Gas & Consumable Fuels | | | 9.9% | |
| |
Insurance | | | 8.1% | |
| |
Pharmaceuticals | | | 6.9% | |
| |
Media | | | 6.7% | |
| |
Health Care Equipment & Supplies | | | 3.8% | |
| |
Technology Hardware, Storage & Peripherals | | | 3.5% | |
| |
Entertainment | | | 2.8% | |
| |
Tobacco | | | 2.6% | |
| |
Software | | | 2.6% | |
| |
financial liquidity to mitigate the effects of the U.S.-China trade dispute and support economic growth. Overall, global emerging market stocks, as measured by the MSCI Emerging Markets Index, posted a +10.78% total return during thesix-month period.1
Investment Strategy
At Franklin Mutual Advisors, we are committed to our distinctive value approach to investing. Our major investment strategy is investing in undervalued stocks. When selecting undervalued equities, we are attracted to what we believe are fundamentally strong companies with healthy balance sheets, high-quality assets, substantial free cash flow and shareholder-oriented management teams and whose stocks are trading at discounts to our assessment of the companies’ intrinsic or business value. We also look for asset-rich companies whose shares may be trading at depressed levels due to concerns over short-term earnings disappointments, litigation, management strategy or other perceived negatives. While the vast majority of our undervalued equity investments are made in publicly traded companies globally, we may invest occasionally in privately held companies as well.
We complement this more traditional investment strategy with two others. One is distressed investing, which is complex and can take many forms. The most common distressed investment the Fund undertakes is the purchase of financially troubled or bankrupt companies’ debt at a substantial discount to face value. After the financially distressed company is reorganized, often in bankruptcy court, the old debt is typically replaced with new securities issued by the financially stronger company.
2. Source: U.S. Bureau of Labor Statistics.
FRANKLIN MUTUAL SHARES VIP FUND
The other piece of our investment strategy is participating in arbitrage situations, another highly specialized field. When companies announce proposed mergers or takeovers, commonly referred to as “deals,” the target company may trade at a discount to the bid it ultimately accepts. One form of arbitrage involves purchasing the target company’s stock when it is trading below the value we believe it would receive in a deal. In keeping with our commitment to a relatively conservative investment approach, we typically focus our arbitrage efforts on announced deals, and eschew rumored deals or other situations we consider relatively risky.
In addition, it is our practice to hedge the Fund’s currency exposure when we deem it advantageous for our shareholders.
What is meant by “hedge”?
To hedge an investment is to take a position intended to offset potential losses/gains that may be incurred by a companion financial instrument.
Manager’s Discussion
Franklin Mutual Series has long analyzed companies in many ways beyond just looking at the numbers. We analyze the way a company is run and how decisions are made at the executive and board levels. We look at the sustainability of a company, including the relationships with employees and customers, as well as the environmental impacts of a company’s business. In many ways this is common sense. A company that takes advantage of customers and unsustainably produces environmental waste is worth less than one that does not do these things. Similarly, a company that iswell-run and responsive to shareholders is worth more than one whose executives manage the company for their private benefit. However, disclosure has been limited on many relevant issues, and there are disagreements about which things should be measured and how they should be measured.
This type of analysis is labeled ESG analysis, where ESG stands for environmental, social, and governance factors. Many firms, including Franklin Templeton, are incorporating ESG factors in their investment research. In addition, there are other bodies such as the Sustainable Accounting Standards Board that are working on standardizing metrics for companies and industries to improve their reporting on these factors, particularly in the environmental and social areas. As a result, ESG analysis is improving across the market, and Franklin Mutual Series analysts are better able to analyzenon-traditional factors, including greenhouse gas emissions, water consumption, energy usage, talent
management, diversity and inclusion, executive compensation, and enterprise risk management, to name a few. ESG investing should not be confused with social or exclusionary types of investing, but should rather be viewed as an additional tool analysts and portfolio managers use in the investment process to identify and measurenon-traditional, potential business risks and opportunities at a company.
Today, Franklin Mutual Series analysts review and analyze ESG reports produced by third parties or the companies themselves to assess potential risks that could have an impact on shareholder value. In addition, we have discussions with management teams around ESG risks, how they deal with them and the potential impact on stakeholders. Our discussions have included issues such as water consumption in mining, the impact of changing carbon dioxide emission standards on the automotive industry and discussions with boards and management teams around management pay. Although more work needs to be done to standardize data from companies within industries so that comparisons can be relevant, the identification and discussion of ESG risk factors is an input we consider in helping frame the potential negative events individual companies or industries may face. In our view, solid ESG ratings are an output of fundamentally good business practices, not an input. As the data and information regarding ESG risk factors continue to evolve, we believe the increased information will highlight additional risk factors to enterprises and help us make more informed investment decisions going forward.
Mergers and Acquisitions
Merger and acquisition (M&A) activity remained healthy in the first half of 2019. The health care sector led the way, with pharmaceuticals megamergers among the biggest transactions. The pending acquisitions of Celgene and Allergan (not a Fund holding), each worth almost $90 billion, exemplify this strength. Large deals have also been announced in the defense, oil and gas exploration and production, and diversified financial services industries, underlying the broad strength of the M&A boom. In addition, U.S. and foreign regulators appear to be more amenable to deals, leading markets to expect fewer regulatory surprises. We are closely monitoring the U.S.-China trade conflict, becauseflare-ups could potentially impact pending and future deals. We expect M&A activity to remain strong for as long as the equity markets remain strong, as has been the historical pattern.
FRANKLIN MUTUAL SHARES VIP FUND
Credit Markets
Opportunities to invest in mispriced risk across global fixed income markets remained limited in the first half of 2019. The low interest-rate environment kept credit widely available, and default rates are still at historically low levels. Debt covenant terms, which include restrictions on the borrower’s financial activities, remain loose or nonexistent. In such an environment, we believe it is prudent to focus our efforts on investing in short-term mispriced risk and catalyst-driven credit opportunities.
On the restructuring side, Cumulus Media and iHeartMedia, two long-term distressed credit positions, emerged from bankruptcy or had reached a confirmable restructuring agreement in 2018, reducing further the purely distressed portion of the credit holdings within the Funds. PG&E, which recently filed for bankruptcy, became a new distressed credit position. Furthermore, Windstream Services became a new distressed credit position after parent company Windstream Holdings and its subsidiaries filed for bankruptcy. We are hopeful more opportunities may emerge as the business and economic cycles elongate amid persistent uncertainties. We will continue to seek to invest across the capital structures of companies that avail themselves of opportunities to bolster liquidity through internally generated free cash flow and corporate actions, including asset sales and debt refinancing.
Fund Performance
Turning to Fund performance, top positive contributors included Charter Communications, American International Group and Walt Disney.
In late January, U.S.-based Charter Communications, a telecommunications and mass media company, reported quarterly earnings, revenues and free cash flow that topped market expectations. Charter also estimated that 2019 capital spending and operating costs per customer could likely be lower than 2018, providing a boost to operating margins. In our view, Charter’s integration plan following the 2016 acquisition of Time Warner Cable is starting to produce positive results.
Shares of American International Group (AIG), a U.S.-based insurer, rose following its fiscal first-quarter 2019 earnings release in May, which indicated a stabilization in its business. AIG has been repositioning itself to focus on writing more profitable business and reducing its overall risk exposure. As a result, the insurer expects to report an underwriting profit for its full fiscal year.
Top 10 Holdings
6/30/19
| | |
| |
Company
Sector/Industry, Country | | % of Total
Net Assets |
| |
Medtronic PLC Health Care Equipment & Supplies, U.S. | | 3.8% |
| |
The Walt Disney Co. Entertainment, U.S. | | 2.8% |
| |
Novartis AG Pharmaceuticals, Switzerland | | 2.6% |
| |
Charter Communications Inc. Media, U.S. | | 2.6% |
| |
JPMorgan Chase & Co. Banks, U.S. | | 2.4% |
| |
American International Group Inc. Insurance, U.S. | | 2.3% |
| |
Royal Dutch Shell PLC Oil, Gas & Consumable Fuels, U.K. | | 2.0% |
| |
Alleghany Corp. Insurance, U.S. | | 1.9% |
| |
Citigroup Inc. Banks, U.S. | | 1.9% |
| |
Wells Fargo & Co. Banks, U.S. | | 1.8% |
The stock of U.S.-based diversified international family entertainment and media enterprise Walt Disney surged following an investor event outlining the strategy and expectations for its new streaming service. The breadth and depth of content, the price point, and the technology and user interface supporting it have increased optimism about the service. Market expectations for the service’s growth and profitability rose significantly on the back of this event.
During the period under review, Fund investments that detracted from performance included Kroger, Walgreens Boots Alliance and CVS Health.
U.S.-based grocery retailer Kroger reported weaker-than-expected quarterly revenues and earnings per share (EPS), and its 2019 EPS guidance was below the consensus estimate. Investments, stronger growth in its lower-margin specialty pharmacy business and the opening of a new warehouse caused a decline in Kroger’s gross margin. In our view, the immediate stock price decline was an overreaction, but earnings announcements can be high volatility events, as a small change in the margin has a significant effect on earnings.
Shares of U.S.-based Walgreens Boots Alliance did not keep up with the market rebound in January and February. In
FRANKLIN MUTUAL SHARES VIP FUND
March, the stock price fell when the chief financial officer cited negative industry trends in drug prices and pharmacy benefit manager (PBM) reimbursement rates, as well as the company’s limited success offsetting those challenges by increasing its volume of drug sales or renegotiating with PBMs. These pressures and weakness in both its U.S. and U.K. stores resulted in a cut to full-year guidance in April. However, Walgreens is reducing costs throughout the enterprise, and within the front end of the store, it is attempting to reduce exposure to lower margin categories, which we believe can help boost growth and profitability over the longer term.
In January, the chief executive officer of U.S.-based CVS Health, an integrated pharmacy health care provider, highlighted probable headwinds for 2019, and in February the company detailed the financial drag from those headwinds. Possible negative factors included: higher costs from increased investments in its workforce, which could have a year-over-year drag on earnings through the first half of 2019; greater price competition in nursing care; and lower-than-expected branded drug price increases.
During the period, the Fund held currency forwards and futures seeking to hedge most of the currency risk of the portfolio’snon-U.S. dollar investments. The hedges had a positive overall impact on the Fund’s performance because of the appreciation of the U.S. dollar versus the hedged currencies.
|
What is a currency forward? A currency forward is a direct agreement between the Fund and a counterparty to buy or sell a foreign currency in exchange for another currency at a specific exchange rate on a future date. |
|
What is a future? A future is an agreement between the Fund and a counterparty made through a U.S. or foreign futures exchange to buy or sell an underlying instrument or asset at a specific price on a future date. |
Thank you for your participation in Franklin Mutual Shares VIP Fund. We look forward to serving your future investment needs.
The foregoing information reflects our analysis, opinions and portfolio holdings as of June 30, 2019, the end of the reporting period. The way we implement our main investment strategies and the resulting portfolio holdings may change depending on factors such as market and economic conditions. These opinions may not be relied upon as investment advice or an offer for a particular security. The information is not a complete analysis of every aspect of any market, country, industry, security or the Fund. Statements of fact are from sources considered reliable, but the investment manager makes no representation or warranty as to their completeness or accuracy. Although historical performance is no guarantee of future results, these insights may help you understand our investment management philosophy.
FRANKLIN MUTUAL SHARES VIP FUND
Class 2 Fund Expenses
As an investor in a variable insurance contract (Contract) that indirectly provides for investment in an underlying mutual fund, you can incur transaction and/or ongoing expenses at both the Fund level and the Contract Level: (1) transaction expenses can include sales charges (loads) on purchases, surrender fees, transfer fees and premium taxes; and (2) ongoing expenses can include management fees, distribution and service(12b-1) fees, contract fees, annual maintenance fees, mortality and expense risk fees and other fees and expenses. All mutual funds and Contracts have some types of ongoing expenses. The table below shows Fund-level ongoing expenses and can help you understand these costs and compare them with those of other mutual funds offered through the Contract. The table assumes a $1,000 investment held for the six months indicated. Please refer to the Fund prospectus for additional information on operating expenses.
Actual Fund Expenses
The table below provides information about the actual account values and actual expenses in the columns under the heading “Actual.” In these columns the Fund’s actual return, which includes the effect of ongoing Fund expenses but does not include the effect of ongoing Contract expenses, is used to calculate the “Ending Account Value.” You can estimate the Fund-level expenses you paid during the period by following these steps (ofcourse, your account value and expenses will differ from those in this illustration):Divide your account value by $1,000 (ifyour account had an $8,600 value, then $8,600÷ $1,000 = 8.6). Then multiply the result by the number under the headings “Actual” and “Fund-Level Expenses Paid During Period” (ifFund-Level Expenses Paid During Period were $ 7.50, then 8.6 x $ 7.50 = $64.50). In this illustration, the estimated expenses paid this period at the Fund level are $64.50.
Hypothetical Example for Comparison with Other Mutual Funds
Under the heading “Hypothetical” in the table, information is provided about hypothetical account values and hypothetical expenses based on the Fund’s actual expense ratio and an assumed rate of return of 5% per year before expenses, which is not the Fund’s actual return. This information may not be used to estimate the actual ending account balance or expenses you paid for the period, but it can help you compare ongoing costs of investing in the Fund with those of other mutual funds offered through the Contract. To do so, compare this 5% hypothetical example with the 5% hypothetical examples that appear in the shareholder reports of other funds offered through the Contract.
Please note that expenses shown in the table are meant to highlight ongoing costs at the Fund level only and do not reflect any ongoing expenses at the Contract level, or transaction expenses at either the Fund or Contract levels. In addition, while the Fund does not have transaction expenses, if the transaction and ongoing expenses at the Contract level were included, the expenses shown below would be higher. You should consult your Contract prospectus or disclosure document for more information.
| | | | | | | | | | | | | | | | | | |
| | | | | | | Actual
(actual return after expenses) | | | | Hypothetical
(5% annual return before expenses) | | | | |
Share Class | | Beginning
Account
Value 1/1/19 | | | | Ending
Account
Value 6/30/19 | | Fund-Level
Expenses
Paid During
Period
1/1/19–6/30/191,2 | | | | Ending
Account
Value 6/30/19 | | Fund-Level
Expenses
Paid During Period
1/1/19–6/30/191,2 | | | | Net
Annualized
Expense
Ratio2 |
Class 2 | | $1,000 | | | | $1,133.30 | | $5.02 | | | | $1,020.08 | | $4.76 | | | | 0.95% |
1. Expenses are equal to the annualized expense ratio for thesix-month period as indicated above—in the far right column—multiplied by the simple average account value over the period indicated, and then multiplied by 181/365 to reflect theone-half year period.
2. Reflects expenses after fee waivers and expense reimbursements. Does not include any ongoing expenses of the Contract for which the Fund is an investment option or acquired fund fees and expenses.
FRANKLIN TEMPLETON VARIABLE INSURANCE PRODUCTS TRUST
Financial Highlights
Franklin Mutual Shares VIP Fund
| | | | | | | | | | | | | | | | | | | | | | | | |
| | |
| | | Six Months Ended
June 30, 2019 (unaudited) | | | Year Ended December 31, | |
| | | 2018 | | | 2017 | | | 2016 | | | 2015 | | | 2014 | |
| | | | | | |
| Class 1 | | | | | | | | | | | | | | | | | | | | | | | | |
| | | | | | |
Per share operating performance (for a share outstanding throughout the period) | | | | | | | | | | | | | | | | | | | | | | | | |
| | | | | | |
Net asset value, beginning of period | | | $17.71 | | | | $20.71 | | | | $20.40 | | | | $19.48 | | | | $22.91 | | | | $21.92 | |
| | | | |
| | | | | | |
| Income from investment operationsa: | | | | | | | | | | | | | | | | | | | | | | | | |
| | | | | | |
Net investment incomeb | | | 0.23 | | | | 0.36 | | | | 0.49 | | | | 0.50 | | | | 0.44 | | | | 0.62c | |
| | | | | | |
Net realized and unrealized gains (losses) | | | 2.16 | | | | (2.04 | ) | | | 1.22 | | | | 2.56 | | | | (1.54 | ) | | | 1.01 | |
| | | | |
| | | | | | |
Total from investment operations | | | 2.39 | | | | (1.68 | ) | | | 1.71 | | | | 3.06 | | | | (1.10 | ) | | | 1.63 | |
| | | | |
| | | | | | |
| Less distributions from: | | | | | | | | | | | | | | | | | | | | | | | | |
| | | | | | |
Net investment income | | | — | | | | (0.55 | ) | | | (0.53 | ) | | | (0.46 | ) | | | (0.77 | ) | | | (0.52) | |
| | | | | | |
Net realized gains | | | — | | | | (0.77 | ) | | | (0.87 | ) | | | (1.68 | ) | | | (1.56 | ) | | | (0.12) | |
| | | | |
| | | | | | |
Total distributions | | | — | | | | (1.32 | ) | | | (1.40 | ) | | | (2.14 | ) | | | (2.33 | ) | | | (0.64) | |
| | | | |
| | | | | | |
Net asset value, end of period | | | $20.10 | | | | $17.71 | | | | $20.71 | | | | $20.40 | | | | $19.48 | | | | $22.91 | |
| | | | |
| | | | | | |
Total returnd | | | 13.50% | | | | (8.86)% | | | | 8.64% | | | | 16.35% | | | | (4.69)% | | | | 7.38% | |
| | | | | | |
| Ratios to average net assetse | | | | | | | | | | | | | | | | | | | | | | | | |
| | | | | | |
Expensesf,g | | | 0.70% | h | | | 0.71% | h | | | 0.72% | h | | | 0.72% | h | | | 0.73% | h | | | 0.73% | |
| | | | | | |
Expenses incurred in connection with securities sold short | | | 0.01% | | | | 0.01% | | | | —% | | | | 0.01% | | | | 0.02% | | | | 0.03% | |
| | | | | | |
Net investment income | | | 2.39% | | | | 1.77% | | | | 2.34% | | | | 2.57% | | | | 2.00% | | | | 2.83%c | |
| | | | | | |
| Supplemental data | | | | | | | | | | | | | | | | | | | | | | | | |
| | | | | | |
Net assets, end of period (000’s) | | | $304,684 | | | | $537,324 | | | | $653,700 | | | | $610,395 | | | | $643,438 | | | | $656,463 | |
| | | | | | |
Portfolio turnover rate | | | 20.04% | | | | 24.67% | | | | 18.32% | | | | 24.45% | | | | 19.88% | | | | 21.33% | |
aThe amount shown for a share outstanding throughout the period may not correlate with the Statement of Operations for the period due to the timing of sales and repurchases of the Fund’s shares in relation to income earned and/or fluctuating fair value of the investments of the Fund.
bBased on average daily shares outstanding.
cNet investment income per share includes approximately $0.23 per share related to income received in the form of special dividends in connection with certain Fund holdings. Excluding this amount, the ratio of net investment income to average net assets would have been 1.79%.
dTotal return does not include fees, charges or expenses imposed by the variable annuity and life insurance contracts for which Franklin Templeton Variable Insurance Products Trust serves as an underlying investment vehicle. Total return is not annualized for periods less than one year.
eRatios are annualized for periods less than one year.
fIncludes dividend and/or interest expense on securities sold short and security borrowing fees, if any. See below for the ratios of such expenses to average net assets for the periods presented. See Note 1(e).
gBenefit of expense reduction rounds to less than 0.01%.
hBenefit of waiver and payments by affiliates rounds to less than 0.01%.
| | | | |
| | | |
MS-8 | | Semiannual Report | The accompanying notes are an integral part of these financial statements. | | |
FRANKLIN TEMPLETON VARIABLE INSURANCE PRODUCTS TRUST
FINANCIAL HIGHLIGHTS
Franklin Mutual Shares VIP Fund(continued)
| | | | | | | | | | | | | | | | | | | | | | | | |
| | |
| | | Six Months Ended
June 30, 2019 (unaudited) | | | Year Ended December 31, | |
| | | 2018 | | | 2017 | | | 2016 | | | 2015 | | | 2014 | |
| | | | | | |
| Class 2 | | | | | | | | | | | | | | | | | | | | | | | | |
| | | | | | |
Per share operating performance (for a share outstanding throughout the period) | | | | | | | | | | | | | | | | | | | | | | | | |
| | | | | | |
Net asset value, beginning of period | | | $17.40 | | | | $20.36 | | | | $20.08 | | | | $19.20 | | | | $22.60 | | | | $21.63 | |
| | | | |
| | | | | | |
| Income from investment operationsa: | | | | | | | | | | | | | | | | | | | | | | | | |
| | | | | | |
Net investment incomeb | | | 0.20 | | | | 0.31 | | | | 0.43 | | | | 0.45 | | | | 0.38 | | | | 0.58c | |
| | | | | | |
Net realized and unrealized gains (losses) | | | 2.12 | | | | (2.00 | ) | | | 1.20 | | | | 2.52 | | | | (1.51 | ) | | | 0.97 | |
| | | | |
| | | | | | |
Total from investment operations | | | 2.32 | | | | (1.69 | ) | | | 1.63 | | | | 2.97 | | | | (1.13 | ) | | | 1.55 | |
| | | | |
| | | | | | |
Less distributions from: | | | | | | | | | | | | | | | | | | | | | | | | |
| | | | | | |
Net investment income | | | — | | | �� | (0.50 | ) | | | (0.48 | ) | | | (0.41 | ) | | | (0.71 | ) | | | (0.46) | |
| | | | | | |
Net realized gains | | | — | | | | (0.77 | ) | | | (0.87 | ) | | | (1.68 | ) | | | (1.56 | ) | | | (0.12) | |
| | | | |
| | | | | | |
Total distributions | | | — | | | | (1.27 | ) | | | (1.35 | ) | | | (2.09 | ) | | | (2.27 | ) | | | (0.58) | |
| | | | |
| | | | | | |
Net asset value, end of period | | | $19.72 | | | | $17.40 | | | | $20.36 | | | | $20.08 | | | | $19.20 | | | | $22.60 | |
| | | | |
| | | | | | |
Total returnd | | | 13.33% | | | | (9.07)% | | | | 8.35% | | | | 16.06% | | | | (4.94)% | | | | 7.12% | |
| | | | | | |
| Ratios to average net assetse | | | | | | | | | | | | | | | | | | | | | | | | |
| | | | | | |
Expensesf,g | | | 0.95% | h | | | 0.96% | h | | | 0.97% | h | | | 0.97% | h | | | 0.98% | h | | | 0.98% | |
| | | | | | |
Expenses incurred in connection with securities sold short | | | 0.01% | | | | 0.01% | | | | —% | | | | 0.01% | | | | 0.02% | | | | 0.03% | |
| | | | | | |
Net investment income | | | 2.14% | | | | 1.52% | | | | 2.09% | | | | 2.32% | | | | 1.75% | | | | 2.58%c | |
| | | | | | |
| Supplemental data | | | | | | | | | | | | | | | | | | | | | | | | |
| | | | | | |
Net assets, end of period (000’s) | | | $2,863,648 | | | | $2,516,834 | | | | $3,476,913 | | | | $3,621,358 | | | | $3,353,505 | | | | $4,218,342 | |
| | | | | | |
Portfolio turnover rate | | | 20.04% | | | | 24.67% | | | | 18.32% | | | | 24.45% | | | | 19.88% | | | | 21.33% | |
aThe amount shown for a share outstanding throughout the period may not correlate with the Statement of Operations for the period due to the timing of sales and repurchases of the Fund’s shares in relation to income earned and/or fluctuating fair value of the investments of the Fund.
bBased on average daily shares outstanding.
cNet investment income per share includes approximately $0.23 per share related to income received in the form of special dividends in connection with certain Fund holdings. Excluding this amount, the ratio of net investment income to average net assets would have been 1.54%.
dTotal return does not include fees, charges or expenses imposed by the variable annuity and life insurance contracts for which Franklin Templeton Variable Insurance Products Trust serves as an underlying investment vehicle. Total return is not annualized for periods less than one year.
eRatios are annualized for periods less than one year.
fIncludes dividend and/or interest expense on securities sold short and security borrowing fees, if any. See below for the ratios of such expenses to average net assets for the periods presented. See Note 1(e).
gBenefit of expense reduction rounds to less than 0.01%.
hBenefit of waiver and payments by affiliates rounds to less than 0.01%.
| | | | | | |
| | | |
| | The accompanying notes are an integral part of these financial statements. | Semiannual Report | | | MS-9 | |
FRANKLIN TEMPLETON VARIABLE INSURANCE PRODUCTS TRUST
FINANCIAL HIGHLIGHTS
Franklin Mutual Shares VIP Fund(continued)
| | | | | | | | | | | | | | | | | | | | | | | | |
| | |
| | | Six Months Ended
June 30, 2019 (unaudited) | | | Year Ended December 31, | |
| | | 2018 | | | 2017 | | | 2016 | | | 2015 | | | 2014 | |
| | | | | | |
| Class 4 | | | | | | | | | | | | | | | | | | | | | | | | |
| | | | | | |
Per share operating performance (for a share outstanding throughout the period) | | | | | | | | | | | | | | | | | | | | | | | | |
| | | | | | |
Net asset value, beginning of period | | | $17.55 | | | | $20.53 | | | | $20.23 | | | | $19.32 | | | | $22.72 | | | | $21.74 | |
| | | | |
| | | | | | |
Income from investment operationsa: | | | | | | | | | | | | | | | | | | | | | | | | |
| | | | | | |
Net investment incomeb | | | 0.19 | | | | 0.29 | | | | 0.41 | | | | 0.44 | | | | 0.36 | | | | 0.57c | |
| | | | | | |
Net realized and unrealized gains (losses) | | | 2.14 | | | | (2.02 | ) | | | 1.21 | | | | 2.53 | | | | (1.52 | ) | | | 0.96 | |
| | | | |
| | | | | | |
Total from investment operations | | | 2.33 | | | | (1.73 | ) | | | 1.62 | | | | 2.97 | | | | (1.16 | ) | | | 1.53 | |
| | | | |
| | | | | | |
| Less distributions from: | | | | | | | | | | | | | | | | | | | | | | | | |
| | | | | | |
Net investment income | | | — | | | | (0.48 | ) | | | (0.45 | ) | | | (0.38 | ) | | | (0.68 | ) | | | (0.43) | |
| | | | | | |
Net realized gains | | | — | | | | (0.77 | ) | | | (0.87 | ) | | | (1.68 | ) | | | (1.56 | ) | | | (0.12) | |
| | | | |
| | | | | | |
Total distributions | | | — | | | | (1.25 | ) | | | (1.32 | ) | | | (2.06 | ) | | | (2.24 | ) | | | (0.55) | |
| | | | |
| | | | | | |
Net asset value, end of period | | | $19.88 | | | | $17.55 | | | | $20.53 | | | | $20.23 | | | | $19.32 | | | | $22.72 | |
| | | | |
| | | | | | |
Total returnd | | | 13.28% | | | | (9.16)% | | | | 8.25% | | | | 15.94% | | | | (5.05)% | | | | 7.04% | |
| | | | | | |
| Ratios to average net assetse | | | | | | | | | | | | | | | | | | | | | | | | |
| | | | | | |
Expensesf,g | | | 1.05% | h | | | 1.06% | h | | | 1.07% | h | | | 1.07% | h | | | 1.08% | h | | | 1.08% | |
| | | | | | |
Expenses incurred in connection with securities sold short | | | 0.01% | | | | 0.01% | | | | —% | | | | 0.01% | | | | 0.02% | | | | 0.03% | |
| | | | | | |
Net investment income | | | 2.04% | | | | 1.42% | | | | 1.99% | | | | 2.22% | | | | 1.65% | | | | 2.48%c | |
| | | | | | |
| Supplemental data | | | | | | | | | | | | | | | | | | | | | | | | |
| | | | | | |
Net assets, end of period (000’s) | | | $116,018 | | | | $105,047 | | | | $122,942 | | | | $122,476 | | | | $130,978 | | | | $158,020 | |
| | | | | | |
Portfolio turnover rate | | | 20.04% | | | | 24.67% | | | | 18.32% | | | | 24.45% | | | | 19.88% | | | | 21.33% | |
aThe amount shown for a share outstanding throughout the period may not correlate with the Statement of Operations for the period due to the timing of sales and repurchases of the Fund’s shares in relation to income earned and/or fluctuating fair value of the investments of the Fund.
bBased on average daily shares outstanding.
cNet investment income per share includes approximately $0.23 per share related to income received in the form of special dividends in connection with certain Fund holdings. Excluding this amount, the ratio of net investment income to average net assets would have been 1.44%.
dTotal return does not include fees, charges or expenses imposed by the variable annuity and life insurance contracts for which Franklin Templeton Variable Insurance Products Trust serves as an underlying investment vehicle. Total return is not annualized for periods less than one year.
eRatios are annualized for periods less than one year.
fIncludes dividend and/or interest expense on securities sold short and security borrowing fees, if any. See below for the ratios of such expenses to average net assets for the periods presented. See Note 1(e).
gBenefit of expense reduction rounds to less than 0.01%.
hBenefit of waiver and payments by affiliates rounds to less than 0.01%.
| | | | |
| | | |
MS-10 | | Semiannual Report | The accompanying notes are an integral part of these financial statements. | | |
FRANKLIN TEMPLETON VARIABLE INSURANCE PRODUCTS TRUST
Statement of Investments, June 30, 2019 (unaudited)
Franklin Mutual Shares VIP Fund
| | | | | | | | | | |
| | | |
| | | Country | | Shares/
Units/
Warrants | | | Value | |
| | | |
Common Stocks and Other Equity Interests 89.5% | | | | | | | | | | |
Aerospace & Defense 1.9% | | | | | | | | | | |
BAE Systems PLC | | United Kingdom | | | 4,569,485 | | | $ | 28,748,147 | |
Huntington Ingalls Industries Inc. | | United States | | | 143,247 | | | | 32,193,331 | |
| | | | | | | | | | |
| | | |
| | | | | | | | | 60,941,478 | |
| | | | | | | | | | |
| | | |
Auto Components 0.1% | | | | | | | | | | |
The Goodyear Tire & Rubber Co. | | United States | | | 314,543 | | | | 4,812,508 | |
| a,b,cInternational Automotive Components Group Brazil LLC | | Brazil | | | 1,730,515 | | | | 44,436 | |
| | | | | | | | | | |
| | | |
| | | | | | | | | 4,856,944 | |
| | | | | | | | | | |
Automobiles 1.3% | | | | | | | | | | |
General Motors Co. | | United States | | | 1,118,830 | | | | 43,108,520 | |
| | | | | | | | | | |
| | | |
Banks 10.6% | | | | | | | | | | |
Barclays PLC | | United Kingdom | | | 9,360,305 | | | | 17,806,904 | |
Cadence Bancorp | | United States | | | 447,646 | | | | 9,311,037 | |
CIT Group Inc. | | United States | | | 705,826 | | | | 37,084,098 | |
Citigroup Inc. | | United States | | | 876,719 | | | | 61,396,632 | |
Citizens Financial Group Inc. | | United States | | | 1,649,366 | | | | 58,321,582 | |
Independent Bank Group Inc. | | United States | | | 133,712 | | | | 7,348,811 | |
JPMorgan Chase & Co. | | United States | | | 712,520 | | | | 79,659,736 | |
Synovus Financial Corp. | | United States | | | 451,377 | | | | 15,798,195 | |
Wells Fargo & Co. | | United States | | | 1,265,060 | | | | 59,862,639 | |
| | | | | | | | | | |
| | | |
| | | | | | | | | 346,589,634 | |
| | | | | | | | | | |
| | | |
Biotechnology 1.1% | | | | | | | | | | |
aCelgene Corp. | | United States | | | 401,188 | | | | 37,085,819 | |
| | | | | | | | | | |
| | | |
Building Products 1.5% | | | | | | | | | | |
Johnson Controls International PLC | | United States | | | 1,171,600 | | | | 48,398,796 | |
| | | | | | | | | | |
| | | |
Chemicals 0.0%† | | | | | | | | | | |
| a,b,dDow Corning Corp., Contingent Distribution | | United States | | | 100,000 | | | | 53,346 | |
| | | | | | | | | | |
| | | |
Communications Equipment 1.0% | | | | | | | | | | |
Cisco Systems Inc. | | United States | | | 611,364 | | | | 33,459,952 | |
| | | | | | | | | | |
| | | |
Construction & Engineering 0.6% | | | | | | | | | | |
Fluor Corp. | | United States | | | 584,682 | | | | 19,697,937 | |
| | | | | | | | | | |
| | | |
Consumer Finance 1.6% | | | | | | | | | | |
Ally Financial Inc. | | United States | | | 268,286 | | | | 8,314,183 | |
Capital One Financial Corp. | | United States | | | 492,885 | | | | 44,724,385 | |
| | | | | | | | | | |
| | | |
| | | | | | | | | 53,038,568 | |
| | | | | | | | | | |
| | | |
Containers & Packaging 1.5% | | | | | | | | | | |
International Paper Co. | | United States | | | 924,175 | | | | 40,035,261 | |
WestRock Co. | | United States | | | 283,171 | | | | 10,327,246 | |
| | | | | | | | | | |
| | | |
| | | | | | | | | 50,362,507 | |
| | | | | | | | | | |
| | | |
Diversified Financial Services 1.4% | | | | | | | | | | |
Voya Financial Inc. | | United States | | | 831,410 | | | | 45,976,973 | |
| | | | | | | | | | |
| | | |
Diversified Telecommunication Services 0.7% | | | | | | | | | | |
Koninklijke KPN NV | | Netherlands | | | 7,402,182 | | | | 22,720,961 | |
| | | | | | | | | | |
FRANKLIN TEMPLETON VARIABLE INSURANCE PRODUCTS TRUST
STATEMENT OF INVESTMENTS (UNAUDITED)
Franklin Mutual Shares VIP Fund(continued)
| | | | | | | | | | |
| | | |
| | | Country | | Shares/
Units/
Warrants | | | Value | |
| | | |
Common Stocks and Other Equity Interests(continued) | | | | | | | | | | |
Electrical Equipment 1.6% | | | | | | | | | | |
aSensata Technologies Holding PLC | | United States | | | 1,069,230 | | | $ | 52,392,270 | |
| | | | | | | | | | |
| | | |
Electronic Equipment, Instruments & Components 0.5% | | | | | | | | | | |
Corning Inc. | | United States | | | 493,869 | | | | 16,411,267 | |
| | | | | | | | | | |
Energy Equipment & Services 1.3% | | | | | | | | | | |
Baker Hughes a GE Co., A | | United States | | | 1,412,585 | | | | 34,791,968 | |
aMcDermott International Inc. | | United States | | | 699,157 | | | | 6,753,857 | |
| | | | | | | | | | |
| | | |
| | | | | | | | | 41,545,825 | |
| | | | | | | | | | |
| | | |
Entertainment 2.8% | | | | | | | | | | |
The Walt Disney Co. | | United States | | | 665,400 | | | | 92,916,456 | |
| | | | | | | | | | |
| | | |
Equity Real Estate Investment Trusts (REITs) 1.4% | | | | | | | | | | |
Alexander’s Inc. | | United States | | | 36,970 | | | | 13,689,991 | |
Vornado Realty Trust | | United States | | | 499,096 | | | | 31,992,054 | |
| | | | | | | | | | |
| | | |
| | | | | | | | | 45,682,045 | |
| | | | | | | | | | |
| | | |
Food & Staples Retailing 2.2% | | | | | | | | | | |
The Kroger Co. | | United States | | | 1,835,560 | | | | 39,850,007 | |
Walgreens Boots Alliance Inc. | | United States | | | 600,658 | | | | 32,837,973 | |
| | | | | | | | | | |
| | | |
| | | | | | | | | 72,687,980 | |
| | | | | | | | | | |
| | | |
Food Products 1.6% | | | | | | | | | | |
Archer-Daniels-Midland Co. | | United States | | | 412,167 | | | | 16,816,414 | |
The Kraft Heinz Co. | | United States | | | 1,105,600 | | | | 34,317,824 | |
| | | | | | | | | | |
| | | |
| | | | | | | | | 51,134,238 | |
| | | | | | | | | | |
| | | |
Health Care Equipment & Supplies 3.8% | | | | | | | | | | |
Medtronic PLC | | United States | | | 1,278,912 | | | | 124,553,240 | |
| | | | | | | | | | |
| | | |
Health Care Providers & Services 1.2% | | | | | | | | | | |
CVS Health Corp. | | United States | | | 739,861 | | | | 40,315,026 | |
| | | | | | | | | | |
| | | |
Household Durables 2.5% | | | | | | | | | | |
Lennar Corp., A | | United States | | | 567,800 | | | | 27,515,588 | |
Newell Brands Inc. | | United States | | | 2,363,717 | | | | 36,448,516 | |
Toll Brothers Inc. | | United States | | | 486,000 | | | | 17,797,320 | |
| | | | | | | | | | |
| | | |
| | | | | | | | | 81,761,424 | |
| | | | | | | | | | |
| | | |
Household Products 0.5% | | | | | | | | | | |
Energizer Holdings Inc. | | United States | | | 458,300 | | | | 17,708,712 | |
| | | | | | | | | | |
| | | |
Independent Power & Renewable Electricity Producers 0.6% | | | | | | | | | | |
Vistra Energy Corp. | | United States | | | 805,295 | | | | 18,231,879 | |
| | | | | | | | | | |
| | | |
Industrial Conglomerates 1.1% | | | | | | | | | | |
General Electric Co. | | United States | | | 3,334,300 | | | | 35,010,150 | |
| | | | | | | | | | |
| | | |
Insurance 8.1% | | | | | | | | | | |
aAlleghany Corp. | | United States | | | 92,388 | | | | 62,933,350 | |
American International Group Inc. | | United States | | | 1,385,096 | | | | 73,797,915 | |
aBrighthouse Financial Inc. | | United States | | | 190,912 | | | | 7,004,561 | |
Chubb Ltd. | | United States | | | 264,699 | | | | 38,987,516 | |
FRANKLIN TEMPLETON VARIABLE INSURANCE PRODUCTS TRUST
STATEMENT OF INVESTMENTS (UNAUDITED)
Franklin Mutual Shares VIP Fund(continued)
| | | | | | | | | | | | |
| | | |
| | | Country | | | Shares/
Units/
Warrants | | | Value | |
| | | |
Common Stocks and Other Equity Interests(continued) | | | | | | | | | | | | |
Insurance(continued) | | | | | | | | | | | | |
The Hartford Financial Services Group Inc. | | | United States | | | | 914,578 | | | $ | 50,960,286 | |
MetLife Inc. | | | United States | | | | 680,203 | | | | 33,785,683 | |
| | | | | | | | | | | | |
| | | |
| | | | | | | | | | | 267,469,311 | |
| | | | | | | | | | | | |
| | | |
IT Services 1.6% | | | | | | | | | | | | |
Cognizant Technology Solutions Corp., A | | | United States | | | | 816,570 | | | | 51,762,372 | |
| | | | | | | | | | | | |
| | | |
Machinery 0.8% | | | | | | | | | | | | |
CNH Industrial NV | | | United Kingdom | | | | 663,594 | | | | 6,803,241 | |
CNH Industrial NV, special voting | | | United Kingdom | | | | 1,844,814 | | | | 18,913,243 | |
| | | | | | | | | | | | |
| | | |
| | | | | | | | | | | 25,716,484 | |
| | | | | | | | | | | | |
| | | |
Media 6.7% | | | | | | | | | | | | |
aCharter Communications Inc., A | | | United States | | | | 213,013 | | | | 84,178,477 | |
aClear Channel Outdoor Holdings Inc. | | | United States | | | | 1,644,649 | | | | 7,762,743 | |
Comcast Corp., A | | | United States | | | | 1,246,900 | | | | 52,718,932 | |
aCumulus Media Inc., A | | | United States | | | | 51,866 | | | | 962,114 | |
aCumulus Media Inc., B | | | United States | | | | 84,765 | | | | 1,572,391 | |
aDiscovery Inc., C | | | United States | | | | 1,137,473 | | | | 32,361,107 | |
aDISH Network Corp., A | | | United States | | | | 725,783 | | | | 27,877,325 | |
| a,b,ciHeartMedia Inc., A | | | United States | | | | 757,945 | | | | 11,001,789 | |
| a,b,ciHeartMedia Inc., B | | | United States | | | | 12,783 | | | | 185,549 | |
| | | | | | | | | | | | |
| | | |
| | | | | | | | | | | 218,620,427 | |
| �� | | | | | | | | | | | |
| | | |
Metals & Mining 0.0%† | | | | | | | | | | | | |
Warrior Met Coal Inc. | | | United States | | | | 21,563 | | | | 563,226 | |
| | | | | | | | | | | | |
| | | |
Oil, Gas & Consumable Fuels 9.9% | | | | | | | | | | | | |
Anadarko Petroleum Corp. | | | United States | | | | 783,170 | | | | 55,260,475 | |
BP PLC | | | United Kingdom | | | | 3,608,739 | | | | 25,141,888 | |
Kinder Morgan Inc. | | | United States | | | | 2,817,440 | | | | 58,828,147 | |
Marathon Oil Corp. | | | United States | | | | 2,720,801 | | | | 38,662,582 | |
Occidental Petroleum Corp. | | | United States | | | | 300,300 | | | | 15,099,084 | |
Plains All American Pipeline LP | | | United States | | | | 976,100 | | | | 23,768,035 | |
Royal Dutch Shell PLC, A (EUR Traded) | | | United Kingdom | | | | 1,247,949 | | | | 40,731,763 | |
Royal Dutch Shell PLC, A (GBP Traded) | | | United Kingdom | | | | 735,364 | | | | 24,023,947 | |
The Williams Cos. Inc. | | | United States | | | | 1,573,698 | | | | 44,126,492 | |
| | | | | | | | | | | | |
| | | |
| | | | | | | | | | | 325,642,413 | |
| | | | | | | | | | | | |
| | | |
Pharmaceuticals 6.9% | | | | | | | | | | | | |
Eli Lilly & Co. | | | United States | | | | 381,286 | | | | 42,242,676 | |
GlaxoSmithKline PLC | | | United Kingdom | | | | 2,872,766 | | | | 57,518,610 | |
Merck & Co. Inc. | | | United States | | | | 510,912 | | | | 42,839,971 | |
Novartis AG, ADR | | | Switzerland | | | | 932,181 | | | | 85,117,447 | |
| | | | | | | | | | | | |
| | | |
| | | | | | | | | | | 227,718,704 | |
| | | | | | | | | | | | |
FRANKLIN TEMPLETON VARIABLE INSURANCE PRODUCTS TRUST
STATEMENT OF INVESTMENTS (UNAUDITED)
Franklin Mutual Shares VIP Fund(continued)
| | | | | | | | | | | | |
| | | |
| | | Country | | | Shares/ Units/
Warrants | | | Value | |
| | | |
Common Stocks and Other Equity Interests(continued) | | | | | | | | | | | | |
Software 2.6% | | | | | | | | | | | | |
aAvaya Holdings Corp., wts., 12/15/22 | | | United States | | | | 91,551 | | | $ | 91,551 | |
aRed Hat Inc. | | | United States | | | | 187,800 | | | | 35,261,328 | |
Symantec Corp. | | | United States | | | | 2,301,161 | | | | 50,073,263 | |
| | | | | | | | | | | | |
| | | |
| | | | | | | | | | | 85,426,142 | |
| | | | | | | | | | | | |
| | | |
Specialty Retail 0.2% | | | | | | | | | | | | |
a,bTRU Kids Parent LLC | | | United States | | | | 2,039 | | | | 7,444,425 | |
| | | | | | | | | | | | |
| | | |
Technology Hardware, Storage & Peripherals 3.5% | | | | | | | | | | | | |
Hewlett Packard Enterprise Co. | | | United States | | | | 1,835,967 | | | | 27,447,707 | |
Samsung Electronics Co. Ltd. | | | South Korea | | | | 1,351,118 | | | | 54,888,366 | |
a,bWayne Services Legacy Inc. | | | United States | | | | 2,040 | | | | 713,354 | |
Western Digital Corp. | | | United States | | | | 672,700 | | | | 31,986,885 | |
| | | | | | | | | | | | |
| | | | | | | | | | | 115,036,312 | |
| | | | | | | | | | | | |
| | | |
Textiles, Apparel & Luxury Goods 1.1% | | | | | | | | | | | | |
PVH Corp. | | | United States | | | | 371,600 | | | | 35,168,224 | |
| | | | | | | | | | | | |
| | | |
Tobacco 2.6% | | | | | | | | | | | | |
Altria Group Inc. | | | United States | | | | 561,788 | | | | 26,600,662 | |
British American Tobacco PLC | | | United Kingdom | | | | 1,124,087 | | | | 39,242,916 | |
British American Tobacco PLC, ADR | | | United Kingdom | | | | 328,733 | | | | 11,462,920 | |
Imperial Brands PLC | | | United Kingdom | | | | 415,920 | | | | 9,754,753 | |
| | | | | | | | | | | | |
| | | | | | | | | | | 87,061,251 | |
| | | | | | | | | | | | |
| | | |
Wireless Telecommunication Services 1.1% | | | | | | | | | | | | |
aT-Mobile U.S. Inc. | | | United States | | | | 475,280 | | | | 35,237,259 | |
| | | | | | | | | | | | |
| | | |
Total Common Stocks and Other Equity Interests (Cost $2,280,498,565) | | | | | | | | | | | 2,939,508,497 | |
| | | | | | | | | | | | |
| | | |
| | | | | | Principal
Amount | | | | |
| | | | | | | | | | | | |
| | | |
Corporate Notes and Senior Floating Rate Interests 3.8% | | | | | | | | | | | | |
eBanff Merger Sub Inc., senior note, 144A, 9.75%, 9/01/26 | | | United States | | | $ | 18,444,000 | | | | 16,092,390 | |
Frontier Communications Corp., | | | | | | | | | | | | |
senior note, 10.50%, 9/15/22 | | | United States | | | | 22,633,000 | | | | 15,447,022 | |
senior note, 11.00%, 9/15/25 | | | United States | | | | 25,535,000 | | | | 15,959,375 | |
esenior secured note, first lien, 144A, 8.00%, 4/01/27 | | | United States | | | | 6,148,000 | | | | 6,409,290 | |
eMcDermott Technology Americas Inc., senior note, 144A, 10.625%, 5/01/24 | | | United States | | | | 9,797,000 | | | | 9,184,687 | |
fVeritas U.S. Inc., | | | | | | | | | | | | |
Term Loan B1, 6.902%,(1-month USD LIBOR + 4.50%), 1/27/23 | | | United States | | | | 14,529,546 | | | | 13,221,887 | |
Term Loan B1, 6.83%,(3-month USD LIBOR + 4.50%), 1/27/23 | | | United States | | | | 2,883,961 | | | | 2,624,405 | |
eVeritas U.S. Inc./Veritas Bermuda Ltd., | | | | | | | | | | | | |
senior note, 144A, 7.50%, 2/01/23 | | | United States | | | | 2,856,000 | | | | 2,684,640 | |
senior note, 144A, 10.50%, 2/01/24 | | | United States | | | | 23,445,000 | | | | 20,162,700 | |
FRANKLIN TEMPLETON VARIABLE INSURANCE PRODUCTS TRUST
STATEMENT OF INVESTMENTS (UNAUDITED)
Franklin Mutual Shares VIP Fund(continued)
| | | | | | | | | | |
| | | |
| | | Country | | Principal
Amount | | | Value | |
| | | |
Corporate Notes and Senior Floating Rate Interests(continued) | | | | | | | | | | |
| f,g Windstream Services LLC, | | | | | | | | | | |
hRevolving Commitment, 8.50%, (Prime + 3.00%), 4/24/20 | | United States | | $ | 17,758,664 | | | $ | 17,855,805 | |
iTerm Loan B6, TBD, 3/30/21 | | United States | | | 3,575,000 | | | | 3,686,719 | |
| | | | | | | | | | |
| | | |
Total Corporate Notes and Senior Floating Rate Interests
(Cost $138,839,979) | | | | | | | | | 123,328,920 | |
| | | | | | | | | | |
| | | |
Corporate Bonds and Notes in Reorganization 0.1% | | | | | | | | | | |
| b,c,jBroadband Ventures III LLC, secured promissory note, 5.00%, 2/01/12 | | United States | | | 1,754 | | | | — | |
| j Pacific Gas & Electric Co., | | | | | | | | | | |
senior bond, 4.45%, 4/15/42 | | United States | | | 991,000 | | | | 953,837 | |
senior bond, 3.75%, 8/15/42 | | United States | | | 1,549,000 | | | | 1,409,590 | |
senior bond, 4.00%, 12/01/46 | | United States | | | 1,755,000 | | | | 1,601,437 | |
senior bond, 3.95%, 12/01/47 | | United States | | | 822,000 | | | | 742,883 | |
| | | | | | | | | | |
| | | |
Total Corporate Bonds and Notes in Reorganization
(Cost $3,873,477) | | | | | | | | | 4,707,747 | |
| | | | | | | | | | |
| | | |
| | | | | Shares | | | | |
| | | | | | | | | | |
| | | |
Companies in Liquidation 0.0%† | | | | | | | | | | |
| a,b,dAvaya Holdings Corp., Contingent Distribution | | United States | | | 30,319,000 | | | | — | |
| a,b,dAvaya Inc., Contingent Distribution | | United States | | | 34,518,267 | | | | — | |
| a,b,dClear Channel Communications Inc., Contingent Distribution | | United States | | | 26,449,000 | | | | — | |
| a,b,diHeartCommunications Inc., Contingent Distribution | | United States | | | 45,914,872 | | | | — | |
| a,b,dTribune Media, Litigation Trust, Contingent Distribution | | United States | | | 398,509 | | | | — | |
| a,dVistra Energy Corp., Litigation Trust, Contingent Distribution | | United States | | | 90,618,406 | | | | 135,928 | |
| | | | | | | | | | |
| | | |
Total Companies in Liquidation (Cost $2,836,069) | | | | | | | | | 135,928 | |
| | | | | | | | | | |
| | | |
Total Investments before Short Term Investments
(Cost $2,426,048,090) | | | | | | | | | 3,067,681,092 | |
| | | | | | | | | | |
| | | |
| | | | | Principal
Amount | | | | |
| | | | | | | | | | |
| | | |
Short Term Investments 5.6% | | | | | | | | | | |
| | | |
U.S. Government and Agency Securities 5.6% | | | | | | | | | | |
| kFHLB, 7/01/19 | | United States | | $ | 47,300,000 | | | | 47,300,000 | |
| k U.S. Treasury Bill, | | | | | | | | | | |
7/02/19 - 9/05/19 | | United States | | | 111,300,000 | | | | 111,072,182 | |
l9/12/19 - 10/31/19 | | United States | | | 25,000,000 | | | | 24,862,728 | |
| | | | | | | | | | |
| | | |
Total U.S. Government and Agency Securities
(Cost $183,158,534) | | | | | | | | | 183,234,910 | |
| | | | | | | | | | |
| | | |
Total Investments (Cost $2,609,206,624) 99.0% | | | | | | | | | 3,250,916,002 | |
| | | |
Securities Sold Short (0.3)% | | | | | | | | | (8,471,380 | ) |
| | | |
Other Assets, less Liabilities 1.3% | | | | | | | | | 41,905,290 | |
| | | | | | | | | | |
| | | |
Net Assets 100.0% | | | | | | | | $ | 3,284,349,912 | |
| | | | | | | | | | |
FRANKLIN TEMPLETON VARIABLE INSURANCE PRODUCTS TRUST
STATEMENT OF INVESTMENTS (UNAUDITED)
Franklin Mutual Shares VIP Fund(continued)
| | | | | | | | |
| | | Country | | Shares | | Value | |
| | | |
m Securities Sold Short (Proceeds $8,965,066) (0.3)% | | | | | | | | |
Common Stocks (0.3)% | | | | | | | | |
Pharmaceuticals (0.3)% | | | | | | | | |
Bristol-Myers Squibb Co. | | United States | | 186,800 | | $ | (8,471,380 | ) |
| | | | | | | | |
†Rounds to less than 0.1% of net assets.
aNon-income producing.
bFair valued using significant unobservable inputs. See Note 12 regarding fair value measurements.
cSee Note 8 regarding restricted securities.
dContingent distributions represent the right to receive additional distributions, if any, during the reorganization of the underlying company. Shares represent total underlying principal of debt securities.
eSecurity was purchased pursuant to Rule 144A under the Securities Act of 1933 and may be sold in transactions exempt from registration only to qualified institutional buyers or in a public offering registered under the Securities Act of 1933. These securities have been deemed liquid under guidelines approved by the Trust’s Board of Trustees. At June 30, 2019, the aggregate value of these securities was $54,533,707, representing 1.7% of net assets.
fSee Note 1(g) regarding senior floating rate interests.
gA portion or all of the security purchased on a delayed delivery basis. See Note 1(c).
hSee Note 9 regarding unfunded loan commitments.
iA portion or all of the security represents an unsettled loan commitment. The coupon rate isto-be determined (TBD) at the time of settlement and will be based upon a reference index/floor plus a spread.
jSee Note 7 regarding credit risk and defaulted securities.
kThe security was issued on a discount basis with no stated coupon rate.
lA portion or all of the security has been segregated as collateral for securities sold short and open forward exchange contracts. At June 30, 2019, the aggregate value of these securities pledged amounted to $5,380,364, representing 0.2% of net assets.
mSee Note 1(e) regarding securities sold short.
At June 30, 2019, the Fund had the following futures contracts outstanding. See Note 1(d).
Futures Contracts
| | | | | | | | | | | | | | | | | | | | |
| | | | | |
| Description | | Type | | | Number of
Contracts | | | Notional
Amount* | | | Expiration
Date | | | Value/
Unrealized
Appreciation
(Depreciation) | |
| | | | | |
| Currency Contracts | | | | | | | | | | | | | | | | | | | | |
EUR/USD | | | Short | | | | 229 | | | | $32,765,606 | | | | 9/16/19 | | | | $(109,142 | ) |
GBP/USD | | | Short | | | | 765 | | | | 60,956,157 | | | | 9/16/19 | | | | 56,407 | |
| | | | | | | | | | | | | | | | | | | | |
| | | | | |
Total Futures Contracts | | | | | | | | | | | | | | | | | | | $ (52,735 | ) |
| | | | | | | | | | | | | | | | | | | | |
* As of period end.
FRANKLIN TEMPLETON VARIABLE INSURANCE PRODUCTS TRUST
STATEMENT OF INVESTMENTS (UNAUDITED)
Franklin Mutual Shares VIP Fund(continued)
At June 30, 2019, the Fund had the following forward exchange contracts outstanding. See Note 1(d).
Forward Exchange Contracts
| | | | | | | | | | | | | | | | | | | | | | | | | | | | |
| Currency | | Counterpartya | | | Type | | | Quantity | | | Contract
Amount | | | Settlement
Date | | | Unrealized
Appreciation | | | Unrealized
Depreciation | |
| | | | | | |
| OTC Forward Exchange Contracts | | | | | | | | | | | | | | | | | | | | | | | | | |
Euro | | | BOFA | | | | Sell | | | | 587,466 | | | $ | 667,291 | | | | 7/15/19 | | | | $ — | | | $ | (1,546 | ) |
Euro | | | HSBK | | | | Sell | | | | 21,658,181 | | | | 24,323,489 | | | | 7/15/19 | | | | — | | | | (334,589 | ) |
British Pound | | | BOFA | | | | Buy | | | | 157,956 | | | | 200,354 | | | | 7/16/19 | | | | 430 | | | | — | |
British Pound | | | BOFA | | | | Sell | | | | 63,991 | | | | 81,600 | | | | 7/16/19 | | | | 258 | | | | — | |
British Pound | | | HSBK | | | | Buy | | | | 187,200 | | | | 237,914 | | | | 7/16/19 | | | | 42 | | | | — | |
British Pound | | | HSBK | | | | Sell | | | | 178,615 | | | | 227,578 | | | | 7/16/19 | | | | 534 | | | | — | |
British Pound | | | SSBT | | | | Sell | | | | 17,334,745 | | | | 21,952,981 | | | | 7/16/19 | | | | — | | | | (81,792 | ) |
South Korean Won | | | HSBK | | | | Sell | | | | 31,925,416,946 | | | | 27,095,037 | | | | 7/19/19 | | | | — | | | | (516,206 | ) |
South Korean Won | | | UBSW | | | | Sell | | | | 29,550,452,054 | | | | 25,025,789 | | | | 7/19/19 | | | | — | | | | (531,425 | ) |
| | | | | | | | | | | | | | | | | | | | | | | | |
| | | | | | | |
Total Forward Exchange Contracts | | | | | | | | | | | | | | | | | | | | | | | $ 1,264 | | | $ | (1,465,558 | ) |
| | | | | | | | | | | | | | | | | | | | | | | | |
| | | | | | |
Net unrealized appreciation (depreciation) | | | | | | | | | | | | | | | | | | | | | | | $ | (1,464,294 | ) |
| | | | | | | | | | | | | | | | | | | | | | | | | | | | |
aMay be comprised of multiple contracts with the same counterparty, currency and settlement date.
See Note 10 regarding other derivative information.
See Abbreviations on pageMS-32.
| | | | | | |
| | | |
| | The accompanying notes are an integral part of these financial statements. | Semiannual Report | | | MS-17 | |
FRANKLIN TEMPLETON VARIABLE INSURANCE PRODUCTS TRUST
FINANCIAL STATEMENTS
Statement of Assets and Liabilities
June 30, 2019 (unaudited)
| | | | |
| |
| | | Franklin Mutual Shares VIP Fund | |
Assets: | | | | |
Investments in securities: | | | | |
Cost - Unaffiliated issuers | | | $2,609,206,624 | |
| | | | |
| |
Value - Unaffiliated issuers | | | $3,250,916,002 | |
Cash | | | 830,663 | |
Foreign currency, at value (cost $1,718,543) | | | 1,720,665 | |
Receivables: | | | | |
Investment securities sold | | | 25,916,323 | |
Capital shares sold | | | 6,955,157 | |
Dividends and interest | | | 8,765,960 | |
European Union tax reclaims | | | 1,574,871 | |
Deposits with brokers for: | | | | |
Securities sold short | | | 8,730,761 | |
Futures contracts | | | 2,184,290 | |
Unrealized appreciation on OTC forward exchange contracts | | | 1,264 | |
Unrealized appreciation on unfunded loan commitments (Note 9) | | | 8,701 | |
Other assets | | | 2,382 | |
| | | | |
| |
Total assets | | | 3,307,607,039 | |
| | | | |
Liabilities: | | | | |
Payables: | | | | |
Investment securities purchased | | | 8,418,647 | |
Capital shares redeemed | | | 1,204,757 | |
Management fees | | | 1,783,043 | |
Distribution fees | | | 1,259,915 | |
Trustees’ fees and expenses | | | 3,364 | |
Variation margin on futures contracts | | | 215,612 | |
Securities sold short, at value (proceeds $8,965,066) | | | 8,471,380 | |
Unrealized depreciation on OTC forward exchange contracts | | | 1,465,558 | |
Accrued expenses and other liabilities | | | 434,851 | |
| | | | |
| |
Total liabilities | | | 23,257,127 | |
| | | | |
| |
Net assets, at value | | | $3,284,349,912 | |
| | | | |
Net assets consist of: | | | | |
Paid-in capital | | | $2,200,881,043 | |
Total distributable earnings (loss) | | | 1,083,468,869 | |
| | | | |
| |
Net assets, at value | | | $3,284,349,912 | |
| | | | |
Class 1: | | | | |
Net assets, at value | | | $ 304,683,946 | |
| | | | |
Shares outstanding | | | 15,161,453 | |
| | | | |
Net asset value and maximum offering price per share | | | $20.10 | |
| | | | |
Class 2: | | | | |
Net assets, at value | | | $2,863,648,283 | |
| | | | |
Shares outstanding | | | 145,232,742 | |
| | | | |
Net asset value and maximum offering price per share | | | $19.72 | |
| | | | |
Class 4: | | | | |
Net assets, at value | | | $ 116,017,683 | |
| | | | |
Shares outstanding | | | 5,836,603 | |
| | | | |
Net asset value and maximum offering price per share | | | $19.88 | |
| | | | |
| | | | |
| | | |
MS-18 | | Semiannual Report | The accompanying notes are an integral part of these financial statements. | | |
FRANKLIN TEMPLETON VARIABLE INSURANCE PRODUCTS TRUST
FINANCIAL STATEMENTS
Statement of Operations
for the six months ended June 30, 2019 (unaudited)
| | | | |
| |
| | | Franklin Mutual
Shares VIP Fund | |
Investment income: | | | | |
Dividends: (net of foreign taxes)* | | | | |
Unaffiliated issuers | | | $40,366,610 | |
Interest: | | | | |
Unaffiliated issuers | | | 11,635,806 | |
Income from securities loaned: | | | | |
Unaffiliated issuers (net of fees and rebates) | | | 255,136 | |
Non-controlled affiliates (Note 3e) | | | 41,390 | |
| | | | |
| |
Total investment income | | | 52,298,942 | |
| | | | |
Expenses: | | | | |
Management fees (Note 3a) | | | 11,401,780 | |
Distribution fees: (Note 3c) | | | | |
Class 2 | | | 3,482,244 | |
Class 4 | | | 199,138 | |
Custodian fees (Note 4) | | | 45,773 | |
Reports to shareholders | | | 213,878 | |
Professional fees | | | 44,144 | |
Trustees’ fees and expenses | | | 13,682 | |
Dividends and interest on securities sold short | | | 111,132 | |
Other | | | 38,041 | |
| | | | |
| |
Total expenses | | | 15,549,812 | |
Expense reductions (Note 4) | | | (8,338 | ) |
Expenses waived/paid by affiliates (Note 3e) | | | (7,025 | ) |
| | | | |
| |
Net expenses | | | 15,534,449 | |
| | | | |
| |
Net investment income | | | 36,764,493 | |
| | | | |
Realized and unrealized gains (losses): | | | | |
Net realized gain (loss) from: | | | | |
Investments: | | | | |
Unaffiliated issuers | | | 46,873,629 | |
Realized gain distributions from REITs | | | 74,381 | |
Foreign currency transactions | | | 421,427 | |
Forward exchange contracts | | | 3,892,295 | |
Futures contracts | | | 1,483,344 | |
Securities sold short | | | (3,542,060 | ) |
| | | | |
| |
Net realized gain (loss) | | | 49,203,016 | |
| | | | |
Net change in unrealized appreciation (depreciation) on: | | | | |
Investments: | | | | |
Unaffiliated issuers | | | 339,610,302 | |
Translation of other assets and liabilities denominated in foreign currencies | | | (71,322 | ) |
Forward exchange contracts | | | (513,176 | ) |
Futures contracts | | | (216,727 | ) |
Securities sold short | | | (6,441,444 | ) |
| | | | |
| |
Net change in unrealized appreciation (depreciation) | | | 332,367,633 | |
| | | | |
| |
Net realized and unrealized gain (loss) | | | 381,570,649 | |
| | | | |
| |
Net increase (decrease) in net assets resulting from operations | | | $418,335,142 | |
| | | | |
| |
*Foreign taxes withheld on dividends | | | $ 956,323 | |
| | | | | | |
| | | |
| | The accompanying notes are an integral part of these financial statements. | Semiannual Report | | | MS-19 | |
FRANKLIN TEMPLETON VARIABLE INSURANCE PRODUCTS TRUST
FINANCIAL STATEMENTS
Statements of Changes in Net Assets
| | | | | | | | |
| | | Franklin Mutual Shares VIP Fund | |
| | |
| | | Six Months Ended
June 30, 2019
(unaudited) | | | Year Ended
December 31, 2018 | |
Increase (decrease) in net assets: | | | | | | | | |
Operations: | | | | | | | | |
Net investment income | | | $ 36,764,493 | | | | $ 60,982,102 | |
Net realized gain (loss) | | | 49,203,016 | | | | 308,792,402 | |
Net change in unrealized appreciation (depreciation) | | | 332,367,633 | | | | (689,920,400 | ) |
| | | | |
| | |
Net increase (decrease) in net assets resulting from operations | | | 418,335,142 | | | | (320,145,896 | ) |
| | | | |
| | |
Distributions to shareholders: | | | | | | | | |
Class 1 | | | — | | | | (37,929,843 | ) |
Class 2 | | | — | | | | (194,310,469 | ) |
Class 4 | | | — | | | | (7,177,027 | ) |
| | | | |
| | |
Total distributions to shareholders | | | — | | | | (239,417,339 | ) |
| | | | |
| | |
Capital share transactions: (Note 2) | | | | | | | | |
Class 1 | | | (306,195,412 | ) | | | (27,996,947 | ) |
Class 2 | | | 15,995,262 | | | | (506,425,142 | ) |
Class 4 | | | (2,989,597 | ) | | | (365,846 | ) |
| | | | |
| | |
Total capital share transactions | | | (293,189,747 | ) | | | (534,787,935 | ) |
| | | | |
| | |
Net increase (decrease) in net assets | | | 125,145,395 | | | | (1,094,351,170 | ) |
| | |
Net assets: | | | | | | | | |
Beginning of period | | | 3,159,204,517 | | | | 4,253,555,687 | |
| | | | |
| | |
End of period | | | $3,284,349,912 | | | | $ 3,159,204,517 | |
| | | | |
| | | | |
| | | |
MS-20 | | Semiannual Report | The accompanying notes are an integral part of these financial statements. | | |
FRANKLIN TEMPLETON VARIABLE INSURANCE PRODUCTS TRUST
Notes to Financial Statements (unaudited)
Franklin Mutual Shares VIP Fund
1. Organization and Significant Accounting Policies
Franklin Templeton Variable Insurance Products Trust (Trust) is registered under the Investment Company Act of 1940 (1940 Act) as anopen-end management investment company, consisting of eighteen separate funds and applies the specialized accounting and reporting guidance in U.S. Generally Accepted Accounting Principles (U.S. GAAP). Franklin Mutual Shares VIP Fund (Fund) is included in this report. Shares of the Fund are generally sold only to insurance company separate accounts to fund the benefits of variable life insurance policies or variable annuity contracts. The Fund offers three classes of shares: Class 1, Class 2 and Class 4. Each class of shares may differ by its distribution fees, voting rights on matters affecting a single class and its exchange privilege.
The following summarizes the Fund’s significant accounting policies.
a. Financial Instrument Valuation
The Fund’s investments in financial instruments are carried at fair value daily. Fair value is the price that would be received to sell an asset or paid to transfer a liability in an orderly transaction between market participants on the measurement date. The Fund calculates the net asset value (NAV) per share each business day as of 4 p.m. Eastern time or the regularly scheduled close of the New York Stock Exchange (NYSE), whichever is earlier. Under compliance policies and procedures approved by the Trust’s Board of Trustees (the Board), the Fund’s administrator has responsibility for oversight of valuation, including leading the cross-functional Valuation Committee (VC). The Fund may utilize independent pricing services, quotations from securities and financial instrument dealers, and other market sources to determine fair value.
Equity securities and derivative financial instruments listed on an exchange or on the NASDAQ National Market System are valued at the last quoted sale price or the official closing price of the day, respectively. Foreign equity securities are valued as of the close of trading on the foreign stock exchange on which the security is primarily traded, or as of 4 p.m. Eastern time. The value is then converted into its U.S. dollar equivalent at the foreign exchange rate in effect at 4 p.m. Eastern time on the day that the value of the security is determined.Over-the-counter (OTC) securities are valued within the range of the most recent quoted bid and ask prices. Securities that trade in multiple markets or on multiple
exchanges are valued according to the broadest and most representative market. Certain equity securities are valued based upon fundamental characteristics or relationships to similar securities.
Debt securities generally trade in the OTC market rather than on a securities exchange. The Fund’s pricing services use multiple valuation techniques to determine fair value. In instances where sufficient market activity exists, the pricing services may utilize a market-based approach through which quotes from market makers are used to determine fair value. In instances where sufficient market activity may not exist or is limited, the pricing services also utilize proprietary valuation models which may consider market characteristics such as benchmark yield curves, credit spreads, estimated default rates, anticipated market interest rate volatility, coupon rates, anticipated timing of principal repayments, underlying collateral, and other unique security features in order to estimate the relevant cash flows, which are then discounted to calculate the fair value.
Investments inopen-end mutual funds are valued at the closing NAV.
Certain derivative financial instruments trade in the OTC market. The Fund’s pricing services use various techniques including industry standard option pricing models and proprietary discounted cash flow models to determine the fair value of those instruments. The Fund’s net benefit or obligation under the derivative contract, as measured by the fair value of the contract, is included in net assets.
The Fund has procedures to determine the fair value of financial instruments for which market prices are not reliable or readily available. Under these procedures, the Fund primarily employs a market-based approach which may use related or comparable assets or liabilities, recent transactions, market multiples, book values, and other relevant information for the investment to determine the fair value of the investment. An income-based valuation approach may also be used in which the anticipated future cash flows of the investment are discounted to calculate fair value. Discounts may also be applied due to the nature or duration of any restrictions on the disposition of the investments. Due to the inherent uncertainty of valuations of such investments, the fair values may differ significantly from the values that would have been used had an active market existed.
FRANKLIN TEMPLETON VARIABLE INSURANCE PRODUCTS TRUST
NOTES TO FINANCIAL STATEMENTS (UNAUDITED)
Franklin Mutual Shares VIP Fund(continued)
1. Organization and Significant Accounting
Policies(continued)
a. Financial Instrument Valuation(continued)
Trading in securities on foreign securities stock exchanges and OTC markets may be completed before 4 p.m. Eastern time. In addition, trading in certain foreign markets may not take place on every Fund’s business day. Occasionally, events occur between the time at which trading in a foreign security is completed and 4 p.m. Eastern time that might call into question the reliability of the value of a portfolio security held by the Fund. As a result, differences may arise between the value of the Fund’s portfolio securities as determined at the foreign market close and the latest indications of value at 4 p.m. Eastern time. In order to minimize the potential for these differences, the VC monitors price movements following the close of trading in foreign stock markets through a series of country specific market proxies (such as baskets of American Depositary Receipts, futures contracts and exchange traded funds). These price movements are measured against established trigger thresholds for each specific market proxy to assist in determining if an event has occurred that may call into question the reliability of the values of the foreign securities held by the Fund. If such an event occurs, the securities may be valued using fair value procedures, which may include the use of independent pricing services.
When the last day of the reporting period is anon-business day, certain foreign markets may be open on those days that the Fund’s NAV is not calculated, which could result in differences between the value of the Fund’s portfolio securities on the last business day and the last calendar day of the reporting period. Any significant security valuation changes due to an open foreign market are adjusted and reflected by the Fund for financial reporting purposes.
b. Foreign Currency Translation
Portfolio securities and other assets and liabilities denominated in foreign currencies are translated into U.S. dollars based on the exchange rate of such currencies against U.S. dollars on the date of valuation. The Fund may enter into foreign currency exchange contracts to facilitate transactions denominated in a foreign currency. Purchases and sales of securities, income and expense items denominated in foreign currencies are translated into U.S. dollars at the exchange rate in effect on the transaction date. Portfolio securities and assets and liabilities denominated in
foreign currencies contain risks that those currencies will decline in value relative to the U.S. dollar. Occasionally, events may impact the availability or reliability of foreign exchange rates used to convert the U.S. dollar equivalent value. If such an event occurs, the foreign exchange rate will be valued at fair value using procedures established and approved by the Board.
The Fund does not separately report the effect of changes in foreign exchange rates from changes in market prices on securities held. Such changes are included in net realized and unrealized gain or loss from investments in the Statement of Operations.
Realized foreign exchange gains or losses arise from sales of foreign currencies, currency gains or losses realized between the trade and settlement dates on securities transactions and the difference between the recorded amounts of dividends, interest, and foreign withholding taxes and the U.S. dollar equivalent of the amounts actually received or paid. Net unrealized foreign exchange gains and losses arise from changes in foreign exchange rates on foreign denominated assets and liabilities other than investments in securities held at the end of the reporting period.
c. Securities Purchased on a Delayed Delivery Basis
The Fund purchases securities on a delayed delivery basis, with payment and delivery scheduled for a future date. These transactions are subject to market fluctuations and are subject to the risk that the value at delivery may be more or less than the trade date purchase price. Although the Fund will generally purchase these securities with the intention of holding the securities, it may sell the securities before the settlement date. Sufficient assets have been segregated for these securities.
d. Derivative Financial Instruments
The Fund invested in derivative financial instruments in order to manage risk or gain exposure to various other investments or markets. Derivatives are financial contracts based on an underlying or notional amount, require no initial investment or an initial net investment that is smaller than would normally be required to have a similar response to changes in market factors, and require or permit net settlement. Derivatives contain various risks including the potential inability of the counterparty to fulfill their obligations under the terms of the contract, the potential for an illiquid secondary market, and/or the potential for market movements which expose the Fund to
FRANKLIN TEMPLETON VARIABLE INSURANCE PRODUCTS TRUST
NOTES TO FINANCIAL STATEMENTS (UNAUDITED)
Franklin Mutual Shares VIP Fund(continued)
gains or losses in excess of the amounts shown in the Statement of Assets and Liabilities. Realized gain and loss and unrealized appreciation and depreciation on these contracts for the period are included in the Statement of Operations.
Derivative counterparty credit risk is managed through a formal evaluation of the creditworthiness of all potential counterparties. The Fund attempts to reduce its exposure to counterparty credit risk on OTC derivatives, whenever possible, by entering into International Swaps and Derivatives Association (ISDA) master agreements with certain counterparties. These agreements contain various provisions, including but not limited to collateral requirements, events of default, or early termination. Termination events applicable to the counterparty include certain deteriorations in the credit quality of the counterparty. Termination events applicable to the Fund include failure of the Fund to maintain certain net asset levels and/or limit the decline in net assets over various periods of time. In the event of default or early termination, the ISDA master agreement gives thenon-defaulting party the right to net andclose-out all transactions traded, whether or not arising under the ISDA agreement, to one net amount payable by one counterparty to the other. However, absent an event of default or early termination, OTC derivative assets and liabilities are presented gross and not offset in the Statement of Assets and Liabilities. Early termination by the counterparty may result in an immediate payment by the Fund of any net liability owed to that counterparty under the ISDA agreement. At June 30, 2019, the Fund had OTC derivatives in a net liability position of $1,463,436 and the aggregate value of collateral pledged for such contracts was $1,213,907.
Collateral requirements differ by type of derivative. Collateral or initial margin requirements are set by the broker or exchange clearing house for exchange traded and centrally cleared derivatives. Initial margin deposited is held at the exchange and can be in the form of cash and/or securities. For OTC derivatives traded under an ISDA master agreement, posting of collateral is required by either the Fund or the applicable counterparty if the total net exposure of all OTC derivatives with the applicable counterparty exceeds the minimum transfer amount, which typically ranges from $100,000 to $250,000, and can vary depending on the counterparty and the type of the agreement. Generally, collateral is determined at the close of Fund business each day and any additional collateral required due to changes in derivative values may be delivered by the Fund or the
counterparty the next business day, or within a few business days. Collateral pledged and/or received by the Fund for OTC derivatives, if any, is held in segregated accounts with the Fund’s custodian/counterparty broker and can be in the form of cash and/or securities. Unrestricted cash may be invested according to the Fund’s investment objectives. To the extent that the amounts due to the Fund from its counterparties are not subject to collateralization or are not fully collateralized, the Fund bears the risk of loss from counterpartynon-performance.
The Fund entered into exchange traded futures contracts primarily to manage exposure to certain foreign currencies. A futures contract is an agreement between the Fund and a counterparty to buy or sell an asset at a specified price on a future date. Required initial margins are pledged by the Fund, and the daily change in fair value is accounted for as a variation margin payable or receivable in the Statement of Assets and Liabilities.
The Fund entered into OTC forward exchange contracts primarily to manage exposure to certain foreign currencies. A forward exchange contract is an agreement between the Fund and a counterparty to buy or sell a foreign currency at a specific exchange rate on a future date.
See Note 10 regarding other derivative information.
e. Securities Sold Short
The Fund is engaged in selling securities short, which obligates the Fund to replace a borrowed security with the same security at current fair value. The Fund incurs a loss if the price of the security increases between the date of the short sale and the date on which the Fund replaces the borrowed security. The Fund realizes a gain if the price of the security declines between those dates. Gains are limited to the price at which the Fund sold the security short, while losses are potentially unlimited in size.
The Fund is required to establish a margin account with the broker lending the security sold short. While the short sale is outstanding, the broker retains the proceeds of the short sale to the extent necessary to meet margin requirements until the short position is closed out. A deposit must also be maintained with the Fund’s custodian/counterparty broker consisting of cash and/or securities having a value equal to a specified percentage of the value of the securities sold short. The Fund is obligated to pay fees for borrowing the securities sold short and is required to pay the counterparty any
FRANKLIN TEMPLETON VARIABLE INSURANCE PRODUCTS TRUST
NOTES TO FINANCIAL STATEMENTS (UNAUDITED)
Franklin Mutual Shares VIP Fund(continued)
1. Organization and Significant Accounting
Policies(continued)
e. Securities Sold Short(continued)
dividends and/or interest due on securities sold short. Such dividends and/or interest and any security borrowing fees are recorded as an expense to the Fund.
f. Securities Lending
The Fund participates in an agency based securities lending program to earn additional income. The Fund receives cash collateral against the loaned securities in an amount equal to at least 102% of the fair value of the loaned securities. Collateral is maintained over the life of the loan in an amount not less than 100% of the fair value of loaned securities, as determined at the close of Fund business each day; any additional collateral required due to changes in security values is delivered to the Fund on the next business day. The collateral is deposited into a joint cash account with other funds and is used to invest in a money market fund managed by Franklin Advisers, Inc., an affiliate of the Fund. The Fund may receive income from the investment of cash collateral, in addition to lending fees and rebates paid by the borrower. Income from securities loaned, net of fees paid to the securities lending agent and/or third-party vendor, is reported separately in the Statement of Operations. The Fund bears the market risk with respect to the collateral investment, securities loaned, and the risk that the agent may default on its obligations to the Fund. If the borrower defaults on its obligation to return the securities loaned, the Fund has the right to repurchase the securities in the open market using the collateral received. The securities lending agent has agreed to indemnify the Fund in the event of default by a third party borrower. At June 30, 2019, the Fund had no securities on loan.
g. Senior Floating Rate Interests
The Fund invests in senior secured corporate loans that pay interest at rates which are periodically reset by reference to a base lending rate plus a spread. These base lending rates are generally the prime rate offered by a designated U.S. bank or the London InterBank Offered Rate (LIBOR). Senior secured corporate loans often require prepayment of principal from excess cash flows or at the discretion of the borrower. As a result, actual maturity may be substantially
less than the stated maturity. Senior secured corporate loans in which the Fund invests are generally readily marketable, but may be subject to certain restrictions on resale.
h. Income and Deferred Taxes
It is the Fund’s policy to qualify as a regulated investment company under the Internal Revenue Code. The Fund intends to distribute to shareholders substantially all of its taxable income and net realized gains to relieve it from federal income and if applicable, excise taxes. As a result, no provision for U.S. federal income taxes is required.
The Fund may be subject to foreign taxation related to income received, capital gains on the sale of securities and certain foreign currency transactions in the foreign jurisdictions in which it invests. Foreign taxes, if any, are recorded based on the tax regulations and rates that exist in the foreign markets in which the Fund invests. When a capital gain tax is determined to apply, the Fund records an estimated deferred tax liability in an amount that would be payable if the securities were disposed of on the valuation date.
As a result of several court cases, in certain countries across the European Union, the Fund filed additional tax reclaims for previously withheld taxes on dividends earned in those countries (EU reclaims). These additional filings are subject to various administrative proceedings by the local jurisdictions’ tax authorities within the European Union, as well as a number of related judicial proceedings. Income recognized, if any, for EU reclaims is reflected as other income in the Statement of Operations and any related receivable, if any, is reflected as European Union tax reclaims in the Statement of Assets and Liabilities. When uncertainty exists as to the ultimate resolution of these proceedings, the likelihood of receipt of these EU reclaims, and the potential timing of payment, no amounts are reflected in the financial statements. For U.S. income tax purposes, when EU reclaims are received by the Fund and the Fund previously passed foreign tax credit on to its shareholders, the Fund must either amend historic tax reporting to shareholders or enter into a closing agreement with the Internal Revenue Service (IRS) in order to pay the associated tax liability on behalf of the Fund’s shareholders.
The Fund may recognize an income tax liability related to its uncertain tax positions under U.S. GAAP when the uncertain tax position has a less than 50% probability that it will be sustained upon examination by the tax authorities based on
FRANKLIN TEMPLETON VARIABLE INSURANCE PRODUCTS TRUST
NOTES TO FINANCIAL STATEMENTS (UNAUDITED)
Franklin Mutual Shares VIP Fund(continued)
its technical merits. As of June 30, 2019, the Fund has determined that no tax liability is required in its financial statements related to uncertain tax positions for any open tax years (or expected to be taken in future tax years). Open tax years are those that remain subject to examination and are based on the statute of limitations in each jurisdiction in which the Fund invests.
i. Security Transactions, Investment Income, Expenses and Distributions
Security transactions are accounted for on trade date. Realized gains and losses on security transactions are determined on a specific identification basis. Interest income and estimated expenses are accrued daily. Amortization of premium and accretion of discount on debt securities are included in interest income. Dividend income and dividends declared on securities sold short are recorded on theex-dividend date except for certain dividends from securities where the dividend rate is not available. In such cases, the dividend is recorded as soon as the information is received by the Fund. Distributions to shareholders are recorded on theex-dividend date. Distributable earnings are determined according to income tax regulations (tax basis) and may differ from earnings recorded in accordance with U.S. GAAP. These differences may be permanent or temporary. Permanent differences are reclassified among capital accounts to reflect their tax character. These reclassifications have no impact on net assets or the results of operations. Temporary differences are not reclassified, as they may reverse in subsequent periods.
Common expenses incurred by the Trust are allocated among the Funds based on the ratio of net assets of each Fund to the combined net assets of the Trust or based on the ratio of
number of shareholders of each Fund to the combined number of shareholders of the Trust. Fund specific expenses are charged directly to the Fund that incurred the expense.
Realized and unrealized gains and losses and net investment income, excluding class specific expenses, are allocated daily to each class of shares based upon the relative proportion of net assets of each class. Differences in per share distributions by class are generally due to differences in class specific expenses.
j. Accounting Estimates
The preparation of financial statements in accordance with U.S. GAAP requires management to make estimates and assumptions that affect the reported amounts of assets and liabilities at the date of the financial statements and the amounts of income and expenses during the reporting period. Actual results could differ from those estimates.
k. Guarantees and Indemnifications
Under the Trust’s organizational documents, its officers and trustees are indemnified by the Trust against certain liabilities arising out of the performance of their duties to the Trust. Additionally, in the normal course of business, the Trust, on behalf of the Fund, enters into contracts with service providers that contain general indemnification clauses. The Trust’s maximum exposure under these arrangements is unknown as this would involve future claims that may be made against the Trust that have not yet occurred. Currently, the Trust expects the risk of loss to be remote.
FRANKLIN TEMPLETON VARIABLE INSURANCE PRODUCTS TRUST
NOTES TO FINANCIAL STATEMENTS (UNAUDITED)
Franklin Mutual Shares VIP Fund(continued)
2. Shares of Beneficial Interest
At June 30, 2019, there were an unlimited number of shares authorized (without par value). Transactions in the Fund’s shares were as follows:
| | | | | | | | | | | | | | | | |
| | |
| | | Six Months Ended June 30, 2019 | | | Year Ended December 31, 2018 | |
| | | | |
| | | Shares | | | Amount | | | Shares | | | Amount | |
| |
| | | | |
| Class 1 Shares: | | | | | | | | | | | | | | | | |
Shares sold | | | 403,550 | | | $ | 7,789,101 | | | | 1,228,202 | | | $ | 23,646,682 | |
Shares issued in reinvestment of distributions | | | — | | | | — | | | | 1,881,441 | | | | 37,929,843 | |
Shares redeemed | | | (15,582,604 | ) | | | (313,984,513 | ) | | | (4,336,171 | ) | | | (89,573,472) | |
| | | | |
| | | | |
Net increase (decrease) | | | (15,179,054 | ) | | $ | (306,195,412 | ) | | | (1,226,528 | ) | | $ | (27,996,947) | |
| | | | |
| | | | |
| Class 2 Shares: | | | | | | | | | | | | | | | | |
Shares sold | | | 18,294,534 | | | $ | 353,687,491 | | | | 14,955,793 | | | $ | 302,887,079 | |
Shares issued in reinvestment of distributions | | | — | | | | — | | | | 9,803,757 | | | | 194,310,469 | |
Shares redeemed | | | (17,700,611 | ) | | | (337,692,229 | ) | | | (50,860,562 | ) | | | (1,003,622,690) | |
| | | | |
| | | | |
Net increase (decrease) | | | 593,923 | | | $ | 15,995,262 | | | | (26,101,012 | ) | | $ | (506,425,142) | |
| | | | |
| | | | |
| Class 4 Shares: | | | | | | | | | | | | | | | | |
Shares sold | | | 378,174 | | | $ | 7,137,753 | | | | 743,333 | | | $ | 14,855,135 | |
Shares issued in reinvestment of distributions | | | — | | | | — | | | | 358,852 | | | | 7,177,027 | |
Shares redeemed | | | (526,970 | ) | | | (10,127,350 | ) | | | (1,104,232 | ) | | | (22,398,008) | |
| | | | |
| | | | |
Net increase (decrease) | | | (148,796 | ) | | $ | (2,989,597) | | | | (2,047 | ) | | $ | (365,846) | |
| | | | |
3. Transactions with Affiliates
Franklin Resources, Inc. is the holding company for various subsidiaries that together are referred to as Franklin Templeton. Certain officers and trustees of the Fund are also officers and/or directors of the following subsidiaries:
| | |
| |
| Subsidiary | | Affiliation |
Franklin Mutual Advisers, LLC (Franklin Mutual) | | Investment manager |
Franklin Templeton Services, LLC (FT Services) | | Administrative manager |
Franklin Templeton Distributors, Inc. (Distributors) | | Principal underwriter |
Franklin Templeton Investor Services, LLC (Investor Services) | | Transfer agent |
FRANKLIN TEMPLETON VARIABLE INSURANCE PRODUCTS TRUST
NOTES TO FINANCIAL STATEMENTS (UNAUDITED)
Franklin Mutual Shares VIP Fund(continued)
a. Management Fees
The Fund pays an investment management fee to Franklin Mutual based on the average daily net assets of the Fund as follows:
| | |
| |
| Annualized Fee Rate | | Net Assets |
| 0.675% | | Up to and including $5 billion |
| 0.645% | | Over $5 billion, up to and including $10 billion |
| 0.625% | | Over $10 billion, up to and including $15 billion |
| 0.595% | | Over $15 billion, up to and including $20 billion |
| 0.585% | | Over $20 billion, up to and including $25 billion |
| 0.565% | | Over $25 billion, up to and including $30 billion |
| 0.555% | | Over $30 billion, up to and including $35 billion |
| 0.545% | | In excess of $35 billion |
b. Administrative Fees
Under an agreement with Franklin Mutual, FT Services provides administrative services to the Fund. The fee is paid by Franklin Mutual based on the Fund’s average daily net assets, and is not an additional expense of the Fund.
c. Distribution Fees
The Board has adopted distribution plans for Class 2 and Class 4 shares pursuant to Rule12b-1 under the 1940 Act. Under the Fund’s compensation distribution plans, the Fund pays Distributors for costs incurred in connection with the servicing, sale and distribution of the Fund’s shares up to 0.35% per year of its average daily net assets of each class. The Board has agreed to limit the current rate to 0.25% per year for Class 2. The plan year, for purposes of monitoring compliance with the maximum annual plan rates, is February 1 through January 31.
d. Transfer Agent Fees
Investor Services, under terms of an agreement, performs shareholder servicing for the Fund and is not paid by the Fund for the services.
e. Investments in Affiliated Management Investment Companies
The Fund invests in one or more affiliated management investment companies for purposes other than exercising a controlling influence over the management or policies. Management fees paid by the Fund are waived on assets invested in the affiliated management investment companies, as noted in the Statement of Operations, in an amount not to exceed the management and administrative fees paid directly or indirectly by each affiliate. During the period ended June 30, 2019, the Fund held investments in affiliated management investment companies as follows:
| | | | | | | | | | | | | | | | | | | | | | | | | | | | | | | | |
| | | Value at
Beginning
of Period | | | Purchases | | | Sales | | | Realized
Gain (Loss) | | | Net Change in
Unrealized
Appreciation
(Depreciation) | | | Value at
End of
Period | | | Number of
Shares
Held at End
of Period | | | Income from
securities
loaned | |
| | | | | | | | |
| Non-Controlled Affiliates | | | | | | | | | | | | | | | | | | | | | | | | | | | | | | | | |
Institutional Fiduciary Trust Money Market Portfolio, 2.05% | | | $ — | | | | $90,240,000 | | | | $(90,240,000) | | | | $ — | | | | $ — | | | | $ — | | | | — | | | | $41,390 | |
FRANKLIN TEMPLETON VARIABLE INSURANCE PRODUCTS TRUST
NOTES TO FINANCIAL STATEMENTS (UNAUDITED)
Franklin Mutual Shares VIP Fund(continued)
4. Expense Offset Arrangement
The Fund has entered into an arrangement with its custodian whereby credits realized as a result of uninvested cash balances are used to reduce a portion of the Fund’s custodian expenses. During the period ended June 30, 2019, the custodian fees were reduced as noted in the Statement of Operations.
5. Income Taxes
At June 30, 2019, the cost of investments and net unrealized appreciation (depreciation) for income tax purposes were as follows:
| | | | |
Cost of investments | | | $2,623,509,388 | |
| | | | |
| |
Unrealized appreciation | | | $ 789,047,411 | |
Unrealized depreciation | | | (171,626,751) | |
| | | | |
| |
Net unrealized appreciation (depreciation) | | | $ 617,420,660 | |
| | | | |
Differences between income and/or capital gains as determined on a book basis and a tax basis are primarily due to differing treatments of defaulted securities, foreign currency transactions and wash sales.
6. Investment Transactions
Purchases and sales of investments (excluding short term securities and securities sold short) for the period ended June 30, 2019, aggregated $617,730,214 and $707,904,303, respectively.
7. Credit Risk and Defaulted Securities
The Fund may purchase thepre-default or defaulted debt of distressed companies. Distressed companies are financially troubled and could be or are already involved in financial restructuring or bankruptcy. Risks associated with purchasing these securities include the possibility that the bankruptcy or other restructuring process takes longer than expected, or that distributions in restructuring are less than anticipated, either or both of which may result in unfavorable consequences to the Fund. If it becomes probable that the income on debt securities, including those of distressed companies, will not be collected, the Fund discontinues accruing income and recognizes an adjustment for uncollectible interest.
At June 30, 2019, the aggregate long value of distressed company securities for which interest recognition has been discontinued was $4,707,747, representing 0.2% of the Fund’s net assets. For information as to specific securities, see the accompanying Statement of Investments.
8. Restricted Securities
The Fund invests in securities that are restricted under the Securities Act of 1933 (1933 Act). Restricted securities are often purchased in private placement transactions, and cannot be sold without prior registration unless the sale is pursuant to an exemption under the 1933 Act. Disposal of these securities may require greater effort and expense, and prompt sale at an acceptable price may be difficult. The Fund may have registration rights for restricted securities. The issuer generally incurs all registration costs.
FRANKLIN TEMPLETON VARIABLE INSURANCE PRODUCTS TRUST
NOTES TO FINANCIAL STATEMENTS (UNAUDITED)
Franklin Mutual Shares VIP Fund(continued)
At June 30, 2019, investments in restricted securities, excluding securities exempt from registration under the 1933 Act deemed to be liquid, were as follows:
| | | | | | | | | | | | | | |
Principal
Amount/
Shares | | Issuer | | Acquisition
Date | | | Cost | | | Value | |
| | | | |
1,754 | | Broadband Ventures III LLC, secured promissory note, 5.00%, 2/01/12 | | | 7/01/10 - 11/30/12 | | | $ | 1,754 | | | $ | — | |
757,945 | | iHeartMedia Inc., A | | | 1/03/11 - 12/19/13 | | | | 17,769,776 | | | | 11,001,789 | |
12,783 | | iHeartMedia Inc., B | | | 1/03/11 - 12/19/13 | | | | 298,947 | | | | 185,549 | |
1,730,515 | | International Automotive Components Group Brazil LLC | | | 4/13/06 - 12/26/08 | | | | 1,149,241 | | | | 44,436 | |
| | | | | | | | | | |
| | | | |
| | Total Restricted Securities(Value is 0.3% of Net Assets) | | | | | | $ | 19,219,718 | | | $ | 11,231,774 | |
| | | | | | | | | | |
9. Unfunded Loan Commitments
The Fund enters into certain credit agreements, all or a portion of which may be unfunded. The Fund is obligated to fund these loan commitments at the borrowers’ discretion. Unfunded loan commitments and funded portions of credit agreements are marked to market daily and any unrealized appreciation or depreciation is included in the Statement of Assets and Liabilities and the Statement of Operations. Funded portions of credit agreements are presented in the Statement of Investments.
At June 30, 2019, unfunded commitments were as follows:
| | | | |
| |
| Borrower | | Unfunded
Commitment | |
| |
Windstream Services LLC, Revolving Commitment | | | $53,481 | |
| | | | |
10. Other Derivative Information
At June 30, 2019, investments in derivative contracts are reflected in the Statement of Assets and Liabilities as follows:
| | | | | | | | | | | | | | | | |
| | | Asset Derivatives | | | | | | Liability Derivatives | |
| | | | | |
Derivative Contracts
Not Accounted for as
Hedging Instruments | | Statement of
Assets and Liabilities
Location | | Fair Value | | | | | | Statement of
Assets and Liabilities
Location | | Fair Value | |
| | | | | |
Foreign exchange contracts | | Variation margin on futures contracts | | | $56,407 | a | | | | | | Variation margin on futures contracts | | $ | 109,142 | a |
| | Unrealized appreciation on OTC forward exchange contracts | | | 1,264 | | | | | | | Unrealized depreciation on OTC forward exchange contracts | | | 1,465,558 | |
| | | | | | | | | | | | | | | | |
Totals | | | | | $57,671 | | | | | | | | | $ | 1,574,700 | |
| | | | | | | | | | | | | | | | |
aThis amount reflects the cumulative appreciation (depreciation) of futures contracts as reported in the Statement of Investments. Only the variation margin receivable/ payable at period end is separately reported within the Statement of Assets and Liabilities. Prior variation margin movements were recorded to cash upon receipt or payment.
FRANKLIN TEMPLETON VARIABLE INSURANCE PRODUCTS TRUST
NOTES TO FINANCIAL STATEMENTS (UNAUDITED)
Franklin Mutual Shares VIP Fund(continued)
10. Other Derivative Information(continued)
For the period ended June 30, 2019, the effect of derivative contracts in the Statement of Operations was as follows:
| | | | | | | | | | |
Derivative Contracts
Not Accounted for as
Hedging Instruments | | Statement of
Operations Location | | Net Realized
Gain (Loss) for
the Period | | | Statement of
Operations Location | | Net Change in
Unrealized
Appreciation
(Depreciation)
for the Period |
| | | | |
| | Net realized gain (loss) from: | | | | | | Net change in unrealized appreciation (depreciation) on: | | |
| | | | |
Foreign exchange contracts | | Forward exchange contracts | | | $3,892,295 | | | Forward exchange contracts | | $(513,176) |
| | | | |
| | Futures contracts | | | 1,483,344 | | | Futures contracts | | (216,727) |
| | | | | | | | | | |
Totals | | | | | $5,375,639 | | | | | $(729,903) |
| | | | | | | | | | |
For the period ended June 30, 2019, the average month end notional amount of futures contracts represented $105,304,246. The average month end contract value of forward exchange contracts was $117,526,716.
See Note 1(d) regarding derivative financial instruments.
11. Credit Facility
The Fund, together with other U.S. registered and foreign investment funds (collectively, Borrowers), managed by Franklin Templeton, are borrowers in a joint syndicated senior unsecured credit facility totaling $2 billion (Global Credit Facility) which matures on February 7, 2020. This Global Credit Facility provides a source of funds to the Borrowers for temporary and emergency purposes, including the ability to meet future unanticipated or unusually large redemption requests.
Under the terms of the Global Credit Facility, the Fund shall, in addition to interest charged on any borrowings made by the Fund and other costs incurred by the Fund, pay its share of fees and expenses incurred in connection with the implementation and maintenance of the Global Credit Facility, based upon its relative share of the aggregate net assets of all of the Borrowers, including an annual commitment fee of 0.15% based upon the unused portion of the Global Credit Facility. These fees are reflected in other expenses in the Statement of Operations. During the period ended June 30, 2019, the Fund did not use the Global Credit Facility.
12. Fair Value Measurements
The Fund follows a fair value hierarchy that distinguishes between market data obtained from independent sources (observable inputs) and the Fund’s own market assumptions (unobservable inputs). These inputs are used in determining the value of the Fund’s financial instruments and are summarized in the following fair value hierarchy:
| | • | | Level 1 – quoted prices in active markets for identical financial instruments |
| | • | | Level 2 – other significant observable inputs (including quoted prices for similar financial instruments, interest rates, prepayment speed, credit risk, etc.) |
| | • | | Level 3 – significant unobservable inputs (including the Fund’s own assumptions in determining the fair value of financial instruments) |
The input levels are not necessarily an indication of the risk or liquidity associated with financial instruments at that level.
FRANKLIN TEMPLETON VARIABLE INSURANCE PRODUCTS TRUST
NOTES TO FINANCIAL STATEMENTS (UNAUDITED)
Franklin Mutual Shares VIP Fund(continued)
A summary of inputs used as of June 30, 2019, in valuing the Fund’s assets and liabilities carried at fair value, is as follows:
| | | | | | | | | | | | | | | | |
| | | Level 1 | | | Level 2 | | | Level 3 | | | Total | |
| | | | |
| Assets: | | | | | | | | | | | | | | | | |
Investments in Securities:a | | | | | | | | | | | | | | | | |
Equity Investments:b | | | | | | | | | | | | | | | | |
Auto Components | | $ | 4,812,508 | | | $ | — | | | $ | 44,436 | | | $ | 4,856,944 | |
Chemicals | | | — | | | | — | | | | 53,346 | | | | 53,346 | |
Machinery | | | 6,803,241 | | | | 18,913,243 | | | | — | | | | 25,716,484 | |
Media | | | 207,433,089 | | | | — | | | | 11,187,338 | | | | 218,620,427 | |
Specialty Retail | | | — | | | | — | | | | 7,444,425 | | | | 7,444,425 | |
Technology Hardware, Storage & Peripherals | | | 114,322,958 | | | | — | | | | 713,354 | | | | 115,036,312 | |
All Other Equity Investments | | | 2,567,780,559 | | | | — | | | | — | | | | 2,567,780,559 | |
Corporate Notes and Senior Floating Rate Interests | | | — | | | | 123,328,920 | | | | — | | | | 123,328,920 | |
Corporate Bonds and Notes in Reorganization | | | — | | | | 4,707,747 | | | | —c | | | | 4,707,747 | |
Companies in Liquidation | | | — | | | | 135,928 | | | | —c | | | | 135,928 | |
Short Term Investments | | | 135,934,910 | | | | 47,300,000 | | | | — | | | | 183,234,910 | |
| | | | |
| | | | |
Total Investments in Securities | | $ | 3,037,087,265 | | | $ | 194,385,838 | | | $ | 19,442,899 | | | $ | 3,250,916,002 | |
| | | | |
Other Financial Instruments: | | | | | | | | | | | | | | | | |
Futures Contracts | | $ | 56,407 | | | $ | — | | | $ | — | | | $ | 56,407 | |
Forward Exchange Contracts | | | — | | | | 1,264 | | | | — | | | | 1,264 | |
Unfunded Loan Commitments | | | — | | | | 8,701 | | | | — | | | | 8,701 | |
| | | | |
| | | | |
Total Other Financial Instruments | | $ | 56,407 | | | $ | 9,965 | | | $ | — | | | $ | 66,372 | |
| | | | |
| | | | |
| Liabilities: | | | | | | | | | | | | | | | | |
Other Financial Instruments: | | | | | | | | | | | | | | | | |
Securities Sold Short | | $ | 8,471,380 | | | $ | — | | | $ | — | | | $ | 8,471,380 | |
Futures Contracts | | | 109,142 | | | | — | | | | — | | | | 109,142 | |
Forward Exchange Contracts | | | — | | | | 1,465,558 | | | | — | | | | 1,465,558 | |
| | | | |
| | | | |
Total Other Financial Instruments | | $ | 8,580,522 | | | $ | 1,465,558 | | | $ | — | | | $ | 10,046,080 | |
| | | | |
aFor detailed categories, see the accompanying Statement of Investments.
bIncludes common stocks as well as other equity interests.
cIncludes securities determined to have no value at June 30, 2019.
A reconciliation of assets in which Level 3 inputs are used in determining fair value is presented when there are significant Level 3 financial instruments at the beginning and/or end of the period.
13. Subsequent Events
The Fund has evaluated subsequent events through the issuance of the financial statements and determined that no events have occurred that require disclosure.
FRANKLIN TEMPLETON VARIABLE INSURANCE PRODUCTS TRUST
NOTES TO FINANCIAL STATEMENTS (UNAUDITED)
Franklin Mutual Shares VIP Fund(continued)
Abbreviations
| | | | | | | | | | | | |
| Counterparty | | Currency | | Selected Portfolio | |
BOFA | | Bank of America Corp. | | EUR | | Euro | | ADR | | | American Depositary Receipt | |
HSBK | | HSBC Bank PLC | | GBP | | British Pound | | FHLB | | | Federal Home Loan Bank | |
SSBT | | State Street Bank and Trust Co., N.A. | | USD | | United States Dollar | | LIBOR | | | London InterBank Offered Rate | |
UBSW | | UBS AG | | | | | | | | | | |
Franklin Rising Dividends VIP Fund
This semiannual report for Franklin Rising Dividends VIP Fund covers the period ended June 30, 2019.
Class 2 Performance Summary as of June 30, 2019
The Fund’s Class 2 Shares posted a +20.33% total return* for thesix-month period ended June 30, 2019.
*The Fund has a fee waiver associated with any investment it makes in a Franklin Templeton money fund and/or other Franklin Templeton fund, contractually guaranteed through 4/30/20. Fund investment results reflect the fee waiver; without this waiver, the results would have been lower.
Performance reflects the Fund’s Class 2 operating expenses, but doesnotinclude any contract fees, expenses or sales charges. If they had been included, performance would be lower. These charges and deductions, particularly for variable life policies, can have a significant effect on contract values and insurance benefits. See the contract prospectus for a complete description of these expenses, including sales charges.
Performance data represent past performance, which does not guarantee future results. Investment return and principal value will fluctuate, and you may have a gain or loss when you sell your shares. Current performance may differ from figures shown.
FRANKLIN RISING DIVIDENDS VIP FUND
Fund Goal and Main Investments
The Fund seeks long-term capital appreciation, with preservation of capital as an important consideration. Under normal market conditions, the Fund invests at least 80% of its net assets in equity securities of financially sound companies that have paid consistently rising dividends.
Fund Risks
All investments involve risks, including possible loss of principal. Value securities may not increase in price as anticipated or may decline further in value. For stocks paying dividends, dividends are not guaranteed, and can increase, decrease or be totally eliminated without notice. Securities issued by smaller and midsize companies may be more volatile in price than those of larger companies, involve substantial risks and should be considered speculative. To the extent that the Fund focuses on particular countries, regions, industries, sectors or types of investment from time to time, the Fund may be subject to greater risks of adverse developments in such areas of focus than a fund that invests in a wider variety of countries, regions, industries, sectors or investments. Foreign investing carries additional risks such as currency and market volatility and political or social instability, risks that are heightened in developing countries. The Fund is actively managed but there is no guarantee that the manager’s investment decisions will produce the desired results. The Fund’s prospectus also includes a description of the main investment risks.
Performance Overview
You can find the Fund’ssix-month total return in the Performance Summary. In comparison, the Standard & Poor’s® 500 Index (S&P 500®) posted a +18.54% total return for the same period.1 Please note the Fund employs abottom-up stock selection process, and the managers invest in securities without regard to benchmark comparisons.
Economic and Market Overview
The U.S. economy grew during the six months ended June 30, 2019. After moderating for two consecutive quarters, the economy grew significantly faster in 2019’s first quarter, driven by growth in consumer spending, inventory investment, exports, business investment, and state and
local government spending. However, the economy moderated again in the second quarter, due to weakness in inventory investment, exports, business investment and housing investment. The manufacturing and services sectors expanded during the period. The unemployment rate decreased from 3.9% in December 2018 to 3.7% atperiod-end.2 The annual inflation rate, as measured by the Consumer Price Index, decreased from 1.9% in December 2018 to 1.6% atperiod-end.2
The U.S. Federal Reserve (Fed) held its target range for the federal funds rate unchanged, at 2.25%–2.50%, during the period. In March, the Fed mentioned it would end its balance sheet normalization program by the end of September 2019. In June, the Fed indicated increased uncertainties around its views on economic activity and the labor market. With market-based inflation measures remaining low in recent months, the market has interpreted the Fed’s recent statements to mean it will likely cut rates in 2019’s second half to foster continued economic growth while attempting to achieve its inflation objective.
U.S. equity markets overall rose during the period, benefiting from upbeat economic data and U.S. corporate earnings. However, markets reflected concerns about tighter regulation of technology companies, U.S. political uncertainties, and the impact of U.S. trade disputes with China and other trading partners on global growth and corporate earnings. These concerns were partially alleviated in 2019’s first four months by easing trade tensions and optimism about a potential U.S.-China trade deal. Furthermore, markets benefited from the Fed’s indications of a patient approach to its monetary policy decisions. The broad U.S. stock market, as measured by the S&P 500, rallied in 2019’s first four months, reaching a newall-time high in April 2019. After declining in May due to escalating trade tensions, stocks reached anotherall-time high in June amid investor optimism about potential interest-rate cuts. Overall, the S&P 500 posted a +18.54% total return for thesix-month period.1
Investment Strategy
We are a research-driven, fundamental investment adviser, pursuing a disciplined value-oriented strategy. Asbottom-up investors concentrating primarily on individual securities, we seek fundamentally sound companies that we believe meet
1. Source: Morningstar. One cannot invest directly in an index, and an index is not representative of the Fund’s portfolio. Please see Index Descriptions following the Fund Summaries.
2. Source: Bureau of Labor Statistics.
The dollar value, number of shares or principal amount, and names of all portfolio holdings are listed in the Fund’s Statement of Investments (SOI).
FRANKLIN RISING DIVIDENDS VIP FUND
our screening criteria, which include consistent, substantial dividend increases; reinvested earnings; and strong balance sheets. We attempt to acquire such stocks at attractive prices, often when they are out of favor with other investors. In following these criteria, we do not necessarily focus on companies whose securities pay a high dividend but rather on companies that consistently raise their dividends.
Manager’s Discussion
During thesix-month period ended June 30, 2019, some holdings that contributed to absolute performance included Roper Technologies, Erie Indemnity and Air Products and Chemicals.
Roper Technologies, a diversified industrial company, enjoyed solid stock price performance during the period as the company continued to post strong revenue and earnings growth, as well as robust cash flow generation. Roper expects to continue achieving strong operating results in 2019, with moderate organic revenue growth and continued strong profitability. The company has increased its dividend for 26 consecutive years.
Erie Indemnity, a property-casualty insurer, contributed to relative performance based on steady earnings growth and margin expansion in recent quarters. Rate growth led to an increase in Erie’s premium growth during the recent period. The company has increased its dividend for 39 consecutive years.
Industrial gases company Air Products and Chemicals supported relative returns following a solid quarterly earnings report and what we considered promising guidance. We believe the overall fundamentals for the industrial gases industry remains robust. The industry has consolidated, competitive pressures remain stable, pricing power has improved and project backlogs look to be increasing. Moreover, we believe Air Products has what we consider a significant long-term opportunity in gasification projects. The company has increased its dividend for 36 consecutive years.
Conversely, some holdings that detracted from absolute performance included Albemarle, Occidental Petroleum and Medtronic.
Shares of Albemarle, a specialty chemicals producer, declined despite ongoing strong fundamental performance. Investor concerns about the possibility of lithium oversupply and pricing implications continued to weigh on the industry despite the company’s outlook for balanced supply and demand. Albemarle’s long-term contracts andlow-cost position could provide insulation from spot price fluctuations,
Portfolio Composition
Based on Total Net Assets as of 6/30/19
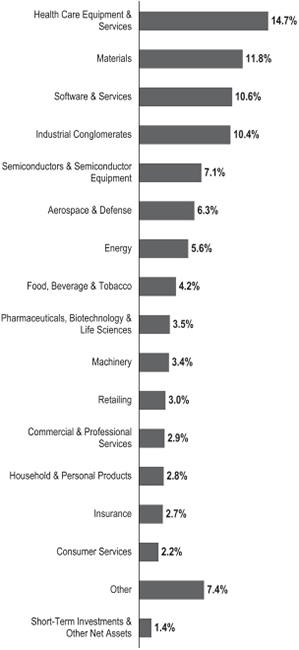
in our view. The company has increased its dividend for 25 consecutive years.
Oil and gas producer Occidental Petroleum announced a $38 billion acquisition of oil and gas exploration and production firm Anadarko Petroleum. We believe the transaction will give Occidental Petroleum a greater presence in the U.S. shale producing Permian Basin and allow it to cut costs, but investor concerns about the
FRANKLIN RISING DIVIDENDS VIP FUND
financing needed to complete the deal weighed on Occidental’s share price. The company has increased its dividend for 16 consecutive years.
Shares of Medtronic, a developer of medical products, was a relative detractor during the period, despite reporting strong financial results in recent quarters. We believe that Medtronic is positioned well going forward, based on good organic growth prospects driven by a strong pipeline, as well as improving margins and cash flow generation. The stock also trades at an undemanding valuation relative to the opportunity, in our view. The company has increased its dividend for 41 years.
During the period, the Fund initiated a new position in Norfolk Southern, a freight railroad (17 consecutive years of dividend increases). We added to existing positions including The Boeing Company, an aerospace company (eight consecutive years of dividend increases); Raytheon, a defense contractor and weapons, military and commercial electronics manufacturer (15 consecutive years of dividend increases); and Honeywell International, a diversified industrial company (nine consecutive years of dividend increases)
We did not liquidate any positions during the period. We also reduced several holdings including ABM Industries, Aflac and the aforementioned Roper Technologies.
Thank you for your participation in Franklin Rising Dividends VIP Fund. We look forward to continuing to serve your investment needs.
The foregoing information reflects our analysis, opinions and portfolio holdings as of June 30, 2019, the end of the reporting period. The way we implement our main investment strategies and the resulting portfolio holdings may change depending on factors such as market and economic conditions. These opinions may not be relied upon as investment advice or an offer for a particular security. The information is not a complete analysis of every aspect of any market, country, industry, security or the Fund. Statements of fact are from sources considered reliable, but the investment manager makes no representation or warranty as to their completeness or accuracy. Although historical performance is no guarantee of future results, these insights may help you understand our investment management philosophy.
Top 10 Holdings
6/30/19
| | | | |
| |
Company
Sector/Industry | | % of Total
Net Assets | |
Microsoft Corp. Software & Services | | | 6.4% | |
Roper Technologies Inc. Industrial Conglomerates | | | 5.9% | |
Linde PLC (United Kingdom) Materials | | | 3.9% | |
Honeywell International Inc. Industrial Conglomerates | | | 3.9% | |
Stryker Corp. Health Care Equipment & Services | | | 3.8% | |
Accenture PLC Software & Services | | | 3.4% | |
Becton, Dickinson and Co. Health Care Equipment & Services | | | 3.4% | |
Texas Instruments Inc. Semiconductors & Semiconductor Equipment | | | 3.4% | |
Analog Devices Inc. Semiconductors & Semiconductor Equipment | | | 3.3% | |
Air Products and Chemicals Inc. Materials | | | 3.3% | |
FRANKLIN RISING DIVIDENDS VIP FUND
Class 2 Fund Expenses
As an investor in a variable insurance contract (Contract) that indirectly provides for investment in an underlying mutual fund, you can incur transaction and/or ongoing expenses at both the Fund level and the Contract Level: (1) transaction expenses can include sales charges (loads) on purchases, surrender fees, transfer fees and premium taxes; and (2) ongoing expenses can include management fees, distribution and service(12b-1) fees, contract fees, annual maintenance fees, mortality and expense risk fees and other fees and expenses. All mutual funds and Contracts have some types of ongoing expenses. The table below shows Fund-level ongoing expenses and can help you understand these costs and compare them with those of other mutual funds offered through the Contract. The table assumes a $1,000 investment held for the six months indicated. Please refer to the Fund prospectus for additional information on operating expenses.
Actual Fund Expenses
The table below provides information about the actual account values and actual expenses in the columns under the heading “Actual.” In these columns the Fund’s actual return, which includes the effect of ongoing Fund expenses but does not include the effect of ongoing Contract expenses, is used to calculate the “Ending Account Value.” You can estimate the Fund-level expenses you paid during the period by following these steps (ofcourse, your account value and expenses will differ from those in this illustration):Divide your account value by $1,000 (ifyour account had an $8,600 value, then $8,600÷ $1,000 = 8.6). Then multiply the result by the number under the headings “Actual” and “Fund-Level Expenses Paid During Period” (ifFund-Level Expenses Paid During Period were $ 7.50, then 8.6 x $ 7.50 = $64.50). In this illustration, the estimated expenses paid this period at the Fund level are $64.50.
Hypothetical Example for Comparison with Other Mutual Funds
Under the heading “Hypothetical” in the table, information is provided about hypothetical account values and hypothetical expenses based on the Fund’s actual expense ratio and an assumed rate of return of 5% per year before expenses, which is not the Fund’s actual return. This information may not be used to estimate the actual ending account balance or expenses you paid for the period, but it can help you compare ongoing costs of investing in the Fund with those of other mutual funds offered through the Contract. To do so, compare this 5% hypothetical example with the 5% hypothetical examples that appear in the shareholder reports of other funds offered through the Contract.
Please note that expenses shown in the table are meant to highlight ongoing costs at the Fund level only and do not reflect any ongoing expenses at the Contract level, or transaction expenses at either the Fund or Contract levels. In addition, while the Fund does not have transaction expenses, if the transaction and ongoing expenses at the Contract level were included, the expenses shown below would be higher. You should consult your Contract prospectus or disclosure document for more information.
| | | | | | | | | | | | | | | | | | |
| | | | | | | Actual
(actual return after expenses) | | | | Hypothetical
(5% annual return before expenses) | | | | |
Share Class | | Beginning
Account
Value 1/1/19 | | | | Ending
Account
Value 6/30/19 | | Fund-Level
Expenses
Paid During
Period
1/1/19–6/30/191, 2 | | | | Ending
Account
Value 6/30/19 | | Fund-Level
Expenses
Paid During Period
1/1/19–6/30/191,2 | | | | Net
Annualized
Expense
Ratio2 |
Class 2 | | $1,000 | | | | $1,203.30 | | $4.81 | | | | $1,020.43 | | $4.41 | | | | 0.88% |
1. Expenses are equal to the annualized expense ratio for thesix-month period as indicated above—in the far right column—multiplied by the simple average account value over the period indicated, and then multiplied by 181/365 to reflect theone-half year period.
2. Reflects expenses after fee waivers and expense reimbursements. Does not include any ongoing expenses of the Contract for which the Fund is an investment option or acquired fund fees and expenses.
FRANKLIN TEMPLETON VARIABLE INSURANCE PRODUCTS TRUST
Financial Highlights
Franklin Rising Dividends VIP Fund
| | | | | | | | | | | | | | | | | | | | | | | | |
| | | Six Months Ended June 30, 2019 (unaudited) | | | Year Ended December 31, | |
| | | 2018 | | | 2017 | | | 2016 | | | 2015 | | | 2014 | |
| |
| | | | | | |
| Class 1 | | | | | | | | | | | | | | | | | | | | | | | | |
| | | | | | |
Per share operating performance
(for a share outstanding throughout the period) | | | | | | | | | | | | | | | | | | | | | | | | |
| | | | | | |
Net asset value, beginning of period | | | $25.75 | | | | $29.21 | | | | $25.51 | | | | $25.26 | | | | $29.63 | | | | $28.14 | |
| | | | |
| | | | | | |
Income from investment operationsa: | | | | | | | | | | | | | | | | | | | | | | | | |
| | | | | | |
Net investment incomeb | | | 0.19 | | | | 0.39 | | | | 0.40 | | | | 0.42 | | | | 0.45 | | | | 0.45 | |
| | | | | | |
Net realized and unrealized gains (losses) | | | 4.99 | | | | (1.65 | ) | | | 4.76 | | | | 3.45 | | | | (1.33 | ) | | | 2.03 | |
| | | | |
| | | | | | |
Total from investment operations | | | 5.18 | | | | (1.26 | ) | | | 5.16 | | | | 3.87 | | | | (0.88 | ) | | | 2.48 | |
| | | | |
| | | | | | |
| Less distributions from: | | | | | | | | | | | | | | | | | | | | | | | | |
| | | | | | |
Net investment income | | | (0.45 | ) | | | (0.44 | ) | | | (0.48 | ) | | | (0.44 | ) | | | (0.48 | ) | | | (0.44) | |
| | | | | | |
Net realized gains | | | (4.54 | ) | | | (1.76 | ) | | | (0.98 | ) | | | (3.18 | ) | | | (3.01 | ) | | | (0.55) | |
| | | | |
| | | | | | |
Total distributions | | | (4.99 | ) | | | (2.20 | ) | | | (1.46 | ) | | | (3.62 | ) | | | (3.49 | ) | | | (0.99) | |
| | | | |
| | | | | | |
Net asset value, end of period | | | $25.94 | | | | $25.75 | | | | $29.21 | | | | $25.51 | | | | $25.26 | | | | $29.63 | |
| | | | |
| | | | | | |
Total returnc | | | 20.48% | | | | (4.84)% | | | | 20.85% | | | | 16.33% | | | | (3.42)% | | | | 9.01% | |
| | | | | | |
| Ratios to average net assetsd | | | | | | | | | | | | | | | | | | | | | | | | |
| | | | | | |
Expenses before waiver and payments by affiliates | | | 0.64% | | | | 0.62% | | | | 0.62% | | | | 0.63% | | | | 0.63% | | | | 0.62% | |
| | | | | | |
Expenses net of waiver and payments by affiliates | | | 0.63% | e | | | 0.62% | e,f | | | 0.62% | e,f | | | 0.62% | e | | | 0.63% | f | | | 0.62%f | |
| | | | | | |
Net investment income | | | 1.37% | | | | 1.38% | | | | 1.49% | | | | 1.67% | | | | 1.65% | | | | 1.58% | |
| | | | | | |
| Supplemental data | | | | | | | | | | | | | | | | | | | | | | | | |
| | | | | | |
Net assets, end of period (000’s) | | | $179,169 | | | | $157,838 | | | | $216,015 | | | | $181,072 | | | | $143,376 | | | | $160,480 | |
| | | | | | |
Portfolio turnover rate | | | 3.13% | | | | 3.09% | g | | | 3.36% | | | | 6.66% | | | | 4.74% | | | | 8.61% | |
aThe amount shown for a share outstanding throughout the period may not correlate with the Statement of Operations for the period due to the timing of sales and repurchases of the Fund’s shares in relation to income earned and/or fluctuating fair value of the investments of the Fund.
bBased on average daily shares outstanding.
cTotal return does not include fees, charges or expenses imposed by the variable annuity and life insurance contracts for which Franklin Templeton Variable Insurance Products Trust serves as an underlying investment vehicle. Total return is not annualized for periods less than one year.
dRatios are annualized for periods less than one year.
eBenefit of expense reduction rounds to less than 0.01%.
fBenefit of waiver and payments by affiliates rounds to less than 0.01%.
gExcludes the value of portfolio securities delivered as a result of a redemptionin-kind. See Note 8.
| | | | |
| | | |
FRD-6 | | Semiannual Report | The accompanying notes are an integral part of these financial statements. | | |
FRANKLIN TEMPLETON VARIABLE INSURANCE PRODUCTS TRUST
FINANCIAL HIGHLIGHTS
Franklin Rising Dividends VIP Fund(continued)
| | | | | | | | | | | | | | | | | | | | | | | | |
| | |
| | | Six Months Ended
June 30, 2019 (unaudited) | | | Year Ended December 31, | |
| | | 2018 | | | 2017 | | | 2016 | | | 2015 | | | 2014 | |
| |
| | | | | | |
| Class 2 | | | | | | | | | | | | | | | | | | | | | | | | |
| | | | | | |
Per share operating performance (for a share outstanding throughout the period) | | | | | | | | | | | | | | | | | | | | | | | | |
| | | | | | |
Net asset value, beginning of period | | | $25.04 | | | | $28.46 | | | | $24.89 | | | | $24.72 | | | | $29.06 | | | | $27.62 | |
| | | | |
| | | | | | |
| Income from investment operationsa: | | | | | | | | | | | | | | | | | | | | | | | | |
| | | | | | |
Net investment incomeb | | | 0.15 | | | | 0.31 | | | | 0.33 | | | | 0.35 | | | | 0.37 | | | | 0.37 | |
| | | | | | |
Net realized and unrealized gains (losses) | | | 4.85 | | | | (1.61 | ) | | | 4.63 | | | | 3.37 | | | | (1.29 | ) | | | 1.99 | |
| | | | |
| | | | | | |
Total from investment operations | | | 5.00 | | | | (1.30 | ) | | | 4.96 | | | | 3.72 | | | | (0.92 | ) | | | 2.36 | |
| | | | |
| | | | | | |
| Less distributions from: | | | | | | | | | | | | | | | | | | | | | | | | |
| | | | | | |
Net investment income | | | (0.37 | ) | | | (0.36 | ) | | | (0.41 | ) | | | (0.37 | ) | | | (0.41 | ) | | | (0.37) | |
| | | | | | |
Net realized gains | | | (4.54 | ) | | | (1.76 | ) | | | (0.98 | ) | | | (3.18 | ) | | | (3.01 | ) | | | (0.55) | |
| | | | |
| | | | | | |
Total distributions | | | (4.91 | ) | | | (2.12 | ) | | | (1.39 | ) | | | (3.55 | ) | | | (3.42 | ) | | | (0.92) | |
| | | | |
| | | | | | |
Net asset value, end of period | | | $25.13 | | | | $25.04 | | | | $28.46 | | | | $24.89 | | | | $24.72 | | | | $29.06 | |
| | | | |
| | | | | | |
Total returnc | | | 20.33% | | | | (5.07)% | | | | 20.56% | | | | 16.04% | | | | (3.65)% | | | | 8.72% | |
| | | | | | |
| Ratios to average net assetsd | | | | | | | | | | | | | | | | | | | | | | | | |
| | | | | | |
Expenses before waiver and payments by affiliates | | | 0.89% | | | | 0.87% | | | | 0.87% | | | | 0.88% | | | | 0.88% | | | | 0.87% | |
| | | | | | |
Expenses net of waiver and payments by affiliates | | | 0.88% | e | | | 0.87% | e,f | | | 0.87% | e,f | | | 0.87% | e | | | 0.88% | f | | | 0.87%f | |
| | | | | | |
Net investment income | | | 1.12% | | | | 1.13% | | | | 1.24% | | | | 1.42% | | | | 1.40% | | | | 1.33% | |
| | | | | | |
| Supplemental data | | | | | | | | | | | | | | | | | | | | | | | | |
| | | | | | |
Net assets, end of period (000’s) | | | $1,393,720 | | | | $1,106,334 | | | | $1,640,883 | | | | $1,530,374 | | | | $1,310,783 | | | | $1,667,816 | |
| | | | | | |
Portfolio turnover rate | | | 3.13% | | | | 3.09% | g | | | 3.36% | | | | 6.66% | | | | 4.74% | | | | 8.61% | |
aThe amount shown for a share outstanding throughout the period may not correlate with the Statement of Operations for the period due to the timing of sales and repurchases of the Fund’s shares in relation to income earned and/or fluctuating fair value of the investments of the Fund.
bBased on average daily shares outstanding.
cTotal return does not include fees, charges or expenses imposed by the variable annuity and life insurance contracts for which Franklin Templeton Variable Insurance Products Trust serves as an underlying investment vehicle. Total return is not annualized for periods less than one year.
dRatios are annualized for periods less than one year.
eBenefit of expense reduction rounds to less than 0.01%.
fBenefit of waiver and payments by affiliates rounds to less than 0.01%.
gExcludes the value of portfolio securities delivered as a result of a redemptionin-kind. See Note 8.
| | | | | | |
| | | |
| | The accompanying notes are an integral part of these financial statements. | Semiannual Report | | | FRD-7 | |
FRANKLIN TEMPLETON VARIABLE INSURANCE PRODUCTS TRUST
FINANCIAL HIGHLIGHTS
Franklin Rising Dividends VIP Fund(continued)
| | | | | | | | | | | | | | | | | | | | | | | | |
| | |
| | | Six Months Ended
June 30, 2019 (unaudited) | | | Year Ended December 31, | |
| | | 2018 | | | 2017 | | | 2016 | | | 2015 | | | 2014 | |
| |
| | | | | | |
| Class 4 | | | | | | | | | | | | | | | | | | | | | | | | |
| | | | | | |
Per share operating performance (for a share outstanding throughout the period) | | | | | | | | | | | | | | | | | | | | | | | | |
| | | | | | |
Net asset value, beginning of period | | | $25.11 | | | | $28.54 | | | | $24.98 | | | | $24.81 | | | | $29.19 | | | | $27.76 | |
| | | | |
| | | | | | |
Income from investment operationsa: | | | | | | | | | | | | | | | | | | | | | | | | |
| | | | | | |
Net investment incomeb | | | 0.14 | | | | 0.29 | | | | 0.30 | | | | 0.32 | | | | 0.35 | | | | 0.35 | |
| | | | | | |
Net realized and unrealized gains (losses) | | | 4.86 | | | | (1.62 | ) | | | 4.65 | | | | 3.39 | | | | (1.31 | ) | | | 2.00 | |
| | | | |
| | | | | | |
Total from investment operations | | | 5.00 | | | | (1.33 | ) | | | 4.95 | | | | 3.71 | | | | (0.96 | ) | | | 2.35 | |
| | | | |
| | | | | | |
| Less distributions from: | | | | | | | | | | | | | | | | | | | | | | | | |
| | | | | | |
Net investment income | | | (0.35 | ) | | | (0.34 | ) | | | (0.41 | ) | | | (0.36 | ) | | | (0.41 | ) | | | (0.37 | ) |
| | | | | | |
Net realized gains | | | (4.54 | ) | | | (1.76 | ) | | | (0.98 | ) | | | (3.18 | ) | | | (3.01 | ) | | | (0.55 | ) |
| | | | |
| | | | | | |
Total distributions | | | (4.89 | ) | | | (2.10 | ) | | | (1.39 | ) | | | (3.54 | ) | | | (3.42 | ) | | | (0.92 | ) |
| | | | |
| | | | | | |
Net asset value, end of period | | | $25.22 | | | | $25.11 | | | | $28.54 | | | | $24.98 | | | | $24.81 | | | | $29.19 | |
| | | | |
| | | | | | |
Total returnc | | | 20.29% | | | | (5.16)% | | | | 20.40% | | | | 15.93% | | | | (3.75)% | | | | 8.62% | |
| | | | | | |
| Ratios to average net assetsd | | | | | | | | | | | | | | | | | | | | | | | | |
| | | | | | |
Expenses before waiver and payments by affiliates | | | 0.99% | | | | 0.97% | | | | 0.97% | | | | 0.98% | | | | 0.98% | | | | 0.97% | |
| | | | | | |
Expenses net of waiver and payments by affiliates | | | 0.98% | e | | | 0.97% | e,f | | | 0.97% | e,f | | | 0.97% | e | | | 0.98% | f | | | 0.97%f | |
| | | | | | |
Net investment income | | | 1.02% | | | | 1.03% | | | | 1.14% | | | | 1.32% | | | | 1.30% | | | | 1.23% | |
| | | | | | |
| Supplemental data | | | | | | | | | | | | | | | | | | | | | | | | |
| | | | | | |
Net assets, end of period (000’s) | | | $39,184 | | | | $32,825 | | | | $36,407 | | | | $28,579 | | | | $20,453 | | | | $15,503 | |
| | | | | | |
Portfolio turnover rate | | | 3.13% | | | | 3.09%g | | | | 3.36% | | | | 6.66% | | | | 4.74% | | | | 8.61% | |
aThe amount shown for a share outstanding throughout the period may not correlate with the Statement of Operations for the period due to the timing of sales and repurchases of the Fund’s shares in relation to income earned and/or fluctuating fair value of the investments of the Fund.
bBased on average daily shares outstanding.
cTotal return does not include fees, charges or expenses imposed by the variable annuity and life insurance contracts for which Franklin Templeton Variable Insurance Products Trust serves as an underlying investment vehicle. Total return is not annualized for periods less than one year.
dRatios are annualized for periods less than one year.
eBenefit of expense reduction rounds to less than 0.01%.
fBenefit of waiver and payments by affiliates rounds to less than 0.01%.
gExcludes the value of portfolio securities delivered as a result of a redemptionin-kind. See Note 8.
| | | | |
| | | |
FRD-8 | | Semiannual Report | The accompanying notes are an integral part of these financial statements. | | |
FRANKLIN TEMPLETON VARIABLE INSURANCE PRODUCTS TRUST
Statement of Investments, June 30, 2019 (unaudited)
Franklin Rising Dividends VIP Fund
| | | | | | |
| | | Shares | | Value | |
| |
Common Stocks 98.6% | | | | | | |
| | |
Aerospace & Defense 6.3% | | | | | | |
The Boeing Co. | | 49,152 | | $ | 17,891,820 | |
General Dynamics Corp. | | 179,400 | | | 32,618,508 | |
Raytheon Co. | | 118,028 | | | 20,522,709 | |
United Technologies Corp. | | 227,897 | | | 29,672,189 | |
| | | | | | |
| | |
| | | | | 100,705,226 | |
| | | | | | |
| | |
Building Products 1.6% | | | | | | |
Johnson Controls International PLC | | 598,852 | | | 24,738,576 | |
aResideo Technologies Inc. | | 51,681 | | | 1,132,848 | |
| | | | | | |
| | |
| | | | | 25,871,424 | |
| | | | | | |
| | |
Commercial & Professional Services 2.9% | | | | | | |
ABM Industries Inc. | | 325,036 | | | 13,001,440 | |
Cintas Corp. | | 113,399 | | | 26,908,449 | |
Matthews International Corp., A | | 212,992 | | | 7,422,771 | |
| | | | | | |
| | |
| | | | | 47,332,660 | |
| | | | | | |
| | |
Consumer Durables & Apparel 1.7% | | | | | | |
NIKE Inc., B | | 333,499 | | | 27,997,241 | |
| | | | | | |
Consumer Services 2.2% | | | | | | |
McDonald’s Corp. | | 139,412 | | | 28,950,296 | |
Yum! Brands Inc. | | 55,463 | | | 6,138,090 | |
| | | | | | |
| | |
| | | | | 35,088,386 | |
| | | | | | |
| | |
Diversified Financials 0.2% | | | | | | |
State Street Corp. | | 58,384 | | | 3,273,007 | |
| | | | | | |
| | |
Electrical Equipment 0.6% | | | | | | |
nVent Electric PLC | | 414,613 | | | 10,278,256 | |
| | | | | | |
| | |
Energy 5.6% | | | | | | |
aApergy Corp. | | 190,719 | | | 6,396,715 | |
Chevron Corp. | | 177,152 | | | 22,044,795 | |
EOG Resources Inc. | | 197,458 | | | 18,395,187 | |
Exxon Mobil Corp. | | 163,217 | | | 12,507,319 | |
Occidental Petroleum Corp. | | 321,212 | | | 16,150,539 | |
Schlumberger Ltd. | | 363,947 | | | 14,463,254 | |
| | | | | | |
| | |
| | | | | 89,957,809 | |
| | | | | | |
| | |
Food & Staples Retailing 1.8% | | | | | | |
Walgreens Boots Alliance Inc. | | 137,088 | | | 7,494,601 | |
Walmart Inc. | | 199,488 | | | 22,041,429 | |
| | | | | | |
| | |
| | | | | 29,536,030 | |
| | | | | | |
| | |
Food, Beverage & Tobacco 4.2% | | | | | | |
Bunge Ltd. | | 304,273 | | | 16,951,049 | |
McCormick & Co. Inc. | | 155,999 | | | 24,181,405 | |
PepsiCo Inc. | | 198,800 | | | 26,068,645 | |
| | | | | | |
| | |
| | | | | 67,201,099 | |
| | | | | | |
FRANKLIN TEMPLETON VARIABLE INSURANCE PRODUCTS TRUST
STATEMENT OF INVESTMENTS (UNAUDITED)
Franklin Rising Dividends VIP Fund(continued)
| | | | | | |
| | | Shares | | Value | |
| |
Common Stocks(continued) | | | | | | |
Health Care Equipment & Services 14.7% | | | | | | |
Abbott Laboratories | | 372,879 | | $ | 31,359,124 | |
Becton, Dickinson and Co. | | 215,303 | | | 54,258,509 | |
CVS Health Corp. | | 170,555 | | | 9,293,542 | |
DENTSPLY SIRONA Inc. | | 60,262 | | | 3,516,890 | |
Medtronic PLC | | 497,861 | | | 48,486,683 | |
Stryker Corp. | | 300,281 | | | 61,731,768 | |
West Pharmaceutical Services Inc. | | 228,602 | | | 28,609,540 | |
| | | | | | |
| | |
| | | | | 237,256,056 | |
| | | | | | |
| | |
Household & Personal Products 2.8% | | | | | | |
Colgate-Palmolive Co. | | 278,562 | | | 19,964,539 | |
The Procter & Gamble Co. | | 226,565 | | | 24,842,852 | |
| | | | | | |
| | |
| | | | | 44,807,391 | |
| | | | | | |
| | |
Industrial Conglomerates 10.4% | | | | | | |
Carlisle Cos. Inc. | | 70,317 | | | 9,873,210 | |
Honeywell International Inc. | | 359,587 | | | 62,780,294 | |
Roper Technologies Inc. | | 258,599 | | | 94,714,470 | |
| | | | | | |
| | |
| | | | | 167,367,974 | |
| | | | | | |
| | |
Insurance 2.7% | | | | | | |
Aflac Inc. | | 260,871 | | | 14,298,340 | |
Arthur J. Gallagher & Co. | | 51,643 | | | 4,523,410 | |
Erie Indemnity Co., A | | 94,349 | | | 23,991,064 | |
| | | | | | |
| | |
| | | | | 42,812,814 | |
| | | | | | |
| | |
Machinery 3.4% | | | | | | |
Donaldson Co. Inc. | | 211,247 | | | 10,744,022 | |
Dover Corp. | | 301,849 | | | 30,245,270 | |
Pentair PLC | | 377,850 | | | 14,056,020 | |
| | | | | | |
| | |
| | | | | 55,045,312 | |
| | | | | | |
| | |
Materials 11.8% | | | | | | |
Air Products and Chemicals Inc. | | 235,264 | | | 53,256,712 | |
Albemarle Corp. | | 614,330 | | | 43,254,975 | |
Ecolab Inc. | | 104,010 | | | 20,535,734 | |
Linde PLC (United Kingdom) | | 317,828 | | | 63,819,863 | |
Nucor Corp. | | 177,494 | | | 9,779,919 | |
| | | | | | |
| | |
| | | | | 190,647,203 | |
| | | | | | |
| | |
Media & Entertainment 0.3% | | | | | | |
John Wiley & Sons Inc., A | | 95,317 | | | 4,371,238 | |
| | | | | | |
| | |
Pharmaceuticals, Biotechnology & Life Sciences 3.5% | | | | | | |
AbbVie Inc. | | 137,521 | | | 10,000,527 | |
Johnson & Johnson | | 228,731 | | | 31,857,654 | |
Perrigo Co. PLC | | 121,314 | | | 5,776,973 | |
Pfizer Inc. | | 210,251 | | | 9,108,073 | |
| | | | | | |
| | |
| | | | | 56,743,227 | |
| | | | | | |
FRANKLIN TEMPLETON VARIABLE INSURANCE PRODUCTS TRUST
STATEMENT OF INVESTMENTS (UNAUDITED)
Franklin Rising Dividends VIP Fund(continued)
| | | | | | |
| | | Shares | | Value | |
| | |
Common Stocks(continued) | | | | | | |
Retailing 3.0% | | | | | | |
The Gap Inc. | | 328,296 | | $ | 5,899,479 | |
Ross Stores Inc. | | 169,172 | | | 16,768,329 | |
Target Corp. | | 130,217 | | | 11,278,094 | |
Tiffany & Co. | | 155,069 | | | 14,520,661 | |
| | | | | | |
| | |
| | | | | 48,466,563 | |
| | | | | | |
| | |
Semiconductors & Semiconductor Equipment 7.1% | | | | | | |
Analog Devices Inc. | | 472,704 | | | 53,354,100 | |
Texas Instruments Inc. | | 467,889 | | | 53,694,942 | |
Versum Materials Inc. | | 131,028 | | | 6,758,424 | |
| | | | | | |
| | |
| | | | | 113,807,466 | |
| | | | | | |
| | |
Software & Services 10.6% | | | | | | |
Accenture PLC, A | | 293,820 | | | 54,289,121 | |
Microsoft Corp. | | 769,540 | | | 103,087,578 | |
Visa Inc., A | | 81,843 | | | 14,203,853 | |
| | | | | | |
| | |
| | | | | 171,580,552 | |
| | | | | | |
| | |
Trading Companies & Distributors 0.4% | | | | | | |
W.W. Grainger Inc. | | 25,696 | | | 6,892,438 | |
| | | | | | |
| | |
Transportation 0.8% | | | | | | |
Norfolk Southern Corp. | | 22,500 | | | 4,484,925 | |
United Parcel Service Inc., B | | 78,756 | | | 8,133,132 | |
| | | | | | |
| | |
| | | | | 12,618,057 | |
| | | | | | |
| | |
Total Common Stocks (Cost $829,540,777) | | | | | 1,589,657,429 | |
| | | | | | |
| | | | | | |
Short Term Investments (Cost $22,048,750) 1.4% | | | | | | |
Money Market Funds 1.4% | | | | | | |
b,cInstitutional Fiduciary Trust Money Market Portfolio, 2.05% | | 22,048,750 | | | 22,048,750 | |
| | | | | | |
| | |
Total Investments (Cost $851,589,527) 100.0% | | | | | 1,611,706,179 | |
Other Assets, less Liabilities 0.0%† | | | | | 366,694 | |
| | | | | | |
| | |
Net Assets 100.0% | | | | $ | 1,612,072,873 | |
| | | | | | |
†Rounds to less than 0.1% of net assets.
aNon-income producing.
bSee Note 3(e) regarding investments in affiliated management investment companies.
cThe rate shown is the annualizedseven-day effective yield at period end.
| | | | | | |
| | | |
| | The accompanying notes are an integral part of these financial statements. | Semiannual Report | | | FRD-11 | |
FRANKLIN TEMPLETON VARIABLE INSURANCE PRODUCTS TRUST
FINANCIAL STATEMENTS
Statement of Assets and Liabilities
June 30, 2019 (unaudited)
| | | | |
| | | Franklin Rising
Dividends VIP
Fund | |
Assets: | | | | |
Investments in securities: | | | | |
Cost - Unaffiliated issuers | | $ | 829,540,777 | |
Cost -Non-controlled affiliates (Note 3e) | | | 22,048,750 | |
| | | | |
Value - Unaffiliated issuers | | $ | 1,589,657,429 | |
Value -Non-controlled affiliates (Note 3e) | | | 22,048,750 | |
Receivables: | | | | |
Investment securities sold | | | 1,460,617 | |
Capital shares sold | | | 323,944 | |
Dividends | | | 1,557,904 | |
Other assets | | | 956 | |
| | | | |
| |
Total assets | | | 1,615,049,600 | |
| | | | |
| |
Liabilities: | | | | |
Payables: | | | | |
Capital shares redeemed | | | 1,438,681 | |
Management fees | | | 786,456 | |
Distribution fees | | | 589,905 | |
Trustees’ fees and expenses | | | 2,110 | |
Accrued expenses and other liabilities | | | 159,575 | |
| | | | |
| |
Total liabilities | | | 2,976,727 | |
| | | | |
| |
Net assets, at value | | $ | 1,612,072,873 | |
| | | | |
Net assets consist of: | | | | |
Paid-in capital | | $ | 822,674,149 | |
Total distributable earnings (loss) | | | 789,398,724 | |
| | | | |
| |
Net assets, at value | | $ | 1,612,072,873 | |
| | | | |
| |
| Class 1: | | | | |
Net assets, at value | | $ | 179,169,008 | |
| | | | |
Shares outstanding | | | 6,907,347 | |
| | | | |
Net asset value and maximum offering price per share | | $ | 25.94 | |
| | | | |
| |
| Class 2: | | | | |
Net assets, at value | | $ | 1,393,719,957 | |
| | | | |
Shares outstanding | | | 55,462,850 | |
| | | | |
Net asset value and maximum offering price per share | | $ | 25.13 | |
| | | | |
| |
| Class 4: | | | | |
Net assets, at value | | $ | 39,183,908 | |
| | | | |
Shares outstanding | | | 1,553,696 | |
| | | | |
Net asset value and maximum offering price per share | | $ | 25.22 | |
| | | | |
| | | | |
| | | |
FRD-12 | | Semiannual Report | The accompanying notes are an integral part of these financial statements. | | |
FRANKLIN TEMPLETON VARIABLE INSURANCE PRODUCTS TRUST
FINANCIAL STATEMENTS
Statement of Operations
for the six months ended June 30, 2019 (unaudited)
| | | | |
| | | Franklin Rising
Dividends VIP
Fund | |
| |
Investment income: | | | | |
Dividends: | | | | |
Unaffiliated issuers | | | $ 14,462,123 | |
Non-controlled affiliates (Note 3e) | | | 486,228 | |
| | | | |
| |
Total investment income | | | 14,948,351 | |
| | | | |
| |
Expenses: | | | | |
Management fees (Note 3a) | | | 4,664,904 | |
Distribution fees: (Note 3c) | | | | |
Class 2 | | | 1,611,521 | |
Class 4 | | | 63,372 | |
Custodian fees (Note 4) | | | 9,000 | |
Reports to shareholders | | | 88,314 | |
Professional fees | | | 30,429 | |
Trustees’ fees and expenses | | | 6,653 | |
Other | | | 18,311 | |
| | | | |
| |
Total expenses | | | 6,492,504 | |
| |
Expense reductions (Note 4) | | | (955 | ) |
| |
Expenses waived/paid by affiliates (Note 3e) | | | (82,105 | ) |
| | | | |
| |
Net expenses | | | 6,409,444 | |
| | | | |
| |
Net investment income | | | 8,538,907 | |
| | | | |
Realized and unrealized gains (losses): | | | | |
Net realized gain (loss) from: | | | | |
Investments: | | | | |
Unaffiliated issuers | | | 23,882,379 | |
| | | | |
| |
Net change in unrealized appreciation (depreciation) on: | | | | |
Investments: | | | | |
Unaffiliated issuers | | | 235,045,693 | |
| | | | |
| |
Net realized and unrealized gain (loss) | | | 258,928,072 | |
| | | | |
| |
Net increase (decrease) in net assets resulting from operations | | | $267,466,979 | |
| | | | |
| | | | | | |
| | | |
| | The accompanying notes are an integral part of these financial statements. | Semiannual Report | | | FRD-13 | |
FRANKLIN TEMPLETON VARIABLE INSURANCE PRODUCTS TRUST
FINANCIAL STATEMENTS
Statements of Changes in Net Assets
| | | | | | | | |
| |
| | | Franklin Rising Dividends VIP Fund | |
| | |
| | | Six Months Ended
June 30, 2019
(unaudited) | | | Year Ended
December 31, 2018 | |
Increase (decrease) in net assets: | | | | | | | | |
Operations: | | | | | | | | |
Net investment income | | $ | 8,538,907 | | | $ | 20,055,601 | |
Net realized gain (loss) | | | 23,882,379 | | | | 314,858,432 | |
Net change in unrealized appreciation (depreciation) | | | 235,045,693 | | | | (398,447,639 | ) |
| | | | |
| | |
Net increase (decrease) in net assets resulting from operations | | | 267,466,979 | | | | (63,533,606 | ) |
| | | | |
Distributions to shareholders: | | | | | | | | |
Class 1 | | | (28,799,833 | ) | | | (13,329,516 | ) |
Class 2 | | | (227,983,493 | ) | | | (115,786,937 | ) |
Class 4 | | | (6,300,776 | ) | | | (2,574,964 | ) |
| | | | |
| | |
Total distributions to shareholders | | | (263,084,102 | ) | | | (131,691,417 | ) |
| | | | |
Capital share transactions: (Note 2) | | | | | | | | |
Class 1 | | | 18,533,840 | | | | (37,447,873 | ) |
Class 2 | | | 286,135,359 | | | | (364,402,663 | ) |
Class 4 | | | 6,024,024 | | | | 766,328 | |
| | | | |
| | |
Total capital share transactions | | | 310,693,223 | | | | (401,084,208 | ) |
| | | | |
| | |
Net increase (decrease) in net assets | | | 315,076,100 | | | | (596,309,231 | ) |
Net assets: | | | | | | | | |
Beginning of period | | | 1,296,996,773 | | | | 1,893,306,004 | |
| | | | |
| | |
End of period | | $ | 1,612,072,873 | | | $ | 1,296,996,773 | |
| | | | |
| | | | |
| | | |
FRD-14 | | Semiannual Report | The accompanying notes are an integral part of these financial statements. | | |
FRANKLIN TEMPLETON VARIABLE INSURANCE PRODUCTS TRUST
Notes to Financial Statements (unaudited)
Franklin Rising Dividends VIP Fund
1. Organization and Significant Accounting Policies
Franklin Templeton Variable Insurance Products Trust (Trust) is registered under the Investment Company Act of 1940 (1940 Act) as anopen-end management investment company, consisting of eighteen separate funds and applies the specialized accounting and reporting guidance in U.S. Generally Accepted Accounting Principles (U.S. GAAP). Franklin Rising Dividends VIP Fund (Fund) is included in this report. Shares of the Fund are generally sold only to insurance company separate accounts to fund the benefits of variable life insurance policies or variable annuity contracts. The Fund offers three classes of shares: Class 1, Class 2 and Class 4. Each class of shares may differ by its distribution fees, voting rights on matters affecting a single class and its exchange privilege.
The following summarizes the Fund’s significant accounting policies.
a. Financial Instrument Valuation
The Fund’s investments in financial instruments are carried at fair value daily. Fair value is the price that would be received to sell an asset or paid to transfer a liability in an orderly transaction between market participants on the measurement date. The Fund calculates the net asset value (NAV) per share each business day as of 4 p.m. Eastern time or the regularly scheduled close of the New York Stock Exchange (NYSE), whichever is earlier. Under compliance policies and procedures approved by the Trust’s Board of Trustees (the Board), the Fund’s administrator has responsibility for oversight of valuation, including leading the cross-functional Valuation Committee (VC). The Fund may utilize independent pricing services, quotations from securities and financial instrument dealers, and other market sources to determine fair value.
Equity securities listed on an exchange or on the NASDAQ National Market System are valued at the last quoted sale price or the official closing price of the day, respectively. Foreign equity securities are valued as of the close of trading on the foreign stock exchange on which the security is primarily traded, or as of 4 p.m. Eastern time. The value is then converted into its U.S. dollar equivalent at the foreign exchange rate in effect at 4 p.m. Eastern time on the day that the value of the security is determined.Over-the-counter (OTC) securities are valued within the range of the most recent quoted bid and ask prices. Securities that trade in multiple markets or on multiple exchanges are valued
according to the broadest and most representative market. Certain equity securities are valued based upon fundamental characteristics or relationships to similar securities.
Investments inopen-end mutual funds are valued at the closing NAV.
The Fund has procedures to determine the fair value of financial instruments for which market prices are not reliable or readily available. Under these procedures, the Fund primarily employs a market-based approach which may use related or comparable assets or liabilities, recent transactions, market multiples, book values, and other relevant information for the investment to determine the fair value of the investment. An income-based valuation approach may also be used in which the anticipated future cash flows of the investment are discounted to calculate fair value. Discounts may also be applied due to the nature or duration of any restrictions on the disposition of the investments. Due to the inherent uncertainty of valuations of such investments, the fair values may differ significantly from the values that would have been used had an active market existed.
Trading in securities on foreign securities stock exchanges and OTC markets may be completed before 4 p.m. Eastern time. In addition, trading in certain foreign markets may not take place on every Fund’s business day. Occasionally, events occur between the time at which trading in a foreign security is completed and 4 p.m. Eastern time that might call into question the reliability of the value of a portfolio security held by the Fund. As a result, differences may arise between the value of the Fund’s portfolio securities as determined at the foreign market close and the latest indications of value at 4 p.m. Eastern time. In order to minimize the potential for these differences, the VC monitors price movements following the close of trading in foreign stock markets through a series of country specific market proxies (such as baskets of American Depositary Receipts, futures contracts and exchange traded funds). These price movements are measured against established trigger thresholds for each specific market proxy to assist in determining if an event has occurred that may call into question the reliability of the values of the foreign securities held by the Fund. If such an event occurs, the securities may be valued using fair value procedures, which may include the use of independent pricing services.
FRANKLIN TEMPLETON VARIABLE INSURANCE PRODUCTS TRUST
NOTES TO FINANCIAL STATEMENTS (UNAUDITED)
Franklin Rising Dividends VIP Fund(continued)
1. Organization and Significant Accounting Policies(continued)
a. Financial Instrument Valuation(continued)
When the last day of the reporting period is anon-business day, certain foreign markets may be open on those days that the Fund’s NAV is not calculated, which could result in differences between the value of the Fund’s portfolio securities on the last business day and the last calendar day of the reporting period. Any significant security valuation changes due to an open foreign market are adjusted and reflected by the Fund for financial reporting purposes.
b. Foreign Currency Translation
Portfolio securities and other assets and liabilities denominated in foreign currencies are translated into U.S. dollars based on the exchange rate of such currencies against U.S. dollars on the date of valuation. The Fund may enter into foreign currency exchange contracts to facilitate transactions denominated in a foreign currency. Purchases and sales of securities, income and expense items denominated in foreign currencies are translated into U.S. dollars at the exchange rate in effect on the transaction date. Portfolio securities and assets and liabilities denominated in foreign currencies contain risks that those currencies will decline in value relative to the U.S. dollar. Occasionally, events may impact the availability or reliability of foreign exchange rates used to convert the U.S. dollar equivalent value. If such an event occurs, the foreign exchange rate will be valued at fair value using procedures established and approved by the Board.
The Fund does not separately report the effect of changes in foreign exchange rates from changes in market prices on securities held. Such changes are included in net realized and unrealized gain or loss from investments in the Statement of Operations.
Realized foreign exchange gains or losses arise from sales of foreign currencies, currency gains or losses realized between the trade and settlement dates on securities transactions and the difference between the recorded amounts of dividends, interest, and foreign withholding taxes and the U.S. dollar equivalent of the amounts actually received or paid. Net unrealized foreign exchange gains and losses arise from changes in foreign exchange rates on foreign denominated assets and liabilities other than investments in securities held at the end of the reporting period.
c. Income and Deferred Taxes
It is the Fund’s policy to qualify as a regulated investment company under the Internal Revenue Code. The Fund intends to distribute to shareholders substantially all of its taxable income and net realized gains to relieve it from federal income and if applicable, excise taxes. As a result, no provision for U.S. federal income taxes is required.
The Fund may be subject to foreign taxation related to income received, capital gains on the sale of securities and certain foreign currency transactions in the foreign jurisdictions in which it invests. Foreign taxes, if any, are recorded based on the tax regulations and rates that exist in the foreign markets in which the Fund invests. When a capital gain tax is determined to apply, the Fund records an estimated deferred tax liability in an amount that would be payable if the securities were disposed of on the valuation date.
The Fund may recognize an income tax liability related to its uncertain tax positions under U.S. GAAP when the uncertain tax position has a less than 50% probability that it will be sustained upon examination by the tax authorities based on its technical merits. As of June 30, 2019, the Fund has determined that no tax liability is required in its financial statements related to uncertain tax positions for any open tax years (or expected to be taken in future tax years). Open tax years are those that remain subject to examination and are based on the statute of limitations in each jurisdiction in which the Fund invests.
d. Security Transactions, Investment Income, Expenses and Distributions
Security transactions are accounted for on trade date. Realized gains and losses on security transactions are determined on a specific identification basis. Estimated expenses are accrued daily. Dividend income is recorded on theex-dividend date except for certain dividends from securities where the dividend rate is not available. In such cases, the dividend is recorded as soon as the information is received by the Fund. Distributions to shareholders are recorded on theex-dividend date. Distributable earnings are determined according to income tax regulations (tax basis) and may differ from earnings recorded in accordance with U.S. GAAP. These differences may be permanent or temporary. Permanent differences are reclassified among capital accounts to reflect their tax character. These
FRANKLIN TEMPLETON VARIABLE INSURANCE PRODUCTS TRUST
NOTES TO FINANCIAL STATEMENTS (UNAUDITED)
Franklin Rising Dividends VIP Fund(continued)
reclassifications have no impact on net assets or the results of operations. Temporary differences are not reclassified, as they may reverse in subsequent periods.
Common expenses incurred by the Trust are allocated among the Funds based on the ratio of net assets of each Fund to the combined net assets of the Trust or based on the ratio of number of shareholders of each Fund to the combined number of shareholders of the Trust. Fund specific expenses are charged directly to the Fund that incurred the expense.
Realized and unrealized gains and losses and net investment income, excluding class specific expenses, are allocated daily to each class of shares based upon the relative proportion of net assets of each class. Differences in per share distributions by class are generally due to differences in class specific expenses.
e. Accounting Estimates
The preparation of financial statements in accordance with U.S. GAAP requires management to make estimates and assumptions that affect the reported amounts of assets and
liabilities at the date of the financial statements and the amounts of income and expenses during the reporting period. Actual results could differ from those estimates.
f. Guarantees and Indemnifications
Under the Trust’s organizational documents, its officers and trustees are indemnified by the Trust against certain liabilities arising out of the performance of their duties to the Trust. Additionally, in the normal course of business, the Trust, on behalf of the Fund, enters into contracts with service providers that contain general indemnification clauses. The Trust’s maximum exposure under these arrangements is unknown as this would involve future claims that may be made against the Trust that have not yet occurred. Currently, the Trust expects the risk of loss to be remote.
2. Shares of Beneficial Interest
At June 30, 2019, there were an unlimited number of shares authorized (without par value). Transactions in the Fund’s shares were as follows:
| | | | | | | | | | | | | | | | | | | | |
| | | |
| | | Six Months Ended June 30, 2019 | | | | | | Year Ended December 31, 2018 | |
| | | | | |
| | | Shares | | | Amount | | | | | | Shares | | | Amount | |
| | | | | |
| Class 1 Shares: | | | | | | | | | | | | | | | | | | | | |
| | | | | |
Shares sold | | | 103,609 | | | $ | 2,877,106 | | | | | | | | 296,177 | | | $ | 8,482,359 | |
| | | | | |
Shares issued in reinvestment of distributions | | | 1,132,514 | | | | 28,799,833 | | | | | | | | 481,211 | | | | 13,329,516 | |
| | | | | |
Shares redeemed | | | (458,204 | ) | | | (13,143,099 | ) | | | | | | | (2,043,710 | ) | | | (59,259,748) | |
| |
| | | | |
| | | | | |
Net increase (decrease) | | | 777,919 | | | $ | 18,533,840 | | | | | | | | (1,266,322 | ) | | $ | (37,447,873) | |
| | | | |
| | | | | |
| Class 2 Shares: | | | | | | | | | | | | | | | | | | | | |
| | | | | |
Shares sold | | | 6,310,410 | | | $ | 174,923,723 | | | | | | | | 3,479,467 | | | $ | 95,894,196 | |
| | | | | |
Shares issued in reinvestment of distributions | | | 9,252,577 | | | | 227,983,493 | | | | | | | | 4,293,174 | | | | 115,786,937 | |
| | | | | |
Shares redeemedin-kind (Note 8) | | | — | | | | — | | | | | | | | (5,455,397 | ) | | | (147,395,561) | |
| | | | | |
Shares redeemed | | | (4,284,464 | ) | | | (116,771,857 | ) | | | | | | | (15,794,114 | ) | | | (428,688,235) | |
| |
| | | | |
| | | | | |
Net increase (decrease) | | | 11,278,523 | | | $ | 286,135,359 | | | | | | | | (13,476,870 | ) | | $ | (364,402,663) | |
| | | | |
| | | | | |
| Class 4 Shares: | | | | | | | | | | | | | | | | | | | | |
| | | | | |
Shares sold | | | 120,629 | | | $ | 3,314,382 | | | | | | | | 206,879 | | | $ | 5,727,225 | |
| | | | | |
Shares issued in reinvestment of distributions | | | 254,783 | | | | 6,300,776 | | | | | | | | 95,123 | | | | 2,574,964 | |
| | | | | |
Shares redeemed | | | (128,731 | ) | | | (3,591,134 | ) | | | | | | | (270,440 | ) | | | (7,535,861) | |
| |
| | | | |
| | | | | |
Net increase (decrease) | | | 246,681 | | | $ | 6,024,024 | | | | | | | | 31,562 | | | $ | 766,328 | |
| | | | |
FRANKLIN TEMPLETON VARIABLE INSURANCE PRODUCTS TRUST
NOTES TO FINANCIAL STATEMENTS (UNAUDITED)
Franklin Rising Dividends VIP Fund(continued)
3. Transactions with Affiliates
Franklin Resources, Inc. is the holding company for various subsidiaries that together are referred to as Franklin Templeton. Certain officers and trustees of the Fund are also officers and/or directors of the following subsidiaries:
| | |
| |
| Subsidiary | | Affiliation |
Franklin Advisers, Inc. (Advisers) | | Investment manager |
Franklin Templeton Services, LLC (FT Services) | | Administrative manager |
Franklin Templeton Distributors, Inc. (Distributors) | | Principal underwriter |
Franklin Templeton Investor Services, LLC (Investor Services) | | Transfer agent |
a. Management Fees
The Fund pays an investment management fee to Advisers based on the average daily net assets of the Fund as follows:
| | |
| |
| Annualized Fee Rate | | Net Assets |
0.750% | | Up to and including $500 million |
0.625% | | Over $500 million, up to and including $1 billion |
0.500% | | Over $1 billion, up to and including $5 billion |
0.490% | | In excess of $5 billion |
For the period ended June 30, 2019, the annualized gross effective investment management fee rate was 0.624% of the Fund’s average daily net assets.
b. Administrative Fees
Under an agreement with Advisers, FT Services provides administrative services to the Fund. The fee is paid by Advisers based on the Fund’s average daily net assets, and is not an additional expense of the Fund.
c. Distribution Fees
The Board has adopted distribution plans for Class 2 and Class 4 shares pursuant to Rule12b-1 under the 1940 Act. Under the Fund’s compensation distribution plans, the Fund pays Distributors for costs incurred in connection with the servicing, sale and distribution of the Fund’s shares up to 0.35% per year of its average daily net assets of each class. The Board has agreed to limit the current rate to 0.25% per year for Class 2. The plan year, for purposes of monitoring compliance with the maximum annual plan rates, is February 1 through January 31.
d. Transfer Agent Fees
Investor Services, under terms of an agreement, performs shareholder servicing for the Fund and is not paid by the Fund for the services.
FRANKLIN TEMPLETON VARIABLE INSURANCE PRODUCTS TRUST
NOTES TO FINANCIAL STATEMENTS (UNAUDITED)
Franklin Rising Dividends VIP Fund(continued)
e. Investments in Affiliated Management Investment Companies
The Fund invests in one or more affiliated management investment companies for purposes other than exercising a controlling influence over the management or policies. Management fees paid by the Fund are waived on assets invested in the affiliated management investment companies, as noted in the Statement of Operations, in an amount not to exceed the management and administrative fees paid directly or indirectly by each affiliate. During the period ended June 30, 2019, the Fund held investments in affiliated management investment companies as follows:
| | | | | | | | | | | | | | | | | | | | | | | | | | | | | | | | |
| | | | | | | | |
| | | Value at
Beginning
of Period | | | Purchases | | | Sales | | | Realized
Gain (Loss) | | | Net Change in
Unrealized
Appreciation
(Depreciation) | | | Value at
End of
Period | | | Number of
Shares
Held at End
of Period | | | Dividend
Income | |
| Non-Controlled Affiliates | | | | | | | | | | | | | | | | | | | | | | | | | | | | | | | | |
Institutional Fiduciary Trust Money Market Portfolio, 2.05% | | | $8,504,577 | | | | $135,744,610 | | | | $(122,200,437 | ) | | | $ — | | | | $ — | | | | $22,048,750 | | | | 22,048,750 | | | | $486,228 | |
| | | | | | | | | | | | |
4. Expense Offset Arrangement
The Fund has entered into an arrangement with its custodian whereby credits realized as a result of uninvested cash balances are used to reduce a portion of the Fund’s custodian expenses. During the period ended June 30, 2019, the custodian fees were reduced as noted in the Statement of Operations.
5. Income Taxes
At June 30, 2019, the cost of investments and net unrealized appreciation (depreciation) for income tax purposes were as follows:
| | | | |
Cost of investments | | | $854,656,620 | |
| | | | |
| |
Unrealized appreciation | | | $820,900,111 | |
| |
Unrealized depreciation | | | (63,850,552) | |
| | | | |
| |
Net unrealized appreciation (depreciation) | | | $757,049,559 | |
| | | | |
Differences between income and/or capital gains as determined on a book basis and a tax basis are primarily due to differing treatment of corporate actions.
6. Investment Transactions
Purchases and sales of investments (excluding short term securities) for the period ended June 30, 2019, aggregated $81,707,375 and $45,789,777, respectively.
7. Credit Facility
The Fund, together with other U.S. registered and foreign investment funds (collectively, Borrowers), managed by Franklin Templeton, are borrowers in a joint syndicated senior unsecured credit facility totaling $2 billion (Global Credit Facility) which matures on February 7, 2020. This Global Credit Facility provides a source of funds to the Borrowers for temporary and emergency purposes, including the ability to meet future unanticipated or unusually large redemption requests.
FRANKLIN TEMPLETON VARIABLE INSURANCE PRODUCTS TRUST
NOTES TO FINANCIAL STATEMENTS (UNAUDITED)
Franklin Rising Dividends VIP Fund(continued)
7. Credit Facility(continued)
Under the terms of the Global Credit Facility, the Fund shall, in addition to interest charged on any borrowings made by the Fund and other costs incurred by the Fund, pay its share of fees and expenses incurred in connection with the implementation and maintenance of the Global Credit Facility, based upon its relative share of the aggregate net assets of all of the Borrowers, including an annual commitment fee of 0.15% based upon the unused portion of the Global Credit Facility. These fees are reflected in other expenses in the Statement of Operations. During the period ended June 30, 2019, the Fund did not use the Global Credit Facility.
8. RedemptionIn-Kind
During the year ended December 31, 2018, the Fund realized $70,642,118 of net gains resulting from a redemptionin-kind in which a shareholder redeemed fund shares for cash and securities held by the Fund. Because such gains are not taxable to the Fund and are not distributed to remaining shareholders, they are reclassified from accumulated net realized gains topaid-in capital.
9. Fair Value Measurements
The Fund follows a fair value hierarchy that distinguishes between market data obtained from independent sources (observable inputs) and the Fund’s own market assumptions (unobservable inputs). These inputs are used in determining the value of the Fund’s financial instruments and are summarized in the following fair value hierarchy:
| | • | | Level 1 – quoted prices in active markets for identical financial instruments |
| | • | | Level 2 – other significant observable inputs (including quoted prices for similar financial instruments, interest rates, prepayment speed, credit risk, etc.) |
| | • | | Level 3 – significant unobservable inputs (including the Fund’s own assumptions in determining the fair value of financial instruments) |
The input levels are not necessarily an indication of the risk or liquidity associated with financial instruments at that level.
At June 30, 2019, all of the Fund’s investments in financial instruments carried at fair value were valued using Level 1 inputs. For detailed categories, see the accompanying Statement of Investments.
10. Subsequent Events
The Fund has evaluated subsequent events through the issuance of the financial statements and determined that no events have occurred that require disclosure.
Franklin Small Cap Value VIP Fund
This semiannual report for Franklin Small Cap Value VIP Fund covers the period ended June 30, 2019.
Class 2 Performance Summary as of June 30, 2019
The Fund’s Class 2 Shares posted a +11.99% total return* for thesix-month period ended June 30, 2019.
*The Fund has a fee waiver associated with any investment it makes in a Franklin Templeton money fund and/or other Franklin Templeton fund, contractually guaranteed through 4/30/20. Fund investment results reflect the fee waiver; without this waiver, the results would have been lower.
Performance reflects the Fund’s Class 2 operating expenses, but doesnotinclude any contract fees, expenses or sales charges. If they had been included, performance would be lower. These charges and deductions, particularly for variable life policies, can have a significant effect on contract values and insurance benefits. See the contract prospectus for a complete description of these expenses, including sales charges.
Performance data represent past performance, which does not guarantee future results. Investment return and principal value will fluctuate, and you may have a gain or loss when you sell your shares. Current performance may differ from figures shown.
FRANKLIN SMALL CAP VALUE VIP FUND
Fund Goal and Main Investments
The Fund seeks long-term total return. Under normal market conditions, the Fund invests at least 80% of its net assets in investments of small capitalization companies. For this Fund, small capitalization companies are those with market capitalizations not exceeding either the highest market capitalization in the Russell 2000® Index or the12-month average of the highest market capitalization in the Russell 2000® Index, whichever is greater, at the time of purchase. The Fund generally invests in equity securities of companies that the manager believes are undervalued at the time of purchase and have the potential for capital appreciation.
Fund Risks
All investments involve risks, including possible loss of principal. Value securities may not increase in price as anticipated, or may decline further in value. The Fund’s investments in smaller company stocks carry special risks as such stocks have historically exhibited greater price volatility than large-company stocks, particularly over the short term. Additionally, smaller companies often have relatively small revenues, limited product lines and a small market share. In addition, the Fund may invest up to 25% of its total assets in foreign securities, which involve special risks, including currency fluctuations and economic and political uncertainty. The Fund also may invest in equity real estate investment trusts (REITs). The Fund is actively managed but there is no guarantee that the manager’s investment decisions will produce the desired results. The Fund’s prospectus also includes a description of the main investment risks.
Performance Overview
You can find the Fund’ssix-month total return in the Performance Summary. In comparison, the Russell 2000® Value Index posted a +13.47% total return for the same period.1 Please note the Fund employs abottom-up stock selection process, and the managers invest in securities without regard to benchmark comparisons.
Economic and Market Overview
The U.S. economy grew during the six months ended June 30, 2019. After moderating for two consecutive quarters, the economy grew significantly faster in 2019’s first
quarter, driven by growth in consumer spending, inventory investment, exports, business investment, and state and local government spending. However, the economy moderated again in the second quarter, due to weakness in inventory investment, exports, business investment and housing investment. The manufacturing and services sectors expanded during the period. The unemployment rate decreased from 3.9% in December 2018 to 3.7% atperiod-end.2 The annual inflation rate, as measured by the Consumer Price Index, decreased from 1.9% in December 2018 to 1.6% atperiod-end.2
The U.S. Federal Reserve (Fed) held its target range for the federal funds rate unchanged, at 2.25%–2.50%, during the reporting period. In March, the Fed mentioned it would end its balance sheet normalization program by the end of September 2019. In June, the Fed indicated increased uncertainties around its views on economic activity and the labor market. With market-based inflation measures remaining low in recent months, the market has interpreted the Fed’s recent statements to mean it will likely cut rates in 2019’s second half to foster continued economic growth while attempting to achieve its inflation objective.
U.S. equity markets overall rose during the period, benefiting from upbeat economic data and U.S. corporate earnings. However, markets reflected concerns about tighter regulation of technology companies, U.S. political uncertainties, and the impact of U.S. trade disputes with China and other trading partners on global growth and corporate earnings. These concerns were partially alleviated in 2019’s first four months by easing trade tensions and optimism about a potential U.S.-China trade deal. Furthermore, markets benefited from the Fed’s indications of a patient approach to its monetary policy decisions. The broad U.S. stock market, as measured by the Standard & Poor’s® 500 Index (S&P 500®), rallied in 2019’s first four months, reaching a newall-time high in April 2019. After declining in May due to escalating trade tensions, stocks reached anotherall-time high in June amid investor optimism about potential interest-rate cuts. Overall, the S&P 500 posted a +18.54% total return for thesix-month period.1
1. Source: Morningstar. One cannot invest directly in an index, and an index is not representative of the Fund’s portfolio. Please see Index Descriptions following the Fund Summaries.
2. Source: Bureau of Labor Statistics.
The dollar value, number of shares or principal amount, and names of all portfolio holdings are listed in the Fund’s Statement of Investments (SOI).
FRANKLIN SMALL CAP VALUE VIP FUND
Investment Strategy
Our strategy is to invest insmall-cap companies that we believe are undervalued at the time of purchase and have the potential for capital appreciation. A stock is undervalued, or is a “value,” when it trades at less than the price at which the investment manager believes it would trade if the market reflected all factors relating to the company’s worth. Following this strategy, the Fund invests in companies that the investment manager believes have, for example: stock prices that are low relative to current, or historical or future earnings, book value, cash flow or sales; recent sharp price declines but the potential for good long-term earnings prospects; and valuable intangibles not reflected in the stock price. The Fund also may invest in equity real estate investment trusts (REITs).
The Fund may invest up to 25% of its total assets in foreign securities.
Manager’s Discussion
During the six months under review, holdings that positively contributed to Fund performance included Dairy Crest Group (sold atperiod-end), Versum Materials (sold atperiod-end) and Carpenter Technologies.
Dairy Crest, a U.K.-based dairy products company, benefited inmid-February 2019 from the company agreeing to a takeover offer from Saputo (not a Fund holding) for a 30% premium to the share price before the announcement of the agreement and any unusual preannouncement price changes based on speculation. As a result of the takeover offer and subsequent increase in the stock price, we exited the position atperiod-end.
Versum Materials is a specialty materials and equipment company that primarily supplies the semiconductor end market. The company agreed to be acquired by Merck KGaA (not a Fund holding) for $53 per share atperiod-end. The revised offer was higher than Merck KGaA’s initial offer of $48 and substantially higher than Entegris’s (not a Fund holding) competing offer of approximately $41. Merck’s offer represented a 68% premium to Versum’s share price on the day prior to the announcement of the Entegris merger. We exited the position prior toperiod-end.
Shares of Carpenter Technologies delivered strong performance during thesix-month reporting period driven by favorable quarterly results. Specifically, the company’s revenue and profits continue to expand due to demand for their commercial aerospace specialty metals. Revenue derived from the aerospaceend-market has increased for 10 consecutive quarters and profit margins continued to
Portfolio Composition
Based on Total Net Assets as of 6/30/19
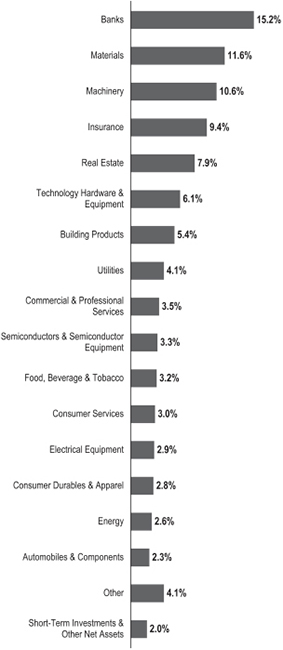
improve as a result of improving product mix and operational improvement. Although recent delays in Boeing’s 737 Max launch represents a risk, in our opinion, we continue to like the prospects for Carpenter due to the large commercial aerospace backlogs at Boeing and Airbus and their respective jet engine suppliers.
FRANKLIN SMALL CAP VALUE VIP FUND
Top 10 Holdings
6/30/19
| | | | |
Company
Sector/Industry | | % of Total
Net Assets | |
The Hanover Insurance Group Inc. Insurance | | | 3.7% | |
Old Republic International Corp. Insurance | | | 3.1% | |
Gibraltar Industries Inc. Building Products | | | 2.9% | |
Mueller Water Products Inc. Machinery | | | 2.8% | |
Maple Leaf Foods Inc. Food, Beverage & Tobacco | | | 2.8% | |
Eagle Materials Inc. Materials | | | 2.7% | |
First Horizon National Corp. Banks | | | 2.6% | |
Horace Mann Educators Corp. Insurance | | | 2.6% | |
McGrath RentCorp Commercial & Professional Services | | | 2.5% | |
Regal Beloit Corp. Electrical Equipment | | | 2.5% | |
Detractors from Fund performance included OceanaGold, Caleres and Synaptics.
Despite a 10% increase in the price of gold during the period, shares of OceanaGold meaningfully declined due to concerns over the company’s ability to renew its production permit for the Didipio mine located in the Philippines as environmental groups placed pressure on the government. The company maintains that it exceeds all environmental requirements and it continues to operate the mine while its permit is under review. Although we think most of the risk is already factored into the share price, we slightly reduced our position.
Caleres, a designer and retailer of women’s and family footwear, reported quarterly results that fell short of investor expectations due to price discounting in its Famous Footwear and Allen Edmonds businesses, as well as higher operating expenses related toe-commerce sales. Management expects these challenges to continue in the near term as it prepares for the importantback-to-school season, and is relying on the strength of its women’s shoe brand portfolio to help it achieve its projected modest growth for the year.
Synaptics, a developer and seller of intuitive human interface solutions for electronic devices, fell during the period
primarily due to the weakness in the smartphone market and news of potential market share loss for some of its products. In addition to the weakness in operations, the company also experiencedtop-level executive turnover as both the chief executive officer and chief financial officer (with the latter leaving to join another public company) departed from the company. We retained a position, albeit substantially reduced, as historically the company has been the leading innovator in its markets and therefore we believe the intrinsic value to be higher than current market value.
During the reporting period, we added some new positions with the largest purchases including Eagle Materials, a producer of building materials; Cinemark, a movie theater chain; and Wyndham Hotels and Resorts, a hotel and resort chain. We added to existing positions in Kennametal, a supplier of tooling and industrial materials; Universal Forest Products, a manufacturer and distributer of wood and wood-alternative products; and Coherent, a laser manufacturer. Conversely, we exited some positions including AAR and the aforementioned Versum Materials and Dairy Crest Group. We also reduced our positions in Brinker International, Heartland Express and the aforementioned Synaptics.
Thank you for your participation in Franklin Small Cap Value VIP Fund. We look forward to serving your future investment needs.
The foregoing information reflects our analysis, opinions and portfolio holdings as of June 30, 2019, the end of the reporting period. The way we implement our main investment strategies and the resulting portfolio holdings may change depending on factors such as market and economic conditions. These opinions may not be relied upon as investment advice or an offer for a particular security. The information is not a complete analysis of every aspect of any market, country, industry, security or the Fund. Statements of fact are from sources considered reliable, but the investment manager makes no representation or warranty as to their completeness or accuracy. Although historical performance is no guarantee of future results, these insights may help you understand our investment management philosophy.
FRANKLIN SMALL CAP VALUE VIP FUND
Class 2 Fund Expenses
As an investor in a variable insurance contract (Contract) that indirectly provides for investment in an underlying mutual fund, you can incur transaction and/or ongoing expenses at both the Fund level and the Contract Level: (1) transaction expenses can include sales charges (loads) on purchases, surrender fees, transfer fees and premium taxes; and (2) ongoing expenses can include management fees, distribution and service(12b-1) fees, contract fees, annual maintenance fees, mortality and expense risk fees and other fees and expenses. All mutual funds and Contracts have some types of ongoing expenses. The table below shows Fund-level ongoing expenses and can help you understand these costs and compare them with those of other mutual funds offered through the Contract. The table assumes a $1,000 investment held for the six months indicated. Please refer to the Fund prospectus for additional information on operating expenses.
Actual Fund Expenses
The table below provides information about the actual account values and actual expenses in the columns under the heading “Actual.” In these columns the Fund’s actual return, which includes the effect of ongoing Fund expenses but does not include the effect of ongoing Contract expenses, is used to calculate the “Ending Account Value.” You can estimate the Fund-level expenses you paid during the period by following these steps (of course, your account value and expenses will differ from those in this illustration): Divide your account value by $1,000 (if your account had an $8,600 value, then $8,600÷ $1,000 =8.6). Then multiply the result by the number under the headings “Actual” and “Fund-Level Expenses Paid During Period” (if Fund-Level Expenses Paid During Period were $ 7.50, then 8.6 x $ 7.50 = $64.50). In this illustration, the estimated expenses paid this period at the Fund level are $64.50.
Hypothetical Example for Comparison with Other Mutual Funds
Under the heading “Hypothetical” in the table, information is provided about hypothetical account values and hypothetical expenses based on the Fund’s actual expense ratio and an assumed rate of return of 5% per year before expenses, which is not the Fund’s actual return. This information may not be used to estimate the actual ending account balance or expenses you paid for the period, but it can help you compare ongoing costs of investing in the Fund with those of other mutual funds offered through the Contract. To do so, compare this 5% hypothetical example with the 5% hypothetical examples that appear in the shareholder reports of other funds offered through the Contract.
Please note that expenses shown in the table are meant to highlight ongoing costs at the Fund level only and do not reflect any ongoing expenses at the Contract level, or transaction expenses at either the Fund or Contract levels. In addition, while the Fund does not have transaction expenses, if the transaction and ongoing expenses at the Contract level were included, the expenses shown below would be higher. You should consult your Contract prospectus or disclosure document for more information.
| | | | | | | | | | | | | | | | | | |
| | | | | | | Actual
(actual return after expenses) | | | | Hypothetical
(5% annual return before expenses) | | | | |
Share Class | | Beginning
Account
Value 1/1/19 | | | | Ending
Account
Value 6/30/19 | | Fund-Level
Expenses
Paid During
Period
1/1/19–6/30/191, 2 | | | | Ending
Account
Value 6/30/19 | | Fund-Level
Expenses
Paid During Period
1/1/19–6/30/191,2 | | | | Net
Annualized
Expense
Ratio2 |
Class 2 | | $1,000 | | | | $1,119.90 | | $4.84 | | | | $1,020.23 | | $4.61 | | | | 0.92% |
1. Expenses are equal to the annualized expense ratio for thesix-month period as indicated above—in the far right column—multiplied by the simple average account value over the period indicated, and then multiplied by 181/365 to reflect theone-half year period.
2. Reflects expenses after fee waivers and expense reimbursements. Does not include any ongoing expenses of the Contract for which the Fund is an investment option or acquired fund fees and expenses.
FRANKLIN TEMPLETON VARIABLE INSURANCE PRODUCTS TRUST
Financial Highlights
Franklin Small Cap Value VIP Fund
| | | | | | | | | | | | | | | | | | | | | | | | |
| | |
| | | Six Months Ended
June 30, 2019 (unaudited) | | | Year Ended December 31, | |
| | | 2018 | | | 2017 | | | 2016 | | | 2015 | | | 2014 | |
| |
| | | | | | |
| Class 1 | | | | | | | | | | | | | | | | | | | | | | | | |
| | | | | | |
Per share operating performance (for a share outstanding throughout the period) | | | | | | | | | | | | | | | | | | | | | | | | |
| | | | | | |
Net asset value, beginning of period | | | $15.14 | | | | $20.43 | | | | $19.93 | | | | $18.12 | | | | $22.81 | | | | $24.54 | |
| | | | |
| | | | | | |
| Income from investment operationsa: | | | | | | | | | | | | | | | | | | | | | | | | |
| | | | | | |
Net investment incomeb | | | 0.12 | | | | 0.21 | | | | 0.21 | c | | | 0.15 | | | | 0.21 | | | | 0.19 | |
| | | | | | |
Net realized and unrealized gains (losses) | | | 1.66 | | | | (2.29 | ) | | | 1.82 | | | | 4.79 | | | | (1.53 | ) | | | 0.06 | |
| | | | |
| | | | | | |
Total from investment operations | | | 1.78 | | | | (2.08 | ) | | | 2.03 | | | | 4.94 | | | | (1.32 | ) | | | 0.25 | |
| | | | |
| | | | | | |
| Less distributions from: | | | | | | | | | | | | | | | | | | | | | | | | |
| | | | | | |
Net investment income | | | (0.22 | ) | | | (0.23 | ) | | | (0.15 | ) | | | (0.21 | ) | | | (0.20 | ) | | | (0.20) | |
| | | | | | |
Net realized gains | | | (2.78 | ) | | | (2.98 | ) | | | (1.38 | ) | | | (2.92 | ) | | | (3.17 | ) | | | (1.78) | |
| | | | |
| | | | | | |
Total distributions | | | (3.00 | ) | | | (3.21 | ) | | | (1.53 | ) | | | (3.13 | ) | | | (3.37 | ) | | | (1.98) | |
| | | | |
| | | | | | |
Net asset value, end of period | | | $13.92 | | | | $15.14 | | | | $20.43 | | | | $19.93 | | | | $18.12 | | | | $22.81 | |
| | | | |
| | | | | | |
Total returnd | | | 12.14% | | | | (12.69)% | | | | 10.92% | | | | 30.54% | | | | (7.18)% | | | | 0.88% | |
| | | | | | |
| Ratios to average net assetse | | | | | | | | | | | | | | | | | | | | | | | | |
| | | | | | |
Expenses before waiver and payments by affiliates | | | 0.68% | | | | 0.66% | | | | 0.66% | | | | 0.66% | | | | 0.65% | | | | 0.63% | |
| | | | | | |
Expenses net of waiver and payments by affiliatesf | | | 0.67% | | | | 0.65% | | | | 0.65% | | | | 0.64% | | | | 0.64% | | | | 0.63%g | |
| | | | | | |
Net investment income | | | 1.51% | | | | 1.13% | | | | 1.06% | c | | | 0.84% | | | | 1.04% | | | | 0.82% | |
| | | | | | |
| Supplemental data | | | | | | | | | | | | | | | | | | | | | | | | |
| | | | | | |
Net assets, end of period (000’s) | | | $43,554 | | | | $40,644 | | | | $51,245 | | | | $47,831 | | | | $45,897 | | | | $57,843 | |
| | | | | | |
Portfolio turnover rate | | | 29.33% | | | | 47.82% | | | | 33.36% | | | | 34.60% | | | | 27.05% | | | | 19.45% | |
aThe amount shown for a share outstanding throughout the period may not correlate with the Statement of Operations for the period due to the timing of sales and repurchases of the Fund’s shares in relation to income earned and/or fluctuating fair value of the investments of the Fund.
bBased on average daily shares outstanding.
cNet investment income per share includes approximately $0.06 per share related to income received in the form of special dividends in connection with certain Fund holdings. Excluding this amount, the ratio of net investment income to average net assets would have been 0.75%.
dTotal return does not include fees, charges or expenses imposed by the variable annuity and life insurance contracts for which Franklin Templeton Variable Insurance Products Trust serves as an underlying investment vehicle. Total return is not annualized for periods less than one year.
eRatios are annualized for periods less than one year.
fBenefit of expense reduction rounds to less than 0.01%.
gBenefit of waiver and payments by affiliates rounds to less than 0.01%.
| | | | |
| | | |
FSV-6 | | Semiannual Report | The accompanying notes are an integral part of these financial statements. | | |
FRANKLIN TEMPLETON VARIABLE INSURANCE PRODUCTS TRUST
FINANCIAL HIGHLIGHTS
Franklin Small Cap Value VIP Fund(continued)
| | | | | | | | | | | | | | | | | | | | | | | | |
| | |
| | | Six Months Ended
June 30, 2019 (unaudited) | | | Year Ended December 31, | |
| | | 2018 | | | 2017 | | | 2016 | | | 2015 | | | 2014 | |
| |
| | | | | | |
Class 2 | | | | | | | | | | | | | | | | | | | | | | | | |
Per share operating performance (for a share outstanding throughout the period) | | | | | | | | | | | | | | | | | | | | | | | | |
| | | | | | |
Net asset value, beginning of period | | | $14.60 | | | | $19.80 | | | | $19.36 | | | | $17.68 | | | | $22.32 | | | | $24.07 | |
| | | | |
| | | | | | |
| Income from investment operationsa: | | | | | | | | | | | | | | | | | | | | | | | | |
| | | | | | |
Net investment incomeb | | | 0.10 | | | | 0.16 | | | | 0.15 | c | | | 0.10 | | | | 0.16 | | | | 0.13 | |
| | | | | | |
Net realized and unrealized gains (losses) | | | 1.59 | | | | (2.20 | ) | | | 1.77 | | | | 4.66 | | | | (1.49 | ) | | | 0.05 | |
| | | | |
| | | | | | |
Total from investment operations | | | 1.69 | | | | (2.04 | ) | | | 1.92 | | | | 4.76 | | | | (1.33 | ) | | | 0.18 | |
| | | | |
| | | | | | |
| Less distributions from: | | | | | | | | | | | | | | | | | | | | | | | | |
| | | | | | |
Net investment income | | | (0.17 | ) | | | (0.18 | ) | | | (0.10 | ) | | | (0.16 | ) | | | (0.14 | ) | | | (0.15) | |
| | | | | | |
Net realized gains | | | (2.78 | ) | | | (2.98 | ) | | | (1.38 | ) | | | (2.92 | ) | | | (3.17 | ) | | | (1.78) | |
| | | | |
| | | | | | |
Total distributions | | | (2.95 | ) | | | (3.16 | ) | | | (1.48 | ) | | | (3.08 | ) | | | (3.31 | ) | | | (1.93) | |
| | | | |
| | | | | | |
Net asset value, end of period | | | $13.34 | | | | $14.60 | | | | $19.80 | | | | $19.36 | | | | $17.68 | | | | $22.32 | |
| | | | |
| | | | | | |
Total returnd | | | 11.99% | | | | (12.88)% | | | | 10.65% | | | | 30.19% | | | | (7.39)% | | | | 0.57% | |
| | | | | | |
| Ratios to average net assetse | | | | | | | | | | | | | | | | | | | | | | | | |
| | | | | | |
Expenses before waiver and payments by affiliates | | | 0.93% | | | | 0.91% | | | | 0.91% | | | | 0.91% | | | | 0.90% | | | | 0.88% | |
| | | | | | |
Expenses net of waiver and payments by affiliatesf | | | 0.92% | | | | 0.90% | | | | 0.90% | | | | 0.89% | | | | 0.89% | | | | 0.88%g | |
| | | | | | |
Net investment income | | | 1.26% | | | | 0.88% | | | | 0.81% | c | | | 0.59% | | | | 0.79% | | | | 0.57% | |
| | | | | | |
| Supplemental data | | | | | | | | | | | | | | | | | | | | | | | | |
| | | | | | |
Net assets, end of period (000’s) | | | $1,047,855 | | | | $978,675 | | | | $1,302,055 | | | | $1,366,807 | | | | $1,172,173 | | | | $1,445,325 | |
| | | | | | |
Portfolio turnover rate | | | 29.33% | | | | 47.82% | | | | 33.36% | | | | 34.60% | | | | 27.05% | | | | 19.45% | |
aThe amount shown for a share outstanding throughout the period may not correlate with the Statement of Operations for the period due to the timing of sales and repurchases of the Fund’s shares in relation to income earned and/or fluctuating fair value of the investments of the Fund.
bBased on average daily shares outstanding.
cNet investment income per share includes approximately $0.06 per share related to income received in the form of special dividends in connection with certain Fund holdings. Excluding this amount, the ratio of net investment income to average net assets would have been 0.50%.
dTotal return does not include fees, charges or expenses imposed by the variable annuity and life insurance contracts for which Franklin Templeton Variable Insurance Products Trust serves as an underlying investment vehicle. Total return is not annualized for periods less than one year.
eRatios are annualized for periods less than one year.
fBenefit of expense reduction rounds to less than 0.01%.
gBenefit of waiver and payments by affiliates rounds to less than 0.01%.
| | | | | | |
| | | |
| | The accompanying notes are an integral part of these financial statements. | Semiannual Report | | | FSV-7 | |
FRANKLIN TEMPLETON VARIABLE INSURANCE PRODUCTS TRUST
FINANCIAL HIGHLIGHTS
Franklin Small Cap Value VIP Fund(continued)
| | | | | | | | | | | | | | | | | | | | | | | | |
| | |
| | | Six Months Ended
June 30, 2019 (unaudited) | | | Year Ended December 31, | |
| | | 2018 | | | 2017 | | | 2016 | | | 2015 | | | 2014 | |
| |
| | | | | | |
| Class 4 | | | | | | | | | | | | | | | | | | | | | | | | |
| | | | | | |
Per share operating performance (for a share outstanding throughout the period) | | | | | | | | | | | | | | | | | | | | | | | | |
| | | | | | |
Net asset value, beginning of period | | | $14.96 | | | | $20.22 | | | | $19.74 | | | | $17.96 | | | | $22.63 | | | | $24.37 | |
| | | | |
| | | | | | |
| Income from investment operationsa: | | | | | | | | | | | | | | | | | | | | | | | | |
| | | | | | |
Net investment incomeb | | | 0.09 | | | | 0.15 | | | | 0.14 | c | | | 0.09 | | | | 0.14 | | | | 0.11 | |
| | | | | | |
Net realized and unrealized gains (losses) | | | 1.65 | | | | (2.28 | ) | | | 1.81 | | | | 4.75 | | | | (1.52 | ) | | | 0.05 | |
| | | | |
| | | | | | |
Total from investment operations | | | 1.74 | | | | (2.13 | ) | | | 1.95 | | | | 4.84 | | | | (1.38 | ) | | | 0.16 | |
| | | | |
| | | | | | |
| Less distributions from: | | | | | | | | | | | | | | | | | | | | | | | | |
| | | | | | |
Net investment income | | | (0.16 | ) | | | (0.15 | ) | | | (0.09 | ) | | | (0.14 | ) | | | (0.12 | ) | | | (0.12) | |
| | | | | | |
Net realized gains | | | (2.78 | ) | | | (2.98 | ) | | | (1.38 | ) | | | (2.92 | ) | | | (3.17 | ) | | | (1.78) | |
| | | | |
| | | | | | |
Total distributions | | | (2.94 | ) | | | (3.13 | ) | | | (1.47 | ) | | | (3.06 | ) | | | (3.29 | ) | | | (1.90) | |
| | | | |
| | | | | | |
Net asset value, end of period | | | $13.76 | | | | $14.96 | | | | $20.22 | | | | $19.74 | | | | $17.96 | | | | $22.63 | |
| | | | |
| | | | | | |
Total returnd | | | 11.99% | | | | (13.01)% | | | | 10.56% | | | | 30.12% | | | | (7.52)% | | | | 0.48% | |
| | | | | | |
| Ratios to average net assetse | | | | | | | | | | | | | | | | | | | | | | | | |
| | | | | | |
Expenses before waiver and payments by affiliates | | | 1.03% | | | | 1.01% | | | | 1.01% | | | | 1.01% | | | | 1.00% | | | | 0.98% | |
| | | | | | |
Expenses net of waiver and payments by affiliatesf | | | 1.02% | | | | 1.00% | | | | 1.00% | | | | 0.99% | | | | 0.99% | | | | 0.98%g | |
| | | | | | |
Net investment income | | | 1.16% | | | | 0.78% | | | | 0.71% | c | | | 0.49% | | | | 0.69% | | | | 0.47% | |
| | | | | | |
| Supplemental data | | | | | | | | | | | | | | | | | | | | | | | | |
| | | | | | |
Net assets, end of period (000’s) | | | $26,586 | | | | $24,592 | | | | $32,053 | | | | $32,751 | | | | $26,128 | | | | $30,452 | |
| | | | | | |
Portfolio turnover rate | | | 29.33% | | | | 47.82% | | | | 33.36% | | | | 34.60% | | | | 27.05% | | | | 19.45% | |
aThe amount shown for a share outstanding throughout the period may not correlate with the Statement of Operations for the period due to the timing of sales and repurchases of the Fund’s shares in relation to income earned and/or fluctuating fair value of the investments of the Fund.
bBased on average daily shares outstanding.
cNet investment income per share includes approximately $0.06 per share related to income received in the form of special dividends in connection with certain Fund holdings. Excluding this amount, the ratio of net investment income to average net assets would have been 0.40%.
dTotal return does not include fees, charges or expenses imposed by the variable annuity and life insurance contracts for which Franklin Templeton Variable Insurance Products Trust serves as an underlying investment vehicle. Total return is not annualized for periods less than one year.
eRatios are annualized for periods less than one year.
fBenefit of expense reduction rounds to less than 0.01%.
gBenefit of waiver and payments by affiliates rounds to less than 0.01%.
| | | | |
| | | |
FSV-8 | | Semiannual Report | The accompanying notes are an integral part of these financial statements. | | |
FRANKLIN TEMPLETON VARIABLE INSURANCE PRODUCTS TRUST
Statement of Investments, June 30, 2019 (unaudited)
Franklin Small Cap Value VIP Fund
| | | | | | |
| | | Shares | | Value | |
| | |
Common Stocks 97.5% | | | | | | |
| | |
Automobiles & Components 2.3% | | | | | | |
Gentex Corp. | | 36,000 | | $ | 885,960 | |
LCI Industries | | 280,066 | | | 25,205,940 | |
| | | | | | |
| | |
| | | | | 26,091,900 | |
| | | | | | |
| | |
Banks 15.2% | | | | | | |
Atlantic Union Bankshares Corp. | | 183,648 | | | 6,488,284 | |
Bryn Mawr Bank Corp. | | 455,083 | | | 16,983,698 | |
Chemical Financial Corp. | | 350,142 | | | 14,394,338 | |
Columbia Banking System Inc. | | 743,100 | | | 26,885,358 | |
First Horizon National Corp. | | 1,971,637 | | | 29,436,540 | |
First of Long Island Corp. | | 614,355 | | | 12,336,248 | |
German American Bancorp Inc. | | 163,523 | | | 4,925,313 | |
Glacier Bancorp Inc. | | 209,600 | | | 8,499,280 | |
Lakeland Financial Corp. | | 516,362 | | | 24,181,233 | |
Peoples Bancorp Inc. | | 289,712 | | | 9,346,109 | |
TrustCo Bank Corp. NY | | 782,700 | | | 6,198,984 | |
Washington Trust Bancorp Inc. | | 200,891 | | | 10,482,492 | |
| | | | | | |
| | |
| | | | | 170,157,877 | |
| | | | | | |
| | |
Building Products 5.4% | | | | | | |
aGibraltar Industries Inc. | | 806,679 | | | 32,557,564 | |
Insteel Industries Inc. | | 282,352 | | | 5,878,569 | |
Simpson Manufacturing Co. Inc. | | 5,719 | | | 380,085 | |
Universal Forest Products Inc. | | 563,240 | | | 21,436,914 | |
| | | | | | |
| | |
| | | | | 60,253,132 | |
| | | | | | |
| | |
Commercial & Professional Services 3.5% | | | | | | |
aHuron Consulting Group Inc. | | 205,815 | | | 10,368,960 | |
McGrath RentCorp | | 458,768 | | | 28,512,431 | |
| | | | | | |
| | |
| | | | | 38,881,391 | |
| | | | | | |
| | |
Consumer Durables & Apparel 2.8% | | | | | | |
Carter’s Inc. | | 165,993 | | | 16,190,957 | |
aCrocs Inc. | | 156,700 | | | 3,094,825 | |
Toll Brothers Inc. | | 263,605 | | | 9,653,215 | |
aUnifi Inc. | | 121,800 | | | 2,213,106 | |
| | | | | | |
| | |
| | | | | 31,152,103 | |
| | | | | | |
| | |
Consumer Services 3.0% | | | | | | |
Brinker International Inc. | | 245,240 | | | 9,650,194 | |
Jack in the Box Inc. | | 68,800 | | | 5,599,632 | |
Wyndham Hotels and Resorts Inc. | | 329,700 | | | 18,377,478 | |
| | | | | | |
| | |
| | | | | 33,627,304 | |
| | | | | | |
| | |
Electrical Equipment 2.9% | | | | | | |
Encore Wire Corp. | | 75,262 | | | 4,408,848 | |
Regal Beloit Corp. | | 343,900 | | | 28,100,069 | |
| | | | | | |
| | |
| | | | | 32,508,917 | |
| | | | | | |
FRANKLIN TEMPLETON VARIABLE INSURANCE PRODUCTS TRUST
STATEMENT OF INVESTMENTS (UNAUDITED)
Franklin Small Cap Value VIP Fund(continued)
| | | | | | | | |
| | |
| | | Shares | | | Value | |
| | |
Common Stocks(continued) | | | | | | | | |
| | |
Energy 2.3% | | | | | | | | |
Hunting PLC (United Kingdom) | | | 3,524,416 | | | $ | 22,849,122 | |
aNatural Gas Services Group Inc. | | | 173,987 | | | | 2,870,786 | |
| | | | | | | | |
| | |
| | | | | | | 25,719,908 | |
| | | | | | | | |
| | |
Food, Beverage & Tobacco 3.2% | | | | | | | | |
aLandec Corp. | | | 443,589 | | | | 4,156,429 | |
Maple Leaf Foods Inc. (Canada) | | | 1,414,971 | | | | 30,984,057 | |
| | | | | | | | |
| | |
| | | | | | | 35,140,486 | |
| | | | | | | | |
| | |
Insurance 9.4% | | | | | | | | |
The Hanover Insurance Group Inc. | | | 320,400 | | | | 41,107,320 | |
Horace Mann Educators Corp. | | | 728,286 | | | | 29,342,643 | |
Old Republic International Corp. | | | 1,526,100 | | | | 34,154,118 | |
| | | | | | | | |
| | |
| | | | | | | 104,604,081 | |
| | | | | | | | |
| | |
Machinery 10.4% | | | | | | | | |
Astec Industries Inc. | | | 227,127 | | | | 7,395,255 | |
Federal Signal Corp. | | | 395,251 | | | | 10,572,964 | |
The Greenbrier Cos. Inc. | | | 246,440 | | | | 7,491,776 | |
Kennametal Inc. | | | 545,474 | | | | 20,177,083 | |
Mueller Industries Inc. | | | 266,662 | | | | 7,805,197 | |
Mueller Water Products Inc., A | | | 3,163,400 | | | | 31,064,588 | |
Oshkosh Corp. | | | 221,200 | | | | 18,467,988 | |
aRexnord Corp. | | | 390,700 | | | | 11,806,954 | |
aSPX Flow Inc. | | | 45,980 | | | | 1,924,723 | |
| | | | | | | | |
| | |
| | | | | | | 116,706,528 | |
| | | | | | | | |
| | |
Materials 11.6% | | | | | | | | |
Carpenter Technology Corp. | | | 409,471 | | | | 19,646,419 | |
Eagle Materials Inc. | | | 327,200 | | | | 30,331,440 | |
Minerals Technologies Inc. | | | 421,752 | | | | 22,567,949 | |
OceanaGold Corp. (Australia) | | | 9,070,561 | | | | 24,792,982 | |
PH Glatfelter Co. | | | 887,200 | | | | 14,975,936 | |
Reliance Steel & Aluminum Co. | | | 188,600 | | | | 17,845,332 | |
| | | | | | | | |
| | |
| | | | | | | 130,160,058 | |
| | | | | | | | |
| | |
Media & Entertainment 1.8% | | | | | | | | |
Cinemark Holdings Inc. | | | 558,900 | | | | 20,176,290 | |
| | | | | | | | |
| | |
Pharmaceuticals, Biotechnology & Life Sciences 1.3% | | | | | | | | |
aCambrex Corp. | | | 310,547 | | | | 14,536,705 | |
| | | | | | | | |
| | |
Real Estate 7.9% | | | | | | | | |
Brandywine Realty Trust | | | 1,064,700 | | | | 15,246,504 | |
Highwoods Properties Inc. | | | 478,400 | | | | 19,757,920 | |
LTC Properties Inc. | | | 293,155 | | | | 13,385,457 | |
Retail Properties of America Inc., A | | | 1,898,611 | | | | 22,327,665 | |
Sunstone Hotel Investors Inc. | | | 1,308,797 | | | | 17,943,607 | |
| | | | | | | | |
| | |
| | | | | | | 88,661,153 | |
| | | | | | | | |
FRANKLIN TEMPLETON VARIABLE INSURANCE PRODUCTS TRUST
STATEMENT OF INVESTMENTS (UNAUDITED)
Franklin Small Cap Value VIP Fund(continued)
| | | | | | | | |
| | |
| | | Shares | | | Value | |
| | |
Common Stocks(continued) | | | | | | | | |
Retailing 0.7% | | | | | | | | |
Caleres Inc. | | | 384,841 | | | $ | 7,666,033 | |
| | | | | | | | |
| | |
Semiconductors & Semiconductor Equipment 3.3% | | | | | | | | |
aAdvanced Energy Industries Inc. | | | 398,076 | | | | 22,399,736 | |
MKS Instruments Inc. | | | 132,894 | | | | 10,351,114 | |
aSynaptics Inc. | | | 130,481 | | | | 3,802,216 | |
| | | | | | | | |
| | |
| | | | | | | 36,553,066 | |
| | | | | | | | |
| | |
Software & Services 0.2% | | | | | | | | |
LogMeIn Inc. | | | 36,172 | | | | 2,665,153 | |
| | | | | | | | |
| | |
Technology Hardware & Equipment 6.1% | | | | | | | | |
aCoherent Inc. | | | 197,808 | | | | 26,975,077 | |
aFARO Technologies Inc. | | | 68,500 | | | | 3,601,730 | |
aFinisar Corp. | | | 502,300 | | | | 11,487,601 | |
aPlexus Corp. | | | 444,800 | | | | 25,962,976 | |
| | | | | | | | |
| | |
| | | | | | | 68,027,384 | |
| | | | | | | | |
| | |
Transportation 0.1% | | | | | | | | |
Heartland Express Inc. | | | 85,838 | | | | 1,551,093 | |
| | | | | | | | |
| | |
Utilities 4.1% | | | | | | | | |
Black Hills Corp. | | | 253,900 | | | | 19,847,363 | |
IDACORP Inc. | | | 61,189 | | | | 6,145,211 | |
Spire Inc. | | | 229,755 | | | | 19,281,040 | |
| | | | | | | | |
| | |
| | | | | | | 45,273,614 | |
| | | | | | | | |
| | |
Total Common Stocks (Cost $988,461,325) | | | | | | | 1,090,114,176 | |
| | | | | | | | |
| | |
| | | Principal
Amount | | | | |
| | | | | | | | |
Corporate Bonds 0.5% | | | | | | | | |
Energy 0.3% | | | | | | | | |
Unit Corp., senior sub. note, 6.625%, 5/15/21 | | $ | 2,836,000 | | | | 2,573,670 | |
| | | | | | | | |
| | |
Machinery 0.2% | | | | | | | | |
Mueller Industries Inc., sub. bond, 6.00%, 3/01/27 | | | 2,378,000 | | | | 2,395,835 | |
| | | | | | | | |
| | |
Total Corporate Bonds (Cost $5,063,286) | | | | | | | 4,969,505 | |
| | | | | | | | |
| | |
Total Investments before Short Term Investments (Cost $993,524,611) | | | | | | | 1,095,083,681 | |
| | | | | | | | |
FRANKLIN TEMPLETON VARIABLE INSURANCE PRODUCTS TRUST
STATEMENT OF INVESTMENTS (UNAUDITED)
Franklin Small Cap Value VIP Fund(continued)
| | | | | | | | |
| | |
| | | Shares | | | Value | |
| | |
Short Term Investments (Cost $13,865,812) 1.2% | | | | | | | | |
| | |
Money Market Funds 1.2% | | | | | | | | |
b,cInstitutional Fiduciary Trust Money Market Portfolio, 2.05% | | | 13,865,812 | | | $ | 13,865,812 | |
| | | | | | | | |
| | |
Total Investments (Cost $1,007,390,423) 99.2% | | | | | | | 1,108,949,493 | |
Other Assets, less Liabilities 0.8% | | | | | | | 9,044,775 | |
| | | | | | | | |
| | |
Net Assets 100.0% | | | | | | $ | 1,117,994,268 | |
| | | | | | | | |
aNon-income producing.
bSee Note 3(e) regarding investments in affiliated management investment companies.
cThe rate shown is the annualizedseven-day effective yield at period end.
| | | | |
| | | |
FSV-12 | | Semiannual Report | | | The accompanying notes are an integral part of these financial statements. |
FRANKLIN TEMPLETON VARIABLE INSURANCE PRODUCTS TRUST
FINANCIAL STATEMENTS
Statement of Assets and Liabilities
June 30, 2019 (unaudited)
| | | | |
| |
| | | Franklin Small
Cap Value VIP Fund | |
| |
Assets: | | | | |
Investments in securities: | | | | |
Cost - Unaffiliated issuers | | | $ 993,524,611 | |
Cost -Non-controlled affiliates (Note 3e) | | | 13,865,812 | |
| | | | |
| |
Value - Unaffiliated issuers | | | $1,095,083,681 | |
Value -Non-controlled affiliates (Note 3e) | | | 13,865,812 | |
Receivables: | | | | |
Investment securities sold | | | 11,232,101 | |
Capital shares sold | | | 333,719 | |
Dividends and interest | | | 1,186,308 | |
Other assets | | | 803 | |
| | | | |
| |
Total assets | | | 1,121,702,424 | |
| | | | |
| |
Liabilities: | | | | |
Payables: | | | | |
Investment securities purchased | | | 1,543,476 | |
Capital shares redeemed | | | 949,020 | |
Management fees | | | 563,468 | |
Distribution fees | | | 451,074 | |
Trustees’ fees and expenses | | | 1,460 | |
Accrued expenses and other liabilities | | | 199,658 | |
| | | | |
| |
Total liabilities | | | 3,708,156 | |
| | | | |
| |
Net assets, at value | | | $1,117,994,268 | |
| | | | |
Net assets consist of: | | | | |
Paid-in capital | | | $ 977,634,649 | |
Total distributable earnings (loss) | | | 140,359,619 | |
| | | | |
| |
Net assets, at value | | | $1,117,994,268 | |
| | | | |
| |
| Class 1: | | | | |
Net assets, at value | | | $ 43,553,629 | |
| | | | |
| |
Shares outstanding | | | 3,128,083 | |
| | | | |
Net asset value and maximum offering price per share | | | $13.92 | |
| | | | |
| |
| Class 2: | | | | |
Net assets, at value | | | $1,047,854,657 | |
| | | | |
Shares outstanding | | | 78,535,478 | |
| | | | |
Net asset value and maximum offering price per share | | | $13.34 | |
| | | | |
| Class 4: | | | | |
Net assets, at value | | | $ 26,585,982 | |
| | | | |
Shares outstanding | | | 1,932,263 | |
| | | | |
Net asset value and maximum offering price per share | | | $13.76 | |
| | | | |
| | | | | | |
| | | |
| | The accompanying notes are an integral part of these financial statements. | Semiannual Report | | | FSV-13 | |
FRANKLIN TEMPLETON VARIABLE INSURANCE PRODUCTS TRUST
FINANCIAL STATEMENTS
Statement of Operations
for the six months ended June 30, 2019 (unaudited)
| | | | |
| |
| | | Franklin Small
Cap Value VIP Fund | |
| |
Investment income: | | | | |
Dividends: (net of foreign taxes)* | | | | |
Unaffiliated issuers | | | $ 11,570,898 | |
Non-controlled affiliates (Note 3e) | | | 314,268 | |
Interest: | | | | |
Unaffiliated issuers | | | 339,080 | |
| | | | |
| |
Total investment income | | | 12,224,246 | |
| | | | |
| |
Expenses: | | | | |
Management fees (Note 3a) | | | 3,598,108 | |
Distribution fees: (Note 3c) | | | | |
Class 2 | | | 1,316,065 | |
Class 4 | | | 46,755 | |
Custodian fees (Note 4) | | | 7,717 | |
Reports to shareholders | | | 135,407 | |
Professional fees | | | 27,049 | |
Trustees’ fees and expenses | | | 4,931 | |
Other | | | 16,553 | |
| | | | |
| |
Total expenses | | | 5,152,585 | |
Expense reductions (Note 4) | | | (208 | ) |
Expenses waived/paid by affiliates (Note 3e) | | | (53,687 | ) |
| | | | |
| |
Net expenses | | | 5,098,690 | |
| | | | |
| |
Net investment income | | | 7,125,556 | |
| | | | |
Realized and unrealized gains (losses): | | | | |
Net realized gain (loss) from: | | | | |
Investments: | | | | |
Unaffiliated issuers | | | 31,878,173 | |
Realized gain distributions from REITs | | | 757,889 | |
Foreign currency transactions | | | (118,872 | ) |
| | | | |
| |
Net realized gain (loss) | | | 32,517,190 | |
| | | | |
Net change in unrealized appreciation (depreciation) on: | | | | |
Investments: | | | | |
Unaffiliated issuers | | | 85,190,270 | |
Translation of other assets and liabilities denominated in foreign currencies | | | 1,720 | |
| | | | |
| |
Net change in unrealized appreciation (depreciation) | | | 85,191,990 | |
| | | | |
| |
Net realized and unrealized gain (loss) | | | 117,709,180 | |
| | | | |
| |
Net increase (decrease) in net assets resulting from operations | | | $124,834,736 | |
| | | | |
| |
*Foreign taxes withheld on dividends | | | $ 57,129 | |
| | | | |
| | | |
FSV-14 | | Semiannual Report | The accompanying notes are an integral part of these financial statements. | | |
FRANKLIN TEMPLETON VARIABLE INSURANCE PRODUCTS TRUST
FINANCIAL STATEMENTS
Statements of Changes in Net Assets
| | | | | | | | |
| |
| | | Franklin Small Cap
Value VIP Fund | |
| | |
| | | Six Months Ended
June 30, 2019
(unaudited) | | | Year Ended
December 31, 2018 | |
| | |
Increase (decrease) in net assets: | | | | | | | | |
Operations: | | | | | | | | |
Net investment income | | | $ 7,125,556 | | | | $ 11,431,886 | |
Net realized gain (loss) | | | 32,517,190 | | | | 192,518,890 | |
Net change in unrealized appreciation (depreciation) | | | 85,191,990 | | | | (356,985,491 | ) |
| | | | |
| | |
Net increase (decrease) in net assets resulting from operations | | | 124,834,736 | | | | (153,034,715 | ) |
| | | | |
| | |
Distributions to shareholders: | | | | | | | | |
Class 1 | | | (7,896,338 | ) | | | (7,555,429 | ) |
Class 2 | | | (189,976,242 | ) | | | (194,090,505 | ) |
Class 4 | | | (4,683,798 | ) | | | (4,574,106 | ) |
| | | | |
| | |
Total distributions to shareholders | | | (202,556,378 | ) | | | (206,220,040 | ) |
| | | | |
| | |
Capital share transactions: (Note 2) | | | | | | | | |
Class 1 | | | 5,852,753 | | | | 2,769,926 | |
Class 2 | | | 142,231,285 | | | | 14,343,221 | |
Class 4 | | | 3,721,349 | | | | 698,981 | |
| | | | |
| | |
Total capital share transactions | | | 151,805,387 | | | | 17,812,128 | |
| | | | |
| | |
Net increase (decrease) in net assets | | | 74,083,745 | | | | (341,442,627 | ) |
Net assets: | | | | | | | | |
Beginning of period | | | 1,043,910,523 | | | | 1,385,353,150 | |
| | | | |
| | |
End of period | | | $1,117,994,268 | | | | $1,043,910,523 | |
| | | | |
| | | | | | |
| | | |
| | The accompanying notes are an integral part of these financial statements. | Semiannual Report | | | FSV-15 | |
FRANKLIN TEMPLETON VARIABLE INSURANCE PRODUCTS TRUST
Notes to Financial Statements (unaudited)
Franklin Small Cap Value VIP Fund
1. Organization and Significant Accounting Policies
Franklin Templeton Variable Insurance Products Trust (Trust) is registered under the Investment Company Act of 1940 (1940 Act) as anopen-end management investment company, consisting of eighteen separate funds and applies the specialized accounting and reporting guidance in U.S. Generally Accepted Accounting Principles (U.S. GAAP). Franklin Small Cap Value VIP Fund (Fund) is included in this report. Shares of the Fund are generally sold only to insurance company separate accounts to fund the benefits of variable life insurance policies or variable annuity contracts. The Fund offers three classes of shares: Class 1, Class 2 and Class 4. Each class of shares may differ by its distribution fees, voting rights on matters affecting a single class and its exchange privilege.
The following summarizes the Fund’s significant accounting policies.
a. Financial Instrument Valuation
The Fund’s investments in financial instruments are carried at fair value daily. Fair value is the price that would be received to sell an asset or paid to transfer a liability in an orderly transaction between market participants on the measurement date. The Fund calculates the net asset value (NAV) per share each business day as of 4 p.m. Eastern time or the regularly scheduled close of the New York Stock Exchange (NYSE), whichever is earlier. Under compliance policies and procedures approved by the Trust’s Board of Trustees (the Board), the Fund’s administrator has responsibility for oversight of valuation, including leading the cross-functional Valuation Committee (VC). The Fund may utilize independent pricing services, quotations from securities and financial instrument dealers, and other market sources to determine fair value.
Equity securities listed on an exchange or on the NASDAQ National Market System are valued at the last quoted sale price or the official closing price of the day, respectively. Foreign equity securities are valued as of the close of trading on the foreign stock exchange on which the security is primarily traded, or as of 4 p.m. Eastern time. The value is then converted into its U.S. dollar equivalent at the foreign exchange rate in effect at 4 p.m. Eastern time on the day that the value of the security is determined.Over-the-counter (OTC) securities are valued
within the range of the most recent quoted bid and ask prices. Securities that trade in multiple markets or on multiple exchanges are valued
according to the broadest and most representative market. Certain equity securities are valued based upon fundamental characteristics or relationships to similar securities.
Debt securities generally trade in the OTC market rather than on a securities exchange. The Fund’s pricing services use multiple valuation techniques to determine fair value. In instances where sufficient market activity exists, the pricing services may utilize a market-based approach through which quotes from market makers are used to determine fair value. In instances where sufficient market activity may not exist or is limited, the pricing services also utilize proprietary valuation models which may consider market characteristics such as benchmark yield curves, credit spreads, estimated default rates, anticipated market interest rate volatility, coupon rates, anticipated timing of principal repayments, underlying collateral, and other unique security features in order to estimate the relevant cash flows, which are then discounted to calculate the fair value.
Investments inopen-end mutual funds are valued at the closing NAV.
The Fund has procedures to determine the fair value of financial instruments for which market prices are not reliable or readily available. Under these procedures, the Fund primarily employs a market-based approach which may use related or comparable assets or liabilities, recent transactions, market multiples, book values, and other relevant information for the investment to determine the fair value of the investment. An income-based valuation approach may also be used in which the anticipated future cash flows of the investment are discounted to calculate fair value. Discounts may also be applied due to the nature or duration of any restrictions on the disposition of the investments. Due to the inherent uncertainty of valuations of such investments, the fair values may differ significantly from the values that would have been used had an active market existed.
Trading in securities on foreign securities stock exchanges and OTC markets may be completed before 4 p.m. Eastern time. In addition, trading in certain foreign markets may not take place on every Fund’s business day. Occasionally, events occur between the time at which trading in a foreign security is completed and 4 p.m. Eastern time that might call into question the reliability of the value of a portfolio security held by the Fund. As a result, differences may arise between the value of the Fund’s portfolio securities as determined at the foreign market close and the latest indications of value at
FRANKLIN TEMPLETON VARIABLE INSURANCE PRODUCTS TRUST
NOTES TO FINANCIAL STATEMENTS (UNAUDITED)
Franklin Small Cap Value VIP Fund(continued)
4 p.m. Eastern time. In order to minimize the potential for these differences, the VC monitors price movements following the close of trading in foreign stock markets through a series of country specific market proxies (such as baskets of American Depositary Receipts, futures contracts and exchange traded funds). These price movements are measured against established trigger thresholds for each specific market proxy to assist in determining if an event has occurred that may call into question the reliability of the values of the foreign securities held by the Fund. If such an event occurs, the securities may be valued using fair value procedures, which may include the use of independent pricing services.
When the last day of the reporting period is anon-business day, certain foreign markets may be open on those days that the Fund’s NAV is not calculated, which could result in differences between the value of the Fund’s portfolio securities on the last business day and the last calendar day of the reporting period. Any significant security valuation changes due to an open foreign market are adjusted and reflected by the Fund for financial reporting purposes.
b. Foreign Currency Translation
Portfolio securities and other assets and liabilities denominated in foreign currencies are translated into U.S. dollars based on the exchange rate of such currencies against U.S. dollars on the date of valuation. The Fund may enter into foreign currency exchange contracts to facilitate transactions denominated in a foreign currency. Purchases and sales of securities, income and expense items denominated in foreign currencies are translated into U.S. dollars at the exchange rate in effect on the transaction date. Portfolio securities and assets and liabilities denominated in foreign currencies contain risks that those currencies will decline in value relative to the U.S. dollar. Occasionally, events may impact the availability or reliability of foreign exchange rates used to convert the U.S. dollar equivalent value. If such an event occurs, the foreign exchange rate will be valued at fair value using procedures established and approved by the Board.
The Fund does not separately report the effect of changes in foreign exchange rates from changes in market prices on securities held. Such changes are included in net realized and unrealized gain or loss from investments in the Statement of Operations.
Realized foreign exchange gains or losses arise from sales of foreign currencies, currency gains or losses realized between the trade and settlement dates on securities transactions and the difference between the recorded amounts of dividends, interest, and foreign withholding taxes and the U.S. dollar equivalent of the amounts actually received or paid. Net unrealized foreign exchange gains and losses arise from changes in foreign exchange rates on foreign denominated assets and liabilities other than investments in securities held at the end of the reporting period.
c. Income and Deferred Taxes
It is the Fund’s policy to qualify as a regulated investment company under the Internal Revenue Code. The Fund intends to distribute to shareholders substantially all of its taxable income and net realized gains to relieve it from federal income and if applicable, excise taxes. As a result, no provision for U.S. federal income taxes is required.
The Fund may be subject to foreign taxation related to income received, capital gains on the sale of securities and certain foreign currency transactions in the foreign jurisdictions in which it invests. Foreign taxes, if any, are recorded based on the tax regulations and rates that exist in the foreign markets in which the Fund invests. When a capital gain tax is determined to apply, the Fund records an estimated deferred tax liability in an amount that would be payable if the securities were disposed of on the valuation date.
The Fund may recognize an income tax liability related to its uncertain tax positions under U.S. GAAP when the uncertain tax position has a less than 50% probability that it will be sustained upon examination by the tax authorities based on its technical merits. As of June 30, 2019, the Fund has determined that no tax liability is required in its financial statements related to uncertain tax positions for any open tax years (or expected to be taken in future tax years). Open tax years are those that remain subject to examination and are based on the statute of limitations in each jurisdiction in which the Fund invests.
d. Security Transactions, Investment Income, Expenses and Distributions
Security transactions are accounted for on trade date. Realized gains and losses on security transactions are determined on a specific identification basis. Interest income and estimated expenses are accrued daily. Amortization of
FRANKLIN TEMPLETON VARIABLE INSURANCE PRODUCTS TRUST
NOTES TO FINANCIAL STATEMENTS (UNAUDITED)
Franklin Small Cap Value VIP Fund(continued)
1. Organization and Significant Accounting
Policies(continued)
d. Security Transactions, Investment Income, Expenses and Distributions(continued)
premium and accretion of discount on debt securities are included in interest income. Dividend income and capital gain distributions are recorded on theex-dividend date except for certain dividends from securities where the dividend rate is not available. In such cases, the dividend is recorded as soon as the information is received by the Fund. Distributions to shareholders are recorded on theex-dividend date. Distributable earnings are determined according to income tax regulations (tax basis) and may differ from earnings recorded in accordance with U.S. GAAP. These differences may be permanent or temporary. Permanent differences are reclassified among capital accounts to reflect their tax character. These reclassifications have no impact on net assets or the results of operations. Temporary differences are not reclassified, as they may reverse in subsequent periods.
Common expenses incurred by the Trust are allocated among the Funds based on the ratio of net assets of each Fund to the combined net assets of the Trust or based on the ratio of number of shareholders of each Fund to the combined number of shareholders of the Trust. Fund specific expenses are charged directly to the Fund that incurred the expense.
Realized and unrealized gains and losses and net investment income, excluding class specific expenses, are allocated daily to each class of shares based upon the relative proportion of net assets of each class. Differences in per share distributions by class are generally due to differences in class specific expenses.
e. Accounting Estimates
The preparation of financial statements in accordance with U.S. GAAP requires management to make estimates and assumptions that affect the reported amounts of assets and liabilities at the date of the financial statements and the amounts of income and expenses during the reporting period. Actual results could differ from those estimates.
f. Guarantees and Indemnifications
Under the Trust’s organizational documents, its officers and trustees are indemnified by the Trust against certain liabilities arising out of the performance of their duties to the Trust. Additionally, in the normal course of business, the Trust, on behalf of the Fund, enters into contracts with service providers that contain general indemnification clauses. The Trust’s maximum exposure under these arrangements is unknown as this would involve future claims that may be made against the Trust that have not yet occurred. Currently, the Trust expects the risk of loss to be remote.
2. Shares of Beneficial Interest
At June 30, 2019, there were an unlimited number of shares authorized (without par value). Transactions in the Fund’s shares were as follows:
| | | | | | | | | | | | | | | | |
| | |
| | | Six Months Ended
June 30, 2019 | | | Year Ended December 31, 2018 | |
| | | | |
| | | | |
| | | Shares | | | Amount | | | Shares | | | Amount | |
| |
| | | | |
| Class 1 Shares: | | | | | | | | | | | | | | | | |
Shares sold | | | 126,514 | | | | $ 2,078,679 | | | | 140,744 | | | | $ 2,624,857 | |
Shares issued in reinvestment of distributions | | | 578,063 | | | | 7,896,338 | | | | 419,746 | | | | 7,555,429 | |
Shares redeemed | | | (261,103 | ) | | | (4,122,264 | ) | | | (384,144 | ) | | | (7,410,360) | |
| | | | |
| | | | |
Net increase (decrease) | | | 443,474 | | | | $ 5,852,753 | | | | 176,346 | | | | $ 2,769,926 | |
| | | | |
| | | | |
| Class 2 Shares: | | | | | | | | | | | | | | | | |
Shares sold | | | 2,436,409 | | | | $ 39,190,494 | | | | 3,241,202 | | | | $ 57,622,650 | |
Shares issued in reinvestment of distributions | | | 14,513,082 | | | | 189,976,242 | | | | 11,167,463 | | | | 194,090,505 | |
Shares redeemed | | | (5,461,873 | ) | | | (86,935,451 | ) | | | (13,111,818 | ) | | | (237,369,934) | |
| | | | |
| | | | |
Net increase (decrease) | | | 11,487,618 | | | | $142,231,285 | | | | 1,296,847 | | | | $ 14,343,221 | |
| | | | |
FRANKLIN TEMPLETON VARIABLE INSURANCE PRODUCTS TRUST
NOTES TO FINANCIAL STATEMENTS (UNAUDITED)
Franklin Small Cap Value VIP Fund(continued)
| | | | | | | | | | | | | | | | |
| | |
| | | Six Months Ended June 30, 2019 | | | Year Ended December 31, 2018 | |
| | | | |
| | | Shares | | | Amount | | | Shares | | | Amount | |
| | | | |
| Class 4 Shares: | | | | | | | | | | | | | | | | |
Shares sold | | | 102,833 | | | | $ 1,623,500 | | | | 142,312 | | | | $ 2,499,385 | |
Shares issued in reinvestment of distributions | | | 346,948 | | | | 4,683,798 | | | | 256,684 | | | | 4,574,106 | |
Shares redeemed | | | (161,332 | ) | | | (2,585,949 | ) | | | (340,602 | ) | | | (6,374,510) | |
| | | | |
| | | | |
Net increase (decrease) | | | 288,449 | | | | $ 3,721,349 | | | | 58,394 | | | | $ 698,981 | |
| | | | |
3. Transactions with Affiliates
Franklin Resources, Inc. is the holding company for various subsidiaries that together are referred to as Franklin Templeton. Certain officers and trustees of the Fund are also officers and/or directors of the following subsidiaries:
| | |
| |
| Subsidiary | | Affiliation |
Franklin Mutual Advisers, LLC (Franklin Mutual) | | Investment manager |
Franklin Templeton Services, LLC (FT Services) | | Administrative manager |
Franklin Templeton Distributors, Inc. (Distributors) | | Principal underwriter |
Franklin Templeton Investor Services, LLC (Investor Services) | | Transfer agent |
a. Management Fees
The Fund pays an investment management fee to Franklin Mutual based on the average daily net assets of the Fund as follows:
| | |
| |
| Annualized Fee Rate | | Net Assets |
0.750% | | Up to and including $200 million |
0.635% | | Over $200 million, up to and including $700 million |
0.600% | | Over $700 million, up to and including $1.2 billion |
0.575% | | Over $1.2 billion, up to and including $1.3 billion |
0.475% | | In excess of $1.3 billion |
For the period ended June 30, 2019, the annualized gross effective investment management fee rate was 0.642% of the Fund’s average daily net assets.
b. Administrative Fees
Under an agreement with Franklin Mutual, FT Services provides administrative services to the Fund. The fee is paid by Franklin Mutual based on the Fund’s average daily net assets, and is not an additional expense of the Fund.
c. Distribution Fees
The Board has adopted distribution plans for Class 2 and Class 4 shares pursuant to Rule12b-1 under the 1940 Act. Under the Fund’s compensation distribution plans, the Fund pays Distributors for costs incurred in connection with the servicing, sale and distribution of the Fund’s shares up to 0.35% per year of its average daily net assets of each class. The Board has agreed to limit the current rate to 0.25% per year for Class 2. The plan year, for purposes of monitoring compliance with the maximum annual plan rates, is February 1 through January 31.
FRANKLIN TEMPLETON VARIABLE INSURANCE PRODUCTS TRUST
NOTES TO FINANCIAL STATEMENTS (UNAUDITED)
Franklin Small Cap Value VIP Fund (continued)
3. Transactions with Affiliates (continued)
d. Transfer Agent Fees
Investor Services, under terms of an agreement, performs shareholder servicing for the Fund and is not paid by the Fund for the services.
e. Investments in Affiliated Management Investment Companies
The Fund invests in one or more affiliated management investment companies for purposes other than exercising a controlling influence over the management or policies. Management fees paid by the Fund are waived on assets invested in the affiliated management investment companies, as noted in the Statement of Operations, in an amount not to exceed the management and administrative fees paid directly or indirectly by each affiliate. During the period ended June 30, 2019, the Fund held investments in affiliated management investment companies as follows:
| | | | | | | | | | | | | | | | | | | | | | | | | | | | | | | | |
| | | | | | | | |
| | | Value at
Beginning
of Period | | | Purchases | | | Sales | | | Realized Gain (Loss) | | | Net Change in Unrealized
Appreciation
(Depreciation) | | | Value at
End of
Period | | | Number of
Shares
Held at End
of Period | | | Dividend
Income | |
| | | | | | | | |
| Non-Controlled Affiliates | | | | | | | | | | | | | | | | | | | | | | | | | | | | | | | | |
Institutional Fiduciary Trust Money Market Portfolio, 2.05% | | | $45,444,842 | | | | $140,817,135 | | | | $(172,396,165 | ) | | | $ — | | | | $ — | | | | $13,865,812 | | | | 13,865,812 | | | | $314,268 | |
4. Expense Offset Arrangement
The Fund has entered into an arrangement with its custodian whereby credits realized as a result of uninvested cash balances are used to reduce a portion of the Fund’s custodian expenses. During the period ended June 30, 2019, the custodian fees were reduced as noted in the Statement of Operations.
5. Income Taxes
At June 30, 2019, the cost of investments and net unrealized appreciation (depreciation) for income tax purposes were as follows:
| | | | |
Cost of investments | | $ | 1,008,223,398 | |
| | | | |
| |
Unrealized appreciation | | $ | 140,598,525 | |
Unrealized depreciation | | | (39,872,430) | |
| | | | |
| |
Net unrealized appreciation (depreciation) | | $ | 100,726,095 | |
| | | | |
Differences between income and/or capital gains as determined on a book basis and a tax basis are primarily due to differing treatment of wash sales.
6. Investment Transactions
Purchases and sales of investments (excluding short term securities) for the period ended June 30, 2019, aggregated $317,584,251 and $337,659,609, respectively.
FRANKLIN TEMPLETON VARIABLE INSURANCE PRODUCTS TRUST
NOTES TO FINANCIAL STATEMENTS (UNAUDITED)
Franklin Small Cap Value VIP Fund(continued)
7. Credit Facility
The Fund, together with other U.S. registered and foreign investment funds (collectively, Borrowers), managed by Franklin Templeton, are borrowers in a joint syndicated senior unsecured credit facility totaling $2 billion (Global Credit Facility) which matures on February 7, 2020. This Global Credit Facility provides a source of funds to the Borrowers for temporary and emergency purposes, including the ability to meet future unanticipated or unusually large redemption requests.
Under the terms of the Global Credit Facility, the Fund shall, in addition to interest charged on any borrowings made by the Fund and other costs incurred by the Fund, pay its share of fees and expenses incurred in connection with the implementation and maintenance of the Global Credit Facility, based upon its relative share of the aggregate net assets of all of the Borrowers, including an annual commitment fee of 0.15% based upon the unused portion of the Global Credit Facility. These fees are reflected in other expenses in the Statement of Operations. During the period ended June 30, 2019, the Fund did not use the Global Credit Facility.
8. Fair Value Measurements
The Fund follows a fair value hierarchy that distinguishes between market data obtained from independent sources
(observable inputs) and the Fund’s own market assumptions (unobservable inputs). These inputs are used in determining the value of the Fund’s financial instruments and are summarized in the following fair value hierarchy:
| | • | | Level 1 – quoted prices in active markets for identical financial instruments |
| | • | | Level 2 – other significant observable inputs (including quoted prices for similar financial instruments, interest rates, prepayment speed, credit risk, etc.) |
| | • | | Level 3 – significant unobservable inputs (including the Fund’s own assumptions in determining the fair value of financial instruments) |
The input levels are not necessarily an indication of the risk or liquidity associated with financial instruments at that level.
A summary of inputs used as of June 30, 2019, in valuing the Fund’s assets carried at fair value, is as follows:
| | | | | | | | | | | | | | | | |
| | | Level 1 | | | Level 2 | | | Level 3 | | | Total | |
| |
| | | | |
| Assets: | | | | | | | | | | | | | | | | |
Investments in Securities:a | | | | | | | | | | | | | | | | |
Equity Investments | | $ | 1,090,114,176 | | | $ | — | | | $ | — | | | $ | 1,090,114,176 | |
Corporate Bonds | | | — | | | | 4,969,505 | | | | — | | | | 4,969,505 | |
Short Term Investments | | | 13,865,812 | | | | — | | | | — | | | | 13,865,812 | |
| | | | |
Total Investments in Securities | | $ | 1,103,979,988 | | | $ | 4,969,505 | | | $ | — | | | $ | 1,108,949,493 | |
| | | | |
aFor detailed categories, see the accompanying Statement of Investments.
9. Subsequent Events
The Fund has evaluated subsequent events through the issuance of the financial statements and determined that no events have occurred that require disclosure.
This page intentionally left blank.
FranklinSmall-Mid Cap Growth VIP Fund
This semiannual report for FranklinSmall-Mid Cap Growth VIP Fund covers the period ended June 30, 2019.
Class 2 Performance Summary as of June 30, 2019
The Fund’s Class 2 Shares posted a +26.65% total return* for thesix-month period ended June 30, 2019.
*The Fund has a fee waiver associated with any investment it makes in a Franklin Templeton money fund and/or other Franklin Templeton fund, contractually guaranteed through 4/30/20. Fund investment results reflect the fee waiver; without this waiver, the results would have been lower.
Performance reflects the Fund’s Class 2 operating expenses, but doesnotinclude any contract fees, expenses or sales charges. If they had been included, performance would be lower. These charges and deductions, particularly for variable life policies, can have a significant effect on contract values and insurance benefits. See the contract prospectus for a complete description of these expenses, including sales charges.
Performance data represent past performance, which does not guarantee future results. Investment return and principal value will fluctuate, and you may have a gain or loss when you sell your shares. Current performance may differ from figures shown.
FRANKLINSMALL-MID CAP GROWTH VIP FUND
Fund Goal and Main Investments
The Fund seeks long-term capital growth. Under normal market conditions, the Fund invests at least 80% of its net assets in equity securities of small-capitalization andmid-capitalization companies. For this Fund,small-cap companies are those within the market capitalization range of companies in the Russell 2500TM Index at the time of purchase, and midcap companies are those within the market capitalization range of companies in the Russell Midcap® Index at the time of purchase.1
Fund Risks
All investments involve risks, including possible loss of principal. Growth stock prices reflect projections of future earnings or revenues, and can, therefore, fall dramatically if the company fails to meet those projections. Smaller, midsized and relatively new or unseasoned companies can be particularly sensitive to changing economic conditions, and their prospects for growth are less certain than those of larger, more established companies. Historically, these securities have experienced more price volatility than larger-company stocks, especially over the short term. To the extent the Fund focuses on particular countries, regions, industries, sectors or types of investment from time to time, it may be subject to greater risk of adverse developments in such areas of focus than a fund that invests in a wider variety of countries, regions, industries, sectors or investments. From time to time, the trading market for a particular security or type of security in which the Fund invests may become less liquid or even illiquid. The Fund is actively managed but there is no guarantee that the manager’s investment decisions will produce the desired results. The Fund’s prospectus also includes a description of the main investment risks.
Performance Overview
You can find the Fund’ssix-month total return in the Performance Summary. In comparison, the Fund’s narrow benchmark, the Russell Midcap® Growth Index, posted a +26.08% total return, and its broad benchmark, the Standard & Poor’s® 500 Index (S&P 500®) posted a +18.54% total return for the same period.2
Portfolio Composition
Based on Total Net Assets as of 6/30/19
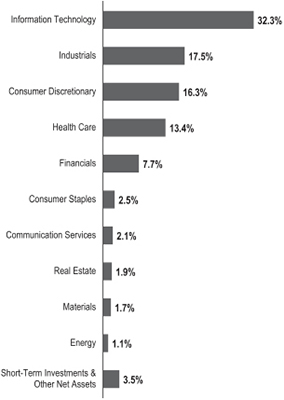
Economic and Market Overview
The U.S. economy grew during the six months ended June 30, 2019. After moderating for two consecutive quarters, the economy grew significantly faster in 2019’s first quarter, driven by growth in consumer spending, inventory investment, exports, business investment, and state and local government spending. However, the economy moderated again in the second quarter, due to weakness in inventory investment, exports, business investment and housing investment. The manufacturing and services sectors expanded during the period. The unemployment rate decreased from 3.9% in December 2018 to 3.7% atperiod-end.3 The annual inflation rate, as measured by the Consumer Price Index, decreased from 1.9% in December 2018 to 1.6% atperiod-end.3
1. Please see Index Descriptions following the Fund Summaries.
2. Source: Morningstar. One cannot invest directly in an index, and an index is not representative of the Fund’s portfolio. Please see Index Descriptions following the Fund Summaries.
3. Source: Bureau of Labor Statistics.
The dollar value, number of shares or principal amount, and names of all portfolio holdings are listed in the Fund’s Statement of Investments (SOI).
FRANKLINSMALL-MID CAP GROWTH VIP FUND
The U.S. Federal Reserve (Fed) held its target range for the federal funds rate unchanged, at 2.25%–2.50%, during the reporting period. In March, the Fed mentioned it would end its balance sheet normalization program by the end of September 2019. In June, the Fed indicated increased uncertainties around its views on economic activity and the labor market. With market-based inflation measures remaining low in recent months, the market has interpreted the Fed’s recent statements to mean it will likely cut rates in 2019’s second half to foster continued economic growth while attempting to achieve its inflation objective.
U.S. equity markets overall rose during the period, benefiting from upbeat economic data and U.S. corporate earnings. However, markets reflected concerns about tighter regulation of technology companies, U.S. political uncertainties, and the impact of U.S. trade disputes with China and other trading partners on global growth and corporate earnings. These concerns were partially alleviated in 2019’s first four months by easing trade tensions and optimism about a potential U.S.-China trade deal. Furthermore, markets benefited from the Fed’s indications of a patient approach to its monetary policy decisions. The broad U.S. stock market, as measured by the S&P 500, rallied in 2019’s first four months, reaching a newall-time high in April 2019. After declining in May due to escalating trade tensions, stocks reached anotherall-time high in June amid investor optimism about potential interest-rate cuts. Overall, the S&P 500 posted a +18.54% total return for thesix-month period.2
Investment Strategy
We use fundamental,bottom-up research to seek companies meeting our criteria of growth potential, quality and valuation. In seeking sustainable growth characteristics, we look for companies we believe can produce sustainable earnings and cash flow growth, evaluating the long-term market opportunity and competitive structure of an industry to target leaders and emerging leaders. We define quality companies as those with strong and improving competitive positions in attractive markets. We also believe important attributes of quality are experienced and talented management teams as well as financial strength reflected in the capital structure, gross and operating margins, free cash flow generation and returns on capital employed. In assessing value, we consider whether security prices fully reflect the balance of the sustainable growth opportunities relative to business and financial risks.
Manager’s Discussion
During the period under review, all sectors represented in the Fund’s portfolio posted positive returns and contributed to
Top 10 Holdings
6/30/19
| | | | |
| |
Company Sector/Industry | | % of Total
Net Assets | |
SBA Communications Corp. Real Estate | | | 1.9% | |
Verisk Analytics Inc. Industrials | | | 1.7% | |
CoStar Group Inc. Industrials | | | 1.7% | |
Microchip Technology Inc. Information Technology | | | 1.7% | |
Mettler-Toledo International Inc. Health Care | | | 1.6% | |
IDEX Corp. Industrials | | | 1.6% | |
MSCI Inc. Financials | | | 1.5% | |
Fortive Corp. Industrials | | | 1.5% | |
MarketAxess Holdings Inc. Financials | | | 1.4% | |
Amphenol Corp. Information Technology | | | 1.4% | |
absolute performance. Relative to the Russell Midcap® Growth Index, key contributors to the Fund’s performance included stock selection in the industrials, information technology (IT) and health care sectors.
In the industrials sector, commercial real estate information, analytics and marketing services company CoStar Group performed well as all business segments exhibited strong growth. We expect CoStar to continue to achieve robust growth with the help of its Apartments.com and LoopNet.com businesses, which concentrate on apartment rental listings and commercial property marketplaces, respectively.
In the IT sector, our investments in cloud-based internet security platform firm Zscaler (not part of the index), Canada-basede-commerce platform operator Shopify (not part of the index) and Israel-based web development and management solutions provider Wix.com (not part of the index) contributed to relative results. Zscaler generated strong revenue and billings growth for its fiscal-year 2019 second and third quarters. We believe Zscaler’s user-centric approach to cybersecurity provides lower costs, better user experience and more effective security than traditional network-centric solutions.
FRANKLINSMALL-MID CAP GROWTH VIP FUND
In the health care sector, cancer specialist Array BioPharma’s (not part of the index; not held atperiod-end) share price surged higher after the firm received a buyout offer from a pharmaceuticals competitor.
Other notable contributors to relative results included our positions in index and portfolio risk and performance analytics provider MSCI and electronic trading platform MarketAxess Holdings.
In contrast, stock selection in the consumer discretionary sector detracted from the Fund’s relative performance. Within the sector, apparel and home products retailer Burlington Stores posted positive returns that lagged the benchmark index, and our overweighted position hurt relative results. Fast-casual restaurant operator Chipotle Mexican Grill performed well, and our underweighted position hindered relative results.
Other key individual detractors included our positions in education technology company 2U, medical devices manufacturer ABIOMED, frozen potato products company Lamb Weston Holdings (not part of the index), biotechnology firm Heron Therapeutics (not part of the index) andsoftware-as-a-service provider New Relic (not part of the index). 2U’s share price declined after the company reduced near-term guidance for revenue growth. ABIOMED’s shares declined after an investigation by the U.S. Food and Drug Administration suggested higher mortality rates of patients using the firm’s Impella RP heart pump. ABIOMED is beginning a launch of Impella CP, its most widely used pump model, in Japan, which could support growth. Lamb Weston’s shares declined due to investor concerns about modestly higher capacity coming online. However, the company continued to see strong growth, driven by robust sales trends and strong pricing power.
Thank you for your participation in FranklinSmall-Mid Cap Growth VIP Fund. We look forward to serving your future investment needs.
The foregoing information reflects our analysis, opinions and portfolio holdings as of June 30, 2019, the end of the reporting period. The way we implement our main investment strategies and the resulting portfolio holdings may change depending on factors such as market and economic conditions. These opinions may not be relied upon as investment advice or an offer for a particular security. The information is not a complete analysis of every aspect of any market, country, industry, security or the Fund. Statements of fact are from sources considered reliable, but the investment manager makes no representation or warranty as to their completeness or accuracy. Although historical performance is no guarantee of future results, these insights may help you understand our investment management philosophy.
FRANKLINSMALL-MID CAP GROWTH VIP FUND
Class 2 Fund Expenses
As an investor in a variable insurance contract (Contract) that indirectly provides for investment in an underlying mutual fund, you can incur transaction and/or ongoing expenses at both the Fund level and the Contract Level: (1) transaction expenses can include sales charges (loads) on purchases, surrender fees, transfer fees and premium taxes; and (2) ongoing expenses can include management fees, distribution and service(12b-1) fees, contract fees, annual maintenance fees, mortality and expense risk fees and other fees and expenses. All mutual funds and Contracts have some types of ongoing expenses. The table below shows Fund-level ongoing expenses and can help you understand these costs and compare them with those of other mutual funds offered through the Contract. The table assumes a $1,000 investment held for the six months indicated. Please refer to the Fund prospectus for additional information on operating expenses.
Actual Fund Expenses
The table below provides information about the actual account values and actual expenses in the columns under the heading “Actual.” In these columns the Fund’s actual return, which includes the effect of ongoing Fund expenses but does not include the effect of ongoing Contract expenses, is used to calculate the “Ending Account Value.” You can estimate the Fund-level expenses you paid during the period by following these steps (of course, your account value and expenses will differ from those in this illustration): Divide your account value by $1,000 (if your account had an $8,600 value, then $8,600÷ $1,000 =8.6). Then multiply the result by the number under the headings “Actual” and “Fund-Level Expenses Paid During Period” (if Fund-Level Expenses Paid During Period were $ 7.50, then 8.6 x $ 7.50 = $64.50). In this illustration, the estimated expenses paid this period at the Fund level are $64.50.
Hypothetical Example for Comparison with Other Mutual Funds
Under the heading “Hypothetical” in the table, information is provided about hypothetical account values and hypothetical expenses based on the Fund’s actual expense ratio and an assumed rate of return of 5% per year before expenses, which is not the Fund’s actual return. This information may not be used to estimate the actual ending account balance or expenses you paid for the period, but it can help you compare ongoing costs of investing in the Fund with those of other mutual funds offered through the Contract. To do so, compare this 5% hypothetical example with the 5% hypothetical examples that appear in the shareholder reports of other funds offered through the Contract.
Please note that expenses shown in the table are meant to highlight ongoing costs at the Fund level only and do not reflect any ongoing expenses at the Contract level, or transaction expenses at either the Fund or Contract levels. In addition, while the Fund does not have transaction expenses, if the transaction and ongoing expenses at the Contract level were included, the expenses shown below would be higher. You should consult your Contract prospectus or disclosure document for more information.
| | | | | | | | | | | | | | | | | | |
| | | | | | | Actual
(actual return after expenses) | | | | Hypothetical
(5% annual return before expenses) | | | | |
Share Class | | Beginning
Account
Value 1/1/19 | | | | Ending
Account
Value 6/30/19 | | Fund-Level
Expenses
Paid During
Period
1/1/19–6/30/191,2 | | | | Ending Account
Value 6/30/19 | | Fund-Level
Expenses
Paid During Period
1/1/19–6/30/191,2 | | | | Net
Annualized
Expense
Ratio2 |
Class 2 | | $1,000 | | | | $1,266.50 | | $6.07 | | | | $1,019.44 | | $5.41 | | | | 1.08% |
1. Expenses are equal to the annualized expense ratio for thesix-month period as indicated above—in the far right column—multiplied by the simple average account value over the period indicated, and then multiplied by 181/365 to reflect theone-half year period.
2. Reflects expenses after fee waivers and expense reimbursements. Does not include any ongoing expenses of the Contract for which the Fund is an investment option or acquired fund fees and expenses.
FRANKLIN TEMPLETON VARIABLE INSURANCE PRODUCTS TRUST
Financial Highlights
FranklinSmall-Mid Cap Growth VIP Fund
| | | | | | | | | | | | | | | | | | | | | | | | |
| | |
| | | Six Months Ended
June 30, 2019 (unaudited) | | | Year Ended December 31, | |
| | | 2018 | | | 2017 | | | 2016 | | | 2015 | | | 2014 | |
| |
| | | | | | |
| Class 1 | | | | | | | | | | | | | | | | | | | | | | | | |
| | | | | | |
Per share operating performance
(for a share outstanding throughout the period) | | | | | | | | | | | | | | | | | | | | | | | | |
| | | | | | |
Net asset value, beginning of period | | | $17.04 | | | | $19.71 | | | | $17.77 | | | | $19.09 | | | | $24.95 | | | | $28.38 | |
| | | | |
| | | | | | |
| Income from investment operationsa: | | | | | | | | | | | | | | | | | | | | | | | | |
| | | | | | |
Net investment income (loss)b | | | (0.02 | ) | | | (0.05 | ) | | | (0.04 | ) | | | (0.03 | ) | | | — | c,d | | | (0.07) | |
| | | | | | |
Net realized and unrealized gains (losses) | | | 4.55 | | | | (0.70 | ) | | | 3.74 | | | | 0.77 | | | | (0.03 | ) | | | 2.04 | |
| | | | |
| | | | | | |
Total from investment operations | | | 4.53 | | | | (0.75 | ) | | | 3.70 | | | | 0.74 | | | | (0.03 | ) | | | 1.97 | |
| | | | |
| | | | | | |
Less distributions from: | | | | | | | | | | | | | | | | | | | | | | | | |
| | | | | | |
Net realized gains | | | (2.57 | ) | | | (1.92 | ) | | | (1.76 | ) | | | (2.06 | ) | | | (5.83 | ) | | | (5.40) | |
| | | | |
| | | | | | |
Net asset value, end of period | | | $19.00 | | | | $17.04 | | | | $19.71 | | | | $17.77 | | | | $19.09 | | | | $24.95 | |
| | | | |
| | | | | | |
Total returne | | | 26.86% | | | | (5.15)% | | | | 21.75% | | | | 4.40% | | | | (2.44)% | | | | 7.78% | |
| | | | | | |
| Ratios to average net assetsf | | | | | | | | | | | | | | | | | | | | | | | | |
| | | | | | |
Expenses before waiver and payments by affiliates | | | 0.84% | | | | 0.86% | | | | 0.85% | | | | 0.84% | | | | 0.81% | | | | 0.80% | |
| | | | | | |
Expenses net of waiver and payments by affiliates | | | 0.83% | g | | | 0.85% | g | | | 0.84% | g | | | 0.82% | g | | | 0.81% | h | | | 0.80% | h |
| | | | | | |
Net investment income (loss) | | | (0.17)% | | | | (0.24)% | | | | (0.24)% | | | | (0.16)% | | | | 0.01% | d | | | (0.29)% | |
| | | | | | |
| Supplemental data | | | | | | | | | | | | | | | | | | | | | | | | |
| | | | | | |
Net assets, end of period (000’s) | | | $42,625 | | | | $33,518 | | | | $36,864 | | | | $31,756 | | | | $87,866 | | | | $99,803 | |
| | | | | | |
Portfolio turnover rate | | | 31.38% | | | | 44.78% | | | | 40.49% | | | | 32.23% | i | | | 37.85% | | | | 48.73% | |
aThe amount shown for a share outstanding throughout the period may not correlate with the Statement of Operations for the period due to the timing of sales and repurchases of the Fund’s shares in relation to income earned and/or fluctuating fair value of the investments of the Fund.
bBased on average daily shares outstanding.
cAmount rounds to less than $0.01 per share.
dNet investment income per share includes approximately $0.05 per share related to income received in the form of special dividends in connection with certain fund holdings. Excluding this amount, the ratio of net investment income to average net assets would have been (0.24)%.
eTotal return does not include fees, charges or expenses imposed by the variable annuity and life insurance contracts for which Franklin Templeton Variable Insurance Products Trust serves as an underlying investment vehicle. Total return is not annualized for periods less than one year.
fRatios are annualized for periods less than one year.
gBenefit of expense reduction rounds to less than 0.01%.
hBenefit of waiver and payments by affiliates rounds to less than 0.01%.
iExcludes the value of portfolio securities delivered as a result of a redemptionin-kind.
| | | | |
| | | |
FSC-6 | | Semiannual Report | The accompanying notes are an integral part of these financial statements. | | |
FRANKLIN TEMPLETON VARIABLE INSURANCE PRODUCTS TRUST
FINANCIAL HIGHLIGHTS
FranklinSmall-Mid Cap Growth VIP Fund(continued)
| | | | | | | | | | | | | | | | | | | | | | | | |
| | |
| | | Six Months Ended
June 30, 2019 (unaudited) | | | Year Ended December 31, | |
| | | 2018 | | | 2017 | | | 2016 | | | 2015 | | | 2014 | |
| |
| | | | | | |
| Class 2 | | | | | | | | | | | | | | | | | | | | | | | | |
| | | | | | |
Per share operating performance
(for a share outstanding throughout the period) | | | | | | | | | | | | | | | | | | | | | | | | |
| | | | | | |
Net asset value, beginning of period | | | $15.22 | | | | $17.83 | | | | $16.27 | | | | $17.69 | | | | $23.56 | | | | $27.16 | |
| | | | |
| | | | | | |
| Income from investment operationsa: | | | | | | | | | | | | | | | | | | | | | | | | |
| | | | | | |
Net investment income (loss)b | | | (0.04 | ) | | | (0.09 | ) | | | (0.08 | ) | | | (0.07 | ) | | | (0.05 | )c | | | (0.13) | |
| | | | | | |
Net realized and unrealized gains (losses) | | | 4.06 | | | | (0.60 | ) | | | 3.40 | | | | 0.71 | | | | 0.01 | | | | 1.93 | |
| | | | |
| | | | | | |
Total from investment operations | | | 4.02 | | | | (0.69 | ) | | | 3.32 | | | | 0.64 | | | | (0.04 | ) | | | 1.80 | |
| | | | |
| | | | | | |
Less distributions from: | | | | | | | | | | | | | | | | | | | | | | | | |
| | | | | | |
Net realized gains | | | (2.57 | ) | | | (1.92 | ) | | | (1.76 | ) | | | (2.06 | ) | | | (5.83 | ) | | | (5.40) | |
| | | | |
| | | | | | |
Net asset value, end of period | | | $16.67 | | | | $15.22 | | | | $17.83 | | | | $16.27 | | | | $17.69 | | | | $23.56 | |
| | | | |
| | | | | | |
Total returnd | | | 26.65% | | | | (5.37)% | | | | 21.40% | | | | 4.17% | | | | (2.66)% | | | | 7.47% | |
| | | | | | |
| Ratios to average net assetse | | | | | | | | | | | | | | | | | | | | | | | | |
| | | | | | |
Expenses before waiver and payments by affiliates | | | 1.09% | | | | 1.11% | | | | 1.10% | | | | 1.09% | | | | 1.06% | | | | 1.05% | |
| | | | | | |
Expenses net of waiver and payments by affiliates | | | 1.08% | f | | | 1.10% | f | | | 1.09% | f | | | 1.07% | f | | | 1.06% | g | | | 1.05% | g |
| | | | | | |
Net investment income (loss) | | | (0.42)% | | | | (0.49)% | | | | (0.49)% | | | | (0.41)% | | | | (0.24)% | c | | | (0.54)% | |
| | | | | | |
| Supplemental data | | | | | | | | | | | | | | | | | | | | | | | | |
| | | | | | |
Net assets, end of period (000’s) | | | $386,369 | | | | $310,300 | | | | $390,094 | | | | $392,777 | | | | $478,649 | | | | $582,772 | |
| | | | | | |
Portfolio turnover rate | | | 31.38% | | | | 44.78% | | | | 40.49% | | | | 32.23% | h | | | 37.85% | | | | 48.73% | |
aThe amount shown for a share outstanding throughout the period may not correlate with the Statement of Operations for the period due to the timing of sales and repurchases of the Fund’s shares in relation to income earned and/or fluctuating fair value of the investments of the Fund.
bBased on average daily shares outstanding.
cNet investment income per share includes approximately $0.05 per share related to income received in the form of special dividends in connection with certain Fund holdings. Excluding this amount, the ratio of net investment income to average net assets would have been (0.49)%.
dTotal return does not include fees, charges or expenses imposed by the variable annuity and life insurance contracts for which Franklin Templeton Variable Insurance Products Trust serves as an underlying investment vehicle. Total return is not annualized for periods less than one year.
eRatios are annualized for periods less than one year.
fBenefit of expense reduction rounds to less than 0.01%.
gBenefit of waiver and payments by affiliates rounds to less than 0.01%.
hExcludes the value of portfolio securities delivered as a result of a redemptionin-kind.
| | | | | | |
| | | |
| | The accompanying notes are an integral part of these financial statements. | Semiannual Report | | | FSC-7 | |
FRANKLIN TEMPLETON VARIABLE INSURANCE PRODUCTS TRUST
FINANCIAL HIGHLIGHTS
FranklinSmall-Mid Cap Growth VIP Fund(continued)
| | | | | | | | | | | | | | | | | | | | | | | | |
| | |
| | | Six Months Ended
June 30, 2019 (unaudited) | | | Year Ended December 31, | |
| | | 2018 | | | 2017 | | | 2016 | | | 2015 | | | 2014 | |
| |
| | | | | | |
| Class 4 | | | | | | | | | | | | | | | | | | | | | | | | |
| | | | | | |
Per share operating performance
(for a share outstanding throughout the period) | | | | | | | | | | | | | | | | | | | | | | | | |
| | | | | | |
Net asset value, beginning of period | | | $15.81 | | | | $18.47 | | | | $16.81 | | | | $18.23 | | | | $24.14 | | | | $27.72 | |
| | | | |
| | | | | | |
| Income from investment operationsa: | | | | | | | | | | | | | | | | | | | | | | | | |
| | | | | | |
Net investment income (loss)b | | | (0.05 | ) | | | (0.11 | ) | | | (0.10 | ) | | | (0.09 | ) | | | (0.07 | )c | | | (0.16) | |
| | | | | | |
Net realized and unrealized gains (losses) | | | 4.21 | | | | (0.63 | ) | | | 3.52 | | | | 0.73 | | | | (0.01 | ) | | | 1.98 | |
| | | | |
| | | | | | |
Total from investment operations | | | 4.16 | | | | (0.74 | ) | | | 3.42 | | | | 0.64 | | | | (0.08 | ) | | | 1.82 | |
| | | | |
| | | | | | |
Less distributions from: | | | | | | | | | | | | | | | | | | | | | | | | |
| | | | | | |
Net realized gains | | | (2.57 | ) | | | (1.92 | ) | | | (1.76 | ) | | | (2.06 | ) | | | (5.83 | ) | | | (5.40) | |
| | | | |
| | | | | | |
Net asset value, end of period | | | $17.40 | | | | $15.81 | | | | $18.47 | | | | $16.81 | | | | $18.23 | | | | $24.14 | |
| | | | |
| | | | | | |
Total returnd | | | 26.61% | | | | (5.46)% | | | | 21.30% | | | | 4.04% | | | | (2.77)% | | | | 7.39% | |
| | | | | | |
| Ratios to average net assetse | | | | | | | | | | | | | | | | | | | | | | | | |
| | | | | | |
Expenses before waiver and payments by affiliates | | | 1.19% | | | | 1.21% | | | | 1.20% | | | | 1.19% | | | | 1.16% | | | | 1.15% | |
| | | | | | |
Expenses net of waiver and payments by affiliates | | | 1.18% | f | | | 1.20% | f | | | 1.19% | f | | | 1.17% | f | | | 1.16% | g | | | 1.15% | g |
| | | | | | |
Net investment income (loss) | | | (0.52)% | | | | (0.59)% | | | | (0.59)% | | | | (0.51)% | | | | (0.34)% | c | | | (0.64)% | |
| | | | | | |
| Supplemental data | | | | | | | | | | | | | | | | | | | | | | | | |
| | | | | | |
Net assets, end of period (000’s) | | | $17,322 | | | | $13,759 | | | | $15,829 | | | | $13,825 | | | | $15,105 | | | | $16,384 | |
| | | | | | |
Portfolio turnover rate | | | 31.38% | | | | 44.78% | | | | 40.49% | | | | 32.23% | h | | | 37.85% | | | | 48.73% | |
aThe amount shown for a share outstanding throughout the period may not correlate with the Statement of Operations for the period due to the timing of sales and repurchases of the Fund’s shares in relation to income earned and/or fluctuating fair value of the investments of the Fund.
bBased on average daily shares outstanding.
cNet investment income per share includes approximately $0.05 per share related to income received in the form of special dividends in connection with certain Fund holdings. Excluding this amount, the ratio of net investment income to average net assets would have been (0.59)%.
dTotal return does not include fees, charges or expenses imposed by the variable annuity and life insurance contracts for which Franklin Templeton Variable Insurance Products Trust serves as an underlying investment vehicle. Total return is not annualized for periods less than one year.
eRatios are annualized for periods less than one year.
fBenefit of expense reduction rounds to less than 0.01%.
gBenefit of waiver and payments by affiliates rounds to less than 0.01%.
hExcludes the value of portfolio securities delivered as a result of a redemptionin-kind.
| | | | |
| | | |
FSC-8 | | Semiannual Report | The accompanying notes are an integral part of these financial statements. | | |
FRANKLIN TEMPLETON VARIABLE INSURANCE PRODUCTS TRUST
Statement of Investments, June 30, 2019 (unaudited)
| | | | | | | | |
FranklinSmall-Mid Cap Growth VIP Fund | | | | |
| | |
| | | Shares | | | Value | |
| | |
Common Stocks 96.3% | | | | | | | | |
| | |
Communication Services 2.1% | | | | | | | | |
a IAC/InterActiveCorp | | | 20,500 | | | $ | 4,459,365 | |
a Pinterest Inc., A | | | 85,500 | | | | 2,327,310 | |
a Spotify Technology SA | | | 17,000 | | | | 2,485,740 | |
| | | | | | | | |
| | |
| | | | | | | 9,272,415 | |
| | | | | | | | |
| | |
Consumer Discretionary 16.3% | | | | | | | | |
Aptiv PLC | | | 59,777 | | | | 4,831,775 | |
a Burlington Stores Inc. | | | 35,500 | | | | 6,040,325 | |
a Chipotle Mexican Grill Inc. | | | 2,200 | | | | 1,612,336 | |
a Dollar Tree Inc. | | | 28,411 | | | | 3,051,057 | |
Domino’s Pizza Inc. | | | 18,800 | | | | 5,231,664 | |
a,b,c DraftKings Inc. | | | 733,541 | | | | 1,930,710 | |
Expedia Group Inc. | | | 44,000 | | | | 5,853,320 | |
a Five Below Inc. | | | 19,000 | | | | 2,280,380 | |
a Grand Canyon Education Inc. | | | 47,057 | | | | 5,506,610 | |
a Levi Strauss & Co., A | | | 104,000 | | | | 2,171,520 | |
MGM Resorts International | | | 126,000 | | | | 3,599,820 | |
a NVR Inc. | | | 1,282 | | | | 4,320,661 | |
a O’Reilly Automotive Inc. | | | 11,107 | | | | 4,102,037 | |
a,d Revolve Group Inc. | | | 10,200 | | | | 351,900 | |
Tractor Supply Co. | | | 46,237 | | | | 5,030,586 | |
a Ulta Beauty Inc. | | | 10,700 | | | | 3,711,723 | |
a Under Armour Inc., A | | | 64,000 | | | | 1,622,400 | |
Vail Resorts Inc. | | | 17,000 | | | | 3,794,060 | |
VF Corp. | | | 51,500 | | | | 4,498,525 | |
Wingstop Inc. | | | 30,500 | | | | 2,889,875 | |
| | | | | | | | |
| | |
| | | | | | | 72,431,284 | |
| | | | | | | | |
| | |
Consumer Staples 2.5% | | | | | | | | |
Brown-Forman Corp., B | | | 58,500 | | | | 3,242,655 | |
Church & Dwight Co. Inc. | | | 34,000 | | | | 2,484,040 | |
Lamb Weston Holdings Inc. | | | 47,000 | | | | 2,977,920 | |
McCormick & Co. Inc. | | | 14,200 | | | | 2,201,142 | |
| | | | | | | | |
| | |
| | | | | | | 10,905,757 | |
| | | | | | | | |
| | |
Energy 1.1% | | | | | | | | |
Concho Resources Inc. | | | 23,000 | | | | 2,373,140 | |
Diamondback Energy Inc. | | | 24,000 | | | | 2,615,280 | |
| | | | | | | | |
| | |
| | | | | | | 4,988,420 | |
| | | | | | | | |
| | |
Financials 7.5% | | | | | | | | |
Ares Management Corp., A | | | 80,000 | | | | 2,093,600 | |
CBOE Global Markets Inc. | | | 42,000 | | | | 4,352,460 | |
Chemical Financial Corp. | | | 50,000 | | | | 2,055,500 | |
MarketAxess Holdings Inc. | | | 20,296 | | | | 6,523,540 | |
MSCI Inc. | | | 28,000 | | | | 6,686,120 | |
SEI Investments Co. | | | 62,000 | | | | 3,478,200 | |
a SVB Financial Group | | | 12,878 | | | | 2,892,270 | |
Tradeweb Markets Inc. | | | 61,000 | | | | 2,672,410 | |
FRANKLIN TEMPLETON VARIABLE INSURANCE PRODUCTS TRUST
STATEMENT OF INVESTMENTS (UNAUDITED)
FranklinSmall-Mid Cap Growth VIP Fund(continued)
| | | | | | | | |
| | |
| | | Shares | | | Value | |
| | |
Common Stocks(continued) | | | | | | | | |
| | |
Financials(continued) | | | | | | | | |
a Western Alliance Bancorp | | | 61,000 | | | $ | 2,727,920 | |
| | | | | | | | |
| | |
| | | | | | | 33,482,020 | |
| | | | | | | | |
| | |
Health Care 13.4% | | | | | | | | |
a ABIOMED Inc. | | | 20,300 | | | | 5,287,947 | |
a Align Technology Inc. | | | 13,000 | | | | 3,558,100 | |
a Argenx SE, ADR (Netherlands) | | | 5,000 | | | | 707,900 | |
a Avantor Inc. | | | 95,000 | | | | 1,813,550 | |
a BioMarin Pharmaceutical Inc. | | | 24,308 | | | | 2,081,980 | |
a DexCom Inc. | | | 25,288 | | | | 3,789,154 | |
a GW Pharmaceuticals PLC, ADR (United Kingdom) | | | 14,000 | | | | 2,413,460 | |
a HealthEquity Inc. | | | 46,500 | | | | 3,041,100 | |
a Heron Therapeutics Inc. | | | 123,000 | | | | 2,286,570 | |
a IDEXX Laboratories Inc. | | | 22,000 | | | | 6,057,260 | |
a Incyte Corp. | | | 24,469 | | | | 2,078,886 | |
a iRhythm Technologies Inc. | | | 25,500 | | | | 2,016,540 | |
a Masimo Corp. | | | 4,500 | | | | 669,690 | |
a Mettler-Toledo International Inc. | | | 8,455 | | | | 7,102,200 | |
a Neurocrine Biosciences Inc. | | | 20,644 | | | | 1,742,973 | |
a Penumbra Inc. | | | 26,748 | | | | 4,279,680 | |
a Precision BioSciences Inc. | | | 37,000 | | | | 490,250 | |
a PTC Therapeutics Inc. | | | 31,500 | | | | 1,417,500 | |
a Reata Pharmaceuticals Inc. | | | 18,894 | | | | 1,782,649 | |
a Revance Therapeutics Inc. | | | 70,801 | | | | 918,289 | |
a Sage Therapeutics Inc. | | | 7,500 | | | | 1,373,175 | |
a Sarepta Therapeutics Inc. | | | 9,000 | | | | 1,367,550 | |
a Veeva Systems Inc. | | | 22,500 | | | | 3,647,475 | |
| | | | | | | | |
| | |
| | | | | | | 59,923,878 | |
| | | | | | | | |
| | |
Industrials 17.5% | | | | | | | | |
BWX Technologies Inc. | | | 86,000 | | | | 4,480,600 | |
a CoStar Group Inc. | | | 13,535 | | | | 7,499,202 | |
Fortive Corp. | | | 81,000 | | | | 6,603,120 | |
IDEX Corp. | | | 41,000 | | | | 7,057,740 | |
a IHS Markit Ltd. | | | 44,915 | | | | 2,861,984 | |
L3Harris Technologies Inc. | | | 30,500 | | | | 5,768,465 | |
a,d Lyft Inc., A | | | 34,000 | | | | 2,234,140 | |
a Mercury Systems Inc. | | | 30,500 | | | | 2,145,675 | |
Old Dominion Freight Line Inc. | | | 27,500 | | | | 4,104,650 | |
Republic Services Inc. | | | 51,000 | | | | 4,418,640 | |
Rockwell Automation Inc. | | | 34,000 | | | | 5,570,220 | |
Roper Technologies Inc. | | | 12,243 | | | | 4,484,121 | |
a Spirit Airlines Inc. | | | 22,500 | | | | 1,073,925 | |
Stanley Black & Decker Inc. | | | 25,296 | | | | 3,658,055 | |
TransUnion | | | 44,000 | | | | 3,234,440 | |
a Univar Inc. | | | 137,800 | | | | 3,037,112 | |
a Upwork Inc. | | | 150,000 | | | | 2,412,000 | |
FRANKLIN TEMPLETON VARIABLE INSURANCE PRODUCTS TRUST
STATEMENT OF INVESTMENTS (UNAUDITED)
FranklinSmall-Mid Cap Growth VIP Fund(continued)
| | | | | | | | |
| | |
| | | Shares | | | Value | |
| | |
Common Stocks(continued) | | | | | | | | |
| | |
Industrials(continued) | | | | | | | | |
Verisk Analytics Inc. | | | 51,361 | | | $ | 7,522,332 | |
| | | | | | | | |
| | |
| | | | | | | 78,166,421 | |
| | | | | | | | |
| | |
Information Technology 32.3% | | | | | | | | |
a 2U Inc. | | | 74,547 | | | | 2,805,949 | |
a Advanced Micro Devices Inc. | | | 82,000 | | | | 2,490,340 | |
a Adyen NV (Netherlands) | | | 3,500 | | | | 2,700,133 | |
a Alteryx Inc. | | | 9,500 | | | | 1,036,640 | |
Amphenol Corp., A | | | 66,000 | | | | 6,332,040 | |
a Arista Networks Inc. | | | 13,700 | | | | 3,556,794 | |
a Atlassian Corp. PLC | | | 39,500 | | | | 5,168,180 | |
a Black Knight Inc. | | | 82,500 | | | | 4,962,375 | |
Cognex Corp. | | | 32,996 | | | | 1,583,148 | |
a Cree Inc. | | | 19,500 | | | | 1,095,510 | |
a Crowdstrike Holdings Inc., A | | | 11,100 | | | | 758,019 | |
a DocuSign Inc. | | | 87,000 | | | | 4,324,770 | |
a Elastic NV | | | 40,500 | | | | 3,023,730 | |
a EPAM Systems Inc. | | | 24,000 | | | | 4,154,400 | |
Global Payments Inc. | | | 36,000 | | | | 5,764,680 | |
a GoDaddy Inc., A | | | 88,617 | | | | 6,216,483 | |
a Guidewire Software Inc. | | | 41,000 | | | | 4,156,580 | |
KLA-Tencor Corp. | | | 30,187 | | | | 3,568,103 | |
Lam Research Corp. | | | 12,616 | | | | 2,369,789 | |
a Lattice Semiconductor Corp. | | | 78,195 | | | | 1,140,865 | |
Microchip Technology Inc. | | | 86,127 | | | | 7,467,211 | |
Monolithic Power Systems | | | 34,000 | | | | 4,616,520 | |
a New Relic Inc. | | | 37,500 | | | | 3,244,125 | |
a Nutanix Inc., A | | | 40,000 | | | | 1,037,600 | |
a,d Pagerduty Inc. | | | 31,100 | | | | 1,463,255 | |
a Paylocity Holding Corp. | | | 29,000 | | | | 2,720,780 | |
a Pluralsight Inc., A | | | 88,000 | | | | 2,668,160 | |
a PTC Inc. | | | 62,500 | | | | 5,610,000 | |
a Q2 Holdings Inc. | | | 48,196 | | | | 3,680,247 | |
a Semtech Corp. | | | 4,600 | | | | 221,030 | |
a Shopify Inc., A (Canada) | | | 5,300 | | | | 1,590,795 | |
a Silicon Laboratories Inc. | | | 37,500 | | | | 3,877,500 | |
a,d Slack Technologies Inc. | | | 23,980 | | | | 899,250 | |
a Square Inc., A | | | 82,500 | | | | 5,983,725 | |
a Synopsys Inc. | | | 36,500 | | | | 4,697,185 | |
a Trimble Inc. | | | 66,500 | | | | 2,999,815 | |
a Twilio Inc., A | | | 34,500 | | | | 4,704,075 | |
a ViaSat Inc. | | | 43,866 | | | | 3,545,250 | |
a WEX Inc. | | | 17,500 | | | | 3,641,750 | |
a Wix.com Ltd. (Israel) | | | 18,800 | | | | 2,671,480 | |
a Workday Inc., A | | | 19,843 | | | | 4,079,324 | |
Xilinx Inc. | | | 28,500 | | | | 3,360,720 | |
FRANKLIN TEMPLETON VARIABLE INSURANCE PRODUCTS TRUST
STATEMENT OF INVESTMENTS (UNAUDITED)
FranklinSmall-Mid Cap Growth VIP Fund(continued)
| | | | | | | | |
| | |
| | | Shares | | | Value | |
| | |
Common Stocks(continued) | | | | | | | | |
Information Technology(continued) | | | | | | | | |
a Zscaler Inc. | | | 28,000 | | | $ | 2,145,920 | |
| | | | | | | | |
| | |
| | | | | | | 144,134,245 | |
| | | | | | | | |
| | |
Materials 1.7% | | | | | | | | |
a Ingevity Corp. | | | 40,341 | | | | 4,242,663 | |
Martin Marietta Materials Inc. | | | 15,000 | | | | 3,451,650 | |
| | | | | | | | |
| | |
| | | | | | | 7,694,313 | |
| | | | | | | | |
| | |
Real Estate 1.9% | | | | | | | | |
a SBA Communications Corp., A | | | 38,057 | | | | 8,556,736 | |
| | | | | | | | |
| | |
Total Common Stocks (Cost $317,240,492) | | | | | | | 429,555,489 | |
| | | | | | | | |
| | |
Preferred Stocks (Cost $799,998) 0.2% | | | | | | | | |
Financials 0.2% | | | | | | | | |
a,b,c Bill.com, pfd., H | | | 96,296 | | | | 902,942 | |
| | | | | | | | |
| | |
Total Investments before Short Term Investments (Cost $318,040,490) | | | | | | | 430,458,431 | |
| | | | | | | | |
| | |
Short Term Investments 4.2% | | | | | | | | |
| | |
Money Market Funds (Cost $15,958,950) 3.6% | | | | | | | | |
e,f Institutional Fiduciary Trust Money Market Portfolio, 2.05% | | | 15,958,950 | | | | 15,958,950 | |
| | | | | | | | |
| | |
gInvestments from Cash Collateral Received for Loaned Securities 0.6% | | | | | | | | |
Money Market Funds (Cost $2,916,125) 0.6% | | | | | | | | |
e,f Institutional Fiduciary Trust Money Market Portfolio, 2.05% | | | 2,916,125 | | | | 2,916,125 | |
| | | | | | | | |
| | |
Total Investments (Cost $336,915,565) 100.7% | | | | | | | 449,333,506 | |
| | |
Other Assets, less Liabilities (0.7)% | | | | | | | (3,017,431 | ) |
| | | | | | | | |
| | |
Net Assets 100.0% | | | | | | $ | 446,316,075 | |
| | | | | | | | |
aNon-income producing.
bFair valued using significant unobservable inputs. See Note 9 regarding fair value measurements.
cSee Note 7 regarding restricted securities.
dA portion or all of the security is on loan at June 30, 2019. See Note 1(c).
eSee Note 3(e) regarding investments in affiliated management investment companies.
fThe rate shown is the annualizedseven-day effective yield at period end.
gSee Note 1(c) regarding securities on loan.
| | | | |
| | |
FSC-12 | | Semiannual Report | The accompanying notes are an integral part of these financial statements. |
FRANKLIN TEMPLETON VARIABLE INSURANCE PRODUCTS TRUST
FINANCIAL STATEMENTS
Statement of Assets and Liabilities
June 30, 2019 (unaudited)
| | | | |
| |
| | | Franklin Small-Mid
Cap Growth
VIP Fund | |
Assets: | | | | |
Investments in securities: | | | | |
Cost - Unaffiliated issuers | | | $318,040,490 | |
Cost -Non-controlled affiliates (Note 3e) | | | 18,875,075 | |
| | | | |
Value - Unaffiliated issuers+ | | | $430,458,431 | |
Value -Non-controlled affiliates (Note 3e) | | | 18,875,075 | |
Receivables: | | | | |
Capital shares sold | | | 494,872 | |
Dividends and interest | | | 154,740 | |
Due from custodian | | | 1,863,720 | |
Other assets | | | 278 | |
| | | | |
| |
Total assets | | | 451,847,116 | |
| | | | |
Liabilities: | | | | |
Payables: | | | | |
Capital shares redeemed | | | 182,224 | |
Management fees | | | 280,628 | |
Distribution fees | | | 168,144 | |
Trustees’ fees and expenses | | | 274 | |
Payable upon return of securities loaned | | | 4,779,845 | |
Accrued expenses and other liabilities | | | 119,926 | |
| | | | |
| |
Total liabilities | | | 5,531,041 | |
| | | | |
| |
Net assets, at value | | | $446,316,075 | |
| | | | |
Net assets consist of: | | | | |
Paid-in capital | | | $289,246,959 | |
Total distributable earnings (loss) | | | 157,069,116 | |
| | | | |
| |
Net assets, at value | | | $446,316,075 | |
| | | | |
Class 1: | | | | |
Net assets, at value | | | $ 42,625,314 | |
| | | | |
Shares outstanding | | | 2,243,327 | |
| | | | |
Net asset value and maximum offering price per share | | | $19.00 | |
| | | | |
Class 2: | | | | |
Net assets, at value | | | $386,369,085 | |
| | | | |
Shares outstanding | | | 23,184,310 | |
| | | | |
Net asset value and maximum offering price per share | | | $16.67 | |
| | | | |
Class 4: | | | | |
Net assets, at value | | | $ 17,321,676 | |
| | | | |
Shares outstanding | | | 995,474 | |
| | | | |
Net asset value and maximum offering price per share | | | $17.40 | |
| | | | |
| |
+Includes securities loaned | | | $ 4,727,537 | |
| | | | | | |
| | | |
| | The accompanying notes are an integral part of these financial statements. | Semiannual Report | | | FSC-13 | |
FRANKLIN TEMPLETON VARIABLE INSURANCE PRODUCTS TRUST
FINANCIAL STATEMENTS
Statement of Operations
for the six months ended June 30, 2019 (unaudited)
| | | | |
| |
| | | Franklin Small-Mid
Cap Growth
VIP Fund | |
| |
Investment income: | | | | |
Dividends: (net of foreign taxes)* | | | | |
Unaffiliated issuers | | | $ 1,205,566 | |
Non-controlled affiliates (Note 3e) | | | 141,303 | |
Income from securities loaned: | | | | |
Unaffiliated issuers (net of fees and rebates) | | | 18,364 | |
Non-controlled affiliates (Note 3e) | | | 16,954 | |
| | | | |
| |
Total investment income | | | 1,382,187 | |
| | | | |
Expenses: | | | | |
Management fees (Note 3a) | | | 1,673,806 | |
Distribution fees: (Note 3c) | | | | |
Class 2 | | | 454,581 | |
Class 4 | | | 27,941 | |
Custodian fees (Note 4) | | | 1,684 | |
Reports to shareholders | | | 66,437 | |
Professional fees | | | 22,794 | |
Trustees’ fees and expenses | | | 1,515 | |
Other | | | 6,611 | |
| | | | |
Total expenses | | | 2,255,369 | |
Expense reductions (Note 4) | | | (52 | ) |
Expenses waived/paid by affiliates (Note 3e) | | | (26,516 | ) |
| | | | |
| |
Net expenses | | | 2,228,801 | |
| | | | |
| |
Net investment income (loss) | | | (846,614 | ) |
| | | | |
Realized and unrealized gains (losses): | | | | |
Net realized gain (loss) from: | | | | |
Investments: | | | | |
Unaffiliated issuers | | | 45,965,449 | |
Foreign currency transactions | | | (740 | ) |
| | | | |
| |
Net realized gain (loss) | | | 45,964,709 | |
| | | | |
Net change in unrealized appreciation (depreciation) on: | | | | |
Investments: | | | | |
Unaffiliated issuers | | | 49,984,210 | |
| | | | |
| |
Net realized and unrealized gain (loss) | | | 95,948,919 | |
| | | | |
| |
Net increase (decrease) in net assets resulting from operations | | | $95,102,305 | |
| | | | |
| |
*Foreign taxes withheld on dividends | | | $ 25 | |
| | | | |
| | | |
FSC-14 | | Semiannual Report | The accompanying notes are an integral part of these financial statements. | | |
FRANKLIN TEMPLETON VARIABLE INSURANCE PRODUCTS TRUST
FINANCIAL STATEMENTS
Statements of Changes in Net Assets
| | | | | | | | |
| | | Franklin Small-Mid Cap Growth VIP Fund | |
| | | | |
| | |
| | | Six Months Ended
June 30, 2019
(unaudited) | | | Year Ended
December 31, 2018 | |
| |
Increase (decrease) in net assets: | | | | | | | | |
Operations: | | | | | | | | |
Net investment income (loss) | | | $ (846,614 | ) | | | $ (2,030,124 | ) |
Net realized gain (loss) | | | 45,964,709 | | | | 59,101,775 | |
Net change in unrealized appreciation (depreciation) | | | 49,984,210 | | | | (74,199,939 | ) |
| | | | |
| | |
Net increase (decrease) in net assets resulting from operations | | | 95,102,305 | | | | (17,128,288 | ) |
| | | | |
| | |
Distributions to shareholders: | | | | | | | | |
Class 1 | | | (5,113,428 | ) | | | (3,540,738 | ) |
Class 2 | | | (51,808,967 | ) | | | (39,501,499 | ) |
Class 4 | | | (2,209,122 | ) | | | (1,517,449 | ) |
| | | | |
Total distributions to shareholders | | | (59,131,517 | ) | | | (44,559,686 | ) |
| | | | |
| | |
Capital share transactions: (Note 2) | | | | | | | | |
Class 1 | | | 5,162,668 | | | | 1,966,782 | |
Class 2 | | | 45,439,605 | | | | (25,664,064 | ) |
Class 4 | | | 2,165,936 | | | | 175,962 | |
| | | | |
Total capital share transactions | | | 52,768,209 | | | | (23,521,320 | ) |
| | | | |
| | |
Net increase (decrease) in net assets | | | 88,738,997 | | | | (85,209,294 | ) |
Net assets: | | | | | | | | |
Beginning of period | | | 357,577,078 | | | | 442,786,372 | |
| | | | |
End of period | | | $446,316,075 | | | | $357,577,078 | |
| | | | |
| | | | | | |
| | | |
| | The accompanying notes are an integral part of these financial statements. | Semiannual Report | | | FSC-15 | |
FRANKLIN TEMPLETON VARIABLE INSURANCE PRODUCTS TRUST
Notes to Financial Statements (unaudited)
FranklinSmall-Mid Cap Growth VIP Fund
1. Organization and Significant Accounting Policies
Franklin Templeton Variable Insurance Products Trust (Trust) is registered under the Investment Company Act of 1940 (1940 Act) as anopen-end management investment company, consisting of eighteen separate funds and applies the specialized accounting and reporting guidance in U.S. Generally Accepted Accounting Principles (U.S. GAAP). FranklinSmall-Mid Cap Growth VIP Fund (Fund) is included in this report. Shares of the Fund are generally sold only to insurance company separate accounts to fund the benefits of variable life insurance policies or variable annuity contracts. At June 30, 2019, 44.5% of the Fund’s shares were held through one insurance company. Investment activities of these insurance company separate accounts could have a material impact on the Fund. The Fund offers three classes of shares: Class 1, Class 2 and Class 4. Each class of shares may differ by its distribution fees, voting rights on matters affecting a single class and its exchange privilege.
The following summarizes the Fund’s significant accounting policies.
a. Financial Instrument Valuation
The Fund’s investments in financial instruments are carried at fair value daily. Fair value is the price that would be received to sell an asset or paid to transfer a liability in an orderly transaction between market participants on the measurement date. The Fund calculates the net asset value (NAV) per share each business day as of 4 p.m. Eastern time or the regularly scheduled close of the New York Stock Exchange (NYSE), whichever is earlier. Under compliance policies and procedures approved by the Trust’s Board of Trustees (the Board), the Fund’s administrator has responsibility for oversight of valuation, including leading the cross-functional Valuation Committee (VC). The Fund may utilize independent pricing services, quotations from securities and financial instrument dealers, and other market sources to determine fair value.
Equity securities listed on an exchange or on the NASDAQ National Market System are valued at the last quoted sale price or the official closing price of the day, respectively. Foreign equity securities are valued as of the close of trading on the foreign stock exchange on which the security is primarily traded, or as of 4 p.m. Eastern time. The value is then converted into its U.S. dollar equivalent at the foreign exchange rate in effect at 4 p.m. Eastern time on the day that the value of the security is determined.Over-the-counter
(OTC) securities are valued within the range of the most recent quoted bid and ask prices. Securities that trade in multiple markets or on multiple exchanges are valued according to the broadest and most representative market. Certain equity securities are valued based upon fundamental characteristics or relationships to similar securities.
Investments inopen-end mutual funds are valued at the closing NAV.
The Fund has procedures to determine the fair value of financial instruments for which market prices are not reliable or readily available. Under these procedures, the Fund primarily employs a market-based approach which may use related or comparable assets or liabilities, recent transactions, market multiples, book values, and other relevant information for the investment to determine the fair value of the investment. An income-based valuation approach may also be used in which the anticipated future cash flows of the investment are discounted to calculate fair value. Discounts may also be applied due to the nature or duration of any restrictions on the disposition of the investments. Due to the inherent uncertainty of valuations of such investments, the fair values may differ significantly from the values that would have been used had an active market existed.
Trading in securities on foreign securities stock exchanges and OTC markets may be completed before 4 p.m. Eastern time. In addition, trading in certain foreign markets may not take place on every Fund’s business day. Occasionally, events occur between the time at which trading in a foreign security is completed and 4 p.m. Eastern time that might call into question the reliability of the value of a portfolio security held by the Fund. As a result, differences may arise between the value of the Fund’s portfolio securities as determined at the foreign market close and the latest indications of value at 4 p.m. Eastern time. In order to minimize the potential for these differences, the VC monitors price movements following the close of trading in foreign stock markets through a series of country specific market proxies (such as baskets of American Depositary Receipts, futures contracts and exchange traded funds). These price movements are measured against established trigger thresholds for each specific market proxy to assist in determining if an event has occurred that may call into question the reliability of the values of the foreign securities held by the Fund. If such an event occurs, the securities may be valued using fair value procedures, which may include the use of independent pricing services.
FRANKLIN TEMPLETON VARIABLE INSURANCE PRODUCTS TRUST
NOTES TO FINANCIAL STATEMENTS (UNAUDITED)
FranklinSmall-Mid Cap Growth VIP Fund(continued)
When the last day of the reporting period is anon-business day, certain foreign markets may be open on those days that the Fund’s NAV is not calculated, which could result in differences between the value of the Fund’s portfolio securities on the last business day and the last calendar day of the reporting period. Any significant security valuation changes due to an open foreign market are adjusted and reflected by the Fund for financial reporting purposes.
b. Foreign Currency Translation
Portfolio securities and other assets and liabilities denominated in foreign currencies are translated into U.S. dollars based on the exchange rate of such currencies against U.S. dollars on the date of valuation. The Fund may enter into foreign currency exchange contracts to facilitate transactions denominated in a foreign currency. Purchases and sales of securities, income and expense items denominated in foreign currencies are translated into U.S. dollars at the exchange rate in effect on the transaction date. Portfolio securities and assets and liabilities denominated in foreign currencies contain risks that those currencies will decline in value relative to the U.S. dollar. Occasionally, events may impact the availability or reliability of foreign exchange rates used to convert the U.S. dollar equivalent value. If such an event occurs, the foreign exchange rate will be valued at fair value using procedures established and approved by the Board.
The Fund does not separately report the effect of changes in foreign exchange rates from changes in market prices on securities held. Such changes are included in net realized and unrealized gain or loss from investments in the Statement of Operations.
Realized foreign exchange gains or losses arise from sales of foreign currencies, currency gains or losses realized between the trade and settlement dates on securities transactions and the difference between the recorded amounts of dividends, interest, and foreign withholding taxes and the U.S. dollar equivalent of the amounts actually received or paid. Net unrealized foreign exchange gains and losses arise from changes in foreign exchange rates on foreign denominated assets and liabilities other than investments in securities held at the end of the reporting period.
c. Securities Lending
The Fund participates in an agency based securities lending program to earn additional income. The Fund receives cash collateral against the loaned securities in an amount equal to at least 102% of the fair value of the loaned securities. Collateral is maintained over the life of the loan in an amount not less than 100% of the fair value of loaned securities, as determined at the close of Fund business each day; any additional collateral required due to changes in security values is delivered to the Fund on the next business day. The collateral is deposited into a joint cash account with other funds and is used to invest in a money market fund managed by Franklin Advisers, Inc., an affiliate of the Fund. The Fund may receive income from the investment of cash collateral, in addition to lending fees and rebates paid by the borrower. Income from securities loaned, net of fees paid to the securities lending agent and/or third-party vendor, is reported separately in the Statement of Operations. The Fund bears the market risk with respect to the collateral investment, securities loaned, and the risk that the agent may default on its obligations to the Fund. If the borrower defaults on its obligation to return the securities loaned, the Fund has the right to repurchase the securities in the open market using the collateral received. The securities lending agent has agreed to indemnify the Fund in the event of default by a third party borrower.
d. Income and Deferred Taxes
It is the Fund’s policy to qualify as a regulated investment company under the Internal Revenue Code. The Fund intends to distribute to shareholders substantially all of its taxable income and net realized gains to relieve it from federal income and if applicable, excise taxes. As a result, no provision for U.S. federal income taxes is required.
The Fund may be subject to foreign taxation related to income received, capital gains on the sale of securities and certain foreign currency transactions in the foreign jurisdictions in which it invests. Foreign taxes, if any, are recorded based on the tax regulations and rates that exist in the foreign markets in which the Fund invests. When a capital gain tax is determined to apply, the Fund records an estimated deferred tax liability in an amount that would be payable if the securities were disposed of on the valuation date.
FRANKLIN TEMPLETON VARIABLE INSURANCE PRODUCTS TRUST
NOTES TO FINANCIAL STATEMENTS (UNAUDITED)
FranklinSmall-Mid Cap Growth VIP Fund(continued)
1. Organization and Significant Accounting Policies(continued)
d. Income and Deferred Taxes(continued)
The Fund may recognize an income tax liability related to its uncertain tax positions under U.S. GAAP when the uncertain tax position has a less than 50% probability that it will be sustained upon examination by the tax authorities based on its technical merits. As of June 30, 2019, the Fund has determined that no tax liability is required in its financial statements related to uncertain tax positions for any open tax years (or expected to be taken in future tax years). Open tax years are those that remain subject to examination and are based on the statute of limitations in each jurisdiction in which the Fund invests.
e. Security Transactions, Investment Income, Expenses and Distributions
Security transactions are accounted for on trade date. Realized gains and losses on security transactions are determined on a specific identification basis. Estimated expenses are accrued daily. Dividend income is recorded on theex-dividend date except for certain dividends from securities where the dividend rate is not available. In such cases, the dividend is recorded as soon as the information is received by the Fund. Distributions to shareholders are recorded on theex-dividend date. Distributable earnings are determined according to income tax regulations (tax basis) and may differ from earnings recorded in accordance with U.S. GAAP. These differences may be permanent or temporary. Permanent differences are reclassified among capital accounts to reflect their tax character. These reclassifications have no impact on net assets or the results of operations. Temporary differences are not reclassified, as they may reverse in subsequent periods.
Common expenses incurred by the Trust are allocated among the Funds based on the ratio of net assets of each Fund to the combined net assets of the Trust or based on the ratio of number of shareholders of each Fund to the combined number of shareholders of the Trust. Fund specific expenses are charged directly to the Fund that incurred the expense.
Realized and unrealized gains and losses and net investment income, excluding class specific expenses, are allocated daily to each class of shares based upon the relative proportion of net assets of each class. Differences in per share distributions by class are generally due to differences in class specific expenses.
f. Accounting Estimates
The preparation of financial statements in accordance with U.S. GAAP requires management to make estimates and assumptions that affect the reported amounts of assets and liabilities at the date of the financial statements and the amounts of income and expenses during the reporting period. Actual results could differ from those estimates.
g. Guarantees and Indemnifications
Under the Trust’s organizational documents, its officers and trustees are indemnified by the Trust against certain liabilities arising out of the performance of their duties to the Trust. Additionally, in the normal course of business, the Trust, on behalf of the Fund, enters into contracts with service providers that contain general indemnification clauses. The Trust’s maximum exposure under these arrangements is unknown as this would involve future claims that may be made against the Trust that have not yet occurred. Currently, the Trust expects the risk of loss to be remote.
FRANKLIN TEMPLETON VARIABLE INSURANCE PRODUCTS TRUST
NOTES TO FINANCIAL STATEMENTS (UNAUDITED)
FranklinSmall-Mid Cap Growth VIP Fund(continued)
2. Shares of Beneficial Interest
At June 30, 2019, there were an unlimited number of shares authorized (without par value). Transactions in the Fund’s shares were as follows:
| | | | | | | | | | | | | | | | |
| | |
| | | Six Months Ended June 30, 2019 | | | Year Ended December 31, 2018 | |
| | | | |
| | | Shares | | | Amount | | | Shares | | | Amount | |
| | | | |
| Class 1 Shares: | | | | | | | | | | | | | | | | |
Shares sold | | | 167,375 | | | | $ 3,360,009 | | | | 148,944 | | | | $ 2,929,602 | |
Shares issued in reinvestment of distributions | | | 273,885 | | | | 5,113,428 | | | | 179,278 | | | | 3,540,738 | |
Shares redeemed | | | (164,444 | ) | | | (3,310,769 | ) | | | (231,919 | ) | | | (4,503,558 | ) |
| | | | |
| | | | |
Net increase (decrease) | | | 276,816 | | | | $ 5,162,668 | | | | 96,303 | | | | $ 1,966,782 | |
| | | | |
| | | | |
| Class 2 Shares: | | | | | | | | | | | | | | | | |
Shares sold | | | 1,402,075 | | | | $ 24,991,042 | | | | 706,305 | | | | $ 12,308,866 | |
Shares issued in reinvestment of distributions | | | 3,162,941 | | | | 51,808,967 | | | | 2,236,778 | | | | 39,501,499 | |
Shares redeemed | | | (1,768,694 | ) | | | (31,360,404 | ) | | | (4,433,380 | ) | | | (77,474,429 | ) |
| | | | |
| | | | |
Net increase (decrease) | | | 2,796,322 | | | | $ 45,439,605 | | | | (1,490,297 | ) | | | $(25,664,064 | ) |
| | | | |
| | | | |
| Class 4 Shares: | | | | | | | | | | | | | | | | |
Shares sold | | | 82,090 | | | | $ 1,530,261 | | | | 136,649 | | | | $ 2,474,956 | |
Shares issued in reinvestment of distributions | | | 129,188 | | | | 2,209,122 | | | | 82,695 | | | | 1,517,449 | |
Shares redeemed | | | (86,166 | ) | | | (1,573,447 | ) | | | (205,969 | ) | | | (3,816,443 | ) |
| | | | |
| | | | |
Net increase (decrease) | | | 125,112 | | | | $ 2,165,936 | | | | 13,375 | | | | $ 175,962 | |
| | | | |
3. Transactions with Affiliates
Franklin Resources, Inc. is the holding company for various subsidiaries that together are referred to as Franklin Templeton. Certain officers and trustees of the Fund are also officers and/or directors of the following subsidiaries:
| | |
| |
| Subsidiary | | Affiliation |
| |
Franklin Advisers, Inc. (Advisers) | | Investment manager |
| |
Franklin Templeton Services, LLC (FT Services) | | Administrative manager |
| |
Franklin Templeton Distributors, Inc. (Distributors) | | Principal underwriter |
| |
Franklin Templeton Investor Services, LLC (Investor Services) | | Transfer agent |
FRANKLIN TEMPLETON VARIABLE INSURANCE PRODUCTS TRUST
NOTES TO FINANCIAL STATEMENTS (UNAUDITED)
FranklinSmall-Mid Cap Growth VIP Fund(continued)
3. Transactions with Affiliates(continued)
a. Management Fees
The Fund pays an investment management fee to Advisers based on the average daily net assets of the Fund as follows:
| | |
| |
| Annualized Fee Rate | | Net Assets |
| |
0.800% | | Up to and including $500 million |
| |
0.700% | | Over $500 million, up to and including $1 billion |
| |
0.650% | | Over $1 billion, up to and including $1.5 billion |
| |
0.600% | | Over $1.5 billion, up to and including $6.5 billion |
| |
0.575% | | Over $6.5 billion, up to and including $11.5 billion |
| |
0.550% | | Over $11.5 billion, up to and including $16.5 billion |
| |
0.540% | | Over $16.5 billion, up to and including $19 billion |
| |
0.530% | | Over $19 billion, up to and including $21.5 billion |
| |
0.520% | | In excess of $21.5 billion |
b. Administrative Fees
Under an agreement with Advisers, FT Services provides administrative services to the Fund. The fee is paid by Advisers based on the Fund’s average daily net assets, and is not an additional expense of the Fund.
c. Distribution Fees
The Board has adopted distribution plans for Class 2 and Class 4 shares pursuant to Rule12b-1 under the 1940 Act. Under the Fund’s compensation distribution plans, the Fund pays Distributors for costs incurred in connection with the servicing, sale and distribution of the Fund’s shares up to 0.35% per year of its average daily net assets of each class. The Board has agreed to limit the current rate to 0.25% per year for Class 2. The plan year, for purposes of monitoring compliance with the maximum annual plan rates, is February 1 through January 31.
d. Transfer Agent Fees
Investor Services, under terms of an agreement, performs shareholder servicing for the Fund and is not paid by the Fund for the services.
FRANKLIN TEMPLETON VARIABLE INSURANCE PRODUCTS TRUST
NOTES TO FINANCIAL STATEMENTS (UNAUDITED)
FranklinSmall-Mid Cap Growth VIP Fund(continued)
e. Investments in Affiliated Management Investment Companies
The Fund invests in one or more affiliated management investment companies for purposes other than exercising a controlling influence over the management or policies. Management fees paid by the Fund are waived on assets invested in the affiliated management investment companies, as noted in the Statement of Operations, in an amount not to exceed the management and administrative fees paid directly or indirectly by each affiliate. During the period ended June 30, 2019, the Fund held investments in affiliated management investment companies as follows:
| | | | | | | | | | | | | | | | | | | | | | | | | | | | | | | | |
| | | | | | | | |
| | | Value at
Beginning
of Period | | | Purchases | | | Sales | | | Realized
Gain (Loss) | | | Net Change in
Unrealized
Appreciation
(Depreciation) | | | Value at
End of
Period | | | Number of
Shares
Held at End
of Period | | | Investment
Income | |
| | | | | | | | |
| Non-Controlled Affiliates | | | | | | | | | | | | | | | | | | | | | | | | | | | | | | | | |
| | | | | | | | | | | | | | | | | | | | | | | | | | | | | | | Dividends | |
| | | | | | | | | | | | | | | | | | | | | | | | | | | | | | | | |
Institutional Fiduciary Trust Money Market Portfolio, 2.05% | | | $12,085,918 | | | | $59,649,353 | | | | $(55,776,321) | | | | $ — | | | | $ — | | | | $15,958,950 | | | | 15,958,950 | | | | $141,303 | |
| | | | | | | | | | | | | | | | | | | | | | | | | | | | | |
| Income from
securities
loaned |
|
| | | | | | | | | | | | | | | | | | | | | | | | | | | | | | | | |
Institutional Fiduciary Trust Money Market Portfolio, 2.05% | | | — | | | | 23,271,023 | | | | (20,354,898 | ) | | | — | | | | — | | | | 2,916,125 | | | | 2,916,125 | | | | 16,954 | |
| | | | | | | | | | | | |
Total Affiliated Securities | | | $12,085,918 | | | | $82,920,376 | | | | $(76,131,219) | | | | $ — | | | | $ — | | | | $18,875,075 | | | | | | | | $158,257 | |
| | | | | | | | | | | | |
4. Expense Offset Arrangement
The Fund has entered into an arrangement with its custodian whereby credits realized as a result of uninvested cash balances are used to reduce a portion of the Fund’s custodian expenses. During the period ended June 30, 2019, the custodian fees were reduced as noted in the Statement of Operations.
5. Income Taxes
At June 30, 2019, the cost of investments and net unrealized appreciation (depreciation) for income tax purposes were as follows:
| | | | |
Cost of investments | | $ | 337,358,579 | |
| | | | |
| |
Unrealized appreciation | | $ | 118,994,886 | |
Unrealized depreciation | | | (7,019,959) | |
| | | | |
| |
Net unrealized appreciation (depreciation) | | $ | 111,974,927 | |
| | | | |
Differences between income and/or capital gains as determined on a book basis and a tax basis are primarily due to differing treatment of wash sales.
6. Investment Transactions
Purchases and sales of investments (excluding short term securities) for the period ended June 30, 2019, aggregated $127,243,150 and $139,600,415, respectively.
FRANKLIN TEMPLETON VARIABLE INSURANCE PRODUCTS TRUST
NOTES TO FINANCIAL STATEMENTS (UNAUDITED)
FranklinSmall-Mid Cap Growth VIP Fund(continued)
6. Investment Transactions(continued)
At June 30, 2019, in connection with securities lending transactions, the Fund loaned equity investments and received $4,779,845 of cash collateral. The gross amount of recognized liability for such transactions is included in payable upon return of securities loaned in the Statement of Assets and Liabilities. The agreements can be terminated at any time.
7. Restricted Securities
The Fund invests in securities that are restricted under the Securities Act of 1933 (1933 Act). Restricted securities are often purchased in private placement transactions, and cannot be sold without prior registration unless the sale is pursuant to an exemption under the 1933 Act. Disposal of these securities may require greater effort and expense, and prompt sale at an acceptable price may be difficult. The Fund may have registration rights for restricted securities. The issuer generally incurs all registration costs.
At June 30, 2019, investments in restricted securities, excluding securities exempt from registration under the 1933 Act deemed to be liquid, were as follows:
| | | | | | | | | | | | | | | | |
| | | | |
| Shares | | | Issuer | | Acquisition
Date | | | Cost | | | Value | |
| | |
| | 96,296 | | | Bill.com, pfd., H | | | 12/21/18 | | | | $ 799,998 | | | | $ 902,942 | |
| | 733,541 | | | DraftKings Inc. | | | 8/07/15 | | | | 2,800,003 | | | | 1,930,710 | |
| | | | | | | | | | | | |
| | | | |
| | | | Total Restricted Securities(Value is 0.6% of Net Assets) | | | | | | | $3,600,001 | | | | $2,833,652 | |
| | | | | | | | | | | | |
8. Credit Facility
The Fund, together with other U.S. registered and foreign investment funds (collectively, Borrowers), managed by Franklin Templeton, are borrowers in a joint syndicated senior unsecured credit facility totaling $2 billion (Global Credit Facility) which matures on February 7, 2020. This Global Credit Facility provides a source of funds to the Borrowers for temporary and emergency purposes, including the ability to meet future unanticipated or unusually large redemption requests.
Under the terms of the Global Credit Facility, the Fund shall, in addition to interest charged on any borrowings made by the Fund and other costs incurred by the Fund, pay its share of fees and expenses incurred in connection with the implementation and maintenance of the Global Credit Facility, based upon its relative share of the aggregate net assets of all of the Borrowers, including an annual commitment fee of 0.15% based upon the unused portion of the Global Credit Facility. These fees are reflected in other expenses in the Statement of Operations. During the period ended June 30, 2019, the Fund did not use the Global Credit Facility.
9. Fair Value Measurements
The Fund follows a fair value hierarchy that distinguishes between market data obtained from independent sources (observable inputs) and the Fund’s own market assumptions (unobservable inputs). These inputs are used in determining the value of the Fund’s financial instruments and are summarized in the following fair value hierarchy:
| | • | | Level 1 – quoted prices in active markets for identical financial instruments |
| | • | | Level 2 – other significant observable inputs (including quoted prices for similar financial instruments, interest rates, prepayment speed, credit risk, etc.) |
FRANKLIN TEMPLETON VARIABLE INSURANCE PRODUCTS TRUST
NOTES TO FINANCIAL STATEMENTS (UNAUDITED)
FranklinSmall-Mid Cap Growth VIP Fund(continued)
| | • | | Level 3 – significant unobservable inputs (including the Fund’s own assumptions in determining the fair value of financial instruments) |
The input levels are not necessarily an indication of the risk or liquidity associated with financial instruments at that level.
A summary of inputs used as of June 30, 2019, in valuing the Fund’s assets carried at fair value, is as follows:
| | | | | | | | | | | | | | | | |
| | | | |
| | | Level 1 | | | Level 2 | | | Level 3 | | | Total | |
| |
| | | | |
| Assets: | | | | | | | | | | | | | | | | |
Investments in Securities:a | | | | | | | | | | | | | | | | |
Equity Investments:b | | | | | | | | | | | | | | | | |
Consumer Discretionary | | | $ 70,500,574 | | | | $ — | | | | $ 1,930,710 | | | | $ 72,431,284 | |
Financials | | | 33,482,020 | | | | — | | | | 902,942 | | | | 34,384,962 | |
All Other Equity Investments | | | 323,642,185 | | | | — | | | | — | | | | 323,642,185 | |
Short Term Investments | | | 18,875,075 | | | | — | | | | — | | | | 18,875,075 | |
| | | | |
| | | | |
Total Investments in Securities | | | $ 446,499,854 | | | | $ — | | | | $ 2,833,652 | | | | $ 449,333,506 | |
| | | | |
aFor detailed categories, see the accompanying Statement of Investments.
bIncludes common and preferred stocks.
A reconciliation of assets in which Level 3 inputs are used in determining fair value is presented when there are significant Level 3 financial instruments at the beginning and/or end of the period.
10. Subsequent Events
The Fund has evaluated subsequent events through the issuance of the financial statements and determined that no events have occurred that require disclosure.
This page intentionally left blank.
Franklin Strategic Income VIP Fund
This semiannual report for Franklin Strategic Income VIP Fund covers the period ended June 30, 2019.
Class 2 Performance Summary as of June 30, 2019
The Fund’s Class 2 Shares posted a +6.72% total return* for thesix-month period ended June 30, 2019.
*The Fund has a fee waiver associated with any investment in a Franklin Templeton money fund and/or other Franklin Templeton fund, contractually guaranteed through 4/30/20. Fund investment results reflect the fee waiver; without this reduction, the results would have been lower.
Performance reflects the Fund’s Class 2 operating expenses, but doesnotinclude any contract fees, expenses or sales charges. If they had been included, performance would be lower. These charges and deductions, particularly for variable life policies, can have a significant effect on contract values and insurance benefits. See the contract prospectus for a complete description of these expenses, including sales charges.
Performance data represent past performance, which does not guarantee future results. Investment return and principal value will fluctuate, and you may have a gain or loss when you sell your shares. Current performance may differ from figures shown.
FRANKLIN STRATEGIC INCOME VIP FUND
Fund Goal and Main Investments
The Fund seeks a high level of current income, with capital appreciation over the long term as a secondary goal. Under normal market conditions, the Fund invests primarily to predominantly in U.S. and foreign debt securities, including those in emerging markets.
Fund Risks
All investments involve risks, including possible loss of principal. Bond prices generally move in the opposite direction of interest rates. Thus, as prices of bonds in the Fund adjust to a rise in interest rates, the Fund’s share price may decline. Changes in the financial strength of a bond issuer or in a bond’s credit rating may affect its value. High yields reflect the higher credit risks associated with certain lower rated securities held in the portfolio. Floating rate loans and high yield corporate bonds are rated below investment grade and are subject to greater risk of default, which could result in loss of principal—a risk that may be heightened in a slowing economy. The risks of foreign securities include currency fluctuations and political uncertainty. Investments in developing markets involve heightened risks related to the same factors, in addition to those associated with their relatively small size and lesser liquidity. Investing in derivative securities and the use of foreign currency techniques involve special risks as such may not achieve the anticipated benefits and/or may result in losses to the Fund. The Fund is actively managed but there is no guarantee that the manager’s investment decisions will produce the desired results. The Fund’s prospectus also includes a description of the main investment risks.
Performance Overview
You can find the Fund’ssix-month total return in the Performance Summary. For comparison, the Fund’s benchmark, the Bloomberg Barclays U.S. Aggregate Index, posted a +6.11% total return for the period under review.1 The Fund’s peers, as measured by the Lipper Multi-Sector Income Funds Classification Average, posted a +6.96% return.2
Economic and Market Overview
The U.S. economy grew during the six months ended June 30, 2019. After moderating for two consecutive quarters, the economy grew significantly faster in 2019’s first quarter, driven by growth in consumer spending, inventory investment, exports, business investment, and state and local government spending. However, the economy moderated again in the second quarter, due to weakness in inventory investment, exports, business investment and housing investment. The manufacturing and services sectors expanded during the period. The unemployment rate decreased from 3.9% in December 2018 to 3.7% atperiod-end.3 The annual inflation rate, as measured by the Consumer Price Index, decreased from 1.9% in December 2018 to 1.6% atperiod-end.3
The U.S. Federal Reserve (Fed) held its target range for the federal funds rate unchanged, at 2.25%–2.50%, during the reporting period. In March, the Fed mentioned it would end its balance sheet normalization program by the end of September 2019. In June, the Fed indicated increased uncertainties around its views on economic activity and the labor market. With market-based inflation measures remaining low in recent months, the market has interpreted the Fed’s recent statements to mean it will likely cut rates in 2019’s second half to foster continued economic growth while attempting to achieve its inflation objective.
The10-year Treasury yield, which moves inversely to its price, decreased during the period. The yield rose at some points during 2019’s first quarter amid several better-than-expected U.S. economic reports and optimism about a potential U.S.-China trade deal. However, concerns about political uncertainties in the U.S., slower domestic and global economic growth, and the Fed’s patient approach to its monetary policy decisions weighed on the Treasury yield. Nearperiod-end, the10-year yield reached multi-year lows and fell below certain short-term yields, due to weaker economic data and escalating U.S. trade tensions with China and Mexico. Overall, the10-year Treasury yield declined from 2.69% at the beginning of the period to 2.00% atperiod-end.
1. Source: Morningstar.
2. Source: Lipper, a Thomson Reuters Company.
One cannot invest directly in an index, and an index is not representative of the Fund’s portfolio. Please see Index Descriptions following the Fund Summaries.
3. Source: Bureau of Labor Statistics.
The dollar value, number of shares or principal amount, and names of all portfolio holdings are listed in the Fund’s Statement of Investments (SOI).
FRANKLIN STRATEGIC INCOME VIP FUND
Investment Strategy
We allocate our investments among the various types of debt available based on our assessment of changing economic, global market, industry and issuer conditions. We use atop-down analysis of macroeconomic trends, combined with abottom-up fundamental analysis of market sectors, industries and issuers, seeking to take advantage of varying sector reactions to economic events. For example, we may evaluate business cycles, yield curves, country risk, and the relative interest rates among currencies, and values between and within markets. In selecting debt securities, we generally conduct our own analysis of the security’s intrinsic value rather than simply relying on the coupon rate or rating. We may also enter into various transactions involving certain currency-, interest rate- or credit-related derivative instruments.
|
What is the yield curve? A yield curve is a line that plots the yield to maturity of bonds having equal credit quality against their maturity dates. |
Manager’s Discussion
The Fund allocated assets across the broad fixed income markets with an emphasis on spread sectors, both corporate and securitized. Our largest allocation was in corporate credit (inclusive of high-yield and investment-grade corporate credit, senior secured floating-rate bank loans and collateralized loan obligations (CLOs)), with a majority of credit exposure in below investment-grade corporate securities. Over the period we pared exposure to high-yield and investment-grade corporate credit as well as senior secured floating-rate loans, while we increased our CLO exposure. The Fund added tonon-agency residential mortgage-backed securities (RMBS) over the period. For our RMBS exposure we preferred to remain allocated to the seasoned credit risk transfer where fundamental and technical forces remained positive. Our foreign-currency exposure was held through a basket of developed-market shorts with major positions in the Australian dollar, Canadian dollar, Swedish Krona and South Korean won versus a basket of emerging-market longs with major positions in the Norwegian krone, Indonesian rupiah, Brazilian real, Colombian and Mexican peso.
The Fund’s U.S. dollar yield curve positioning was the most significant contributor to performance. Allocations across corporate credit provided sizable contributions to results over the period, including high yield and investment-grade corporate bonds, senior secured floating-rate bank loans and CLOs. Foreign currency exposure contributed overall to
| | | | |
| Portfolio Composition* | | | | |
Based on Consolidated Net Assets | | | |
| |
| | | 6/30/19 | |
| |
| High-Yield Corporate Bonds | | | 24.39% | |
| |
| Floating Rate Loans | | | 16.92% | |
| |
| Residential Mortgage-Backed Securities | | | 12.34% | |
| |
| Interest-Rate Derivatives | | | 12.21% | |
| |
| International Government & Agency Bonds | | | 11.13% | |
| |
| Investment-Grade Corporate Bonds | | | 10.80% | |
| |
| Collateralized Loan Obligations | | | 10.46% | |
| |
| Agency Mortgage-Backed Securities | | | 9.58% | |
| |
| Treasury Inflation-Protected Securities | | | 2.63% | |
| |
| U.S. Treasury Securities | | | 2.61% | |
| |
| Municipal Bonds | | | 2.46% | |
| |
| Commercial Mortgage-Backed Securities | | | 1.81% | |
| |
| Asset-Backed Securities | | | 1.69% | |
| |
| Other | | | 0.33% | |
| |
| Covered Bonds | | | 0.12% | |
| |
| Short-Term Investments & Other Net Assets | | | -1.54% | |
*Notional exposure figures are intended to estimate the portfolio’s exposure, including any hedged or increased exposure through certain derivatives held in the portfolio (or their underlying reference assets). Portfolio breakdown percentages may not total 100% and may be negative due to rounding, use of any derivatives, unsettled trades or other factors. Interest-rate derivatives sector consists of Treasury, interest rate and other derivatives that are primarily used for duration management.
returns with performance gains mainly from our Mexican peso and Norwegian krone exposures, which more than offset negative returns from short Swedish krona and Canadian dollar positions. In contrast, the Fund’s exposure to fixed-rate agency MBS andnon-dollar emerging market securities detracted from performance.
The Fund utilized derivatives, including credit default swaps, currency forwards and government bond futures, primarily as a tool for efficient portfolio management and to manage overall portfolio risk. These derivative transactions may provide the same, or similar, net long or short exposure to select currencies, interest rates, countries, duration or credit risks compared to holding securities.
|
What is a currency forward? A currency forward is a direct agreement between the Fund and a counterparty to buy or sell a foreign currency in exchange for another currency at a specific exchange rate on a future date. |
FRANKLIN STRATEGIC INCOME VIP FUND
|
What is a credit derivative? A credit derivative is a contract agreement between the Fund and a counterparty that is principally used by the Fund to gain or increase exposure to certain financial assets and/or to hedge against credit risk. |
|
What is meant by “hedge”? To hedge an investment is to take a position intended to offset potential losses/gains that may be incurred by a companion financial instrument. |
Thank you for your participation in Franklin Strategic Income VIP Fund. We look forward to serving your future investment needs.
The foregoing information reflects our analysis, opinions and portfolio holdings as of June 30, 2019, the end of the reporting period. The way we implement our main investment strategies and the resulting portfolio holdings may change depending on factors such as market and economic conditions. These opinions may not be relied upon as investment advice or an offer for a particular security. The information is not a complete analysis of every aspect of any market, country, industry, security or the Fund. Statements of fact are from sources considered reliable, but the investment manager makes no representation or warranty as to their completeness or accuracy. Although historical performance is no guarantee of future results, these insights may help you understand our investment management philosophy.
FRANKLIN STRATEGIC INCOME VIP FUND
Class 2 Fund Expenses
As an investor in a variable insurance contract (Contract) that indirectly provides for investment in an underlying mutual fund, you can incur transaction and/or ongoing expenses at both the Fund level and the Contract Level: (1) transaction expenses can include sales charges (loads) on purchases, surrender fees, transfer fees and premium taxes; and (2) ongoing expenses can include management fees, distribution and service(12b-1) fees, contract fees, annual maintenance fees, mortality and expense risk fees and other fees and expenses. All mutual funds and Contracts have some types of ongoing expenses. The table below shows Fund-level ongoing expenses and can help you understand these costs and compare them with those of other mutual funds offered through the Contract. The table assumes a $1,000 investment held for the six months indicated. Please refer to the Fund prospectus for additional information on operating expenses.
Actual Fund Expenses
The table below provides information about the actual account values and actual expenses in the columns under the heading “Actual.” In these columns the Fund’s actual return, which includes the effect of ongoing Fund expenses but does not include the effect of ongoing Contract expenses, is used to calculate the “Ending Account Value.” You can estimate the Fund-level expenses you paid during the period by following these steps (ofcourse, your account value and expenses will differ from those in this illustration):Divide your account value by $1,000 (ifyour account had an $8,600 value, then $8,600÷ $1,000 = 8.6). Then multiply the result by the number under the headings “Actual” and “Fund-Level Expenses Paid During Period” (if Fund-Level Expenses Paid During Period were $ 7.50, then 8.6 x $ 7.50 = $64.50). In this illustration, the estimated expenses paid this period at the Fund level are $64.50.
Hypothetical Example for Comparison with Other Mutual Funds
Under the heading “Hypothetical” in the table, information is provided about hypothetical account values and hypothetical expenses based on the Fund’s actual expense ratio and an assumed rate of return of 5% per year before expenses, which is not the Fund’s actual return. This information may not be used to estimate the actual ending account balance or expenses you paid for the period, but it can help you compare ongoing costs of investing in the Fund with those of other mutual funds offered through the Contract. To do so, compare this 5% hypothetical example with the 5% hypothetical examples that appear in the shareholder reports of other funds offered through the Contract.
Please note that expenses shown in the table are meant to highlight ongoing costs at the Fund level only and do not reflect any ongoing expenses at the Contract level, or transaction expenses at either the Fund or Contract levels. In addition, while the Fund does not have transaction expenses, if the transaction and ongoing expenses at the Contract level were included, the expenses shown below would be higher. You should consult your Contract prospectus or disclosure document for more information.
| | | | | | | | | | | | |
| | | | | Actual
(actual return after expenses) | | Hypothetical
(5% annual return before expenses) | | |
Share Class | | Beginning
Account
Value 1/1/19 | | Ending
Account
Value 6/30/19 | | Fund-Level
Expenses
Paid During
Period
1/1/19–6/30/191, 2 | | Ending
Account
Value 6/30/19 | | Fund-Level
Expenses Paid During Period
1/1/19–6/30/191,2 | | Net
Annualized
Expense
Ratio2 |
| | | | | | |
Class 2 | | $1,000 | | $1,067.20 | | $4.72 | | $1,020.23 | | $4.61 | | 0.92% |
1. Expenses are equal to the annualized expense ratio for thesix-month period as indicated above—in the far right column—multiplied by the simple average account value over the period indicated, and then multiplied by 181/365 to reflect theone-half year period.
2. Reflects expenses after fee waivers and expense reimbursements. Does not include any ongoing expenses of the Contract for which the Fund is an investment option or acquired fund fees and expenses.
FRANKLIN TEMPLETON VARIABLE INSURANCE PRODUCTS TRUST
Consolidated Financial Highlights
Franklin Strategic Income VIP Fund
| | | | | | | | | | | | | | | | | | | | | | | | |
| | |
| | | Six Months Ended June 30, 2019 (unaudited) | | | Year Ended December 31, | |
| | | 2018 | | | 2017 | | | 2016 | | | 2015 | | | 2014 | |
| |
| | | | | | |
| Class 1 | | | | | | | | | | | | | | | | | | | | | | | | |
| | | | | | |
Per share operating performance (for a share outstanding throughout the period) | | | | | | | | | | | | | | | | | | | | | | | | |
| | | | | | |
Net asset value, beginning of period | | | $10.65 | | | | $11.15 | | | | $11.01 | | | | $10.55 | | | | $11.90 | | | | $12.64 | |
| | | | |
| | | | | | |
| Income from investment operationsa: | | | | | | | | | | | | | | | | | | | | | | | | |
| | | | | | |
Net investment incomeb | | | 0.24 | | | | 0.47 | | | | 0.45 | | | | 0.48 | | | | 0.53 | | | | 0.54 | |
| | | | | | |
Net realized and unrealized gains (losses) | | | 0.49 | | | | (0.65 | ) | | | 0.04 | | | | 0.37 | | | | (0.91 | ) | | | (0.25) | |
| | | | |
| | | | | | |
Total from investment operations | | | 0.73 | | | | (0.18 | ) | | | 0.49 | | | | 0.85 | | | | (0.38 | ) | | | 0.29 | |
| | | | |
| | | | | | |
Less distributions from: | | | | | | | | | | | | | | | | | | | | | | | | |
| | | | | | |
Net investment income and net foreign currency gains | | | (0.60 | ) | | | (0.32 | ) | | | (0.35 | ) | | | (0.39 | ) | | | (0.77 | ) | | | (0.78) | |
| | | | | | |
Net realized gains | | | — | | | | — | | | | — | | | | — | | | | (0.20 | ) | | | (0.25) | |
| | | | |
| | | | | | |
Total distributions | | | (0.60 | ) | | | (0.32 | ) | | | (0.35 | ) | | | (0.39 | ) | | | (0.97 | ) | | | (1.03) | |
| | | | |
| | | | | | |
Net asset value, end of period | | | $10.78 | | | | $10.65 | | | | $11.15 | | | | $11.01 | | | | $10.55 | | | | $11.90 | |
| | | | |
| | | | | | |
Total returnc | | | 6.92% | | | | (1.65)% | | | | 4.46% | | | | 8.25% | | | | (3.62)% | | | | 2.12% | |
| | | | | | |
| Ratios to average net assetsd | | | | | | | | | | | | | | | | | | | | | | | | |
| | | | | | |
Expenses before waiver and payments by affiliates | | | 0.70% | | | | 0.67% | | | | 0.68% | | | | 0.67% | | | | 0.63% | | | | 0.63% | |
| | | | | | |
Expenses net of waiver and payments by affiliatese | | | 0.67% | | | | 0.63% | | | | 0.63% | | | | 0.60% | | | | 0.62% | | | | 0.62% | |
| | | | | | |
Net investment income | | | 4.33% | | | | 4.28% | | | | 4.00% | | | | 4.42% | | | | 4.71% | | | | 4.34% | |
| | | | | | |
| Supplemental data | | | | | | | | | | | | | | | | | | | | | | | | |
| | | | | | |
Net assets, end of period (000’s) | | | $302,061 | | | | $302,610 | | | | $361,465 | | | | $396,170 | | | | $441,658 | | | | $574,850 | |
| | | | | | |
Portfolio turnover rate | | | 66.30%f | | | | 107.90%g | | | | 108.73% | | | | 128.51% | | | | 85.85% | | | | 55.64% | |
| | | | | | |
Portfolio turnover rate excluding mortgage dollar rollsh | | | 37.89%f | | | | 40.38%g | | | | 48.11% | | | | 77.93% | | | | 51.47% | | | | 48.86% | |
aThe amount shown for a share outstanding throughout the period may not correlate with the Consolidated Statement of Operations for the period due to the timing of sales and repurchases of the Fund’s shares in relation to income earned and/or fluctuating fair value of the investments of the Fund.
bBased on average daily shares outstanding.
cTotal return does not include fees, charges or expenses imposed by the variable annuity and life insurance contracts for which Franklin Templeton Variable Insurance Products Trust serves as an underlying investment vehicle. Total return is not annualized for periods less than one year.
dRatios are annualized for periods less than one year.
eBenefit of expense reduction rounds to less than 0.01%.
fExcludes the value of portfolio activity as a result ofin-kind transactions. See Note 6.
gExcludes the value of portfolio securities delivered as a result of a redemptionin-kind. See Note 11.
hSee Note 1(h) regarding mortgage dollar rolls.
| | | | |
| | | |
FSI-6 | | Semiannual Report | The accompanying notes are an integral part of these consolidated financial statements. | | |
FRANKLIN TEMPLETON VARIABLE INSURANCE PRODUCTS TRUST
CONSOLIDATED FINANCIAL HIGHLIGHTS
Franklin Strategic Income VIP Fund(continued)
| | | | | | | | | | | | | | | | | | | | | | | | |
| | |
| | | Six Months Ended June 30, 2019 (unaudited) | | | Year Ended December 31, | |
| | | 2018 | | | 2017 | | | 2016 | | | 2015 | | | 2014 | |
| |
| | | | | | |
| Class 2 | | | | | | | | | | | | | | | | | | | | | | | | |
| | | | | | |
Per share operating performance (for a share outstanding throughout the period) | | | | | | | | | | | | | | | | | | | | | | | | |
| | | | | | |
Net asset value, beginning of period | | | $10.28 | | | | $10.76 | | | | $10.64 | | | | $10.21 | | | | $11.55 | | | | $12.30 | |
| | | | |
| | | | | | |
| Income from investment operationsa: | | | | | | | | | | | | | | | | | | | | | | | | |
| | | | | | |
Net investment incomeb | | | 0.22 | | | | 0.42 | | | | 0.40 | | | | 0.43 | | | | 0.49 | | | | 0.49 | |
| | | | | | |
Net realized and unrealized gains (losses) | | | 0.47 | | | | (0.61 | ) | | | 0.04 | | | | 0.36 | | | | (0.89 | ) | | | (0.24) | |
| | | | |
| | | | | | |
Total from investment operations | | | 0.69 | | | | (0.19 | ) | | | 0.44 | | | | 0.79 | | | | (0.40 | ) | | | 0.25 | |
| | | | |
| | | | | | |
Less distributions from: | | | | | | | | | | | | | | | | | | | | | | | | |
| | | | | | |
Net investment income and net foreign currency gains | | | (0.55 | ) | | | (0.29 | ) | | | (0.32 | ) | | | (0.36 | ) | | | (0.74 | ) | | | (0.75) | |
| | | | | | |
Net realized gains | | | — | | | | — | | | | — | | | | — | | | | (0.20 | ) | | | (0.25) | |
| | | | |
| | | | | | |
Total distributions | | | (0.55 | ) | | | (0.29 | ) | | | (0.32 | ) | | | (0.36 | ) | | | (0.94 | ) | | | (1.00) | |
| | | | |
| | | | | | |
Net asset value, end of period | | | $10.42 | | | | $10.28 | | | | $10.76 | | | | $10.64 | | | | $10.21 | | | | $11.55 | |
| | | | |
| | | | | | |
Total returnc | | | 6.72% | | | | (1.77)% | | | | 4.17% | | | | 7.94% | | | | (3.87)% | | | | 1.86% | |
| | | | | | |
| Ratios to average net assetsd | | | | | | | | | | | | | | | | | | | | | | | | |
| | | | | | |
Expenses before waiver and payments by affiliates | | | 0.95% | | | | 0.92% | | | | 0.93% | | | | 0.92% | | | | 0.88% | | | | 0.88% | |
| | | | | | |
Expenses net of waiver and payments by affiliatese | | | 0.92% | | | | 0.88% | | | | 0.88% | | | | 0.85% | | | | 0.87% | | | | 0.87% | |
| | | | | | |
Net investment income | | | 4.08% | | | | 4.03% | | | | 3.75% | | | | 4.17% | | | | 4.46% | | | | 4.09% | |
| | | | | | |
| Supplemental data | | | | | | | | | | | | | | | | | | | | | | | | |
| | | | | | |
Net assets, end of period (000’s) | | | $92,191 | | | | $89,264 | | | | $214,271 | | | | $203,418 | | | | $202,192 | | | | $206,571 | |
| | | | | | |
Portfolio turnover rate | | | 66.30%f | | | | 107.90%g | | | | 108.73% | | | | 128.51% | | | | 85.85% | | | | 55.64% | |
| | | | | | |
Portfolio turnover rate excluding mortgage dollar rollsh | |
| 37.89%f
|
| | | 40.38%g | | | | 48.11% | | | | 77.93% | | | | 51.47% | | | | 48.86% | |
aThe amount shown for a share outstanding throughout the period may not correlate with the Consolidated Statement of Operations for the period due to the timing of sales and repurchases of the Fund’s shares in relation to income earned and/or fluctuating fair value of the investments of the Fund.
bBased on average daily shares outstanding.
cTotal return does not include fees, charges or expenses imposed by the variable annuity and life insurance contracts for which Franklin Templeton Variable Insurance Products Trust serves as an underlying investment vehicle. Total return is not annualized for periods less than one year.
dRatios are annualized for periods less than one year.
eBenefit of expense reduction rounds to less than 0.01%.
fExcludes the value of portfolio activity as a result ofin-kind transactions. See Note 6.
gExcludes the value of portfolio securities delivered as a result of a redemptionin-kind. See Note 11.
hSee Note 1(h) regarding mortgage dollar rolls.
| | | | | | |
| | | |
| | The accompanying notes are an integral part of these consolidated financial statements. | Semiannual Report | | | FSI-7 | |
FRANKLIN TEMPLETON VARIABLE INSURANCE PRODUCTS TRUST
CONSOLIDATED FINANCIAL HIGHLIGHTS
Franklin Strategic Income VIP Fund(continued)
| | | | | | | | | | | | | | | | | | | | | | | | |
| | |
| | | Six Months Ended June 30, 2019 (unaudited) | | | Year Ended December 31, | |
| | | 2018 | | | 2017 | | | 2016 | | | 2015 | | | 2014 | |
| |
| | | | | | |
| Class 4 | | | | | | | | | | | | | | | | | | | | | | | | |
| | | | | | |
Per share operating performance (for a share outstanding throughout the period) | | | | | | | | | | | | | | | | | | | | | | | | |
| | | | | | |
Net asset value, beginning of period | | | $10.56 | | | | $11.04 | | | | $10.90 | | | | $10.44 | | | | $11.78 | | | | $12.51 | |
| | | | |
| | | | | | |
| Income from investment operationsa: | | | | | | | | | | | | | | | | | | | | | | | | |
| | | | | | |
Net investment incomeb | | | 0.22 | | | | 0.43 | | | | 0.40 | | | | 0.43 | | | | 0.49 | | | | 0.49 | |
| | | | | | |
Net realized and unrealized gains (losses) | | | 0.49 | | | | (0.64 | ) | | | 0.04 | | | | 0.38 | | | | (0.91 | ) | | | (0.25) | |
| | | | |
| | | | | | |
Total from investment operations | | | 0.71 | | | | (0.21 | ) | | | 0.44 | | | | 0.81 | | | | (0.42 | ) | | | 0.24 | |
| | | | |
| | | | | | |
Less distributions from: | | | | | | | | | | | | | | | | | | | | | | | | |
| | | | | | |
Net investment income and net foreign currency gains | | | (0.56 | ) | | | (0.27 | ) | | | (0.30 | ) | | | (0.35 | ) | | | (0.72 | ) | | | (0.72) | |
| | | | | | |
Net realized gains | | | — | | | | — | | | | — | | | | — | | | | (0.20 | ) | | | (0.25) | |
| | | | |
| | | | | | |
Total distributions | | | (0.56 | ) | | | (0.27 | ) | | | (0.30 | ) | | | (0.35 | ) | | | (0.92 | ) | | | (0.97) | |
| | | | |
| | | | | | |
Net asset value, end of period | | | $10.71 | | | | $10.56 | | | | $11.04 | | | | $10.90 | | | | $10.44 | | | | $11.78 | |
| | | | |
| | | | | | |
Total returnc | | | 6.74% | | | | (1.88)% | | | | 4.08% | | | | 7.86% | | | | (3.98)% | | | | 1.75% | |
| | | | | | |
| Ratios to average net assetsd | | | | | | | | | | | | | | | | | | | | | | | | |
| | | | | | |
Expenses before waiver and payments by affiliates | | | 1.05% | | | | 1.02% | | | | 1.03% | | | | 1.02% | | | | 0.98% | | | | 0.98% | |
| | | | | | |
Expenses net of waiver and payments by affiliatese | | | 1.02% | | | | 0.98% | | | | 0.98% | | | | 0.95% | | | | 0.97% | | | | 0.97% | |
| | | | | | |
Net investment income | | | 3.98% | | | | 3.93% | | | | 3.65% | | | | 4.07% | | | | 4.36% | | | | 3.99% | |
| | | | | | |
| Supplemental data | | | | | | | | | | | | | | | | | | | | | | | | |
| | | | | | |
Net assets, end of period (000’s) | | | $59,274 | | | | $60,763 | | | | $74,013 | | | | $80,175 | | | | $92,965 | | | | $113,986 | |
| | | | | | |
Portfolio turnover rate | | | 66.30%f | | | | 107.90%g | | | | 108.73% | | | | 128.51% | | | | 85.85% | | | | 55.64% | |
| | | | | | |
Portfolio turnover rate excluding mortgage dollar rollsh | | | 37.89%f | | | | 40.38%g | | | | 48.11% | | | | 77.93% | | | | 51.47% | | | | 48.86% | |
aThe amount shown for a share outstanding throughout the period may not correlate with the Consolidated Statement of Operations for the period due to the timing of sales and repurchases of the Fund’s shares in relation to income earned and/or fluctuating fair value of the investments of the Fund.
bBased on average daily shares outstanding.
cTotal return does not include fees, charges or expenses imposed by the variable annuity and life insurance contracts for which Franklin Templeton Variable Insurance Products Trust serves as an underlying investment vehicle. Total return is not annualized for periods less than one year.
dRatios are annualized for periods less than one year.
eBenefit of expense reduction rounds to less than 0.01%.
fExcludes the value of portfolio activitiy as a result ofin-kind transactions. See Note 6.
gExcludes the value of portfolio securities delivered as a result of a redemptionin-kind. See Note 11.
hSee Note 1(h) regarding mortgage dollar rolls.
| | | | |
| | |
FSI-8 | | Semiannual Report | The accompanying notes are an integral part of these consolidated financial statements. |
FRANKLIN TEMPLETON VARIABLE INSURANCE PRODUCTS TRUST
Consolidated Statement of Investments, June 30, 2019 (unaudited)
Franklin Strategic Income VIP Fund
| | | | | | | | | | | | | | | | |
| | | | |
| | | Country | | | Shares/
Warrants | | | | | | Value | |
Common Stocks and Other Equity Interests 0.3% | | | | | | | | | | | | | | | | |
Commercial & Professional Services 0.0%† | | | | | | | | | | | | | | | | |
aRemington Outdoor Co. Inc. | | | United States | | | | 74,576 | | | | | | | $ | 111,864 | |
| | | | | | | | | | | | | | | | |
Consumer Services 0.0%† | | | | | | | | | | | | | | | | |
a,b,cTurtle Bay Resort | | | United States | | | | 1,901,449 | | | | | | | | 41,832 | |
| | | | | | | | | | | | | | | | |
| | | | |
Energy 0.1% | | | | | | | | | | | | | | | | |
aBirch Permian Holdings Inc. | | | United States | | | | 39,385 | | | | | | | | 438,158 | |
aHalcon Resources Corp. | | | United States | | | | 78,920 | | | | | | | | 13,953 | |
aHalcon Resources Corp., wts., 9/09/20 | | | United States | | | | 6,591 | | | | | | | | 53 | |
aMidstates Petroleum Co. Inc. | | | United States | | | | 415 | | | | | | | | 2,444 | |
a,cMidstates Petroleum Co. Inc., wts., 4/21/20 | | | United States | | | | 4,005 | | | | | | | | 9 | |
aRiviera Resources Inc. | | | United States | | | | 6,922 | | | | | | | | 87,910 | |
aRoan Resources Inc. | | | United States | | | | 6,922 | | | | | | | | 12,044 | |
| | | | | | | | | | | | | | | | |
| | | | | | | | | | | | | | | 554,571 | |
| | | | | | | | | | | | | | | | |
| | | | |
Materials 0.1% | | | | | | | | | | | | | | | | |
a,c,dAppvion Operations Inc. | | | United States | | | | 18,684 | | | | | | | | 287,369 | |
aVerso Corp., A | | | United States | | | | 5,620 | | | | | | | | 107,061 | |
aVerso Corp., wts., 7/25/23 | | | United States | | | | 592 | | | | | | | | 2,368 | |
| | | | | | | | | | | | | | | | |
| | | | | | | | | | | | | | | 396,798 | |
| | | | | | | | | | | | | | | | |
| | | | |
Media & Entertainment 0.1% | | | | | | | | | | | | | | | | |
aClear Channel Outdoor Holdings Inc. | | | United States | | | | 20,804 | | | | | | | | 98,195 | |
a,c,diHeartMedia Inc., A | | | United States | | | | 8,384 | | | | | | | | 121,696 | |
a,c,diHeartMedia Inc., B | | | United States | | | | 142 | | | | | | | | 2,061 | |
| | | | | | | | | | | | | | | | |
| | | | | | | | | | | | | | | 221,952 | |
| | | | | | | | | | | | | | | | |
| | | | |
Retailing 0.0%† | | | | | | | | | | | | | | | | |
a,c,dK2016470219 South Africa Ltd., A | | | South Africa | | | | 14,792,309 | | | | | | | | 10,500 | |
a,c,dK2016470219 South Africa Ltd., B | | | South Africa | | | | 1,472,041 | | | | | | | | 1,045 | |
| | | | | | | | | | | | | | | | |
| | | | | | | | | | | | | | | 11,545 | |
| | | | | | | | | | | | | | | | |
Total Common Stocks and Other Equity Interests
(Cost $6,779,510) | | | | | | | | | | | | | | | 1,338,562 | |
| | | | | | | | | | | | | | | | |
| | | | |
Management Investment Companies
(Cost $13,450,545) 2.6% | | | | | | | | | | | | | | | | |
Diversified Financials 2.6% | | | | | | | | | | | | | | | | |
eFranklin Floating Rate Income Fund | | | United States | | | | 1,358,951 | | | | | | | | 11,727,751 | |
| | | | | | | | | | | | | | | | |
| | | | |
| | | | | |
| Principal
Amount |
* | | | | | | | | |
Corporate Bonds 35.4% | | | | | | | | | | | | | | | | |
Automobiles & Components 0.2% | | | | | | | | | | | | | | | | |
Fiat Chrysler Automobiles NV, senior note, 5.25%, 4/15/23 | | | United Kingdom | | | | 970,000 | | | | | | | | 1,025,324 | |
| | | | | | | | | | | | | | | | |
| | | | |
Banks 3.4% | | | | | | | | | | | | | | | | |
fAkbank T.A.S., senior note, 144A, 5.125%, 3/31/25 | | | Turkey | | | | 800,000 | | | | | | | | 739,744 | |
Bank of America Corp., | | | | | | | | | | | | | | | | |
senior bond, 3.248%, 10/21/27 | | | United States | | | | 647,000 | | | | | | | | 663,171 | |
senior note, 3.50%, 4/19/26 | | | United States | | | | 2,480,000 | | | | | | | | 2,598,197 | |
FRANKLIN TEMPLETON VARIABLE INSURANCE PRODUCTS TRUST
CONSOLIDATED STATEMENT OF INVESTMENTS (UNAUDITED)
Franklin Strategic Income VIP Fund(continued)
| | | | | | | | | | | | | | | | |
| | | | |
| | | Country | | | Principal
Amount* | | | | | | Value | |
Corporate Bonds(continued) | | | | | | | | | | | | | | | | |
Banks(continued) | | | | | | | | | | | | | | | | |
CIT Group Inc., senior bond, 5.00%, 8/15/22 | | | United States | | | | 809,000 | | | | | | | $ | 857,540 | |
Citigroup Inc., | | | | | | | | | | | | | | | | |
senior note, 3.30%, 4/27/25 | | | United States | | | | 243,000 | | | | | | | | 251,476 | |
senior note, 3.40%, 5/01/26 | | | United States | | | | 1,106,000 | | | | | | | | 1,145,474 | |
senior note, 3.20%, 10/21/26 | | | United States | | | | 2,425,000 | | | | | | | | 2,476,494 | |
sub. bond, 5.50%, 9/13/25 | | | United States | | | | 405,000 | | | | | | | | 458,831 | |
sub. note, 4.05%, 7/30/22 | | | United States | | | | 243,000 | | | | | | | | 253,561 | |
fIntesa Sanpaolo SpA, senior note, 144A, 6.50%, 2/24/21 | | | Italy | | | | 200,000 | | | | | | | | 210,269 | |
JPMorgan Chase & Co., | | | | | | | | | | | | | | | | |
gjunior sub. bond, R, 6.00% to 8/01/23, FRN thereafter, Perpetual | | | United States | | | | 213,000 | | | | | | | | 224,069 | |
senior bond, 3.20%, 6/15/26 | | | United States | | | | 1,213,000 | | | | | | | | 1,248,869 | |
sub. note, 3.375%, 5/01/23 | | | United States | | | | 809,000 | | | | | | | | 832,031 | |
sub. note, 3.875%, 9/10/24 | | | United States | | | | 809,000 | | | | | | | | 850,679 | |
hTurkiye Vakiflar Bankasi TAO, secured note, Reg S, 2.375%, 11/04/22 | | | Turkey | | | | 500,000 | | | | EUR | | | | 563,812 | |
Wells Fargo & Co., senior note, 3.00%, 4/22/26 | | | United States | | | | 2,021,000 | | | | | | | | 2,045,409 | |
| | | | | | | | | | | | | | | | |
| | | | |
| | | | | | | | | | | | | | | 15,419,626 | |
| | | | | | | | | | | | | | | | |
| | | | |
Capital Goods 1.3% | | | | | | | | | | | | | | | | |
fBeacon Roofing Supply Inc., senior note, 144A, 4.875%, 11/01/25 | | | United States | | | | 1,294,000 | | | | | | | | 1,285,912 | |
CNH Industrial NV, senior bond, 3.85%, 11/15/27 | | | United Kingdom | | | | 566,000 | | | | | | | | 569,206 | |
f,iHerc Holdings Inc., senior note, 144A, 5.50%, 7/15/27 | | | United States | | | | 500,000 | | | | | | | | 504,375 | |
Legrand France SA, senior bond, 8.50%, 2/15/25 | | | France | | | | 100,000 | | | | | | | | 129,927 | |
jOnsite Rental Group Operations Pty. Ltd., secured note, PIK, 6.10%, 10/26/23 | | | Australia | | | | 262,519 | | | | | | | | 203,452 | |
Tennant Co., senior note, 5.625%, 5/01/25 | | | United States | | | | 809,000 | | | | | | | | 839,338 | |
fTerex Corp., senior note, 144A, 5.625%, 2/01/25 | | | United States | | | | 1,617,000 | | | | | | | | 1,639,234 | |
fVertiv Group Corp., senior note, 144A, 9.25%, 10/15/24 | | | United States | | | | 994,000 | | | | | | | | 956,725 | |
| | | | | | | | | | | | | | | | |
| | | | |
| | | | | | | | | | | | | | | 6,128,169 | |
| | | | | | | | | | | | | | | | |
| | | | |
Commercial & Professional Services 0.7% | | | | | | | | | | | | | | | | |
United Rentals North America Inc., senior bond, 5.875%, 9/15/26 | | | United States | | | | 1,294,000 | | | | | | | | 1,382,962 | |
fWest Corp., senior note, 144A, 8.50%, 10/15/25 | | | United States | | | | 1,821,000 | | | | | | | | 1,602,480 | |
| | | | | | | | | | | | | | | | |
| | | | |
| | | | | | | | | | | | | | | 2,985,442 | |
| | | | | | | | | | | | | | | | |
| | | | |
Consumer Durables & Apparel 0.9% | | | | | | | | | | | | | | | | |
fHanesbrands Inc., senior bond, 144A, 4.875%, 5/15/26 | | | United States | | | | 1,682,000 | | | | | | | | 1,753,300 | |
KB Home, senior note, 7.00%, 12/15/21 | | | United States | | | | 970,000 | | | | | | | | 1,044,690 | |
PulteGroup Inc., senior bond, 5.00%, 1/15/27 | | | United States | | | | 309,000 | | | | | | | | 325,163 | |
Toll Brothers Finance Corp., senior bond, 5.625%, 1/15/24 | | | United States | | | | 889,000 | | | | | | | | 959,009 | |
| | | | | | | | | | | | | | | | |
| | | | |
| | | | | | | | | | | | | | | 4,082,162 | |
| | | | | | | | | | | | | | | | |
| | | | |
Consumer Services 1.7% | | | | | | | | | | | | | | | | |
f1011778 BC ULC/New Red Finance Inc., | | | | | | | | | | | | | | | | |
secured note, second lien, 144A, 5.00%, 10/15/25 | | | Canada | | | | 970,000 | | | | | | | | 979,991 | |
senior secured note, first lien, 144A, 4.25%, 5/15/24 | | | Canada | | | | 728,000 | | | | | | | | 737,038 | |
FRANKLIN TEMPLETON VARIABLE INSURANCE PRODUCTS TRUST
CONSOLIDATED STATEMENT OF INVESTMENTS (UNAUDITED)
Franklin Strategic Income VIP Fund(continued)
| | | | | | | | | | | | | | | | |
| | | | |
| | | Country | | | Principal
Amount* | | | | | | Value | |
| | | | |
Corporate Bonds(continued) | | | | | | | | | | | | | | | | |
Consumer Services(continued) | | | | | | | | | | | | | | | | |
fGolden Nugget Inc., senior note, 144A, 6.75%, 10/15/24 | | | United States | | | | 1,132,000 | | | | | | | $ | 1,168,790 | |
fInternational Game Technology PLC, senior secured bond, 144A, 6.50%, 2/15/25 | | | United States | | | | 1,051,000 | | | | | | | | 1,154,787 | |
fKFC Holding Co./Pizza Hut Holdings LLC/Taco Bell of America LLC, | | | | | | | | | | | | | | | | |
senior note, 144A, 5.00%, 6/01/24 | | | United States | | | | 728,000 | | | | | | | | 753,480 | |
senior note, 144A, 5.25%, 6/01/26 | | | United States | | | | 851,000 | | | | | | | | 894,605 | |
fStars Group Holdings BV/Stars Group U.S.Co-Borrower LLC, senior
note, 144A, 7.00%, 7/15/26 | | | Canada | | | | 566,000 | | | | | | | | 599,960 | |
fWynn Las Vegas LLC/Wynn Las Vegas Capital Corp., | | | | | | | | | | | | | | | | |
senior bond, 144A, 5.50%, 3/01/25 | | | United States | | | | 970,000 | | | | | | | | 1,004,241 | |
senior bond, 144A, 5.25%, 5/15/27 | | | United States | | | | 200,000 | | | | | | | | 201,000 | |
| | | | | | | | | | | | | | | | |
| | | | |
| | | | | | | | | | | | | | | 7,493,892 | |
| | | | | | | | | | | | | | | | |
Diversified Financials 2.2% | | | | | | | | | | | | | | | | |
Capital One Financial Corp., senior note, 3.20%, 2/05/25 | | | United States | | | | 1,617,000 | | | | | | | | 1,649,084 | |
The Goldman Sachs Group Inc., | | | | | | | | | | | | | | | | |
senior note, 3.50%, 1/23/25 | | | United States | | | | 1,725,000 | | | | | | | | 1,784,898 | |
senior note, 3.75%, 2/25/26 | | | United States | | | | 1,213,000 | | | | | | | | 1,266,693 | |
Morgan Stanley, | | | | | | | | | | | | | | | | |
senior bond, 3.591% to 7/22/27, FRN thereafter, 7/22/28 | | | United States | | | | 809,000 | | | | | | | | 842,669 | |
senior note, 3.875%, 1/27/26 | | | United States | | | | 2,395,000 | | | | | | | | 2,547,030 | |
Navient Corp., senior note, 7.25%, 9/25/23 | | | United States | | | | 921,000 | | | | | | | | 986,621 | |
Springleaf Finance Corp., senior note, 6.625%, 1/15/28 | | | United States | | | | 1,000,000 | | | | | | | | 1,052,500 | |
| | | | | | | | | | | | | | | | |
| | | | |
| | | | | | | | | | | | | | | 10,129,495 | |
| | | | | | | | | | | | | | | | |
Energy 3.5% | | | | | | | | | | | | | | | | |
fAker BP ASA, senior note, 144A, 4.75%, 6/15/24 | | | Norway | | | | 600,000 | | | | | | | | 618,000 | |
fCalifornia Resources Corp., secured note, second lien, 144A, 8.00%, 12/15/22 | | | United States | | | | 579,000 | | | | | | | | 439,316 | |
Cheniere Corpus Christi Holdings LLC, | | | | | | | | | | | | | | | | |
senior secured note, first lien, 7.00%, 6/30/24 | | | United States | | | | 647,000 | | | | | | | | 745,732 | |
senior secured note, first lien, 5.875%, 3/31/25 | | | United States | | | | 566,000 | | | | | | | | 631,797 | |
Cheniere Energy Partners LP, senior secured note, first lien, 5.25%, 10/01/25 | | | United States | | | | 970,000 | | | | | | | | 1,006,375 | |
CONSOL Energy Inc., senior note, 5.875%, 4/15/22 | | | United States | | | | 1,317,000 | | | | | | | | 1,284,075 | |
Energy Transfer Operating LP, | | | | | | | | | | | | | | | | |
senior bond, 4.05%, 3/15/25 | | | United States | | | | 200,000 | | | | | | | | 208,581 | |
senior note, 7.50%, 10/15/20 | | | United States | | | | 1,536,000 | | | | | | | | 1,629,569 | |
f,jEnQuest PLC, senior note, 144A, PIK, 7.00%, 4/15/22 | | | United Kingdom | | | | 1,020,556 | | | | | | | | 832,498 | |
Exxon Mobil Corp., senior note, 2.222%, 3/01/21 | | | United States | | | | 324,000 | | | | | | | | 324,821 | |
f,kGaz Capital SA, (OJSC Gazprom), loan participation, senior note, 144A, 3.85%, 2/06/20 | | | Russia | | | | 1,213,000 | | | | | | | | 1,220,029 | |
Kinder Morgan Inc., | | | | | | | | | | | | | | | | |
senior bond, 4.30%, 6/01/25 | | | United States | | | | 1,617,000 | | | | | | | | 1,728,433 | |
senior note, 3.15%, 1/15/23 | | | United States | | | | 1,213,000 | | | | | | | | 1,234,318 | |
FRANKLIN TEMPLETON VARIABLE INSURANCE PRODUCTS TRUST
CONSOLIDATED STATEMENT OF INVESTMENTS (UNAUDITED)
Franklin Strategic Income VIP Fund(continued)
| | | | | | | | | | | | | | | | |
| | | | |
| | | Country | | | Principal
Amount* | | | | | | Value | |
| | | | |
Corporate Bonds(continued) | | | | | | | | | | | | | | | | |
Energy(continued) | | | | | | | | | | | | | | | | |
Martin Midstream Partners LP/Martin Midstream Finance Corp.,
senior note, 7.25%, 2/15/21 | | | United States | | | | 1,617,000 | | | | | | | $ | 1,610,855 | |
Oceaneering International Inc., senior note, 4.65%, 11/15/24 | | | United States | | | | 200,000 | | | | | | | | 197,000 | |
Sanchez Energy Corp., senior note, 6.125%, 1/15/23 | | | United States | | | | 243,000 | | | | | | | | 12,150 | |
Sunoco LP/Sunoco Finance Corp., senior note, 4.875%, 1/15/23 | | | United States | | | | 485,000 | | | | | | | | 496,519 | |
lWeatherford International Ltd., | | | | | | | | | | | | | | | | |
senior note, 7.75%, 6/15/21 | | | United States | | | | 647,000 | | | | | | | | 344,528 | |
senior note, 8.25%, 6/15/23 | | | United States | | | | 809,000 | | | | | | | | 426,748 | |
fWoodside Finance Ltd., | | | | | | | | | | | | | | | | |
senior bond, 144A, 3.70%, 3/15/28 | | | Australia | | | | 647,000 | | | | | | | | 647,708 | |
senior note, 144A, 3.70%, 9/15/26 | | | Australia | | | | 405,000 | | | | | | | | 411,394 | |
| | | | | | | | | | | | | | | | |
| | | | |
| | | | | | | | | | | | | | | 16,050,446 | |
| | | | | | | | | | | | | | | | |
| | | | |
Food & Staples Retailing 0.8% | | | | | | | | | | | | | | | | |
fAramark Services Inc., senior bond, 144A, 5.00%, 2/01/28 | | | United States | | | | 1,247,000 | | | | | | | | 1,285,969 | |
Walgreens Boots Alliance Inc., senior note, 3.80%, 11/18/24 | | | United States | | | | 2,087,000 | | | | | | | | 2,171,414 | |
| | | | | | | | | | | | | | | | |
| | | | |
| | | | | | | | | | | | | | | 3,457,383 | |
| | | | | | | | | | | | | | | | |
| | | | |
Food, Beverage & Tobacco 1.1% | | | | | | | | | | | | | | | | |
Bunge Ltd. Finance Corp., senior note, 3.25%, 8/15/26 | | | United States | | | | 200,000 | | | | | | | | 193,445 | |
fImperial Brands Finance PLC, senior note, 144A, 3.50%, 2/11/23 | | | United Kingdom | | | | 1,698,000 | | | | | | | | 1,729,867 | |
fLamb Weston Holdings Inc., | | | | | | | | | | | | | | | | |
senior note, 144A, 4.625%, 11/01/24 | | | United States | | | | 485,000 | | | | | | | | 505,006 | |
senior note, 144A, 4.875%, 11/01/26 | | | United States | | | | 1,132,000 | | | | | | | | 1,182,940 | |
fPost Holdings Inc., | | | | | | | | | | | | | | | | |
senior bond, 144A, 5.625%, 1/15/28 | | | United States | | | | 405,000 | | | | | | | | 417,656 | |
senior note, 144A, 5.50%, 3/01/25 | | | United States | | | | 809,000 | | | | | | | | 838,326 | |
Reynolds American Inc., senior note, 4.45%, 6/12/25 | | | United Kingdom | | | | 200,000 | | | | | | | | 212,131 | |
| | | | | | | | | | | | | | | | |
| | | | |
| | | | | | | | | | | | | | | 5,079,371 | |
| | | | | | | | | | | | | | | | |
| | | | |
Health Care Equipment & Services 1.6% | | | | | | | | | | | | | | | | |
Centene Corp., | | | | | | | | | | | | | | | | |
senior note, 4.75%, 5/15/22 | | | United States | | | | 1,374,000 | | | | | | | | 1,408,350 | |
fsenior note, 144A, 5.375%, 6/01/26 | | | United States | | | | 324,000 | | | | | | | | 341,415 | |
CHS/Community Health Systems Inc., | | | | | | | | | | | | | | | | |
senior note, 6.875%, 2/01/22 | | | United States | | | | 183,000 | | | | | | | | 124,440 | |
senior secured note, first lien, 6.25%, 3/31/23 | | | United States | | | | 405,000 | | | | | | | | 391,331 | |
DaVita Inc., | | | | | | | | | | | | | | | | |
senior bond, 5.125%, 7/15/24 | | | United States | | | | 405,000 | | | | | | | | 406,134 | |
senior bond, 5.00%, 5/01/25 | | | United States | | | | 728,000 | | | | | | | | 721,448 | |
senior note, 5.75%, 8/15/22 | | | United States | | | | 309,000 | | | | | | | | 312,863 | |
Edwards Lifesciences Corp., senior note, 4.30%, 6/15/28 | | | United States | | | | 243,000 | | | | | | | | 262,547 | |
HCA Inc., senior bond, 5.875%, 5/01/23 | | | United States | | | | 1,213,000 | | | | | | | | 1,322,024 | |
fMEDNAX Inc., senior note, 144A, 6.25%, 1/15/27 | | | United States | | | | 1,100,000 | | | | | | | | 1,084,875 | |
f,jPolaris Intermediate Corp., senior note, 144A, PIK, 8.50%, 12/01/22 | | | United States | | | | 500,000 | | | | | | | | 443,750 | |
Stryker Corp., senior bond, 3.50%, 3/15/26 | | | United States | | | | 405,000 | | | | | | | | 423,967 | |
| | | | | | | | | | | | | | | | |
| | | | |
| | | | | | | | | | | | | | | 7,243,144 | |
| | | | | | | | | | | | | | | | |
FRANKLIN TEMPLETON VARIABLE INSURANCE PRODUCTS TRUST
CONSOLIDATED STATEMENT OF INVESTMENTS (UNAUDITED)
Franklin Strategic Income VIP Fund(continued)
| | | | | | | | | | | | | | | | |
| | | | |
| | | Country | | | Principal
Amount* | | | | | | Value | |
| | | | |
Corporate Bonds(continued) | | | | | | | | | | | | | | | | |
Materials 4.9% | | | | | | | | | | | | | | | | |
ArcelorMittal, senior note, 6.125%, 6/01/25 | | | France | | | | 243,000 | | | | | | | $ | 275,349 | |
fArdagh Packaging Finance PLC/Ardagh MP Holdings USA Inc., senior note, 144A, 6.00%, 2/15/25 | | | Luxembourg | | | | 900,000 | | | | | | | | 934,875 | |
fBWAY Holding Co., senior note, 144A, 7.25%, 4/15/25 | | | United States | | | | 1,278,000 | | | | | | | | 1,236,465 | |
fCemex Finance LLC, senior secured note, first lien, 144A, 6.00%, 4/01/24 | | | Mexico | | | | 500,000 | | | | | | | | 515,907 | |
fCemex SAB de CV, senior secured bond, first lien, 144A, 5.70%, 1/11/25 | | | Mexico | | | | 1,213,000 | | | | | | | | 1,259,961 | |
Crown Americas LLC/Crown Americas Capital Corp. VI, senior note, 4.75%, 2/01/26 | | | United States | | | | 566,000 | | | | | | | | 582,980 | |
fFirst Quantum Minerals Ltd., senior note, 144A, 7.25%, 4/01/23 | | | Zambia | | | | 1,294,000 | | | | | | | | 1,264,885 | |
fFMG Resources (August 2006) Pty. Ltd.,
senior note, 144A, 5.125%, 3/15/23 | | | Australia | | | | 324,000 | | | | | | | | 335,745 | |
senior note, 144A, 5.125%, 5/15/24 | | | Australia | | | | 647,000 | | | | | | | | 673,488 | |
Freeport-McMoRan Inc., senior note, 4.55%, 11/14/24 | | | United States | | | | 1,217,000 | | | | | | | | 1,247,121 | |
fGlencore Funding LLC,
senior note, 144A, 4.125%, 5/30/23 | | | Switzerland | | | | 485,000 | | | | | | | | 504,585 | |
senior note, 144A, 4.625%, 4/29/24 | | | Switzerland | | | | 250,000 | | | | | | | | 264,505 | |
fINVISTA Finance LLC, senior secured note, 144A, 4.25%, 10/15/19 | | | United States | | | | 1,536,000 | | | | | | | | 1,552,444 | |
LYB International Finance BV, senior note, 4.00%, 7/15/23 | | | United States | | | | 1,698,000 | | | | | | | | 1,789,633 | |
fNew Gold Inc., senior note, 144A, 6.375%, 5/15/25 | | | Canada | | | | 566,000 | | | | | | | | 472,610 | |
fNorthwest Acquisitions ULC/Dominion Finco Inc., secured note, second lien, 144A, 7.125%, 11/01/22 | | | Canada | | | | 324,000 | | | | | | | | 224,370 | |
fNovelis Corp., senior bond, 144A, 5.875%, 9/30/26 | | | United States | | | | 1,359,000 | | | | | | | | 1,379,385 | |
fOwens-Brockway Glass Container Inc.,
senior note, 144A, 5.00%, 1/15/22 | | | United States | | | | 1,132,000 | | | | | | | | 1,164,545 | |
senior note, 144A, 5.875%, 8/15/23 | | | United States | | | | 566,000 | | | | | | | | 612,582 | |
Reynolds Group Issuer Inc./Reynolds Group Issuer LLC/Reynolds Group Issuer Luxembourg SA,
fsenior note, 144A, 7.00%, 7/15/24 | | | United States | | | | 105,000 | | | | | | | | 108,769 | |
senior secured note, first lien, 5.75%, 10/15/20 | | | United States | | | | 548,375 | | | | | | | | 550,432 | |
fsenior secured note, first lien, 144A, 5.125%, 7/15/23 | | | United States | | | | 566,000 | | | | | | | | 578,027 | |
fSABIC Capital II BV, senior note, 144A, 4.50%, 10/10/28 | | | Saudi Arabia | | | | 600,000 | | | | | | | | 643,809 | |
fSealed Air Corp., senior bond, 144A, 5.125%, 12/01/24 | | | United States | | | | 809,000 | | | | | | | | 853,495 | |
senior bond, 144A, 5.50%, 9/15/25 | | | United States | | | | 124,000 | | | | | | | | 132,370 | |
senior note, 144A, 4.875%, 12/01/22 | | | United States | | | | 485,000 | | | | | | | | 510,463 | |
Steel Dynamics Inc.,
senior bond, 5.50%, 10/01/24 | | | United States | | | | 809,000 | | | | | | | | 840,349 | |
senior note, 5.125%, 10/01/21 | | | United States | | | | 609,000 | | | | | | | | 616,107 | |
fSunCoke Energy Partners LP/SunCoke Energy Partners Finance Corp., senior note, 144A, 7.50%, 6/15/25 | | | United States | | | | 1,100,000 | | | | | | | | 1,078,000 | |
| | | | | | | | | | | | | | | | |
| | | | |
| | | | | | | | | | | | | | | 22,203,256 | |
| | | | | | | | | | | | | | | | |
FRANKLIN TEMPLETON VARIABLE INSURANCE PRODUCTS TRUST
CONSOLIDATED STATEMENT OF INVESTMENTS (UNAUDITED)
Franklin Strategic Income VIP Fund(continued)
| | | | | | | | | | | | | | | | |
| | | | |
| | | Country | | | Principal
Amount* | | | | | | Value | |
| | | | |
Corporate Bonds(continued) | | | | | | | | | | | | | | | | |
Media & Entertainment 3.0% | | | | | | | | | | | | | | | | |
fAltice Financing SA, secured bond, 144A, 7.50%, 5/15/26 | | | Luxembourg | | | | 200,000 | | | | | | | $ | 201,500 | |
CCO Holdings LLC/CCO Holdings Capital Corp.,
senior bond, 5.25%, 9/30/22 | | | United States | | | | 889,000 | | | | | | | | 904,091 | |
fsenior bond, 144A, 5.375%, 5/01/25 | | | United States | | | | 728,000 | | | | | | | | 754,390 | |
Clear Channel Worldwide Holdings Inc.,
senior note, 6.50%, 11/15/22 | | | United States | | | | 809,000 | | | | | | | | 827,202 | |
fsenior sub. note, 144A, 9.25%, 2/15/24 | | | United States | | | | 300,000 | | | | | | | | 326,250 | |
fCSC Holdings LLC, senior secured note, first lien, 144A, 5.50%, 5/15/26 | | | United States | | | | 1,378,000 | | | | | | | | 1,448,554 | |
DISH DBS Corp.,
senior bond, 6.75%, 6/01/21 | | | United States | | | | 405,000 | | | | | | | | 426,262 | |
senior note, 5.875%, 11/15/24 | | | United States | | | | 970,000 | | | | | | | | 921,500 | |
iHeartCommunications Inc.,
8.375%, 5/01/27 | | | United States | | | | 87,378 | | | | | | | | 91,967 | |
secured note, 6.375%, 5/01/26 | | | United States | | | | 48,209 | | | | | | | | 51,403 | |
Netflix Inc., senior bond, 5.875%, 2/15/25 | | | United States | | | | 1,400,000 | | | | | | | | 1,547,000 | |
fNexstar Broadcasting Inc., senior note, 144A, 5.625%, 8/01/24 | | | United States | | | | 1,417,000 | | | | | | | | 1,471,498 | |
fSirius XM Radio Inc.,
senior bond, 144A, 6.00%, 7/15/24 | | | United States | | | | 389,000 | | | | | | | | 401,253 | |
senior bond, 144A, 5.375%, 4/15/25 | | | United States | | | | 647,000 | | | | | | | | 669,645 | |
Tegna Inc.,
fsenior bond, 144A, 5.50%, 9/15/24 | | | United States | | | | 405,000 | | | | | | | | 417,150 | |
senior note, 5.125%, 7/15/20 | | | United States | | | | 205,000 | | | | | | | | 205,769 | |
fUnitymedia KabelBW GmbH, senior bond, 144A, 6.125%, 1/15/25 | | | Germany | | | | 1,174,000 | | | | | | | | 1,229,765 | |
fUnivision Communications Inc., senior secured note, first lien, 144A, 5.125%, 2/15/25 | | | United States | | | | 1,621,000 | | | | | | | | 1,548,055 | |
| | | | | | | | | | | | | | | | |
| | | | |
| | | | | | | | | | | | | | | 13,443,254 | |
| | | | | | | | | | | | | | | | |
Pharmaceuticals, Biotechnology & Life Sciences 1.9% | | | | | | | | | | | | | | | | |
Allergan Funding SCS, senior bond, 3.80%, 3/15/25 | | | United States | | | | 1,778,000 | | | | | | | | 1,844,639 | |
fAvantor Inc., senior secured note, first lien, 144A, 6.00%, 10/01/24 | | | United States | | | | 1,417,000 | | | | | | | | 1,511,230 | |
fBausch Health Cos. Inc.,
senior bond, 144A, 6.125%, 4/15/25 | | | United States | | | | 243,000 | | | | | | | | 248,468 | |
senior note, 144A, 4.50%, 5/15/23 | | | United States | | | | 400,000 | | | | EUR | | | | 461,761 | |
senior note, 144A, 8.50%, 1/31/27 | | | United States | | | | 809,000 | | | | | | | | 891,534 | |
senior note, first lien, 144A, 7.00%, 3/15/24 | | | United States | | | | 200,000 | | | | | | | | 213,020 | |
fBayer U.S. Finance II LLC, senior bond, 144A, 4.375%, 12/15/28 | | | Germany | | | | 889,000 | | | | | | | | 937,454 | |
f,jEagle Holdings Co. II LLC, senior note, 144A, PIK, 7.625%, 5/15/22 | | | United States | | | | 566,000 | | | | | | | | 570,245 | |
fEndo DAC/Endo Finance LLC/Endo Finco Inc.,
senior bond, 144A, 6.00%, 2/01/25 | | | United States | | | | 970,000 | | | | | | | | 654,750 | |
senior note, 144A, 6.00%, 7/15/23 | | | United States | | | | 328,000 | | | | | | | | 237,800 | |
fJaguar Holding Co. II/Pharmaceutical Product Development LLC, senior note, 144A, 6.375%, 8/01/23 | | | United States | | | | 970,000 | | | | | | | | 1,006,375 | |
| | | | | | | | | | | | | | | | |
| | | | |
| | | | | | | | | | | | | | | 8,577,276 | |
| | | | | | | | | | | | | | | | |
FRANKLIN TEMPLETON VARIABLE INSURANCE PRODUCTS TRUST
CONSOLIDATED STATEMENT OF INVESTMENTS (UNAUDITED)
Franklin Strategic Income VIP Fund(continued)
| | | | | | | | | | | | | | | | |
| | | | |
| | | Country | | | Principal
Amount* | | | | | | Value | |
| | | | |
Corporate Bonds(continued) | | | | | | | | | | | | | | | | |
Real Estate 1.1% | | | | | | | | | | | | | | | | |
American Tower Corp., senior bond, 3.375%, 10/15/26 | | | United States | | | | 1,940,000 | | | | | | | $ | 1,974,400 | |
Equinix Inc.,
senior bond, 5.375%, 4/01/23 | | | United States | | | | 1,317,000 | | | | | | | | 1,346,632 | |
senior bond, 5.875%, 1/15/26 | | | United States | | | | 100,000 | | | | | | | | 106,125 | |
MPT Operating Partnership LP/MPT Finance Corp.,
senior bond, 5.25%, 8/01/26 | | | United States | | | | 647,000 | | | | | | | | 676,924 | |
senior bond, 5.00%, 10/15/27 | | | United States | | | | 889,000 | | | | | | | | 917,893 | |
| | | | | | | | | | | | | | | | |
| | | | |
| | | | | | | | | | | | | | | 5,021,974 | |
| | | | | | | | | | | | | | | | |
Retailing 0.3% | | | | | | | | | | | | | | | | |
c,d,jK2016470219 South Africa Ltd., senior secured note, 144A, PIK, 3.00%, 12/31/22 | | | South Africa | | | | 947,792 | | | | | | | | 1,185 | |
d,jK2016470260 South Africa Ltd., senior secured note, 144A, PIK, 25.00%, 12/31/22 | | | South Africa | | | | 278,546 | | | | | | | | 8,356 | |
fParty City Holdings Inc., senior note, 144A, 6.625%, 8/01/26 | | | United States | | | | 1,085,000 | | | | | | | | 1,055,163 | |
fPetSmart Inc., senior secured note, first lien, 144A, 5.875%, 6/01/25 | | | United States | | | | 209,000 | | | | | | | | 203,775 | |
| | | | | | | | | | | | | | | | |
| | | | |
| | | | | | | | | | | | | | | 1,268,479 | |
| | | | | | | | | | | | | | | | |
Semiconductors & Semiconductor Equipment 0.0%† | | | | | | | | | | | | | | | | |
Maxim Integrated Products Inc., senior note, 3.375%, 3/15/23 | | | United States | | | | 100,000 | | | | | | | | 102,104 | |
| | | | | | | | | | | | | | | | |
Software & Services 0.4% | | | | | | | | | | | | | | | | |
Fiserv Inc., senior bond, 3.85%, 6/01/25 | | | United States | | | | 485,000 | | | | | | | | 513,466 | |
fSymantec Corp., senior note, 144A, 5.00%, 4/15/25 | | | United States | | | | 1,378,000 | | | | | | | | 1,413,254 | |
| | | | | | | | | | | | | | | | |
| | | | |
| | | | | | | | | | | | | | | 1,926,720 | |
| | | | | | | | | | | | | | | | |
Technology Hardware & Equipment 0.4% | | | | | | | | | | | | | | | | |
fCommScope Technologies LLC,
senior bond, 144A, 6.00%, 6/15/25 | | | United States | | | | 324,000 | | | | | | | | 304,560 | |
senior bond, 144A, 5.00%, 3/15/27 | | | United States | | | | 1,374,000 | | | | | | | | 1,202,250 | |
Juniper Networks Inc., senior bond, 5.95%, 3/15/41 | | | United States | | | | 100,000 | | | | | | | | 109,096 | |
Tech Data Corp., senior bond, 4.95%, 2/15/27 | | | United States | | | | 200,000 | | | | | | | | 209,394 | |
| | | | | | | | | | | | | | | | |
| | | | |
| | | | | | | | | | | | | | | 1,825,300 | |
| | | | | | | | | | | | | | | | |
Telecommunication Services 1.6% | | | | | | | | | | | | | | | | |
AT&T Inc., senior note, 2.95%, 7/15/26 | | | United States | | | | 2,021,000 | | | | | | | | 2,009,224 | |
fDigicel Group Two Ltd., senior note, 144A, 8.25%, 9/30/22 | | | Bermuda | | | | 486,000 | | | | | | | | 122,919 | |
fDigicel Ltd., senior note, 144A, 6.00%, 4/15/21 | | | Bermuda | | | | 1,000,000 | | | | | | | | 750,000 | |
Hughes Satellite Systems Corp., senior bond, 6.625%, 8/01/26 | | | United States | | | | 994,000 | | | | | | | | 1,047,427 | |
Sprint Communications Inc.,
senior note, 6.00%, 11/15/22 | | | United States | | | | 405,000 | | | | | | | | 423,225 | |
fsenior note, 144A, 7.00%, 3/01/20 | | | United States | | | | 647,000 | | | | | | | | 664,793 | |
Sprint Corp., senior bond, 7.875%, 9/15/23 | | | United States | | | | 405,000 | | | | | | | | 441,450 | |
T-Mobile USA Inc.,
senior bond, 6.50%, 1/15/24 | | | United States | | | | 405,000 | | | | | | | | 420,188 | |
senior bond, 6.375%, 3/01/25 | | | United States | | | | 1,051,000 | | | | | | | | 1,094,091 | |
senior note, 6.00%, 4/15/24 | | | United States | | | | 200,000 | | | | | | | | 209,000 | |
| | | | | | | | | | | | | | | | |
| | | | |
| | | | | | | | | | | | | | | 7,182,317 | |
| | | | | | | | | | | | | | | | |
FRANKLIN TEMPLETON VARIABLE INSURANCE PRODUCTS TRUST
CONSOLIDATED STATEMENT OF INVESTMENTS (UNAUDITED)
Franklin Strategic Income VIP Fund(continued)
| | | | | | | | | | | | | | | | |
| | | | |
| | | Country | | | Principal
Amount* | | | | | | Value | |
| | | | |
Corporate Bonds(continued) | | | | | | | | | | | | | | | | |
Transportation 1.0% | | | | | | | | | | | | | | | | |
fDAE Funding LLC, senior note, 144A, 5.00%, 8/01/24 | | | United Arab Emirates | | | | 1,294,000 | | | | | | | $ | 1,350,612 | |
fKazakhstan Temir Zholy Finance BV, senior bond, 144A, 6.95%, 7/10/42 | | | Kazakhstan | | | | 1,200,000 | | | | | | | | 1,491,366 | |
fMexico City Airport Trust, secured bond, 144A, 5.50%, 7/31/47 | | | Mexico | | | | 1,200,000 | | | | | | | | 1,197,564 | |
h,kRZD Capital PLC, (Russian Railways), loan participation, senior bond, Reg S, 5.70%, 4/05/22 | | | Russia | | | | 400,000 | | | | | | | | 422,332 | |
| | | | | | | | | | | | | | | | |
| | | | |
| | | | | | | | | | | | | | | 4,461,874 | |
| | | | | | | | | | | | | | | | |
Utilities 3.4% | | | | | | | | | | | | | | | | |
Calpine Corp.,
senior bond, 5.75%, 1/15/25 | | | United States | | | | 970,000 | | | | | | | | 966,362 | |
senior note, 5.375%, 1/15/23 | | | United States | | | | 551,000 | | | | | | | | 558,576 | |
fClearway Energy Operating LLC, senior note, 144A, 5.75%, 10/15/25 | | | United States | | | | 1,132,000 | | | | | | | | 1,153,225 | |
Dominion Energy Inc., senior bond, 2.85%, 8/15/26 | | | United States | | | | 889,000 | | | | | | | | 882,068 | |
f,gEDF SA, junior sub. note, 144A, 5.25% to 1/29/23, FRN thereafter, Perpetual | | | France | | | | 2,425,000 | | | | | | | | 2,491,700 | |
Exelon Corp., senior bond, 3.95%, 6/15/25 | | | United States | | | | 1,455,000 | | | | | | | | 1,553,984 | |
fInterGen NV, secured bond, 144A, 7.00%, 6/30/23 | | | Netherlands | | | | 700,000 | | | | | | | | 651,438 | |
fIsrael Electric Corp. Ltd., secured bond, 144A, 4.25%, 8/14/28 | | | Israel | | | | 1,000,000 | | | | | | | | 1,044,465 | |
The Southern Co., senior bond, 3.25%, 7/01/26 | | | United States | | | | 2,410,000 | | | | | | | | 2,448,606 | |
fState Grid Overseas Investment 2016 Ltd., senior note, 144A, 3.50%, 5/04/27 | | | China | | | | 1,051,000 | | | | | | | | 1,088,431 | |
fTalen Energy Supply LLC, senior secured note, 144A, 7.25%, 5/15/27 | | | United States | | | | 1,300,000 | | | | | | | | 1,335,750 | |
fThree Gorges Finance I Cayman Islands Ltd., senior note, 144A, 3.15%, 6/02/26 | | | China | | | | 1,051,000 | | | | | | | | 1,056,723 | |
Virginia Electric & Power Co., senior bond, 6.35%, 11/30/37 | | | United States | | | | 85,000 | | | | | | | | 114,004 | |
| | | | | | | | | | | | | | | | |
| | | | |
| | | | | | | | | | | | | | | 15,345,332 | |
| | | | | | | | | | | | | | | | |
| | | | |
Total Corporate Bonds (Cost $160,497,780) | | | | | | | | | | | | | | | 160,452,340 | |
| | | | | | | | | | | | | | | | |
| | | | |
m,nSenior Floating Rate Interests 13.0% | | | | | | | | | | | | | | | | |
Automobiles & Components 0.8% | | | | | | | | | | | | | | | | |
o,pAdient US LLC, Initial Term Loans, TBD, 5/06/24 | | | United States | | | | 1,170,000 | | | | | | | | 1,142,704 | |
Allison Transmission Inc., Initial Term Loans, 4.475%,(2-month USD LIBOR + 2.00%), 3/29/26 | | | United States | | | | 519,785 | | | | | | | | 521,950 | |
Thor Industries Inc., Initial USD Term Loans, 6.25%,(1-month USD LIBOR + 3.75%), 2/01/26 | | | United States | | | | 2,128,113 | | | | | | | | 2,101,495 | |
| | | | | | | | | | | | | | | | |
| | | | |
| | | | | | | | | | | | | | | 3,766,149 | |
| | | | | | | | | | | | | | | | |
Capital Goods 0.2% | | | | | | | | | | | | | | | | |
Altra Industrial Motion Corp., Term Loan, 4.402%,(1-month USD LIBOR + 2.00%), 10/01/25 | | | United States | | | | 239,214 | | | | | | | | 235,177 | |
Doncasters U.S. Finance LLC, Second Lien Term Loan, 10.58%,(3-month USD LIBOR + 8.25%), 10/09/20 | | | United States | | | | 742,509 | | | | | | | | 222,010 | |
Harsco Corp., Term LoanB-2, 4.688%,(1-month USD LIBOR + 2.25%), 12/10/24 | | | United States | | | | 229,110 | | | | | | | | 229,444 | |
Onsite Rental Group Operations Pty. Ltd., Term Loan, 6.904%,(1-month USD LIBOR + 4.50%), 10/25/22 | | | Australia | | | | 192,010 | | | | | | | | 188,170 | |
| | | | | | | | | | | | | | | | |
| | | | |
| | | | | | | | | | | | | | | 874,801 | |
| | | | | | | | | | | | | | | | |
FRANKLIN TEMPLETON VARIABLE INSURANCE PRODUCTS TRUST
CONSOLIDATED STATEMENT OF INVESTMENTS (UNAUDITED)
Franklin Strategic Income VIP Fund(continued)
| | | | | | | | | | | | | | | | |
| | | | | |
| | | Country | | | | | Principal
Amount* | | | | | Value | |
| | | | | |
| m,nSenior Floating Rate Interests(continued) | | | | | | | | | | | | | | | | |
Commercial & Professional Services 0.0%† | | | | | | | | | | | | | | | | |
KAR Auction Services Inc., TrancheB-5 Term Loans, 4.875%,(3-month USD LIBOR + 2.50%), 3/09/23 | | | United States | | | | | | 178,651 | | | | | $ | 178,734 | |
| | | | | | | | | | | | | | | | |
| | | | | |
Consumer Services 0.7% | | | | | | | | | | | | | | | | |
Aristocrat Technologies Inc., TermB-3 Loans, 4.342%,(3-month USD LIBOR + 1.75%), 10/19/24 | | | United States | | | | | | 838,240 | | | | | | 831,953 | |
Avis Budget Car Rental LLC, Tranche B Term Loans, 4.41%,(1-month USD LIBOR + 2.00%), 2/13/25 | | | United States | | | | | | 1,013,874 | | | | | | 1,012,926 | |
Eldorado Resorts Inc., Initial Term Loan, 4.688%,(1-month USD LIBOR + 2.25%), 4/17/24 | | | United States | | | | | | 345,096 | | | | | | 344,734 | |
Las Vegas Sands LLC, Term B Loans, 4.152%,(1-month USD LIBOR + 1.75%), 3/27/25 | | | United States | | | | | | 839,375 | | | | | | 834,511 | |
| | | | | | | | | | | | | | | | |
| | | | | |
| | | | | | | | | | | | | | | 3,024,124 | |
| | | | | | | | | | | | | | | | |
| | | | | |
Diversified Financials 0.4% | | | | | | | | | | | | | | | | |
Asurion LLC, Second Lien ReplacementB-2 Term Loans, 8.902%,(1-month USD LIBOR + 6.50%), 8/04/25 | | | United States | | | | | | 35,919 | | | | | | 36,499 | |
oRussell Investments U.S. Institutional Holdco Inc., Initial Term Loan, 5.652%,(1-month USD LIBOR + 3.25%), 6/01/23 | | | United States | | | | | | 1,169,103 | | | | | | 1,160,335 | |
Trans Union LLC, 2017 Replacement TermA-2 Loans, 4.152%,(1-month USD LIBOR + 1.75%), 8/09/22 | | | United States | | | | | | 796,813 | | | | | | 795,941 | |
| | | | | | | | | | | | | | | | �� |
| | | | | |
| | | | | | | | | | | | | | | 1,992,775 | |
| | | | | | | | | | | | | | | | |
| | | | | |
Energy 2.2% | | | | | | | | | | | | | | | | |
Fieldwood Energy LLC, Closing Date Loans, 7.652%,(1-month USD LIBOR + 5.25%), 4/11/22 | | | United States | | | | | | 5,136,631 | | | | | | 4,789,909 | |
Foresight Energy LLC, Term Loans, 8.272%,(3-month USD LIBOR + 5.75%), 3/28/22 | | | United States | | | | | | 1,452,781 | | | | | | 1,196,728 | |
Utex Industries Inc., | | | | | | | | | | | | | | | | |
First Lien Initial Term Loan, 6.402%,(1-month USD LIBOR + 4.00%), 5/21/21 | | | United States | | | | | | 518,399 | | | | | | 487,295 | |
Second Lien Initial Term Loan, 9.652%,(1-month USD LIBOR + 7.25%), 5/20/22 | | | United States | | | | | | 53,878 | | | | | | 49,164 | |
Wolverine Fuels Holding LLC, | | | | | | | | | | | | | | | | |
First Lien Initial Term Loan, 8.272%,(3-month USD LIBOR + 5.75%), 8/14/20 | | | United States | | | | | | 1,881,662 | | | | | | 1,850,300 | |
Second Lien Initial Term Loan, 13.272%,(3-month USD LIBOR + 10.75%), 2/16/21 | | | United States | | | | | | 1,571,328 | | | | | | 1,491,779 | |
| | | | | | | | | | | | | | | | |
| | | | | |
| | | | | | | | | | | | | | | 9,865,175 | |
| | | | | | | | | | | | | | | | |
| | | | | |
Food & Staples Retailing 0.1% | | | | | | | | | | | | | | | | |
Aramark Corp., U.S. TermB-3 Loan, 4.08%,(3-month USD LIBOR + 1.75%), 3/11/25 | | | United States | | | | | | 359,644 | | | | | | 359,080 | |
| | | | | | | | | | | | | | | | |
| | | | | |
Food, Beverage & Tobacco 0.1% | | | | | | | | | | | | | | | | |
CSM Bakery Supplies LLC, Second Lien Term Loan, 10.34%,(3-month USD LIBOR + 7.75%), 7/03/21 | | | United States | | | | | | 584,249 | | | | | | 543,838 | |
| | | | | | | | | | | | | | | | |
FRANKLIN TEMPLETON VARIABLE INSURANCE PRODUCTS TRUST
CONSOLIDATED STATEMENT OF INVESTMENTS (UNAUDITED)
Franklin Strategic Income VIP Fund(continued)
| | | | | | | | | | | | | | | | |
| | | | |
| | | Country | | | Principal
Amount* | | | | | | Value | |
| | | | |
m,nSenior Floating Rate Interests (continued) | | | | | | | | | | | | | | | | |
Health Care Equipment & Services 0.8% | | | | | | | | | | | | | | | | |
DaVita Healthcare Partners Inc., Tranche B Term Loan, 5.135%,(1-week USD LIBOR + 2.75%), 6/24/21 | | | United States | | | | 1,102,591 | | | | | | | $ | 1,103,280 | |
HCA Inc., Term Loan B11, 4.08%,(3-month USD LIBOR + 1.75%), 3/18/23 | | | United States | | | | 486,404 | | | | | | | | 487,113 | |
IQVIA Inc., | | | | | | | | | | | | | | | | |
TermB-2 Dollar Loans, 4.33%,(3-month USD LIBOR + 2.00%), 1/20/25 | | | United States | | | | 1,139,325 | | | | | | | | 1,139,122 | |
TermB-3 Dollar Loans, 4.152%,(1-month USD LIBOR + 1.75%), 6/11/25 | | | United States | | | | 695,054 | | | | | | | | 692,509 | |
| | | | | | | | | | | | | | | | |
| | | | |
| | | | | | | | | | | | | | | 3,422,024 | |
| | | | | | | | | | | | | | | | |
| | | | |
Household & Personal Products 0.5% | | | | | | | | | | | | | | | | |
cFGI Operating Co. LLC (Freedom Group), | | | | | | | | | | | | | | | | |
jTerm Loan, PIK, 12.518%,(3-month USD LIBOR + 10.00%), 5/15/22 | | | United States | | | | 811,426 | | | | | | | | 780,394 | |
Term Loan FILO, 10.018% - 10.022%,(3-month USD LIBOR + 7.50%), 5/15/21 | | | United States | | | | 1,616,351 | | | | | | | | 1,610,309 | |
| | | | | | | | | | | | | | | | |
| | | | |
| | | | | | | | | | | | | | | 2,390,703 | |
| | | | | | | | | | | | | | | | |
| | | | |
Materials 1.1% | | | | | | | | | | | | | | | | |
Appvion Operations Inc., Term Loan, 8.60%,(3-month USD LIBOR + 6.00%), 6/15/26 | | | United States | | | | 424,833 | | | | | | | | 424,833 | |
Axalta Coating Systems U.S. Holdings Inc., TermB-3 Dollar Loan, 4.08%,(3-month USD LIBOR + 1.75%), 6/01/24 | | | United States | | | | 569,571 | | | | | | | | 563,699 | |
Chemours Co., TrancheB-2 US$ Term Loan, 4.16%,(1-month USD | | | | | | | | | | | | | | | | |
LIBOR + 1.75%), 4/03/25 | | | United States | | | | 1,329,939 | | | | | | | | 1,294,473 | |
Crown Americas LLC, Dollar Term B Loan, 4.401%,(1-month USD | | | | | | | | | | | | | | | | |
LIBOR + 2.00%), 4/03/25 | | | United States | | | | 795,370 | | | | | | | | 800,789 | |
Oxbow Carbon LLC, | | | | | | | | | | | | | | | | |
Second Lien Term Loan, 9.902%,(1-month USD LIBOR + 7.50%), 1/04/24 | | | United States | | | | 151,273 | | | | | | | | 151,651 | |
Tranche A Term Loan, 4.902%,(1-month USD LIBOR + 2.50%), 1/04/22 | | | United States | | | | 1,147,500 | | | | | | | | 1,141,763 | |
Tranche B Term Loan, 6.152%,(1-month USD LIBOR + 3.75%), 1/04/23 | | | United States | | | | 518,000 | | | | | | | | 520,590 | |
| | | | | | | | | | | | | | | | |
| | | | |
| | | | | | | | | | | | | | | 4,897,798 | |
| | | | | | | | | | | | | | | | |
| | | | |
Media & Entertainment 1.4% | | | | | | | | | | | | | | | | |
Charter Communications Operating LLC, TermA-2 Loan, 3.83%,(3-month USD LIBOR + 1.50%), 3/31/23 | | | United States | | | | 868,965 | | | | | | | | 865,489 | |
CSC Holdings LLC, March 2017 Incremental Term Loans, 4.644%,(1-month USD LIBOR + 2.25%), 7/17/25 | | | United States | | | | 1,209,516 | | | | | | | | 1,192,696 | |
Gray Television Inc., | | | | | | | | | | | | | | | | |
TermB-2 Loan, 4.681%,(1-month USD LIBOR + 2.25%), 2/07/24 | | | United States | | | | 843,033 | | | | | | | | 840,549 | |
Term C Loan, 4.931%,(1-month USD LIBOR + 2.50%), 1/02/26 | | | United States | | | | 628,112 | | | | | | | | 628,269 | |
FRANKLIN TEMPLETON VARIABLE INSURANCE PRODUCTS TRUST
CONSOLIDATED STATEMENT OF INVESTMENTS (UNAUDITED)
Franklin Strategic Income VIP Fund(continued)
| | | | | | | | | | | | | | | | |
| | | | |
| | | Country | | | Principal
Amount* | | | | | | Value | |
| | | | |
| m,nSenior Floating Rate Interests (continued) | | | | | | | | | | | | | | | | |
Media & Entertainment(continued) | | | | | | | | | | | | | | | | |
iHeartCommunications Inc., Term Loan, 6.579%,(3-month USD LIBOR + 4.00%), 5/04/26 | | | United States | | | | 210,913 | | | | | | | $ | 211,424 | |
Lions Gate Capital Holdings LLC, Term A Loan, 4.152%,(1-month USD LIBOR + 1.75%), 3/22/23 | | | Canada | | | | 252,699 | | | | | | | | 250,962 | |
Live Nation Entertainment Inc., TermB-3 Loans, 4.188%,(1-month USD LIBOR + 1.75%), 10/31/23 | | | United States | | | | 571,234 | | | | | | | | 571,056 | |
Mediacom Illinois LLC, Tranche N Term Loan, 4.14%,(1-week USD LIBOR + 1.75%), 2/15/24 | | | United States | | | | 1,653,773 | | | | | | | | 1,645,491 | |
| | | | | | | | | | | | | | | | |
| | | | |
| | | | | | | | | | | | | | | 6,205,936 | |
| | | | | | | | | | | | | | | | |
| | | | |
Pharmaceuticals, Biotechnology & Life Sciences 0.8% | | | | | | | | | | | | | | | | |
Endo Luxembourg Finance Co. I S.A.R.L. and Endo LLC, Initial Term Loans, 6.688%,(1-month USD LIBOR + 4.25%), 4/29/24 | | | United States | | | | 2,215,115 | | | | | | | | 2,083,593 | |
Valeant Pharmaceuticals International, | | | | | | | | | | | | | | | | |
First Incremental Term Loan, 5.162%,(1-month USD LIBOR + 2.75%), 11/27/25 | | | United States | | | | 1,406,250 | | | | | | | | 1,399,746 | |
Initial Term Loans, 5.412%,(1-month USD LIBOR + 3.00%), 6/02/25 | | | United States | | | | 285,199 | | | | | | | | 285,377 | |
| | | | | | | | | | | | | | | | |
| | | | |
| | | | | | | | | | | | | | | 3,768,716 | |
| | | | | | | | | | | | | | | | |
| | | | |
Retailing 1.2% | | | | | | | | | | | | | | | | |
j99 Cents Only Stores, | | | | | | | | | | | | | | | | |
First Lien Term Loan, PIK, 8.83% - 9.022%,(3-month USD LIBOR + 6.50%), 1/13/22 | | | United States | | | | 154,133 | | | | | | | | 141,931 | |
First Lien Term Loan, PIK, 9.151%,(6-month USD LIBOR + 6.50%), 1/13/22 | | | United States | | | | 187,199 | | | | | | | | 172,379 | |
Ascena Retail Group Inc., Tranche B Term Loan, 6.938%,(1-month USD LIBOR + 4.50%), 8/21/22 | | | United States | | | | 2,103,259 | | | | | | | | 1,383,765 | |
General Nutrition Centers Inc., FILO Term Loan (ABL), 9.41%,(1-month USD LIBOR + 7.00%), 12/31/22 | | | United States | | | | 152,644 | | | | | | | | 154,695 | |
General Nutrition Centers, Inc., | | | | | | | | | | | | | | | | |
TrancheB-2 Term Loans, 11.16%,(1-month USD LIBOR + 8.75%), 3/04/21 | | | United States | | | | 413,269 | | | | | | | | 367,165 | |
TrancheB-2 Term Loans, 11.24%,(2-month USD LIBOR + 8.75%), 3/04/21 | | | United States | | | | 410,443 | | | | | | | | 364,654 | |
Harbor Freight Tools USA Inc., Refinancing Loans, 4.902%,(1-month USD LIBOR + 2.50%), 8/19/23 | | | United States | | | | 1,963,343 | | | | | | | | 1,916,306 | |
Jo-Ann Stores Inc., Initial Loans, 7.592%,(3-month USD LIBOR + 5.00%), 10/23/23 | | | United States | | | | 821,178 | | | | | | | | 730,849 | |
PETCO Animal Supplies Stores Inc., Second Amendment Term Loans, 5.833%,(3-month USD LIBOR + 3.25%), 1/26/23 | | | United States | | | | 106,928 | | | | | | | | 83,404 | |
oPetSmart Inc., Amended Loan, 6.67%,(1-month USD LIBOR + 4.25%), 3/11/22 | | | United States | | | | 29,780 | | | | | | | | 29,068 | |
| | | | | | | | | | | | | | | | |
| | | | |
| | | | | | | | | | | | | | | 5,344,216 | |
| | | | | | | | | | | | | | | | |
| | | | |
Semiconductors & Semiconductor Equipment 0.4% | | | | | | | | | | | | | | | | |
MKS Instruments Inc., | | | | | | | | | | | | | | | | |
TrancheB-4 Term Loan, 4.402%,(1-month USD LIBOR + 2.00%), 4/29/23 | | | United States | | | | 224,811 | | | | | | | | 225,204 | |
TrancheB-5 Term Loans, 4.652%,(1-month USD LIBOR + 2.25%), 2/01/26 | | | United States | | | | 313,475 | | | | | | | | 314,141 | |
FRANKLIN TEMPLETON VARIABLE INSURANCE PRODUCTS TRUST
CONSOLIDATED STATEMENT OF INVESTMENTS (UNAUDITED)
Franklin Strategic Income VIP Fund (continued)
| | | | | | | | | | | | | | | | |
| | | | |
| | | Country | | | Principal
Amount* | | | | | | Value | |
| | | | |
| m,nSenior Floating Rate Interests(continued) | | | | | | | | | | | | | | | | |
Semiconductors & Semiconductor Equipment(continued) | | | | | | | | | | | | | | | | |
ON Semiconductor Corp., 2018 New Replacement TermB-3 Loans, 4.152%,(1-month USD LIBOR + 1.75%), 3/31/23 | | | United States | | | | 1,139,956 | | | | | | | $ | 1,126,736 | |
| | | | | | | | | | | | | | | | |
| | | | |
| | | | | | | | | | | | | | | 1,666,081 | |
| | | | | | | | | | | | | | | | |
| | | | |
Software & Services 0.5% | | | | | | | | | | | | | | | | |
oCarbonite Inc., Initial Term Loan, 6.152%,(1-month USD LIBOR + 3.75%), 3/26/26 | | | United States | | | | 94,118 | | | | | | | | 94,490 | |
LegalZoom.com Inc., 2018 Term Loans, 6.902%,(1-month USD LIBOR + 4.50%), 11/21/24 | | | United States | | | | 184,556 | | | | | | | | 185,244 | |
o,pTIBCO Software Inc., First Lien Term Loan, TBD, 6/15/26 | | | United States | | | | 1,170,000 | | | | | | | | 1,173,168 | |
WEX Inc., Term Loan B, 4.652%,(1-month USD LIBOR + 2.25%), 5/17/26 | | | United States | | | | 643,353 | | | | | | | | 642,013 | |
| | | | | | | | | | | | | | | | |
| | | | |
| | | | | | | | | | | | | | | 2,094,915 | |
| | | | | | | | | | | | | | | | |
| | | | |
Technology Hardware & Equipment 0.1% | | | | | | | | | | | | | | | | |
CommScope Inc., Initial Term Loans, 5.652%,(1-month USD LIBOR + 3.25%), 4/04/26 | | | United States | | | | 647,567 | | | | | | | | 647,648 | |
| | | | | | | | | | | | | | | | |
| | | | |
Telecommunication Services 0.3% | | | | | | | | | | | | | | | | |
Global Tel*Link Corp., | | | | | | | | | | | | | | | | |
oFirst Lien Term Loan, 6.652%,(1-month USD LIBOR + 4.25%), 11/29/25 | | | United States | | | | 398,997 | | | | | | | | 386,130 | |
Second Lien Term Loan, 10.652%,(1-month USD LIBOR + 8.25%), 11/29/26 | | | United States | | | | 183,038 | | | | | | | | 178,690 | |
Securus Technologies Holdings Inc., | | | | | | | | | | | | | | | | |
oInitial Term Loan, 6.83%,(3-month USD LIBOR + 4.50%), 11/01/24 | | | United States | | | | 249,367 | | | | | | | | 232,743 | |
Second Lien Initial Loan, 10.58%,(3-month USD LIBOR + 8.25%), 11/01/25 | | | United States | | | | 597,127 | | | | | | | | 553,338 | |
| | | | | | | | | | | | | | | | |
| | | | |
| | | | | | | | | | | | | | | 1,350,901 | |
| | | | | | | | | | | | | | | | |
| | | | |
Transportation 0.8% | | | | | | | | | | | | | | | | |
Allegiant Travel Co., Class B Term Loans, 7.065%,(3-month USD LIBOR + 4.50%), 2/05/24 | | | United States | | | | 232,708 | | | | | | | | 232,999 | |
Hertz Corp., TrancheB-1 Term Loan, 5.16%,(1-month USD LIBOR + 2.75%), 6/30/23 | | | United States | | | | 1,658,930 | | | | | | | | 1,655,820 | |
International Seaways Operating Corp., Initial Term Loans, 8.44%,(1-month USD LIBOR + 6.00%), 6/22/22 | | | United States | | | | 722,471 | | | | | | | | 722,471 | |
Navios Maritime Midstream Partners LP, Initial Term Loan, 6.89%,(3-month USD LIBOR + 4.50%), 6/18/20 | | | Marshall Islands | | | | 1,252,931 | | | | | | | | 1,234,137 | |
| | | | | | | | | | | | | | | | |
| | | | |
| | | | | | | | | | | | | | | 3,845,427 | |
| | | | | | | | | | | | | | | | |
| | | | |
Utilities 0.6% | | | | | | | | | | | | | | | | |
EFS Cogen Holdings I LLC (Linden), Term B Advance, 5.86%,(1-month USD LIBOR + 3.25%), 6/28/23 | | | United States | | | | 2,769,083 | | | | | | | | 2,756,622 | |
| | | | | | | | | | | | | | | | |
| | | | | | | | | | | | | | | | |
Total Senior Floating Rate Interests
(Cost $60,911,718) | | | | | | | | | | | | | | | 58,995,663 | |
| | | | | | | | | | | | | | | | |
FRANKLIN TEMPLETON VARIABLE INSURANCE PRODUCTS TRUST
CONSOLIDATED STATEMENT OF INVESTMENTS (UNAUDITED)
Franklin Strategic Income VIP Fund(continued)
| | | | | | | | | | | | | | |
| | | | |
| | | Country | | | Principal
Amount* | | | | | Value | |
| | | |
Foreign Government and Agency Securities 5.6% | | | | | | | | | | | |
f Angolan Government International Bond, senior note, 144A, 8.25%,
5/09/28 | | | Angola | | | | 1,600,000 | | | | | $ | 1,716,064 | |
| | | | |
h Banque Centrale de Tunisie International Bond, senior note, Reg S,
5.625%, 2/17/24 | | | Tunisia | | | | 1,400,000 | | | EUR | | | 1,585,940 | |
| | | | |
fDominican Republic, senior note, 144A, 8.90%, 2/15/23 | | | Dominican Republic | | | | 56,500,000 | | | DOP | | | 1,115,534 | |
| | | | |
f The Export-Import Bank of India, senior note, 144A, 3.875%, 2/01/28 | | | India | | | | 1,455,000 | | | | | | 1,497,288 | |
| | | | |
Government of Colombia, | | | | | | | | | | | | | | |
| | | | |
senior bond, 9.85%, 6/28/27 | | | Colombia | | | | 4,015,000,000 | | | COP | | | 1,576,903 | |
| | | | |
senior bond, 5.00%, 6/15/45 | | | Colombia | | | | 1,300,000 | | | | | | 1,438,541 | |
| | | | |
fGovernment of Gabon, 144A, 6.375%, 12/12/24 | | | Gabon | | | | 1,700,000 | | | | | | 1,686,578 | |
| | | | |
Government of Indonesia, | | | | | | | | | | | | | | |
| | | | |
senior bond, FR64, 6.125%, 5/15/28 | | | Indonesia | | | | 26,500,000,000 | | | IDR | | | 1,736,028 | |
| | | | |
senior bond, FR70, 8.375%, 3/15/24 | | | Indonesia | | | | 19,648,000,000 | | | IDR | | | 1,474,765 | |
| | | | |
fGovernment of Iraq, 144A, 5.80%, 1/15/28 | | | Iraq | | | | 1,600,000 | | | | | | 1,581,128 | |
| | | | |
fGovernment of Kazakhstan, senior bond, 144A, 4.875%, 10/14/44 | | | Kazakhstan | | | | 700,000 | | | | | | 807,362 | |
| | | | |
Government of Mexico, | | | | | | | | | | | | | | |
| | | | |
senior bond, M, 6.50%, 6/10/21 | | | Mexico | | | | 293,000 | q | | MXN | | | 1,498,101 | |
| | | | |
senior note, 4.15%, 3/28/27 | | | Mexico | | | | 1,100,000 | | | | | | 1,153,350 | |
| | | | |
Government of South Africa, senior bond, 7.00%, 2/28/31 | | | South Africa | | | | 24,100,000 | | | ZAR | | | 1,465,765 | |
| | | | |
fGovernment of Ukraine, | | | | | | | | | | | | | | |
| | | | |
144A, 7.75%, 9/01/22 | | | Ukraine | | | | 200,000 | | | | | | 212,265 | |
| | | | |
144A, 7.75%, 9/01/23 | | | Ukraine | | | | 369,000 | | | | | | 391,574 | |
| | | | |
144A, 7.75%, 9/01/24 | | | Ukraine | | | | 369,000 | | | | | | 385,605 | |
| | | | |
a,r144A, VRI, GDP Linked Security, 5/31/40 | | | Ukraine | | | | 978,000 | | | | | | 701,651 | |
| | | | |
senior bond, 144A, 7.375%, 9/25/32 | | | Ukraine | | | | 500,000 | | | | | | 491,993 | |
| | | | |
sGovernment of Uruguay, senior bond, Index Linked, 3.70%, 6/26/37 | | | Uruguay | | | | 44,585,302 | | | UYU | | | 1,260,404 | |
| | | | |
Nota do Tesouro Nacional, | | | | | | | | | | | | | | |
| | | | |
10.00%, 1/01/21 | | | Brazil | | | | 2,900 | t | | BRL | | | 796,231 | |
| | | | |
10.00%, 1/01/23 | | | Brazil | | | | 2,800 | t | | BRL | | | 801,273 | |
| | | | |
| | | | | | | | | | | | | | |
| | | |
Total Foreign Government and Agency Securities
(Cost $24,485,743) | | | | | | | | | | 25,374,343 | |
| | | | |
| | | | | | | | | | | | | | |
| | | | |
U.S. Government and Agency Securities 5.2% | | | | | | | | | | | | | | |
| | | | |
U.S. Treasury Bond, | | | | | | | | | | | | | | |
| | | | |
7.875%, 2/15/21 | | | United States | | | | 728,000 | | | | | | 798,155 | |
| | | | |
6.50%, 11/15/26 | | | United States | | | | 1,940,000 | | | | | | 2,552,237 | |
| | | | |
3.875%, 8/15/40 | | | United States | | | | 2,800,000 | | | | | | 3,495,078 | |
| | | | |
3.00%, 11/15/45 | | | United States | | | | 2,041,000 | | | | | | 2,231,427 | |
| | | | |
U.S. Treasury Note, | | | | | | | | | | | | | | |
| | | | |
2.75%, 2/15/24 | | | United States | | | | 809,000 | | | | | | 844,552 | |
| | | | |
3.125%, 11/15/28 | | | United States | | | | 1,700,000 | | | | | | 1,863,891 | |
| | | | |
sIndex Linked, 0.125%, 7/15/24 | | | United States | | | | 7,409,448 | | | | | | 7,399,616 | |
| | | | |
sIndex Linked, 0.375%, 7/15/25 | | | United States | | | | 4,525,161 | | | | | | 4,576,872 | |
| | | | | | | | | | | | | | |
| | | |
Total U.S. Government and Agency Securities
(Cost $23,006,727) | | | | | | | | | | 23,761,828 | |
| | | | | | | | | | | | | | |
FRANKLIN TEMPLETON VARIABLE INSURANCE PRODUCTS TRUST
CONSOLIDATED STATEMENT OF INVESTMENTS (UNAUDITED)
Franklin Strategic Income VIP Fund(continued)
| | | | | | | | | | | | |
| | | |
| | | Country | | | Principal
Amount* | | | Value | |
| | | |
Asset-Backed Securities and Commercial Mortgage-
Backed Securities 26.3% | | | | | | | | | | | | |
| | | |
Banks 0.4% | | | | | | | | | | | | |
| | | |
uCommercial Mortgage Trust,2006-GG7, AJ, FRN, 5.83%, 7/10/38 | | | United States | | | | 425,000 | | | $ | 393,829 | |
| | | |
CSAIL Commercial Mortgage Trust,2015-C1, A4, 3.505%, 4/15/50 | | | United States | | | | 740,000 | | | | 777,576 | |
| | | |
uCWABS Asset-Backed Certificates Trust,2005-11, AF4, FRN, 5.21%, 3/25/34 | | | United States | | | | 723,056 | | | | 733,497 | |
| | | |
vMerrill Lynch Mortgage Investors Trust,2005-A6, 2A3, FRN, 2.784%,
(1-month USD LIBOR + 0.38%), 8/25/35 | | | United States | | | | 73,795 | | | | 74,174 | |
| | | | | | | | | | | | |
| | | |
| | | | | | | | | | | 1,979,076 | |
| | | | | | | | | | | | |
| | | |
Diversified Financials 25.9% | | | | | | | | | | | | |
| | | |
vAmerican Express Credit Account Master Trust,2017-2, A, FRN,
2.844%,(1-month USD LIBOR + 0.45%), 9/16/24 | | | United States | | | | 670,000 | | | | 673,814 | |
| | | |
f,vAMMC CLO XI Ltd., | | | | | | | | | | | | |
| | | |
2012-11A, BR2, 144A, FRN, 4.183%,(3-month USD LIBOR +
1.60%), 4/30/31 | | | United States | | | | 350,000 | | | | 346,272 | |
| | | |
2012-11A, DR2, 144A, FRN, 5.433%,(3-month USD LIBOR +
2.85%), 4/30/31 | | | United States | | | | 300,000 | | | | 284,049 | |
| | | |
f,vAntares CLO Ltd.,2018-1A, B, 144A, FRN, 4.242%,(3-month USD
LIBOR + 1.65%), 4/20/31 | | | United States | | | | 1,455,000 | | | | 1,438,937 | |
| | | |
f,vAres CLO Ltd.,2018-48A, D, 144A, FRN, 5.292%,(3-month USD
LIBOR + 2.70%), 7/20/30 | | | United States | | | | 400,000 | | | | 383,048 | |
| | | |
f,uARES L CLO Ltd.,2018-50A, B, 144A, FRN, 4.478%, 1/15/32 | | | United States | | | | 500,000 | | | | 497,965 | |
| | | |
f,uARES LII CLO Ltd., | | | | | | | | | | | | |
| | | |
2019-52A, A2, 144A, FRN, 4.259%, 4/22/31 | | | United States | | | | 250,000 | | | | 250,300 | |
| | | |
2019-52A, B, 144A, FRN, 4.459%, 4/22/31 | | | United States | | | | 500,000 | | | | 500,770 | |
| | | |
f,vAres XLIII CLO Ltd.,2017-43A, A, 144A, FRN, 3.817%,(3-month
USD LIBOR + 1.22%), 10/15/29 | | | United States | | | | 432,000 | | | | 431,348 | |
| | | |
f,uAtrium XIV LLC, 14A, D, 144A, FRN, 5.551%, 8/23/30 | | | United States | | | | 750,000 | | | | 732,300 | |
| | | |
Banc of America Commercial Mortgage Trust, | | | | | | | | | | | | |
| | | |
2015-UBS7, A3, 3.441%, 9/15/48 | | | United States | | | | 849,000 | | | | 892,502 | |
| | | |
2015-UBS7, A4, 3.705%, 9/15/48 | | | United States | | | | 946,000 | | | | 1,008,780 | |
| | | |
u2015-UBS7, B, FRN, 4.506%, 9/15/48 | | | United States | | | | 615,000 | | | | 666,586 | |
| | | |
f,uBCAP LLC Trust,2009-RR1, 2A2, 144A, FRN, 4.961%, 5/26/35 | | | United States | | | | 224,354 | | | | 216,794 | |
| | | |
f,uBCC Middle Market CLO LLC,2018-1A, A2, 144A, FRN, 4.742%,
10/20/30 | | | United States | | | | 700,000 | | | | 689,472 | |
| | | |
fBetony CLO 2 Ltd., | | | | | | | | | | | | |
| | | |
u2018-1A, A1, 144A, FRN, 3.663%, 4/30/31 | | | United States | | | | 1,250,000 | | | | 1,240,600 | |
| | | |
v2018-1A, C, 144A, FRN, 5.483%,(3-month USD LIBOR +
2.90%), 4/30/31 | | | United States | | | | 400,000 | | | | 387,096 | |
| | | |
f,uBlueMountain CLO Ltd., | | | | | | | | | | | | |
| | | |
2012-2A, BR2, 144A, FRN, 3.97%, 11/20/28 | | | United States | | | | 510,000 | | | | 507,776 | |
| | | |
2012-2A, CR2, 144A, FRN, 4.52%, 11/20/28 | | | United States | | | | 270,000 | | | | 266,827 | |
| | | |
2018-1A, D, 144A, FRN, 5.633%, 7/30/30 | | | United States | | | | 1,000,000 | | | | 974,520 | |
FRANKLIN TEMPLETON VARIABLE INSURANCE PRODUCTS TRUST
CONSOLIDATED STATEMENT OF INVESTMENTS (UNAUDITED)
Franklin Strategic Income VIP Fund(continued)
| | | | | | | | | | | | |
| | | |
| | | Country | | | Principal
Amount* | | | Value | |
| | | |
Asset-Backed Securities and Commercial Mortgage-
Backed Securities(continued) | | | | | | | | | | | | |
| | | |
Diversified Financials(continued) | | | | | | | | | | | | |
| | | |
f,vBlueMountain Fuji U.S. CLO II Ltd.,2017-2A, A1A, 144A, FRN,
3.792%,(3-month USD LIBOR + 1.20%), 10/20/30 | | | United States | | | | 1,455,000 | | | $ | 1,456,280 | |
| | | |
f,vBlueMountain Fuji U.S. CLO III Ltd.,2017-3A, A2, 144A, FRN,
3.747%,(3-month USD LIBOR + 1.15%), 1/15/30 | | | United States | | | | 200,000 | | | | 194,760 | |
| | | |
fBRAVO Residential Funding Trust,2019-1, A1C, 144A, 3.50%, 3/25/58 | | | United States | | | | 1,052,916 | | | | 1,076,018 | |
| | | |
fBurnham Park CLO Ltd., | | | | | | | | | | | | |
| | | |
v2016-1A, A, 144A, FRN, 4.022%,(3-month USD LIBOR +
1.43%), 10/20/29. | | | United States | | | | 350,000 | | | | 351,830 | |
| | | |
u2016-1A, BR, 144A, FRN, 4.092%, 10/20/29 | | | United States | | | | 460,000 | | | | 454,931 | |
| | | |
u2016-1A, CR, 144A, FRN, 4.742%, 10/20/29 | | | United States | | | | 460,000 | | | | 457,833 | |
| | | |
f,uButtermilk Park CLO Ltd.,2018-1A, C, 144A, FRN, 4.697%, 10/15/31 | | | United States | | | | 1,408,860 | | | | 1,378,781 | |
| | | |
v Capital One Multi-Asset Execution Trust, | | | | | | | | | | | | |
| | | |
2016-A2, A2, FRN, 3.024%,(1-month USD LIBOR + 0.63%), 2/15/24 | | | United States | | | | 3,225,000 | | | | 3,251,847 | |
| | | |
2016-A7, A7, FRN, 2.904%,(1-month USD LIBOR + 0.51%), 9/16/24 | | | United States | | | | 320,000 | | | | 322,344 | |
| | | |
f,vCarlyle Global Market Strategies CLO Ltd.,2014-4RA, C, 144A, FRN,
5.497%,(3-month USD LIBOR + 2.90%), 7/15/30 | | | United States | | | | 300,000 | | | | 286,863 | |
| | | |
f,uCarlyle GMS Finance MM CLO LLC,2015-1A, A2R, 144A, FRN,
4.797%, 10/15/31 | | | United States | | | | 1,213,000 | | | | 1,207,857 | |
| | | |
f,vCarlyle U.S. CLO Ltd.,2017-2A, A1B, 144A, FRN, 3.812%,(3-month USD LIBOR + 1.22%), 7/20/31 | | | United States | | | | 1,150,000 | | | | 1,148,827 | |
| | | |
f,vCatamaran CLO Ltd.,2014-2A, BR, 144A, FRN, 5.551%,(3-month USD LIBOR + 2.95%), 10/18/26 | | | United States | | | | 1,253,000 | | | | 1,253,514 | |
| | | |
f,uCGRBS Commercial Mortgage Trust, 2013-VN05, C, 144A, FRN, 3.703%, 3/13/35 | | | United States | | | | 704,000 | | | | 740,948 | |
| | | |
f,uCIM Trust, | | | | | | | | | | | | |
| | | |
2019-INV1, A1, 144A, FRN, 4.00%, 2/25/49 | | | United States | | | | 1,547,541 | | | | 1,590,437 | |
| | | |
2019-INV2, A3, 144A, FRN, 4.00%, 5/25/49 | | | United States | | | | 2,210,859 | | | | 2,263,028 | |
| | | |
uCitibank Credit Card Issuance Trust, | | | | | | | | | | | | |
| | | |
2016-A3, A3, FRN, 2.909%, 12/07/23 | | | United States | | | | 350,000 | | | | 352,533 | |
| | | |
2017-A7, A7, FRN, 2.782%, 8/08/24 | | | United States | | | | 2,685,000 | | | | 2,694,525 | |
| | | |
f,uCole Park CLO Ltd.,2015-1A, BR, 144A, FRN, 4.192%, 10/20/28 | | | United States | | | | 270,000 | | | | 268,798 | |
| | | |
fCore Industrial Trust, 2015-CALW, A, 144A, 3.04%, 2/10/34 | | | United States | | | | 1,081,627 | | | | 1,107,012 | |
| | | |
uDiscover Card Execution Note Trust,2017-A7, A7, FRN, 2.754%, 4/15/25 | | | United States | | | | 390,000 | | | | 390,516 | |
| | | |
f,uDryden 38 Senior Loan Fund, | | | | | | | | | | | | |
| | | |
2015-38A, CR, 144A, FRN, 4.597%, 7/15/30 | | | United States | | | | 863,000 | | | | 848,950 | |
| | | |
2015-38A, DR, 144A, FRN, 5.597%, 7/15/30 | | | United States | | | | 557,000 | | | | 544,451 | |
FRANKLIN TEMPLETON VARIABLE INSURANCE PRODUCTS TRUST
CONSOLIDATED STATEMENT OF INVESTMENTS (UNAUDITED)
Franklin Strategic Income VIP Fund(continued)
| | | | | | | | | | | | |
| | | |
| | | Country | | | Principal
Amount* | | | Value | |
| | | |
Asset-Backed Securities and Commercial Mortgage-
Backed Securities (continued) | | | | | | | | | | | | |
| | | |
| Diversified Financials (continued) | | | | | | | | | | | | |
| | | |
f,vDryden 41 Senior Loan Fund,2015-41A, AR, 144A, FRN, 3.567%,
(3-month USD LIBOR + 0.97%), 4/15/31 | | | United States | | | | 1,100,000 | | | $ | 1,088,483 | |
| | | |
f,vDryden 42 Senior Loan Fund,2016-42A, DR, 144A, FRN, 5.527%,
(3-month USD LIBOR + 2.93%), 7/15/30 | | | United States | | | | 1,294,000 | | | | 1,248,658 | |
| | | |
f,vDryden 55 CLO Ltd., | | | | | | | | | | | | |
| | | |
2018-55A, A1, 144A, FRN, 3.617%,(3-month USD LIBOR +
1.02%), 4/15/31 | | | United States | | | | 900,000 | | | | 895,446 | |
| | | |
2018-55A, D, 144A, FRN, 5.447%,(3-month USD LIBOR +
2.85%), 4/15/31 | | | United States | | | | 300,000 | | | | 288,027 | |
| | | |
f,vDryden 64 CLO Ltd.,2018-64A, D, 144A, FRN, 5.251%,(3-month
USD LIBOR + 2.65%), 4/18/31 | | | United States | | | | 300,000 | | | | 289,527 | |
| | | |
f,uEaton Vance CLO Ltd., | | | | | | | | | | | | |
| | | |
2014-1RA, C, 144A, FRN, 4.697%, 7/15/30 | | | United States | | | | 315,610 | | | | 310,680 | |
| | | |
2014-1RA, D, 144A, FRN, 5.647%, 7/15/30 | | | United States | | | | 462,825 | | | | 455,674 | |
| | | |
f,uEleven Madison Trust 2015-11MD Mortgage Trust, 2015-11MD, A,
144A, FRN, 3.673%, 9/10/35 | | | United States | | | | 1,091,000 | | | | 1,156,887 | |
| | | |
FHLMC Structured Agency Credit Risk Debt Notes, | | | | | | | | | | | | |
| | | |
v2013-DN2, M2, FRN, 6.654%,(1-month USD LIBOR + 4.25%),
11/25/23 | | | United States | | | | 1,861,193 | | | | 2,012,903 | |
| | | |
v2014-DN1, M2, FRN, 4.604%,(1-month USD LIBOR + 2.20%),
2/25/24 | | | United States | | | | 796,894 | | | | 810,740 | |
| | | |
v2014-DN2, M3, FRN, 6.004%,(1-month USD LIBOR + 3.60%),
4/25/24 | | | United States | | | | 2,290,000 | | | | 2,437,671 | |
| | | |
v2014-DN3, M3, FRN, 6.404%,(1-month USD LIBOR + 4.00%),
8/25/24 | | | United States | | | | 184,376 | | | | 196,889 | |
| | | |
v2014-DN4, M3, FRN, 6.954%,(1-month USD LIBOR + 4.55%),
10/25/24 | | | United States | | | | 1,373,225 | | | | 1,479,039 | |
| | | |
v2014-HQ1, M3, FRN, 6.504%,(1-month USD LIBOR + 4.10%),
8/25/24 | | | United States | | | | 355,909 | | | | 373,946 | |
| | | |
v2014-HQ2, M2, FRN, 4.604%,(1-month USD LIBOR + 2.20%),
9/25/24 | | | United States | | | | 571,769 | | | | 581,014 | |
| | | |
v2014-HQ3, M3, FRN, 7.154%,(1-month USD LIBOR + 4.75%),
10/25/24 | | | United States | | | | 712,776 | | | | 761,593 | |
| | | |
v2015-DNA1, M3, FRN, 5.704%,(1-month USD LIBOR + 3.30%),
10/25/27 | | | United States | | | | 250,000 | | | | 269,264 | |
| | | |
v2015-DNA3, M3, FRN, 7.104%,(1-month USD LIBOR + 4.70%),
4/25/28 | | | United States | | | | 1,819,000 | | | | 2,024,130 | |
| | | |
v2015-HQ1, M3, FRN, 6.204%,(1-month USD LIBOR + 3.80%),
3/25/25 | | | United States | | | | 873,900 | | | | 899,839 | |
| | | |
v2015-HQA1, M3, FRN, 7.104%,(1-month USD LIBOR + 4.70%),
3/25/28 | | | United States | | | | 1,835,000 | | | | 1,989,733 | |
| | | |
v2016-DNA2, M3, FRN, 7.054%,(1-month USD LIBOR + 4.65%),
10/25/28 | | | United States | | | | 1,673,000 | | | | 1,808,430 | |
| | | |
u2017-DNA1, M2, FRN, 5.654%, 7/25/29 | | | United States | | | | 990,000 | | | | 1,047,496 | |
| | | |
u2017-DNA2, M2, FRN, 5.854%, 10/25/29 | | | United States | | | | 1,340,000 | | | | 1,434,417 | |
| | | |
v2017-DNA3, M2, FRN, 4.904%,(1-month USD LIBOR + 2.50%),
3/25/30 | | | United States | | | | 2,920,000 | | | | 2,988,942 | |
| | | |
u2017-HQA1, M2, FRN, 5.954%, 8/25/29 | | | United States | | | | 1,180,000 | | | | 1,260,333 | |
FRANKLIN TEMPLETON VARIABLE INSURANCE PRODUCTS TRUST
CONSOLIDATED STATEMENT OF INVESTMENTS (UNAUDITED)
Franklin Strategic Income VIP Fund(continued)
| | | | | | | | | | | | | | |
| | | | |
| | | Country | |
| Principal
Amount |
* | | | | | | | Value | |
| | | | |
Asset-Backed Securities and Commercial Mortgage-Backed Securities(continued) | | | | | | | | | | | | | | |
Diversified Financials(continued) | | | | | | | | | | | | | | |
f,vFlagship CLO VIII Ltd., | | | | | | | | | | | | | | |
2014-8A, ARR, 144A, FRN, 3.451%,(3-month USD LIBOR + 0.85%), 1/16/26 | | United States | | | 501,760 | | | | | | | $ | 501,258 | |
2014-8A, DR, 144A, FRN, 5.651%,(3-month USD LIBOR + 3.05%), 1/16/26 | | United States | | | 350,000 | | | | | | | | 338,037 | |
FNMA Connecticut Avenue Securities, | | | | | | | | | | | | | | |
v2013-C01, M2, FRN, 7.654%,(1-month USD LIBOR + 5.25%), 10/25/23 | | United States | | | 336,022 | | | | | | | | 373,556 | |
v2014-C01, M2, FRN, 6.804%,(1-month USD LIBOR + 4.40%), 1/25/24 | | United States | | | 498,000 | | | | | | | | 544,759 | |
v2014-C02, 1M2, FRN, 5.004%,(1-month USD LIBOR + 2.60%), 5/25/24 | | United States | | | 1,414,047 | | | | | | | | 1,462,571 | |
v2014-C02, 2M2, FRN, 5.004%,(1-month USD LIBOR + 2.60%), 5/25/24 | | United States | | | 727,098 | | | | | | | | 745,047 | |
v2014-C03, 1M2, FRN, 5.404%,(1-month USD LIBOR + 3.00%), 7/25/24 | | United States | | | 2,868,442 | | | | | | | | 3,010,131 | |
v2014-C03, 2M2, FRN, 5.304%,(1-month USD LIBOR + 2.90%), 7/25/24 | | United States | | | 144,781 | | | | | | | | 151,054 | |
v2015-C01, 1M2, FRN, 6.704%,(1-month USD LIBOR + 4.30%), 2/25/25 | | United States | | | 955,095 | | | | | | | | 1,022,414 | |
v2015-C01, 2M2, FRN, 6.954%,(1-month USD LIBOR + 4.55%), 2/25/25 | | United States | | | 870,071 | | | | | | | | 916,168 | |
v2015-C02, 1M2, FRN, 6.404%,(1-month USD LIBOR + 4.00%), 5/25/25 | | United States | | | 2,094,284 | | | | | | | | 2,233,397 | |
v2015-C02, 2M2, FRN, 6.404%,(1-month USD LIBOR + 4.00%), 5/25/25 | | United States | | | 1,009,199 | | | | | | | | 1,050,810 | |
v2015-C03, 1M2, FRN, 7.404%,(1-month USD LIBOR + 5.00%), 7/25/25 | | United States | | | 3,071,858 | | | | | | | | 3,364,218 | |
v2015-C03, 2M2, FRN, 7.404%,(1-month USD LIBOR + 5.00%), 7/25/25 | | United States | | | 1,478,527 | | | | | | | | 1,582,395 | |
u2016-C04, 1M2, FRN, 6.654%, 1/25/29 | | United States | | | 1,590,000 | | | | | | | | 1,708,924 | |
v2017-C01, 1M2, FRN, 5.954%,(1-month USD LIBOR + 3.55%), 7/25/29 | | United States | | | 1,858,000 | | | | | | | | 1,968,476 | |
u2017-C03, 1M2, FRN, 5.404%, 10/25/29 | | United States | | | 2,720,000 | | | | | | | | 2,841,761 | |
u2017-C03, 2M2, FRN, 5.254%, 11/25/29 | | United States | | | 450,000 | | | | | | | | 464,174 | |
u2016-C02, 1M2, FRN, 8.404%, 9/25/28 | | United States | | | 872,467 | | | | | | | | 965,143 | |
u2017-C05, 1M2, FRN, 4.604%, 1/25/30 | | United States | | | 1,020,000 | | | | | | | | 1,030,627 | |
fGalaxy XVIII CLO Ltd., | | | | | | | | | | | | | | |
u2018-28A, A2, 144A, FRN, 3.667%, 7/15/31 | | United States | | | 900,000 | | | | | | | | 900,198 | |
v2018-28A, C, 144A, FRN, 4.547%,(3-month USD LIBOR + 1.95%), 7/15/31 | | United States | | | 250,000 | | | | | | | | 241,555 | |
f,uGalaxy XXV CLO Ltd.,2018-25A, D, 144A, FRN, 5.68%, 10/25/31 | | United States | | | 852,270 | | | | | | | | 839,980 | |
f,uGalaxy XXVI CLO Ltd.,2018-26A, A, 144A, FRN, 3.723%, 11/22/31 | | United States | | | 700,000 | | | | | | | | 698,327 | |
f,vGalaxy XXVII CLO Ltd., | | | | | | | | | | | | | | |
2018-27A, C, 144A, FRN, 4.325%,(3-month USD LIBOR + 1.80%), 5/16/31 | | United States | | | 400,000 | | | | | | | | 386,984 | |
2018-27A, C, 144A, FRN, 5.275%,(3-month USD LIBOR + 2.75%), 5/16/31 | | United States | | | 600,000 | | | | | | | | 565,164 | |
FRANKLIN TEMPLETON VARIABLE INSURANCE PRODUCTS TRUST
CONSOLIDATED STATEMENT OF INVESTMENTS (UNAUDITED)
Franklin Strategic Income VIP Fund(continued)
| | | | | | | | | | | | | | |
| | | | |
| | | Country | |
| Principal
Amount |
* | | | | | | | Value | |
| | | | |
Asset-Backed Securities and Commercial Mortgage-Backed Securities(continued) | | | | | | | | | | | | | | |
Diversified Financials(continued) | | | | | | | | | | | | | | |
GS Mortgage Securities Trust, | | | | | | | | | | | | | | |
u2016-GS3, B, FRN, 3.395%, 10/10/49 | | United States | | | 728,000 | | | | | | | $ | 742,486 | |
2017-GS6, B, 3.869%, 5/10/50 | | United States | | | 704,000 | | | | | | | | 738,600 | |
f,vLCM 26 Ltd., 26A, B, 144A, FRN, 3.992%,(3-month USD LIBOR + 1.40%), 1/20/31 | | United States | | | 250,000 | | | | | | | | 245,228 | |
f,uLCM XVI LP, 2016A, BR2, 144A, FRN, 4.347%, 10/15/31 | | United States | | | 351,320 | | | | | | | | 351,236 | |
f,uLCM XVII LP, | | | | | | | | | | | | | | |
2017A, BRR, 144A, FRN, 4.197%, 10/15/31 | | United States | | | 350,000 | | | | | | | | 347,154 | |
2017A, CRR, 144A, FRN, 4.697%, 10/15/31 | | United States | | | 320,000 | | | | | | | | 315,283 | |
f,vLCM XVIII LP, 2018A, DR, 144A, FRN, 5.392%,(3-month USD LIBOR + 2.80%), 4/20/31 | | United States | | | 770,000 | | | | | | | | 737,660 | |
f,vLCM XXIV Ltd., 24A, A, 144A, FRN, 3.902%,(3-month USD LIBOR + 1.31%), 3/20/30 | | United States | | | 480,000 | | | | | | | | 480,480 | |
f,i,wMadison Park Euro Funding XIV DAC, 14A, A1N, 144A, FRN, 7/15/32 | | Ireland | | | 1,000,000 | | | | EUR | | | | 1,136,850 | |
f,vMadison Park Funding XXIII Ltd., | | | | | | | | | | | | | | |
2017-23A, B, 144A, FRN, 4.282%,(3-month USD LIBOR + 1.70%), 7/27/30 | | United States | | | 400,000 | | | | | | | | 399,300 | |
2017-23A, C, 144A, FRN, 4.932%,(3-month USD LIBOR + 2.35%), 7/27/30 | | United States | | | 500,000 | | | | | | | | 500,725 | |
f,uMill City Mortgage Loan Trust,2018-4, A1B, 144A, FRN, 3.50%, 4/25/66 | | United States | | | 1,470,000 | | | | | | | | 1,509,700 | |
vMortgageIT Trust,2004-1, A2, FRN, 3.304%,(1-month USD LIBOR + 0.90%), 11/25/34 | | United States | | | 134,695 | | | | | | | | 135,582 | |
f,uMountain View Funding CLO XIV Ltd., | | | | | | | | | | | | | | |
2019-1A, A1, 144A, FRN, 4.058%, 4/15/29 | | United States | | | 500,000 | | | | | | | | 501,165 | |
2019-1A, C, 144A, FRN, 5.518%, 4/15/29 | | United States | | | 500,000 | | | | | | | | 501,535 | |
f,vNZCG Funding Ltd.,2015-1A, A2R, 144A, FRN, 4.071%,(3-month USD LIBOR + 1.55%), 2/26/31 | | United States | | | 2,182,000 | | | | | | | | 2,150,186 | |
f,uOctagon Investment Partners 24 Ltd.,2015-1A, BS, 144A, FRN, 4.529%, 4/21/31 | | United States | | | 390,000 | | | | | | | | 390,835 | |
f,uOctagon Investment Partners 28 Ltd.,2016-1A, BR, 144A, FRN, 4.381%, 10/24/30 | | United States | | | 250,000 | | | | | | | | 250,368 | |
f,vOctagon Investment Partners 30 Ltd., 144A, FRN, 3.912%,(3-month USD LIBOR + 1.32%), 3/17/30 | | United States | | | 480,000 | | | | | | | | 481,517 | |
f,vOctagon Investment Partners 36 Ltd.,2018-1A, A1, 144A, FRN, 3.567%,(3-month USD LIBOR + 0.97%), 4/15/31 | | United States | | | 500,000 | | | | | | | | 496,725 | |
f,vOctagon Investment Partners 37 Ltd.,2018-2A, C, 144A, FRN, 5.43%,(3-month USD LIBOR + 2.85%), 7/25/30 | | United States | | | 400,000 | | | | | | | | 386,892 | |
f,uOctagon Investment Partners 38 Ltd.,2018-1A, C, 144A, FRN, 5.542%, 7/20/30 | | United States | | | 1,000,000 | | | | | | | | 974,240 | |
f,vOctagon Investment Partners XVI Ltd.,2013-1A, DR, 144A, FRN, 5.588%,(3-month USD LIBOR + 3.00%), 7/17/30 | | United States | | | 400,000 | | | | | | | | 387,964 | |
f,vOctagon Investment Partners XXIII Ltd., | | | | | | | | | | | | | | |
2015-1A, BR, 144A, FRN, 3.797%,(3-month USD LIBOR + 1.20%), 7/15/27 | | United States | | | 400,000 | | | | | | | | 395,764 | |
2015-1A, DR, 144A, FRN, 5.147%,(3-month USD LIBOR + 2.55%), 7/15/27 | | United States | | | 800,000 | | | | | | | | 792,376 | |
FRANKLIN TEMPLETON VARIABLE INSURANCE PRODUCTS TRUST
CONSOLIDATED STATEMENT OF INVESTMENTS (UNAUDITED)
Franklin Strategic Income VIP Fund(continued)
| | | | | | | | | | | | | | | | |
| | | | |
| | | | Country | | |
| Principal
Amount |
* | | | | | | | Value | |
| | | | |
Asset-Backed Securities and Commercial Mortgage-
Backed Securities(continued) | | | | | | | | | | | | | | | | |
Diversified Financials(continued) | | | | | | | | | | | | | | | | |
vOpteum Mortgage Acceptance Corp. Trust,2005-4, 1APT, FRN,
2.714%,(1-month USD LIBOR + 0.31%), 11/25/35 | | | United States | | | | 160,754 | | | | | | | $ | 161,184 | |
f,vRace Point IX CLO Ltd.,2015-9A, A1AR, 144A, FRN, 3.807%,
(3-month USD LIBOR + 1.21%), 10/15/30 | | | United States | | | | 400,000 | | | | | | | | 400,064 | |
f,uStrata CLO I Ltd.,2018-1A, B, 144A, FRN, 5.016%, 1/15/31 | | | United States | | | | 1,300,000 | | | | | | | | 1,308,996 | |
vStructured Asset Securities Corp.,2005-2XS, 2A2, FRN, 3.94%,
(1-month USD LIBOR + 1.50%), 2/25/35 | | | United States | | | | 142,393 | | | | | | | | 143,354 | |
uThornburg Mortgage Securities Trust,2005-1, A3, FRN, 4.616%, 4/25/45 | | | United States | | | | 110,943 | | | | | | | | 113,874 | |
fVoya CLO Ltd., | | | | | | | | | | | | | | | | |
v2013-2A, BR, 144A, FRN, 4.43%,(3-month USD LIBOR + 1.85%), 4/25/31 | | | United States | | | | 780,000 | | | | | | | | 754,221 | |
v2014-1A, CR2, 144A, FRN, 5.401%,(3-month USD LIBOR + 2.80%), 4/18/31 | | | United States | | | | 1,000,000 | | | | | | | | 957,020 | |
u2015-2A, BR, 144A, FRN, 4.092%, 7/23/27 | | | United States | | | | 820,000 | | | | | | | | 814,891 | |
u2016-3A, A1R, 144A, FRN, 3.791%, 10/18/31 | | | United States | | | | 900,000 | | | | | | | | 898,425 | |
v2017-2A, B, 144A, FRN, 4.947%,(3-month USD LIBOR + 2.35%), 6/07/30 | | | United States | | | | 1,455,000 | | | | | | | | 1,455,567 | |
u2018-2A, A1, 144A, FRN, 3.597%, 7/15/31 | | | United States | | | | 400,000 | | | | | | | | 397,564 | |
v2018-2A, D, 144A, FRN, 5.347%,(3-month USD LIBOR + 2.75%), 7/15/31 | | | United States | | | | 300,000 | | | | | | | | 288,054 | |
Wells Fargo Mortgage Backed Securities Trust, | | | | | | | | | | | | | | | | |
u2004-W, A9, FRN, 4.855%, 11/25/34 | | | United States | | | | 252,829 | | | | | | | | 263,709 | |
2007-3, 3A1, 5.50%, 4/25/22 | | | United States | | | | 46,075 | | | | | | | | 47,041 | |
| | | | | | | | | | | | | | | | |
| | | | |
| | | | | | | | | | | | | | | 117,403,343 | |
| | | | | | | | | | | | | | | | |
Total Asset-Backed Securities and Commercial
Mortgage-Backed Securities (Cost $120,760,595) | | | | | | | | | | | | | | | 119,382,419 | |
| | | | | | | | | | | | | | | | |
Mortgage-Backed Securities 9.6% | | | | | | | | | | | | | | | | |
xFederal Home Loan Mortgage Corp. (FHLMC) Adjustable Rate 0.0%† | | | | | | | | | | | | | | | | |
FHLMC, 4.929%, (US 1 Year CMTT-Note +/- MBS Margin), 1/01/33 | | | United States | | | | 8,697 | | | | | | | | 9,007 | |
| | | | | | | | | | | | | | | | |
| | | | |
Federal Home Loan Mortgage Corp. (FHLMC) Fixed Rate 1.6% | | | | | | | | | | | | | | | | |
FHLMC Gold 30 Year, 3.50%, 5/01/49 | | | United States | | | | 6,519,759 | | | | | | | | 6,669,322 | |
FHLMC Gold 30 Year, 5.00%, 4/01/34 - 8/01/35 | | | United States | | | | 193,140 | | | | | | | | 210,937 | |
FHLMC Gold 30 Year, 5.50%, 3/01/33 - 1/01/35 | | | United States | | | | 144,030 | | | | | | | | 156,469 | |
FHLMC Gold 30 Year, 6.00%, 4/01/33 - 2/01/36 | | | United States | | | | 91,167 | | | | | | | | 101,902 | |
FHLMC Gold 30 Year, 6.50%, 11/01/27 - 7/01/32 | | | United States | | | | 18,121 | | | | | | | | 20,327 | |
FHLMC Gold 30 Year, 7.00%, 9/01/21 - 4/01/30 | | | United States | | | | 7,177 | | | | | | | | 7,631 | |
FHLMC Gold 30 Year, 7.50%, 8/01/30 - 7/01/31 | | | United States | | | | 903 | | | | | | | | 949 | |
| | | | | | | | | | | | | | | | |
| | | | |
| | | | | | | | | | | | | | | 7,167,537 | |
| | | | | | | | | | | | | | | | |
xFederal National Mortgage Association (FNMA) Adjustable Rate 0.0%† | | | | | | | | | | | | | | | | |
FNMA, 4.622%, (US 1 Year CMTT-Note +/- MBS Margin), 12/01/34 | | | United States | | | | 68,028 | | | | | | | | 71,697 | |
| | | | | | | | | | | | | | | | |
FRANKLIN TEMPLETON VARIABLE INSURANCE PRODUCTS TRUST
CONSOLIDATED STATEMENT OF INVESTMENTS (UNAUDITED)
Franklin Strategic Income VIP Fund(continued)
| | | | | | | | | | | | | | | | |
| | | | |
| | | | Country | | |
| Principal
Amount |
* | | | | | | | Value | |
| | | | |
Mortgage-Backed Securities(continued) | | | | | | | | | | | | | | | | |
Federal National Mortgage Association (FNMA) Fixed Rate 7.0% | | | | | | | | | | | | | | | | |
FNMA 15 Year, 2.50%, 7/01/22 - 6/01/27 | | | United States | | | | 196,413 | | | | | | | $ | 198,135 | |
FNMA 15 Year, 4.50%, 3/01/20 | | | United States | | | | 713 | | | | | | | | 728 | |
FNMA 30 Year, 3.00%, 9/01/48 | | | United States | | | | 3,509,872 | | | | | | | | 3,555,004 | |
FNMA 30 Year, 3.00%, 11/01/48 | | | United States | | | | 4,332,392 | | | | | | | | 4,381,622 | |
FNMA 30 Year, 3.50%, 11/01/47 | | | United States | | | | 2,763,193 | | | | | | | | 2,846,360 | |
FNMA 30 Year, 3.50%, 6/01/49 | | | United States | | | | 3,959,511 | | | | | | | | 4,053,516 | |
yFNMA 30 Year, 3.50%, 7/01/49 | | | United States | | | | 1,100,000 | | | | | | | | 1,124,320 | |
yFNMA 30 Year, 4.00%, 6/01/49 | | | United States | | | | 9,380,000 | | | | | | | | 9,693,094 | |
FNMA 30 Year, 4.50%, 5/01/48 | | | United States | | | | 5,519,488 | | | | | | | | 5,863,947 | |
FNMA 30 Year, 5.00%, 4/01/30 | | | United States | | | | 44,865 | | | | | | | | 47,462 | |
FNMA 30 Year, 6.50%, 6/01/28 - 10/01/37 | | | United States | | | | 124,061 | | | | | | | | 142,612 | |
| | | | | | | | | | | | | | | | |
| | | | |
| | | | | | | | | | | | | | | 31,906,800 | |
| | | | | | | | | | | | | | | | |
Government National Mortgage Association (GNMA) Fixed Rate 1.0% | | | | | | | | | | | | | | | | |
GNMA I SF 30 Year, 5.00%, 11/15/33 - 7/15/34 | | | United States | | | | 197,167 | | | | | | | | 214,049 | |
GNMA I SF 30 Year, 7.00%, 10/15/28 - 6/15/32 | | | United States | | | | 13,958 | | | | | | | | 14,099 | |
GNMA I SF 30 Year, 7.50%, 9/15/30 | | | United States | | | | 1,163 | | | | | | | | 1,349 | |
GNMA II SF 30 Year, 4.50%, 5/20/49 | | | United States | | | | 3,751,202 | | | | | | | | 3,933,186 | |
GNMA II SF 30 Year, 5.00%, 9/20/33 - 11/20/33 | | | United States | | | | 51,080 | | | | | | | | 54,950 | |
GNMA II SF 30 Year, 6.00%, 11/20/34 | | | United States | | | | 67,712 | | | | | | | | 77,682 | |
GNMA II SF 30 Year, 6.50%, 4/20/31 - 2/20/34 | | | United States | | | | 34,703 | | | | | | | | 40,105 | |
GNMA II SF 30 Year, 7.50%, 1/20/28 - 4/20/32 | | | United States | | | | 8,734 | | | | | | | | 9,891 | |
| | | | | | | | | | | | | | | | |
| | | | |
| | | | | | | | | | | | | | | 4,345,311 | |
| | | | | | | | | | | | | | | | |
| | | | |
Total Mortgage-Backed Securities
(Cost $43,011,753) | | | | | | | | | | | | | | | 43,500,352 | |
| | | | | | | | | | | | | | | | |
| | | | |
Municipal Bonds 1.5% | | | | | | | | | | | | | | | | |
California State GO, Various Purpose, Refunding, 5.00%, 9/01/29 | | | United States | | | | 1,335,000 | | | | | | | | 1,643,225 | |
New York City HDC Capital Fund Grant Program Revenue, New York City Housing Authority Program, Series B1, 5.00%, 7/01/33 | | | United States | | | | 405,000 | | | | | | | | 446,780 | |
Orlando Health Obligated Group, 3.777%, 10/01/28 | | | United States | | | | 330,000 | | | | | | | | 351,823 | |
Port Authority of New York and New Jersey Revenue, Consolidated, One Hundred Ninety-First Series, 4.823%, 6/01/45 | | | United States | | | | 1,205,000 | | | | | | | | 1,326,283 | |
lPuerto Rico Electric Power Authority Power Revenue, | | | | | | | | | | | | | | | | |
SeriesA-RSA-1, 6.75%, 7/01/36 | | | United States | | | | 2,805,000 | | | | | | | | 2,258,025 | |
SeriesXX-RSA-1, 5.25%, 7/01/40 | | | United States | | | | 165,000 | | | | | | | | 129,938 | |
San Jose RDA Successor Agency Tax Allocation, Senior, Refunding, SeriesA-T, 3.25%, 8/01/29 | | | United States | | | | 440,000 | | | | | | | | 454,709 | |
| | | | | | | | | | | | | | | | |
| | | | |
Total Municipal Bonds (Cost $6,657,154) | | | | | | | | | | | | | | | 6,610,783 | |
| | | | | | | | | | | | | | | | |
FRANKLIN TEMPLETON VARIABLE INSURANCE PRODUCTS TRUST
CONSOLIDATED STATEMENT OF INVESTMENTS (UNAUDITED)
Franklin Strategic Income VIP Fund(continued)
| | | | | | | | | | | | | | | | |
| | | | |
| | | Country | | | Shares/
Units | | | | | | Value | |
| | | | |
Escrows and Litigation Trusts 0.0%† | | | | | | | | | | | | | | | | |
a,cClear Channel Communications Inc., Escrow Account | | | United States | | | | 485,000 | | | | | | | $ | — | |
a,ciHeartCommunications Inc., Escrow Account | | | United States | | | | 324,000 | | | | | | | | — | |
a,cMidstates Petroleum Co. Inc./Midstates Petroleum Co. LLC, Escrow Account | | | United States | | | | 1,500,000 | | | | | | | | — | |
a,cNewPage Corp., Litigation Trust | | | United States | | | | 2,500,000 | | | | | | | | — | |
a,c,dRemington Outdoor Co. Inc., Litigation Units | | | United States | | | | 7,021 | | | | | | | | — | |
a,cT-Mobile USA Inc., Escrow Account | | | United States | | | | 1,654,665 | | | | | | | | — | |
aVistra Energy Corp., Escrow Account | | | United States | | | | 3,000,000 | | | | | | | | 7,500 | |
| | | | | | | | | | | | | | | | |
| | | | |
Total Escrows and Litigation Trusts (Cost $82,648) | | | | | | | | | | | | | | | 7,500 | |
| | | | | | | | | | | | | | | | |
| | | | |
Total Investments before Short Term Investments
(Cost $459,644,173) | | | | | | | | | | | | | | | 451,151,541 | |
| | | | | | | | | | | | | | | | |
| | | | |
| | | | | | | Shares | | | | | | | | | |
Short Term Investments (Cost $7,294,034) 1.6% | | | | | | | | | | | | | | | | |
| | | | |
Money Market Funds 1.6% | | | | | | | | | | | | | | | | |
e,zInstitutional Fiduciary Trust Money Market Portfolio, 2.05% | | | United States | | | | 7,294,034 | | | | | | | | 7,294,034 | |
| | | | | | | | | | | | | | | | |
| | | | |
Total Investments (Cost $466,938,207) 101.1% | | | | | | | | | | | | | | | 458,445,575 | |
Other Assets, less Liabilities (1.1)% | | | | | | | | | | | | | | | (4,920,351 | ) |
| | | | | | | | | | | | | | | | |
| | | | |
Net Assets 100.0% | | | | | | | | | | | | | | $ | 453,525,224 | |
| | | | | | | | | | | | | | | | |
FRANKLIN TEMPLETON VARIABLE INSURANCE PRODUCTS TRUST
CONSOLIDATED STATEMENT OF INVESTMENTS (UNAUDITED)
Franklin Strategic Income VIP Fund(continued)
†Rounds to less than 0.1% of net assets.
*The principal amount is stated in U.S. dollars unless otherwise indicated.
aNon-income producing.
bThe security is owned by FT Holdings Corporation III, a wholly-owned subsidiary of the Fund. See Note 1(g).
cFair valued using significant unobservable inputs. See Note 12 regarding fair value measurements.
dSee Note 8 regarding restricted securities.
eSee Note 3(e) regarding investments in affiliated management investment companies.
fSecurity was purchased pursuant to Rule 144A under the Securities Act of 1933 and may be sold in transactions exempt from registration only to qualified institutional buyers or in a public offering registered under the Securities Act of 1933. These securities have been deemed liquid under guidelines approved by the Trust’s Board of Trustees. At June 30, 2019 , the aggregate value of these securities was $145,843,754, representing 32.2% of net assets.
gPerpetual security with no stated maturity date.
hSecurity was purchased pursuant to Regulation S under the Securities Act of 1933, which exempts from registration securities offered and sold outside of the United States. Such a security cannot be sold in the United States without either an effective registration statement filed pursuant to the Securities Act of 1933, or pursuant to an exemption from registration. These securities have been deemed liquid under guidelines approved by the Trust’s Board of Trustees. At June 30, 2019, the aggregate value of these securities was $2,572,084, representing 0.6% of net assets.
iSecurity purchased on a when-issued basis. See Note 1(c).
jIncome may be received in additional securities and/or cash.
kSee Note 1(f) regarding loan participation notes.
lSee Note 7 regarding defaulted securities.
mThe coupon rate shown represents the rate at period end.
nSee Note 1(i) regarding senior floating rate interests.
oSecurity purchased on a delayed delivery basis. See Note 1(c).
pA portion or all of the security represents an unsettled loan commitment. The coupon rate isto-be determined (TBD) at the time of settlement and will be based upon a reference index/floor plus a spread.
qPrincipal amount is stated in 100 Mexican Peso Units.
rThe principal represents the notional amount. See Note 1(d) regarding value recovery instruments.
sPrincipal amount of security is adjusted for inflation. See Note 1(k).
tPrincipal amount is stated in 1,000 Brazilian Real Units.
uAdjustable rate security with an interest rate that is not based on a published reference index and spread. The rate is based on the structure of the agreement and current market conditions. The coupon rate shown represents the rate at period end.
vThe coupon rate shown represents the rate inclusive of any caps or floors, if applicable, in effect at period end.
wThe coupon rate will be determined at time of issue.
xAdjustable Rate Mortgage-Backed Security (ARM); the rate shown is the effective rate at period end. ARM rates are not based on a published reference rate and spread, but instead pass-through weighted average interest income inclusive of any caps or floors, if applicable, from the underlying mortgage loans in which the majority of mortgages pay interest based on the index shown at their designated reset dates plus a spread, less the applicable servicing and guaranty fee (MBS margin).
ySecurity purchased on ato-be-announced (TBA) basis. See Note 1(c).
zThe rate shown is the annualizedseven-day effective yield at period end.
At June 30, 2019, the Fund had the following futures contracts outstanding. See Note 1(d).
Futures Contracts
| | | | | | | | | | | | | | | | | | | | |
| | | | | |
| Description | | | Type | | |
| Number of
Contracts |
| |
| Notional
Amount |
* | |
| Expiration
Date |
| |
| Value/
Unrealized
Appreciation
(Depreciation) |
|
| | | | | |
| Interest Rate Contracts | | | | | | | | | | | | | | | | | | | | |
U.S. Treasury 5 Yr. Note | | | Long | | | | 70 | | | $ | 8,270,937 | | | | 9/30/19 | | | | $ 17,355 | |
U.S. Treasury 10 Yr. Note | | | Long | | | | 33 | | | | 4,222,969 | | | | 9/19/19 | | | | 48,658 | |
Ultra 10 Yr. U.S. Treasury Note | | | Long | | | | 341 | | | | 47,100,625 | | | | 9/19/19 | | | | 1,008,147 | |
| | | | | | | | | | | | | | | | | | | | |
| | | | | |
Total Futures Contracts | | | | | | | | | | | | | | | | | | | $ 1,074,160 | |
| | | | | | | | | | | | | | | | | | | | |
*As of period end.
FRANKLIN TEMPLETON VARIABLE INSURANCE PRODUCTS TRUST
CONSOLIDATED STATEMENT OF INVESTMENTS (UNAUDITED)
Franklin Strategic Income VIP Fund(continued)
At June 30, 2019, the Fund had the following forward exchange contracts outstanding. See Note 1(d).
Forward Exchange Contracts
| | | | | | | | | | | | | | | | | | | | | | | | | | | | |
| | | | | | | |
| Currency | | | Counterparty | a | | | Type | | | | Quantity | | |
| Contract
Amount |
| |
| Settlement
Date |
| |
| Unrealized
Appreciation |
| |
| Unrealized
Depreciation |
|
| |
| | | | | | |
| OTC Forward Exchange Contracts | | | | | | | | | | | | | | | | | | | | | | | | | |
Australian Dollar | | | JPHQ | | | | Sell | | | | 3,050,000 | | | $ | 2,185,432 | | | | 7/26/19 | | | | $ 42,321 | | | | $ — | |
Canadian Dollar | | | JPHQ | | | | Sell | | | | 4,000,000 | | | | 3,024,323 | | | | 7/26/19 | | | | — | | | | (31,779 | ) |
Australian Dollar | | | JPHQ | | | | Sell | | | | 1,350,000 | | | | 946,889 | | | | 8/08/19 | | | | — | | | | (2,075 | ) |
Canadian Dollar | | | JPHQ | | | | Buy | | | | 600,000 | | | | 448,229 | | | | 9/18/19 | | | | 10,556 | | | | — | |
Canadian Dollar | | | JPHQ | | | | Sell | | | | 1,500,000 | | | | 1,127,997 | | | | 9/18/19 | | | | — | | | | (18,966 | ) |
Euro | | | DBAB | | | | Sell | | | | 650,000 | | | | 733,863 | | | | 9/18/19 | | | | — | | | | (9,956 | ) |
Euro | | | JPHQ | | | | Buy | | | | 2,936,600 | | | | 3,341,366 | | | | 9/18/19 | | | | 19,092 | | | | — | |
Euro | | | JPHQ | | | | Sell | | | | 4,242,409 | | | | 4,834,384 | | | | 9/18/19 | | | | — | | | | (20,357 | ) |
Norwegian Krone | | | JPHQ | | | | Buy | | | | 25,500,000 | | | | 2,923,440 | | | | 9/18/19 | | | | 71,573 | | | | — | |
Swedish Krona | | | JPHQ | | | | Buy | | | | 13,400,000 | | | | 1,440,605 | | | | 9/18/19 | | | | 11,035 | | | | — | |
Swedish Krona | | | JPHQ | | | | Sell | | | | 13,400,000 | | | | 1,463,202 | | | | 9/18/19 | | | | 11,562 | | | | — | |
Swedish Krona | | | JPHQ | | | | Sell | | | | 27,800,000 | | | | 2,933,727 | | | | 9/18/19 | | | | — | | | | (77,884 | ) |
Swiss Franc | | | JPHQ | | | | Buy | | | | 200,000 | | | | 199,169 | | | | 9/18/19 | | | | 7,200 | | | | — | |
Swiss Franc | | | JPHQ | | | | Sell | | | | 200,000 | | | | 202,018 | | | | 9/18/19 | | | | — | | | | (4,351 | ) |
Chinese Yuan Renminbi | | | JPHQ | | | | Buy | | | | 6,600,000 | | | | 983,418 | | | | 9/27/19 | | | | — | | | | (23,529 | ) |
Chinese Yuan Renminbi | | | JPHQ | | | | Sell | | | | 12,750,000 | | | | 1,897,773 | | | | 9/27/19 | | | | 43,443 | | | | — | |
Chinese Yuan Renminbi | | | JPHQ | | | | Sell | | | | 15,500,000 | | | | 2,244,325 | | | | 9/27/19 | | | | — | | | | (9,959 | ) |
Australian Dollar | | | JPHQ | | | | Sell | | | | 1,300,000 | | | | 895,817 | | | | 10/11/19 | | | | — | | | | (19,476 | ) |
Australian Dollar | | | JPHQ | | | | Sell | | | | 2,000,000 | | | | 1,438,914 | | | | 10/11/19 | | | | 30,772 | | | | — | |
Turkish Lira | | | JPHQ | | | | Buy | | | | 5,800,000 | | | | 892,239 | | | | 10/18/19 | | | | 52,463 | | | | — | |
Indonesian Rupiah | | | JPHQ | | | | Sell | | | | 7,200,000,000 | | | | 491,199 | | | | 12/13/19 | | | | — | | | | (7,667 | ) |
Mexican Peso | | | JPHQ | | | | Buy | | | | 1,300,000 | | | | 65,853 | | | | 12/16/19 | | | | — | | | | (85 | ) |
South Korean Won | | | JPHQ | | | | Sell | | | | 1,700,000,000 | | | | 1,453,054 | | | | 12/16/19 | | | | — | | | | (23,994 | ) |
| | | | | | | | | | | | | | | | | | | | | | | | |
| | | | | |
Total Forward Exchange Contracts | | | | | | | | | | | | | | | | $ 300,017 | | | | $ (250,078 | ) |
| | | | | | | | | | | | | | | | | | | | | | | | |
| | | | | |
Net unrealized appreciation (depreciation) | | | | | | | | | | | | | | | | $ 49,939 | | | | | |
| | | | | | | | | | | | | | | | | | | | | | | | | | | | |
aMay be comprised of multiple contracts with the same counterparty, currency and settlement date.
At June 30, 2019, the Fund had the following credit default swap contracts outstanding. See Note 1(d).
Credit Default Swap Contracts
| | | | | | | | | | | | | | | | | | | | | | | | | | | | | | | | | | | | |
| | | | | | | | | |
| Description | |
| Periodic
Payment Rate
Received
(Paid) |
| |
| Payment
Frequency |
| |
| Counter-
party |
| |
| Maturity
Date |
| |
| Notional
Amount |
a | | | Value | | |
| Unamortized
Upfront
Payments
(Receipts) |
| |
| Unrealized
Appreciation
(Depreciation) |
| | | Ratingb | |
Centrally Cleared Swap Contracts | | | | | | | | | | | | | | | | | | | | | | | | | | | | | | | | | | | | |
Contracts to Sell Protectionc,d | | | | | | | | | | | | | | | | | | | | | | | | | | | | | | | | | | | | |
Traded Index | | | | | | | | | | | | | | | | | | | | | | | | | | | | | | | | | | | | |
CDX.EM.30 | | | 1.00% | | | | Quarterly | | | | | | | | 12/20/23 | | | | $5,200,000 | | | | $(147,820) | | | | $(199,488) | | | | $ 51,668 | | | | Investment | |
| | | | | | | | | | | | | | | | | | | | | | | | | | | | |
| | | | | | | | | | | | | | | | | | | | | | | | | | | | | | | | | | | Grade | |
OTC Swap Contracts | | | | | | | | | | | | | | | | | | | | | | | | | | | | | | | | | | | | |
Contracts to Buy Protectionc | | | | | | | | | | | | | | | | | | | | | | | | | | | | | | | | | | | | |
Single Name | | | | | | | | | | | | | | | | | | | | | | | | | | | | | | | | | | | | |
Ally Financial Inc. | | | (5.00)% | | | | Quarterly | | | | JPHQ | | | | 6/20/24 | | | | $1,810,000 | | | | $(329,739) | | | | $(284,905) | | | | $(44,834) | | | | | |
FRANKLIN TEMPLETON VARIABLE INSURANCE PRODUCTS TRUST
CONSOLIDATED STATEMENT OF INVESTMENTS (UNAUDITED)
Franklin Strategic Income VIP Fund(continued)
Credit Default Swap Contracts(continued)
| | | | | | | | | | | | | | | | | | | | | | | | | | | | | | | | | | | | |
| | | | | | | | | |
| Description | |
| Periodic
Payment Rate
Received
(Paid) |
| |
| Payment
Frequency |
| |
| Counter-
party |
| |
| Maturity
Date |
| |
| Notional
Amount |
a | | | Value | | |
| Unamortized
Upfront
Payments
(Receipts) |
| |
| Unrealized
Appreciation
(Depreciation) |
| | | Ratingb | |
| | | | | | | |
OTC Swap Contracts(continued) | | | | | | | | | | | | | | | | | | | | | | | | | | | | | |
Contracts to Buy Protectionc(continued) | | | | | | | | | | | | | | | | | | | | | | | | | | | | | |
Single Name(continued) | | | | | | | | | | | | | | | | | | | | | | | | | | | | | |
Government of Italy | | | (1.00) | % | | | Quarterly | | | | BZWS | | | | 6/20/23 | | | $ | 1,500,000 | | | $ | 10,721 | | | | $ 12,984 | | | | $ (2,263) | | | | | |
Government of Turkey | | | (1.00) | % | | | Quarterly | | | | BZWS | | | | 12/20/19 | | | | 966,667 | | | | 4,905 | | | | 21,398 | | | | (16,493) | | | | | |
Contracts to Sell Protectionc,d | | | | | | | | | | | | | | | | | | | | | | | | | | | | | |
Single Name | | | | | | | | | | | | | | | | | | | | | | | | | | | | | | | | | | | | |
Government of Argentina | | | 5.00 | % | | | Quarterly | | | | MSCO | | | | 6/20/23 | | | | 4,300,000 | | | | (621,435) | | | | 341,249 | | | | (962,684) | | | | B | |
Government of Indonesia | | | 1.00 | % | | | Quarterly | | | | CITI | | | | 6/20/24 | | | | 2,300,000 | | | | 10,819 | | | | (7,458) | | | | 18,277 | | | | BBB | |
Government of Italy | | | 1.00 | % | | | Quarterly | | | | BZWS | | | | 6/20/23 | | | | 1,500,000 | | | | (42,487) | | | | (56,937) | | | | 14,450 | | | | NR | |
Government of Russia | | | 1.00 | % | | | Quarterly | | | | BNDP | | | | 6/20/24 | | | | 1,300,000 | | | | (8,045) | | | | (16,773) | | | | 8,728 | | | | BBB- | |
Traded Index | | | | | | | | | | | | | | | | | | | | | | | | | | | | | |
eBNP Paribas Bespoke Bordeaux Index, Mezzanine Tranche7-10% | | | 2.10 | % | | | Quarterly | | | | BNDP | | | | 6/20/20 | | | | 750,000 | | | | 5,132 | | | | — | | | | 5,132 | | | | Non- | |
| | | | | | | | | | | | | | | | | | | | | | | | | | | | | | | | | | | Investment | |
| | | | | | | | | | | | | | | | | | | | | | | | | | | | | | | | | | | Grade | |
eBNP Paribas Bespoke Rodez2 Index, Mezzanine Tranche5-7% | | | 3.20 | % | | | Quarterly | | | | BNDP | | | | 12/20/20 | | | | 300,000 | | | | 5,467 | | | | — | | | | 5,467 | | | | Non- | |
| | | | | | | | | | | | | | | | | | | | | | | | | | | | | | | | | | | Investment | |
| | | | | | | | | | | | | | | | | | | | | | | | | | | | | | | | | | | Grade | |
eCitibank Bespoke Bogota Index, Mezzanine Tranche7-10% | | | 1.35 | % | | | Quarterly | | | | CITI | | | | 6/20/20 | | | | 750,000 | | | | 1,790 | | | | — | | | | 1,790 | | | | Non- | |
| | | | | | | | | | | | | | | | | | | | | | | | | | | | | | | | | | | Investment | |
| | | | | | | | | | | | | | | | | | | | | | | | | | | | | | | | | | | Grade | |
eCitibank Bespoke Cambridge Index, Equity Tranche0-3% | | | 0.00 | % | | | Quarterly | | | | CITI | | | | 12/20/19 | | | | 2,900,000 | | | | (682,788) | | | | (112,511) | | | | (570,277) | | | | Non- | |
| | | | | | | | | | | | | | | | | | | | | | | | | | | | | | | | | | | Investment | |
| | | | | | | | | | | | | | | | | | | | | | | | | | | | | | | | | | | Grade | |
eCitibank Bespoke Palma Index, Mezzanine Tranche5-7% | | | 2.30 | % | | | Quarterly | | | | CITI | | | | 6/20/21 | | | | 620,000 | | | | 3,957 | | | | — | | | | 3,957 | | | | Non- | |
| | | | | | | | | | | | | | | | | | | | | | | | | | | | | | | | | | | Investment | |
| | | | | | | | | | | | | | | | | | | | | | | | | | | | | | | | | | | Grade | |
eCitibank Bespoke Singapore Index, Equity Tranche0-3% | | | 0.00 | % | | | Quarterly | | | | CITI | | | | 6/20/20 | | | | 300,000 | | | | (49,137) | | | | (40,828) | | | | (8,309) | | | | Non- | |
| | | | | | | | | | | | | | | | | | | | | | | | | | | | | | | | | | | Investment | |
| | | | | | | | | | | | | | | | | | | | | | | | | | | | | | | | | | | Grade | |
eCitibank Bespoke Sydney Index, Equity Tranche0-3% | | | 0.00 | % | | | Quarterly | | | | CITI | | | | 6/20/20 | | | | 450,000 | | | | (140,317) | | | | (69,915) | | | | (70,402) | | | | Non- | |
| | | | | | | | | | | | | | | | | | | | | | | | | | | | | | | | | | | Investment | |
| | | | | | | | | | | | | | | | | | | | | | | | | | | | | | | | | | | Grade | |
eCitibank Bespoke Verona Index, Equity Tranche0-3% | | | 0.00 | % | | | Quarterly | | | | CITI | | | | 12/20/19 | | | | 1,100,000 | | | | (227,784) | | | | (52,386) | | | | (175,398) | | | | Non- | |
| | | | | | | | | | | | | | | | | | | | | | | | | | | | | | | | | | | Investment | |
| | | | | | | | | | | | | | | | | | | | | | | | | | | | | | | | | | | Grade | |
FRANKLIN TEMPLETON VARIABLE INSURANCE PRODUCTS TRUST
CONSOLIDATED STATEMENT OF INVESTMENTS (UNAUDITED)
Franklin Strategic Income VIP Fund(continued)
Credit Default Swap Contracts(continued)
| | | | | | | | | | | | | | | | | | | | | | | | | | | | | | | | | | | | |
| | | | | | | | | |
| Description | |
| Periodic
Payment Rate
Received
(Paid) |
| |
| Payment
Frequency |
| |
| Counter-
party |
| |
| Maturity
Date |
| |
| Notional
Amount |
a | | | Value | | |
| Unamortized
Upfront
Payments
(Receipts) |
| |
| Unrealized
Appreciation
(Depreciation) |
| | | Ratingb | |
| | | | | | | |
OTC Swap Contracts(continued) | | | | | | | | | | | | | | | | | | | | | | | | | | | | | |
Contracts to Sell Protectionc,d(continued) | | | | | | | | | | | | | | | | | | | | | | | | | | | | | |
Traded Index(continued) | | | | | | | | | | | | | | | | | | | | | | | | | | | | | |
eCitibank Bespoke Verona Index, Mezzanine Tranche7-15% | | | 0.40% | | | | Quarterly | | | | CITI | | | | 12/20/19 | | | $ | 3,100,000 | | | $ | 2,857 | | | $ | — | | | $ | 2,857 | | | | Non- | |
| | | | | | | | | | | | | | | | | | | | | | | | | | | | | | | | | | | Investment | |
| | | | | | | | | | | | | | | | | | | | | | | | | | | | | | | | | | | Grade | |
MCDX.NA.31 | | | 1.00% | | | | Quarterly | | | | CITI | | | | 12/20/23 | | | | 2,270,000 | | | | 44,185 | | | | 20,573 | | | | 23,612 | | | | Investment | |
| | | | | | | | | | | | | | | | | | | | | | | | | | | | | | | | | | | Grade | |
eMorgan Stanley Bespoke Pecan Index, Mezzanine Tranche5-10% | | | 4.10% | | | | Quarterly | | | | MSCO | | | | 12/20/21 | | | | 850,000 | | | | 13,073 | | | | — | | | | 13,073 | | | | Non- | |
| | | | | | | | | | | | | | | | | | | | | | | | | | | | | | | | | | | Investment | |
| | | | | | | | | | | | | | | | | | | | | | | | | | | | | | | | | | | Grade | |
eMorgan Stanley Bespoke Pecan Index, Mezzanine Tranche5-10% | | | 3.98% | | | | Quarterly | | | | MSCO | | | | 12/20/21 | | | | 850,000 | | | | 13,713 | | | | — | | | | 13,713 | | | | Non- | |
| | | | | | | | | | | | | | | | | | | | | | | | | | | | |
| | | | | | | | | | | | | | | | | | | | | | | | | | | | | | | | | | | Investment | |
| | | | | | | | | | | | | | | | | | | | | | | | | | | | | | | | | | | Grade | |
Total OTC Swap Contracts | | | | | | | | | | | | | | | $ | (1,985,113) | | | $ | (245,509) | | | $ | (1,739,604) | | | | | |
| | | | | | | | | | | | | | | | | | | | | | | | | | | | |
| | | | | | | |
Total Credit Default Swap Contracts | | | | | | | | | | | | | | | $ | (2,132,933) | | | $ | (444,997) | | | $ | (1,687,936) | | | | | |
| | | | | | | | | | | | | | | | | | | | | | | | | | | | |
aFor contracts to sell protection, the notional amount is equal to the maximum potential amount of the future payments and no recourse provisions have been entered into in association with the contracts.
bBased on Standard and Poor’s (S&P) Rating for single name swaps and internal ratings for index swaps. Internal ratings based on mapping into equivalent ratings from external vendors.
cPerformance triggers for settlement of contract include default, bankruptcy or restructuring for single name swaps and failure to pay or bankruptcy of the underlying securities for traded index swaps.
dThe fund enters contracts to sell protection to create a long credit position.
eRepresents a custom index comprised of a basket of underlying instruments.
At June 30, 2019, the Fund had the following cross-currency swap contracts outstanding. See Note 1(d).
Cross-Currency Swap Contracts
| | | | | | | | | | | | | | | | | | | | | | | | |
| | | | | | |
| Description | | Payment
Frequency | | | Coun-
terparty | | | Maturity Date | | | Notional
Amount | | | | | | Value/
Unrealized
Appreciation
(Depreciation) | |
| | | | | | |
OTC Swap Contracts | | | | | | | | | | | | | | | | | | | | | | | | |
Receive Floating3-month USD LIBOR + 2.87% | | | Quarterly | | | | | | | | | | | | 464,800 | | | | USD | | | | | |
Pay Fixed 2.50% | | | Annual | | | | CITI | | | | 5/04/21 | | | | 400,000 | | | | EUR | | | | $9,751 | |
| | | | | | | | | | | | | | | | | | | | | | | | |
FRANKLIN TEMPLETON VARIABLE INSURANCE PRODUCTS TRUST
CONSOLIDATED STATEMENT OF INVESTMENTS (UNAUDITED)
Franklin Strategic Income VIP Fund(continued)
At June 30, 2019, the Fund had the following total return swap contracts outstanding. See Note 1(d).
Total Return Swap Contracts
| | | | | | | | | | | | | | | | | | | | | | | | |
| | | | | | |
| Underlying Instruments | | Financing Rate | | | Payment
Frequency | | | Counter-
party | | | Maturity
Date | | | Notional
Value | | | Value/
Unrealized
Appreciation
(Depreciation) | |
| | | | | | |
OTC Swap Contracts | | | | | | | | | | | | | | | | | | | | | | | | |
Longa | | | | | | | | | | | | | | | | | | | | | | | | |
Markit iBoxx USD Liquid Leveraged Loan Index | | | 3-month USD LIBOR | | | | Quarterly | | | | JPHQ | | | | 12/20/19 | | | | $ 600,000 | | | | $ 824 | |
Markit iBoxx USD Liquid Leveraged Loan Index | | | 3-month USD LIBOR | | | | Quarterly | | | | MSCO | | | | 12/20/19 | | | | 700,000 | | | | 5,399 | |
Markit iBoxx USD Liquid Leveraged Loan Index | | | 3-month USD LIBOR | | | | Quarterly | | | | FBCO | | | | 3/20/20 | | | | 750,000 | | | | 3,381 | |
Markit iBoxx USD Liquid Leveraged Loan Index | | | 3-month USD LIBOR | | | | Quarterly | | | | GSCO | | | | 3/20/20 | | | | 1,100,000 | | | | 9,385 | |
| | | | | | | | | | | | | | | | | | | | | | | | |
| | | | | | |
Total Total Return Swap Contracts | | | | | | | | | | | | | | | | | | | | | | | $18,989 | |
| | | | | | | | | | | | | | | | | | | | | | | | |
aThe Fund receives the total return on the underlying instrument and pays a variable financing rate.
See Note 9 regarding other derivative information.
See Abbreviations on pageFSI-54.
| | | | |
| | | |
FSI-34 | | Semiannual Report | | | The accompanying notes are an integral part of these consolidated financial statements. |
FRANKLIN TEMPLETON VARIABLE INSURANCE PRODUCTS TRUST
CONSOLIDATED FINANCIAL STATEMENTS
Consolidated Statement of Assets and Liabilities
June 30, 2019 (unaudited)
| | | | |
| | | Franklin Strategic
Income VIP Fund | |
Assets: | | | | |
Investments in securities: | | | | |
Cost - Unaffiliated issuers | | | $446,193,628 | |
Cost -Non-controlled affiliates (Note 3e) | | | 20,744,579 | |
| | | | |
| |
Value - Unaffiliated issuers | | | $439,423,790 | |
Value -Non-controlled affiliates (Note 3e) | | | 19,021,785 | |
| |
Cash | | | 7,697,525 | |
Restricted cash for OTC derivative contracts (Note 1e) | | | 110,000 | |
Foreign currency, at value (cost $52,370) | | | 52,370 | |
Receivables: | | | | |
Investment securities sold | | | 173,988 | |
Capital shares sold. | | | 173,398 | |
Dividends and interest | | | 3,861,100 | |
Deposits with brokers for: | | | | |
OTC derivative contracts | | | 1,680,000 | |
Futures contracts | | | 524,150 | |
Centrally cleared swap contracts | | | 839,188 | |
Variation margin on futures contracts | | | 11,688 | |
Variation margin on centrally cleared swap contracts | | | 2,422 | |
OTC swap contracts (upfront payments $551,403) | | | 396,204 | |
Unrealized appreciation on OTC forward exchange contracts | | | 300,017 | |
Unrealized appreciation on OTC swap contracts | | | 139,796 | |
FT Subsidiary deferred tax benefit (Note 1g) | | | 181,227 | |
Other assets | | | 316 | |
| | | | |
| |
Total assets | | | 474,588,964 | |
| | | | |
| |
Liabilities: | | | | |
Payables: | | | | |
Investment securities purchased | | | 16,883,959 | |
Capital shares redeemed | | | 839,398 | |
Management fees | | | 224,965 | |
Distribution fees | | | 72,794 | |
Trustees’ fees and expenses | | | 857 | |
Deposits from brokers for: | | | | |
OTC derivative contracts | | | 110,000 | |
OTC swap contracts (upfront receipts $1,299,682) | | | 641,713 | |
Unrealized depreciation on OTC forward exchange contracts | | | 250,078 | |
Unrealized depreciation on OTC swap contracts | | | 1,850,660 | |
Deferred tax | | | 22,442 | |
Accrued expenses and other liabilities | | | 166,874 | |
| | | | |
| |
Total liabilities | | | 21,063,740 | |
| | | | |
| |
Net assets, at value | | | $453,525,224 | |
| | | | |
| |
Net assets consist of: | | | | |
Paid-in capital | | | $487,808,916 | |
Total distributable earnings (loss) | | | (34,283,692 | ) |
| | | | |
| |
Net assets, at value | | | $453,525,224 | |
| | | | |
| | | | | | |
| | | |
| | The accompanying notes are an integral part of these consolidated financial statements. | Semiannual Report | | | FSI-35 | |
FRANKLIN TEMPLETON VARIABLE INSURANCE PRODUCTS TRUST
CONSOLIDATED FINANCIAL STATEMENTS
Consolidated Statement of Assets and Liabilities(continued)
June 30, 2019 (unaudited)
| | | | |
| | | Franklin Strategic
Income VIP Fund | |
| |
| Class 1: | | | | |
Net assets, at value | | | $302,060,958 | |
| | | | |
Shares outstanding | | | 28,008,421 | |
| | | | |
Net asset value and maximum offering price per share | | | $10.78 | |
| | | | |
| Class 2: | | | | |
Net assets, at value | | | $ 92,190,615 | |
| | | | |
Shares outstanding | | | 8,844,521 | |
| | | | |
Net asset value and maximum offering price per share | | | $10.42 | |
| | | | |
| Class 4: | | | | |
Net assets, at value | | | $ 59,273,651 | |
| | | | |
Shares outstanding | | | 5,535,613 | |
| | | | |
Net asset value and maximum offering price per share | | | $10.71 | |
| | | | |
| | | | |
| | |
FSI-36 | | Semiannual Report | The accompanying notes are an integral part of these consolidated financial statements. |
FRANKLIN TEMPLETON VARIABLE INSURANCE PRODUCTS TRUST
CONSOLIDATED FINANCIAL STATEMENTS
Consolidated Statement of Operations
for the six months ended June 30, 2019 (unaudited)
| | | | |
| | | Franklin Strategic
Income VIP Fund | |
| |
Investment income: | | | | |
Dividends: | | | | |
Non-controlled affiliates (Note 3e) | | | $ 950,855 | |
Interest: (net of foreign taxes)~ | | | | |
Unaffiliated issuers | | | 10,282,607 | |
| | | | |
| |
Total investment income | | | 11,233,462 | |
| | | | |
| |
Expenses: | | | | |
Management fees (Note 3a) | | | 1,404,208 | |
Distribution fees: (Note 3c) | | | | |
Class 2 | | | 111,460 | |
Class 4 | | | 102,523 | |
Custodian fees (Note 4) | | | 5,708 | |
Reports to shareholders | | | 73,872 | |
Professional fees | | | 55,275 | |
Trustees’ fees and expenses | | | 2,274 | |
Other | | | 34,623 | |
| | | | |
| |
Total expenses | | | 1,789,943 | |
Expense reductions (Note 4) | | | (4,401 | ) |
Expenses waived/paid by affiliates (Note 3e) | | | (71,107 | ) |
| | | | |
| |
Net expenses | | | 1,714,435 | |
| | | | |
| |
Net investment income | | | 9,519,027 | |
| | | | |
| |
Realized and unrealized gains (losses): | | | | |
Net realized gain (loss) from: | | | | |
Investments: | | | | |
Unaffiliated issuers | | | (424,838 | ) |
Non-controlled affiliates (Note 3e) | | | (1,769,646 | ) |
Foreign currency transactions | | | 11,307 | |
Forward exchange contracts | | | 316,816 | |
Futures contracts | | | 1,609,018 | |
Swap contracts | | | 1,771,132 | |
| | | | |
| |
Net realized gain (loss) | | | 1,513,789 | |
| | | | |
| |
Net change in unrealized appreciation (depreciation) on: | | | | |
Investments: | | | | |
Unaffiliated issuers | | | 17,908,048 | |
Non-controlled affiliates (Note 3e) | | | 586,351 | |
Translation of other assets and liabilities denominated in foreign currencies | | | (20,151 | ) |
Forward exchange contracts | | | (212,811 | ) |
Futures contracts | | | 382,479 | |
Swap contracts | | | 408,595 | |
Change in deferred taxes on unrealized appreciation | | | (14,081 | ) |
| | | | |
| |
Net change in unrealized appreciation (depreciation) | | | 19,038,430 | |
| | | | |
| |
Net realized and unrealized gain (loss) | | | 20,552,219 | |
| | | | |
| |
Net increase (decrease) in net assets resulting from operations | | | $30,071,246 | |
| | | | |
| |
~Foreign taxes withheld on interest | | | $ 12,493 | |
| | | | | | |
| | | |
| | The accompanying notes are an integral part of these consolidated financial statements. | Semiannual Report | | | FSI-37 | |
FRANKLIN TEMPLETON VARIABLE INSURANCE PRODUCTS TRUST
CONSOLIDATED FINANCIAL STATEMENTS
Consolidated Statements of Changes in Net Assets
for the six months ended June 30, 2019 (unaudited)
| | | | | | | | |
| | | Franklin Strategic Income VIP Fund | |
| | | Six Months Ended
June 30, 2019
(unaudited) | | | Year Ended
December 31, 2018 | |
| | |
Increase (decrease) in net assets: | | | | | | | | |
Operations: | | | | | | | | |
Net investment income | | | $ 9,519,027 | | | | $ 24,508,744 | |
Net realized gain (loss) | | | 1,513,789 | | | | (9,616,538 | ) |
Net change in unrealized appreciation (depreciation) | | | 19,038,430 | | | | (23,561,419 | ) |
| | | | |
| | |
Net increase (decrease) in net assets resulting from operations | | | 30,071,246 | | | | (8,669,213 | ) |
| | | | |
| | |
Distributions to shareholders: | | | | | | | | |
Class 1 | | | (16,055,733 | ) | | | (9,703,924 | ) |
Class 2 | | | (4,608,498 | ) | | | (5,724,625 | ) |
Class 4 | | | (2,951,572 | ) | | | (1,690,861 | ) |
| | | | |
| | |
Total distributions to shareholders | | | (23,615,803 | ) | | | (17,119,410 | ) |
| | | | |
| | |
Capital share transactions: (Note 2) | | | | | | | | |
Class 1 | | | (4,794,924 | ) | | | (43,986,518 | ) |
Class 2 | | | 1,616,075 | | | | (117,066,128 | ) |
Class 4 | | | (2,387,529 | ) | | | (10,271,574 | ) |
| | | | |
| | |
Total capital share transactions | | | (5,566,378 | ) | | | (171,324,220 | ) |
| | | | |
| | |
Net increase (decrease) in net assets | | | 889,065 | | | | (197,112,843 | ) |
Net assets: | | | | | | | | |
Beginning of period | | | 452,636,159 | | | | 649,749,002 | |
| | | | |
| | |
End of period | | | $453,525,224 | | | | $452,636,159 | |
| | | | |
| | | | |
| | |
FSI-38 | | Semiannual Report | The accompanying notes are an integral part of these consolidated financial statements. |
FRANKLIN TEMPLETON VARIABLE INSURANCE PRODUCTS TRUST
Notes to Consolidated Financial Statements (unaudited)
Franklin Strategic Income VIP Fund
1. Organization and Significant Accounting Policies
Franklin Templeton Variable Insurance Products Trust (Trust) is registered under the Investment Company Act of 1940 (1940 Act) as anopen-end management investment company, consisting of eighteen separate funds and applies the specialized accounting and reporting guidance in U.S. Generally Accepted Accounting Principles (U.S. GAAP). Franklin Strategic Income VIP Fund (Fund) is included in this report. Shares of the Fund are generally sold only to insurance company separate accounts to fund the benefits of variable life insurance policies or variable annuity contracts. At June 30, 2019, 80.6% of the Fund’s shares were held through one insurance company. Investment activities of these insurance company separate accounts could have a material impact on the Fund. The Fund offers three classes of shares: Class 1, Class 2 and Class 4. Each class of shares may differ by its distribution fees, voting rights on matters affecting a single class and its exchange privilege.
The following summarizes the Fund’s significant accounting policies.
a. Financial Instrument Valuation
The Fund’s investments in financial instruments are carried at fair value daily. Fair value is the price that would be received to sell an asset or paid to transfer a liability in an orderly transaction between market participants on the measurement date. The Fund calculates the net asset value (NAV) per share each business day as of 4 p.m. Eastern time or the regularly scheduled close of the New York Stock Exchange (NYSE), whichever is earlier. Under compliance policies and procedures approved by the Trust’s Board of Trustees (the Board), the Fund’s administrator has responsibility for oversight of valuation, including leading the cross-functional Valuation Committee (VC). The Fund may utilize independent pricing services, quotations from securities and financial instrument dealers, and other market sources to determine fair value.
Equity securities and derivative financial instruments listed on an exchange or on the NASDAQ National Market System are valued at the last quoted sale price or the official closing price of the day, respectively. Foreign equity securities are valued as of the close of trading on the foreign stock exchange on which the security is primarily traded, or as of 4 p.m. Eastern time. The value is then converted into its U.S. dollar equivalent at the foreign exchange rate in effect at 4 p.m. Eastern time on the day that the value of the security is
determined.Over-the-counter (OTC) securities are valued within the range of the most recent quoted bid and ask prices. Securities that trade in multiple markets or on multiple exchanges are valued according to the broadest and most representative market. Certain equity securities are valued based upon fundamental characteristics or relationships to similar securities.
Debt securities generally trade in the OTC market rather than on a securities exchange. The Fund’s pricing services use multiple valuation techniques to determine fair value. In instances where sufficient market activity exists, the pricing services may utilize a market-based approach through which quotes from market makers are used to determine fair value. In instances where sufficient market activity may not exist or is limited, the pricing services also utilize proprietary valuation models which may consider market characteristics such as benchmark yield curves, credit spreads, estimated default rates, anticipated market interest rate volatility, coupon rates, anticipated timing of principal repayments, underlying collateral, and other unique security features in order to estimate the relevant cash flows, which are then discounted to calculate the fair value. Securities denominated in a foreign currency are converted into their U.S. dollar equivalent at the foreign exchange rate in effect at 4 p.m. Eastern time on the date that the values of the foreign debt securities are determined.
Investments inopen-end mutual funds are valued at the closing NAV.
Certain derivative financial instruments are centrally cleared or trade in the OTC market. The Fund’s pricing services use various techniques including industry standard option pricing models and proprietary discounted cash flow models to determine the fair value of those instruments. The Fund’s net benefit or obligation under the derivative contract, as measured by the fair value of the contract, is included in net assets.
The Fund has procedures to determine the fair value of financial instruments for which market prices are not reliable or readily available. Under these procedures, the Fund primarily employs a market-based approach which may use related or comparable assets or liabilities, recent transactions, market multiples, book values, and other relevant information for the investment to determine the fair value of the investment. An income-based valuation approach may also be used in which the anticipated future cash flows of the
FRANKLIN TEMPLETON VARIABLE INSURANCE PRODUCTS TRUST
NOTES TO CONSOLIDATED FINANCIAL STATEMENTS (UNAUDITED)
Franklin Strategic Income VIP Fund(continued)
1. Organization and Significant Accounting Policies(continued)
a. Financial Instrument Valuation(continued)
investment are discounted to calculate fair value. Discounts may also be applied due to the nature or duration of any restrictions on the disposition of the investments. Due to the inherent uncertainty of valuations of such investments, the fair values may differ significantly from the values that would have been used had an active market existed.
Trading in securities on foreign securities stock exchanges and OTC markets may be completed before 4 p.m. Eastern time. In addition, trading in certain foreign markets may not take place on every Fund’s business day. Occasionally, events occur between the time at which trading in a foreign security is completed and 4 p.m. Eastern time that might call into question the reliability of the value of a portfolio security held by the Fund. As a result, differences may arise between the value of the Fund’s portfolio securities as determined at the foreign market close and the latest indications of value at 4 p.m. Eastern time. In order to minimize the potential for these differences, the VC monitors price movements following the close of trading in foreign stock markets through a series of country specific market proxies (such as baskets of American Depositary Receipts, futures contracts and exchange traded funds). These price movements are measured against established trigger thresholds for each specific market proxy to assist in determining if an event has occurred that may call into question the reliability of the values of the foreign securities held by the Fund. If such an event occurs, the securities may be valued using fair value procedures, which may include the use of independent pricing services.
When the last day of the reporting period is anon-business day, certain foreign markets may be open on those days that the Fund’s NAV is not calculated, which could result in differences between the value of the Fund’s portfolio securities on the last business day and the last calendar day of the reporting period. Any significant security valuation changes due to an open foreign market are adjusted and reflected by the Fund for financial reporting purposes.
b. Foreign Currency Translation
Portfolio securities and other assets and liabilities denominated in foreign currencies are translated into U.S. dollars based on the exchange rate of such currencies
against U.S. dollars on the date of valuation. The Fund may enter into foreign currency exchange contracts to facilitate transactions denominated in a foreign currency. Purchases and sales of securities, income and expense items denominated in foreign currencies are translated into U.S. dollars at the exchange rate in effect on the transaction date. Portfolio securities and assets and liabilities denominated in foreign currencies contain risks that those currencies will decline in value relative to the U.S. dollar. Occasionally, events may impact the availability or reliability of foreign exchange rates used to convert the U.S. dollar equivalent value. If such an event occurs, the foreign exchange rate will be valued at fair value using procedures established and approved by the Board.
The Fund does not separately report the effect of changes in foreign exchange rates from changes in market prices on securities held. Such changes are included in net realized and unrealized gain or loss from investments in the Consolidated Statement of Operations.
Realized foreign exchange gains or losses arise from sales of foreign currencies, currency gains or losses realized between the trade and settlement dates on securities transactions and the difference between the recorded amounts of dividends, interest, and foreign withholding taxes and the U.S. dollar equivalent of the amounts actually received or paid. Net unrealized foreign exchange gains and losses arise from changes in foreign exchange rates on foreign denominated assets and liabilities other than investments in securities held at the end of the reporting period.
c. Securities Purchased on a When-Issued or Delayed Delivery and TBA Basis
The Fund purchases securities on a when-issued or delayed delivery andto-be-announced (TBA) basis, with payment and delivery scheduled for a future date. These transactions are subject to market fluctuations and are subject to the risk that the value at delivery may be more or less than the trade date purchase price. Although the Fund will generally purchase these securities with the intention of holding the securities, it may sell the securities before the settlement date. Sufficient assets have been segregated for these securities.
d. Derivative Financial Instruments
The Fund invested in derivative financial instruments in order to manage risk or gain exposure to various other investments or markets. Derivatives are financial contracts based on an
FRANKLIN TEMPLETON VARIABLE INSURANCE PRODUCTS TRUST
NOTES TO CONSOLIDATED FINANCIAL STATEMENTS (UNAUDITED)
Franklin Strategic Income VIP Fund(continued)
underlying or notional amount, require no initial investment or an initial net investment that is smaller than would normally be required to have a similar response to changes in market factors, and require or permit net settlement. Derivatives contain various risks including the potential inability of the counterparty to fulfill their obligations under the terms of the contract, the potential for an illiquid secondary market, and/or the potential for market movements which expose the Fund to gains or losses in excess of the amounts shown in the Consolidated Statement of Assets and Liabilities. Realized gain and loss and unrealized appreciation and depreciation on these contracts for the period are included in the Consolidated Statement of Operations.
Derivative counterparty credit risk is managed through a formal evaluation of the creditworthiness of all potential counterparties. The Fund attempts to reduce its exposure to counterparty credit risk on OTC derivatives, whenever possible, by entering into International Swaps and Derivatives Association (ISDA) master agreements with certain counterparties. These agreements contain various provisions, including but not limited to collateral requirements, events of default, or early termination. Termination events applicable to the counterparty include certain deteriorations in the credit quality of the counterparty. Termination events applicable to the Fund include failure of the Fund to maintain certain net asset levels and/or limit the decline in net assets over various periods of time. In the event of default or early termination, the ISDA master agreement gives thenon-defaulting party the right to net andclose-out all transactions traded, whether or not arising under the ISDA agreement, to one net amount payable by one counterparty to the other. However, absent an event of default or early termination, OTC derivative assets and liabilities are presented gross and not offset in the Consolidated Statement of Assets and Liabilities. Early termination by the counterparty may result in an immediate payment by the Fund of any net liability owed to that counterparty under the ISDA agreement.
Collateral requirements differ by type of derivative. Collateral or initial margin requirements are set by the broker or exchange clearing house for exchange traded and centrally cleared derivatives. Initial margin deposited is held at the exchange and can be in the form of cash and/or securities. For OTC derivatives traded under an ISDA master agreement, posting of collateral is required by either the Fund or the applicable counterparty if the total net exposure of all OTC derivatives with the applicable counterparty exceeds the minimum transfer amount, which typically ranges from
$100,000 to $250,000, and can vary depending on the counterparty and the type of the agreement. Generally, collateral is determined at the close of Fund business each day and any additional collateral required due to changes in derivative values may be delivered by the Fund or the counterparty the next business day, or within a few business days. Collateral pledged and/or received by the Fund for OTC derivatives, if any, is held in segregated accounts with the Fund’s custodian/counterparty broker and can be in the form of cash and/or securities. Unrestricted cash may be invested according to the Fund’s investment objectives. To the extent that the amounts due to the Fund from its counterparties are not subject to collateralization or are not fully collateralized, the Fund bears the risk of loss from counterpartynon-performance.
The Fund entered into exchange traded futures contracts primarily to manage and/or gain exposure to interest rate risk. A futures contract is an agreement between the Fund and a counterparty to buy or sell an asset at a specified price on a future date. Required initial margins are pledged by the Fund, and the daily change in fair value is accounted for as a variation margin payable or receivable.
The Fund entered into OTC forward exchange contracts primarily to manage and/or gain exposure to certain foreign currencies. A forward exchange contract is an agreement between the Fund and a counterparty to buy or sell a foreign currency at a specific exchange rate on a future date.
The Fund entered into credit default swap contracts primarily to manage and/or gain exposure to credit risk. A credit default swap is an agreement between the Fund and a counterparty whereby the buyer of the contract receives credit protection and the seller of the contract guarantees the credit worthiness of a referenced debt obligation. These agreements may be privately negotiated in theover-the-counter market (OTC credit default swaps) or may be executed in a multilateral trade facility platform, such as a registered exchange (centrally cleared credit default swaps). The underlying referenced debt obligation may be a single issuer of corporate or sovereign debt, a credit index, a basket of issuers or indices, or a tranche of a credit index or basket of issuers or indices. In the event of a default of the underlying referenced debt obligation, the buyer is entitled to receive the notional amount of the credit default swap contract from the seller in exchange for the referenced debt obligation, a net settlement amount equal to the notional amount of the credit default swap less the recovery value of
FRANKLIN TEMPLETON VARIABLE INSURANCE PRODUCTS TRUST
NOTES TO CONSOLIDATED FINANCIAL STATEMENTS (UNAUDITED)
Franklin Strategic Income VIP Fund(continued)
1. Organization and Significant Accounting Policies(continued)
d. Derivative Financial Instruments(continued)
the referenced debt obligation, or other agreed upon amount. For centrally cleared credit default swaps, required initial margins are pledged by the Fund, and the daily change in fair value is accounted for as a variation margin payable or receivable in the Consolidated Statement of Assets and Liabilities. Over the term of the contract, the buyer pays the seller a periodic stream of payments, provided that no event of default has occurred. Such periodic payments are accrued daily as an unrealized appreciation or depreciation until the payments are made, at which time they are realized. Upfront payments and receipts are reflected in the Consolidated Statement of Assets and Liabilities and represent compensating factors between stated terms of the credit default swap agreement and prevailing market conditions (credit spreads and other relevant factors). These upfront payments and receipts are amortized over the term of the contract as a realized gain or loss in the Consolidated Statement of Operations.
The Fund entered into OTC cross currency swap contracts primarily to manage and/or gain exposure to interest rate risk and certain foreign currencies. A cross currency swap is an agreement between the Fund and a counterparty to exchange cash flows (determined using either a fixed or floating rate) based on the notional amounts of two different currencies. The notional amounts are typically determined based on the spot exchange rates at the opening of the contract. Cross currency swaps may require the exchange of notional amounts at the opening and/or closing of the contract. Over the term of the contract, contractually required payments to be paid and to be received are accrued daily and recorded as unrealized depreciation and appreciation until the payments are made, at which time they are realized. Upfront payments and receipts are reflected in the Consolidated Statement of Assets and Liabilities and represent compensating factors between stated terms of the cross currency swap contract and prevailing market conditions (interest rate spreads and other relevant factors). These upfront payments and receipts are amortized over the term of the contract as a realized gain or loss in the Consolidated Statement of Operations.
The Fund entered into OTC total return swap contracts primarily to manage and/or gain exposure to interest rate risk of an underlying instrument such as a stock, bond, index or
basket of securities or indices. A total return swap is an agreement between the Fund and a counterparty to exchange a return linked to an underlying instrument for a floating or fixed rate payment, both based upon a notional amount. Over the term of the contract, contractually required payments to be paid or received are accrued daily and recorded as unrealized appreciation or depreciation until the payments are made, at which time they are recognized as realized gain or loss.
The Fund invests in value recovery instruments (VRI) primarily to gain exposure to economic growth. Periodic payments from VRI are dependent on established benchmarks for underlying variables. VRI has a notional amount, which is used to calculate amounts of payments to holders. Payments are recorded upon receipt as realized gains in the Consolidated Statement of Operations. The risks of investing in VRI include growth risk, liquidity, and the potential loss of investment.
See Note 9 regarding other derivative information.
e. Restricted Cash
At June 30, 2019, the Fund held restricted cash in connection with investments in certain derivative securities. Restricted cash is held in a segregated account with the Fund’s custodian and is reflected in the Consolidated Statement of Assets and Liabilities.
f. Loan Participation Notes
The Fund invests in loan participation notes (Participations). Participations are loans originally issued to a borrower by one or more financial institutions (the Lender) and subsequently sold to other investors, such as the Fund. Participations typically result in the Fund having a contractual relationship only with the Lender and not with the borrower. The Fund has the right to receive from the Lender any payments of principal, interest and fees which the Lender received from the borrower. The Fund generally has no rights to either enforce compliance by the borrower with the terms of the loan agreement or to any collateral relating to the original loan. As a result, the Fund assumes the credit risk of both the borrower and the Lender that is selling the Participation. The Participations may also involve interest rate risk and liquidity risk, including the potential default or insolvency of the borrower and/or the Lender.
FRANKLIN TEMPLETON VARIABLE INSURANCE PRODUCTS TRUST
NOTES TO CONSOLIDATED FINANCIAL STATEMENTS (UNAUDITED)
Franklin Strategic Income VIP Fund(continued)
g. Investments in FT Holdings Corporation III (FT Subsidiary)
The Fund invests in certain financial instruments through its investment in FT Subsidiary. FT Subsidiary is a Delaware Corporation, is a wholly-owned subsidiary of the Fund, and is able to invest in certain financial instruments consistent with the investment objective of the Fund. At June 30, 2019, FT Subsidiary’s investment, Turtle Bay Resort, as well as any other assets and liabilities of FT Subsidiary are reflected in the Fund’s Consolidated Statement of Investments and Consolidated Statement of Assets and Liabilities.
At June 30, 2019, FT Subsidiary, which is a tax paying entity, recognized an unrealized loss on its Turtle Bay investment. An estimated deferred tax asset based on such unrealized loss is reflected as FT Subsidiary deferred tax benefit in the Consolidated Statement of Assets and Liabilities. The estimated benefit was calculated using a federal rate of 21%. When the Turtle Bay investment liquidates, the FT Subsidiary will recognize a capital loss which can be carried-back to offset prior year capital gains, resulting in a tax refund which will relieve the deferred tax asset.
The financial statements have been consolidated and include the accounts of the Fund and FT Subsidiary. All intercompany transactions and balances have been eliminated. At June 30, 2019, the net assets of FT Subsidiary were $6,398,598, representing 1.4% of the Fund’s consolidated net assets. The Fund’s investment in FT Subsidiary is limited to 25% of consolidated assets.
h. Mortgage Dollar Rolls
The Fund enters into mortgage dollar rolls, typically on a TBA basis. Mortgage dollar rolls are agreements between the Fund and a financial institution where the Fund sells (or buys) mortgage-backed securities for delivery on a specified date and simultaneously contracts to repurchase (or sell) substantially similar (same type, coupon, and maturity) securities at a future date and at a predetermined price. Gains or losses are realized on the initial sale, and the difference between the repurchase price and the sale price is recorded as an unrealized gain or loss to the Fund upon entering into the mortgage dollar roll. In addition, the Fund may invest the cash proceeds that are received from the initial sale. During the period between the sale and repurchase, the Fund is not entitled to principal and interest paid on the mortgage backed securities. Transactions in mortgage dollar rolls are accounted for as purchases and
sales and may result in an increase to the Fund’s portfolio turnover rate. The risks of mortgage dollar roll transactions include the potential inability of the counterparty to fulfill its obligations.
i. Senior Floating Rate Interests
The Fund invests in senior secured corporate loans that pay interest at rates which are periodically reset by reference to a base lending rate plus a spread. These base lending rates are generally the prime rate offered by a designated U.S. bank or the London InterBank Offered Rate (LIBOR). Senior secured corporate loans often require prepayment of principal from excess cash flows or at the discretion of the borrower. As a result, actual maturity may be substantially less than the stated maturity. Senior secured corporate loans in which the Fund invests are generally readily marketable, but may be subject to certain restrictions on resale.
j. Income and Deferred Taxes
It is the Fund’s policy to qualify as a regulated investment company under the Internal Revenue Code. The Fund intends to distribute to shareholders substantially all of its taxable income and net realized gains to relieve it from federal income and if applicable, excise taxes. As a result, no provision for U.S. federal income taxes is required.
The Fund may be subject to foreign taxation related to income received, capital gains on the sale of securities and certain foreign currency transactions in the foreign jurisdictions in which it invests. Foreign taxes, if any, are recorded based on the tax regulations and rates that exist in the foreign markets in which the Fund invests. When a capital gain tax is determined to apply, the Fund records an estimated deferred tax liability in an amount that would be payable if the securities were disposed of on the valuation date.
The Fund may recognize an income tax liability related to its uncertain tax positions under U.S. GAAP when the uncertain tax position has a less than 50% probability that it will be sustained upon examination by the tax authorities based on its technical merits. As of June 30, 2019, the Fund has determined that no tax liability is required in its financial statements related to uncertain tax positions for any open tax years (or expected to be taken in future tax years). Open tax years are those that remain subject to examination and are based on the statute of limitations in each jurisdiction in which the Fund invests.
FRANKLIN TEMPLETON VARIABLE INSURANCE PRODUCTS TRUST
NOTES TO CONSOLIDATED FINANCIAL STATEMENTS (UNAUDITED)
Franklin Strategic Income VIP Fund(continued)
1. Organization and Significant Accounting Policies(continued)
k. Security Transactions, Investment Income, Expenses and Distributions
Security transactions are accounted for on trade date. Realized gains and losses on security transactions are determined on a specific identification basis. Interest income and estimated expenses are accrued daily. Amortization of premium and accretion of discount on debt securities are included in interest income. Paydown gains and losses are recorded as an adjustment to interest income. Facility fees are recognized as income over the expected term of the loan. Dividend income is recorded on theex-dividend date except for certain dividends from securities where the dividend rate is not available. In such cases, the dividend is recorded as soon as the information is received by the Fund. Distributions to shareholders are recorded on theex-dividend date. Distributable earnings are determined according to income tax regulations (tax basis) and may differ from earnings recorded in accordance with U.S. GAAP. These differences may be permanent or temporary. Permanent differences are reclassified among capital accounts to reflect their tax character. These reclassifications have no impact on net assets or the results of operations. Temporary differences are not reclassified, as they may reverse in subsequent periods.
Common expenses incurred by the Trust are allocated among the Funds based on the ratio of net assets of each Fund to the combined net assets of the Trust or based on the ratio of number of shareholders of each Fund to the combined number of shareholders of the Trust. Fund specific expenses are charged directly to the Fund that incurred the expense.
Realized and unrealized gains and losses and net investment income, excluding class specific expenses, are allocated daily to each class of shares based upon the relative proportion of
net assets of each class. Differences in per share distributions by class are generally due to differences in class specific expenses.
Inflation-indexed bonds are adjusted for inflation through periodic increases or decreases in the security’s interest accruals, face amount, or principal redemption value, by amounts corresponding to the rate of inflation as measured by an index. Any increase or decrease in the face amount or principal redemption value will be included as interest income in the Consolidated Statement of Operations.
l. Accounting Estimates
The preparation of financial statements in accordance with U.S. GAAP requires management to make estimates and assumptions that affect the reported amounts of assets and liabilities at the date of the financial statements and the amounts of income and expenses during the reporting period. Actual results could differ from those estimates.
m. Guarantees and Indemnifications
Under the Trust’s organizational documents, its officers and trustees are indemnified by the Trust against certain liabilities arising out of the performance of their duties to the Trust. Additionally, in the normal course of business, the Trust, on behalf of the Fund, enters into contracts with service providers that contain general indemnification clauses. The Trust’s maximum exposure under these arrangements is unknown as this would involve future claims that may be made against the Trust that have not yet occurred. Currently, the Trust expects the risk of loss to be remote.
FRANKLIN TEMPLETON VARIABLE INSURANCE PRODUCTS TRUST
NOTES TO CONSOLIDATED FINANCIAL STATEMENTS (UNAUDITED)
Franklin Strategic Income VIP Fund(continued)
2. Shares of Beneficial Interest
At June 30, 2019, there were an unlimited number of shares authorized (without par value). Transactions in the Fund’s shares were as follows:
| | | | | | | | | | | | | | | | | | | | |
| | | |
| | | Six Months Ended June 30, 2019 | | | | | | Year Ended December 31, 2018 | |
| | | | | |
| | | Shares | | | Amount | | | | | | Shares | | | Amount | |
| | | | | |
| Class 1 Shares: | | | | | | | | | | | | | | | | | | | | |
Shares sold | | | 381,210 | | | $ | 4,201,734 | | | | | | | | 529,935 | | | $ | 5,819,800 | |
Shares issued in reinvestment of distributions | | | 1,499,135 | | | | 16,055,733 | | | | | | | | 904,373 | | | | 9,703,924 | |
Shares redeemed | | | (2,273,100 | ) | | | (25,052,391 | ) | | | | | | | (5,463,142 | ) | | | (59,510,242 | ) |
| | | | | |
Net increase (decrease) | | | (392,755 | ) | | $ | (4,794,924 | ) | | | | | | | (4,028,834 | ) | | $ | (43,986,518 | ) |
| | | | | |
| Class 2 Shares: | | | | | | | | | | | | | | | | | | | | |
Shares sold | | | 859,552 | | | $ | 9,193,927 | | | | | | | | 1,939,103 | | | $ | 20,473,500 | |
Shares issued in reinvestment of distributions | | | 445,266 | | | | 4,608,498 | | | | | | | | 552,570 | | | | 5,724,625 | |
Shares redeemedin-kind (Note 11) | | | — | | | | — | | | | | | | | (10,844,970 | ) | | | (113,023,023 | ) |
Shares redeemed | | | (1,145,506 | ) | | | (12,186,350 | ) | | | | | | | (2,870,064 | ) | | | (30,241,230 | ) |
| | | | | |
Net increase (decrease) | | | 159,312 | | | $ | 1,616,075 | | | | | | | | (11,223,361 | ) | | $ | (117,066,128 | ) |
| | | | | |
| Class 4 Shares: | | | | | | | | | | | | | | | | | | | | |
Shares sold | | | 282,205 | | | $ | 3,113,729 | | | | | | | | 351,399 | | | $ | 3,829,733 | |
Shares issued in reinvestment of distributions | | | 277,403 | | | | 2,951,572 | | | | | | | | 158,766 | | | | 1,690,861 | |
Shares redeemed | | | (778,798 | ) | | | (8,452,830 | ) | | | | | | | (1,457,847 | ) | | | (15,792,168 | ) |
| | | | | |
Net increase (decrease) | | | (219,190 | ) | | $ | (2,387,529 | ) | | | | | | | (947,682 | ) | | $ | (10,271,574 | ) |
3. Transactions with Affiliates
Franklin Resources, Inc. is the holding company for various subsidiaries that together are referred to as Franklin Templeton. Certain officers and trustees of the Fund are also officers and/or directors of the following subsidiaries:
| | |
| Subsidiary | | Affiliation |
| |
| Franklin Advisers, Inc. (Advisers) | | Investment manager |
| |
| Franklin Templeton Services, LLC (FT Services) | | Administrative manager |
| |
| Franklin Templeton Distributors, Inc. (Distributors) | | Principal underwriter |
| |
| Franklin Templeton Investor Services, LLC (Investor Services) | | Transfer agent |
FRANKLIN TEMPLETON VARIABLE INSURANCE PRODUCTS TRUST
NOTES TO CONSOLIDATED FINANCIAL STATEMENTS (UNAUDITED)
Franklin Strategic Income VIP Fund(continued)
3. Transactions with Affiliates(continued)
a. Management Fees
The Fund pays an investment management fee to Advisers based on the average daily net assets of the Fund as follows:
| | |
| Annualized Fee Rate | | Net Assets |
| |
| 0.625% | | Up to and including $500 million |
| |
| 0.525% | | Over $500 million, up to and including $1 billion |
| |
| 0.480% | | Over $1 billion, up to and including $1.5 billion |
| |
| 0.435% | | Over $1.5 billion, up to and including $6.5 billion |
| |
| 0.415% | | Over $6.5 billion, up to and including $11.5 billion |
| |
| 0.400% | | Over $11.5 billion, up to and including $16.5 billion |
| |
| 0.390% | | Over $16.5 billion, up to and including $19 billion |
| |
| 0.380% | | Over $19 billion, up to and including $21.5 billion |
| |
| 0.370% | | In excess of $21.5 billion |
b. Administrative Fees
Under an agreement with Advisers, FT Services provides administrative services to the Fund. The fee is paid by Advisers based on the Fund’s average daily net assets, and is not an additional expense of the Fund.
c. Distribution Fees
The Board has adopted distribution plans for Class 2 and Class 4 shares pursuant to Rule12b-1 under the 1940 Act. Under the Fund’s compensation distribution plans, the Fund pays Distributors for costs incurred in connection with the servicing, sale and distribution of the Fund’s shares up to 0.25% and 0.35% per year of its average daily net assets of Class 2 and Class 4, respectively. The plan year, for purposes of monitoring compliance with the maximum annual plan rates, is February 1 through January 31.
d. Transfer Agent Fees
Investor Services, under terms of an agreement, performs shareholder servicing for the Fund and is not paid by the Fund for the services.
e. Investments in Affiliated Management Investment Companies
The Fund invests in one or more affiliated management investment companies for purposes other than exercising a controlling influence over the management or policies. Management fees paid by the Fund are waived on assets invested in the affiliated management investment companies, as noted in the Consolidated Statement of Operations, in an amount not to exceed the management and administrative fees paid directly or indirectly by each affiliate. During the period ended June 30, 2019, the Fund held investments in affiliated management investment companies as follows:
| | | | | | | | | | | | | | | | | | | | | | | | | | | | | | | | |
| | | Value at
Beginning
of Period | | | Purchases | | | Sales | | | Realized
Gain (Loss) | | | Net Change in
Unrealized
Appreciation
(Depreciation) | | | Value at
End of
Period | | | Number of
Shares
Held at End
of Period | | | Dividend
Income | |
| |
| | | | | | | | |
| Non-Controlled Affiliates | | | | | | | | | | | | | | | | | | | | | | | | | | | | | | | | |
Franklin Floating Rate Income Funda | | $ | 12,230,563 | | | $ | — | | | $ | — | | | $ | — | | | $ | (502,812 | ) | | $ | 11,727,751 | | | | 1,358,951 | | | $ | 485,775 | |
FRANKLIN TEMPLETON VARIABLE INSURANCE PRODUCTS TRUST
NOTES TO CONSOLIDATED FINANCIAL STATEMENTS (UNAUDITED)
Franklin Strategic Income VIP Fund(continued)
| | | | | | | | | | | | | | | | | | | | | | | | | | | | | | | | |
| | | Value at
Beginning
of Period | | | Purchases | | | Sales | | | Realized
Gain (Loss) | | | Net Change in
Unrealized
Appreciation
(Depreciation) | | | Value at
End of
Period | | | Number of
Shares
Held at End
of Period | | | Dividend
Income | |
| |
| | | |
| Non-Controlled Affiliates(continued) | | | | | | | | | | | | | |
Franklin Lower Tier Floating Rate Fund | | $ | 13,000,405 | | | $ | — | | | $ | (12,319,922 | )b | | $ | (1,769,646 | ) | | $ | 1,089,163 | | | $ | — | | | | — | | | $ | 359,788 | |
Institutional Fiduciary Trust Money Market Portfolio, 2.05% | | | 10,265,231 | | | | 78,898,452 | | | | (81,869,649 | ) | | | — | | | $ | — | | | | 7,294,034 | | | | 7,294,034 | | | | 105,292 | |
| | | | | | | | | | | | |
| | | | | | | | |
Total Affiliated Securities | | $ | 35,496,199 | | | $ | 78,898,452 | | | $ | (94,189,571 | ) | | $ | (1,769,646 | ) | | $ | 586,351 | | | $ | 19,021,785 | | | | | | | $ | 950,855 | |
| | | | | | | | | | | | |
aEffective May 31, 2019, Franklin Middle Tier Floating Rate Fund was renamed Franklin Floating Rate Income Fund.
bThe Fund sold shares of the affiliate through anin-kind transfer of common stocks and other equity interests, corporate bonds and senior floating rate interests securities and cash. See Note 6.
4. Expense Offset Arrangement
The Fund has entered into an arrangement with its custodian whereby credits realized as a result of uninvested cash balances are used to reduce a portion of the Fund’s custodian expenses. During the period ended June 30, 2019, the custodian fees were reduced as noted in the Consolidated Statement of Operations.
5. Income Taxes
For tax purposes, capital losses may be carried over to offset future capital gains.
At December 31, 2018, the capital loss carryforwards were as follows:
| | | | |
Capital loss carryforwards not subject to expiration: | | | | |
Short term | | $ | 3,186,035 | |
Long term | | | 36,761,926 | |
| | | | |
| |
Total capital loss carryforwards | | $ | 39,947,961a | |
| | | | |
aSubject to certain limitations under Internal Revenue Code Section 382.
At June 30, 2019, the cost of investments and net unrealized appreciation (depreciation) for income tax purposes were as follows:
| | | | |
Cost of investments | | $ | 469,675,559 | |
| | | | |
| |
Unrealized appreciation | | $ | 9,535,735 | |
Unrealized depreciation | | | (21,758,733 | ) |
| | | | |
| |
Net unrealized appreciation (depreciation) | | $ | (12,222,998 | ) |
| | | | |
Differences between income and/or capital gains as determined on a book basis and a tax basis are primarily due to differing treatments of foreign currency transactions, bond discounts and premiums, swaps and financial futures transactions.
FRANKLIN TEMPLETON VARIABLE INSURANCE PRODUCTS TRUST
NOTES TO CONSOLIDATED FINANCIAL STATEMENTS (UNAUDITED)
Franklin Strategic Income VIP Fund(continued)
6. Investment Transactions
Purchases and sales of investments (excluding short term securities) for the period ended June 30, 2019, aggregated $309,092,020 and $336,241,726, respectively. Purchases and sales of investments excludesin-kind transactions of $10,271,362 and $12,319,922, respectively.
7. Credit Risk and Defaulted Securities
At June 30, 2019, the Fund had 51.4% of its portfolio invested in high yield, senior secured floating rate loans, or other securities rated below investment grade and unrated securities, if any. These securities may be more sensitive to economic conditions causing greater price volatility and are potentially subject to a greater risk of loss due to default than higher rated securities.
The Fund held defaulted securities and/or other securities for which the income has been deemed uncollectible. At June 30, 2019, the aggregate value of these securities was $3,159,239, representing 0.7% of the Fund’s net assets. The Fund discontinues accruing income on securities for which income has been deemed uncollectible and provides an estimate for losses on interest receivable. The securities have been identified in the accompanying Consolidated Statement of Investments.
8. Restricted Securities
The Fund invests in securities that are restricted under the Securities Act of 1933 (1933 Act). Restricted securities are often purchased in private placement transactions, and cannot be sold without prior registration unless the sale is pursuant to an exemption under the 1933 Act. Disposal of these securities may require greater effort and expense, and prompt sale at an acceptable price may be difficult. The Fund may have registration rights for restricted securities. The issuer generally incurs all registration costs.
At June 30, 2019, investments in restricted securities, excluding securities exempt from registration under the 1933 Act deemed to be liquid, were as follows:
| | | | | | | | | | | | |
Principal
Amount/
Shares/
Units | | Issuer | | Acquisition Date | | Cost | | | Value | |
| | | | |
18,684 | | aAppvion Operations Inc. | | 4/12/19 | | $ | 252,711 | | | $ | 287,369 | |
8,384 | | iHeartMedia Inc., A | | 6/09/11 - 9/05/14 | | | 194,247 | | | | 121,696 | |
142 | | iHeartMedia Inc., B | | 6/09/11 - 9/05/14 | | | 3,268 | | | | 2,061 | |
14,792,309 | | K2016470219 South Africa Ltd., A | | 2/08/13 - 2/01/17 | | | 114,768 | | | | 10,500 | |
1,472,041 | | K2016470219 South Africa Ltd., B | | 2/01/17 | | | 1,093 | | | | 1,045 | |
947,792 | | K2016470219 South Africa Ltd., senior secured note, 144A, PIK, 3.00%, 12/31/22 | | 2/08/13 - 6/30/19 | | | 1,330,313 | | | | 1,185 | |
278,546 | | K2016470260 South Africa Ltd., senior secured note, 144A, PIK, 25.00%, 12/31/22 | | 2/01/17 - 6/30/19 | | | 199,465 | | | | 8,356 | |
7,021 | | bRemington Outdoor Co. Inc., Litigation Units | | 4/12/19 | | | — | | | | — | |
| | | | |
| | Total Restricted Securities(Value is 0.1% of Net Assets) | | | | $ | 2,095,865 | | | $ | 432,212 | |
aThe Fund also invests in unrestricted securities of the issuer, valued at $424,833 as of June 30, 2019.
bThe Fund also invests in unrestricted securities of the issuer, valued at $111,864 as of June 30, 2019.
FRANKLIN TEMPLETON VARIABLE INSURANCE PRODUCTS TRUST
NOTES TO CONSOLIDATED FINANCIAL STATEMENTS (UNAUDITED)
Franklin Strategic Income VIP Fund(continued)
9. Other Derivative Information
At June 30, 2019, investments in derivative contracts are reflected in the Consolidated Statement of Assets and Liabilities as follows:
| | | | | | | | | | | | | | |
| | | Asset Derivatives | | | | | Liability Derivatives | |
| | | | | | | | |
| | | | | |
Derivative Contracts Not Accounted for as Hedging Instruments | | Consolidated Statement of Assets and Liabilities
Location | | Fair Value | | | | | Consolidated Statement of Assets and Liabilities
Location | | Fair Value | |
| |
| | | | | |
Interest rate contracts | | Variation margin on futures contracts | | $ | 1,074,160 | a | | | | Variation margin on futures contracts | | $ | — | |
| | | | | |
| | Unrealized appreciation on OTC swap contracts | | | 28,740 | | | | | Unrealized depreciation on OTC swap contracts | | | — | |
| | | | | |
Foreign exchange contracts | | Unrealized appreciation on OTC forward exchange contracts | | | 300,017 | | | | | Unrealized depreciation on OTC forward exchange contracts | | | 250,078 | |
| | | | | |
Credit contracts | | Variation margin on centrally cleared swap contracts | | | 51,668 | a | | | | Variation margin on centrally cleared swap contracts | | | — | |
| | | | | |
| | OTC swap contracts (upfront payments) | | | 396,204 | | | | | OTC swap contracts (upfront receipts) | | | 641,713 | |
| | | | | |
| | Unrealized appreciation on OTC swap contracts | | | 111,056 | | | | | Unrealized depreciation on OTC swap contracts | | | 1,850,660 | |
| | | | | |
Value recovery instruments | | Investments in securities, at value | | | 701,651 | b | | | | | | | | |
| | | | | | | | | | | | | | |
| | | | | |
Totals | | | | $ | 2,663,496 | | | | | | | $ | 2,742,451 | |
| | | | | | | | | | | | | | |
aThis amount reflects the cumulative appreciation (depreciation) of futures contracts and centrally cleared swap contracts as reported in the Consolidated Statement of Investments. Only the variation margin receivable/payable at period end is separately reported within the Consolidated Statement of Assets and Liabilities. Prior variation margin movements were recorded to cash upon receipt or payment.
bVRI are included in investments in securities, at value in the Consolidated Statement of Assets and Liabilities.
For the period ended June 30, 2019, the effect of derivative contracts in the Consolidated Statement of Operations was as follows:
| | | | | | | | | | | | | | | | |
Derivative Contracts
Not Accounted for as
Hedging Instruments | | Consolidated Statement of
Operations Location | | Net Realized
Gain (Loss) for
the Period | | | | | | Consolidated Statement of
Operations Location | | Net Change in
Unrealized
Appreciation
(Depreciation)
for the Period | |
| |
| | | | | |
| | Net realized gain (loss) from: | | | | | | | | | | Net change in unrealized appreciation (depreciation) on: | | | | |
Interest rate contracts | | Futures contracts | | | $1,609,018 | | | | | | | Futures contracts | | | $ 382,479 | |
| | Swap contracts | | | 925,071 | | | | | | | Swap contracts | | | 451,264 | |
Foreign exchange contracts | | Forward exchange contracts | | | 316,816 | | | | | | | Forward exchange contracts | | | (212,811) | |
Credit contracts | | Swap contracts | | | 846,061 | | | | | | | Swap contracts | | | (42,669) | |
Value recovery instruments | | Investments | | | 98,000 | a | | | | | | Investments | | | 65,778 | a |
| | | | | | | | | | | | | | | | |
Totals | | | | | $3,794,966 | | | | | | | | | | $644,041 | |
| | | | | | | | | | | | | | | | |
aVRI are included in net realized gain (loss) from investments and net change in unrealized appreciation (depreciation) on investments in the Consolidated Statement of Operations.
FRANKLIN TEMPLETON VARIABLE INSURANCE PRODUCTS TRUST
NOTES TO CONSOLIDATED FINANCIAL STATEMENTS (UNAUDITED)
Franklin Strategic Income VIP Fund(continued)
9. Other Derivative Information(continued)
For the period ended June 30, 2019, the average month end notional amount of futures contracts and swap contracts and the average month end contract value for forward exchange contracts, and average month end fair value of VRI, were as follows:
| | | | |
Futures contracts | | $ | 32,829,607 | |
Swap contracts | | | 56,808,610 | |
Forward exchange contracts | | | 37,064,038 | |
VRI | | | 729,187 | |
| | | | | | | | |
| | | Gross Amounts of Assets and Liabilities Presented in the Consolidated Statement of Assets and Liabilities | |
| | | Assetsa | | | Liabilitiesa | |
| | |
| Derivatives | | | | | | | | |
Forward exchange contracts | | | $300,017 | | | | $ 250,078 | |
Swap contracts | | | 536,000 | | | | 2,492,373 | |
| | |
Total | | | $836,017 | | | | $2,742,451 | |
aAbsent an event of default or early termination, OTC derivative assets and liabilities are presented gross and not offset in the Consolidated Statement of Assets and Liabilities.
At June 30, 2019, OTC derivative assets, which may be offset against OTC derivative liabilities and collateral received from the counterparty, are as follows:
| | | | | | | | | | | | | | | | | | | | |
| | | | | | Amounts Not Offset in the Consolidated Statement of Assets and Liabilities | | | | |
| | | | | |
| | | Gross Amounts of Assets Presented in
the Consolidated Statement of
Assets and Liabilities | | | Financial
Instruments
Available for
Offset | | | Financial
Instruments
Collateral
Received | | | Cash
Collateral
Receiveda | | | Net Amount
(Not less
than zero) | |
| | | | | |
| Counterparty | | | | | | | | | | | | | | | | | | | | |
BNDP | | | $ 19,327 | | | | $ (16,773) | | | | $ — | | | | $ — | | | | $2,554 | |
BZWS | | | 48,832 | | | | (48,832 | ) | | | — | | | | — | | | | — | |
CITI | | | 80,817 | | | | (80,817 | ) | | | — | | | | — | | | | — | |
DBAB | | | — | | | | — | | | | — | | | | — | | | | — | |
FBCO | | | 3,381 | | | | — | | | | — | | | | — | | | | 3,381 | |
GSCO | | | 9,385 | | | | — | | | | — | | | | (9,385 | ) | | | — | |
JPHQ | | | 300,841 | | | | (300,841 | ) | | | — | | | | — | | | | — | |
MSCO | | | 373,434 | | | | (373,434 | ) | | | — | | | | — | | | | — | |
| | | | | |
Total | | | $836,017 | | | | $(820,697 | ) | | | $ — | | | | $(9,385 | ) | | | $5,935 | |
FRANKLIN TEMPLETON VARIABLE INSURANCE PRODUCTS TRUST
NOTES TO CONSOLIDATED FINANCIAL STATEMENTS (UNAUDITED)
Franklin Strategic Income VIP Fund(continued)
At June 30, 2019, OTC derivative liabilities, which may be offset against OTC derivative assets and collateral pledged to the counterparty, are as follows:
| | | | | | | | | | | | | | | | | | | | |
| | | | | | Amounts Not Offset in the
Consolidated Statement of Assets and Liabilities | | | | |
| | | | | |
| | | Gross Amounts of Liabilities Presented in
the Consolidated Statement of
Assets and Liabilities | | | Financial
Instruments
Available for
Offset | | | Financial
Instruments
Collateral
Pledged | | | Cash
Collateral
Pledgeda | | | Net Amount
(Not less
than zero) | |
| | | | | |
| Counterparty | | | | | | | | | | | | | | | | | | | | |
BNDP | | | $ 16,773 | | | | $ (16,773 | ) | | | $ — | | | | $ — | | | | $ — | |
BZWS | | | 75,693 | | | | (48,832 | ) | | | — | | | | — | | | | 26,861 | |
CITI | | | 1,107,484 | | | | (80,817 | ) | | | — | | | | (1,020,000 | ) | | | 6,667 | |
DBAB | | | 9,956 | | | | — | | | | — | | | | — | | | | 9,956 | |
FBCO | | | — | | | | — | | | | — | | | | — | | | | — | |
GSCO | | | — | | | | — | | | | — | | | | — | | | | — | |
JPHQ | | | 569,861 | | | | (300,841 | ) | | | — | | | | — | | | | 269,020 | |
MSCO | | | 962,684 | | | | (373,434 | ) | | | — | | | | (589,250 | ) | | | — | |
| | | | | |
Total | | | $2,742,451 | | | | $(820,697 | ) | | | $ — | | | | $(1,609,250 | ) | | | $312,504 | |
aIn some instances, the collateral amounts disclosed in the table above were adjusted due to the requirement to limit collateral amounts to avoid the effect of overcollateralization. Actual collateral received and/or pledged may be more than the amounts disclosed herein.
See Note 1(d) regarding derivative financial instruments.
See Abbreviations on pageFSI-54.
10. Credit Facility
The Fund, together with other U.S. registered and foreign investment funds (collectively, Borrowers), managed by Franklin Templeton, are borrowers in a joint syndicated senior unsecured credit facility totaling $2 billion (Global Credit Facility) which matures on February 7, 2020. This Global Credit Facility provides a source of funds to the Borrowers for temporary and emergency purposes, including the ability to meet future unanticipated or unusually large redemption requests.
Under the terms of the Global Credit Facility, the Fund shall, in addition to interest charged on any borrowings made by the Fund and other costs incurred by the Fund, pay its share of fees and expenses incurred in connection with the implementation and maintenance of the Global Credit Facility, based upon its relative share of the aggregate net assets of all of the Borrowers, including an annual commitment fee of 0.15% based upon the unused portion of the Global Credit Facility. These fees are reflected in other expenses in the Consolidated Statement of Operations. During the period ended June 30, 2019, the Fund did not use the Global Credit Facility.
11. RedemptionIn-Kind
During the year ended December 31, 2018, the Fund realized $2,963,426 of net losses resulting from a redemptionin-kind in which a shareholder redeemed fund shares for cash and securities held by the Fund. Because such losses are not taxable to the Fund, are not netted with capital gains that are distributed to remaining shareholders, they are reclassified from accumulated net realized losses topaid-in capital.
FRANKLIN TEMPLETON VARIABLE INSURANCE PRODUCTS TRUST
NOTES TO CONSOLIDATED FINANCIAL STATEMENTS (UNAUDITED)
Franklin Strategic Income VIP Fund(continued)
12. Fair Value Measurements
The Fund follows a fair value hierarchy that distinguishes between market data obtained from independent sources (observable inputs) and the Fund’s own market assumptions (unobservable inputs). These inputs are used in determining the value of the Fund’s financial instruments and are summarized in the following fair value hierarchy:
| | • | Level 1 – quoted prices in active markets for identical financial instruments |
| | • | Level 2 – other significant observable inputs (including quoted prices for similar financial instruments, interest rates, prepayment speed, credit risk, etc.) |
| | • | Level 3 – significant unobservable inputs (including the Fund’s own assumptions in determining the fair value of financial instruments) |
The input levels are not necessarily an indication of the risk or liquidity associated with financial instruments at that level.
FRANKLIN TEMPLETON VARIABLE INSURANCE PRODUCTS TRUST
NOTES TO CONSOLIDATED FINANCIAL STATEMENTS (UNAUDITED)
Franklin Strategic Income VIP Fund(continued)
A summary of inputs used as of June 30, 2019, in valuing the Fund’s assets and liabilities carried at fair value, is as follows:
| | | | | | | | | | | | | | | | |
| | | Level 1 | | | Level 2 | | | Level 3 | | | Total | |
| |
| | | | |
| Assets: | | | | | | | | | | | | | | | | |
Investments in Securities:a | | | | | | | | | | | | | | | | |
Equity Investments:b | | | | | | | | | | | | | | | | |
Commercial & Professional Services | | $ | — | | | $ | 111,864 | | | $ | — | | | $ | 111,864 | |
Consumer Services | | | — | | | | — | | | | 41,832 | | | | 41,832 | |
Energy | | | 116,404 | | | | 438,158 | | | | 9 | | | | 554,571 | |
Materials | | | 109,429 | | | | — | | | | 287,369 | | | | 396,798 | |
Media & Entertainment | | | 98,195 | | | | — | | | | 123,757 | | | | 221,952 | |
Retailing | | | — | | | | — | | | | 11,545 | | | | 11,545 | |
All Other Equity Investments | | | 11,727,751 | | | | — | | | | — | | | | 11,727,751 | |
Corporate Bonds: | | | | | | | | | | | | | | | | |
Retailing | | | — | | | | 1,267,294 | | | | 1,185 | | | | 1,268,479 | |
All Other Corporate Bonds | | | — | | | | 159,183,861 | | | | — | | | | 159,183,861 | |
Senior Floating Rate Interests: | | | | | | | | | | | | | | | | |
Household & Personal Products | | | — | | | | — | | | | 2,390,703 | | | | 2,390,703 | |
All Other Senior Floating Rate Interests | | | — | | | | 56,604,960 | | | | — | | | | 56,604,960 | |
Foreign Government and Agency Securities | | | — | | | | 25,374,343 | | | | — | | | | 25,374,343 | |
U.S. Government and Agency Securities | | | — | | | | 23,761,828 | | | | — | | | | 23,761,828 | |
Asset-Backed Securities and Commercial Mortgage-Backed Securities | | | — | | | | 119,382,419 | | | | — | | | | 119,382,419 | |
Mortgage-Backed Securities | | | — | | | | 43,500,352 | | | | — | | | | 43,500,352 | |
Municipal Bonds | | | — | | | | 6,610,783 | | | | — | | | | 6,610,783 | |
Escrows and Litigation Trusts | | | — | | | | 7,500 | | | | — | c | | | 7,500 | |
Short Term Investments | | | 7,294,034 | | | | — | | | | — | | | | 7,294,034 | |
| | | | |
| | | | |
Total Investments in Securities | | $ | 19,345,813 | | | $ | 436,243,362 | | | $ | 2,856,400 | | | $ | 458,445,575 | |
| | | | |
| | | | |
Other Financial Instruments: | | | | | | | | | | | | | | | | |
Futures Contracts | | $ | 1,074,160 | | | $ | — | | | $ | — | | | $ | 1,074,160 | |
Forward Exchange Contracts | | | — | | | | 300,017 | | | | — | | | | 300,017 | |
Swap Contracts | | | — | | | | 191,464 | | | | — | | | | 191,464 | |
| | | | |
| | | | |
Total Other Financial Instruments | | $ | 1,074,160 | | | $ | 491,481 | | | $ | — | | | $ | 1,565,641 | |
| | | | |
| | | | |
| Liabilities: | | | | | | | | | | | | | | | | |
Other Financial Instruments: | | | | | | | | | | | | | | | | |
Forward Exchange Contracts | | $ | — | | | $ | 250,078 | | | $ | — | | | $ | 250,078 | |
Swap Contracts | | | — | | | | 1,850,660 | | | | — | | | | 1,850,660 | |
| | | | |
| | | | |
Total Other Financial Instruments | | $ | — | | | $ | 2,100,738 | | | $ | — | | | $ | 2,100,738 | |
| | | | |
aFor detailed categories, see the accompanying Consolidated Statement of Investments.
bIncludes common stocks and management investment companies as well as other equity interests.
cIncludes securities determined to have no value at June 30, 2019.
A reconciliation of assets in which Level 3 inputs are used in determining fair value is presented when there are significant Level 3 financial instruments at the beginning and/or end of the period.
FRANKLIN TEMPLETON VARIABLE INSURANCE PRODUCTS TRUST
NOTES TO CONSOLIDATED FINANCIAL STATEMENTS (UNAUDITED)
Franklin Strategic Income VIP Fund(continued)
13. Subsequent Events
The Fund has evaluated subsequent events through the issuance of the Consolidated financial statements and determined that no events have occurred that require disclosure.
Abbreviations
| | | | | | | | | | |
| Counterparty | | Currency | | Selected Portfolio |
| | | | | |
BNDP | | BNP Paribas SA | | BRL | | Brazilian Real | | ARM | | Adjustable Rate Mortgage |
BZWS | | Barclays Bank PLC | | COP | | Colombian Peso | | CLO | | Collateralized Loan Obligation |
CITI | | Citigroup, Inc. | | DOP | | Dominican Peso | | CMT | | 1 year Constant Maturity Treasury Index |
DBAB | | Deutsche Bank AG | | EUR | | Euro | | FHLMC | | Federal Home Loan Mortgage Corp. |
FBCO | | Credit Suisse International | | IDR | | Indonesian Rupiah | | FNMA | | Federal National Mortgage Association |
GSCO | | The Goldman Sachs Group, Inc. | | MXN | | Mexican Peso | | FRN | | Floating Rate Note |
JPHQ | | JP Morgan Chase & Co. | | USD | | United States Dollar | | GDP | | Gross Domestic Product |
MSCO | | Morgan Stanley | | UYU | | Uruguayan peso | | GNMA | | Government National Mortgage Association |
| | | | ZAR | | South African rand | | HDC | | Housing Development Corp. |
| | | | | | | | LIBOR | | London InterBank Offered Rate |
| | | | | | | | MBS | | Mortgage-Backed Security |
| | | | | | | | PIK | | Payment-In-Kind |
| | | | | | | | RDA | | Redevelopment Agency/Authority |
| | | | | | | | SF | | Single Family |
| | | | | | | | T-Note | | Treasury Note |
| | | | | | | | VRI | | Value Recovery Instrument |
| | |
| Index | | |
| |
CDX.EM.Series number | | CDX Emerging Markets Index |
| MCDX.NA.Series number | | MCDX North America Index |
Franklin U.S. Government Securities VIP Fund
This semiannual report for Franklin U.S. Government Securities VIP Fund covers the period ended June 30, 2019.
Class 2 Performance Summary as of June 30, 2019
The Fund’s Class 2 Shares posted a +3.83% total return for thesix-month period ended June 30, 2019.
Performance reflects the Fund’s Class 2 operating expenses, but doesnotinclude any contract fees, expenses or sales charges. If they had been included, performance would be lower. These charges and deductions, particularly for variable life policies, can have a significant effect on contract values and insurance benefits. See the contract prospectus for a complete description of these expenses, including sales charges.
Performance data represent past performance, which does not guarantee future results. Investment return and principal value will fluctuate, and you may have a gain or loss when you sell your shares. Current performance may differ from figures shown.
FRANKLIN U.S. GOVERNMENT SECURITIES VIP FUND
Fund Goal and Main Investments
The Fund seeks income. Under normal market conditions, the Fund invests at least 80% of its net assets in U.S. government securities.
Fund Risks
All investments involve risks, including possible loss of principal. The Fund’s share price and yield will be affected by interest rate movements and mortgage prepayments. Bond prices generally move in the opposite direction of interest rates. Thus, as prices of bonds in the Fund adjust to a rise in interest rates, the Fund’s share price may decline. Changes in the financial strength of a bond issuer or in a bond’s credit rating may affect its value. The Fund is actively managed but there is no guarantee that the manager’s investment decisions will produce the desired results. The Fund’s prospectus also includes a description of the main investment risks.
Performance Overview
You can find the Fund’ssix-month total return in the Performance Summary. In comparison, the Fund’s primary benchmark, the Bloomberg Barclays U.S. Government Index: Intermediate Component, posted a +3.96% total return.1 The Fund’s secondary benchmark, the Lipper VIP General U.S. Government Funds Classification Average, posted a +4.39% total return.2 Funds in the Lipper average may allocate as much as 35% of their investments in asset types other than U.S. government and agency mortgage-backed securities.
Economic and Market Overview
The U.S. economy grew during the six months ended June 30, 2019. After moderating for two consecutive quarters, the economy grew significantly faster in 2019’s first quarter, driven by growth in consumer spending, inventory investment, exports, business investment, and state and local government spending. However, the economy moderated again in the second quarter, due to weakness in inventory investment, exports, business investment and housing investment. The manufacturing and services sectors expanded during the period. The unemployment rate
Portfolio Composition
Based on Total Net Assets as of 6/30/19
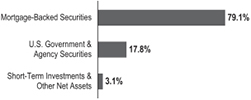
decreased from 3.9% in December 2018 to 3.7% atperiod-end.3 The annual inflation rate, as measured by the Consumer Price Index, decreased from 1.9% in December 2018 to 1.6% atperiod-end.3
The U.S. Federal Reserve (Fed) held its target range for the federal funds rate unchanged, at 2.25%–2.50%, during the reporting period. In March, the Fed mentioned it would end its balance sheet normalization program by the end of September 2019. In June, the Fed indicated increased uncertainties around its views on economic activity and the labor market. With market-based inflation measures remaining low in recent months, the market has interpreted the Fed’s recent statements to mean it will likely cut rates in 2019’s second half to foster continued economic growth while attempting to achieve its inflation objective.
The10-year Treasury yield, which moves inversely to its price, decreased during the period. The yield rose at some points during 2019’s first quarter amid several better-than-expected U.S. economic reports and optimism about a potential U.S.-China trade deal. However, concerns about political uncertainties in the U.S., slower domestic and global economic growth, and the Fed’s patient approach to its monetary policy decisions weighed on the Treasury yield. Nearperiod-end, the10-year yield reached multi-year lows and fell below certain short-term yields, due to weaker economic data and escalating U.S. trade tensions with China and Mexico. Overall, the10-year Treasury yield declined from 2.69% at the beginning of the period to 2.00% atperiod-end.
1. Source: Morningstar.
2. Source: Lipper, a Thomson Reuters Company.
One cannot invest directly in an index, and an index is not representative of the Fund’s portfolio. Please see Index Descriptions following the Fund Summaries.
3. Source: Bureau of Labor Statistics.
The dollar value, number of shares or principal amount, and names of all portfolio holdings are listed in the Fund’s Statement of Investments (SOI).
FRANKLIN U.S. GOVERNMENT SECURITIES VIP FUND
Investment Strategy
Using our straightforward investment approach, we seek to produce current income with a high degree of credit safety from a conservatively managed portfolio of U.S. government securities. Analyzing securities using proprietary and nonproprietary research, we seek to identify attractive investment opportunities.
Manager’s Discussion
Performance for the fixed income sectors in which this portfolio invests was mixed. From a perspective of excess returns over Treasuries, as measured by Bloomberg Barclays indexes, commercial mortgage-backed securities (CMBS), asset-backed securities (ABS) and U.S. agency bonds all posted positive excess returns. Agency mortgage-backed securities (MBS) posted positive total returns but underperformed similar duration U.S. Treasuries and produced negative excess returns. Within the agency mortgage pass-through (MBS) sector, although all produced negative basis points (bps) of excess returns, Freddie Mac (FHLMC) MBS and Ginnie Mae (GNMA) MBS were the best performers, versus Fannie Mae (FNMA) which produced negative 18 bps of excess returns. For the GNMA coupon stack, GNMA II 3.0 and 3.5% were the best performers while GNMA I 4.5% and 5.0% coupons lagged.
The Fund maintains a consistent and disciplined approach to our investment strategy. The Fund’s investment process and strategy have not changed, and the team continues to look for strong cash flow fundamentals and valuations seeking to uncover opportunities across the agency mortgage and agency debenture universe. The Fund emphasizes agency pass-throughs and invests in other agency securities for diversification purposes.
The portfolio’s largest allocation remains in fixed-rate MBS and primarily in30-year GNMA II securities. The Fund’s largest absolute allocation remained in 3.5% and 4.0% coupons. Over the period, we increased exposure to GNMA II 3.0% coupons, while reducing exposure to 4.0% coupons.
The Fund’s allocation to fixed-rate agency MBS detracted from performance, but significant performance from security selection more than offset the negative impact. The Fund’s exposures to adjustable-rate mortgage securities and U.S. agency bonds also contributed during the period. In contrast, the Fund’s U.S. yield curve positioning was a detractor during the period as yield curve movements had a negative impact relative to the benchmark.
Thank you for your participation in Franklin U.S. Government Securities VIP Fund. We look forward to serving your future investment needs.
The foregoing information reflects our analysis, opinions and portfolio holdings as of June 30, 2019, the end of the reporting period. The way we implement our main investment strategies and the resulting portfolio holdings may change depending on factors such as market and economic conditions. These opinions may not be relied upon as investment advice or an offer for a particular security. The information is not a complete analysis of every aspect of any market, country, industry, security or the Fund. Statements of fact are from sources considered reliable, but the investment manager makes no representation or warranty as to their completeness or accuracy. Although historical performance is no guarantee of future results, these insights may help you understand our investment management philosophy.
FRANKLIN U.S. GOVERNMENT SECURITIES VIP FUND
Class 2 Fund Expenses
As an investor in a variable insurance contract (Contract) that indirectly provides for investment in an underlying mutual fund, you can incur transaction and/or ongoing expenses at both the Fund level and the Contract Level: (1) transaction expenses can include sales charges (loads) on purchases, surrender fees, transfer fees and premium taxes; and (2) ongoing expenses can include management fees, distribution and service(12b-1) fees, contract fees, annual maintenance fees, mortality and expense risk fees and other fees and expenses. All mutual funds and Contracts have some types of ongoing expenses. The table below shows Fund-level ongoing expenses and can help you understand these costs and compare them with those of other mutual funds offered through the Contract. The table assumes a $1,000 investment held for the six months indicated. Please refer to the Fund prospectus for additional information on operating expenses.
Actual Fund Expenses
The table below provides information about the actual account values and actual expenses in the columns under the heading “Actual.” In these columns the Fund’s actual return, which includes the effect of ongoing Fund expenses but does not include the effect of ongoing Contract expenses, is used to calculate the “Ending Account Value.” You can estimate the Fund-level expenses you paid during the period by following these steps (of course, your account value and expenses will differ from those in this illustration): Divide your account value by $1,000 (if your account had an $8,600 value, then $8,600 ÷ $1,000 = 8.6). Then multiply the result by the number under the headings “Actual” and “Fund-Level Expenses Paid During Period” (if Fund-Level Expenses Paid During Period were $ 7.50, then 8.6 x $ 7.50 = $64.50). In this illustration, the estimated expenses paid this period at the Fund level are $64.50.
Hypothetical Example for Comparison with Other Mutual Funds
Under the heading “Hypothetical” in the table, information is provided about hypothetical account values and hypothetical expenses based on the Fund’s actual expense ratio and an assumed rate of return of 5% per year before expenses, which is not the Fund’s actual return. This information may not be used to estimate the actual ending account balance or expenses you paid for the period, but it can help you compare ongoing costs of investing in the Fund with those of other mutual funds offered through the Contract. To do so, compare this 5% hypothetical example with the 5% hypothetical examples that appear in the shareholder reports of other funds offered through the Contract.
Please note that expenses shown in the table are meant to highlight ongoing costs at the Fund level only and do not reflect any ongoing expenses at the Contract level, or transaction expenses at either the Fund or Contract levels. In addition, while the Fund does not have transaction expenses, if the transaction and ongoing expenses at the Contract level were included, the expenses shown below would be higher. You should consult your Contract prospectus or disclosure document for more information.
| | | | | | | | | | | | | | | | | | |
| | | | | | | Actual
(actual return after expenses) | | | | Hypothetical
(5% annual return before expenses) | | | | |
Share Class | | Beginning
Account
Value 1/1/19 | | | | Ending
Account
Value 6/30/19 | | Fund-Level
Expenses
Paid During
Period
1/1/19–6/30/191, 2 | | | | Ending Account
Value 6/30/19 | | Fund-Level
Expenses
Paid During Period
1/1/19–6/30/191,2 | | | | Net
Annualized
Expense
Ratio2 |
| | | | | | | | |
| | | | | | | | | |
Class 2 | | $1,000 | | | | $1,038.30 | | $3.79 | | | | $1,021.08 | | $3.76 | | | | 0.75% |
1. Expenses are equal to the annualized expense ratio for thesix-month period as indicated above—in the far right column—multiplied by the simple average account value over the period indicated, and then multiplied by 181/365 to reflect theone-half year period.
2. Does not include any ongoing expenses of the Contract for which the Fund is an investment option or acquired fund fees and expenses.
FRANKLIN TEMPLETON VARIABLE INSURANCE PRODUCTS TRUST
Financial Highlights
Franklin U.S. Government Securities VIP Fund
| | | | | | | | | | | | | | | | | | | | | | | | |
| | | Six Months Ended
June 30, 2019 (unaudited) | | | Year Ended December 31, | |
| | | 2018 | | | 2017 | | | 2016 | | | 2015 | | | 2014 | |
| | | | | | |
| Class 1 | | | | | | | | | | | | | | | | | | | | | | | | |
| | | | | | |
Per share operating performance
(for a share outstanding throughout the period) | | | | | | | | | | | | | | | | | | | | | | | | |
| | | | | | |
Net asset value, beginning of period | | | $12.07 | | | | $12.36 | | | | $12.51 | | | | $12.74 | | | | $13.00 | | | | $12.91 | |
| | | | |
| | | | | | |
| Income from investment operationsa: | | | | | | | | | | | | | | | | | | | | | | | | |
| | | | | | |
Net investment incomeb | | | 0.15 | | | | 0.29 | | | | 0.25 | | | | 0.22 | | | | 0.21 | | | | 0.24 | |
| | | | | | |
Net realized and unrealized gains (losses) | | | 0.32 | | | | (0.22 | ) | | | (0.04 | ) | | | (0.10 | ) | | | (0.12 | ) | | | 0.22 | |
| | | | |
| | | | | | |
Total from investment operations | | | 0.47 | | | | 0.07 | | | | 0.21 | | | | 0.12 | | | | 0.09 | | | | 0.46 | |
| | | | |
| | | | | | |
Less distributions from: | | | | | | | | | | | | | | | | | | | | | | | | |
| | | | | | |
Net investment income | | | (0.38 | ) | | | (0.36 | ) | | | (0.36 | ) | | | (0.35 | ) | | | (0.35 | ) | | | (0.37) | |
| | | | |
| | | | | | |
Net asset value, end of period | | | $12.16 | | | | $12.07 | | | | $12.36 | | | | $12.51 | | | | $12.74 | | | | $13.00 | |
| | | | |
| | | | | | |
Total returnc | | | 3.93% | | | | 0.60% | | | | 1.66% | | | | 0.90% | | | | 0.71% | | | | 3.64% | |
| | | | | | |
| Ratios to average net assetsd | | | | | | | | | | | | | | | | | | | | | | | | |
| | | | | | |
Expensese | | | 0.50% | | | | 0.50% | | | | 0.50% | | | | 0.50% | | | | 0.50% | | | | 0.49% | |
| | | | | | |
Net investment income | | | 2.43% | | | | 2.38% | | | | 2.00% | | | | 1.75% | | | | 1.64% | | | | 1.84% | |
| | | | | | |
Supplemental data | | | | | | | | | | | | | | | | | | | | | | | | |
| | | | | | |
| Net assets, end of period (000’s) | | | $56,770 | | | | $59,213 | | | | $66,404 | | | | $73,695 | | | | $79,620 | | | | $90,656 | |
| | | | | | |
Portfolio turnover rate | | | 14.59% | | | | 22.25% | | | | 80.49% | | | | 86.28% | | | | 61.91% | | | | 42.88% | |
aThe amount shown for a share outstanding throughout the period may not correlate with the Statement of Operations for the period due to the timing of sales and repurchases of the Fund’s shares in relation to income earned and/or fluctuating fair value of the investments of the Fund.
bBased on average daily shares outstanding.
cTotal return does not include fees, charges or expenses imposed by the variable annuity and life insurance contracts for which Franklin Templeton Variable Insurance Products Trust serves as an underlying investment vehicle. Total return is not annualized for periods less than one year.
dRatios are annualized for periods less than one year.
eBenefit of expense reduction rounds to less than 0.01%.
| | | | | | |
| | | |
| | The accompanying notes are an integral part of these financial statements. | Semiannual Report | | | FUS-5 | |
FRANKLIN TEMPLETON VARIABLE INSURANCE PRODUCTS TRUST
FINANCIAL HIGHLIGHTS
Franklin U.S. Government Securities VIP Fund(continued)
| | | | | | | | | | | | | | | | | | | | | | | | |
| | | Six Months Ended
June 30, 2019 (unaudited) | | | Year Ended December 31, | |
| | | 2018 | | | 2017 | | | 2016 | | | 2015 | | | 2014 | |
| | | | | | |
| Class 2 | | | | | | | | | | | | | | | | | | | | | | | | |
| | | | | | |
Per share operating performance
(for a share outstanding throughout the period) | | | | | | | | | | | | | | | | | | | | | | | | |
| | | | | | |
Net asset value, beginning of period | | | $11.79 | | | | $12.09 | | | | $12.24 | | | | $12.47 | | | | $12.73 | | | | $12.65 | |
| | | | |
| | | | | | |
| Income from investment operationsa: | | | | | | | | | | | | | | | | | | | | | | | | |
| | | | | | |
Net investment incomeb | | | 0.13 | | | | 0.25 | | | | 0.21 | | | | 0.19 | | | | 0.18 | | | | 0.20 | |
| | | | | | |
Net realized and unrealized gains (losses) | | | 0.32 | | | | (0.22 | ) | | | (0.04 | ) | | | (0.10 | ) | | | (0.12 | ) | | | 0.22 | |
| | | | |
| | | | | | |
Total from investment operations | | | 0.45 | | | | 0.03 | | | | 0.17 | | | | 0.09 | | | | 0.06 | | | | 0.42 | |
| | | | |
| | | | | | |
Less distributions from: | | | | | | | | | | | | | | | | | | | | | | | | |
| | | | | | |
Net investment income | | | (0.35 | ) | | | (0.33 | ) | | | (0.32 | ) | | | (0.32 | ) | | | (0.32 | ) | | | (0.34) | |
| | | | |
| | | | | | |
Net asset value, end of period | | | $11.89 | | | | $11.79 | | | | $12.09 | | | | $12.24 | | | | $12.47 | | | | $12.73 | |
| | | | |
| | | | | | |
Total returnc | | | 3.83% | | | | 0.34% | | | | 1.34% | | | | 0.66% | | | | 0.47% | | | | 3.38% | |
| | | | | | |
| Ratios to average net assetsd | | | | | | | | | | | | | | | | | | | | | | | | |
| | | | | | |
Expensese | | | 0.75% | | | | 0.75% | | | | 0.75% | | | | 0.75% | | | | 0.75% | | | | 0.74% | |
| | | | | | |
Net investment income | | | 2.18% | | | | 2.13% | | | | 1.75% | | | | 1.50% | | | | 1.39% | | | | 1.59% | |
| | | | | | |
Supplemental data | | | | | | | | | | | | | | | | | | | | | | | | |
| | | | | | |
| Net assets, end of period (000’s) | | | $1,086,681 | | | | $1,105,627 | | | | $1,223,491 | | | | $1,268,963 | | | | $1,311,974 | | | | $1,369,037 | |
| | | | | | |
Portfolio turnover rate | | | 14.59% | | | | 22.25% | | | | 80.49% | | | | 86.28% | | | | 61.91% | | | | 42.88% | |
aThe amount shown for a share outstanding throughout the period may not correlate with the Statement of Operations for the period due to the timing of sales and repurchases of the Fund’s shares in relation to income earned and/or fluctuating fair value of the investments of the Fund.
bBased on average daily shares outstanding.
cTotal return does not include fees, charges or expenses imposed by the variable annuity and life insurance contracts for which Franklin Templeton Variable Insurance Products Trust serves as an underlying investment vehicle. Total return is not annualized for periods less than one year.
dRatios are annualized for periods less than one year.
eBenefit of expense reduction rounds to less than 0.01%.
| | | | |
| | | |
FUS-6 | | Semiannual Report | The accompanying notes are an integral part of these financial statements. | | |
FRANKLIN TEMPLETON VARIABLE INSURANCE PRODUCTS TRUST
Statement of Investments, June 30, 2019 (unaudited)
Franklin U.S. Government Securities VIP Fund
| | | | | | | | |
| | |
| | | Principal
Amount | | | Value | |
| | |
Mortgage-Backed Securities 79.1% | | | | | | | | |
aFederal Home Loan Mortgage Corp. (FHLMC) Adjustable Rate 1.0% | | | | | | | | |
FHLMC, 4.681%,(12-month USD LIBOR +/- MBS Margin), 4/01/40 | | $ | 5,219,363 | | | $ | 5,500,463 | |
FHLMC, 4.66% - 4.762%,(12-month USD LIBOR +/- MBS Margin), 3/01/36 - 5/01/38 | | | 5,325,810 | | | | 5,600,079 | |
FHLMC, 4.764%, (US 1 Year CMTT-Note +/- MBS Margin), 5/01/37 | | | 408,860 | | | | 430,455 | |
| | | | | | | | |
| | |
| | | | | | | 11,530,997 | |
| | | | | | | | |
Federal Home Loan Mortgage Corp. (FHLMC) Fixed Rate 9.4% | | | | | | | | |
FHLMC 30 Year, 3.50%, 12/01/47 | | | 7,133,252 | | | | 7,354,713 | |
FHLMC 30 Year, 8.50%, 9/01/20 | | | 17 | | | | 17 | |
FHLMC Gold 15 Year, 4.50%, 3/01/25 - 4/01/25 | | | 692,048 | | | | 717,428 | |
FHLMC Gold 30 Year, 3.00%, 5/01/43 | | | 416,061 | | | | 423,428 | |
FHLMC Gold 30 Year, 3.00%, 6/01/46 | | | 33,568,620 | | | | 34,029,939 | |
FHLMC Gold 30 Year, 3.00%, 10/01/46 | | | 23,747,425 | | | | 24,068,886 | |
FHLMC Gold 30 Year, 3.50%, 3/01/32 - 5/01/43 | | | 3,214,500 | | | | 3,336,085 | |
FHLMC Gold 30 Year, 3.50%, 1/01/48 | | | 13,418,819 | | | | 13,817,262 | |
FHLMC Gold 30 Year, 4.00%, 9/01/40 - 1/01/48 | | | 10,501,763 | | | | 11,024,993 | |
FHLMC Gold 30 Year, 4.00%, 5/01/48 | | | 3,593,790 | | | | 3,740,506 | |
FHLMC Gold 30 Year, 4.50%, 5/01/40 - 7/01/41 | | | 2,011,714 | | | | 2,162,781 | |
FHLMC Gold 30 Year, 5.00%, 9/01/33 - 4/01/40 | | | 4,415,562 | | | | 4,799,773 | |
FHLMC Gold 30 Year, 5.50%, 7/01/33 - 5/01/38 | | | 1,003,312 | | | | 1,108,568 | |
FHLMC Gold 30 Year, 6.00%, 1/01/24 - 8/01/35 | | | 710,746 | | | | 790,080 | |
FHLMC Gold 30 Year, 6.50%, 12/01/23 - 5/01/35 | | | 329,642 | | | | 366,626 | |
FHLMC Gold 30 Year, 7.00%, 4/01/24 - 9/01/31 | | | 109,545 | | | | 119,975 | |
FHLMC Gold 30 Year, 7.50%, 12/01/22 | | | 320 | | | | 322 | |
FHLMC Gold 30 Year, 8.00%, 9/01/21 - 5/01/22 | | | 1,563 | | | | 1,637 | |
FHLMC Gold 30 Year, 8.50%, 7/01/31 | | | 214,736 | | | | 246,589 | |
| | | | | | | | |
| | |
| | | | | | | 108,109,608 | |
| | | | | | | | |
aFederal National Mortgage Association (FNMA) Adjustable Rate 3.4% | | | | | | | | |
FNMA, 3.994% - 4.499%,(12-month USD LIBOR +/- MBS Margin), 5/01/33 - 1/01/40 | | | 8,409,429 | | | | 8,777,735 | |
FNMA, 4.739%,(12-month USD LIBOR +/- MBS Margin), 9/01/37 | | | 12,087,544 | | | | 12,771,321 | |
FNMA, 4.501% - 5.005%,(12-month USD LIBOR +/- MBS Margin), 1/01/32 - 3/01/47 | | | 5,698,232 | | | | 5,962,612 | |
FNMA, 3.704% - 5.348%, (US 1 Year CMTT-Note +/- MBS Margin), 10/01/19 - 10/01/44 | | | 9,360,342 | | | | 9,811,140 | |
FNMA, 2.208% - 5.383%, (11th District COF +/- MBS Margin), 6/01/25 - 6/01/38 | | | 130,046 | | | | 131,391 | |
FNMA, 3.21% - 5.758%, (US 3 Year CMTT-Note +/- MBS Margin), 3/01/20 - 3/01/29 | | | 25,006 | | | | 25,916 | |
FNMA, 3.677% - 5.918%,(6-month USD LIBOR +/- MBS Margin), 6/01/21 - 7/01/37 | | | 871,988 | | | | 893,792 | |
| | | | | | | | |
| | |
| | | | | | | 38,373,907 | |
| | | | | | | | |
Federal National Mortgage Association (FNMA) Fixed Rate 13.2% | | | | | | | | |
FNMA 15 Year, 2.64%, 7/01/25 | | | 2,460,899 | | | | 2,511,443 | |
FNMA 15 Year, 2.77%, 4/01/25 | | | 3,500,000 | | | | 3,597,062 | |
FNMA 15 Year, 2.99%, 11/01/24 | | | 2,922,455 | | | | 3,034,361 | |
FNMA 15 Year, 3.14%, 10/01/25 | | | 4,000,000 | | | | 4,162,366 | |
FNMA 15 Year, 3.28%, 7/01/27 | | | 4,000,000 | | | | 4,241,833 | |
FNMA 15 Year, 3.51%, 8/01/23 | | | 3,000,000 | | | | 3,160,541 | |
FNMA 15 Year, 5.50%, 1/01/25 | | | 645,514 | | | | 674,141 | |
FNMA 30 Year, 3.00%, 12/01/42 | | | 175,537 | | | | 178,058 | |
FNMA 30 Year, 3.00%, 9/01/47 | | | 18,189,644 | | | | 18,373,017 | |
FRANKLIN TEMPLETON VARIABLE INSURANCE PRODUCTS TRUST
STATEMENT OF INVESTMENTS (UNAUDITED)
Franklin U.S. Government Securities VIP Fund(continued)
| | | | | | | | |
| | |
| | | Principal
Amount | | | Value | |
| | |
Mortgage-Backed Securities(continued) | | | | | | | | |
Federal National Mortgage Association (FNMA) Fixed Rate(continued) | | | | | | | | |
FNMA 30 Year, 3.50%, 7/01/45 | | $ | 31,020,969 | | | $ | 31,993,703 | |
FNMA 30 Year, 4.00%, 1/01/41 - 8/01/41 | | | 6,828,979 | | | | 7,203,753 | |
FNMA 30 Year, 4.00%, 10/01/47 | | | 12,308,556 | | | | 12,867,293 | |
FNMA 30 Year, 4.00%, 4/01/48 | | | 39,996,522 | | | | 41,593,825 | |
FNMA 30 Year, 4.50%, 8/01/40 - 6/01/41 | | | 7,065,321 | | | | 7,590,940 | |
FNMA 30 Year, 5.00%, 3/01/34 - 7/01/41 | | | 3,789,816 | | | | 4,120,995 | |
FNMA 30 Year, 5.50%, 12/01/32 - 8/01/35 | | | 1,588,019 | | | | 1,739,638 | |
FNMA 30 Year, 6.00%, 1/01/24 - 8/01/38 | | | 1,709,091 | | | | 1,905,809 | |
FNMA 30 Year, 6.50%, 1/01/24 - 9/01/36 | | | 250,392 | | | | 284,492 | |
FNMA 30 Year, 7.50%, 4/01/23 - 8/01/25 | | | 13,652 | | | | 13,900 | |
FNMA 30 Year, 8.00%, 3/01/22 - 12/01/24 | | | 59,577 | | | | 60,320 | |
FNMA 30 Year, 8.50%, 3/01/20 - 6/01/21 | | | 121 | | | | 122 | |
FNMA 30 Year, 9.00%, 10/01/26 | | | 45,981 | | | | 46,913 | |
FNMA PL 30 Year, 5.50%, 4/01/34 | | | 1,032,782 | | | | 1,112,119 | |
| | | | | | | | |
| | |
| | | | | | | 150,466,644 | |
| | | | | | | | |
Government National Mortgage Association (GNMA) Fixed Rate 52.1% | | | | | | | | |
GNMA I SF 30 Year, 3.00%, 7/15/42 | | | 445,253 | | | | 455,978 | |
GNMA I SF 30 Year, 4.00%, 10/15/40 - 8/15/46 | | | 9,610,909 | | | | 10,194,777 | |
GNMA I SF 30 Year, 4.50%, 1/15/39 - 6/15/40 | | | 9,456,034 | | | | 10,219,065 | |
GNMA I SF 30 Year, 4.50%, 7/15/40 - 6/15/41 | | | 3,817,497 | | | | 4,118,238 | |
GNMA I SF 30 Year, 5.00%, 6/15/30 - 11/15/39 | | | 9,670,957 | | | | 10,566,711 | |
GNMA I SF 30 Year, 5.00%, 11/15/39 - 9/15/40 | | | 9,605,057 | | | | 10,560,185 | |
GNMA I SF 30 Year, 5.50%, 12/15/28 - 10/15/39 | | | 4,823,298 | | | | 5,313,170 | |
GNMA I SF 30 Year, 6.00%, 11/15/23 - 11/15/38 | | | 2,271,612 | | | | 2,552,703 | |
GNMA I SF 30 Year, 6.50%, 6/15/23 - 9/15/38 | | | 1,217,526 | | | | 1,353,277 | |
GNMA I SF 30 Year, 7.00%, 9/15/22 - 1/15/32 | | | 260,311 | | | | 269,258 | |
GNMA I SF 30 Year, 7.50%, 2/15/22 - 8/15/33 | | | 336,272 | | | | 379,803 | |
GNMA I SF 30 Year, 8.00%, 12/15/21 - 7/15/23 | | | 63,898 | | | | 65,160 | |
GNMA I SF 30 Year, 8.50%, 6/15/22 - 12/15/24 | | | 25,650 | | | | 26,110 | |
GNMA I SF 30 Year, 9.00%, 3/15/20 | | | 119 | | | | 119 | |
GNMA I SF 30 Year, 9.50%, 4/15/20 - 12/15/20 | | | 6,038 | | | | 6,062 | |
GNMA I SF 30 Year, 10.00%, 2/15/20 - 8/15/21 | | | 1,067 | | | | 1,070 | |
GNMA II SF 30 Year, 3.00%, 12/20/42 - 2/20/45 | | | 2,158,996 | | | | 2,217,115 | |
GNMA II SF 30 Year, 3.00%, 9/20/45 | | | 8,892,443 | | | | 9,101,390 | |
GNMA II SF 30 Year, 3.00%, 4/20/46 | | | 25,602,231 | | | | 26,202,870 | |
GNMA II SF 30 Year, 3.00%, 7/20/47 | | | 20,220,498 | | | | 20,684,528 | |
bGNMA II SF 30 Year, 3.00%, 6/01/49 | | | 11,000,000 | | | | 11,235,899 | |
GNMA II SF 30 Year, 3.00%, 6/20/49 | | | 15,000,000 | | | | 15,344,227 | |
GNMA II SF 30 Year, 3.50%, 12/20/40 - 8/20/43 | | | 2,196,785 | | | | 2,293,152 | |
GNMA II SF 30 Year, 3.50%, 8/20/42 | | | 6,138,977 | | | | 6,407,170 | |
GNMA II SF 30 Year, 3.50%, 9/20/42 | | | 17,922,608 | | | | 18,703,762 | |
GNMA II SF 30 Year, 3.50%, 10/20/42 | | | 5,458,758 | | | | 5,696,183 | |
GNMA II SF 30 Year, 3.50%, 11/20/42 | | | 10,748,110 | | | | 11,215,563 | |
GNMA II SF 30 Year, 3.50%, 12/20/42 | | | 8,132,824 | | | | 8,485,640 | |
GNMA II SF 30 Year, 3.50%, 1/20/43 | | | 13,651,498 | | | | 14,243,815 | |
GNMA II SF 30 Year, 3.50%, 3/20/43 | | | 4,878,785 | | | | 5,088,937 | |
FRANKLIN TEMPLETON VARIABLE INSURANCE PRODUCTS TRUST
STATEMENT OF INVESTMENTS (UNAUDITED)
Franklin U.S. Government Securities VIP Fund(continued)
| | | | | | | | |
| | | Principal
Amount | | | Value | |
| |
| | |
Mortgage-Backed Securities(continued) | | | | | | | | |
Government National Mortgage Association (GNMA) Fixed Rate(continued) | | | | | | | | |
GNMA II SF 30 Year, 3.50%, 4/20/43 | | $ | 6,106,980 | | | $ | 6,369,607 | |
GNMA II SF 30 Year, 3.50%, 5/20/43 | | | 11,254,367 | | | | 11,737,994 | |
GNMA II SF 30 Year, 3.50%, 6/20/43 | | | 5,142,856 | | | | 5,362,416 | |
GNMA II SF 30 Year, 3.50%, 9/20/47 | | | 84,377,742 | | | | 87,233,959 | |
GNMA II SF 30 Year, 3.50%, 10/20/47 | | | 6,941,210 | | | | 7,175,424 | |
GNMA II SF 30 Year, 3.50%, 11/20/47 | | | 125,377,593 | | | | 129,597,386 | |
GNMA II SF 30 Year, 4.00%, 11/20/39 - 9/20/41 | | | 10,486,421 | | | | 11,106,880 | |
GNMA II SF 30 Year, 4.00%, 11/20/41 | | | 5,949,433 | | | | 6,303,464 | |
GNMA II SF 30 Year, 4.00%, 12/20/41 - 2/20/44 | | | 2,832,461 | | | | 2,978,877 | |
GNMA II SF 30 Year, 4.00%, 11/20/48 | | | 21,308,360 | | | | 22,097,783 | |
GNMA II SF 30 Year, 4.00%, 5/20/49 | | | 45,244,643 | | | | 47,112,266 | |
GNMA II SF 30 Year, 4.50%, 10/20/39 - 6/20/41 | | | 9,117,716 | | | | 9,730,944 | |
GNMA II SF 30 Year, 4.50%, 7/20/41 - 2/20/44 | | | 9,109,638 | | | | 9,713,847 | |
GNMA II SF 30 Year, 4.50%, 9/20/41 | | | 4,695,973 | | | | 5,012,391 | |
GNMA II SF 30 Year, 4.50%, 10/20/44 | | | 2,469,384 | | | | 2,620,812 | |
GNMA II SF 30 Year, 5.00%, 9/20/33 - 6/20/44 | | | 10,064,740 | | | | 11,018,336 | |
GNMA II SF 30 Year, 5.50%, 5/20/34 - 6/20/38 | | | 3,914,261 | | | | 4,289,933 | |
GNMA II SF 30 Year, 6.00%, 11/20/23 - 7/20/39 | | | 2,492,892 | | | | 2,851,915 | |
GNMA II SF 30 Year, 6.50%, 12/20/27 - 4/20/34 | | | 389,198 | | | | 442,153 | |
GNMA II SF 30 Year, 7.00%, 5/20/32 | | | 7,074 | | | | 8,322 | |
GNMA II SF 30 Year, 7.50%, 9/20/22 - 11/20/26 | | | 57,218 | | | | 62,505 | |
GNMA II SF 30 Year, 8.00%, 8/20/26 | | | 3,911 | | | | 4,450 | |
GNMA II SF 30 Year, 9.50%, 4/20/25 | | | 1,778 | | | | 1,783 | |
| | | | | | | | |
| | |
| | | | | | | 595,835,384 | |
| | | | | | | | |
| | |
Total Mortgage-Backed Securities (Cost $903,144,937) | | | | | | | 904,316,540 | |
| | | | | | | | |
| | |
U.S. Government and Agency Securities 17.8% | | | | | | | | |
DY9 Leasing LLC, secured bond, 2.372%, 3/19/27 | | | 2,448,007 | | | | 2,472,126 | |
Federal Agricultural Mortgage Corp., | | | | | | | | |
1.41%, 3/06/20 | | | 10,000,000 | | | | 9,938,622 | |
2.66%, 4/12/22 | | | 7,000,000 | | | | 7,131,850 | |
FHLB, 2.625%, 9/12/25 | | | 20,000,000 | | | | 20,689,426 | |
FICO,D-P, Strip, 9/26/19 | | | 7,605,000 | | | | 7,564,861 | |
Israel Government Agency for International Development Bond, | | | | | | | | |
5.50%, 9/18/23 | | | 12,000,000 | | | | 13,718,207 | |
7-Z, U.S. Government Guaranteed, Strip, 8/15/22 | | | 5,619,000 | | | | 5,274,356 | |
New Valley Generation IV, secured bond, 4.687%, 1/15/22 | | | 1,057,020 | | | | 1,089,539 | |
Overseas Private Investment Corp., | | | | | | | | |
A, Strip, 11/15/20 | | | 2,575,000 | | | | 3,261,012 | |
senior bond, 4.01%, 5/15/30 | | | 1,785,000 | | | | 1,946,971 | |
Petroleos Mexicanos, 2.378%, 4/15/25 | | | 1,974,000 | | | | 1,991,529 | |
Private Export Funding Corp., | | | | | | | | |
secured bond, 2.80%, 5/15/22 | | | 9,000,000 | | | | 9,255,714 | |
secured note, 4.30%, 12/15/21 | | | 1,865,000 | | | | 1,967,709 | |
secured note, LL, 2.25%, 3/15/20 | | | 1,700,000 | | | | 1,700,176 | |
senior secured note, MM, 2.30%, 9/15/20 | | | 3,500,000 | | | | 3,510,901 | |
FRANKLIN TEMPLETON VARIABLE INSURANCE PRODUCTS TRUST
STATEMENT OF INVESTMENTS (UNAUDITED)
Franklin U.S. Government Securities VIP Fund(continued)
| | | | | | | | |
| | |
| | | Principal
Amount | | | Value | |
| |
| | |
U.S. Government and Agency Securities(continued) | | | | | | | | |
Reliance Industries Ltd., | | | | | | | | |
senior bond, 2.512%, 1/15/26 | | $ | 9,187,500 | | | $ | 9,296,659 | |
senior note, 2.06%, 1/15/26 | | | 4,375,000 | | | | 4,379,879 | |
Tunisia Government Agency for International Development Bonds, 1.686%, 7/16/19 | | | 7,000,000 | | | | 7,032,965 | |
TVA, | | | | | | | | |
1.875%, 8/15/22 | | | 6,000,000 | | | | 6,003,597 | |
5.88%, 4/01/36 | | | 5,000,000 | | | | 6,894,217 | |
Strip, 6/15/20 | | | 6,138,000 | | | | 6,014,097 | |
U.S. Treasury Bond, | | | | | | | | |
2.50%, 2/15/46 | | | 4,000,000 | | | | 3,974,531 | |
cIndex Linked, 2.00%, 1/15/26 | | | 1,930,974 | | | | 2,149,480 | |
cIndex Linked, 1.75%, 1/15/28 | | | 9,756,848 | | | | 10,944,070 | |
cIndex Linked, 3.625%, 4/15/28 | | | 7,898,576 | | | | 10,145,319 | |
U.S. Treasury Note, | | | | | | | | |
2.375%, 8/15/24 | | | 22,000,000 | | | | 22,635,937 | |
2.25%, 8/15/27 | | | 6,000,000 | | | | 6,142,500 | |
cIndex Linked, 0.125%, 7/15/24 | | | 16,678,738 | | | | 16,656,606 | |
| | | | | | | | |
| | |
Total U.S. Government and Agency Securities (Cost $199,322,741) | | | | | | | 203,782,856 | |
| | | | | | | | |
| | |
Total Investments before Short Term Investments
(Cost $1,102,467,678) | | | | | | | 1,108,099,396 | |
| | | | | | | | |
| | |
Short Term Investments (Cost $44,335,086) 3.9% | | | | | | | | |
| | |
Repurchase Agreements 3.9% | | | | | | | | |
dJoint Repurchase Agreement, 2.451%, 7/01/19 (Maturity Value $44,344,143) | | | | | | | | |
BNP Paribas Securities Corp. (Maturity Value $32,972,531) | | | | | | | | |
Deutsche Bank Securities Inc. (Maturity Value $9,722,897) | | | | | | | | |
HSBC Securities (USA) Inc. (Maturity Value $1,648,715) | | | | | | | | |
Collateralized by U.S. Government Agency Securities, 4.00% - 4.50%, 7/15/40 - 3/20/49; U.S. Treasury Bonds, 8.00%, 11/15/21; U.S. Treasury Notes, 1.50% - 3.125%, 5/15/21 - 8/15/26; U.S. Treasury Notes, Index Linked, 0.875%, 1/15/29; and U.S. Treasury Strips, 8/15/22 - 6/15/35 (valued at $45,426,256) | | | 44,335,086 | | | | 44,335,086 | |
| | | | | | | | |
| | |
Total Investments (Cost $1,146,802,764) 100.8% | | | | | | | 1,152,434,482 | |
Other Assets, less Liabilities (0.8)% | | | | | | | (8,983,658 | ) |
| | | | | | | | |
| | |
Net Assets 100.0% | | | | | | $ | 1,143,450,824 | |
| | | | | | | | |
See Abbreviations on pageFUS-19.
aAdjustable Rate Mortgage-Backed Security (ARM); the rate shown is the effective rate at period end. ARM rates are not based on a published reference rate and spread, but instead pass-through weighted average interest income inclusive of any caps or floors, if applicable, from the underlying mortgage loans in which the majority of mortgages pay interest based on the index shown at their designated reset dates plus a spread, less the applicable servicing and guaranty fee (MBS margin).
bSecurity purchased on ato-be-announced (TBA) basis. See Note 1(c).
cPrincipal amount of security is adjusted for inflation. See Note 1(e).
dSee Note 1(b) regarding joint repurchase agreement.
| | | | |
| | | |
FUS-10 | | Semiannual Report | The accompanying notes are an integral part of these financial statements. | | |
FRANKLIN TEMPLETON VARIABLE INSURANCE PRODUCTS TRUST
FINANCIAL STATEMENTS
Statement of Assets and Liabilities
June 30, 2019 (unaudited)
| | | | |
| |
| | | Franklin U.S.
Government
Securities VIP Fund | |
| |
| |
Assets: | | | | |
Investments in securities: | | | | |
Cost - Unaffiliated issuers | | $ | 1,102,467,678 | |
Cost - Unaffiliated repurchase agreements | | | 44,335,086 | |
| | | | |
| |
Value - Unaffiliated issuers | | $ | 1,108,099,396 | |
Value - Unaffiliated repurchase agreements | | | 44,335,086 | |
Receivables: | | | | |
Investment securities sold | | | 304,585 | |
Capital shares sold | | | 12,196 | |
Interest | | | 3,957,799 | |
Other assets | | | 814 | |
| | | | |
| |
Total assets | | | 1,156,709,876 | |
| | | | |
| |
Liabilities: | | | | |
Payables: | | | | |
Investment securities purchased | | | 11,243,117 | |
Capital shares redeemed | | | 961,207 | |
Management fees | | | 442,946 | |
Distribution fees | | | 454,252 | |
Trustees’ fees and expenses | | | 1,302 | |
Accrued expenses and other liabilities | | | 156,228 | |
| | | | |
| |
Total liabilities | | | 13,259,052 | |
| | | | |
| |
Net assets, at value | | $ | 1,143,450,824 | |
| | | | |
| |
Net assets consist of: | | | | |
Paid-in capital | | $ | 1,222,839,296 | |
Total distributable earnings (loss) | | | (79,388,472 | ) |
| | | | |
| |
Net assets, at value | | $ | 1,143,450,824 | |
| | | | |
| |
| Class 1: | | | | |
Net assets, at value | | $ | 56,770,037 | |
| | | | |
Shares outstanding | | | 4,669,230 | |
| | | | |
Net asset value and maximum offering price per share | | $ | 12.16 | |
| | | | |
| |
| Class 2: | | | | |
Net assets, at value | | $ | 1,086,680,787 | |
| | | | |
Shares outstanding | | | 91,398,696 | |
| | | | |
Net asset value and maximum offering price per share | | $ | 11.89 | |
| | | | |
| | | | | | |
| | | |
| | The accompanying notes are an integral part of these financial statements. | Semiannual Report | | | FUS-11 | |
FRANKLIN TEMPLETON VARIABLE INSURANCE PRODUCTS TRUST
FINANCIAL STATEMENTS
Statement of Operations
for the six months ended June 30, 2019 (unaudited)
| | | | |
| |
| | | Franklin U.S.
Government
Securities VIP Fund | |
| |
| |
Investment income: | | | | |
Interest: | | | | |
Unaffiliated issuers: | | | | |
Paydown gain (loss) | | | $ (2,590,498 | ) |
Paid in cash | | | 19,200,054 | |
| | | | |
| |
Total investment income | | | 16,609,556 | |
| | | | |
| |
Expenses: | | | | |
Management fees (Note 3a) | | | 2,672,321 | |
Distribution fees: (Note 3c) | | | | |
Class 2 | | | 1,345,995 | |
Custodian fees (Note 4) | | | 5,111 | |
Reports to shareholders | | | 66,962 | |
Professional fees | | | 30,571 | |
Trustees’ fees and expenses | | | 4,714 | |
Other | | | 64,853 | |
| | | | |
| |
Total expenses | | | 4,190,527 | |
Expense reductions (Note 4) | | | (4 | ) |
| | | | |
| |
Net expenses | | | 4,190,523 | |
| | | | |
| |
Net investment income | | | 12,419,033 | |
| | | | |
| |
Realized and unrealized gains (losses): | | | | |
Net realized gain (loss) from: | | | | |
Investments: | | | | |
Unaffiliated issuers | | | (373,626 | ) |
| | | | |
| |
Net change in unrealized appreciation (depreciation) on: | | | | |
Investments: | | | | |
Unaffiliated issuers | | | 30,577,963 | |
| | | | |
| |
Net realized and unrealized gain (loss) | | | 30,204,337 | |
| | | | |
| |
Net increase (decrease) in net assets resulting from operations | | | $42,623,370 | |
| | | | |
| | | | |
| | | |
FUS-12 | | Semiannual Report | The accompanying notes are an integral part of these financial statements. | | |
FRANKLIN TEMPLETON VARIABLE INSURANCE PRODUCTS TRUST
FINANCIAL STATEMENTS
Statements of Changes in Net Assets
| | | | | | | | |
| |
| | | Franklin U.S. Government
Securities VIP Fund | |
| | |
| | | Six Months Ended
June 30, 2019
(unaudited) | | | Year Ended
December 31, 2018 | |
| |
| | |
Increase (decrease) in net assets: | | | | | | | | |
Operations: | | | | | | | | |
Net investment income | | | $ 12,419,033 | | | $ | 26,174,868 | |
Net realized gain (loss) | | | (373,626 | ) | | | (3,111,667 | ) |
Net change in unrealized appreciation (depreciation) | | | 30,577,963 | | | | (20,898,185 | ) |
| | | | |
| | |
Net increase (decrease) in net assets resulting from operations | | | 42,623,370 | | | | 2,165,016 | |
| | | | |
| | |
Distributions to shareholders: | | | | | | | | |
Class 1 | | | (1,737,360 | ) | | | (1,830,491 | ) |
Class 2 | | | (31,230,563 | ) | | | (31,691,784 | ) |
| | | | |
| | |
Total distributions to shareholders | | | (32,967,923 | ) | | | (33,522,275 | ) |
| | | | |
| | |
Capital share transactions: (Note 2) | | | | | | | | |
Class 1 | | | (2,886,794 | ) | | | (5,618,467 | ) |
Class 2 | | | (28,157,581 | ) | | | (88,079,314 | ) |
| | | | |
| | |
Total capital share transactions | | | (31,044,375 | ) | | | (93,697,781 | ) |
| | | | |
| | |
Net increase (decrease) in net assets | | | (21,388,928 | ) | | | (125,055,040 | ) |
Net assets: | | | | | | | | |
Beginning of period | | | 1,164,839,752 | | | | 1,289,894,792 | |
| | | | |
| | |
End of period | | | $1,143,450,824 | | | $ | 1,164,839,752 | |
| | | | |
| | | | | | |
| | | |
| | The accompanying notes are an integral part of these financial statements. | Semiannual Report | | | FUS-13 | |
FRANKLIN TEMPLETON VARIABLE INSURANCE PRODUCTS TRUST
Notes to Financial Statements (unaudited)
Franklin U.S. Government Securities VIP Fund
1. Organization and Significant Accounting Policies
Franklin Templeton Variable Insurance Products Trust (Trust) is registered under the Investment Company Act of 1940 (1940 Act) as anopen-end management investment company, consisting of eighteen separate funds and applies the specialized accounting and reporting guidance in U.S. Generally Accepted Accounting Principles (U.S. GAAP). Franklin U.S. Government Securities VIP Fund (Fund) is included in this report. Shares of the Fund are generally sold only to insurance company separate accounts to fund the benefits of variable life insurance policies or variable annuity contracts. At June 30, 2019, 43.1% of the Fund’s shares were held through one insurance company. The Fund offers two classes of shares: Class 1 and Class 2. Each class of shares may differ by its distribution fees, voting rights on matters affecting a single class and its exchange privilege.
The following summarizes the Fund’s significant accounting policies.
a. Financial Instrument Valuation
The Fund’s investments in financial instruments are carried at fair value daily. Fair value is the price that would be received to sell an asset or paid to transfer a liability in an orderly transaction between market participants on the measurement date. The Fund calculates the net asset value (NAV) per share each business day as of 4 p.m. Eastern time or the regularly scheduled close of the New York Stock Exchange (NYSE), whichever is earlier. Under compliance policies and procedures approved by the Trust’s Board of Trustees (the Board), the Fund’s administrator has responsibility for oversight of valuation, including leading the cross-functional Valuation Committee (VC). The Fund may utilize independent pricing services, quotations from securities and financial instrument dealers, and other market sources to determine fair value.
Debt securities generally trade in theover-the-counter market rather than on a securities exchange. The Fund’s pricing services use multiple valuation techniques to determine fair value. In instances where sufficient market activity exists, the pricing services may utilize a market-based approach through which quotes from market makers are used to determine fair value. In instances where sufficient market activity may not exist or is limited, the pricing services also utilize proprietary valuation models which may consider market characteristics such as benchmark yield curves, credit spreads, estimated default rates, anticipated market interest rate volatility, coupon
rates, anticipated timing of principal repayments, underlying collateral, and other unique security features in order to estimate the relevant cash flows, which are then discounted to calculate the fair value.
Investments in repurchase agreements are valued at cost, which approximates fair value.
The Fund has procedures to determine the fair value of financial instruments for which market prices are not reliable or readily available. Under these procedures, the Fund primarily employs a market-based approach which may use related or comparable assets or liabilities, recent transactions, market multiples, book values, and other relevant information for the investment to determine the fair value of the investment. An income-based valuation approach may also be used in which the anticipated future cash flows of the investment are discounted to calculate fair value. Discounts may also be applied due to the nature or duration of any restrictions on the disposition of the investments. Due to the inherent uncertainty of valuations of such investments, the fair values may differ significantly from the values that would have been used had an active market existed.
b. Joint Repurchase Agreement
The Fund enters into a joint repurchase agreement whereby its uninvested cash balance is deposited into a joint cash account with other funds managed by the investment manager or an affiliate of the investment manager and is used to invest in one or more repurchase agreements. The value and face amount of the joint repurchase agreement are allocated to the funds based on theirpro-rata interest. A repurchase agreement is accounted for as a loan by the Fund to the seller, collateralized by securities which are delivered to the Fund’s custodian. The fair value, including accrued interest, of the initial collateralization is required to be at least 102% of the dollar amount invested by the funds, with the value of the underlying securities marked to market daily to maintain coverage of at least 100%. Repurchase agreements are subject to the terms of Master Repurchase Agreements (MRAs) with approved counterparties (sellers). The MRAs contain various provisions, including but not limited to events of default and maintenance of collateral for repurchase agreements. In the event of default by either the seller or the Fund, certain MRAs may permit thenon-defaulting party to net andclose-out all transactions, if any, traded under such agreements. The Fund may sell securities it holds as collateral and apply the proceeds towards the repurchase
FRANKLIN TEMPLETON VARIABLE INSURANCE PRODUCTS TRUST
NOTES TO FINANCIAL STATEMENTS (UNAUDITED)
Franklin U.S. Government Securities VIP Fund(continued)
price and any other amounts owed by the seller to the Fund in the event of default by the seller. This could involve costs or delays in addition to a loss on the securities if their value falls below the repurchase price owed by the seller. The joint repurchase agreement held by the Fund at period end, as indicated in the Statement of Investments, had been entered into on June 28, 2019.
c. Securities Purchased on a TBA Basis
The Fund purchases securities on ato-be-announced (TBA) basis, with payment and delivery scheduled for a future date. These transactions are subject to market fluctuations and are subject to the risk that the value at delivery may be more or less than the trade date purchase price. Sufficient assets have been segregated for these securities.
d. Income Taxes
It is the Fund’s policy to qualify as a regulated investment company under the Internal Revenue Code. The Fund intends to distribute to shareholders substantially all of its taxable income and net realized gains to relieve it from federal income and if applicable, excise taxes. As a result, no provision for U.S. federal income taxes is required.
The Fund may recognize an income tax liability related to its uncertain tax positions under U.S. GAAP when the uncertain tax position has a less than 50% probability that it will be sustained upon examination by the tax authorities based on its technical merits. As of June 30, 2019, the Fund has determined that no tax liability is required in its financial statements related to uncertain tax positions for any open tax years (or expected to be taken in future tax years). Open tax years are those that remain subject to examination and are based on the statute of limitations in each jurisdiction in which the Fund invests.
e. Security Transactions, Investment Income, Expenses and Distributions
Security transactions are accounted for on trade date. Realized gains and losses on security transactions are determined on a specific identification basis. Interest income and estimated expenses are accrued daily. Amortization of premium and accretion of discount on debt securities are included in interest income. Paydown gains and losses are recorded separately in the Statement of Operations. Distributions to shareholders are recorded on theex-dividend date. Distributable earnings are determined according to
income tax regulations (tax basis) and may differ from earnings recorded in accordance with U.S. GAAP. These differences may be permanent or temporary. Permanent differences are reclassified among capital accounts to reflect their tax character. These reclassifications have no impact on net assets or the results of operations. Temporary differences are not reclassified, as they may reverse in subsequent periods.
Common expenses incurred by the Trust are allocated among the Funds based on the ratio of net assets of each Fund to the combined net assets of the Trust or based on the ratio of number of shareholders of each Fund to the combined number of shareholders of the Trust. Fund specific expenses are charged directly to the Fund that incurred the expense.
Realized and unrealized gains and losses and net investment income, excluding class specific expenses, are allocated daily to each class of shares based upon the relative proportion of net assets of each class. Differences in per share distributions by class are generally due to differences in class specific expenses.
Inflation-indexed bonds are adjusted for inflation through periodic increases or decreases in the security’s interest accruals, face amount, or principal redemption value, by amounts corresponding to the rate of inflation as measured by an index. Any increase or decrease in the face amount or principal redemption value will be included as interest income in the Statement of Operations.
f. Accounting Estimates
The preparation of financial statements in accordance with U.S. GAAP requires management to make estimates and assumptions that affect the reported amounts of assets and liabilities at the date of the financial statements and the amounts of income and expenses during the reporting period. Actual results could differ from those estimates.
g. Guarantees and Indemnifications
Under the Trust’s organizational documents, its officers and trustees are indemnified by the Trust against certain liabilities arising out of the performance of their duties to the Trust. Additionally, in the normal course of business, the Trust, on behalf of the Fund, enters into contracts with service providers that contain general indemnification clauses. The Trust’s maximum exposure under these arrangements is
FRANKLIN TEMPLETON VARIABLE INSURANCE PRODUCTS TRUST
NOTES TO FINANCIAL STATEMENTS (UNAUDITED)
Franklin U.S. Government Securities VIP Fund(continued)
1. Organization and Significant Accounting
Policies(continued)
g. Guarantees and Indemnifications(continued)
unknown as this would involve future claims that may be made against the Trust that have not yet occurred. Currently, the Trust expects the risk of loss to be remote.
2. Shares of Beneficial Interest
At June 30, 2019, there were an unlimited number of shares authorized (without par value). Transactions in the Fund’s shares were as follows:
| | | | | | | | | | | | | | | | |
| | |
| | | Six Months Ended
June 30, 2019 | | | Year Ended December 31, 2018 | |
| | | | |
| | | | |
| | | Shares | | | Amount | | | Shares | | | Amount | |
| |
| | | | |
| Class 1 Shares: | | | | | | | | | | | | | | | | |
Shares sold | | | 142,923 | | | $ | 1,745,272 | | | | 130,524 | | | $ | 1,575,698 | |
Shares issued in reinvestment of distributions | | | 143,584 | | | | 1,737,360 | | | | 154,472 | | | | 1,830,491 | |
Shares redeemed | | | (523,320 | ) | | | (6,369,426 | ) | | | (750,422 | ) | | | (9,024,656) | |
| | | | |
| | | | |
Net increase (decrease) | | | (236,813 | ) | | $ | (2,886,794 | ) | | | (465,426 | ) | | $ | (5,618,467) | |
| | | | |
| | | | |
| Class 2 Shares: | | | | | | | | | | | | | | | | |
Shares sold | | | 2,428,196 | | | $ | 29,127,162 | | | | 5,018,026 | | | $ | 59,241,587 | |
Shares issued in reinvestment of distributions | | | 2,639,946 | | | | 31,230,563 | | | | 2,734,407 | | | | 31,691,784 | |
Shares redeemed | | | (7,415,990 | ) | | | (88,515,306 | ) | | | (15,242,864 | ) | | | (179,012,685) | |
| | | | |
| | | | |
Net increase (decrease) | | | (2,347,848 | ) | | $ | (28,157,581 | ) | | | (7,490,431 | ) | | $ | (88,079,314) | |
| | | | |
3. Transactions with Affiliates
Franklin Resources, Inc. is the holding company for various subsidiaries that together are referred to as Franklin Templeton. Certain officers and trustees of the Fund are also officers and/or directors of the following subsidiaries:
| | |
| |
| Subsidiary | | Affiliation |
| |
Franklin Advisers, Inc. (Advisers) | | Investment manager |
| |
Franklin Templeton Services, LLC (FT Services) | | Administrative manager |
| |
Franklin Templeton Distributors, Inc. (Distributors) | | Principal underwriter |
| |
Franklin Templeton Investor Services, LLC (Investor Services) | | Transfer agent |
FRANKLIN TEMPLETON VARIABLE INSURANCE PRODUCTS TRUST
NOTES TO FINANCIAL STATEMENTS (UNAUDITED)
Franklin U.S. Government Securities VIP Fund(continued)
a. Management Fees
The Fund pays an investment management fee to Advisers based on the average daily net assets of the Fund as follows:
| | |
| |
| Annualized Fee Rate | | Net Assets |
| |
| 0.625% | | Up to and including $100 million |
| |
| 0.500% | | Over $100 million, up to and including $250 million |
| |
| 0.450% | | Over $250 million, up to and including $7.5 billion |
| |
| 0.440% | | Over $7.5 billion, up to and including $10 billion |
| |
| 0.430% | | Over $10 billion, up to and including $12.5 billion |
| |
| 0.420% | | Over $12.5 billion, up to and including $15 billion |
| |
| 0.400% | | In excess of $15 billion |
For the period ended June 30, 2019, the annualized gross effective investment management fee rate was 0.472% of the Fund’s average daily net assets.
b. Administrative Fees
Under an agreement with Advisers, FT Services provides administrative services to the Fund. The fee is paid by Advisers based on the Fund’s average daily net assets, and is not an additional expense of the Fund.
c. Distribution Fees
The Board has adopted distribution plans for Class 2 shares pursuant to Rule12b-1 under the 1940 Act. Under the Fund’s compensation distribution plans, the Fund pays Distributors for costs incurred in connection with the servicing, sale and distribution of the Fund’s shares up to 0.35% per year of its average daily net assets. The Board has agreed to limit the current rate to 0.25% per year for Class 2. The plan year, for purposes of monitoring compliance with the maximum annual plan rates, is February 1 through January 31.
d. Transfer Agent Fees
Investor Services, under terms of an agreement, performs shareholder servicing for the Fund and is not paid by the Fund for the services.
4. Expense Offset Arrangement
The Fund has entered into an arrangement with its custodian whereby credits realized as a result of uninvested cash balances are used to reduce a portion of the Fund’s custodian expenses. During the period ended June 30, 2019, the custodian fees were reduced as noted in the Statement of Operations.
5. Income Taxes
For tax purposes, capital losses may be carried over to offset future capital gains.
FRANKLIN TEMPLETON VARIABLE INSURANCE PRODUCTS TRUST
NOTES TO FINANCIAL STATEMENTS (UNAUDITED)
Franklin U.S. Government Securities VIP Fund(continued)
5. Income Taxes(continued)
At December 31, 2018, capital loss carryforwards were as follows:
| | | | |
Capital loss carryforwards not subject to expiration: | | | | |
Short term | | $ | 38,715,602 | |
| |
Long term | | | 54,934,163 | |
| | | | |
| |
Total capital loss carryforwards | | $ | 93,649,765 | |
| | | | |
At June 30, 2019, the cost of investments and net unrealized appreciation (depreciation) for income tax purposes were as follows:
| | | | |
Cost of investments | | $ | 1,150,451,324 | |
| | | | |
| |
Unrealized appreciation | | $ | 13,013,806 | |
Unrealized depreciation | | | (11,030,648) | |
| | | | |
| |
Net unrealized appreciation (depreciation) | | $ | 1,983,158 | |
| | | | |
Differences between income and/or capital gains as determined on a book basis and a tax basis are primarily due to differing treatments of paydown losses and bond discounts and premiums.
6. Investment Transactions
Purchases and sales of investments (excluding short term securities) for the period ended June 30, 2019, aggregated $162,438,429 and $216,456,934, respectively.
7. Credit Facility
The Fund, together with other U.S. registered and foreign investment funds (collectively, Borrowers), managed by Franklin Templeton, are borrowers in a joint syndicated senior unsecured credit facility totaling $2 billion (Global Credit Facility) which, matures on February 7, 2020. This Global Credit Facility provides a source of funds to the Borrowers for temporary and emergency purposes, including the ability to meet future unanticipated or unusually large redemption requests.
Under the terms of the Global Credit Facility, the Fund shall, in addition to interest charged on any borrowings made by the Fund and other costs incurred by the Fund, pay its share of fees and expenses incurred in connection with the implementation and maintenance of the Global Credit Facility, based upon its relative share of the aggregate net assets of all of the Borrowers, including an annual commitment fee of 0.15% based upon the unused portion of the Global Credit Facility. These fees are reflected in other expenses in the Statement of Operations. During the period ended June 30, 2019, the Fund did not use the Global Credit Facility.
8. Fair Value Measurements
The Fund follows a fair value hierarchy that distinguishes between market data obtained from independent sources (observable inputs) and the Fund’s own market assumptions (unobservable inputs). These inputs are used in determining the value of the Fund’s financial instruments and are summarized in the following fair value hierarchy:
| | • | | Level 1 – quoted prices in active markets for identical financial instruments |
FRANKLIN TEMPLETON VARIABLE INSURANCE PRODUCTS TRUST
NOTES TO FINANCIAL STATEMENTS (UNAUDITED)
Franklin U.S. Government Securities VIP Fund(continued)
| | • | | Level 2 – other significant observable inputs (including quoted prices for similar financial instruments, interest rates, prepayment speed, credit risk, etc.) |
| | • | | Level 3 – significant unobservable inputs (including the Fund’s own assumptions in determining the fair value of financial instruments) |
The input levels are not necessarily an indication of the risk or liquidity associated with financial instruments at that level.
At June 30, 2019, all of the Fund’s investments in financial instruments carried at fair value were valued using Level 2 inputs.
9. Subsequent Events
The Fund has evaluated subsequent events through the issuance of the financial statements and determined that no events have occurred that require disclosure.
Abbreviations
| | | | | | |
Currency | | Selected Portfolio |
| | | |
| USD | | United States Dollar | | CMT | | Constant Maturity Treasury Index |
| | | |
| | | | COF | | Cost of Funds |
| | | |
| | | | FHLB | | Federal Home Loan Bank |
| | | |
| | | | FICO | | Financing Corp. |
| | | |
| | | | LIBOR | | London InterBank Offered Rate |
| | | |
| | | | MBS | | Mortgage-Backed Security |
| | | |
| | | | PL | | Project Loan |
| | | |
| | | | SF | | Single Family |
| | | |
| | | | T-Note | | Treasury Note |
| | | |
| | | | TVA | | Tennessee Valley Authority |
This page intentionally left blank.
Franklin VolSmart Allocation VIP Fund
This semiannual report for Franklin VolSmart Allocation VIP Fund covers the period ended June 30, 2019.
Class 2 Performance Summary as of June 30, 2019
The Fund’s Class 2 Shares posted a +12.87% total return* for thesix-month period ended June 30, 2019.
*The Fund has an expense reduction and a fee waiver associated with any investments it makes in a Franklin Templeton money fund and/or other Franklin Templeton fund, contractually guaranteed through 4/30/20. Fund investment results reflect the expense reduction and fee waiver; without these reductions, the results would have been lower.
Performance reflects the Fund’s Class 2 operating expenses, but doesnotinclude any contract fees, expenses or sales charges. If they had been included, performance would be lower. These charges and deductions, particularly for variable life policies, can have a significant effect on contract values and insurance benefits. See the contract prospectus for a complete description of these expenses, including sales charges.
Performance data represent past performance, which does not guarantee future results. Investment return and principal value will fluctuate, and you may have a gain or loss when you sell your shares. Current performance may differ from figures shown.
FRANKLIN VOLSMART ALLOCATION VIP FUND
Fund Goal and Main Investments
The Fund seeks total return (including income and capital gains) while seeking to manage volatility. The Fund is structured as a limited“fund-of-funds” that seeks to achieve its investment goal by investing its assets partially in other mutual funds, which include other Franklin Templeton mutual funds as well as Franklin Templeton and third-party exchange-traded funds (ETFs) (underlying funds). Each underlying fund is allocated to the equity, fixed income, multi-class or cash asset class based on its predominant asset class and strategies. These underlying funds, in turn, invest in a variety of U.S. and foreign equity, fixed-income and money market securities. The Fund also obtains exposure to certain strategies and investments in its core portfolio by directly investing in the securities and instruments in that strategy.
Fund Risks
All investments involve risks, including possible loss of principal. There can be no guarantee that the Fund will stay within its target volatility. Also, the managed volatility and tail risk protection strategies could negatively impact the Fund’s return and expose the Fund to additional costs. Generally, investors should be comfortable with fluctuation in the value of their investments, especially over the short term. Stock prices fluctuate, sometimes rapidly and dramatically, due to factors affecting individual companies, particular industries or sectors, or general market conditions. Bond prices generally move in the opposite direction of interest rates. Changes in the financial strength of a bond issuer or in a bond’s credit rating may affect its value. Derivatives involve costs and can create economic leverage in the portfolio, which may result in significant volatility and cause the Fund to participate in losses (as well as gains) in an amount that exceeds the Fund’s initial investment. The Fund may not achieve the anticipated benefits, and may realize losses when a counterparty fails to perform. Because the Fund allocates assets to a variety of investment strategies, ETFs and other mutual funds, which involve certain risks, it may be subject to those same risks. The Fund is actively managed but there is no guarantee that the manager’s investment decisions will produce the desired results. The Fund’s
prospectus also includes a description of the main investment risks.
Performance Overview
You can find the Fund’ssix-month total return in the Performance Summary. For comparison, the Fund’s equity benchmark, the Standard & Poor’s® 500 Index (S&P 500®), posted a +18.54% total return, while the Fund’s fixed income benchmark, the Bloomberg Barclays U.S. Aggregate Bond Index, posted a +6.11% total return for the period under review.1 The Fund’s Blended Benchmark, a combination of leading stock and bond indexes that better reflects the asset allocation of the Fund’s portfolio, posted a +13.07% total return for the same period.2
Economic and Market Overview
The U.S. economy grew during the six months ended June 30, 2019. After moderating for two consecutive quarters, the economy grew significantly faster in 2019’s first quarter, driven by growth in consumer spending, inventory investment, exports, business investment, and state and local government spending. However, the economy moderated again in the second quarter, due to weakness in inventory investment, exports, business investment and housing investment. The manufacturing and services sectors expanded during the period. The unemployment rate decreased from 3.9% in December 2018 to 3.7% atperiod-end.3 The annual inflation rate, as measured by the Consumer Price Index, decreased from 1.9% in December 2018 to 1.6% atperiod-end.3
The U.S. Federal Reserve (Fed) held its target range for the federal funds rate unchanged, at 2.25%–2.50%, during the reporting period. In March, the Fed mentioned it would end its balance sheet normalization program by the end of September 2019. In June, the Fed indicated increased uncertainties around its views on economic activity and the labor market. With market-based inflation measures remaining low in recent months, the market has interpreted the Fed’s recent statements to mean it will likely cut rates in 2019’s second half to foster continued economic growth while attempting to achieve its inflation objective.
1. Source: Morningstar.
2. Source: FactSet. The Fund’s Blended Benchmark was calculated internally and rebalanced monthly and was composed of 60% S&P 500, 30% Bloomberg Barclays U.S. Aggregate Bond Index and 10% Bloomberg Barclays1-3 Month U.S. Treasury Bill Index.
One cannot invest directly in an index, and an index is not representative of the Fund’s portfolio. Please see Index Descriptions following the Fund Summaries.
3. Source: Bureau of Labor Statistics.
The dollar value, number of shares or principal amount, and names of all portfolio holdings are listed in the Fund’s Statement of Investments (SOI).
FRANKLIN VOLSMART ALLOCATION VIP FUND
U.S. equity markets overall rose during the period, benefiting from upbeat economic data and U.S. corporate earnings. However, markets reflected concerns about tighter regulation of technology companies, U.S. political uncertainties, and the impact of U.S. trade disputes with China and other trading partners on global growth and corporate earnings. These concerns were partially alleviated in 2019’s first four months by easing trade tensions and optimism about a potential U.S.-China trade deal. Furthermore, markets benefited from the Fed’s indications of a patient approach to its monetary policy decisions. The broad U.S. stock market, as measured by the S&P 500, rallied in 2019’s first four months, reaching a newall-time high in April 2019. After declining in May due to escalating trade tensions, stocks reached anotherall-time high in June amid investor optimism about potential interest-rate cuts. Overall, the S&P 500 posted a +18.54% total return for thesix-month period.1
The10-year Treasury yield, which moves inversely to its price, decreased during the period. The yield rose at some points during 2019’s first quarter amid several better-than-expected U.S. economic reports and optimism about a potential U.S.-China trade deal. However, concerns about political uncertainties in the U.S., slower domestic and global economic growth, and the Fed’s patient approach to its monetary policy decisions weighed on the Treasury yield. Nearperiod-end, the10-year yield reached multi-year lows and fell below certain short-term yields, due to weaker economic data and escalating U.S. trade tensions with China and Mexico. Overall, the10-year Treasury yield declined from 2.69% at the beginning of the period to 2.00% atperiod-end.
Investment Strategy
Under normal market conditions, the Fund seeks to achieve its investment goal by allocating its assets across certain asset classes, sectors and strategies in an attempt to produce a diversified portfolio that will generate returns, while minimizing the expected volatility of the Fund’s returns so that volatility does not exceed a target of 10% per year. (Volatility within the 10% target is referred to as “Target Volatility.”) The Fund’s assets are primarily invested in its “core portfolio,” which is principally composed of various U.S. equity and fixed income investments and strategies, including other mutual funds that provide exposure to such investments and strategies.
In addition, the Fund employs a volatility management strategy, which is designed to manage the expected volatility of the Fund’s returns so that volatility remains within the Fund’s Target Volatility. Thus, the Fund may utilize certain derivative instruments (primarily futures contracts on
Portfolio Composition*
6/30/19
| | | | |
| |
| | | % of Total
Net Assets | |
| |
| Stocks | | | 53.9% | |
| |
| Capital Goods | | | 12.1% | |
| |
| Health Care Equipment & Services | | | 8.2% | |
| |
| Software & Services | | | 6.5% | |
| |
| Materials | | | 6.3% | |
| |
| Semiconductors & Semiconductor Equipment | | | 3.7% | |
| |
| Energy | | | 3.0% | |
| |
| Food, Beverage & Tobacco | | | 2.3% | |
| |
| Retailing | | | 2.2% | |
| |
| Pharmaceuticals, Biotechnology & Life Sciences | | | 1.9% | |
| |
| Household & Personal Products | | | 1.5% | |
| |
| Consumer Services | | | 1.3% | |
| |
| Commercial & Professional Services | | | 1.1% | |
| |
| Food & Staples Retailing | | | 1.0% | |
| |
| Insurance | | | 1.0% | |
| |
| Consumer Durables & Apparel | | | 1.0% | |
| |
| Transportation | | | 0.5% | |
| |
| Media & Entertainment | | | 0.2% | |
| |
| Diversified Financials | | | 0.1% | |
| |
| Underlying Funds - Equity | | | 9.4% | |
| |
| Franklin DynaTech Fund—Class R6 | | | 5.3% | |
| |
| Franklin Income Fund—Class R6 | | | 4.1% | |
| |
| Underlying Funds - Fixed Income | | | 33.4% | |
| |
| Franklin Low Duration Total Return Fund—Class R6 | | | 17.9% | |
| |
| Franklin Strategic Income Fund—Class R6 | | | 11.6% | |
| |
| Franklin Income Fund—Class R6 | | | 3.9% | |
| |
| Hedge Strategy | | | 0.3% | |
| |
| Short-Term Investments & Other Net Assets | | | 3.0% | |
| * | Figures are stated as a perentage of total and may not equal 100% or may be negative due to rounding, use of any derivatives, unsettled trades or other factors. The breakdown may not match the SOI. |
indexes) in an effort to adjust the Fund’s expected volatility to within the Target Volatility. There is no guarantee that the Fund will stay within its Target Volatility. The Fund also employs a “tail risk protection strategy,” designed to protect the Fund from risks related to extreme short-term market downturns (tail risk). Thus, the Fund may utilize certain derivatives (primarily total return swap agreements) in an effort to hedge the tail risk of the Fund. There is no guarantee that the Fund’s volatility management or tail risk protection strategies will be successful.
FRANKLIN VOLSMART ALLOCATION VIP FUND
|
|
What is a futures contract? |
A futures contract is an agreement between the Fund and a counterparty made through a U.S. or foreign futures exchange to buy or sell an underlying instrument or asset at a specific price on a future date. |
|
|
What is a total return swap agreement? |
A swap agreement, such as an equity total return swap, is a contract between the Fund and a counterparty to exchange on a future date the returns, or differentials in rates of return, that would have been earned or realized if a notional amount were invested in specific instruments. |
Manager’s Discussion
At thetop-down asset allocation level atperiod-end, equity exposure was close to, but still above, the middle of its allocation range, while fixed income exposure was at the high end of its allocation range. The Fund held a hedge linked to a volatility index (VIX) and nominal exposure to cash atperiod-end.
Equities
The Fund’s relative performance was strengthened by an equity overweighting relative to the Blended Benchmark throughout thesix-month period. Equities were supported by accommodative policies of major central banks, mostly positive signals around U.S.-China trade talks and investor expectations of future cuts in the federal funds target rate.
Also supporting relative results was our selection of underlying equity funds. A significant allocation to Franklin Rising Dividends Strategy lifted returns as the strategy outperformed the equity benchmark. With many central banks growing increasingly dovish during the period, yields pulled back across global bond markets. Investors in search of yield sought out dividend-paying stocks, such as those in Franklin Rising Dividends Strategy, which supported relative results. Franklin DynaTech Fund also benefited returns. In contrast, the equity component of Franklin Income Fund detracted from relative performance.
Fixed Income
The Fund’s overweighted allocation to bonds relative to the Blended Benchmark detracted from relative results. Our preference for low duration exposure in fixed income dampened relative returns as long-term U.S. Treasury yields fell. Investors’ inflation expectations generally remained subdued amid growing concerns about slowing economic activity.
Portfolio Strategy Holdings*
6/30/19
| | | | |
| |
| | | % of Total
Net Assets | |
| |
| Franklin Rising Dividends Strategy | | | 53.9% | |
| |
| Franklin Low Duration Total Return Fund | | | 17.9% | |
| |
| Franklin Strategic Income Fund | | | 11.6% | |
| |
| Franklin Income Fund | | | 8.0% | |
| |
| Franklin DynaTech Fund | | | 5.3% | |
| |
| Hedge Strategy | | | 0.3% | |
| |
| Short-Term Investments & Other Net Assets | | | 3.0% | |
*The breakdown may not match the SOI.
|
|
What is duration? |
Duration is a measure of a bond’s price sensitivity to interest-rate changes. In general, a portfolio of securities with a lower duration can be expected to be less sensitive to interest-rate changes than a portfolio with a higher duration. |
In contrast, the Fund’s yield spread exposure in fixed income, including a healthy allocation to high-yield bonds through Franklin Strategic Income Fund, strengthened relative performance. We found that the economic environment was constructive for corporate bonds.
Hedging
The Fund’s tactical hedging comprises two strategies—tail risk protection and volatility management—both of which were active during parts of thesix-month review period. The Fund kept its holding of aVIX-linked hedge, which is designed to provide tail risk protection during periods of increased market volatility and drawdowns, active atperiod-end. The Fund also employed an independent volatility management strategy (implemented using S&P futures), designed to keep overall volatility below 10%. This strategy was not active atperiod-end, but was engaged intermittently during the period.
Although these hedge strategies helped limit portfolio volatility, they ultimately detracted from the Fund’s relative performance as arisk-on market environment persisted for most of thesix-month period. Still, the tail risk protection and volatility management strategies meaningfully supported relative performance in May, as both strategies were active amid a sharp selloff that dragged down returns as deteriorating trade relations between the U.S. and some of its major partners drove heightened market volatility.
FRANKLIN VOLSMART ALLOCATION VIP FUND
Thank you for your participation in Franklin VolSmart Allocation VIP Fund. We look forward to serving your future investment needs.
The foregoing information reflects our analysis, opinions and portfolio holdings as of June 30, 2019, the end of the reporting period. The way we implement our main investment strategies and the resulting portfolio holdings may change depending on factors such as market and economic conditions. These opinions may not be relied upon as investment advice or an offer for a particular security. The information is not a complete analysis of every aspect of any market, country, industry, security or the Fund. Statements of fact are from sources considered reliable, but the investment manager makes no representation or warranty as to their completeness or accuracy. Although historical performance is no guarantee of future results, these insights may help you understand our investment management philosophy.
FRANKLIN VOLSMART ALLOCATION VIP FUND
Class 2 Fund Expenses
As an investor in a variable insurance contract (Contract) that indirectly provides for investment in an underlying mutual fund, you can incur transaction and/or ongoing expenses at both the Fund level and the Contract Level: (1) transaction expenses can include sales charges (loads) on purchases, surrender fees, transfer fees and premium taxes; and (2) ongoing expenses can include management fees, distribution and service(12b-1) fees, contract fees, annual maintenance fees, mortality and expense risk fees and other fees and expenses. All mutual funds and Contracts have some types of ongoing expenses. The table below shows Fund-level ongoing expenses and can help you understand these costs and compare them with those of other mutual funds offered through the Contract. The table assumes a $1,000 investment held for the six months indicated. Please refer to the Fund prospectus for additional information on operating expenses.
Actual Fund Expenses
The table below provides information about the actual account values and actual expenses in the columns under the heading “Actual.” In these columns the Fund’s actual return, which includes the effect of ongoing Fund expenses but does not include the effect of ongoing Contract expenses, is used to calculate the “Ending Account Value.” You can estimate the Fund-level expenses you paid during the period by following these steps (of course, your account value and expenses will differ from those in this illustration): Divide your account value by $1,000 (if your account had an $8,600 value, then $8,600÷ $1,000 =8.6). Then multiply the result by the number under the headings “Actual” and “Fund-Level Expenses Paid During Period” (if Fund-Level Expenses Paid During Period were $ 7.50, then 8.6 x $ 7.50 = $64.50). In this illustration, the estimated expenses paid this period at the Fund level are $64.50.
Hypothetical Example for Comparison with Other Mutual Funds
Under the heading “Hypothetical” in the table, information is provided about hypothetical account values and hypothetical expenses based on the Fund’s actual expense ratio and an assumed rate of return of 5% per year before expenses, which is not the Fund’s actual return. This information may not be used to estimate the actual ending account balance or expenses you paid for the period, but it can help you compare ongoing costs of investing in the Fund with those of other mutual funds offered through the Contract. To do so, compare this 5% hypothetical example with the 5% hypothetical examples that appear in the shareholder reports of other funds offered through the Contract.
Please note that expenses shown in the table are meant to highlight ongoing costs at the Fund level only and do not reflect any ongoing expenses at the Contract level, or transaction expenses at either the Fund or Contract levels. In addition, while the Fund does not have transaction expenses, if the transaction and ongoing expenses at the Contract level were included, the expenses shown below would be higher. You should consult your Contract prospectus or disclosure document for more information.
| | | | | | | | | | | | | | | | | | |
| | | | | | | Actual
(actual return after expenses) | | | | Hypothetical
(5% annual return before expenses) | | | | |
| | | | | | | | | |
Share Class | | Beginning
Account
Value 1/1/19 | | | | Ending
Account
Value 6/30/19 | | Fund-Level
Expenses
Paid During
Period
1/1/19–6/30/191, 2 | | | | Ending Account
Value 6/30/19 | | Fund-Level
Expenses
Paid During Period
1/1/19–6/30/191, 2 | | | | Net
Annualized
Expense
Ratio2 |
Class 2 | | $1,000 | | | | $1,128.70 | | $4.75 | | | | $1,020.33 | | $4.51 | | | | 0.90% |
1. Expenses are equal to the annualized expense ratio for thesix-month period as indicated above—in the far right column—multiplied by the simple average account value over the period indicated, and then multiplied by 181/365 to reflect theone-half year period.
2. Reflects expenses after fee waivers and expense reimbursements. Does not include any ongoing expenses of the Contract for which the Fund is an investment option or acquired fund fees and expenses.
FRANKLIN TEMPLETON VARIABLE INSURANCE PRODUCTS TRUST
Financial Highlights
Franklin VolSmart Allocation VIP Fund
| | | | | | | | | | | | | | | | | | | | | | | | |
| | |
| | | Six Months Ended
June 30, 2019 (unaudited) | | | Year Ended December 31, | |
| | | 2018 | | | 2017 | | | 2016 | | | 2015 | | | 2014 | |
| |
|
| Class 2 | |
| | | | | | |
Per share operating performance
(for a share outstanding throughout the period) | | | | | | | | | | | | | | | | | | | | | | | | |
| | | | | | |
| Net asset value, beginning of period | | | $10.82 | | | | $11.67 | | | | $10.10 | | | | $ 9.68 | | | | $10.20 | | | | $10.07 | |
| | | | |
| | | | | | |
| Income from investment operationsa: | | | | | | | | | | | | | | | | | | | | | | | | |
| | | | | | |
Net investment incomeb,c | | | 0.11 | | | | 0.21 | | | | 0.16 | | | | 0.16 | | | | 0.10 | | | | 0.11 | |
| | | | | | |
Net realized and unrealized gains (losses) | | | 1.28 | | | | (1.02 | ) | | | 1.41 | | | | 0.28 | | | | (0.42 | ) | | | 0.25 | |
| | | | |
| | | | | | |
Total from investment operations | | | 1.39 | | | | (0.81 | ) | | | 1.57 | | | | 0.44 | | | | (0.32 | ) | | | 0.36 | |
| | | | |
| | | | | | |
Less distributions from: | | | | | | | | | | | | | | | | | | | | | | | | |
| | | | | | |
Net investment income and net foreign currency gains | | | — | | | | (0.04 | ) | | | — | | | | (— | )d | | | (0.05 | ) | | | (0.23) | |
| | | | | | |
Net realized gains | | | (0.14 | ) | | | — | | | | — | | | | (0.02 | ) | | | (0.15 | ) | | | (—) | d |
| | | | |
| | | | | | |
Total distributions | | | (0.14 | ) | | | (0.04 | ) | | | — | | | | (0.02 | ) | | | (0.20 | ) | | | (0.23) | |
| | | | |
| | | | | | |
Net asset value, end of period | | | $12.07 | | | | $10.82 | | | | $11.67 | | | | $10.10 | | | | $ 9.68 | | | | $10.20 | |
| | | | |
| | | | | | |
Total returne | | | 12.87% | | | | (6.93)% | | | | 15.54% | | | | 4.39% | | | | (3.12)% | | | | 3.60% | |
| | | | | | |
| Ratios to average net assetsf | | | | | | | | | | | | | | | | | | | | | | | | |
| | | | | | |
Expenses before waiver and payments by affiliatesg | | | 1.12% | | | | 1.10% | | | | 1.14% | | | | 1.25% | | | | 1.77% | | | | 1.97% | |
| | | | | | |
Expenses net of waiver and payments by affiliatesg | | | 0.90% | h | | | 0.75% | h | | | 0.73% | h | |
| 0.73%
| h
| | | 0.93% | | | | 1.08% | h |
| | | | | | |
Net investment incomec | | | 1.83% | | | | 1.85% | | | | 1.44% | | | | 1.50% | | | | 1.30% | | | | 1.07% | |
| | | | | | |
| Supplemental data | | | | | | | | | | | | | | | | | | | | | | | | |
| | | | | | |
Net assets, end of period (000’s) | | | $37 | | | | $33 | | | | $36 | | | | $31 | | | | $8,703 | | | | $10,201 | |
| | | | | | |
Portfolio turnover rate | | | 3.72% | | | | 6.28% | | | | 5.69% | | | | 1.00% | | | | 95.15% | | | | 22.04% | |
aThe amount shown for a share outstanding throughout the period may not correlate with the Statement of Operations for the period due to the timing of sales and repurchases of the Fund’s shares in relation to income earned and/or fluctuating fair value of the investments of the Fund.
bBased on average daily shares outstanding.
cRecognition of net investment income by the Fund is affected by the timing of declaration of dividends by the Underlying Funds and exchange traded funds in which the Fund invests.
dAmount rounds to less than $0.01 per share.
eTotal return does not include fees, charges or expenses imposed by the variable annuity and life insurance contracts for which Franklin Templeton Variable Insurance Products Trust serves as an underlying investment vehicle. Total return is not annualized for periods less than one year.
fRatios are annualized for periods less than one year.
gDoes not include expenses of the Underlying Funds and exchange traded funds in which the Fund invests. The weighted average indirect expenses of the Underlying Funds and exchange traded funds was 0.17% for the period ended June 30, 2019.
hBenefit of expense reduction rounds to less than 0.01%.
| | | | | | |
| | | |
| | The accompanying notes are an integral part of these financial statements. | Semiannual Report | | | FVA-7 | |
FRANKLIN TEMPLETON VARIABLE INSURANCE PRODUCTS TRUST
FINANCIAL HIGHLIGHTS
Franklin VolSmart Allocation VIP Fund(continued)
| | | | | | | | | | | | | | | | | | | | | | | | |
| | |
| | | Six Months Ended
June 30, 2019 (unaudited) | | | Year Ended December 31, | |
| | | 2018 | | | 2017 | | | 2016 | | | 2015 | | | 2014 | |
| |
| | | | | | |
| Class 5 | | | | | | | | | | | | | | | | | | | | | | | | |
| | | | | | |
Per share operating performance
(for a share outstanding throughout the period) | | | | | | | | | | | | | | | | | | | | | | | | |
| | | | | | |
Net asset value, beginning of period | | | $10.80 | | | | $11.65 | | | | $10.07 | | | | $ 9.67 | | | | $10.20 | | | | $10.07 | |
| | | | |
| | | | | | |
| Income from investment operationsa: | | | | | | | | | | | | | | | | | | | | | | | | |
| | | | | | |
Net investment incomeb,c | | | 0.11 | | | | 0.22 | | | | 0.17 | | | | 0.16 | | | | 0.16 | | | | 0.13 | |
| | | | | | |
Net realized and unrealized gains (losses) | | | 1.28 | | | | (1.01 | ) | | | 1.41 | | | | 0.29 | | | | (0.47 | ) | | | 0.25 | |
| | | | |
| | | | | | |
Total from investment operations | | | 1.39 | | | | (0.79 | ) | | | 1.58 | | | | 0.45 | | | | (0.31 | ) | | | 0.38 | |
| | | | |
| | | | | | |
Less distributions from: | | | | | | | | | | | | | | | | | | | | | | | | |
| | | | | | |
Net investment income and net foreign currency gains | | | — | | | | (0.06 | ) | | | — | | | | (0.03 | ) | | | (0.07 | ) | | | (0.25) | |
| | | | | | |
Net realized gains | | | (0.14 | ) | | | — | | | | — | | | | (0.02 | ) | | | (0.15 | ) | | | (—) | d |
| | | | |
| | | | | | |
Total distributions | | | (0.14 | ) | | | (0.06) | | | | — | | | | (0.05 | ) | | | (0.22 | ) | | | (0.25) | |
| | | | |
| | | | | | |
Net asset value, end of period | | | $12.05 | | | | $10.80 | | | | $11.65 | | | | $10.07 | | | | $ 9.67 | | | | $10.20 | |
| | | | |
| | | | | | |
Total returne | | | 12.89% | | | | (6.85)% | | | | 15.69% | | | | 4.59% | | | | (3.10)% | | | | 3.75% | |
| | | | | | |
| Ratios to average net assetsf | | | | | | | | | | | | | | | | | | | | | | | | |
| | | | | | |
Expenses before waiver and payments by affiliatesg | | | 1.02% | | | | 1.00% | | | | 1.04% | | | | 1.15% | | | | 1.66% | | | | 1.82% | |
| | | | | | |
Expenses net of waiver and payments by affiliatesg | | | 0.80%h | | | | 0.65% | h | | | 0.63% | h | | | 0.63% | h | | | 0.82% | | | | 0.93% | h |
| | | | | | |
Net investment incomec | | | 1.93% | | | | 1.95% | | | | 1.54% | | | | 1.60% | | | | 1.41% | | | | 1.22% | |
| | | | | | |
Supplemental data | | | | | | | | | | | | | | | | | | | | | | | | |
| | | | | | |
Net assets, end of period (000’s) | | | $187,528 | | | | $171,173 | | | | $188,240 | | | | $124,581 | | | | $54,816 | | | | $10,201 | |
| | | | | | |
Portfolio turnover rate | | | 3.72% | | | | 6.28% | | | | 5.69% | | | | 1.00% | | | | 95.15% | | | | 22.04% | |
aThe amount shown for a share outstanding throughout the period may not correlate with the Statement of Operations for the period due to the timing of sales and repurchases of the Fund’s shares in relation to income earned and/or fluctuating fair value of the investments of the Fund.
bBased on average daily shares outstanding.
cRecognition of net investment income by the Fund is affected by the timing of declaration of dividends by the Underlying Funds and exchange traded funds in which the Fund invests.
dAmount rounds to less than $0.01 per share.
eTotal return does not include fees, charges or expenses imposed by the variable annuity and life insurance contracts for which Franklin Templeton Variable Insurance Products Trust serves as an underlying investment vehicle. Total return is not annualized for periods less than one year.
fRatios are annualized for periods less than one year.
gDoes not include expenses of the Underlying Funds and exchange traded funds in which the Fund invests. The weighted average indirect expenses of the Underlying Funds and exchange traded funds was 0.17% for the period ended June 30, 2019.
hBenefit of expense reduction rounds to less than 0.01%.
| | | | |
| | | |
FVA-8 | | Semiannual Report | The accompanying notes are an integral part of these financial statements. | | |
FRANKLIN TEMPLETON VARIABLE INSURANCE PRODUCTS TRUST
Statement of Investments, June 30, 2019 (unaudited)
Franklin VolSmart Allocation VIP Fund
| | | | | | | | |
| | |
| | | Shares | | | Value | |
| | |
Common Stocks 53.9% | | | | | | | | |
Capital Goods 12.1% | | | | | | | | |
The Boeing Co. | | | 3,100 | | | $ | 1,128,431 | |
Carlisle Cos. Inc. | | | 6,460 | | | | 907,049 | |
Donaldson Co. Inc. | | | 12,630 | | | | 642,362 | |
Dover Corp. | | | 17,044 | | | | 1,707,809 | |
General Dynamics Corp. | | | 10,300 | | | | 1,872,746 | |
Honeywell International Inc. | | | 21,800 | | | | 3,806,062 | |
Johnson Controls International PLC | | | 36,892 | | | | 1,524,008 | |
nVent Electric PLC | | | 25,100 | | | | 622,229 | |
Pentair PLC | | | 24,200 | | | | 900,240 | |
Raytheon Co. | | | 5,000 | | | | 869,400 | |
aResideo Technologies Inc. | | | 3,666 | | | | 80,359 | |
Roper Technologies Inc. | | | 16,900 | | | | 6,189,794 | |
United Technologies Corp. | | | 14,200 | | | | 1,848,840 | |
W.W. Grainger Inc. | | | 2,450 | | | | 657,163 | |
| | | | | | | | |
| | |
| | | | | | | 22,756,492 | |
| | | | | | | | |
| | |
Commercial & Professional Services 1.1% | | | | | | | | |
Cintas Corp. | | | 6,900 | | | | 1,637,301 | |
Matthews International Corp., A | | | 11,670 | | | | 406,700 | |
| | | | | | | | |
| | |
| | | | | | | 2,044,001 | |
| | | | | | | | |
| | |
Consumer Durables & Apparel 1.0% | | | | | | | | |
NIKE Inc., B | | | 21,300 | | | | 1,788,135 | |
| | | | | | | | |
Consumer Services 1.3% | | | | | | | | |
McDonald’s Corp. | | | 8,880 | | | | 1,844,021 | |
Yum! Brands Inc. | | | 4,800 | | | | 531,216 | |
| | | | | | | | |
| | |
| | | | | | | 2,375,237 | |
| | | | | | | | |
| | |
Diversified Financials 0.1% | | | | | | | | |
State Street Corp. | | | 3,450 | | | | 193,407 | |
| | | | | | | | |
| | |
Energy 3.0% | | | | | | | | |
aApergy Corp. | | | 12,150 | | | | 407,511 | |
Chevron Corp. | | | 10,190 | | | | 1,268,043 | |
EOG Resources Inc. | | | 12,730 | | | | 1,185,927 | |
Exxon Mobil Corp. | | | 11,300 | | | | 865,919 | |
Occidental Petroleum Corp. | | | 19,100 | | | | 960,348 | |
Schlumberger Ltd. | | | 21,300 | | | | 846,462 | |
| | | | | | | | |
| | |
| | | | | | | 5,534,210 | |
| | | | | | | | |
| | |
Food & Staples Retailing 1.0% | | | | | | | | |
Walgreens Boots Alliance Inc. | | | 8,600 | | | | 470,162 | |
Walmart Inc. | | | 12,990 | | | | 1,435,265 | |
| | | | | | | | |
| | |
| | | | | | | 1,905,427 | |
| | | | | | | | |
FRANKLIN TEMPLETON VARIABLE INSURANCE PRODUCTS TRUST
STATEMENT OF INVESTMENTS (UNAUDITED)
Franklin VolSmart Allocation VIP Fund(continued)
| | | | | | | | |
| | |
| | | Shares | | | Value | |
| | |
Common Stocks(continued) | | | | | | | | |
Food, Beverage & Tobacco 2.3% | | | | | | | | |
Bunge Ltd. | | | 19,100 | | | $ | 1,064,061 | |
McCormick & Co. Inc. | | | 10,350 | | | | 1,604,354 | |
PepsiCo Inc. | | | 12,700 | | | | 1,665,351 | |
| | | | | | | | |
| | |
| | | | | | | 4,333,766 | |
| | | | | | | | |
Health Care Equipment & Services 8.2% | | | | | | | | |
Abbott Laboratories | | | 24,060 | | | | 2,023,446 | |
Becton, Dickinson and Co. | | | 13,600 | | | | 3,427,336 | |
CVS Health Corp. | | | 10,950 | | | | 596,665 | |
DENTSPLY SIRONA Inc. | | | 12,400 | | | | 723,664 | |
Medtronic PLC | | | 29,400 | | | | 2,863,266 | |
Stryker Corp. | | | 18,900 | | | | 3,885,462 | |
West Pharmaceutical Services Inc. | | | 14,100 | | | | 1,764,615 | |
| | | | | | | | |
| | |
| | | | | | | 15,284,454 | |
| | | | | | | | |
Household & Personal Products 1.5% | | | | | | | | |
Colgate-Palmolive Co. | | | 18,300 | | | | 1,311,561 | |
The Procter & Gamble Co. | | | 14,480 | | | | 1,587,732 | |
| | | | | | | | |
| | |
| | | | | | | 2,899,293 | |
| | | | | | | | |
Insurance 1.0% | | | | | | | | |
Aflac Inc. | | | 14,440 | | | | 791,456 | |
Chubb Ltd. | | | 2,781 | | | | 409,613 | |
Erie Indemnity Co., A | | | 2,720 | | | | 691,642 | |
| | | | | | | | |
| | |
| | | | | | | 1,892,711 | |
| | | | | | | | |
Materials 6.3% | | | | | | | | |
Air Products and Chemicals Inc. | | | 15,700 | | | | 3,554,009 | |
Albemarle Corp. | | | 38,500 | | | | 2,710,785 | |
Ecolab Inc. | | | 6,760 | | | | 1,334,694 | |
Linde PLC (United Kingdom) | | | 18,200 | | | | 3,654,560 | |
Nucor Corp. | | | 9,500 | | | | 523,450 | |
| | | | | | | | |
| | |
| | | | | | | 11,777,498 | |
| | | | | | | | |
Media & Entertainment 0.2% | | | | | | | | |
John Wiley & Sons Inc., A | | | 6,000 | | | | 275,160 | |
| | | | | | | | |
| | |
Pharmaceuticals, Biotechnology & Life Sciences 1.9% | | | | | | | | |
AbbVie Inc. | | | 8,540 | | | | 621,029 | |
Johnson & Johnson | | | 14,900 | | | | 2,075,272 | |
Perrigo Co. PLC | | | 7,440 | | | | 354,293 | |
Pfizer Inc. | | | 12,810 | | | | 554,929 | |
| | | | | | | | |
| | |
| | | | | | | 3,605,523 | |
| | | | | | | | |
Retailing 2.2% | | | | | | | | |
The Gap Inc. | | | 15,720 | | | | 282,488 | |
Ross Stores Inc. | | | 19,300 | | | | 1,913,016 | |
Target Corp. | | | 8,340 | | | | 722,328 | |
Tiffany & Co. | | | 13,123 | | | | 1,228,838 | |
| | | | | | | | |
| | |
| | | | | | | 4,146,670 | |
| | | | | | | | |
FRANKLIN TEMPLETON VARIABLE INSURANCE PRODUCTS TRUST
STATEMENT OF INVESTMENTS (UNAUDITED)
Franklin VolSmart Allocation VIP Fund(continued)
| | | | | | | | |
| | |
| | | Shares | | | Value | |
Common Stocks (continued) | | | | | | | | |
Semiconductors & Semiconductor Equipment 3.7% | | | | | | | | |
Analog Devices Inc. | | | 29,714 | | | $ | 3,353,819 | |
Texas Instruments Inc. | | | 28,800 | | | | 3,305,088 | |
Versum Materials Inc. | | | 5,495 | | | | 283,432 | |
| | | | | | | | |
| | |
| | | | | | | 6,942,339 | |
| | | | | | | | |
Software & Services 6.5% | | | | | | | | |
Accenture PLC, A | | | 19,400 | | | | 3,584,538 | |
Microsoft Corp. | | | 50,400 | | | | 6,751,584 | |
Visa Inc., A | | | 11,100 | | | | 1,926,405 | |
| | | | | | | | |
| | |
| | | | | | | 12,262,527 | |
| | | | | | | | |
Transportation 0.5% | | | | | | | | |
Norfolk Southern Corp. | | | 100 | | | | 19,933 | |
United Parcel Service Inc., B | | | 9,200 | | | | 950,084 | |
| | | | | | | | |
| | |
| | | | | | | 970,017 | |
| | | | | | | | |
| | |
Total Common Stocks (Cost $72,380,200) | | | | | | | 100,986,867 | |
| | | | | | | | |
| | |
Investments in Underlying Funds 42.8% | | | | | | | | |
Domestic Equity 5.3% | | | | | | | | |
a,bFranklin DynaTech Fund, Class R6 | | | 113,058 | | | | 10,032,767 | |
| | | | | | | | |
| | |
Domestic Fixed Income 29.5% | | | | | | | | |
bFranklin Low Duration Total Return Fund, Class R6 | | | 3,435,835 | | | | 33,533,754 | |
bFranklin Strategic Income Fund, Class R6 | | | 2,239,123 | | | | 21,719,493 | |
| | | | | | | | |
| | |
| | | | | | | 55,253,247 | |
| | | | | | | | |
Domestic Hybrid 8.0% | | | | | | | | |
bFranklin Income Fund, Class R6 | | | 6,516,497 | | | | 15,053,108 | |
| | | | | | | | |
| | |
Total Investments in Underlying Funds (Cost $75,017,612) | | | | | | | 80,339,122 | |
| | | | | | | | |
| | |
Total Investments before Short Term Investments (Cost $147,397,812) | | | | | | | 181,325,989 | |
| | | | | | | | |
| | |
Short Term Investments (Cost $6,426,292) 3.4% | | | | | | | | |
| | |
Money Market Funds 3.4% | | | | | | | | |
b,cInstitutional Fiduciary Trust Money Market Portfolio, 2.05% | | | 6,426,292 | | | | 6,426,292 | |
| | | | | | | | |
| | |
Total Investments (Cost $153,824,104) 100.1% | | | | | | | 187,752,281 | |
Other Assets, less Liabilities (0.1)% | | | | | | | (187,173 | ) |
| | | | | | | | |
| | |
Net Assets 100.0% | | | | | | $ | 187,565,108 | |
| | | | | | | | |
aNon-income producing.
bSee Note 3(e) regarding investments in Underlying Funds.
cThe rate shown is the annualizedseven-day effective yield at period end.
FRANKLIN TEMPLETON VARIABLE INSURANCE PRODUCTS TRUST
STATEMENT OF INVESTMENTS (UNAUDITED)
Franklin VolSmart Allocation VIP Fund(continued)
At June 30, 2019, the Fund had the following total return swap contracts outstanding. See Note 1(c).
Total Return Swap Contracts
| | | | | | | | | | | | | | | | | | | | | | | | |
| | | | | | |
| Underlying Instruments | | Financing
Rate | | | Payment
Frequency | | | Counter-
party | | | Maturity
Date | | | Notional
Value | | | Value/
Unrealized
Appreciation (Depreciation) | |
| | | | | | |
| OTC Swap Contracts | | | | | | | | | | | | | | | | | | | | | | | | |
| Longa | | | | | | | | | | | | | | | | | | | | | | | | |
Dynamic VIX Backwardation (BEFSDVB1) | | | 0.00% | | | | At maturity | | | | BZWS | | | | 2/21/20 | | | $ | 19,100,000 | | | | $(3,183) | |
| | | | | | | | | | | | | | | | | | | | | | | | |
aThe fund receives the total return on the underlying instrument.
See Note 7 regarding other derivative information.
See Abbreviations on pageFVA-23.
| | | | |
| | | |
| FVA-12 | | Semiannual Report | The accompanying notes are an integral part of these financial statements. | | |
FRANKLIN TEMPLETON VARIABLE INSURANCE PRODUCTS TRUST
FINANCIAL STATEMENTS
Statement of Assets and Liabilities
June 30, 2019 (unaudited)
| | | | |
| |
| | | Franklin VolSmart
Allocation VIP
Fund | |
| |
Assets: | | | | |
Investments in securities: | | | | |
Cost - Unaffiliated issuers | | | $ 72,380,200 | |
Cost -Non-controlled affiliates (Note 3e) | | | 81,443,904 | |
| | | | |
Value - Unaffiliated issuers | | | $100,986,867 | |
Value -Non-controlled affiliates (Note 3e) | | | 86,765,414 | |
Receivables: | | | | |
Investment securities sold | | | 65,505 | |
Capital shares sold | | | 2,352 | |
Dividends and interest | | | 101,015 | |
Other assets | | | 124 | |
| | | | |
| |
Total assets | | | 187,921,277 | |
| | | | |
| |
Liabilities: | | | | |
Payables: | | | | |
Investment securities purchased | | | 73,438 | |
Capital shares redeemed | | | 39,402 | |
Management fees | | | 144,063 | |
Distribution fees | | | 46,383 | |
Trustees’ fees and expenses | | | 92 | |
Reports to shareholders | | | 19,919 | |
Professional fees | | | 22,985 | |
Unrealized depreciation on OTC swap contracts | | | 3,183 | |
Accrued expenses and other liabilities | | | 6,704 | |
| | | | |
| |
Total liabilities | | | 356,169 | |
| | | | |
| |
Net assets, at value | | | $187,565,108 | |
| | | | |
| |
Net assets consist of: | | | | |
Paid-in capital | | | $154,499,556 | |
Total distributable earnings (loss) | | | 33,065,552 | |
| | | | |
| |
Net assets, at value | | | $187,565,108 | |
| | | | |
| |
| Class 2: | | | | |
Net assets, at value | | | $ 36,951 | |
| | | | |
Shares outstanding | | | 3,061 | |
| | | | |
Net asset value and maximum offering price per share | | | $ 12.07 | |
| | | | |
| Class 5: | | | | |
Net assets, at value | | | $187,528,157 | |
| | | | |
Shares outstanding | | | 15,559,327 | |
| | | | |
Net asset value and maximum offering price per share | | | $12.05 | |
| | | | |
| | | | | | |
| | | |
| | The accompanying notes are an integral part of these financial statements. | Semiannual Report | | | FVA-13 | |
FRANKLIN TEMPLETON VARIABLE INSURANCE PRODUCTS TRUST
FINANCIAL STATEMENTS
Statement of Operations
for the six months ended June 30, 2019 (unaudited)
| | | | |
| |
| | | Franklin VolSmart
Allocation VIP
Fund | |
Investment income: | | | | |
Dividends: | | | | |
Unaffiliated issuers | | | $ 930,370 | |
Non-controlled affiliates (Note 3e) | | | 1,528,283 | |
| | | | |
| |
Total investment income | | | 2,458,653 | |
| | | | |
| |
Expenses: | | | | |
Management fees (Note 3a) | | | 720,448 | |
Distribution fees: (Note 3c) | | | | |
Class 2 | | | 44 | |
Class 5 | | | 135,110 | |
Custodian fees (Note 4) | | | 532 | |
Reports to shareholders | | | 19,304 | |
Professional fees | | | 33,840 | |
Trustees’ fees and expenses | | | 665 | |
Other | | | 6,886 | |
| | | | |
| |
Total expenses | | | 916,829 | |
Expense reductions (Note 4) | | | (365 | ) |
Expenses waived/paid by affiliates (Note 3e and 3f) | | | (196,081 | ) |
| | | | |
| |
Net expenses | | | 720,383 | |
| | | | |
| |
Net investment income | | | 1,738,270 | |
| | | | |
| |
Realized and unrealized gains (losses): | | | | |
Net realized gain (loss) from: | | | | |
Investments: | | | | |
Unaffiliated issuers | | | 524,268 | |
Non-controlled affiliates (Note 3e) | | | 303,179 | |
Futures contracts | | | (3,528,195 | ) |
Swap contracts | | | (260,544 | ) |
| | | | |
| |
Net realized gain (loss) | | | (2,961,292 | ) |
| | | | |
| |
Net change in unrealized appreciation (depreciation) on: | | | | |
Investments: | | | | |
Unaffiliated issuers | | | 17,222,401 | |
Non-controlled affiliates (Note 3e) | | | 5,017,419 | |
Futures contracts | | | 1,511,553 | |
Swap contracts | | | (716,726 | ) |
| | | | |
| |
Net change in unrealized appreciation (depreciation) | | | 23,034,647 | |
| | | | |
| |
Net realized and unrealized gain (loss) | | | 20,073,355 | |
| | | | |
| |
Net increase (decrease) in net assets resulting from operations | | | $21,811,625 | |
| | | | |
| | | | |
| | | |
FVA-14 | | Semiannual Report | The accompanying notes are an integral part of these financial statements. | | |
FRANKLIN TEMPLETON VARIABLE INSURANCE PRODUCTS TRUST
FINANCIAL STATEMENTS
Statements of Changes in Net Assets
| | | | | | | | |
| |
| | | Franklin VolSmart Allocation VIP Fund | |
| | |
| | | Six Months Ended
June 30, 2019
(unaudited) | | | Year Ended
December 31, 2018 | |
| |
Increase (decrease) in net assets: | | | | | | | | |
Operations: | | | | | | | | |
Net investment income | | | $ 1,738,270 | | | | $ 3,643,502 | |
Net realized gain (loss) | | | (2,961,292 | ) | | | (1,216,554 | ) |
Net change in unrealized appreciation (depreciation) | | | 23,034,647 | | | | (14,701,565 | ) |
| | | | |
| | |
Net increase (decrease) in net assets resulting from operations | | | 21,811,625 | | | | (12,274,617 | ) |
| | | | |
| | |
Distributions to shareholders: | | | | | | | | |
Class 2 | | | (429 | ) | | | (134 | ) |
Class 5 | | | (2,160,339 | ) | | | (923,085 | ) |
| | | | |
| | |
Total distributions to shareholders | | | (2,160,768 | ) | | | (923,219 | ) |
| | | | |
| | |
Capital share transactions: (Note 2) | | | | | | | | |
Class 5 | | | (3,291,463 | ) | | | (3,872,250 | ) |
| | | | |
| | |
Total capital share transactions | | | (3,291,463 | ) | | | (3,872,250 | ) |
| | | | |
| | |
Net increase (decrease) in net assets | | | 16,359,394 | | | | (17,070,086 | ) |
| | |
Net assets: | | | | | | | | |
Beginning of period | | | 171,205,714 | | | | 188,275,800 | |
| | | | |
| | |
End of period | | | $187,565,108 | | | | $171,205,714 | |
| | | | |
| | | | | | |
| | | |
| | The accompanying notes are an integral part of these financial statements. | Semiannual Report | | | FVA-15 | |
FRANKLIN TEMPLETON VARIABLE INSURANCE PRODUCTS TRUST
Notes to Financial Statements (unaudited)
Franklin VolSmart Allocation VIP Fund
1. Organization and Significant Accounting Policies
Franklin Templeton Variable Insurance Products Trust (Trust) is registered under the Investment Company Act of 1940 (1940 Act) as anopen-end management investment company, consisting of eighteen separate funds and applies the specialized accounting and reporting guidance in U.S. Generally Accepted Accounting Principles (U.S. GAAP). Franklin VolSmart Allocation VIP Fund (Fund) is included in this report. The Fund invests primarily in other funds of the Trust (Underlying Funds). Shares of the Fund are generally sold only to insurance company separate accounts to fund the benefits of variable life insurance policies or variable annuity contracts. At June 30, 2019, 98.4% of the Fund’s shares were held through one insurance company. Investment activities of these insurance company separate accounts could have a material impact on the Fund. The Fund offers two classes of shares: Class 2 and Class 5. Each class of shares may differ by its distribution fees, voting rights on matters affecting a single class and its exchange privilege.
The accounting policies of the Underlying Funds are outlined in their respective shareholder reports. A copy of the Underlying Funds’ shareholder reports is available on the U.S. Securities and Exchange Commission (SEC) website at sec.gov. The Underlying Funds’ shareholder reports are not covered by this report.
The following summarizes the Fund’s significant accounting policies.
a. Financial Instrument Valuation
The Fund’s investments in financial instruments are carried at fair value daily. Fair value is the price that would be received to sell an asset or paid to transfer a liability in an orderly transaction between market participants on the measurement date. The Fund calculates the net asset value (NAV) per share each business day as of 4 p.m. Eastern time or the regularly scheduled close of the New York Stock Exchange (NYSE), whichever is earlier. Under compliance policies and procedures approved by the Trust’s Board of Trustees (the Board), the Fund’s administrator has responsibility for oversight of valuation, including leading the cross-functional Valuation Committee (VC). The Fund may utilize independent pricing services, quotations from securities and financial instrument dealers, and other market sources to determine fair value.
Investments in the Underlying Funds are valued at their closing NAV each trading day.
Equity securities listed on an exchange or on the NASDAQ National Market System are valued at the last quoted sale price or the official closing price of the day, respectively. Foreign equity securities are valued as of the close of trading on the foreign stock exchange on which the security is primarily traded, or as of 4 p.m. Eastern time. The value is then converted into its U.S. dollar equivalent at the foreign exchange rate in effect at 4 p.m. Eastern time on the day that the value of the security is determined.Over-the-counter (OTC) securities are valued within the range of the most recent quoted bid and ask prices. Securities that trade in multiple markets or on multiple exchanges are valued according to the broadest and most representative market. Certain equity securities are valued based upon fundamental characteristics or relationships to similar securities.
Certain derivative financial instruments trade in the OTC market. The Fund’s pricing services use various techniques including industry standard option pricing models and proprietary discounted cash flow models to determine the fair value of those instruments. The Fund’s net benefit or obligation under the derivative contract, as measured by the fair value of the contract, is included in net assets.
The Fund has procedures to determine the fair value of financial instruments for which market prices are not reliable or readily available. Under these procedures, the Fund primarily employs a market-based approach which may use related or comparable assets or liabilities, recent transactions, market multiples, book values, and other relevant information for the investment to determine the fair value of the investment. An income-based valuation approach may also be used in which the anticipated future cash flows of the investment are discounted to calculate fair value. Discounts may also be applied due to the nature or duration of any restrictions on the disposition of the investments. Due to the inherent uncertainty of valuations of such investments, the fair values may differ significantly from the values that would have been used had an active market existed.
Trading in securities on foreign securities stock exchanges and OTC markets may be completed before 4 p.m. Eastern time. In addition, trading in certain foreign markets may not take place on every Fund’s business day. Occasionally, events occur between the time at which trading in a foreign security is completed and 4 p.m. Eastern time that might call
FRANKLIN TEMPLETON VARIABLE INSURANCE PRODUCTS TRUST
NOTES TO FINANCIAL STATEMENTS (UNAUDITED)
Franklin VolSmart Allocation VIP Fund(continued)
into question the reliability of the value of a portfolio security held by the Fund. As a result, differences may arise between the value of the Fund’s portfolio securities as determined at the foreign market close and the latest indications of value at 4 p.m. Eastern time. In order to minimize the potential for these differences, the VC monitors price movements following the close of trading in foreign stock markets through a series of country specific market proxies (such as baskets of American Depositary Receipts, futures contracts and exchange traded funds). These price movements are measured against established trigger thresholds for each specific market proxy to assist in determining if an event has occurred that may call into question the reliability of the values of the foreign securities held by the Fund. If such an event occurs, the securities may be valued using fair value procedures, which may include the use of independent pricing services.
When the last day of the reporting period is anon-business day, certain foreign markets may be open on those days that the Fund’s NAV is not calculated, which could result in differences between the value of the Fund’s portfolio securities on the last business day and the last calendar day of the reporting period. Any significant security valuation changes due to an open foreign market are adjusted and reflected by the Fund for financial reporting purposes.
b. Foreign Currency Translation
Portfolio securities and other assets and liabilities denominated in foreign currencies are translated into U.S. dollars based on the exchange rate of such currencies against U.S. dollars on the date of valuation. The Fund may enter into foreign currency exchange contracts to facilitate transactions denominated in a foreign currency. Purchases and sales of securities, income and expense items denominated in foreign currencies are translated into U.S. dollars at the exchange rate in effect on the transaction date. Portfolio securities and assets and liabilities denominated in foreign currencies contain risks that those currencies will decline in value relative to the U.S. dollar. Occasionally, events may impact the availability or reliability of foreign exchange rates used to convert the U.S. dollar equivalent value. If such an event occurs, the foreign exchange rate will be valued at fair value using procedures established and approved by the Board.
The Fund does not separately report the effect of changes in foreign exchange rates from changes in market prices on securities held. Such changes are included in net realized and unrealized gain or loss from investments in the Statement of Operations.
Realized foreign exchange gains or losses arise from sales of foreign currencies, currency gains or losses realized between the trade and settlement dates on securities transactions and the difference between the recorded amounts of dividends, interest, and foreign withholding taxes and the U.S. dollar equivalent of the amounts actually received or paid. Net unrealized foreign exchange gains and losses arise from changes in foreign exchange rates on foreign denominated assets and liabilities other than investments in securities held at the end of the reporting period.
c. Derivative Financial Instruments
The Fund invested in derivative financial instruments in order to manage risk or gain exposure to various other investments or markets. Derivatives are financial contracts based on an underlying or notional amount, require no initial investment or an initial net investment that is smaller than would normally be required to have a similar response to changes in market factors, and require or permit net settlement. Derivatives contain various risks including the potential inability of the counterparty to fulfill their obligations under the terms of the contract, the potential for an illiquid secondary market, and/or the potential for market movements which expose the Fund to gains or losses in excess of the amounts shown in the Statement of Assets and Liabilities. Realized gain and loss and unrealized appreciation and depreciation on these contracts for the period are included in the Statement of Operations.
Derivative counterparty credit risk is managed through a formal evaluation of the creditworthiness of all potential counterparties. The Fund attempts to reduce its exposure to counterparty credit risk on OTC derivatives, whenever possible, by entering into International Swaps and Derivatives Association (ISDA) master agreements with certain counterparties. These agreements contain various provisions, including but not limited to collateral requirements, events of default, or early termination. Termination events applicable to the counterparty include certain deteriorations in the credit quality of the counterparty. Termination events applicable to the Fund include failure of the Fund to maintain certain net asset levels and/or limit the decline in net assets over various
FRANKLIN TEMPLETON VARIABLE INSURANCE PRODUCTS TRUST
NOTES TO FINANCIAL STATEMENTS (UNAUDITED)
Franklin VolSmart Allocation VIP Fund(continued)
1. Organization and Significant Accounting Policies (continued)
c. Derivative Financial Instruments(continued)
periods of time. In the event of default or early termination, the ISDA master agreement gives thenon-defaulting party the right to net andclose-out all transactions traded, whether or not arising under the ISDA agreement, to one net amount payable by one counterparty to the other. However, absent an event of default or early termination, OTC derivative assets and liabilities are presented gross and not offset in the Statement of Assets and Liabilities. Early termination by the counterparty may result in an immediate payment by the Fund of any net liability owed to that counterparty under the ISDA agreement. At June 30, 2019, the Fund had OTC derivatives in a net liability position of $3,183.
Collateral requirements differ by type of derivative. Collateral or initial margin requirements are set by the broker or exchange clearing house for exchange traded and centrally cleared derivatives. Initial margin deposited is held at the exchange and can be in the form of cash and/or securities. For OTC derivatives traded under an ISDA master agreement, posting of collateral is required by either the Fund or the applicable counterparty if the total net exposure of all OTC derivatives with the applicable counterparty exceeds the minimum transfer amount, which typically ranges from $100,000 to $250,000, and can vary depending on the counterparty and the type of the agreement. Generally, collateral is determined at the close of Fund business each day and any additional collateral required due to changes in derivative values may be delivered by the Fund or the counterparty the next business day, or within a few business days. Collateral pledged and/or received by the Fund for OTC derivatives, if any, is held in segregated accounts with the Fund’s custodian/counterparty broker and can be in the form of cash and/or securities. Unrestricted cash may be invested according to the Fund’s investment objectives. To the extent that the amounts due to the Fund from its counterparties are not subject to collateralization or are not fully collateralized, the Fund bears the risk of loss from counterpartynon-performance.
The Fund entered into exchange traded futures contracts primarily to manage and/or gain exposure to equity price risk. A futures contract is an agreement between the Fund and a counterparty to buy or sell an asset at a specified price on a future date. Required initial margins are pledged by the Fund,
and the daily change in fair value is accounted for as a variation margin payable or receivable in the Statement of Assets and Liabilities.
The Fund entered into OTC total return swap contracts primarily to manage and/or gain exposure to equity price risk of an underlying instrument such as a stock, bond, index or basket of securities or indices. A total return swap is an agreement between the Fund and a counterparty to exchange a return linked to an underlying instrument for a floating or fixed rate payment, both based upon a notional amount. Over the term of the contract, contractually required payments to be paid or received are accrued daily and recorded as unrealized appreciation or depreciation until the payments are made, at which time they are recognized as realized gain or loss.
See Note 7 regarding other derivative information.
d. Income and Deferred Taxes
It is the Fund’s policy to qualify as a regulated investment company under the Internal Revenue Code. The Fund intends to distribute to shareholders substantially all of its taxable income and net realized gains to relieve it from federal income and if applicable, excise taxes. As a result, no provision for U.S. federal income taxes is required.
The Fund may be subject to foreign taxation related to income received, capital gains on the sale of securities and certain foreign currency transactions in the foreign jurisdictions in which it invests. Foreign taxes, if any, are recorded based on the tax regulations and rates that exist in the foreign markets in which the Fund invests. When a capital gain tax is determined to apply, the Fund records an estimated deferred tax liability in an amount that would be payable if the securities were disposed of on the valuation date.
The Fund may recognize an income tax liability related to its uncertain tax positions under U.S. GAAP when the uncertain tax position has a less than 50% probability that it will be sustained upon examination by the tax authorities based on its technical merits. As of June 30, 2019, the Fund has determined that no tax liability is required in its financial statements related to uncertain tax positions for any open tax years (or expected to be taken in future tax years). Open tax years are those that remain subject to examination and are based on the statute of limitations in each jurisdiction in which the Fund invests.
FRANKLIN TEMPLETON VARIABLE INSURANCE PRODUCTS TRUST
NOTES TO FINANCIAL STATEMENTS (UNAUDITED)
Franklin VolSmart Allocation VIP Fund(continued)
e. Security Transactions, Investment Income, Expenses and Distributions
Security transactions are accounted for on trade date. Realized gains and losses on security transactions are determined on a specific identification basis. Estimated expenses are accrued daily. Dividend income and capital gain distributions by Underlying Funds are recorded on theex-dividend date except for certain dividends from securities where the dividend rate is not available. In such cases, the dividend is recorded as soon as the information is received by the Fund. Distributions to shareholders are recorded on theex-dividend date. Distributable earnings are determined according to income tax regulations (tax basis) and may differ from earnings recorded in accordance with U.S. GAAP. These differences may be permanent or temporary. Permanent differences are reclassified among capital accounts to reflect their tax character. These reclassifications have no impact on net assets or the results of operations. Temporary differences are not reclassified, as they may reverse in subsequent periods.
Common expenses incurred by the Trust are allocated among the Funds based on the ratio of net assets of each Fund to the combined net assets of the Trust or based on the ratio of number of shareholders of each Fund to the combined number of shareholders of the Trust. Fund specific expenses are charged directly to the Fund that incurred the expense.
The Fund indirectly bears its proportionate share of expenses from the Underlying Funds and ETFs. Since the Underlying Funds and ETFs have varied expense levels and
the Fund may own different proportions of the Underlying Funds and ETFs at different times, the amount of expenses incurred indirectly by the Fund will vary.
Realized and unrealized gains and losses and net investment income, excluding class specific expenses, are allocated daily to each class of shares based upon the relative proportion of net assets of each class. Differences in per share distributions by class are generally due to differences in class specific expenses.
f. Accounting Estimates
The preparation of financial statements in accordance with U.S. GAAP requires management to make estimates and assumptions that affect the reported amounts of assets and liabilities at the date of the financial statements and the amounts of income and expenses during the reporting period. Actual results could differ from those estimates.
g. Guarantees and Indemnifications
Under the Trust’s organizational documents, its officers and trustees are indemnified by the Trust against certain liabilities arising out of the performance of their duties to the Trust. Additionally, in the normal course of business, the Trust, on behalf of the Fund, enters into contracts with service providers that contain general indemnification clauses. The Trust’s maximum exposure under these arrangements is unknown as this would involve future claims that may be made against the Trust that have not yet occurred. Currently, the Trust expects the risk of loss to be remote.
2. Shares of Beneficial Interest
At June 30, 2019, there were an unlimited number of shares authorized (without par value). During the period ended June 30, 2019 and the year ended December 31, 2018, there were no transactions of the Fund’s Class 2 shares. Transactions in the Fund’s Class 5 shares were as follows:
| | | | | | | | | | | | | | | | | | | | |
| | | |
| | | Six Months Ended
June 30, 2019 | | | | | | Year Ended
December 31, 2018 | |
| | | | |
| | | | | |
| | | Shares | | | Amount | | | | | | Shares | | | Amount | |
| |
| | | | | |
| Class 5 Shares: | | | | | | | | | | | | | | | | | | | | |
| | | | | |
Shares sold | | | 602,580 | | | $ | 6,955,301 | | | | | | | | 2,484,376 | | | $ | 28,578,684 | |
Shares issued in reinvestment of distributions | | | 181,847 | | | | 2,160,339 | | | | | | | | 79,783 | | | | 923,085 | |
Shares redeemed | | | (1,072,788 | ) | | | (12,407,103 | ) | | | | | | | (2,879,138 | ) | | | (33,374,019 | ) |
| | | | |
| | | | | |
Net increase (decrease) | | | (288,361 | ) | | $ | (3,291,463 | ) | | | | | | | (314,979 | ) | | $ | (3,872,250 | ) |
| | | | |
FRANKLIN TEMPLETON VARIABLE INSURANCE PRODUCTS TRUST
NOTES TO FINANCIAL STATEMENTS (UNAUDITED)
Franklin VolSmart Allocation VIP Fund(continued)
3. Transactions with Affiliates
Franklin Resources, Inc. is the holding company for various subsidiaries that together are referred to as Franklin Templeton. Certain officers and trustees of the Fund are also officers, directors and/or trustees of certain of the Underlying Funds and of the following subsidiaries:
| | |
| |
| Subsidiary | | Affiliation |
| |
Franklin Advisers, Inc. (Advisers) | | Investment manager |
| |
K2/D&S Management Co., LLC (K2 Advisors) | | Investment manager |
| |
Franklin Templeton Services, LLC (FT Services) | | Administrative manager |
| |
Franklin Templeton Distributors, Inc. (Distributors) | | Principal underwriter |
| |
Franklin Templeton Investor Services, LLC (Investor Services) | | Transfer agent |
a. Management Fees
The Fund pays an investment management fee to Advisers of 0.80% per year of the average daily net assets of the Fund.
Under a subadvisory agreement, K2 Advisors, an affiliate of Advisers, provides subadvisory services to the Fund. The subadvisory fee is paid by Advisers based on the Fund’s average daily net assets, and is not an additional expense of the Fund.
b. Administrative Fees
Under an agreement with Advisers, FT Services provides administrative services to the Fund. The fee is paid by Advisers based on the Fund’s average daily net assets, and is not an additional expense of the Fund.
c. Distribution Fees
The Board has adopted distribution plans for Class 2 and Class 5 shares pursuant to Rule12b-1 under the 1940 Act. Under the Fund’s compensation distribution plans, the Fund pays Distributors for costs incurred in connection with the servicing, sale and distribution of the Fund’s shares up to 0.35% and 0.15% per year of its average daily net assets of Class 2 and Class 5, respectively. The Board has agreed to limit the current rate to 0.25% per year for Class 2. The plan year, for purposes of monitoring compliance with the maximum annual plan rates, is February 1 through January 31.
d. Transfer Agent Fees
Investor Services, under terms of an agreement, performs shareholder servicing for the Fund and is not paid by the Fund for the services.
e. Investments in Underlying Funds
The Fund invests in Underlying Funds which are managed by affiliates of the Fund’s administrative manager, Franklin Templeton Services, LLC. The Fund does not invest in Underlying Funds for the purpose of exercising a controlling influence over the management or policies. Management fees paid by the Fund are waived on assets invested in the Underlying Funds, as noted in the Statement of Operations, in an amount not to exceed the management and administrative fees paid directly or indirectly by the Underlying Funds.
FRANKLIN TEMPLETON VARIABLE INSURANCE PRODUCTS TRUST
NOTES TO FINANCIAL STATEMENTS (UNAUDITED)
Franklin VolSmart Allocation VIP Fund(continued)
Investments in Underlying Funds for the ended June 30, 2019, were as follows:
| | | | | | | | | | | | | | | | | | | | | | | | |
| | | | | | | | |
| | | Value at
Beginning
of Period | | Purchases | | Sales | | | Realized
Gain (Loss) | | | Net Change in
Unrealized
Appreciation
(Depreciation) | | Value at End of Period | | Number of
Shares
Held at End
of Period | | | Dividend
Income | |
| | | | | | | |
| Non-Controlled Affiliates | | | | | | | | | | | | | | | | | | | | | | |
Franklin DynaTech Fund, Class R6 | | $ 8,980,816 | | $ — | | | $ (1,501,590 | ) | | | $ 500,486 | | | $2,053,055 | | $10,032,767 | | | 113,058 | | | | $ — | |
Franklin Income Fund, Class R6 | | 16,795,196 | | 428,986 | | | (3,562,423 | ) | | | (197,307 | ) | | 1,588,656 | | 15,053,108 | | | 6,516,497 | | | | 428,986 | |
Franklin Low Duration Total Return Fund, Class R6 | | 28,805,726 | | 4,228,986 | | | — | | | | — | | | 499,042 | | 33,533,754 | | | 3,435,835 | | | | 550,930 | |
Franklin Strategic Income Fund, Class R6 | | 18,529,912 | | 2,312,915 | | | — | | | | — | | | 876,666 | | 21,719,493 | | | 2,239,123 | | | | 490,319 | |
Institutional Fiduciary Trust Money Market Portfolio, 2.05% | | 1,130,276 | | 16,457,951 | | | (11,161,935 | ) | | | — | | | — | | 6,426,292 | | | 6,426,292 | | | | 58,048 | |
| | | | | | | | | | |
| | | | | | | | |
Total Affiliated Securities | | $74,241,926 | | $23,428,838 | | | $ (16,225,948 | ) | | | $ 303,179 | | | $5,017,419 | | $86,765,414 | | | | | | | $1,528,283 | |
| | | | | | | | | | |
f. Waiver and Expense Reimbursements
Advisers has contractually agreed in advance to waive or limit its fees and to assume as its own expense certain expenses otherwise payable by the Fund so that the expenses (excluding distribution fees and acquired fund fees and expenses and certainnon-routine expenses or costs, including those relating to litigation, indemnification, reorganizations, and liquidations) for each class of the Fund do not exceed 0.65%, based on the average net assets of each class until April 30, 2020. Total expenses waived or paid are not subject to recapture subsequent to the Fund’s fiscal year end.
4. Expense Offset Arrangement
The Fund has entered into an arrangement with its custodian whereby credits realized as a result of uninvested cash balances are used to reduce a portion of the Fund’s custodian expenses. During the period ended June 30, 2019, the custodian fees were reduced as noted in the Statement of Operations.
5. Income Taxes
At June 30, 2019, the cost of investments, net unrealized appreciation (depreciation) and undistributed long term capital gains for income tax purposes were as follows:
| | | | |
Cost of investments | | $ | 152,730,013 | |
| | | | |
| |
Unrealized appreciation | | $ | 39,398,938 | |
Unrealized depreciation | | | (4,379,853) | |
| | | | |
| |
Net unrealized appreciation (depreciation) | | $ | 35,019,085 | |
| | | | |
Differences between income and/or capital gains as determined on a book basis and a tax basis are primarily due to differing treatment of swaps and financial futures transactions.
6. Investment Transactions
Purchases and sales of investments (excluding short term securities) for the period ended June 30, 2019, aggregated $6,531,071 and $16,229,793, respectively.
FRANKLIN TEMPLETON VARIABLE INSURANCE PRODUCTS TRUST
NOTES TO FINANCIAL STATEMENTS (UNAUDITED)
Franklin VolSmart Allocation VIP Fund(continued)
7. Other Derivative Information
At June 30, 2019, investments in derivative contracts are reflected in the Statement of Assets and Liabilities as follows:
| | | | | | | | | | | | | | | | |
| | | Asset Derivatives | | | | | | Liability Derivatives | |
| | | | | | | | | | |
| | | | | |
Derivative Contracts Not Accounted for as Hedging Instruments | | Statement of Assets and Liabilities Location | | Fair Value | | | | | | Statement of Assets and Liabilities Location | | Fair Value | |
| | | | | |
Equity contracts | | Unrealized appreciation on OTC
swap contracts | | | $ — | | | | | | | Unrealized depreciation on OTC
swap contracts | | | $3,183 | |
| | | | | | | | | | | | | | | | |
For the period ended June 30, 2019, the effect of derivative contracts in the Statement of Operations was as follows:
| | | | | | | | | | | | | | | | |
| | | | | |
Derivative Contracts Not Accounted for as Hedging Instruments | | Statement of Operations Location | | Net Realized
Gain (Loss) for
the Period | | | | | | Statement of Operations Location | | Net Change in
Unrealized
Appreciation
(Depreciation)
for the Period | |
| | | | | |
| | Net realized gain (loss) from: | | | | | | | | | | Net change in unrealized | | | | |
| | | | | | | | | | | | appreciation (depreciation) on: | | | | |
Equity contracts | | Futures contracts | | | $(3,528,195) | | | | | | | Futures contracts | | | $1,511,553 | |
| | Swap contracts | | | (260,544) | | | | | | | Swap contracts | | | (716,726) | |
| | | | | | | | | | | | | | | | |
| | | | | |
Totals | | | | | $(3,788,739) | | | | | | | | | | $ 794,827 | |
| | | | | | | | | | | | | | | | |
For the period ended June 30, 2019, the average month end notional amount of futures contracts and swap contracts represented $8,453,634 and $19,100,000, respectively.
See Note 1(c) regarding derivative financial instruments.
8. Credit Facility
The Fund, together with other U.S. registered and foreign investment funds (collectively, Borrowers), managed by Franklin Templeton, are borrowers in a joint syndicated senior unsecured credit facility totaling $2 billion (Global Credit Facility) which matures on February 7, 2020. This Global Credit Facility provides a source of funds to the Borrowers for temporary and emergency purposes, including the ability to meet future unanticipated or unusually large redemption requests.
Under the terms of the Global Credit Facility, the Fund shall, in addition to interest charged on any borrowings made by the Fund and other costs incurred by the Fund, pay their share of fees and expenses incurred in connection with the implementation and maintenance of the Global Credit Facility, based upon their relative share of the aggregate net assets of all of the Borrowers, including an annual commitment fee of 0.15% based upon the unused portion of the Global Credit Facility. These fees are reflected in other expenses in the Statement of Operations. During the period ended June 30, 2019, the Fund did not use the Global Credit Facility.
FRANKLIN TEMPLETON VARIABLE INSURANCE PRODUCTS TRUST
NOTES TO FINANCIAL STATEMENTS (UNAUDITED)
Franklin VolSmart Allocation VIP Fund(continued)
9. Fair Value Measurements
The Fund follows a fair value hierarchy that distinguishes between market data obtained from independent sources (observable inputs) and the Fund’s own market assumptions (unobservable inputs). These inputs are used in determining the value of the Fund’s financial instruments and are summarized in the following fair value hierarchy:
| | • | | Level 1 – quoted prices in active markets for identical financial instruments |
| | • | | Level 2 – other significant observable inputs (including quoted prices for similar financial instruments, interest rates, prepayment speed, credit risk, etc.) |
| | • | | Level 3 – significant unobservable inputs (including the Fund’s own assumptions in determining the fair value of financial instruments) |
The input levels are not necessarily an indication of the risk or liquidity associated with financial instruments at that level.
A summary of inputs used as of June 30, 2019, in valuing the Fund’s assets and liabilities carried at fair value, is as follows:
| | | | | | | | | | | | | | | | |
| | | | |
| | | Level 1 | | | Level 2 | | | Level 3 | | | Total | |
| Assets: | | | | | | | | | | | | | | | | |
Investments in Securities:a | | | | | | | | | | | | | | | | |
Equity Investments | | $ | 100,986,867 | | | $ | — | | | $ | — | | | $ | 100,986,867 | |
Investments in Underlying Funds | | | 80,339,122 | | | | — | | | | — | | | | 80,339,122 | |
Short Term Investments | | | 6,426,292 | | | | — | | | | — | | | | 6,426,292 | |
| | | | |
| | | | |
Total Investments in Securities | | $ | 187,752,281 | | | $ | — | | | $ | — | | | $ | 187,752,281 | |
| | | | |
| | | | |
| Liabilities: | | | | | | | | | | | | | | | | |
Other Financial Instruments: | | | | | | | | | | | | | | | | |
Swap Contracts | | $ | — | | | $ | 3,183 | | | $ | — | | | $ | 3,183 | |
| | | | |
| | |
aFor detailed categories, see the accompanying Statement of Investments. | | | | | | | | | |
10. Subsequent Events
The Fund has evaluated subsequent events through the issuance of the financial statements and determined that no events have occurred that require disclosure.
Abbreviations
| | |
| |
| Counterparty | | Selected Portfolio |
| |
| BZWS Barclays Bank PLC | | VIX Market Volatility Index |
This page intentionally left blank.
Templeton Developing Markets VIP Fund
This semiannual report for Templeton Developing Markets VIP Fund covers the period ended June 30, 2019.
Class 2 Performance Summary as of June 30, 2019
The Fund’s Class 2 Shares posted a +14.16% total return* for thesix-month period ended June 30, 2019.
*The Fund has a fee waiver associated with any investments it makes in a Franklin Templeton money fund and/or other Franklin Templeton fund, contractually guaranteed through 4/30/20. Fund investment results reflect the expense reduction and fee waiver; without these reductions, the results would have been lower.
Performance reflects the Fund’s Class 2 operating expenses, but doesnotinclude any contract fees, expenses or sales charges. If they had been included, performance would be lower. These charges and deductions, particularly for variable life policies, can have a significant effect on contract values and insurance benefits. See the contract prospectus for a complete description of these expenses, including sales charges.
Performance data represent past performance, which does not guarantee future results. Investment return and principal value will fluctuate, and you may have a gain or loss when you sell your shares. Current performance may differ from figures shown.
TEMPLETON DEVELOPING MARKETS VIP FUND
Fund Goal and Main Investments
The Fund seeks long-term capital appreciation. Under normal market conditions, the Fund invests at least 80% of its net assets in emerging market investments.
Fund Risks
All investments involve risks, including possible loss of principal. Special risks are associated with foreign investing, including currency fluctuations, economic instability and political developments. Investments in developing markets, of which frontier markets are a subset, involve heightened risks related to the same factors, in addition to those associated with these markets’ smaller size, lesser liquidity and lack of established legal, political, business and social frameworks to support securities markets. Because these frameworks are typically even less developed in frontier markets, as well as various factors including the increased potential for extreme price volatility, illiquidity, trade barriers and exchange controls, the risks associated with developing markets are magnified in frontier markets. The Fund is designed for the aggressive portion of a well-diversified portfolio. The Fund is actively managed but there is no guarantee that the manager’s investment decisions will produce the desired results. The Fund’s prospectus also includes a description of the main investment risks.
Performance Overview
You can find the Fund’ssix-month total return in the Performance Summary. In comparison, the MSCI Emerging Markets (EM) Index posted a +10.78% total return, and the Standard & Poor’s®/International Finance Corporation Investable Composite Index posted a +10.49% total return for the same period.1 Please note, index performance numbers are for reference and we do not attempt to track an index but rather undertake investments on the basis of fundamental research.
Economic and Market Overview
Emerging market economic growth moderated during the six months ended June 30, 2019, with many countries’ growth rates dipping to multi-year lows. However, emerging market economies in general continued to grow faster than their developed market counterparts. China’s annual growth rate held steady in the first quarter of 2019 before moderating in
Geographic Composition
Based on Total Net Assets as of 6/30/19
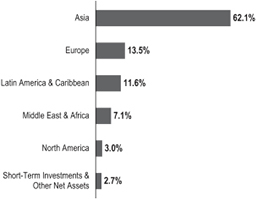
the second quarter to its lowest level since 1992. Trade tensions with the U.S. and weak global demand hurt China’s economy, though industrial production growth and strong consumer demand, stimulated by government policies, were bright spots. Elsewhere in Asia, South Korea’s first-quarter annual growth rate was the lowest since 2009, due to weak growth in manufacturing and a contraction in construction. Taiwan’s first-quarter annual growth rate also hit a multi-year low, as the global slowdown hurt the country’s export-driven economy. In India, weak consumer demand and fixed investment drove first-quarter annual growth to its lowest level since 2014. Turning to Europe, Russia’s annual growth rate slowed in the first quarter due to weakness in information, communication, financial and insurance sectors, as well as contractions in other sectors, significantly real estate. In Latin America, Brazil’s first-quarter annual growth moderated due to weak consumer demand and fixed investment.
Monetary policies varied among emerging market central banks. The People’s Bank of China left its benchmark interest rate unchanged during the period, but it took measures to improve financial liquidity to mitigate the negative effects of the U.S.-China trade dispute and support economic growth. South Korea’s and Taiwan’s central banks also held their benchmark interest rates steady, despite concerns about the negative effects of the U.S.-China trade dispute on the countries’ economies. India’s central bank unexpectedly cut its benchmark interest rate in February to
1. Source: Morningstar. One cannot invest directly in an index, and an index is not representative of the Fund’s portfolio. Please see Index Descriptions following the Fund Summaries.
The dollar value, number of shares or principal amount, and names of all portfolio holdings are listed in the Fund’s Statement of Investments (SOI).
TEMPLETON DEVELOPING MARKETS VIP FUND
boost a slowing economy amid low inflation, and made further cuts in April and June amid continued economic concerns. Russia’s central bank cut its key rate in June due to slowing inflation growth and weaker-than-expected economic growth. In Latin America, Brazil and Mexico’s central banks held their benchmark rates steady.
Emerging market equities rose during thesix-month period, though they lagged developed and frontier market stocks. Emerging market equities, led by Asia, posted significant gains in the first quarter of 2019, aided by the U.S. Federal Reserve’s decision to halt interest rate hikes and easing U.S.-China trade tensions. In contrast, emerging market equities posted modest gains in the second quarter, as Asian emerging market equities declined due to a spike in U.S.-China tensions in May (though tensions eased again in late June) that included further tariff impositions and fears China would decrease stimulus policies. For thesix-month period, all major regions posted positive returns, although Europe was the only region where emerging market equities outpaced overall developed market equities. Russia benefited from higher oil prices, an appreciating ruble and its perceived relative insulation from the U.S.-China trade dispute. Latin American equities advanced, led by Colombia and Brazil, despite concerns about Brazil’s slowing economic growth. Asian emerging market stocks lagged other regions, though Chinese equities still outpaced overall emerging market stocks. In this environment, global emerging market stocks, as measured by the MSCI EM Index, posted a +10.78% total return for thesix-month period.1
Investment Strategy
We employ a fundamental research, value-oriented, long-term investment approach. We focus on the market price of a company’s securities relative to our evaluation of its long-term earnings, asset value and cash flow potential. This includes an assessment of the potential impacts of material environmental, social and governance factors on the long-term risk and return profile of a company. We also consider a company’s profit and loss outlook, balance sheet strength, cash flow trends and asset value in relation to the current price of the company’s securities. Our analysis considers the company’s position in its sector, the economic framework and political environment.
Manager’s Discussion
During the six months under review, key contributors to absolute performance included Naspers, Brilliance China Automotive and Samsung Electronics.
Top 10 Countries
6/30/19
| | |
| |
| | | % of Total
Net Assets |
| |
China | | 24.5% |
| |
South Korea | | 16.0% |
| |
Russia | | 9.2% |
| |
Taiwan | | 8.5% |
| |
Brazil | | 8.2% |
| |
India | | 7.3% |
| |
South Africa | | 6.8% |
| |
U.K. | | 3.0% |
| |
U.S. | | 3.0% |
| |
Thailand | | 2.6% |
Naspers is an internet and media group based in South Africa. It also has sizeable investments in some of the world’s leading technology companies, including China-based Tencent and Russia-based Mail.Ru (both Fund holdings). The first quarter of 2019 saw a broad recovery in the information technology (IT) sector driven by improved investor confidence. Sentiment in Naspers further benefited from Tencent’s above-consensus fourth quarter 2018 revenue and earnings. Investors also reacted positively to Naspers’ creation of a new company listing in Amsterdam, which management expects to unlock value and reduce the discount to net asset value.
Brilliance China manufactures and sells automobiles for the Chinese domestic market, predominantly through its joint venture (JV) with German luxury car maker BMW (not a Fund holding). Brilliance China’s share price rebounded in the first half of 2019 as investors saw value emerge following a steep decline in the second half of 2018 after BMW announced plans to increase its JV stake to a majority share. The sale of part of Brilliance’s stake to BMW was approved by shareholders in early 2019, and the company is expected to distribute a special dividend from sale proceeds. However, completion of the deal is pending approval from Chinese regulators in 2022, when a change in regulations on foreign ownership comes into effect. Sentiment in the stock also benefited from Chinese government measures to support car sales.
Samsung is a South Korea-based consumer electronics and semiconductor manufacturer. It is one of the world’s largest smartphone and memory chip producers as well as a key supplier of organic light-emitting diode displays. Following weakness in the second half of 2018, Samsung’s share price rebounded due to improved sentiment in the technology sector in general. Although the company
TEMPLETON DEVELOPING MARKETS VIP FUND
reported weak first-quarter operating profits, largely due to weakness in the semiconductor and display segments, management expectations for a recovery in the second half of 2019 provided investors with some comfort.
In contrast, key detractors from absolute performance included Glenmark Pharmaceuticals, Massmart and Naver.
Glenmark Pharmaceuticals is amid-size Indian pharmaceutical company with a presence in generics and research and development. While fourth-quarter 2018 corporate results generally met market expectations, sentiment was hurt by weaker-than-expected growth in U.S. revenues along with earnings pressure from foreign exchange losses and higher research and development expenditures. A delay in U.S. approval and launch of an investigational product for the treatment of seasonal allergic rhinitis also led to shares falling sharply in June.
Massmart is a leading South African wholesaler, distributor and retailer of food products, general merchandise, alcohol, home improvement equipment and supplies. U.S.-based Walmart (not a Fund holding), the world’s largest retailer, owns a controlling stake in the company. Disappointing 2018 corporate results gave rise to a correction of Massmart’s share price. 2018 earnings declined largely due to weak sales growth and a contraction in the operating margin in two divisions. The company also released a profit decline warning for the first half of 2019. The resignation of the CEO and CFO further impacted sentiment.
Naver is South Korea’s largest web search engine, as well as a global information and communication technology brand that provides services including LINE messenger, currently with more than 200 million users around the world. Although lower marketing costs supported earnings, concerns that competition from U.S. search platforms have impacted key business areas hurt its share price. Losses at Naver’s Japanese subsidiary LINE were due to aggressive efforts to expand the service into fintech and also raised investor concerns.
During the past six months, we increased the Fund’s holdings in China, Brazil and Mexico due to their solid fundamentals. Investments in companies that are listed in the U.S. but have significant exposure to emerging markets were also increased. In terms of sectors, we undertook
Top 10 Holdings
6/30/19
| | |
| |
Company Sector/Industry, Country | | % of Total
Net Assets |
| |
Samsung Electronics Co. Ltd. Technology Hardware, Storage & Peripherals, South Korea | | 7.5% |
| |
Taiwan Semiconductor Manufacturing Co. Ltd. Semiconductors & Semiconductor Equipment, Taiwan | | 6.4% |
| |
Naspers Ltd. Internet & Direct Marketing Retail, South Africa | | 5.9% |
| |
Alibaba Group Holding Ltd. Internet & Direct Marketing Retail, China | | 5.0% |
| |
ICICI Bank Ltd. Banks, India | | 3.6% |
| |
Brilliance China Automotive Holdings Ltd. Automobiles, China | | 3.4% |
| |
Unilever PLC Personal Products, U.K. | | 3.0% |
| |
Tencent Holdings Ltd. Interactive Media & Services, China | | 2.9% |
| |
Banco Bradesco SA Banks, Brazil | | 2.6% |
| |
LUKOIL PJSC Oil, Gas & Consumable Fuels, Russia | | 2.5% |
additions in IT, industrials and financials.2 New purchases included Health & Happiness H&H International, a leading family nutrition product company in China; Petroleo Brasileiro (Petrobras), Brazil’s national energy company; and Argentinian bank BBVA Argentina, which initiated the Fund’s exposure to that country. We increased existing positions in Cognizant Technology, a major global information technology services company, and China Resources Cement.
We reduced the Fund’s investments in Thailand, Peru and Taiwan in favor of stocks we deemed to be more attractively valued within our investment universe. Sectors that experienced the largest sales were materials, consumer discretionary and communication services.3 We made key reductions in the aforementioned Naspers and in Compania De Minas Buenaventura, a Peruvian precious metals company, while we liquidated the Fund’s positions in cement producer Semen Indonesia and Nigerian Breweries, which eliminated the Fund’s exposure to Nigeria.
2. The information technology sector comprises electronic equipment, instruments and components; IT services; semiconductors and semiconductor equipment; software; and technology hardware, storage and peripherals in the SOI. The industrials sector comprises construction and engineering, industrial conglomerates and transportation infrastructure in the SOI. The financials sector comprises banks, capital markets, diversified financial services and insurance in the SOI.
3. The materials sector comprises chemicals, construction materials, and metals and mining in the SOI. The consumer discretionary sector comprises auto components; automobiles; distributors; hotels, restaurants and leisure; internet and direct marketing retail; multiline retail; and textiles, apparel and luxury goods in the SOI. The communication services sector comprises entertainment, interactive media and services, media and wireless telecommunication services in the SOI.
TEMPLETON DEVELOPING MARKETS VIP FUND
Thank you for your participation in Templeton Developing Markets VIP Fund. We look forward to serving your future investment needs.
The foregoing information reflects our analysis, opinions and portfolio holdings as of June 30, 2019, the end of the reporting period. The way we implement our main investment strategies and the resulting portfolio holdings may change depending on factors such as market and economic conditions. These opinions may not be relied upon as investment advice or an offer for a particular security. The information is not a complete analysis of every aspect of any market, country, industry, security or the Fund. Statements of fact are from sources considered reliable, but the investment manager makes no representation or warranty as to their completeness or accuracy. Although historical performance is no guarantee of future results, these insights may help you understand our investment management philosophy.
TEMPLETON DEVELOPING MARKETS VIP FUND
Class 2 Fund Expenses
As an investor in a variable insurance contract (Contract) that indirectly provides for investment in an underlying mutual fund, you can incur transaction and/or ongoing expenses at both the Fund level and the Contract Level: (1) transaction expenses can include sales charges (loads) on purchases, surrender fees, transfer fees and premium taxes; and (2) ongoing expenses can include management fees, distribution and service(12b-1) fees, contract fees, annual maintenance fees, mortality and expense risk fees and other fees and expenses. All mutual funds and Contracts have some types of ongoing expenses. The table below shows Fund-level ongoing expenses and can help you understand these costs and compare them with those of other mutual funds offered through the Contract. The table assumes a $1,000 investment held for the six months indicated. Please refer to the Fund prospectus for additional information on operating expenses.
Actual Fund Expenses
The table below provides information about the actual account values and actual expenses in the columns under the heading “Actual.” In these columns the Fund’s actual return, which includes the effect of ongoing Fund expenses but does not include the effect of ongoing Contract expenses, is used to calculate the “Ending Account Value.” You can estimate the Fund-level expenses you paid during the period by following these steps (of course, your account value and expenses will differ from those in this illustration): Divide your account value by $1,000 (if your account had an $8,600 value, then $8,600÷ $1,000 =8.6). Then multiply the result by the number under the headings “Actual” and “Fund-Level Expenses Paid During Period” (if Fund-Level Expenses Paid During Period were $ 7.50, then 8.6 x $ 7.50 = $64.50). In this illustration, the estimated expenses paid this period at the Fund level are $64.50.
Hypothetical Example for Comparison with Other Mutual Funds
Under the heading “Hypothetical” in the table, information is provided about hypothetical account values and hypothetical expenses based on the Fund’s actual expense ratio and an assumed rate of return of 5% per year before expenses, which is not the Fund’s actual return. This information may not be used to estimate the actual ending account balance or expenses you paid for the period, but it can help you compare ongoing costs of investing in the Fund with those of other mutual funds offered through the Contract. To do so, compare this 5% hypothetical example with the 5% hypothetical examples that appear in the shareholder reports of other funds offered through the Contract.
Please note that expenses shown in the table are meant to highlight ongoing costs at the Fund level only and do not reflect any ongoing expenses at the Contract level, or transaction expenses at either the Fund or Contract levels. In addition, while the Fund does not have transaction expenses, if the transaction and ongoing expenses at the Contract level were included, the expenses shown below would be higher. You should consult your Contract prospectus or disclosure document for more information.
| | | | | | | | | | | | |
| | | | | Actual | | Hypothetical | | |
| | | | | (actual return after expenses) | | (5% annual return before expenses) | | |
Share Class | | Beginning
Account
Value 1/1/19 | | Ending
Account
Value 6/30/19 | | Fund-Level
Expenses
Paid During
Period
1/1/19–6/30/191, 2 | | Ending Account Value 6/30/19 | | Fund-Level
Expenses Paid During Period 1/1/19–6/30/191,2 | | Net
Annualized
Expense
Ratio2 |
| | | | | | |
Class 2 | | $1,000 | | $1,141.60 | | $7.43 | | $1,017.85 | | $7.00 | | 1.40% |
1. Expenses are equal to the annualized expense ratio for thesix-month period as indicated above—in the far right column—multiplied by the simple average account value over the period indicated, and then multiplied by 181/365 to reflect theone-half year period.
2. Reflects expenses after fee waivers and expense reimbursements. Does not include any ongoing expenses of the Contract for which the Fund is an investment option or acquired fund fees and expenses.
FRANKLIN TEMPLETON VARIABLE INSURANCE PRODUCTS TRUST
Financial Highlights
Templeton Developing Markets VIP Fund
| | | | | | | | | | | | | | | | | | | | | | | | |
| | |
| | | Six Months Ended
June 30, 2019 (unaudited) | | | Year Ended December 31, | |
| | | 2018 | | | 2017 | | | 2016 | | | 2015 | | | 2014 | |
| |
| | | | | | |
Class 1 | | | | | | | | | | | | | | | | | | | | | | | | |
| | | | | | |
Per share operating performance (for a share outstanding throughout the period) | | | | | | | | | | | | | | | | | | | | | | | | |
| | | | | | |
Net asset value, beginning of period | | | $ 8.62 | | | | $10.31 | | | | $ 7.42 | | | | $ 6.37 | | | | $ 9.27 | | | | $10.26 | |
| | | | |
| | | | | | |
Income from investment operationsa: | | | | | | | | | | | | | | | | | | | | | | | | |
| | | | | | |
Net investment incomeb | | | 0.07 | | | | 0.09 | | | | 0.08 | | | | 0.05 | | | | 0.06 | | | | 0.15c | |
| | | | | | |
Net realized and unrealized gains (losses) | | | 1.15 | | | | (1.67 | ) | | | 2.92 | | | | 1.08 | | | | (1.63 | ) | | | (0.97) | |
| | | | |
| | | | | | |
Total from investment operations | | | 1.22 | | | | (1.58 | ) | | | 3.00 | | | | 1.13 | | | | (1.57 | ) | | | (0.82) | |
| | | | |
| | | | | | |
Less distributions from: | | | | | | | | | | | | | | | | | | | | | | | | |
| | | | | | |
Net investment income | | | (0.12 | ) | | | (0.11 | ) | | | (0.11 | ) | | | (0.08 | ) | | | (0.20 | ) | | | (0.17) | |
| | | | | | |
Net realized gains | | | — | | | | — | | | | — | | | | — | | | | (1.13 | ) | | | — | |
| | | | |
| | | | | | |
Total distributions | | | (0.12 | ) | | | (0.11 | ) | | | (0.11 | ) | | | (0.08 | ) | | | (1.33 | ) | | | (0.17) | |
| | | | |
| | | | | | |
Redemption fees. | | | — | | | | — | | | | — | | | | — | | | | — | | | | —d | |
| | | | |
| | | | | | |
Net asset value, end of period | | | $ 9.72 | | | | $ 8.62 | | | | $10.31 | | | | $ 7.42 | | | | $ 6.37 | | | | $ 9.27 | |
| | | | |
| | | | | | |
Total returne | | | 14.23% | | | | (15.44)% | | | | 40.65% | | | | 17.79% | | | | (19.42)% | | | | (8.09)% | |
| | | | | | |
| Ratios to average net assetsf | | | | | | | | | | | | | | | | | | | | | | | | |
| | | | | | |
Expenses before waiver and payments by affiliates | | | 1.15% | | | | 1.24% | | | | 1.36% | | | | 1.38% | | | | 1.33% | | | | 1.36% | |
| | | | | | |
Expenses net of waiver and payments by affiliates | | | 1.15% | g | | | 1.24% | g | | | 1.35% | h | | | 1.36% | | | | 1.32% | | | | 1.36% | g |
| | | | | | |
Net investment income | | | 1.42% | | | | 0.99% | | | | 0.86% | | | | 0.79% | | | | 0.74% | | | | 1.51% | c |
| | | | | | |
| Supplemental data | | | | | | | | | | | | | | | | | | | | | | | | |
| | | | | | |
Net assets, end of period (000’s) | | | $91,732 | | | | $85,397 | | | | $105,493 | | | | $82,596 | | | | $77,000 | | | | $114,487 | |
| | | | | | |
Portfolio turnover rate | | | 8.56% | | | | 9.22% | | | | 10.76% | | | | 26.78% | | | | 71.69% | | | | 82.87% | |
aThe amount shown for a share outstanding throughout the period may not correlate with the Statement of Operations for the period due to the timing of sales and repurchases of the Fund’s shares in relation to income earned and/or fluctuating fair value of the investments of the Fund.
bBased on average daily shares outstanding.
cNet investment income per share includes approximately $0.04 per share related to income received in the form of special dividends in connection with certain Fund holdings. Excluding this amount, the ratio of net investment income to average net assets would have been 1.11%.
dAmount rounds to less than $0.01 per share.
eTotal return does not include fees, charges or expenses imposed by the variable annuity and life insurance contracts for which Franklin Templeton Variable Insurance Products Trust serves as an underlying investment vehicle. Total return is not annualized for periods less than one year.
fRatios are annualized for periods less than one year.
gBenefit of waiver and payments by affiliates rounds to less than 0.01%.
hBenefit of expense reduction rounds to less than 0.01%.
| | | | | | |
| | | |
| | The accompanying notes are an integral part of these financial statements. | Semiannual Report | | | TD-7 | |
FRANKLIN TEMPLETON VARIABLE INSURANCE PRODUCTS TRUST
FINANCIAL HIGHLIGHTS
Templeton Developing Markets VIP Fund(continued)
| | | | | | | | | | | | | | | | | | | | | | | | |
| | |
| | | Six Months Ended
June 30, 2019 (unaudited) | | | Year Ended December 31, | |
| | | 2018 | | | 2017 | | | 2016 | | | 2015 | | | 2014 | |
| |
| | | | | | |
Class 2 | | | | | | | | | | | | | | | | | | | | | | | | |
| | | | | | |
Per share operating performance (for a share outstanding throughout the period) | | | | | | | | | | | | | | | | | | | | | | | | |
| | | | | | |
Net asset value, beginning of period | | | $ 8.54 | | | | $10.23 | | | | $ 7.36 | | | | $ 6.32 | | | | $ 9.20 | | | | $10.19 | |
| | | | |
| | | | | | |
Income from investment operationsa: | | | | | | | | | | | | | | | | | | | | | | | | |
| | | | | | |
Net investment incomeb | | | 0.05 | | | | 0.07 | | | | 0.05 | | | | 0.04 | | | | 0.04 | | | | 0.12c | |
| | | | | | |
Net realized and unrealized gains (losses) | | | 1.15 | | | | (1.68 | ) | | | 2.91 | | | | 1.06 | | | | (1.61 | ) | | | (0.96) | |
| | | | |
| | | | | | |
Total from investment operations | | | 1.20 | | | | (1.61 | ) | | | 2.96 | | | | 1.10 | | | | (1.57 | ) | | | (0.84) | |
| | | | |
| | | | | | |
Less distributions from: | | | | | | | | | | | | | | | | | | | | | | | | |
| | | | | | |
Net investment income | | | (0.09 | ) | | | (0.08 | ) | | | (0.09 | ) | | | (0.06 | ) | | | (0.18 | ) | | | (0.15) | |
| | | | | | |
Net realized gains | | | — | | | | — | | | | — | | | | — | | | | (1.13 | ) | | | — | |
| | | | |
| | | | | | |
Total distributions | | | (0.09 | ) | | | (0.08 | ) | | | (0.09 | ) | | | (0.06 | ) | | | (1.31 | ) | | | (0.15) | |
| | | | |
| | | | | | |
Redemption fees | | | — | | | | — | | | | — | | | | — | | | | — | | | | — | d |
| | | | |
| | | | | | |
Net asset value, end of period | | | $ 9.65 | | | | $ 8.54 | | | | $10.23 | | | | $ 7.36 | | | | $ 6.32 | | | | $ 9.20 | |
| | | | |
| | | | | | |
Total returne | | | 14.16% | | | | (15.79)% | | | | 40.41% | | | | 17.44% | | | | (19.60)% | | | | (8.39)% | |
| | | | | | |
Ratios to average net assetsf | | | | | | | | | | | | | | | | | | | | | | | | |
| | | | | | |
Expenses before waiver and payments by affiliates | | | 1.40% | | | | 1.49% | | | | 1.61% | | | | 1.63% | | | | 1.58% | | | | 1.61% | |
| | | | | | |
Expenses net of waiver and payments by affiliates | | | 1.40% | g | | | 1.49% | g | | | 1.60% | h | | | 1.61% | | | | 1.57% | | | | 1.61% | g |
| | | | | | |
Net investment income | | | 1.17% | | | | 0.74% | | | | 0.61% | | | | 0.54% | | | | 0.49% | | | | 1.26%c | |
| | | | | | |
Supplemental data | | | | | | | | | | | | | | | | | | | | | | | | |
| | | | | | |
Net assets, end of period (000’s) | | | $221,695 | | | | $195,305 | | | | $270,433 | | | | $205,151 | | | | $192,120 | | | | $250,813 | |
| | | | | | |
Portfolio turnover rate | | | 8.56% | | | | 9.22% | | | | 10.76% | | | | 26.78% | | | | 71.69% | | | | 82.87% | |
aThe amount shown for a share outstanding throughout the period may not correlate with the Statement of Operations for the period due to the timing of sales and repurchases of the Fund’s shares in relation to income earned and/or fluctuating fair value of the investments of the Fund.
bBased on average daily shares outstanding.
cNet investment income per share includes approximately $0.04 per share related to income received in the form of special dividends in connection with certain Fund holdings. Excluding this amount, the ratio of net investment income to average net assets would have been 0.86%.
dAmount rounds to less than $0.01 per share.
eTotal return does not include fees, charges or expenses imposed by the variable annuity and life insurance contracts for which Franklin Templeton Variable Insurance Products Trust serves as an underlying investment vehicle. Total return is not annualized for periods less than one year.
fRatios are annualized for periods less than one year.
gBenefit of waiver and payments by affiliates rounds to less than 0.01%.
hBenefit of expense reduction rounds to less than 0.01%.
| | | | |
| | | |
TD-8 | | Semiannual Report | The accompanying notes are an integral part of these financial statements. | | |
FRANKLIN TEMPLETON VARIABLE INSURANCE PRODUCTS TRUST
FINANCIAL HIGHLIGHTS
Templeton Developing Markets VIP Fund(continued)
| | | | | | | | | | | | | | | | | | | | | | | | |
| | |
| | | Six Months Ended
June 30, 2019 (unaudited) | | | Year Ended December 31, | |
| | | 2018 | | | 2017 | | | 2016 | | | 2015 | | | 2014 | |
| |
| | | | | | |
Class 4 | | | | | | | | | | | | | | | | | | | | | | | | |
| | | | | | |
Per share operating performance (for a share outstanding throughout the period) | | | | | | | | | | | | | | | | | | | | | | | | |
| | | | | | |
Net asset value, beginning of period | | | $ 8.59 | | | | $10.28 | | | | $ 7.39 | | | | $ 6.34 | | | | $ 9.22 | | | | $10.20 | |
| | | | |
| | | | | | |
Income from investment operationsa: | | | | | | | | | | | | | | | | | | | | | | | | |
| | | | | | |
Net investment incomeb | | | 0.05 | | | | 0.06 | | | | 0.05 | | | | 0.03 | | | | 0.03 | | | | 0.12 | c |
| | | | | | |
Net realized and unrealized gains (losses) | | | 1.15 | | | | (1.68 | ) | | | 2.92 | | | | 1.06 | | | | (1.62 | ) | | | (0.97 | ) |
| | | | |
| | | | | | |
Total from investment operations | | | 1.20 | | | | (1.62 | ) | | | 2.97 | | | | 1.09 | | | | (1.59 | ) | | | (0.85 | ) |
| | | | |
| | | | | | |
Less distributions from: | | | | | | | | | | | | | | | | | | | | | | | | |
| | | | | | |
Net investment income | | | (0.08 | ) | | | (0.07 | ) | | | (0.08 | ) | | | (0.04 | ) | | | (0.16 | ) | | | (0.13 | ) |
| | | | | | |
Net realized gains | | | — | | | | — | | | | — | | | | — | | | | (1.13 | ) | | | — | |
| | | | |
| | | | | | |
Total distributions | | | (0.08 | ) | | | (0.07 | ) | | | (0.08 | ) | | | (0.04 | ) | | | (1.29 | ) | | | (0.13 | ) |
| | | | |
| | | | | | |
Redemption fees | | | — | | | | — | | | | — | | | | — | | | | — | | | | — | d |
| | | | |
| | | | | | |
Net asset value, end of period | | | $ 9.71 | | | | $ 8.59 | | | | $10.28 | | | | $ 7.39 | | | | $ 6.34 | | | | $ 9.22 | |
| | | | |
| | | | | | |
Total returne | | | 14.04% | | | | (15.81)% | | | | 40.30% | | | | 17.32% | | | | (19.70)% | | | | (8.48)% | |
| | | | | | |
Ratios to average net assetsf | | | | | | | | | | | | | | | | | | | | | | | | |
| | | | | | |
Expenses before waiver and payments by affiliates | | | 1.50% | | | | 1.59% | | | | 1.71% | | | | 1.73% | | | | 1.68% | | | | 1.71% | |
| | | | | | |
Expenses net of waiver and payments by affiliates | | | 1.50% | g | | | 1.59% | g | | | 1.70% | h | | | 1.71% | | | | 1.67% | | | | 1.71% | g |
| | | | | | |
Net investment income | | | 1.07% | | | | 0.64% | | | | 0.51% | | | | 0.44% | | | | 0.39% | | | | 1.16%c | |
| | | | | | |
Supplemental data | | | | | | | | | | | | | | | | | | | | | | | | |
| | | | | | |
Net assets, end of period (000’s) | | | $5,574 | | | | $5,203 | | | | $7,199 | | | | $6,377 | | | | $7,109 | | | | $11,106 | |
| | | | | | |
Portfolio turnover rate | | | 8.56% | | | | 9.22% | | | | 10.76% | | | | 26.78% | | | | 71.69% | | | | 82.87% | |
aThe amount shown for a share outstanding throughout the period may not correlate with the Statement of Operations for the period due to the timing of sales and repurchases of the Fund’s shares in relation to income earned and/or fluctuating fair value of the investments of the Fund.
bBased on average daily shares outstanding.
cNet investment income per share includes approximately $0.04 per share related to income received in the form of special dividends in connection with certain Fund holdings. Excluding this amount, the ratio of net investment income to average net assets would have been 0.76%.
dAmount rounds to less than $0.01 per share.
eTotal return does not include fees, charges or expenses imposed by the variable annuity and life insurance contracts for which Franklin Templeton Variable Insurance Products Trust serves as an underlying investment vehicle. Total return is not annualized for periods less than one year.
fRatios are annualized for periods less than one year.
gBenefit of waiver and payments by affiliates rounds to less than 0.01%.
hBenefit of expense reduction rounds to less than 0.01%.
| | | | | | |
| | | |
| | The accompanying notes are an integral part of these financial statements. | Semiannual Report | | | TD-9 | |
FRANKLIN TEMPLETON VARIABLE INSURANCE PRODUCTS TRUST
Statement of Investments, June 30, 2019 (unaudited)
Templeton Developing Markets VIP Fund
| | | | | | | | | | |
| | | |
| | | Industry | | Shares | | | Value | |
Common Stocks 91.8% | | | | | | | | | | |
Argentina 0.2% | | | | | | | | | | |
Banco BBVA Argentina SA, ADR | | Banks | | | 58,700 | | | | $ 664,484 | |
| | | | | | | | | | |
| | | |
Brazil 2.7% | | | | | | | | | | |
aB2W Cia Digital | | Internet & Direct Marketing Retail | | | 115,300 | | | | 981,430 | |
B3 SA - Brasil Bolsa Balcao | | Capital Markets | | | 247,800 | | | | 2,414,825 | |
Lojas Americanas SA | | Multiline Retail | | | 169,200 | | | | 580,139 | |
M. Dias Branco SA | | Food Products | | | 136,200 | | | | 1,380,425 | |
Mahle-Metal Leve SA | | Auto Components | | | 136,600 | | | | 878,447 | |
Totvs SA | | Software | | | 200,000 | | | | 2,287,721 | |
| | | | | | | | | | |
| | | |
| | | | | | | | | 8,522,987 | |
| | | | | | | | | | |
Cambodia 1.1% | | | | | | | | | | |
NagaCorp Ltd. | | Hotels, Restaurants & Leisure | | | 2,857,800 | | | | 3,515,480 | |
| | | | | | | | | | |
| | | |
China 24.5% | | | | | | | | | | |
aAlibaba Group Holding Ltd., ADR | | Internet & Direct Marketing Retail | | | 93,210 | | | | 15,794,435 | |
BAIC Motor Corp. Ltd., H | | Automobiles | | | 1,686,100 | | | | 1,057,569 | |
aBaidu Inc., ADR | | Interactive Media & Services | | | 9,411 | | | | 1,104,475 | |
Brilliance China Automotive Holdings Ltd. | | Automobiles | | | 9,831,800 | | | | 10,873,671 | |
China Construction Bank Corp., H | | Banks | | | 7,168,000 | | | | 6,175,079 | |
China Merchants Bank Co. Ltd., A | | Banks | | | 337,500 | | | | 1,768,400 | |
China Mobile Ltd. | | Wireless Telecommunication Services | | | 447,000 | | | | 4,071,101 | |
China Petroleum & Chemical Corp., H | | Oil, Gas & Consumable Fuels | | | 2,500,900 | | | | 1,699,888 | |
China Resources Cement Holdings Ltd. | | Construction Materials | | | 2,338,400 | | | | 2,265,918 | |
CNOOC Ltd. | | Oil, Gas & Consumable Fuels | | | 2,000,500 | | | | 3,421,168 | |
COSCO Shipping Ports Ltd. | | Transportation Infrastructure | | | 847,238 | | | | 836,160 | |
Dah Chong Hong Holdings Ltd. | | Distributors | | | 1,746,100 | | | | 583,363 | |
Dairy Farm International Holdings Ltd. | | Food & Staples Retailing | | | 98,933 | | | | 707,371 | |
Health & Happiness H&H International Holdings Ltd. | | Food Products | | | 335,400 | | | | 1,904,084 | |
MGM China Holdings Ltd. | | Hotels, Restaurants & Leisure | | | 603,200 | | | | 1,025,389 | |
NetEase Inc., ADR | | Entertainment | | | 6,922 | | | | 1,770,440 | |
Ping An Bank Co. Ltd., A | | Banks | | | 2,027,300 | | | | 4,068,299 | |
Ping An Insurance Group Co. of China Ltd., A | | Insurance | | | 273,623 | | | | 3,530,864 | |
Sands China Ltd. | | Hotels, Restaurants & Leisure | | | 338,600 | | | | 1,618,851 | |
Sunny Optical Technology Group Co. Ltd. | | Electronic Equipment, Instruments & Components | | | 161,000 | | | | 1,663,140 | |
Tencent Holdings Ltd. | | Interactive Media & Services | | | 208,500 | | | | 9,410,610 | |
Uni-President China Holdings Ltd. | | Food Products | | | 2,016,700 | | | | 2,245,898 | |
Weifu High-Technology Co. Ltd., B | | Auto Components | | | 334,339 | | | | 603,014 | |
| | | | | | | | | | |
| | | |
| | | | | | | | | 78,199,187 | |
| | | | | | | | | | |
Czech Republic 0.4% | | | | | | | | | | |
Moneta Money Bank AS | | Banks | | | 390,403 | | | | 1,336,799 | |
| | | | | | | | | | |
| | | |
Hungary 0.9% | | | | | | | | | | |
Richter Gedeon Nyrt | | Pharmaceuticals | | | 161,270 | | | | 2,970,562 | |
| | | | | | | | | | |
| | | |
India 7.3% | | | | | | | | | | |
Bajaj Holdings & Investment Ltd. | | Diversified Financial Services | | | 35,390 | | | | 1,846,876 | |
Biocon Ltd. | | Biotechnology | | | 581,104 | | | | 2,111,611 | |
Coal India Ltd. | | Oil, Gas & Consumable Fuels | | | 224,035 | | | | 824,657 | |
Glenmark Pharmaceuticals Ltd. | | Pharmaceuticals | | | 292,323 | | | | 1,879,643 | |
FRANKLIN TEMPLETON VARIABLE INSURANCE PRODUCTS TRUST
STATEMENT OF INVESTMENTS (UNAUDITED)
Templeton Developing Markets VIP Fund(continued)
| | | | | | | | | | |
| | | |
| | | Industry | | Shares | | | Value | |
| | | |
Common Stocks(continued) | | | | | | | | | | |
| | | |
India (continued) | | | | | | | | | | |
ICICI Bank Ltd. | | Banks | | | 1,806,409 | | | | $ 11,451,506 | |
Infosys Ltd. | | IT Services | | | 306,365 | | | | 3,252,490 | |
Tata Chemicals Ltd. | | Chemicals | | | 174,200 | | | | 1,583,085 | |
aTata Motors Ltd., A | | Automobiles | | | 394,471 | | | | 455,687 | |
| | | | | | | | | | |
| | | |
| | | | | | | | | 23,405,555 | |
| | | | | | | | | | |
Indonesia 1.3% | | | | | | | | | | |
Astra International Tbk PT | | Automobiles | | | 8,085,700 | | | | 4,263,915 | |
| | | | | | | | | | |
| | | |
Kenya 0.3% | | | | | | | | | | |
Equity Group Holdings PLC | | Banks | | | 2,127,994 | | | | 810,862 | |
| | | | | | | | | | |
| | | |
Mexico 2.5% | | | | | | | | | | |
Banco Santander Mexico SA Institucion de Banca Multiple Grupo Financiero Santander, ADR | | Banks | | | 949,761 | | | | 7,265,672 | |
Nemak SAB de CV | | Auto Components | | | 1,686,600 | | | | 791,311 | |
| | | | | | | | | | |
| | | |
| | | | | | | | | 8,056,983 | |
| | | | | | | | | | |
Pakistan 0.3% | | | | | | | | | | |
Habib Bank Ltd. | | Banks | | | 1,460,000 | | | | 1,002,690 | |
| | | | | | | | | | |
| | | |
Peru 0.7% | | | | | | | | | | |
Compania de Minas Buenaventura SA, ADR | | Metals & Mining | | | 47,770 | | | | 796,326 | |
Intercorp Financial Services Inc. | | Banks | | | 31,950 | | | | 1,453,725 | |
| | | | | | | | | | |
| | | |
| | | | | | | | | 2,250,051 | |
| | | | | | | | | | |
Philippines 0.3% | | | | | | | | | | |
BDO Unibank Inc. | | Banks | | | 327,469 | | | | 894,899 | |
| | | | | | | | | | |
| | | |
Russia 9.2% | | | | | | | | | | |
Gazprom PJSC, ADR | | Oil, Gas & Consumable Fuels | | | 622,000 | | | | 4,556,772 | |
LUKOIL PJSC, ADR | | Oil, Gas & Consumable Fuels | | | 95,250 | | | | 8,041,005 | |
a,bMail.Ru Group Ltd., GDR, Reg S | | Interactive Media & Services | | | 112,799 | | | | 2,878,630 | |
MMC Norilsk Nickel PJSC, ADR | | Metals & Mining | | | 37,800 | | | | 858,438 | |
Sberbank of Russia PJSC, ADR | | Banks | | | 498,847 | | | | 7,672,267 | |
aYandex NV, A | | Interactive Media & Services | | | 136,818 | | | | 5,199,084 | |
| | | | | | | | | | |
| | | |
| | | | | | | | | 29,206,196 | |
| | | | | | | | | | |
Singapore 0.2% | | | | | | | | | | |
DBS Group Holdings Ltd. | | Banks | | | 25,706 | | | | 493,130 | |
| | | | | | | | | | |
| | | |
South Africa 6.8% | | | | | | | | | | |
Massmart Holdings Ltd. | | Food & Staples Retailing | | | 465,421 | | | | 2,054,831 | |
aMultiChoice Group Ltd. | | Media | | | 90,505 | | | | 860,637 | |
Naspers Ltd., N | | Internet & Direct Marketing Retail | | | 77,527 | | | | 18,817,330 | |
| | | | | | | | | | |
| | | |
| | | | | | | | | 21,732,798 | |
| | | | | | | | | | |
South Korea 16.0% | | | | | | | | | | |
Fila Korea Ltd. | | Textiles, Apparel & Luxury Goods | | | 59,210 | | | | 3,925,361 | |
Hankook Technology Group Co. Ltd. | | Diversified Financial Services | | | 37,500 | | | | 555,885 | |
Hankook Tire & Technology Co. Ltd. | | Auto Components | | | 21,600 | | | | 655,315 | |
Hanon Systems | | Auto Components | | | 94,741 | | | | 954,010 | |
HDC Hyundai DevelopmentCo-Engineering & Construction | | Construction & Engineering | | | 56,247 | | | | 2,114,841 | |
Hite Jinro Co. Ltd. | | Beverages | | | 29,470 | | | | 518,363 | |
FRANKLIN TEMPLETON VARIABLE INSURANCE PRODUCTS TRUST
STATEMENT OF INVESTMENTS (UNAUDITED)
Templeton Developing Markets VIP Fund(continued)
| | | | | | | | | | |
| | | |
| | | Industry | | Shares | | | Value | |
| | | |
Common Stocks(continued) | | | | | | | | | | |
| | | |
South Korea(continued) | | | | | | | | | | |
KT Skylife Co. Ltd. | | Media | | | 166,071 | | | | $ 1,514,382 | |
LG Corp. | | Industrial Conglomerates | | | 83,455 | | | | 5,547,124 | |
Naver Corp. | | Interactive Media & Services | | | 62,869 | | | | 6,194,847 | |
POSCO | | Metals & Mining | | | 12,766 | | | | 2,697,881 | |
Samsung Electronics Co. Ltd. | | Technology Hardware, Storage & Peripherals | | | 589,877 | | | | 23,963,403 | |
SK Hynix Inc. | | Semiconductors & Semiconductor Equipment | | | 37,980 | | | | 2,281,544 | |
| | | | | | | | | | |
| | | |
| | | | | | | | | 50,922,956 | |
| | | | | | | | | | |
Taiwan 8.5% | | | | | | | | | | |
| | | |
Catcher Technology Co. Ltd. | | Technology Hardware, Storage & Peripherals | | | 248,000 | | | | 1,781,264 | |
CTBC Financial Holding Co. Ltd. | | Banks | | | 2,244,000 | | | | 1,546,562 | |
FIT Hon Teng Ltd. | | Electronic Equipment, Instruments | | | | | | | | |
| | & Components | | | 1,759,800 | | | | 711,836 | |
Hon Hai Precision Industry Co. Ltd. | | Electronic Equipment, Instruments | | | | | | | | |
| | & Components | | | 629,200 | | | | 1,572,086 | |
Largan Precision Co. Ltd. | | Electronic Equipment, Instruments | | | | | | | | |
| | & Components | | | 7,900 | | | | 983,101 | |
Taiwan Semiconductor Manufacturing Co. Ltd. | | Semiconductors & Semiconductor Equipment | | | 2,658,000 | | | | 20,506,876 | |
| | | | | | | | | | |
| | | |
| | | | | | | | | 27,101,725 | |
| | | | | | | | | | |
Thailand 2.6% | | | | | | | | | | |
| | | |
Kasikornbank PCL, fgn | | Banks | | | 619,500 | | | | 3,825,196 | |
Kiatnakin Bank PCL, fgn | | Banks | | | 1,009,800 | | | | 2,286,774 | |
Thai Beverage PCL, fgn | | Beverages | | | 3,442,500 | | | | 2,111,417 | |
| | | | | | | | | | |
| | | |
| | | | | | | | | 8,223,387 | |
| | | | | | | | | | |
United Kingdom 3.0% | | | | | | | | | | |
| | | |
Unilever PLC | | Personal Products | | | 155,816 | | | | 9,685,164 | |
| | | | | | | | | | |
| | | |
United States 3.0% | | | | | | | | | | |
| | | |
Cognizant Technology Solutions Corp., A | | IT Services | | | 110,315 | | | | 6,992,868 | |
aIMAX Corp. | | Entertainment | | | 125,255 | | | | 2,530,151 | |
| | | | | | | | | | |
| | | |
| | | | | | | | | 9,523,019 | |
| | | | | | | | | | |
Total Common Stocks (Cost $215,575,062) | | | | | | | | | 292,782,829 | |
| | | | | | | | | | |
| | | |
Preferred Stocks 5.5% | | | | | | | | | | |
| | | |
Brazil 5.5% | | | | | | | | | | |
cBanco Bradesco SA, 3.053%, ADR, pfd | | Banks | | | 828,715 | | | | 8,137,981 | |
cItau Unibanco Holding SA, 7.589%, ADR, pfd | | Banks | | | 808,743 | | | | 7,618,359 | |
cPetroleo Brasileiro SA, 0.599%, ADR, pfd | | Oil, Gas & Consumable Fuels | | | 118,600 | | | | 1,684,120 | |
| | | | | | | | | | |
| | | |
Total Preferred Stocks (Cost $7,685,628) | | | | | | | | | 17,440,460 | |
| | | | | | | | | | |
| | | |
Total Investments before Short Term Investments (Cost $223,260,690) | | | | | | | | | 310,223,289 | |
| | | | | | | | | | |
FRANKLIN TEMPLETON VARIABLE INSURANCE PRODUCTS TRUST
STATEMENT OF INVESTMENTS (UNAUDITED)
Templeton Developing Markets VIP Fund(continued)
| | | | | | | | |
| | |
| | | Shares | | | Value | |
| | |
Short Term Investments (Cost $8,751,654) 2.7% | | | | | | | | |
| | |
Money Market Funds 2.7% | | | | | | | | |
United States 2.7% | | | | | | | | |
d,eInstitutional Fiduciary Trust Money Market Portfolio, 2.05% | | | 8,751,654 | | | | $ 8,751,654 | |
| | | | | | | | |
| | |
Total Investments (Cost $232,012,344) 100.0% | | | | | | | 318,974,943 | |
| | |
Other Assets, less Liabilities 0.0%† | | | | | | | 25,081 | |
| | | | | | | | |
| | |
Net Assets 100.0% | | | | | | | $319,000,024 | |
| | | | | | | | |
See Abbreviations on pageTD-23.
†Rounds to less than 0.1% of net assets.
aNon-income producing.
bSecurity was purchased pursuant to Regulation S under the Securities Act of 1933, which exempts from registration securities offered and sold outside of the United States. Such a security cannot be sold in the United States without either an effective registration statement filed pursuant to the Securities Act of 1933, or pursuant to an exemption from registration. This security has been deemed liquid under guidelines approved by the Trust’s Board of Trustees. At June 30, 2019, the value of this security was $2,878,630, representing 0.9% of net assets.
cVariable rate security. The rate shown represents the yield at period end.
dSee Note 3(e) regarding investments in affiliated management investment companies.
eThe rate shown is the annualizedseven-day effective yield at period end.
| | | | | | |
| | | |
| | The accompanying notes are an integral part of these financial statements. | Semiannual Report | | | TD-13 | |
FRANKLIN TEMPLETON VARIABLE INSURANCE PRODUCTS TRUST
FINANCIAL STATEMENTS
Statement of Assets and Liabilities
June 30, 2019 (unaudited)
| | | | |
| |
| | | Templeton
Developing Markets
VIP Fund | |
| |
Assets: | | | | |
Investments in securities: | | | | |
Cost - Unaffiliated issuers | | | $223,260,690 | |
Cost -Non-controlled affiliates (Note 3e) | | | 8,751,654 | |
| | | | |
| |
Value - Unaffiliated issuers | | | $310,223,289 | |
Value -Non-controlled affiliates (Note 3e) | | | 8,751,654 | |
Foreign currency, at value (cost $40,969) | | | 41,031 | |
Receivables: | | | | |
Capital shares sold | | | 320,724 | |
Dividends | | | 1,630,697 | |
Foreign tax refund | | | 22,245 | |
Other assets | | | 221 | |
| | | | |
| |
Total assets | | | 320,989,861 | |
| | | | |
| |
Liabilities: | | | | |
Payables: | | | | |
Investment securities purchased | | | 442,375 | |
Capital shares redeemed | | | 254,788 | |
Management fees | | | 263,622 | |
Distribution fees | | | 92,834 | |
Trustees’ fees and expenses | | | 370 | |
Deferred tax | | | 787,108 | |
Accrued expenses and other liabilities | | | 148,740 | |
| | | | |
| |
Total liabilities | | | 1,989,837 | |
| | | | |
| |
Net assets, at value | | | $319,000,024 | |
| | | | |
Net assets consist of: | | | | |
Paid-in capital | | | $236,719,859 | |
Total distributable earnings (loss) | | | 82,280,165 | |
| | | | |
| |
Net assets, at value | | | $319,000,024 | |
| | | | |
| |
| Class 1: | | | | |
Net assets, at value | | | $ 91,731,514 | |
| | | | |
Shares outstanding | | | 9,441,896 | |
| | | | |
Net asset value and maximum offering price per share | | | $9.72 | |
| | | | |
| Class 2: | | | | |
Net assets, at value | | | $221,694,981 | |
| | | | |
Shares outstanding | | | 22,978,355 | |
| | | | |
Net asset value and maximum offering price per share | | | $9.65 | |
| | | | |
| Class 4: | | | | |
Net assets, at value | | | $ 5,573,529 | |
| | | | |
Shares outstanding | | | 574,222 | |
| | | | |
Net asset value and maximum offering price per share | | | $9.71 | |
| | | | |
| | | | |
| | | |
TD-14 | | Semiannual Report | The accompanying notes are an integral part of these financial statements. | | |
FRANKLIN TEMPLETON VARIABLE INSURANCE PRODUCTS TRUST
FINANCIAL STATEMENTS
Statement of Operations
for the six months ended June 30, 2019 (unaudited)
| | | | |
| |
| | | Templeton
Developing Markets
VIP Fund | |
| |
Investment income: | | | | |
Dividends: (net of foreign taxes)* | | | | |
Unaffiliated issuers | | | $ 3,954,387 | |
Non-controlled affiliates (Note 3e) | | | 62,701 | |
| | | | |
| |
Total investment income | | | 4,017,088 | |
| | | | |
Expenses: | | | | |
Management fees (Note 3a) | | | 1,638,242 | |
Distribution fees: (Note 3c) | | | | |
Class 2 | | | 269,584 | |
Class 4 | | | 9,623 | |
Custodian fees (Note 4) | | | 44,519 | |
Reports to shareholders | | | 79,037 | |
Professional fees | | | 32,077 | |
Trustees’ fees and expenses | | | 1,304 | |
Other | | | 15,131 | |
| | | | |
| |
Total expenses | | | 2,089,517 | |
Expenses waived/paid by affiliates (Note 3e) | | | (10,484 | ) |
| | | | |
| |
Net expenses | | | 2,079,033 | |
| | | | |
| |
Net investment income | | | 1,938,055 | |
| | | | |
Realized and unrealized gains (losses): | | | | |
Net realized gain (loss) from: | | | | |
Investments:# | | | | |
Unaffiliated issuers | | | 4,574,914 | |
Foreign currency transactions | | | (17,931 | ) |
| | | | |
| |
Net realized gain (loss) | | | 4,556,983 | |
| | | | |
Net change in unrealized appreciation (depreciation) on: | | | | |
Investments: | | | | |
Unaffiliated issuers | | | 33,336,434 | |
Translation of other assets and liabilities denominated in foreign currencies | | | (4,828 | ) |
Change in deferred taxes on unrealized appreciation | | | (226,625 | ) |
| | | | |
| |
Net change in unrealized appreciation (depreciation) | | | 33,104,981 | |
| | | | |
| |
Net realized and unrealized gain (loss) | | | 37,661,964 | |
| | | | |
| |
Net increase (decrease) in net assets resulting from operations | | | $39,600,019 | |
| | | | |
| | | | |
| |
*Foreign taxes withheld on dividends | | | $ 593,574 | |
#Net of foreign taxes | | | $ 62,742 | |
| | | | | | |
| | | |
| | The accompanying notes are an integral part of these financial statements. | Semiannual Report | | | TD-15 | |
FRANKLIN TEMPLETON VARIABLE INSURANCE PRODUCTS TRUST
FINANCIAL STATEMENTS
Statements of Changes in Net Assets
| | | | | | | | |
| |
| | | Templeton Developing
Markets VIP Fund | |
| | |
| | | Six Months Ended
June 30, 2019
(unaudited) | | | Year Ended
December 31, 2018 | |
| | |
Increase (decrease) in net assets: | | | | | | | | |
Operations: | | | | | | | | |
Net investment income | | | $ 1,938,055 | | | | $ 2,697,670 | |
Net realized gain (loss) | | | 4,556,983 | | | | 19,694,258 | |
Net change in unrealized appreciation (depreciation) | | | 33,104,981 | | | | (77,137,099 | ) |
| | | | |
| | |
Net increase (decrease) in net assets resulting from operations | | | 39,600,019 | | | | (54,745,171 | ) |
| | | | |
| | |
Distributions to shareholders: | | | | | | | | |
Class 1 | | | (1,134,638 | ) | | | (1,013,838 | ) |
Class 2 | | | (2,113,534 | ) | | | (1,947,210 | ) |
Class 4 | | | (46,961 | ) | | | (46,243 | ) |
| | | | |
| | |
Total distributions to shareholders | | | (3,295,133 | ) | | | (3,007,291 | ) |
| | | | |
| | |
Capital share transactions: (Note 2) | | | | | | | | |
Class 1 | | | (4,446,567 | ) | | | (3,414,259 | ) |
Class 2 | | | 1,537,945 | | | | (35,130,020 | ) |
Class 4 | | | (301,194 | ) | | | (923,409 | ) |
| | | | |
| | |
Total capital share transactions | | | (3,209,816 | ) | | | (39,467,688 | ) |
| | | | |
| | |
Net increase (decrease) in net assets | | | 33,095,070 | | | | (97,220,150 | ) |
Net assets: | | | | | | | | |
Beginning of period | | | 285,904,954 | | | | 383,125,104 | |
| | | | |
| | |
End of period | | | $319,000,024 | | | | $285,904,954 | |
| | | | |
| | | | |
| | | |
TD-16 | | Semiannual Report | The accompanying notes are an integral part of these financial statements. | | |
FRANKLIN TEMPLETON VARIABLE INSURANCE PRODUCTS TRUST
Notes to Financial Statements (unaudited)
Templeton Developing Markets VIP Fund
1. Organization and Significant Accounting Policies
Franklin Templeton Variable Insurance Products Trust (Trust) is registered under the Investment Company Act of 1940 (1940 Act) as anopen-end management investment company, consisting of eighteen separate funds and applies the specialized accounting and reporting guidance in U.S. Generally Accepted Accounting Principles (U.S. GAAP). Templeton Developing Markets VIP Fund (Fund) is included in this report. Shares of the Fund are generally sold only to insurance company separate accounts to fund the benefits of variable life insurance policies or variable annuity contracts. The Fund offers three classes of shares: Class 1, Class 2, and Class 4. Each class of shares may differ by its distribution fees, voting rights on matters affecting a single class and its exchange privilege.
The following summarizes the Fund’s significant accounting policies.
a. Financial Instrument Valuation
The Fund’s investments in financial instruments are carried at fair value daily. Fair value is the price that would be received to sell an asset or paid to transfer a liability in an orderly transaction between market participants on the measurement date. The Fund calculates the net asset value (NAV) per share each business day as of 4 p.m. Eastern time or the regularly scheduled close of the New York Stock Exchange (NYSE), whichever is earlier. Under compliance policies and procedures approved by the Trust’s Board of Trustees (the Board), the Fund’s administrator has responsibility for oversight of valuation, including leading the cross-functional Valuation Committee (VC). The Fund may utilize independent pricing services, quotations from securities and financial instrument dealers, and other market sources to determine fair value.
Equity securities listed on an exchange or on the NASDAQ National Market System are valued at the last quoted sale price or the official closing price of the day, respectively. Foreign equity securities are valued as of the close of trading on the foreign stock exchange on which the security is primarily traded, or as of 4 p.m. Eastern time. The value is then converted into its U.S. dollar equivalent at the foreign exchange rate in effect at 4 p.m. Eastern time on the day that the value of the security is determined.Over-the-counter (OTC) securities are valued within the range of the most recent quoted bid and ask prices. Securities that trade in multiple markets or on multiple exchanges are valued
according to the broadest and most representative market. Certain equity securities are valued based upon fundamental characteristics or relationships to similar securities.
Investments inopen-end mutual funds are valued at the closing NAV.
The Fund has procedures to determine the fair value of financial instruments for which market prices are not reliable or readily available. Under these procedures, the Fund primarily employs a market-based approach which may use related or comparable assets or liabilities, recent transactions, market multiples, book values, and other relevant information for the investment to determine the fair value of the investment. An income-based valuation approach may also be used in which the anticipated future cash flows of the investment are discounted to calculate fair value. Discounts may also be applied due to the nature or duration of any restrictions on the disposition of the investments. Due to the inherent uncertainty of valuations of such investments, the fair values may differ significantly from the values that would have been used had an active market existed.
Trading in securities on foreign securities stock exchanges and OTC markets may be completed before 4 p.m. Eastern time. In addition, trading in certain foreign markets may not take place on every Fund’s business day. Occasionally, events occur between the time at which trading in a foreign security is completed and 4 p.m. Eastern time that might call into question the reliability of the value of a portfolio security held by the Fund. As a result, differences may arise between the value of the Fund’s portfolio securities as determined at the foreign market close and the latest indications of value at 4 p.m. Eastern time. In order to minimize the potential for these differences, the VC monitors price movements following the close of trading in foreign stock markets through a series of country specific market proxies (such as baskets of American Depositary Receipts, futures contracts and exchange traded funds). These price movements are measured against established trigger thresholds for each specific market proxy to assist in determining if an event has occurred that may call into question the reliability of the values of the foreign securities held by the Fund. If such an event occurs, the securities may be valued using fair value procedures, which may include the use of independent pricing services.
FRANKLIN TEMPLETON VARIABLE INSURANCE PRODUCTS TRUST
NOTES TO FINANCIAL STATEMENTS (UNAUDITED)
Templeton Developing Markets VIP Fund(continued)
1. Organization and Significant Accounting
Policies(continued)
a. Financial Instrument Valuation(continued)
When the last day of the reporting period is anon-business day, certain foreign markets may be open on those days that the Fund’s NAV is not calculated, which could result in differences between the value of the Fund’s portfolio securities on the last business day and the last calendar day of the reporting period. Any significant security valuation changes due to an open foreign market are adjusted and reflected by the Fund for financial reporting purposes.
b. Foreign Currency Translation
Portfolio securities and other assets and liabilities denominated in foreign currencies are translated into U.S. dollars based on the exchange rate of such currencies against U.S. dollars on the date of valuation. The Fund may enter into foreign currency exchange contracts to facilitate transactions denominated in a foreign currency. Purchases and sales of securities, income and expense items denominated in foreign currencies are translated into U.S. dollars at the exchange rate in effect on the transaction date. Portfolio securities and assets and liabilities denominated in foreign currencies contain risks that those currencies will decline in value relative to the U.S. dollar. Occasionally, events may impact the availability or reliability of foreign exchange rates used to convert the U.S. dollar equivalent value. If such an event occurs, the foreign exchange rate will be valued at fair value using procedures established and approved by the Board.
The Fund does not separately report the effect of changes in foreign exchange rates from changes in market prices on securities held. Such changes are included in net realized and unrealized gain or loss from investments in the Statement of Operations.
Realized foreign exchange gains or losses arise from sales of foreign currencies, currency gains or losses realized between the trade and settlement dates on securities transactions and the difference between the recorded amounts of dividends, interest, and foreign withholding taxes and the U.S. dollar equivalent of the amounts actually received or paid. Net unrealized foreign exchange gains and losses arise from changes in foreign exchange rates on foreign denominated assets and liabilities other than investments in securities held at the end of the reporting period.
c. Income and Deferred Taxes
It is the Fund’s policy to qualify as a regulated investment company under the Internal Revenue Code. The Fund intends to distribute to shareholders substantially all of its taxable income and net realized gains to relieve it from federal income and if applicable, excise taxes. As a result, no provision for U.S. federal income taxes is required.
The Fund may be subject to foreign taxation related to income received, capital gains on the sale of securities and certain foreign currency transactions in the foreign jurisdictions in which it invests. Foreign taxes, if any, are recorded based on the tax regulations and rates that exist in the foreign markets in which the Fund invests. When a capital gain tax is determined to apply, the Fund records an estimated deferred tax liability in an amount that would be payable if the securities were disposed of on the valuation date.
The Fund may recognize an income tax liability related to its uncertain tax positions under U.S. GAAP when the uncertain tax position has a less than 50% probability that it will be sustained upon examination by the tax authorities based on its technical merits. As of June 30, 2019, the Fund has determined that no tax liability is required in its financial statements related to uncertain tax positions for any open tax years (or expected to be taken in future tax years). Open tax years are those that remain subject to examination and are based on the statute of limitations in each jurisdiction in which the Fund invests.
d. Security Transactions, Investment Income, Expenses and Distributions
Security transactions are accounted for on trade date. Realized gains and losses on security transactions are determined on a specific identification basis. Estimated expenses are accrued daily. Dividend income is recorded on theex-dividend date except for certain dividends from securities where the dividend rate is not available. In such cases, the dividend is recorded as soon as the information is received by the Fund. Distributions to shareholders are recorded on theex-dividend date. Distributable earnings are determined according to income tax regulations (tax basis) and may differ from earnings recorded in accordance with U.S. GAAP. These differences may be permanent or temporary. Permanent differences are reclassified among capital accounts to reflect their tax character. These
FRANKLIN TEMPLETON VARIABLE INSURANCE PRODUCTS TRUST
NOTES TO FINANCIAL STATEMENTS (UNAUDITED)
Templeton Developing Markets VIP Fund(continued)
reclassifications have no impact on net assets or the results of operations. Temporary differences are not reclassified, as they may reverse in subsequent periods.
Common expenses incurred by the Trust are allocated among the Funds based on the ratio of net assets of each Fund to the combined net assets of the Trust or based on the ratio of number of shareholders of each Fund to the combined number of shareholders of the Trust. Fund specific expenses are charged directly to the Fund that incurred the expense.
Realized and unrealized gains and losses and net investment income, excluding class specific expenses, are allocated daily to each class of shares based upon the relative proportion of net assets of each class. Differences in per share distributions by class are generally due to differences in class specific expenses.
e. Accounting Estimates
The preparation of financial statements in accordance with U.S. GAAP requires management to make estimates and assumptions that affect the reported amounts of assets and
liabilities at the date of the financial statements and the amounts of income and expenses during the reporting period. Actual results could differ from those estimates.
f. Guarantees and Indemnifications
Under the Trust’s organizational documents, its officers and trustees are indemnified by the Trust against certain liabilities arising out of the performance of their duties to the Trust. Additionally, in the normal course of business, the Trust, on behalf of the Fund, enters into contracts with service providers that contain general indemnification clauses. The Trust’s maximum exposure under these arrangements is unknown as this would involve future claims that may be made against the Trust that have not yet occurred. Currently, the Trust expects the risk of loss to be remote.
2. Shares of Beneficial Interest
At June 30, 2019, there were an unlimited number of shares authorized (without par value). Transactions in the Fund’s shares were as follows:
| | | | | | | | | | | | | | | | | | | | |
| | | |
| | | Six Months Ended
June 30, 2019 | | | | | | Year Ended
December 31, 2018 | |
| | | | | |
| | | Shares | | | Amount | | | | | | Shares | | | Amount | |
| | | | | |
| Class 1 Shares: | | | | | | | | | | | | | | | | | | | | |
Shares sold | | | 326,922 | | | $ | 3,144,807 | | | | | | | | 1,801,012 | | | $ | 17,302,432 | |
Shares issued in reinvestment of distributions | | | 121,873 | | | | 1,134,638 | | | | | | | | 105,170 | | | | 1,013,838 | |
Shares redeemed | | | (918,209 | ) | | | (8,726,012 | ) | | | | | | | (2,222,370 | ) | | | (21,730,529 | ) |
| | | | |
| | | | | |
Net increase (decrease) | | | (469,414 | ) | | $ | (4,446,567 | ) | | | | | | | (316,188 | ) | | $ | (3,414,259 | ) |
| | | | |
| | | | | |
| Class 2 Shares: | | | | | | | | | | | | | | | | | | | | |
Shares sold | | | 2,954,596 | | | $ | 28,019,292 | | | | | | | | 4,771,227 | | | $ | 45,978,347 | |
Shares issued in reinvestment of distributions | | | 228,490 | | | | 2,113,534 | | | | | | | | 203,470 | | | | 1,947,210 | |
Shares redeemed | | | (3,063,335 | ) | | | (28,594,881 | ) | | | | | | | (8,557,714 | ) | | | (83,055,577 | ) |
| | | | |
| | | | | |
Net increase (decrease) | | | 119,751 | | | $ | 1,537,945 | | | | | | | | (3,583,017 | ) | | $ | (35,130,020 | ) |
| | | | |
| | | | | |
| Class 4 Shares: | | | | | | | | | | | | | | | | | | | | |
Shares sold | | | 21,672 | | | $ | 206,120 | | | | | | | | 48,260 | | | $ | 471,887 | |
Shares issued in reinvestment of distributions | | | 5,050 | | | | 46,961 | | | | | | | | 4,802 | | | | 46,243 | |
Shares redeemed | | | (58,336 | ) | | | (554,275 | ) | | | | | | | (147,608 | ) | | | (1,441,539 | ) |
| | | | |
| | | | | |
Net increase (decrease) | | | (31,614 | ) | | $ | (301,194 | ) | | | | | | | (94,546 | ) | | $ | (923,409 | ) |
| | | | |
FRANKLIN TEMPLETON VARIABLE INSURANCE PRODUCTS TRUST
NOTES TO FINANCIAL STATEMENTS (UNAUDITED)
Templeton Developing Markets VIP Fund(continued)
3. Transactions with Affiliates
Franklin Resources, Inc. is the holding company for various subsidiaries that together are referred to as Franklin Templeton. Certain officers and trustees of the Fund are also officers and/or trustees of the following subsidiaries:
| | |
| |
| Subsidiary | | Affiliation |
| |
Templeton Asset Management Ltd. (Asset Management) | | Investment manager |
| |
Franklin Templeton Services, LLC (FT Services) | | Administrative manager |
| |
Franklin Templeton Distributors, Inc. (Distributors) | | Principal underwriter |
| |
Franklin Templeton Investor Services, LLC (Investor Services) | | Transfer agent |
a. Management Fees
The Fund pays an investment management fee to Asset Management based on the average daily net assets of the Fund as follows:
| | |
| |
| Annualized Fee Rate | | Net Assets |
| |
1.050% | | Up to and including $1 billion |
| |
1.000% | | Over $1 billion, up to and including $5 billion |
| |
0.950% | | Over $5 billion, up to and including $10 billion |
| |
0.900% | | Over $10 billion, up to and including $15 billion |
| |
0.850% | | Over $15 billion, up to and including $20 billion |
| |
0.800% | | In excess of $20 billion |
For the period ended June 30, 2019, the annualized gross effective investment management fee rate was 1.049% of the Fund’s average daily net assets.
b. Administrative Fees
Under an agreement with Asset Management, FT Services provides administrative services to the Fund. The fee is paid by Asset Management based on the Fund’s average daily net assets, and is not an additional expense of the Fund.
c. Distribution Fees
The Board has adopted distribution plans for Class 2 and Class 4 shares pursuant to Rule12b-1 under the 1940 Act. Under the Fund’s compensation distribution plans, the Fund pays Distributors for costs incurred in connection with the servicing, sale and distribution of the Fund’s shares up to 0.25% and 0.35% per year of its average daily net assets of Class 2 and Class 4 respectively. The plan year, for purposes of monitoring compliance with the maximum annual plan rates, is February 1 through January 31.
d. Transfer Agent Fees
Investor Services, under terms of an agreement, performs shareholder servicing for the Fund and is not paid by the Fund for the services.
FRANKLIN TEMPLETON VARIABLE INSURANCE PRODUCTS TRUST
NOTES TO FINANCIAL STATEMENTS (UNAUDITED)
Templeton Developing Markets VIP Fund(continued)
e. Investments in Affiliated Management Investment Companies
The Fund invests in one or more affiliated management investment companies for purposes other than exercising a controlling influence over the management or policies. Management fees paid by the Fund are waived on assets invested in the affiliated management investment companies, as noted in the Statement of Operations, in an amount not to exceed the management and administrative fees paid directly or indirectly by each affiliate. During the period ended June 30, 2019, the Fund held investments in affiliated management investment companies as follows:
| | | | | | | | | | | | | | | | | | | | | | | | | | | | | | | | |
| | | Value at
Beginning
of Period | | | Purchases | | | Sales | | | Realized
Gain (Loss) | | | Net Change in
Unrealized
Appreciation
(Depreciation) | | | Value at
End of
Period | | | Number of
Shares
Held at End
of Period | | | Dividend
Income | |
| |
| | | | | | | | |
| Non-Controlled Affiliates | | | | | | | | | | | | | | | | | | | | | | | | | | | | | | | | |
Institutional Fiduciary Trust Money Market Portfolio, 2.05% | | $ | 5,427,431 | | | $ | 30,356,496 | | | $ | (27,032,273) | | | | $ — | | | | $ — | | | $ | 8,751,654 | | | | 8,751,654 | | | | $62,701 | |
| | | | | | | | | | | | |
4. Expense Offset Arrangement
The Fund has entered into an arrangement with its custodian whereby credits realized as a result of uninvested cash balances are used to reduce a portion of the Fund’s custodian expenses. During the period ended June 30, 2019, there were no credits earned.
5. Income Taxes
At December 31, 2018, the capital loss carryforwards were as follows:
| | | | |
Capital loss carryforwards not subject to expiration: | | | | |
Short term | | $ | 6,657,029 | |
At June 30, 2019, the cost of investments and net unrealized appreciation (depreciation) for income tax purposes were as follows:
| | | | |
Cost of investments | | $ | 237,006,458 | |
| | | | |
| |
Unrealized appreciation | | $ | 101,238,393 | |
Unrealized depreciation | | | (19,269,908 | ) |
| | | | |
| |
Net unrealized appreciation (depreciation) | | $ | 81,968,485 | |
| | | | |
Differences between income and/or capital gains as determined on a book basis and a tax basis are primarily due to differing treatment of corporate actions.
6. Investment Transactions
Purchases and sales of investments (excluding short term securities) for the period ended June 30, 2019, aggregated $26,350,921 and $35,045,781, respectively.
FRANKLIN TEMPLETON VARIABLE INSURANCE PRODUCTS TRUST
NOTES TO FINANCIAL STATEMENTS (UNAUDITED)
Templeton Developing Markets VIP Fund(continued)
7. Concentration of Risk
Investing in foreign securities may include certain risks and considerations not typically associated with investing in U.S. securities, such as fluctuating currency values and changing local and regional economic, political and social conditions, which may result in greater market volatility. Current political and financial uncertainty surrounding the European Union may increase market volatility and the economic risk of investing in securities in Europe. In addition, certain foreign securities may not be as liquid as U.S. securities.
The United States and other nations have imposed and could impose additional sanctions on certain issuers in Russia due to regional conflicts. These sanctions could result in the devaluation of Russia’s currency, a downgrade in Russian issuers’ credit ratings, or a decline in the value and liquidity of Russian stocks or other securities. Such sanctions could also adversely affect Russia’s economy. The Fund may be prohibited from investing in securities issued by companies subject to such sanctions. In addition, if the Fund holds the securities of an issuer that is subject to such sanctions, an immediate freeze of that issuer’s securities could result, impairing the ability of the Fund to buy, sell, receive or deliver those securities. There is also the risk that countermeasures could be taken by Russia’s government, which could involve the seizure of the Fund’s assets. These risks could affect the value of the Fund’s portfolio. While the Fund holds securities of certain issuers impacted by the sanctions, existing investments do not presently violate the applicable terms and conditions of the sanctions. The sanctions currently do not affect the Fund’s ability to sell these securities. At June 30, 2019, the Fund had 9.2% of its net assets invested in Russia.
8. Credit Facility
The Fund, together with other U.S. registered and foreign investment funds (collectively, Borrowers), managed by Franklin Templeton, are borrowers in a joint syndicated senior unsecured credit facility totaling $2 billion (Global Credit Facility) which matures on February 7, 2020. This Global Credit Facility provides a source of funds to the Borrowers for temporary and emergency purposes, including the ability to meet future unanticipated or unusually large redemption requests.
Under the terms of the Global Credit Facility, the Fund shall, in addition to interest charged on any borrowings made by the Fund and other costs incurred by the Fund, pay its share of fees and expenses incurred in connection with the implementation and maintenance of the Global Credit Facility, based upon its relative share of the aggregate net assets of all of the Borrowers, including an annual commitment fee of 0.15% based upon the unused portion of the Global Credit Facility. These fees are reflected in other expenses in the Statement of Operations. During the period ended June 30, 2019, the Fund did not use the Global Credit Facility.
9. Fair Value Measurements
The Fund follows a fair value hierarchy that distinguishes between market data obtained from independent sources (observable inputs) and the Fund’s own market assumptions (unobservable inputs). These inputs are used in determining the value of the Fund’s financial instruments and are summarized in the following fair value hierarchy:
| | • | Level 1 – quoted prices in active markets for identical financial instruments |
| | • | Level 2 – other significant observable inputs (including quoted prices for similar financial instruments, interest rates, prepayment speed, credit risk, etc.) |
| | • | Level 3 – significant unobservable inputs (including the Fund’s own assumptions in determining the fair value of financial instruments) |
The input levels are not necessarily an indication of the risk or liquidity associated with financial instruments at that level.
FRANKLIN TEMPLETON VARIABLE INSURANCE PRODUCTS TRUST
NOTES TO FINANCIAL STATEMENTS (UNAUDITED)
Templeton Developing Markets VIP Fund(continued)
At June 30, 2019, all of the Fund’s investments in financial instruments carried at fair value were valued using Level 1 inputs. For detailed categories, see the accompanying Statement of Investments.
10. Subsequent Events
The Fund has evaluated subsequent events through the issuance of the financial statements and determined that no events have occurred that require disclosure.
Abbreviations
| | |
| Selected Portfolio |
| |
ADR | | American Depositary Receipt |
GDR | | Global Depositary Receipt |
FRANKLIN TEMPLETON VARIABLE INSURANCE PRODUCTS TRUST
Tax Information (unaudited)
Templeton Developing Markets VIP Fund
At December 31, 2018, more than 50% of the Fund’s total assets were invested in securities of foreign issuers. In most instances, foreign taxes were withheld from income paid to the Fund on these investments. As shown in the table below, the Fund hereby reports to shareholders the foreign source income and foreign taxes paid, pursuant to Section 853 of the Internal Revenue Code. This written statement will allow shareholders of record on June 13, 2019, to treat their proportionate share of foreign taxes paid by the Fund as having been paid directly by them. The shareholder shall consider these amounts as foreign taxes paid in the tax year in which they receive the Fund distribution.
The following table provides a detailed analysis of foreign tax paid and foreign source income as reported by the Fund to shareholders of record.
| | | | | | | | |
| Class | | Foreign Tax Paid
Per Share | | | Foreign Source
Income Per Share | |
| | |
Class 1 | | | $0.0303 | | | | $0.1526 | |
| | |
Class 2 | | | $0.0303 | | | | $0.1267 | |
| | |
Class 4 | | | $0.0303 | | | | $0.1143 | |
Foreign Tax Paid Per Share is the amount per share available to you, as a tax credit (assuming you held your shares in the Fund for a minimum of 16 days during the31-day period beginning 15 days before theex-dividend date of the Fund’s distribution to which the foreign taxes relate), or, as a tax deduction.
Foreign Source Income Per Share is the amount per share of income dividends attributable to foreign securities held by the Fund, plus any foreign taxes withheld on these dividends.
Templeton Foreign VIP Fund
This semiannual report for Templeton Foreign VIP Fund covers the period ended June 30, 2019.
Class 2 Performance Summary as of June 30, 2019
The Fund’s Class 2 Shares posted a +6.47% total return* for thesix-month period ended June 30, 2019.
*The Fund has a fee waiver associated with any investments it makes in a Franklin Templeton money fund and/or other Franklin Templeton fund, contractually guaranteed through 4/30/20. Fund investment results reflect the expense reduction and fee waiver; without these reductions, the results would have been lower.
Performance reflects the Fund’s Class 2 operating expenses, but doesnotinclude any contract fees, expenses or sales charges. If they had been included, performance would be lower. These charges and deductions, particularly for variable life policies, can have a significant effect on contract values and insurance benefits. See the contract prospectus for a complete description of these expenses, including sales charges.
Performance data represent past performance, which does not guarantee future results. Investment return and principal value will fluctuate, and you may have a gain or loss when you sell your shares. Current performance may differ from figures shown.
TEMPLETON FOREIGN VIP FUND
Fund Goal and Main Investments
The Fund seeks long-term capital growth. Under normal market conditions, the Fund invests at least 80% of its net assets in investments of issuers located outside the US, including those in emerging markets.
Fund Risks
All investments involve risks, including possible loss of principal. Special risks are associated with foreign investing, including currency fluctuations, economic instability and political developments; investments in emerging markets involve heightened risks related to the same factors. Currency rates may fluctuate significantly over short periods of time, and can reduce returns. Because the Fund may invest its assets in companies in a specific region, including Europe, it is subject to greater risks of adverse developments in that region and/or the surrounding regions than a fund that is more broadly diversified geographically. Current political and financial uncertainty surrounding the European Union may increase market volatility and the economic risk of investing in companies in Europe. The Fund is actively managed but there is no guarantee that the manager’s investment decisions will produce the desired results. The Fund’s prospectus also includes a description of the main investment risks.
Performance Overview
You can find the Fund’ssix-month total return in the Performance Summary. In comparison, the Fund’s benchmark, the MSCI All Country World Index (ACWI) ex USA Index, posted a +13.60% total return for the same period.1 Please note, index performance information is provided for reference and we do not attempt to track the index but rather undertake investments on the basis of fundamental research.
Economic and Market Overview
The global economy expanded during the six months ended June 30, 2019, despite weakness in certain regions. Global developed and emerging market stocks were aided by upbeat economic data in some regions, encouraging corporate earnings reports and periods of optimism about a potential U.S.-China trade deal. Further supporting markets
Geographic Composition
Based on Total Net Assets as of 6/30/19
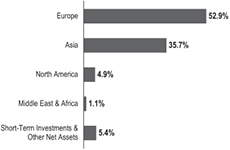
were the U.S. Federal Reserve’s (Fed’s) patient approach to its monetary policy in 2019 and recent indication it will act as appropriate to sustain U.S. economic expansion.
However, markets reflected concerns about political uncertainties in the U.S. and the European Union, geopolitical risks in certain regions, and the impact of U.S. trade disputes with China and other trading partners on global growth and corporate earnings. In this environment, global developed and emerging market stocks, as measured by the MSCI ACWI, posted a +16.60% total return for thesix-month period.1
The U.S. economy grew during the six months ended June 30, 2019. After moderating for two consecutive quarters, the economy grew significantly faster in 2019’s first quarter, driven by growth in consumer spending, inventory investment, exports, business investment, and state and local government spending. However, the economy moderated again in the second quarter, due to weakness in inventory investment, exports, business investment and housing investment. The unemployment rate decreased from 3.9% in December 2018 to 3.7% atperiod-end.2 The annual inflation rate, as measured by the Consumer Price Index, decreased from 1.9% in December 2018 to 1.6% atperiod-end.2
The Fed held its target range for the federal funds rate unchanged, at 2.25%–2.50%, during the reporting period. In March, the Fed mentioned it would end its balance sheet normalization program by the end of September 2019. In
1. Source: Morningstar. One cannot invest directly in an index, and an index is not representative of the Fund’s portfolio. Please see Index Descriptions following the Fund Summaries.
2. Source: U.S. Bureau of Labor Statistics.
The dollar value, number of shares or principal amount, and names of all portfolio holdings are listed in the Fund’s Statement of Investments (SOI).
TEMPLETON FOREIGN VIP FUND
June, the Fed indicated increased uncertainties around its views on economic activity and the labor market. With market-based inflation measures remaining low recently, the market has interpreted the Fed’s recent statements to mean it will likely cut rates in 2019’s second half to foster continued economic growth while attempting to achieve its inflation objective.
In Europe, the U.K.’s quarterly gross domestic product (GDP) growth accelerated in 2019’s first quarter. The Bank of England left its key policy rate unchanged during the period. The eurozone’s quarterly GDP accelerated in 2019’s first quarter. However, the bloc’s annual inflation rate decreased during the period. The European Central Bank (ECB) kept its benchmark interest rate unchanged during the period. In June, the ECB mentioned it would leave interest rates unchanged through the first half of 2020, provided details of its new stimulus, and indicated its openness to cut rates or increase stimulus.
In Asia, Japan’s quarterly GDP growth accelerated in 2019’s first quarter. In June, the Bank of Japan also left its benchmark interest rate unchanged, while continuing its stimulus measures, and expressed its openness to cut interest rates or increase stimulus.
In larger emerging markets, Brazil’s quarterly GDP growth contracted in 2019’s first quarter. The Central Bank of Brazil left its benchmark interest rate unchanged during the period. Russia’s annual GDP growth moderated in 2019’s first quarter. The Bank of Russia cut its key rate once during the period. China’s annual GDP growth rate stabilized in 2019’s first quarter. The People’s Bank of China left its benchmark interest rate unchanged, but it took measures to improve financial liquidity to mitigate the effects of the U.S.-China trade dispute and support economic growth. Overall, global emerging market stocks, as measured by the MSCI Emerging Markets Index, posted a +10.78% total return during thesix-month period.1
Investment Strategy
Our investment philosophy is bottom up, value oriented and long term. When choosing investments for the Fund, we generally focus on the market price of a company’s securities relative to our evaluation of the company’s potential long-term earnings, asset value and cash flow. This includes an assessment by the investment manager of the potential impacts of material environmental, social and governance factors on the long-term risk and return profile of
Top 10 Holdings
6/30/19
| | |
| |
Company Sector/Industry, Country | | % of Total
Net Assets |
| |
Samsung Electronics Co. Ltd. Technology Hardware, Storage & Peripherals, South Korea | | 4.1% |
| |
BP PLC Oil, Gas & Consumable Fuels, U.K. | | 3.3% |
| |
Standard Chartered PLC Banks, U.K. | | 3.3% |
| |
Roche Holding AG Pharmaceuticals, Switzerland | | 3.1% |
| |
Royal Dutch Shell PLC Oil, Gas & Consumable Fuels, U.K. | | 3.0% |
| |
BNP Paribas SA Banks, France | | 3.0% |
| |
Wheaton Precious Metals Corp. Metals & Mining, Canada | | 2.7% |
| |
KB Financial Group Inc. Banks, South Korea | | 2.6% |
| |
Sanofi Pharmaceuticals, France | | 2.4% |
| |
ING Groep NV Banks, Netherlands | | 2.2% |
a company. We also consider a company’s price/earnings ratio, price/cash flow ratio, profit margins and liquidation value.
Manager’s Discussion
During the six months under review, stock selection in materials contributed to relative performance.3 The sector’s largest contributors were Canadian precious metal firms Alamos Gold (not part of the index) and Wheaton Precious Metals. Wheaton benefited from a favorable settlement related to a Canadian tax audit that had depressed its share price for years. Shares also rallied in May after the firm’s reported earnings and gold production beat consensus expectations. The stock remains an attractive holding, trading at what we view as reasonable valuations on a variety of metrics and providing a capital-light,low-cost streaming model that offers gold exposure with superior economics compared to traditional mining companies.
In other sectors, key relative contributors included China Life Insurance (not held atperiod-end), a Chinese life insurer, and SBM Offshore (not part of the index), a Dutch oil
3. The materials sector comprises chemicals, construction materials, and metals and mining in the SOI.
TEMPLETON FOREIGN VIP FUND
services firm. SBM’s shares rallied after it announced a strong order book, raised its dividend and initiated a share buyback program. The stock continued to rally after securing contracts from Exxon Mobil and Petrobras (not Fund holdings). Other relative contributors included Dutch semiconductor manufacturer NXP Semiconductors, South Korean multinational electronics company Samsung Electronics, Swiss smart metering solutions company Landis+Gyr (not part of the index), Canadian integrated oil company Cenovus Energy (not held atperiod-end), British banking firm Standard Chartered and Singaporean telecommunications firm Singapore Telecommunications.
In contrast, stock selection and an overweighted allocation in the communication services sector detracted from relative results.4 Notably, our positions in Chinese internet services company Baidu, German telecommunication services provider Telefonica Deutschland, Luxembourg-based media firm SES and British telecommunications company Vodafone hurt performance. Baidu’s stock price fell amid a cyclical slowdown in China’s economy. We believe Baidu’s core search business remains undervalued, and the company has enjoyed strong growth in active daily users and a high cash position.
Stock selection in the health care and financials sectors also detracted from relative results.5 In health care, Israeli pharmaceuticals firm Teva Pharmaceutical Industries and Chinese health care provider Sinopharm were notable detractors. Teva’s share price declined due to weakness in the U.S. generic drug market and slumping sales of one of its aging flagship drugs. A surprising settlement of a U.S. opioid lawsuit, which added to the existing litigation risk surrounding an industry-wide price-fixing scandal, also hurt its share price. While these situations are unlikely to materially impact near-term cash flow—which we believe should improve amid ongoing cost-cutting—they do raise the risk profile of the investment, particularly in light of Teva’s high financial and operating leverage in the competitive, commodity-like generic drug industry. In financials, South Korean banking firm KB Financial Group was a notable relative detractor.
Key relative detractors in other sectors included Japanese food retailer Seven & i Holdings, Japanese household durables company Panasonic and South Korean electric utilities firm Korea Electric Power.
No region contributed to relative performance, but overweighting in the Netherlands and stock selection in Singapore and Canada helped relative results. In contrast, stock selection in Asia and Europe detracted from relative results. Notable individual detractors included China, Germany and Israel.
Thank you for your participation in Templeton Foreign VIP Fund. We look forward to serving your future investment needs.
The foregoing information reflects our analysis, opinions and portfolio holdings as of June 30, 2019, the end of the reporting period. The way we implement our main investment strategies and the resulting portfolio holdings may change depending on factors such as market and economic conditions. These opinions may not be relied upon as investment advice or an offer for a particular security. The information is not a complete analysis of every aspect of any market, country, industry, security or the Fund.
Statements of fact are from sources considered reliable, but the investment manager makes no representation or warranty as to their completeness or accuracy. Although historical performance is no guarantee of future results, these insights may help you understand our investment management philosophy.
4. The communication services sector comprises diversified telecommunication services, entertainment, interactive media and services, media and wireless telecommunication services in the SOI.
5. The health care sector comprises health care equipment and supplies, health care providers and services, and pharmaceuticals in the SOI. The financials sector comprises banks and capital markets in the SOI.
TEMPLETON FOREIGN VIP FUND
Class 2 Fund Expenses
As an investor in a variable insurance contract (Contract) that indirectly provides for investment in an underlying mutual fund, you can incur transaction and/or ongoing expenses at both the Fund level and the Contract Level: (1) transaction expenses can include sales charges (loads) on purchases, surrender fees, transfer fees and premium taxes; and (2) ongoing expenses can include management fees, distribution and service(12b-1) fees, contract fees, annual maintenance fees, mortality and expense risk fees and other fees and expenses. All mutual funds and Contracts have some types of ongoing expenses. The table below shows Fund-level ongoing expenses and can help you understand these costs and compare them with those of other mutual funds offered through the Contract. The table assumes a $1,000 investment held for the six months indicated. Please refer to the Fund prospectus for additional information on operating expenses.
Actual Fund Expenses
The table below provides information about the actual account values and actual expenses in the columns under the heading “Actual.” In these columns the Fund’s actual return, which includes the effect of ongoing Fund expenses but does not include the effect of ongoing Contract expenses, is used to calculate the “Ending Account Value.” You can estimate the Fund-level expenses you paid during the period by following these steps (ofcourse, your account value and expenses will differ from those in this illustration):Divide your account value by $1,000 (ifyour account had an $8,600 value, then $8,600÷ $1,000 = 8.6). Then multiply the result by the number under the headings “Actual” and “Fund-Level Expenses Paid During Period” (ifFund-Level Expenses Paid During Period were $ 7.50, then 8.6 x $ 7.50 = $64.50). In this illustration, the estimated expenses paid this period at the Fund level are $64.50.
Hypothetical Example for Comparison with Other Mutual Funds
Under the heading “Hypothetical” in the table, information is provided about hypothetical account values and hypothetical expenses based on the Fund’s actual expense ratio and an assumed rate of return of 5% per year before expenses, which is not the Fund’s actual return. This information may not be used to estimate the actual ending account balance or expenses you paid for the period, but it can help you compare ongoing costs of investing in the Fund with those of other mutual funds offered through the Contract. To do so, compare this 5% hypothetical example with the 5% hypothetical examples that appear in the shareholder reports of other funds offered through the Contract.
Please note that expenses shown in the table are meant to highlight ongoing costs at the Fund level only and do not reflect any ongoing expenses at the Contract level, or transaction expenses at either the Fund or Contract levels. In addition, while the Fund does not have transaction expenses, if the transaction and ongoing expenses at the Contract level were included, the expenses shown below would be higher. You should consult your Contract prospectus or disclosure document for more information.
| | | | | | | | | | | | | | | | | | |
| | | | | | | Actual
(actual return after expenses) | | | | Hypothetical
(5% annual return before expenses) | | | | |
Share Class | | Beginning
Account
Value 1/1/19 | | | | Ending
Account
Value 6/30/19 | | Fund-Level
Expenses
Paid During
Period
1/1/19–6/30/191, 2 | | | | Ending
Account Value 6/30/19 | | Fund-Level
Expenses
Paid During
Period
1/1/19–6/30/191, 2 | | | | Net
Annualized
Expense
Ratio2 |
Class 2 | | $1,000 | | | | $1,064.70 | | $5.53 | | | | $1,019.44 | | $5.41 | | | | 1.08% |
1. Expenses are equal to the annualized expense ratio for thesix-month period as indicated above—in the far right column—multiplied by the simple average account value over the period indicated, and then multiplied by 181/365 to reflect theone-half year period.
2. Reflects expenses after fee waivers and expense reimbursements. Does not include any ongoing expenses of the Contract for which the Fund is an investment option or acquired fund fees and expenses.
FRANKLIN TEMPLETON VARIABLE INSURANCE PRODUCTS TRUST
Financial Highlights
Templeton Foreign VIP Fund
| | | | | | | | | | | | | | | | | | | | | | | | |
| | |
| | | Six Months Ended June 30, 2019 (unaudited) | | | Year Ended December 31, | |
| | | 2018 | | | 2017 | | | 2016 | | | 2015 | | | 2014 | |
| |
| | | | | | |
| Class 1 | | | | | | | | | | | | | | | | | | | | | | | | |
| | | | | | |
Per share operating performance (for a share outstanding throughout the period) | | | | | | | | | | | | | | | | | | | | | | | | |
| | | | | | |
Net asset value, beginning of period | | | $13.01 | | | | $15.80 | | | | $13.89 | | | | $13.46 | | | | $15.34 | | | | $17.56 | |
| | | | |
| | | | | | |
| Income from investment operationsa: | | | | | | | | | | | | | | | | | | | | | | | | |
| | | | | | |
Net investment incomeb | | | 0.33 | | | | 0.29 | | | | 0.30 | | | | 0.33 | | | | 0.31 | | | | 0.53c | |
| | | | | | |
Net realized and unrealized gains (losses) | | | 0.52 | | | | (2.64 | ) | | | 2.03 | | | | 0.62 | | | | (1.16 | ) | | | (2.39) | |
| | | | |
| | | | | | |
Total from investment operations | | | 0.85 | | | | (2.35 | ) | | | 2.33 | | | | 0.95 | | | | (0.85 | ) | | | (1.86) | |
| | | | |
| | | | | | |
Less distributions from: | | | | | | | | | | | | | | | | | | | | | | | | |
| | | | | | |
Net investment income | | | (0.27 | ) | | | (0.44 | ) | | | (0.42 | ) | | | (0.29 | ) | | | (0.53 | ) | | | (0.36) | |
| | | | | | |
Net realized gains | | | (0.14 | ) | | | — | | | | — | | | | (0.23 | ) | | | (0.50 | ) | | | — | |
| | | | |
| | | | | | |
Total distributions | | | (0.41 | ) | | | (0.44 | ) | | | (0.42 | ) | | | (0.52 | ) | | | (1.03 | ) | | | (0.36) | |
| | | | |
| | | | | | |
Redemption fees | | | — | | | | — | | | | — | | | | — | | | | — | | | | —d | |
| | | | |
| | | | | | |
Net asset value, end of period | | | $13.45 | | | | $13.01 | | | | $15.80 | | | | $13.89 | | | | $13.46 | | | | $15.34 | |
| | | | |
| | | | | | |
Total returne | | | 6.65% | | | | (15.27)% | | | | 17.02% | | | | 7.49% | | | | (6.31)% | | | | (10.89)% | |
| | | | | | |
| Ratios to average net assetsf | | | | | | | | | | | | | | | | | | | | | | | | |
| | | | | | |
Expenses before waiver and payments by affiliates | | | 0.85% | | | | 0.83% | | | | 0.82% | | | | 0.80% | | | | 0.78% | | | | 0.77% | |
| | | | | | |
Expenses net of waiver and payments by affiliates | | | 0.83% | | | | 0.81% | | | | 0.81% | g | | | 0.78% | | | | 0.78% | h | | | 0.77% | h |
| | | | | | |
Net investment income | | | 4.85% | | | | 1.96% | | | | 1.99% | | | | 2.38% | | | | 2.05% | | | | 3.11% | c |
| | | | | | |
| Supplemental data | | | | | | | | | | | | | | | | | | | | | | | | |
| | | | | | |
Net assets, end of period (000’s) | | | $119,825 | | | | $114,784 | | | | $152,684 | | | | $133,218 | | | | $214,172 | | | | $248,355 | |
| | | | | | |
Portfolio turnover rate | | | 11.70% | | | | 21.38% | | | | 26.81% | | | | 20.93% | | | | 15.15% | | | | 25.71% | |
aThe amount shown for a share outstanding throughout the period may not correlate with the Statement of Operations for the period due to the timing of sales and repurchases of the Fund’s shares in relation to income earned and/or fluctuating fair value of the investments of the Fund.
bBased on average daily shares outstanding.
cNet investment income per share includes approximately $0.16 per share related to income received in the form of special dividends in connection with certain Fund holdings. Excluding this amount, the ratio of net investment income to average net assets would have been 2.13%.
dAmount rounds to less than $0.01 per share.
eTotal return does not include fees, charges or expenses imposed by the variable annuity and life insurance contracts for which Franklin Templeton Variable Insurance Products Trust serves as an underlying investment vehicle. Total return is not annualized for periods less than one year.
fRatios are annualized for periods less than one year.
gBenefit of expense reduction rounds to less than 0.01%.
hBenefit of waiver and payments by affiliates rounds to less than 0.01%.
| | | | |
| | | |
TF-6 | | Semiannual Report | The accompanying notes are an integral part of these financial statements. | | |
FRANKLIN TEMPLETON VARIABLE INSURANCE PRODUCTS TRUST
FINANCIAL HIGHLIGHTS
Templeton Foreign VIP Fund(continued)
| | | | | | | | | | | | | | | | | | | | | | | | |
| | |
| | | Six Months Ended June��30, 2019 (unaudited) | | | Year Ended December 31, | |
| | | 2018 | | | 2017 | | | 2016 | | | 2015 | | | 2014 | |
| |
| | | | | | |
| Class 2 | | | | | | | | | | | | | | | | | | | | | | | | |
| | | | | | |
Per share operating performance (for a share outstanding throughout the period) | | | | | | | | | | | | | | | | | | | | | | | | |
| | | | | | |
Net asset value, beginning of period | | | $12.74 | | | | $15.47 | | | | $13.61 | | | | $13.20 | | | | $15.05 | | | | $17.24 | |
| | | | |
| | | | | | |
| Income from investment operationsa: | | | | | | | | | | | | | | | | | | | | | | | | |
| | | | | | |
Net investment incomeb | | | 0.31 | | | | 0.25 | | | | 0.26 | | | | 0.28 | | | | 0.27 | | | | 0.48c | |
| | | | | | |
Net realized and unrealized gains (losses) | | | 0.50 | | | | (2.58 | ) | | | 1.98 | | | | 0.62 | | | | (1.13 | ) | | | (2.35) | |
| | | | |
| | | | | | |
Total from investment operations | | | 0.81 | | | | (2.33 | ) | | | 2.24 | | | | 0.90 | | | | (0.86 | ) | | | (1.87) | |
| | | | |
| | | | | | |
Less distributions from: | | | | | | | | | | | | | | | | | | | | | | | | |
| | | | | | |
Net investment income | | | (0.23 | ) | | | (0.40 | ) | | | (0.38 | ) | | | (0.26 | ) | | | (0.49 | ) | | | (0.32) | |
| | | | | | |
Net realized gains | | | (0.14 | ) | | | — | | | | — | | | | (0.23 | ) | | | (0.50 | ) | | | — | |
| | | | |
| | | | | | |
Total distributions | | | (0.37 | ) | | | (0.40 | ) | | | (0.38 | ) | | | (0.49 | ) | | | (0.99 | ) | | | (0.32) | |
| | | | |
| | | | | | |
Redemption fees | | | — | | | | — | | | | — | | | | — | | | | — | | | | —d | |
| | | | |
| | | | | | |
Net asset value, end of period | | | $13.18 | | | | $12.74 | | | | $15.47 | | | | $13.61 | | | | $13.20 | | | | $15.05 | |
| | | | |
| | | | | | |
Total returne | | | 6.47% | | | | (15.44)% | | | | 16.69% | | | | 7.18% | | | | (6.49)% | | | | (11.13)% | |
| | | | | | |
| Ratios to average net assetsf | | | | | | | | | | | | | | | | | | | | | | | | |
| | | | | | |
Expenses before waiver and payments by affiliates | | | 1.10% | | | | 1.08% | | | | 1.07% | | | | 1.05% | | | | 1.03% | | �� | | 1.02% | |
| | | | | | |
Expenses net of waiver and payments by affiliates | | | 1.08% | | | | 1.06% | | | | 1.06% | g | | | 1.03% | | | | 1.03% | h | | | 1.02% | h |
| | | | | | |
Net investment income | | | 4.60% | | | | 1.71% | | | | 1.74% | | | | 2.13% | | | | 1.80% | | | | 2.86% | c |
| | | | | | |
| Supplemental data | | | | | | | | | | | | | | | | | | | | | | | | |
| | | | | | |
Net assets, end of period (000’s) | | | $1,087,490 | | | | $1,060,101 | | | | $1,394,475 | | | | $1,436,518 | | | | $1,456,854 | | | | $1,645,571 | |
| | | | | | |
Portfolio turnover rate | | | 11.70% | | | | 21.38% | | | | 26.81% | | | | 20.93% | | | | 15.15% | | | | 25.71% | |
aThe amount shown for a share outstanding throughout the period may not correlate with the Statement of Operations for the period due to the timing of sales and repurchases of the Fund’s shares in relation to income earned and/or fluctuating fair value of the investments of the Fund.
bBased on average daily shares outstanding.
cNet investment income per share includes approximately $0.16 per share related to income received in the form of special dividends in connection with certain Fund holdings. Excluding this amount, the ratio of net investment income to average net assets would have been 1.88%.
dAmount rounds to less than $0.01 per share.
eTotal return does not include fees, charges or expenses imposed by the variable annuity and life insurance contracts for which Franklin Templeton Variable Insurance Products Trust serves as an underlying investment vehicle. Total return is not annualized for periods less than one year.
fRatios are annualized for periods less than one year.
gBenefit of expense reduction rounds to less than 0.01%.
hBenefit of waiver and payments by affiliates rounds to less than 0.01%.
| | | | | | |
| | | |
| | The accompanying notes are an integral part of these financial statements. | Semiannual Report | | | TF-7 | |
FRANKLIN TEMPLETON VARIABLE INSURANCE PRODUCTS TRUST
FINANCIAL HIGHLIGHTS
Templeton Foreign VIP Fund(continued)
| | | | | | | | | | | | | | | | | | | | | | | | |
| | |
| | | Six Months Ended June 30, 2019 (unaudited) | | | Year Ended December 31, | |
| | | 2018 | | | 2017 | | | 2016 | | | 2015 | | | 2014 | |
| |
| | | | | | |
| Class 4 | | | | | | | | | | | | | | | | | | | | | | | | |
| | | | | | |
Per share operating performance (for a share outstanding throughout the period) | | | | | | | | | | | | | | | | | | | | | | | | |
| | | | | | |
Net asset value, beginning of period | | | $12.96 | | | | $15.71 | | | | $13.71 | | | | $13.29 | | | | $15.16 | | | | $17.37 | |
| | | | |
| | | | | | |
| Income from investment operationsa: | | | | | | | | | | | | | | | | | | | | | | | | |
| | | | | | |
Net investment incomeb | | | 0.30 | | | | 0.24 | | | | 0.23 | | | | 0.26 | | | | 0.25 | | | | 0.46c | |
| | | | | | |
Net realized and unrealized gains (losses) | | | 0.53 | | | | (2.63 | ) | | | 2.03 | | | | 0.63 | | | | (1.14 | ) | | | (2.36) | |
| | | | |
| | | | | | |
Total from investment operations | | | 0.83 | | | | (2.39 | ) | | | 2.26 | | | | 0.89 | | | | (0.89 | ) | | | (1.90) | |
| | | | |
| | | | | | |
Less distributions from: | | | | | | | | | | | | | | | | | | | | | | | | |
| | | | | | |
Net investment income | | | (0.21 | ) | | | (0.36 | ) | | | (0.26 | ) | | | (0.24 | ) | | | (0.48 | ) | | | (0.31) | |
| | | | | | |
Net realized gains | | | (0.14 | ) | | | — | | | | — | | | | (0.23 | ) | | | (0.50 | ) | | | — | |
| | | | |
| | | | | | |
Total distributions | | | (0.35 | ) | | | (0.36 | ) | | | (0.26 | ) | | | (0.47 | ) | | | (0.98 | ) | | | (0.31) | |
| | | | |
| | | | | | |
Redemption fees | | | — | | | | — | | | | — | | | | — | | | | — | | | | —d | |
| | | | |
| | | | | | |
Net asset value, end of period | | | $13.44 | | | | $12.96 | | | | $15.71 | | | | $13.71 | | | | $13.29 | | | | $15.16 | |
| | | | |
| | | | | | |
Total returne | | | 6.47% | | | | (15.54)% | | | | 16.62% | | | | 7.09% | | | | (6.65)% | | | | (11.22)% | |
| | | | | | |
| Ratios to average net assetsf | | | | | | | | | | | | | | | | | | | | | | | | |
| | | | | | |
Expenses before waiver and payments by affiliates | | | 1.20% | | | | 1.18% | | | | 1.17% | | | | 1.15% | | | | 1.13% | | | | 1.12% | |
| | | | | | |
Expenses net of waiver and payments by affiliates | | | 1.18% | | | | 1.16% | | | | 1.16% | g | | | 1.13% | | | | 1.13% | h | | | 1.12% | h |
| | | | | | |
Net investment income | | | 4.50% | | | | 1.61% | | | | 1.64% | | | | 2.03% | | | | 1.70% | | | | 2.76% | c |
| | | | | | |
| Supplemental data | | | | | | | | | | | | | | | | | | | | | | | | |
| | | | | | |
Net assets, end of period (000’s) | | | $112,652 | | | | $125,265 | | | | $159,944 | | | | $484,763 | | | | $472,189 | | | | $503,143 | |
| | | | | | |
Portfolio turnover rate | | | 11.70% | | | | 21.38% | | | | 26.81% | | | | 20.93% | | | | 15.15% | | | | 25.71% | |
aThe amount shown for a share outstanding throughout the period may not correlate with the Statement of Operations for the period due to the timing of sales and repurchases of the Fund’s shares in relation to income earned and/or fluctuating fair value of the investments of the Fund.
bBased on average daily shares outstanding.
cNet investment income per share includes approximately $0.16 per share related to income received in the form of special dividends in connection with certain Fund holdings. Excluding this amount, the ratio of net investment income to average net assets would have been 1.78%.
dAmount rounds to less than $0.01 per share.
eTotal return does not include fees, charges or expenses imposed by the variable annuity and life insurance contracts for which Franklin Templeton Variable Insurance Products Trust serves as an underlying investment vehicle. Total return is not annualized for periods less than one year.
fRatios are annualized for periods less than one year.
gBenefit of expense reduction rounds to less than 0.01%.
hBenefit of waiver and payments by affiliates rounds to less than 0.01%.
| | | | |
| | | |
TF-8 | | Semiannual Report | The accompanying notes are an integral part of these financial statements. | | |
FRANKLIN TEMPLETON VARIABLE INSURANCE PRODUCTS TRUST
Statement of Investments, June 30, 2019 (unaudited)
Templeton Foreign VIP Fund
| | | | | | | | | | | | |
| | | |
| | | Country | | | Shares | | | Value | |
| | | |
Common Stocks 94.6% | | | | | | | | | | | | |
Aerospace & Defense 1.1% | | | | | | | | | | | | |
BAE Systems PLC | | | United Kingdom | | | | 2,299,513 | | | $ | 14,467,000 | |
| | | | | | | | | | | | |
| | | |
Auto Components 1.3% | | | | | | | | | | | | |
Cie Generale des Etablissements Michelin SCA | | | France | | | | 67,168 | | | | 8,517,953 | |
Sumitomo Rubber Industries Ltd. | | | Japan | | | | 712,200 | | | | 8,230,395 | |
| | | | | | | | | | | | |
| | | |
| | | | | | | | | | | 16,748,348 | |
| | | | | | | | | | | | |
| | | |
Automobiles 0.4% | | | | | | | | | | | | |
Hero Motocorp Ltd. | | | India | | | | 154,059 | | | | 5,767,996 | |
| | | | | | | | | | | | |
| | | |
Banks 19.6% | | | | | | | | | | | | |
Bangkok Bank PCL, fgn | | | Thailand | | | | 2,290,200 | | | | 14,850,108 | |
Bank of Ireland Group PLC | | | Ireland | | | | 2,346,131 | | | | 12,258,447 | |
Barclays PLC | | | United Kingdom | | | | 6,423,850 | | | | 12,220,636 | |
BNP Paribas SA | | | France | | | | 832,583 | | | | 39,531,492 | |
Hana Financial Group Inc. | | | South Korea | | | | 494,927 | | | | 15,999,334 | |
HSBC Holdings PLC | | | United Kingdom | | | | 3,012,800 | | | | 24,990,488 | |
ING Groep NV | | | Netherlands | | | | 2,515,913 | | | | 29,162,760 | |
Kasikornbank PCL, fgn | | | Thailand | | | | 1,860,000 | | | | 11,484,848 | |
KB Financial Group Inc., ADR | | | South Korea | | | | 871,106 | | | | 34,391,265 | |
Standard Chartered PLC | | | United Kingdom | | | | 4,786,838 | | | | 43,416,537 | |
Sumitomo Mitsui Financial Group Inc. | | | Japan | | | | 571,800 | | | | 20,184,296 | |
| | | | | | | | | | | | |
| | | |
| | | | | | | | | | | 258,490,211 | |
| | | | | | | | | | | | |
| | | |
Beverages 1.0% | | | | | | | | | | | | |
Suntory Beverage & Food Ltd. | | | Japan | | | | 293,800 | | | | 12,766,212 | |
| | | | | | | | | | | | |
| | | |
Building Products 1.1% | | | | | | | | | | | | |
Compagnie de Saint-Gobain | | | France | | | | 373,982 | | | | 14,572,409 | |
| | | | | | | | | | | | |
| | | |
Capital Markets 1.2% | | | | | | | | | | | | |
UBS Group AG | | | Switzerland | | | | 1,326,231 | | | | 15,755,317 | |
| | | | | | | | | | | | |
| | | |
Chemicals 2.1% | | | | | | | | | | | | |
Johnson Matthey PLC | | | United Kingdom | | | | 494,842 | | | | 20,920,254 | |
Lotte Chemical Corp. | | | South Korea | | | | 29,003 | | | | 6,329,851 | |
| | | | | | | | | | | | |
| | | |
| | | | | | | | | | | 27,250,105 | |
| | | | | | | | | | | | |
Construction & Engineering 0.8% | | | | | | | | | | | | |
Sinopec Engineering Group Co. Ltd. | | | China | | | | 11,734,000 | | | | 9,943,368 | |
| | | | | | | | | | | | |
| | | |
Construction Materials 1.8% | | | | | | | | | | | | |
CRH PLC | | | Ireland | | | | 294,271 | | | | 9,598,010 | |
Taiheiyo Cement Corp. | | | Japan | | | | 452,700 | | | | 13,687,646 | |
| | | | | | | | | | | | |
| | | |
| | | | | | | | | | | 23,285,656 | |
| | | | | | | | | | | | |
Diversified Telecommunication Services 4.0% | | | | | | | | | | | | |
China Telecom Corp. Ltd., H | | | China | | | | 40,444,357 | | | | 20,346,041 | |
Singapore Telecommunications Ltd. | | | Singapore | | | | 8,893,300 | | | | 23,001,330 | |
Telefonica Deutschland Holding AG | | | Germany | | | | 3,443,999 | | | | 9,619,918 | |
| | | | | | | | | | | | |
| | | |
| | | | | | | | | | | 52,967,289 | |
| | | | | | | | | | | | |
Electric Utilities 0.5% | | | | | | | | | | | | |
aKorea Electric Power Corp. | | | South Korea | | | | 267,802 | | | | 5,914,171 | |
| | | | | | | | | | | | |
FRANKLIN TEMPLETON VARIABLE INSURANCE PRODUCTS TRUST
STATEMENT OF INVESTMENTS (UNAUDITED)
Templeton Foreign VIP Fund(continued)
| | | | | | | | | | | | |
| | | |
| | | Country | | | Shares | | | Value | |
| | | |
Common Stocks(continued) | | | | | | | | | | | | |
Electrical Equipment 0.7% | | | | | | | | | | | | |
Vestas Wind Systems AS | | | Denmark | | | | 110,255 | | | $ | 9,521,244 | |
| | | | | | | | | | | | |
| | | |
Electronic Equipment, Instruments & Components 0.7% | | | | | | | | | | | | |
bLandis+Gyr Group AG | | | Switzerland | | | | 120,834 | | | | 9,621,428 | |
| | | | | | | | | | | | |
| | | |
Energy Equipment & Services 2.3% | | | | | | | | | | | | |
The Drilling Co. of 1972 AS | | | Denmark | | | | 10,416 | | | | 809,065 | |
SBM Offshore NV | | | Netherlands | | | | 1,147,815 | | | | 22,157,092 | |
Tenaris SA | | | Italy | | | | 570,849 | | | | 7,469,641 | |
| | | | | | | | | | | | |
| | | |
| | | | | | | | | | | 30,435,798 | |
| | | | | | | | | | | | |
Entertainment 0.9% | | | | | | | | | | | | |
NetEase Inc., ADR | | | China | | | | 48,100 | | | | 12,302,537 | |
| | | | | | | | | | | | |
| | | |
Food & Staples Retailing 0.9% | | | | | | | | | | | | |
Seven & i Holdings Co. Ltd. | | | Japan | | | | 360,100 | | | | 12,183,684 | |
| | | | | | | | | | | | |
| | | |
Food Products 0.5% | | | | | | | | | | | | |
Ezaki Glico Co. Ltd. | | | Japan | | | | 143,750 | | | | 6,399,555 | |
| | | | | | | | | | | | |
| | | |
Health Care Equipment & Supplies 0.1% | | | | | | | | | | | | |
aAlcon Inc. | | | Switzerland | | | | 25,784 | | | | 1,591,745 | |
| | | | | | | | | | | | |
| | | |
Health Care Providers & Services 0.7% | | | | | | | | | | | | |
Sinopharm Group Co. Ltd., H | | | China | | | | 2,794,800 | | | | 9,838,137 | |
| | | | | | | | | | | | |
| | | |
Household Durables 1.4% | | | | | | | | | | | | |
Panasonic Corp. | | | Japan | | | | 2,272,100 | | | | 18,915,201 | |
| | | | | | | | | | | | |
| | | |
Industrial Conglomerates 2.3% | | | | | | | | | | | | |
CK Hutchison Holdings Ltd. | | | Hong Kong | | | | 2,353,000 | | | | 23,192,207 | |
Siemens AG | | | Germany | | | | 63,215 | | | | 7,517,181 | |
| | | | | | | | | | | | |
| | | |
| | | | | | | | | | | 30,709,388 | |
| | | | | | | | | | | | |
Interactive Media & Services 1.2% | | | | | | | | | | | | |
aBaidu Inc., ADR | | | China | | | | 138,230 | | | | 16,222,673 | |
| | | | | | | | | | | | |
| | | |
Marine 0.5% | | | | | | | | | | | | |
A.P. Moeller-Maersk AS, B | | | Denmark | | | | 5,208 | | | | 6,458,244 | |
| | | | | | | | | | | | |
| | | |
Media 1.0% | | | | | | | | | | | | |
SES SA, IDR | | | Luxembourg | | | | 809,562 | | | | 12,654,820 | |
| | | | | | | | | | | | |
| | | |
Metals & Mining 5.3% | | | | | | | | | | | | |
Alamos Gold Inc., A | | | Canada | | | | 3,063,752 | | | | 18,535,700 | |
Sumitomo Metal Mining Co. Ltd. | | | Japan | | | | 553,200 | | | | 16,515,960 | |
Wheaton Precious Metals Corp. | | | Canada | | | | 1,450,800 | | | | 35,080,615 | |
| | | | | | | | | | | | |
| | | |
| | | | | | | | | | | 70,132,275 | |
| | | | | | | | | | | | |
Multi-Utilities 2.5% | | | | | | | | | | | | |
E.ON SE | | | Germany | | | | 1,516,092 | | | | 16,461,809 | |
Veolia Environnement SA | | | France | | | | 671,188 | | | | 16,344,319 | |
| | | | | | | | | | | | |
| | | |
| | | | | | | | | | | 32,806,128 | |
| | | | | | | | | | | | |
Oil, Gas & Consumable Fuels 11.5% | | | | | | | | | | | | |
BP PLC | | | United Kingdom | | | | 6,337,733 | | | | 44,154,640 | |
Eni SpA | | | Italy | | | | 1,751,379 | | | | 29,081,353 | |
bHusky Energy Inc. | | | Canada | | | | 1,163,600 | | | | 11,025,216 | |
FRANKLIN TEMPLETON VARIABLE INSURANCE PRODUCTS TRUST
STATEMENT OF INVESTMENTS (UNAUDITED)
Templeton Foreign VIP Fund (continued)
| | | | | | | | | | | | |
| | | |
| | | Country | | | Shares | | | Value | |
| | | |
Common Stocks (continued) | | | | | | | | | | | | |
Oil, Gas & Consumable Fuels(continued) | | | | | | | | | | | | |
Royal Dutch Shell PLC, A | | | United Kingdom | | | | 16,803 | | | $ | 548,945 | |
Royal Dutch Shell PLC, B | | | United Kingdom | | | | 1,205,385 | | | | 39,509,397 | |
Total SA | | | France | | | | 493,039 | | | | 27,619,198 | |
| | | | | | | | | | | | |
| | | |
| | | | | | | | | | | 151,938,749 | |
| | | | | | | | | | | | |
Pharmaceuticals 13.1% | | | | | | | | | | | | |
Astellas Pharma Inc. | | | Japan | | | | 1,323,300 | | | | 18,839,413 | |
Bayer AG | | | Germany | | | | 314,157 | | | | 21,764,684 | |
Merck KGaA | | | Germany | | | | 121,789 | | | | 12,732,398 | |
Novartis AG | | | Switzerland | | | | 128,920 | | | | 11,777,013 | |
Roche Holding AG | | | Switzerland | | | | 143,560 | | | | 40,379,696 | |
Sanofi | | | France | | | | 370,668 | | | | 31,988,013 | |
Takeda Pharmaceutical Co. Ltd. | | | Japan | | | | 565,194 | | | | 20,040,221 | |
aTeva Pharmaceutical Industries Ltd., ADR | | | Israel | | | | 1,610,544 | | | | 14,865,321 | |
| | | | | | | | | | | | |
| | | |
| | | | | | | | | | | 172,386,759 | |
| | | | | | | | | | | | |
Real Estate Management & Development 1.9% | | | | | | | | | | | | |
CK Asset Holdings Ltd. | | | Hong Kong | | | | 933,100 | | | | 7,303,887 | |
Mitsui Fudosan Co. Ltd. | | | Japan | | | | 604,000 | | | | 14,635,040 | |
Swire Pacific Ltd., A | | | Hong Kong | | | | 201,500 | | | | 2,476,143 | |
| | | | | | | | | | | | |
| | | |
| | | | | | | | | | | 24,415,070 | |
| | | | | | | | | | | | |
Semiconductors & Semiconductor Equipment 3.9% | | | | | | | | | | | | |
Infineon Technologies AG | | | Germany | | | | 590,665 | | | | 10,441,786 | |
NXP Semiconductors NV | | | Netherlands | | | | 221,300 | | | | 21,601,093 | |
Taiwan Semiconductor Manufacturing Co. Ltd. | | | Taiwan | | | | 2,587,000 | | | | 19,959,100 | |
| | | | | | | | | | | | |
| | | |
| | | | | | | | | | | 52,001,979 | |
| | | | | | | | | | | | |
Specialty Retail 1.1% | | | | | | | | | | | | |
Kingfisher PLC | | | United Kingdom | | | | 5,347,092 | | | | 14,592,869 | |
| | | | | | | | | | | | |
| | | |
Technology Hardware, Storage & Peripherals 4.1% | | | | | | | | | | | | |
Samsung Electronics Co. Ltd. | | | South Korea | | | | 1,337,964 | | | | 54,353,992 | |
| | | | | | | | | | | | |
| | | |
Wireless Telecommunication Services 3.1% | | | | | | | | | | | | |
China Mobile Ltd. | | | China | | | | 1,821,000 | | | | 16,584,954 | |
Vodafone Group PLC, ADR | | | United Kingdom | | | | 1,512,103 | | | | 24,692,642 | |
| | | | | | | | | | | | |
| | | |
| | | | | | | | | | | 41,277,596 | |
| | | | | | | | | | | | |
| | | |
Total Common Stocks (Cost $1,188,489,209) | | | | | | | | | | | 1,248,687,953 | |
| | | | | | | | | | | | |
| | | |
Short Term Investments 5.6% | | | | | | | | | | | | |
| | | |
Money Market Funds (Cost $63,314,322) 4.8% | | | | | | | | | | | | |
c,dInstitutional Fiduciary Trust Money Market Portfolio, 2.05% | | | United States | | | | 63,314,322 | | | | 63,314,322 | |
| | | | | | | | | | | | |
FRANKLIN TEMPLETON VARIABLE INSURANCE PRODUCTS TRUST
STATEMENT OF INVESTMENTS (UNAUDITED)
Templeton Foreign VIP Fund(continued)
| | | | | | | | | | |
| | | |
| | | Country | | Shares | | | Value | |
| | | |
Short Term Investments (continued) | | | | | | | | | | |
eInvestments from Cash Collateral Received for Loaned Securities 0.8% | | | | | | | | | | |
Money Market Funds (Cost $11,122,273) 0.8% | | | | | | | | | | |
c,d Institutional Fiduciary Trust Money Market Portfolio, 2.05% | | United States | | | 11,122,273 | | | $ | 11,122,273 | |
| | | | | | | | | | |
| | | |
Total Investments (Cost $1,262,925,804) 100.2% | | | | | | | | | 1,323,124,548 | |
Other Assets, less Liabilities (0.2)% | | | | | | | | | (3,157,225 | ) |
| | | | | | | | | | |
| | | |
Net Assets 100.0% | | | | | | | | $ | 1,319,967,323 | |
| | | | | | | | | | |
See Abbreviations on pageTF-23.
aNon-income producing.
bA portion or all of the security is on loan at June 30, 2019. See Note 1(c).
cSee Note 3(e) regarding investments in affiliated management investment companies.
dThe rate shown is the annualizedseven-day effective yield at period end.
eSee Note 1(c) regarding securities on loan.
| | | | |
| | |
TF-12 | | Semiannual Report | The accompanying notes are an integral part of these financial statements. |
FRANKLIN TEMPLETON VARIABLE INSURANCE PRODUCTS TRUST
FINANCIAL STATEMENTS
Statement of Assets and Liabilities
June 30, 2019 (unaudited)
| | | | |
| |
| | | Templeton
Foreign
VIP Fund | |
| |
Assets: | | | | |
Investments in securities: | | | | |
Cost - Unaffiliated issuers | | | $1,188,489,209 | |
Cost -Non-controlled affiliates (Note 3e) | | | 74,436,595 | |
| | | | |
| |
Value - Unaffiliated issuers+ | | | $1,248,687,953 | |
Value -Non-controlled affiliates (Note 3e) | | | 74,436,595 | |
Cash | | | 25,095 | |
Receivables: | | | | |
Investment securities sold | | | 9,722 | |
Capital shares sold | | | 2,368,573 | |
Dividends. | | | 8,564,960 | |
European Union tax reclaims | | | 159,053 | |
Other assets | | | 971 | |
| | | | |
| |
Total assets | | | 1,334,252,922 | |
| | | | |
Liabilities: | | | | |
Payables: | | | | |
Investment securities purchased | | | 562,239 | |
Capital shares redeemed | | | 892,227 | |
Management fees | | | 826,384 | |
Distribution fees | | | 512,222 | |
Trustees’ fees and expenses | | | 1,925 | |
Payable upon return of securities loaned | | | 11,122,273 | |
Accrued expenses and other liabilities | | | 368,329 | |
| | | | |
| |
Total liabilities | | | 14,285,599 | |
| | | | |
| |
Net assets, at value | | | $1,319,967,323 | |
| | | | |
Net assets consist of: | | | | |
Paid-in capital | | | $1,239,440,919 | |
Total distributable earnings (loss) | | | 80,526,404 | |
| | | | |
| |
Net assets, at value | | | $1,319,967,323 | |
| | | | |
| |
| Class 1: | | | | |
Net assets, at value | | | $ 119,825,105 | |
| | | | |
Shares outstanding | | | 8,911,289 | |
| | | | |
Net asset value and maximum offering price per share | | | $13.45 | |
| |
| Class 2: | | | | |
Net assets, at value | | | $1,087,490,226 | |
| | | | |
Shares outstanding | | | 82,500,011 | |
| | | | |
Net asset value and maximum offering price per share | | | $13.18 | |
| | | | |
| |
| Class 4: | | | | |
Net assets, at value | | | $ 112,651,992 | |
| | | | |
Shares outstanding | | | 8,384,869 | |
| | | | |
Net asset value and maximum offering price per share | | | $13.44 | |
| | | | |
| |
+Includes securities loaned | | | $ 4,912,344 | |
| | | | | | |
| | | |
| | The accompanying notes are an integral part of these financial statements. | Semiannual Report | | | TF-13 | |
FRANKLIN TEMPLETON VARIABLE INSURANCE PRODUCTS TRUST
FINANCIAL STATEMENTS
Statement of Operations
for the six months ended June 30, 2019 (unaudited)
| | | | |
| |
| | | Templeton
Foreign
VIP Fund | |
| |
Investment income: | | | | |
Dividends: (net of foreign taxes)* | | | | |
Unaffiliated issuers | | | $37,062,615 | |
Non-controlled affiliates (Note 3e) | | | 454,823 | |
Interest: | | | | |
Unaffiliated issuers | | | 3,478 | |
Income from securities loaned: | | | | |
Unaffiliated issuers (net of fees and rebates) | | | 4,816 | |
Non-controlled affiliates (Note 3e) | | | 234,251 | |
| | | | |
| |
Total investment income | | | 37,759,983 | |
| | | | |
Expenses: | | | | |
Management fees (Note 3a) | | | 5,329,091 | |
Distribution fees: (Note 3c) | | | | |
Class 2 | | | 1,367,445 | |
Class 4 | | | 203,435 | |
Custodian fees (Note 4) | | | 71,309 | |
Reports to shareholders | | | 156,411 | |
Professional fees | | | 48,264 | |
Trustees’ fees and expenses | | | 6,013 | |
Other | | | 25,846 | |
| | | | |
| |
Total expenses | | | 7,207,814 | |
Expenses waived/paid by affiliates (Note 3e) | | | (116,436 | ) |
| | | | |
| |
Net expenses | | | 7,091,378 | |
| | | | |
| |
Net investment income | | | 30,668,605 | |
| | | | |
Realized and unrealized gains (losses): | | | | |
Net realized gain (loss) from: | | | | |
Investments: | | | | |
Unaffiliated issuers | | | (7,023,946 | ) |
Foreign currency transactions | | | (179,114 | ) |
| | | | |
| |
Net realized gain (loss) | | | (7,203,060 | ) |
| | | | |
Net change in unrealized appreciation (depreciation) on: | | | | |
Investments: | | | | |
Unaffiliated issuers | | | 60,778,948 | |
| |
Translation of other assets and liabilities denominated in foreign currencies | | | (37,118 | ) |
| | | | |
| |
Net change in unrealized appreciation (depreciation) | | | 60,741,830 | |
| | | | |
| |
Net realized and unrealized gain (loss) | | | 53,538,770 | |
| | | | |
| |
Net increase (decrease) in net assets resulting from operations | | | $84,207,375 | |
| | | | |
| | | | |
| |
*Foreign taxes withheld on dividends | | | $ 2,795,886 | |
| | | | |
| | |
| TF-14 | | Semiannual Report | The accompanying notes are an integral part of these financial statements. |
FRANKLIN TEMPLETON VARIABLE INSURANCE PRODUCTS TRUST
FINANCIAL STATEMENTS
Statements of Changes in Net Assets
| | | | | | | | |
| |
| | | Templeton Foreign VIP Fund | |
| | |
| | | Six Months Ended
June 30, 2019
(unaudited) | | | Year Ended
December 31, 2018 | |
| | |
Increase (decrease) in net assets: | | | | | | | | |
Operations: | | | | | | | | |
Net investment income | | | $ 30,668,605 | | | | $ 26,739,957 | |
Net realized gain (loss) | | | (7,203,060 | ) | | | 97,768,736 | |
Net change in unrealized appreciation (depreciation) | | | 60,741,830 | | | | (367,924,342 | ) |
| | | | |
| | |
Net increase (decrease) in net assets resulting from operations | | | 84,207,375 | | | | (243,415,649 | ) |
| | | | |
| | |
Distributions to shareholders: | | | | | | | | |
Class 1 | | | (3,542,825 | ) | | | (3,961,619 | ) |
Class 2 | | | (29,727,357 | ) | | | (33,465,356 | ) |
Class 4 | | | (2,819,837 | ) | | | (3,521,973 | ) |
| | | | |
| | |
Total distributions to shareholders | | | (36,090,019 | ) | | | (40,948,948 | ) |
| | | | |
| | |
Capital share transactions: (Note 2) | | | | | | | | |
Class 1 | | | 988,366 | | | | (12,722,479 | ) |
Class 2 | | | (11,544,167 | ) | | | (102,793,664 | ) |
Class 4 | | | (17,744,037 | ) | | | (7,072,417 | ) |
| | | | |
| | |
Total capital share transactions | | | (28,299,838 | ) | | | (122,588,560 | ) |
| | | | |
| | |
Net increase (decrease) in net assets | | | 19,817,518 | | | | (406,953,157 | ) |
Net assets: | | | | | | | | |
Beginning of period | | | 1,300,149,805 | | | | 1,707,102,962 | |
| | | | |
| | |
End of period | | | $1,319,967,323 | | | | $1,300,149,805 | |
| | | | |
| | | | | | |
| | | |
| | The accompanying notes are an integral part of these financial statements. | Semiannual Report | | | TF-15 | |
FRANKLIN TEMPLETON VARIABLE INSURANCE PRODUCTS TRUST
Notes to Financial Statements (unaudited)
Templeton Foreign VIP Fund
1. Organization and Significant Accounting Policies
Franklin Templeton Variable Insurance Products Trust (Trust) is registered under the Investment Company Act of 1940 (1940 Act) as anopen-end management investment company, consisting of eighteen separate funds and applies the specialized accounting and reporting guidance in U.S. Generally Accepted Accounting Principles (U.S. GAAP). Templeton Foreign VIP Fund (Fund) is included in this report. Shares of the Fund are generally sold only to insurance company separate accounts to fund the benefits of variable life insurance policies or variable annuity contracts. The Fund offers three classes of shares: Class 1, Class 2, and Class 4. Each class of shares may differ by its distribution fees, voting rights on matters affecting a single class and its exchange privilege.
The following summarizes the Fund’s significant accounting policies.
a. Financial Instrument Valuation
The Fund’s investments in financial instruments are carried at fair value daily. Fair value is the price that would be received to sell an asset or paid to transfer a liability in an orderly transaction between market participants on the measurement date. The Fund calculates the net asset value (NAV) per share each business day as of 4 p.m. Eastern time or the regularly scheduled close of the New York Stock Exchange (NYSE), whichever is earlier. Under compliance policies and procedures approved by the Trust’s Board of Trustees (the Board), the Fund’s administrator has responsibility for oversight of valuation, including leading the cross-functional Valuation Committee (VC). The Fund may utilize independent pricing services, quotations from securities and financial instrument dealers, and other market sources to determine fair value.
Equity securities listed on an exchange or on the NASDAQ National Market System are valued at the last quoted sale price or the official closing price of the day, respectively. Foreign equity securities are valued as of the close of trading on the foreign stock exchange on which the security is primarily traded, or as of 4 p.m. Eastern time. The value is then converted into its U.S. dollar equivalent at the foreign exchange rate in effect at 4 p.m. Eastern time on the day that the value of the security is determined.Over-the-counter (OTC) securities are valued within the range of the most recent quoted bid and ask prices. Securities that trade in multiple markets or on multiple exchanges are valued
according to the broadest and most representative market. Certain equity securities are valued based upon fundamental characteristics or relationships to similar securities.
Investments inopen-end mutual funds are valued at the closing NAV.
The Fund has procedures to determine the fair value of financial instruments for which market prices are not reliable or readily available. Under these procedures, the Fund primarily employs a market-based approach which may use related or comparable assets or liabilities, recent transactions, market multiples, book values, and other relevant information for the investment to determine the fair value of the investment. An income-based valuation approach may also be used in which the anticipated future cash flows of the investment are discounted to calculate fair value. Discounts may also be applied due to the nature or duration of any restrictions on the disposition of the investments. Due to the inherent uncertainty of valuations of such investments, the fair values may differ significantly from the values that would have been used had an active market existed.
Trading in securities on foreign securities stock exchanges and OTC markets may be completed before 4 p.m. Eastern time. In addition, trading in certain foreign markets may not take place on every Fund’s business day. Occasionally, events occur between the time at which trading in a foreign security is completed and 4 p.m. Eastern time that might call into question the reliability of the value of a portfolio security held by the Fund. As a result, differences may arise between the value of the Fund’s portfolio securities as determined at the foreign market close and the latest indications of value at 4 p.m. Eastern time. In order to minimize the potential for these differences, the VC monitors price movements following the close of trading in foreign stock markets through a series of country specific market proxies (such as baskets of American Depositary Receipts, futures contracts and exchange traded funds). These price movements are measured against established trigger thresholds for each specific market proxy to assist in determining if an event has occurred that may call into question the reliability of the values of the foreign securities held by the Fund. If such an event occurs, the securities may be valued using fair value procedures, which may include the use of independent pricing services.
FRANKLIN TEMPLETON VARIABLE INSURANCE PRODUCTS TRUST
NOTES TO FINANCIAL STATEMENTS (UNAUDITED)
Templeton Foreign VIP Fund(continued)
When the last day of the reporting period is anon-business day, certain foreign markets may be open on those days that the Fund’s NAV is not calculated, which could result in differences between the value of the Fund’s portfolio securities on the last business day and the last calendar day of the reporting period. Any significant security valuation changes due to an open foreign market are adjusted and reflected by the Fund for financial reporting purposes.
b. Foreign Currency Translation
Portfolio securities and other assets and liabilities denominated in foreign currencies are translated into U.S. dollars based on the exchange rate of such currencies against U.S. dollars on the date of valuation. The Fund may enter into foreign currency exchange contracts to facilitate transactions denominated in a foreign currency. Purchases and sales of securities, income and expense items denominated in foreign currencies are translated into U.S. dollars at the exchange rate in effect on the transaction date. Portfolio securities and assets and liabilities denominated in foreign currencies contain risks that those currencies will decline in value relative to the U.S. dollar. Occasionally, events may impact the availability or reliability of foreign exchange rates used to convert the U.S. dollar equivalent value. If such an event occurs, the foreign exchange rate will be valued at fair value using procedures established and approved by the Board.
The Fund does not separately report the effect of changes in foreign exchange rates from changes in market prices on securities held. Such changes are included in net realized and unrealized gain or loss from investments in the Statement of Operations.
Realized foreign exchange gains or losses arise from sales of foreign currencies, currency gains or losses realized between the trade and settlement dates on securities transactions and the difference between the recorded amounts of dividends, interest, and foreign withholding taxes and the U.S. dollar equivalent of the amounts actually received or paid. Net unrealized foreign exchange gains and losses arise from changes in foreign exchange rates on foreign denominated assets and liabilities other than investments in securities held at the end of the reporting period.
c. Securities Lending
The Fund participates in an agency based securities lending program to earn additional income. The Fund receives cash collateral against the loaned securities in an amount equal to at least 102% of the fair value of the loaned securities. Collateral is maintained over the life of the loan in an amount not less than 100% of the fair value of loaned securities, as determined at the close of Fund business each day; any additional collateral required due to changes in security values is delivered to the Fund on the next business day. The collateral is deposited into a joint cash account with other funds and is used to invest in a money market fund managed by Franklin Advisers, Inc., an affiliate of the Fund. The Fund may receive income from the investment of cash collateral, in addition to lending fees and rebates paid by the borrower. Income from securities loaned, net of fees paid to the securities lending agent and/or third-party vendor, is reported separately in the Statement of Operations. The Fund bears the market risk with respect to the collateral investment, securities loaned, and the risk that the agent may default on its obligations to the Fund. If the borrower defaults on its obligation to return the securities loaned, the Fund has the right to repurchase the securities in the open market using the collateral received. The securities lending agent has agreed to indemnify the Fund in the event of default by a third party borrower.
d. Income and Deferred Taxes
It is the Fund’s policy to qualify as a regulated investment company under the Internal Revenue Code. The Fund intends to distribute to shareholders substantially all of its taxable income and net realized gains to relieve it from federal income and if applicable, excise taxes. As a result, no provision for U.S. federal income taxes is required.
The Fund may be subject to foreign taxation related to income received, capital gains on the sale of securities and certain foreign currency transactions in the foreign jurisdictions in which it invests. Foreign taxes, if any, are recorded based on the tax regulations and rates that exist in the foreign markets in which the Fund invests. When a capital gain tax is determined to apply, the Fund records an estimated deferred tax liability in an amount that would be payable if the securities were disposed of on the valuation date.
FRANKLIN TEMPLETON VARIABLE INSURANCE PRODUCTS TRUST
NOTES TO FINANCIAL STATEMENTS (UNAUDITED)
Templeton Foreign VIP Fund(continued)
1. Organization and Significant Accounting
Policies(continued)
d. Income and Deferred Taxes(continued)
As a result of several court cases, in certain countries across the European Union, the Fund filed additional tax reclaims for previously withheld taxes on dividends earned in those countries (EU reclaims). These additional filings are subject to various administrative proceedings by the local jurisdictions’ tax authorities within the European Union, as well as a number of related judicial proceedings. Income recognized, if any, for EU reclaims is reflected as other income in the Statement of Operations and any related receivable, if any, is reflected as European Union tax reclaims in the Statement of Assets and Liabilities. When uncertainty exists as to the ultimate resolution of these proceedings, the likelihood of receipt of these EU reclaims, and the potential timing of payment, no amounts are reflected in the financial statements. For U.S. income tax purposes, when EU reclaims are received by the Fund and the Fund previously passed foreign tax credit on to its shareholders, the Fund must either amend historic tax reporting to shareholders or enter into a closing agreement with the Internal Revenue Service (IRS) in order to pay the associated tax liability on behalf of the Fund’s shareholders.
The Fund may recognize an income tax liability related to its uncertain tax positions under U.S. GAAP when the uncertain tax position has a less than 50% probability that it will be sustained upon examination by the tax authorities based on its technical merits. As of June 30, 2019, the Fund has determined that no tax liability is required in its financial statements related to uncertain tax positions for any open tax years (or expected to be taken in future tax years). Open tax years are those that remain subject to examination and are based on the statute of limitations in each jurisdiction in which the Fund invests.
e. Security Transactions, Investment Income, Expenses and Distributions
Security transactions are accounted for on trade date. Realized gains and losses on security transactions are determined on a specific identification basis. Interest income and estimated expenses are accrued daily. Dividend income is recorded on theex-dividend date except for certain dividends from securities where the dividend rate is not
available. In such cases, the dividend is recorded as soon as the information is received by the Fund. Distributions to shareholders are recorded on theex-dividend date. Distributable earnings are determined according to income tax regulations (tax basis) and may differ from earnings recorded in accordance with U.S. GAAP. These differences may be permanent or temporary. Permanent differences are reclassified among capital accounts to reflect their tax character. These reclassifications have no impact on net assets or the results of operations. Temporary differences are not reclassified, as they may reverse in subsequent periods.
Common expenses incurred by the Trust are allocated among the Funds based on the ratio of net assets of each Fund to the combined net assets of the Trust or based on the ratio of number of shareholders of each Fund to the combined number of shareholders of the Trust. Fund specific expenses are charged directly to the Fund that incurred the expense.
Realized and unrealized gains and losses and net investment income, excluding class specific expenses, are allocated daily to each class of shares based upon the relative proportion of net assets of each class. Differences in per share distributions by class are generally due to differences in class specific expenses.
f. Accounting Estimates
The preparation of financial statements in accordance with U.S. GAAP requires management to make estimates and assumptions that affect the reported amounts of assets and liabilities at the date of the financial statements and the amounts of income and expenses during the reporting period. Actual results could differ from those estimates.
g. Guarantees and Indemnifications
Under the Trust’s organizational documents, its officers and trustees are indemnified by the Trust against certain liabilities arising out of the performance of their duties to the Trust. Additionally, in the normal course of business, the Trust, on behalf of the Fund, enters into contracts with service providers that contain general indemnification clauses. The Trust’s maximum exposure under these arrangements is unknown as this would involve future claims that may be made against the Trust that have not yet occurred. Currently, the Trust expects the risk of loss to be remote.
FRANKLIN TEMPLETON VARIABLE INSURANCE PRODUCTS TRUST
NOTES TO FINANCIAL STATEMENTS (UNAUDITED)
Templeton Foreign VIP Fund(continued)
2. Shares of Beneficial Interest
At June 30, 2019, there were an unlimited number of shares authorized (without par value). Transactions in the Fund’s shares were as follows:
| | | | | | | | | | | | | | | | |
| | | Six Months Ended June 30, 2019 | | | Year Ended December 31, 2018 | |
| | | | |
| | | Shares | | | Amount | | | Shares | | | Amount | |
| |
| | | | |
| Class 1 Shares: | | | | | | | | | | | | | | | | |
| | | | |
Shares sold | | | 175,552 | | | $ | 2,431,425 | | | | 438,905 | | | $ | 6,719,723 | |
| | | | |
Shares issued in reinvestment of distributions | | | 273,789 | | | | 3,542,825 | | | | 263,056 | | | | 3,961,619 | |
| | | | |
Shares redeemed | | | (361,352) | | | | (4,985,884) | | | | (1,543,257) | | | | (23,403,821) | |
| | | | |
| | | | |
Net increase (decrease) | | | 87,989 | | | $ | 988,366 | | | | (841,296) | | | $ | (12,722,479) | |
| | | | |
| | | | |
| Class 2 Shares: | | | | | | | | | | | | | | | | |
| | | | |
Shares sold | | | 3,116,026 | | | $ | 42,274,359 | | | | 7,214,702 | | | $ | 104,866,589 | |
| | | | |
Shares issued in reinvestment of distributions | | | 2,342,581 | | | | 29,727,357 | | | | 2,265,765 | | | | 33,465,356 | |
| | | | |
Shares redeemed | | | (6,178,932) | | | | (83,545,883) | | | | (16,372,436) | | | | (241,125,609) | |
| | | | |
| | | | |
Net increase (decrease) | | | (720,325) | | | $ | (11,544,167) | | | | (6,891,969) | | | $ | (102,793,664) | |
| | | | |
| | | | |
| Class 4 Shares: | | | | | | | | | | | | | | | | |
| | | | |
Shares sold | | | 414,444 | | | $ | 5,663,852 | | | | 1,564,942 | | | $ | 23,205,250 | |
| | | | |
Shares issued in reinvestment of distributions | | | 218,085 | | | | 2,819,837 | | | | 234,330 | | | | 3,521,973 | |
| | | | |
Shares redeemed | | | (1,913,741) | | | | (26,227,726) | | | | (2,311,503) | | | | (33,799,640) | |
| | | | |
| | | | |
Net increase (decrease) | | | (1,281,212) | | | $ | (17,744,037) | | | | (512,231) | | | $ | (7,072,417) | |
| | | | |
3. Transactions with Affiliates
Franklin Resources, Inc. is the holding company for various subsidiaries that together are referred to as Franklin Templeton. Certain officers and trustees of the Fund are also officers and/or directors of the following subsidiaries:
| | |
| |
| Subsidiary | | Affiliation |
| |
Templeton Investment Counsel, LLC (TIC) | | Investment manager |
| |
Franklin Templeton Services, LLC (FT Services) | | Administrative manager |
| |
Franklin Templeton Distributors, Inc. (Distributors) | | Principal underwriter |
| |
Franklin Templeton Investor Services, LLC (Investor Services) | | Transfer agent |
FRANKLIN TEMPLETON VARIABLE INSURANCE PRODUCTS TRUST
NOTES TO FINANCIAL STATEMENTS (UNAUDITED)
Templeton Foreign VIP Fund(continued)
3. Transactions with Affiliates(continued)
a. Management Fees
The Fund pays an investment management fee to TIC based on the average daily net assets of the Fund as follows:
| | |
| |
| Annualized Fee Rate | | Net Assets |
| |
0.900% | | Up to and including $200 million |
| |
0.810% | | Over $200 million, up to and including $700 million |
| |
0.775% | | Over $700 million, up to and including $1.2 billion |
| |
0.750% | | Over $1.2 billion, up to and including $1.3 billion |
| |
0.675% | | Over $1.3 billion, up to and including $10 billion |
| |
0.655% | | Over $10 billion, up to and including $15 billion |
| |
0.635% | | Over $15 billion, up to and including $20 billion |
| |
0.615% | | In excess of $20 billion |
For the period ended June 30, 2019, the annualized gross effective investment management fee rate was 0.801% of the Fund’s average daily net assets.
b. Administrative Fees
Under an agreement with TIC, FT Services provides administrative services to the Fund. The fee is paid by TIC based on the Fund’s average daily net assets, and is not an additional expense of the Fund.
c. Distribution Fees
The Board has adopted distribution plans for Class 2 and Class 4 shares pursuant to Rule12b-1 under the 1940 Act. Under the Fund’s compensation distribution plans, the Fund pays Distributors for costs incurred in connection with the servicing, sale and distribution of the Fund’s shares up to 0.25% and 0.35% per year of its average daily net assets of Class 2 and Class 4, respectively. The plan year, for purposes of monitoring compliance with the maximum annual plan rates, is February 1 through January 31.
d. Transfer Agent Fees
Investor Services, under terms of an agreement, performs shareholder servicing for the Fund and is not paid by the Fund for the services.
FRANKLIN TEMPLETON VARIABLE INSURANCE PRODUCTS TRUST
NOTES TO FINANCIAL STATEMENTS (UNAUDITED)
Templeton Foreign VIP Fund(continued)
e. Investments in Affiliated Management Investment Companies
The Fund invests in one or more affiliated management investment companies for purposes other than exercising a controlling influence over the management or policies. Management fees paid by the Fund are waived on assets invested in the affiliated management investment companies, as noted in the Statement of Operations, in an amount not to exceed the management and administrative fees paid directly or indirectly by each affiliate. During the period ended June 30, 2019, the Fund held investments in affiliated management investment companies as follows:
| | | | | | | | | | | | | | | | | | | | | | | | | | | | | | |
| | | Value at
Beginning of Period | | | Purchases | | | Sales | | | Realized
Gain (Loss) | | | Net Change in
Unrealized
Appreciation
(Depreciation) | | | Value at End of Period | | | Number of
Shares Held at End
of Period | | | Investment
Income |
| Non-Controlled Affiliates | | | | | | | | | | | | | | | | | | | | | | | | | | | | | | |
| | | | | | | | | | | | | | | | | | | | | | | | | | | | | | Dividends |
Institutional Fiduciary Trust Money Market Portfolio, 2.05% | | | $49,866,794 | | | | $156,280,845 | | | | $(142,833,317) | | | | $ — | | | | $ — | | | | $63,314,322 | | | | 63,314,322 | | | $454,823 |
| | | | | | | | |
| | | | | | | | | | | | | | | | | | | | | | | | | | | | | | Income from securities
loaned |
Institutional Fiduciary Trust Money Market Portfolio, 2.05% | | | 13,003,937 | | | | 267,023,676 | | | | (268,905,340) | | | | — | | | | — | | | | 11,122,273 | | | | 11,122,273 | | | 234,251 |
| | | | | | | | |
Total Affiliated Securities | | | $62,870,731 | | | | $423,304,521 | | | | $(411,738,657) | | | | $ — | | | | $ — | | | | $74,436,595 | | | | | | | $689,074 |
4. Expense Offset Arrangement
The Fund has entered into an arrangement with its custodian whereby credits realized as a result of uninvested cash balances are used to reduce a portion of the Fund’s custodian expenses. During the period ended June 30, 2019, there were no credits earned.
5. Income Taxes
At June 30, 2019, the cost of investments and net unrealized appreciation (depreciation) for income tax purposes were as follows:
| | | | |
Cost of investments | | $ | 1,266,955,782 | |
| | | | |
| |
Unrealized appreciation | | $ | 200,220,390 | |
Unrealized depreciation | | | (144,051,624) | |
| | | | |
| |
Net unrealized appreciation (depreciation) | | $ | 56,168,766 | |
| | | | |
Differences between income and/or capital gains as determined on a book basis and a tax basis are primarily due to differing treatment of passive foreign investment company shares.
6. Investment Transactions
Purchases and sales of investments (excluding short term securities) for the period ended June 30, 2019, aggregated $149,655,770 and $208,609,412, respectively.
FRANKLIN TEMPLETON VARIABLE INSURANCE PRODUCTS TRUST
NOTES TO FINANCIAL STATEMENTS (UNAUDITED)
Templeton Foreign VIP Fund(continued)
6. Investment Transactions(continued)
At June 30, 2019, in connection with securities lending transactions, the Fund loaned equity investments and received $11,122,273 of cash collateral. The gross amount of recognized liability for such transactions is included in payable upon return of securities loaned in the Statement of Assets and Liabilities. The agreements can be terminated at any time.
7. Concentration of Risk
Investing in foreign securities may include certain risks and considerations not typically associated with investing in U.S. securities, such as fluctuating currency values and changing local and regional economic, political and social conditions, which may result in greater market volatility. Current political and financial uncertainty surrounding the European Union may increase market volatility and the economic risk of investing in securities in Europe. In addition, certain foreign securities may not be as liquid as U.S. securities.
8. Credit Facility
The Fund, together with other U.S. registered and foreign investment funds (collectively, Borrowers), managed by Franklin Templeton, are borrowers in a joint syndicated senior unsecured credit facility totaling $2 billion (Global Credit Facility) which matures on February 7, 2020. This Global Credit Facility provides a source of funds to the Borrowers for temporary and emergency purposes, including the ability to meet future unanticipated or unusually large redemption requests.
Under the terms of the Global Credit Facility, the Fund shall, in addition to interest charged on any borrowings made by the Fund and other costs incurred by the Fund, pay its share of fees and expenses incurred in connection with the implementation and maintenance of the Global Credit Facility, based upon its relative share of the aggregate net assets of all of the Borrowers, including an annual commitment fee of 0.15% based upon the unused portion of the Global Credit Facility. These fees are reflected in other expenses in the Statement of Operations. During the period ended June 30, 2019, the Fund did not use the Global Credit Facility.
9. Fair Value Measurements
The Fund follows a fair value hierarchy that distinguishes between market data obtained from independent sources (observable inputs) and the Fund’s own market assumptions (unobservable inputs). These inputs are used in determining the value of the Fund’s financial instruments and are summarized in the following fair value hierarchy:
| | • | | Level 1 – quoted prices in active markets for identical financial instruments |
| | • | | Level 2 – other significant observable inputs (including quoted prices for similar financial instruments, interest rates, prepayment speed, credit risk, etc.) |
| | • | | Level 3 – significant unobservable inputs (including the Fund’s own assumptions in determining the fair value of financial instruments) |
The input levels are not necessarily an indication of the risk or liquidity associated with financial instruments at that level.
At June 30, 2019, all of the Fund’s investments in financial instruments carried at fair value were valued using Level 1 inputs. For detailed categories, see the accompanying Statement of Investments.
10. Subsequent Events
The Fund has evaluated subsequent events through the issuance of the financial statements and determined that no events have occurred that require disclosure.
FRANKLIN TEMPLETON VARIABLE INSURANCE PRODUCTS TRUST
NOTES TO FINANCIAL STATEMENTS (UNAUDITED)
Templeton Foreign VIP Fund(continued)
Abbreviations
| | |
|
| Selected Portfolio |
| |
| ADR | | American Depositary Receipt |
| |
| IDR | | International Depositary Receipt |
FRANKLIN TEMPLETON VARIABLE INSURANCE PRODUCTS TRUST
Tax Information (unaudited)
Templeton Foreign VIP Fund
At December 31, 2018, more than 50% of the Fund’s total assets were invested in securities of foreign issuers. In most instances, foreign taxes were withheld from income paid to the Fund on these investments. As shown in the table below, the Fund hereby reports to shareholders the foreign source income and foreign taxes paid, pursuant to Section 853 of the Internal Revenue Code. This written statement will allow shareholders of record on June 13, 2019, to treat their proportionate share of foreign taxes paid by the Fund as having been paid directly by them. The shareholder shall consider these amounts as foreign taxes paid in the tax year in which they receive the Fund distribution.
The following table provides a detailed analysis of foreign tax paid and foreign source income as reported by the Fund to shareholders of record.
| | | | |
| Class | | Foreign Tax Paid Per Share | | Foreign Source Income Per Share |
| | |
Class 1 | | $0.0348 | | $0.3349 |
| | |
Class 2 | | $0.0348 | | $0.2952 |
| | |
Class 4 | | $0.0348 | | $0.2701 |
Foreign Tax Paid Per Share is the amount per share available to you, as a tax credit (assuming you held your shares in the Fund for a minimum of 16 days during the31-day period beginning 15 days before theex-dividend date of the Fund’s distribution to which the foreign taxes relate), or, as a tax deduction.
Foreign Source Income Per Share is the amount per share of income dividends attributable to foreign securities held by the Fund, plus any foreign taxes withheld on these dividends.
Templeton Global Bond VIP Fund
This semiannual report for Templeton Global Bond VIP Fund covers the period ended June 30, 2019.
Class 2 Performance Summary as of June 30, 2019
The Fund’s Class 2 Shares posted a +3.10% total return* for thesix-month period ended June 30, 2019.
*The Fund has a fee waiver associated with any investment it makes in a Franklin Templeton money fund and/or other Franklin Templeton fund, contractually guaranteed through 4/30/20. Fund investment results reflect the fee waiver; without this waiver, the results would have been lower.
Performance reflects the Fund’s Class 2 operating expenses, but doesnotinclude any contract fees, expenses or sales charges. If they had been included, performance would be lower. These charges and deductions, particularly for variable life policies, can have a significant effect on contract values and insurance benefits. See the contract prospectus for a complete description of these expenses, including sales charges.
Performance data represent past performance, which does not guarantee future results. Investment return and principal value will fluctuate, and you may have a gain or loss when you sell your shares. Current performance may differ from figures shown.
TEMPLETON GLOBAL BOND VIP FUND
Fund Goal and Main Investments
The Fund seeks high current income, consistent with preservation of capital, with capital appreciation as a secondary consideration. Under normal market conditions, the Fund invests at least 80% of its net assets in bonds, which include debt securities of any maturity, such as bonds, notes, bills and debentures.
Fund Risks
All investments involve risks, including possible loss of principal. Foreign securities involve special risks, including currency fluctuations and economic and political uncertainties. Currency rates may fluctuate significantly over short periods of time, and can reduce returns. Sovereign debt securities are subject to various risks in addition to those relating to debt securities and foreign securities generally, including, but not limited to, the risk that a governmental entity may be unwilling or unable to pay interest and repay principal on its sovereign debt, or otherwise meet its obligations when due. Adverse conditions in a certain region or country can adversely affect securities of issuers in other countries whose economies appear to be unrelated. Investments in developing markets involve heightened risks related to the same factors, in addition to those associated with these markets’ smaller size, lesser liquidity and lack of established legal, political, business and social frameworks to support securities market. The Fund is actively managed but there is no guarantee that the manager’s investment decisions will produce the desired results. The Fund’s prospectus also includes a description of the main investment risks.
Performance Overview
You can find the Fund’ssix-month total return in the Performance Summary. For comparison, the J.P.Morgan Global Government Bond Index posted a +5.37% total return and the FTSE World Government Bond Index (WGBI), posted a +5.38% total return for the same period.1
Economic and Market Overview
Global financial markets began thesix-month period on a positive note, significantly recovering from the heightened volatility in December 2018. Some of the strongest rallies in January were seen across emerging markets, notably in
Geographic Composition*
Based on Total Net Assets as of 6/30/19
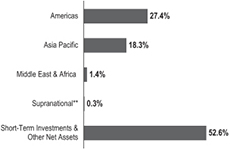
*Figures represent the net Fund exposure and include certain derivatives held in the portfolio (or their underlying reference assets) and may not total 100% or may be negative due to rounding, use of any derivatives or other factors.
**The Fund’s supranational investment was denominated in the Mexican peso.
Latin America. Most global currencies initially strengthened against a broadly weaker U.S. dollar before the trends reversed in February, March, April and May. However, weakness in the U.S. dollar returned in June, resulting in positive appreciations for a number of currencies against the U.S. dollar over the fullsix-month period. Additionally, risk assets around the world largely rallied during the period as a whole despite intermittent periods of volatility, with credit spreads broadly tightening across much of the global fixed income markets.
The Federal Open Market Committee (FOMC) shifted its policy stance at its January 2019 meeting, keeping rates unchanged, but removing its prior statement that “some further gradual increases in the target range for the federal funds rate” would be warranted. By March, the U.S. Federal Reserve (Fed) dropped its projected rate hikes for 2019 to zero, from the previous projections for two. In June, the FOMC shifted forward guidance further into dovish territory, notably removing its prior statement on being “patient… on future adjustments” and replacing it with a declaration that it “will act as appropriate to sustain the expansion.” Fed Chair Jay Powell indicated that several FOMC members saw a strengthening case for rate cuts.
In Europe, the European Central Bank (ECB) kept its policy rate unchanged at its January, March, April and June meetings, but moved increasingly into dovish territory
1. Source: Morningstar. One cannot invest directly in an index, and an index is not representative of the Fund’s portfolio. Please see Index Descriptions following the Fund Summaries.
The dollar value, number of shares or principal amount, and names of all portfolio holdings are listed in the Fund’s Statement of Investments (SOI).
TEMPLETON GLOBAL BOND VIP FUND
throughout the period. ECB President Mario Draghi indicated the central bank was prepared to “use all the instruments in its toolbox” to support economic conditions and move inflation closer to its 2.0% target, specifically including the possibility for rate cuts and quantitative easing.
Trade tensions between the U.S. and China presented risks to economic continuity and market sentiment during the period. Negotiations appeared to deteriorate throughout May, but not to a point that we believed would trigger an imminent recession or require acute monetary accommodation. The impasse appeared to thaw at the end of June, as President Trump resumed trade talks with Chinese President Xi Jinping at the G20 summit in Osaka, Japan. Our baseline view was for trade agreements to be reached in the second half of 2019, though the tail risks for“no-deal” scenarios and ongoing tariff tensions remained elevated.
Sovereign bond yields around the world declined during thesix-month period, with the yield on the10-year U.S. Treasury (UST) note finishing 0.68% lower at 2.01%, its lowest level since November 2016, and the yield on the10-year German bund dropping 0.57% to finish at 0.33%, its lowest level on record. The UST yield curve inverted with the spread between three-month and10-year USTs reaching a low of-0.25% in early June, its lowest level since 2007. In our view, markets were overvaluing longer-term USTs during the period and overstating the probabilities for a near-term contraction in the U.S. economy. The probability for slower growth in the second half of 2019 increased during the period, but the likelihood for a recession still remained quite low, in our assessment.
On the whole, duration and credit exposures around the world rallied during the period. Additionally, a number of global currencies appreciated against a weakened U.S. dollar, with some notable exceptions including the euro, the Australian dollar, the Argentine peso and the Ghanaian cedi. Overall, long-duration exposures and select currency exposures across global fixed income markets were key drivers of investment returns during the period.
Investment Strategy
We invest selectively in bonds around the world based upon our assessment of changing market, political and economic conditions. While seeking opportunities, we monitor various factors including changes in interest rates, currency exchange rates and credit risks. We seek to manage the Fund’s exposure to various currencies and regularly utilize currency and cross currency forward contracts and may also use currency and currency index futures contracts and other derivative instruments.
Currency Composition*
6/30/19
| | | | |
| |
| | | % of Total
Net Assets | |
| |
Americas | | | 128.4% | |
| |
| |
U.S. Dollar | | | 93.1% | |
|
| |
| |
Mexican Peso | | | 17.9% | |
|
| |
| |
Brazilian Real | | | 12.1% | |
|
| |
| |
Argentine Peso | | | 3.7% | |
|
| |
| |
Colombian Peso | | | 1.6% | |
|
| |
| |
Canadian Dollar | | | 0.0% | ** |
|
| |
| |
Asia Pacific | | | 10.6% | |
|
| |
| |
Japanese Yen | | | 16.9% | |
|
| |
| |
Indonesian Rupiah | | | 4.1% | |
|
| |
| |
Philippine Peso | | | 0.7% | |
|
| |
| |
Indian Rupee | | | 0.2% | |
|
| |
| |
South Korean Won | | | 0.0% | ** |
|
| |
| |
New Zealand Dollar | | | 0.0% | ** |
|
| |
| |
Australian Dollar | | | -11.3% | |
|
| |
| |
Middle East & Africa | | | 1.4% | |
|
| |
| |
Ghanaian Cedi | | | 1.4% | |
|
| |
| |
Europe | | | -40.4% | |
|
| |
| |
Polish Zloty | | | 0.0% | ** |
|
| |
| |
Euro | | | -40.4% | |
| |
*Figures represent the net Fund exposure and include certain derivatives held in the portfolio (or their underlying reference assets) and may not total 100% or may be negative due to rounding, use of any derivatives or other factors.
**Rounds to less than 0.1%.
|
What is a currency forward contract? A currency forward contract is an agreement between the Fund and a counterparty to buy or sell a foreign currency in exchange for another currency at a specific exchange rate on a future date. Currency forward contracts are privately traded in the interbank market, not on a centralized exchange. |
|
What is a futures contract? A futures contract is an agreement between the Fund and a counterparty made through a U.S. or foreign futures exchange to buy or sell an underlying instrument or asset at a specific price on a future date. |
Manager’s Discussion
During the period, we held duration exposures in select local-currency markets, notably including Brazil, Colombia, India and Indonesia. We held short-term local-currency bonds in Mexico, Argentina and South Korea. We also continued to hold anet-negative position in the euro, through
TEMPLETON GLOBAL BOND VIP FUND
currency forward contracts, as a macro hedge against a broadly strengthening U.S. dollar and as a directional view on the currency. We expected the euro to weaken based on rate differentials and growth divergence between Europe and the U.S. The ECB has shifted back toward ongoing stimulus with intentions to not raise rates above the 0% main refinancing rate through at least the first half of 2020. Our short euro position was also designed to hedge against eurosceptic political risks and unresolved structural risks across Europe. We also continued to holdnet-negative positioning in the Australian dollar, also through currency forward contracts, based on the Reserve Bank of Australia’s (RBA’s) continued rate accommodation, and as a partial hedge against potential trade risks and tail risks associated with China’s economy. The short Australian dollar position is intended to hedge broad-based beta risk across emerging markets. In May, we closed ournet-negative position in the Japanese yen, formerly achieved through currency forward contracts, and transitioned toward a positive exposure to the yen, as our expectations shifted to a positive outlook for yen strength. We continued to hedge our exposures to the Indian rupee and South Korean won but maintained our positions in the local-currency bonds. In credit markets, we continued to see areas of value in some specific sovereign credits. However, we largely preferred the risk-adjusted returns in specific areas of the local-currency bond markets over the more fully valued credit markets. We remained positioned for rising yields by maintaining low overall portfolio duration and holding negative duration exposure to USTs through interest-rate swaps.
|
What is duration? Duration is a measure of a bond’s price sensitivity to interest-rate changes. In general, a portfolio of securities with a lower duration can be expected to be less sensitive to interest-rate changes than a portfolio with a higher duration. |
|
What is an interest-rate swap? An interest-rate swap is an agreement between two parties to exchange interest-rate payment obligations, generally one based on an interest rate fixed to maturity and the other based on an interest rate that changes in accordance with changes in a designated benchmark (for example, LIBOR, prime, commercial paper or other benchmarks). |
During the period, the strategy’s positive absolute performance was primarily attributable to currency positions. Interest-rate strategies detracted from absolute performance, while sovereign credit exposures had a largely neutral effect. Among currencies, the Fund’snet-negative positions in the
euro and the Japanese yen contributed to absolute performance. Its position in the Mexican peso also contributed to absolute results, while its position in the Argentine peso detracted. The Fund maintained a defensive approach regarding interest rates in developed markets, while holding duration exposures in select emerging markets. Negative duration exposure to USTs detracted from absolute performance. However, duration exposure in Brazil contributed to absolute results.
The strategy’s relative underperformance during the period was primarily due to interest-rate strategies. Currency positions contributed to relative results while sovereign credit exposures had a largely neutral effect. Underweighted duration exposure in the U.S. detracted from relative performance, as did select underweighted duration exposures in Europe and Japan. However, overweighted duration exposure in Brazil contributed to relative results. Among currencies, the Fund’s underweighted positions in the euro and the Japanese yen contributed to relative results. Its overweighted position in the Mexican peso also contributed to relative performance, while its overweighted position in the Argentine peso detracted.
Thank you for your participation in Templeton Global Bond VIP Fund. We look forward to serving your future investment needs.
The foregoing information reflects our analysis, opinions and portfolio holdings as of June 30, 2019, the end of the reporting period. The way we implement our main investment strategies and the resulting portfolio holdings may change depending on factors such as market and economic conditions. These opinions may not be relied upon as investment advice or an offer for a particular security. The information is not a complete analysis of every aspect of any market, country, industry, security or the Fund. Statements of fact are from sources considered reliable, but the investment manager makes no representation or warranty as to their completeness or accuracy. Although historical performance is no guarantee of future results, these insights may help you understand our investment management philosophy.
TEMPLETON GLOBAL BOND VIP FUND
Class 2 Fund Expenses
As an investor in a variable insurance contract (Contract) that indirectly provides for investment in an underlying mutual fund, you can incur transaction and/or ongoing expenses at both the Fund level and the Contract Level: (1) transaction expenses can include sales charges (loads) on purchases, surrender fees, transfer fees and premium taxes; and (2) ongoing expenses can include management fees, distribution and service(12b-1) fees, contract fees, annual maintenance fees, mortality and expense risk fees and other fees and expenses. All mutual funds and Contracts have some types of ongoing expenses. The table below shows Fund-level ongoing expenses and can help you understand these costs and compare them with those of other mutual funds offered through the Contract. The table assumes a $1,000 investment held for the six months indicated. Please refer to the Fund prospectus for additional information on operating expenses.
Actual Fund Expenses
The table below provides information about the actual account values and actual expenses in the columns under the heading “Actual.” In these columns the Fund’s actual return, which includes the effect of ongoing Fund expenses but does not include the effect of ongoing Contract expenses, is used to calculate the “Ending Account Value.” You can estimate the Fund-level expenses you paid during the period by following these steps (of course, your account value and expenses will differ from those in this illustration): Divide your account value by $1,000 (if your account had an $8,600 value, then $8,600÷ $1,000 =8.6). Then multiply the result by the number under the headings “Actual” and “Fund-Level Expenses Paid During Period” (if Fund-Level Expenses Paid During Period were $ 7.50, then 8.6 x $ 7.50 = $64.50). In this illustration, the estimated expenses paid this period at the Fund level are $64.50.
Hypothetical Example for Comparison with Other Mutual Funds
Under the heading “Hypothetical” in the table, information is provided about hypothetical account values and hypothetical expenses based on the Fund’s actual expense ratio and an assumed rate of return of 5% per year before expenses, which is not the Fund’s actual return. This information may not be used to estimate the actual ending account balance or expenses you paid for the period, but it can help you compare ongoing costs of investing in the Fund with those of other mutual funds offered through the Contract. To do so, compare this 5% hypothetical example with the 5% hypothetical examples that appear in the shareholder reports of other funds offered through the Contract.
Please note that expenses shown in the table are meant to highlight ongoing costs at the Fund level only and do not reflect any ongoing expenses at the Contract level, or transaction expenses at either the Fund or Contract levels. In addition, while the Fund does not have transaction expenses, if the transaction and ongoing expenses at the Contract level were included, the expenses shown below would be higher. You should consult your Contract prospectus or disclosure document for more information.
| | | | | | | | | | | | |
| | | | | Actual
(actual return after expenses) | | Hypothetical
(5% annual return before expenses) | | |
Share Class | | Beginning
Account
Value 1/1/19 | | Ending
Account
Value 6/30/19 | | Fund-Level
Expenses
Paid During
Period
1/1/19–6/30/191,2 | | Ending Account Value 6/30/19 | | Fund-Level
Expenses
Paid During Period 1/1/19–6/30/191,2 | | Net
Annualized
Expense
Ratio2 |
| | | | | | |
Class 2 | | $1,000 | | $1,031.00 | | $3.53 | | $1,021.32 | | $3.51 | | 0.70% |
1. Expenses are equal to the annualized expense ratio for thesix-month period as indicated above—in the far right column—multiplied by the simple average account value over the period indicated, and then multiplied by 181/365 to reflect theone-half year period.
2. Reflects expenses after fee waivers and expense reimbursements. Does not include any ongoing expenses of the Contract for which the Fund is an investment option or acquired fund fees and expenses.
FRANKLIN TEMPLETON VARIABLE INSURANCE PRODUCTS TRUST
Financial Highlights
Templeton Global Bond VIP Fund
| | | | | | | | | | | | | | | | | | | | | | | | |
| | |
| | | Six Months Ended
June 30, 2019 (unaudited) | | | Year Ended December 31, | |
| | | 2018 | | | 2017 | | | 2016 | | | 2015 | | | 2014 | |
| |
| | | | | | |
| Class 1 | | | | | | | | | | | | | | | | | | | | | | | | |
| | | | | | |
Per share operating performance
(for a share outstanding throughout the period) | | | | | | | | | | | | | | | | | | | | | | | | |
| | | | | | |
Net asset value, beginning of period | | | $17.54 | | | | $17.17 | | | | $16.85 | | | | $16.34 | | | | $18.56 | | | | $19.15 | |
| | | | |
| | | | | | |
| Income from investment operationsa: | | | | | | | | | | | | | | | | | | | | | | | | |
| | | | | | |
Net investment incomeb | | | 0.52 | | | | 0.88 | | | | 0.83 | | | | 0.62 | | | | 0.52 | | | | 0.58 | |
| | | | | | |
Net realized and unrealized gains (losses) | | | 0.05 | | | | (0.51 | ) | | | (0.46 | ) | | | (0.10 | ) | | | (1.22 | ) | | | (0.16) | |
| | | | |
| | | | | | |
Total from investment operations | | | 0.57 | | | | 0.37 | | | | 0.37 | | | | 0.52 | | | | (0.70 | ) | | | 0.42 | |
| | | | |
| | | | | | |
Less distributions from: | | | | | | | | | | | | | | | | | | | | | | | | |
| | | | | | |
Net investment income and net foreign currency gains | | | (1.26 | ) | | | — | | | | — | | | | — | | | | (1.43 | ) | | | (1.01) | |
| | | | | | |
Net realized gains | | | — | | | | — | | | | (0.05 | ) | | | (0.01 | ) | | | (0.09 | ) | | | — | |
| | | | |
| | | | | | |
Total distributions | | | (1.26 | ) | | | — | | | | (0.05 | ) | | | (0.01 | ) | | | (1.52 | ) | | | (1.01) | |
| | | | |
| | | | | | |
Redemption fees. | | | — | | | | — | | | | — | | | | — | | | | — | | | | —C | |
| | | | |
| | | | | | |
Net asset value, end of period | | | $16.85 | | | | $17.54 | | | | $17.17 | | | | $16.85 | | | | $16.34 | | | | $18.56 | |
| | | | |
| | | | | | |
Total returnd | | | 3.24% | | | | 2.15% | | | | 2.15% | | | | 3.21% | | | | (4.10)% | | | | 2.12% | |
| | | | | | |
| Ratios to average net assetse | | | | | | | | | | | | | | | | | | | | | | | | |
| | | | | | |
Expenses before waiver and payments by affiliates and expense reduction | | | 0.53% | | | | 0.56% | | | | 0.53% | | | | 0.53% | | | | 0.52% | | | | 0.51% | |
| | | | | | |
Expenses net of waiver and payments by affiliates | | | 0.45% | | | | 0.47% | | | | 0.46% | | | | 0.48% | | | | 0.52%f | | | | 0.51% | |
| | | | | | |
Expenses net of waiver and payments by affiliates and expense reduction | | | 0.45% | g | | | 0.45% | | | | 0.46% | g | | | 0.48%g | | | | 0.52% | f,g | | | 0.51% | g |
| | | | | | |
Net investment income | | | 5.81% | | | | 5.09% | | | | 4.81% | | | | 3.88% | | | | 2.99% | | | | 3.08% | |
| | | | | | |
| Supplemental data | | | | | | | | | | | | | | | | | | | | | | | | |
| | | | | | |
Net assets, end of period (000’s) | | | $322,895 | | | | $285,046 | | | | $286,502 | | | | $241,792 | | | | $292,802 | | | | $323,491 | |
| | | | | | |
Portfolio turnover rate | | | 12.95% | | | | 18.22% | | | | 37.97% | | | | 59.00% | | | | 51.58% | | | | 39.14% | |
aThe amount shown for a share outstanding throughout the period may not correlate with the Statement of Operations for the period due to the timing of sales and repurchases of the Fund’s shares in relation to income earned, adjustments to interest income for the inflation-indexed bonds, and/or fluctuating fair value of the investments of the Fund.
bBased on average daily shares outstanding.
cAmount rounds to less than $0.01 per share.
dTotal return does not include fees, charges or expenses imposed by the variable annuity and life insurance contracts for which Franklin Templeton Variable Insurance Products Trust serves as an underlying investment vehicle. Total return is not annualized for periods less than one year.
eRatios are annualized for periods less than one year.
fBenefit of waiver and payments by affiliates rounds to less than 0.01%.
gBenefit of expense reduction rounds to less than 0.01%.
| | | | |
| | |
TGB-6 | | Semiannual Report | The accompanying notes are an integral part of these financial statements. |
FRANKLIN TEMPLETON VARIABLE INSURANCE PRODUCTS TRUST
FINANCIAL HIGHLIGHTS
Templeton Global Bond VIP Fund(continued)
| | | | | | | | | | | | | | | | | | | | | | | | |
| | |
| | | Six Months Ended
June 30, 2019 (unaudited) | | | Year Ended December 31, | |
| | | 2018 | | | 2017 | | | 2016 | | | 2015 | | | 2014 | |
| |
| | | | | | |
| Class 2 | | | | | | | | | | | | | | | | | | | | | | | | |
| | | | | | |
Per share operating performance
(for a share outstanding throughout the period) | | | | | | | | | | | | | | | | | | | | | | | | |
| | | | | | |
Net asset value, beginning of period | | | $16.83 | | | | $16.51 | | | | $16.25 | | | | $15.80 | | | | $17.99 | | | | $18.60 | |
| | | | |
| | | | | | |
| Income from investment operationsa: | | | | | | | | | | | | | | | | | | | | | | | | |
| | | | | | |
Net investment incomeb | | | 0.47 | | | | 0.81 | | | | 0.76 | | | | 0.56 | | | | 0.46 | | | | 0.52 | |
| | | | | | |
Net realized and unrealized gains (losses) | | | 0.05 | | | | (0.49 | ) | | | (0.45 | ) | | | (0.10 | ) | | | (1.17 | ) | | | (0.17) | |
| | | | |
| | | | | | |
Total from investment operations | | | 0.52 | | | | 0.32 | | | | 0.31 | | | | 0.46 | | | | (0.71 | ) | | | 0.35 | |
| | | | |
| | | | | | |
Less distributions from: | | | | | | | | | | | | | | | | | | | | | | | | |
| | | | | | |
Net investment income and net foreign currency gains | | | (1.21 | ) | | | — | | | | — | | | | — | | | | (1.39 | ) | | | (0.96) | |
| | | | | | |
Net realized gains | | | — | | | | — | | | | (0.05 | ) | | | (0.01 | ) | | | (0.09 | ) | | | — | |
| | | | |
| | | | | | |
Total distributions | | | (1.21 | ) | | | — | | | | (0.05 | ) | | | (0.01 | ) | | | (1.48 | ) | | | (0.96 | ) |
| | | | |
| | | | | | |
Redemption fees | | | — | | | | — | | | | — | | | | — | | | | — | | | | — | c |
| | | | |
| | | | | | |
Net asset value, end of period | | | $16.14 | | | | $16.83 | | | | $16.51 | | | | $16.25 | | | | $15.80 | | | | $17.99 | |
| | | | |
| | | | | | |
Total returnd | | | 3.10% | | | | 1.94% | | | | 1.93% | | | | 2.94% | | | | (4.30)% | | | | 1.83% | |
| | | | | | |
| Ratios to average net assetse | | | | | | | | | | | | | | | | | | | | | | | | |
| | | | | | |
Expenses before waiver and payments by affiliates and expense reduction | | | 0.78% | | | | 0.81% | | | | 0.78% | | | | 0.78% | | | | 0.77% | | | | 0.76% | |
| | | | | | |
Expenses net of waiver and payments by affiliates | | | 0.70% | | | | 0.72% | | | | 0.71% | | | | 0.73% | | | | 0.77% | f | | | 0.76% | |
| | | | | | |
Expenses net of waiver and payments by affiliates and expense reduction | | | 0.70% | g | | | 0.70% | | | | 0.71% | g | | | 0.73% | g | | | 0.77% | f,g | | | 0.76% | g |
| | | | | | |
Net investment income | | | 5.56% | | | | 4.84% | | | | 4.56% | | | | 3.63% | | | | 2.74% | | | | 2.83% | |
| | | | | | |
| Supplemental data | | | | | | | | | | | | | | | | | | | | | | | | |
| | | | | | |
Net assets, end of period (000’s) | | | $2,506,399 | | | | $2,544,900 | | | | $2,730,081 | | | | $2,812,535 | | | | $2,971,667 | | | | $3,177,638 | |
| | | | | | |
Portfolio turnover rate | | | 12.95% | | | | 18.22% | | | | 37.97% | | | | 59.00% | | | | 51.58% | | | | 39.14% | |
aThe amount shown for a share outstanding throughout the period may not correlate with the Statement of Operations for the period due to the timing of sales and repurchases of the Fund’s shares in relation to income earned, adjustments to interest income for the inflation-indexed bonds, and/or fluctuating fair value of the investments of the Fund.
bBased on average daily shares outstanding.
cAmount rounds to less than $0.01 per share.
dTotal return does not include fees, charges or expenses imposed by the variable annuity and life insurance contracts for which Franklin Templeton Variable Insurance Products Trust serves as an underlying investment vehicle. Total return is not annualized for periods less than one year.
eRatios are annualized for periods less than one year.
fBenefit of waiver and payments by affiliates rounds to less than 0.01%.
gBenefit of expense reduction rounds to less than 0.01%.
| | | | | | |
| | | |
| | The accompanying notes are an integral part of these financial statements. | Semiannual Report | | | TBG-7 | |
FRANKLIN TEMPLETON VARIABLE INSURANCE PRODUCTS TRUST
FINANCIAL HIGHLIGHTS
Templeton Global Bond VIP Fund(continued)
| | | | | | | | | | | | | | | | | | | | | | | | |
| | |
| | | Six Months Ended
June 30, 2019 (unaudited) | | | Year Ended December 31, | |
| | | 2018 | | | 2017 | | | 2016 | | | 2015 | | | 2014 | |
| |
| | | | | | |
Class 4 | | | | | | | | | | | | | | | | | | | | | | | | |
| | | | | | |
Per share operating performance
(for a share outstanding throughout the period) | | | | | | | | | | | | | | | | | | | | | | | | |
| | | | | | |
Net asset value, beginning of period | | | $17.19 | | | | $16.88 | | | | $16.62 | | | | $16.18 | | | | $18.38 | | | | $18.97 | |
| | | | |
| | | | | | |
| Income from investment operationsa: | | | | | | | | | | | | | | | | | | | | | | | | |
| | | | | | |
Net investment incomeb | | | 0.47 | | | | 0.81 | | | | 0.76 | | | | 0.56 | | | | 0.46 | | | | 0.51 | |
| | | | | | |
Net realized and unrealized gains (losses) | | | 0.05 | | | | (0.50 | ) | | | (0.45 | ) | | | (0.11 | ) | | | (1.21 | ) | | | (0.18) | |
| | | | |
| | | | | | |
Total from investment operations | | | 0.52 | | | | 0.31 | | | | 0.31 | | | | 0.45 | | | | (0.75 | ) | | | 0.33 | |
| | | | |
| | | | | | |
Less distributions from: | | | | | | | | | | | | | | | | | | | | | | | | |
| | | | | | |
Net investment income and net foreign currency gains | | | (1.19 | ) | | | — | | | | — | | | | — | | | | (1.36 | ) | | | (0.92) | |
| | | | |
| | | | | | |
Net realized gains | | | — | | | | — | | | | (0.05 | ) | | | (0.01 | ) | | | (0.09 | ) | | | — | |
| | | | |
| | | | | | |
Total distributions | | | (1.19 | ) | | | — | | | | (0.05 | ) | | | (0.01 | ) | | | (1.45 | ) | | | (0.92) | |
| | | | |
| | | | | | |
Redemption fees. | | | — | | | | — | | | | — | | | | — | | | | — | | | | — | c |
| | | | |
| | | | | | |
Net asset value, end of period | | | $16.52 | | | | $17.19 | | | | $16.88 | | | | $16.62 | | | | $16.18 | | | | $18.38 | |
| | | | |
| | | | | | |
Total returnd | | | 3.04% | | | | 1.84% | | | | 1.76% | | | | 2.87% | | | | (4.39)% | | | | 1.69% | |
| | | | | | |
| Ratios to average net assetse | | | | | | | | | | | | | | | | | | | | | | | | |
| | | | | | |
Expenses before waiver and payments by affiliates and expense reduction | | | 0.88% | | | | 0.91% | | | | 0.88% | | | | 0.88% | | | | 0.87% | | | | 0.86% | |
| | | | | | |
Expenses net of waiver and payments by affiliates | | | 0.80% | | | | 0.82% | | | | 0.81% | | | | 0.83% | | | | 0.87% | f | | | 0.86% | |
| | | | | | |
Expenses net of waiver and payments by affiliates and expense reduction | | | 0.80% | g | | | 0.80% | | | | 0.81% | g | | | 0.83% | g | | | 0.87%f | ,g | | | 0.86% | g |
| | | | | | |
Net investment income | | | 5.46% | | | | 4.74% | | | | 4.46% | | | | 3.53% | | | | 2.64% | | | | 2.73% | |
| | | | | | |
Supplemental data | | | | | | | | | | | | | | | | | | | | | | | | |
| | | | | | |
Net assets, end of period (000’s) | | | $92,416 | | | | $94,312 | | | | $98,934 | | | | $96,798 | | | | $103,045 | | | | $111,199 | |
| | | | | | |
Portfolio turnover rate | | | 12.95% | | | | 18.22% | | | | 37.97% | | | | 59.00% | | | | 51.58% | | | | 39.14% | |
aThe amount shown for a share outstanding throughout the period may not correlate with the Statement of Operations for the period due to the timing of sales and repurchases of the Fund’s shares in relation to income earned, adjustments to interest income for the inflation-indexed bonds, and/or fluctuating fair value of the investments of the Fund.
bBased on average daily shares outstanding.
cAmount rounds to less than $0.01 per share.
dTotal return does not include fees, charges or expenses imposed by the variable annuity and life insurance contracts for which Franklin Templeton Variable Insurance Products Trust serves as an underlying investment vehicle. Total return is not annualized for periods less than one year.
eRatios are annualized for periods less than one year.
fBenefit of waiver and payments by affiliates rounds to less than 0.01%.
gBenefit of expense reduction rounds to less than 0.01%.
| | | | |
| | |
TGB-8 | | Semiannual Report | The accompanying notes are an integral part of these financial statements. |
FRANKLIN TEMPLETON VARIABLE INSURANCE PRODUCTS TRUST
Statement of Investments, June 30, 2019 (unaudited)
Templeton Global Bond VIP Fund
| | | | | | | | | | | | |
| | |
| Principal
Amount |
* | | | | | | | Value | |
Foreign Government and Agency Securities 47.3% | | | | | | | | | | | | |
Argentina 2.4% | | | | | | | | | | | | |
Argentina Treasury Bill, | | | | | | | | | | | | |
Strip, 4/30/20 | | | 207,735,000 | | | | ARS | | | $ | 5,558,300 | |
Strip, 7/31/20 | | | 48,339,000 | | | | ARS | | | | 1,101,897 | |
Argentine Bonos del Tesoro, | | | | | | | | | | | | |
18.20%, 10/03/21 | | | 820,823,000 | | | | ARS | | | | 13,129,701 | |
16.00%, 10/17/23 | | | 844,288,000 | | | | ARS | | | | 14,301,850 | |
senior note, 15.50%, 10/17/26 | | | 1,668,306,000 | | | | ARS | | | | 27,487,318 | |
Government of Argentina, | | | | | | | | | | | | |
aFRN, 68.466%, (ARPP7DRR), 6/21/20 | | | 10,990,000 | | | | ARS | | | | 252,144 | |
aFRN, 52.006%, (ARS Badlar + 2.00%), 4/03/22 | | | 24,036,000 | | | | ARS | | | | 486,090 | |
bIndex Linked, 4.00%, 3/06/20 | | | 4,138,000 | | | | ARS | | | | 133,534 | |
senior note, 4.50%, 2/13/20 | | | 9,351,000 | | | | | | | | 8,088,615 | |
| | | | | | | | | | | | |
| | | |
| | | | | | | | | | | 70,539,449 | |
| | | | | | | | | | | | |
Brazil 10.3% | | | | | | | | | | | | |
Letra Tesouro Nacional, | | | | | | | | | | | | |
Strip, 7/01/19 | | | 102,840c | | | | BRL | | | | 26,746,771 | |
Strip, 7/01/20 | | | 118,041c | | | | BRL | | | | 29,011,063 | |
Strip, 7/01/21 | | | 24,360c | | | | BRL | | | | 5,631,006 | |
Nota do Tesouro Nacional, | | | | | | | | | | | | |
10.00%, 1/01/21 | | | 38,520c | | | | BRL | | | | 10,576,145 | |
10.00%, 1/01/23 | | | 522,145c | | | | BRL | | | | 149,421,694 | |
10.00%, 1/01/25 | | | 69,029c | | | | BRL | | | | 20,277,628 | |
10.00%, 1/01/27 | | | 194,573c | | | | BRL | | | | 58,114,855 | |
| | | | | | | | | | | | |
| | | |
| | | | | | | | | | | 299,779,162 | |
| | | | | | | | | | | | |
Colombia 1.6% | | | | | | | | | | | | |
Government of Colombia, | | | | | | | | | | | | |
senior bond, 7.75%, 4/14/21 | | | 2,386,000,000 | | | | COP | | | | 777,177 | |
senior bond, 4.375%, 3/21/23 | | | 362,000,000 | | | | COP | | | | 109,464 | |
senior bond, 9.85%, 6/28/27 | | | 576,000,000 | | | | COP | | | | 226,226 | |
Titulos de Tesoreria, | | | | | | | | | | | | |
senior bond, B, 11.00%, 7/24/20 | | | 9,167,000,000 | | | | COP | | | | 3,048,135 | |
senior bond, B, 7.00%, 5/04/22 | | | 10,237,000,000 | | | | COP | | | | 3,361,594 | |
senior bond, B, 10.00%, 7/24/24 | | | 40,977,000,000 | | | | COP | | | | 15,439,515 | |
senior bond, B, 7.50%, 8/26/26 | | | 35,134,200,000 | | | | COP | | | | 12,115,832 | |
senior bond, B, 6.00%, 4/28/28 | | | 29,113,600,000 | | | | COP | | | | 9,100,649 | |
senior note, B, 7.00%, 9/11/19 | | | 4,056,000,000 | | | | COP | | | | 1,268,860 | |
| | | | | | | | | | | | |
| | | |
| | | | | | | | | | | 45,447,452 | |
| | | | | | | | | | | | |
Ghana 1.4% | | | | | | | | | | | | |
Government of Ghana, | | | | | | | | | | | | |
24.75%, 3/01/21 | | | 690,000 | | | | GHS | | | | 136,680 | |
16.25%, 5/17/21 | | | 7,250,000 | | | | GHS | | | | 1,275,199 | |
24.50%, 6/21/21 | | | 80,000 | | | | GHS | | | | 15,977 | |
24.75%, 7/19/21 | | | 1,190,000 | | | | GHS | | | | 239,092 | |
18.75%, 1/24/22 | | | 26,840,000 | | | | GHS | | | | 4,872,819 | |
17.60%, 11/28/22 | | | 370,000 | | | | GHS | | | | 66,255 | |
FRANKLIN TEMPLETON VARIABLE INSURANCE PRODUCTS TRUST
STATEMENT OF INVESTMENTS (UNAUDITED)
Templeton Global Bond VIP Fund(continued)
| | | | | | | | | | | | |
| | |
| Principal
Amount |
* | | | | | | | Value | |
Foreign Government and Agency Securities(continued) | | | | | | | | | | | | |
Ghana(continued) | | | | | | | | | | | | |
Government of Ghana, (continued) | | | | | | | | | | | | |
19.75%, 3/25/24 | | | 26,840,000 | | | | GHS | | | $ | 5,012,541 | |
19.00%, 11/02/26 | | | 80,510,000 | | | | GHS | | | | 14,589,657 | |
senior bond, 19.75%, 3/15/32 | | | 80,510,000 | | | | GHS | | | | 14,670,390 | |
senior note, 21.50%, 3/09/20 | | | 1,270,000 | | | | GHS | | | | 238,727 | |
senior note, 18.50%, 6/01/20 | | | 500,000 | | | | GHS | | | | 91,843 | |
senior note, 18.25%, 9/21/20 | | | 480,000 | | | | GHS | | | | 87,844 | |
senior note, 16.50%, 3/22/21 | | | 1,730,000 | | | | GHS | | | | 306,376 | |
| | | | | | | | | | | | |
| | | |
| | | | | | | | | | | 41,603,400 | |
| | | | | | | | | | | | |
India 8.4% | | | | | | | | | | | | |
Government of India, | | | | | | | | | | | | |
senior bond, 8.20%, 2/15/22 | | | 500,000,000 | | | | INR | | | | 7,549,021 | |
senior bond, 8.35%, 5/14/22 | | | 212,700,000 | | | | INR | | | | 3,233,626 | |
senior bond, 8.08%, 8/02/22 | | | 1,783,000,000 | | | | INR | | | | 26,951,616 | |
senior bond, 8.13%, 9/21/22 | | | 28,000,000 | | | | INR | | | | 424,824 | |
senior bond, 9.15%, 11/14/24 | | | 2,409,000,000 | | | | INR | | | | 38,356,381 | |
senior note, 8.27%, 6/09/20 | | | 1,222,000,000 | | | | INR | | | | 18,064,244 | |
senior note, 7.80%, 4/11/21 | | | 1,980,300,000 | | | | INR | | | | 29,430,934 | |
senior note, 8.79%, 11/08/21 | | | 653,000,000 | | | | INR | | | | 9,950,508 | |
senior note, 8.15%, 6/11/22 | | | 1,621,000,000 | | | | INR | | | | 24,542,810 | |
senior note, 6.84%, 12/19/22 | | | 98,000,000 | | | | INR | | | | 1,432,534 | |
senior note, 7.16%, 5/20/23 | | | 133,700,000 | | | | INR | | | | 1,967,261 | |
senior note, 8.83%, 11/25/23 | | | 2,983,900,000 | | | | INR | | | | 46,706,799 | |
senior note, 7.68%, 12/15/23 | | | 1,376,000,000 | | | | INR | | | | 20,741,179 | |
senior note, 6.79%, 5/15/27 | | | 1,142,800,000 | | | | INR | | | | 16,360,789 | |
| | | | | | | | | | | | |
| | | |
| | | | | | | | | | | 245,712,526 | |
| | | | | | | | | | | | |
Indonesia 4.1% | | | | | | | | | | | | |
Government of Indonesia, | | | | | | | | | | | | |
senior bond, FR34, 12.80%, 6/15/21 | | | 324,406,000,000 | | | | IDR | | | | 25,564,426 | |
senior bond, FR35, 12.90%, 6/15/22 | | | 71,229,000,000 | | | | IDR | | | | 5,855,124 | |
senior bond, FR39, 11.75%, 8/15/23 | | | 5,491,000,000 | | | | IDR | | | | 455,313 | |
senior bond, FR40, 11.00%, 9/15/25 | | | 46,856,000,000 | | | | IDR | | | | 3,951,127 | |
senior bond, FR43, 10.25%, 7/15/22 | | | 147,832,000,000 | | | | IDR | | | | 11,451,421 | |
senior bond, FR44, 10.00%, 9/15/24 | | | 4,454,000,000 | | | | IDR | | | | 355,374 | |
senior bond, FR46, 9.50%, 7/15/23 | | | 226,780,000,000 | | | | IDR | | | | 17,495,487 | |
senior bond, FR47, 10.00%, 2/15/28 | | | 12,000,000 | | | | IDR | | | | 984 | |
senior bond, FR52, 10.50%, 8/15/30 | | | 6,960,000,000 | | | | IDR | | | | 600,252 | |
senior bond, FR59, 7.00%, 5/15/27 | | | 47,752,000,000 | | | | IDR | | | | 3,334,952 | |
senior bond, FR61, 7.00%, 5/15/22 | | | 244,849,000,000 | | | | IDR | | | | 17,460,500 | |
senior bond, FR63, 5.625%, 5/15/23 | | | 258,951,000,000 | | | | IDR | | | | 17,655,046 | |
senior bond, FR64, 6.125%, 5/15/28 | | | 37,000,000 | | | | IDR | | | | 2,424 | |
senior bond, FR70, 8.375%, 3/15/24 | | | 78,915,000,000 | | | | IDR | | | | 5,923,305 | |
senior bond, FR71, 9.00%, 3/15/29 | | | 51,222,000,000 | | | | IDR | | | | 4,012,194 | |
senior bond, FR73, 8.75%, 5/15/31 | | | 60,845,000,000 | | | | IDR | | | | 4,682,619 | |
| | | | | | | | | | | | |
| | | |
| | | | | | | | | | | 118,800,548 | |
| | | | | | | | | | | | |
FRANKLIN TEMPLETON VARIABLE INSURANCE PRODUCTS TRUST
STATEMENT OF INVESTMENTS (UNAUDITED)
Templeton Global Bond VIP Fund(continued)
| | | | | | | | | | | | | | | | |
| | | | | | |
| Principal
Amount |
* | | | | | | | Value | |
| | | | |
Foreign Government and Agency Securities(continued) | | | | | | | | | | | | | | | | |
Mexico 13.1% | | | | | | | | | | | | | | | | |
Government of Mexico, | | | | | | | | | | | | | | | | |
senior bond, M, 8.00%, 6/11/20 | | | | | | | 3,814,000d | | | | MXN | | | $ | 19,899,575 | |
senior bond, M, 6.50%, 6/10/21 | | | | | | | 18,568,200d | | | | MXN | | | | 94,938,684 | |
senior bond, M, 6.50%, 6/09/22 | | | | | | | 16,179,100d | | | | MXN | | | | 82,219,895 | |
senior bond, M, 8.00%, 12/07/23 | | | | | | | 41,600d | | | | MXN | | | | 221,479 | |
senior note, M, 5.00%, 12/11/19 | | | | | | | 18,742,300d | | | | MXN | | | | 96,281,699 | |
senior note, M, 7.25%, 12/09/21 | | | | | | | 17,097,500d | | | | MXN | | | | 88,702,869 | |
eMexican Udibonos, Index Linked, 2.50%, 12/10/20 | | | | | | | 381,661f | | | | MXN | | | | 1,963,943 | |
| | | | | | | | | | | | | | | | |
| | | | |
| | | | | | | | | | | | | | | 384,228,144 | |
| | | | | | | | | | | | | | | | |
Philippines 0.7% | | | | | | | | | | | | | | | | |
Government of the Philippines, senior note, 3.375%, 8/20/20 | | | | | | | 1,102,110,000 | | | | PHP | | | | 21,237,184 | |
| | | | | | | | | | | | | | | | |
South Korea 5.0% | | | | | | | | | | | | | | | | |
Korea Monetary Stabilization Bond, | | | | | | | | | | | | | | | | |
senior note, 2.06%, 12/02/19 | | | | | | | 91,389,000,000 | | | | KRW | | | | 79,158,429 | |
senior note, 2.14%, 6/02/20 | | | | | | | 14,858,000,000 | | | | KRW | | | | 12,912,156 | |
senior note, 2.05%, 10/05/20 | | | | | | | 31,280,000,000 | | | | KRW | | | | 27,206,900 | |
Korea Treasury Bond, | | | | | | | | | | | | | | | | |
senior note, 1.25%, 12/10/19 | | | | | | | 18,280,000,000 | | | | KRW | | | | 15,783,599 | |
senior note, 1.75%, 6/10/20 | | | | | | | 7,615,000,000 | | | | KRW | | | | 6,596,702 | |
senior note, 3.00%, 3/10/23 | | | | | | | 3,919,000,000 | | | | KRW | | | | 3,566,062 | |
| | | | | | | | | | | | | | | | |
| | | | |
| | | | | | | | | | | | | | | 145,223,848 | |
| | | | | | | | | | | | | | | | |
| | | | |
gSupranational 0.3% | | | | | | | | | | | | | | | | |
Inter-American Development Bank, senior bond, 7.50%, 12/05/24 | | | | | | | 200,000,000 | | | | MXN | | | | 10,375,132 | |
| | | | | | | | | | | | | | | | |
| | | | |
Total Foreign Government and Agency Securities
(Cost $1,523,195,112) | | | | | | | | | | | | | | | 1,382,946,845 | |
| | | | | | | | | | | | | | | | |
| | | | |
| | | Number of
Contracts | | | Notional Amount* | | | | | | | |
| | | | | | | | | | | | | | | | |
Options Purchased 0.4% | | | | | | | | | | | | | | | | |
Calls -Over-the-Counter | | | | | | | | | | | | | | | | |
Currency Options 0.3% | | | | | | | | | | | | | | | | |
AUD/JPY, Counterparty CITI, February Strike Price 82.35 JPY, Expires 2/12/20 | | | 1 | | | | 2,664,000 | | | | AUD | | | | 3,804 | |
AUD/JPY, Counterparty CITI, May Strike Price 84.00 JPY, Expires 5/06/20 | | | 1 | | | | 11,838,000 | | | | AUD | | | | 18,447 | |
AUD/JPY, Counterparty CITI, May Strike Price 86.63 JPY, Expires 5/06/20 | | | 1 | | | | 13,022,000 | | | | AUD | | | | 11,545 | |
AUD/JPY, Counterparty CITI, May Strike Price 85.50 JPY, Expires 5/07/20 | | | 1 | | | | 47,352,000 | | | | AUD | | | | 51,187 | |
AUD/JPY, Counterparty CITI, November Strike Price 84.33 JPY, Expires 11/12/20 | | | 1 | | | | 8,878,000 | | | | AUD | | | | 27,813 | |
AUD/USD, Counterparty HSBK, April Strike Price $0.77, Expires 4/30/20 | | | 1 | | | | 14,798,000 | | | | AUD | | | | 33,988 | |
AUD/USD, Counterparty HSBK, May Strike Price $0.77, Expires 5/04/20 | | | 1 | | | | 18,644,000 | | | | AUD | | | | 47,807 | |
AUD/USD, Counterparty HSBK, May Strike Price $0.77, Expires 5/07/20 | | | 1 | | | | 11,838,000 | | | | AUD | | | | 25,212 | |
USD/MXN, Counterparty CITI, November Strike Price 20.00 MXN, Expires 11/07/19 | | | 1 | | | | 11,701,000 | | | | | | | | 209,577 | |
USD/MXN, Counterparty CITI, December Strike Price 20.50 MXN, Expires 12/05/19 | | | 1 | | | | 36,196,000 | | | | | | | | 548,659 | |
USD/MXN, Counterparty CITI, May Strike Price 20.50 MXN, Expires 5/11/20 | | | 1 | | | | 65,528,000 | | | | | | | | 2,401,929 | |
FRANKLIN TEMPLETON VARIABLE INSURANCE PRODUCTS TRUST
STATEMENT OF INVESTMENTS (UNAUDITED)
Templeton Global Bond VIP Fund(continued)
| | | | | | | | | | | | | | | | |
| | | Number of
Contracts | | | Notional
Amount* | | | | | | Value | |
| | | | |
Options Purchased(continued) | | | | | | | | | | | | | | | | |
| | | | |
Calls -Over-the-Counter(continued) | | | | | | | | | | | | | | | | |
| | | | |
Currency Options(continued) | | | | | | | | | | | | | | | | |
| | | | |
USD/MXN, Counterparty CITI, May Strike Price 20.92 MXN, Expires 5/12/20 | | | 1 | | | | 39,005,000 | | | | | | | $ | 1,176,040 | |
USD/MXN, Counterparty CITI, May Strike Price 20.87 MXN, Expires 5/14/20 | | | 1 | | | | 43,998,000 | | | | | | | | 1,374,717 | |
USD/MXN, Counterparty JPHQ, November Strike Price 20.11 MXN, Expires 11/14/19 | | | 1 | | | | 21,999,000 | | | | | | | | 381,551 | |
USD/MXN, Counterparty JPHQ, November Strike Price 20.11 MXN, Expires 11/14/19 | | | 1 | | | | 21,999,000 | | | | | | | | 381,551 | |
USD/MXN, Counterparty JPHQ, November Strike Price 22.35 MXN, Expires 11/14/19 | | | 1 | | | | 21,999,000 | | | | | | | | 77,480 | |
USD/MXN, Counterparty JPHQ, May Strike Price 20.93 MXN, Expires 5/13/20 | | | 1 | | | | 25,142,000 | | | | | | | | 758,182 | |
| | | | | | | | | | | | | | | | |
| | | | |
| | | | | | | | | | | | | | | 7,529,489 | |
| | | | | | | | | | | | | | | | |
| | | | |
Puts -Over-the-Counter | | | | | | | | | | | | | | | | |
| | | | |
Currency Options 0.1% | | | | | | | | | | | | | | | | |
| | | | |
AUD/JPY, Counterparty CITI, May Strike Price 69.54 JPY, Expires 5/06/20 | | | 1 | | | | 9,470,000 | | | | AUD | | | | 72,251 | |
AUD/JPY, Counterparty CITI, May Strike Price 70.65 JPY, Expires 5/06/20 | | | 1 | | | | 5,919,000 | | | | AUD | | | | 54,096 | |
AUD/JPY, Counterparty CITI, May Strike Price 74.48 JPY, Expires 5/06/20 | | | 1 | | | | 43,800,000 | | | | AUD | | | | 753,385 | |
AUD/JPY, Counterparty CITI, May Strike Price 75.50 JPY, Expires 5/06/20 | | | 1 | | | | 17,757,000 | | | | AUD | | | | 335,695 | |
AUD/JPY, Counterparty CITI, May Strike Price 65.55 JPY, Expires 5/07/20 | | | 1 | | | | 23,676,000 | | | | AUD | | | | 96,675 | |
AUD/JPY, Counterparty CITI, May Strike Price 73.25 JPY, Expires 5/07/20 | | | 1 | | | | 23,676,000 | | | | AUD | | | | 333,085 | |
AUD/JPY, Counterparty CITI, November Strike Price 66.78 JPY, Expires 11/12/20 | | | 1 | | | | 4,439,000 | | | | AUD | | | | 41,180 | |
AUD/JPY, Counterparty CITI, November Strike Price 69.18 JPY, Expires 11/12/20 | | | 1 | | | | 2,664,000 | | | | AUD | | | | 33,331 | |
AUD/JPY, Counterparty CITI, November Strike Price 72.78 JPY, Expires 11/12/20 | | | 1 | | | | 11,098,000 | | | | AUD | | | | 219,342 | |
AUD/JPY, Counterparty CITI, November Strike Price 74.00 JPY, Expires 11/12/20 | | | 1 | | | | 7,990,000 | | | | AUD | | | | 184,416 | |
AUD/USD, Counterparty HSBK, April Strike Price $0.66, Expires 4/30/20 | | | 1 | | | | 39,460,000 | | | | AUD | | | | 174,060 | |
AUD/USD, Counterparty HSBK, April Strike Price $0.68, Expires 4/30/20 | | | 1 | | | | 19,730,000 | | | | AUD | | | | 151,389 | |
AUD/USD, Counterparty HSBK, May Strike Price $0.65, Expires 5/04/20 | | | 1 | | | | 49,720,000 | | | | AUD | | | | 130,006 | |
AUD/USD, Counterparty HSBK, May Strike Price $0.68, Expires 5/04/20 | | | 1 | | | | 24,662,000 | | | | AUD | | | | 173,877 | |
AUD/USD, Counterparty HSBK, May Strike Price $0.66, Expires 5/05/20 | | | 1 | | | | 19,730,000 | | | | AUD | | | | 106,752 | |
AUD/USD, Counterparty HSBK, May Strike Price $0.65, Expires 5/07/20 | | | 1 | | | | 23,676,000 | | | | AUD | | | | 97,157 | |
AUD/USD, Counterparty HSBK, May Strike Price $0.68, Expires 5/07/20 | | | 1 | | | | 11,838,000 | | | | AUD | | | | 86,446 | |
AUD/USD, Counterparty MSCO, November Strike Price $0.67, Expires 11/14/19 | | | 1 | | | | 43,000 | | | | AUD | | | | 122 | |
USD/MXN, Counterparty CITI, October Strike Price 18.25 MXN, Expires 10/08/19 | | | 1 | | | | 18,098,000 | | | | | | | | 45,136 | |
USD/MXN, Counterparty CITI, November Strike Price 18.28 MXN, Expires 11/07/19 | | | 1 | | | | 11,701,000 | | | | | | | | 40,544 | |
USD/MXN, Counterparty CITI, May Strike Price 18.31 MXN, Expires 5/14/20 | | | 1 | | | | 11,000,000 | | | | | | | | 90,706 | |
| | | | | | | | | | | | | | | | |
| | | | |
| | | | | | | | | | | | | | | 3,219,651 | |
| | | | | | | | | | | | | | | | |
| | | | |
Total Options Purchased | | | | | | | | | | | | | | | | |
(Cost $14,763,158) | | | | | | | | | | | | | | | 10,749,140 | |
| | | | | | | | | | | | | | | | |
| | | | |
Total Investments before Short Term Investments | | | | | | | | | | | | | | | | |
(Cost $1,537,958,270) | | | | | | | | | | | | | | | 1,393,695,985 | |
| | | | | | | | | | | | | | | | |
FRANKLIN TEMPLETON VARIABLE INSURANCE PRODUCTS TRUST
STATEMENT OF INVESTMENTS (UNAUDITED)
Templeton Global Bond VIP Fund(continued)
| | | | | | | | | | | | |
| |
| Principal
Amount |
* | | | | | | | Value | |
| |
| | | |
Short Term Investments 39.8% | | | | | | | | | | | | |
Foreign Government and Agency Securities 9.2% | | | | | | | | | | | | |
Argentina 1.5% | | | | | | | | | | | | |
hArgentina Treasury Bill, 7/19/19 - 2/28/20 | | | 1,467,087,600 | | | | ARS | | | $ | 43,469,653 | |
| | | | | | | | | | | | |
Mexico 4.4% | | | | | | | | | | | | |
hMexico Treasury Bill, | | | | | | | | | | | | |
7/04/19 | | | 199,789,187i | | | | MXN | | | | 103,869,279 | |
7/18/19 - 2/27/20 | | | 50,835,660i | | | | MXN | | | | 25,388,664 | |
| | | | | | | | | | | | |
| | | |
| | | | | | | | | | | 129,257,943 | |
| | | | | | | | | | | | |
South Korea 3.3% | | | | | | | | | | | | |
Korea Monetary Stabilization Bond,
senior note, 1.85%, 10/02/19 | | | 59,950,000,000 | | | | KRW | | | | 51,856,384 | |
senior note, 1.87%, 11/09/19 | | | 45,390,000,000 | | | | KRW | | | | 39,276,235 | |
senior note, 2.16%, 2/02/20 | | | 7,615,000,000 | | | | KRW | | | | 6,605,569 | |
| | | | | | | | | | | | |
| | | |
| | | | | | | | | | | 97,738,188 | |
| | | | | | | | | | | | |
| | | |
Total Foreign Government and Agency Securities
(Cost $278,628,187) | | | | | | | | | | | 270,465,784 | |
| | | | | | | | | | | | |
| | | |
U.S. Government and Agency Securities (Cost $51,743,504) 1.8% | | | | | | | | | | | | |
United States 1.8% | | | | | | | | | | | | |
hU.S. Treasury Bill, 7/18/19 - 12/05/19 | | | 52,062,000 | | | | | | | | 51,779,602 | |
| | | | | | | | | | | | |
| | | |
Total Investments before Money Market Funds
(Cost $1,868,329,961) | | | | | | | | | | | 1,715,941,371 | |
| | | | | | | | | | | | |
| | | |
| | | Shares | | | | | | | |
Money Market Funds (Cost $840,987,190) 28.8% | | | | | | | | | | | | |
United States 28.8% | | | | | | | | | | | | |
j,kInstitutional Fiduciary Trust Money Market Portfolio, 2.05% | | | 840,987,190 | | | | | | | | 840,987,190 | |
| | | | | | | | | | | | |
| | | |
Total Investments (Cost $2,709,317,151) 87.5% | | | | | | | | | | | 2,556,928,561 | |
Options Written (0.3)% | | | | | | | | | | | (8,140,326 | ) |
Other Assets, less Liabilities 12.8% | | | | | | | | | | | 372,921,281 | |
| | | | | | | | | | | | |
| | | |
Net Assets 100.0% | | | | | | | | | | $ | 2,921,709,516 | |
| | | | | | | | | | | | |
| | | | | | | | | | | | | | | | | | | | | | |
| | | Number of
Contracts | | | | | Notional
Amount* | | | | | | | | | | |
lOptions Written (0.3)% | | | | | | | | | | | | | | | | | | | | | | |
Calls -Over-the-Counter | | | | | | | | | | | | | | | | | | | | | | |
Currency Options (0.2)% | | | | | | | | | | | | | | | | | | | | | | |
AUD/JPY, Counterparty CITI, November Strike Price 79.77 JPY, Expires 11/06/19 | | | 1 | | | | | | 28,411,000 | | | | AUD | | | | | | | | (46,248 | ) |
AUD/JPY, Counterparty CITI, November Strike Price 80.15 JPY, Expires 11/06/19 | | | 1 | | | | | | 11,838,000 | | | | AUD | | | | | | | | (16,121 | ) |
AUD/JPY, Counterparty CITI, November Strike Price 80.60 JPY, Expires 11/08/19 | | | 1 | | | | | | 23,676,000 | | | | AUD | | | | | | | | (26,674 | ) |
AUD/JPY, Counterparty CITI, February Strike Price 77.28 JPY, Expires 2/12/20 | | | 1 | | | | | | 8,878,000 | | | | AUD | | | | | | | | (67,467 | ) |
FRANKLIN TEMPLETON VARIABLE INSURANCE PRODUCTS TRUST
STATEMENT OF INVESTMENTS (UNAUDITED)
Templeton Global Bond VIP Fund(continued)
| | | | | | | | | | | | | | | | | | | | | | |
| | | Number of
Contracts | | | | | Notional
Amount* | | | | | | | | | Value | |
| |
| | | | | | |
lOptions Written(continued) | | | | | | | | | | | | | | | | | | | | | | |
Calls -Over-the-Counter(continued) | | | | | | | | | | | | | | | | | | | | | | |
Currency Options(continued) | | | | | | | | | | | | | | | | | | | | | | |
AUD/JPY, Counterparty CITI, February Strike Price 78.18 JPY, Expires 2/12/20 | | | 1 | | | | | | 5,327,000 | | | | AUD | | | | | | | | $ (30,535) | |
AUD/JPY, Counterparty CITI, February Strike Price 79.45 JPY, Expires 2/12/20 | | | 1 | | | | | | 7,991,000 | | | | AUD | | | | | | | | (30,161 | ) |
AUD/JPY, Counterparty CITI, February Strike Price 80.32 JPY, Expires 2/12/20 | | | 1 | | | | | | 8,879,000 | | | | AUD | | | | | | | | (24,999 | ) |
AUD/JPY, Counterparty CITI, May Strike Price 78.60 JPY, Expires 5/06/20 | | | 1 | | | | | | 18,941,000 | | | | AUD | | | | | | | | (127,133 | ) |
AUD/JPY, Counterparty CITI, May Strike Price 79.10 JPY, Expires 5/06/20 | | | 1 | | | | | | 11,838,000 | | | | AUD | | | | | | | | (69,436 | ) |
AUD/JPY, Counterparty CITI, May Strike Price 77.35 JPY, Expires 5/07/20 | | | 1 | | | | | | 47,352,000 | | | | AUD | | | | | | | | (441,776 | ) |
AUD/USD, Counterparty HSBK, April Strike Price $0.71, Expires 4/30/20 | | | 1 | | | | | | 14,798,000 | | | | AUD | | | | | | | | (200,467 | ) |
AUD/USD, Counterparty HSBK, May Strike Price $0.71, Expires 5/04/20 | | | 1 | | | | | | 18,644,000 | | | | AUD | | | | | | | | (278,024 | ) |
AUD/USD, Counterparty HSBK, November Strike Price $0.71, Expires 11/05/20 | | | 1 | | | | | | 11,838,000 | | | | AUD | | | | | | | | (211,515 | ) |
AUD/USD, Counterparty HSBK, November Strike Price $0.80, Expires 11/05/20 | | | 1 | | | | | | 23,676,000 | | | | AUD | | | | | | | | (68,472 | ) |
AUD/USD, Counterparty HSBK, April Strike Price $0.81, Expires 4/29/21 | | | 1 | | | | | | 29,594,000 | | | | AUD | | | | | | | | (120,943 | ) |
AUD/USD, Counterparty HSBK, May Strike Price $0.80, Expires 5/04/21 | | | 1 | | | | | | 37,290,000 | | | | AUD | | | | | | | | (174,147 | ) |
AUD/USD, Counterparty HSBK, May Strike Price $0.78, Expires 5/05/21 | | | 1 | | | | | | 19,730,000 | | | | AUD | | | | | | | | (147,552 | ) |
AUD/USD, Counterparty MSCO, November Strike Price $0.72, Expires 11/14/19 | | | 1 | | | | | | 43,000 | | | | AUD | | | | | | | | (224 | ) |
USD/MXN, Counterparty CITI, December Strike Price 21.90 MXN, Expires 12/05/19 | | | 1 | | | | | | 36,196,000 | | | | | | | | | | | | (209,901 | ) |
USD/MXN, Counterparty CITI, May Strike Price 19.55 MXN, Expires 5/11/20 | | | 1 | | | | | | 21,843,000 | | | | | | | | | | | | (1,266,260 | ) |
USD/MXN, Counterparty CITI, May Strike Price 22.55 MXN, Expires 5/11/20 | | | 1 | | | | | | 21,843,000 | | | | | | | | | | | | (321,682 | ) |
USD/MXN, Counterparty CITI, May Strike Price 19.82 MXN, Expires 5/12/20 | | | 1 | | | | | | 15,602,000 | | | | | | | | | | | | (796,794 | ) |
USD/MXN, Counterparty CITI, May Strike Price 23.85 MXN, Expires 5/12/20 | | | 1 | | | | | | 15,602,000 | | | | | | | | | | | | (141,760 | ) |
USD/MXN, Counterparty CITI, May Strike Price 22.85 MXN, Expires 5/14/20 | | | 1 | | | | | | 21,999,000 | | | | | | | | | | | | (292,829 | ) |
USD/MXN, Counterparty JPHQ, November Strike Price 21.00 MXN, Expires 11/14/19 | | | 1 | | | | | | 43,999,000 | | | | | | | | | | | | (379,051 | ) |
USD/MXN, Counterparty JPHQ, May Strike Price 23.76 MXN, Expires 5/13/20 | | | 1 | | | | | | 12,571,000 | | | | | | | | | | | | (118,482 | ) |
| | | | | | | | | | | | | | | | | | | | | | |
| | | | | | |
| | | | | | | | | | | | | | | | | | | | | (5,608,653 | ) |
| | | | | | | | | | | | | | | | | | | | | | |
Puts -Over-the-Counter | | | | | | | | | | | | | | | | | | | | | | |
Currency Options (0.1)% | | | | | | | | | | | | | | | | | | | | | | |
USD/MXN, Counterparty CITI, October Strike Price 18.66 MXN, Expires 10/08/19 | | | 1 | | | | | | 18,098,000 | | | | | | | | | | | | (98,109 | ) |
USD/MXN, Counterparty CITI, October Strike Price 19.60 MXN, Expires 10/08/19 | | | 1 | | | | | | 13,574,000 | | | | | | | | | | | | (149,124 | ) |
USD/MXN, Counterparty CITI, November Strike Price 18.74 MXN, Expires 11/07/19 | | | 1 | | | | | | 23,403,000 | | | | | | | | | | | | (172,597 | ) |
USD/MXN, Counterparty CITI, May Strike Price 19.55 MXN, Expires 5/11/20 | | | 1 | | | | | | 21,843,000 | | | | | | | | | | | | (567,590 | ) |
USD/MXN, Counterparty CITI, May Strike Price 19.69 MXN, Expires 5/12/20 | | | 1 | | | | | | 7,801,000 | | | | | | | | | | | | (226,627 | ) |
USD/MXN, Counterparty CITI, May Strike Price 19.24 MXN, Expires 5/14/20 | | | 1 | | | | | | 32,999,000 | | | | | | | | | | | | (661,069 | ) |
USD/MXN, Counterparty JPHQ, November Strike Price 19.44 MXN, Expires 11/13/19 | | | 1 | | | | | | 12,571,000 | | | | | | | | | | | | (255,933 | ) |
USD/MXN, Counterparty JPHQ, November Strike Price 19.36 MXN, Expires 11/14/19 | | | 1 | | | | | | 21,999,000 | | | | | | | | | | | | (400,624 | ) |
| | | | | | | | | | | | | | | | | | | | | | |
| | | | | | |
| | | | | | | | | | | | | | | | | | | | | (2,531,673 | ) |
| | | | | | | | | | | | | | | | | | | | | | |
| | | | | | |
Total Options Written (Premiums received $11,159,153) | | | | | | | | | | | | | | | | | | | | | (8,140,326 | ) |
| | | | | | | | | | | | | | | | | | | | | | |
FRANKLIN TEMPLETON VARIABLE INSURANCE PRODUCTS TRUST
STATEMENT OF INVESTMENTS (UNAUDITED)
Templeton Global Bond VIP Fund(continued)
*The principal/notional amount is stated in U.S. dollars unless otherwise indicated.
aThe coupon rate shown represents the rate at period end.
bRedemption price at maturity and coupon payment are adjusted for inflation. See Note 1(e).
cPrincipal amount is stated in 1,000 Brazilian Real Units.
dPrincipal amount is stated in 100 Mexican Peso Units.
ePrincipal amount of security is adjusted for inflation. See Note 1(e).
fPrincipal amount is stated in 100 Unidad de Inversion Units.
gA supranational organization is an entity formed by two or more central governments through international treaties.
hThe security was issued on a discount basis with no stated coupon rate.
iPrincipal amount is stated in 10 Mexican Peso Units.
jSee Note 3(e) regarding investments in affiliated management investment companies.
kThe rate shown is the annualizedseven-day effective yield at period end.
lSee Note 1(c) regarding written options.
At June 30, 2019, the Fund had the following forward exchange contracts outstanding. See Note 1(c).
Forward Exchange Contracts
| | | | | | | | | | | | | | | | | | | | | | | | | | | | | | | | |
| | | | | | | | |
| Currency | | | Counterparty | a | | | Type | | | | Quantity | | |
| Contract
Amount |
* | | | | | |
| Settlement
Date |
| |
| Unrealized
Appreciation |
| |
| Unrealized
Depreciation |
|
|
| OTC Forward Exchange Contracts | |
Indian Rupee | | | BNDP | | | | Sell | | | | 845,797,600 | | | | 12,077,733 | | | | | | | | 7/05/19 | | | $ | — | | | $ | (177,687 | ) |
Indian Rupee | | | HSBK | | | | Buy | | | | 721,903,000 | | | | 10,474,507 | | | | | | | | 7/05/19 | | | | — | | | | (14,292 | ) |
Indian Rupee | | | HSBK | | | | Sell | | | | 721,903,000 | | | | 10,357,288 | | | | | | | | 7/05/19 | | | | — | | | | (102,926 | ) |
South Korean Won | | | HSBK | | | | Sell | | | | 42,561,000,000 | | | | 37,554,265 | | | | | | | | 7/10/19 | | | | 754,109 | | | | — | |
Indian Rupee | | | HSBK | | | | Sell | | | | 1,015,502,619 | | | | 14,411,235 | | | | | | | | 7/11/19 | | | | — | | | | (291,456 | ) |
Japanese Yen | | | DBAB | | | | Buy | | | | 770,370,000 | | | | 7,001,670 | | | | | | | | 7/11/19 | | | | 150,713 | | | | — | |
Japanese Yen | | | DBAB | | | | Sell | | | | 770,370,000 | | | | 6,983,144 | | | | | | | | 7/11/19 | | | | — | | | | (169,239 | ) |
Australian Dollar | | | JPHQ | | | | Sell | | | | 30,315,000 | | | | 21,688,564 | | | | | | | | 7/15/19 | | | | 395,900 | | | | — | |
Indian Rupee | | | CITI | | | | Sell | | | | 677,015,000 | | | | 9,586,120 | | | | | | | | 7/15/19 | | | | — | | | | (210,665 | ) |
Japanese Yen | | | CITI | | | | Buy | | | | 893,794,665 | | | | 8,138,457 | | | | | | | | 7/16/19 | | | | 163,159 | | | | — | |
Japanese Yen | | | CITI | | | | Sell | | | | 893,794,665 | | | | 8,077,975 | | | | | | | | 7/16/19 | | | | — | | | | (223,641 | ) |
Japanese Yen | | | DBAB | | | | Buy | | | | 1,825,131,000 | | | | 16,595,660 | | | | | | | | 7/17/19 | | | | 357,616 | | | | — | |
Japanese Yen | | | DBAB | | | | Sell | | | | 1,825,131,000 | | | | 16,407,147 | | | | | | | | 7/17/19 | | | | — | | | | (546,129 | ) |
Japanese Yen | | | GSCO | | | | Buy | | | | 568,759,434 | | | | 5,169,177 | | | | | | | | 7/17/19 | | | | 113,915 | | | | — | |
Japanese Yen | | | GSCO | | | | Sell | | | | 568,759,434 | | | | 5,112,444 | | | | | | | | 7/17/19 | | | | — | | | | (170,648 | ) |
Japanese Yen | | | HSBK | | | | Buy | | | | 536,380,000 | | | | 4,869,886 | | | | | | | | 7/17/19 | | | | 112,440 | | | | — | |
Japanese Yen | | | HSBK | | | | Sell | | | | 536,380,000 | | | | 4,823,583 | | | | | | | | 7/17/19 | | | | — | | | | (158,743 | ) |
Japanese Yen | | | MSCO | | | | Buy | | | | 300,000,000 | | | | 2,732,415 | | | | | | | | 7/17/19 | | | | 54,225 | | | | — | |
Japanese Yen | | | MSCO | | | | Sell | | | | 300,000,000 | | | | 2,697,890 | | | | | | | | 7/17/19 | | | | — | | | | (88,750 | ) |
Japanese Yen | | | CITI | | | | Buy | | | | 1,372,892,008 | | | | 12,488,114 | | | | | | | | 7/18/19 | | | | 265,424 | | | | — | |
Japanese Yen | | | CITI | | | | Sell | | | | 1,372,892,008 | | | | 12,346,162 | | | | | | | | 7/18/19 | | | | — | | | | (407,376 | ) |
Japanese Yen | | | HSBK | | | | Buy | | | | 1,245,390,000 | | | | 11,307,983 | | | | | | | | 7/18/19 | | | | 261,120 | | | | — | |
Japanese Yen | | | HSBK | | | | Sell | | | | 1,245,390,000 | | | | 11,199,581 | | | | | | | | 7/18/19 | | | | — | | | | (369,522 | ) |
Japanese Yen | | | JPHQ | | | | Buy | | | | 1,886,055,000 | | | | 17,143,219 | | | | | | | | 7/18/19 | | | | 377,368 | | | | — | |
Japanese Yen | | | JPHQ | | | | Sell | | | | 1,886,055,000 | | | | 16,962,787 | | | | | | | | 7/18/19 | | | | — | | | | (557,800 | ) |
South Korean Won | | | HSBK | | | | Sell | | | | 13,984,825,441 | | | | 12,358,890 | | | | | | | | 7/19/19 | | | | 263,874 | | | | — | |
Indian Rupee | | | HSBK | | | | Sell | | | | 833,252,000 | | | | 11,585,538 | | | | | | | | 7/22/19 | | | | — | | | | (460,898 | ) |
Indian Rupee | | | JPHQ | | | | Sell | | | | 1,087,029,000 | | | | 15,329,700 | | | | | | | | 7/22/19 | | | | — | | | | (385,625 | ) |
Japanese Yen | | | HSBK | | | | Buy | | | | 471,730,400 | | | | 4,284,563 | | | | | | | | 7/22/19 | | | | 98,998 | | | | — | |
Japanese Yen | | | HSBK | | | | Sell | | | | 471,730,400 | | | | 4,242,180 | | | | | | | | 7/22/19 | | | | — | | | | (141,381 | ) |
Euro | | | DBAB | | | | Sell | | | | 8,405,717 | | | | 9,574,279 | | | | | | | | 7/23/19 | | | | — | | | | (2,307 | ) |
FRANKLIN TEMPLETON VARIABLE INSURANCE PRODUCTS TRUST
STATEMENT OF INVESTMENTS (UNAUDITED)
Templeton Global Bond VIP Fund(continued)
Forward Exchange Contracts(continued)
| | | | | | | | | | | | | | | | | | | | | | | | | | | | | | | | |
| | | | | | | | |
| Currency | | | Counterparty | a | | | Type | | | | Quantity | | |
| Contract
Amount |
* | | | | | |
| Settlement
Date |
| |
| Unrealized
Appreciation |
| |
| Unrealized
Depreciation |
|
| | | | | |
| OTC Forward Exchange Contracts(continued) | | | | | | | | | | | | | | | | | | | | | |
South Korean Won | | | HSBK | | | | Sell | | | | 4,497,174,559 | | | | 4,034,426 | | | | | | | | 7/24/19 | | | $ | 144,412 | | | $ | — | |
South Korean Won | | | HSBK | | | | Sell | | | | 35,277,000,000 | | | | 29,624,622 | | | | | | | | 7/29/19 | | | | — | | | | (893,794 | ) |
South Korean Won | | | HSBK | | | | Sell | | | | 24,029,880,977 | | | | 20,944,723 | | | | | | | | 7/30/19 | | | | 155,831 | | | | — | |
Euro | | | BZWS | | | | Sell | | | | 22,495,166 | | | | 25,267,020 | | | | | | | | 7/31/19 | | | | — | | | | (378,723 | ) |
Japanese Yen | | | BZWS | | | | Buy | | | | 2,063,184,840 | | | | 18,810,434 | | | | | | | | 7/31/19 | | | | 375,119 | | | | — | |
Japanese Yen | | | BZWS | | | | Sell | | | | 2,063,184,840 | | | | 18,587,921 | | | | | | | | 7/31/19 | | | | — | | | | (597,632 | ) |
Japanese Yen | | | CITI | | | | Buy | | | | 1,866,452,000 | | | | 16,994,566 | | | | | | | | 7/31/19 | | | | 361,569 | | | | — | |
Japanese Yen | | | CITI | | | | Sell | | | | 1,866,452,000 | | | | 16,814,353 | | | | | | | | 7/31/19 | | | | — | | | | (541,782 | ) |
Japanese Yen | | | DBAB | | | | Buy | | | | 1,148,260,758 | | | | 10,535,005 | | | | | | | | 7/31/19 | | | | 142,670 | | | | — | |
Japanese Yen | | | DBAB | | | | Sell | | | | 1,148,260,758 | | | | 10,345,717 | | | | | | | | 7/31/19 | | | | — | | | | (331,959 | ) |
Japanese Yen | | | GSCO | | | | Buy | | | | 944,420,000 | | | | 8,592,667 | | | | | | | | 7/31/19 | | | | 189,494 | | | | — | |
Japanese Yen | | | GSCO | | | | Sell | | | | 944,420,000 | | | | 8,509,285 | | | | | | | | 7/31/19 | | | | — | | | | (272,875 | ) |
Euro | | | JPHQ | | | | Sell | | | | 32,859,900 | | | | 36,939,917 | | | | | | | | 8/02/19 | | | | — | | | | (528,145 | ) |
Euro | | | JPHQ | | | | Sell | | | | 6,147,005 | | | | 6,963,266 | | | | | | | | 8/13/19 | | | | — | | | | (51,896 | ) |
Indian Rupee | | | HSBK | | | | Sell | | | | 640,177,000 | | | | 9,164,369 | | | | | | | | 8/14/19 | | | | — | | | | (61,501 | ) |
South Korean Won | | | DBAB | | | | Sell | | | | 13,920,000,000 | | | | 11,761,724 | | | | | | | | 8/16/19 | | | | — | | | | (285,270 | ) |
South Korean Won | | | HSBK | | | | Sell | | | | 75,818,000,000 | | | | 67,858,230 | | | | | | | | 8/19/19 | | | | 2,237,665 | | | | — | |
Indian Rupee | | | JPHQ | | | | Sell | | | | 451,390,000 | | | | 6,336,321 | | | | | | | | 8/20/19 | | | | — | | | | (163,425 | ) |
Euro | | | JPHQ | | | | Sell | | | | 26,361,295 | | | | 29,644,727 | | | | | | | | 8/21/19 | | | | — | | | | (458,762 | ) |
Euro | | | SCNY | | | | Sell | | | | 4,975,000 | | | | 5,600,507 | | | | | | | | 8/21/19 | | | | — | | | | (80,734 | ) |
Indian Rupee | | | SCNY | | | | Sell | | | | 945,558,000 | | | | 13,262,334 | | | | | | | | 8/28/19 | | | | — | | | | (338,120 | ) |
Indian Rupee | | | JPHQ | | | | Sell | | | | 1,986,473,600 | | | | 28,132,836 | | | | | | | | 9/03/19 | | | | — | | | | (417,476 | ) |
Indian Rupee | | | SCNY | | | | Sell | | | | 1,135,539,000 | | | | 16,082,186 | | | | | | | | 9/03/19 | | | | — | | | | (238,189 | ) |
Indian Rupee | | | BNDP | | | | Sell | | | | 852,858,400 | | | | 12,054,025 | | | | | | | | 9/06/19 | | | | — | | | | (198,808 | ) |
Indian Rupee | | | HSBK | | | | Sell | | | | 718,737,000 | | | | 10,188,348 | | | | | | | | 9/06/19 | | | | — | | | | (137,591 | ) |
Indian Rupee | | | SCNY | | | | Sell | | | | 2,362,358,000 | | | | 33,444,581 | | | | | | | | 9/06/19 | | | | — | | | | (494,906 | ) |
Japanese Yen | | | HSBK | | | | Buy | | | | 1,385,935,670 | | | | 12,894,032 | | | | | | | | 9/06/19 | | | | 28,184 | | | | — | |
Japanese Yen | | | JPHQ | | | | Buy | | | | 1,190,714,470 | | | | 11,089,521 | | | | | | | | 9/06/19 | | | | 12,487 | | | | — | |
South Korean Won | | | DBAB | | | | Sell | | | | 13,919,000,000 | | | | 11,813,784 | | | | | | | | 9/10/19 | | | | — | | | | (240,812 | ) |
Indian Rupee | | | HSBK | | | | Sell | | | | 639,544,904 | | | | 9,046,537 | | | | | | | | 9/11/19 | | | | — | | | | (135,731 | ) |
Australian Dollar | | | JPHQ | | | | Sell | | | | 25,330,000 | | | | 1,905,801,173 | | | | JPY | | | | 9/12/19 | | | | — | | | | (45,258 | ) |
Indian Rupee | | | BNDP | | | | Sell | | | | 237,955,000 | | | | 3,398,435 | | | | | | | | 9/12/19 | | | | — | | | | (17,563 | ) |
Indian Rupee | | | CITI | | | | Sell | | | | 516,565,000 | | | | 7,360,048 | | | | | | | | 9/16/19 | | | | — | | | | (51,746 | ) |
Indian Rupee | | | HSBK | | | | Sell | | | | 320,909,148 | | | | 4,570,053 | | | | | | | | 9/16/19 | | | | — | | | | (34,425 | ) |
Indian Rupee | | | JPHQ | | | | Sell | | | | 842,066,000 | | | | 11,956,070 | | | | | | | | 9/18/19 | | | | — | | | | (122,968 | ) |
South Korean Won | | | CITI | | | | Sell | | | | 4,215,000,000 | | | | 3,745,102 | | | | | | | | 9/20/19 | | | | 93,475 | | | | — | |
South Korean Won | | | HSBK | | | | Sell | | | | 7,007,000,000 | | | | 6,209,402 | | | | | | | | 9/20/19 | | | | 138,951 | | | | — | |
Euro | | | GSCO | | | | Sell | | | | 1,230,811 | | | | 1,419,334 | | | | | | | | 9/23/19 | | | | 10,359 | | | | — | |
Euro | | | JPHQ | | | | Sell | | | | 14,818,028 | | | | 16,825,426 | | | | | | | | 9/25/19 | | | | — | | | | (140,044 | ) |
Euro | | | BZWS | | | | Sell | | | | 11,247,583 | | | | 12,905,420 | | | | | | | | 9/30/19 | | | | 22,902 | | | | — | |
Euro | | | SCNY | | | | Sell | | | | 12,544,218 | | | | 14,327,128 | | | | | | | | 9/30/19 | | | | — | | | | (40,503 | ) |
Brazilian Real | | | CITI | | | | Buy | | | | 206,375,000 | | | | 45,101,403 | | | | EUR | | | | 10/02/19 | | | | 1,548,473 | | | | — | |
Indian Rupee | | | HSBK | | | | Sell | | | | 721,903,000 | | | | 10,344,673 | | | | | | | | 10/03/19 | | | | 9,100 | | | | — | |
Euro | | | GSCO | | | | Sell | | | | 17,044,025 | | | | 19,389,965 | | | | | | | | 10/04/19 | | | | — | | | | (137,601 | ) |
Euro | | | BOFA | | | | Sell | | | | 17,079,724 | | | | 19,447,486 | | | | | | | | 10/08/19 | | | | — | | | | (127,039 | ) |
Euro | | | DBAB | | | | Sell | | | | 8,136,104 | | | | 9,264,988 | | | | | | | | 10/08/19 | | | | — | | | | (59,540 | ) |
FRANKLIN TEMPLETON VARIABLE INSURANCE PRODUCTS TRUST
STATEMENT OF INVESTMENTS (UNAUDITED)
Templeton Global Bond VIP Fund(continued)
Forward Exchange Contracts(continued)
| | | | | | | | | | | | | | | | | | | | | | | | | | | | |
| | | | | | | |
| Currency | | | Counterpartya | | | | Type | | | | Quantity | | |
| Contract
Amount |
* | |
| Settlement
Date |
| |
| Unrealized
Appreciation |
| |
| Unrealized
Depreciation |
|
| | | | |
| OTC Forward Exchange Contracts(continued) | | | | | | | | | | | | | | | | | |
Euro | | | GSCO | | | | Sell | | | | 2,045,000 | | | | 2,328,437 | | | | 10/08/19 | | | $ | — | | | $ | (15,272 | ) |
Euro | | | UBSW | | | | Sell | | | | 8,311,299 | | | | 9,466,611 | | | | 10/09/19 | | | | — | | | | (59,440 | ) |
Australian Dollar | | | JPHQ | | | | Sell | | | | 5,243,250 | | | | 3,763,028 | | | | 10/11/19 | | | | 71,406 | | | | — | |
Euro | | | BZWS | | | | Sell | | | | 7,003,000 | | | | 8,019,030 | | | | 10/11/19 | | | | — | | | | (8,748 | ) |
Euro | | | HSBK | | | | Sell | | | | 33,800,018 | | | | 38,700,683 | | | | 10/11/19 | | | | — | | | | (45,433 | ) |
Euro | | | JPHQ | | | | Sell | | | | 14,342,996 | | | | 16,427,177 | | | | 10/11/19 | | | | — | | | | (14,690 | ) |
Australian Dollar | | | CITI | | | | Sell | | | | 19,379,733 | | | | 13,888,680 | | | | 10/15/19 | | | | 242,729 | | | | — | |
Australian Dollar | | | JPHQ | | | | Sell | | | | 30,315,000 | | | | 21,728,731 | | | | 10/15/19 | | | | 382,876 | | | | — | |
Euro | | | BOFA | | | | Sell | | | | 17,769,000 | | | | 20,333,067 | | | | 10/15/19 | | | | — | | | | (42,455 | ) |
Euro | | | DBAB | | | | Sell | | | | 50,881,000 | | | | 58,164,615 | | | | 10/15/19 | | | | — | | | | (180,081 | ) |
Euro | | | GSCO | | | | Sell | | | | 1,789,884 | | | | 2,046,356 | | | | 10/15/19 | | | | — | | | | (6,084 | ) |
Euro | | | BOFA | | | | Sell | | | | 5,251,819 | | | | 6,036,441 | | | | 10/16/19 | | | | 13,770 | | | | — | |
Euro | | | HSBK | | | | Sell | | | | 8,692,000 | | | | 9,979,546 | | | | 10/16/19 | | | | 11,751 | | | | — | |
Euro | | | SCNY | | | | Sell | | | | 657,000 | | | | 754,624 | | | | 10/17/19 | | | | 1,132 | | | | — | |
Japanese Yen | | | HSBK | | | | Buy | | | | 3,480,722,080 | | | | 32,447,384 | | | | 10/21/19 | | | | 115,972 | | | | — | |
Japanese Yen | | | JPHQ | | | | Buy | | | | 2,192,959,130 | | | | 20,427,169 | | | | 10/21/19 | | | | 88,721 | | | | — | |
Euro | | | GSCO | | | | Sell | | | | 1,231,111 | | | | 1,412,515 | | | | 10/23/19 | | | | — | | | | (62 | ) |
Euro | | | JPHQ | | | | Sell | | | | 28,236,000 | | | | 32,407,869 | | | | 10/23/19 | | | | 9,880 | | | | — | |
Euro | | | UBSW | | | | Sell | | | | 1,922,305 | | | | 2,208,306 | | | | 10/23/19 | | | | 2,653 | | | | — | |
Euro | | | DBAB | | | | Sell | | | | 14,940,282 | | | | 17,055,826 | | | | 10/24/19 | | | | — | | | | (87,984 | ) |
Euro | | | UBSW | | | | Sell | | | | 11,641,500 | | | | 13,369,040 | | | | 10/24/19 | | | | 10,547 | | | | — | |
Euro | | | DBAB | | | | Sell | | | | 4,518,681 | | | | 5,143,886 | | | | 10/25/19 | | | | — | | | | (41,653 | ) |
Euro | | | HSBK | | | | Sell | | | | 19,488,000 | | | | 22,175,005 | | | | 10/25/19 | | | | — | | | | (188,994 | ) |
Euro | | | BOFA | | | | Sell | | | | 33,910,663 | | | | 38,371,610 | | | | 10/29/19 | | | | — | | | | (555,586 | ) |
Euro | | | CITI | | | | Sell | | | | 77,832,770 | | | | 88,114,479 | | | | 10/29/19 | | | | — | | | | (1,232,390 | ) |
Euro | | | GSCO | | | | Sell | | | | 2,855,793 | | | | 3,231,615 | | | | 10/29/19 | | | | — | | | | (46,646 | ) |
Euro | | | JPHQ | | | | Sell | | | | 11,263,000 | | | | 12,741,607 | | | | 10/29/19 | | | | — | | | | (187,572 | ) |
Euro | | | SCNY | | | | Sell | | | | 12,300,264 | | | | 13,918,989 | | | | 10/29/19 | | | | — | | | | (200,900 | ) |
Euro | | | DBAB | | | | Sell | | | | 14,776,110 | | | | 16,726,556 | | | | 10/30/19 | | | | — | | | | (236,755 | ) |
Euro | | | BOFA | | | | Sell | | | | 33,910,663 | | | | 38,343,803 | | | | 10/31/19 | | | | — | | | | (589,429 | ) |
Euro | | | GSCO | | | | Sell | | | | 13,037,050 | | | | 14,736,625 | | | | 10/31/19 | | | | — | | | | (231,366 | ) |
Euro | | | HSBK | | | | Sell | | | | 25,974,891 | | | | 29,415,785 | | | | 10/31/19 | | | | — | | | | (406,295 | ) |
Euro | | | JPHQ | | | | Sell | | | | 9,220,500 | | | | 10,470,708 | | | | 11/08/19 | | | | — | | | | (122,028 | ) |
Australian Dollar | | | CITI | | | | Sell | | | | 19,311,633 | | | | 13,514,281 | | | | 11/13/19 | | | | — | | | | (92,661 | ) |
Australian Dollar | | | JPHQ | | | | Sell | | | | 5,243,250 | | | | 3,674,338 | | | | 11/13/19 | | | | — | | | | (20,046 | ) |
Euro | | | HSBK | | | | Sell | | | | 1,800,000 | | | | 2,052,882 | | | | 11/14/19 | | | | — | | | | (15,965 | ) |
Australian Dollar | | | CITI | | | | Sell | | | | 19,311,633 | | | | 13,527,799 | | | | 11/15/19 | | | | — | | | | (79,760 | ) |
Australian Dollar | | | JPHQ | | | | Sell | | | | 50,143,500 | | | | 35,128,029 | | | | 11/15/19 | | | | — | | | | (204,594 | ) |
Euro | | | CITI | | | | Sell | | | | 37,063,039 | | | | 42,359,347 | | | | 11/15/19 | | | | — | | | | (242,715 | ) |
Euro | | | JPHQ | | | | Sell | | | | 6,894,178 | | | | 7,880,597 | | | | 11/15/19 | | | | — | | | | (43,907 | ) |
Euro | | | BOFA | | | | Sell | | | | 10,878,191 | | | | 12,345,223 | | | | 11/20/19 | | | | — | | | | (163,554 | ) |
Euro | | | GSCO | | | | Sell | | | | 1,898,500 | | | | 2,153,563 | | | | 11/20/19 | | | | — | | | | (29,512 | ) |
Euro | | | JPHQ | | | | Sell | | | | 30,863,836 | | | | 35,046,657 | | | | 11/20/19 | | | | — | | | | (443,514 | ) |
Australian Dollar | | | CITI | | | | Sell | | | | 13,307,000 | | | | 9,202,456 | | | | 11/21/19 | | | | — | | | | (175,334 | ) |
Euro | | | BOFA | | | | Sell | | | | 7,066,000 | | | | 8,015,176 | | | | 11/21/19 | | | | — | | | | (110,613 | ) |
Euro | | | GSCO | | | | Sell | | | | 1,230,811 | | | | 1,395,924 | | | | 11/21/19 | | | | — | | | | (19,489 | ) |
FRANKLIN TEMPLETON VARIABLE INSURANCE PRODUCTS TRUST
STATEMENT OF INVESTMENTS (UNAUDITED)
Templeton Global Bond VIP Fund(continued)
Forward Exchange Contracts(continued)
| | | | | | | | | | | | | | | | | | | | | | | | | | | | | | | | |
| | | | | | | | |
| Currency | | | Counterpartya | | | | Type | | | | Quantity | | |
| Contract
Amount |
* | | | | | |
| Settlement
Date |
| |
| Unrealized
Appreciation |
| |
| Unrealized
Depreciation |
|
|
| OTC Forward Exchange Contracts(continued) | |
Euro | | | JPHQ | | | | Sell | | | | 26,361,295 | | | | 29,864,448 | | | | | | | | 11/21/19 | | | $ | — | | | $ | (450,628 | ) |
Euro | | | UBSW | | | | Sell | | | | 2,600,555 | | | | 2,947,313 | | | | | | | | 11/21/19 | | | | — | | | | (43,284 | ) |
Euro | | | BZWS | | | | Sell | | | | 11,247,583 | | | | 12,717,642 | | | | | | | | 11/29/19 | | | | — | | | | (224,943 | ) |
Euro | | | DBAB | | | | Sell | | | | 14,781,916 | | | | 16,715,021 | | | | | | | | 11/29/19 | | | | — | | | | (294,519 | ) |
Euro | | | GSCO | | | | Sell | | | | 6,309,207 | | | | 7,137,448 | | | | | | | | 11/29/19 | | | | — | | | | (122,552 | ) |
Euro | | | MSCO | | | | Sell | | | | 30,744,500 | | | | 34,772,644 | | | | | | | | 11/29/19 | | | | — | | | | (605,029 | ) |
Australian Dollar | | | GSCO | | | | Sell | | | | 127,700,540 | | | | 89,008,553 | | | | | | | | 12/04/19 | | | | — | | | | (1,011,891 | ) |
Euro | | | BOFA | | | | Sell | | | | 27,627,938 | | | | 31,296,237 | | | | | | | | 12/04/19 | | | | — | | | | (507,568 | ) |
Euro | | | GSCO | | | | Sell | | | | 17,044,025 | | | | 19,323,152 | | | | | | | | 12/04/19 | | | | — | | | | (297,019 | ) |
Euro | | | GSCO | | | | Sell | | | | 8,105,300 | | | | 9,213,457 | | | | | | | | 12/05/19 | | | | — | | | | (117,657 | ) |
Euro | | | JPHQ | | | | Sell | | | | 6,775,311 | | | | 7,694,213 | | | | | | | | 12/05/19 | | | | — | | | | (105,770 | ) |
Euro | | | SCNY | | | | Sell | | | | 17,972,751 | | | | 20,409,497 | | | | | | | | 12/05/19 | | | | — | | | | (281,382 | ) |
Euro | | | UBSW | | | | Sell | | | | 6,231,299 | | | | 7,068,599 | | | | | | | | 12/05/19 | | | | — | | | | (105,097 | ) |
Japanese Yen | | | JPHQ | | | | Buy | | | | 1,151,402,090 | | | | 10,790,503 | | | | | | | | 12/05/19 | | | | 19,623 | | | | — | |
Japanese Yen | | | HSBK | | | | Buy | | | | 3,536,432,420 | | | | 33,156,398 | | | | | | | | 12/06/19 | | | | 48,602 | | | | — | |
Japanese Yen | | | JPHQ | | | | Buy | | | | 1,197,791,130 | | | | 11,228,053 | | | | | | | | 12/06/19 | | | | 18,495 | | | | — | |
Euro | | | BOFA | | | | Sell | | | | 17,090,572 | | | | 19,557,254 | | | | | | | | 12/09/19 | | | | — | | | | (124,149 | ) |
Euro | | | DBAB | | | | Sell | | | | 8,136,104 | | | | 9,302,170 | | | | | | | | 12/09/19 | | | | — | | | | (67,320 | ) |
South Korean Won | | | GSCO | | | | Sell | | | | 44,346,000,000 | | | | 37,444,904 | | | | | | | | 12/09/19 | | | | — | | | | (1,076,192 | ) |
Euro | | | DBAB | | | | Sell | | | | 13,483,000 | | | | 15,477,810 | | | | | | | | 12/11/19 | | | | — | | | | (51,550 | ) |
Australian Dollar | | | HSBK | | | | Sell | | | | 10,030,000 | | | | 750,855,830 | | | | JPY | | | | 12/12/19 | | | | — | | | | (18,331 | ) |
Australian Dollar | | | HSBK | | | | Sell | | | | 28,650,000 | | | | 2,151,328,500 | | | | JPY | | | | 12/12/19 | | | | 9,270 | | | | — | |
Australian Dollar | | | JPHQ | | | | Sell | | | | 17,540,000 | | | | 1,314,694,914 | | | | JPY | | | | 12/12/19 | | | | — | | | | (16,717 | ) |
Euro | | | BOFA | | | | Sell | | | | 5,439,095 | | | | 6,200,569 | | | | | | | | 12/18/19 | | | | — | | | | (67,449 | ) |
Euro | | | DBAB | | | | Sell | | | | 5,008,730 | | | | 5,707,949 | | | | | | | | 12/18/19 | | | | — | | | | (64,116 | ) |
Euro | | | GSCO | | | | Sell | | | | 1,789,884 | | | | 2,038,319 | | | | | | | | 12/18/19 | | | | — | | | | (24,344 | ) |
Japanese Yen | | | HSBK | | | | Buy | | | | 3,616,471,000 | | | | 33,750,629 | | | | | | | | 12/19/19 | | | | 240,860 | | | | — | |
Japanese Yen | | | JPHQ | | | | Buy | | | | 1,776,469,130 | | | | 16,587,881 | | | | | | | | 12/20/19 | | | | 110,612 | | | | — | |
Japanese Yen | | | HSBK | | | | Buy | | | | 1,385,935,670 | | | | 13,063,576 | | | | | | | | 3/06/20 | | | | 25,770 | | | | — | |
Japanese Yen | | | JPHQ | | | | Buy | | | | 1,316,291,430 | | | | 12,420,546 | | | | | | | | 3/06/20 | | | | 11,051 | | | | — | |
Australian Dollar | | | JPHQ | | | | Sell | | | | 22,880,000 | | | | 1,707,432,812 | | | | JPY | | | | 3/12/20 | | | | — | | | | (28,888 | ) |
Australian Dollar | | | HSBK | | | | Sell | | | | 9,830,000 | | | | 730,865,415 | | | | JPY | | | | 3/13/20 | | | | — | | | | (37,671 | ) |
Japanese Yen | | | HSBK | | | | Buy | | | | 5,242,851,400 | | | | 49,342,826 | | | | | | | | 3/23/20 | | | | 223,673 | | | | — | |
Japanese Yen | | | JPHQ | | | | Buy | | | | 3,549,117,130 | | | | 33,375,614 | | | | | | | | 3/23/20 | | | | 178,133 | | | | — | |
Japanese Yen | | | JPHQ | | | | Buy | | | | 921,145,640 | | | | 8,744,741 | | | | | | | | 3/24/20 | | | | — | | | | (35,601 | ) |
Japanese Yen | | | HSBK | | | | Buy | | | | 1,385,935,690 | | | | 13,139,372 | | | | | | | | 6/08/20 | | | | 24,791 | | | | — | |
Japanese Yen | | | JPHQ | | | | Buy | | | | 1,316,291,430 | | | | 12,493,638 | | | | | | | | 6/08/20 | | | | 9,016 | | | | — | |
Australian Dollar | | | HSBK | | | | Sell | | | | 10,030,000 | | | | 743,659,305 | | | | JPY | | | | 6/12/20 | | | | — | | | | (29,809 | ) |
Australian Dollar | | | JPHQ | | | | Sell | | | | 27,360,000 | | | | 2,029,372,749 | | | | JPY | | | | 6/12/20 | | | | — | | | | (73,650 | ) |
Euro | | | JPHQ | | | | Sell | | | | 6,775,311 | | | | 7,873,725 | | | | | | | | 6/15/20 | | | | — | | | | (29,216 | ) |
Japanese Yen | | | JPHQ | | | | Buy | | | | 1,776,469,130 | | | | 16,798,461 | | | | | | | | 6/22/20 | | | | 89,525 | | | | — | |
FRANKLIN TEMPLETON VARIABLE INSURANCE PRODUCTS TRUST
STATEMENT OF INVESTMENTS (UNAUDITED)
Templeton Global Bond VIP Fund(continued)
Forward Exchange Contracts(continued)
| | | | | | | | | | | | | | | | | | | | | | | | | | | | |
| | | | | | | |
| Currency | | | Counterpartya | | | | Type | | | | Quantity | | |
| Contract
Amount |
* | |
| Settlement
Date |
| |
| Unrealized
Appreciation |
| |
| Unrealized
Depreciation |
|
| | | | |
| OTC Forward Exchange Contracts(continued) | | | | | | | | | | | | | | | | | |
Japanese Yen | | | BNDP | | | | Buy | | | | 4,489,315,360 | | | | 42,878,248 | | | | 6/24/20 | | | | $ — | | | | $ (195,420) | |
| | | | | | | | | | | | | | | | | | | | | | | | |
| | |
Total Forward Exchange Contracts | | | | $10,800,410 | | | | $(24,353,192) | |
| | | | | | | | | | | | | | | | | | | | | | | | |
| | |
Net unrealized appreciation (depreciation) | | | | | | | | $(13,552,782) | |
| | | | | | | | | | | | | | | | | | | | | | | | | | | | |
*In U.S. dollars unless otherwise indicated.
aMay be comprised of multiple contracts with the same counterparty, currency and settlement date.
At June 30, 2019, the Fund had the following interest rate swap contracts outstanding. See Note 1(c).
Interest Rate Swap Contracts
| | | | | | | | | | | | | | | | | | | | |
| | | | | |
| Description | | Payment
Frequency | | | Counter-
party | | | Maturity
Date | | | Notional
Amount | | | Value/
Unrealized
Appreciation
(Depreciation) | |
| | | | | |
Centrally Cleared Swap Contracts | | | | | | | | | | | | | | | | | | | | |
Receive Floating3-month USD LIBOR | | | Quarterly | | | | | | | | | | | | | | | | | |
Pay Fixed 3.558% | | | Semi-Annual | | | | | | | | 3/04/21 | | | $ | 3,240,000 | | | $ | (122,000 | ) |
Receive Floating3-month USD LIBOR | | | Quarterly | | | | | | | | | | | | | | | | | |
Pay Fixed 2.775% | | | Semi-Annual | | | | | | | | 10/04/23 | | | | 13,090,000 | | | | (560,798 | ) |
Receive Floating3-month USD LIBOR | | | Quarterly | | | | | | | | | | | | | | | | | |
Pay Fixed 2.795% | | | Semi-Annual | | | | | | | | 10/04/23 | | | | 13,090,000 | | | | (572,186 | ) |
Receive Floating3-month USD LIBOR | | | Quarterly | | | | | | | | | | | | | | | | | |
Pay Fixed 2.765% | | | Semi-Annual | | | | | | | | 10/07/23 | | | | 13,090,000 | | | | (556,489 | ) |
Receive Floating3-month USD LIBOR | | | Quarterly | | | | | | | | | | | | | | | | | |
Pay Fixed 2.731% | | | Semi-Annual | | | | | | | | 7/07/24 | | | | 34,000,000 | | | | (1,830,406 | ) |
Receive Floating3-month USD LIBOR | | | Quarterly | | | | | | | | | | | | | | | | | |
Pay Fixed 1.914% | | | Semi-Annual | | | | | | | | 1/22/25 | | | | 114,670,000 | | | | (1,182,108 | ) |
Receive Floating3-month USD LIBOR | | | Quarterly | | | | | | | | | | | | | | | | | |
Pay Fixed 1.97% | | | Semi-Annual | | | | | | | | 1/23/25 | | | | 143,340,000 | | | | (1,935,166 | ) |
Receive Floating3-month USD LIBOR | | | Quarterly | | | | | | | | | | | | | | | | | |
Pay Fixed 1.973% | | | Semi-Annual | | | | | | | | 1/27/25 | | | | 84,590,000 | | | | (1,169,130 | ) |
Receive Floating3-month USD LIBOR | | | Quarterly | | | | | | | | | | | | | | | | | |
Pay Fixed 1.937% | | | Semi-Annual | | | | | | | | 1/29/25 | | | | 21,150,000 | | | | (247,845 | ) |
Receive Floating3-month USD LIBOR | | | Quarterly | | | | | | | | | | | | | | | | | |
Pay Fixed 1.942% | | | Semi-Annual | | | | | | | | 1/30/25 | | | | 17,910,000 | | | | (214,037 | ) |
Receive Floating3-month USD LIBOR | | | Quarterly | | | | | | | | | | | | | | | | | |
Pay Fixed 1.817% | | | Semi-Annual | | | | | | | | 2/03/25 | | | | 28,210,000 | | | | (132,951 | ) |
Receive Floating3-month USD LIBOR | | | Quarterly | | | | | | | | | | | | | | | | | |
Pay Fixed 4.349% | | | Semi-Annual | | | | | | | | 2/25/41 | | | | 7,460,000 | | | | (2,957,633 | ) |
Receive Floating3-month USD LIBOR | | | Quarterly | | | | | | | | | | | | | | | | | |
Pay Fixed 4.32% | | | Semi-Annual | | | | | | | | 2/28/41 | | | | 5,600,000 | | | | (2,187,593 | ) |
Receive Floating3-month USD LIBOR | | | Quarterly | | | | | | | | | | | | | | | | | |
Pay Fixed 4.299% | | | Semi-Annual | | | | | | | | 3/01/41 | | | | 1,870,000 | | | | (724,297 | ) |
Receive Floating3-month USD LIBOR | | | Quarterly | | | | | | | | | | | | | | | | | |
Pay Fixed 3.668% | | | Semi-Annual | | | | | | | | 10/04/43 | | | | 6,370,000 | | | | (1,827,825 | ) |
Receive Floating3-month USD LIBOR | | | Quarterly | | | | | | | | | | | | | | | | | |
FRANKLIN TEMPLETON VARIABLE INSURANCE PRODUCTS TRUST
STATEMENT OF INVESTMENTS (UNAUDITED)
Templeton Global Bond VIP Fund(continued)
Interest Rate Swap Contracts(continued)
| | | | | | | | | | | | | | | | | | | | |
| | | | | |
| Description | | Payment
Frequency | | | Counter-
party | | | Maturity
Date | | | Notional
Amount | | | Value/
Unrealized
Appreciation
(Depreciation) | |
| | | | | |
Centrally Cleared Swap Contracts(continued) | | | | | | | | | | | | | | | | | | | | |
Pay Fixed 3.687% | | | Semi-Annual | | | | | | | | 10/04/43 | | | | $ 6,370,000 | | | | $ (1,851,049 | ) |
Receive Floating3-month USD LIBOR | | | Quarterly | | | | | | | | | | | | | | | | | |
Pay Fixed 3.675% | | | Semi-Annual | | | | | | | | 10/07/43 | | | | 6,370,000 | | | | (1,836,145 | ) |
Receive Floating3-month USD LIBOR | | | Quarterly | | | | | | | | | | | | | | | | | |
Pay Fixed 2.378% | | | Semi-Annual | | | | | | | | 11/18/46 | | | | 122,400,000 | | | | (4,266,750 | ) |
Receive Floating3-month USD LIBOR | | | Quarterly | | | | | | | | | | | | | | | | | |
Pay Fixed 2.537% | | | Semi-Annual | | | | | | | | 4/13/47 | | | | 72,700,000 | | | | (5,051,107 | ) |
Receive Floating3-month USD LIBOR | | | Quarterly | | | | | | | | | | | | | | | | | |
Pay Fixed 2.587% | | | Semi-Annual | | | | | | | | 7/27/47 | | | | 36,700,000 | | | | (3,208,437 | ) |
Receive Floating3-month USD LIBOR | | | Quarterly | | | | | | | | | | | | | | | | | |
Pay Fixed 2.98% | | | Semi-Annual | | | | | | | | 2/20/48 | | | | 15,638,000 | | | | (2,751,703 | ) |
Receive Floating3-month USD LIBOR | | | Quarterly | | | | | | | | | | | | | | | | | |
Pay Fixed 3.002% | | | Semi-Annual | | | | | | | | 2/22/48 | | | | 15,638,000 | | | | (2,829,404 | ) |
Receive Floating3-month USD LIBOR | | | Quarterly | | | | | | | | | | | | | | | | | |
Pay Fixed 3.019% | | | Semi-Annual | | | | | | | | 2/23/48 | | | | 15,638,000 | | | | (2,885,783 | ) |
| | | | | | | | | | | | | | | | | | | | |
| |
Total Centrally Cleared Swap Contracts | | | | $(40,900,842 | ) |
| | | | | | | | | | | | | | | | | | | | |
| | | | | |
| OTC Swap Contracts | | | | | | | | | | | | | | | | | | | | |
Receive Floating3-month USD LIBOR | | | Quarterly | | | | | | | | | | | | | | | | | |
Pay Fixed 3.523% | | | Semi-Annual | | | | DBAB | | | | 3/28/21 | | | | $ 14,630,000 | | | | $ (555,316 | ) |
Receive Floating3-month USD LIBOR | | | Quarterly | | | | | | | | | | | | | | | | | |
Pay Fixed 4.347% | | | Semi-Annual | | | | CITI | | | | 2/25/41 | | | | 7,460,000 | | | | (2,954,052 | ) |
| | | | | | | | | | | | | | | | | | | | |
| | |
Total OTC Swap Contracts | | | | | | | | $ (3,509,368 | ) |
| | | | | | | | | | | | | | | | | | | | |
| | |
Total Interest Rate Swap Contracts | | | | | | | | $(44,410,210 | ) |
| | | | | | | | | | | | | | | | | | | | |
See Note 9 regarding other derivative information.
See Abbreviations on pageTGB-36.
| | | | |
| | | |
TGB-20 | | Semiannual Report | The accompanying notes are an integral part of these financial statements. | | |
FRANKLIN TEMPLETON VARIABLE INSURANCE PRODUCTS TRUST
FINANCIAL STATEMENTS
Statement of Assets and Liabilities
June 30, 2019 (unaudited)
| | | | |
| |
| | | Templeton
Global Bond
VIP Fund | |
| |
Assets: | | | | |
Investments in securities: | | | | |
Cost - Unaffiliated issuers | | | $1,868,329,961 | |
Cost -Non-controlled affiliates (Note 3e) | | | 840,987,190 | |
| | | | |
| |
Value - Unaffiliated issuers | | | $1,715,941,371 | |
Value -Non-controlled affiliates (Note 3e) | | | 840,987,190 | |
Foreign currency, at value (cost $3,139,800) | | | 3,143,810 | |
Receivables: | | | | |
Investment securities sold | | | 306,105,949 | |
Capital shares sold | | | 432,766 | |
Interest | | | 28,017,671 | |
Deposits with brokers for: | | | | |
OTC derivative contracts | | | 13,111,000 | |
Centrally cleared swap contracts | | | 43,812,453 | |
Variation margin on centrally cleared swap contracts | | | 1,750,564 | |
Unrealized appreciation on OTC forward exchange contracts | | | 10,800,410 | |
Other assets | | | 2,077 | |
| | | | |
| |
Total assets | | | 2,964,105,261 | |
| | | | |
| |
Liabilities: | | | | |
Payables: | | | | |
Capital shares redeemed | | | 1,873,996 | |
Management fees | | | 871,727 | |
Distribution fees | | | 1,104,022 | |
Trustees’ fees and expenses | | | 2,943 | |
Options written, at value (premiums received $11,159,153) | | | 8,140,326 | |
Unrealized depreciation on OTC forward exchange contracts | | | 24,353,192 | |
Unrealized depreciation on OTC swap contracts | | | 3,509,368 | |
Deferred tax | | | 1,069,598 | |
Accrued expenses and other liabilities | | | 1,470,573 | |
| | | | |
| |
Total liabilities | | | 42,395,745 | |
| | | | |
| |
Net assets, at value | | | $2,921,709,516 | |
| | | | |
Net assets consist of: | | | | |
Paid-in capital | | | $3,013,559,830 | |
Total distributable earnings (loss) | | | (91,850,314 | ) |
| | | | |
| |
Net assets, at value | | | $2,921,709,516 | |
| | | | |
| | | | | | |
| | | |
| | The accompanying notes are an integral part of these financial statements. | Semiannual Report | | | TGB-21 | |
FRANKLIN TEMPLETON VARIABLE INSURANCE PRODUCTS TRUST
FINANCIAL STATEMENTS
Statement of Assets and Liabilities(continued)
June 30, 2019 (unaudited)
| | | | |
| |
| | | Templeton
Global Bond
VIP Fund | |
| |
Class 1: | | | | |
Net assets, at value | | | $ 322,894,936 | |
| | | | |
Shares outstanding | | | 19,159,539 | |
| | | | |
Net asset value and maximum offering price per share | | | $16.85 | |
| | | | |
Class 2: | | | | |
Net assets, at value | | | $2,506,398,779 | |
| | | | |
Shares outstanding | | | 155,279,892 | |
| | | | |
Net asset value and maximum offering price per share | | | $16.14 | |
| | | | |
Class 4: | | | | |
Net assets, at value | | | $ 92,415,801 | |
| | | | |
Shares outstanding | | | 5,594,502 | |
| | | | |
Net asset value and maximum offering price per share | | | $16.52 | |
| | | | |
| | | | |
| | |
TGB-22 | | Semiannual Report | The accompanying notes are an integral part of these financial statements. |
FRANKLIN TEMPLETON VARIABLE INSURANCE PRODUCTS TRUST
FINANCIAL STATEMENTS
Statement of Operations
for the six months ended June 30, 2019 (unaudited)
| | | | |
| |
| | | Templeton
Global Bond
VIP Fund | |
| |
| |
Investment income: | | | | |
Dividends: | | | | |
Non-controlled affiliates (Note 3e) | | | $ 7,272,536 | |
Interest: (net of foreign taxes)~ | | | | |
Unaffiliated issuers | | | 83,677,638 | |
| | | | |
| |
Total investment income | | | 90,950,174 | |
| | | | |
| |
Expenses: | | | | |
Management fees (Note 3a) | | | 6,664,374 | |
Distribution fees: (Note 3c) | | | | |
Class 2 | | | 3,151,919 | |
Class 4 | | | 162,031 | |
Custodian fees (Note 4) | | | 622,636 | |
Reports to shareholders | | | 200,875 | |
Professional fees | | | 52,053 | |
Trustees’ fees and expenses | | | 11,670 | |
Other | | | 258,393 | |
| | | | |
| |
Total expenses | | | 11,123,951 | |
Expense reductions (Note 4) | | | (99,819 | ) |
Expenses waived/paid by affiliates (Note 3e) | | | (1,224,809 | ) |
| | | | |
| |
Net expenses | | | 9,799,323 | |
| | | | |
| |
Net investment income | | | 81,150,851 | |
| | | | |
| |
Realized and unrealized gains (losses): | | | | |
Net realized gain (loss) from: | | | | |
Investments:# | | | | |
Unaffiliated issuers | | | (3,116,265 | ) |
Written options | | | (270,237 | ) |
Foreign currency transactions | | | 59,956 | |
Forward exchange contracts | | | 73,887,062 | |
Swap contracts | | | 1,230,638 | |
| | | | |
| |
Net realized gain (loss) | | | 71,791,154 | |
| | | | |
| |
Net change in unrealized appreciation (depreciation) on: | | | | |
Investments: | | | | |
Unaffiliated issuers | | | 14,559,126 | |
Translation of other assets and liabilities
denominated in foreign currencies | | | 230,753 | |
Forward exchange contracts | | | (18,328,568 | ) |
Written options | | | 3,018,827 | |
Swap contracts | | | (63,106,879 | ) |
Change in deferred taxes on unrealized appreciation | | | 808,513 | |
| | | | |
| |
Net change in unrealized appreciation (depreciation) | | | (62,818,228 | ) |
| | | | |
| |
Net realized and unrealized gain (loss) | | | 8,972,926 | |
| | | | |
| |
Net increase (decrease) in net assets resulting from operations | | | $ 90,123,777 | |
| | | | |
| |
~Foreign taxes withheld on interest. | | | $ 1,721,531 | |
#Net of foreign taxes | | | $ 356,048 | |
| | | | | | |
| | | |
| | The accompanying notes are an integral part of these financial statements. | Semiannual Report | | | TGB-23 | |
FRANKLIN TEMPLETON VARIABLE INSURANCE PRODUCTS TRUST
FINANCIAL STATEMENTS
Statements of Changes in Net Assets
| | | | | | | | |
| | | Templeton Global
Bond VIP Fund | |
| | |
| | | Six Months Ended
June 30, 2019
(unaudited) | | | Year Ended
December 31, 2018 | |
| |
| | |
Increase (decrease) in net assets: | | | | | | | | |
Operations: | | | | | | | | |
Net investment income | | | $ 81,150,851 | | | | $ 148,925,933 | |
Net realized gain (loss) | | | 71,791,154 | | | | 29,395,004 | |
Net change in unrealized appreciation (depreciation) | | | (62,818,228 | ) | | | (118,382,692 | ) |
| | | | |
| | |
Net increase (decrease) in net assets resulting from operations | | | 90,123,777 | | | | 59,938,245 | |
| | | | |
| | |
Distributions to shareholders: | | | | | | | | |
Class 1 | | | (22,427,340 | ) | | | — | |
Class 2 | | | (175,601,316 | ) | | | — | |
Class 4 | | | (6,224,019 | ) | | | — | |
| | | | |
| | |
Total distributions to shareholders | | | (204,252,675 | ) | | | — | |
| | | | |
Capital share transactions: (Note 2) | | | | | | | | |
Class 1 | | | 51,298,106 | | | | (7,760,972 | ) |
Class 2 | | | 58,771,690 | | | | (237,044,140 | ) |
Class 4 | | | 1,510,796 | | | | (6,392,585 | ) |
| | | | |
| | |
Total capital share transactions | | | 111,580,592 | | | | (251,197,697 | ) |
| | | | |
| | |
Net increase (decrease) in net assets | | | (2,548,306 | ) | | | (191,259,452 | ) |
| | |
Net assets: | | | | | | | | |
Beginning of period | | | 2,924,257,822 | | | | 3,115,517,274 | |
| | | | |
| | |
End of period | | | $2,921,709,516 | | | | $2,924,257,822 | |
| | | | |
| | | | |
| | | |
TGB-24 | | Semiannual Report | The accompanying notes are an integral part of these financial statements. | | |
FRANKLIN TEMPLETON VARIABLE INSURANCE PRODUCTS TRUST
Notes to Financial Statements (unaudited)
Templeton Global Bond VIP Fund
1. Organization and Significant Accounting Policies
Franklin Templeton Variable Insurance Products Trust (Trust) is registered under the Investment Company Act of 1940 (1940 Act) as anopen-end management investment company, consisting of eighteen separate funds and applies the specialized accounting and reporting guidance in U.S. Generally Accepted Accounting Principles (U.S. GAAP). Templeton Global Bond VIP Fund (Fund) is included in this report. Shares of the Fund are generally sold only to insurance company separate accounts to fund the benefits of variable life insurance policies or variable annuity contracts. The Fund offers three classes of shares: Class 1, Class 2, and Class 4. Each class of shares may differ by its distribution fees, voting rights on matters affecting a single class and its exchange privilege.
The following summarizes the Fund’s significant accounting policies.
a. Financial Instrument Valuation
The Fund’s investments in financial instruments are carried at fair value daily. Fair value is the price that would be received to sell an asset or paid to transfer a liability in an orderly transaction between market participants on the measurement date. The Fund calculates the net asset value (NAV) per share each business day as of 4 p.m. Eastern time or the regularly scheduled close of the New York Stock Exchange (NYSE), whichever is earlier. Under compliance policies and procedures approved by the Trust’s Board of Trustees (the Board), the Fund’s administrator has responsibility for oversight of valuation, including leading the cross-functional Valuation Committee (VC). The Fund may utilize independent pricing services, quotations from securities and financial instrument dealers, and other market sources to determine fair value.
Debt securities generally trade in theover-the-counter (OTC) market rather than on a securities exchange. The Fund’s pricing services use multiple valuation techniques to determine fair value. In instances where sufficient market activity exists, the pricing services may utilize a market-based approach through which quotes from market makers are used to determine fair value. In instances where sufficient market activity may not exist or is limited, the pricing services also utilize proprietary valuation models which may consider market characteristics such as benchmark yield curves, credit spreads, estimated default rates, anticipated market interest rate volatility, coupon rates, anticipated timing of principal
repayments, underlying collateral, and other unique security features in order to estimate the relevant cash flows, which are then discounted to calculate the fair value. Securities denominated in a foreign currency are converted into their U.S. dollar equivalent at the foreign exchange rate in effect at 4 p.m. Eastern time on the date that the values of the foreign debt securities are determined.
Investments inopen-end mutual funds are valued at the closing NAV.
Certain derivative financial instruments are centrally cleared or trade in the OTC market. The Fund’s pricing services use various techniques including industry standard option pricing models and proprietary discounted cash flow models to determine the fair value of those instruments. The Fund’s net benefit or obligation under the derivative contract, as measured by the fair value of the contract, is included in net assets.
The Fund has procedures to determine the fair value of financial instruments for which market prices are not reliable or readily available. Under these procedures, the Fund primarily employs a market-based approach which may use related or comparable assets or liabilities, recent transactions, market multiples, book values, and other relevant information for the investment to determine the fair value of the investment. An income-based valuation approach may also be used in which the anticipated future cash flows of the investment are discounted to calculate fair value. Discounts may also be applied due to the nature or duration of any restrictions on the disposition of the investments. Due to the inherent uncertainty of valuations of such investments, the fair values may differ significantly from the values that would have been used had an active market existed.
b. Foreign Currency Translation
Portfolio securities and other assets and liabilities denominated in foreign currencies are translated into U.S. dollars based on the exchange rate of such currencies against U.S. dollars on the date of valuation. The Fund may enter into foreign currency exchange contracts to facilitate transactions denominated in a foreign currency. Purchases and sales of securities, income and expense items denominated in foreign currencies are translated into U.S. dollars at the exchange rate in effect on the transaction date. Portfolio securities and assets and liabilities denominated in foreign currencies contain risks that those currencies will decline in value relative to the U.S. dollar. Occasionally,
FRANKLIN TEMPLETON VARIABLE INSURANCE PRODUCTS TRUST
FINANCIAL STATEMENTS
Templeton Global Bond VIP Fund(continued)
1. Organization and Significant Accounting Policies(continued)
b. Foreign Currency Translation(continued)
events may impact the availability or reliability of foreign exchange rates used to convert the U.S. dollar equivalent value. If such an event occurs, the foreign exchange rate will be valued at fair value using procedures established and approved by the Board.
The Fund does not separately report the effect of changes in foreign exchange rates from changes in market prices on securities held. Such changes are included in net realized and unrealized gain or loss from investments in the Statement of Operations.
Realized foreign exchange gains or losses arise from sales of foreign currencies, currency gains or losses realized between the trade and settlement dates on securities transactions and the difference between the recorded amounts of dividends, interest, and foreign withholding taxes and the U.S. dollar equivalent of the amounts actually received or paid. Net unrealized foreign exchange gains and losses arise from changes in foreign exchange rates on foreign denominated assets and liabilities other than investments in securities held at the end of the reporting period.
c. Derivative Financial Instruments
The Fund invested in derivative financial instruments in order to manage risk or gain exposure to various other investments or markets. Derivatives are financial contracts based on an underlying or notional amount, require no initial investment or an initial net investment that is smaller than would normally be required to have a similar response to changes in market factors, and require or permit net settlement. Derivatives contain various risks including the potential inability of the counterparty to fulfill their obligations under the terms of the contract, the potential for an illiquid secondary market, and/or the potential for market movements which expose the Fund to gains or losses in excess of the amounts shown in the Statement of Assets and Liabilities. Realized gain and loss and unrealized appreciation and depreciation on these contracts for the period are included in the Statement of Operations.
Derivative counterparty credit risk is managed through a formal evaluation of the creditworthiness of all potential counterparties. The Fund attempts to reduce its exposure to counterparty credit risk on OTC derivatives, whenever
possible, by entering into International Swaps and Derivatives Association (ISDA) master agreements with certain counterparties. These agreements contain various provisions, including but not limited to collateral requirements, events of default, or early termination. Termination events applicable to the counterparty include certain deteriorations in the credit quality of the counterparty. Termination events applicable to the Fund include failure of the Fund to maintain certain net asset levels and/or limit the decline in net assets over various periods of time. In the event of default or early termination, the ISDA master agreement gives thenon-defaulting party the right to net andclose-out all transactions traded, whether or not arising under the ISDA agreement, to one net amount payable by one counterparty to the other. However, absent an event of default or early termination, OTC derivative assets and liabilities are presented gross and not offset in the Statement of Assets and Liabilities. Early termination by the counterparty may result in an immediate payment by the Fund of any net liability owed to that counterparty under the ISDA agreement.
Collateral requirements differ by type of derivative. Collateral or initial margin requirements are set by the broker or exchange clearing house for exchange traded and centrally cleared derivatives. Initial margin deposited is held at the exchange and can be in the form of cash and/or securities. For OTC derivatives traded under an ISDA master agreement, posting of collateral is required by either the Fund or the applicable counterparty if the total net exposure of all OTC derivatives with the applicable counterparty exceeds the minimum transfer amount, which typically ranges from $100,000 to $250,000, and can vary depending on the counterparty and the type of the agreement. Generally, collateral is determined at the close of Fund business each day and any additional collateral required due to changes in derivative values may be delivered by the Fund or the counterparty the next business day, or within a few business days. Collateral pledged and/or received by the Fund for OTC derivatives, if any, is held in segregated accounts with the Fund’s custodian/counterparty broker and can be in the form of cash and/or securities. Unrestricted cash may be invested according to the Fund’s investment objectives. To the extent that the amounts due to the Fund from its counterparties are not subject to collateralization or are not fully collateralized, the Fund bears the risk of loss from counterpartynon-performance.
FRANKLIN TEMPLETON VARIABLE INSURANCE PRODUCTS TRUST
FINANCIAL STATEMENTS
Templeton Global Bond VIP Fund(continued)
The Fund entered into OTC forward exchange contracts primarily to manage and/or gain exposure to certain foreign currencies. A forward exchange contract is an agreement between the Fund and a counterparty to buy or sell a foreign currency at a specific exchange rate on a future date.
The Fund entered into interest rate swap contracts primarily to manage interest rate risk. An interest rate swap is an agreement between the Fund and a counterparty to exchange cash flows based on the difference between two interest rates, applied to a notional amount. These agreements may be privately negotiated in theover-the-counter market (OTC interest rate swaps) or may be executed on a registered exchange (centrally cleared interest rate swaps). For centrally cleared interest rate swaps, required initial margins are pledged by the Fund, and the daily change in fair value is accounted for as a variation margin payable or receivable in the Statement of Assets and Liabilities. Over the term of the contract, contractually required payments to be paid and to be received are accrued daily and recorded as unrealized depreciation and appreciation until the payments are made, at which time they are realized.
The Fund purchased or wrote OTC option contracts primarily to manage and/or gain exposure to foreign exchange rate risk. An option is a contract entitling the holder to purchase or sell a specific amount of shares or units of an asset or notional amount of a swap (swaption), at a specified price. When an option is purchased or written, an amount equal to the premium paid or received is recorded as an asset or liability, respectively. Upon exercise of an option, the acquisition cost or sales proceeds of the underlying investment is adjusted by any premium received or paid. Upon expiration of an option, any premium received or paid is recorded as a realized gain or loss. Upon closing an option other than through expiration or exercise, the difference between the premium received or paid and the cost to close the position is recorded as a realized gain or loss.
The Fund invested in value recovery instruments (VRI) primarily to gain exposure to economic growth. Periodic payments from VRI are dependent on established benchmarks for underlying variables. VRI has a notional amount, which is used to calculate amounts of payments to holders. Payments are recorded upon receipt as realized
gains in the Statement of Operations. The risks of investing in VRI include growth risk, liquidity, and the potential loss of investment.
See Note 9 regarding other derivative information.
d. Income and Deferred Taxes
It is the Fund’s policy to qualify as a regulated investment company under the Internal Revenue Code. The Fund intends to distribute to shareholders substantially all of its taxable income and net realized gains to relieve it from federal income and if applicable, excise taxes. As a result, no provision for U.S. federal income taxes is required.
The Fund may be subject to foreign taxation related to income received, capital gains on the sale of securities and certain foreign currency transactions in the foreign jurisdictions in which it invests. Foreign taxes, if any, are recorded based on the tax regulations and rates that exist in the foreign markets in which the Fund invests. When a capital gain tax is determined to apply, the Fund records an estimated deferred tax liability in an amount that would be payable if the securities were disposed of on the valuation date.
The Fund may recognize an income tax liability related to its uncertain tax positions under U.S. GAAP when the uncertain tax position has a less than 50% probability that it will be sustained upon examination by the tax authorities based on its technical merits. As of June 30, 2019, the Fund has determined that no tax liability is required in its financial statements related to uncertain tax positions for any open tax years (or expected to be taken in future tax years). Open tax years are those that remain subject to examination and are based on the statute of limitations in each jurisdiction in which the Fund invests.
e. Security Transactions, Investment Income, Expenses and Distributions
Security transactions are accounted for on trade date. Realized gains and losses on security transactions are determined on a specific identification basis. Interest income and estimated expenses are accrued daily. Amortization of premium and accretion of discount on debt securities are included in interest income. Dividend income is recorded on theex-dividend date. Distributions to shareholders are recorded on theex-dividend date. Distributable earnings are determined according to income tax regulations (tax basis)
FRANKLIN TEMPLETON VARIABLE INSURANCE PRODUCTS TRUST
FINANCIAL STATEMENTS
Templeton Global Bond VIP Fund(continued)
1. Organization and Significant Accounting
Policies(continued)
e. Security Transactions, Investment Income, Expenses and Distributions(continued)
and may differ from earnings recorded in accordance with U.S. GAAP. These differences may be permanent or temporary. Permanent differences are reclassified among capital accounts to reflect their tax character. These reclassifications have no impact on net assets or the results of operations. Temporary differences are not reclassified, as they may reverse in subsequent periods.
Common expenses incurred by the Trust are allocated among the Funds based on the ratio of net assets of each Fund to the combined net assets of the Trust or based on the ratio of number of shareholders of each Fund to the combined number of shareholders of the Trust. Fund specific expenses are charged directly to the Fund that incurred the expense.
Realized and unrealized gains and losses and net investment income, excluding class specific expenses, are allocated daily to each class of shares based upon the relative proportion of net assets of each class. Differences in per share distributions by class are generally due to differences in class specific expenses.
Inflation-indexed bonds are adjusted for inflation through periodic increases or decreases in the security’s interest accruals, face amount, or principal redemption value, by
amounts corresponding to the rate of inflation as measured by an index. Any increase or decrease in the face amount or principal redemption value will be included as interest income in the Statement of Operations.
f. Accounting Estimates
The preparation of financial statements in accordance with U.S. GAAP requires management to make estimates and assumptions that affect the reported amounts of assets and liabilities at the date of the financial statements and the amounts of income and expenses during the reporting period. Actual results could differ from those estimates.
g. Guarantees and Indemnifications
Under the Trust’s organizational documents, its officers and trustees are indemnified by the Trust against certain liabilities arising out of the performance of their duties to the Trust. Additionally, in the normal course of business, the Trust, on behalf of the Fund, enters into contracts with service providers that contain general indemnification clauses. The Trust’s maximum exposure under these arrangements is unknown as this would involve future claims that may be made against the Trust that have not yet occurred. Currently, the Trust expects the risk of loss to be remote.
2. Shares of Beneficial Interest
At June 30, 2019, there were an unlimited number of shares authorized (without par value). Transactions in the Fund’s shares were as follows:
| | | | | | | | | | | | | | | | | | | | |
| | | Six Months Ended June 30, 2019 | | | | | | Year Ended December 31, 2018 | |
| | | | |
| | | | | |
| | | Shares | | | Amount | | | | | | Shares | | | Amount | |
| |
| | | | | |
| Class 1 Shares: | | | | | | | | | | | | | | | | | | | | |
Shares sold | | | 3,257,781 | | | $ | 58,874,081 | | | | | | | | 3,298,930 | | | $ | 57,215,991 | |
Shares issued in reinvestment of distributions | | | 1,330,210 | | | | 22,427,340 | | | | | | | | — | | | | — | |
Shares redeemed | | | (1,676,435 | ) | | | (30,003,315 | ) | | | | | | | (3,741,198 | ) | | | (64,976,963) | |
| | | | |
| | | | | |
Net increase (decrease) | | | 2,911,556 | | | $ | 51,298,106 | | | | | | | | (442,268 | ) | | $ | (7,760,972) | |
| | | | |
FRANKLIN TEMPLETON VARIABLE INSURANCE PRODUCTS TRUST
FINANCIAL STATEMENTS
Templeton Global Bond VIP Fund(continued)
| | | | | | | | | | | | | | | | | | | | |
| |
| Six Months Ended
June 30, 2019 |
| |
| Year Ended
December 31, 2018 |
|
| | | | | |
| | | Shares | | | Amount | | | | | | Shares | | | Amount | |
| | | | | |
| Class 2 Shares: | | | | | | | | | | | | | | | | | | | | |
Shares sold | | | 3,326,780 | | | | $ 57,259,173 | | | | | | | | 10,132,393 | | | | $ 169,096,447 | |
Shares issued in reinvestment of distributions | | | 10,873,146 | | | | 175,601,316 | | | | | | | | — | | | | — | |
Shares redeemed | | | (10,136,099 | ) | | | (174,088,799 | ) | | | | | | | (24,289,543 | ) | | | (406,140,587) | |
| | | | |
| | | | | |
Net increase (decrease) | | | 4,063,827 | | | | $ 58,771,690 | | | | | | | | (14,157,150 | ) | | | $(237,044,140) | |
| | | | |
| | | | | |
| Class 4 Shares: | | | | | | | | | | | | | | | | | | | | |
Shares sold | | | 338,125 | | | | $ 5,942,275 | | | | | | | | 816,409 | | | | $13,930,984 | |
Shares issued in reinvestment of distributions | | | 376,529 | | | | 6,224,019 | | | | | | | | — | | | | — | |
Shares redeemed | | | (607,785 | ) | | | (10,655,498 | ) | | | | | | | (1,191,456 | ) | | | (20,323,569) | |
| | | | |
| | | | | |
Net increase (decrease) | | | 106,869 | | | | $ 1,510,796 | | | | | | | | (375,047 | ) | | | $(6,392,585) | |
| | | | |
3. Transactions with Affiliates
Franklin Resources, Inc. is the holding company for various subsidiaries that together are referred to as Franklin Templeton. Certain officers and trustees of the Fund are also officers and/or directors of the following subsidiaries:
| | |
| |
| Subsidiary | | Affiliation |
Franklin Advisers, Inc. (Advisers) | | Investment manager |
Franklin Templeton Services, LLC (FT Services) | | Administrative manager |
Franklin Templeton Distributors, Inc. (Distributors) | | Principal underwriter |
Franklin Templeton Investor Services, LLC (Investor Services) | | Transfer agent |
a. Management Fees
The Fund pays an investment management fee to Advisers based on the average daily net assets of the Fund as follows:
| | |
| |
| Annualized Fee Rate | | Net Assets |
0.625% | | Up to and including $100 million |
0.500% | | Over $100 million, up to and including $250 million |
0.450% | | Over $250 million, up to and including $7.5 billion |
0.440% | | Over $7.5 billion, up to and including $10 billion |
0.430% | | Over $10 billion, up to and including $12.5 billion |
0.420% | | Over $12.5 billion, up to and including $15 billion |
0.400% | | In excess of $15 billion |
For the period ended June 30, 2019, the annualized gross effective investment management fee rate was 0.459% of the Fund’s average daily net assets.
b. Administrative Fees
Under an agreement with Advisers, FT Services provides administrative services to the Fund. The fee is paid by Advisers based on the Fund’s average daily net assets, and is not an additional expense of the Fund.
FRANKLIN TEMPLETON VARIABLE INSURANCE PRODUCTS TRUST
FINANCIAL STATEMENTS
Templeton Global Bond VIP Fund(continued)
3. Transactions with Affiliates(continued)
c. Distribution Fees
The Board has adopted distribution plans for Class 2 and Class 4 shares pursuant to Rule12b-1 under the 1940 Act. Under the Fund’s compensation distribution plans, the Fund pays Distributors for costs incurred in connection with the servicing, sale and distribution of the Fund’s shares up to 0.25% and 0.35% per year of its average daily net assets of Class 2 and Class 4, respectively. The plan year, for purposes of monitoring compliance with the maximum annual plan rates, is February 1 through January 31.
d. Transfer Agent Fees
Investor Services, under terms of an agreement, performs shareholder servicing for the Fund and is not paid by the Fund for the services.
e. Investments in Affiliated Management Investment Companies
The Fund invests in one or more affiliated management investment companies for purposes other than exercising a controlling influence over the management or policies. Management fees paid by the Fund are waived on assets invested in the affiliated management investment companies, as noted in the Statement of Operations, in an amount not to exceed the management and administrative fees paid directly or indirectly by each affiliate. During the period ended June 30, 2019, the Fund held investments in affiliated management investment companies as follows:
| | | | | | | | | | | | | | | | | | | | | | | | | | | | | | | | |
| | | | | | | | |
| | | Value at
Beginning of Period | | | Purchases | | | Sales | | | Realized
Gain (Loss) | | | Net Change in
Unrealized
Appreciation
(Depreciation) | | | Value at End of
Period | | | Number of
Shares
Held at End
of Period | | | Dividend
Income | |
| Non-Controlled Affiliates | | | | | | | | | | | | | | | | | | | | | | | | | | | | | | | | |
Institutional Fiduciary Trust Money Market Portfolio, 2.05% | | | $663,563,266 | | | | $364,241,589 | | | | $(186,817,665 | ) | | | $ — | | | | $ — | | | | $840,987,190 | | | | 840,987,190 | | | | $7,272,536 | |
| | | | | | | | | | | | |
4. Expense Offset Arrangement
The Fund has entered into an arrangement with its custodian whereby credits realized as a result of uninvested cash balances are used to reduce a portion of the Fund’s custodian expenses. During the period ended June 30, 2019, the custodian fees were reduced as noted in the Statement of Operations.
5. Income Taxes
For tax purposes, capital losses may be carried over to offset future capital gains.
At December 31, 2018, the capital loss carryforwards were as follows:
| | | | |
Capital loss carryforwards not subject to expiration: | | | | |
Short term | | $ | 1,830,066 | |
Long term | | | 23,760,579 | |
| | | | |
| |
Total capital loss carryforwards | | $ | 25,590,645 | |
| | | | |
FRANKLIN TEMPLETON VARIABLE INSURANCE PRODUCTS TRUST
FINANCIAL STATEMENTS
Templeton Global Bond VIP Fund(continued)
At June 30, 2019, the cost of investments and net unrealized appreciation (depreciation) for income tax purposes were as follows:
| | | | |
Cost of investments | | $ | 2,712,504,045 | |
| | | | |
| |
Unrealized appreciation | | $ | 71,578,938 | |
Unrealized depreciation | | | (290,382,662) | |
| | | | |
| |
Net unrealized appreciation (depreciation) | | $ | (218,803,724) | |
| | | | |
Differences between income and/or capital gains as determined on a book basis and a tax basis are primarily due to differing treatment of bond discounts and premiums.
6. Investment Transactions
Purchases and sales of investments (excluding short term securities) for the period ended June 30, 2019, aggregated $210,959,199 and $431,222,785, respectively.
7. Credit Risk
At June 30, 2019, the Fund had 15.2% of its portfolio invested in high yield or other securities rated below investment grade and unrated securities, if any. These securities may be more sensitive to economic conditions causing greater price volatility and are potentially subject to a greater risk of loss due to default than higher rated securities.
8. Concentration of Risk
Investing in foreign securities may include certain risks and considerations not typically associated with investing in U.S. securities, such as fluctuating currency values and changing local and regional economic, political and social conditions, which may result in greater market volatility. Current political and financial uncertainty surrounding the European Union may increase market volatility and the economic risk of investing in securities in Europe. In addition, certain foreign securities may not be as liquid as U.S. securities.
9. Other Derivative Information
At June 30, 2019, investments in derivative contracts are reflected in the Statement of Assets and Liabilities as follows:
| | | | | | | | | | | | | | | | |
| | | |
| | | Asset Derivatives | | | | | | Liability Derivatives | |
| | | | | |
Derivative Contracts Not Accounted for as Hedging Instruments | | Statement of
Assets and Liabilities
Location | | Fair Value | | | | | | Statement of
Assets and Liabilities
Location | | Fair
Value | |
Interest rate contracts | | Variation margin on centrally cleared swap contracts | | | $ — | | | | | | | Variation margin on centrally cleared swap contracts | | | $40,900,842 | a |
| | Unrealized appreciation on OTC swap contracts | | | — | | | | | | | Unrealized depreciation on OTC swap contracts | | | 3,509,368 | |
FRANKLIN TEMPLETON VARIABLE INSURANCE PRODUCTS TRUST
FINANCIAL STATEMENTS
Templeton Global Bond VIP Fund(continued)
9. Other Derivative Information (continued)
| | | | | | | | | | | | | | | | |
| | | |
| | | Asset Derivatives | | | | | | Liability Derivatives | |
| | | | | |
Derivative Contracts
Not Accounted for as Hedging Instruments | | Statement of
Assets and Liabilities
Location | | Fair Value | | | | | | Statement of
Assets and Liabilities
Location | | Fair Value | |
Foreign exchange contracts | | Investments in securities, at value | | $
| 10,749,140
| b
| | | | | | Options written, at value | | $ | 8,140,326 | |
| | | | | |
| | Unrealized appreciation on OTC forward exchange contracts | | | 10,800,410 | | | | | | | Unrealized depreciation on OTC forward exchange contracts | | | 24,353,192 | |
| | | | | | | | | | | | | | | | |
Totals | | | | $ | 21,549,550 | | | | | | | | | $ | 76,903,728 | |
| | | | | | | | | | | | | | | | |
aThis amount reflects the cumulative appreciation (depreciation) of centrally cleared swap contracts as reported in the Statement of Investments. Only the variation margin receivable/payable at period end is separately reported within the Statement of Assets and Liabilities. Prior variation margin movements were recorded to cash upon receipt or payment.
bPurchased option contracts are included in investments in securities, at value in the Statement of Assets and Liabilities.
For the period ended June 30, 2019, the effect of derivative contracts in the Statement of Operations was as follows:
| | | | | | | | | | | | | | | | |
| | | | | |
Derivative Contracts Not Accounted for as
Hedging Instruments | | Statement of Operations Location | | Net Realized
Gain (Loss) for
the Period | | | | | | Statement of Operations Location | | Net Change in
Unrealized
Appreciation
(Depreciation)
for the Period | |
| | Net realized gain (loss) from: | | | | | | | | | | Net change in unrealized appreciation (depreciation) on: | | | | |
Interest rate contracts | | Swap contracts | | $ | 1,230,638 | | | | | | | Swap contracts | | | $(63,106,879) | |
Foreign exchange contracts | | Investments | | | 433,153 | a | | | | | | Investments | | | (4,014,018)a | |
| | Written options | | | (270,237 | ) | | | | | | Written options | | | 3,018,827 | |
| | Forward exchange contracts | | | 73,887,062 | | | | | | | Forward exchange contracts | | | (18,328,568) | |
Value recovery instruments | | Investments | | | 4,142,988 | a | | | | | | Investments | | | (3,416,727)a | |
| | | | | | | | | | | | | | | | |
Totals | | | | $ | 79,423,604 | | | | | | | | | | $(85,847,365) | |
| | | | | | | | | | | | | | | | |
aPurchased option contracts and VRI are included in net realized gain (loss) from investments and net change in unrealized appreciation (depreciation) on investments in the Statement of Operations.
For the period ended June 30, 2019, the average month end notional amount of options and swap contracts, the average month end contract value for forward exchange contracts and average month end fair value of VRI, were as follows:
| | | | |
Options | | | $ 343,333,182 | |
Swap contracts | | | $ 821,224,000 | |
Forward exchange contracts | | | 2,993,537,783 | |
VRI | | | 7,181,264 | |
See Note 1(c) regarding derivative financial instruments.
FRANKLIN TEMPLETON VARIABLE INSURANCE PRODUCTS TRUST
FINANCIAL STATEMENTS
Templeton Global Bond VIP Fund(continued)
At June 30, 2019, OTC derivative assets and liabilities are as follows:
| | | | | | | | |
| | | Gross Amounts of Assets and Liabilities Presented
in the Statement of Assets and Liabilities | |
| | |
| | | Assetsa | | | Liabilitiesa | |
| Derivatives | | | | | | | | |
Forward exchange contracts | | | $10,800,410 | | | | $24,353,192 | |
Options purchased | | | 10,749,140 | | | | — | |
Options written | | | — | | | | 8,140,326 | |
Swap contracts | | | — | | | | 3,509,368 | |
| | | | |
| | |
Total | | | $21,549,550 | | | | $36,002,886 | |
| | | | |
aAbsent an event of default or early termination, OTC derivative assets and liabilities are presented gross and not offset in the Statement of Assets and Liabilities.
At June 30, 2019, OTC derivative assets, which may be offset against OTC derivative liabilities and collateral received from the counterparty, are as follows:
| | | | | | | | | | | | | | | | | | | | |
| | | | | | Amounts Not Offset in the | | | | |
| | | | | | Statement of Assets and Liabilities | | | | |
| | | | | |
| | | Gross Amounts of
Assets Presented in
the Statement of
Assets and Liabilities | | | Financial
Instruments
Available for
Offset | | | Financial
Instruments
Collateral
Receiveda,b | | | Cash
Collateral
Received | | | Net Amount
(Not less
than zero) | |
| | | | | |
| Counterparty | | | | | | | | | | | | | | | | | | | | |
BNDP | | | $ — | | | $ | — | | | $ | — | | | | $ — | | | | $ — | |
BOFA | | | 13,770 | | | | (13,770 | ) | | | — | | | | — | | | | — | |
BZWS | | | 398,021 | | | | (398,021 | ) | | | — | | | | — | | | | — | |
CITI | | | 10,798,389 | | | | (10,798,389 | ) | | | — | | | | — | | | | — | |
DBAB | | | 650,999 | | | | (650,999 | ) | | | — | | | | — | | | | — | |
GSCO | | | 313,768 | | | | (313,768 | ) | | | — | | | | — | | | | — | |
HSBK | | | 5,932,067 | | | | (4,745,878 | ) | | | (1,186,189 | ) | | | — | | | | — | |
JPHQ | | | 3,373,857 | | | | (3,373,857 | ) | | | — | | | | — | | | | — | |
MSCO | | | 54,347 | | | | (54,347 | ) | | | — | | | | — | | | | — | |
SCNY | | | 1,132 | | | | (1,132 | ) | | | — | | | | — | | | | — | |
UBSW | | | 13,200 | | | | (13,200 | ) | | | — | | | | — | | | | — | |
| | | | |
| | | | | |
Total | | | $21,549,550 | | | $ | (20,363,361 | ) | | | $(1,186,189 | ) | | | $ — | | | | $ — | |
| | | | |
FRANKLIN TEMPLETON VARIABLE INSURANCE PRODUCTS TRUST
FINANCIAL STATEMENTS
Templeton Global Bond VIP Fund(continued)
9. Other Derivative Information(continued)
At June 30, 2019, OTC derivative liabilities, which may be offset against OTC derivative assets and collateral pledged to the counterparty, are as follows:
| | | | | | | | | | | | | | | | | | | | |
| | | | | | Amounts Not Offset in the
Statement of Assets and Liabilities | | | | |
| | | Gross Amounts of Liabilities Presented in the Statement of Assets and Liabilities | | | Financial
Instruments
Available for Offset | | | Financial
Instruments
Collateral
Pledged | | | Cash
Collateral
Pledgedb | | | Net Amount
(Not less
than zero) | |
| | | | | |
| Counterparty | | | | | | | | | | | | | | | | | | | | |
BNDP | | | $ 589,478 | | | | $ — | | | | $ — | | | | $ (520,000 | ) | | | $ 69,478 | |
BOFA | | | 2,287,842 | | | | (13,770 | ) | | | — | | | | (2,274,072 | ) | | | — | |
BZWS | | | 1,210,046 | | | | (398,021 | ) | | | — | | | | (812,025 | ) | | | — | |
CITI | | | 11,997,014 | | | | (10,798,389 | ) | | | — | | | | (494,000 | ) | | | 704,625 | |
DBAB | | | 3,214,550 | | | | (650,999 | ) | | | — | | | | (2,542,000 | ) | | | 21,551 | |
GSCO | | | 3,579,210 | | | | (313,768 | ) | | | — | | | | (2,860,000 | ) | | | 405,442 | |
HSBK | | | 4,745,878 | | | | (4,745,878 | ) | | | — | | | | — | | | | — | |
JPHQ | | | 5,802,310 | | | | (3,373,857 | ) | | | — | | | | (1,260,000 | ) | | | 1,168,453 | |
MSCO | | | 694,003 | | | | (54,347 | ) | | | — | | | | (620,000 | ) | | | 19,656 | |
SCNY | | | 1,674,734 | | | | (1,132 | ) | | | — | | | | (1,405,000 | ) | | | 268,602 | |
UBSW | | | 207,821 | | | | (13,200 | ) | | | — | | | | (194,621 | ) | | | — | |
| | | | | |
Total | | | $36,002,886 | | | | $(20,363,361 | ) | | | $ — | | | | $(12,981,718 | ) | | | $2,657,807 | |
aAt June 30, 2019, the Fund received U.K. Treasury Bonds as collateral for derivatives.
bIn some instances, the collateral amounts disclosed in the table above were adjusted due to the requirement to limit collateral amounts to avoid the effect of overcollateralization. Actual collateral received and/or pledged may be more than the amounts disclosed herein.
See Abbreviations on pageTGB-36.
10. Credit Facility
The Fund, together with other U.S. registered and foreign investment funds (collectively, Borrowers), managed by Franklin Templeton, are borrowers in a joint syndicated senior unsecured credit facility totaling $2 billion (Global Credit Facility) which matures on February 7, 2020. This Global Credit Facility provides a source of funds to the Borrowers for temporary and emergency purposes, including the ability to meet future unanticipated or unusually large redemption requests.
Under the terms of the Global Credit Facility, the Fund shall, in addition to interest charged on any borrowings made by the Fund and other costs incurred by the Fund, pay its share of fees and expenses incurred in connection with the implementation and maintenance of the Global Credit Facility, based upon its relative share of the aggregate net assets of all of the Borrowers, including an annual commitment fee of 0.15% based upon the unused portion of the Global Credit Facility. These fees are reflected in other expenses in the Statement of Operations. During the period ended June 30, 2019, the Fund did not use the Global Credit Facility.
FRANKLIN TEMPLETON VARIABLE INSURANCE PRODUCTS TRUST
FINANCIAL STATEMENTS
Templeton Global Bond VIP Fund(continued)
11. Fair Value Measurements
The Fund follows a fair value hierarchy that distinguishes between market data obtained from independent sources (observable inputs) and the Fund’s own market assumptions (unobservable inputs). These inputs are used in determining the value of the Fund’s financial instruments and are summarized in the following fair value hierarchy:
| | • | Level 1 – quoted prices in active markets for identical financial instruments |
| | • | Level 2 – other significant observable inputs (including quoted prices for similar financial instruments, interest rates, prepayment speed, credit risk, etc.) |
| | • | Level 3 – significant unobservable inputs (including the Fund’s own assumptions in determining the fair value of financial instruments) |
The input levels are not necessarily an indication of the risk or liquidity associated with financial instruments at that level.
A summary of inputs used as of June 30, 2019, in valuing the Fund’s assets and liabilities carried at fair value, is as follows:
| | | | | | | | | | | | | | | | |
| | | Level 1 | | | Level 2 | | | Level 3 | | | Total | |
| |
| | | | |
| Assets: | | | | | | | | | | | | | | | | |
| | | | |
Investments in Securities:a | | | | | | | | | | | | | | | | |
Foreign Government and Agency Securities | | $ | — | | | $ | 1,382,946,845 | | | $ | — | | | $ | 1,382,946,845 | |
Options Purchased | | | — | | | | 10,749,140 | | | | — | | | | 10,749,140 | |
Short Term Investments | | | 892,766,792 | | | | 270,465,784 | | | | — | | | | 1,163,232,576 | |
| | | | |
| | | | |
Total Investments in Securities | | $ | 892,766,792 | | | $ | 1,664,161,769 | | | $ | — | | | $ | 2,556,928,561 | |
| | | | |
| | | | |
Other Financial Instruments: | | | | | | | | | | | | | | | | |
| | | | |
Forward Exchange Contracts | | $ | — | | | $ | 10,800,410 | | | $ | — | | | $ | 10,800,410 | |
| | | | |
| | | | |
| Liabilities: | | | | | | | | | | | | | | | | |
| | | | |
Other Financial Instruments: | | | | | | | | | | | | | | | | |
| | | | |
Options Written | | $ | — | | | $ | 8,140,326 | | | $ | — | | | $ | 8,140,326 | |
| | | | |
Forward Exchange Contracts | | | — | | | | 24,353,192 | | | | — | | | | 24,353,192 | |
| | | | |
Swap Contracts | | | — | | | | 44,410,210 | | | | — | | | | 44,410,210 | |
| | | | |
| | | | |
Total Other Financial Instruments | | $ | — | | | $ | 76,903,728 | | | $ | — | | | $ | 76,903,728 | |
| | | | |
aFor detailed categories, see the accompanying Statement of Investments.
12. Subsequent Events
The Fund has evaluated subsequent events through the issuance of the financial statements and determined that no events have occurred that require disclosure.
FRANKLIN TEMPLETON VARIABLE INSURANCE PRODUCTS TRUST
FINANCIAL STATEMENTS
Templeton Global Bond VIP Fund(continued)
Abbreviations
| | | | | | | | | | |
| Counterparty | | Currency | | Selected Portfolio |
| | | | | |
BNDP | | BNP Paribas SA | | ARS | | Argentine Peso | | ARPP7DRR | | Argentina Central Bank 7 Day Repo Rate |
BOFA | | Bank of America Corp. | | AUD | | Australian Dollar | | BADLAR | | Argentina Deposit Rates Badlar Private |
BZWS | | Barclays Bank PLC | | BRL | | Brazilian Real | | | | Banks ARS |
CITI | | Citigroup, Inc. | | COP | | Colombian Peso | | FRN | | Floating Rate Note |
DBAB | | Deutsche Bank AG | | EUR | | Euro | | LIBOR | | London InterBank Offered Rate |
GSCO | | The Goldman Sachs Group, Inc. | | GHS | | Ghanaian Cedi | | | | |
HSBK | | HSBC Bank PLC | | IDR | | Indonesian Rupiah | | | | |
JPHQ | | JP Morgan Chase & Co. | | INR | | Indian Rupee | | | | |
MSCO | | Morgan Stanley | | JPY | | Japanese Yen | | | | |
SCNY | | Standard Chartered Bank | | KRW | | South Korean Won | | | | |
UBSW | | UBS AG | | MXN | | Mexican Peso | | | | |
| | | | PHP | | Philippine Peso | | | | |
| | | | USD | | United States Dollar | | | | |
FRANKLIN TEMPLETON VARIABLE INSURANCE PRODUCTS TRUST
Tax Information (unaudited)
Templeton Global Bond VIP Fund
At December 31, 2018, more than 50% of the Fund’s total assets were invested in securities of foreign issuers. In most instances, foreign taxes were withheld from income paid to the Fund on these investments. As shown in the table below, the Fund hereby reports to shareholders the foreign source income and foreign taxes paid, pursuant to Section 853 of the Internal Revenue Code. This written statement will allow shareholders of record on June 13, 2019, to treat their proportionate share of foreign taxes paid by the Fund as having been paid directly by them. The shareholder shall consider these amounts as foreign taxes paid in the tax year in which they receive the Fund distribution.
The following table provides a detailed analysis of foreign tax paid and foreign source income as reported by the Fund to shareholders of record.
| | | | | | | | |
| | |
| Class | | Foreign Tax Paid
Per Share | | | Foreign Source
Income Per Share | |
| | |
Class 1 | | | $0.0282 | | | | $0.8543 | |
Class 2 | | | $0.0282 | | | | $0.8235 | |
Class 4 | | | $0.0282 | | | | $0.8111 | |
Foreign Tax Paid Per Share is the amount per share available to you, as a tax credit (assuming you held your shares in the Fund for a minimum of 16 days during the31-day period beginning 15 days before theex-dividend date of the Fund’s distribution to which the foreign taxes relate), or, as a tax deduction.
Foreign Source Income Per Share is the amount per share of income dividends attributable to foreign securities held by the Fund, plus any foreign taxes withheld on these dividends.
This page intentionally left blank.
Templeton Growth VIP Fund
This semiannual report for Templeton Growth VIP Fund covers the period ended June 30, 2019.
Class 2 Performance Summary as of June 30, 2019
The Fund’s Class 2 Shares posted a +7.34% total return* for thesix-month period ended June 30, 2019.
*The Fund has a fee waiver associated with any investments it makes in a Franklin Templeton money fund and/or other Franklin Templeton fund, contractually guaranteed through 4/30/20. Fund investment results reflect the expense reduction and fee waiver; without these reductions, the results would have been lower.
Performance reflects the Fund’s Class 2 operating expenses, but doesnotinclude any contract fees, expenses or sales charges. If they had been included, performance would be lower. These charges and deductions, particularly for variable life policies, can have a significant effect on contract values and insurance benefits. See the contract prospectus for a complete description of these expenses, including sales charges.
Performance data represent past performance, which does not guarantee future results. Investment return and principal value will fluctuate, and you may have a gain or loss when you sell your shares. Current performance may differ from figures shown.
TEMPLETON GROWTH VIP FUND
Fund Goal and Main Investments
The Fund seeks long-term capital growth. Under normal market conditions, the Fund invests predominantly in equity securities (primarily common stocks) of companies located anywhere in the world, including developing markets.
Fund Risks
All investments involve risks, including possible loss of principal. Special risks are associated with foreign investing, including currency fluctuations, economic instability and political developments; investments in emerging markets involve heightened risks related to the same factors. Because the Fund may invest its assets in companies in a specific region, including Europe, it is subject to greater risks of adverse developments in that region and/or the surrounding regions than a fund that is more broadly diversified geographically. Political, social or economic disruptions in the region, even in countries in which the Fund is not invested, may adversely affect the value of securities held by the Fund. Current political and financial uncertainty surrounding the European Union (EU) and the financial instability of some countries in the EU may increase market volatility and the economic risk of investing in companies in Europe. In addition, smaller company stocks have historically experienced more price volatility than larger company stocks, especially over the short term. The Fund is actively managed but there is no guarantee that the manager’s investment decisions will produce the desired results. The Fund’s prospectus also includes a description of the main investment risks.
Performance Overview
You can find the Fund’ssix-month total return in the Performance Summary. For comparison, the Fund’s benchmark, the MSCI All Country World Index (ACWI), posted a +16.60% total return for the period under review.1
Economic and Market Overview
The global economy expanded during the six months ended June 30, 2019, despite weakness in certain regions. Global developed and emerging market stocks were aided by upbeat economic data in some regions, encouraging corporate earnings reports and periods of optimism about a
Geographic Composition
Based on Total Net Assets as of 6/30/19
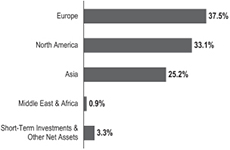
potential U.S.-China trade deal. Further supporting markets were the U.S. Federal Reserve’s (Fed’s) patient approach to its monetary policy in 2019 and recent indication it will act as appropriate to sustain U.S. economic expansion.
However, markets reflected concerns about political uncertainties in the U.S. and the European Union, geopolitical risks in certain regions, and the impact of U.S. trade disputes with China and other trading partners on global growth and corporate earnings. In this environment, global developed and emerging market stocks, as measured by the MSCI ACWI, posted a +16.60% total return for thesix-month period.1
The U.S. economy grew during the six months ended June 30, 2019. After moderating for two consecutive quarters, the economy grew significantly faster in 2019’s first quarter, driven by growth in consumer spending, inventory investment, exports, business investment, and state and local government spending. However, the economy moderated again in the second quarter, due to weakness in inventory investment, exports, business investment and housing investment. The unemployment rate decreased from 3.9% in December 2018 to 3.7% atperiod-end.2 The annual inflation rate, as measured by the Consumer Price Index, decreased from 1.9% in December 2018 to 1.6% atperiod-end.2
The Fed held its target range for the federal funds rate unchanged, at 2.25%–2.50%, during the reporting period. In March, the Fed mentioned it would end its balance sheet
1. Source: Morningstar. One cannot invest directly in an index, and an index is not representative of the Fund’s portfolio. Please see Index Descriptions following the Fund Summaries.
2. Source: U.S. Bureau of Labor Statistics.
The dollar value, number of shares or principal amount, and names of all portfolio holdings are listed in the Fund’s Statement of Investments (SOI).
TEMPLETON GROWTH VIP FUND
normalization program by the end of September 2019. In June, the Fed indicated increased uncertainties around its views on economic activity and the labor market. With market-based inflation measures remaining low recently, the market has interpreted the Fed’s recent statements to mean it will likely cut rates in 2019’s second half to foster continued economic growth while attempting to achieve its inflation objective.
In Europe, the U.K.’s quarterly gross domestic product (GDP) growth accelerated in 2019’s first quarter. The Bank of England left its key policy rate unchanged during the period. The eurozone’s quarterly GDP accelerated in 2019’s first quarter. However, the bloc’s annual inflation rate decreased during the period. The European Central Bank (ECB) kept its benchmark interest rate unchanged during the period. In June, the ECB mentioned it would leave interest rates unchanged through the first half of 2020, provided details of its new stimulus, and indicated its openness to cut rates or increase stimulus.
In Asia, Japan’s quarterly GDP growth accelerated in 2019’s first quarter. In June, the Bank of Japan also left its benchmark interest rate unchanged, while continuing its stimulus measures, and expressed its openness to cut interest rates or increase stimulus.
In larger emerging markets, Brazil’s quarterly GDP growth contracted in 2019’s first quarter. The Central Bank of Brazil left its benchmark interest rate unchanged during the period. Russia’s annual GDP growth moderated in 2019’s first quarter. The Bank of Russia cut its key rate once during the period. China’s annual GDP growth rate stabilized in 2019’s first quarter. The People’s Bank of China left its benchmark interest rate unchanged, but it took measures to improve financial liquidity to mitigate the effects of the U.S.-China trade dispute and support economic growth. Overall, global emerging market stocks, as measured by the MSCI Emerging Markets Index, posted a +10.78% total return during thesix-month period.1
Investment Strategy
Our investment philosophy is bottom up, value oriented and long term. When choosing equity investments for the Fund, we focus on the market price of a company’s securities relative to our evaluation of the company’s potential long-term earnings, asset value and cash flow. This includes an assessment by the investment manager of the potential
impacts of material environmental, social and governance factors on the long-term risk and return profile of a company. We also consider a company’s price/earnings ratio, price/cash flow ratio, profit margins and liquidation value.
Manager’s Discussion
Stock selection in the utilities sector, particularly in multi-utilities, contributed to relative results.3 French transnational company Veolia Environnement was the sector’s top relative contributor. Veolia’s share price continues to rally due to better-than-expected earnings, boosted by strong growth in new hazardous waste treatment and plastics recycling, favorable water tax rulings and new water contracts. The company has also increased its dividend and earnings outlook for 2019.
In other sectors, key relative contributors included multiple American companies: global beauty firm Coty, banking firm Citigroup, pharmaceutical company Allergan, computer technology firm Oracle, truckmaker Navistar International (not part of the index) and pharmaceutical company Perrigo. Swedish health care equipment and supplies firm Getinge (not part of the index, not held atperiod-end) and Canadian precious metals firm Wheaton Precious Metals also contributed to relative results. Wheaton benefited from a favorable settlement related to a Canadian tax audit that had depressed its share price for years. Shares also rallied in May after the firm’s reported earnings and gold production beat consensus expectations. The stock remains an attractive holding, trading at what we view as reasonable valuations on a variety of metrics and providing a capital-light,low-cost streaming model that offers gold exposure with superior economics compared to traditional mining companies.
In contrast, stock selection in the communication services sector, especially in media, detracted from relative results.4 Notable detractors included Luxembourg-based media firm SES, Chinese internet services company Baidu and British telecommunications company Vodafone. Baidu’s stock price fell amid a cyclical slowdown in China’s economy. We believe Baidu’s core search business remains undervalued, and the company has enjoyed strong growth in active daily users and a high cash position.
Stock selection in the consumer staples sector, particularly in food and staples retailing, also detracted from relative
3. The utilities sector comprises gas utilities and multi-utilities in the SOI.
4. The communication services sector comprises diversified telecommunication services, interactive media and services, media and wireless telecommunication services in the SOI.
TEMPLETON GROWTH VIP FUND
performance.5 Key detractors included American companies such as drugstore Walgreens Boots Alliance, supermarket chain The Kroger Co. and food manufacturer Kellogg. Japanese food retailer Seven & i Holdings also hurt relative performance.
In other sectors, key relative detractors included Israeli pharmaceuticals firm Teva Pharmaceutical Industries, Chinese natural gas distributor Kunlun Energy and Japanese household durables firm Panasonic. Teva’s share price declined due to weakness in the U.S. generic drug market and slumping sales of one of its aging flagship drugs. A surprising settlement of a U.S. opioid lawsuit, which added to the existing litigation risk surrounding an industry-wide price-fixing scandal, also hurt its share price. While these situations are unlikely to materially impact near-term cash flow—which we believe should improve amid ongoing cost-cutting—they do raise the risk profile of the investment, particularly in light of Teva’s high financial and operating leverage in the competitive, commodity-like generic drug industry.
From a geographic perspective, no regions contributed to relative performance, but stock selection in Sweden and Singapore did help the Fund’s results. In contrast, stock selection in Europe, particularly in the U.K., detracted from relative performance. An overweighting in Luxembourg also hurt results. Other relative detractors included stock selection in Asia, particularly in China and Japan, and North America, notably in the U.S.
Thank you for your participation in Templeton Growth VIP Fund. We look forward to serving your future investment needs.
The foregoing information reflects our analysis, opinions and portfolio holdings as of June 30, 2019, the end of the reporting period. The way we implement our main investment strategies and the resulting portfolio holdings may change depending on factors such as market and economic conditions. These opinions may not be relied upon as investment advice or an offer for a particular security. The information is not a complete analysis of every aspect of any market, country, industry, security or the Fund. Statements of fact are from sources considered reliable, but the investment manager makes no representation or warranty as to their completeness or accuracy. Although historical performance is no guarantee of future results, these insights may help you understand our investment management philosophy.
Top 10 Holdings
6/30/19
| | | | |
| |
Company
Sector/Industry, Country | | % of Total
Net Assets | |
Allergan PLC
Pharmaceuticals, U.S. | | | 2.7% | |
Singapore Telecommunications Ltd.
Diversified Telecommunication Services, Singapore | | | 2.6% | |
Citigroup Inc.
Banks, U.S. | | | 2.6% | |
BP PLC
Oil, Gas & Consumable Fuels, U.K. | | | 2.4% | |
SES SA
Media, Luxembourg | | | 2.3% | |
Royal Dutch Shell PLC
Oil, Gas & Consumable Fuels, U.K. | | | 2.3% | |
BNP Paribas SA
Banks, France | | | 2.2% | |
Kellogg Co.
Food Products, U.S. | | | 2.1% | |
Takeda Pharmaceutical Co. Ltd.
Pharmaceuticals, Japan | | | 2.0% | |
Standard Chartered PLC
Banks, U.K. | | | 2.0% | |
5. The consumer staples sector comprises beverages, food and staples retailing, food products and personal products in the SOI.
TEMPLETON GROWTH VIP FUND
Class 2 Fund Expenses
As an investor in a variable insurance contract (Contract) that indirectly provides for investment in an underlying mutual fund, you can incur transaction and/or ongoing expenses at both the Fund level and the Contract Level: (1) transaction expenses can include sales charges (loads) on purchases, surrender fees, transfer fees and premium taxes; and (2) ongoing expenses can include management fees, distribution and service(12b-1) fees, contract fees, annual maintenance fees, mortality and expense risk fees and other fees and expenses. All mutual funds and Contracts have some types of ongoing expenses. The table below shows Fund-level ongoing expenses and can help you understand these costs and compare them with those of other mutual funds offered through the Contract. The table assumes a $1,000 investment held for the six months indicated. Please refer to the Fund prospectus for additional information on operating expenses.
Actual Fund Expenses
The table below provides information about the actual account values and actual expenses in the columns under the heading “Actual.” In these columns the Fund’s actual return, which includes the effect of ongoing Fund expenses but does not include the effect of ongoing Contract expenses, is used to calculate the “Ending Account Value.” You can estimate the Fund-level expenses you paid during the period by following these steps (of course, your account value and expenses will differ from those in this illustration): Divide your account value by $1,000 (if your account had an $8,600 value, then $8,600÷ $1,000 =8.6). Then multiply the result by the number under the headings “Actual” and “Fund-Level Expenses Paid During Period” (if Fund-Level Expenses Paid During Period were $ 7.50, then 8.6 x $ 7.50 = $64.50). In this illustration, the estimated expenses paid this period at the Fund level are $64.50.
Hypothetical Example for Comparison with Other Mutual Funds
Under the heading “Hypothetical” in the table, information is provided about hypothetical account values and hypothetical expenses based on the Fund’s actual expense ratio and an assumed rate of return of 5% per year before expenses, which is not the Fund’s actual return. This information may not be used to estimate the actual ending account balance or expenses you paid for the period, but it can help you compare ongoing costs of investing in the Fund with those of other mutual funds offered through the Contract. To do so, compare this 5% hypothetical example with the 5% hypothetical examples that appear in the shareholder reports of other funds offered through the Contract.
Please note that expenses shown in the table are meant to highlight ongoing costs at the Fund level only and do not reflect any ongoing expenses at the Contract level, or transaction expenses at either the Fund or Contract levels. In addition, while the Fund does not have transaction expenses, if the transaction and ongoing expenses at the Contract level were included, the expenses shown below would be higher. You should consult your Contract prospectus or disclosure document for more information.
| | | | | | | | | | | | | | | | |
| | | | | | |
| | | | | Actual (actual return after expenses) | | | | Hypothetical (5% annual return before expenses) | | | | |
Share Class | | Beginning
Account Value 1/1/19 | | Ending Account Value 6/30/19 | | Fund-Level
Expenses Paid During
Period 1/1/19–6/30/191, 2 | | | | Ending Account Value 6/30/19 | | Fund-Level
Expenses Paid During
Period 1/1/19–6/30/191, 2 | | | | Net Annualized
Expense Ratio2
|
| | | | | | | | | | |
Class 2 | | $1,000 | | $1,073.40 | | $5.65 | | | | $1,019.34 | | $5.51 | | | | 1.10% |
1. Expenses are equal to the annualized expense ratio for thesix-month period as indicated above—in the far right column—multiplied by the simple average account value over the period indicated, and then multiplied by 181/365 to reflect theone-half year period.
2. Reflects expenses after fee waivers and expense reimbursements. Does not include any ongoing expenses of the Contract for which the Fund is an investment option or acquired fund fees and expenses.
FRANKLIN TEMPLETON VARIABLE INSURANCE PRODUCTS TRUST
Financial Highlights
Templeton Growth VIP Fund
| | | | | | | | | | | | | | | | | | | | | | | | |
| | |
| | | Six Months Ended
June 30, 2019 (unaudited) | | | Year Ended December 31, | |
| | | 2018 | | | 2017 | | | 2016 | | | 2015 | | | 2014 | |
| |
| | | | | | |
Class 1 | | | | | | | | | | | | | | | | | | | | | | | | |
| | | | | | |
Per share operating performance (for a share outstanding throughout theperiod) | | | | | | | | | | | | | | | | | | | | | | | | |
| | | | | | |
Net asset value, beginning of period | | | $12.44 | | | | $16.24 | | | | $13.93 | | | | $13.54 | | | | $14.85 | | | | $15.47 | |
| | | | |
| | | | | | |
Income from investment operationsa: | | | | | | | | | | | | | | | | | | | | | | | | |
| | | | | | |
Net investment incomeb | | | 0.18 | | | | 0.28 | | | | 0.29 | | | | 0.26 | | | | 0.28 | | | | 0.38c | |
| | | | | | |
Net realized and unrealized gains (losses) | | | 0.65 | | | | (2.42 | ) | | | 2.30 | | | | 0.96 | | | | (1.17 | ) | | | (0.75) | |
| | | | |
| | | | | | |
Total from investment operations | | | 0.83 | | | | (2.14 | ) | | | 2.59 | | | | 1.22 | | | | (0.89 | ) | | | (0.37) | |
| | | | |
| | | | | | |
Less distributions from: | | | | | | | | | | | | | | | | | | | | | | | | |
| | | | | | |
Net investment income | | | (0.40 | ) | | | (0.35 | ) | | | (0.28 | ) | | | (0.31 | ) | | | (0.42 | ) | | | (0.25) | |
| | | | | | |
Net realized gains | | | (2.49 | ) | | | (1.31 | ) | | | — | | | | (0.52 | ) | | | — | | | | — | |
| | | | |
| | | | | | |
Total distributions | | | (2.89 | ) | | | (1.66 | ) | | | (0.28 | ) | | | (0.83 | ) | | | (0.42 | ) | | | (0.25) | |
| | | | |
| | | | | | |
Net asset value, end of period | | | $10.38 | | | | $12.44 | | | | $16.24 | | | | $13.93 | | | | $13.54 | | | | $14.85 | |
| | | | |
| | | | | | |
Total returnd | | | 7.46% | | | | (14.61)% | | | | 18.77% | | | | 9.90% | | | | (6.24)% | | | | (2.53)% | |
| | | | | | |
Ratios to average net assetse | | | | | | | | | | | | | | | | | | | | | | | | |
| | | | | | |
Expenses | | | 0.85% | f | | | 0.83% | f | | | 0.82% | f,g | | | 0.82% | f | | | 0.80% | f | | | 0.78% | |
| | | | | | |
Net investment income | | | 3.24% | | | | 1.90% | | | | 1.94% | | | | 2.01% | | | | 1.96% | | | | 2.46% | c |
| | | | | | |
Supplemental data | | | | | | | | | | | | | | | | | | | | | | | | |
| | | | | | |
Net assets, end of period (000’s) | | | $95,901 | | | | $354,164 | | | | $466,207 | | | | $453,997 | | | | $468,548 | | | | $572,860 | |
| | | | | | |
Portfolio turnover rate | | | 11.43% | | | | 29.25% | | | | 26.46% | | | | 22.88% | | | | 20.92% | | | | 17.46% | |
aThe amount shown for a share outstanding throughout the period may not correlate with the Statement of Operations for the period due to the timing of sales and repurchases of the Fund’s shares in relation to income earned and/or fluctuating fair value of the investments of the Fund.
bBased on average daily shares outstanding.
cNet investment income per share includes approximately $0.09 per share related to income received in the form of special dividends in connection with certain Fund holdings. Excluding this amount, the ratio of net investment income to average net assets would have been 1.88%.
dTotal return does not include fees, charges or expenses imposed by the variable annuity and life insurance contracts for which Franklin Templeton Variable Insurance Products Trust serves as an underlying investment vehicle. Total return is not annualized for periods less than one year.
eRatios are annualized for periods less than one year.
fBenefit of waiver and payments by affiliates rounds to less than 0.01%.
gBenefit of expense reduction rounds to less than 0.01%.
| | |
| | |
TG-6 | | Semiannual Report | The accompanying notes are an integral part of these financial statements. |
FRANKLIN TEMPLETON VARIABLE INSURANCE PRODUCTS TRUST
FINANCIAL HIGHLIGHTS
Templeton Growth VIP Fund(continued)
| | | | | | | | | | | | | | | | | | | | | | | | |
| | |
| | | Six Months Ended
June 30, 2019 (unaudited) | | | Year Ended December 31, | |
| | | 2018 | | | 2017 | | | 2016 | | | 2015 | | | 2014 | |
| |
| | | | | | |
Class 2 | | | | | | | | | | | | | | | | | | | | | | | | |
| | | | | | |
Per share operating performance (for a share outstanding throughout the period) | | | | | | | | | | | | | | | | | | | | | | | | |
| | | | | | |
Net asset value, beginning of period | | | $12.21 | | | | $15.97 | | | | $13.70 | | | | $13.32 | | | | $14.61 | | | | $15.23 | |
| | | | |
| | | | | | |
| Income from investment operationsa: | | | | | | | | | | | | | | | | | | | | | | | | |
| | | | | | |
Net investment incomeb | | | 0.20 | | | | 0.24 | | | | 0.25 | | | | 0.23 | | | | 0.25 | | | | 0.34c | |
| | | | | | |
Net realized and unrealized gains (losses) | | | 0.60 | | | | (2.38 | ) | | | 2.26 | | | | 0.94 | | | | (1.16 | ) | | | (0.75) | |
| | | | |
| | | | | | |
Total from investment operations | | | 0.80 | | | | (2.14 | ) | | | 2.51 | | | | 1.17 | | | | (0.91 | ) | | | (0.41) | |
| | | | |
| | | | | | |
Less distributions from: | | | | | | | | | | | | | | | | | | | | | | | | |
| | | | | | |
Net investment income | | | (0.36 | ) | | | (0.31 | ) | | | (0.24 | ) | | | (0.27 | ) | | | (0.38 | ) | | | (0.21) | |
| | | | | | |
Net realized gains | | | (2.49 | ) | | | (1.31 | ) | | | — | | | | (0.52 | ) | | | — | | | | — | |
| | | | |
| | | | | | |
Total distributions | | | (2.85 | ) | | | (1.62 | ) | | | (0.24 | ) | | | (0.79 | ) | | | (0.38 | ) | | | (0.21) | |
| | | | |
| | | | | | |
Net asset value, end of period | | | $10.16 | | | | $12.21 | | | | $15.97 | | | | $13.70 | | | | $13.32 | | | | $14.61 | |
| | | | |
| | | | | | |
Total returnd | | | 7.34% | | | | (14.85)% | | | | 18.50% | | | | 9.62% | | | | (6.49)% | | | | (2.81)% | |
| | | | | | |
| Ratios to average net assetse | | | | | | | | | | | | | | | | | | | | | | | | |
| | | | | | |
Expenses | | | 1.10% | f | | | 1.08% | f | | | 1.07% | f,g | | | 1.07% | f | | | 1.05% | f | | | 1.03% | |
| | | | | | |
Net investment income | | | 2.99% | | | | 1.65% | | | | 1.69% | | | | 1.76% | | | | 1.71% | | | | 2.21% | c |
| | | | | | |
Supplemental data | | | | | | | | | | | | | | | | | | | | | | | | |
| | | | | | |
Net assets, end of period (000’s) | | | $641,016 | | | | $625,311 | | | | $879,521 | | | | $876,128 | | | | $921,895 | | | | $1,171,896 | |
| | | | | | |
Portfolio turnover rate | | | 11.43% | | | | 29.25% | | | | 26.46% | | | | 22.88% | | | | 20.92% | | | | 17.46% | |
aThe amount shown for a share outstanding throughout the period may not correlate with the Statement of Operations for the period due to the timing of sales and repurchases of the Fund’s shares in relation to income earned and/or fluctuating fair value of the investments of the Fund.
bBased on average daily shares outstanding.
cNet investment income per share includes approximately $0.09 per share related to income received in the form of special dividends in connection with certain Fund holdings. Excluding this amount, the ratio of net investment income to average net assets would have been 1.63%.
dTotal return does not include fees, charges or expenses imposed by the variable annuity and life insurance contracts for which Franklin Templeton Variable Insurance Products Trust serves as an underlying investment vehicle. Total return is not annualized for periods less than one year.
eRatios are annualized for periods less than one year.
fBenefit of waiver and payments by affiliates rounds to less than 0.01%.
gBenefit of expense reduction rounds to less than 0.01%.
| | | | | | |
| | | |
| | The accompanying notes are an integral part of these financial statements. | Semiannual Report | | | TG-7 | |
FRANKLIN TEMPLETON VARIABLE INSURANCE PRODUCTS TRUST
FINANCIAL HIGHLIGHTS
Templeton Growth VIP Fund(continued)
| | | | | | | | | | | | | | | | | | | | | | | | |
| | |
| | | Six Months Ended
June 30, 2019 (unaudited) | | | Year Ended December 31, | |
| | | 2018 | | | 2017 | | | 2016 | | | 2015 | | | 2014 | |
| |
| | | | | | |
Class 4 | | | | | | | | | | | | | | | | | | | | | | | | |
| | | | | | |
Per share operating performance (for a share outstanding throughout the period) | | | | | | | | | | | | | | | | | | | | | | | | |
| | | | | | |
Net asset value, beginning of period | | | $12.36 | | | | $16.13 | | | | $13.83 | | | | $13.44 | | | | $14.73 | | | | $15.35 | |
| | | | |
| | | | | | |
Income from investment operationsa: | | | | | | | | | | | | | | | | | | | | | | | | |
| | | | | | |
Net investment incomeb | | | 0.20 | | | | 0.23 | | | | 0.24 | | | | 0.22 | | | | 0.23 | | | | 0.33 | c |
| | | | | | |
Net realized and unrealized gains (losses) | | | 0.60 | | | | (2.40 | ) | | | 2.28 | | | | 0.94 | | | | (1.16 | ) | | | (0.76) | |
| | | | |
| | | | | | |
Total from investment operations | | | 0.80 | | | | (2.17 | ) | | | 2.52 | | | | 1.16 | | | | (0.93 | ) | | | (0.43) | |
| | | | |
| | | | | | |
Less distributions from: | | | | | | | | | | | | | | | | | | | | | | | | |
| | | | | | |
Net investment income | | | (0.35 | ) | | | (0.29 | ) | | | (0.22 | ) | | | (0.25 | ) | | | (0.36 | ) | | | (0.19) | |
| | | | | | |
Net realized gains | | | (2.49 | ) | | | (1.31 | ) | | | — | | | | (0.52 | ) | | | — | | | | — | |
| | | | |
| | | | | | |
Total distributions | | | (2.84 | ) | | | (1.60 | ) | | | (0.22 | ) | | | (0.77 | ) | | | (0.36 | ) | | | (0.19) | |
| | | | |
| | | | | | |
Net asset value, end of period | | | $10.32 | | | | $12.36 | | | | $16.13 | | | | $13.83 | | | | $13.44 | | | | $14.73 | |
| | | | |
| | | | | | |
Total returnd | | | 7.18% | | | | (14.88)% | | | | 18.38% | | | | 9.47% | | | | (6.54)% | | | | (2.88)% | |
| | | | | | |
Ratios to average net assetse | | | | | | | | | | | | | | | | | | | | | | | | |
| | | | | | |
Expenses | | | 1.20%f | | | | 1.18%f | | | | 1.17% | f,g | | | 1.17%f | | | | 1.15%f | | | | 1.13% | |
| | | | | | |
Net investment income | | | 2.89% | | | | 1.55% | | | | 1.59% | | | | 1.66% | | | | 1.61% | | | | 2.11% | c |
| | | | | | |
Supplemental data | | | | | | | | | | | | | | | | | | | | | | | | |
| | | | | | |
Net assets, end of period (000’s) | | | $27,768 | | | | $28,238 | | | | $38,798 | | | | $43,286 | | | | $47,777 | | | | $59,989 | |
| | | | | | |
Portfolio turnover rate | | | 11.43% | | | | 29.25% | | | | 26.46% | | | | 22.88% | | | | 20.92% | | | | 17.46% | |
aThe amount shown for a share outstanding throughout the period may not correlate with the Statement of Operations for the period due to the timing of sales and repurchases of the Fund’s shares in relation to income earned and/or fluctuating fair value of the investments of the Fund.
bBased on average daily shares outstanding.
cNet investment income per share includes approximately $0.09 per share related to income received in the form of special dividends in connection with certain Fund holdings. Excluding this amount, the ratio of net investment income to average net assets would have been 1.53%.
dTotal return does not include fees, charges or expenses imposed by the variable annuity and life insurance contracts for which Franklin Templeton Variable Insurance Products Trust serves as an underlying investment vehicle. Total return is not annualized for periods less than one year.
eRatios are annualized for periods less than one year.
fBenefit of waiver and payments by affiliates rounds to less than 0.01%.
gBenefit of expense reduction rounds to less than 0.01%.
| | | | |
| | | |
TG-8 | | Semiannual Report | The accompanying notes are an integral part of these financial statements. | | |
FRANKLIN TEMPLETON VARIABLE INSURANCE PRODUCTS TRUST
Statement of Investments, June 30, 2019 (unaudited)
Templeton Growth VIP Fund
| | | | | | | | | | | | |
| | | |
| | | Country | | | Shares | | | Value | |
| | | |
Common Stocks 96.7% | | | | | | | | | | | | |
| | | |
Air Freight & Logistics 1.5% | | | | | | | | | | | | |
United Parcel Service Inc., B | | | United States | | | | 108,330 | | | $ | 11,187,239 | |
| | | | | | | | | | | | |
| | | |
Automobiles 0.7% | | | | | | | | | | | | |
Hero Motocorp Ltd. | | | India | | | | 141,930 | | | | 5,313,884 | |
| | | | | | | | | | | | |
| | | |
Banks 16.9% | | | | | | | | | | | | |
Bangkok Bank PCL, fgn | | | Thailand | | | | 1,250,380 | | | | 8,107,710 | |
Bank of Ireland Group PLC | | | Ireland | | | | 581,690 | | | | 3,039,308 | |
BNP Paribas SA | | | France | | | | 349,237 | | | | 16,581,962 | |
Citigroup Inc. | | | United States | | | | 282,490 | | | | 19,782,775 | |
Credit Agricole SA | | | France | | | | 745,066 | | | | 8,931,913 | |
HSBC Holdings PLC | | | United Kingdom | | | | 1,495,704 | | | | 12,406,523 | |
ING Groep NV | | | Netherlands | | | | 1,228,286 | | | | 14,237,460 | |
KB Financial Group Inc. | | | South Korea | | | | 280,494 | | | | 11,116,091 | |
Standard Chartered PLC | | | United Kingdom | | | | 1,703,223 | | | | 15,448,203 | |
Sumitomo Mitsui Financial Group Inc. | | | Japan | | | | 271,960 | | | | 9,600,072 | |
Wells Fargo & Co. | | | United States | | | | 203,257 | | | | 9,618,121 | |
| | | | | | | | | | | | |
| | | | | | | | | | | 128,870,138 | |
| | | | | | | | | | | | |
| | | |
Beverages 1.2% | | | | | | | | | | | | |
Kirin Holdings Co. Ltd. | | | Japan | | | | 102,600 | | | | 2,211,010 | |
Suntory Beverage & Food Ltd. | | | Japan | | | | 165,960 | | | | 7,211,302 | |
| | | | | | | | | | | | |
| | | | | | | | | | | 9,422,312 | |
| | | | | | | | | | | | |
| | | |
Biotechnology 1.8% | | | | | | | | | | | | |
Gilead Sciences Inc. | | | United States | | | | 207,830 | | | | 14,040,995 | |
| | | | | | | | | | | | |
Building Products 0.7% | | | | | | | | | | | | |
Compagnie de Saint-Gobain | | | France | | | | 137,620 | | | | 5,362,437 | |
| | | | | | | | | | | | |
| | | |
Capital Markets 1.1% | | | | | | | | | | | | |
UBS Group AG | | | Switzerland | | | | 641,450 | | | | 7,620,278 | |
Value Partners Group Ltd. | | | Hong Kong | | | | 1,525,640 | | | | 1,017,464 | |
| | | | | | | | | | | | |
| | | | | | | | | | | 8,637,742 | |
| | | | | | | | | | | | |
| | | |
Chemicals 0.2% | | | | | | | | | | | | |
Akzo Nobel NV | | | Netherlands | | | | 19,702 | | | | 1,850,989 | |
| | | | | | | | | | | | |
| | | |
Communications Equipment 0.6% | | | | | | | | | | | | |
aCommScope Holding Co. Inc. | | | United States | | | | 298,730 | | | | 4,699,023 | |
| | | | | | | | | | | | |
| | | |
Construction Materials 0.5% | | | | | | | | | | | | |
Taiheiyo Cement Corp. | | | Japan | | | | 136,800 | | | | 4,136,227 | |
| | | | | | | | | | | | |
| | | |
Consumer Finance 1.6% | | | | | | | | | | | | |
Capital One Financial Corp. | | | United States | | | | 137,560 | | | | 12,482,194 | |
| | | | | | | | | | | | |
| | | |
Diversified Telecommunication Services 4.7% | | | | | | | | | | | | |
China Telecom Corp. Ltd., ADR | | | China | | | | 98,965 | | | | 4,951,219 | |
Singapore Telecommunications Ltd. | | | Singapore | | | | 7,759,230 | | | | 20,068,210 | |
Telefonica SA | | | Spain | | | | 901,225 | | | | 7,398,331 | |
Verizon Communications Inc. | | | United States | | | | 63,530 | | | | 3,629,469 | |
| | | | | | | | | | | | |
| | | | | | | | | | | 36,047,229 | |
| | | | | | | | | | | | |
FRANKLIN TEMPLETON VARIABLE INSURANCE PRODUCTS TRUST
STATEMENT OF INVESTMENTS (UNAUDITED)
Templeton Growth VIP Fund(continued)
| | | | | | | | | | | | |
| | | |
| | | Country | | | Shares | | | Value | |
| | | |
Common Stocks(continued) | | | | | | | | | | | | |
| | | |
Electrical Equipment 0.6% | | | | | | | | | | | | |
Vestas Wind Systems AS | | | Denmark | | | | 49,100 | | | $ | 4,240,108 | |
| | | | | | | | | | | | |
| | | |
Food & Staples Retailing 4.4% | | | | | | | | | | | | |
The Kroger Co. | | | United States | | | | 555,660 | | | | 12,063,379 | |
Seven & i Holdings Co. Ltd. | | | Japan | | | | 215,860 | | | | 7,303,443 | |
Walgreens Boots Alliance Inc. | | | United States | | | | 257,879 | | | | 14,098,245 | |
| | | | | | | | | | | | |
| | | | | | | | | | | 33,465,067 | |
| | | | | | | | | | | | |
| | | |
Food Products 2.1% | | | | | | | | | | | | |
Kellogg Co. | | | United States | | | | 300,330 | | | | 16,088,678 | |
| | | | | | | | | | | | |
| | | |
Gas Utilities 1.2% | | | | | | | | | | | | |
Kunlun Energy Co. Ltd. | | | China | | | | 10,599,870 | | | | 9,240,109 | |
| | | | | | | | | | | | |
| | | |
Health Care Providers & Services 2.3% | | | | | | | | | | | | |
AmerisourceBergen Corp. | | | United States | | | | 123,640 | | | | 10,541,546 | |
Cardinal Health Inc. | | | United States | | | | 151,930 | | | | 7,155,903 | |
| | | | | | | | | | | | |
| | | | | | | | | | | 17,697,449 | |
| | | | | | | | | | | | |
| | | |
Household Durables 1.3% | | | | | | | | | | | | |
Panasonic Corp. | | | Japan | | | | 1,181,830 | | | | 9,838,718 | |
| | | | | | | | | | | | |
| | | |
Industrial Conglomerates 3.2% | | | | | | | | | | | | |
CK Hutchison Holdings Ltd. | | | Hong Kong | | | | 1,127,940 | | | | 11,117,475 | |
Siemens AG | | | Germany | | | | 110,732 | | | | 13,167,642 | |
| | | | | | | | | | | | |
| | | | | | | | | | | 24,285,117 | |
| | | | | | | | | | | | |
| | | |
Insurance 2.8% | | | | | | | | | | | | |
Aegon NV | | | Netherlands | | | | 1,605,016 | | | | 7,988,372 | |
China Life Insurance Co. Ltd., H | | | China | | | | 5,473,120 | | | | 13,479,366 | |
| | | | | | | | | | | | |
| | | | | | | | | | | 21,467,738 | |
| | | | | | | | | | | | |
| | | |
Interactive Media & Services 1.4% | | | | | | | | | | | | |
aAlphabet Inc., A | | | United States | | | | 3,553 | | | | 3,847,188 | |
aBaidu Inc., ADR | | | China | | | | 55,840 | | | | 6,553,383 | |
| | | | | | | | | | | | |
| | | | | | | | | | | 10,400,571 | |
| | | | | | | | | | | | |
| | | |
Leisure Products 1.2% | | | | | | | | | | | | |
aMattel Inc. | | | United States | | | | 831,780 | | | | 9,324,254 | |
| | | | | | | | | | | | |
| | | |
Machinery 0.9% | | | | | | | | | | | | |
aNavistar International Corp. | | | United States | | | | 210,030 | | | | 7,235,533 | |
| | | | | | | | | | | | |
| | | |
Marine 1.0% | | | | | | | | | | | | |
A.P. Moeller-Maersk AS, B | | | Denmark | | | | 6,240 | | | | 7,737,988 | |
| | | | | | | | | | | | |
| | | |
Media 3.9% | | | | | | | | | | | | |
Comcast Corp., A | | | United States | | | | 278,447 | | | | 11,772,739 | |
SES SA, IDR | | | Luxembourg | | | | 1,140,870 | | | | 17,833,701 | |
| | | | | | | | | | | | |
| | | | | | | | | | | 29,606,440 | |
| | | | | | | | | | | | |
| | | |
Metals & Mining 1.6% | | | | | | | | | | | | |
Wheaton Precious Metals Corp. | | | Canada | | | | 496,476 | | | | 12,004,883 | |
| | | | | | | | | | | | |
FRANKLIN TEMPLETON VARIABLE INSURANCE PRODUCTS TRUST
STATEMENT OF INVESTMENTS (UNAUDITED)
Templeton Growth VIP Fund(continued)
| | | | | | | | | | | | |
| | | |
| | | Country | | | Shares | | | Value | |
| | | |
Common Stocks(continued) | | | | | | | | | | | | |
| | | |
Multi-Utilities 3.2% | | | | | | | | | | | | |
E.ON SE | | | Germany | | | | 843,290 | | | $ | 9,156,489 | |
Veolia Environnement SA | | | France | | | | 616,570 | | | | 15,014,298 | |
| | | | | | | | | | | | |
| | | | | | | | | | | 24,170,787 | |
| | | | | | | | | | | | |
| | | |
Oil, Gas & Consumable Fuels 9.7% | | | | | | | | | | | | |
Apache Corp. | | | United States | | | | 369,080 | | | | 10,692,248 | |
BP PLC | | | United Kingdom | | | | 2,586,571 | | | | 18,020,499 | |
Eni SpA | | | Italy | | | | 674,349 | | | | 11,197,452 | |
Exxon Mobil Corp. | | | United States | | | | 157,870 | | | | 12,097,578 | |
bHusky Energy Inc. | | | Canada | | | | 527,660 | | | | 4,999,626 | |
Royal Dutch Shell PLC, B | | | United Kingdom | | | | 529,239 | | | | 17,347,083 | |
| | | | | | | | | | | | |
| | | | | | | | | | | 74,354,486 | |
| | | | | | | | | | | | |
| | | |
Personal Products 1.1% | | | | | | | | | | | | |
Coty Inc., A | | | United States | | | | 617,051 | | | | 8,268,483 | |
| | | | | | | | | | | | |
| | | |
Pharmaceuticals 12.7% | | | | | | | | | | | | |
Allergan PLC | | | United States | | | | 122,834 | | | | 20,566,097 | |
Bayer AG | | | Germany | | | | 207,926 | | | | 14,405,039 | |
Merck KGaA | | | Germany | | | | 72,694 | | | | 7,599,774 | |
Novartis AG | | | Switzerland | | | | 30,740 | | | | 2,808,140 | |
Perrigo Co. PLC | | | United States | | | | 34,630 | | | | 1,649,081 | |
Roche Holding AG | | | Switzerland | | | | 42,833 | | | | 12,047,809 | |
Sanofi | | | France | | | | 177,087 | | | | 15,282,304 | |
Takeda Pharmaceutical Co. Ltd. | | | Japan | | | | 440,170 | | | | 15,607,215 | |
aTeva Pharmaceutical Industries Ltd., ADR | | | Israel | | | | 741,550 | | | | 6,844,506 | |
| | | | | | | | | | | | |
| | | | | | | | | | | 96,809,965 | |
| | | | | | | | | | | | |
| | | |
Real Estate Management & Development 1.2% | | | | | | | | | | | | |
CK Asset Holdings Ltd. | | | Hong Kong | | | | 59,500 | | | | 465,739 | |
Mitsui Fudosan Co. Ltd. | | | Japan | | | | 365,950 | | | | 8,867,041 | |
| | | | | | | | | | | | |
| | | | | | | | | | | 9,332,780 | |
| | | | | | | | | | | | |
| | | |
Software 2.0% | | | | | | | | | | | | |
Oracle Corp. | | | United States | | | | 268,058 | | | | 15,271,264 | |
| | | | | | | | | | | | |
| | | |
Specialty Retail 1.1% | | | | | | | | | | | | |
Kingfisher PLC | | | United Kingdom | | | | 3,149,137 | | | | 8,594,381 | |
| | | | | | | | | | | | |
| | | |
Technology Hardware, Storage & Peripherals 2.0% | | | | | | | | | | | | |
Samsung Electronics Co. Ltd. | | | South Korea | | | | 373,630 | | | | 15,178,497 | |
| | | | | | | | | | | | |
| | | |
Wireless Telecommunication Services 4.3% | | | | | | | | | | | | |
Bharti Airtel Ltd. | | | India | | | | 2,608,534 | | | | 13,114,551 | |
China Mobile Ltd. | | | China | | | | 1,020,100 | | | | 9,290,671 | |
Vodafone Group PLC | | | United Kingdom | | | | 6,514,102 | | | | 10,698,105 | |
| | | | | | | | | | | | |
| | | | | | | | | | | 33,103,327 | |
| | | | | | | | | | | | |
Total Common Stocks (Cost $706,560,370) | | | | | | | | | | | 739,767,032 | |
| | | | | | | | | | | | |
FRANKLIN TEMPLETON VARIABLE INSURANCE PRODUCTS TRUST
STATEMENT OF INVESTMENTS (UNAUDITED)
Templeton Growth VIP Fund(continued)
| | | | | | | | | | | | |
| | | |
| | | Country | | | Principal
Amount* | | | Value | |
Short Term Investments 2.3% | | | | | | | | | | | | |
| | | |
U.S. Government and Agency Securities (Cost $199,988) 0.0%† | | | | | | | | | | | | |
cFFCB, 7/01/19 | | | United States | | | | $200,000 | | | | $ 200,000 | |
| | | | | | | | | | | | |
| | | |
Time Deposits (Cost $12,000,000) 1.6% | | | | | | | | | | | | |
Royal Bank of Canada, 2.35%, 7/01/19 | | | Canada | | | | 12,000,000 | | | | 12,000,000 | |
| | | | | | | | | | | | |
| | | |
| | | | | | Shares | | | | |
dInvestments from Cash Collateral Received for Loaned Securities 0.7% | | | | | | | | | | | | |
Money Market Funds (Cost $5,037,834) 0.7% | | | | | | | | | | | | |
e,fInstitutional Fiduciary Trust Money Market Portfolio, 2.05%. | | | United States | | | | 5,037,834 | | | | 5,037,834 | |
| | | | | | | | | | | | |
| | | |
Total Investments (Cost $723,798,192) 99.0% | | | | | | | | | | | 757,004,866 | |
Other Assets, less Liabilities 1.0% | | | | | | | | | | | 7,680,655 | |
| | | | | | | | | | | | |
| | | |
Net Assets 100.0% | | | | | | | | | | | $764,685,521 | |
| | | | | | | | | | | | |
See Abbreviations on pageTG-23.
†Rounds to less than 0.1% of net assets.
*The principal amount is stated in U.S. dollars unless otherwise indicated.
aNon-income producing.
bA portion or all of the security is on loan at June 30, 2019. See Note 1(c).
cThe security was issued on a discount basis with no stated coupon rate.
dSee Note 1(c) regarding securities on loan.
eSee Note 3(e) regarding investments in affiliated management investment companies.
fThe rate shown is the annualizedseven-day effective yield at period end.
| | |
| | |
TG-12 | | Semiannual Report | The accompanying notes are an integral part of these financial statements. |
FRANKLIN TEMPLETON VARIABLE INSURANCE PRODUCTS TRUST
FINANCIAL STATEMENTS
Statement of Assets and Liabilities
June 30, 2019 (unaudited)
| | | | |
| |
| | | Templeton Growth
VIP Fund | |
| |
Assets: | | | | |
Investments in securities: | | | | |
Cost - Unaffiliated issuers | | | $718,760,358 | |
Cost -Non-controlled affiliates (Note 3e) | | | 5,037,834 | |
| | | | |
| |
Value - Unaffiliated issuers+ | | | $751,967,032 | |
Value -Non-controlled affiliates (Note 3e) | | | 5,037,834 | |
Cash | | | 1,128,814 | |
Receivables: | | | | |
Investment securities sold | | | 10,048,278 | |
Capital shares sold | | | 647,726 | |
Dividends and interest | | | 2,689,165 | |
European Union tax reclaims | | | 790,686 | |
Other assets | | | 763 | |
| | | | |
| |
Total assets | | | 772,310,298 | |
| | | | |
| |
Liabilities: | | | | |
Payables: | | | | |
Investment securities purchased | | | 374,802 | |
Capital shares redeemed | | | 1,040,037 | |
Management fees | | | 497,399 | |
Distribution fees | | | 279,435 | |
Payable upon return of securities loaned | | | 5,037,834 | |
Deferred tax | | | 122,628 | |
Accrued expenses and other liabilities | | | 272,642 | |
| | | | |
| |
Total liabilities | | | 7,624,777 | |
| | | | |
| |
Net assets, at value | | | $764,685,521 | |
| | | | |
| |
Net assets consist of: | | | | |
Paid-in capital | | | $741,775,453 | |
Total distributable earnings (loss) | | | 22,910,068 | |
| | | | |
| |
Net assets, at value | | | $764,685,521 | |
| | | | |
| |
| Class 1: | | | | |
Net assets, at value | | | $95,901,005 | |
| | | | |
Shares outstanding | | | 9,240,966 | |
| | | | |
Net asset value and maximum offering price per share | | | $10.38 | |
| | | | |
| |
| Class 2: | | | | |
Net assets, at value | | | $641,016,439 | |
| | | | |
Shares outstanding | | | 63,106,979 | |
| | | | |
Net asset value and maximum offering price per share | | | $10.16 | |
| | | | |
| |
| Class 4: | | | | |
Net assets, at value | | | $27,768,077 | |
| | | | |
Shares outstanding | | | 2,690,735 | |
| | | | |
Net asset value and maximum offering price per share | | | $10.32 | |
| | | | |
| |
+Includes securities loaned | | | $4,749,645 | |
| | | | | | |
| | | |
| | The accompanying notes are an integral part of these financial statements. | Semiannual Report | | | TG-13 | |
FRANKLIN TEMPLETON VARIABLE INSURANCE PRODUCTS TRUST
FINANCIAL STATEMENTS
Statement of Operations
for the six months ended June 30, 2019 (unaudited)
| | | | |
| |
| | | Templeton Growth
VIP Fund | |
| |
Investment income: | | | | |
Dividends: (net of foreign taxes)* | | | | |
Unaffiliated issuers | | | $ 19,280,114 | |
Interest: | | | | |
Unaffiliated issuers | | | 165,380 | |
Income from securities loaned: | | | | |
Unaffiliated issuers (net of fees and rebates) | | | 58,874 | |
Non-controlled affiliates (Note 3e) | | | 71,351 | |
| | | | |
| |
Total investment income | | | 19,575,719 | |
| | | | |
| |
Expenses: | | | | |
Management fees (Note 3a) | | | 3,877,982 | |
Distribution fees: (Note 3c) | | | | |
Class 2 | | | 812,598 | |
Class 4 | | | 50,354 | |
Custodian fees (Note 4) | | | 34,573 | |
Reports to shareholders | | | 92,511 | |
Professional fees | | | 45,603 | |
Trustees’ fees and expenses | | | 4,783 | |
Other | | | 20,753 | |
| | | | |
| |
Total expenses | | | 4,939,157 | |
Expenses waived/paid by affiliates (Note 3e) | | | (12,320 | ) |
| | | | |
| |
Net expenses | | | 4,926,837 | |
| | | | |
| |
Net investment income | | | 14,648,882 | |
| | | | |
| |
Realized and unrealized gains (losses): | | | | |
Net realized gain (loss) from: | | | | |
Investments: | | | | |
Unaffiliated issuers | | | (19,850,282 | ) |
Foreign currency transactions | | | 87,001 | |
| | | | |
| |
Net realized gain (loss) | | | (19,763,281 | ) |
| | | | |
| |
Net change in unrealized appreciation (depreciation) on: | | | | |
Investments: | | | | |
Unaffiliated issuers | | | 85,919,624 | |
Translation of other assets and liabilities denominated in foreign currencies | | | (48,147 | ) |
Change in deferred taxes on unrealized appreciation | | | (122,628 | ) |
| | | | |
| |
Net change in unrealized appreciation (depreciation) | | | 85,748,849 | |
| | | | |
| |
Net realized and unrealized gain (loss) | | | 65,985,568 | |
| | | | |
| |
Net increase (decrease) in net assets resulting from operations | | | $ 80,634,450 | |
| | | | |
| |
*Foreign taxes withheld on dividends. | | | $ 1,666,230 | |
| | | | |
| | | |
TG-14 | | Semiannual Report | The accompanying notes are an integral part of these financial statements. | | |
FRANKLIN TEMPLETON VARIABLE INSURANCE PRODUCTS TRUST
FINANCIAL STATEMENTS
Statements of Changes in Net Assets
| | | | | | | | |
| | | Templeton Growth VIP Fund | |
| | | | |
| | |
| | | Six Months Ended
June 30, 2019
(unaudited) | | | Year Ended
December 31, 2018 | |
| | |
Increase (decrease) in net assets: | | | | | | | | |
Operations: | | | | | | | | |
Net investment income | | | $ 14,648,882 | | | | $ 21,598,649 | |
Net realized gain (loss) | | | (19,763,281 | ) | | | 145,036,204 | |
Net change in unrealized appreciation (depreciation) | | | 85,748,849 | | | | (344,182,476 | ) |
| | | | |
| | |
Net increase (decrease) in net assets resulting from operations | | | 80,634,450 | | | | (177,547,623 | ) |
| | | | |
| | |
Distributions to shareholders: | | | | | | | | |
Class 1 | | | (20,901,613 | ) | | | (44,508,681 | ) |
Class 2 | | | (139,418,589 | ) | | | (82,384,314 | ) |
Class 4 | | | (6,044,047 | ) | | | (3,542,055 | ) |
| | | | |
| | |
Total distributions to shareholders | | | (166,364,249 | ) | | | (130,435,050 | ) |
| | | | |
| | |
Capital share transactions: (Note 2) | | | | | | | | |
Class 1 | | | (270,325,446 | ) | | | (7,474,527 | ) |
Class 2 | | | 109,479,958 | | | | (59,234,414 | ) |
Class 4 | | | 3,547,382 | | | | (2,120,747 | ) |
| | | | |
| | |
Total capital share transactions | | | (157,298,106 | ) | | | (68,829,688 | ) |
| | | | |
Net increase (decrease) in net assets | | | (243,027,905 | ) | | | (376,812,361 | ) |
| | |
Net assets: | | | | | | | | |
Beginning of period | | | 1,007,713,426 | | | | 1,384,525,787 | |
| | | | |
| | |
End of period | | | $ 764,685,521 | | | | $1,007,713,426 | |
| | | | |
| | | | | | |
| | | |
| | The accompanying notes are an integral part of these financial statements. | Semiannual Report | | | TG-15 | |
FRANKLIN TEMPLETON VARIABLE INSURANCE PRODUCTS TRUST
Notes to Financial Statements (unaudited)
Templeton Growth VIP Fund
1. Organization and Significant Accounting Policies
Franklin Templeton Variable Insurance Products Trust (Trust) is registered under the Investment Company Act of 1940 (1940 Act) as anopen-end management investment company, consisting of eighteen separate funds and applies the specialized accounting and reporting guidance in U.S. Generally Accepted Accounting Principles (U.S. GAAP). Templeton Growth VIP Fund (Fund) is included in this report. Shares of the Fund are generally sold only to insurance company separate accounts to fund the benefits of variable life insurance policies or variable annuity contracts. The Fund offers three classes of shares: Class 1, Class 2, and Class 4. Each class of shares may differ by its distribution fees, voting rights on matters affecting a single class and its exchange privilege.
The following summarizes the Fund’s significant accounting policies.
a. Financial Instrument Valuation
The Fund’s investments in financial instruments are carried at fair value daily. Fair value is the price that would be received to sell an asset or paid to transfer a liability in an orderly transaction between market participants on the measurement date. The Fund calculates the net asset value (NAV) per share each business day as of 4 p.m. Eastern time or the regularly scheduled close of the New York Stock Exchange (NYSE), whichever is earlier. Under compliance policies and procedures approved by the Trust’s Board of Trustees (the Board), the Fund’s administrator has responsibility for oversight of valuation, including leading the cross-functional Valuation Committee (VC). The Fund may utilize independent pricing services, quotations from securities and financial instrument dealers, and other market sources to determine fair value.
Equity securities listed on an exchange or on the NASDAQ National Market System are valued at the last quoted sale price or the official closing price of the day, respectively. Foreign equity securities are valued as of the close of trading on the foreign stock exchange on which the security is primarily traded, or as of 4 p.m. Eastern time. The value is then converted into its U.S. dollar equivalent at the foreign exchange rate in effect at 4 p.m. Eastern time on the day that the value of the security is determined.Over-the-counter (OTC) securities are valued within the range of the most recent quoted bid and ask prices. Securities that trade in multiple markets or on multiple exchanges are valued
according to the broadest and most representative market. Certain equity securities are valued based upon fundamental characteristics or relationships to similar securities.
Debt securities generally trade in the OTC market rather than on a securities exchange. The Fund’s pricing services use multiple valuation techniques to determine fair value. In instances where sufficient market activity exists, the pricing services may utilize a market-based approach through which quotes from market makers are used to determine fair value. In instances where sufficient market activity may not exist or is limited, the pricing services also utilize proprietary valuation models which may consider market characteristics such as benchmark yield curves, credit spreads, estimated default rates, anticipated market interest rate volatility, coupon rates, anticipated timing of principal repayments, underlying collateral, and other unique security features in order to estimate the relevant cash flows, which are then discounted to calculate the fair value.
Investments inopen-end mutual funds are valued at the closing NAV. Investments in time deposits are valued at cost, which approximates fair value.
The Fund has procedures to determine the fair value of financial instruments for which market prices are not reliable or readily available. Under these procedures, the Fund primarily employs a market-based approach which may use related or comparable assets or liabilities, recent transactions, market multiples, book values, and other relevant information for the investment to determine the fair value of the investment. An income-based valuation approach may also be used in which the anticipated future cash flows of the investment are discounted to calculate fair value. Discounts may also be applied due to the nature or duration of any restrictions on the disposition of the investments. Due to the inherent uncertainty of valuations of such investments, the fair values may differ significantly from the values that would have been used had an active market existed.
Trading in securities on foreign securities stock exchanges and OTC markets may be completed before 4 p.m. Eastern time. In addition, trading in certain foreign markets may not take place on every Fund’s business day. Occasionally, events occur between the time at which trading in a foreign security is completed and 4 p.m. Eastern time that might call into question the reliability of the value of a portfolio security held by the Fund. As a result, differences may arise between the value of the Fund’s portfolio securities as determined at
FRANKLIN TEMPLETON VARIABLE INSURANCE PRODUCTS TRUST
NOTES TO FINANCIAL STATEMENTS (UNAUDITED)
Templeton Growth VIP Fund(continued)
the foreign market close and the latest indications of value at 4 p.m. Eastern time. In order to minimize the potential for these differences, the VC monitors price movements following the close of trading in foreign stock markets through a series of country specific market proxies (such as baskets of American Depositary Receipts, futures contracts and exchange traded funds). These price movements are measured against established trigger thresholds for each specific market proxy to assist in determining if an event has occurred that may call into question the reliability of the values of the foreign securities held by the Fund. If such an event occurs, the securities may be valued using fair value procedures, which may include the use of independent pricing services.
When the last day of the reporting period is anon-business day, certain foreign markets may be open on those days that the Fund’s NAV is not calculated, which could result in differences between the value of the Fund’s portfolio securities on the last business day and the last calendar day of the reporting period. Any significant security valuation changes due to an open foreign market are adjusted and reflected by the Fund for financial reporting purposes.
b. Foreign Currency Translation
Portfolio securities and other assets and liabilities denominated in foreign currencies are translated into U.S. dollars based on the exchange rate of such currencies against U.S. dollars on the date of valuation. The Fund may enter into foreign currency exchange contracts to facilitate transactions denominated in a foreign currency. Purchases and sales of securities, income and expense items denominated in foreign currencies are translated into U.S. dollars at the exchange rate in effect on the transaction date. Portfolio securities and assets and liabilities denominated in foreign currencies contain risks that those currencies will decline in value relative to the U.S. dollar. Occasionally, events may impact the availability or reliability of foreign exchange rates used to convert the U.S. dollar equivalent value. If such an event occurs, the foreign exchange rate will be valued at fair value using procedures established and approved by the Board.
The Fund does not separately report the effect of changes in foreign exchange rates from changes in market prices on securities held. Such changes are included in net realized and unrealized gain or loss from investments in the Statement of Operations.
Realized foreign exchange gains or losses arise from sales of foreign currencies, currency gains or losses realized between the trade and settlement dates on securities transactions and the difference between the recorded amounts of dividends, interest, and foreign withholding taxes and the U.S. dollar equivalent of the amounts actually received or paid. Net unrealized foreign exchange gains and losses arise from changes in foreign exchange rates on foreign denominated assets and liabilities other than investments in securities held at the end of the reporting period.
c. Securities Lending
The Fund participates in an agency based securities lending program to earn additional income. The Fund receives cash collateral against the loaned securities in an amount equal to at least 102% of the fair value of the loaned securities. Collateral is maintained over the life of the loan in an amount not less than 100% of the fair value of loaned securities, as determined at the close of Fund business each day; any additional collateral required due to changes in security values is delivered to the Fund on the next business day. The collateral is deposited into a joint cash account with other funds and is used to invest in a money market fund managed by Franklin Advisers, Inc., an affiliate of the Fund. The Fund may receive income from the investment of cash collateral, in addition to lending fees and rebates paid by the borrower. Income from securities loaned, net of fees paid to the securities lending agent and/or third-party vendor, is reported separately in the Statement of Operations. The Fund bears the market risk with respect to the collateral investment, securities loaned, and the risk that the agent may default on its obligations to the Fund. If the borrower defaults on its obligation to return the securities loaned, the Fund has the right to repurchase the securities in the open market using the collateral received. The securities lending agent has agreed to indemnify the Fund in the event of default by a third party borrower.
d. Income and Deferred Taxes
It is the Fund’s policy to qualify as a regulated investment company under the Internal Revenue Code. The Fund intends to distribute to shareholders substantially all of its taxable income and net realized gains to relieve it from federal income and if applicable, excise taxes. As a result, no provision for U.S. federal income taxes is required.
FRANKLIN TEMPLETON VARIABLE INSURANCE PRODUCTS TRUST
NOTES TO FINANCIAL STATEMENTS (UNAUDITED)
Templeton Growth VIP Fund(continued)
1. Organization and Significant Accounting Policies(continued)
d. Income and Deferred Taxes(continued)
The Fund may be subject to foreign taxation related to income received, capital gains on the sale of securities and certain foreign currency transactions in the foreign jurisdictions in which it invests. Foreign taxes, if any, are recorded based on the tax regulations and rates that exist in the foreign markets in which the Fund invests. When a capital gain tax is determined to apply, the Fund records an estimated deferred tax liability in an amount that would be payable if the securities were disposed of on the valuation date.
As a result of several court cases, in certain countries across the European Union, the Fund filed additional tax reclaims for previously withheld taxes on dividends earned in those countries (EU reclaims). These additional filings are subject to various administrative proceedings by the local jurisdictions’ tax authorities within the European Union, as well as a number of related judicial proceedings. Income recognized, if any, for EU reclaims is reflected as other income in the Statement of Operations and any related receivable, if any, is reflected as European Union tax reclaims in the Statement of Assets and Liabilities. When uncertainty exists as to the ultimate resolution of these proceedings, the likelihood of receipt of these EU reclaims, and the potential timing of payment, no amounts are reflected in the financial statements. For U.S. income tax purposes, when EU reclaims are received by the Fund and the Fund previously passed foreign tax credit on to its shareholders, the Fund must either amend historic tax reporting to shareholders or enter into a closing agreement with the Internal Revenue Service (IRS) in order to pay the associated tax liability on behalf of the Fund’s shareholders.
The Fund may recognize an income tax liability related to its uncertain tax positions under U.S. GAAP when the uncertain tax position has a less than 50% probability that it will be sustained upon examination by the tax authorities based on its technical merits. As of June 30, 2019, the Fund has determined that no tax liability is required in its financial statements related to uncertain tax positions for any open tax years (or expected to be taken in future tax years). Open tax years are those that remain subject to examination and are based on the statute of limitations in each jurisdiction in which the Fund invests.
e. Security Transactions, Investment Income, Expenses and Distributions
Security transactions are accounted for on trade date. Realized gains and losses on security transactions are determined on a specific identification basis. Interest income and estimated expenses are accrued daily. Dividend income and capital gain distributions are recorded on theex-dividend date except for certain dividends from securities where the dividend rate is not available. In such cases, the dividend is recorded as soon as the information is received by the Fund. Distributions to shareholders are recorded on theex-dividend date. Distributable earnings are determined according to income tax regulations (tax basis) and may differ from earnings recorded in accordance with U.S. GAAP. These differences may be permanent or temporary. Permanent differences are reclassified among capital accounts to reflect their tax character. These reclassifications have no impact on net assets or the results of operations. Temporary differences are not reclassified, as they may reverse in subsequent periods.
Common expenses incurred by the Trust are allocated among the Funds based on the ratio of net assets of each Fund to the combined net assets of the Trust or based on the ratio of number of shareholders of each Fund to the combined number of shareholders of the Trust. Fund specific expenses are charged directly to the Fund that incurred the expense.
Realized and unrealized gains and losses and net investment income, excluding class specific expenses, are allocated daily to each class of shares based upon the relative proportion of net assets of each class. Differences in per share distributions by class are generally due to differences in class specific expenses.
f. Accounting Estimates
The preparation of financial statements in accordance with U.S. GAAP requires management to make estimates and assumptions that affect the reported amounts of assets and liabilities at the date of the financial statements and the amounts of income and expenses during the reporting period. Actual results could differ from those estimates.
g. Guarantees and Indemnifications
Under the Trust’s organizational documents, its officers and trustees are indemnified by the Trust against certain liabilities arising out of the performance of their duties to the Trust. Additionally, in the normal course of business, the Trust, on
FRANKLIN TEMPLETON VARIABLE INSURANCE PRODUCTS TRUST
NOTES TO FINANCIAL STATEMENTS (UNAUDITED)
Templeton Growth VIP Fund(continued)
behalf of the Fund, enters into contracts with service providers that contain general indemnification clauses. The Trust’s maximum exposure under these arrangements is
unknown as this would involve future claims that may be made against the Trust that have not yet occurred. Currently, the Trust expects the risk of loss to be remote.
2. Shares of Beneficial Interest
At June 30, 2019, there were an unlimited number of shares authorized (without par value). Transactions in the Fund’s shares were as follows:
| | | | | | | | | | | | | | | | | | | | |
| | | Six Months Ended June 30, 2019 | | | | | | Year Ended December 31, 2018 | |
| | | | |
| | | | | |
| | | Shares | | | Amount | | | | | | Shares | | | Amount | |
| |
| | | | | |
| Class 1 Shares: | | | | | | | | | | | | | | | | | | | | |
Shares sold | | | 34,315 | | | $ | 434,886 | | | | | | | | 751,581 | | | $ | 10,285,009 | |
Shares issued in reinvestment of distributions | | | 2,083,910 | | | | 20,901,613 | | | | | | | | 3,065,336 | | | | 44,508,681 | |
Shares redeemed | | | (21,347,643 | ) | | | (291,661,945 | ) | | | | | | | (4,049,692 | ) | | | (62,268,217) | |
| | | | |
| | | | | |
Net increase (decrease) | | | (19,229,418 | ) | | $ | (270,325,446 | ) | | | | | | | (232,775 | ) | | $ | (7,474,527) | |
| | | | |
| | | | | |
| Class 2 Shares: | | | | | | | | | | | | | | | | | | | | |
Shares sold | | | 1,225,694 | | | $ | 15,071,351 | | | | | | | | 2,342,753 | | | $ | 33,884,634 | |
Shares issued in reinvestment of distributions | | | 14,197,412 | | | | 139,418,589 | | | | | | | | 5,773,252 | | | | 82,384,314 | |
Shares redeemed | | | (3,511,422 | ) | | | (45,009,982 | ) | | | | | | | (11,984,334 | ) | | | (175,503,362) | |
| | | | |
| | | | | |
Net increase (decrease) | | | 11,911,684 | | | $ | 109,479,958 | | | | | | | | (3,868,329 | ) | | $ | (59,234,414) | |
| | | | |
| | | | | |
| Class 4 Shares: | | | | | | | | | | | | | | | | | | | | |
Shares sold | | | 69,674 | | | $ | 885,651 | | | | | | | | 154,144 | | | $ | 2,180,515 | |
Shares issued in reinvestment of distributions | | | 605,616 | | | | 6,044,047 | | | | | | | | 245,125 | | | | 3,542,055 | |
Shares redeemed | | | (270,028 | ) | | | (3,382,316 | ) | | | | | | | (518,871 | ) | | | (7,843,317) | |
| | | | |
| | | | | |
Net increase (decrease) | | | 405,262 | | | $ | 3,547,382 | | | | | | | | (119,602 | ) | | $ | (2,120,747) | |
| | | | |
3. Transactions with Affiliates
Franklin Resources, Inc. is the holding company for various subsidiaries that together are referred to as Franklin Templeton. Certain officers and trustees of the Fund are also officers and/or directors of the following subsidiaries:
| | |
| |
| Subsidiary | | Affiliation |
| |
Templeton Global Advisors Limited (TGAL) | | Investment manager |
| |
Franklin Templeton Services, LLC (FT Services) | | Administrative manager |
| |
Franklin Templeton Distributors, Inc. (Distributors) | | Principal underwriter |
| |
Franklin Templeton Investor Services, LLC (Investor Services) | | Transfer agent |
FRANKLIN TEMPLETON VARIABLE INSURANCE PRODUCTS TRUST
NOTES TO FINANCIAL STATEMENTS (UNAUDITED)
Templeton Growth VIP Fund(continued)
3. Transactions with Affiliates (continued)
a. Management Fees
The Fund pays an investment management fee to TGAL based on the average daily net assets of the Fund as follows:
| | |
| |
| Annualized Fee Rate | | Net Assets |
| |
1.000% | | Up to and including $100 million |
| |
0.900% | | Over $100 million, up to and including $250 million |
| |
0.800% | | Over $250 million, up to and including $500 million |
| |
0.750% | | Over $500 million, up to and including $1 billion |
| |
0.700% | | Over $1 billion, up to and including $5 billion |
| |
0.675% | | Over $5 billion, up to and including $10 billion |
| |
0.655% | | Over $10 billion, up to and including $15 billion |
| |
0.635% | | Over $15 billion, up to and including $20��billion |
| |
0.615% | | In excess of $20 billion |
For the period ended June 30, 2019, the annualized gross effective investment management fee rate was 0.811% of the Fund’s average daily net assets.
b. Administrative Fees
Under an agreement with TGAL, FT Services provides administrative services to the Fund. The fee is paid by TGAL based on the Fund’s average daily net assets, and is not an additional expense of the Fund.
c. Distribution Fees
The Board has adopted distribution plans for Class 2 and Class 4 shares pursuant to Rule12b-1 under the 1940 Act. Under the Fund’s compensation distribution plans, the Fund pays Distributors for costs incurred in connection with the servicing, sale and distribution of the Fund’s shares up to 0.35% per year of its average daily net assets of each class. The Board has agreed to limit the current rate to 0.25% per year for Class 2. The plan year, for purposes of monitoring compliance with the maximum annual plan rates, is February 1 through January 31.
d. Transfer Agent Fees
Investor Services, under terms of an agreement, performs shareholder servicing for the Fund and is not paid by the Fund for the services.
FRANKLIN TEMPLETON VARIABLE INSURANCE PRODUCTS TRUST
NOTES TO FINANCIAL STATEMENTS (UNAUDITED)
Templeton Growth VIP Fund(continued)
e. Investments in Affiliated Management Investment Companies
The Fund invests in one or more affiliated management investment companies for purposes other than exercising a controlling influence over the management or policies. Management fees paid by the Fund are waived on assets invested in the affiliated management investment companies, as noted in the Statement of Operations, in an amount not to exceed the management and administrative fees paid directly or indirectly by each affiliate. During the period ended June 30, 2019, the Fund held investments in affiliated management investment companies as follows:
| | | | | | | | | | | | | | | | | | | | | | | | | | | | | | |
| | | | | | | | |
| | | Value at
Beginning
of Period | | Purchases | | | Sales | | | Realized
Gain (Loss) | | | Net Change in
Unrealized
Appreciation
(Depreciation) | | | Value at
End of
Period | | | Number of
Shares
Held at End
of Period | | | Income from
securities loaned | |
| | | | | | | | |
| Non-Controlled Affiliates | | | | | | | | | | | | | | | | | | | | | | | | | | | | | | |
Institutional Fiduciary Trust Money Market Portfolio, 2.05% | | $12,394,593 | | $ | 116,707,362 | | | $ | (124,064,121 | ) | | | $ — | | | | $ — | | | $ | 5,037,834 | | | | 5,037,834 | | | | $71,351 | |
| | | | | | | | | | | |
f. Interfund Transactions
The Fund engaged in purchases and sales of investments with funds or other accounts that have common investment managers (or affiliated investment managers), directors, trustees or officers. During the period ended June 30, 2019, these purchase and sale transactions aggregated $0 and $7,221,547, respectively.
4. Expense Offset Arrangement
The Fund has entered into an arrangement with its custodian whereby credits realized as a result of uninvested cash balances are used to reduce a portion of the Fund’s custodian expenses. During the period ended June 30, 2019, there were no credits earned.
5. Income Taxes
At June 30, 2019, the cost of investments and net unrealized appreciation (depreciation) for income tax purposes were as follows:
| | | | |
Cost of investments | | $ | 729,534,511 | |
| | | | |
| |
Unrealized appreciation | | $ | 112,120,064 | |
Unrealized depreciation | | | (84,649,709) | |
| | | | |
| |
Net unrealized appreciation (depreciation) | | $ | 27,470,355 | |
| | | | |
Differences between income and/or capital gains as determined on a book basis and a tax basis are primarily due to differing treatment of bond discounts and premiums.
6. Investment Transactions
Purchases and sales of investments (excluding short term securities) for the period ended June 30, 2019, aggregated $104,839,302 and $432,628,546, respectively.
At June 30, 2019, in connection with securities lending transactions, the Fund loaned equity investments and received $5,037,834 of cash collateral. The gross amount of recognized liability for such transactions is included in payable upon return of securities loaned in the Statement of Assets and Liabilities. The agreements can be terminated at any time.
FRANKLIN TEMPLETON VARIABLE INSURANCE PRODUCTS TRUST
NOTES TO FINANCIAL STATEMENTS (UNAUDITED)
Templeton Growth VIP Fund(continued)
7. Concentration of Risk
Investing in foreign securities may include certain risks and considerations not typically associated with investing in U.S. securities, such as fluctuating currency values and changing local and regional economic, political and social conditions, which may result in greater market volatility. Current political and financial uncertainty surrounding the European Union may increase market volatility and the economic risk of investing in securities in Europe. In addition, certain foreign securities may not be as liquid as U.S. securities.
8. Credit Facility
The Fund, together with other U.S. registered and foreign investment funds (collectively, Borrowers), managed by Franklin Templeton, are borrowers in a joint syndicated senior unsecured credit facility totaling $2 billion (Global Credit Facility) which matures on February 7, 2020. This Global Credit Facility provides a source of funds to the Borrowers for temporary and emergency purposes, including the ability to meet future unanticipated or unusually large redemption requests.
Under the terms of the Global Credit Facility, the Fund shall, in addition to interest charged on any borrowings made by the Fund and other costs incurred by the Fund, pay its share of fees and expenses incurred in connection with the implementation and maintenance of the Global Credit Facility, based upon its relative share of the aggregate net assets of all of the Borrowers, including an annual commitment fee of 0.15% based upon the unused portion of the Global Credit Facility. These fees are reflected in other expenses in the Statement of Operations. During the period ended June 30, 2019, the Fund did not use the Global Credit Facility.
9. Fair Value Measurements
The Fund follows a fair value hierarchy that distinguishes between market data obtained from independent sources (observable inputs) and the Fund’s own market assumptions (unobservable inputs). These inputs are used in determining the value of the Fund’s financial instruments and are summarized in the following fair value hierarchy:
| | • | | Level 1 – quoted prices in active markets for identical financial instruments |
| | • | | Level 2 – other significant observable inputs (including quoted prices for similar financial instruments, interest rates, prepayment speed, credit risk, etc.) |
| | • | | Level 3 – significant unobservable inputs (including the Fund’s own assumptions in determining the fair value of financial instruments) |
The input levels are not necessarily an indication of the risk or liquidity associated with financial instruments at that level.
A summary of inputs used as of June 30, 2019, in valuing the Fund’s assets carried at fair value, is as follows:
| | | | | | | | | | | | | | | | |
| | | | |
| | | Level 1 | | | Level 2 | | | Level 3 | | | Total | |
| | | | |
| Assets: | | | | | | | | | | | | | | | | |
Investments in Securities:a | | | | | | | | | | | | | | | | |
Equity Investments | | $ | 739,767,032 | | | $ | — | | | $ | — | | | $ | 739,767,032 | |
Short Term Investments | | | 5,037,834 | | | | 12,200,000 | | | | — | | | | 17,237,834 | |
| | | | |
Total Investments in Securities | | $ | 744,804,866 | | | $ | 12,200,000 | | | $ | — | | | $ | 757,004,866 | |
| | | | |
aFor detailed categories, see the accompanying Statement of Investments.
FRANKLIN TEMPLETON VARIABLE INSURANCE PRODUCTS TRUST
NOTES TO FINANCIAL STATEMENTS (UNAUDITED)
Templeton Growth VIP Fund(continued)
10. Subsequent Events
The Fund has evaluated subsequent events through the issuance of the financial statements and determined that no events have occurred that require disclosure.
Abbreviations
| | |
|
| Selected Portfolio |
| |
| ADR | | American Depositary Receipt |
| |
| FFCB | | Federal Farm Credit Bank |
| |
| IDR | | International Depositary Receipt |
FRANKLIN TEMPLETON VARIABLE INSURANCE PRODUCTS TRUST
Tax Information (unaudited)
Templeton Growth VIP Fund
At December 31, 2018, more than 50% of the Fund’s total assets were invested in securities of foreign issuers. In most instances, foreign taxes were withheld from income paid to the Fund on these investments. As shown in the table below, the Fund hereby reports to shareholders the foreign source income and foreign taxes paid, pursuant to Section 853 of the Internal Revenue Code. This written statement will allow shareholders of record on June 13, 2019, to treat their proportionate share of foreign taxes paid by the Fund as having been paid directly by them. The shareholder shall consider these amounts as foreign taxes paid in the tax year in which they receive the Fund distribution.
The following table provides a detailed analysis of foreign tax paid, and foreign source income as reported by the Fund to shareholders of record.
| | | | |
| | |
| Class | | Foreign Tax Paid
Per Share | | Foreign Source
Income Per Share |
Class 1 | | $0.0380 | | $0.3897 |
Class 2 | | $0.0380 | | $0.3670 |
Class 4 | | $0.0380 | | $0.3571 |
Foreign Tax Paid Per Share (Column 1) is the amount per share available to you, as a tax credit (assuming you held your shares in the Fund for a minimum of 16 days during the31-day period beginning 15 days before theex-dividend date of the Fund’s distribution to which the foreign taxes relate), or, as a tax deduction.
Foreign Source Income Per Share (Column 2) is the amount per share of income dividends attributable to foreign securities held by the Fund, plus any foreign taxes withheld on these dividends.
FRANKLIN TEMPLETON VARIABLE INSURANCE PRODUCTS TRUST
Index Descriptions
The indexes are unmanaged and include reinvestment of any income or distributions. They do not reflect any fees, expenses or sales charges.
For Russell Indexes: Frank Russell Company is the source and owner of the trademarks, service marks and copyrights related to the Russell Indexes. Russell® is a trademark of Frank Russell Company.
See www.franklintempletondatasources.com for additional data provider information.
Bloomberg Barclays1-3 Month U.S. Treasury Bill Indexmeasures the performance of U.S. Treasury bills that have a remaining maturity of greater than or equal to 1 month and less than 3 months.
Bloomberg Barclays U.S. Aggregate Bondis a market capitalization-weighted index representing the U.S. investment-grade, fixed-rate, taxable bond market with index components for government and corporate, mortgage pass-through and asset-backed securities. All issues included are SEC registered, taxable, dollar denominated and nonconvertible, must have at least one year to final maturity and must be rated investment grade (Baa3/BBB-/BBB- or higher) using the middle rating of Moody’s, Standard & Poor’s and Fitch, respectively.
Bloomberg Barclays U.S. Corporate Index: Investment-Grade Componentmeasures the investment grade, fixed-rate, taxable corporate bond market. It includes U.S. dollar-denominated securities publicly issued by U.S. andnon-U.S. industrial, utility and financial issuers.
Bloomberg Barclays U.S. Government Index: Intermediate Componentis the intermediate component of the Barclays U.S. Government Index, which includes public obligations of the U.S. Treasury with at least one year to final maturity and publicly issued debt of U.S. government agencies, quasi-federal corporations, and corporate or foreign debt guaranteed by the U.S. government.
Bloomberg Barclays U.S. High Yield Very Liquid Indexis a component of the U.S. Corporate High Yield Index that is designed to track a more liquid component of the U.S. dollar-denominated, high-yield fixed-rate corporate bond market.
Consumer Price Index (CPI)is a commonly used measure of the inflation rate.
FTSE® EPRA®/NAREIT® Developed Indexis a free float-adjusted index designed to measure the performance of publicly traded real estate securities in the North American, European and Asian real estate markets.
FTSE World Government Bond Indexis a market capitalization-weighted index consisting of investment-grade world government bond markets.
J.P. Morgan (JPM) Global Government Bond Index (GGBI)tracks total returns for liquid, fixed-rate, domestic government bonds with maturities greater than one year issued by developed countries globally.
Lipper Multi-Sector Income Funds Classification Averageis calculated by averaging the total returns of all funds within the Lipper Multi-Sector Income Funds Classification in the LipperOpen-End underlying funds universe. Lipper Multi-Sector Income Funds are defined as funds that seek current income by allocation of assets among different fixed income securities sectors (not primarily in one sector except for defensive purposes), including U.S. and foreign governments, with a significant portion rated below investment grade. For thesix-month period ended 6/30/19, there were 37 funds in this category. Lipper calculations do not include contract fees, expenses or sales charges, and may have been different if such charges had been considered.
Lipper VIP General U.S. Government Funds Classification Averageis an equally weighted average calculation of performance figures for all funds within the Lipper General U.S. Government Funds classification in the Lipper VIP underlying funds universe. Lipper General U.S. Government Funds invest primarily in U.S. government and agency issues. For thesix-month period ended 6/30/19, there were 26 funds in this category. Lipper calculations do not include contract fees, expenses or sales charges, and may have been different if such charges had been considered.
MSCI All Country World Index (ACWI)is a free float-adjusted, market capitalization-weighted index designed to measure equity market performance in global developed and emerging markets.
MSCI All Country World Index (ACWI) ex USA Indexcaptures large- andmid-capitalization representation across 22 of 23 developed markets countries (excluding the U.S.) and 23 emerging markets countries. The index covers approximately 85% of the global equity opportunity set outside the U.S.
FRANKLIN TEMPLETON VARIABLE INSURANCE PRODUCTS TRUST
INDEX DESCRIPTIONS
MSCI EAFE Indexis a free float-adjusted market capitalization-weighted index that is designed to measure the equity market performance of developed markets, excluding the U.S. and Canada.
MSCI Emerging Markets (EM) Indexis a free float-adjusted, market capitalization-weighted index designed to measure equity market performance in global emerging markets.
MSCI USA High Dividend Yield Indexis based on the MSCI USA Index, its parent index, and includes large- andmid-capitalization stocks. The index is designed to reflect the performance of equities in the parent index (excluding real estate investment trusts) with higher dividend income and quality characteristics than average dividend yields that are both sustainable and persistent.
MSCI World Indexis a free float-adjusted, market capitalization-weighted index designed to measure equity market performance in global developed markets.
Russell 1000® Growth Indexis market capitalization weighted and measures performance of those Russell 1000® Index companies with higherprice-to-book ratios and higher forecasted growth values.
Russell 1000® Indexis market capitalization weighted and measures performance of the largest companies in the Russell 3000® Index, which represents the majority of the U.S. market’s total capitalization.
Russell 2000® Indexis market capitalization weighted and measures performance of the 2,000 smallest companies in the Russell 3000® Index, which represent a small amount of the total market capitalization of the Russell 3000® Index.
Russell 2000® Value Indexis market capitalization weighted and measures performance of those Russell 2000® Index companies with lowerprice-to-book ratios and lower forecasted growth values.
Russell 3000® Growth Indexis market capitalization weighted and measures performance of those Russell 3000® Index companies with higherprice-to-book ratios and higher forecasted growth values.
Russell Midcap® Growth Indexis market capitalization weighted and measures performance of those Russell Midcap® Index companies with higherprice-to-book ratios and higher forecasted growth values.
Russell Midcap® Indexis market capitalization weighted and measures performance of the smallest companies in the Russell 1000® Index, which represents a modest amount of the Russell 1000® Index’s total market capitalization.
Standard & Poor’s® 500 Index (S&P 500®)is a market capitalization-weighted index of 500 stocks designed to measure total U.S. equity market performance.
Standard & Poor’s®/International Finance Corporation Investable (S&P/IFCI) Composite Indexis a free float-adjusted, market capitalization-weighted index designed to measure equity performance in global emerging markets.
FRANKLIN TEMPLETON VARIABLE INSURANCE PRODUCTS TRUST
Shareholder Information
Board Approval of Investment Management Agreements
FRANKLIN TEMPLETON VARIABLE INSURANCE PRODUCTS TRUST
Franklin Flex Cap Growth VIP Fund
Franklin Global Real Estate VIP Fund
Franklin Growth and Income VIP Fund
Franklin Income VIP Fund
Franklin Large Cap Growth VIP Fund
Franklin Mutual Global Discovery VIP Fund
Franklin Mutual Shares VIP Fund
Franklin Rising Dividends VIP Fund
Franklin Small Cap Value VIP Fund
FranklinSmall-Mid Cap Growth VIP Fund
Franklin Strategic Income VIP Fund
Franklin U.S. Government Securities VIP Fund
Franklin VolSmart Allocation VIP Fund
Templeton Developing Markets VIP Fund
Templeton Foreign VIP Fund
Templeton Global Bond VIP Fund
Templeton Growth VIP Fund
(each a Fund)
At anin-person meeting held on April 16, 2019 (Meeting), the Board of Trustees (Board) of Franklin Templeton Variable Insurance Products Trust (Trust), including a majority of the trustees who are not “interested persons” as defined in the Investment Company Act of 1940 (Independent Trustees), reviewed and approved the continuance of the (i) investment management agreement between Franklin Advisers, Inc. (FAI) and the Trust, on behalf of each of Franklin Flex Cap Growth VIP Fund, Franklin Growth and Income VIP Fund, Franklin Income VIP Fund, Franklin Large Cap Growth VIP Fund, Franklin Rising Dividends VIP Fund, Franklin SmallMid-Cap Growth VIP Fund, Franklin Strategic Income VIP Fund, Franklin U.S. Government Securities VIP Fund, Franklin VolSmart Allocation VIP Fund, and Templeton Global Bond VIP Fund; (ii) the investmentsub-advisory agreement between FAI and K2/D&S Management Co., LLC(Sub-Adviser), an affiliate of FAI, on behalf of Franklin VolSmart Allocation VIP Fund; (iii) the investment management agreement between Franklin Templeton Institutional, LLC (FTIL) and the Trust, on behalf of Franklin Global Real Estate VIP Fund; (iv) the investment management agreement between Franklin Mutual Advisers, LLC (FMA) and the Trust, on behalf of each of Franklin Mutual Global Discovery VIP Fund, Franklin Mutual Shares VIP Fund and Franklin Small Cap Value VIP Fund; (v) the
investment management agreement between Templeton Asset Management Ltd. (TAML) and the Trust, on behalf of Templeton Developing Markets VIP Fund; (vi) the investment management agreement between Templeton Investment Counsel, LLC (TICL) and the Trust, on behalf of Templeton Foreign VIP Fund; and (vii) the investment management agreement between Templeton Global Advisors Limited (TGAL) and the Trust, on behalf of Templeton Growth VIP Fund (each a Management Agreement) for an additionalone-year period. The Independent Trustees received advice from and met separately with Independent Trustee counsel in considering whether to approve the continuation of each Management Agreement. Although the Management Agreements for the Funds were considered at the same Board meeting, the Board considered the information provided to it about the Funds together and with respect to each Fund separately as the Board deemed appropriate. FAI, FTIL, FMA, TAML, TICL, TGAL and theSub-Adviser are each referred to herein as a Manager.
In considering the continuation of each Management Agreement, the Board reviewed and considered information provided by each Manager at the Meeting and throughout the year at meetings of the Board and its committees. The Board also reviewed and considered information provided in response to a detailed set of requests for information submitted to each Manager by Independent Trustee counsel on behalf of the Independent Trustees in connection with the annual contract renewal process. In addition, prior to the Meeting, the Independent Trustees held a telephonic contract renewal meeting at which the Independent Trustees conferred amongst themselves and Independent Trustee counsel about contract renewal matters. The Board reviewed and considered all of the factors it deemed relevant in approving the continuance of each Management Agreement, including, but not limited to: (i) the nature, extent and quality of the services provided by each Manager; (ii) the investment performance of each Fund; (iii) the costs of the services provided and profits realized by each Manager and its affiliates from the relationship with each Fund; (iv) the extent to which economies of scale are realized as each Fund grows; and (v) whether fee levels reflect these economies of scale for the benefit of Fund investors.
In approving the continuance of each Management Agreement, the Board, including a majority of the Independent Trustees, determined that the terms of each Management Agreement are fair and reasonable and that the continuance of such Management Agreement is in the interests of the applicable Fund and its shareholders. While
FRANKLIN TEMPLETON VARIABLE INSURANCE PRODUCTS TRUST
SHAREHOLDER INFORMATION
attention was given to all information furnished, the following discusses some primary factors relevant to the Board’s determination.
Nature, Extent and Quality of Services
The Board reviewed and considered information regarding the nature, extent and quality of investment management services provided by each Manager and its affiliates to the Funds and their shareholders. This information included, among other things, the qualifications, background and experience of the senior management and investment personnel of each Manager; the structure of investment personnel compensation; oversight of third-party service providers; investment performance reports and related financial information for each Fund; reports on expenses, shareholder services, marketing support payments made to financial intermediaries and third party servicing arrangements; legal and compliance matters; risk controls; pricing and other services provided by each Manager and its affiliates; and management fees charged by each Manager and its affiliates to US funds and other accounts, including management’s explanation of differences among accounts where relevant. The Board also reviewed and considered an annual report on payments made by Franklin Templeton Investments (FTI) or the Funds to financial intermediaries, as well as a memorandum relating to third-party servicing arrangements in response to a guidance update in 2016 from the US Securities and Exchange Commission (SEC) relating to mutual fund distribution andsub-accounting fees. The Board noted management’s continuing efforts and expenditures in establishing effective business continuity plans and developing strategies to address areas of heightened concern in the mutual fund industry, such as cybersecurity and liquidity risk management. The Board also recognized management’s commitment to facilitating Board oversight of liquidity through the designation of a liquidity/risk administrator and the development of reports that highlight the amount of illiquid investments for each Fund.
The Board also reviewed and considered the benefits provided to Fund shareholders of investing in a fund that is part of the Franklin Templeton family of funds. The Board noted the financial position of Franklin Resources, Inc. (FRI), the Managers’ parent, and its commitment to the mutual fund business as evidenced by its continued introduction of new funds, reassessment of the fund offerings in response to the market environment and project initiatives and capital investments relating to the services provided to the Funds by the FTI organization.
Following consideration of such information, the Board was satisfied with the nature, extent and quality of services provided by each Manager and its affiliates to the Funds and their shareholders.
Fund Performance
The Board reviewed and considered the performance results of each Fund over various time periods ended January 31, 2019. The Board considered the performance returns for each Fund in comparison to the performance returns of mutual funds deemed comparable to the Fund included in a universe (Performance Universe) selected by Broadridge Financial Solutions, Inc. (Broadridge), an independent provider of investment company data. The Board received a description of the methodology used by Broadridge to select the mutual funds included in a Performance Universe. The Board also considered the performance returns for the Franklin Income VIP Fund and Franklin VolSmart Allocation VIP Fund in comparison to the performance returns of a customized peer group (Performance Customized Peer Group) selected by the Manager. The Board also reviewed and considered Fund performance reports provided and discussions that occurred with portfolio managers at Board meetings throughout the year. A summary of each Fund’s performance results is below.
Franklin Flex Cap Growth VIP Fund- The Performance Universe for this Fund included the Fund and alllarge-cap growth funds underlying variable insurance products (VIPs). The Board noted that the Fund’s annualized total return for theone-year period was above the median of its Performance Universe, but for the three-, five- and10-year periods was below the median of its Performance Universe. The Board concluded that the Fund’s performance was satisfactory, noting the Fund’sone-year first quintile (best) performance. The Board also noted the actions management has taken in an effort to address the Fund’s performance over the past few years, including changes to the Fund’s portfolio management team and enhancements to the team’s security selection process.
Franklin Growth and Income VIP Fund - The Performance Universe for this Fund included the Fund and all equity income funds underlying VIPs. The Board noted that the Fund’s annualized income return and annualized total return for theone-, three-, five- and10-year periods were above the medians of its Performance Universe. The Board concluded that the Fund’s performance was satisfactory.
Franklin Income VIP Fund- The Performance Universe for this Fund included the Fund and all mixed-asset target
FRANKLIN TEMPLETON VARIABLE INSURANCE PRODUCTS TRUST
SHAREHOLDER INFORMATION
allocation moderate funds underlying VIPs. The Performance Customized Peer Group for this Fund consisted of funds sorted by trailing12-month yield and set to be top quartile (highest yield). The Board noted that the Fund’s annualized income return for theone-, three-, five- and10-year periods was above the medians of its Performance Universe and Performance Customized Peer Group. The Board also noted that the Fund’s annualized total return for theone-,three-and10-year periods was above the median of its Performance Universe, and for the five-year period was equal to the median of its Performance Universe. The Board noted that the Fund’s annualized total return for theone-, three-, five- and10-year periods was above the median of its Performance Customized Peer Group. The Board concluded that the Fund’s performance was satisfactory.
Franklin Strategic Income VIP Fund - The Performance Universe for this Fund included the Fund and all general bond funds underlying VIPs. The Board noted that the Fund’s annualized income return for theone- and three-year periods was below the median of its Performance Universe, but for the five- and10-year periods was above the median of its Performance Universe. The Board also noted that the Fund’s annualized total return for the five- andten-year periods was below the median of its Performance Universe, but for the three-year period was above the median of its Performance Universe and for theone-year period was equal to the median of its Performance Universe. The Board discussed this performance with management and management explained that the Fund’s relative underperfor-mance for the five-year period was impacted by, among other things, energy related credit investments that were affected by declining oil prices and globalnon-dollar long positions that were affected by broad US Dollar strength. Management then explained to the Board that it is continuing to enhance the Fund’s investment team and process, emphasizingbottom-up fundamental research,top-down macroeconomic analysis and quantitative modeling. Based on management’s explanation and the Fund’s shorter-term performance, the Board concluded that the Fund’s performance was satisfactory.
Franklin Large Cap Growth VIP Fund- The Performance Universe for this Fund included the Fund and alllarge-cap growth funds underlying VIPs. The Board noted that the Fund’s annualized total return for theone-year period was above the median of its Performance Universe, but for the three-, five- and10-year periods was below the median of its Performance Universe. The Board discussed this performance with management and management explained
that the Fund has historically maintained a higher allocation to smaller andmid-cap companies than the average fund in its Performance Universe. Management further explained that over the three- and five-year periods larger cap companies had outperformed smaller andmid-cap companies, contributing to the Fund’s below median performance. Management also explained that the Fund’s performance was impacted over the three- and five-year periods by security selection in the health care sector and general market rotation out of traditional secular growth sectors into cyclical sectors following the US presidential election in 2016. Based on management’s explanation, management’s recent actions taken to reposition certain portfolio holdings and the Fund’s above medianone-year performance, the Board concluded that the Fund’s performance was satisfactory. In doing so, the Board noted and that the Fund’s annualized total return for the three-, five- and10-year periods, while below the median, exceeded 14.7%, 11.1% and 13.8%, respectively.
Franklin Mutual Global Discovery VIP Fund-The Performance Universe for this Fund included the Fund and all globalmulti-cap value funds underlying VIPs. The Board noted that the Fund’s annualized total return for thethree-and10-year periods was below the median of its Performance Universe, but for theone- and five-year periods was above the median and in the first quintile (the best) of its Performance Universe. The Board concluded that the Fund’s performance was satisfactory. In doing so, the Board noted that the Fund’s annualized total return for the three- and10-year periods, while below the median, exceeded 7.5% and 9.0%, respectively.
Franklin Mutual Shares VIP Fund- The Performance Universe for this Fund included the Fund and allmulti-cap value funds underlying VIPs. The Board noted that the Fund’s annualized total return for theone-year period was above the median of its Performance Universe, but for the three-, five- and10-year periods was below the median of its Performance Universe. The Board discussed this performance with management and management explained that the Fund’s underperformance in 2017 was material and continues to adversely impact the Fund’s ranking over longer-term periods. Management reminded the Board of the primary factors that impacted the 2017 performance, including, among factors, exposure tonon-US equities and stock selection. Management then explained to the Board the actions it has taken in an effort to address the sources of the Fund’s underperformance, including changes to the Fund’s portfolio management team and enhancements to
FRANKLIN TEMPLETON VARIABLE INSURANCE PRODUCTS TRUST
SHAREHOLDER INFORMATION
the Fund’s investment process. Based on management’s explanation and the Fund’s above medianone-year performance, the Board concluded that the Fund’s performance was satisfactory. In doing so, the Board noted that the Fund’s annualized total return for the three-,five-and10-year periods, while below the median, were equal to or exceeded 9.0%, 5.5% and 10.7%, respectively.
FranklinSmall-Mid Cap Growth VIP Fund- The Performance Universe for this Fund included the Fund and allmid-cap growth funds underlying VIPs. The Board noted that the Fund’s annualized total return for theone-year period was above the median of its Performance Universe, but for the three-, five- and10-year periods was below the median of its Performance Universe. The Board discussed this performance with management and management explained that the Fund’s positioning in the healthcare, consumer, financial and industrial sectors was a primary detractor from relative performance over the three- and five-year periods. Management further explained that overweight exposure to the pharmaceutical industry was the largest detractor from performance, especially in 2016. Management then explained to the Board the actions it has taken in an effort to address the sources of the Fund’s relative underperfor-mance, including changes to the Fund’s portfolio management team and enhancements to the Fund’s investment process. Based on management’s explanation and the Fund’s above medianone-year performance, the Board concluded that the Fund’s performance was satisfactory. In doing so, the Board noted that the Fund’s annualized total return for the three-, five- and10-year periods, while below the median, were equal to or exceeded 13.8%, 7.4% and 14.7%, respectively.
Franklin Global Real Estate VIP Fund, Franklin Rising Dividends VIP Fund and Templeton Developing Markets VIP Fund- The Performance Universe for the Franklin Global Real Estate VIP Fund included the Fund and all global real estate funds underlying VIPs. The Performance Universe for the Franklin Rising Dividends VIP Fund included the Fund and allmulti-cap core funds underlying VIPs. The Performance Universe for the Templeton Developing Markets VIP Fund included the Fund and all emerging markets funds underlying VIPs. The Board noted that the Funds’ annualized total returns for theone-, three- and five-year periods were above the medians of their respective Performance Universes, but for theten-year period were below the medians of their respective Performance Universes. The Board concluded that the Funds’ performance was satisfactory.
Franklin Small Cap Value VIP Fund- The Performance Universe for this Fund included the Fund and a representative class/fund from each portfolio in thesmall-cap value funds underlying VIPs. The Board noted that the Fund’s annualized total return for theone-, three-, five- and10-year periods was above the median of its Performance Universe. The Board concluded that the Fund’s performance was satisfactory.
Franklin U.S. Government Securities VIP Fund- The Performance Universe for this Fund included the Fund and all general U.S. government funds underlying VIPs. The Board noted that the Fund’s annualized income return for theone-, three-, five- and10-year periods was above the median and in the first quintile (the best) of its Performance Universe. The Board also noted that the Fund’s annualized total return for the five- and10-year periods was below the median of its Performance Universe, but for theone- and three-year periods was above the median and in the second quintile of its Performance Universe. The Board concluded that the Fund’s performance was satisfactory.
Franklin VolSmart Allocation VIP Fund- The Performance Universe for this Fund included the Fund and all flexible portfolio funds underlying VIPs. The Performance Customized Peer Group for this Fund consisted of the Fund and all retail and institutional mixed-asset target allocation moderate funds. The Fund has been in operation for less than ten years. The Board noted that the Fund’s annualized total return for theone-, three- and five-year periods was below the medians of its Performance Universe and Performance Customized Peer Group. The Board discussed this performance with management and management explained that it is not aware of another fund in the Performance Universe that is a pure comparison to the Fund, noting the Fund’s strategy to seek to achieve its investment goal while attempting to minimize the expected volatility of the Fund’s returns so that volatility does not exceed a target of 10% per year. Management then explained to the Board the actions it has taken in an effort to address the sources of the Fund’s relative underperfor-mance, including changes to the Fund’s equity index short positions, and noted that the portfolio management team continues to monitor the security selection and weightings of the exchange-traded funds and active funds that comprise the Fund’s equity and fixed incomesub-strategies in anticipation of future allocation shifts that may be necessary in the coming year due to ongoing market concerns. In light of this explanation, the Board concluded that the Fund’s Management Agreement should be continued for an
FRANKLIN TEMPLETON VARIABLE INSURANCE PRODUCTS TRUST
SHAREHOLDER INFORMATION
additionalone-year period, and the Fund’s performance should continue to be monitored.
Templeton Foreign VIP Fund- The Performance Universe for this Fund included the Fund and all internationalmulti-cap value funds underlying VIPs. The Board noted that the Fund’s annualized total return for the five- andten-year periods was below the median of its Performance Universe, but for theone- and three-year periods was above the median of its Performance Universe. The Board concluded that the Fund’s performance was satisfactory.
Templeton Global Bond VIP Fund- The Performance Universe for this Fund included the Fund and all global income funds underlying VIPs. The Board noted that the Fund’s annualized income return for theone- and three-year periods was below the median of its Performance Universe, but for the five- and10-year periods was above the median of its Performance Universe. The Board also noted that the Fund’s annualized total return for theone-, three-, five- and10-year periods was above the median and in the first (best) and second quintiles of its Performance Universe. The Board concluded that the Fund’s performance was satisfactory.
Templeton Growth VIP Fund- The Performance Universe for this Fund included the Fund and all globalmulti-cap value funds underlying VIPs. The Board noted that the Fund’s annualized total return for theone- and five-year periods was below the median of its Performance Universe, but for the three- and10-year periods was above the median of its Performance Universe. The Board discussed this performance with management and management explained that the Fund’s underweight position in US stocks, overweight position in European holdings and overall stock selection (including in the health care sector) were primary themes that impacted the Fund’s relative performance over the past five years, noting that the Fund’s peers have a larger exposure to US investments and smaller exposure to emerging market investments as compared to the Fund. The Board also noted a number of changes implemented/being implemented by management to address the Fund’s below median annualized total return, in particular, changes to the Fund’s portfolio management team, macroeconomic analysis and portfolio construction. In light of this explanation and the Fund’s above median three- and10-year performance, the Board concluded that the Fund’s performance was acceptable and that the changes management is implementing will continue to be monitored.
Comparative Fees and Expenses
The Board reviewed and considered information regarding
each Fund’s actual total expense ratio and its various components, including, as applicable, management fees; transfer agent expenses; underlying fund expenses; Rule12b-1 andnon-Rule12b-1 service fees; and othernon-management fees. The Board also noted the quarterly and annual reports it receives on all marketing support payments made by FTI to financial intermediaries. The Board considered the actual total expense ratio and, separately, the contractual management fee rate, without the effect of fee waivers, if any (Management Rate) of each Fund in comparison to the median expense ratio and median Management Rate, respectively, of other mutual funds deemed comparable to and with a similar expense structure to the Fund selected by Broadridge (Expense Group). Broadridge fee and expense data is based upon information taken from each fund’s most recent annual report, which reflects historical asset levels that may be quite different from those currently existing, particularly in a period of market volatility. While recognizing such inherent limitation and the fact that expense ratios and Management Rates generally increase as assets decline and decrease as assets grow, the Board believed the independent analysis conducted by Broadridge to be an appropriate measure of comparative fees and expenses. The Broadridge Management Rate includes administrative charges. The Board received a description of the methodology used by Broadridge to select the mutual funds included in an Expense Group.
Franklin Flex Cap Growth VIP Fund, Franklin Mutual Shares VIP Fund and Franklin Strategic Income VIP Fund-The Expense Group for the Franklin Flex Cap Growth VIP Fund included the Fund and twelve otherlarge-cap growth funds underlying VIPs. The Expense Group for the Franklin Mutual Shares VIP Fund included the Fund and eight othermulti-cap value funds underlying VIPs. The Expense Group for the Franklin Strategic Income VIP Fund included the Fund and seven other general bond funds underlying VIPs. The Board noted that the Management Rates for these Funds were above (only slightly for Franklin Mutual Shares VIP Fund and the Franklin Strategic Income VIP Fund) the medians of their respective Expense Groups, but their actual total expense ratios were below the medians of their respective Expense Groups. The Board concluded that the Management Rates charged to these Funds are reasonable. In doing so, the Board noted that the Franklin Flex Cap Growth Fund’s actual total expense ratio reflected a fee waiver from management. With respect to the Franklin Mutual Shares VIP Fund, the Board further noted management’s explanation that the portfolio management
FRANKLIN TEMPLETON VARIABLE INSURANCE PRODUCTS TRUST
SHAREHOLDER INFORMATION
team makes investments in distressed securities and merger arbitrage that are specialist in nature and therefore require additional resources that raise management costs, whereas the Fund’s Expense Group generally does not make such investments.
Templeton Growth VIP Fund- The Expense Group for this Fund included the Fund, three other globalmulti-cap value fund underlying VIPs, two globalmulti-cap core funds underlying VIPs and three globalmulti-cap growth funds underlying VIPs. The Board noted that the Management Rate for the Fund was slightly above the median of its Expense Group and its actual total expense ratio was equal to the median of its Expense Group. The Board concluded that the Management Rate charged to the Fund is reasonable.
FranklinSmall-Mid Cap Growth VIP Fund- The Expense Group for the Fund included this Fund and twelve othermid-cap growth funds underlying VIPs. The Board noted that the Management Rate for the Fund was below the median of its Expense Group, and the actual total expense ratio for the Fund was equal to the median of its Expense Group. The Board concluded that the Management Rate charged to the Fund is reasonable.
Franklin Global Real Estate VIP Fund, Franklin Large Cap Growth VIP Fund, Franklin Mutual Global Discovery VIP Fund and Templeton Developing Markets VIP Fund- The Expense Group for the Franklin Global Real Estate VIP Fund included the Fund and eight other global real estate funds underlying VIPs. The Expense Group for the Franklin Large Cap Growth VIP Fund included the Fund and ten otherlarge-cap growth funds underlying VIPs. The Expense Group for the Franklin Mutual Global Discovery VIP Fund included the Fund, three other globalmulti-cap value funds underlying VIPs, two globalmulti-cap core funds underlying VIPs and five globalmulti-cap growth funds underlying VIPs. The Expense Group for the Templeton Developing Markets VIP Fund included the Fund and 12 other emerging markets funds underlying VIPs. The Board noted that the Management Rates and actual total expense ratios for these Funds were above the medians of their respective Expense Groups. With respect to the Franklin Mutual Global Discovery VIP Fund, the Board noted management’s explanation that the portfolio management team makes investments in distressed securities and merger arbitrage that are specialist in nature and therefore require additional resources that raise management costs, whereas the Fund’s Expense Group generally does not make such investments.
With respect to the Franklin Global Real Estate VIP Fund, the Board noted management’s explanation that the portfolio managers’ rigorous fundamental analysis and active risk controls elevate management costs. With respect to the Franklin Large Cap Growth VIP Fund and the Templeton Developing Markets VIP Fund, the Board noted that the Funds’ Management Rates and actual total expense ratios were only slightly above (approximately 5 basis points or less) the medians of each Fund’s respective Expense Group. The Board concluded that the Management Rates charged to these Funds are reasonable.
Franklin Growth and Income VIP Fund, Franklin Income VIP Fund, Franklin Small Cap Value VIP Fund, Franklin U.S. Government Securities VIP Fund, Templeton Foreign VIP Fund and Templeton Global Bond VIP Fund– The Expense Group for the Franklin Growth and Income VIP Fund included the Fund and seven other equity income funds underlying VIPs. The Expense Group for the Franklin Income VIP Fund included the Fund and seven other mixed-asset target allocation moderate funds underlying VIPs. The Expense Group for the Franklin Small Cap Value VIP Fund included the Fund and seven othersmall-cap value funds underlying VIPs. The Expense Group for the Franklin U.S. Government Securities VIP Fund included the Fund and ten other general U.S. government funds underlying VIPs. The Expense Group for the Templeton Foreign VIP Fund included the Fund, eight other internationalmulti-cap value funds underlying VIPs and three internationalmulti-cap core funds underlying VIPs. The Expense Group for the Templeton Global Bond VIP Fund included the Fund and eight other global income funds underlying VIPs. The Board noted that the Management Rates and actual total expense ratios for these Funds were below the medians of their respective Expense Groups. The Board concluded that the Management Rates charged to these Funds are reasonable. The Board also noted that the Franklin Growth and Income VIP Fund’s actual total expense ratio reflected a fee waiver from management.
Franklin Rising Dividends VIP Fund- The Expense Group for this Fund included the Fund and 12 othermulti-cap core funds underlying VIPs. The Board noted that the Management Rate for the Fund was equal to the median of its Expense Group, but its actual total expense ratio was below the median of its Expense Group. The Board concluded that the Management Rate charged to the Fund is reasonable.
FRANKLIN TEMPLETON VARIABLE INSURANCE PRODUCTS TRUST
SHAREHOLDER INFORMATION
Franklin VolSmart Allocation VIP Fund– The Expense Group for this Fund included the Fund and four other flexible portfolio funds underlying VIPs. The Board noted the small size of the Expense Group. The Board also noted that the Management Rate for the Fund was below the median of its Expense Group and its actual total expense ratio was slightly above the median of its Expense Group. The Board concluded that the Management Rate charged to the Fund is reasonable. In doing so, the Board noted that the Fund’s actual total expense ratio reflected a fee waiver from management and that theSub-Adviser was paid by FAI out of the management fee FAI received from the Fund.
Profitability
The Board reviewed and considered information regarding the profits realized by each Manager and its affiliates in connection with the operation of each Fund. In this respect, the Board considered the Fund profitability analysis provided by each Manager that addresses the overall profitability of FTI’s US fund business, as well as its profits in providing investment management and other services to each of the individual funds during the12-month period ended September 30, 2018, being the most recent fiscalyear-end for FRI. The Board noted that although management continually makes refinements to its methodologies used in calculating profitability in response to organizational and product related changes, the overall methodology has remained consistent with that used in the Funds’ profitability report presentations from prior years. Additionally, PricewaterhouseCoopers LLP, auditor to FRI and certain Franklin Templeton funds, has been engaged by each Manager to periodically review and assess the allocation methodologies to be used solely by the Funds’ Board with respect to the profitability analysis.
The Board noted management’s belief that costs incurred in establishing the infrastructure necessary for the type of mutual fund operations conducted by each Manager and its affiliates may not be fully reflected in the expenses allocated to each Fund in determining its profitability, as well as the fact that the level of profits, to a certain extent, reflected operational cost savings and efficiencies initiated by management. The Board also noted management’s expenditures in improving shareholder services provided to the Funds, as well as the need to implement systems and meet additional regulatory and compliance requirements resulting from recent SEC and other regulatory requirements.
The Board also considered the extent to which each Manager and its affiliates might derive ancillary benefits from fund operations, including revenues generated from transfer agent services, potential benefits resulting from personnel and systems enhancements necessitated by fund growth, as well as increased leverage with service providers and counterparties. Based upon its consideration of all these factors, the Board concluded that the level of profits realized by each Manager and its affiliates from providing services to each Fund was not excessive in view of the nature, extent and quality of services provided to each Fund.
Economies of Scale
The Board reviewed and considered the extent to which each Manager may realize economies of scale, if any, as each Fund grows larger and whether each Fund’s management fee structure reflects any economies of scale for the benefit of shareholders. With respect to possible economies of scale, the Board noted the existence of management fee breakpoints for each Fund (except for the Franklin VolSmart Allocation VIP Fund), which operate generally to share any economies of scale with a Fund’s shareholders by reducing the Fund’s effective management fees as the Fund grows in size. The Board considered management’s view that any analyses of potential economies of scale in managing a particular fund are inherently limited in light of the joint and common costs and investments each Manager incurs across the Franklin Templeton family of funds as a whole. The Board concluded that to the extent economies of scale may be realized by each Manager and its affiliates, each Fund’s management fee structure (except that of the Franklin VolSmart Allocation VIP Fund) provided a sharing of benefits with the Fund and its shareholders as the Fund grows. The Board recognized that there would not likely be any economies of scale for the Franklin Flex Cap Growth VIP Fund, Franklin Global Real Estate VIP Fund, Franklin Growth and Income VIP Fund, Franklin Large Cap Growth VIP Fund and Franklin VolSmart Allocation VIP Fund until each Fund’s assets grow. The Board also recognized that given the decline in assets over the past three calendar years for each of the FranklinSmall-Mid Cap Growth VIP Fund, Franklin Strategic Income VIP Fund, Franklin U.S. Government Securities VIP Fund and Templeton Foreign VIP Fund, these Funds are not expected to experience additional economies of scale in the foreseeable future.
Conclusion
Based on its review, consideration and evaluation of all factors it believed relevant, including the above-described
FRANKLIN TEMPLETON VARIABLE INSURANCE PRODUCTS TRUST
SHAREHOLDER INFORMATION
factors and conclusions, the Board unanimously approved the continuation of each Management Agreement for an additionalone-year period.
Proxy Voting Policies and Procedures
The Trust’s investment manager has established Proxy Voting Policies and Procedures (Policies) that the Trust uses to determine how to vote proxies relating to portfolio securities. Shareholders may view the Trust’s complete Policies online at franklintempleton.com. Alternatively, shareholders may request copies of the Policies free of charge by calling the Proxy Group collect at (954)527-7678 or by sending a written request to: Franklin Templeton Companies, LLC, 300 S.E. 2nd Street, Fort Lauderdale, FL 33301, Attention: Proxy Group. Copies of the Trust’s proxy voting records are also made available online at franklintempleton.com and posted on the U.S. Securities and Exchange Commission’s website at sec.gov and reflect the most recent12-month period ended June 30.
Quarterly Statement of Investments
The Trust files a complete statement of investments with the U.S. Securities and Exchange Commission for the first and third quarters for each fiscal year as an exhibit to its report on FormN-PORT. Shareholders may view the filed FormN-PORT by visiting the Commission’s website at sec.gov. The filed form may also be viewed and copied at the Commission’s Public Reference Room in Washington, DC. Information regarding the operations of the Public Reference Room may be obtained by calling(800) SEC-0330.
This page intentionally left blank.
This page intentionally left blank.
Franklin Templeton Variable Insurance Products Trust (FTVIP) shares are not offered to the public; they are offered and sold only to: (1) insurance company separate accounts (Separate Account) to serve as the underlying investment vehicle for variable contracts; (2) certain qualified plans; and (3) other mutual funds (funds of funds).
Authorized for distribution to investors in Separate Accounts only when accompanied or preceded by the current prospectus for the applicable contract, which includes the Separate Account and the FTVIP prospectuses. Investors should carefully consider a fund’s investment goals, risks, charges and expenses before investing. The prospectus contains this and other information; please read it carefully before investing.
To help ensure we provide you with quality service, all calls to and from our service areas are monitored and/or recorded.
| | | | | | |
 | | Semiannual Report | | | | |
| | Franklin Templeton Variable Insurance Products Trust |
| | Investment Managers | | Fund Administrator | | Distributor |
| | Franklin Advisers, Inc. | | Franklin Templeton Services, LLC | | Franklin Templeton Distributors, Inc. |
| | Franklin Mutual Advisers, LLC | | | | |
| | Franklin Templeton | | | | |
| | Institutional, LLC | | | | |
| | Templeton Asset | | | | |
| | Management Ltd. | | | | |
| | Templeton Global Advisors Limited | | | | |
| | Templeton Investment | | | | |
| | Counsel, LLC | | | | |
| | |
| © 2019 Franklin Templeton Investments. All rights reserved. | | VIP2 S 08/19 |
| (a) | The Registrant has adopted a code of ethics that applies to its principal executive officers and principal financial and accounting officer. |
| (f) | Pursuant to Item 13(a)(1), the Registrant is attaching as an exhibit a copy of its code of ethics that applies to its principal executive officers and principal financial and accounting officer. |
| Item 3. | Audit Committee Financial Expert. |
| | |
| (a) (1) | | The Registrant has an audit committee financial expert serving on its audit committee. |
| |
| (2) | | The audit committee financial expert is Mary C. Choksi and he is “independent” as defined under the relevant Securities and Exchange Commission Rules and Releases. |
| Item 4. | Principal Accountant Fees and Services. N/A |
| Item 5. | Audit Committee of Listed Registrants. N/A |
| Item 6. | Schedule of Investments. N/A |
| Item 7. | Disclosure of Proxy Voting Policies and Procedures forClosed-End Management Investment Companies. N/A |
| Item 8. | Portfolio Managers ofClosed-End Management Investment Companies. N/A |
| Item 9. | Purchases of Equity Securities byClosed-End Management Investment Company and Affiliated Purchasers. N/A |
| Item 10. | Submission of Matters to a Vote of Security Holders. |
There have been no changes to the procedures by which shareholders may recommend nominees to the Registrant’s Board of Trustees that would require disclosure herein.
| Item 11. | Controls and Procedures. |
(a)Evaluation of Disclosure Controls and Procedures. The Registrant maintains disclosure controls and procedures that are designed to
provide reasonable assurance that information required to be disclosed in the Registrant’s filings under the Securities Exchange Act of 1934, as amended, and the Investment Company Act of 1940 is recorded, processed, summarized and reported within the periods specified in the rules and forms of the Securities and Exchange Commission. Such information is accumulated and communicated to the Registrant’s management, including its principal executive officer and principal financial officer, as appropriate, to allow timely decisions regarding required disclosure. The Registrant’s management, including the principal executive officer and the principal financial officer, recognizes that any set of controls and procedures, no matter how well designed and operated, can provide only reasonable assurance of achieving the desired control objectives.
Within 90 days prior to the filing date of this Shareholder Report onForm N-CSRS, the Registrant had carried out an evaluation, under the supervision and with the participation of the Registrant’s management, including the Registrant’s principal executive officer and the Registrant’s principal financial officer, of the effectiveness of the design and operation of the Registrant’s disclosure controls and procedures. Based on such evaluation, the Registrant’s principal executive officer and principal financial officer concluded that the Registrant’s disclosure controls and procedures are effective.
(b)Changes in Internal Controls. There have been no changes in the Registrant’s internal control over financial reporting that occurred during the period covered by this report that has materially affected, or is reasonably likely to materially affect the internal control over financial reporting.
| Item 12. | Disclosure of Securities Lending Activities forClosed-End Management Investment Company. N/A |
(a)(1) Code of Ethics
(a)(2) Certifications pursuant to Section 302 of the Sarbanes-Oxley Act of 2002 of Matthew T. Hinkle, Chief Executive Officer—Finance and Administration, and Gaston Gardey, Chief Financial Officer and Chief Accounting Officer
(b)Certifications pursuant to Section 906 of the Sarbanes-Oxley Act of 2002 of Matthew T. Hinkle, Chief Executive Officer—Finance and Administration, and Gaston Gardey, Chief Financial Officer and Chief Accounting Officer
SIGNATURES
Pursuant to the requirements of the Securities Exchange Act of 1934 and the Investment Company Act of 1940, the registrant has duly caused this report to be signed on its behalf by the undersigned, thereunto duly authorized.
Franklin Templeton Variable Insurance Products Trust
| | |
| By | | S\ MATTHEW T. HINKLE |
| | Matthew T. Hinkle |
| | Chief Executive Officer – |
| | Finance and Administration |
| Date August 30, 2019 |
Pursuant to the requirements of the Securities Exchange Act of 1934 and the Investment Company Act of 1940, this report has been signed below by the following persons on behalf of the registrant and in the capacities and on the dates indicated.
| | |
| By | | S\ MATTHEW T. HINKLE |
| | Matthew T. Hinkle |
| | Chief Executive Officer – |
| | Finance and Administration |
| Date August 30, 2019 |
| |
| By | | S\ GASTON GARDEY |
| | Gaston Gardey |
| | Chief Financial Officer and |
| | Chief Accounting Officer |
| Date August 30, 2019 |