UNITED STATES
SECURITIES AND EXCHANGE COMMISSION
Washington, DC 20549
FORMN-CSR
CERTIFIED SHAREHOLDER REPORT OF REGISTERED
MANAGEMENT INVESTMENT COMPANIES
Investment Company Act file number811-05583
Franklin Templeton Variable Insurance Products Trust
(Exact name of registrant as specified in charter)
One Franklin Parkway, San Mateo, CA 94403-1906
(Address of principal executive offices) (Zip code)
Craig S. Tyle, One Franklin Parkway, San Mateo, CA 94403-1906
(Name and address of agent for service)
Registrant’s telephone number, including area code: (650)312-2000
Date of fiscal year end: 12/31
Date of reporting period: 12/31/19
| Item 1. | Reports to Stockholders. |
Internet Delivery of Shareholder Reports: Effective January 1, 2021, as permitted by regulations adopted by the SEC, you may not be receiving paper copies of the Fund’s annual or semiannual shareholder reports by mail, unless you specifically request them from the insurance company that offers your variable annuity or variable life insurance contract or your financial intermediary. Instead of delivering paper copies of the report, the insurance company may choose to make the reports available on a website, and will notify you by mail each time a shareholder report is posted and provide you with a website link to access the report. Instructions for requesting paper copies will be provided by your insurance company.
If you already elected to receive shareholder reports electronically, you will not be affected by this change and you need not take any action. You may elect to receive shareholder reports and other communications from the insurance company or your financial intermediary electronically by following the instructions provided by the insurance company or by contacting your financial intermediary.
You may elect to receive all future Fund shareholder reports in paper free of charge from the insurance company. You can inform the insurance company or your financial intermediary that you wish to continue receiving paper copies of your shareholder reports by following the instructions provided by the insurance company or by contacting your financial intermediary. Your election to receive reports in paper will apply to all portfolio companies available under your contract with the insurance company.
This notice is not legally a part of the shareholder report.
Franklin Templeton Variable Insurance
Products Trust Annual Report
Table of Contents
*Not part of the annual report. Retain for your records.
|
| |
| Not FDIC Insured | May Lose Value | No Bank Guarantee |
MASTER CLASS – 4
FRANKLIN TEMPLETON VARIABLE INSURANCE PRODUCTS TRUST
Important Notes to
Performance Information
Performance data is historical and cannot predict or guarantee future results. Principal value and investment return will fluctuate with market conditions, and you may have a gain or loss when you withdraw your money. Inception dates of the funds may have preceded the effective dates of the subaccounts, contracts or their availability in all states.
When reviewing the index comparisons, please keep in mind that indexes have a number of inherent performance differentials over the funds. First, unlike the funds, which must hold a minimum amount of cash to maintain liquidity,
indexes do not have a cash component. Second, the funds are actively managed and, thus, are subject to management fees to cover salaries of securities analysts or portfolio managers in addition to other expenses. Indexes are unmanaged and do not include any commissions or other expenses typically associated with investing in securities. Third, indexes often contain a different mix of securities than the fund to which they are compared. Additionally, please remember that indexes are simply a measure of performance and cannot be invested in directly.
Franklin Allocation VIP Fund
(Formerly, Franklin Founding Funds Allocation VIP Fund)
This annual report for Franklin Allocation VIP Fund covers the period ended December 31, 2019. As previously communicated, effective May 1, 2019, the Fund changed its name to Franklin Allocation VIP Fund and changed from a fund of funds that invested fixed percentages in three underlying funds to an actively managed fund that invests in a variety of equity and fixed income investments.
Class 4 Performance Summary as of December 31, 2019
Average annual total return of Class 4 shares* represents the average annual change in value, assuming reinvestment of dividends and capital gains. Average returns smooth out variations in returns, which can be significant; they are not the same asyear-by-year results.
| | | | | | | | | | | | |
| Periods ended 12/31/19 | | 1-Year | | | 5-Year | | | 10-Year | |
Average Annual Total Return | | | +19.56% | | | | +5.05% | | | | +7.34% | |
*On May 1, 2019, the Fund’s investment strategies changed. Performance prior to May 1, 2019, is attributable to the Fund’s performance before the strategy change. The Fund has an expense reduction and a fee waiver associated with any investments in a Franklin Templeton money fund and/or other Franklin Templeton fund, contractually guaranteed through 4/30/20. Fund investment results reflect the expense reduction and fee waiver; without these reductions, the results would have been lower.
Performance reflects the Fund’s Class 4 operating expenses, but doesnotinclude any contract fees, expenses or sales charges. If they had been included, performance would be lower. These charges and deductions, particularly for variable life policies, can have a significant effect on contract values and insurance benefits. See the contract prospectus for a complete description of these expenses, including sales charges.
Performance data represent past performance, which does not guarantee future results. Investment return and principal value will fluctuate, and you may have a gain or loss when you sell your shares. Current performance may differ from figures shown.
FRANKLIN ALLOCATION VIP FUND
Total Return Index Comparison for a Hypothetical $10,000 Investment (1/1/10–12/31/19)
The graph below shows the change in value of a hypothetical $10,000 investment in the Fund over the indicated period and includes reinvestment of any income or distributions. The Fund’s performance* is compared to the performance of the Standard & Poor’s® 500 Index (S&P 500®), the MSCI World Index, the Bloomberg Barclays U.S. Aggregate Bond Index, MSCI World ex USAIndex-NR and the Linked Allocation VIP Fund Benchmark (Blended Benchmark). One cannot invest directly in an index, and an index is not representative of the Fund’s portfolio.Please see Important Notes to Performance Information preceding the Fund Summaries.
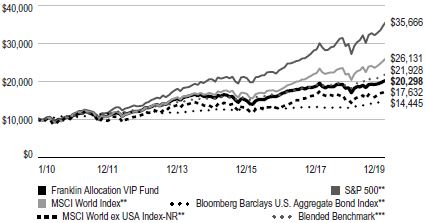
**Source: Morningstar. Please see Index Descriptions following the Fund Summaries.
***Source: FactSet. The Fund’s Blended Benchmark was calculated internally and rebalanced monthly and was composed of 40% S&P 500, 40% Bloomberg Barclays U.S. Aggregate Bond Index and 20% MSCI World ex USAIndex-NR. Net Returns (NR) include income net of tax withholding when dividends are paid. Please see Index Descriptions following the Fund Summaries.
FRANKLIN ALLOCATION VIP FUND
Fund Goal and Main Investments
The Fund seeks capital appreciation, with income as a secondary goal. Under normal market conditions, the Fund allocates approximately 60% of its assets to the equity asset class and 40% of its assets to the fixed income asset class by allocating the Fund’s assets among various sleeves (investment strategies).
Fund Risks
All investments involve risks, including possible loss of principal. Because the Fund invests in underlying funds, and the Fund’s performance is directly related to the performance of the underlying funds held by it, the ability of the Fund to achieve its investment goals is directly related to the ability of the underlying funds to meet their investment goals. Additionally, because these underlying funds may engage in a variety of investment strategies involving certain risks, the Fund may be subject to these same risks. Stock prices fluctuate, sometimes rapidly and dramatically, due to factors affecting individual companies, particular industries or sectors, or general market conditions. Bonds are affected by changes in interest rates and the creditworthiness of their issuers. Bond prices generally move in the opposite direction of interest rates. Thus, as prices of bonds adjust to a rise in interest rates, the Fund’s share price may decline. Higher yielding, lower rated corporate bonds entail a greater degree of credit risk compared to investment-grade securities. Foreign investing carries additional risks such as currency and market volatility and political or social instability, risks that are heightened in developing countries. Value securities may not increase in price as anticipated or may decline further in value. The Fund’s prospectus also includes a description of the main investment risks.
Performance Overview
You can find the Fund’sone-year total return in the Performance Summary. In comparison, one of the Fund’s benchmarks, the S&P 500 posted a +31.49% total return. The Fund’s new benchmarks, the Bloomberg Barclays U.S. Aggregate Bond Index posted a +8.72% total return; the MSCI World ex USAIndex-NR posted a +23.16% total return; and the Linked Allocation VIP Fund Benchmark
Asset Allocation*
Based on Total Net Assets as of 12/31/19
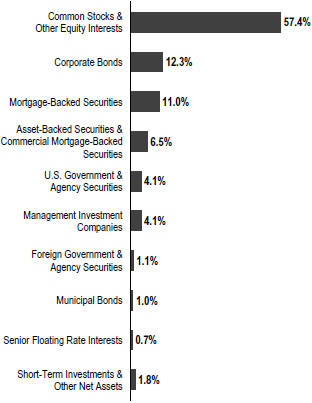
*The asset allocation is based on the Statement of Investments (SOI), which classifies each underlying fund into a broad asset class.
(Blended Benchmark) posted a +20.45% total return.1,2 One of the Fund’s old benchmarks, the MSCI World Index posted a +28.40% total return for the same period.1 The Fund changed from a fund that invested fixed percentages in three underlying funds to an actively managed fund that invests in a variety of equity and fixed income investments; its benchmarks also changed.
Economic and Market Overview
Global developed and emerging market stocks, as measured by the MSCI All Country World Index, posted strong returns during the reporting period. Although global economic growth slowed from 2018, interest-rate cuts from many central banks and the easing of trade tensions near
1. Source: Morningstar.
2. Source: FactSet. The Fund’s Blended Benchmark was calculated internally and rebalanced monthly and was composed of 40% S&P 500, 40% Bloomberg Barclays U.S. Aggregate Bond Index and 20% MSCI World ex USAIndex-NR.
One cannot invest directly in an index, and an index is not representative of the Fund’s portfolio. Net Returns (NR) include income net of tax withholding when dividends are paid. Please see Index Descriptions following the Fund Summaries.
The dollar value, number of shares or principal amount, and names of all portfolio holdings are listed in the Fund’s Statement of Investments (SOI).
FRANKLIN ALLOCATION VIP FUND
period-end contributed to the generally positive environment for equities worldwide. Reflecting investor optimism and slowing but resilient economic growth, stocks advanced in every major region of the globe.
In the U.S., solid economic growth also supported equities, as healthy consumer spending and a strong labor market kept the economy afloat. The unemployment rate fell during the year, reaching 3.5% in September, November and December 2019, the lowest recorded unemployment rate in 50 years.3 Wages also grew, albeit at a moderate pace, and inflation remained persistently low. In addition, deficit spending by the U.S. government boosted current growth at the expense of long-term debt. Despite the strength in the consumer sector, some parts of the economy struggled, particularly heavy industry. Annual industrial production contracted late in the reporting period, manufacturing output stalled and capital spending declined.
The U.S. Federal Reserve (Fed) provided a substantial boost to equity markets early in the reporting period as it shifted to a more accommodative monetary policy. In January 2019, the Fed signaled the end of its tightening cycle and cut the federal funds rate three times thereafter, lowering it to a range of 1.50%–1.75%. Stocks responded positively to the interest-rate cuts and gained further in December 2019 after the Fed indicated it would likely leave interest rates unchanged in 2020.
Growth slowed overall in the eurozone, particularly in Germany and Italy. Germany, which is heavily reliant on exports, was adversely affected by the trade conflict between the U.S. and China and the resulting slowdown in global trade. In Italy, political uncertainty and budget concerns caused the country’s annual gross domestic product (GDP) growth to stall in 2019’s first quarter before accelerating in the second quarter. Despite sluggish economic conditions, European developed market equities, as measured by the MSCI Europe Index, posted strong returns overall, as easing trade tensions buoyed investor optimism and an electoral victory by the Conservative Party in the U.K. alleviated uncertainty surrounding Brexit. Although the European Central Bank left its headline refinancing rate unchanged, it lowered the deposit rate and restarted its bond-buying stimulus program, further supporting stocks.
Economic growth in Asia was relatively solid overall, despite slowdowns in several large emerging market countries, such as China and India. Japan’s economy grew amid the Bank of Japan’s sizable stimulus program. The trade war between
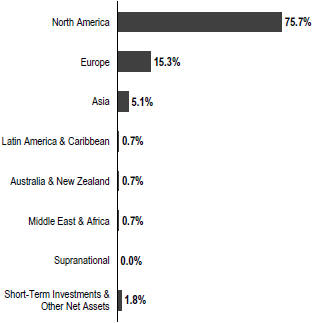
Geographic Composition
Based on Total Net Assets as of 12/31/19
the U.S. and China provided the backdrop for Asian stocks, which rose and fell in sync with investor sentiment regarding a trade deal. A phase one agreement reached in December 2019 propelled Asian developed and emerging market stocks, which ultimately ended with strong returns over the12-month period, as measured by the MSCI All Country Asia Index.
Emerging market stocks overall experienced several sharp selloffs and subsequent rebounds throughout the reporting period before ending with gains. In aggregate, economic growth slowed somewhat from 2018 but remained solid, although there was some variation among individual countries. Many central banks in emerging markets cut interest rates throughout the reporting period which, along with resilient GDP growth, provided a supportive environment for equities. Russian stocks posted the highest returns among emerging markets as the threat of further sanctions receded and a solid fiscal environment reassured investors. Overall, global emerging markets, as measured by the MSCI Emerging Markets Index, posted robust returns for the period.
Investment Strategy
The Fund seeks to achieve its investment goals by allocating its assets among the broad asset classes of equity and fixed income investments through a variety of investment
3. Source: U.S. Bureau of Labor Statistics.
FRANKLIN ALLOCATION VIP FUND
strategies or “sleeves” managed by the investment manager or its affiliates, which include Franklin U.S. Smart Beta Equity Strategy, Franklin Total Return Strategy, Franklin Growth Strategy, Templeton Foreign Strategy, Franklin International Growth Strategy, Franklin U.S. Government Securities Strategy, Franklin Rising Dividends Strategy, Franklin Investment Grade Corporate Strategy and Templeton Global Bond VIP Fund Strategy. The Fund is structured as a multi-manager fund (meaning the Fund’s assets are managed by multiplesub-advisors), with the investment manager having overall responsibility for the Fund’s investments. Allocation to each sleeve will generally not exceed 20% and will vary with market conditions. However, under normal market conditions, no sleeve constitutes a majority of the Fund’s assets.
Top 10 Holdings
12/31/19
| | |
Company Sector/Industry | | % of Total
Net Assets |
| |
Templeton Global Bond VIP Fund Diversified Financials | | 4.1% |
| |
Microsoft Corp. Software & Services | | 1.2% |
| |
Apple Inc. Technology Hardware & Equipment | | 0.9% |
| |
Texas Instruments Inc. Semiconductors & Semiconductor Equipment | | 0.6% |
| |
Mastercard Inc. Software & Services | | 0.5% |
| |
Amazon.com Inc. Retailing | | 0.5% |
| |
NIKE Inc. Consumer Durables & Apparel | | 0.5% |
| |
Accenture PLC Software & Services | | 0.5% |
| |
Johnson & Johnson Pharmaceuticals, Biotechnology & Life Sciences | | 0.5% |
| |
Union Pacific Corp. Transportation | | 0.5% |
Manager’s Discussion
From January 1, 2019, through the date of the investment strategy change on May 1, 2019, the Fund’s performance can be attributed largely to its allocation among the underlying funds and their investments in domestic and foreign equities, fixed income securities, and short-term investments and other net assets. For the period after the investment strategy change through December 31, 2019, the Fund’s performance can be attributed largely to its allocation
among the underlying sleeves and their investments in domestic and foreign equities, fixed income securities, and short-term investments and other net assets. The allocation to the sleeves did not change over the period.
For the period before the investment strategy change, Franklin Income VIP Fund – Class 1 and Franklin Mutual Shares VIP Fund – Class 1 underperformed the S&P 500. Templeton Growth VIP Fund – Class 1 underperformed the MSCI World Index. For the period after the investment strategy change, the Franklin Growth Strategy underperformed the S&P 500, the Franklin Rising Dividends Strategy underperformed the S&P 500, the Templeton Foreign Strategy underperformed the MSCI All Country World ex USAIndex-NR, the Franklin International Growth Strategy outperformed the MSCI EAFE Index, the U.S. Smart Beta Equity Strategy underperformed the Russell 1000® Index, the Franklin U.S. Government Securities Strategy underperformed the Bloomberg Barclays U.S. Government Index: Intermediate Component, and the Investment-Grade Corporate Strategy performed in line with the Bloomberg Barclays U.S. Corporate Bond Index.
Thank you for your participation in Franklin Allocation VIP Fund. We look forward to serving your Future investment needs.
The foregoing information reflects our analysis, opinions and portfolio holdings as of December 31, 2019, the end of the reporting period. The way we implement our main investment strategies and the resulting portfolio holdings may change depending on factors such as market and economic conditions. These opinions may not be relied upon as investment advice or an offer for a particular security. The information is not a complete analysis of every aspect of any market, country, industry, security or the Fund. Statements of fact are from sources considered reliable, but the investment manager makes no representation or warranty as to their completeness or accuracy. Although historical performance is no guarantee of future results, these insights may help you understand our investment management philosophy.
FRANKLIN ALLOCATION VIP FUND
Class 4 Fund Expenses
As an investor in a variable insurance contract (Contract) that indirectly provides for investment in an underlying mutual fund, you can incur transaction and/or ongoing expenses at both the Fund level and the Contract Level: (1) transaction expenses can include sales charges (loads) on purchases, surrender fees, transfer fees and premium taxes; and (2) ongoing expenses can include management fees, distribution and service(12b-1) fees, contract fees, annual maintenance fees, mortality and expense risk fees and other fees and expenses. All mutual funds and Contracts have some types of ongoing expenses. The table below shows Fund-level ongoing expenses and can help you understand these costs and compare them with those of other mutual funds offered through the Contract. The table assumes a $1,000 investment held for the six months indicated. Please refer to the Fund prospectus for additional information on operating expenses.
Actual Fund Expenses
The table below provides information about the actual account values and actual expenses in the columns under the heading “Actual.” In these columns the Fund’s actual return, which includes the effect of ongoing Fund expenses but does not include the effect of ongoing Contract expenses, is used to calculate the “Ending Account Value.” You can estimate the Fund-level expenses you paid during the period by following these steps (of course, your account value and expenses will differ from those in this illustration): Divide your account value by $1,000 (if your account had an $8,600 value, then $8,600÷ $1,000 =8.6). Then multiply the result by the number under the headings “Actual” and “Fund-Level Expenses Paid During Period” (if Fund-Level Expenses Paid During Period were $ 7.50, then 8.6 x $ 7.50 = $64.50). In this illustration, the estimated expenses paid this period at the Fund level are $64.50.
Hypothetical Example for Comparison with Other Mutual Funds
Under the heading “Hypothetical” in the table, information is provided about hypothetical account values and hypothetical expenses based on the Fund’s actual expense ratio and an assumed rate of return of 5% per year before expenses, which is not the Fund’s actual return. This information may not be used to estimate the actual ending account balance or expenses you paid for the period, but it can help you compare ongoing costs of investing in the Fund with those of other mutual funds offered through the Contract. To do so, compare this 5% hypothetical example with the 5% hypothetical examples that appear in the shareholder reports of other funds offered through the Contract.
Please note that expenses shown in the table are meant to highlight ongoing costs at the Fund level only and do not reflect any ongoing expenses at the Contract level, or transaction expenses at either the Fund or Contract levels. In addition, while the Fund does not have transaction expenses, if the transaction and ongoing expenses at the Contract level were included, the expenses shown below would be higher. You should consult your Contract prospectus or disclosure document for more information.
| | | | | | | | | | | | |
| | | | | Actual
(actual return after expenses) | | Hypothetical
(5% annual return before expenses) | | |
Share
Class | | Beginning
Account
Value 7/1/19 | | Ending
Account
Value 12/31/19 | | Fund-Level
Expenses
Paid During
Period 7/1/19–12/31/191, 2 | | Ending
Account
Value 12/31/19 | | Fund-Level
Expenses
Paid During
Period
7/1/19–12/31/191, 2 | | Net
Annualized
Expense
Ratio2 |
| | | | | | |
| Class 4 | | $1,000 | | $1,059.30 | | $4.62 | | $1,020.72 | | $4.53 | | 0.89% |
1. Expenses are equal to the annualized expense ratio for thesix-month period as indicated above—in the far right column—multiplied by the simple average account value over the period indicated, and then multiplied by 184/365 to reflect theone-half year period.
2. Reflects expenses after fee waivers and expense reimbursements. Does not include acquired fund fees and expenses.
FFA P1 P2 P4 09/19
SUPPLEMENT DATED SEPTEMBER 12, 2019
TO THE PROSPECTUSES
DATED MAY 1, 2019 OF
FRANKLIN ALLOCATION VIP FUND
(A series of Franklin Templeton Variable Insurance Products Trust)
The prospectus is amended as follows:
I. The “Fund Summary – Average Annual Total Returns” table on pageFFA-S8 in the Fund’s Class 1 prospectus is replaced with the following:
Average Annual Total Returns
For the periods ended December 31, 2018
| | | | | | | | |
| | | | | 1 Year | | 5 Years | | 10 Years |
Franklin Allocation VIP Fund – Class 1 | | | | -9.34% | | 2.26% | | 8.62% |
| | | | |
S&P 500®Index (index reflects no deduction for fees, expenses or taxes) | | | | -4.38% | | 8.50% | | 13.12% |
| | | | |
Bloomberg Barclays U.S. Aggregate Index (index reflects no deduction for fees, expenses or taxes) | | | | 0.01% | | 2.52% | | 3.48% |
| | | | |
MSCI Worldex-US (Net Dividends) Index (index reflects no deduction for fees, expenses or taxes) | | | | -14.09% | | 0.34% | | 6.24% |
| | | | |
Linked Allocation VIP Fund Benchmark (index reflects no deduction for fees, expenses or taxes) | | | | -4.41% | | 4.62% | | 8.11% |
II. The “Fund Summary – Average Annual Total Returns” table on pageFFA-S8 in the Fund’s Class 2 prospectus is replaced with the following:
Average Annual Total Returns
For the periods ended December 31, 2018
| | | | | | | | |
| | | | | 1 Year | | 5 Years | | 10 Years |
Franklin Allocation VIP Fund – Class 2 | | | | -9.65% | | 2.01% | | 8.35% |
| | | | |
S&P 500®Index (index reflects no deduction for fees, expenses or taxes) | | | | -4.38% | | 8.50% | | 13.12% |
| | | | |
Bloomberg Barclays U.S. Aggregate Index (index reflects no deduction for fees, expenses or taxes) | | | | 0.01% | | 2.52% | | 3.48% |
| | | | |
MSCI Worldex-US (Net Dividends) Index (index reflects no deduction for fees, expenses or taxes) | | | | -14.09% | | 0.34% | | 6.24% |
| | | | |
Linked Allocation VIP Fund Benchmark (index reflects no deduction for fees, expenses or taxes) | | | | -4.41% | | 4.62% | | 8.11% |
III. The “Fund Summary – Average Annual Total Returns” table on pageFFA-S8 in the Fund’s Class 4 prospectus is replaced with the following:
Average Annual Total Returns
For the periods ended December 31, 2018
| | | | | | | | |
| | | | | 1 Year | | 5 Years | | 10 Years |
Franklin Allocation VIP Fund – Class 4 | | | | -9.58% | | 1.92% | | 8.24% |
| | | | |
S&P 500®Index (index reflects no deduction for fees, expenses or taxes) | | | | -4.38% | | 8.50% | | 13.12% |
| | | | |
Bloomberg Barclays U.S. Aggregate Index (index reflects no deduction for fees, expenses or taxes) | | | | 0.01% | | 2.52% | | 3.48% |
| | | | |
MSCI Worldex-US (Net Dividends) Index (index reflects no deduction for fees, expenses or taxes) | | | | -14.09% | | 0.34% | | 6.24% |
| | | | |
Linked Allocation VIP Fund Benchmark (index reflects no deduction for fees, expenses or taxes) | | | | -4.41% | | 4.62% | | 8.11% |
Please keep this supplement with your prospectus for future reference.
FRANKLIN TEMPLETON VARIABLE INSURANCE PRODUCTS TRUST
Financial Highlights
Franklin Allocation VIP Fund
| | | | | | | | | | | | | | | | | | | | |
| | | | | | Year Ended December 31, | | | | |
| | | 2019 | | | 2018 | | | 2017 | | | 2016 | | | 2015 | |
| | | | | |
Class 1 | | | | | | | | | | | | | | | | | | | | |
| | | | | |
Per share operating performance (for a share outstanding throughout the year) | | | | | | | | | | | | | | | | | | | | |
| | | | | |
Net asset value, beginning of year | | | $ 6.37 | | | | $ 7.44 | | | | $ 7.13 | | | | $ 6.80 | | | | $ 7.47 | |
| | | | | |
Income from investment operationsa: | | | | | | | | | | | | | | | | | | | | |
| | | | | |
Net investment incomeb,c | | | 0.11 | | | | 0.23 | | | | 0.21 | | | | 0.21 | | | | 0.26 | |
| | | | | |
Net realized and unrealized gains (losses) | | | 1.11 | | | | (0.89 | ) | | | 0.63 | | | | 0.64 | | | | (0.68 | ) |
| | | | | |
Total from investment operations | | | 1.22 | | | | (0.66 | ) | | | 0.84 | | | | 0.85 | | | | (0.42 | ) |
| | | | | |
Less distributions from: | | | | | | | | | | | | | | | | | | | | |
| | | | | |
Net investment income | | | (0.27 | ) | | | (0.24 | ) | | | (0.22 | ) | | | (0.29 | ) | | | (0.24 | ) |
| | | | | |
Net realized gains | | | (0.46 | ) | | | (0.17 | ) | | | (0.31 | ) | | | (0.23 | ) | | | (0.01 | ) |
| | | | | |
Total distributions | | | (0.73 | ) | | | (0.41 | ) | | | (0.53 | ) | | | (0.52 | ) | | | (0.25 | ) |
| | | | | |
Net asset value, end of year | | | $ 6.86 | | | | $ 6.37 | | | | $ 7.44 | | | | $ 7.13 | | | | $ 6.80 | |
| | | | | |
Total returnd | | | 20.04% | | | | (9.34)% | | | | 12.17% | | | | 13.43% | | | | (5.93)% | |
| | | | | |
Ratios to average net assets | | | | | | | | | | | | | | | | | | | | |
| | | | | |
Expenses before waiver and payments by affiliates | | | 0.44% | | | | 0.12% | | | | 0.12% | | | | 0.11% | | | | 0.11% | |
| | | | | |
Expenses net of waiver and payments by affiliates | | | 0.39% | | | | 0.10% | | | | 0.10% | | | | 0.10% | | | | 0.10% | |
| | | | | |
Net investment income | | | 1.55% | | | | 3.13% | | | | 2.75% | | | | 3.09% | | | | 3.51% | |
| | | | | |
Supplemental data | | | | | | | | | | | | | | | | | | | | |
| | | | | |
Net assets, end of year (000’s) | | | $842 | | | | $984 | | | | $1,047 | | | | $1,025 | | | | $1,083 | |
| | | | | |
Portfolio turnover rate | | | 170.79% | | | | 2.23% | | | | 1.28% | | | | 0.10% | | | | 0.26% | |
| | | | | |
Portfolio turnover rate excluding mortgage dollar rolls | | | 158.11% | e | | | 2.23% | | | | 1.28% | | | | 0.10% | | | | 0.26% | |
aThe amount shown for a share outstanding throughout the period may not correlate with the Statement of Operations for the period due to the timing of sales and repurchases of the Fund’s shares in relation to income earned and/or fluctuating fair value of the investments of the Fund.
bBased on average daily shares outstanding.
cRecognition of net investment income by the Fund is affected by the timing of declaration of dividends by the Underlying Funds and exchange traded funds in which the Fund invests.
dTotal return does not include fees, charges or expenses imposed by the variable annuity and life insurance contracts for which Franklin Templeton Variable Insurance Products Trust serves as an underlying investment vehicle.
eSee Note 1(f) regarding mortgage dollar rolls.
| | | | |
| | | |
| | The accompanying notes are an integral part of these financial statements. | Annual Report | | FFA-9 |
FRANKLIN TEMPLETON VARIABLE INSURANCE PRODUCTS TRUST
FINANCIAL HIGHLIGHTS
Franklin Allocation VIP Fund(continued)
| | | | | | | | | | | | | | | | | | | | |
| | | | | | Year Ended December 31, | | | | |
| | | 2019 | | | 2018 | | | 2017 | | | 2016 | | | 2015 | |
| | | | | |
Class 2 | | | | | | | | | | | | | | | | | | | | |
| | | | | |
Per share operating performance (for a share outstanding throughout the year) | | | | | | | | | | | | | | | | | | | | |
| | | | | |
Net asset value, beginning of year | | | $ 6.32 | | | | $ 7.39 | | | | $ 7.08 | | | | $ 6.75 | | | | $ 7.42 | |
| | | | | |
Income from investment operationsa: | | | | | | | | | | | | | | | | | | | | |
| | | | | |
Net investment incomeb,c | | | 0.09 | | | | 0.21 | | | | 0.18 | | | | 0.19 | | | | 0.24 | |
| | | | | |
Net realized and unrealized gains (losses) | | | 1.11 | | | | (0.89 | ) | | | 0.64 | | | | 0.64 | | | | (0.68 | ) |
| | | | | |
Total from investment operations | | | 1.20 | | | | (0.68 | ) | | | 0.82 | | | | 0.83 | | | | (0.44 | ) |
| | | | | |
Less distributions from: | | | | | | | | | | | | | | | | | | | | |
| | | | | |
Net investment income | | | (0.25 | ) | | | (0.22 | ) | | | (0.20 | ) | | | (0.27 | ) | | | (0.22 | ) |
| | | | | |
Net realized gains | | | (0.46 | ) | | | (0.17 | ) | | | (0.31 | ) | | | (0.23 | ) | | | (0.01 | ) |
| | | | | |
Total distributions | | | (0.71 | ) | | | (0.39 | ) | | | (0.51 | ) | | | (0.50 | ) | | | (0.23 | ) |
| | | | | |
Net asset value, end of year | | | $ 6.81 | | | | $ 6.32 | | | | $ 7.39 | | | | $ 7.08 | | | | $ 6.75 | |
| | | | | |
Total returnd | | | 19.86% | | | | (9.65)% | | | | 11.98% | | | | 13.18% | | | | (6.21)% | |
| | | | | |
Ratios to average net assets | | | | | | | | | | | | | | | | | | | | |
| | | | | |
Expenses before waiver and payments by affiliates | | | 0.69% | | | | 0.37% | | | | 0.37% | | | | 0.36% | | | | 0.36% | |
| | | | | |
Expenses net of waiver and payments by affiliates | | | 0.64% | | | | 0.35% | | | | 0.35% | | | | 0.35% | | | | 0.35% | |
| | | | | |
Net investment income | | | 1.30% | | | | 2.88% | | | | 2.50% | | | | 2.84% | | | | 3.26% | |
| | | | | |
Supplemental data | | | | | | | | | | | | | | | | | | | | |
| | | | | |
Net assets, end of year (000’s) | | | $403,040 | | | | $390,300 | | | | $480,402 | | | | $474,669 | | | | $480,715 | |
| | | | | |
Portfolio turnover rate | | | 170.79% | | | | 2.23% | | | | 1.28% | | | | 0.10% | | | | 0.26% | |
| | | | | |
Portfolio turnover rate excluding mortgage dollar rolls | | | 158.11% | e | | | 2.23% | | | | 1.28% | | | | 0.10% | | | | 0.26% | |
aThe amount shown for a share outstanding throughout the period may not correlate with the Statement of Operations for the period due to the timing of sales and repurchases of the Fund’s shares in relation to income earned and/or fluctuating fair value of the investments of the Fund.
bBased on average daily shares outstanding.
cRecognition of net investment income by the Fund is affected by the timing of declaration of dividends by the Underlying Funds and exchange traded funds in which the Fund invests.
dTotal return does not include fees, charges or expenses imposed by the variable annuity and life insurance contracts for which Franklin Templeton Variable Insurance Products Trust serves as an underlying investment vehicle.
eSee Note 1(f) regarding mortgage dollar rolls.
| | | | |
| | | |
FFA-10 | | Annual Report | The accompanying notes are an integral part of these financial statements. | | |
FRANKLIN TEMPLETON VARIABLE INSURANCE PRODUCTS TRUST
FINANCIAL HIGHLIGHTS
Franklin Allocation VIP Fund(continued)
| | | | | | | | | | | | | | | | | | | | |
| | | | | | Year Ended December 31, | | | | |
| | | 2019 | | | 2018 | | | 2017 | | | 2016 | | | 2015 | |
| | | | | |
Class 4 | | | | | | | | | | | | | | | | | | | | |
| | | | | |
Per share operating performance (for a share outstanding throughout the year) | | | | | | | | | | | | | | | | | | | | |
| | | | | |
Net asset value, beginning of year | | | $ 6.46 | | | | $ 7.53 | | | | $ 7.21 | | | | $ 6.87 | | | | $ 7.54 | |
| | | | | |
Income from investment operationsa: | | | | | | | | | | | | | | | | | | | | |
| | | | | |
Net investment incomeb,c | | | 0.08 | | | | 0.20 | | | | 0.18 | | | | 0.19 | | | | 0.23 | |
| | | | | |
Net realized and unrealized gains (losses) | | | 1.13 | | | | (0.89 | ) | | | 0.64 | | | | 0.64 | | | | (0.68 | ) |
| | | | | |
Total from investment operations | | | 1.21 | | | | (0.69 | ) | | | 0.82 | | | | 0.83 | | | | (0.45 | ) |
| | | | | |
Less distributions from: | | | | | | | | | | | | | | | | | | | | |
| | | | | |
Net investment income | | | (0.24 | ) | | | (0.21 | ) | | | (0.19 | ) | | | (0.26 | ) | | | (0.21 | ) |
| | | | | |
Net realized gains | | | (0.46 | ) | | | (0.17 | ) | | | (0.31 | ) | | | (0.23 | ) | | | (0.01 | ) |
| | | | | |
Total distributions | | | (0.70 | ) | | | (0.38 | ) | | | (0.50 | ) | | | (0.49 | ) | | | (0.22 | ) |
| | | | | |
Net asset value, end of year | | | $ 6.97 | | | | $ 6.46 | | | | $ 7.53 | | | | $ 7.21 | | | | $ 6.87 | |
| | | | | |
Total returnd | | | 19.56% | | | | (9.58)% | | | | 11.78% | | | | 12.92% | | | | (6.24)% | |
| | | | | |
Ratios to average net assets | | | | | | | | | | | | | | | | | | | | |
| | | | | |
Expenses before waiver and payments by affiliates | | | 0.79% | | | | 0.47% | | | | 0.47% | | | | 0.46% | | | | 0.46% | |
| | | | | |
Expenses net of waiver and payments by affiliates | | | 0.74% | | | | 0.45% | | | | 0.45% | | | | 0.45% | | | | 0.45% | |
| | | | | |
Net investment income | | | 1.20% | | | | 2.78% | | | | 2.40% | | | | 2.74% | | | | 3.16% | |
| | | | | |
Supplemental data | | | | | | | | | | | | | | | | | | | | |
| | | | | |
Net assets, end of year (000’s) | | | $406,693 | | | | $393,385 | | | | $528,862 | | | | $530,403 | | | | $550,825 | |
| | | | | |
Portfolio turnover rate | | | 170.79% | | | | 2.23% | | | | 1.28% | | | | 0.10% | | | | 0.26% | |
| | | | | |
Portfolio turnover rate excluding mortgage dollar rolls | | | 158.11% | e | | | 2.23% | | | | 1.28% | | | | 0.10% | | | | 0.26% | |
aThe amount shown for a share outstanding throughout the period may not correlate with the Statement of Operations for the period due to the timing of sales and repurchases of the Fund’s shares in relation to income earned and/or fluctuating fair value of the investments of the Fund.
bBased on average daily shares outstanding.
cRecognition of net investment income by the Fund is affected by the timing of declaration of dividends by the Underlying Funds and exchange traded funds in which the Fund invests.
dTotal return does not include fees, charges or expenses imposed by the variable annuity and life insurance contracts for which Franklin Templeton Variable Insurance Products Trust serves as an underlying investment vehicle.
eSee Note 1(f) regarding mortgage dollar rolls.
| | | | |
| | | |
| | The accompanying notes are an integral part of these financial statements. | Annual Report | | FFA-11 |
FRANKLIN TEMPLETON VARIABLE INSURANCE PRODUCTS TRUST
Statement of Investments, December 31, 2019
Franklin Allocation VIP Fund
| | | | | | | | |
| | | Country/ Organization | | Shares/ Rights | | Value | |
| | | |
Common Stocks and Other Equity Interests 57.4% | | | | | | | | |
Automobiles & Components 0.7% | | | | | | | | |
Aptiv PLC | | United States | | 23,000 | | $ | 2,184,310 | |
BorgWarner Inc. | | United States | | 7,564 | | | 328,126 | |
Cie Generale des Etablissements Michelin SCA | | France | | 8,174 | | | 1,000,091 | |
General Motors Co. | | United States | | 17,439 | | | 638,267 | |
Gentex Corp. | | United States | | 7,901 | | | 228,971 | |
Isuzu Motors Ltd. | | Japan | | 61,700 | | | 737,504 | |
Lear Corp. | | United States | | 1,768 | | | 242,570 | |
| | | | | | | | |
| | | |
| | | | | | | 5,359,839 | |
| | | | | | | | |
Banks 2.1% | | | | | | | | |
Bank of Ireland Group PLC | | Ireland | | 144,599 | | | 791,668 | |
BNP Paribas SA | | France | | 34,750 | | | 2,058,806 | |
FinecoBank Banca Fineco SpA | | Italy | | 197,000 | | | 2,361,695 | |
Hana Financial Group Inc. | | South Korea | | 29,472 | | | 940,767 | |
ING Groep NV | | Netherlands | | 169,040 | | | 2,026,123 | |
Kasikornbank PCL, fgn | | Thailand | | 82,200 | | | 415,556 | |
KB Financial Group Inc. | | South Korea | | 52,538 | | | 2,165,621 | |
KBC Groep NV | | Belgium | | 30,000 | | | 2,256,133 | |
Shinhan Financial Group Co. Ltd. | | South Korea | | 19,766 | | | 741,231 | |
Standard Chartered PLC | | United Kingdom | | 197,696 | | | 1,865,337 | |
Sumitomo Mitsui Financial Group Inc., ADR | | Japan | | 193,000 | | | 1,430,130 | |
| | | | | | | | |
| | | |
| | | | | | | 17,053,067 | |
| | | | | | | | |
Capital Goods 6.6% | | | | | | | | |
3M Co. | | United States | | 8,277 | | | 1,460,228 | |
Allegion PLC | | United States | | 5,221 | | | 650,223 | |
Allison Transmission Holdings Inc. | | United States | | 2,065 | | | 99,781 | |
AMETEK Inc. | | United States | | 4,418 | | | 440,651 | |
BAE Systems PLC | | United Kingdom | | 98,353 | | | 735,729 | |
The Boeing Co. | | United States | | 9,354 | | | 3,047,159 | |
BWX Technologies Inc. | | United States | | 10,901 | | | 676,734 | |
CAE Inc. | | Canada | | 71,000 | | | 1,879,701 | |
Carlisle Cos. Inc. | | United States | | 3,000 | | | 485,520 | |
Caterpillar Inc. | | United States | | 3,646 | | | 538,441 | |
CK Hutchison Holdings Ltd. | | Hong Kong | | 197,000 | | | 1,878,406 | |
Compagnie de Saint-Gobain | | France | | 18,180 | | | 744,161 | |
Cummins Inc. | | United States | | 4,300 | | | 769,528 | |
Deere & Co. | | United States | | 3,386 | | | 586,658 | |
Donaldson Co. Inc. | | United States | | 8,200 | | | 472,484 | |
Dover Corp. | | United States | | 9,300 | | | 1,071,918 | |
Emerson Electric Co. | | United States | | 23,967 | | | 1,827,723 | |
Fastenal Co. | | United States | | 17,478 | | | 645,812 | |
Ferguson PLC | | United Kingdom | | 27,000 | | | 2,449,570 | |
Fortive Corp. | | United States | | 3,417 | | | 261,025 | |
General Dynamics Corp. | | United States | | 12,687 | | | 2,237,352 | |
Graco Inc. | | United States | | 4,502 | | | 234,104 | |
GrafTech International Ltd. | | United States | | 769 | | | 8,936 | |
Honeywell International Inc. | | United States | | 20,870 | | | 3,693,990 | |
FRANKLIN TEMPLETON VARIABLE INSURANCE PRODUCTS TRUST
STATEMENT OF INVESTMENTS
Franklin Allocation VIP Fund(continued)
| | | | | | | | | | |
| | | Country/ Organization | | Shares/ Rights | | | | Value | |
Common Stocks and Other Equity Interests(continued) | | | | | | | | | | |
Capital Goods(continued) | | | | | | | | | | |
Huntington Ingalls Industries Inc. | | United States | | 3,138 | | | | $ | 787,261 | |
Illinois Tool Works Inc. | | United States | | 10,967 | | | | | 1,970,002 | |
Ingersoll-Rand PLC | | United States | | 7,056 | | | | | 937,884 | |
Johnson Controls International PLC | | United States | | 22,700 | | | | | 924,117 | |
Lennox International Inc. | | United States | | 477 | | | | | 116,374 | |
Lockheed Martin Corp. | | United States | | 6,856 | | | | | 2,669,589 | |
Masco Corp. | | United States | | 2,097 | | | | | 100,635 | |
MSC Industrial Direct Co. Inc., A | | United States | | 1,157 | | | | | 90,790 | |
MTU Aero Engines AG | | Germany | | 8,500 | | | | | 2,426,930 | |
Northrop Grumman Corp. | | United States | | 8,205 | | | | | 2,822,274 | |
nVent Electric PLC | | United States | | 15,000 | | | | | 383,700 | |
PACCAR Inc. | | United States | | 4,676 | | | | | 369,872 | |
Pentair PLC | | United States | | 13,800 | | | | | 633,006 | |
Raytheon Co. | | United States | | 13,917 | | | | | 3,058,122 | |
Rockwell Automation Inc. | | United States | | 3,421 | | | | | 693,334 | |
Roper Technologies Inc. | | United States | | 10,100 | | | | | 3,577,723 | |
Sinopec Engineering Group Co. Ltd. | | China | | 843,500 | | | | | 504,435 | |
Snap-on Inc. | | United States | | 966 | | | | | 163,640 | |
Stanley Black & Decker Inc. | | United States | | 4,952 | | | | | 820,745 | |
Toro Co. | | United States | | 3,372 | | | | | 268,647 | |
United Technologies Corp. | | United States | | 15,175 | | | | | 2,272,608 | |
W.W. Grainger Inc. | | United States | | 3,014 | | | | | 1,020,299 | |
aWABCO Holdings Inc. | | United States | | 819 | | | | | 110,975 | |
Watsco Inc. | | United States | | 784 | | | | | 141,238 | |
| | | | | | | | | | |
| | | | |
| | | | | | | | | 53,760,034 | |
| | | | | | | | | | |
Commercial & Professional Services 1.2% | | | | | | | | | | |
Cintas Corp. | | United States | | 6,559 | | | | | 1,764,896 | |
aCopart Inc. | | United States | | 5,678 | | | | | 516,357 | |
Equifax Inc. | | United States | | 3,490 | | | | | 489,019 | |
Experian PLC | | United Kingdom | | 80,000 | | | | | 2,703,997 | |
aIAA Inc. | | United States | | 1,064 | | | | | 50,072 | |
aIHS Markit Ltd. | | United States | | 23,109 | | | | | 1,741,263 | |
KAR Auction Services Inc. | | United States | | 942 | | | | | 20,526 | |
Matthews International Corp., A | | United States | | 7,500 | | | | | 286,275 | |
Republic Services Inc. | | United States | | 1,000 | | | | | 89,630 | |
Robert Half International Inc. | | United States | | 3,964 | | | | | 250,326 | |
Rollins Inc. | | United States | | 4,380 | | | | | 145,241 | |
Verisk Analytics Inc. | | United States | | 9,761 | | | | | 1,457,708 | |
| | | | | | | | | | |
| | | | |
| | | | | | | | | 9,515,310 | |
| | | | | | | | | | |
Consumer Durables & Apparel 1.1% | | | | | | | | | | |
aCapri Holdings Ltd. | | United States | | 4,344 | | | | | 165,723 | |
Carter’s Inc. | | United States | | 1,286 | | | | | 140,611 | |
D.R. Horton Inc. | | United States | | 2,493 | | | | | 131,506 | |
Garmin Ltd. | | United States | | 4,046 | | | | | 394,728 | |
Hanesbrands Inc. | | United States | | 4,752 | | | | | 70,567 | |
Hasbro Inc. | | United States | | 3,251 | | | | | 343,338 | |
FRANKLIN TEMPLETON VARIABLE INSURANCE PRODUCTS TRUST
STATEMENT OF INVESTMENTS
Franklin Allocation VIP Fund(continued)
| | | | | | | | | | |
| | | Country/ Organization | | Shares/ Rights | | | | Value | |
Common Stocks and Other Equity Interests(continued) | | | | | | | | | | |
Consumer Durables & Apparel(continued) | | | | | | | | | | |
Leggett & Platt Inc. | | United States | | 3,602 | | | | $ | 183,090 | |
aLululemon Athletica Inc. | | United States | | 3,282 | | | | | 760,341 | |
NIKE Inc., B | | United States | | 40,458 | | | | | 4,098,800 | |
aNVR Inc. | | United States | | 87 | | | | | 331,332 | |
Panasonic Corp., ADR | | Japan | | 105,900 | | | | | 996,519 | |
PulteGroup Inc. | | United States | | 3,695 | | | | | 143,366 | |
Tapestry Inc. | | United States | | 8,755 | | | | | 236,122 | |
VF Corp. | | United States | | 9,005 | | | | | 897,438 | |
Whirlpool Corp. | | United States | | 475 | | | | | 70,077 | |
| | | | | | | | | | |
| | | | |
| | | | | | | | | 8,963,558 | |
| | | | | | | | | | |
Consumer Services 1.2% | | | | | | | | | | |
Carnival Corp. | | United States | | 10,218 | | | | | 519,381 | |
Choice Hotels International Inc. | | United States | | 959 | | | | | 99,189 | |
Darden Restaurants Inc. | | United States | | 3,945 | | | | | 430,044 | |
Domino’s Pizza Inc. | | United States | | 1,252 | | | | | 367,813 | |
Graham Holdings Co., B | | United States | | 358 | | | | | 228,758 | |
H&R Block Inc. | | United States | | 6,807 | | | | | 159,828 | |
Las Vegas Sands Corp. | | United States | | 13,479 | | | | | 930,590 | |
McDonald’s Corp. | | United States | | 12,726 | | | | | 2,514,785 | |
Six Flags Entertainment Corp. | | United States | | 1,589 | | | | | 71,680 | |
Starbucks Corp. | | United States | | 9,490 | | | | | 834,361 | |
aTAL Education Group, ADR | | China | | 54,000 | | | | | 2,602,800 | |
Wyndham Destinations Inc. | | United States | | 1,762 | | | | | 91,078 | |
Yum! Brands Inc. | | United States | | 10,475 | | | | | 1,055,147 | |
| | | | | | | | | | |
| | | | |
| | | | | | | | | 9,905,454 | |
| | | | | | | | | | |
Diversified Financials 1.6% | | | | | | | | | | |
American Express Co. | | United States | | 3,890 | | | | | 484,266 | |
aBerkshire Hathaway Inc., B | | United States | | 6,144 | | | | | 1,391,616 | |
BlackRock Inc. | | United States | | 1,465 | | | | | 736,456 | |
The Charles Schwab Corp. | | United States | | 19,431 | | | | | 924,138 | |
Deutsche Boerse AG | | Germany | | 17,000 | | | | | 2,671,911 | |
FactSet Research Systems Inc. | | United States | | 1,064 | | | | | 285,471 | |
Flow Traders | | Netherlands | | 26,411 | | | | | 637,985 | |
Intercontinental Exchange Inc. | | United States | | 9,055 | | | | | 838,040 | |
Intermediate Capital Group PLC | | United Kingdom | | 20,000 | | | | | 426,473 | |
Invesco Ltd. | | United States | | 6,531 | | | | | 117,427 | |
Lazard Ltd., A | | United States | | 3,263 | | | | | 130,390 | |
MarketAxess Holdings Inc. | | United States | | 1,055 | | | | | 399,961 | |
MFA Financial Inc. | | United States | | 3,230 | | | | | 24,710 | |
Moody’s Corp. | | United States | | 2,263 | | | | | 537,259 | |
Morningstar Inc. | | United States | | 520 | | | | | 78,681 | |
MSCI Inc. | | United States | | 2,278 | | | | | 588,134 | |
S&P Global Inc. | | United States | | 1,999 | | | | | 545,827 | |
Santander Consumer USA Holdings Inc. | | United States | | 2,925 | | | | | 68,357 | |
SEI Investments Co. | | United States | | 2,830 | | | | | 185,308 | |
State Street Corp. | | United States | | 2,600 | | | | | 205,660 | |
FRANKLIN TEMPLETON VARIABLE INSURANCE PRODUCTS TRUST
STATEMENT OF INVESTMENTS
Franklin Allocation VIP Fund(continued)
| | | | | | | | | | |
| | | Country/ Organization | | Shares/ Rights | | | | Value | |
| | | | |
Common Stocks and Other Equity Interests (continued) | | | | | | | | | | |
Diversified Financials(continued) | | | | | | | | | | |
T. Rowe Price Group Inc. | | United States | | 7,539 | | | | $ | 918,552 | |
UBS Group AG | | Switzerland | | 28,367 | | | | | 358,380 | |
| | | | | | | | | | |
| | | | |
| | | | | | | | | 12,555,002 | |
Energy 2.3% | | | | | | | | | | |
aApergy Corp. | | United States | | 7,800 | | | | | 263,484 | |
BP PLC | | United Kingdom | | 284,973 | | | | | 1,779,972 | |
Cabot Oil & Gas Corp., A | | United States | | 27,616 | | | | | 480,795 | |
Chevron Corp. | | United States | | 7,400 | | | | | 891,774 | |
Cimarex Energy Co. | | United States | | 1,676 | | | | | 87,973 | |
Concho Resources Inc. | | United States | | 4,018 | | | | | 351,856 | |
ConocoPhillips | | United States | | 14,455 | | | | | 940,009 | |
Eni SpA | | Italy | | 91,864 | | | | | 1,426,427 | |
EOG Resources Inc. | | United States | | 6,400 | | | | | 536,064 | |
Equinor ASA | | Norway | | 66,776 | | | | | 1,335,140 | |
Exxon Mobil Corp. | | United States | | 27,226 | | | | | 1,899,830 | |
Galp Energia SGPS SA, B | | Portugal | | 48,999 | | | | | 818,754 | |
HollyFrontier Corp. | | United States | | 1,991 | | | | | 100,964 | |
Husky Energy Inc. | | Canada | | 103,200 | | | | | 828,079 | |
Occidental Petroleum Corp. | | United States | | 11,400 | | | | | 469,794 | |
ONEOK Inc. | | United States | | 2,943 | | | | | 222,697 | |
Phillips 66 | | United States | | 9,569 | | | | | 1,066,082 | |
Royal Dutch Shell PLC, B | | United Kingdom | | 42,569 | | | | | 1,262,642 | |
SBM Offshore NV | | Netherlands | | 40,838 | | | | | 759,785 | |
Schlumberger Ltd. | | United States | | 14,300 | | | | | 574,860 | |
Tenaris SA | | Italy | | 54,609 | | | | | 615,475 | |
Total SA | | France | | 12,943 | | | | | 714,134 | |
Valero Energy Corp. | | United States | | 11,045 | | | | | 1,034,364 | |
| | | | | | | | | | |
| | | | |
| | | | | | | | | 18,460,954 | |
Food & Staples Retailing 1.1% | | | | | | | | | | |
Casey’s General Stores Inc. | | United States | | 922 | | | | | 146,589 | |
Costco Wholesale Corp. | | United States | | 4,687 | | | | | 1,377,603 | |
The Kroger Co. | | United States | | 14,245 | | | | | 412,962 | |
Matsumotokiyoshi Holdings Co. Ltd. | | Japan | | 20,200 | | | | | 787,182 | |
Seven & I Holdings Co. Ltd., ADR | | Japan | | 35,900 | | | | | 657,508 | |
aSprouts Farmers Market Inc. | | United States | | 2,414 | | | | | 46,711 | |
Sundrug Co. Ltd. | | Japan | | 22,200 | | | | | 807,923 | |
Sysco Corp. | | United States | | 14,000 | | | | | 1,197,560 | |
Walgreens Boots Alliance Inc. | | United States | | 17,351 | | | | | 1,023,015 | |
Walmart Inc. | | United States | | 20,000 | | | | | 2,376,800 | |
| | | | | | | | | | |
| | | | |
| | | | | | | | | 8,833,853 | |
Food, Beverage & Tobacco 2.5% | | | | | | | | | | |
Altria Group Inc. | | United States | | 28,276 | | | | | 1,411,255 | |
Brown-Forman Corp., A | | United States | | 1,486 | | | | | 93,276 | |
Brown-Forman Corp., B | | United States | | 11,799 | | | | | 797,612 | |
Bunge Ltd. | | United States | | 10,300 | | | | | 592,765 | |
FRANKLIN TEMPLETON VARIABLE INSURANCE PRODUCTS TRUST
STATEMENT OF INVESTMENTS
Franklin Allocation VIP Fund(continued)
| | | | | | | | | | |
| | | Country/ Organization | | Shares/ Rights | | | | Value | |
| | | | |
Common Stocks and Other Equity Interests(continued) | | | | | | | | | | |
Food, Beverage & Tobacco (continued) | | | | | | | | | | |
The Coca-Cola Co. | | United States | | 26,317 | | | | $ | 1,456,646 | |
Constellation Brands Inc., A | | United States | | 3,504 | | | | | 664,884 | |
Fevertree Drinks PLC | | United Kingdom | | 70,000 | | | | | 1,940,452 | |
Flowers Foods Inc. | | United States | | 5,137 | | | | | 111,678 | |
General Mills Inc. | | United States | | 17,306 | | | | | 926,909 | |
The Hershey Co. | | United States | | 5,001 | | | | | 735,047 | |
Hormel Foods Corp. | | United States | | 8,367 | | | | | 377,435 | |
Ingredion Inc. | | United States | | 1,745 | | | | | 162,198 | |
The J. M. Smucker Co. | | United States | | 2,227 | | | | | 231,898 | |
Kellogg Co. | | United States | | 4,136 | | | | | 286,046 | |
Kirin Holdings Co. Ltd. | | Japan | | 50,100 | | | | | 1,101,808 | |
Lamb Weston Holdings Inc. | | United States | | 3,432 | | | | | 295,255 | |
McCormick & Co. Inc. | | United States | | 6,200 | | | | | 1,052,326 | |
Mondelez International Inc., A | | United States | | 9,469 | | | | | 521,553 | |
aMonster Beverage Corp. | | United States | | 26,249 | | | | | 1,668,124 | |
PepsiCo Inc. | | United States | | 22,238 | | | | | 3,039,268 | |
Philip Morris International Inc. | | United States | | 16,946 | | | | | 1,441,935 | |
Suntory Beverage & Food Ltd. | | Japan | | 11,300 | | | | | 472,588 | |
Tyson Foods Inc. | | United States | | 8,049 | | | | | 732,781 | |
| | | | | | | | | | |
| | | | |
| | | | | | | | | 20,113,739 | |
Health Care Equipment & Services 3.7% | | | | | | | | | | |
Abbott Laboratories | | United States | | 22,460 | | | | | 1,950,875 | |
aABIOMED Inc. | | United States | | 1,312 | | | | | 223,814 | |
Baxter International Inc. | | United States | | 2,515 | | | | | 210,304 | |
Becton, Dickinson and Co. | | United States | | 8,843 | | | | | 2,405,031 | |
Cerner Corp. | | United States | | 7,272 | | | | | 533,692 | |
Chemed Corp. | | United States | | 346 | | | | | 151,984 | |
Cochlear Ltd. | | Australia | | 17,000 | | | | | 2,680,591 | |
CVS Health Corp. | | United States | | 6,800 | | | | | 505,172 | |
Danaher Corp. | | United States | | 6,687 | | | | | 1,026,321 | |
Dentsply Sirona Inc. | | United States | | 4,800 | | | | | 271,632 | |
aEdwards Lifesciences Corp. | | United States | | 2,707 | | | | | 631,516 | |
GN Store Nord AS | | Denmark | | 55,000 | | | | | 2,586,070 | |
aHaemonetics Corp. | | United States | | 6,324 | | | | | 726,628 | |
HCA Holdings Inc. | | United States | | 5,114 | | | | | 755,900 | |
aIDEXX Laboratories Inc. | | United States | | 620 | | | | | 161,901 | |
aIntuitive Surgical Inc. | | United States | | 2,922 | | | | | 1,727,340 | |
aLaboratory Corp. of America Holdings | | United States | | 3,410 | | | | | 576,870 | |
aLivaNova PLC | | United Kingdom | | 36,000 | | | | | 2,715,480 | |
Medtronic PLC | | United States | | 17,800 | | | | | 2,019,410 | |
aPremier Inc., A | | United States | | 586 | | | | | 22,198 | |
Quest Diagnostics Inc. | | United States | | 5,773 | | | | | 616,499 | |
ResMed Inc. | | United States | | 3,815 | | | | | 591,210 | |
Sinopharm Group Co. Ltd., H | | China | | 157,200 | | | | | 573,943 | |
Stryker Corp. | | United States | | 14,592 | | | | | 3,063,444 | |
Teleflex Inc. | | United States | | 3,384 | | | | | 1,273,873 | |
FRANKLIN TEMPLETON VARIABLE INSURANCE PRODUCTS TRUST
STATEMENT OF INVESTMENTS
Franklin Allocation VIP Fund(continued)
| | | | | | | | | | |
| | | Country/ Organization | | Shares/ Rights | | | | Value | |
| | | | |
Common Stocks and Other Equity Interests(continued) | | | | | | | | | | |
Health Care Equipment & Services (continued) | | | | | | | | | | |
Universal Health Services Inc., B | | United States | | 1,289 | | | | $ | 184,920 | |
aVarian Medical Systems Inc. | | United States | | 2,004 | | | | | 284,588 | |
West Pharmaceutical Services Inc. | | United States | | 9,000 | | | | | 1,352,970 | |
| | | | | | | | | | |
| | | | |
| | | | | | | | | 29,824,176 | |
Household & Personal Products 1.0% | | | | | | | | | | |
Church & Dwight Co. Inc. | | United States | | 6,941 | | | | | 488,230 | |
Clorox Co. | | United States | | 4,242 | | | | | 651,316 | |
Colgate-Palmolive Co. | | United States | | 30,504 | | | | | 2,099,895 | |
Estee Lauder Cos. Inc., A | | United States | | 6,568 | | | | | 1,356,555 | |
Kimberly-Clark Corp. | | United States | | 6,764 | | | | | 930,388 | |
Nu Skin Enterprises Inc., A | | United States | | 1,414 | | | | | 57,946 | |
The Procter & Gamble Co. | | United States | | 20,713 | | | | | 2,587,054 | |
| | | | | | | | | | |
| | | | |
| | | | | | | | | 8,171,384 | |
Insurance 0.2% | | | | | | | | | | |
Aflac Inc. | | United States | | 10,400 | | | | | 550,160 | |
American National Insurance Co. | | United States | | 233 | | | | | 27,419 | |
Assured Guaranty Ltd. | | United States | | 1,766 | | | | | 86,569 | |
Erie Indemnity Co., A | | United States | | 3,000 | | | | | 498,000 | |
Fidelity National Financial Inc. | | United States | | 1,930 | | | | | 87,526 | |
RenaissanceRe Holdings Ltd. | | United States | | 540 | | | | | 105,851 | |
| | | | | | | | | | |
| | | | |
| | | | | | | | | 1,355,525 | |
Materials 3.5% | | | | | | | | | | |
Air Products and Chemicals Inc. | | United States | | 15,822 | | | | | 3,718,012 | |
Alamos Gold Inc., A | | Canada | | 83,100 | | | | | 500,262 | |
Albemarle Corp. | | United States | | 21,500 | | | | | 1,570,360 | |
aAxalta Coating Systems Ltd. | | United States | | 21,685 | | | | | 659,224 | |
Celanese Corp. | | United States | | 9,616 | | | | | 1,183,922 | |
Eastman Chemical Co. | | United States | | 2,680 | | | | | 212,417 | |
Ecolab Inc. | | United States | | 10,021 | | | | | 1,933,953 | |
International Flavors & Fragrances Inc. | | United States | | 2,716 | | | | | 350,418 | |
Johnson Matthey PLC | | United Kingdom | | 29,607 | | | | | 1,174,821 | |
Koninklijke DSM NV | | Netherlands | | 20,000 | | | | | 2,604,007 | |
Linde PLC | | United Kingdom | | 14,985 | | | | | 3,190,307 | |
Lotte Chemical Corp. | | South Korea | | 4,020 | | | | | 778,969 | |
LyondellBasell Industries NV, A | | United States | | 10,246 | | | | | 968,042 | |
Martin Marietta Materials Inc. | | United States | | 2,563 | | | | | 716,717 | |
NewMarket Corp. | | United States | | 218 | | | | | 106,061 | |
Nucor Corp. | | United States | | 9,120 | | | | | 513,274 | |
Packaging Corp. of America | | United States | | 2,106 | | | | | 235,851 | |
Reliance Steel & Aluminum Co. | | United States | | 486 | | | | | 58,203 | |
Royal Gold Inc. | | United States | | 468 | | | | | 57,213 | |
Sonoco Products Co. | | United States | | 2,793 | | | | | 172,384 | |
Steel Dynamics Inc. | | United States | | 3,807 | | | | | 129,590 | |
Sumitomo Metal Mining Co. Ltd. | | Japan | | 31,000 | | | | | 1,010,941 | |
Symrise AG | | Germany | | 22,500 | | | | | 2,366,820 | |
FRANKLIN TEMPLETON VARIABLE INSURANCE PRODUCTS TRUST
STATEMENT OF INVESTMENTS
Franklin Allocation VIP Fund(continued)
| | | | | | | | | | |
| | | Country/ Organization | | Shares/ Rights | | | | Value | |
| | | | |
Common Stocks and Other Equity Interests(continued) | | | | | | | | | | |
Materials (continued) | | | | | | | | | | |
Umicore SA | | Belgium | | 57,000 | | | | $ | 2,771,686 | |
Valvoline Inc. | | United States | | 2,506 | | | | | 53,654 | |
Wheaton Precious Metals Corp. | | Canada | | 46,900 | | | | | 1,395,515 | |
| | | | | | | | | | |
| | | | |
| | | | | | | | | 28,432,623 | |
Media & Entertainment 2.1% | | | | | | | | | | |
aAlphabet Inc., A | | United States | | 2,146 | | | | | 2,874,331 | |
aAMC Networks Inc., A | | United States | | 1,033 | | | | | 40,803 | |
Ascential PLC | | United Kingdom | | 467,885 | | | | | 2,427,947 | |
aBaidu Inc., ADR | | China | | 7,800 | | | | | 985,920 | |
Cable One Inc. | | United States | | 430 | | | | | 640,042 | |
Cinemark Holdings Inc. | | United States | | 1,767 | | | | | 59,813 | |
Comcast Corp., A | | United States | | 36,932 | | | | | 1,660,832 | |
CyberAgent Inc. | | Japan | | 65,000 | | | | | 2,281,804 | |
aFacebook Inc., A | | United States | | 11,928 | | | | | 2,448,222 | |
aIAC/InterActiveCorp. | | United States | | 2,007 | | | | | 499,964 | |
The Interpublic Group of Cos. Inc. | | United States | | 7,664 | | | | | 177,038 | |
John Wiley & Sons Inc., A | | United States | | 1,300 | | | | | 63,076 | |
aMatch Group Inc. | | United States | | 1,273 | | | | | 104,526 | |
Omnicom Group Inc. | | United States | | 6,087 | | | | | 493,169 | |
SES SA, IDR | | Luxembourg | | 64,135 | | | | | 899,052 | |
The Walt Disney Co. | | United States | | 11,212 | | | | | 1,621,592 | |
| | | | | | | | | | |
| | | | |
| | | | | | | | | 17,278,131 | |
Pharmaceuticals, Biotechnology & Life Sciences 5.3% | | | | | | | | | | |
AbbVie Inc. | | United States | | 24,677 | | | | | 2,184,902 | |
Agilent Technologies Inc. | | United States | | 8,185 | | | | | 698,262 | |
Amgen Inc. | | United States | | 12,459 | | | | | 3,003,491 | |
Astellas Pharma Inc., ADR | | Japan | | 30,200 | | | | | 514,306 | |
AstraZeneca PLC, ADR | | United Kingdom | | 13,014 | | | | | 648,878 | |
Bayer AG | | Germany | | 22,776 | | | | | 1,859,724 | |
aBiogen Inc. | | United States | | 4,687 | | | | | 1,390,774 | |
Bristol-Myers Squibb Co. | | United States | | 24,680 | | | | | 1,584,209 | |
aBristol-Myers Squibb Co., rts., 2/01/49 | | United States | | 5,348 | | | | | 16,098 | |
aCatalent Inc. | | United States | | 21,889 | | | | | 1,232,351 | |
CSL Ltd. | | Australia | | 15,000 | | | | | 2,902,305 | |
aElanco Animal Health Inc. | | United States | | 9,587 | | | | | 282,337 | |
Eli Lilly & Co. | | United States | | 7,962 | | | | | 1,046,446 | |
aExelixis Inc. | | United States | | 6,973 | | | | | 122,864 | |
Gilead Sciences Inc. | | United States | | 25,158 | | | | | 1,634,767 | |
aGW Pharmaceuticals PLC, ADR | | United Kingdom | | 1,426 | | | | | 149,103 | |
Hikma Pharmaceuticals PLC | | United Kingdom | | 100,000 | | | | | 2,636,980 | |
aIllumina Inc. | | United States | | 3,446 | | | | | 1,143,176 | |
Johnson & Johnson | | United States | | 26,805 | | | | | 3,910,045 | |
Merck & Co. Inc. | | United States | | 22,588 | | | | | 2,054,379 | |
Merck KGaA | | Germany | | 7,936 | | | | | 937,597 | |
aMettler-Toledo International Inc. | | United States | | 3,555 | | | | | 2,820,110 | |
aNeurocrine Biosciences Inc. | | United States | | 3,209 | | | | | 344,935 | |
FRANKLIN TEMPLETON VARIABLE INSURANCE PRODUCTS TRUST
STATEMENT OF INVESTMENTS
Franklin Allocation VIP Fund(continued)
| | | | | | | | | | |
| | | Country/ Organization | | Shares/ Rights | | | | Value | |
| | | | |
Common Stocks and Other Equity Interests(continued) | | | | | | | | | | |
Pharmaceuticals, Biotechnology & Life Sciences (continued) | | | | | | | | | | |
Pfizer Inc. | | United States | | 63,147 | | | | $ | 2,474,099 | |
aPTC Therapeutics Inc. | | United States | | 2,600 | | | | | 124,878 | |
aReata Pharmaceuticals Inc. | | United States | | 700 | | | | | 143,101 | |
aRegeneron Pharmaceuticals Inc. | | United States | | 588 | | | | | 220,782 | |
Roche Holding AG | | Switzerland | | 3,897 | | | | | 1,264,567 | |
Sanofi | | France | | 10,624 | | | | | 1,067,758 | |
Santen Pharmaceutical Co. Ltd. | | Japan | | 115,000 | | | | | 2,207,407 | |
Takeda Pharmaceutical Co. Ltd., ADR | | Japan | | 84,900 | | | | | 1,675,077 | |
aWaters Corp. | | United States | | 3,896 | | | | | 910,300 | |
| | | | | | | | | | |
| | | | |
| | | | | | | | | 43,206,008 | |
Real Estate 1.4% | | | | | | | | | | |
American Tower Corp. | | United States | | 5,854 | | | | | 1,345,366 | |
CK Asset Holdings Ltd. | | Hong Kong | | 186,630 | | | | | 1,347,219 | |
Crown Castle International Corp. | | United States | | 7,085 | | | | | 1,007,133 | |
EPR Properties | | United States | | 2,075 | | | | | 146,578 | |
Equinix Inc. | | United States | | 1,198 | | | | | 699,273 | |
Gaming and Leisure Properties Inc. | | United States | | 4,956 | | | | | 213,356 | |
Kimco Realty Corp. | | United States | | 9,753 | | | | | 201,985 | |
Mitsui Fudosan Co. Ltd. | | Japan | | 41,700 | | | | | 1,025,281 | |
National Retail Properties Inc. | | United States | | 4,982 | | | | | 267,135 | |
OMEGA Healthcare Investors Inc. | | United States | | 6,174 | | | | | 261,469 | |
Public Storage | | United States | | 4,964 | | | | | 1,057,133 | |
Realty Income Corp. | | United States | | 9,040 | | | | | 665,615 | |
Simon Property Group Inc. | | United States | | 6,987 | | | | | 1,040,783 | |
Spirit Realty Capital Inc. | | United States | | 2,899 | | | | | 142,573 | |
STORE Capital Corp. | | United States | | 5,345 | | | | | 199,048 | |
Swire Pacific Ltd., A | | Hong Kong | | 45,600 | | | | | 423,680 | |
Ventas Inc. | | United States | | 5,956 | | | | | 343,899 | |
VEREIT Inc. | | United States | | 28,432 | | | | | 262,712 | |
WP Carey Inc. | | United States | | 3,655 | | | | | 292,546 | |
| | | | | | | | | | |
| | | | |
| | | | | | | | | 10,942,784 | |
Retailing 3.3% | | | | | | | | | | |
aAlibaba Group Holding Ltd., ADR | | China | | 3,245 | | | | | 688,264 | |
aAmazon.com Inc. | | United States | | 2,238 | | | | | 4,135,466 | |
aAutoZone Inc. | | United States | | 544 | | | | | 648,073 | |
Best Buy Co. Inc. | | United States | | 7,259 | | | | | 637,340 | |
aboohoo Group PLC | | United Kingdom | | 690,000 | | | | | 2,722,420 | |
aBooking Holdings Inc. | | United States | | 307 | | | | | 630,495 | |
aBurlington Stores Inc. | | United States | | 506 | | | | | 115,383 | |
Dick’s Sporting Goods Inc. | | United States | | 2,306 | | | | | 114,124 | |
Dollar General Corp. | | United States | | 6,350 | | | | | 990,473 | |
Expedia Group Inc. | | United States | | 2,351 | | | | | 254,237 | |
Foot Locker Inc. | | United States | | 4,007 | | | | | 156,233 | |
The Gap Inc. | | United States | | 7,717 | | | | | 136,437 | |
Genuine Parts Co. | | United States | | 4,077 | | | | | 433,100 | |
The Home Depot Inc. | | United States | | 6,374 | | | | | 1,391,954 | |
FRANKLIN TEMPLETON VARIABLE INSURANCE PRODUCTS TRUST
STATEMENT OF INVESTMENTS
Franklin Allocation VIP Fund(continued)
| | | | | | | | | | |
| | | Country/ Organization | | Shares/ Rights | | | | Value | |
| | | | |
Common Stocks and Other Equity Interests(continued) | | | | | | | | | | |
Retailing (continued) | | | | | | | | | | |
Kingfisher PLC | | United Kingdom | | 219,553 | | | | $ | 631,008 | |
Kohl’s Corp. | | United States | | 5,312 | | | | | 270,646 | |
L Brands Inc. | | United States | | 7,263 | | | | | 131,606 | |
Lowe’s Cos. Inc. | | United States | | 4,200 | | | | | 502,992 | |
Macy’s Inc. | | United States | | 9,207 | | | | | 156,519 | |
aMercadoLibre Inc. | | Argentina | | 3,900 | | | | | 2,230,566 | |
Nordstrom Inc. | | United States | | 3,423 | | | | | 140,103 | |
aO’Reilly Automotive Inc. | | United States | | 2,303 | | | | | 1,009,313 | |
Penske Automotive Group Inc. | | United States | | 707 | | | | | 35,506 | |
Pool Corp. | | United States | | 1,044 | | | | | 221,725 | |
Ross Stores Inc. | | United States | | 24,299 | | | | | 2,828,890 | |
Seria Co. Ltd. | | Japan | | 7,600 | | | | | 207,702 | |
Target Corp. | | United States | | 16,841 | | | | | 2,159,185 | |
Tiffany & Co. | | United States | | 4,900 | | | | | 654,885 | |
The TJX Cos. Inc. | | United States | | 22,989 | | | | | 1,403,708 | |
Tractor Supply Co. | | United States | | 3,601 | | | | | 336,477 | |
aUlta Beauty Inc. | | United States | | 1,743 | | | | | 441,223 | |
aUrban Outfitters Inc. | | United States | | 2,199 | | | | | 61,066 | |
Williams-Sonoma Inc. | | United States | | 2,642 | | | | | 194,028 | |
| | | | | | | | | | |
| | | | |
| | | | | | | | | 26,671,147 | |
Semiconductors & Semiconductor Equipment 2.9% | | | | | | | | | | |
Analog Devices Inc. | | United States | | 17,200 | | | | | 2,044,048 | |
Applied Materials Inc. | | United States | | 24,271 | | | | | 1,481,502 | |
ASML Holding NV, N.Y. shs | | Netherlands | | 4,222 | | | | | 1,249,459 | |
Infineon Technologies AG | | Germany | | 135,000 | | | | | 3,074,848 | |
Intel Corp. | | United States | | 24,208 | | | | | 1,448,849 | |
KLA Corp. | | United States | | 4,277 | | | | | 762,033 | |
Lam Research Corp. | | United States | | 3,869 | | | | | 1,131,295 | |
Maxim Integrated Products Inc. | | United States | | 7,553 | | | | | 464,585 | |
Monolithic Power Systems | | United States | | 2,900 | | | | | 516,258 | |
NVIDIA Corp. | | United States | | 3,387 | | | | | 796,961 | |
NXP Semiconductors NV | | Netherlands | | 14,297 | | | | | 1,819,436 | |
QUALCOMM Inc. | | United States | | 9,599 | | | | | 846,920 | |
Skyworks Solutions Inc. | | United States | | 5,654 | | | | | 683,455 | |
Taiwan Semiconductor Manufacturing Co. Ltd. | | Taiwan | | 153,000 | | | | | 1,693,123 | |
Texas Instruments Inc. | | United States | | 36,445 | | | | | 4,675,529 | |
Xilinx Inc. | | United States | | 7,178 | | | | | 701,793 | |
| | | | | | | | | | |
| | | | |
| | | | | | | | | 23,390,094 | |
Software & Services 6.8% | | | | | | | | | | |
Accenture PLC, A | | United States | | 18,687 | | | | | 3,934,922 | |
aAdobe Inc. | | United States | | 877 | | | | | 289,243 | |
aAdyen NV | | Netherlands | | 3,501 | | | | | 2,870,050 | |
Amdocs Ltd. | | United States | | 4,013 | | | | | 289,698 | |
aAspen Technology Inc. | | United States | | 1,261 | | | | | 152,493 | |
aAtlassian Corp. PLC | | United States | | 900 | | | | | 108,306 | |
aAutodesk Inc. | | United States | | 5,142 | | | | | 943,351 | |
FRANKLIN TEMPLETON VARIABLE INSURANCE PRODUCTS TRUST
STATEMENT OF INVESTMENTS
Franklin Allocation VIP Fund(continued)
| | | | | | | | | | |
| | | Country/ Organization | | Shares/ Rights | | | | Value | |
| | | | |
Common Stocks and Other Equity Interests(continued) | | | | | | | | | | |
Software & Services(continued) | | | | | | | | | | |
Automatic Data Processing Inc. | | United States | | 12,815 | | | | $ | 2,184,958 | |
AVEVA Group PLC | | United Kingdom | | 21,000 | | | | | 1,294,994 | |
Booz Allen Hamilton Holding Corp. | | United States | | 1,799 | | | | | 127,963 | |
Broadridge Financial Solutions Inc. | | United States | | 3,465 | | | | | 428,066 | |
a Cadence Design Systems Inc. | | United States | | 3,830 | | | | | 265,649 | |
Citrix Systems Inc. | | United States | | 1,818 | | | | | 201,616 | |
Cognizant Technology Solutions Corp., A | | United States | | 11,134 | | | | | 690,531 | |
a CyberArk Software Ltd. | | Israel | | 15,000 | | | | | 1,748,700 | |
International Business Machines Corp. | | United States | | 10,451 | | | | | 1,400,852 | |
a InterXion Holding NV | | Netherlands | | 26,000 | | | | | 2,179,122 | |
Intuit Inc. | | United States | | 11,913 | | | | | 3,120,372 | |
Jack Henry & Associates Inc. | | United States | | 2,222 | | | | | 323,679 | |
Keywords Studios PLC | | Ireland | | 127,000 | | | | | 2,519,713 | |
Mastercard Inc., A | | United States | | 13,875 | | | | | 4,142,936 | |
Microsoft Corp. | | United States | | 61,073 | | | | | 9,631,212 | |
Paychex Inc. | | United States | | 10,204 | | | | | 867,952 | |
a PTC Inc. | | United States | | 8,021 | | | | | 600,693 | |
The Sage Group PLC | | United Kingdom | | 280,000 | | | | | 2,777,636 | |
a salesforce.com Inc. | | United States | | 3,653 | | | | | 594,124 | |
SAP SE | | Germany | | 19,000 | | | | | 2,563,724 | |
a ServiceNow Inc. | | United States | | 6,455 | | | | | 1,822,376 | |
a Shopify Inc., A | | Canada | | 7,000 | | | | | 2,783,060 | |
a Twilio Inc., A | | United States | | 2,562 | | | | | 251,793 | |
a Tyler Technologies Inc. | | United States | | 1,096 | | | | | 328,822 | |
a VeriSign Inc. | | United States | | 2,859 | | | | | 550,872 | |
Visa Inc., A | | United States | | 13,484 | | | | | 2,533,644 | |
a Workday Inc., A | | United States | | 3,620 | | | | | 595,309 | |
| | | | | | | | | | |
| | | | |
| | | | | | | | | 55,118,431 | |
Technology Hardware & Equipment 2.2% | | | | | | | | | | |
Amphenol Corp., A | | United States | | 5,833 | | | | | 631,306 | |
Apple Inc. | | United States | | 25,462 | | | | | 7,476,916 | |
Cisco Systems Inc. | | United States | | 50,098 | | | | | 2,402,700 | |
Cognex Corp. | | United States | | 2,687 | | | | | 150,580 | |
a F5 Networks Inc. | | United States | | 1,900 | | | | | 265,335 | |
HP Inc. | | United States | | 47,342 | | | | | 972,878 | |
a Keysight Technologies Inc. | | United States | | 4,162 | | | | | 427,146 | |
Motorola Solutions Inc. | | United States | | 4,272 | | | | | 688,390 | |
NetApp Inc. | | United States | | 6,367 | | | | | 396,346 | |
Samsung Electronics Co. Ltd. | | South Korea | | 52,005 | | | | | 2,510,298 | |
TE Connectivity Ltd. | | United States | | 12,149 | | | | | 1,164,360 | |
a Trimble Inc. | | United States | | 17,458 | | | | | 727,824 | |
Ubiquiti Inc. | | United States | | 298 | | | | | 56,316 | |
a ViaSat Inc. | | United States | | 4,447 | | | | | 325,498 | |
| | | | | | | | | | |
| | | | |
| | | | | | | | | 18,195,893 | |
FRANKLIN TEMPLETON VARIABLE INSURANCE PRODUCTS TRUST
STATEMENT OF INVESTMENTS
Franklin Allocation VIP Fund(continued)
| | | | | | | | | | |
| | | Country/ Organization | | Shares/ Rights | | | | Value | |
| | | | |
Common Stocks and Other Equity Interests(continued) | | | | | | | | | | |
Telecommunication Services 0.8% | | | | | | | | | | |
AT&T Inc. | | United States | | 37,596 | | | | $ | 1,469,252 | |
China Mobile Ltd. | | China | | 166,320 | | | | | 1,398,042 | |
Singapore Telecommunications Ltd. | | Singapore | | 260,600 | | | | | 652,856 | |
Telefonica Deutschland Holding AG | | Germany | | 99,448 | | | | | 288,183 | |
Verizon Communications Inc. | | United States | | 23,329 | | | | | 1,432,401 | |
Vodafone Group PLC | | United Kingdom | | 824,215 | | | | | 1,602,078 | |
| | | | | | | | | | |
| | | | |
| | | | | | | | | 6,842,812 | |
Transportation 2.0% | | | | | | | | | | |
A.P. Moeller-Maersk AS, B | | Denmark | | 515 | | | | | 742,604 | |
Alaska Air Group Inc. | | United States | | 24,235 | | | | | 1,641,921 | |
C.H. Robinson Worldwide Inc. | | United States | | 4,222 | | | | | 330,160 | |
Canadian National Railway Co. | | Canada | | 6,314 | | | | | 571,101 | |
Canadian Pacific Railway Ltd. | | Canada | | 3,272 | | | | | 834,196 | |
Delta Air Lines Inc. | | United States | | 16,077 | | | | | 940,183 | |
DSV Panalpina A/S | | Denmark | | 21,500 | | | | | 2,477,443 | |
Expeditors International of Washington Inc. | | United States | | 4,782 | | | | | 373,092 | |
J.B. Hunt Transport Services Inc. | | United States | | 5,801 | | | | | 677,441 | |
Kansas City Southern | | United States | | 4,795 | | | | | 734,402 | |
Landstar System Inc. | | United States | | 1,060 | | | | | 120,702 | |
aLyft Inc., A | | United States | | 1,925 | | | | | 82,814 | |
Norfolk Southern Corp. | | United States | | 1,800 | | | | | 349,434 | |
Old Dominion Freight Line Inc. | | United States | | 501 | | | | | 95,080 | |
Southwest Airlines Co. | | United States | | 14,008 | | | | | 756,152 | |
aUber Technologies Inc. | | United States | | 4,538 | | | | | 134,960 | |
Union Pacific Corp. | | United States | | 21,021 | | | | | 3,800,387 | |
United Parcel Service Inc., B | | United States | | 16,177 | | | | | 1,893,680 | |
| | | | | | | | | | |
| | | | |
| | | | | | | | | 16,555,752 | |
Utilities 1.8% | | | | | | | | | | |
Alliant Energy Corp. | | United States | | 5,988 | | | | | 327,663 | |
Ameren Corp. | | United States | | 4,173 | | | | | 320,486 | |
American Electric Power Co. Inc. | | United States | | 3,548 | | | | | 335,321 | |
American Water Works Co. Inc. | | United States | | 4,619 | | | | | 567,444 | |
Atmos Energy Corp. | | United States | | 2,942 | | | | | 329,092 | |
Consolidated Edison Inc. | | United States | | 8,367 | | | | | 756,963 | |
Dominion Energy Inc. | | United States | | 10,618 | | | | | 879,383 | |
DTE Energy Co. | | United States | | 5,118 | | | | | 664,675 | |
E.ON SE | | Germany | | 89,716 | | | | | 958,229 | |
Evergy Inc. | | United States | | 4,028 | | | | | 262,183 | |
Eversource Energy | | United States | | 7,424 | | | | | 631,560 | |
Exelon Corp. | | United States | | 24,694 | | | | | 1,125,799 | |
Hawaiian Electric Industries Inc. | | United States | | 2,856 | | | | | 133,832 | |
aKorea Electric Power Corp. | | South Korea | | 26,869 | | | | | 646,163 | |
NextEra Energy Inc. | | United States | | 9,408 | | | | | 2,278,241 | |
OGE Energy Corp. | | United States | | 5,155 | | | | | 229,243 | |
PPL Corp. | | United States | | 13,039 | | | | | 467,839 | |
Public Service Enterprise Group Inc. | | United States | | 14,881 | | | | | 878,723 | |
FRANKLIN TEMPLETON VARIABLE INSURANCE PRODUCTS TRUST
STATEMENT OF INVESTMENTS
Franklin Allocation VIP Fund(continued)
| | | | | | | | | | | | | | | | |
| | | Country/
Organization | | | Shares/
Rights | | | | | | Value | |
| | | | |
Common Stocks and Other Equity Interests(continued) | | | | | | | | | | | | | | | | |
Utilities(continued) | | | | | | | | | | | | | | | | |
Sempra Energy | | | United States | | | | 2,018 | | | | | | | $ | 305,687 | |
The Southern Co. | | | United States | | | | 18,720 | | | | | | | | 1,192,464 | |
Veolia Environnement SA | | | France | | | | 34,604 | | | | | | | | 920,106 | |
Xcel Energy Inc. | | | United States | | | | 3,771 | | | | | | | | 239,421 | |
| | | | | | | | | | | | | | | | |
| | | | | | | | | | | | | | | 14,450,517 | |
| | | | | | | | | | | | | | | | |
Total Common Stocks and Other Equity Interests
(Cost $427,888,694) | | | | | | | | | | | | | | | 464,956,087 | |
| | | | | | | | | | | | | | | | |
| | | | |
Management Investment Companies (Cost $35,760,635) 4.1% | | | | | | | | | | | | | | | | |
Diversified Financials 4.1% | | | | | | | | | | | | | | | | |
bTempleton Global Bond VIP Fund, Class 1 | | | United States | | | | 1,978,021 | | | | | | | | 33,013,162 | |
| | | | | | | | | | | | | | | | |
| | | | |
| | | | | | Principal
Amount* | | | | | | | |
| | | | |
Corporate Bonds 12.3% | | | | | | | | | | | | | | | | |
Banks 2.4% | | | | | | | | | | | | | | | | |
cAkbank T.A.S., senior note, 144A, 5.125%, 3/31/25 | | | Turkey | | | | 200,000 | | | | | | | | 196,185 | |
Bank of America Corp., sub. bond, 4.183%, 11/25/27 | | | United States | | | | 2,240,000 | | | | | | | | 2,428,111 | |
Barclays PLC, senior note, 3.932% to 5/07/24, FRN thereafter, 5/07/25 | | | United Kingdom | | | | 800,000 | | | | | | | | 840,876 | |
dBDO Unibank Inc., senior note, Reg S, 2.95%, 3/06/23 | | | Philippines | | | | 200,000 | | | | | | | | 202,152 | |
cBPCE SA, | | | | | | | | | | | | | | | | |
sub. note, 144A, 5.15%, 7/21/24 | | | France | | | | 1,000,000 | | | | | | | | 1,097,665 | |
sub. note, 144A, 4.875%, 4/01/26 | | | France | | | | 500,000 | | | | | | | | 550,845 | |
Citigroup Inc., senior note, 3.352% to 4/24/24, FRN thereafter, 4/24/25 | | | United States | | | | 2,300,000 | | | | | | | | 2,393,559 | |
Credit Suisse Group Funding Guernsey Ltd., senior note, 3.80%, 9/15/22 | | | Switzerland | | | | 2,300,000 | | | | | | | | 2,394,165 | |
JPMorgan Chase & Co., senior bond, 3.54% to 5/01/27, FRN thereafter, 5/01/28 | | | United States | | | | 1,350,000 | | | | | | | | 1,433,852 | |
dRealkredit Danmark A/S, | | | | | | | | | | | | | | | | |
secured bond, Reg S, 1.00%, 4/01/27 | | | Denmark | | | | 2,530,000 | | | | DKK | | | | 402,838 | |
senior bond, 10F, Reg S, 1.00%, 4/01/29 | | | Denmark | | | | 2,000,000 | | | | DKK | | | | 318,700 | |
Regions Financial Corp., senior note, 3.80%, 8/14/23 | | | United States | | | | 1,310,000 | | | | | | | | 1,386,719 | |
cStandard Chartered PLC, senior note, 144A, 4.05%, 4/12/26 | | | United Kingdom | | | | 1,500,000 | | | | | | | | 1,598,136 | |
Truist Financial Corp., sub. bond, 3.875%, 3/19/29 | | | United States | | | | 2,000,000 | | | | | | | | 2,169,201 | |
eWells Fargo Bank NA, senior note, FRN, 2.082%,(3-month USD LIBOR + 0.65%), 9/09/22 | | | United States | | | | 1,700,000 | | | | | | | | 1,702,953 | |
| | | | | | | | | | | | | | | | |
| | | | | | | | | | | | | | | 19,115,957 | |
| | | | | | | | | | | | | | | | |
Capital Goods 0.5% | | | | | | | | | | | | | | | | |
cBeacon Roofing Supply Inc., senior note, 144A, 4.875%, 11/01/25 | | | United States | | | | 200,000 | | | | | | | | 201,417 | |
Caterpillar Financial Services Corp., senior note, I, 2.65%, 5/17/21 | | | United States | | | | 1,500,000 | | | | | | | | 1,517,303 | |
General Electric Co., | | | | | | | | | | | | | | | | |
senior bond, 3.10%, 1/09/23 | | | United States | | | | 500,000 | | | | | | | | 510,872 | |
senior bond, 4.125%, 10/09/42 | | | United States | | | | 103,000 | | | | | | | | 106,041 | |
FRANKLIN TEMPLETON VARIABLE INSURANCE PRODUCTS TRUST
STATEMENT OF INVESTMENTS
Franklin Allocation VIP Fund(continued)
| | | | | | | | | | | | | | | | |
| | | Country/
Organization | | | Principal
Amount* | | | | | | Value | |
| | | | |
Corporate Bonds(continued) | | | | | | | | | | | | | | | | |
Capital Goods(continued) | | | | | | | | | | | | | | | | |
cHarsco Corp., senior note, 144A, 5.75%, 7/31/27 | | | United States | | | | 200,000 | | | | | | | $ | 213,759 | |
Lockheed Martin Corp., senior bond, 3.55%, 1/15/26 | | | United States | | | | 500,000 | | | | | | | | 536,321 | |
United Technologies Corp., senior bond, 4.50%, 6/01/42 | | | United States | | | | 800,000 | | | | | | | | 958,167 | |
cVertiv Group Corp., senior note, 144A, 9.25%, 10/15/24 | | | United States | | | | 200,000 | | | | | | | | 215,417 | |
| | | | | | | | | | | | | | | | |
| | | | |
| | | | | | | | | | | | | | | 4,259,297 | |
| | | | | | | | | | | | | | | | |
Commercial & Professional Services 0.1% | | | | | | | | | | | | | | | | |
cAshtead Capital Inc., secured note, second lien, 144A, 4.125%, 8/15/25 | | | United Kingdom | | | | 850,000 | | | | | | | | 875,500 | |
cIntrado Corp., senior note, 144A, 8.50%, 10/15/25 | | | United States | | | | 300,000 | | | | | | | | 240,750 | |
| | | | | | | | | | | | | | | | |
| | | | |
| | | | | | | | | | | | | | | 1,116,250 | |
| | | | | | | | | | | | | | | | |
Consumer Services 0.2% | | | | | | | | | | | | | | | | |
Marriott International Inc., senior note, 3.60%, 4/15/24 | | | United States | | | | 1,100,000 | | | | | | | | 1,158,420 | |
cStars Group Holdings BV/Stars Group U.S.Co-Borrower LLC, senior note, 144A, 7.00%, 7/15/26 | | | Canada | | | | 100,000 | | | | | | | | 108,560 | |
cWynn Las Vegas LLC/Wynn Las Vegas Capital Corp., senior bond, 144A, 5.25%, 5/15/27 | | | United States | | | | 200,000 | | | | | | | | 212,750 | |
| | | | | | | | | | | | | | | | |
| | | | |
| | | | | | | | | | | | | | | 1,479,730 | |
| | | | | | | | | | | | | | | | |
Diversified Financials 1.1% | | | | | | | | | | | | | | | | |
Capital One Financial Corp, senior note, 3.20%, 1/30/23 | | | United States | | | | 200,000 | | | | | | | | 205,635 | |
Capital One Financial Corp., senior note, 3.75%, 3/09/27 | | | United States | | | | 1,100,000 | | | | | | | | 1,173,063 | |
DY9 Leasing LLC, secured bond, 2.372%, 3/19/27 | | | United States | | | | 722,826 | | | | | | | | 732,922 | |
cFirstCash Inc., senior note, 144A, 5.375%, 6/01/24 | | | United States | | | | 200,000 | | | | | | | | 207,583 | |
The Goldman Sachs Group Inc., senior note, 3.50%, 1/23/25 | | | United States | | | | 1,900,000 | | | | | | | | 1,993,254 | |
Jyske Realkredit A/S, secured note, 1.00%, 4/01/26 | | | Denmark | | | | 2,220,000 | | | | DKK | | | | 353,378 | |
Morgan Stanley, senior bond, 3.591% to 7/22/27, FRN thereafter, 7/22/28 | | | United States | | | | 1,800,000 | | | | | | | | 1,913,162 | |
Private Export Funding Corp., secured bond, 2.80%, 5/15/22 | | | United States | | | | 1,600,000 | | | | | | | | 1,637,462 | |
dTNB Global Ventures Capital Bhd., senior note, Reg S, 3.244%, 10/19/26 | | | Malaysia | | | | 300,000 | | | | | | | | 301,824 | |
cUBS Group AG, senior note, 144A, 4.125%, 9/24/25 | | | Switzerland | | | | 700,000 | | | | | | | | 761,388 | |
| | | | | | | | | | | | | | | | |
| | | | |
| | | | | | | | | | | | | | | 9,279,671 | |
| | | | | | | | | | | | | | | | |
Energy 1.7% | | | | | | | | | | | | | | | | |
cAker BP ASA, senior note, 144A, 4.75%, 6/15/24 | | | Norway | | | | 200,000 | | | | | | | | 207,998 | |
Baker Hughes a GE Co. LLC/Baker HughesCo-obligator Inc., senior bond, 4.08%, 12/15/47 | | | United States | | | | 900,000 | | | | | | | | 921,677 | |
cCalifornia Resources Corp., secured note, second lien, 144A, 8.00%, 12/15/22 | | | United States | | | | 100,000 | | | | | | | | 44,500 | |
Canadian Natural Resources Ltd., senior bond, 3.90%, 2/01/25 | | | Canada | | | | 1,350,000 | | | | | | | | 1,439,352 | |
Cheniere Corpus Christi Holdings LLC, senior secured note, first lien, 5.875%, 3/31/25 | | | United States | | | | 200,000 | | | | | | | | 225,309 | |
Cheniere Energy Partners LP, senior secured note, first lien, 5.25%, 10/01/25 | | | United States | | | | 200,000 | | | | | | | | 208,916 | |
Enable Midstream Partners LP, senior bond, 4.95%, 5/15/28 | | | United States | | | | 300,000 | | | | | | | | 303,777 | |
Energy Transfer Operating LP, senior bond, 6.05%, 6/01/41 | | | United States | | | | 700,000 | | | | | | | | 789,969 | |
Enterprise Products Operating LLC, senior bond, 6.125%, 10/15/39 | | | United States | | | | 700,000 | | | | | | | | 915,125 | |
Kinder Morgan Inc., senior bond, 5.55%, 6/01/45 | | | United States | | | | 800,000 | | | | | | | | 957,705 | |
MPLX LP, senior bond, 5.50%, 2/15/49 | | | United States | | | | 425,000 | | | | | | | | 482,152 | |
Murphy Oil USA Inc., senior bond, 4.75%, 9/15/29 | | | United States | | | | 100,000 | | | | | | | | 105,792 | |
Occidental Petroleum Corp., senior note, 2.60%, 8/13/21 | | | United States | | | | 700,000 | | | | | | | | 705,276 | |
FRANKLIN TEMPLETON VARIABLE INSURANCE PRODUCTS TRUST
STATEMENT OF INVESTMENTS
Franklin Allocation VIP Fund(continued)
| | | | | | | | | | | | |
| | | Country/
Organization | | | Principal
Amount* | | | Value | |
| | | |
Corporate Bonds(continued) | | | | | | | | | | | | |
Energy(continued) | | | | | | | | | | | | |
Oceaneering International Inc., senior note, 4.65%, 11/15/24 | | | United States | | | | 200,000 | | | $ | 196,500 | |
Reliance Industries Ltd., senior note, 2.06%, 1/15/26 | | | United States | | | | 812,500 | | | | 816,776 | |
cSchlumberger Holdings Corp., senior note, 144A, 3.75%, 5/01/24 | | | United States | | | | 1,800,000 | | | | 1,896,605 | |
Total Capital International SA, senior note, 3.455%, 2/19/29 | | | France | | | | 670,000 | | | | 726,019 | |
TransCanada PipeLines Ltd., senior bond, 4.875%, 5/15/48 | | | Canada | | | | 200,000 | | | | 236,062 | |
Valero Energy Corp., senior bond, 4.00%, 4/01/29 | | | United States | | | | 1,000,000 | | | | 1,079,149 | |
The Williams Cos. Inc., | | | | | | | | | | | | |
senior bond, 4.125%, 11/15/20 | | | United States | | | | 1,350,000 | | | | 1,366,221 | |
senior bond, 4.85%, 3/01/48 | | | United States | | | | 320,000 | | | | 349,845 | |
| | | | | | | | | | | | |
| | | | | | | | | | | 13,974,725 | |
| | | | | | | | | | | | |
Food & Staples Retailing 0.3% | | | | | | | | | | | | |
cCencosud SA, senior note, 144A, 4.375%, 7/17/27 | | | Chile | | | | 300,000 | | | | 296,308 | |
cCK Hutchison International 19 Ltd., senior note, 144A, 3.25%, 4/11/24 | | | Hong Kong | | | | 1,275,000 | | | | 1,308,840 | |
The Kroger Co., senior bond, 5.40%, 1/15/49 | | | United States | | | | 550,000 | | | | 670,912 | |
Walgreens Boots Alliance Inc., senior note, 3.80%, 11/18/24 | | | United States | | | | 500,000 | | | | 520,073 | |
| | | | | | | | | | | | |
| | | | | | | | | | | 2,796,133 | |
| | | | | | | | | | | | |
Food, Beverage & Tobacco 0.7% | | | | | | | | | | | | |
Anheuser-Busch InBev Worldwide Inc., senior bond, 5.80%, 1/23/59 | | | Belgium | | | | 335,000 | | | | 456,616 | |
Bunge Ltd. Finance Corp., senior note, 4.35%, 3/15/24 | | | United States | | | | 700,000 | | | | 735,266 | |
Coca-Cola Femsa SAB de CV, senior note, 3.875%, 11/26/23 | | | Mexico | | | | 1,100,000 | | | | 1,163,451 | |
cImperial Brands Finance PLC, | | | | | | | | | | | | |
senior note, 144A, 4.25%, 7/21/25 | | | United Kingdom | | | | 585,000 | | | | 617,248 | |
senior note, 144A, 3.50%, 7/26/26 | | | United Kingdom | | | | 300,000 | | | | 301,554 | |
Kraft Heinz Foods Co., senior bond, 3.00%, 6/01/26 | | | United States | | | | 850,000 | | | | 850,031 | |
Reynolds American Inc., senior bond, 5.85%, 8/15/45 | | | United Kingdom | | | | 650,000 | | | | 745,190 | |
Tyson Foods Inc., senior bond, 5.10%, 9/28/48 | | | United States | | | | 690,000 | | | | 867,494 | |
| | | | | | | | | | | | |
| | | | | | | | | | | 5,736,850 | |
| | | | | | | | | | | | |
Health Care Equipment & Services 0.6% | | | | | | | | | | | | |
Abbott Laboratories, senior bond, 3.75%, 11/30/26 | | | United States | | | | 450,000 | | | | 491,749 | |
Anthem Inc., senior bond, 5.10%, 1/15/44 | | | United States | | | | 600,000 | | | | 717,161 | |
cCentene Corp., senior note, 144A, 4.25%, 12/15/27 | | | United States | | | | 200,000 | | | | 206,120 | |
CHS/Community Health Systems Inc., senior secured note, first lien, 6.25%, 3/31/23 | | | United States | | | | 100,000 | | | | 101,750 | |
cCigna Corp., senior note, 144A, 3.05%, 10/15/27 | | | United States | | | | 850,000 | | | | 862,453 | |
CVS Health Corp., senior bond, 5.30%, 12/05/43 | | | United States | | | | 1,050,000 | | | | 1,252,572 | |
HCA Inc., senior secured bond, first lien, 4.50%, 2/15/27 | | | United States | | | | 583,000 | | | | 629,019 | |
cMEDNAX Inc., senior note, 144A, 6.25%, 1/15/27 | | | United States | | | | 200,000 | | | | 205,505 | |
| | | | | | | | | | | | |
| | | | | | | | | | | 4,466,329 | |
| | | | | | | | | | | | |
Household & Personal Products 0.0%† | | | | | | | | | | | | |
Avon Products Inc., senior bond, 7.00%, 3/15/23 | | | United Kingdom | | | | 260,000 | | | | 283,481 | |
| | | | | | | | | | | | |
| | | |
Insurance 0.7% | | | | | | | | | | | | |
Aflac Inc., senior bond, 4.75%, 1/15/49 | | | United States | | | | 700,000 | | | | 851,333 | |
The Allstate Corp., senior bond, 4.20%, 12/15/46 | | | United States | | | | 700,000 | | | | 805,358 | |
Marsh & McLennan Cos. Inc., senior note, 3.875%, 3/15/24 | | | United States | | | | 2,000,000 | | | | 2,133,164 | |
MetLife Inc., junior sub. bond, 6.40%, 12/15/66 | | | United States | | | | 700,000 | | | | 858,617 | |
FRANKLIN TEMPLETON VARIABLE INSURANCE PRODUCTS TRUST
STATEMENT OF INVESTMENTS
Franklin Allocation VIP Fund(continued)
| | | | | | | | | | | | |
| | | Country/
Organization | | | Principal
Amount* | | | Value | |
| | | |
Corporate Bonds(continued) | | | | | | | | | | | | |
Insurance(continued) | | | | | | | | | | | | |
cMetropolitan Life Global Funding I, secured note, 144A, 3.60%, 1/11/24 | | | United States | | | | 1,220,000 | | | $ | 1,290,691 | |
| | | | | | | | | | | | |
| | | | | | | | | | | 5,939,163 | |
| | | | | | | | | | | | |
Materials 0.4% | | | | | | | | | | | | |
cBraskem Netherlands Finance BV, senior bond, 144A, 4.50%, 1/31/30 | | | Brazil | | | | 300,000 | | | | 298,170 | |
cGlencore Funding LLC, senior note, 144A, 4.625%, 4/29/24 | | | Switzerland | | | | 1,350,000 | | | | 1,434,915 | |
International Paper Co., senior bond, 3.80%, 1/15/26 | | | United States | | | | 300,000 | | | | 320,119 | |
cMauser Packaging Solutions Holding Co., senior note, 144A, 7.25%, 4/15/25 | | | United States | | | | 200,000 | | | | 197,998 | |
cNew Gold Inc., senior note, 144A, 6.375%, 5/15/25 | | | Canada | | | | 100,000 | | | | 92,773 | |
cOI European Group BV, senior note, 144A, 4.00%, 3/15/23 | | | United States | | | | 150,000 | | | | 151,562 | |
cPlastipak Holdings Inc., senior note, 144A, 6.25%, 10/15/25 | | | United States | | | | 200,000 | | | | 172,992 | |
cSunCoke Energy Partners LP/SunCoke Energy Partners Finance Corp., senior note, 144A, 7.50%, 6/15/25 | | | United States | | | | 200,000 | | | | 192,832 | |
| | | | | | | | | | | | |
| | | | | | | | | | | 2,861,361 | |
| | | | | | | | | | | | |
Media & Entertainment 0.5% | | | | | | | | | | | | |
cCCO Holdings LLC/CCO Holdings Capital Corp., senior bond, 144A, 5.00%, 2/01/28 | | | United States | | | | 100,000 | | | | 105,117 | |
Charter Communications Operating LLC/Charter Communications Operating Capital, senior secured note, first lien, 4.50%, 2/01/24 | | | United States | | | | 700,000 | | | | 753,242 | |
Comcast Corp., senior bond, 4.049%, 11/01/52 | | | United States | | | | 1,350,000 | | | | 1,515,644 | |
cCSC Holdings LLC, senior bond, 144A, 5.375%, 2/01/28 | | | United States | | | | 300,000 | | | | 320,572 | |
cDiamond Sports Group LLC/Diamond Sports Finance Co., first lien, 144A, 5.375%, 8/15/26 | | | United States | | | | 200,000 | | | | 202,685 | |
cFox Corp., senior bond, 144A, 5.476%, 1/25/39 | | | United States | | | | 420,000 | | | | 513,573 | |
cTencent Holdings Ltd., senior note, 144A, 3.595%, 1/19/28 | | | China | | | | 900,000 | | | | 939,966 | |
| | | | | | | | | | | | |
| | | | | | | | | | | 4,350,799 | |
| | | | | | | | | | | | |
Pharmaceuticals, Biotechnology & Life Sciences 0.6% | | | | | | | | | | | | |
cAbbVie Inc., | | | | | | | | | | | | |
senior bond, 144A, 4.25%, 11/21/49 | | | United States | | | | 370,000 | | | | 391,068 | |
senior note, 144A, 2.95%, 11/21/26 | | | United States | | | | 200,000 | | | | 203,299 | |
Allergan Funding SCS, senior bond, 4.85%, 6/15/44 | | | United States | | | | 550,000 | | | | 598,716 | |
AstraZeneca PLC, senior bond, 4.375%, 11/16/45 | | | United Kingdom | | | | 1,000,000 | | | | 1,179,675 | |
cBausch Health Cos. Inc., senior bond, 144A, 6.125%, 4/15/25 | | | United States | | | | 200,000 | | | | 207,063 | |
Biogen Inc., senior bond, 5.20%, 9/15/45 | | | United States | | | | 700,000 | | | | 844,242 | |
cBristol-Myers Squibb Co., senior bond, 144A, 4.625%, 5/15/44 | | | United States | | | | 600,000 | | | | 727,012 | |
Gilead Sciences Inc., senior bond, 4.80%, 4/01/44 | | | United States | | | | 700,000 | | | | 840,108 | |
| | | | | | | | | | | | |
| | | | | | | | | | | 4,991,183 | |
| | | | | | | | | | | | |
Real Estate 0.1% | | | | | | | | | | | | |
Simon Property Group LP, senior note, 3.375%, 12/01/27 | | | United States | | | | 780,000 | | | | 828,926 | |
| | | | | | | | | | | | |
| | | |
Retailing 0.3% | | | | | | | | | | | | |
Alibaba Group Holding Ltd., senior bond, 4.20%, 12/06/47 | | | China | | | | 800,000 | | | | 887,435 | |
AutoZone Inc., senior note, 3.75%, 4/18/29 | | | United States | | | | 500,000 | | | | 529,429 | |
Dollar Tree Inc., senior note, 4.00%, 5/15/25 | | | United States | | | | 450,000 | | | | 481,340 | |
cParty City Holdings Inc., senior note, 144A, 6.625%, 8/01/26 | | | United States | | | | 200,000 | | | | 141,465 | |
| | | | | | | | | | | | |
| | | | | | | | | | | 2,039,669 | |
| | | | | | | | | | | | |
FRANKLIN TEMPLETON VARIABLE INSURANCE PRODUCTS TRUST
STATEMENT OF INVESTMENTS
Franklin Allocation VIP Fund(continued)
| | | | | | | | | | | | |
| | | Country/
Organization | | | Principal
Amount* | | | Value | |
| | | |
Corporate Bonds(continued) | | | | | | | | | | | | |
Software & Services 0.4% | | | | | | | | | | | | |
Fiserv Inc., senior bond, 3.50%, 7/01/29 | | | United States | | | | 630,000 | | | $ | 662,555 | |
Microsoft Corp., senior note, 2.65%, 11/03/22 | | | United States | | | | 2,100,000 | | | | 2,150,982 | |
| | | | | | | | | | | | |
| | | | | | | | | | | 2,813,537 | |
| | | | | | | | | | | | |
Telecommunication Services 0.2% | | | | | | | | | | | | |
AT&T Inc., | | | | | | | | | | | | |
senior bond, 4.85%, 7/15/45 | | | United States | | | | 100,000 | | | | 114,323 | |
senior note, 3.80%, 2/15/27 | | | United States | | | | 700,000 | | | | 746,547 | |
Telefonica Emisiones SA, senior bond, 5.52%, 3/01/49 | | | Spain | | | | 800,000 | | | | 1,002,176 | |
| | | | | | | | | | | | |
| | | | | | | | | | | 1,863,046 | |
| | | | | | | | | | | | |
Transportation 0.3% | | | | | | | | | | | | |
CSX Corp., senior bond, 4.75%, 11/15/48 | | | United States | | | | 800,000 | | | | 969,147 | |
Fedex Corp., senior bond, 5.10%, 1/15/44 | | | United States | | | | 550,000 | | | | 602,964 | |
cKazakhstan Temir Zholy Finance BV, senior bond, 144A, 6.95%, 7/10/42 | | | Kazakhstan | | | | 250,000 | | | | 336,283 | |
cMexico City Airport Trust, senior secured bond, first lien, 144A, 5.50%, 7/31/47 | | | Mexico | | | | 200,000 | | | | 206,939 | |
d,fRZD Capital PLC, (Russian Railways), loan participation, senior bond, Reg S, 5.70%, 4/05/22 | | | Russia | | | | 200,000 | | | | 215,203 | |
| | | | | | | | | | | | |
| | | | | | | | | | | 2,330,536 | |
| | | | | | | | | | | | |
Utilities 1.2% | | | | | | | | | | | | |
Dominion Energy Inc., senior note, 4.25%, 6/01/28 | | | United States | | | | 1,750,000 | | | | 1,935,472 | |
Duke Energy Corp., | | | | | | | | | | | | |
senior bond, 3.75%, 4/15/24 | | | United States | | | | 350,000 | | | | 370,897 | |
senior bond, 3.75%, 9/01/46 | | | United States | | | | 100,000 | | | | 103,292 | |
cElectricite de France SA, senior note, 144A, 4.50%, 9/21/28 | | | France | | | | 1,600,000 | | | | 1,778,964 | |
cEnel Finance International NV, senior note, 144A, 4.25%, 9/14/23 | | | Italy | | | | 1,400,000 | | | | 1,483,692 | |
Georgia Power Co., senior bond, 4.30%, 3/15/42 | | | United States | | | | 1,400,000 | | | | 1,534,831 | |
Public Service Enterprise Group Inc., senior note, 2.875%, 6/15/24 | | | United States | | | | 1,000,000 | | | | 1,022,543 | |
cState Grid Overseas Investment 2016 Ltd., senior note, 144A, 3.50%, 5/04/27 | | | China | | | | 400,000 | | | | 418,920 | |
cTalen Energy Supply LLC, senior secured note, 144A, 7.25%, 5/15/27 | | | United States | | | | 200,000 | | | | 210,810 | |
cVistra Operations Co. LLC, senior secured note, first lien, 144A, 3.55%, 7/15/24 | | | United States | | | | 510,000 | | | | 516,728 | |
| | | | | | | | | | | | |
| | | | | | | | | | | 9,376,149 | |
| | | | | | | | | | | | |
Total Corporate Bonds (Cost $95,226,481) | | | | | | | | | | | 99,902,792 | |
| | | | | | | | | | | | |
| | | |
e,gSenior Floating Rate Interests 0.7% | | | | | | | | | | | | |
Capital Goods 0.1% | | | | | | | | | | | | |
Delos Finance S.A.R.L. (AerCap), New Loans, 3.695%,(3-month USD LIBOR + 1.75%), 10/06/23 | | �� | Luxembourg | | | | 140,000 | | | | 140,712 | |
Flying Fortress Holdings LLC (ILFC), New Loan, 3.695%,(3-month USD LIBOR + 1.75%), 10/30/22 | | | United States | | | | 93,334 | | | | 93,807 | |
Navistar Inc., Tranche B Term Loan, 5.24%,(1-month USD LIBOR + 3.50%), 11/06/24 | | | United States | | | | 298,481 | | | | 298,108 | |
Resideo Funding Inc., Tranche B Term Loan, 4.20%,(3-month USD LIBOR + 2.25%), 10/25/25 | | | United States | | | | 198,496 | | | | 197,628 | |
| | | | | | | | | | | | |
| | | | | | | | | | | 730,255 | |
| | | | | | | | | | | | |
FRANKLIN TEMPLETON VARIABLE INSURANCE PRODUCTS TRUST
STATEMENT OF INVESTMENTS
Franklin Allocation VIP Fund(continued)
| | | | | | | | | | | | |
| | | Country/
Organization | | | Principal
Amount* | | | Value | |
| | | |
e,gSenior Floating Rate Interests(continued) | | | | | | | | | | | | |
Commercial & Professional Services 0.1% | | | | | | | | | | | | |
Nielsen Finance LLC,Class B-4 Term Loans, 3.71%,(1-month USD LIBOR + 2.00%), 10/04/23 | | | United States | | | | 198,980 | | | $ | 199,947 | |
h,iPitney Bowes Inc., Term Loan B, TBD, 1/15/25 | | | United States | | | | 100,000 | | | | 99,094 | |
hPrime Security Services Borrower LLC, TermB-1, 4.944%,(1-month USD LIBOR + 3.25%), 9/12/26 | | | United States | | | | 625,000 | | | | 627,430 | |
United Rentals North America Inc., Initial Term Loans, 3.549%,(1-month USD LIBOR + 1.75%), 10/31/25 | | | United States | | | | 198,492 | | | | 200,017 | |
| | | | | | | | | | | | |
| | | | | | | | | | | 1,126,488 | |
| | | | | | | | | | | | |
Consumer Services 0.1% | | | | | | | | | | | | |
Avis Budget Car Rental LLC, Tranche B Term Loans, 3.80%,(1-month USD LIBOR + 2.00%), 2/13/25. | | | United States | | | | 198,481 | | | | 199,877 | |
Equinox Holdings Inc., TermB-1 Loans, 4.799%,(1-month USD LIBOR + 3.00%), 3/08/24 | | | United States | | | | 199,490 | | | | 200,694 | |
KFC Holding Co./Pizza Hut Holdings LLC/Taco Bell of America LLC (Yum Brands), Term Loan B, 3.495%,(1-month USD LIBOR + 1.75%), 4/03/25 | | | United States | | | | 198,485 | | | | 199,415 | |
NASCAR Holdings Inc., Initial Term Loans, 4.495%,(1-month USD LIBOR + 2.75%), 10/18/26 | | | United States | | | | 260,453 | | | | 263,587 | |
| | | | | | | | | | | | |
| | | | | | | | | | | 863,573 | |
| | | | | | | | | | | | |
Energy 0.0%† | | | | | | | | | | | | |
Buckeye Partners LP, Initial Term Loans, 4.441%,(1-month USD LIBOR + 2.75%), 11/01/26 | | | United States | | | | 300,000 | | | | 302,937 | |
| | | | | | | | | | | | |
| | | |
Food & Staples Retailing 0.1% | | | | | | | | | | | | |
Aramark Corp., | | | | | | | | | | | | |
U.S. TermB-3 Loan, 3.549%,(1-month USD LIBOR + 1.75%), 3/11/25 | | | United States | | | | 200,000 | | | | 201,094 | |
h,iU.S. TermB-4 Loan, TBD, 12/31/26 | | | United States | | | | 460,000 | | | | 463,018 | |
US Foods Inc., Term Loan B, 3.549%,(1-month USD LIBOR + 1.75%), 6/27/23 | | | United States | | | | 198,972 | | | | 199,896 | |
| | | | | | | | | | | | |
| | | | | | | | | | | 864,008 | |
| | | | | | | | | | | | |
Food, Beverage & Tobacco 0.0%† | | | | | | | | | | | | |
hJBS USA Lux SA, New Term Loans, 3.799%,(1-month USD LIBOR + 2.00%), 5/01/26 | | | United States | | | | 44,119 | | | | 44,485 | |
| | | | | | | | | | | | |
| | | |
Health Care Equipment & Services 0.0%† | | | | | | | | | | | | |
hHCA Inc., Term Loan B13, 3.549%,(1-month USD LIBOR + 1.75%), 3/18/26 | | | United States | | | | 198,492 | | | | 199,857 | |
| | | | | | | | | | | | |
| | | |
Media & Entertainment 0.1% | | | | | | | | | | | | |
Charter Communications Operating LLC (CCO Safari), TermB-2 Loan, 3.55%,(1-month USD LIBOR + 1.75%), 2/01/27 | | | United States | | | | 198,987 | | | | 200,495 | |
Diamond Sports Group LLC, Term Loan, 5.03%,(1-month USD LIBOR + 3.25%), 8/24/26 | | | United States | | | | 68,096 | | | | 68,096 | |
Gray Television Inc., Term C Loan, 4.197%,(1-month USD LIBOR + 2.50%), 1/02/26 | | | United States | | | | 255,532 | | | | 257,161 | |
| | | | | | | | | | | | |
| | | | | | | | | | | 525,752 | |
| | | | | | | | | | | | |
FRANKLIN TEMPLETON VARIABLE INSURANCE PRODUCTS TRUST
STATEMENT OF INVESTMENTS
Franklin Allocation VIP Fund(continued)
| | | | | | | | | | | | | | |
| | | Country/
Organization | | | Principal
Amount* | | | | | Value | |
e,gSenior Floating Rate Interests (continued) | | | | | | | | | | | | | | |
Retailing 0.1% | | | | | | | | | | | | | | |
hBass Pro Group LLC, Initial Term Loans, 6.799%,(1-month USD LIBOR + 5.00%), 9/25/24 | | | United States | | | | 150,000 | | | | | $ | 149,663 | |
hHarbor Freight Tools USA Inc., Refinancing Loans, 4.299%,(1-month USD LIBOR + 2.50%), 8/19/23 | | | United States | | | | 100,000 | | | | | | 99,656 | |
Michaels Stores Inc., 2018 New Replacement Term B Loan, 4.292% - 4.305%,(1-month USD LIBOR + 2.50%), 1/28/23 | | | United States | | | | 300,000 | | | | | | 291,000 | |
| | | | | | | | | | | | | | |
| | | | |
| | | | | | | | | | | | | 540,319 | |
| | | | | | | | | | | | | | |
Software & Services 0.0%† | | | | | | | | | | | | | | |
| | | | |
h,iInfor (US) Inc. (Lawson), First Lien Term Loan, TBD, 2/01/22 | | | United States | | | | 99,744 | | | | | | 100,305 | |
| | | | | | | | | | | | | | |
Telecommunication Services 0.0%† | | | | | | | | | | | | | | |
Global Tel*Link Corp., First Lien Term Loan, 6.049%,(1-month USD LIBOR + 4.25%), 11/29/25 | | | United States | | | | 39,699 | | | | | | 36,275 | |
Securus Technologies Holdings Inc., Initial Term Loan, 6.299%,(1-month USD LIBOR + 4.50%), 11/01/24 | | | United States | | | | 29,771 | | | | | | 22,180 | |
| | | | | | | | | | | | | | |
| | | | |
| | | | | | | | | | | | | 58,455 | |
| | | | | | | | | | | | | | |
Transportation 0.1% | | | | | | | | | | | | | | |
Air Canada, New Term Loans, 3.514%,(1-month USD LIBOR + 1.75%), 10/06/23 | | | Canada | | | | 198,658 | | | | | | 200,145 | |
XPO Logistics Inc., Refinanced Term Loan, 3.799%,(1-month USD LIBOR + 2.00%), 2/24/25 | | | United States | | | | 200,000 | | | | | | 201,084 | |
| | | | | | | | | | | | | | |
| | | | |
| | | | | | | | | | | | | 401,229 | |
| | | | | | | | | | | | | | |
| | | | |
Total Senior Floating Rate Interests (Cost $5,730,039) | | | | | | | | | | | | | 5,757,663 | |
| | | | | | | | | | | | | | |
| | | | |
Foreign Government and Agency Securities 1.1% | | | | | | | | | | | | | | |
cAngolan Government International Bond, senior note, 144A, 8.25%, 5/09/28 | | | Angola | | | | 550,000 | | | | | | 595,489 | |
dBanque Centrale de Tunisie International Bond, senior note, Reg S, 5.625%, 2/17/24 | | | Tunisia | | | | 550,000 | | | EUR | | | 614,901 | |
cBanque Ouest Africaine de Developpement, senior note, 144A, 5.00%, 7/27/27 | | | Supranational | j | | | 300,000 | | | | | | 318,750 | |
cDominican Republic, senior note, 144A, 8.90%, 2/15/23 | | | Dominican Republic | | | | 23,800,000 | | | DOP | | | 452,204 | |
cGovernment of Belarus International Bond, senior note, 144A, 7.625%, 6/29/27 | | | Belarus | | | | 400,000 | | | | | | 455,974 | |
Government of Colombia, | | | | | | | | | | | | | | |
senior bond, 9.85%, 6/28/27 | | | Colombia | | | | 1,000,000,000 | | | COP | | | 382,487 | |
senior bond, 5.00%, 6/15/45 | | | Colombia | | | | 300,000 | | | | | | 349,481 | |
cGovernment of Gabon, 144A, 6.375%, 12/12/24 | | | Gabon | | | | 600,000 | | | | | | 628,143 | |
cGovernment of Indonesia, senior bond, 144A, 4.35%, 1/08/27 | | | Indonesia | | | | 300,000 | | | | | | 328,286 | |
cGovernment of Iraq, 144A, 5.80%, 1/15/28 | | | Iraq | | | | 650,000 | | | | | | 637,891 | |
cGovernment of Kazakhstan, senior bond, 144A, 4.875%, 10/14/44 | | | Kazakhstan | | | | 300,000 | | | | | | 371,427 | |
Government of Mexico, senior note, 4.15%, 3/28/27 | | | Mexico | | | | 600,000 | | | | | | 643,206 | |
Government of Peru, senior bond, 6.55%, 3/14/37 | | | Peru | | | | 100,000 | | | | | | 146,340 | |
Government of South Africa, senior bond, 7.00%, 2/28/31 | | | South Africa | | | | 8,500,000 | | | ZAR | | | 514,212 | |
c,dGovernment of Spain, senior bond, 144A, Reg S, 2.70%, 10/31/48 | | | Spain | | | | 1,065,000 | | | EUR | | | 1,587,654 | |
cGovernment of Ukraine, senior bond, 144A, 7.375%, 9/25/32 | | | Ukraine | | | | 600,000 | | | | | | 641,530 | |
FRANKLIN TEMPLETON VARIABLE INSURANCE PRODUCTS TRUST
STATEMENT OF INVESTMENTS
Franklin Allocation VIP Fund(continued)
| | | | | | | | | | | | |
| | | Country/
Organization | | | Principal
Amount* | | | | Value | |
| | | | |
Foreign Government and Agency Securities (continued) | | | | | | | | | | | | |
kGovernment of Uruguay, senior bond, Index Linked, 3.70%, 6/26/37 | | | Uruguay | | | 17,102,564 | | UYU | | $ | 448,690 | |
| | | | | | | | | | | | |
| | | | |
Total Foreign Government and Agency Securities
(Cost $9,010,585) | | | | | | | | | | | 9,116,665 | |
| | | | | | | | | | | | |
| | | | |
U.S. Government and Agency Securities 4.1% | | | | | | | | | | | | |
Federal Agricultural Mortgage Corp., 2.90%, 1/03/22 | | | United States | | | 800,000 | | | | | 820,212 | |
FFCB, | | | | | | | | | | | | |
3.17%, 3/07/28 | | | United States | | | 800,000 | | | | | 866,407 | |
senior bond, 2.86%, 7/11/28 | | | United States | | | 800,000 | | | | | 848,344 | |
FHLB, 2.625%, 9/12/25 | | | United States | | | 1,600,000 | | | | | 1,667,451 | |
Hashemite Kingdom of Jordan Government AID Bond, senior note, 2.578%, 6/30/22 | | | United States | | | 800,000 | | | | | 812,824 | |
Israel Government Agency for International Development Bond, 5.50%, 9/18/23 | | | United States | | | 1,110,000 | | | | | 1,254,599 | |
Overseas Private Investment Corp., senior note, 2.12%, 3/20/24 | | | United States | | | 400,000 | | | | | 401,734 | |
TVA, 5.88%, 4/01/36 | | | United States | | | 630,000 | | | | | 889,181 | |
U.S. Treasury Bond, | | | | | | | | | | | | |
3.75%, 8/15/41 | | | United States | | | 1,090,000 | | | | | 1,352,240 | |
3.125%, 2/15/42 | | | United States | | | 2,220,000 | | | | | 2,516,285 | |
2.50%, 2/15/46 | | | United States | | | 840,000 | | | | | 856,876 | |
3.00%, 2/15/49 | | | United States | | | 2,060,000 | | | | | 2,321,968 | |
kIndex Linked, 2.00%, 1/15/26 | | | United States | | | 518,602 | | | | | 576,574 | |
kIndex Linked, 1.75%, 1/15/28 | | | United States | | | 798,403 | | | | | 897,160 | |
kIndex Linked, 3.625%, 4/15/28 | | | United States | | | 715,946 | | | | | 916,081 | |
U.S. Treasury Note, | | | | | | | | | | | | |
2.375%, 8/15/24 | | | United States | | | 1,680,000 | | | | | 1,730,303 | |
2.25%, 8/15/27 | | | United States | | | 2,920,000 | | | | | 3,000,267 | |
2.625%, 2/15/29 | | | United States | | | 3,525,000 | | | | | 3,733,840 | |
kIndex Linked, 0.125%, 7/15/24 | | | United States | | | 1,733,967 | | | | | 1,744,580 | |
k,lIndex Linked, 0.375%, 7/15/25 | | | United States | | | 4,448,953 | | | | | 4,540,499 | |
kIndex Linked, 0.375%, 7/15/27 | | | United States | | | 1,472,734 | | | | | 1,502,656 | |
| | | | | | | | | | | | |
| | | | |
Total U.S. Government and Agency Securities
(Cost $32,144,955) | | | | | | | | | | | 33,250,081 | |
| | | | | | | | | | | | |
| | | | |
Asset-Backed Securities and Commercial Mortgage-Backed
Securities 6.5% | | | | | | | | | | | | |
Diversified Financials 6.5% | | | | | | | | | | | | |
c,mAdagio CLO VIII DAC,VIII-A, B1, 144A, FRN, 1.65%, 4/15/32 | | | Ireland | | | 250,000 | | EUR | | | 279,598 | |
American Express Credit Account Master Trust, | | | | | | | | | | | | |
m2018-3, A, FRN, 2.06%, 10/15/25 | | | United States | | | 1,040,000 | | | | | 1,040,361 | |
2019-1, A, 2.87%, 10/15/24 | | | United States | | | 1,160,000 | | | | | 1,186,238 | |
2019-3, A, 2.00%, 4/15/25 | | | United States | | | 410,000 | | | | | 411,316 | |
c,mAres European CLO VIII BV, | | | | | | | | | | | | |
8A, AR, 144A, FRN, 0.92%, 4/17/32 | | | Netherlands | | | 600,000 | | EUR | | | 670,051 | |
8A, BR, 144A, FRN, 1.60%, 4/17/32 | | | Netherlands | | | 250,000 | | EUR | | | 279,285 | |
FRANKLIN TEMPLETON VARIABLE INSURANCE PRODUCTS TRUST
STATEMENT OF INVESTMENTS
Franklin Allocation VIP Fund(continued)
| | | | | | | | | | | | |
| | | Country/
Organization | | | Principal
Amount* | | | | Value | |
| | | | |
Asset-Backed Securities and Commercial Mortgage-Backed Securities (continued) | | | | | | | | | | | | |
Diversified Financials(continued) | | | | | | | | | | | | |
c,nAtrium XII, 12A, CR, 144A, FRN, 3.603%,(3-month USD LIBOR + 1.65%), 4/22/27 | | | United States | | | 1,240,000 | | | | $ | 1,218,312 | |
c,mAtrium XIII,2017-13A, A1, 144A, FRN, 3.114%, 11/21/30 | | | United States | | | 1,410,000 | | | | | 1,409,605 | |
c,mAvoca CLO XVII Designated Activity Co., 17A, B1R, 144A, FRN, 1.70%, 10/15/32 | | | Ireland | | | 250,000 | | EUR | | | 279,567 | |
c,m Blackrock European CLO IX DAC, | | | | | | | | | | | | |
9A, A, 144A, FRN, 0.90%, 12/15/32 | | | Ireland | | | 500,000 | | EUR | | | 558,413 | |
9A, B, 144A, FRN, 1.55%, 12/15/32 | | | Ireland | | | 250,000 | | EUR | | | 279,200 | |
c,mBlueMountain CLO XXII Ltd.,2018-1A, B, 144A, FRN, 3.636%, 7/30/30 | | | United States | | | 900,000 | | | | | 892,737 | |
c,m BlueMountain EUR CLO, | | | | | | | | | | | | |
5A, A, 144A, FRN, 0.91%, 1/15/33 | | | Ireland | | | 600,000 | | EUR | | | 672,368 | |
5A, B, 144A, FRN, 1.55%, 1/15/33 | | | Ireland | | | 250,000 | | EUR | | | 280,197 | |
c,nBlueMountain Fuji U.S. CLO III Ltd.,2017-3A, A2, 144A, FRN, 3.151%,(3-month USD LIBOR + 1.15%), 1/15/30 | | | United States | | | 650,000 | | | | | 635,863 | |
cBRAVO Residential Funding Trust,2019-1, A1C, 144A, 3.50%, 3/25/58 | | | United States | | | 847,965 | | | | | 860,073 | |
cBWAY Mortgage Trust, 2013-1515, C, 144A, 3.454%, 3/10/33 | | | United States | | | 750,000 | | | | | 781,677 | |
Capital One Multi-Asset Execution Trust, | | | | | | | | | | | | |
2015-A4, A4, 2.75%, 5/15/25 | | | United States | | | 380,000 | | | | | 388,334 | |
2016-A5, A5, 1.66%, 6/17/24 | | | United States | | | 330,000 | | | | | 329,003 | |
2019-A1, A1, 2.84%, 12/15/24 | | | United States | | | 750,000 | | | | | 765,299 | |
c,mCarlyle Euro CLO DAC,2019-2A, A1A, 144A, FRN, 1.11%, 8/15/32 | | | Ireland | | | 350,000 | | EUR | | | 395,658 | |
c,n Carlyle Global Market Strategies CLO Ltd., | | | | | | | | | | | | |
2014-4RA, C, 144A, FRN, 4.901%,(3-month USD LIBOR + 2.90%), 7/15/30 | | | United States | | | 250,000 | | | | | 223,925 | |
2015-2A, A1R, 144A, FRN, 2.716%,(3-month USD LIBOR + 0.78%), 4/27/27 | | | United States | | | 897,232 | | | | | 895,474 | |
c,mCent CLO,2018-28A, C, 144A, FRN, 5.314%, 11/07/30 | | | United States | | | 750,000 | | | | | 723,758 | |
c,mCIM Trust, 2019-INV2, A3, 144A, FRN, 4.00%, 5/25/49 | | | United States | | | 583,917 | | | | | 598,397 | |
m Citibank Credit Card Issuance Trust, | | | | | | | | | | | | |
2017-A7, A7, FRN, 2.08%, 8/08/24 | | | United States | | | 130,000 | | | | | 130,497 | |
2018-A2, A2, FRN, 2.095%, 1/20/25 | | | United States | | | 1,280,000 | | | | | 1,281,124 | |
c,mCOMM Mortgage Trust, 2014-277P, A, 144A, FRN, 3.611%, 8/10/49 | | | United States | | | 1,000,000 | | | | | 1,053,960 | |
Discover Card Execution Note Trust, | | | | | | | | | | | | |
2019-A1, A1, 3.04%, 7/15/24 | | | United States | | | 920,000 | | | | | 942,058 | |
2019-A3, A, 1.89%, 10/15/24 | | | United States | | | 680,000 | | | | | 679,251 | |
c,nDryden 41 Senior Loan Fund,2015-41A, AR, 144A, FRN, 2.956%,(3-month USD LIBOR + 0.97%), 4/15/31 | | | United States | | | 1,000,000 | | | | | 992,450 | |
c,nDryden 42 Senior Loan Fund,2016-42A, CR, 144A, FRN, 4.051%,(3-month USD LIBOR + 2.05%), 7/15/30 | | | United States | | | 900,000 | | | | | 874,413 | |
c,mEuro-Galaxy III CLO BV,2013-3A, B2ER, 144A, FRN, 1.50%, 1/17/31 | | | Netherlands | | | 250,000 | | EUR | | | 280,382 | |
FHLMC Structured Agency Credit Risk Debt Notes, | | | | | | | | | | | | |
n2016-DNA2, M3, FRN, 6.442%,(1-month USD LIBOR + 4.65%), 10/25/28 | | | United States | | | 933,071 | | | | | 1,005,687 | |
n2016-HQA2, M3, FRN, 6.942%,(1-month USD LIBOR + 5.15%), 11/25/28 | | | United States | | | 750,000 | | | | | 820,881 | |
m2017-DNA2, M2, FRN, 5.242%, 10/25/29 | | | United States | | | 1,000,000 | | | | | 1,066,228 | |
FRANKLIN TEMPLETON VARIABLE INSURANCE PRODUCTS TRUST
STATEMENT OF INVESTMENTS
Franklin Allocation VIP Fund(continued)
| | | | | | | | | | | | |
| | | Country/
Organization | | | Principal
Amount* | | | | Value | |
| | | | |
Asset-Backed Securities and Commercial Mortgage-Backed
Securities (continued) | | | | | | | | | | | | |
Diversified Financials(continued) | | | | | | | | | | | | |
FHLMC Structured Agency Credit Risk Debt Notes, (continued) | | | | | | | | | | | | |
n2017-DNA3, M2, FRN, 4.292%,(1-month USD LIBOR + 2.50%), 3/25/30 | | | United States | | | 1,000,000 | | | | $ | 1,024,427 | |
FNMA Connecticut Avenue Securities, | | | | | | | | | | | | |
n2013-C01, M2, FRN, 7.042%,(1-month USD LIBOR + 5.25%), 10/25/23 | | | United States | | | 786,889 | | | | | 869,083 | |
n2014-C01, M2, FRN, 6.192%,(1-month USD LIBOR + 4.40%), 1/25/24 | | | United States | | | 950,412 | | | | | 1,033,584 | |
n2014-C03, 1M2, FRN, 4.792%,(1-month USD LIBOR + 3.00%), 7/25/24 | | | United States | | | 1,325,629 | | | | | 1,395,444 | |
n2014-C04, 2M2, FRN, 6.792%,(1-month USD LIBOR + 5.00%), 11/25/24 | | | United States | | | 1,062,934 | | | | | 1,149,298 | |
m2016-C02, 1M2, FRN, 7.792%, 9/25/28 | | | United States | | | 817,462 | | | | | 900,251 | |
m2016-C04, 1M2, FRN, 6.042%, 1/25/29 | | | United States | | | 1,000,000 | | | | | 1,064,105 | |
m2016-C05, 2M2, FRN, 6.242%, 1/25/29 | | | United States | | | 350,003 | | | | | 370,055 | |
m2016-C06, 1M2, FRN, 6.042%, 4/25/29 | | | United States | | | 180,000 | | | | | 193,499 | |
n2017-C01, 1M2, FRN, 5.342%,(1-month USD LIBOR + 3.55%), 7/25/29 | | | United States | | | 1,000,000 | | | | | 1,059,120 | |
m2017-C03, 1M2, FRN, 4.792%, 10/25/29 | | | United States | | | 1,000,000 | | | | | 1,045,587 | |
m2017-C05, 1M2, FRN, 3.992%, 1/25/30 | | | United States | | | 1,000,000 | | | | | 1,018,011 | |
c,mHolland Park CLO DAC, 1A, A1RR, 144A, FRN, 0.92%, 11/14/32 | | | Ireland | | | 1,300,000 | | EUR | | | 1,451,838 | |
c,nLCM XXV Ltd., 25A, B2, 144A, FRN, 3.616%,(3-month USD LIBOR + 1.65%), 7/20/30 | | | United States | | | 1,200,000 | | | | | 1,189,452 | |
c,m Madison Park Euro Funding VIII DAC, | | | | | | | | | | | | |
8A, ARN, 144A, FRN, 0.95%, 4/15/32 | | | Ireland | | | 1,100,000 | | EUR | | | 1,232,498 | |
8A, BRN, 144A, FRN, 1.70%, 4/15/32 | | | Ireland | | | 300,000 | | EUR | | | 336,148 | |
c,mMadison Park Euro Funding XIV DAC, 2014A, A1N, 144A, FRN, 1.12%, 7/15/32 | | | Ireland | | | 250,000 | | EUR | | | 281,522 | |
c,nMadison Park Funding XI Ltd.,2013-11, CR, 144A, FRN, 4.134%,(3-month USD LIBOR + 2.20%), 7/23/29 | | | United States | | | 1,000,000 | | | | | 978,990 | |
c,nMadison Park Funding XXVI Ltd.,2017-26A, AR, 144A, FRN, 3.128%,(3-month USD LIBOR + 1.20%), 7/29/30 | | | United States | | | 2,350,000 | | | | | 2,351,081 | |
c,mMill City Mortgage Loan Trust,2018-2, A1, 144A, FRN, 3.50%, 5/25/58 | | | United States | | | 1,085,169 | | | | | 1,110,089 | |
c,mNeuberger Berman CLO XVIII Ltd.,2014-18A, CR2, 144A, FRN, 4.966%, 10/21/30 | | | United States | | | 800,000 | | | | | 775,056 | |
c,mOctagon Investment Partners18-R Ltd.,2018-18A, A1A, 144A, FRN, 2.961%, 4/16/31 | | | United States | | | 1,000,000 | | | | | 991,520 | |
c,mOctagon Investment Partners 28 Ltd.,2016-1A, BR, 144A, FRN, 3.736%, 10/24/30 | | | United States | | | 1,200,000 | | | | | 1,202,676 | |
c,nOctagon Investment Partners XVI Ltd.,2013-1A, CR, 144A, FRN, 3.852%,(3-month USD LIBOR + 1.85%), 7/17/30 | | | United States | | | 850,000 | | | | | 812,634 | |
c,mProvident Funding Mortgage Trust,2019-1, A2, 144A, FRN, 3.00%, 12/25/49 | | | United States | | | 319,498 | | | | | 321,981 | |
FRANKLIN TEMPLETON VARIABLE INSURANCE PRODUCTS TRUST
STATEMENT OF INVESTMENTS
Franklin Allocation VIP Fund(continued)
| | | | | | | | | | |
| | | Country/
Organization | | Principal
Amount* | | | | Value | |
| | | | |
Asset-Backed Securities and Commercial Mortgage-
Backed Securities (continued) | | | | | | | | | | |
Diversified Financials(continued) | | | | | | | | | | |
c,m Towd Point Mortgage Trust, | | | | | | | | | | |
2015-5, A1B, 144A, FRN, 2.75%, 5/25/55 | | United States | | 617,337 | | | | $ | 618,380 | |
2018-1, A1, 144A, FRN, 3.00%, 1/25/58 | | United States | | 1,299,226 | | | | | 1,315,788 | |
2018-3, A1, 144A, FRN, 3.75%, 5/25/58 | | United States | | 980,580 | | | | | 1,019,423 | |
| | | | | | | | | | |
| | | | |
Total Asset-Backed Securities and Commercial Mortgage-Backed Securities (Cost $52,451,707) | | | | | | | | | 52,293,180 | |
| | | | | | | | | | |
| | | | |
Mortgage-Backed Securities 11.0% | | | | | | | | | | |
Federal Home Loan Mortgage Corp. (FHLMC) Fixed Rate 2.5% | | | | | | | | | | |
oFHLMC 15 Year, 2.50%, 12/01/34 | | United States | | 200,000 | | | | | 201,706 | |
FHLMC 30 Year, 2.50%, 10/01/49 | | United States | | 1,299,871 | | | | | 1,285,190 | |
oFHLMC 30 Year, 2.50%, 12/01/49 | | United States | | 1,050,000 | | | | | 1,037,685 | |
FHLMC 30 Year, 3.00%, 12/01/49 | | United States | | 568,164 | | | | | 576,345 | |
oFHLMC 30 Year, 3.00%, 12/01/49 | | United States | | 10,150,000 | | | | | 10,288,346 | |
FHLMC 30 Year, 4.00%, 7/01/49 | | United States | | 2,520,279 | | | | | 2,620,674 | |
FHLMC 30 Year, 4.00%, 8/01/49 | | United States | | 2,580,628 | | | | | 2,683,550 | |
FHLMC Gold 30 Year, 3.50%, 5/01/49 | | United States | | 1,633,607 | | | | | 1,679,875 | |
| | | | | | | | | | |
| | | | |
| | | | | | | | | 20,373,371 | |
| | | | | | | | | | |
Federal National Mortgage Association (FNMA) Fixed Rate 1.4% | | | | | | | | | | |
FNMA 15 Year, 2.50%, 12/01/34 | | United States | | 1,490,144 | | | | | 1,503,248 | |
FNMA 30 Year, 3.00%, 5/01/49 | | United States | | 5,448,329 | | | | | 5,530,308 | |
FNMA 30 Year, 3.00%, 10/01/49 - 12/01/49 | | United States | | 1,319,097 | | | | | 1,337,852 | |
FNMA 30 Year, 3.50%, 6/01/49 | | United States | | 2,204,490 | | | | | 2,265,474 | |
FNMA 30 Year, 4.00%, 1/01/50 | | United States | | 1,128,000 | | | | | 1,179,743 | |
| | | | | | | | | | |
| | | | |
| | | | | | | | | 11,816,625 | |
| | | | | | | | | | |
Government National Mortgage Association (GNMA) Fixed Rate 7.1% | | | | | | | | | | |
GNMA II SF 30 Year, 3.00%, 9/20/47 | | United States | | 2,676,218 | | | | | 2,758,072 | |
GNMA II SF 30 Year, 3.00%, 11/20/47 - 4/20/49 | | United States | | 1,366,960 | | | | | 1,405,740 | |
GNMA II SF 30 Year, 3.50%, 5/20/49 | | United States | | 12,598,092 | | | | | 12,991,760 | |
GNMA II SF 30 Year, 3.50%, 10/20/49 | | United States | | 12,744,821 | | | | | 13,180,047 | |
GNMA II SF 30 Year, 3.50%, 11/20/49 | | United States | | 5,608,149 | | | | | 5,811,006 | |
oGNMA II SF 30 Year, 3.50%, 12/01/49 | | United States | | 2,350,000 | | | | | 2,421,709 | |
GNMA II SF 30 Year, 3.50%, 12/20/49 | | United States | | 5,780,000 | | | | | 5,989,074 | |
GNMA II SF 30 Year, 4.00%, 11/20/49 | | United States | | 4,929,855 | | | | | 5,143,730 | |
GNMA II SF 30 Year, 4.00%, 12/20/49 | | United States | | 2,860,000 | | | | | 2,988,439 | |
GNMA II SF 30 Year, 4.50%, 5/20/49 | | United States | | 2,235,371 | | | | | 2,336,484 | |
GNMA II SF 30 Year, 5.00%, 3/20/49 | | United States | | 2,176,907 | | | | | 2,292,368 | |
| | | | | | | | | | |
| | | | |
| | | | | | | | | 57,318,429 | |
| | | | | | | | | | |
Total Mortgage-Backed Securities (Cost $89,128,660) | | | | | | | | | 89,508,425 | |
| | | | | | | | | | |
FRANKLIN TEMPLETON VARIABLE INSURANCE PRODUCTS TRUST
STATEMENT OF INVESTMENTS
Franklin Allocation VIP Fund(continued)
| | | | | | | | | | |
| | | Country/ Organization | | Principal
Amount* | | | | Value | |
| | | | |
Municipal Bonds 1.0% | | | | | | | | | | |
Birmingham Water Works Board Water Revenue, Senior, Refunding, 3.573%, 1/01/45 | | United States | | 530,000 | | | | | $ 536,826 | |
Board of Regents of the Texas A & M University System Revenue, Permanent University Fund, Refunding, 3.10%, 7/01/49 | | United States | | 355,000 | | | | | 346,313 | |
Broward County Airport System Revenue, Refunding, Series C, 3.477%, 10/01/43 | | United States | | 140,000 | | | | | 140,738 | |
California Health Facilities Financing Authority Revenue, | | | | | | | | | | |
Senior, 2.934%, 6/01/32 | | United States | | 135,000 | | | | | 134,679 | |
Senior, 2.984%, 6/01/33 | | United States | | 115,000 | | | | | 114,205 | |
Senior, 3.034%, 6/01/34 | | United States | | 90,000 | | | | | 89,334 | |
City of Austin Electric Utility System Revenue, Travis and Williamson Counties, Refunding, 6.262%, 11/15/32. | | United States | | 270,000 | | | | | 333,814 | |
Foothill/Eastern Transportation Corridor Agency Toll Road Revenue, Refunding, Series A, 4.094%, 1/15/49 | | United States | | 70,000 | | | | | 70,000 | |
Gilroy USD, GO, Santa Clara County, Refunding, 3.364%, 8/01/47 | | United States | | 290,000 | | | | | 284,719 | |
Greenville City School District GO, County of Darke, School Improvement, Refunding, 3.541%, 1/01/51 | | United States | | 330,000 | | | | | 323,750 | |
Honolulu City and County Wastewater System Revenue, Second Bond Resolution, Refunding, Junior, Series B, 2.585%, 7/01/28 | | United States | | 50,000 | | | | | 50,777 | |
Kaiser Foundation Hospitals, 3.266%, 11/01/49 | | United States | | 445,000 | | | | | 447,904 | |
Massachusetts State College Building Authority Revenue, Refunding, Series C, 3.373%, 5/01/43 | | United States | | 230,000 | | | | | 226,900 | |
Massachusetts State School Building Authority Dedicated Sales Tax Revenue, Subordinated, Refunding, Series B, 3.395%, 10/15/40 | | United States | | 265,000 | | | | | 265,170 | |
Metro Wastewater Reclamation District Sewer Revenue, Refunding, Series B, 3.158%, 4/01/41 | | United States | | 220,000 | | | | | 218,409 | |
Metropolitan St. Louis Sewer District Wastewater System Revenue, Refunding, Series C, 3.259%, 5/01/45 | | United States | | 635,000 | | | | | 635,730 | |
New Jersey State Transportation Trust Fund Authority Revenue, Transportation System, Series B, 4.131%, 6/15/42 | | United States | | 160,000 | | | | | 158,928 | |
New York State Dormitory Authority Revenues, Non State Supported Debt, State University of New York Dormitory Facilities, Series B, 3.142%, 7/01/43 | | United States | | 140,000 | | | | | 138,988 | |
New York State GO, Refunding, Series B, 3.20%, 2/15/39 | | United States | | 530,000 | | | | | 530,583 | |
New York State Urban Development Corp. Sales Tax Revenue, Bidding Group 2,
Series B, 2.97%, 3/15/34 | | United States | | 865,000 | | | | | 863,642 | |
Ohio State Hospital Facility Revenue, Cleveland Clinic Health System Obligated Group, Refunding, Series G, 3.276%, 1/01/42 | | United States | | 90,000 | | | | | 90,584 | |
Oregon State Department of Transportation Highway User Tax Revenue, senior lien, Refunding, Series B, 3.168%, 11/15/38 | | United States | | 175,000 | | | | | 174,494 | |
Pennsylvania State Turnpike Commission Turnpike Revenue, Motor License Fund-Enhanced, Subordinate, Refunding, First Series, 3.579%, 12/01/43 | | United States | | 440,000 | | | | | 439,472 | |
Regional Transportation District Sales Tax Revenue, Fastracks Project, Refunding, Series A, 3.258%, 11/01/38 | | United States | | 140,000 | | | | | 140,223 | |
RWJ Barnabas Health Inc., 3.477%, 7/01/49 | | United States | | 120,000 | | | | | 118,515 | |
Salt Lake City Sales and Excise Tax Revenue, Refunding, Series B, 3.102%, 4/01/38 | | United States | | 125,000 | | | | | 122,386 | |
San Bernardino Community College District GO, Election of 2018, SeriesA-1, 3.271%, 8/01/39 | | United States | | 100,000 | | | | | 98,989 | |
San Diego County Regional Transportation Commission Revenue, Refunding, 3.248%, 4/01/48 | | United States | | 105,000 | | | | | 105,140 | |
FRANKLIN TEMPLETON VARIABLE INSURANCE PRODUCTS TRUST
STATEMENT OF INVESTMENTS
Franklin Allocation VIP Fund(continued)
| | | | | | | | | | |
| | | Country/ Organization | | Principal
Amount* | | | | Value | |
| | | | |
| Municipal Bonds(continued) | | | | | | | | | | |
pSan Francisco City and County Public Utilities Commission Water Revenue, Refunding, 3.473%, 11/01/43 | | United States | | 105,000 | | | | $ | 104,971 | |
Texas State GO, Transportation Commission, Highway Improvement, Refunding, 3.211%, 4/01/44 | | United States | | 265,000 | | | | | 267,859 | |
| | | | |
Texas State University System Financing Revenue, | | | | | | | | | | |
Refunding, Series B, 2.938%, 3/15/33 | | United States | | 105,000 | | | | | 105,548 | |
Refunding, Serise B, 3.289%, 3/15/40 | | United States | | 90,000 | | | | | 89,138 | |
University of Pittsburgh of the Commonwealth System of Higher Education Revenue, Refunding, Series C, 3.005%, 9/15/41 | | United States | | 250,000 | | | | | 245,163 | |
Utah Transit Authority Sales Tax Revenue, Refunding, Series B, 3.443%, 12/15/42 | | United States | | 175,000 | | | | | 177,819 | |
| | | | | | | | | | |
| | | | |
Total Municipal Bonds (Cost $8,201,359) | | | | | | | | | 8,191,710 | |
| | | | | | | | | | |
| | | | |
Total Investments before Short Term Investments
(Cost $755,543,115) | | | | | | | | | 795,989,765 | |
| | | | | | | | | | |
| | | | |
| | | | | Shares | | | | | |
| | | | |
Short Term Investments (Cost $21,473,752) 2.6% | | | | | | | | | | |
| | | | |
Money Market Funds 2.6% | | | | | | | | | | |
b,qInstitutional Fiduciary Trust Money Market Portfolio, 1.26% | | United States | | 21,473,752 | | | | | 21,473,752 | |
| | | | | | | | | | |
Total Investments (Cost $777,016,867) 100.8% | | | | | | | | | 817,463,517 | |
| | | | |
Other Assets, less Liabilities (0.8)% | | | | | | | | | (6,888,490 | ) |
| | | | | | | | | | |
| | | | |
Net Assets 100.0% | | | | | | | | $ | 810,575,027 | |
| | | | | | | | | | |
FRANKLIN TEMPLETON VARIABLE INSURANCE PRODUCTS TRUST
STATEMENT OF INVESTMENTS
Franklin Allocation VIP Fund(continued)
†Rounds to less than 0.1% of net assets.
*The principal amount is stated in U.S. dollars unless otherwise indicated.
aNon-income producing.
bSee Note 3(e) regarding investments in affiliated management investment companies.
cSecurity was purchased pursuant to Rule 144A under the Securities Act of 1933 and may be sold in transactions exempt from registration only to qualified institutional buyers or in a public offering registered under the Securities Act of 1933. At December 31, 2019, the aggregate value of these securities was $62,104,962, representing 7.7% of net assets.
dSecurity was purchased pursuant to Regulation S under the Securities Act of 1933, which exempts from registration securities offered and sold outside of the United States. Such a security cannot be sold in the United States without either an effective registration statement filed pursuant to the Securities Act of 1933, or pursuant to an exemption from registration. At December 31, 2019, the aggregate value of these securities was $3,643,272, representing 0.4% of net assets.
eThe coupon rate shown represents the rate at period end.
fSee Note 1(e) regarding loan participation notes.
gSee Note 1(g) regarding senior floating rate interests.
hSecurity purchased on a delayed delivery basis. See Note 1(c).
iA portion or all of the security represents an unsettled loan commitment. The coupon rate isto-be determined (TBD) at the time of settlement and will be based upon a reference index/floor plus a spread.
jA supranational organization is an entity formed by two or more central governments through international treaties.
kPrincipal amount of security is adjusted for inflation. See Note 1(i).
lA portion or all of the security has been segregated as collateral for open swap contracts. At December 31, 2019, the value of this security and/or cash pledged amounted to $370,041, representing less than 0.1% of net assets.
mAdjustable rate security with an interest rate that is not based on a published reference index and spread. The rate is based on the structure of the agreement and current market conditions. The coupon rate shown represents the rate at period end.
nThe coupon rate shown represents the rate inclusive of any caps or floors, if applicable, in effect at period end.
oSecurity purchased on ato-be-announced (TBA) basis. See Note 1(c).
pSecurity purchased on a when-issued basis. See Note 1(c).
qThe rate shown is the annualizedseven-day effective yield at period end.
At December 31, 2019, the Fund had the following futures contracts outstanding. See Note 1(d).
Futures Contracts
| | | | | | | | | | | | | | | | | | | | |
| Description | | Type | | | Number of
Contracts | | | Notional
Amount* | | | Expiration
Date | | | Value/
Unrealized
Appreciation
(Depreciation) | |
| | | | | |
Equity Contracts | | | | | | | | | | | | | | | | | | | | |
S&P 500E-Mini | | | Long | | | | 17 | | | | $ 2,746,435 | | | | 3/20/20 | | | | $ 46,722 | |
| | | | | | | | | | | | | | | | | | | | |
| | | | | |
Interest Rate Contracts | | | | | | | | | | | | | | | | | | | | |
Australian 3 Yr. Bond | | | Long | | | | 45 | | | | 3,631,470 | | | | 3/16/20 | | | | (19,077 | ) |
Australian 10 Yr. Bond | | | Long | | | | 27 | | | | 2,708,278 | | | | 3/16/20 | | | | (38,480 | ) |
Canada 10 Yr. Bond | | | Long | | | | 33 | | | | 3,493,639 | | | | 3/20/20 | | | | (64,847 | ) |
CME Ultra Long Term U.S. Treasury Bond | | | Long | | | | 22 | | | | 3,996,438 | | | | 3/20/20 | | | | (145,954 | ) |
Euro-BTP. | | | Long | | | | 15 | | | | 2,396,427 | | | | 3/06/20 | | | | 8,932 | |
Euro-Bund | | | Long | | | | 3 | | | | 573,588 | | | | 3/06/20 | | | | (4,847 | ) |
Euro-OAT. | | | Short | | | | 11 | | | | 2,007,923 | | | | 3/06/20 | | | | 14,054 | |
U.S. Treasury 2 Yr. Note | | | Long | | | | 8 | | | | 1,724,000 | | | | 3/31/20 | | | | (135 | ) |
U.S. Treasury 5 Yr. Note | | | Long | | | | 83 | | | | 9,844,578 | | | | 3/31/20 | | | | (31,231 | ) |
U.S. Treasury 10 Yr. Note | | | Long | | | | 15 | | | | 1,926,328 | | | | 3/20/20 | | | | (24,868 | ) |
U.S. Treasury 10 Yr. Note | | | Long | | | | 12 | | | | 1,541,063 | | | | 3/20/20 | | | | 12,674 | |
Ultra 10 Yr. U.S. Treasury Note | | | Short | | | | 21 | | | | 2,954,766 | | | | 3/20/20 | | | | 36,721 | |
| | | | | | | | | | | | | | | | | | | | |
| | | | | |
| | | | | | | | | | | $26,873,120 | | | | | | | | $(257,058 | ) |
| | | | | | | | | | | | | | | | | | | | |
| | | | | |
Total Futures Contracts. | | | | | | | | | | | $29,619,555 | | | | | | | | $(210,336 | ) |
| | | | | | | | | | | | | | | | | | | | |
FRANKLIN TEMPLETON VARIABLE INSURANCE PRODUCTS TRUST
STATEMENT OF INVESTMENTS
Franklin Allocation VIP Fund(continued)
Futures Contracts(continued)
*As of period end.
At December 31, 2019, the Fund had the following forward exchange contracts outstanding. See Note 1(d).
Forward Exchange Contracts
| | | | | | | | | | | | | | | | | | | | | | | | |
| Currency | | Counterpartya | | Type | | Quantity | | | Contract
Amount | | | Settlement
Date | | | Unrealized
Appreciation | | | Unrealized
Depreciation | |
| | | | | | | |
OTC Forward Exchange Contracts | | | | | | | | | | | | | | | | | | | | | | | | |
Australian Dollar | | JPHQ | | Sell | | | 1,100,000 | | | $ | 742,263 | | | | 1/09/20 | | | $ | — | | | $ | (29,732 | ) |
Australian Dollar | | JPHQ | | Sell | | | 390,000 | | | | 265,883 | | | | 1/28/20 | | | | — | | | | (7,960 | ) |
Japanese Yen | | JPHQ | | Buy | | | 239,900,000 | | | | 2,271,551 | | | | 1/29/20 | | | | — | | | | (60,424 | ) |
Canadian Dollar | | JPHQ | | Sell | | | 430,000 | | | | 323,998 | | | | 1/30/20 | | | | — | | | | (7,181 | ) |
Danish Krone | | JPHQ | | Sell | | | 7,518,245 | | | | 1,133,196 | | | | 1/30/20 | | | | 2,497 | | | | — | |
Euro | | JPHQ | | Buy | | | 2,000,000 | | | | 2,226,114 | | | | 1/30/20 | | | | 21,108 | | | | — | |
Euro | | JPHQ | | Sell | | | 1,933,997 | | | | 2,150,919 | | | | 1/30/20 | | | | — | | | | (22,141 | ) |
Euro | | JPHQ | | Sell | | | 2,180,769 | | | | 2,465,161 | | | | 1/30/20 | | | | 14,825 | | | | — | |
Mexican Peso | | JPHQ | | Buy | | | 6,950,000 | | | | 344,426 | | | | 1/30/20 | | | | 21,144 | | | | — | |
Norwegian Krone | | JPHQ | | Buy | | | 6,740,000 | | | | 748,609 | | | | 1/30/20 | | | | 19,370 | | | | — | |
Chinese Yuan Renminbi | | JPHQ | | Sell | | | 5,095,000 | | | | 717,687 | | | | 2/24/20 | | | | — | | | | (13,261 | ) |
Japanese Yen | | JPHQ | | Buy | | | 70,500,000 | | | | 663,320 | | | | 3/13/20 | | | | — | | | | (11,889 | ) |
Canadian Dollar | | JPHQ | | Sell | | | 1,450,000 | | | | 1,101,825 | | | | 3/16/20 | | | | — | | | | (15,059 | ) |
Euro | | JPHQ | | Sell | | | 1,504,009 | | | | 1,682,043 | | | | 3/16/20 | | | | — | | | | (12,704 | ) |
Norwegian Krone | | JPHQ | | Buy | | | 7,680,000 | | | | 857,622 | | | | 3/16/20 | | | | 17,541 | | | | — | |
Swedish Krona | | JPHQ | | Buy | | | 5,530,000 | | | | 564,202 | | | | 3/16/20 | | | | 28,384 | | | | — | |
Swedish Krona | | JPHQ | | Sell | | | 5,530,000 | | | | 581,408 | | | | 3/16/20 | | | | — | | | | (11,178 | ) |
South Korean Won | | JPHQ | | Sell | | | 467,500,000 | | | | 392,956 | | | | 3/25/20 | | | | — | | | | (12,549 | ) |
Turkish Lira | | JPHQ | | Buy | | | 1,380,000 | | | | 218,822 | | | | 4/15/20 | | | | 6,934 | | | | — | |
Indonesian Rupiah | | JPHQ | | Buy | | | 4,950,000,000 | | | | 345,598 | | | | 6/15/20 | | | | 6,240 | | | | — | |
| | | | | | | | | | | | | | | | | | | | |
| | | | | | |
Total Forward Exchange Contracts | | | | | | | | | | | | | | | | $ | 138,043 | | | $ | (204,078 | ) |
| | | | | | | | | | | | | | | | | | | | |
| | | | | | |
Net unrealized appreciation (depreciation) | | | | | | | | | | | | | | | | | | | | $ | (66,035 | ) |
| | | | | | | | | | | | | | | | | | | | | | | | |
aMay be comprised of multiple contracts with the same counterparty, currency and settlement date.
At December 31, 2019, the Fund had the following credit default swap contracts outstanding. See Note 1(d).
Credit Default Swap Contracts
| | | | | | | | | | | | | | | | | | | | | | | | | | | | | | | | | | | | |
| Description | | Periodic
Payment Rate
Received
(Paid) | | | Payment
Frequency | | | Counter-
party | | | Maturity
Date | | | Notional
Amounta | | | Value | | | Unamortized
Upfront
Payments
(Receipts) | | | Unrealized
Appreciation
(Depreciation) | | | Ratingb
| |
| | | | | | | | | |
OTC Swap Contracts | | | | | | | | | | | | | | | | | | | | | | | | | | | | | | | | | | | | |
Contracts to Buy Protectionc | | | | | | | | | | | | | | | | | | | | | | | | | | | | | | | | | | | | |
Single Name | | | | | | | | | | | | | | | | | | | | | | | | | | | | | | | | | | | | |
Avon Products Inc. | | | (5.00)% | | | | Quarterly | | | | CITI | | | | 3/20/23 | | | $ | 260,000 | | | $ | (35,871 | ) | | $ | (24,349 | ) | | $ | (11,522 | ) | | | | |
Contracts to Sell Protectionc,d | | | | | | | | | | | | | | | | | | | | | | | | | | | | | | | | | | | | |
Single Name | | | | | | | | | | | | | | | | | | | | | | | | | | | | | | | | | | | | |
Government of Argentina | | | 5.00% | | | | Quarterly | | | | CITI | | | | 12/20/21 | | | | 550,000 | | | | (298,724 | ) | | | (284,938 | ) | | | (13,786 | ) | | | CC | |
FRANKLIN TEMPLETON VARIABLE INSURANCE PRODUCTS TRUST
STATEMENT OF INVESTMENTS
Franklin Allocation VIP Fund(continued)
Credit Default Swap Contracts(continued)
| | | | | | | | | | | | | | | | | | | | | | | | | | | | | | | | | | | | |
| Description | | Periodic
Payment Rate
Received
(Paid) | | | Payment
Frequency | | | Counter-
party | | | Maturity
Date | | | Notional
Amounta | | | Value | | | Unamortized
Upfront
Payments
(Receipts) | | | Unrealized
Appreciation
(Depreciation) | | | Ratingb | |
| | | | | | | | | |
OTC Swap Contracts(continued) | | | | | | | | | | | | | | | | | | | | | | | | | | | | | | | | | | | | |
Contracts to Sell Protectionc,d(continued) | | | | | | | | | | | | | | | | | | | | | | | | | | | | | | | | | | | | |
Single Name(continued) | | | | | | | | | | | | | | | | | | | | | | | | | | | | | | | | | | | | |
Government of Russia | | | 1.00% | | | | Quarterly | | | | CITI | | | | 12/20/24 | | | $ | 300,000 | | | $ | 6,442 | | | $ | 2,958 | | | $ | 3,484 | | | | BBB- | |
Traded Index | | | | | | | | | | | | | | | | | | | | | | | | | | | | | | | | | | | | |
eCitibank Bespoke Phoenix Index, Mezzanine Tranche5-7% | | | 2.90% | | | | Quarterly | | | | CITI | | | | 12/20/21 | | | | 250,000 | | | | 8,235 | | | | — | | | | 8,235 | | |
| Non-
Investment
Grade |
|
| | | | | | | | | | | | | | | | | | | | | | | | | | | | |
| | | | | | | | | |
Total Credit Default Swap Contracts | | | | | | | | | | | | | | | | | | | | | | $ | (319,918 | ) | | $ | (306,329 | ) | | $ | (13,589 | ) | | | | |
| | | | | | | | | | | | | | | | | | | | | | | | | | | | |
aFor contracts to sell protection, the notional amount is equal to the maximum potential amount of the future payments and no recourse provisions have been entered into in association with the contracts.
bBased on Standard and Poor’s (S&P) Rating for single name swaps. Internal ratings based on mapping into equivalent ratings from external vendors.
cPerformance triggers for settlement of contract include default, bankruptcy or restructuring for single name swaps and failure to pay or bankruptcy of the underlying securities for traded index swaps.
dThe fund enters contracts to sell protection to create a long credit position.
eRepresents a custom index comprised of a basket of underlying instruments.
At December 31, 2019, the Fund had the following cross-currency swap contracts outstanding. See Note 1(d).
Cross-Currency Swap Contracts
| | | | | | | | | | | | | | | | | | | | | | | | |
| Description | | Payment
Frequency | | | Coun- terparty | | | Maturity
Date | | | Notional
Amount | | | | | | Value/
Unrealized
Appreciation
(Depreciation) | |
| | | | | | |
OTC Swap Contracts | | | | | | | | | | | | | | | | | | | | | | | | |
Receive Floating3-month USD LIBOR + 1.334% | | | Quarterly | | | | | | | | | | | | 280,000 | | | | USD | | | | | |
Pay Floating3-month EUR LIBOR + 1.12% | | | Quarterly | | | | CITI | | | | 7/10/21 | | | | 250,000 | | | | EUR | | | $ | 1,078 | |
Receive Floating3-month USD LIBOR + 1.305% | | | Quarterly | | | | | | | | | | | | 387,450 | | | | USD | | | | | |
Pay Floating3-month EUR LIBOR + 1.11% | | | Quarterly | | | | JPHQ | | | | 8/20/21 | | | | 350,000 | | | | EUR | | | | (3,950 | ) |
Receive Floating3-month USD LIBOR + 1.23% | | | Quarterly | | | | | | | | | | | | 277,500 | | | | USD | | | | | |
Pay Floating3-month EUR LIBOR + 1.07% | | | Quarterly | | | | CITI | | | | 9/17/21 | | | | 250,000 | | | | EUR | | | | (2,704 | ) |
Receive Floating3-month USD LIBOR + 1.87% | | | Quarterly | | | | | | | | | | | | 275,000 | | | | USD | | | | | |
Pay Floating3-month EUR LIBOR + 1.70% | | | Quarterly | | | | CITI | | | | 10/15/21 | | | | 250,000 | | | | EUR | | | | (4,333 | ) |
Receive Floating3-month USD LIBOR + 1.25% | | | Quarterly | | | | | | | | | | | | 1,221,000 | | | | USD | | | | | |
Pay Floating3-month EUR LIBOR + 1.10% | | | Quarterly | | | | CITI | | | | 10/30/21 | | | | 1,100,000 | | | | EUR | | | | (8,836 | ) |
Receive Floating3-month USD LIBOR + 1.175% | | | Quarterly | | | | | | | | | | | | 1,436,500 | | | | USD | | | | | |
Pay Floating3-month EUR LIBOR + 1.05% | | | Quarterly | | | | CITI | | | | 11/22/21 | | | | 1,300,000 | | | | EUR | | | | (19,885 | ) |
Receive Floating3-month USD LIBOR + 1.17% | | | Quarterly | | | | | | | | | | | | 832,500 | | | | USD | | | | | |
Pay Floating3-month EUR LIBOR + 1.05% | | | Quarterly | | | | CITI | | | | 11/29/21 | | | | 750,000 | | | | EUR | | | | (8,004 | ) |
Receive Floating3-month USD LIBOR + 1.174% | | | Quarterly | | | | | | | | | | | | 1,554,000 | | | | USD | | | | | |
Pay Floating3-month EUR LIBOR + 1.05% | | | Quarterly | | | | CITI | | | | 12/10/21 | | | | 1,400,000 | | | | EUR | | | | (15,818 | ) |
FRANKLIN TEMPLETON VARIABLE INSURANCE PRODUCTS TRUST
STATEMENT OF INVESTMENTS
Franklin Allocation VIP Fund(continued)
Cross-Currency Swap Contracts(continued)
| | | | | | | | | | | | | | | | | | | | | | | | |
| Description | | Payment
Frequency | | | Coun- terparty | | | Maturity
Date | | | Notional
Amount | | | | | | Value/
Unrealized
Appreciation
(Depreciation) | |
| | | | | | |
OTC Swap Contracts(continued) | | | | | | | | | | | | | | | | | | | | | | | | |
Receive Floating3-month USD LIBOR + 1.318% | | | Quarterly | | | | | | | | | | | | 943,500 | | | | USD | | | | | |
Pay Floating3-month EUR LIBOR + 1.20% | | | Quarterly | | | | CITI | | | | 12/12/21 | | | | 850,000 | | | | EUR | | | | $ (9,986 | ) |
| | | | | | | | | | | | | | | | | | | | | | | | |
| | | | | | |
Total Cross Currency Swap Contracts | | | | | | | | | | | | | | | | | | | | | | | $(72,438 | ) |
| | | | | | | | | | | | | | | | | | | | | | | | |
At December 31, 2019, the Fund had the following interest rate swap contracts outstanding. See Note 1(d).
Interest Rate Swap Contracts
| | | | | | | | | | | | | | | | |
| Description | | Payment
Frequency | | | Maturity
Date | | | Notional
Amount* | | | Value/
Unrealized
Appreciation
(Depreciation) | |
| | | | |
Centrally Cleared Swap Contracts | | | | | | | | | | | | | | | | |
Receive Fixed 2.773% | | | Quarterly | | | | | | | | | | | | | |
Pay Floating3-month CNY CNRR | | | Quarterly | | | | 8/23/24 | | | | 6,300,000 | CNY | | | $ (6,881 | ) |
Receive Fixed 2.765% | | | Quarterly | | | | | | | | | | | | | |
Pay Floating3-month CNY CNRR | | | Quarterly | | | | 8/26/24 | | | | 5,100,000 | CNY | | | (5,075 | ) |
Receive Fixed 2.79% | | | Quarterly | | | | | | | | | | | | | |
Pay Floating3-month CNY CNRR | | | Quarterly | | | | 8/30/24 | | | | 8,000,000 | CNY | | | (6,643 | ) |
Receive Fixed 2.745% | | | Quarterly | | | | | | | | | | | | | |
Pay Floating3-month CNY CNRR | | | Quarterly | | | | 9/06/24 | | | | 5,350,000 | CNY | | | (5,995 | ) |
| | | | | | | | | | | | | | | | |
| | | | |
Total Interest Rate Swap Contracts | | | | | | | | | | | | | | | $(24,594 | ) |
| | | | | | | | | | | | | | | | |
*In U.S. dollars unless otherwise indicated.
At December 31, 2019, the Fund had the following inflation index swap contracts outstanding. See Note 1(d).
Inflation Index Swap Contracts
| | | | | | | | | | | | | | | | |
| Description | | Payment
Frequency | | | Maturity
Date | | | Notional
Amount | | | Value/
Unrealized
Appreciaton
(Depreciation) | |
| | | | |
Centrally Cleared Swap Contracts | | | | | | | | | | | | | | | | |
Receive variable change inUSA-CPI-U | | | At maturity | | | | | | | | | | | | | |
Pay Fixed 1.719% | | | At maturity | | | | 8/14/26 | | | $ | 1,950,000 | | | | $23,779 | |
| | | | | | | | | | | | | | | | |
Total Inflation Index Swap Contracts | | | | | | | | | | | | | | | $23,779 | |
| | | | | | | | | | | | | | | | |
FRANKLIN TEMPLETON VARIABLE INSURANCE PRODUCTS TRUST
STATEMENT OF INVESTMENTS
Franklin Allocation VIP Fund(continued)
At December 31, 2019, the Fund had the following total return swap contracts outstanding. See Note 1(d).
Total Return Swap Contracts
| | | | | | | | | | | | | | | | | | | | | | | | |
| Underlying Instruments | | Financing Rate | | | Payment
Frequency | | | Counter-
party | | | Maturity
Date | | | Notional
Value | | | Value/
Unrealized
Appreciation
(Depreciation) | |
| | | | | | |
OTC Swap Contracts | | | | | | | | | | | | | | | | | | | | | | | | |
Longa | | | | | | | | | | | | | | | | | | | | | | | | |
Markit iBoxx USD Liquid Leveraged Loan Index | | | 3-month USD LIBOR | | | | Quarterly | | | | GSCO | | | | 3/20/20 | | | $ | 1,400,000 | | | | $5,772 | |
| | | | | | | | | | | | | | | | | | | | | | | | |
aThe Fund receives the total return on the underlying instrument and pays a variable financing rate.
See Note 7 regarding other derivative information.
See Abbreviations on pageFFA-59.
| | | | |
| | | |
FFA-40 | | Annual Report | The accompanying notes are an integral part of these financial statements. | | |
FRANKLIN TEMPLETON VARIABLE INSURANCE PRODUCTS TRUST
FINANCIAL STATEMENTS
Statement of Assets and Liabilities
December 31, 2019
| | | | |
| | | Franklin Allocation VIP Fund | |
| |
Assets: | | | | |
Investments in securities: | | | | |
Cost - Unaffiliated issuers | | | $719,782,480 | |
Cost -Non-controlled affiliates (Note 3e) | | | 57,234,387 | |
| | | | |
| |
Value - Unaffiliated issuers | | | $762,976,603 | |
Value -Non-controlled affiliates (Note 3e) | | | 54,486,914 | |
Cash | | | 9,666 | |
Foreign currency, at value (cost $1,484,347) | | | 1,486,973 | |
Receivables: | | | | |
Investment securities sold | | | 5,407,669 | |
Capital shares sold | | | 859,027 | |
Dividends and interest | | | 2,468,752 | |
Deposits with brokers for: | | | | |
OTC derivative contracts | | | 120,000 | |
Futures contracts | | | 427,393 | |
Centrally cleared swap contracts | | | 97,491 | |
Variation margin on centrally cleared swap contracts | | | 2,878 | |
OTC swap contracts (upfront payments $3,122) | | | 2,958 | |
Unrealized appreciation on OTC forward exchange contracts | | | 138,043 | |
Unrealized appreciation on OTC swap contracts | | | 18,569 | |
Other assets | | | 1,020 | |
| | | | |
| |
Total assets | | | 828,503,956 | |
| | | | |
| |
Liabilities: | | | | |
Payables: | | | | |
Investment securities purchased | | | 16,401,222 | |
Capital shares redeemed | | | 238,429 | |
Management fees | | | 309,567 | |
Distribution fees | | | 205,290 | |
Variation margin on futures contracts | | | 50,648 | |
OTC swap contracts (upfront receipts $341,889) | | | 309,287 | |
Unrealized depreciation on OTC forward exchange contracts | | | 204,078 | |
Unrealized depreciation on OTC swap contracts | | | 98,824 | |
Deferred tax | | | 232 | |
Accrued expenses and other liabilities | | | 111,352 | |
| | | | |
| |
Total liabilities | | | 17,928,929 | |
| | | | |
| |
Net assets, at value | | | $810,575,027 | |
| | | | |
| |
Net assets consist of: | | | | |
Paid-in capital | | | $559,631,135 | |
Total distributable earnings (losses) | | | 250,943,892 | |
| | | | |
| |
Net assets, at value | | | $810,575,027 | |
| | | | |
| | | | |
| | | |
| | The accompanying notes are an integral part of these financial statements. | Annual Report | | FFA-41 |
FRANKLIN TEMPLETON VARIABLE INSURANCE PRODUCTS TRUST
FINANCIAL STATEMENTS
Statement of Assets and Liabilities(continued)
December 31, 2019
| | | | |
| | | Franklin Allocation VIP Fund | |
| |
| |
Class 1: | | | | |
Net assets, at value | | $ | 842,031 | |
| | | | |
Shares outstanding | | | 122,683 | |
| | | | |
Net asset value and maximum offering price per share | | | $6.86 | |
| | | | |
Class 2: | | | | |
Net assets, at value | | $ | 403,039,888 | |
| | | | |
Shares outstanding | | | 59,195,689 | |
| | | | |
Net asset value and maximum offering price per share | | | $6.81 | |
| | | | |
Class 4: | | | | |
Net assets, at value | | $ | 406,693,108 | |
| | | | |
Shares outstanding | | | 58,326,520 | |
| | | | |
Net asset value and maximum offering price per share | | | $6.97 | |
| | | | |
| | | | |
| | | |
FFA-42 | | Annual Report | The accompanying notes are an integral part of these financial statements. | | |
FRANKLIN TEMPLETON VARIABLE INSURANCE PRODUCTS TRUST
FINANCIAL STATEMENTS
Statement of Operations
for the year ended December 31, 2019
| | | | |
| | | Franklin Allocation VIP Fund | |
| |
| |
Investment income: | | | | |
Dividends: (net of foreign taxes)* | | | | |
Unaffiliated issuers | | $ | 6,596,821 | |
Non-controlled affiliates (Note 3e) | | | 2,820,935 | |
Interest: | | | | |
Unaffiliated issuers | | | 6,376,180 | |
| | | | |
| |
Total investment income | | | 15,793,936 | |
| | | | |
| |
Expenses: | | | | |
Management fees (Note 3a) | | | 2,982,491 | |
Administrative fees (Note 3b) | | | 272,591 | |
Distribution fees: (Note 3c) | | | | |
Class 2 | | | 1,018,907 | |
Class 4 | | | 1,420,999 | |
Custodian fees (Note 4) | | | 2,841 | |
Reports to shareholders | | | 80,442 | |
Registration and filing fees | | | 3,539 | |
Professional fees | | | 137,856 | |
Trustees’ fees and expenses | | | 4,931 | |
Other | | | 68,609 | |
| | | | |
| |
Total expenses | | | 5,993,206 | |
Expenses waived/paid by affiliates (Note 3e and 3f) | | | (396,447 | ) |
| | | | |
| |
Net expenses | | | 5,596,759 | |
| | | | |
| |
Net investment income | | | 10,197,177 | |
| | | | |
Realized and unrealized gains (losses): | | | | |
Net realized gain (loss) from: | | | | |
Investments: | | | | |
Unaffiliated issuers | | | 2,825,588 | |
Controlled affiliates (Note 3e) | | | 82,811,056 | |
Non-controlled affiliates (Note 3e) | | | 153,778,207 | |
Foreign currency transactions | | | (107,008 | ) |
Forward exchange contracts | | | 85,073 | |
Futures contracts | | | 647,582 | |
Swap contracts | | | (200,300 | ) |
| | | | |
| |
Net realized gain (loss) | | | 239,840,198 | |
| | | | |
| |
Net change in unrealized appreciation (depreciation) on: | | | | |
Investments: | | | | |
Unaffiliated issuers | | | 43,194,123 | |
Controlled affiliates (Note 3e) | | | (56,876,879 | ) |
Non-controlled affiliates (Note 3e) | | | (89,868,100 | ) |
Translation of other assets and liabilities denominated in foreign currencies | | | 10,471 | |
Forward exchange contracts | | | (66,035 | ) |
Futures contracts | | | (210,336 | ) |
Swap contracts | | | (81,070 | ) |
Change in deferred taxes on unrealized appreciation | | | (232 | ) |
| | | | |
| | | | |
| | | |
| | The accompanying notes are an integral part of these financial statements. | Annual Report | | FFA-43 |
FRANKLIN TEMPLETON VARIABLE INSURANCE PRODUCTS TRUST
FINANCIAL STATEMENTS
Statement of Operations(continued)
for the year ended December 31, 2019
| | | | |
| | | Franklin Allocation VIP Fund | |
| |
| |
Net change in unrealized appreciation (depreciation) | | $ | (103,898,058 | ) |
| | | | |
| |
Net realized and unrealized gain (loss) | | | 135,942,140 | |
| | | | |
| |
Net increase (decrease) in net assets resulting from operations | | $ | 146,139,317 | |
| | | | |
| | | | |
* Foreign taxes withheld on dividends | | $ | 272,330 | |
| | | | |
| | | |
FFA-44 | | Annual Report | The accompanying notes are an integral part of these financial statements. | | |
FRANKLIN TEMPLETON VARIABLE INSURANCE PRODUCTS TRUST
FINANCIAL STATEMENTS
Statements of Changes in Net Assets
| | | | | | | | |
| | | Franklin Allocation VIP Fund | |
| | | | |
| | | Year Ended December 31, | |
| | | | |
| | | 2019 | | | 2018 | |
| |
Increase (decrease) in net assets: | | | | | | | | |
Operations: | | | | | | | | |
Net investment income | | $ | 10,197,177 | | | $ | 26,188,755 | |
Net realized gain (loss) | | | 239,840,198 | | | | 57,368,194 | |
Net change in unrealized appreciation (depreciation) | | | (103,898,058 | ) | | | (166,306,372 | ) |
| | | | |
| | |
Net increase (decrease) in net assets resulting from operations | | | 146,139,317 | | | | (82,749,423 | ) |
| | | | |
| | |
Distributions to shareholders: | | | | | | | | |
Class 1 | | | (114,944 | ) | | | (60,348 | ) |
Class 2 | | | (41,503,915 | ) | | | (24,442,861 | ) |
Class 4 | | | (39,405,922 | ) | | | (24,951,975 | ) |
| | | | |
| | |
Total distributions to shareholders | | | (81,024,781 | ) | | | (49,455,184 | ) |
| | | | |
| | |
Capital share transactions: (Note 2) | | | | | | | | |
Class 1 | | | (205,346 | ) | | | 99,087 | |
Class 2 | | | (18,907,288 | ) | | | (25,472,556 | ) |
Class 4 | | | (20,095,745 | ) | | | (68,063,868 | ) |
| | | | |
| | |
Total capital share transactions | | | (39,208,379 | ) | | | (93,437,337 | ) |
| | | | |
| | |
Net increase (decrease) in net assets | | | 25,906,157 | | | | (225,641,944 | ) |
Net assets: | | | | | | | | |
Beginning of year | | | 784,668,870 | | | | 1,010,310,814 | |
| | | | |
| | |
End of year | | $ | 810,575,027 | | | $ | 784,668,870 | |
| | | | |
| | | | |
| | | |
| | The accompanying notes are an integral part of these financial statements. | Annual Report | | FFA-45 |
FRANKLIN TEMPLETON VARIABLE INSURANCE PRODUCTS TRUST
Notes to Financial Statements
Franklin Allocation VIP Fund
1. Organization and Significant Accounting Policies
Franklin Templeton Variable Insurance Products Trust (Trust) is registered under the Investment Company Act of 1940 (1940 Act) as anopen-end management investment company, consisting of eighteen separate funds and applies the specialized accounting and reporting guidance in U.S. Generally Accepted Accounting Principles (U.S. GAAP). Franklin Allocation VIP Fund (Fund) is included in this report. The Fund invests in other funds of the Trust (Underlying Funds). Shares of the Fund are generally sold only to insurance company separate accounts to fund the benefits of variable life insurance policies or variable annuity contracts. The Fund offers three classes of shares: Class 1, Class 2, and Class 4. Each class of shares may differ by its distribution fees, voting rights on matters affecting a single class and its exchange privilege.
The accounting policies of the Underlying Funds are outlined in their respective shareholder reports. A copy of the Underlying Funds’ shareholder reports is available on the U.S. Securities and Exchange Commission (SEC) website at sec.gov. The Underlying Funds’ shareholder reports are not covered by this report.
Effective May 1, 2019, the Fund repositioned to a direct investment fund with an actively managed dynamic allocation strategy, which involved entering into an investment management arrangement with Franklin Advisers, Inc. (Advisers) andsub-advisory arrangements with various Franklin Templeton affiliated advisers, modifying the Fund’s principal investment strategies and changing the name of the Fund from Franklin Founding Funds Allocation VIP Fund to Franklin Allocation VIP Fund.
The following summarizes the Fund’s significant accounting policies.
a. Financial Instrument Valuation
The Fund’s investments in financial instruments are carried at fair value daily. Fair value is the price that would be received to sell an asset or paid to transfer a liability in an orderly transaction between market participants on the measurement date. The Fund calculates the net asset value (NAV) per share each business day as of 4 p.m. Eastern time or the regularly scheduled close of the New York Stock Exchange (NYSE), whichever is earlier. Under compliance policies and procedures approved by the Trust’s Board of Trustees (the Board), the Fund’s administrator has responsibility for
oversight of valuation, including leading the cross-functional Valuation Committee (VC). The Fund may utilize independent pricing services, quotations from securities and financial instrument dealers, and other market sources to determine fair value.
Investments in the Underlying Funds are valued at their closing NAV each trading day. Exchange traded funds listed on an exchange or on the NASDAQ National Market System are valued at the last quoted sale price or the official closing price of the day, respectively.
Equity securities and derivative financial instruments listed on an exchange or on the NASDAQ National Market System are valued at the last quoted sale price or the official closing price of the day, respectively. Foreign equity securities are valued as of the close of trading on the foreign stock exchange on which the security is primarily traded, or as of 4 p.m. Eastern time. The value is then converted into its U.S. dollar equivalent at the foreign exchange rate in effect at 4 p.m. Eastern time on the day that the value of the security is determined.Over-the-counter (OTC) securities are valued within the range of the most recent quoted bid and ask prices. Securities that trade in multiple markets or on multiple exchanges are valued according to the broadest and most representative market. Certain equity securities are valued based upon fundamental characteristics or relationships to similar securities.
Debt securities generally trade in the OTC market rather than on a securities exchange. The Fund’s pricing services use multiple valuation techniques to determine fair value. In instances where sufficient market activity exists, the pricing services may utilize a market-based approach through which quotes from market makers are used to determine fair value. In instances where sufficient market activity may not exist or is limited, the pricing services also utilize proprietary valuation models which may consider market characteristics such as benchmark yield curves, credit spreads, estimated default rates, anticipated market interest rate volatility, coupon rates, anticipated timing of principal repayments, underlying collateral, and other unique security features in order to estimate the relevant cash flows, which are then discounted to calculate the fair value. Securities denominated in a foreign currency are converted into their U.S. dollar equivalent at the foreign exchange rate in effect at 4 p.m. Eastern time on the date that the values of the foreign debt securities are determined.
FRANKLIN TEMPLETON VARIABLE INSURANCE PRODUCTS TRUST
NOTES TO FINANCIAL STATEMENTS
Franklin Allocation VIP Fund(continued)
Certain derivative financial instruments are centrally cleared or trade in the OTC market. The Fund’s pricing services use various techniques including industry standard option pricing models and proprietary discounted cash flow models to determine the fair value of those instruments. The Fund’s net benefit or obligation under the derivative contract, as measured by the fair value of the contract, is included in net assets.
The Fund has procedures to determine the fair value of financial instruments for which market prices are not reliable or readily available. Under these procedures, the Fund primarily employs a market-based approach which may use related or comparable assets or liabilities, recent transactions, market multiples, book values, and other relevant information for the investment to determine the fair value of the investment. An income-based valuation approach may also be used in which the anticipated future cash flows of the investment are discounted to calculate fair value. Discounts may also be applied due to the nature or duration of any restrictions on the disposition of the investments. Due to the inherent uncertainty of valuations of such investments, the fair values may differ significantly from the values that would have been used had an active market existed.
Trading in securities on foreign securities stock exchanges and OTC markets may be completed before 4 p.m. Eastern time. In addition, trading in certain foreign markets may not take place on every Fund’s business day. Occasionally, events occur between the time at which trading in a foreign security is completed and 4 p.m. Eastern time that might call into question the reliability of the value of a portfolio security held by the Fund. As a result, differences may arise between the value of the Fund’s portfolio securities as determined at the foreign market close and the latest indications of value at 4 p.m. Eastern time. In order to minimize the potential for these differences, the VC monitors price movements following the close of trading in foreign stock markets through a series of country specific market proxies (such as baskets of American Depositary Receipts, futures contracts and exchange traded funds). These price movements are measured against established trigger thresholds for each specific market proxy to assist in determining if an event has occurred that may call into question the reliability of the values of the foreign securities held by the Fund. If such an event occurs, the securities may be valued using fair value procedures, which may include the use of independent pricing services.
When the last day of the reporting period is anon-business day, certain foreign markets may be open on those days that the Fund’s NAV is not calculated, which could result in differences between the value of the Fund’s portfolio securities on the last business day and the last calendar day of the reporting period. Any significant security valuation changes due to an open foreign market are adjusted and reflected by the Fund for financial reporting purposes.
b. Foreign Currency Translation
Portfolio securities and other assets and liabilities denominated in foreign currencies are translated into U.S. dollars based on the exchange rate of such currencies against U.S. dollars on the date of valuation. The Fund may enter into foreign currency exchange contracts to facilitate transactions denominated in a foreign currency. Purchases and sales of securities, income and expense items denominated in foreign currencies are translated into U.S. dollars at the exchange rate in effect on the transaction date. Portfolio securities and assets and liabilities denominated in foreign currencies contain risks that those currencies will decline in value relative to the U.S. dollar. Occasionally, events may impact the availability or reliability of foreign exchange rates used to convert the U.S. dollar equivalent value. If such an event occurs, the foreign exchange rate will be valued at fair value using procedures established and approved by the Board.
The Fund does not separately report the effect of changes in foreign exchange rates from changes in market prices on securities held. Such changes are included in net realized and unrealized gain or loss from investments in the Statement of Operations.
Realized foreign exchange gains or losses arise from sales of foreign currencies, currency gains or losses realized between the trade and settlement dates on securities transactions and the difference between the recorded amounts of dividends, interest, and foreign withholding taxes and the U.S. dollar equivalent of the amounts actually received or paid. Net unrealized foreign exchange gains and losses arise from changes in foreign exchange rates on foreign denominated assets and liabilities other than investments in securities held at the end of the reporting period.
FRANKLIN TEMPLETON VARIABLE INSURANCE PRODUCTS TRUST
NOTES TO FINANCIAL STATEMENTS
Franklin Allocation VIP Fund(continued)
1. Organization and Significant Accounting Policies(continued)
c. Securities Purchased on a When-Issued or Delayed Delivery and TBA Basis
The Fund purchases securities on a when-issued or delayed delivery andto-be-announced (TBA) basis, with payment and delivery scheduled for a future date. These transactions are subject to market fluctuations and are subject to the risk that the value at delivery may be more or less than the trade date purchase price. Although the Fund will generally purchase these securities with the intention of holding the securities, it may sell the securities before the settlement date. Sufficient assets have been segregated for these securities.
d. Derivative Financial Instruments
The Fund invested in derivative financial instruments in order to manage risk or gain exposure to various other investments or markets. Derivatives are financial contracts based on an underlying or notional amount, require no initial investment or an initial net investment that is smaller than would normally be required to have a similar response to changes in market factors, and require or permit net settlement. Derivatives contain various risks including the potential inability of the counterparty to fulfill their obligations under the terms of the contract, the potential for an illiquid secondary market, and/or the potential for market movements which expose the Fund to gains or losses in excess of the amounts shown in the Statement of Assets and Liabilities. Realized gain and loss and unrealized appreciation and depreciation on these contracts for the period are included in the Statement of Operations.
Derivative counterparty credit risk is managed through a formal evaluation of the creditworthiness of all potential counterparties. The Fund attempts to reduce its exposure to counterparty credit risk on OTC derivatives, whenever possible, by entering into International Swaps and Derivatives Association (ISDA) master agreements with certain counterparties. These agreements contain various provisions, including but not limited to collateral requirements, events of default, or early termination. Termination events applicable to the counterparty include certain deteriorations in the credit quality of the counterparty. Termination events applicable to the Fund include failure of the Fund to maintain certain net asset levels and/or limit the decline in net assets over various periods of time. In the event of default or early termination, the ISDA master agreement gives thenon-defaulting party
the right to net andclose-out all transactions traded, whether or not arising under the ISDA agreement, to one net amount payable by one counterparty to the other. However, absent an event of default or early termination, OTC derivative assets and liabilities are presented gross and not offset in the Statement of Assets and Liabilities. Early termination by the counterparty may result in an immediate payment by the Fund of any net liability owed to that counterparty under the ISDA agreement.
Collateral requirements differ by type of derivative. Collateral or initial margin requirements are set by the broker or exchange clearing house for exchange traded and centrally cleared derivatives. Initial margin deposited is held at the exchange and can be in the form of cash and/or securities. For OTC derivatives traded under an ISDA master agreement, posting of collateral is required by either the Fund or the applicable counterparty if the total net exposure of all OTC derivatives with the applicable counterparty exceeds the minimum transfer amount, which typically ranges from $100,000 to $250,000, and can vary depending on the counterparty and the type of the agreement. Generally, collateral is determined at the close of Fund business each day and any additional collateral required due to changes in derivative values may be delivered by the Fund or the counterparty the next business day, or within a few business days. Collateral pledged and/or received by the Fund for OTC derivatives, if any, is held in segregated accounts with the Fund’s custodian/counterparty broker and can be in the form of cash and/or securities. Unrestricted cash may be invested according to the Fund’s investment objectives. To the extent that the amounts due to the Fund from its counterparties are not subject to collateralization or are not fully collateralized, the Fund bears the risk of loss from counterpartynon-performance.
The Fund entered into exchange traded futures contracts primarily to manage and/or gain exposure to interest rate and equity price. A futures contract is an agreement between the Fund and a counterparty to buy or sell an asset at a specified price on a future date. Required initial margins are pledged by the Fund, and the daily change in fair value is accounted for as a variation margin payable or receivable in the Statement of Assets and Liabilities.
FRANKLIN TEMPLETON VARIABLE INSURANCE PRODUCTS TRUST
NOTES TO FINANCIAL STATEMENTS
Franklin Allocation VIP Fund(continued)
The Fund entered into OTC forward exchange contracts primarily to manage and/or gain exposure to certain foreign currencies. A forward exchange contract is an agreement between the Fund and a counterparty to buy or sell a foreign currency at a specific exchange rate on a future date.
The Fund entered into credit default swap contracts primarily to manage and/or gain exposure to credit risk. A credit default swap is an agreement between the Fund and a counterparty whereby the buyer of the contract receives credit protection and the seller of the contract guarantees the credit worthiness of a referenced debt obligation. These agreements may be privately negotiated in theover-the-counter market (OTC credit default swaps) or may be executed in a multilateral trade facility platform, such as a registered exchange (centrally cleared credit default swaps). The underlying referenced debt obligation may be a single issuer of corporate or sovereign debt, a credit index, a basket of issuers or indices, or a tranche of a credit index or basket of issuers or indices. In the event of a default of the underlying referenced debt obligation, the buyer is entitled to receive the notional amount of the credit default swap contract from the seller in exchange for the referenced debt obligation, a net settlement amount equal to the notional amount of the credit default swap less the recovery value of the referenced debt obligation, or other agreed upon amount. For centrally cleared credit default swaps, required initial margins are pledged by the Fund, and the daily change in fair value is accounted for as a variation margin payable or receivable in the Statement of Assets and Liabilities. Over the term of the contract, the buyer pays the seller a periodic stream of payments, provided that no event of default has occurred. Such periodic payments are accrued daily as an unrealized appreciation or depreciation until the payments are made, at which time they are realized. Upfront payments and receipts are reflected in the Statement of Assets and Liabilities and represent compensating factors between stated terms of the credit default swap agreement and prevailing market conditions (credit spreads and other relevant factors). These upfront payments and receipts are amortized over the term of the contract as a realized gain or loss in the Statement of Operations.
The Fund entered into OTC cross currency swap contracts primarily to manage and/or gain exposure to certain foreign currencies. A cross currency swap is an agreement between the Fund and a counterparty to exchange cash flows (determined using either a fixed or floating rate) based on the notional amounts of two different currencies. The notional
amounts are typically determined based on the spot exchange rates at the opening of the contract. Cross currency swaps may require the exchange of notional amounts at the opening and/or closing of the contract. Over the term of the contract, contractually required payments to be paid and to be received are accrued daily and recorded as unrealized depreciation and appreciation until the payments are made, at which time they are realized. Upfront payments and receipts are reflected in the Statement of Assets and Liabilities and represent compensating factors between stated terms of the cross currency swap contract and prevailing market conditions (interest rate spreads and other relevant factors). These upfront payments and receipts are amortized over the term of the contract as a realized gain or loss in the Statement of Operations.
The Fund entered into inflation index swap contracts primarily to manage and/or gain exposure to inflation risk. An inflation index swap is an agreement between the Fund and a counterparty to exchange cash flows whereby one party makes payments based on the percentage change in an index that serves as a measure of inflation and the other party makes a regular payment based on a compounded fixed rate, applied to a notional amount. These agreements may be privately negotiated in theover-the-counter market (OTC inflation index swap) or may be executed on a registered exchange (centrally cleared inflation index swap). For centrally cleared inflation index swaps, required initial margins are pledged by the Fund, and the daily change in fair value is accounted for as a variation margin payable or receivable. Over the term of the contract, contractually required payments to be paid and to be received are accrued daily and recorded as unrealized depreciation and appreciation until the payments are made, at which time they are realized. Typically, an inflation index swap has payment obligations netted and exchanged upon maturity.
The Fund entered into interest rate swap contracts primarily to manage interest rate risk. An interest rate swap is an agreement between the Fund and a counterparty to exchange cash flows based on the difference between two interest rates, applied to a notional amount. These agreements may be privately negotiated in theover-the-counter market (OTC interest rate swaps) or may be executed on a registered exchange (centrally cleared interest rate swaps). For centrally cleared interest rate swaps, required initial margins are pledged by the Fund, and the daily change in fair value is accounted for as a variation margin payable or receivable in the Statement of Assets and Liabilities. Over the
FRANKLIN TEMPLETON VARIABLE INSURANCE PRODUCTS TRUST
NOTES TO FINANCIAL STATEMENTS
Franklin Allocation VIP Fund(continued)
1. Organization and Significant Accounting Policies(continued)
d. Derivative Financial Instruments(continued)
term of the contract, contractually required payments to be paid and to be received are accrued daily and recorded as unrealized depreciation and appreciation until the payments are made, at which time they are realized.
The Fund entered into OTC total return swap contracts primarily to manage and/or gain exposure to credit and market risk of an underlying instrument such as a stock, bond, index or basket of securities or indices. A total return swap is an agreement between the Fund and a counterparty to exchange a return linked to an underlying instrument for a floating or fixed rate payment, both based upon a notional amount. Over the term of the contract, contractually required payments to be paid or received are accrued daily and recorded as unrealized appreciation or depreciation until the payments are made, at which time they are recognized as realized gain or loss.
See Note 7 regarding other derivative information.
e. Loan Participation Notes
The Fund invests in loan participation notes (Participations). Participations are loans originally issued to a borrower by one or more financial institutions (the Lender) and subsequently sold to other investors, such as the Fund. Participations typically result in the Fund having a contractual relationship only with the Lender and not with the borrower. The Fund has the right to receive from the Lender any payments of principal, interest and fees which the Lender received from the borrower. The Fund generally has no rights to either enforce compliance by the borrower with the terms of the loan agreement or to any collateral relating to the original loan. As a result, the Fund assumes the credit risk of both the borrower and the Lender that is selling the Participation. The Participations may also involve interest rate risk and liquidity risk, including the potential default or insolvency of the borrower and/or the Lender.
f. Mortgage Dollar Rolls
The Fund enters into mortgage dollar rolls, typically on a TBA basis. Mortgage dollar rolls are agreements between the Fund and a financial institution where the Fund sells (or buys) mortgage-backed securities for delivery on a specified date and simultaneously contracts to repurchase (or sell)
substantially similar (same type, coupon, and maturity) securities at a future date and at a predetermined price. Gains or losses are realized on the initial sale, and the difference between the repurchase price and the sale price is recorded as an unrealized gain or loss to the Fund upon entering into the mortgage dollar roll. In addition, the Fund may invest the cash proceeds that are received from the initial sale. During the period between the sale and repurchase, the Fund is not entitled to principal and interest paid on the mortgage backed securities. Transactions in mortgage dollar rolls are accounted for as purchases and sales and may result in an increase to the Fund’s portfolio turnover rate. The risks of mortgage dollar roll transactions include the potential inability of the counterparty to fulfill its obligations.
g. Senior Floating Rate Interests
The Fund invests in senior secured corporate loans that pay interest at rates which are periodically reset by reference to a base lending rate plus a spread. These base lending rates are generally the prime rate offered by a designated U.S. bank or the London InterBank Offered Rate (LIBOR). Senior secured corporate loans often require prepayment of principal from excess cash flows or at the discretion of the borrower. As a result, actual maturity may be substantially less than the stated maturity. Senior secured corporate loans in which the Fund invests are generally readily marketable, but may be subject to certain restrictions on resale. On July 27, 2017, the United Kingdom’s Financial Conduct Authority announced its intention to cease sustaining LIBOR after 2021. There remains uncertainty regarding the future utilization of LIBOR and the nature of any replacement rate. As such, the potential effect of a transition away from LIBOR on the Fund or the Fund’s investments that use or may use a floating rate based on LIBOR cannot yet be determined.
h. Income and Deferred Taxes
It is the Fund’s policy to qualify as a regulated investment company under the Internal Revenue Code. The Fund intends to distribute to shareholders substantially all of its taxable income and net realized gains to relieve it from federal income and if applicable, excise taxes. As a result, no provision for U.S. federal income taxes is required.
The Fund may be subject to foreign taxation related to income received, capital gains on the sale of securities and certain foreign currency transactions in the foreign jurisdictions in which it invests. Foreign taxes, if any, are
FRANKLIN TEMPLETON VARIABLE INSURANCE PRODUCTS TRUST
NOTES TO FINANCIAL STATEMENTS
Franklin Allocation VIP Fund(continued)
recorded based on the tax regulations and rates that exist in the foreign markets in which the Fund invests. When a capital gain tax is determined to apply, the Fund records an estimated deferred tax liability in an amount that would be payable if the securities were disposed of on the valuation date.
The Fund may recognize an income tax liability related to its uncertain tax positions under U.S. GAAP when the uncertain tax position has a less than 50% probability that it will be sustained upon examination by the tax authorities based on its technical merits. As of December 31, 2019, the Fund has determined that no tax liability is required in its financial statements related to uncertain tax positions for any open tax years (or expected to be taken in future tax years). Open tax years are those that remain subject to examination and are based on the statute of limitations in each jurisdiction in which the Fund invests.
i. Security Transactions, Investment Income, Expenses and Distributions
Security transactions are accounted for on trade date. Realized gains and losses on security transactions are determined on a specific identification basis. Interest income and estimated expenses are accrued daily. Amortization of premium and accretion of discount on debt securities are included in interest income. Paydown gains and losses are recorded as an adjustment to interest income. Dividend income, capital gain distributions by Underlying Funds and ETFs are recorded on theex-dividend date except for certain dividends from securities where the dividend rate is not available. In such cases, the dividend is recorded as soon as the information is received by the Fund. Distributions to shareholders are recorded on theex-dividend date. Distributable earnings are determined according to income tax regulations (tax basis) and may differ from earnings recorded in accordance with U.S. GAAP. These differences may be permanent or temporary. Permanent differences are reclassified among capital accounts to reflect their tax character. These reclassifications have no impact on net assets or the results of operations. Temporary differences are not reclassified, as they may reverse in subsequent periods.
Common expenses incurred by the Trust are allocated among the Funds based on the ratio of net assets of each Fund to the combined net assets of the Trust or based on the ratio of
number of shareholders of each Fund to the combined number of shareholders of the Trust. Fund specific expenses are charged directly to the Fund that incurred the expense.
The Fund indirectly bears its proportionate share of expenses from the Underlying Funds. Since the Underlying Funds have varied expense levels and the Fund may own different proportions of the Underlying Funds at different times, the amount of expenses incurred indirectly by the Fund will vary.
Realized and unrealized gains and losses and net investment income, excluding class specific expenses, are allocated daily to each class of shares based upon the relative proportion of net assets of each class. Differences in per share distributions by class are generally due to differences in class specific expenses.
Inflation-indexed bonds are adjusted for inflation through periodic increases or decreases in the security’s interest accruals, face amount, or principal redemption value, by amounts corresponding to the rate of inflation as measured by an index. Any increase or decrease in the face amount or principal redemption value will be included as interest income in the Statement of Operations.
j. Accounting Estimates
The preparation of financial statements in accordance with U.S. GAAP requires management to make estimates and assumptions that affect the reported amounts of assets and liabilities at the date of the financial statements and the amounts of income and expenses during the reporting period. Actual results could differ from those estimates.
k. Guarantees and Indemnifications
Under the Trust’s organizational documents, its officers and trustees are indemnified by the Trust against certain liabilities arising out of the performance of their duties to the Trust. Additionally, in the normal course of business, the Trust, on behalf of the Fund, enters into contracts with service providers that contain general indemnification clauses. The Trust’s maximum exposure under these arrangements is unknown as this would involve future claims that may be made against the Trust that have not yet occurred. Currently, the Trust expects the risk of loss to be remote.
FRANKLIN TEMPLETON VARIABLE INSURANCE PRODUCTS TRUST
NOTES TO FINANCIAL STATEMENTS
Franklin Allocation VIP Fund(continued)
2. Shares of Beneficial Interest
At December 31, 2019, there were an unlimited number of shares authorized (without par value). Transactions in the Fund’s shares were as follows:
| | | | | | | | | | | | | | | | |
| | | Year Ended December 31, | |
| | | 2019 | | | 2018 | |
| | | Shares | | | Amount | | | Shares | | | Amount | |
Class 1 Shares: | | | | | | | | | | | | | | | | |
Shares sold | | | 12,786 | | | $ | 87,589 | | | | 17,451 | | | $ | 125,360 | |
Shares issued in reinvestment of distributions | | | 18,101 | | | | 114,944 | | | | 8,536 | | | | 60,348 | |
Shares redeemed | | | (62,639 | ) | | | (407,879 | ) | | | (12,205 | ) | | | (86,621 | ) |
| | | | |
Net increase (decrease) | | | (31,752 | ) | | $ | (205,346 | ) | | | 13,782 | | | $ | 99,087 | |
| | | | |
Class 2 Shares: | | | | | | | | | | | | | | | | |
Shares sold | | | 2,057,930 | | | $ | 13,832,099 | | | | 4,193,705 | | | $ | 28,329,864 | |
Shares issued in reinvestment of distributions | | | 6,577,483 | | | | 41,503,915 | | | | 3,476,936 | | | | 24,442,861 | |
Shares redeemed | | | (11,168,839 | ) | | | (74,243,302 | ) | | | (10,985,773 | ) | | | (78,245,281 | ) |
| | | | |
Net increase (decrease) | | | (2,533,426 | ) | | $ | (18,907,288 | ) | | | (3,315,132 | ) | | $ | (25,472,556 | ) |
| | | | |
Class 4 Shares: | | | | | | | | | | | | | | | | |
Shares sold | | | 973,482 | | | $ | 6,631,528 | | | | 1,130,901 | | | $ | 8,277,821 | |
Shares issued in reinvestment of distributions | | | 6,099,988 | | | | 39,405,922 | | | | 3,475,205 | | | | 24,951,975 | |
Shares redeemed | | | (9,669,394 | ) | | | (66,133,195 | ) | | | (13,897,304 | ) | | | (101,293,664 | ) |
Net increase (decrease) | | | (2,595,924 | ) | | $ | (20,095,745 | ) | | | (9,291,198 | ) | | $ | (68,063,868 | ) |
3. Transactions with Affiliates
Franklin Resources, Inc. is the holding company for various subsidiaries that together are referred to as Franklin Templeton. Certain officers and trustees of the Fund are also officers and/or directors of the following subsidiaries:
| | |
| Subsidiary | | Affiliation |
Franklin Advisers, Inc. (Advisers) | | Investment Manager |
Templeton Global Advisors Limited (Global Advisors) | | Investment Manager |
Franklin Templeton Institutional, LLC (FT Institutional) | | Investment Manager |
Franklin Templeton Services, LLC (FT Services) | | Administrative manager |
Franklin Templeton Distributors, Inc. (Distributors) | | Principal underwriter |
Franklin Templeton Investor Services, LLC (Investor Services) | | Transfer agent |
a. Management Fees
Effective May 1, 2019, the Fund pays an investment management fee to Advisers of 0.55% per year of the average daily net assets of the Fund.
Effective May 1, 2019, under a subadvisory agreement, Global Advisors and FT Institutional, affiliates of Advisers, provide subadvisory services to the Fund. The subadvisory fee is paid by Advisers based on the Fund’s average daily net assets, and is not an additional expense of the Fund.
FRANKLIN TEMPLETON VARIABLE INSURANCE PRODUCTS TRUST
NOTES TO FINANCIAL STATEMENTS
Franklin Allocation VIP Fund(continued)
b. Administrative Fees
Effective May 1, 2019, under an agreement with Advisers, FT Services provides administrative services to the Fund. The fee is paid by Advisers based on the Fund’s average daily net assets, and is not an additional expense of the Fund.
Prior to May 1, 2019, the Fund paid FT Services for administrative services. The Fund paid administrative fees of 0.10% per year of the average daily net assets of the Fund.
c. Distribution Fees
The Board has adopted distribution plans for Class 2 and Class 4 shares pursuant to Rule12b-1 under the 1940 Act. Under the Fund’s compensation distribution plans, the Fund pays Distributors for costs incurred in connection with the servicing, sale and distribution of the Fund’s shares up to 0.35% per year of its average daily net assets of each class. The Board has agreed to limit the current rate to 0.25% per year for Class 2. The plan year, for purposes of monitoring compliance with the maximum annual plan rates, is February 1 through January 31.
d. Transfer Agent Fees
Investor Services, under terms of an agreement, performs shareholder servicing for the Fund and is not paid by the Fund for the services.
e. Investments in Affiliated Management Investment Companies
The Fund invests in one or more affiliated management investment companies for purposes other than exercising a controlling influence over the management or policies. Management fees paid by the Fund are waived on assets invested in the affiliated management investment companies, as noted in the Statement of Operations, in an amount not to exceed the management and administrative fees paid directly or indirectly by each affiliate. During the year ended December 31, 2019, the Fund held investments in affiliated management investment companies as follows:
| | | | | | | | | | | | | | | | | | | | | | | | | | | | | | | | |
| | | Value at Beginning of Year | | | Purchases | | | Sales | | | Realized Gain (Loss) | | | Net Change in Unrealized Appreciation (Depreciation) | | | Value at End of Year | | | Number of Shares Held at End of Year | | | Dividend Income | |
Controlled Affiliates | | | | | | | | | | | | | | | | | | | | | | | | | | | | | | | | |
Templeton Growth VIP Fund, Class 1 | | $ | 259,507,605 | | | $ | — | | | $ | (285,441,782 | ) | | $ | 82,811,056 | | | $ | (56,876,879 | ) | | $ | — | a | | | — | | | $ | — | |
| | | | | | | | |
Non-Controlled Affiliates | | | | | | | | | | | | | | | | | | | | | | | | | | | | | | | | |
Franklin Income VIP Fund, Class 1 | | | 260,563,549 | | | | 700,000 | | | | (290,767,442 | ) | | | 62,950,179 | | | | (33,446,286 | ) | | | — | a | | | — | | | | — | |
Franklin LibertyQ U.S. Equity ETF | | | — | | | | 16,856,847 | | | | (17,299,761 | ) | | | 442,914 | | | | — | | | | — | a | | | — | | | | 61,961 | |
Franklin Mutual Shares VIP Fund, Class 1 | | | 262,865,813 | | | | 600,000 | | | | (300,176,586 | ) | | | 90,385,114 | | | | (53,674,341 | ) | | | — | a | | | — | | | | — | |
Institutional Fiduciary Trust Money Market Portfolio, 1.26% | | | — | | | | 390,683,117 | | | | (369,209,365 | ) | | | — | | | | — | | | | 21,473,752 | | | | 21,473,752 | | | | 442,372 | |
Templeton Global Bond VIP Fund, Class 1 | | | — | | | | 35,760,635 | | | | — | | | | — | | | | (2,747,473 | ) | | | 33,013,162 | | | | 1,978,021 | | | | 2,316,602 | |
| | | | | | | | |
TotalNon-Controlled Affiliates | | $ | 523,429,362 | | | $ | 444,600,599 | | | $ | (977,453,154 | ) | | $ | 153,778,207 | | | $ | (89,868,100 | ) | | $ | 54,486,914 | | | | | | | $ | 2,820,935 | |
Total Affiliated Securities | | $ | 782,936,967 | | | $ | 444,600,599 | | | $ | (1,262,894,936 | ) | | $ | 236,589,263 | | | $ | (146,744,979 | ) | | $ | 54,486,914 | | | | | | | $ | 2,820,935 | |
aAs of December 31, 2019, no longer held by the fund.
FRANKLIN TEMPLETON VARIABLE INSURANCE PRODUCTS TRUST
NOTES TO FINANCIAL STATEMENTS
Franklin Allocation VIP Fund(continued)
3. Transactions with Affiliates(continued)
f. Waiver and Expense Reimbursements
Effective May 1, 2019, Advisers has contractually agreed in advance to waive or limit its fees and to assume as its own expense certain expenses otherwise payable by the Fund so that the expenses (including acquired fund fees and expenses but excluding distribution fees, and certainnon-routine expenses or costs, including those relating to litigation, indemnification, reorganizations, and liquidations) for each class of the Fund do not exceed 0.57%, based on the average net assets of each class until April 30, 2020. Total expenses waived or paid are not subject to recapture subsequent to the Fund’s fiscal year end.
Prior to May 1, 2019, expenses (excluding certain fees and expenses as previously disclosed) for the Fund was limited to 0.10% based on the average net assets of the Fund.
4. Expense Offset Arrangement
The Fund has entered into an arrangement with its custodian whereby credits realized as a result of uninvested cash balances are used to reduce a portion of the Fund’s custodian expenses. During the year ended December 31, 2019, there were no credits earned.
5. Income Taxes
The tax character of distributions paid during the years ended December 31, 2019 and 2018, was as follows:
| | | | | | | | |
| | | 2019 | | | 2018 | |
Distributions paid from: | | | | | | | | |
Ordinary income | | $ | 28,495,590 | | | $ | 29,280,715 | |
Long term capital gain | | | 52,529,191 | | | | 20,174,469 | |
| | $ | 81,024,781 | | | $ | 49,455,184 | |
At December 31, 2019, the cost of investments, net unrealized appreciation (depreciation), undistributed ordinary income and undistributed long term capital gains for income tax purposes were as follows:
| | | | |
Cost of investments | | $ | 777,547,657 | |
| |
Unrealized appreciation | | $ | 52,899,795 | |
Unrealized depreciation | | | (13,671,684 | ) |
| |
Net unrealized appreciation (depreciation) | | $ | 39,228,111 | |
| |
Distributable earnings: | | | | |
Undistributed ordinary income | | $ | 13,443,075 | |
Undistributed long term capital gains | | | 198,271,415 | |
| |
Total distributable earnings | | $ | 211,714,490 | |
Differences between income and/or capital gains as determined on a book basis and a tax basis are primarily due to differing treatments of paydown losses, bond discounts and premiums and wash sales.
FRANKLIN TEMPLETON VARIABLE INSURANCE PRODUCTS TRUST
NOTES TO FINANCIAL STATEMENTS
Franklin Allocation VIP Fund(continued)
6. Investment Transactions
Purchases and sales of investments (excluding short term securities) for the year ended December 31, 2019, aggregated $1,374,649,700 and $1,499,095,016, respectively.
7. Other Derivative Information
At December 31, 2019, investments in derivative contracts are reflected in the Statement of Assets and Liabilities as follows:
| | | | | | | | | | | | |
| | | Asset Derivatives | | | Liability Derivatives | |
Derivative Contracts Not Accounted for as Hedging Instruments | | Statement of Assets and Liabilities Location | | Fair Value | | | Statement of Assets and Liabilities Location | | Fair Value | |
| |
Interest rate contracts | | Variation margin on futures contracts | | $ | 72,381 | a | | Variation margin on futures contracts | |
| $329,439
| a
|
| | | | |
| | Variation margin on centrally cleared swap contracts | | | — | | | Variation margin on centrally cleared swap contracts | | | 24,594 | a |
| | | | |
| | Unrealized appreciation on OTC swap contracts | | | 6,850 | | | Unrealized depreciation on OTC swap contracts | | | 73,516 | |
| | | | |
Foreign exchange contracts | | Unrealized appreciation on OTC forward exchange contracts | | | 138,043 | | | Unrealized depreciation on OTC forward exchange contracts | | | 204,078 | |
| | | | |
Credit contracts | | OTC swap contracts (upfront payments) | | | 2,958 | | | OTC swap contracts (upfront receipts) | | | 309,287 | |
| | | | |
| | Unrealized appreciation on OTC swap contracts | | | 11,719 | | | Unrealized depreciation on OTC swap contracts | | | 25,308 | |
| | | | |
Equity contracts | | Variation margin on futures contracts | | | 46,722 | a | | Variation margin on futures contracts | | | — | |
| | | | |
Inflation contracts | | Variation margin on centrally cleared swap contracts | | | 23,779 | a | | Variation margin on centrally cleared swap contracts | | | — | |
| | | | | | | | | | | | |
| | | | |
Totals | | | | | $302,452 | | | | | | $966,222 | |
| | | | | | | | | | | | |
aThis amount reflects the cumulative appreciation (depreciation) of futures contracts and centrally cleared swap contracts as reported in the Statement of Investments. Only the variation margin receivable/payable at year end is separately reported within the Statement of Assets and Liabilities. Prior variation margin movements were recorded to cash upon receipt or payment.
For the year ended December 31, 2019, the effect of derivative contracts in the Statement of Operations was as follows:
| | | | | | | | | | | | |
Derivative Contracts Not Accounted for as Hedging Instruments | | Statement of Operations Location | | Net Realized Gain (Loss) for the Year | | | Statement of Operations Location | | Net Change in Unrealized Appreciation (Depreciation) for the Year | |
| | Net realized gain (loss) from: | | | | | | Net change in unrealized appreciation (depreciation) on: | | | | |
Interest rate contracts | | Futures contracts | | | $ 730,677 | | | Futures contracts | | | $(257,058 | ) |
| | Swap contracts | | | (36,832 | ) | | Swap contracts | | | (91,260 | ) |
Foreign exchange contracts | | Forward exchange contracts | | | 85,073 | | | Forward exchange contracts | | | (66,035 | ) |
Credit contracts | | Swap contracts | | | (163,457 | ) | | Swap contracts | | | (13,589 | ) |
Equity contracts | | Futures contracts | | | (83,095 | ) | | Futures contracts | | | 46,722 | |
Inflation contracts | | Swap contracts | | | (11 | ) | | Swap contracts | | | 23,779 | |
Totals | | | | | $ 532,355 | | | | | | $(357,441 | ) |
FRANKLIN TEMPLETON VARIABLE INSURANCE PRODUCTS TRUST
NOTES TO FINANCIAL STATEMENTS
Franklin Allocation VIP Fund(continued)
7. Other Derivative Information(continued)
For the year ended December 31, 2019, the average month end notional amount of futures contracts and swap contracts represented $34,669,291 and 10,936,893, respectively. The average month end contract value of forward exchange contracts was $7,943,334.
At December 31, 2019, OTC derivative assets and liabilities are as follows:
| | | | | | | | |
| | | Gross Amounts of
Assets and Liabilities Presented
in the Statement of Assets and Liabilities | |
| | | Assetsa | | | Liabilitiesa | |
| |
Derivatives | | | | | | | | |
Forward exchange contracts | | | $138,043 | | | | $204,078 | |
Swap contracts | | | 21,527 | | | | 408,111 | |
| | | | |
Total | | | $159,570 | | | | $612,189 | |
| | | | |
aAbsent an event of default or early termination, OTC derivative assets and liabilities are presented gross and not offset in the Statement of Assets and Liabilities.
At December 31, 2019, OTC derivative assets, which may be offset against OTC derivative liabilities and collateral received from the counterparty, are as follows:
| | | | | | | | | | | | | | | | | | | | |
| | | | | | Amounts Not Offset in the
Statement of Assets and Liabilities | | | | |
| | | Gross Amounts of Assets Presented in the Statement of Assets and Liabilities | | | Financial Instruments Available for Offset | | | Financial Instruments Collateral Received | | | Cash Collateral Received | | | Net Amount (Not less than zero) | |
Counterparty | | | | | | | | | | | | | | | | | | | | |
CITI | | | $ 15,755 | | | | $ (15,755 | ) | | | $ — | | | | $ — | | | | $ — | |
GSCO | | | 5,772 | | | | — | | | | — | | | | — | | | | 5,772 | |
JPHQ | | | 138,043 | | | | (138,043 | ) | | | — | | | | — | | | | — | |
| | | | | |
Total | | | $159,570 | | | | $(153,798 | ) | | | $ — | | | | $ — | | | | $5,772 | |
FRANKLIN TEMPLETON VARIABLE INSURANCE PRODUCTS TRUST
NOTES TO FINANCIAL STATEMENTS
Franklin Allocation VIP Fund(continued)
At December 31, 2019, OTC derivative liabilities, which may be offset against OTC derivative assets and collateral pledged to the counterparty, are as follows:
| | | | | | | | | | | | | | | | | | | | |
| | | | | Amounts Not Offset in the
Statement of Assets and Liabilities | | | | |
| | | Gross Amounts of
Liabilities Presented in
the Statement of
Assets and Liabilities | | Financial
Instruments
Available for
Offset | | | Financial
Instruments
Collateral
Pledgeda | | | Cash
Collateral
Pledged | | | Net Amount
(Not less
than zero) | |
| | | | | |
Counterparty | | | | | | | | | | | | | | | | | | | | |
CITI | | | $404,161 | | | | $(15,755 | ) | | | $(250,041 | ) | | | $(120,000 | ) | | | $18,365 | |
GSCO | | | — | | | | — | | | | — | | | | — | | | | — | |
JPHQ | | | 208,028 | | | | (138,043 | ) | | | — | | | | — | | | | 69,985 | |
| | | | |
| | | | | |
Total | | | $612,189 | | | | $(153,798 | ) | | | $(250,041 | ) | | | $(120,000 | ) | | | $88,350 | |
| | | | |
aSee the accompanying Statement of Investments for securities pledged as collateral for derivatives.
See Note 1(d) regarding derivative financial instruments.
See Abbreviations on pageFFA-59.
8. Credit Facility
The Fund, together with other U.S. registered and foreign investment funds (collectively, Borrowers), managed by Franklin Templeton, are borrowers in a joint syndicated senior unsecured credit facility totaling $2 billion (Global Credit Facility) which, matured on February 7, 2020. This Global Credit Facility provides a source of funds to the Borrowers for temporary and emergency purposes, including the ability to meet future unanticipated or unusually large redemption requests. Effective February 7, 2020, the Borrowers renewed the Global Credit Facility for a one year term, maturing February 5, 2021, for a total of $2 billion.
Under the terms of the Global Credit Facility, the Fund shall, in addition to interest charged on any borrowings made by the Fund and other costs incurred by the Fund, pay its share of fees and expenses incurred in connection with the implementation and maintenance of the Global Credit Facility, based upon its relative share of the aggregate net assets of all of the Borrowers, including an annual commitment fee of 0.15% based upon the unused portion of the Global Credit Facility. These fees are reflected in other expenses in the Statement of Operations. During the year ended December 31, 2019, the Fund did not use the Global Credit Facility.
9. Fair Value Measurements
The Fund follows a fair value hierarchy that distinguishes between market data obtained from independent sources (observable inputs) and the Fund’s own market assumptions (unobservable inputs). These inputs are used in determining the value of the Fund’s financial instruments and are summarized in the following fair value hierarchy:
| | • | | Level 1 – quoted prices in active markets for identical financial instruments |
| | • | | Level 2 – other significant observable inputs (including quoted prices for similar financial instruments, interest rates, prepayment speed, credit risk, etc.) |
FRANKLIN TEMPLETON VARIABLE INSURANCE PRODUCTS TRUST
NOTES TO FINANCIAL STATEMENTS
Franklin Allocation VIP Fund(continued)
9. Fair Value Measurements(continued)
| | • | | Level 3 – significant unobservable inputs (including the Fund’s own assumptions in determining the fair value of financial instruments) |
The input levels are not necessarily an indication of the risk or liquidity associated with financial instruments at that level.
A summary of inputs used as of December 31, 2019, in valuing the Fund’s assets and liabilities carried at fair value, is as follows:
| | | | | | | | | | | | | | | | |
| | | Level 1 | | | Level 2 | | | Level 3 | | | Total | |
| |
| | | | |
Assets: | | | | | | | | | | | | | | | | |
Investments in Securities:a | | | | | | | | | | | | | | | | |
Equity Investmentsb | | $ | 497,969,249 | | | $ | — | | | $ | — | | | $ | 497,969,249 | |
Corporate Bonds | | | — | | | | 99,902,792 | | | | — | | | | 99,902,792 | |
Senior Floating Rate Interests | | | — | | | | 5,757,663 | | | | — | | | | 5,757,663 | |
Foreign Government and Agency Securities | | | — | | | | 9,116,665 | | | | — | | | | 9,116,665 | |
U.S. Government and Agency Securities | | | — | | | | 33,250,081 | | | | — | | | | 33,250,081 | |
Asset-Backed Securities and Commercial | | | | | | | | | | | | | | | | |
Mortgage-Backed Securities | | | — | | | | 52,293,180 | | | | — | | | | 52,293,180 | |
Mortgage-Backed Securities | | | — | | | | 89,508,425 | | | | — | | | | 89,508,425 | |
Municipal Bonds | | | — | | | | 8,191,710 | | | | — | | | | 8,191,710 | |
Short Term Investments | | | 21,473,752 | | | | — | | | | — | | | | 21,473,752 | |
| | | | |
| | | | |
Total Investments in Securities | | $ | 519,443,001 | | | $ | 298,020,516 | | | $ | — | | | $ | 817,463,517 | |
| | | | |
| | | | |
Other Financial Instruments: | | | | | | | | | | | | | | | | |
Futures Contracts | | $ | 119,103 | | | $ | — | | | $ | — | | | $ | 119,103 | |
Forward Exchange Contracts | | | — | | | | 138,043 | | | | — | | | | 138,043 | |
Swap Contracts | | | — | | | | 42,348 | | | | — | | | | 42,348 | |
| | | | |
Total Other Financial Instruments | | $ | 119,103 | | | $ | 180,391 | | | $ | — | | | $ | 299,494 | |
| | | | |
Liabilities: | | | | | | | | | | | | | | | | |
Other Financial Instruments: | | | | | | | | | | | | | | | | |
Futures Contracts | | $ | 329,439 | | | $ | — | | | $ | — | | | $ | 329,439 | |
Forward Exchange Contracts | | | — | | | | 204,078 | | | | — | | | | 204,078 | |
Swap Contracts | | | — | | | | 123,418 | | | | — | | | | 123,418 | |
| | | | |
Total Other Financial Instruments | | $ | 329,439 | | | $ | 327,496 | | | $ | — | | | $ | 656,935 | |
| | | | |
aFor detailed categories, see the accompanying Statement of Investments.
bIncludes common stocks and management investment companies as well as other equity interests.
10. Subsequent Events
The Fund has evaluated subsequent events through the issuance of the financial statements and determined that no events have occurred that require disclosure other than those already disclosed in the financial statements.
FRANKLIN TEMPLETON VARIABLE INSURANCE PRODUCTS TRUST
NOTES TO FINANCIAL STATEMENTS
Franklin Allocation VIP Fund(continued)
Abbreviations
| | | | | | | | | | |
| Counterparty | | Currency | | Selected Portfolio |
| | | | | |
| CITI | | Citigroup, Inc. | | COP | | Colombian Peso | | ADR | | American Depositary Receipt |
| | | | | |
| GSCO | | The Goldman Sachs Group, Inc. | | CNY | | Chinese Yuan | | CLO | | Collateralized Loan Obligations |
| | | | | |
| JPHQ | | JP Morgan Chase & Co. | | DOP | | Dominican Peso | | CNRR | | China Reverse Repo Rate |
| | | | | |
| | | | DKK | | Danish Krone | | ETF | | Exchange Traded Fund |
| | | | | |
| | | | EUR | | Euro | | FFCB | | Federal Farm Credit Bank |
| | | | | |
| | | | USD | | United States Dollar | | FHLB | | Federal Home Loan Bank |
| | | | | |
| | | | UYU | | Uruguayan Peso | | FRN | | Floating Rate Note |
| | | | | |
| | | | ZAR | | South African Rand | | GO | | General Obligation |
| | | | | |
| | | | | | | | IDR | | International Depository Receipt |
| | | | | |
| | | | | | | | LIBOR | | London InterBank Offered Rate |
| | | | | |
| | | | | | | | SF | | Single Family |
| | | | | |
| | | | | | | | USD | | United School District |
FRANKLIN TEMPLETON VARIABLE INSURANCE PRODUCTS TRUST
Report of Independent Registered Public Accounting Firm
To the Board of Trustees of Franklin Templeton Variable Insurance Products Trust and Shareholders of Franklin Allocation VIP Fund
Opinion on the Financial Statements
We have audited the accompanying statement of assets and liabilities, including the statement of investments, of Franklin Allocation VIP Fund (the ‘‘Fund’’) as of December 31, 2019, the related statement of operations for the year ended December 31, 2019, the statement of changes in net assets for each of the two years in the period ended December 31, 2019, including the related notes, and the financial highlights for each of the five years in the period ended December 31, 2019 (collectively referred to as the “financial statements”). In our opinion, the financial statements present fairly, in all material respects, the financial position of the Fund as of December 31, 2019, the results of its operations for the year then ended, the changes in its net assets for each of the two years in the period ended December 31, 2019 and the financial highlights for each of the five years in the period ended December 31, 2019 in conformity with accounting principles generally accepted in the United States of America.
Basis for Opinion
These financial statements are the responsibility of the Fund’s management. Our responsibility is to express an opinion on the Fund’s financial statements based on our audits. We are a public accounting firm registered with the Public Company Accounting Oversight Board (United States) (PCAOB) and are required to be independent with respect to the Fund in accordance with the U.S. federal securities laws and the applicable rules and regulations of the Securities and Exchange Commission and the PCAOB.
We conducted our audits of these financial statements in accordance with the standards of the PCAOB. Those standards require that we plan and perform the audit to obtain reasonable assurance about whether the financial statements are free of material misstatement, whether due to error or fraud.
Our audits included performing procedures to assess the risks of material misstatement of the financial statements, whether due to error or fraud, and performing procedures that respond to those risks. Such procedures included examining, on a test basis, evidence regarding the amounts and disclosures in the financial statements. Our audits also included evaluating the accounting principles used and significant estimates made by management, as well as evaluating the overall presentation of the financial statements. Our procedures included confirmation of securities owned as of December 31, 2019 by correspondence with the custodian, transfer agent and brokers; when replies were not received from brokers, we performed other auditing procedures. We believe that our audits provide a reasonable basis for our opinion.
PricewaterhouseCoopers LLP
San Francisco, California
February 20, 2020
We have served as the auditor of one or more investment companies in the Franklin Templeton Group of Funds since 1948.
FRANKLIN TEMPLETON VARIABLE INSURANCE PRODUCTS TRUST
Tax Information (unaudited)
Franklin Allocation VIP Fund
Under Section 852(b)(3)(C) of the Internal Revenue Code, the Fund hereby reports the maximum amount allowable but no less than $52,529,191 as a long term capital gain dividend for the fiscal year ended December 31, 2019.
Under Section 854(b)(1)(A) of the Internal Revenue Code, the Fund hereby reports 12.20% of the ordinary income dividends as income qualifying for the dividends received deduction for the fiscal year ended December 31, 2019.
This page intentionally left blank.
Franklin Flex Cap Growth VIP Fund
This annual report for Franklin Flex Cap Growth VIP Fund covers the fiscal year ended December 31, 2019.
Class 4 Performance Summary as of December 31, 2019
Average annual total return of Class 4 shares* represents the average annual change in value, assuming reinvestment of dividends and capital gains. Average returns smooth out variations in returns, which can be significant; they are not the same asyear-by-year results.
| | | | | | |
| Periods ended 12/31/19 | | 1-Year | | 5-Year | | 10-Year |
Average Annual Total Return | | +31.03% | | +11.63% | | +11.76% |
*The Fund has an expense reduction and a fee waiver associated with any investments in a Franklin Templeton money fund and/or other Franklin Templeton fund, contractually guaranteed through 4/30/20. Fund investment results reflect the expense reduction and fee waiver; without these reductions, the results would have been lower.
Performance reflects the Fund’s Class 4 operating expenses, but doesnotinclude any contract fees, expenses or sales charges. If they had been included, performance would be lower. These charges and deductions, particularly for variable life policies, can have a significant effect on contract values and insurance benefits. See the contract prospectus for a complete description of these expenses, including sales charges.
Performance data represent past performance, which does not guarantee future results. Investment return and principal value will fluctuate, and you may have a gain or loss when you sell your shares. Current performance may differ from figures shown.
Total Return Index Comparison for a Hypothetical $10,000 Investment (1/1/10–12/31/19)
The graph below shows the change in value of a hypothetical $10,000 investment in the Fund over the indicated period and includes reinvestment of any income or distributions. The Fund’s performance* is compared to the performance of the Russell 3000® Growth Index, the Russell 1000® Growth Index and the Standard & Poors® 500 Index (S&P 500®). One cannot invest directly in an index, and an index is not representative of the Fund’s portfolio.Please see Important Notes to Performance Information preceding the Fund Summaries.
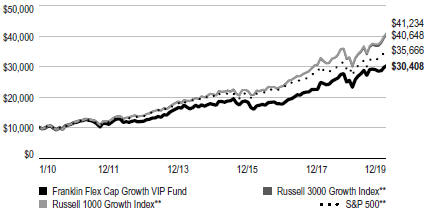
**Source: Morningstar. Please see Index Descriptions following the Fund Summaries.
FRANKLIN FLEX CAP GROWTH VIP FUND
Fund Goal and Main Investments
The Fund seeks capital appreciation. Under normal market conditions, the Fund invests predominantly in equity securities of companies that the investment manager believes have the potential for capital appreciation.
Fund Risks
All investments involve risks, including possible loss of principal. Growth stock prices reflect projections of future earnings or revenues, and can, therefore, fall dramatically if the company fails to meet those projections. To the extent the Fund focuses on particular countries, regions, industries, sectors or types of investment from time to time, it may be subject to greater risk of adverse developments in such areas of focus than a fund that invests in a wider variety of countries, regions, industries, sectors or investments. Smaller, midsized and relatively new or unseasoned companies can be particularly sensitive to changing economic conditions, and their prospects for growth are less certain than those of larger, more established companies. Historically, these securities have experienced more price volatility than larger-company stocks, especially over the short term. Foreign securities involve special risks, including currency fluctuations and economic and political uncertainties. The Fund is actively managed but there is no guarantee that the manager’s investment decisions will produce the desired results. The Fund’s prospectus also includes a description of the main investment risks.
Performance Overview
You can find the Fund’sone-year total return in the Performance Summary. In comparison, the Russell 3000® Growth Index posted a +35.85% total return, the Russell 1000® Growth Index posted a +36.39% total return, and the S&P 500 posted a +31.49% total return for the same period.1
Economic and Market Overview
U.S. equities, as measured by the S&P 500, posted strong returns during the reporting period, driven by the U.S. Federal Reserve’s (Fed’s) monetary policy easing, solid domestic economic growth and diminished concerns about the global economy and trade relations. Stocks gained sharply early in the year and experienced heightened volatility in May and September before reaching record price
Portfolio Composition
Based on Total Net Assets as of 12/31/19
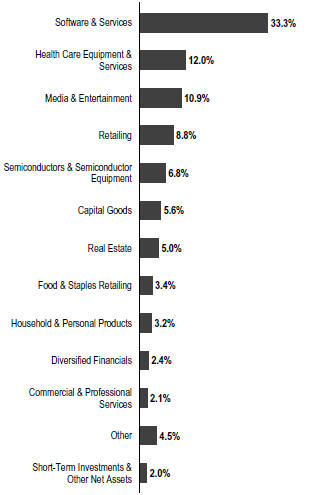
highs near the end of 2019. The decline in market volatility reflected many market participants’ shift from growth concerns to a more optimistic outlook.
The Fed provided a substantial boost to equity markets early in the reporting period as it shifted to a more accommodative monetary policy. In January 2019, the Fed signaled the end of its tightening cycle and cut the federal funds rate three times thereafter, lowering it to a range of 1.50%–1.75%. Stocks responded positively to the interest-rate cuts and gained further in December 2019 after the Fed indicated it would likely leave interest rates unchanged in 2020.
1. Source: Morningstar. One cannot invest directly in an index, and an index is not representative of the Fund’s portfolio. Please see Index Descriptions following the Fund Summaries.
The dollar value, number of shares or principal amount, and names of all portfolio holdings are listed in the Fund’s Statement of Investments (SOI).
FRANKLIN FLEX CAP GROWTH VIP FUND
Solid U.S. economic growth also supported equities, as healthy consumer spending and a strong labor market kept the economy afloat. The unemployment rate fell during the year, reaching 3.5% in September, November and December 2019, the lowest recorded unemployment rate in 50 years.2 Wages also grew, albeit at a moderate pace, and inflation remained persistently low. In addition, deficit spending by the U.S. government boosted current growth at the expense of long-term debt. Despite the strength in the consumer sector, some parts of the economy struggled, particularly heavy industry. Annual industrial production contracted late in the reporting period, manufacturing output stalled and capital spending declined.
International and trade developments also impacted U.S. stocks during the period. Investors were concerned about slowing global growth and the impact it might have on U.S. equities, but some market participants’ predictions of a global recession did not materialize as growth proved resilient amid a series of interest-rate cuts by many central banks. The trade war between the U.S. and China was a dominant theme over the period, and stocks fluctuated as many investors responded to the latest developments, both positive and negative. However, byperiod-end, markets were reassured by a phase one trade agreement between the two countries, which lowered certain tariffs and addressed some of the principal areas of conflict.
Investment Strategy
We use fundamental,bottom-up research to seek companies meeting our criteria of growth potential, quality and valuation. In seeking sustainable growth characteristics, we look for companies we believe can produce sustainable earnings and cash flow growth, evaluating the long-term market opportunity and competitive structure of an industry to target leaders and emerging leaders. We define quality companies as those with strong and improving competitive positions in attractive markets. We also believe important attributes of quality are experienced and talented management teams as well as financial strength reflected in the capital structure, gross and operating margins, free cash flow generation and returns on capital employed. Our valuation analysis includes a range of potential outcomes based on an assessment of multiple scenarios. In assessing
Top 10 Holdings
12/31/19
| | | | |
Company Sector/Industry | | % of Total Net Assets | |
| |
Microsoft Corp. Software & Services | | | 8.4% | |
| |
Amazon.com Inc. Retailing | | | 6.7% | |
| |
Alphabet Inc. Media & Entertainment | | | 6.1% | |
| |
Mastercard Inc. Software & Services | | | 5.7% | |
| |
ServiceNow Inc. Software & Services | | | 5.4% | |
| |
salesforce.com Inc. Software & Services | | | 4.6% | |
| |
Visa Inc. Software & Services | | | 3.8% | |
| |
Costco Wholesale Corp. Food & Staples Retailing | | | 3.4% | |
| |
Estee Lauder Cos. Inc. Household & Personal Products | | | 3.2% | |
| |
Analog Devices Inc. Semiconductors & Semiconductor Equipment | | | 2.8% | |
value, we consider whether security prices fully reflect the balance of the sustainable growth opportunities relative to business and financial risks.
Manager’s Discussion
During the 12 months ended December 31, 2019, all sectors in the Fund’s portfolio posted positive returns, with the exception of energy.3 Compared to the Russell 3000® Growth Index, stock selection in consumer staples and real estate sectors contributed to relative returns.4 Relative detractors included stock selection in information technology (IT), industrials and health care.5
In consumer staples, beauty products manufacturer Estee Lauder contributed to relative returns. The company’s flagship brands and skin care products performed strongly during the period, and sales accelerated in Asia and elsewhere, though there was some softness in the U.S.
2. Source: Bureau of Labor Statistics.
3. The Fund had no energy holdings atperiod-end.
4. The consumer staples sector comprises food and staples retailing, food products, and household and personal products in the SOI. The real estate sector comprises real estate in the SOI.
5. The IT sector comprises semiconductors and semiconductor equipment, software and services, and technology hardware and equipment in the SOI. The industrials sector comprises commercial and professional services in the SOI. The health care sector comprises health care equipment and services and pharmaceuticals, biotechnology and life sciences in the SOI.
FRANKLIN FLEX CAP GROWTH VIP FUND
Plant-based meat products company Beyond Meat (not part of the Index, not held atperiod-end) also contributed.
In real estate, real estate investment trust and communications infrastructure operator American Tower helped relative results.
Elsewhere, financial technology company Mastercard and cloud-based enterprise workflow management provider ServiceNow contributed to relative performance. Mastercard reported solid quarterly earnings throughout 2019, with net revenues coming in slightly ahead of consensus, and modestly increased guidance late in the year. The company announced new partnerships with major companies throughout the period, including flipping a major outdoor retailer from competing payments company Visa (also a Fund holding). Growth accelerated or was steady in all regions. In a challenging macroeconomic environment for technology companies, ServiceNow reported solid quarterly earnings, better-than-expected earnings per share and raised guidance. The company unexpectedly changed CEOs late in the year, however, and we will reevaluate our position based on how the new executive adapts to an unfamiliar Silicon Valley business culture. Other contributors included telecommunications and media company Charter Communications ande-commerce platform Alibaba Group Holding (not part of the Index).
In IT, customer relations management software company salesforce.com posted a positive return that lagged the benchmark, which detracted from relative performance. Financial and human resource software company Workday also detracted.
In the industrials sector, Fortive hindered performance. Fortive is a diversified industrial conglomerate that designs, develops, manufactures and markets professional and engineered products, software and services. Shares declined after the company reported mixed second- and third-quarter 2019 results, with earnings exceeding expectations and revenues missing them. In September, the company announced its intention to separate into two independent companies in the second half of 2020 by spinning off its transportation-related businesses, which include retail and commercial fueling, fleet management, and automotive service and repair solutions. We believe this separation makes a lot of sense, as it could potentially isolate the cyclicality of the retail fueling business. Aerospace firm Boeing detracted as well.
In health care, veterinary health company Elanco Animal Health (not held atperiod-end) significantly detracted from relative results. Investors backed away from the company
due to tepid quarterly earnings, challenges related to disentangling itself from its prior parent company, and concerns over its acquisition of Bayer’s (not a Fund holding) animal health subsidiary. We believe these concerns are overblown. In our opinion, earnings reports were solid when considering the impact of the African Swine Flu outbreak, and the acquisition of the Bayer subsidiary—yet to be finalized—will substantially increase its exposure to the companion animal business. Furthermore, we believe the company is well-positioned to benefit from the long-term global trend of increasing protein consumption and industrial-scale livestock raising. Other contributors included life sciences software provider Veeva Systems and medical technology company Becton, Dickinson and Co.
Elsewhere, our underweighted position in Facebook also detracted from relative results. The social media company’s stock rose despite privacy violations that led to a multi-billion dollar fine from the U.S. government during the period. Healthy quarterly profits throughout 2019 boosted the company’s stock, which has rebounded from a steep drop in late-2018.
Thank you for your participation in Franklin Flex Cap Growth VIP Fund. We look forward to serving your future investment needs.
The foregoing information reflects our analysis, opinions and portfolio holdings as of December 31, 2019, the end of the reporting period. The way we implement our main investment strategies and the resulting portfolio holdings may change depending on factors such as market and economic conditions. These opinions may not be relied upon as investment advice or an offer for a particular security. The information is not a complete analysis of every aspect of any market, state, industry, security or the Fund. Statements of fact are from sources considered reliable, but the investment manager makes no representation or warranty as to their completeness or accuracy. Although historical performance is no guarantee of future results, these insights may help you understand our investment management philosophy.
FRANKLIN FLEX CAP GROWTH VIP FUND
Class 4 Fund Expenses
As an investor in a variable insurance contract (Contract) that indirectly provides for investment in an underlying mutual fund, you can incur transaction and/or ongoing expenses at both the Fund level and the Contract Level: (1) transaction expenses can include sales charges (loads) on purchases, surrender fees, transfer fees and premium taxes; and (2) ongoing expenses can include management fees, distribution and service(12b-1) fees, contract fees, annual maintenance fees, mortality and expense risk fees and other fees and expenses. All mutual funds and Contracts have some types of ongoing expenses. The table below shows Fund-level ongoing expenses and can help you understand these costs and compare them with those of other mutual funds offered through the Contract. The table assumes a $1,000 investment held for the six months indicated. Please refer to the Fund prospectus for additional information on operating expenses.
Actual Fund Expenses
The table below provides information about the actual account values and actual expenses in the columns under the heading “Actual.” In these columns the Fund’s actual return, which includes the effect of ongoing Fund expenses but does not include the effect of ongoing Contract expenses, is used to calculate the “Ending Account Value.” You can estimate the Fund-level expenses you paid during the period by following these steps (of course, your account value and expenses will differ from those in this illustration): Divide your account value by $1,000 (if your account had an $8,600 value, then $8,600÷ $1,000 =8.6). Then multiply the result by the number under the headings “Actual” and “Fund-Level Expenses Paid During Period” (if Fund-Level Expenses Paid During Period were $ 7.50, then 8.6 x $ 7.50 = $64.50). In this illustration, the estimated expenses paid this period at the Fund level are $64.50.
Hypothetical Example for Comparison with Other Mutual Funds
Under the heading “Hypothetical” in the table, information is provided about hypothetical account values and hypothetical expenses based on the Fund’s actual expense ratio and an assumed rate of return of 5% per year before expenses, which is not the Fund’s actual return. This information may not be used to estimate the actual ending account balance or expenses you paid for the period, but it can help you compare ongoing costs of investing in the Fund with those of other mutual funds offered through the Contract. To do so, compare this 5% hypothetical example with the 5% hypothetical examples that appear in the shareholder reports of other funds offered through the Contract.
Please note that expenses shown in the table are meant to highlight ongoing costs at the Fund level only and do not reflect any ongoing expenses at the Contract level, or transaction expenses at either the Fund or Contract levels. In addition, while the Fund does not have transaction expenses, if the transaction and ongoing expenses at the Contract level were included, the expenses shown below would be higher. You should consult your Contract prospectus or disclosure document for more information.
| | | | | | | | | | | | |
| | | | | Actual
(actual return after expenses) | | Hypothetical
(5% annual return before expenses) | | |
Share
Class | | Beginning
Account
Value 7/1/19 | | Ending
Account
Value 12/31/19 | | Fund-Level
Expenses
Paid During
Period
7/1/19–12/31/191, 2 | | Ending
Account
Value 12/31/19 | | Fund-Level
Expenses
Paid During
Period
7/1/19–12/31/191, 2 | | Net
Annualized
Expense
Ratio2 |
| | | | | | |
| Class 4 | | $1,000 | | $1,049.00 | | $5.47 | | $1,019.86 | | $5.40 | | 1.06% |
1. Expenses are equal to the annualized expense ratio for thesix-month period as indicated above—in the far right column—multiplied by the simple average account value over the period indicated, and then multiplied by 184/365 to reflect theone-half year period.
2. Reflects expenses after fee waivers and expense reimbursements. Does not include any ongoing expenses of the Contract for which the Fund is an investment option or acquired fund fees and expenses.
FRANKLIN TEMPLETON VARIABLE INSURANCE PRODUCTS TRUST
Financial Highlights
Franklin Flex Cap Growth VIP Fund
| | | | | | | | | | | | | | | | | | | | |
| | | Year Ended December 31, | |
| | | 2019 | | | 2018 | | | 2017 | | | 2016 | | | 2015 | |
| | | | | |
Class 2 | | | | | | | | | | | | | | | | | | | | |
| | | | | |
Per share operating performance (for a share outstanding throughout the year) | | | | | | | | | | | | | | | | | | | | |
| | | | | |
Net asset value, beginning of year | | | $ 6.46 | | | | $ 7.46 | | | | $ 5.89 | | | | $ 7.09 | | | | $ 16.61 | |
| | | | | |
Income from investment operationsa: | | | | | | | | | | | | | | | | | | | | |
| | | | | |
Net investment income (loss)b | | | (0.01 | ) | | | (0.02 | ) | | | (0.01 | ) | | | (0.03 | ) | | | (0.06 | ) |
| | | | | |
Net realized and unrealized gains (losses) | | | 1.99 | | | | 0.42 | | | | 1.60 | | | | (0.20 | ) | | | 1.00 | |
| | | | | |
Total from investment operations | | | 1.98 | | | | 0.40 | | | | 1.59 | | | | (0.23 | ) | | | 0.94 | |
| | | | | |
Less distributions from: | | | | | | | | | | | | | | | | | | | | |
| | | | | |
Net realized gains | | | (0.38 | ) | | | (1.40 | ) | | | (0.02 | ) | | | (0.97 | ) | | | (10.46 | ) |
| | | | | |
Net asset value, end of year | | | $ 8.06 | | | | $ 6.46 | | | | $ 7.46 | | | | $ 5.89 | | | | $ 7.09 | |
| | | | | |
Total returnc | | | 31.16% | | | | 3.14% | | | | 26.94% | | | | (2.89)% | | | | 4.37% | |
| | | | | |
Ratios to average net assets | | | | | | | | | | | | | | | | | | | | |
| | | | | |
Expenses before waiver and payments by affiliates | | | 1.33% | | | | 1.30% | | | | 1.35% | | | | 1.36% | | | | 1.33% | |
| | | | | |
Expenses net of waiver and payments by affiliates | | | 0.96% | d | | | 0.96% | d | | | 0.96% | | | | 0.96% | | | | 0.96% | |
| | | | | |
Net investment income (loss) | | | (0.19)% | | | | (0.20)% | | | | (0.20)% | | | | (0.44)% | | | | (0.62)% | |
| | | | | |
Supplemental data | | | | | | | | | | | | | | | | | | | | |
| | | | | |
Net assets, end of year (000’s) | | $ | 97,964 | | | $ | 69,233 | | | $ | 81,084 | | | $ | 73,337 | | | $ | 82,901 | |
| | | | | |
Portfolio turnover rate | | | 26.29% | | | | 15.17% | | | | 52.12% | | | | 17.76% | | | | 88.15% | |
aThe amount shown for a share outstanding throughout the period may not correlate with the Statement of Operations for the period due to the timing of sales and repurchases of the Fund’s shares in relation to income earned and/or fluctuating fair value of the investments of the Fund.
bBased on average daily shares outstanding.
cTotal return does not include fees, charges or expenses imposed by the variable annuity and life insurance contracts for which Franklin Templeton Variable Insurance Products Trust serves as an underlying investment vehicle.
dBenefit of expense reduction rounds to less than 0.01%.
| | | | |
| | | |
FFC-6 | | Annual Report | The accompanying notes are an integral part of these financial statements. | | |
FRANKLIN TEMPLETON VARIABLE INSURANCE PRODUCTS TRUST
FINANCIAL HIGHLIGHTS
Franklin Flex Cap Growth VIP Fund(continued)
| | | | | | | | | | | | | | | | | | | | |
| | | | | | Year Ended December 31, | | | | |
| | | 2019 | | | 2018 | | | 2017 | | | 2016 | | | 2015 | |
| | | | | |
Class 4 | | | | | | | | | | | | | | | | | | | | |
| | | | | |
Per share operating performance (for a share outstanding throughout the year) | | | | | | | | | | | | | | | | | | | | |
| | | | | |
Net asset value, beginning of year | | | $ 6.20 | | | | $ 7.21 | | | | $ 5.70 | | | | $ 6.90 | | | | $ 16.44 | |
| | | | | |
Income from investment operationsa: | | | | | | | | | | | | | | | | | | | | |
| | | | | |
Net investment income (loss)b | | | (0.02 | ) | | | (0.02 | ) | | | (0.02 | ) | | | (0.03 | ) | | | (0.07 | ) |
| | | | | |
Net realized and unrealized gains (losses) | | | 1.91 | | | | 0.41 | | | | 1.55 | | | | (0.20 | ) | | | 0.99 | |
| | | | | |
Total from investment operations | | | 1.89 | | | | 0.39 | | | | 1.53 | | | | (0.23 | ) | | | 0.92 | |
| | | | | |
Less distributions from: | | | | | | | | | | | | | | | | | | | | |
| | | | | |
Net realized gains | | | (0.38 | ) | | | (1.40 | ) | | | (0.02 | ) | | | (0.97 | ) | | | (10.46 | ) |
| | | | | |
Net asset value, end of year | | | $ 7.71 | | | | $ 6.20 | | | | $ 7.21 | | | | $ 5.70 | | | | $ 6.90 | |
| | | | | |
Total returnc | | | 31.03% | | | | 3.10% | | | | 26.78% | | | | (2.98)% | | | | 4.32% | |
| | | | | |
Ratios to average net assets | | | | | | | | | | | | | | | | | | | | |
| | | | | |
Expenses before waiver and payments by affiliates | | | 1.43% | | | | 1.40% | | | | 1.45% | | | | 1.46% | | | | 1.43% | |
| | | | | |
Expenses net of waiver and payments by affiliates | | | 1.06% | d | | | 1.06% | d | | | 1.06% | | | | 1.06% | | | | 1.06% | |
| | | | | |
Net investment income (loss) | | | (0.29)% | | | | (0.30)% | | | | (0.30)% | | | | (0.54)% | | | | (0.72)% | |
| | | | | |
Supplemental data | | | | | | | | | | | | | | | | | | | | |
| | | | | |
Net assets, end of year (000’s) | | $ | 31,761 | | | $ | 29,681 | | | $ | 30,112 | | | $ | 27,163 | | | $ | 34,479 | |
| | | | | |
Portfolio turnover rate | | | 26.29% | | | | 15.17% | | | | 52.12% | | | | 17.76% | | | | 88.15% | |
aThe amount shown for a share outstanding throughout the period may not correlate with the Statement of Operations for the period due to the timing of sales and repurchases of the Fund’s shares in relation to income earned and/or fluctuating fair value of the investments of the Fund.
bBased on average daily shares outstanding.
cTotal return does not include fees, charges or expenses imposed by the variable annuity and life insurance contracts for which Franklin Templeton Variable Insurance Products Trust serves as an underlying investment vehicle.
dBenefit of expense reduction rounds to less than 0.01%.
| | | | |
| | | |
| | The accompanying notes are an integral part of these financial statements. | Annual Report | | FFC-7 |
FRANKLIN TEMPLETON VARIABLE INSURANCE PRODUCTS TRUST
Statement of Investments, December 31, 2019
Franklin Flex Cap Growth VIP Fund
| | | | | | | | |
| | | Shares | | | Value | |
| | |
Common Stocks 98.0% | | | | | | | | |
Capital Goods 5.6% | | | | | | | | |
The Boeing Co. | | | 7,814 | | | $ | 2,545,489 | |
Fortive Corp. | | | 20,000 | | | | 1,527,800 | |
Raytheon Co. | | | 8,000 | | | | 1,757,920 | |
Roper Technologies Inc. | | | 4,000 | | | | 1,416,920 | |
| | | | | | | | |
| | |
| | | | | | | 7,248,129 | |
| | | | | | | | |
Commercial & Professional Services 2.1% | | | | | | | | |
aCoStar Group Inc. | | | 2,000 | | | | 1,196,600 | |
Verisk Analytics Inc. | | | 10,000 | | | | 1,493,400 | |
| | | | | | | | |
| | |
| | | | | | | 2,690,000 | |
| | | | | | | | |
Consumer Durables & Apparel 1.5% | | | | | | | | |
NIKE Inc., B | | | 19,800 | | | | 2,005,938 | |
| | | | | | | | |
| | |
Diversified Financials 2.4% | | | | | | | | |
CME Group Inc. | | | 7,677 | | | | 1,540,927 | |
Intercontinental Exchange Inc. | | | 17,000 | | | | 1,573,350 | |
| | | | | | | | |
| | |
| | | | | | | 3,114,277 | |
| | | | | | | | |
Food & Staples Retailing 3.4% | | | | | | | | |
Costco Wholesale Corp. | | | 14,850 | | | | 4,364,712 | |
| | | | | | | | |
| | |
Health Care Equipment & Services 12.0% | | | | | | | | |
Abbott Laboratories | | | 30,000 | | | | 2,605,800 | |
aAlcon Inc. (Switzerland) | | | 24,750 | | | | 1,400,107 | |
Becton, Dickinson and Co. | | | 5,000 | | | | 1,359,850 | |
Danaher Corp. | | | 19,790 | | | | 3,037,369 | |
aIDEXX Laboratories Inc. | | | 9,890 | | | | 2,582,576 | |
aIntuitive Surgical Inc. | | | 3,960 | | | | 2,340,954 | |
aVeeva Systems Inc. | | | 16,000 | | | | 2,250,560 | |
| | | | | | | | |
| | |
| | | | | | | 15,577,216 | |
| | | | | | | | |
Household & Personal Products 3.2% | | | | | | | | |
Estee Lauder Cos. Inc., A | | | 19,800 | | | | 4,089,492 | |
| | | | | | | | |
| | |
Media & Entertainment 10.9% | | | | | | | | |
aAlphabet Inc., C | | | 5,940 | | | | 7,941,899 | |
aCharter Communications Inc., A | | | 4,956 | | | | 2,404,056 | |
aFacebook Inc., A | | | 10,000 | | | | 2,052,500 | |
aNetflix Inc. | | | 5,500 | | | | 1,779,635 | |
| | | | | | | | |
| | |
| | | | | | | 14,178,090 | |
| | | | | | | | |
Pharmaceuticals, Biotechnology & Life Sciences 1.1% | | | | | | | | |
a10X Genomics Inc., A | | | 500 | | | | 38,125 | |
aIllumina Inc. | | | 4,000 | | | | 1,326,960 | |
| | | | | | | | |
| | |
| | | | | | | 1,365,085 | |
| | | | | | | | |
FRANKLIN TEMPLETON VARIABLE INSURANCE PRODUCTS TRUST
STATEMENT OF INVESTMENTS
Franklin Flex Cap Growth VIP Fund(continued)
| | | | | | | | |
| | | Shares | | | Value | |
| | |
Common Stocks(continued) | | | | | | | | |
Real Estate 5.0% | | | | | | | | |
American Tower Corp. | | | 11,459 | | | $ | 2,633,508 | |
Crown Castle International Corp. | | | 18,582 | | | | 2,641,431 | |
Equinix Inc. | | | 2,000 | | | | 1,167,400 | |
| | | | | | | | |
| | |
| | | | | | | 6,442,339 | |
| | | | | | | | |
Retailing 8.8% | | | | | | | | |
aAlibaba Group Holding Ltd., ADR (China) | | | 9,890 | | | | 2,097,669 | |
aAmazon.com Inc. | | | 4,726 | | | | 8,732,892 | |
aBooking Holdings Inc. | | | 300 | | | | 616,119 | |
aChewy Inc., A | | | 590 | | | | 17,110 | |
| | | | | | | | |
| | |
| | | | | | | 11,463,790 | |
| | | | | | | | |
Semiconductors & Semiconductor Equipment 6.8% | | | | | | | | |
Analog Devices Inc. | | | 30,430 | | | | 3,616,301 | |
NVIDIA Corp. | | | 9,890 | | | | 2,327,117 | |
Xilinx Inc. | | | 29,724 | | | | 2,906,116 | |
| | | | | | | | |
| | |
| | | | | | | 8,849,534 | |
| | | | | | | | |
Software & Services 33.3% | | | | | | | | |
aAdobe Inc. | | | 9,890 | | | | 3,261,821 | |
aBill.Com Holdings Inc. | | | 1,000 | | | | 38,050 | |
Mastercard Inc., A | | | 24,600 | | | | 7,345,314 | |
Microsoft Corp. | | | 69,290 | | | | 10,927,033 | |
aPayPal Holdings Inc. | | | 19,790 | | | | 2,140,684 | |
asalesforce.com Inc. | | | 36,630 | | | | 5,957,503 | |
aServiceNow Inc. | | | 24,740 | | | | 6,984,597 | |
Visa Inc., A | | | 26,200 | | | | 4,922,980 | |
aWorkday Inc., A | | | 9,900 | | | | 1,628,055 | |
| | | | | | | | |
| | |
| | | | | | | 43,206,037 | |
| | | | | | | | |
Technology Hardware & Equipment 0.9% | | | | | | | | |
aKeysight Technologies Inc. | | | 12,000 | | | | 1,231,560 | |
| | | | | | | | |
Utilities 1.0% | | | | | | | | |
NextEra Energy Inc. | | | 5,400 | | | | 1,307,664 | |
| | | | | | | | |
| | |
Total Common Stocks (Cost $66,198,743) | | | | | | | 127,133,863 | |
| | | | | | | | |
| | |
Short Term Investments 2.1% | | | | | | | | |
| | |
Money Market Funds (Cost $2,694,405) 2.1% | | | | | | | | |
b,cInstitutional Fiduciary Trust Money Market Portfolio, 1.26% | | | 2,694,405 | | | | 2,694,405 | |
| | | | | | | | |
FRANKLIN TEMPLETON VARIABLE INSURANCE PRODUCTS TRUST
STATEMENT OF INVESTMENTS
Franklin Flex Cap Growth VIP Fund(continued)
| | | | | | | | |
| | | Shares | | | Value | |
| |
| | |
Short Term Investments(continued) | | | | | | | | |
| | |
dInvestments from Cash Collateral Received for Loaned Securities 0.0%† | | | | | | | | |
Money Market Funds (Cost $23,100) 0.0%† | | | | | | | | |
b,cInstitutional Fiduciary Trust Money Market Portfolio, 1.26% | | | 23,100 | | | $ | 23,100 | |
| | | | | | | | |
| | |
Total Investments (Cost $68,916,248) 100.1% | | | | | | | 129,851,368 | |
Other Assets, less Liabilities (0.1)% | | | | | | | (126,461 | ) |
| | | | | | | | |
| | |
Net Assets 100.0% | | | | | | $ | 129,724,907 | |
| | | | | | | | |
See Abbreviations on pageFFC-20.
†Rounds to less than 0.1% of net assets.
aNon-income producing.
bSee Note 3(e) regarding investments in affiliated management investment companies.
cThe rate shown is the annualizedseven-day effective yield at period end.
dSee Note 1(b) regarding securities on loan.
| | | | |
| | | |
FFC-10 | | Annual Report | The accompanying notes are an integral part of these financial statements. | | |
FRANKLIN TEMPLETON VARIABLE INSURANCE PRODUCTS TRUST
FINANCIAL STATEMENTS
Statement of Assets and Liabilities
December 31, 2019
| | | | |
| | | Franklin Flex | |
| | | Cap Growth | |
| | | VIP Fund | |
| |
Assets: | | | | |
Investments in securities: | | | | |
Cost - Unaffiliated issuers | | $ | 66,198,743 | |
Cost -Non-controlled affiliates (Note 3e) | | | 2,717,505 | |
| |
Value - Unaffiliated issuers | | $ | 127,133,863 | |
Value -Non-controlled affiliates (Note 3e) | | | 2,717,505 | |
Receivables: | | | | |
Investment securities sold (includes securities loaned in the amount of $19,107) | | | 19,107 | |
Capital shares sold | | | 67,540 | |
Dividends | | | 50,283 | |
Other assets | | | 13 | |
| |
Total assets | | | 129,988,311 | |
Liabilities: | | | | |
Payables: | | | | |
Capital shares redeemed | | | 79,133 | |
Management fees | | | 60,634 | |
Distribution fees | | | 29,996 | |
Reports to shareholders | | | 35,645 | |
Professional fees | | | 33,018 | |
Payable upon return of securities loaned | | | 23,100 | |
Accrued expenses and other liabilities | | | 1,878 | |
| |
Total liabilities | | | 263,404 | |
| |
Net assets, at value | | $ | 129,724,907 | |
Net assets consist of: | | | | |
Paid-in capital | | $ | 60,404,501 | |
Total distributable earnings (losses) | | | 69,320,406 | |
| |
Net assets, at value | | $ | 129,724,907 | |
Class 2: | | | | |
Net assets, at value | | $ | 97,964,104 | |
Shares outstanding | | | 12,152,762 | |
Net asset value and maximum offering price per share | | | $8.06 | |
Class 4: | | | | |
Net assets, at value | | $ | 31,760,803 | |
Shares outstanding | | | 4,120,259 | |
Net asset value and maximum offering price per share | | | $7.71 | |
| | | | |
| | | |
| | The accompanying notes are an integral part of these financial statements. | Annual Report | | FFC-11 |
FRANKLIN TEMPLETON VARIABLE INSURANCE PRODUCTS TRUST
FINANCIAL STATEMENTS
Statement of Operations
for the year ended December 31, 2019
| | | | |
| | | Franklin Flex | |
| | | Cap Growth | |
| | | VIP Fund | |
| |
| |
Investment income: | | | | |
Dividends: | | | | |
Unaffiliated issuers | | $ | 810,522 | |
Non-controlled affiliates (Note 3e) | | | 71,907 | |
Income from securities loaned: | | | | |
Unaffiliated issuers (net of fees and rebates) | | | 52,368 | |
Non-controlled affiliates (Note 3e) | | | 10,796 | |
| | | | |
| |
Total investment income | | | 945,593 | |
| | | | |
Expenses: | | | | |
Management fees (Note 3a) | | | 1,211,211 | |
Distribution fees: (Note 3c) | | | | |
Class 2 | | | 229,669 | |
Class 4 | | | 110,806 | |
Custodian fees (Note 4) | | | 1,666 | |
Reports to shareholders | | | 49,889 | |
Professional fees | | | 58,942 | |
Trustees’ fees and expenses | | | 755 | |
Other | | | 7,824 | |
| | | | |
| |
Total expenses | | | 1,670,762 | |
Expense reductions (Note 4) | | | (36 | ) |
Expenses waived/paid by affiliates (Note 3e and 3f) | | | (453,633 | ) |
| | | | |
| |
Net expenses | | | 1,217,093 | |
| | | | |
| |
Net investment income (loss) | | | (271,500 | ) |
| | | | |
Realized and unrealized gains (losses): | | | | |
Net realized gain (loss) from: | | | | |
Investments: | | | | |
Unaffiliated issuers | | | 8,427,290 | |
| | | | |
Net change in unrealized appreciation (depreciation) on: | | | | |
Investments: | | | | |
Unaffiliated issuers | | | 22,895,498 | |
| | | | |
| |
Net realized and unrealized gain (loss) | | | 31,322,788 | |
| | | | |
| |
Net increase (decrease) in net assets resulting from operations | | $ | 31,051,288 | |
| | | | |
| | | | |
| | | |
FFC-12 | | Annual Report | The accompanying notes are an integral part of these financial statements. | | |
FRANKLIN TEMPLETON VARIABLE INSURANCE PRODUCTS TRUST
FINANCIAL STATEMENTS
Statements of Changes in Net Assets
| | | | | | | | |
| | | Franklin Flex Cap | |
| | | Growth VIP Fund | |
| | | | |
| | | Year Ended December 31, | |
| | | | |
| | | 2019 | | | 2018 | |
| |
| | |
Increase (decrease) in net assets: | | | | | | | | |
Operations: | | | | | | | | |
Net investment income (loss) | | $ | (271,500 | ) | | $ | (278,068 | ) |
Net realized gain (loss) | | | 8,427,290 | | | | 6,194,237 | |
Net change in unrealized appreciation (depreciation) | | | 22,895,498 | | | | (2,119,037 | ) |
| | | | |
| | |
Net increase (decrease) in net assets resulting from operations | | | 31,051,288 | | | | 3,797,132 | |
| | | | |
Distributions to shareholders: | | | | | | | | |
Class 2 | | | (4,527,605 | ) | | | (15,220,091 | ) |
Class 4 | | | (1,613,765 | ) | | | (5,742,189 | ) |
| | | | |
| | |
Total distributions to shareholders | | | (6,141,370 | ) | | | (20,962,280 | ) |
| | | | |
Capital share transactions: (Note 2) | | | | | | | | |
Class 2 | | | 10,720,742 | | | | 414,873 | |
Class 4 | | | (4,820,540 | ) | | | 4,469,506 | |
| | | | |
| | |
Total capital share transactions | | | 5,900,202 | | | | 4,884,379 | |
| | | | |
Net increase (decrease) in net assets | | | 30,810,120 | | | | (12,280,769 | ) |
Net assets: | | | | | | | | |
Beginning of year | | | 98,914,787 | | | | 111,195,556 | |
| | | | |
| | |
End of year | | $ | 129,724,907 | | | $ | 98,914,787 | |
| | | | |
| | | | |
| | | |
| | The accompanying notes are an integral part of these financial statements. | Annual Report | | FFC-13 |
FRANKLIN TEMPLETON VARIABLE INSURANCE PRODUCTS TRUST
Notes to Financial Statements
Franklin Flex Cap Growth VIP Fund
1. Organization and Significant Accounting Policies
Franklin Templeton Variable Insurance Products Trust (Trust) is registered under the Investment Company Act of 1940 (1940 Act) as an open-end management investment company, consisting of eighteen separate funds and applies the specialized accounting and reporting guidance in U.S. Generally Accepted Accounting Principles (U.S. GAAP). Franklin Flex Cap Growth VIP Fund (Fund) is included in this report. Shares of the Fund are generally sold only to insurance company separate accounts to fund the benefits of variable life insurance policies or variable annuity contracts. The Fund offers two classes of shares: Class 2 and Class 4. Each class of shares may differ by its distribution fees, voting rights on matters affecting a single class and its exchange privilege.
The following summarizes the Fund’s significant accounting policies.
a. Financial Instrument Valuation
The Fund’s investments in financial instruments are carried at fair value daily. Fair value is the price that would be received to sell an asset or paid to transfer a liability in an orderly transaction between market participants on the measurement date. The Fund calculates the net asset value (NAV) per share each business day as of 4 p.m. Eastern time or the regularly scheduled close of the New York Stock Exchange (NYSE), whichever is earlier. Under compliance policies and procedures approved by the Trust’s Board of Trustees (the Board), the Fund’s administrator has responsibility for oversight of valuation, including leading the cross-functional Valuation Committee (VC). The Fund may utilize independent pricing services, quotations from securities and financial instrument dealers, and other market sources to determine fair value.
Equity securities listed on an exchange or on the NASDAQ National Market System are valued at the last quoted sale price or the official closing price of the day, respectively. Foreign equity securities are valued as of the close of trading on the foreign stock exchange on which the security is primarily traded, or as of 4 p.m. Eastern time. The value is then converted into its U.S. dollar equivalent at the foreign exchange rate in effect at 4 p.m. Eastern time on the day that the value of the security is determined. Over-the-counter (OTC) securities are valued within the range of the most recent quoted bid and ask prices. Securities that trade in multiple markets or on multiple exchanges are valued
according to the broadest and most representative market. Certain equity securities are valued based upon fundamental characteristics or relationships to similar securities.
Investments in open-end mutual funds are valued at the closing NAV.
The Fund has procedures to determine the fair value of financial instruments for which market prices are not reliable or readily available. Under these procedures, the Fund primarily employs a market-based approach which may use related or comparable assets or liabilities, recent transactions, market multiples, book values, and other relevant information for the investment to determine the fair value of the investment. An income-based valuation approach may also be used in which the anticipated future cash flows of the investment are discounted to calculate fair value. Discounts may also be applied due to the nature or duration of any restrictions on the disposition of the investments. Due to the inherent uncertainty of valuations of such investments, the fair values may differ significantly from the values that would have been used had an active market existed.
Trading in securities on foreign securities stock exchanges and OTC markets may be completed before 4 p.m. Eastern time. In addition, trading in certain foreign markets may not take place on every Fund’s business day. Occasionally, events occur between the time at which trading in a foreign security is completed and 4 p.m. Eastern time that might call into question the reliability of the value of a portfolio security held by the Fund. As a result, differences may arise between the value of the Fund’s portfolio securities as determined at the foreign market close and the latest indications of value at 4 p.m. Eastern time. In order to minimize the potential for these differences, the VC monitors price movements following the close of trading in foreign stock markets through a series of country specific market proxies (such as baskets of American Depositary Receipts, futures contracts and exchange traded funds). These price movements are measured against established trigger thresholds for each specific market proxy to assist in determining if an event has occurred that may call into question the reliability of the values of the foreign securities held by the Fund. If such an event occurs, the securities may be valued using fair value procedures, which may include the use of independent pricing services.
FRANKLIN TEMPLETON VARIABLE INSURANCE PRODUCTS TRUST
NOTES TO FINANCIAL STATEMENTS
Franklin Flex Cap Growth VIP Fund(continued)
When the last day of the reporting period is a non-business day, certain foreign markets may be open on those days that the Fund’s NAV is not calculated, which could result in differences between the value of the Fund’s portfolio securities on the last business day and the last calendar day of the reporting period. Any significant security valuation changes due to an open foreign market are adjusted and reflected by the Fund for financial reporting purposes.
b. Securities Lending
The Fund participates in an agency based securities lending program to earn additional income. The Fund receives cash collateral against the loaned securities in an amount equal to at least 102% of the fair value of the loaned securities. Collateral is maintained over the life of the loan in an amount not less than 100% of the fair value of loaned securities, as determined at the close of Fund business each day; any additional collateral required due to changes in security values is delivered to the Fund on the next business day. The collateral is deposited into a joint cash account with other funds and is used to invest in a money market fund managed by Franklin Advisers, Inc., an affiliate of the Fund. The Fund may receive income from the investment of cash collateral, in addition to lending fees and rebates paid by the borrower. Income from securities loaned, net of fees paid to the securities lending agent and/or third-party vendor, is reported separately in the Statement of Operations. The Fund bears the market risk with respect to the collateral investment, securities loaned, and the risk that the agent may default on its obligations to the Fund. If the borrower defaults on its obligation to return the securities loaned, the Fund has the right to repurchase the securities in the open market using the collateral received. The securities lending agent has agreed to indemnify the Fund in the event of default by a third party borrower. At December 31, 2019, the Fund had no securities on loan.
c. Income and Deferred Taxes
It is the Fund’s policy to qualify as a regulated investment company under the Internal Revenue Code. The Fund intends to distribute to shareholders substantially all of its taxable income and net realized gains to relieve it from federal income and if applicable, excise taxes. As a result, no provision for U.S. federal income taxes is required.
The Fund may be subject to foreign taxation related to income received, capital gains on the sale of securities and certain foreign currency transactions in the foreign
jurisdictions in which it invests. Foreign taxes, if any, are recorded based on the tax regulations and rates that exist in the foreign markets in which the Fund invests. When a capital gain tax is determined to apply, the Fund records an estimated deferred tax liability in an amount that would be payable if the securities were disposed of on the valuation date.
The Fund may recognize an income tax liability related to its uncertain tax positions under U.S. GAAP when the uncertain tax position has a less than 50% probability that it will be sustained upon examination by the tax authorities based on its technical merits. As of December 31, 2019, the Fund has determined that no tax liability is required in its financial statements related to uncertain tax positions for any open tax years (or expected to be taken in future tax years). Open tax years are those that remain subject to examination and are based on the statute of limitations in each jurisdiction in which the Fund invests.
d. Security Transactions, Investment Income, Expenses and Distributions
Security transactions are accounted for on trade date. Realized gains and losses on security transactions are determined on a specific identification basis. Estimated expenses are accrued daily. Dividend income is recorded on the ex-dividend date except for certain dividends from securities where the dividend rate is not available. In such cases, the dividend is recorded as soon as the information is received by the Fund. Distributions to shareholders are recorded on the ex-dividend date. Distributable earnings are determined according to income tax regulations (tax basis) and may differ from earnings recorded in accordance with U.S. GAAP. These differences may be permanent or temporary. Permanent differences are reclassified among capital accounts to reflect their tax character. These reclassifications have no impact on net assets or the results of operations. Temporary differences are not reclassified, as they may reverse in subsequent periods.
Common expenses incurred by the Trust are allocated among the Funds based on the ratio of net assets of each Fund to the combined net assets of the Trust or based on the ratio of number of shareholders of each Fund to the combined number of shareholders of the Trust. Fund specific expenses are charged directly to the Fund that incurred the expense.
FRANKLIN TEMPLETON VARIABLE INSURANCE PRODUCTS TRUST
NOTES TO FINANCIAL STATEMENTS
Franklin Flex Cap Growth VIP Fund(continued)
1. Organization and Significant Accounting Policies(continued)
d. Security Transactions, Investment Income, Expenses and Distributions(continued)
Realized and unrealized gains and losses and net investment income, excluding class specific expenses, are allocated daily to each class of shares based upon the relative proportion of net assets of each class. Differences in per share distributions by class are generally due to differences in class specific expenses.
e. Accounting Estimates
The preparation of financial statements in accordance with U.S. GAAP requires management to make estimates and assumptions that affect the reported amounts of assets and
liabilities at the date of the financial statements and the amounts of income and expenses during the reporting period. Actual results could differ from those estimates.
f. Guarantees and Indemnifications
Under the Trust’s organizational documents, its officers and trustees are indemnified by the Trust against certain liabilities arising out of the performance of their duties to the Trust. Additionally, in the normal course of business, the Trust, on behalf of the Fund, enters into contracts with service providers that contain general indemnification clauses. The Trust’s maximum exposure under these arrangements is unknown as this would involve future claims that may be made against the Trust that have not yet occurred. Currently, the Trust expects the risk of loss to be remote.
2. Shares of Beneficial Interest
At December 31, 2019, there were an unlimited number of shares authorized (without par value). Transactions in the Fund’s shares were as follows:
| | | | | | | | | | | | | | | | |
| | | Year Ended December 31, | |
| | | 2019 | | | 2018 | |
| | | Shares | | | Amount | | | Shares | | | Amount | |
| | | | |
Class 2 Shares: | | | | | | | | | | | | | | | | |
Shares sold | | | 3,678,687 | | | $ | 27,630,014 | | | | 2,321,138 | | | $ | 17,811,401 | |
Shares issued in reinvestment of distributions | | | 606,105 | | | | 4,527,605 | | | | 2,079,248 | | | | 15,220,091 | |
Shares redeemed | | | (2,846,348 | ) | | | (21,436,877 | ) | | | (4,549,773 | ) | | | (32,616,619 | ) |
| | | | |
Net increase (decrease) | | | 1,438,444 | | | $ | 10,720,742 | | | | (149,387 | ) | | $ | 414,873 | |
| | | | |
Class 4 Shares: | | | | | | | | | | | | | | | | |
Shares sold | | | 406,751 | | | $ | 2,950,254 | | | | 1,392,557 | | | $ | 10,306,262 | |
Shares issued in reinvestment of distributions | | | 226,017 | | | | 1,613,765 | | | | 816,812 | | | | 5,742,189 | |
Shares redeemed | | | (1,300,636 | ) | | | (9,384,559 | ) | | | (1,595,007 | ) | | | (11,578,945 | ) |
| | | | |
Net increase (decrease) | | | (667,868 | ) | | $ | (4,820,540 | ) | | | 614,362 | | | $ | 4,469,506 | |
FRANKLIN TEMPLETON VARIABLE INSURANCE PRODUCTS TRUST
NOTES TO FINANCIAL STATEMENTS
Franklin Flex Cap Growth VIP Fund(continued)
3. Transactions with Affiliates
Franklin Resources, Inc. is the holding company for various subsidiaries that together are referred to as Franklin Templeton. Certain officers and trustees of the Fund are also officers and/or directors of the following subsidiaries:
| | |
| Subsidiary | | Affiliation |
Franklin Advisers, Inc. (Advisers) | | Investment manager |
Franklin Templeton Services, LLC (FT Services) | | Administrative manager |
Franklin Templeton Distributors, Inc. (Distributors) | | Principal underwriter |
Franklin Templeton Investor Services, LLC (Investor Services) | | Transfer agent |
a. Management Fees
The Fund pays an investment management fee to Advisers based on the average daily net assets of the Fund as follows:
| | |
| Annualized Fee Rate | | Net Assets |
1.000% | | Up to and including $100 million |
0.900% | | Over $100 million, up to and including $250 million |
0.850% | | Over $250 million, up to and including $10 billion |
0.800% | | Over $10 billion, up to and including $12.5 billion |
0.775% | | Over $12.5 billion, up to and including $15 billion |
0.750% | | In excess of $15 billion |
For the year ended December 31, 2019, the gross effective investment management fee rate was 0.980% of the Fund’s average daily net assets.
b. Administrative Fees
Under an agreement with Advisers, FT Services provides administrative services to the Fund. The fee is paid by Advisers based on the Fund’s average daily net assets, and is not an additional expense of the Fund.
c. Distribution Fees
The Board has adopted distribution plans for Class 2 and Class 4 shares pursuant to Rule 12b-1 under the 1940 Act. Under the Fund’s compensation distribution plans, the Fund pays Distributors for costs incurred in connection with the servicing, sale and distribution of the Fund’s shares up to 0.35% per year of its average daily net assets of Class 2 and Class 4, respectively. The Board has agreed to limit the current rate to 0.25% per year for Class 2. The plan year, for purposes of monitoring compliance with the maximum annual plan rates, is February 1 through January 31.
d. Transfer Agent Fees
Investor Services, under terms of an agreement, performs shareholder servicing for the Fund and is not paid by the Fund for the services.
FRANKLIN TEMPLETON VARIABLE INSURANCE PRODUCTS TRUST
NOTES TO FINANCIAL STATEMENTS
Franklin Flex Cap Growth VIP Fund(continued)
3. Transactions with Affiliates(continued)
e. Investments in Affiliated Management Investment Companies
The Fund invests in one or more affiliated management investment companies for purposes other than exercising a controlling influence over the management or policies. Management fees paid by the Fund are waived on assets invested in the affiliated management investment companies, as noted in the Statement of Operations, in an amount not to exceed the management and administrative fees paid directly or indirectly by each affiliate. During the year ended December 31, 2019, the Fund held investments in affiliated management investment companies as follows:
| | | | | | | | | | | | | | | | | | | | | | | | | | | | | | | | |
| | | Value at Beginning of Year | | | Purchases | | | Sales | | | Realized Gain (Loss) | | | Net Change in Unrealized Appreciation (Depreciation) | | | Value at End of Year | | | Number of Shares Held at End of Year | | | Investment Income | |
Non-Controlled Affiliates | | | | | | | | | | | | | | | | | | | | | | | | | | | | | | | | |
| | | | | | | | |
| | | | | | | | | | | | | | | | | | | | | | | | | | | | | | | Dividends | |
| | | | | | | | |
Institutional Fiduciary Trust Money Market Portfolio, 1.26% | | $ | 639 | | | $ | 40,160,893 | | | $ | (37,467,127 | ) | | | $ — | | | | $ — | | | $ | 2,694,405 | | | | 2,694,405 | | | | $71,907 | |
| | | | | | | | |
| | | | | | | | | | | | | | | | | | | | | | | | Income from | |
| | | | | | | | | | | | | | | | | | | | | | | | securities | |
| | | | | | | | | | | | | | | | | | | | | | | | loaned | |
| | | | | | | | |
Institutional Fiduciary Trust Money Market Portfolio, 1.26% | | | 107,250 | | | | 7,823,615 | | | | (7,907,765 | ) | | | — | | | | — | | | | 23,100 | | | | 23,100 | | | | 10,796 | |
| | | | | | | | |
Total Affiliated Securities | | $ | 107,889 | | | $ | 47,984,508 | | | $ | (45,374,892 | ) | | | $ — | | | | $ — | | | $ | 2,717,505 | | | | | | | | $82,703 | |
f. Waiver and Expense Reimbursements
Advisers have contractually agreed in advance to waive or limit its fees and to assume as its own expense certain expenses otherwise payable by the Fund so that the expenses (excluding distribution fees and acquired fund fees and expenses and certain non-routine expenses or costs, including those relating to litigation, indemnification, reorganizations, and liquidations) for each class of the Fund does not exceed 0.71% based on the average net assets of each class until April 30, 2020. Total expenses waived or paid are not subject to recapture subsequent to the Fund’s fiscal year end.
4. Expense Offset Arrangement
The Fund has entered into an arrangement with its custodian whereby credits realized as a result of uninvested cash balances are used to reduce a portion of the Fund’s custodian expenses. During the year ended December 31, 2019, the custodian fees were reduced as noted in the Statement of Operations.
5. Income Taxes
The tax character of distributions paid during the years ended December 31, 2019 and 2018, was as follows:
| | | | | | | | |
| | | 2019 | | | 2018 | |
| | |
Distributions paid from: | | | | | | | | |
Long term capital gain | | | 6,141,370 | | | | 20,962,280 | |
FRANKLIN TEMPLETON VARIABLE INSURANCE PRODUCTS TRUST
NOTES TO FINANCIAL STATEMENTS
Franklin Flex Cap Growth VIP Fund(continued)
At December 31, 2019, the cost of investments, net unrealized appreciation (depreciation) and undistributed long term capital gains for income tax purposes were as follows:
| | | | |
Cost of investments | | $ | 68,935,482 | |
| |
Unrealized appreciation | | $ | 61,494,290 | |
Unrealized depreciation | | | (578,404 | ) |
| |
Net unrealized appreciation (depreciation) | | $ | 60,915,886 | |
| |
Distributable earnings: | | | | |
Undistributed long term capital gains | | $ | 8,404,520 | |
Differences between income and/or capital gains as determined on a book basis and a tax basis are primarily due to differing treatment of wash sales.
6. Investment Transactions
Purchases and sales (excluding short term securities) for the year ended December 31, 2019, aggregated $31,226,320 and $31,237,329, respectively.
At December 31, 2019, in connection with securities lending transactions, the Fund loaned equity investments and received $23,100 of cash collateral. The gross amount of recognized liability for such transactions is included in payable upon return of securities loaned in the Statement of Assets and Liabilities. The agreements can be terminated at any time.
7. Credit Facility
The Fund, together with other U.S. registered and foreign investment funds (collectively, Borrowers), managed by Franklin Templeton, are borrowers in a joint syndicated senior unsecured credit facility totaling $2 billion (Global Credit Facility) which matured on February 7, 2020. This Global Credit Facility provides a source of funds to the Borrowers for temporary and emergency purposes, including the ability to meet future unanticipated or unusually large redemption requests. Effective February 7, 2020, the Borrowers renewed the Global Credit Facility for a one year term, maturing February 5, 2021, for a total of $2 billion.
Under the terms of the Global Credit Facility, the Fund shall, in addition to interest charged on any borrowings made by the Fund and other costs incurred by the Fund, pay its share of fees and expenses incurred in connection with the implementation and maintenance of the Global Credit Facility, based upon its relative share of the aggregate net assets of all of the Borrowers, including an annual commitment fee of 0.15% based upon the unused portion of the Global Credit Facility. These fees are reflected in other expenses in the Statement of Operations. During the year ended December 31, 2019, the Fund did not use the Global Credit Facility.
8. Fair Value Measurements
The Fund follows a fair value hierarchy that distinguishes between market data obtained from independent sources (observable inputs) and the Fund’s own market assumptions (unobservable inputs). These inputs are used in determining the value of the Fund’s financial instruments and are summarized in the following fair value hierarchy:
| | • | | Level 1 – quoted prices in active markets for identical financial instruments |
| | • | | Level 2 – other significant observable inputs (including quoted prices for similar financial instruments, interest rates, prepayment speed, credit risk, etc.) |
FRANKLIN TEMPLETON VARIABLE INSURANCE PRODUCTS TRUST
NOTES TO FINANCIAL STATEMENTS
Franklin Flex Cap Growth VIP Fund(continued)
8. Fair Value Measurements(continued)
| | • | | Level 3 – significant unobservable inputs (including the Fund’s own assumptions in determining the fair value of financial instruments) |
The input levels are not necessarily an indication of the risk or liquidity associated with financial instruments at that level.
At December 31, 2019, all of the Fund’s investments in financial instruments carried at fair value were valued using Level 1 inputs. For detailed categories, see the accompanying Statement of Investments.
9. Subsequent Events
The Fund has evaluated subsequent events through the issuance of the financial statements and determined that no events have occurred that require disclosure other than those already disclosed in the financial statements.
Abbreviations
Selected Portfolio
ADR American Depositary Receipt
FRANKLIN TEMPLETON VARIABLE INSURANCE PRODUCTS TRUST
Report of Independent Registered Public Accounting Firm
To the Board of Trustees of Franklin Templeton Variable Insurance Products Trust and Shareholders of Franklin Flex Cap Growth VIP Fund
Opinion on the Financial Statements
We have audited the accompanying statement of assets and liabilities, including the statement of investments, of Franklin Flex Cap Growth VIP Fund (the “Fund”) as of December 31, 2019, the related statement of operations for the year ended December 31, 2019, the statement of changes in net assets for each of the two years in the period ended December 31, 2019, including the related notes, and the financial highlights for each of the five years in the period ended December 31, 2019 (collectively referred to as the “financial statements”). In our opinion, the financial statements present fairly, in all material respects, the financial position of the Fund as of December 31, 2019, the results of its operations for the year then ended, the changes in its net assets for each of the two years in the period ended December 31, 2019 and the financial highlights for each of the five years in the period ended December 31, 2019 in conformity with accounting principles generally accepted in the United States of America.
Basis for Opinion
These financial statements are the responsibility of the Fund’s management. Our responsibility is to express an opinion on the Fund’s financial statements based on our audits. We are a public accounting firm registered with the Public Company Accounting Oversight Board (United States) (PCAOB) and are required to be independent with respect to the Fund in accordance with the U.S. federal securities laws and the applicable rules and regulations of the Securities and Exchange Commission and the PCAOB.
We conducted our audits of these financial statements in accordance with the standards of the PCAOB. Those standards require that we plan and perform the audit to obtain reasonable assurance about whether the financial statements are free of material misstatement, whether due to error or fraud.
Our audits included performing procedures to assess the risks of material misstatement of the financial statements, whether due to error or fraud, and performing procedures that respond to those risks. Such procedures included examining, on a test basis, evidence regarding the amounts and disclosures in the financial statements. Our audits also included evaluating the accounting principles used and significant estimates made by management, as well as evaluating the overall presentation of the financial statements. Our procedures included confirmation of securities owned as of December 31, 2019 by correspondence with the custodian and transfer agent. We believe that our audits provide a reasonable basis for our opinion.
PricewaterhouseCoopers LLP
San Francisco, California
February 20, 2020
We have served as the auditor of one or more investment companies in the Franklin Templeton Group of Funds since 1948.
This page intentionally left blank.
Franklin Income VIP Fund
This annual report for Franklin Income VIP Fund covers the fiscal year ended December 31, 2019.
Class 4 Performance Summary as of December 31, 2019
Average annual total return of Class 4 shares* represents the average annual change in value, assuming reinvestment of dividends and capital gains. Average returns smooth out variations in returns, which can be significant; they are not the same as year-by-year results.
| | | | | | | | | | | | |
| Periods ended 12/31/19 | | 1-Year | | | 5-Year | | | 10-Year | |
| | | |
Average Annual Total Return | | | +16.05% | | | | +5.14% | | | | +7.08% | |
*The Fund has a fee waiver associated with any investment it makes in a Franklin Templeton money fund and/or other Franklin Templeton fund, contractually guaranteed through 4/30/20. Fund investment results reflect the fee waiver; without this waiver, the results would have been lower.
Performance reflects the Fund’s Class 4 operating expenses, but doesnot include any contract fees, expenses or sales charges. If they had been included, performance would be lower. These charges and deductions, particularly for variable life policies, can have a significant effect on contract values and insurance benefits. See the contract prospectus for a complete description of these expenses, including sales charges.
Performance data represent past performance, which does not guarantee future results. Investment return and principal value will fluctuate, and you may have a gain or loss when you sell your shares. Current performance may differ from figures shown.
Total Return Index Comparison for a Hypothetical $10,000 Investment (1/1/10–12/31/19)
The graph below shows the change in value of a hypothetical $10,000 investment in the Fund over the indicated period and includes reinvestment of any income or distributions. The Fund’s performance* is compared to the performance of the Standard & Poor’s® 500 Index (S&P 500®), the Fund’s Blended Benchmark and the Bloomberg Barclays U.S. Aggregate Bond Index. One cannot invest directly in an index, and an index is not representative of the Fund’s portfolio.Please see Important Notes toPerformance Information preceding the Fund Summaries.
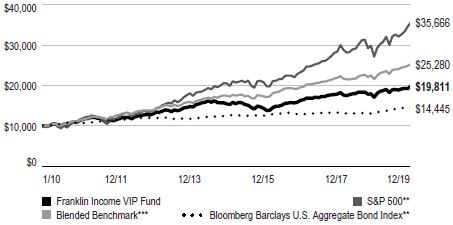
**Source: Morningstar. Please see Index Descriptions following the Fund Summaries.
***Source: FactSet. The Fund’s Blended Benchmark was calculated internally and rebalanced monthly and was composed of 50% MSCI USA High Dividend Yield Index + 25% Bloomberg Barclays High Yield Very Liquid Index + 25% Bloomberg Barclays U.S. Aggregate Bond Index. Please see Index Descriptions following the Fund Summaries.
FRANKLIN INCOME VIP FUND
Fund Goal and Main Investments
The Fund seeks to maximize income, while maintaining prospects for capital appreciation. Under normal market conditions, the Fund invests in a diversified portfolio of debt and equity securities.
Fund Risks
All investments involve risks, including possible loss of principal. Stock prices fluctuate, sometimes rapidly and dramatically, due to factors affecting individual companies, particular industries or sectors, or general market conditions. The Fund’s portfolio includes a substantial portion of higher yielding, lower rated corporate bonds because of the relatively higher yields they offer. The Fund’s share price and yield will be affected by interest rate movements. Bond prices generally move in the opposite direction of interest rates. Thus, as prices of bonds in the Fund adjust to a rise in interest rates, the Fund’s share price may decline. Changes in the financial strength of a bond issuer or in a bond’s credit rating may affect its value. Foreign investing carries additional risks such as currency and market volatility and political or social instability, risks that are heightened in developing countries. The Fund is actively managed but there is no guarantee that the manager’s investment decisions will produce the desired results. The Fund’s prospectus also includes a description of the main investment risks.
Performance Overview
You can find the Fund’s one-year total return in the Performance Summary. In comparison, the Fund’s primary benchmark, the S&P 500 posted a +31.49% total return.1 The Fund’s new secondary benchmark, the Blended Benchmark, posted a +17.28% total return.2 The Fund’s old secondary benchmark, the Bloomberg Barclays U.S. Aggregate Bond Index posted a +8.72% total return.1 We believe the new second benchmark’s composition more accurately reflects the Fund’s holdings.
Economic and Market Overview
Bond prices rose sharply during the reporting period, as interest-rate cuts and many investors’ search for income
Portfolio Composition
12/31/19
| | |
| | | % of Total
Net Assets |
| |
Equity | | 51.4% |
| |
Financials | | 9.7% |
| |
Information Technology | | 8.4% |
| |
Health Care | | 7.5% |
| |
Utilities | | 6.4% |
| |
Energy | | 5.7% |
| |
Consumer Staples | | 3.5% |
| |
Communication Services | | 3.1% |
| |
Consumer Discretionary | | 3.0% |
| |
Materials | | 2.0% |
| |
Industrials | | 1.5% |
| |
Real Estate | | 0.6% |
| |
Fixed Income* | | 46.4% |
| |
Health Care | | 14.1% |
| |
Financials | | 14.1% |
| |
Energy | | 5.9% |
| |
Communication Services | | 4.9% |
| |
Consumer Discretionary | | 2.3% |
| |
Materials | | 1.5% |
| |
Consumer Staples | | 1.1% |
| |
Industrials | | 0.8% |
| |
Utilities | | 0.8% |
| |
Real Estate | | 0.6% |
| |
Information Technology | | 0.3% |
| |
Short-Term Investments & Other Net Assets | | 2.2% |
*Includes senior floating rate interests.
pushed down yields on most bond categories. Notably, U.S. bonds, as measured by the Bloomberg Barclays U.S. Aggregate Bond Index, performed well alongside high returns from U.S. equities, as measured by the S&P 500.
The primary driver of U.S. bond performance was a shift in the U.S. Federal Reserve’s (Fed’s) monetary policy. After a period of tightening in 2018, the Fed shifted course, announcing in January 2019 that it would not be raising interest rates in the near future. Three interest-rate cuts
1. Source: Morningstar.
2. Source: FactSet. The Fund’s Blended Benchmark was calculated internally and rebalanced monthly and was composed of 50% MSCI USA High Dividend Yield Index + 25% Bloomberg Barclays High Yield Very Liquid Index + 25% Bloomberg Barclays U.S. Aggregate Bond Index.
One cannot invest directly in an index, and an index is not representative of the Fund’s portfolio. Please see Index Descriptions following the Fund Summaries.
The dollar value, number of shares or principal amount, and names of all portfolio holdings are listed in the Fund’s Statement of Investments (SOI).
FRANKLIN INCOME VIP FUND
followed thereafter, with the Fed lowering the federal funds rate to a range of 1.50%–1.75. Falling interest rates typically increase the value of existing bonds, since their relatively higher yields become more attractive to investors.
Both long-term and short-term U.S. bonds, as measured by subindexes of the Bloomberg Barclays U.S. Aggregate Bond Index, gained during the period, with long-term bonds posting stronger returns due to their higher sensitivity to interest-rate changes. Interest rates on long-term U.S. Treasuries initially fell more than interest rates on short-term U.S. Treasuries, leading to a flattening of the yield curve, which charts the yields of U.S. Treasuries at varying maturity dates. In August 2019, the yield on 10-year U.S. Treasuries fell below the yield on two-year U.S. Treasuries. While some investors considered this inversion a sign that the economy was moving toward a recession, the two-year and 10-year U.S. Treasury yield curve steepened again shortly thereafter amid positive economic signals.
U.S. Treasury bonds, as measured by the Bloomberg Barclays U.S. Treasury Index, gained during the period, which was characterized by high levels of Treasury issuance due to the government’s deficit spending. A strong U.S. dollar during most of the period and comparatively higher Treasury yields relative to sovereign debt issued by other developed market countries made Treasuries attractive to foreign investors.
Corporate bonds also posted noteworthy returns, driven by the combination of a relatively strong economy and lower interest rates. Both investment-grade and high-yield corporate bonds gained significantly, as measured by the Bloomberg Barclays U.S. Corporate Bond Index and Bloomberg Barclays U.S. Corporate High Yield Bond Index, respectively, as solid corporate profits and steady economic growth helped strengthen investors’ confidence in corporate creditworthiness. The positive environment for debt extended to mortgage-backed securities, as prepayments due to homeowner refinancing declined after hitting a three-year high in August 2019.
Investment Strategy
In analyzing debt and equity securities, we consider such factors as a company’s experience and managerial strength; responsiveness to changes in interest rates and business conditions; debt maturity schedules and borrowing requirements; changing financial condition and market recognition of the change; and a security’s relative value based on such factors as anticipated cash flow, interest or dividend coverage, asset coverage and earnings. When choosing investments for the Fund, we apply a bottom-up,
Top Five Equity Holdings
12/31/19
| | |
Company Sector/Industry | | % of Total
Net Assets |
| |
The Southern Co. Utilities | | 2.3% |
| |
JPMorgan Chase & Co. Financials | | 2.1% |
| |
Wells Fargo & Co. Financials | | 1.8% |
| |
Dominion Energy Inc. Utilities | | 1.7% |
| |
Verizon Communications Inc. Communication Services | | 1.5% |
value oriented, long-term approach, focusing on the market price of a company’s securities relative to the investment manager’s evaluation of the company’s long-term earnings, asset value and cash flow potential.
Manager’s Discussion
Following a volatile period of market performance at the end of 2018, the Federal Reserve’s policy pause and ultimate pivot to reducing the federal funds rate three times during 2019 helped reverse declines and fueled both the equity and fixed income markets during the reporting period. Supportive monetary policy, the strength of the U.S. consumer and a strong domestic labor market also helped support markets and offset concerns around a slowdown in global economic growth, trade tensions and weakening corporate earnings.
During the period under review, the Fund’s asset mix shifted toward modestly more defensive positioning as we have seen valuations rise and we positioned ourselves for an increased level of uncertainty going forward. Our movement toward more defensive positioning in equities and our increased exposure to higher credit quality positioning on the fixed income side has been undertaken with a keen focus on not sacrificing yield and positioning ourselves to be nimble to seek to take advantage of dislocations that could arise going forward.
The improvement in the equity markets during the period was broad-based, with every sector positively contributing to underlying Fund performance. Monetary policy accommodation led markets higher during the first half of the year and progress toward a trade deal between the U.S. and China further bolstered equity performance late in the year. At the sector level, leading contributors included information technology, financials and utilities. The Fund’s leading individual contributors included holdings in the utilities sector,
FRANKLIN INCOME VIP FUND
such as the Southern Company and Sempra Energy, which benefited from declining interest rates. Additionally, Apple in information technology and Target in consumer discretionary were key positive contributors. Energy holdings were the only detractors on the equity side including Occidental Petroleum, Weatherford International and Chesapeake Energy. The Fund’s focus on volatility management was also a detractor during the period as equity index positions detracted from returns in a period of strong equity market performance.
Top Five Fixed Income Holdings
and Senior Floating Rate Interests
12/31/19
| | |
Company Sector/Industry | | % of Total Net Assets |
| |
U.S. Treasury Note Financials | | 7.2% |
| |
CHS/Community Health Systems Inc. Health Care | | 5.5% |
| |
Tenet Healthcare Corp. Health Care | | 2.9% |
| |
GNMA II SF 30 Year Financials | | 2.3% |
| |
Chesapeake Energy Corp. Energy | | 2.3% |
Declining credit spreads and lower interest rates throughout the year led to positive performance from fixed income markets during the period. The Fund’s overweight position in relatively short duration credit exposure and generally underweight position in higher quality, longer-duration fixed income assets were the primary detractors from performance relative to the benchmark. All sectors were positive contributors in fixed income, excluding energy, which struggled during the 12-month period due to rising credit spreads. Notable outperformers were health care, communication services and financials. Holdings of U.S. Treasury securities boosted returns during the period as did hospital management companies Community Health Systems and Tenet Healthcare amid improving fundamentals and modest deleveraging. Notable detractors included oil field service and equipment company Weatherford International, which struggled due to weakening demand for their services as well as oil and gas exploration and production company Chesapeake Energy, which struggled partly due to lower expectations for commodity oil and gas prices. Additionally, specialty pharmaceutical company Mallinckrodt was a key detractor partly due to concerns around potential liabilities related to opioid settlements.
Effective February 1, 2020, Matthew Quinlan and Richard Hsu will step off the Fund as portfolio managers. Ed Perks
will continue to lead the Fund and Brendan Circle and Todd Brighton will remain as portfolio managers.
Thank you for your participation in Franklin Income VIP Fund. We look forward to serving your future investment needs.
The foregoing information reflects our analysis, opinions and portfolio holdings as of December 31, 2019, the end of the reporting period. The way we implement our main investment strategies and the resulting portfolio holdings may change depending on factors such as market and economic conditions. These opinions may not be relied upon as investment advice or an offer for a particular security. The information is not a complete analysis of every aspect of any market, country, industry, security or the Fund. Statements of fact are from sources considered reliable, but the investment manager makes no representation or warranty as to their completeness or accuracy. Although historical performance is no guarantee of future results, these insights may help you understand our investment management philosophy.
FRANKLIN INCOME VIP FUND
Class 4 Fund Expenses
As an investor in a variable insurance contract (Contract) that indirectly provides for investment in an underlying mutual fund, you can incur transaction and/or ongoing expenses at both the Fund level and the Contract Level: (1) transaction expenses can include sales charges (loads) on purchases, surrender fees, transfer fees and premium taxes; and (2) ongoing expenses can include management fees, distribution and service (12b-1) fees, contract fees, annual maintenance fees, mortality and expense risk fees and other fees and expenses. All mutual funds and Contracts have some types of ongoing expenses. The table below shows Fund-level ongoing expenses and can help you understand these costs and compare them with those of other mutual funds offered through the Contract. The table assumes a $1,000 investment held for the six months indicated. Please refer to the Fund prospectus for additional information on operating expenses.
Actual Fund Expenses
The table below provides information about the actual account values and actual expenses in the columns under the heading “Actual.” In these columns the Fund’s actual return, which includes the effect of ongoing Fund expenses but does not include the effect of ongoing Contract expenses, is used to calculate the “Ending Account Value.” You can estimate the Fund-level expenses you paid during the period by following these steps (of course, your account value and expenses will differ from those in this illustration): Divide your account value by $1,000 (if your account had an $8,600 value, then $8,600 ÷ $1,000 = 8.6). Then multiply the result by the number under the headings “Actual” and “Fund-Level Expenses Paid During Period” (if Fund-Level Expenses Paid During Period were $ 7.50, then 8.6 x $ 7.50 = $64.50). In this illustration, the estimated expenses paid this period at the Fund level are $64.50.
Hypothetical Example for Comparison with Other Mutual Funds
Under the heading “Hypothetical” in the table, information is provided about hypothetical account values and hypothetical expenses based on the Fund’s actual expense ratio and an assumed rate of return of 5% per year before expenses, which is not the Fund’s actual return. This information may not be used to estimate the actual ending account balance or expenses you paid for the period, but it can help you compare ongoing costs of investing in the Fund with those of other mutual funds offered through the Contract. To do so, compare this 5% hypothetical example with the 5% hypothetical examples that appear in the shareholder reports of other funds offered through the Contract.
Please note that expenses shown in the table are meant to highlight ongoing costs at the Fund level only and do not reflect any ongoing expenses at the Contract level, or transaction expenses at either the Fund or Contract levels. In addition, while the Fund does not have transaction expenses, if the transaction and ongoing expenses at the Contract level were included, the expenses shown below would be higher. You should consult your Contract prospectus or disclosure document for more information.
| | | | | | | | | | | | | | | | | | |
| | | | | | | Actual (actual return after expenses) | | | | Hypothetical (5% annual return before expenses) | | | | |
| | | | | | | | | | | | | | |
Share
Class | | Beginning Account Value 7/1/19 | | | | Ending Account Value 12/31/19 | | Fund-Level Expenses Paid During Period 7/1/19–12/31/191, 2 | | | | Ending Account Value 12/31/19 | | Fund-Level Expenses Paid During Period 7/1/19–12/31/191, 2 | | | | Net Annualized Expense Ratio2 |
| | | | | | | | | | | | |
| Class 4 | | $1,000 | | | | $1,044.80 | | $4.07 | | | | $1,021.22 | | $4.02 | | | | 0.79% |
1. Expenses are equal to the annualized expense ratio for the six-month period as indicated above—in the far right column—multiplied by the simple average account value over the period indicated, and then multiplied by 184/365 to reflect the one-half year period.
2. Reflects expenses after fee waivers and expense reimbursements. Does not include any ongoing expenses of the Contract for which the Fund is an investment option or acquired fund fees and expenses.
FI P1 P2 P4 01/20
SUPPLEMENT DATED JANUARY 27, 2020
TO THE PROSPECTUSES
DATED MAY 1, 2019
FRANKLIN INCOME VIP FUND
(a series of Franklin Templeton Variable Insurance Products Trust)
The prospectuses are amended as follows:
I. The following is added to the “Portfolio Managers” section in the “Fund Summaries – Franklin Income VIP Fund” section on page FI-S5 of the prospectus:
Effective on February 1, 2020, the portfolio managers of the Fund will be as follows:
Edward D. Perks, CFAPresident and Director of Advisers and portfolio manager of the Fund since 2002.
Brendan Circle, CFAPortfolio Manager of Advisers and portfolio manager of the Fund since February 2019.
Todd Brighton, CFAPortfolio Manager of Advisers and portfolio manager of the Fund since 2017.
II. The following is added to the portfolio manager line-up under the “Fund Details – Franklin Income VIP Fund – Management” section on page FI-D9 of the prospectus:
Effective on February 1, 2020, the portfolio managers of the Fund will be as follows:
Edward D. Perks, CFA
President and Director of Advisers
Mr. Perks has been the lead portfolio manager of the Fund since 2002. He has primary responsibility for the investments of the Fund. He has final authority over all aspects of the Fund’s investment portfolio, including but not limited to, purchases and sales of individual securities, portfolio risk assessment, and the management of daily cash balances in accordance with anticipated investment management requirements. The degree to which he may perform these functions, and the nature of these functions, may change from time to time. He joined Franklin Templeton in 1992.
Brendan Circle, CFA
Portfolio Manager of Advisers
Mr. Circle has been a portfolio manager of the Fund since February 2019, providing research and advice on the purchases and sales of individual securities, and portfolio risk assessment. He joined Franklin Templeton in 2014.
Todd Brighton, CFA
Portfolio Manager of Advisers
Mr. Brighton has been a portfolio manager of the Fund since 2017, providing research and advice on the purchases and sales of individual securities, and portfolio risk assessment. He joined Franklin Templeton in 2000.
CFA® and Chartered Financial Analyst® are trademarks owned by CFA Institute.
Please keep this supplement with your prospectus for future reference.
FRANKLIN TEMPLETON VARIABLE INSURANCE PRODUCTS TRUST
Financial Highlights
Franklin Income VIP Fund
| | | | | | | | | | | | | | | | | | |
| | | | | | Year Ended December 31, |
| | | | | |
| | | 2019 | | | 2018 | | | 2017 | | | 2016 | | | 2015 |
| | | | | |
Class 1 | | | | | | | | | | | | | | | | | | |
| | | | | |
Per share operating performance (for a share outstanding throughout the year) | | | | | | | | | | | | | | | | | | |
| | | | | |
Net asset value, beginning of year | | | $15.26 | | | | $16.72 | | | | $15.87 | | | | $14.64 | | | $16.48 |
| | | | | |
Income from investment operationsa: | | | | | | | | | | | | | | | | | | |
| | | | | |
Net investment incomeb | | | 0.75 | | | | 0.71 | | | | 0.69 | | | | 0.67 | | | 0.71 |
| | | | | |
Net realized and unrealized gains (losses) | | | 1.68 | | | | (1.35 | ) | | | 0.87 | | | | 1.34 | | | (1.78) |
| | | | | |
Total from investment operations | | | 2.43 | | | | (0.64 | ) | | | 1.56 | | | | 2.01 | | | (1.07) |
| | | | | |
Less distributions from: | | | | | | | | | | | | | | | | | | |
| | | | | |
Net investment income | | | (0.91 | ) | | | (0.82 | ) | | | (0.71 | ) | | | (0.78 | ) | | (0.77) |
| | | | | |
Net realized gains | | | (0.26 | ) | | | — | | | | — | | | | — | | | — |
| | | | | |
Total distributions | | | (1.17 | ) | | | (0.82 | ) | | | (0.71 | ) | | | (0.78 | ) | | (0.77) |
| | | | | |
Net asset value, end of year | | | $16.52 | | | | $15.26 | | | | $16.72 | | | | $15.87 | | | $14.64 |
| | | | | |
Total returnc | | | 16.42% | | | | (4.09)% | | | | 9.94% | | | | 14.33% | | | (6.84)% |
| | | | | |
Ratios to average net assets | | | | | | | | | | | | | | | | | | |
| | | | | |
Expenses before waiver and payments by affiliates | | | 0.46% | | | | 0.47% | | | | 0.47% | | | | 0.47% | | | 0.46% |
| | | | | |
Expenses net of waiver and payments by affiliatesd | | | 0.45% | | | | 0.45% | | | | 0.45% | | | | 0.44% | | | 0.46%e |
| | | | | |
Net investment income | | | 4.38% | | | | 4.33% | | | | 4.22% | | | | 4.47% | | | 4.47% |
| | | | | |
Supplemental data | | | | | | | | | | | | | | | | | | |
| | | | | |
Net assets, end of year (000’s) | | | $309,330 | | | | $612,657 | | | | $735,149 | | | | $696,227 | | | $604,228 |
| | | | | |
Portfolio turnover rate | | | 25.16% | | | | 43.22% | | | | 20.96% | | | | 39.03% | | | 31.53% |
aThe amount shown for a share outstanding throughout the period may not correlate with the Statement of Operations for the period due to the timing of sales and repurchases of the Fund’s shares in relation to income earned and/or fluctuating fair value of the investments of the Fund.
bBased on average daily shares outstanding.
cTotal return does not include fees, charges or expenses imposed by the variable annuity and life insurance contracts for which Franklin Templeton Variable Insurance Products Trust serves as an underlying investment vehicle.
dBenefit of expense reduction rounds to less than 0.01%.
eBenefit of waiver and payments by affiliates rounds to less than 0.01%.
| | | | |
| | | |
| | The accompanying notes are an integral part of these financial statements. | Annual Report | | FI-7 |
FRANKLIN TEMPLETON VARIABLE INSURANCE PRODUCTS TRUST
FINANCIAL HIGHLIGHTS
Franklin Income VIP Fund(continued)
| | | | | | | | | | | | | | | | | | |
| | | | | | Year Ended December 31, |
| | | | | |
| | | 2019 | | | 2018 | | | 2017 | | | 2016 | | | 2015 |
| | | | | |
Class 2 | | | | | | | | | | | | | | | | | | |
| | | | | |
Per share operating performance (for a share outstanding throughout the year) | | | | | | | | | | | | | | | | | | |
| | | | | |
Net asset value, beginning of year | | | $14.74 | | | | $16.17 | | | | $15.38 | | | | $14.20 | | | $16.00 |
| | | | | |
Income from investment operationsa: | | | | | | | | | | | | | | | | | | |
| | | | | |
Net investment incomeb | | | 0.64 | | | | 0.65 | | | | 0.63 | | | | 0.61 | | | 0.65 |
| | | | | |
Net realized and unrealized gains (losses) | | | 1.66 | | | | (1.30 | ) | | | 0.83 | | | | 1.31 | | | (1.73) |
| | | | | |
Total from investment operations | | | 2.30 | | | | (0.65 | ) | | | 1.46 | | | | 1.92 | | | (1.08) |
| | | | | |
Less distributions from: | | | | | | | | | | | | | | | | | | |
| | | | | |
Net investment income | | | (0.87 | ) | | | (0.78 | ) | | | (0.67 | ) | | | (0.74 | ) | | (0.72) |
| | | | | |
Net realized gains | | | (0.26 | ) | | | — | | | | — | | | | — | | | — |
| | | | | |
Total distributions | | | (1.13 | ) | | | (0.78 | ) | | | (0.67 | ) | | | (0.74 | ) | | (0.72) |
| | | | | |
Net asset value, end of year | | | $15.91 | | | | $14.74 | | | | $16.17 | | | | $15.38 | | | $14.20 |
| | | | | |
Total returnc | | | 16.06% | | | | (4.30)% | | | | 9.67% | | | | 14.02% | | | (7.05)% |
| | | | | |
Ratios to average net assets | | | | | | | | | | | | | | | | | | |
| | | | | |
Expenses before waiver and payments by affiliates | | | 0.71% | | | | 0.72% | | | | 0.72% | | | | 0.72% | | | 0.71% |
| | | | | |
Expenses net of waiver and payments by affiliatesd | | | 0.70% | | | | 0.70% | | | | 0.70% | | | | 0.69% | | | 0.71%e |
| | | | | |
Net investment income | | | 4.13% | | | | 4.08% | | | | 3.97% | | | | 4.22% | | | 4.22% |
| | | | | |
Supplemental data | | | | | | | | | | | | | | | | | | |
| | | | | |
Net assets, end of year (000’s) | | | $4,318,156 | | | | $4,086,652 | | | | $5,041,498 | | | | $5,088,556 | | | $4,907,599 |
| | | | | |
Portfolio turnover rate | | | 25.16% | | | | 43.22% | | | | 20.96% | | | | 39.03% | | | 31.53% |
aThe amount shown for a share outstanding throughout the period may not correlate with the Statement of Operations for the period due to the timing of sales and repurchases of the Fund’s shares in relation to income earned and/or fluctuating fair value of the investments of the Fund.
bBased on average daily shares outstanding.
cTotal return does not include fees, charges or expenses imposed by the variable annuity and life insurance contracts for which Franklin Templeton Variable Insurance Products Trust serves as an underlying investment vehicle.
dBenefit of expense reduction rounds to less than 0.01%.
eBenefit of waiver and payments by affiliates rounds to less than 0.01%.
| | | | |
| | | |
FI-8 | | Annual Report | The accompanying notes are an integral part of these financial statements. | | |
FRANKLIN TEMPLETON VARIABLE INSURANCE PRODUCTS TRUST
FINANCIAL HIGHLIGHTS
Franklin Income VIP Fund(continued)
| | | | | | | | | | | | | | | | | | |
| | | | | | Year Ended December 31, |
| | | | | |
| | | 2019 | | | 2018 | | | 2017 | | | 2016 | | | 2015 |
| | | | | |
Class 4 | | | | | | | | | | | | | | | | | | |
| | | | | |
Per share operating performance (for a share outstanding throughout the year) | | | | | | | | | | | | | | | | | | |
| | | | | |
Net asset value, beginning of year | | | $15.08 | | | | $16.53 | | | | $15.71 | | | | $14.49 | | | $16.31 |
| | | | | |
Income from investment operationsa: | | | | | | | | | | | | | | | | | | |
| | | | | |
Net investment incomeb | | | 0.64 | | | | 0.64 | | | | 0.62 | | | | 0.61 | | | 0.65 |
| | | | | |
Net realized and unrealized gains (losses) | | | 1.71 | | | | (1.33 | ) | | | 0.85 | | | | 1.33 | | | (1.76) |
| | | | | |
Total from investment operations | | | 2.35 | | | | (0.69 | ) | | | 1.47 | | | | 1.94 | | | (1.11) |
| | | | | |
Less distributions from: | | | | | | | | | | | | | | | | | | |
| | | | | |
Net investment income | | | (0.85 | ) | | | (0.76 | ) | | | (0.65 | ) | | | (0.72 | ) | | (0.71) |
| | | | | |
Net realized gains | | | (0.26 | ) | | | — | | | | — | | | | — | | | — |
| | | | | |
Total distributions | | | (1.11 | ) | | | (0.76 | ) | | | (0.65 | ) | | | (0.72 | ) | | (0.71) |
| | | | | |
Net asset value, end of year | | | $16.32 | | | | $15.08 | | | | $16.53 | | | | $15.71 | | | $14.49 |
| | | | | |
Total returnc | | | 16.05% | | | | (4.42)% | | | | 9.55% | | | | 13.87% | | | (7.15)% |
| | | | | |
Ratios to average net assets | | | | | | | | | | | | | | | | | | |
| | | | | |
Expenses before waiver and payments by affiliates | | | 0.81% | | | | 0.82% | | | | 0.82% | | | | 0.82% | | | 0.81% |
| | | | | |
Expenses net of waiver and payments by affiliatesd | | | 0.80% | | | | 0.80% | | | | 0.80% | | | | 0.79% | | | 0.81%e |
| | | | | |
Net investment income | | | 4.03% | | | | 3.98% | | | | 3.87% | | | | 4.12% | | | 4.12% |
| | | | | |
Supplemental data | | | | | | | | | | | | | | | | | | |
| | | | | |
Net assets, end of year (000’s) | | | $323,582 | | | | $294,700 | | | | $335,217 | | | | $309,935 | | | $306,023 |
| | | | | |
Portfolio turnover rate | | | 25.16% | | | | 43.22% | | | | 20.96% | | | | 39.03% | | | 31.53% |
aThe amount shown for a share outstanding throughout the period may not correlate with the Statement of Operations for the period due to the timing of sales and repurchases of the Fund’s shares in relation to income earned and/or fluctuating fair value of the investments of the Fund.
bBased on average daily shares outstanding.
cTotal return does not include fees, charges or expenses imposed by the variable annuity and life insurance contracts for which Franklin Templeton Variable Insurance Products Trust serves as an underlying investment vehicle.
dBenefit of expense reduction rounds to less than 0.01%.
eBenefit of waiver and payments by affiliates rounds to less than 0.01%.
| | | | |
| | | |
| | The accompanying notes are an integral part of these financial statements. | Annual Report | | FI-9 |
FRANKLIN TEMPLETON VARIABLE INSURANCE PRODUCTS TRUST
Statement of Investments, December 31, 2019
Franklin Income VIP Fund
| | | | | | | | | | | | |
| | | Country | | | Shares | | | Value | |
| | | |
Common Stocks 38.2% | | | | | | | | | | | | |
Communication Services 2.2% | | | | | | | | | | | | |
a Alphabet Inc., A | | | United States | | | | 10,000 | | | $ | 13,393,900 | |
BCE Inc. | | | Canada | | | | 466,000 | | | | 21,588,295 | |
Verizon Communications Inc. | | | United States | | | | 1,200,000 | | | | 73,680,000 | |
| | | | | | | | | | | | |
| | | |
| | | | | | | | | | | 108,662,195 | |
| | | | | | | | | | | | |
Consumer Discretionary 1.5% | | | | | | | | | | | | |
Ford Motor Co. | | | United States | | | | 2,500,000 | | | | 23,250,000 | |
General Motors Co. | | | United States | | | | 1,425,000 | | | | 52,155,000 | |
| | | | | | | | | | | | |
| | | |
| | | | | | | | | | | 75,405,000 | |
| | | | | | | | | | | | |
Consumer Staples 3.5% | | | | | | | | | | | | |
Anheuser-Busch InBev SA/NV, ADR | | | Belgium | | | | 300,000 | | | | 24,612,000 | |
The Coca-Cola Co. | | | United States | | | | 245,600 | | | | 13,593,960 | |
PepsiCo Inc. | | | United States | | | | 300,000 | | | | 41,001,000 | |
Philip Morris International Inc. | | | United States | | | | 350,000 | | | | 29,781,500 | |
The Procter & Gamble Co. | | | United States | | | | 500,000 | | | | 62,450,000 | |
| | | | | | | | | | | | |
| | | |
| | | | | | | | | | | 171,438,460 | |
| | | | | | | | | | | | |
Energy 5.7% | | | | | | | | | | | | |
Baker Hughes Co., A | | | United States | | | | 614,100 | | | | 15,739,383 | |
Chevron Corp. | | | United States | | | | 400,000 | | | | 48,204,000 | |
Exxon Mobil Corp. | | | United States | | | | 500,000 | | | | 34,890,000 | |
Halliburton Co. | | | United States | | | | 839,165 | | | | 20,534,367 | |
Occidental Petroleum Corp. | | | United States | | | | 500,000 | | | | 20,605,000 | |
Royal Dutch Shell PLC, A, ADR | | | United Kingdom | | | | 900,000 | | | | 53,082,000 | |
Schlumberger Ltd. | | | United States | | | | 225,000 | | | | 9,045,000 | |
TC Energy Corp. | | | Canada | | | | 350,000 | | | | 18,658,500 | |
a Weatherford International PLC | | | United States | | | | 1,153,568 | | | | 32,242,226 | |
The Williams Cos. Inc. | | | United States | | | | 1,200,000 | | | | 28,464,000 | |
| | | | | | | | | | | | |
| | | |
| | | | | | | | | | | 281,464,476 | |
| | | | | | | | | | | | |
Financials 5.2% | | | | | | | | | | | | |
Bank of America Corp. | | | United States | | | | 365,000 | | | | 12,855,300 | |
Barclays PLC | | | United Kingdom | | | | 12,500,000 | | | | 29,740,524 | |
JPMorgan Chase & Co. | | | United States | | | | 600,000 | | | | 83,640,000 | |
MetLife Inc. | | | United States | | | | 535,108 | | | | 27,274,455 | |
Morgan Stanley | | | United States | | | | 250,000 | | | | 12,780,000 | |
Wells Fargo & Co. | | | United States | | | | 1,665,000 | | | | 89,577,000 | |
| | | | | | | | | | | | |
| | | |
| | | | | | | | | | | 255,867,279 | |
| | | | | | | | | | | | |
Health Care 7.0% | | | | | | | | | | | | |
AstraZeneca PLC | | | United Kingdom | | | | 700,000 | | | | 70,525,637 | |
Bayer AG | | | Germany | | | | 311,750 | | | | 25,455,253 | |
Bristol-Myers Squibb Co. | | | United States | | | | 1,000,000 | | | | 64,190,000 | |
CVS Health Corp. | | | United States | | | | 520,000 | | | | 38,630,800 | |
Johnson & Johnson | | | United States | | | | 230,000 | | | | 33,550,100 | |
Merck & Co. Inc. | | | United States | | | | 700,000 | | | | 63,665,000 | |
Pfizer Inc. | | | United States | | | | 1,300,000 | | | | 50,934,000 | |
| | | | | | | | | | | | |
| | | |
| | | | | | | | | | | 346,950,790 | |
| | | | | | | | | | | | |
FRANKLIN TEMPLETON VARIABLE INSURANCE PRODUCTS TRUST
STATEMENT OF INVESTMENTS
Franklin Income VIP Fund(continued)
| | | | | | | | | | | | |
| | | Country | | | Shares | | | Value | |
| | | |
Common Stocks(continued) | | | | | | | | | | | | |
Industrials 1.5% | | | | | | | | | | | | |
3M Co. | | | United States | | | | 250,000 | | | $ | 44,105,000 | |
The Boeing Co. | | | United States | | | | 36,300 | | | | 11,825,088 | |
Cummins Inc. | | | United States | | | | 100,000 | | | | 17,896,000 | |
| | | |
| | | | | | | | | | | 73,826,088 | |
| | | |
Information Technology 2.9% | | | | | | | | | | | | |
Applied Materials Inc. | | | United States | | | | 286,000 | | | | 17,457,440 | |
Cisco Systems Inc. | | | United States | | | | 300,000 | | | | 14,388,000 | |
Intel Corp. | | | United States | | | | 414,307 | | | | 24,796,274 | |
International Business Machines Corp. | | | United States | | | | 109,976 | | | | 14,741,183 | |
Lam Research Corp. | | | United States | | | | 70,000 | | | | 20,468,000 | |
Microchip Technology Inc. | | | United States | | | | 150,000 | | | | 15,708,000 | |
Texas Instruments Inc. | | | United States | | | | 276,000 | | | | 35,408,040 | |
| | | |
| | | | | | | | | | | 142,966,937 | |
| | | |
Materials 2.0% | | | | | | | | | | | | |
BASF SE | | | Germany | | | | 700,000 | | | | 52,870,761 | |
Rio Tinto PLC, ADR | | | Australia | | | | 800,000 | | | | 47,488,000 | |
| | | |
| | | | | | | | | | | 100,358,761 | |
| | | |
Real Estate 0.6% | | | | | | | | | | | | |
Host Hotels & Resorts Inc. | | | United States | | | | 1,500,000 | | | | 27,825,000 | |
| | | |
Utilities 6.1% | | | | | | | | | | | | |
Dominion Energy Inc. | | | United States | | | | 1,036,638 | | | | 85,854,359 | |
Duke Energy Corp. | | | United States | | | | 577,500 | | | | 52,673,775 | |
Sempra Energy | | | United States | | | | 275,000 | | | | 41,657,000 | |
The Southern Co. | | | United States | | | | 1,560,000 | | | | 99,372,000 | |
Xcel Energy Inc. | | | United States | | | | 400,000 | | | | 25,396,000 | |
| | | |
| | | | | | | | | | | 304,953,134 | |
| | | |
Total Common Stocks (Cost $1,462,457,605) | | | | | | | | | | | 1,889,718,120 | |
| | | | | | | | | | | | |
| | | |
b Equity-Linked Securities 10.4% | | | | | | | | | | | | |
Communication Services 0.9% | | | | | | | | | | | | |
c Goldman Sachs International into Alphabet Inc., 7.00%, A, 144A | | | United States | | | | 35,000 | | | | 42,756,839 | |
| | | | | | | | | | | | |
| | | |
Consumer Discretionary 1.5% | | | | | | | | | | | | |
c JPMorgan Chase Bank NA into Target Corp., 9.00%, 144A | | | United States | | | | 250,000 | | | | 29,212,042 | |
c JPMorgan Chase Financial Co. LLC into Amazon.com Inc., 9.00%, 144A | | | United States | | | | 25,000 | | | | 46,049,372 | |
| | | | | | | | | | | | |
| | | |
| | | | | | | | | | | 75,261,414 | |
| | | |
Financials 2.6% | | | | | | | | | | | | |
c Barclays Bank PLC into Bank of America Corp., 8.50%, 144A | | | United States | | | | 600,000 | | | | 20,578,525 | |
c Credit Suisse AG into Bank of America Corp., 7.00%, 144A | | | United States | | | | 750,000 | | | | 24,894,809 | |
c Merrill Lynch International & Co. CV into Wells Fargo &Co., 8.00%, 144A | | | United States | | | | 775,000 | | | | 40,789,631 | |
c UBS AG London into MetLife Inc., 7.50%, 144A | | | United States | | | | 800,000 | | | | 41,931,074 | |
| | | | | | | | | | | | |
| | | |
| | | | | | | | | | | 128,194,039 | |
| | | |
Health Care 0.5% | | | | | | | | | | | | |
c UBS AG London into CVS Health Corp., 8.50%, 144A | | | United States | | | | 400,000 | | | | 26,996,955 | |
| | | | | | | | | | | | |
FRANKLIN TEMPLETON VARIABLE INSURANCE PRODUCTS TRUST
STATEMENT OF INVESTMENTS
Franklin Income VIP Fund(continued)
| | | | | | | | | | | | |
| | | Country | | | Shares | | | Value | |
| | | |
bEquity-Linked Securities(continued) | | | | | | | | | | | | |
Information Technology 4.9% | | | | | | | | | | | | |
c Credit Suisse AG London into Analog Devices Inc., 7.50%, 144A | | | United States | | | | 260,000 | | | $ | 29,858,291 | |
c JPMorgan Chase Bank NA into Apple Inc., 7.00%, 144A | | | United States | | | | 450,000 | | | | 102,439,065 | |
c Royal Bank of Canada into Intel Corp., 8.00%, 144A | | | United States | | | | 1,100,000 | | | | 58,465,881 | |
c UBS AG London into Texas Instruments Inc., 8.50%, 144A | | | United States | | | | 400,000 | | | | 52,106,747 | |
| | | | | | | | | | | | |
| | | |
| | | | | | | | | | | 242,869,984 | |
| | | |
Total Equity-Linked Securities (Cost $ 467,531,300) | | | | | | | | | | | 516,079,231 | |
| | | | | | | | | | | | |
| | | |
Convertible Preferred Stocks 2.3% | | | | | | | | | | | | |
Financials 1.4% | | | | | | | | | | | | |
Bank of America Corp., 7.25%, cvt. pfd., L | | | United States | | | | 34,600 | | | | 50,135,400 | |
a FNMA, 5.375%, cvt. pfd. | | | United States | | | | 475 | | | | 19,118,199 | |
| | | | | | | | | | | | |
| | | |
| | | | | | | | | | | 69,253,599 | |
Information Technology 0.6% | | | | | | | | | | | | |
Broadcom Inc., 8.00%, cvt. pfd., A | | | United States | | | | 25,000 | | | | 29,449,250 | |
| | | | | | | | | | | | |
| | | |
Utilities 0.3% | | | | | | | | | | | | |
The Southern Co., 6.75%, cvt. pfd. | | | United States | | | | 280,000 | | | | 15,092,000 | |
| | | | | | | | | | | | |
| | | |
Total Convertible Preferred Stocks (Cost $104,397,102) | | | | | | | | | | | 113,794,849 | |
| | | | | | | | | | | | |
| | | |
Preferred Stocks (Cost $15,000,000) 0.3% | | | | | | | | | | | | |
Financials 0.3% | | | | | | | | | | | | |
JPMorgan Chase & Co., 6.00%, pfd., EE | | | United States | | | | 600,000 | | | | 16,884,000 | |
| | | | | | | | | | | | |
| | | |
| | | | | |
| Principal
Amount |
* | | | | |
| | | |
Corporate Bonds 35.3% | | | | | | | | | | | | |
Communication Services 4.9% | | | | | | | | | | | | |
AMC Entertainment Holdings Inc., senior sub. note, 5.875%, 11/15/26 | | | United States | | | $ | 5,600,000 | | | | 5,060,006 | |
AT&T Inc., senior bond, 4.125%, 2/17/26 | | | United States | | | | 12,000,000 | | | | 13,004,642 | |
CCO Holdings LLC/CCO Holdings Capital Corp., | | | | | | | | | | | | |
senior bond, 5.125%, 2/15/23 | | | United States | | | | 10,000,000 | | | | 10,124,900 | |
senior bond, 5.75%, 1/15/24 | | | United States | | | | 1,352,000 | | | | 1,379,601 | |
c senior bond, 144A, 5.50%, 5/01/26 | | | United States | | | | 10,000,000 | | | | 10,560,725 | |
DISH DBS Corp., | | | | | | | | | | | | |
senior bond, 5.875%, 7/15/22 | | | United States | | | | 27,000,000 | | | | 28,668,060 | |
senior bond, 5.00%, 3/15/23 | | | United States | | | | 21,000,000 | | | | 21,595,140 | |
senior note, 5.875%, 11/15/24 | | | United States | | | | 9,400,000 | | | | 9,625,224 | |
Netflix Inc., senior bond, 4.875%, 4/15/28 | | | United States | | | | 22,000,000 | | | | 22,906,950 | |
Sprint Communications Inc., | | | | | | | | | | | | |
senior bond, 11.50%, 11/15/21 | | | United States | | | | 30,000,000 | | | | 34,329,600 | |
senior note, 7.00%, 8/15/20 | | | United States | | | | 7,500,000 | | | | 7,668,000 | |
senior note, 6.00%, 11/15/22 | | | United States | | | | 6,300,000 | | | | 6,618,339 | |
Sprint Corp., | | | | | | | | | | | | |
senior bond, 7.875%, 9/15/23 | | | United States | | | | 12,500,000 | | | | 13,817,688 | |
senior bond, 7.125%, 6/15/24 | | | United States | | | | 8,200,000 | | | | 8,862,847 | |
senior note, 7.625%, 3/01/26 | | | United States | | | | 7,500,000 | | | | 8,284,875 | |
FRANKLIN TEMPLETON VARIABLE INSURANCE PRODUCTS TRUST
STATEMENT OF INVESTMENTS
Franklin Income VIP Fund(continued)
| | | | | | | | | | | | |
| | | Country | | | Principal
Amount* | | | Value | |
| | | |
Corporate Bonds(continued) | | | | | | | | | | | | |
Communication Services(continued) | | | | | | | | | | | | |
cSprint Spectrum Co. LLC, senior secured bond, first lien, 144A, 5.152%, 9/20/29 | | | United States | | | $ | 16,000,000 | | | $ | 17,485,560 | |
cUnivision Communications Inc., | | | | | | | | | | | | |
senior secured note, first lien, 144A, 5.125%, 5/15/23 | | | United States | | | | 15,000,000 | | | | 15,000,000 | |
senior secured note, first lien, 144A, 5.125%, 2/15/25 | | | United States | | | | 7,140,000 | | | | 7,077,525 | |
| | | | | | | | | | | | |
| | | |
| | | | | | | | | | | 242,069,682 | |
| | | | | | | | | | | | |
Consumer Discretionary 1.8% | | | | | | | | | | | | |
c24 Hour Holdings III LLC, senior note, 144A, 8.00%, 6/01/22 | | | United States | | | | 10,000,000 | | | | 4,628,120 | |
Ford Motor Co., senior note, 4.346%, 12/08/26 | | | United States | | | | 18,500,000 | | | | 19,112,730 | |
General Motors Co., senior bond, 5.15%, 4/01/38 | | | United States | | | | 16,000,000 | | | | 16,359,553 | |
cGolden Nugget Inc., senior note, 144A, 6.75%, 10/15/24 | | | United States | | | | 5,000,000 | | | | 5,187,450 | |
cShea Homes LP/Shea Homes Funding Corp., | | | | | | | | | | | | |
senior bond, 144A, 6.125%, 4/01/25 | | | United States | | | | 10,000,000 | | | | 10,379,150 | |
senior note, 144A, 5.875%, 4/01/23 | | | United States | | | | 10,000,000 | | | | 10,216,650 | |
cWynn Las Vegas LLC/Wynn Las Vegas Capital Corp., | | | | | | | | | | | | |
senior bond, 144A, 5.50%, 3/01/25 | | | United States | | | | 13,200,000 | | | | 14,173,368 | |
senior bond, 144A, 5.25%, 5/15/27 | | | United States | | | | 10,000,000 | | | | 10,637,500 | |
| | | | | | | | | | | | |
| | | |
| | | | | | | | | | | 90,694,521 | |
| | | | | | | | | | | | |
Consumer Staples 1.1% | | | | | | | | | | | | |
BAT Capital Corp., | | | | | | | | | | | | |
senior note, 3.222%, 8/15/24 | | | United Kingdom | | | | 10,000,000 | | | | 10,226,546 | |
senior note, 3.557%, 8/15/27 | | | United Kingdom | | | | 20,000,000 | | | | 20,413,687 | |
Kraft Heinz Foods Co., senior bond, 4.625%, 1/30/29 | | | United States | | | | 13,000,000 | | | | 14,295,442 | |
cPost Holdings Inc., | | | | | | | | | | | | |
senior bond, 144A, 5.00%, 8/15/26 | | | United States | | | | 7,500,000 | | | | 7,935,750 | |
senior bond, 144A, 5.625%, 1/15/28 | | | United States | | | | 2,500,000 | | | | 2,698,375 | |
| | | | | | | | | | | | |
| | | |
| | | | | | | | | | | 55,569,800 | |
| | | | | | | | | | | | |
Energy 5.5% | | | | | | | | | | | | |
cAscent Resources Utica Holdings LLC/ARU Finance Corp., senior note, 144A, 10.00%, 4/01/22 | | | United States | | | | 3,000,000 | | | | 2,991,371 | |
Calumet Specialty Products Partners LP/Calumet Finance Corp., | | | | | | | | | | | | |
dsenior note, 7.625%, 1/15/22 | | | United States | | | | 8,000,000 | | | | 8,022,496 | |
dsenior note, 7.75%, 4/15/23 | | | United States | | | | 2,000,000 | | | | 2,000,830 | |
csenior note, 144A, 11.00%, 4/15/25 | | | United States | | | | 28,500,000 | | | | 31,064,715 | |
Chesapeake Energy Corp., | | | | | | | | | | | | |
csecond lien, 144A, 11.50%, 1/01/25 | | | United States | | | | 81,444,000 | | | | 77,168,190 | |
senior note, 7.00%, 10/01/24 | | | United States | | | | 21,000,000 | | | | 12,704,790 | |
cCNX Resources Corp., senior note, 144A, 7.25%, 3/14/27 | | | United States | | | | 8,000,000 | | | | 7,017,800 | |
HighPoint Operating Corp., | | | | | | | | | | | | |
senior bond, 7.00%, 10/15/22 | | | United States | | | | 17,937,000 | | | | 17,090,589 | |
senior note, 8.75%, 6/15/25 | | | United States | | | | 26,600,000 | | | | 24,339,000 | |
Kinder Morgan Inc., | | | | | | | | | | | | |
senior bond, 7.75%, 1/15/32 | | | United States | | | | 22,000,000 | | | | 30,253,383 | |
csenior secured bond, first lien, 144A, 5.625%, 11/15/23 | | | United States | | | | 6,400,000 | | | | 7,082,146 | |
cWeatherford International Ltd., senior note, 144A, 11.00%, 12/01/24 | | | United States | | | | 49,344,000 | | | | 53,476,560 | |
| | | | | | | | | | | | |
| | | |
| | | | | | | | | | | 273,211,870 | |
| | | | | | | | | | | | |
FRANKLIN TEMPLETON VARIABLE INSURANCE PRODUCTS TRUST
STATEMENT OF INVESTMENTS
Franklin Income VIP Fund(continued)
| | | | | | | | | | | | |
| | | Country | | | Principal
Amount* | | | Value | |
| | | |
Corporate Bonds(continued) | | | | | | | | | | | | |
Financials 3.9% | | | | | | | | | | | | |
Bank of America Corp., | | | | | | | | | | | | |
ejunior sub. bond, AA, 6.10% to 3/17/25, FRN thereafter, Perpetual | | | United States | | | $ | 8,000,000 | | | $ | 8,916,120 | |
ejunior sub. bond, X, 6.25% to 9/05/24, FRN thereafter, Perpetual | | | United States | | | | 6,000,000 | | | | 6,671,790 | |
senior bond, 3.419% to 12/20/27, FRN thereafter, 12/20/28 | | | United States | | | | 10,000,000 | | | | 10,495,330 | |
Capital One Financial Corp., senior sub. note, 4.20%, 10/29/25 | | | United States | | | | 15,500,000 | | | | 16,727,689 | |
Citigroup Inc., | | | | | | | | | | | | |
ejunior sub. bond, O, 5.875% to 3/27/20, FRN thereafter, Perpetual | | | United States | | | | 25,000,000 | | | | 25,133,625 | |
sub. bond, 4.125%, 7/25/28 | | | United States | | | | 18,500,000 | | | | 20,181,935 | |
The Goldman Sachs Group Inc., senior note, 3.272% to 9/29/24, FRN thereafter, 9/29/25 | | | United States | | | | 15,500,000 | | | | 16,043,206 | |
HSBC Holdings PLC, senior note, 4.292% to 9/12/25, FRN thereafter, 9/12/26 | | | United Kingdom | | | | 28,500,000 | | | | 30,811,762 | |
eJPMorgan Chase & Co., | | | | | | | | | | | | |
fjunior sub. bond, FRN, 5.406%,(3-month USD LIBOR + 3.47%), Perpetual | | | United States | | | | 19,559,000 | | | | 19,764,761 | |
junior sub. bond, R, 6.00% to 8/01/23, FRN thereafter, Perpetual | | | United States | | | | 3,200,000 | | | | 3,438,288 | |
eMorgan Stanley, junior sub. bond, 5.55% to 7/15/20, FRN thereafter, Perpetual | | | United States | | | | 7,300,000 | | | | 7,446,511 | |
Prudential Financial Inc., junior sub. bond, 5.70% to 9/15/28, FRN thereafter, 9/15/48 | | | United States | | | | 17,000,000 | | | | 19,448,340 | |
eWells Fargo & Co., junior sub. bond, S, 5.90% to 6/15/24, FRN thereafter, Perpetual | | | United States | | | | 6,600,000 | | | | 7,190,931 | |
| | | | | | | | | | | | |
| | | |
| | | | | | | | | | | 192,270,288 | |
| | | | | | | | | | | | |
| | | |
Health Care 14.1% | | | | | | | | | | | | |
Allergan Funding SCS, senior bond, 3.80%, 3/15/25 | | | United States | | | | 17,000,000 | | | | 17,830,059 | |
cBausch Health Cos. Inc., | | | | | | | | | | | | |
senior bond, 144A, 6.125%, 4/15/25 | | | United States | | | | 9,400,000 | | | | 9,731,961 | |
senior note, 144A, 5.50%, 3/01/23 | | | United States | | | | 15,000,000 | | | | 15,118,725 | |
senior note, 144A, 5.875%, 5/15/23 | | | United States | | | | 13,564,000 | | | | 13,691,162 | |
senior note, 144A, 9.00%, 12/15/25 | | | United States | | | | 5,000,000 | | | | 5,698,500 | |
senior note, first lien, 144A, 7.00%, 3/15/24 | | | United States | | | | 4,500,000 | | | | 4,689,383 | |
senior secured note, first lien, 144A, 6.50%, 3/15/22 | | | United States | | | | 3,000,000 | | | | 3,071,250 | |
senior secured note, first lien, 144A, 5.50%, 11/01/25 | | | United States | | | | 35,000,000 | | | | 36,647,975 | |
cBayer U.S. Finance II LLC, senior note, 144A, 4.25%, 12/15/25 | | | Germany | | | | 15,000,000 | | | | 16,183,515 | |
cBristol-Myers Squibb Co., | | | | | | | | | | | | |
senior bond, 144A, 3.40%, 7/26/29 | | | United States | | | | 8,000,000 | | | | 8,556,359 | |
senior bond, 144A, 4.25%, 10/26/49 | | | United States | | | | 8,000,000 | | | | 9,480,790 | |
CHS/Community Health Systems Inc., | | | | | | | | | | | | |
csenior note, 144A, 9.875%, 6/30/23 | | | United States | | | | 101,596,000 | | | | 88,684,672 | |
csenior note, 144A, 8.125%, 6/30/24 | | | United States | | | | 42,388,000 | | | | 34,863,706 | |
csenior note, 144A, 8.00%, 12/15/27 | | | United States | | | | 38,674,000 | | | | 39,157,425 | |
csenior note, 144A, 6.875%, 4/01/28 | | | United States | | | | 92,000,000 | | | | 52,783,160 | |
csenior secured note, 144A, 8.00%, 3/15/26 | | | United States | | | | 15,500,000 | | | | 15,994,047 | |
senior secured note, first lien, 6.25%, 3/31/23 | | | United States | | | | 39,000,000 | | | | 39,682,500 | |
Cigna Corp., senior note, 3.75%, 7/15/23 | | | United States | | | | 20,000,000 | | | | 20,978,484 | |
CVS Health Corp., | | | | | | | | | | | | |
senior bond, 4.30%, 3/25/28 | | | United States | | | | 8,000,000 | | | | 8,737,004 | |
senior bond, 5.05%, 3/25/48 | | | United States | | | | 3,900,000 | | | | 4,615,118 | |
senior note, 4.10%, 3/25/25 | | | United States | | | | 5,100,000 | | | | 5,473,858 | |
FRANKLIN TEMPLETON VARIABLE INSURANCE PRODUCTS TRUST
STATEMENT OF INVESTMENTS
Franklin Income VIP Fund(continued)
| | | | | | | | | | | | |
| | | Country | | | Principal
Amount* | | | Value | |
| | | |
Corporate Bonds(continued) | | | | | | | | | | | | |
Health Care(continued) | | | | | | | | | | | | |
DaVita Inc., | | | | | | | | | | | | |
senior bond, 5.125%, 7/15/24 | | | United States | | | $ | 5,000,000 | | | $ | 5,135,425 | |
senior bond, 5.00%, 5/01/25 | | | United States | | | | 4,000,000 | | | | 4,123,340 | |
cEndo DAC/Endo Finance LLC/Endo Finco Inc., | | | | | | | | | | | | |
senior bond, 144A, 6.00%, 2/01/25 | | | United States | | | | 6,300,000 | | | | 4,266,297 | |
senior note, 144A, 6.00%, 7/15/23 | | | United States | | | | 10,000,000 | | | | 7,249,900 | |
HCA Inc., | | | | | | | | | | | | |
senior bond, 5.875%, 5/01/23 | | | United States | | | | 7,500,000 | | | | 8,304,338 | |
senior note, 7.50%, 2/15/22 | | | United States | | | | 25,000,000 | | | | 27,669,500 | |
senior secured note, first lien, 5.00%, 3/15/24 | | | United States | | | | 10,400,000 | | | | 11,370,760 | |
cMallinckrodt International Finance SA/Mallinckrodt CB LLC, | | | | | | | | | | | | |
senior note, 144A, 4.875%, 4/15/20 | | | United States | | | | 5,800,000 | | | | 4,484,514 | |
senior note, 144A, 5.75%, 8/01/22 | | | United States | | | | 12,100,000 | | | | 5,142,500 | |
senior note, 144A, 5.625%, 10/15/23 | | | United States | | | | 11,800,000 | | | | 4,518,397 | |
senior note, 144A, 5.50%, 4/15/25 | | | United States | | | | 10,000,000 | | | | 3,575,000 | |
Mylan NV, senior note, 3.95%, 6/15/26 | | | United States | | | | 10,000,000 | | | | 10,433,821 | |
cPar Pharmaceutical Inc., senior secured note, 144A, 7.50%, 4/01/27 | | | United States | | | | 8,500,000 | | | | 8,478,962 | |
Tenet Healthcare Corp., | | | | | | | | | | | | |
secured note, second lien, 5.125%, 5/01/25 | | | United States | | | | 2,500,000 | | | | 2,581,250 | |
senior note, 8.125%, 4/01/22 | | | United States | | | | 27,600,000 | | | | 30,581,628 | |
senior note, 6.75%, 6/15/23 | | | United States | | | | 58,200,000 | | | | 64,066,269 | |
senior note, 7.00%, 8/01/25 | | | United States | | | | 12,175,000 | | | | 12,867,514 | |
csenior note, second lien, 144A, 6.25%, 2/01/27 | | | United States | | | | 29,000,000 | | | | 31,247,500 | |
| | | | | | | | | | | | |
| | | |
| | | | | | | | | | | 697,766,568 | |
| | | | | | | | | | | | |
| | | |
Industrials 0.8% | | | | | | | | | | | | |
cAshtead Capital Inc., second lien, 144A, 4.25%, 11/01/29 | | | United Kingdom | | | | 4,500,000 | | | | 4,606,875 | |
United Rentals North America Inc., senior bond, 4.875%, 1/15/28 | | | United States | | | | 20,000,000 | | | | 20,861,600 | |
United Technologies Corp., senior note, 3.95%, 8/16/25 | | | United States | | | | 15,000,000 | | | | 16,362,088 | |
| | | | | | | | | | | | |
| | | |
| | | | | | | | | | | 41,830,563 | |
| | | | | | | | | | | | |
| | | |
Information Technology 0.3% | | | | | | | | | | | | |
cCommScope Inc., senior bond, 144A, 5.50%, 6/15/24 | | | United States | | | | 10,000,000 | | | | 10,150,100 | |
NCR Corp., senior note, 6.375%, 12/15/23 | | | United States | | | | 4,212,000 | | | | 4,326,082 | |
| | | | | | | | | | | | |
| | | |
| | | | | | | | | | | 14,476,182 | |
| | | | | | | | | | | | |
Materials 1.5% | | | | | | | | | | | | |
cCemex Finance LLC, senior secured note, first lien, 144A, 6.00%, 4/01/24 | | | Mexico | | | | 9,665,000 | | | | 9,959,782 | |
DuPont de Nemours Inc., senior note, 4.493%, 11/15/25 | | | United States | | | | 10,500,000 | | | | 11,560,614 | |
cFMG Resources (August 2006) Pty. Ltd., senior note, 144A, 5.125%, 5/15/24 | | | Australia | | | | 6,700,000 | | | | 7,168,799 | |
cMauser Packaging Solutions Holding Co., | | | | | | | | | | | | |
secured note, 144A, 5.50%, 4/15/24 | | | United States | | | | 10,000,000 | | | | 10,325,900 | |
senior note, 144A, 7.25%, 4/15/25 | | | United States | | | | 23,000,000 | | | | 22,769,770 | |
cSyngenta Finance NV, senior note, 144A, 4.441%, 4/24/23 | | | Switzerland | | | | 10,000,000 | | | | 10,443,243 | |
| | | | | | | | | | | | |
| | | |
| | | | | | | | | | | 72,228,108 | |
| | | | | | | | | | | | |
FRANKLIN TEMPLETON VARIABLE INSURANCE PRODUCTS TRUST
STATEMENT OF INVESTMENTS
Franklin Income VIP Fund(continued)
| | | | | | | | | | | | |
| | | Country | | | Principal
Amount* | | | Value | |
| | | |
Corporate Bonds(continued) | | | | | | | | | | | | |
Real Estate 0.6% | | | | | | | | | | | | |
Equinix Inc., senior bond, 5.375%, 5/15/27 | | | United States | | | $ | 11,000,000 | | | $ | 11,966,680 | |
Iron Mountain Inc., senior sub. bond, 5.75%, 8/15/24 | | | United States | | | | 18,000,000 | | | | 18,247,320 | |
| | | | | | | | | | | | |
| | | |
| | | | | | | | | | | 30,214,000 | |
| | | | | | | | | | | | |
| | | |
Utilities 0.8% | | | | | | | | | | | | |
Calpine Corp., | | | | | | | | | | | | |
senior note, 5.375%, 1/15/23 | | | United States | | | | 20,000,000 | | | | 20,276,023 | |
senior note, 5.50%, 2/01/24 | | | United States | | | | 16,375,000 | | | | 16,661,399 | |
| | | | | | | | | | | | |
| | | |
| | | | | | | | | | | 36,937,422 | |
| | | | | | | | | | | | |
| | | |
Total Corporate Bonds (Cost $1,825,007,981) | | | | | | | | | | | 1,747,269,004 | |
| | | | | | | | | | | | |
| | | |
f,gSenior Floating Rate Interests 0.9% | | | | | | | | | | | | |
Consumer Discretionary 0.5% | | | | | | | | | | | | |
24 Hour Fitness Worldwide Inc., Term Loan, 5.299%,(1-month USD LIBOR + 3.50%), 5/30/25 | | | United States | | | | 13,790,000 | | | | 10,512,407 | |
Belk Inc., Extended Term Loan B, 8.803%,(3-month USD LIBOR + 6.75%), 7/31/25 | | | United States | | | | 18,499,734 | | | | 13,088,562 | |
| | | | | | | | | | | | |
| | | |
| | | | | | | | | | | 23,600,969 | |
| | | | | | | | | | | | |
Energy 0.4% | | | | | | | | | | | | |
Chesapeake Energy Corp., Class A Loan, 9.928%,(3-month USD LIBOR + 8.00%), 6/23/24 | | | United States | | | | 19,000,000 | | | | 19,629,375 | |
| | | | | | | | | | | | |
| | | |
Total Senior Floating Rate Interests (Cost $49,677,378) | | | | | | | | | | | 43,230,344 | |
| | | | | | | | | | | | |
| | | |
U.S. Government and Agency Securities 7.2% | | | | | | | | | | | | |
U.S. Treasury Note, | | | | | | | | | | | | |
2.25%, 3/31/20 | | | United States | | | | 50,000,000 | | | | 50,071,532 | |
2.50%, 5/31/20 | | | United States | | | | 75,000,000 | | | | 75,260,499 | |
2.50%, 6/30/20 | | | United States | | | | 50,000,000 | | | | 50,213,401 | |
2.375%, 3/15/21 | | | United States | | | | 75,000,000 | | | | 75,652,883 | |
2.75%, 4/30/23 | | | United States | | | | 25,000,000 | | | | 25,893,723 | |
2.75%, 5/31/23 | | | United States | | | | 50,000,000 | | | | 51,821,556 | |
2.875%, 5/31/25 | | | United States | | | | 25,000,000 | | | | 26,460,558 | |
| | | | | | | | | | | | |
| | | |
Total U.S. Government and Agency Securities
(Cost $349,769,660) | | | | | | | | | | | 355,374,152 | |
| | | | | | | | | | | | |
| | | |
Mortgage-Backed Securities 3.0% | | | | | | | | | | | | |
| | | |
Federal Home Loan Mortgage Corp. (FHLMC) Fixed Rate 0.1% | | | | | | | | | | | | |
FHLMC 30 Year, 4.00%, 9/01/49 - 10/01/49 | | | United States | | | | 3,931,050 | | | | 4,096,606 | |
| | | | | | | | | | | | |
| | | |
Federal National Mortgage Association (FNMA) Fixed Rate 0.7% | | | | | | | | | | | | |
FNMA 30 Year, 4.00%, 8/01/49 - 1/01/50 | | | United States | | | | 30,186,659 | | | | 31,617,466 | |
| | | | | | | | | | | | |
| | | |
Government National Mortgage Association (GNMA) Fixed Rate 2.2% | | | | | | | | | | | | |
GNMA II SF 30 Year, 3.50%, 9/20/49 - 11/20/49 | | | United States | | | | 47,550,789 | | | | 49,247,092 | |
GNMA II SF 30 Year, 3.50%, 12/20/49 | | | United States | | | | 23,600,000 | | | | 24,453,659 | |
GNMA II SF 30 Year, 4.00%, 9/20/49 - 12/20/49 | | | United States | | | | 35,508,216 | | | | 37,041,828 | |
| | | | | | | | | | | | |
| | | |
Total Mortgage-Backed Securities
(Cost $146,694,857) | | | | | | | | | | | 146,456,651 | |
| | | | | | | | | | | | |
FRANKLIN TEMPLETON VARIABLE INSURANCE PRODUCTS TRUST
STATEMENT OF INVESTMENTS
Franklin Income VIP Fund(continued)
| | | | | | | | | | | | |
| | | Country | | | Shares | | | Value | |
| | | |
Escrows and Litigation Trusts (Cost $62,602) 0.0% | | | | | | | | | | | | |
a,hMotors Liquidation Co., Escrow Account, cvt. pfd., C | | | United States | | | | 1,400,000 | | | $ | — | |
| | | | | | | | | | | | |
| | | |
| | | Number of Contracts | | | Notional Amount | | | | |
| | | | | | | | | | | | |
| | | |
Options Purchased 0.2% | | | | | | | | | | | | |
Puts - Exchange-Traded | | | | | | | | | | | | |
S&P 500 Index, March Strike Price $2,900.00, Expires 3/20/20 | | | 1,000 | | | | 100,000 | | | | 1,750,000 | |
S&P 500 Index, September Strike Price $3,000.00, Expires 9/18/20 | | | 1,000 | | | | 100,000 | | | | 9,520,000 | |
| | | | | | | | | | | | |
| | | |
Total Options Purchased
(Cost $34,004,076) | | | | | | | | | | | 11,270,000 | |
| | | | | | | | | | | | |
| | | |
Total Investments before Short Term Investments
(Cost $4,454,602,561) | | | | | | | | | | | 4,840,076,351 | |
| | | | | | | | | | | | |
| | | |
| | | Country | | | Shares | | | | |
| | | | | | | | | | | | |
| | | |
Short Term Investments 1.7% | | | | | | | | | | | | |
| | | |
Money Market Funds (Cost $83,971,136) 1.7% | | | | | | | | | | | | |
i,jInstitutional Fiduciary Trust Money Market Portfolio, 1.26% | | | United States | | | | 83,971,136 | | | | 83,971,136 | |
| | | | | | | | | | | | |
| | |
kInvestments from Cash Collateral Received for Loaned Securities 0.0%† | | | | | | | | | |
Money Market Funds (Cost $747,000) 0.0%† | | | | | | | | | | | | |
i,jInstitutional Fiduciary Trust Money Market Portfolio, 1.26% | | | United States | | | | 747,000 | | | | 747,000 | |
| | | | | | | | | | | | |
| | | |
| | | | | | Principal
Amount* | | | | |
| | | | | | | | | | | | |
| | | |
Repurchase Agreement (Cost $187,657) 0.0%† | | | | | | | | | | | | |
lJoint Repurchase Agreement, 1.55%, 1/02/20 (Maturity Value $187,673) | | | | | | | | | | | | |
BofA Securities Inc. | | | | | | | | | | | | |
Collateralized by U.S. Treasury Notes, 1.75% - 2.00%, 6/15/22 - 6/30/24 (valued at $191,274) | | | United States | | | $ | 187,657 | | | | 187,657 | |
| | | | | | | | | | | | |
| | | |
Total Investments from Cash Collateral Received for Loaned
Securities (Cost $934,657) | | | | | | | | | | | 934,657 | |
| | | | | | | | | | | | |
| | | |
Total Investments (Cost $4,539,508,354) 99.5% | | | | | | | | | | | 4,924,982,144 | |
| | | |
Other Assets, less Liabilities 0.5% | | | | | | | | | | | 26,084,987 | |
| | | | | | | | | | | | |
Net Assets 100.0% | | | | | | | | | | $ | 4,951,067,131 | |
| | | | | | | | | | | | |
FRANKLIN TEMPLETON VARIABLE INSURANCE PRODUCTS TRUST
STATEMENT OF INVESTMENTS
Franklin Income VIP Fund(continued)
See Abbreviations on pageFI-31.
†Rounds to less than 0.1% of net assets.
*The principal amount is stated in U.S. dollars unless otherwise indicated.
aNon-income producing.
bSee Note 1(e) regarding equity-linked securities.
cSecurity was purchased pursuant to Rule 144A under the Securities Act of 1933 and may be sold in transactions exempt from registration only to qualified institutional buyers or in a public offering registered under the Securities Act of 1933. At December 31, 2019, the aggregate value of these securities was $1,309,600,355, representing 26.5% of net assets.
dA portion or all of the security is on loan at December 31, 2019. See Note 1(f).
ePerpetual security with no stated maturity date.
fThe coupon rate shown represents the rate at period end.
gSee Note 1(g) regarding senior floating rate interests.
hFair valued using significant unobservable inputs. See Note 10 regarding fair value measurements.
iSee Note 3(e) regarding investments in affiliated management investment companies.
jThe rate shown is the annualizedseven-day effective yield at period end.
kSee Note 1(f) regarding securities on loan.
lSee Note 1(c) regarding repurchase agreement.
| | | | |
| | | |
FI-18 | | Annual Report | The accompanying notes are an integral part of these financial statements. | | |
FRANKLIN TEMPLETON VARIABLE INSURANCE PRODUCTS TRUST
NOTES TO FINANCIAL STATEMENTS
Statement of Assets and Liabilities
December 31, 2019
| | | | |
| | | Franklin Income VIP Fund | |
| |
Assets: | | | | |
Investments in securities: | | | | |
Cost - Unaffiliated issuers | | $ | 4,454,602,561 | |
Cost -Non-controlled affiliates (Note 3e) | | | 84,718,136 | |
Cost - Unaffiliated repurchase agreements | | | 187,657 | |
| | | | |
Value - Unaffiliated issuers+ | | $ | 4,840,076,351 | |
Value -Non-controlled affiliates (Note 3e) | | | 84,718,136 | |
Value - Unaffiliated repurchase agreements | | | 187,657 | |
Cash | | | 198,633 | |
Receivables: | | | | |
Investment securities sold | | | 2,535,000 | |
Capital shares sold | | | 2,977,767 | |
Dividends and interest | | | 27,454,974 | |
Other assets | | | 633 | |
| | | | |
| |
Total assets | | | 4,958,149,151 | |
| | | | |
Liabilities: | | | | |
Payables: | | | | |
Capital shares redeemed | | | 2,750,725 | |
Management fees | | | 1,878,619 | |
Distribution fees | | | 1,001,502 | |
Payable upon return of securities loaned | | | 934,657 | |
Accrued expenses and other liabilities. | | | 516,517 | |
| | | | |
| |
Total liabilities | | | 7,082,020 | |
| | | | |
| |
Net assets, at value | | $ | 4,951,067,131 | |
| | | | |
Net assets consist of: | | | | |
Paid-in capital | | $ | 4,318,916,349 | |
Total distributable earnings (losses) | | | 632,150,782 | |
| | | | |
| |
Net assets, at value | | $ | 4,951,067,131 | |
| | | | |
Class 1: | | | | |
Net assets, at value | | $ | 309,329,668 | |
| | | | |
Shares outstanding | | | 18,719,960 | |
| | | | |
Net asset value and maximum offering price per share | | | $16.52 | |
| | | | |
Class 2: | | | | |
Net assets, at value | | $ | 4,318,155,959 | |
| | | | |
Shares outstanding | | | 271,348,136 | |
| | | | |
Net asset value and maximum offering price per share | | | $15.91 | |
| | | | |
Class 4: | | | | |
Net assets, at value | | $ | 323,581,504 | |
| | | | |
Shares outstanding | | | 19,831,473 | |
| | | | |
Net asset value and maximum offering price per share | | | $16.32 | |
| | | | |
| | | | |
+Includes securities loaned | | | $ 884,317 | |
| | | | |
| | | |
| | The accompanying notes are an integral part of these financial statements. | Annual Report | | FI-19 |
FRANKLIN TEMPLETON VARIABLE INSURANCE PRODUCTS TRUST
NOTES TO FINANCIAL STATEMENTS
Statement of Operations
for the year ended December 31, 2019
| | | | |
| | | Franklin Income VIP Fund | |
| |
Investment income: | | | | |
Dividends: (net of foreign taxes)* | | | | |
Unaffiliated issuers | | $ | 77,022,504 | |
Non-controlled affiliates (Note 3e) | | | 2,711,159 | |
Interest: | | | | |
Unaffiliated issuers | | | 166,530,732 | |
Income from securities loaned: | | | | |
Unaffiliated issuers (net of fees and rebates) | | | 30,912 | |
Non-controlled affiliates (Note 3e) | | | 27,098 | |
| | | | |
| |
Total investment income | | | 246,322,405 | |
| | | | |
Expenses: | | | | |
Management fees (Note 3a) | | | 23,173,719 | |
Distribution fees: (Note 3c) | | | | |
Class 2 | | | 10,790,993 | |
Class 4 | | | 1,095,119 | |
Custodian fees (Note 4) | | | 54,743 | |
Reports to shareholders | | | 428,371 | |
Professional feesa | | | (226,875 | ) |
Trustees’ fees and expenses | | | 30,668 | |
Other | | | 125,030 | |
| | | | |
| |
Total expenses | | | 35,471,768 | |
Expense reductions (Note 4) | | | (52,296 | ) |
Expenses waived/paid by affiliates (Note 3e) | | | (514,740 | ) |
| | | | |
| |
Net expenses | | | 34,904,732 | |
| | | | |
| |
Net investment income | | | 211,417,673 | |
| | | | |
Realized and unrealized gains (losses): | | | | |
Net realized gain (loss) from: | | | | |
Investments: | | | | |
Unaffiliated issuers | | | 37,328,890 | |
Written options | | | 2,885,179 | |
Foreign currency transactions | | | (166,248 | ) |
| | | | |
| |
Net realized gain (loss) | | | 40,047,821 | |
| | | | |
Net change in unrealized appreciation (depreciation) on: | | | | |
Investments: | | | | |
Unaffiliated issuers | | | 514,968,335 | |
Translation of other assets and liabilities denominated in foreign currencies | | | 504 | |
| | | | |
| |
Net change in unrealized appreciation (depreciation) | | | 514,968,839 | |
| | | | |
| |
Net realized and unrealized gain (loss) | | | 555,016,660 | |
| | | | |
| |
Net increase (decrease) in net assets resulting from operations | | $ | 766,434,333 | |
| | | | |
| |
*Foreign taxes withheld on dividends | | $ | 1,410,045 | |
aIncludes unaffiliated reimbursement of legal fees incurred in connection with certain fund holdings.
| | | | |
| | | |
FI-20 | | Annual Report | The accompanying notes are an integral part of these financial statements. | | |
FRANKLIN TEMPLETON VARIABLE INSURANCE PRODUCTS TRUST
NOTES TO FINANCIAL STATEMENTS
Statements of Changes in Net Assets
| | | | | | | | |
| | | Franklin Income VIP Fund | |
| |
| | | Year Ended December 31, | |
| | |
| | | 2019 | | | 2018 | |
| | |
Increase (decrease) in net assets: | | | | | | | | |
Operations: | | | | | | | | |
Net investment income | | $ | 211,417,673 | | | $ | 235,338,694 | |
Net realized gain (loss) | | | 40,047,821 | | | | 351,140,755 | |
Net change in unrealized appreciation (depreciation) | | | 514,968,839 | | | | (809,608,127 | ) |
| | | | |
| | |
Net increase (decrease) in net assets resulting from operations | | | 766,434,333 | | | | (223,128,678 | ) |
| | | | |
Distributions to shareholders: | | | | | | | | |
Class 1 | | | (26,604,329 | ) | | | (34,377,723 | ) |
Class 2 | | | (301,656,285 | ) | | | (227,495,537 | ) |
Class 4 | | | (21,101,452 | ) | | | (14,948,805 | ) |
| | | | |
| | |
Total distributions to shareholders | | | (349,362,066 | ) | | | (276,822,065 | ) |
| | | | |
Capital share transactions: (Note 2) | | | | | | | | |
Class 1 | | | (360,324,820 | ) | | | (62,663,457 | ) |
Class 2 | | | (103,843,936 | ) | | | (543,422,123 | ) |
Class 4 | | | 4,153,985 | | | | (11,817,756 | ) |
| | | | |
| | |
Total capital share transactions | | | (460,014,771 | ) | | | (617,903,336 | ) |
| | | | |
Net increase (decrease) in net assets | | | (42,942,504 | ) | | | (1,117,854,079 | ) |
Net assets: | | | | | | | | |
Beginning of year | | | 4,994,009,635 | | | | 6,111,863,714 | |
| | | | |
| | |
End of year | | $ | 4,951,067,131 | | | $ | 4,994,009,635 | |
| | | | |
| | | | |
| | | |
| | The accompanying notes are an integral part of these financial statements. | Annual Report | | FI-21 |
FRANKLIN TEMPLETON VARIABLE INSURANCE PRODUCTS TRUST
Notes to Financial Statements
Franklin Income VIP Fund
1. Organization and Significant Accounting Policies
Franklin Templeton Variable Insurance Products Trust (Trust) is registered under the Investment Company Act of 1940 (1940 Act) as anopen-end management investment company, consisting of eighteen separate funds and applies the specialized accounting and reporting guidance in U.S. Generally Accepted Accounting Principles (U.S. GAAP). Franklin Income VIP Fund (Fund) is included in this report. Shares of the Fund are generally sold only to insurance company separate accounts to fund the benefits of variable life insurance policies or variable annuity contracts. The Fund offers three classes of shares: Class 1, Class 2 and Class 4. Each class of shares may differ by its distribution fees, voting rights on matters affecting a single class and its exchange privilege.
The following summarizes the Fund’s significant accounting policies.
a. Financial Instrument Valuation
The Fund’s investments in financial instruments are carried at fair value daily. Fair value is the price that would be received to sell an asset or paid to transfer a liability in an orderly transaction between market participants on the measurement date. The Fund calculates the net asset value (NAV) per share each business day as of 4 p.m. Eastern time or the regularly scheduled close of the New York Stock Exchange (NYSE), whichever is earlier. Under compliance policies and procedures approved by the Trust’s Board of Trustees (the Board), the Fund’s administrator has responsibility for oversight of valuation, including leading the cross-functional Valuation Committee (VC). The Fund may utilize independent pricing services, quotations from securities and financial instrument dealers, and other market sources to determine fair value.
Equity securities and derivative financial instruments listed on an exchange or on the NASDAQ National Market System are valued at the last quoted sale price or the official closing price of the day, respectively. Foreign equity securities are valued as of the close of trading on the foreign stock exchange on which the security is primarily traded, or as of 4 p.m. Eastern time. The value is then converted into its U.S. dollar equivalent at the foreign exchange rate in effect at 4 p.m. Eastern time on the day that the value of the security is determined.Over-the-counter (OTC) securities are valued within the range of the most recent quoted bid and ask prices. Securities that trade in multiple markets or on multiple
exchanges are valued according to the broadest and most representative market. Certain equity securities are valued based upon fundamental characteristics or relationships to similar securities.
Debt securities generally trade in the OTC market rather than on a securities exchange. The Fund’s pricing services use multiple valuation techniques to determine fair value. In instances where sufficient market activity exists, the pricing services may utilize a market-based approach through which quotes from market makers are used to determine fair value. In instances where sufficient market activity may not exist or is limited, the pricing services also utilize proprietary valuation models which may consider market characteristics such as benchmark yield curves, credit spreads, estimated default rates, anticipated market interest rate volatility, coupon rates, anticipated timing of principal repayments, underlying collateral, and other unique security features in order to estimate the relevant cash flows, which are then discounted to calculate the fair value. Securities denominated in a foreign currency are converted into their U.S. dollar equivalent at the foreign exchange rate in effect at 4 p.m. Eastern time on the date that the values of the foreign debt securities are determined.
Investments inopen-end mutual funds are valued at the closing NAV. Investments in repurchase agreements are valued at cost, which approximates fair value.
The Fund has procedures to determine the fair value of financial instruments for which market prices are not reliable or readily available. Under these procedures, the Fund primarily employs a market-based approach which may use related or comparable assets or liabilities, recent transactions, market multiples, book values, and other relevant information for the investment to determine the fair value of the investment. An income-based valuation approach may also be used in which the anticipated future cash flows of the investment are discounted to calculate fair value. Discounts may also be applied due to the nature or duration of any restrictions on the disposition of the investments. Due to the inherent uncertainty of valuations of such investments, the fair values may differ significantly from the values that would have been used had an active market existed.
Trading in securities on foreign securities stock exchanges and OTC markets may be completed before 4 p.m. Eastern time. In addition, trading in certain foreign markets may not take place on every Fund’s business day. Occasionally,
FRANKLIN TEMPLETON VARIABLE INSURANCE PRODUCTS TRUST
NOTES TO FINANCIAL STATEMENTS
Franklin Income VIP Fund(continued)
events occur between the time at which trading in a foreign security is completed and 4 p.m. Eastern time that might call into question the reliability of the value of a portfolio security held by the Fund. As a result, differences may arise between the value of the Fund’s portfolio securities as determined at the foreign market close and the latest indications of value at 4 p.m. Eastern time. In order to minimize the potential for these differences, the VC monitors price movements following the close of trading in foreign stock markets through a series of country specific market proxies (such as baskets of American Depositary Receipts, futures contracts and exchange traded funds). These price movements are measured against established trigger thresholds for each specific market proxy to assist in determining if an event has occurred that may call into question the reliability of the values of the foreign securities held by the Fund. If such an event occurs, the securities may be valued using fair value procedures, which may include the use of independent pricing services.
When the last day of the reporting period is anon-business day, certain foreign markets may be open on those days that the Fund’s NAV is not calculated, which could result in differences between the value of the Fund’s portfolio securities on the last business day and the last calendar day of the reporting period. Any significant security valuation changes due to an open foreign market are adjusted and reflected by the Fund for financial reporting purposes.
b. Foreign Currency Translation
Portfolio securities and other assets and liabilities denominated in foreign currencies are translated into U.S. dollars based on the exchange rate of such currencies against U.S. dollars on the date of valuation. The Fund may enter into foreign currency exchange contracts to facilitate transactions denominated in a foreign currency. Purchases and sales of securities, income and expense items denominated in foreign currencies are translated into U.S. dollars at the exchange rate in effect on the transaction date. Portfolio securities and assets and liabilities denominated in foreign currencies contain risks that those currencies will decline in value relative to the U.S. dollar. Occasionally, events may impact the availability or reliability of foreign exchange rates used to convert the U.S. dollar equivalent value. If such an event occurs, the foreign exchange rate will be valued at fair value using procedures established and approved by the Board.
The Fund does not separately report the effect of changes in foreign exchange rates from changes in market prices on securities held. Such changes are included in net realized and unrealized gain or loss from investments in the Statement of Operations.
Realized foreign exchange gains or losses arise from sales of foreign currencies, currency gains or losses realized between the trade and settlement dates on securities transactions and the difference between the recorded amounts of dividends, interest, and foreign withholding taxes and the U.S. dollar equivalent of the amounts actually received or paid. Net unrealized foreign exchange gains and losses arise from changes in foreign exchange rates on foreign denominated assets and liabilities other than investments in securities held at the end of the reporting period.
c. Joint Repurchase Agreement
The Fund enters into a joint repurchase agreement whereby its uninvested cash balance is deposited into a joint cash account with other funds managed by the investment manager or an affiliate of the investment manager and is used to invest in one or more repurchase agreements. The value and face amount of the joint repurchase agreement are allocated to the funds based on theirpro-rata interest. A repurchase agreement is accounted for as a loan by the Fund to the seller, collateralized by securities which are delivered to the Fund’s custodian. The fair value, including accrued interest, of the initial collateralization is required to be at least 102% of the dollar amount invested by the funds, with the value of the underlying securities marked to market daily to maintain coverage of at least 100%. Repurchase agreements are subject to the terms of Master Repurchase Agreements (MRAs) with approved counterparties (sellers). The MRAs contain various provisions, including but not limited to events of default and maintenance of collateral for repurchase agreements. In the event of default by either the seller or the Fund, certain MRAs may permit thenon-defaulting party to net andclose-out all transactions, if any, traded under such agreements. The Fund may sell securities it holds as collateral and apply the proceeds towards the repurchase price and any other amounts owed by the seller to the Fund in the event of default by the seller. This could involve costs or delays in addition to a loss on the securities if their value falls below the repurchase price owed by the seller. The joint repurchase agreement held by the Fund at year end, as indicated in the Statement of Investments, had been entered into on December 31, 2019.
FRANKLIN TEMPLETON VARIABLE INSURANCE PRODUCTS TRUST
NOTES TO FINANCIAL STATEMENTS
Franklin Income VIP Fund(continued)
1. Organization and Significant Accounting Policies(continued)
d. Derivative Financial Instruments
The Fund invested in derivative financial instruments in order to manage risk or gain exposure to various other investments or markets. Derivatives are financial contracts based on an underlying or notional amount, require no initial investment or an initial net investment that is smaller than would normally be required to have a similar response to changes in market factors, and require or permit net settlement. Derivatives contain various risks including the potential inability of the counterparty to fulfill their obligations under the terms of the contract, the potential for an illiquid secondary market, and/or the potential for market movements which expose the Fund to gains or losses in excess of the amounts shown in the Statement of Assets and Liabilities. Realized gain and loss and unrealized appreciation and depreciation on these contracts for the period are included in the Statement of Operations.
Collateral requirements differ by type of derivative. Collateral or initial margin requirements are set by the broker or exchange clearing house for exchange traded and centrally cleared derivatives. Initial margin deposited is held at the exchange and can be in the form of cash and/or securities.
The Fund purchased or wrote exchange traded option contracts primarily to gain exposure to equity price risk. An option is a contract entitling the holder to purchase or sell a specific amount of shares or units of an asset or notional amount of a swap (swaption), at a specified price. When an option is purchased or written, an amount equal to the premium paid or received is recorded as an asset or liability, respectively. Upon exercise of an option, the acquisition cost or sales proceeds of the underlying investment is adjusted by any premium received or paid. Upon expiration of an option, any premium received or paid is recorded as a realized gain or loss. Upon closing an option other than through expiration or exercise, the difference between the premium received or paid and the cost to close the position is recorded as a realized gain or loss.
See Note 8 regarding other derivative information.
e. Equity-Linked Securities
The Fund invests in equity-linked securities. Equity-linked securities are hybrid financial instruments that generally combine both debt and equity characteristics into a single
note form. Income received from equity-linked securities is recorded as realized gains in the Statement of Operations and may be based on the performance of an underlying equity security, an equity index, or an option position. The risks of investing in equity-linked securities include unfavorable price movements in the underlying security and the credit risk of the issuing financial institution. There may be no guarantee of a return of principal with equity-linked securities and the appreciation potential may be limited. Equity-linked securities may be more volatile and less liquid than other investments held by the Fund.
f. Securities Lending
The Fund participates in an agency based securities lending program to earn additional income. The Fund receives cash collateral against the loaned securities in an amount equal to at least 102% of the fair value of the loaned securities. Collateral is maintained over the life of the loan in an amount not less than 100% of the fair value of loaned securities, as determined at the close of Fund business each day; any additional collateral required due to changes in security values is delivered to the Fund on the next business day. The collateral is deposited into a joint cash account with other funds and is used to invest in a money market fund managed by Franklin Advisers, Inc., an affiliate of the Fund, and/or a joint repurchase agreement. The Fund may receive income from the investment of cash collateral, in addition to lending fees and rebates paid by the borrower. Income from securities loaned, net of fees paid to the securities lending agent and/or third-party vendor, is reported separately in the Statement of Operations. The Fund bears the market risk with respect to the collateral investment, securities loaned, and the risk that the agent may default on its obligations to the Fund. If the borrower defaults on its obligation to return the securities loaned, the Fund has the right to repurchase the securities in the open market using the collateral received. The securities lending agent has agreed to indemnify the Fund in the event of default by a third party borrower.
g. Senior Floating Rate Interests
The Fund invests in senior secured corporate loans that pay interest at rates which are periodically reset by reference to a base lending rate plus a spread. These base lending rates are generally the prime rate offered by a designated U.S. bank or the London InterBank Offered Rate (LIBOR). Senior secured corporate loans often require prepayment of principal from excess cash flows or at the discretion of the
FRANKLIN TEMPLETON VARIABLE INSURANCE PRODUCTS TRUST
NOTES TO FINANCIAL STATEMENTS
Franklin Income VIP Fund(continued)
borrower. As a result, actual maturity may be substantially less than the stated maturity. Senior secured corporate loans in which the Fund invests are generally readily marketable, but may be subject to certain restrictions on resale. On July 27, 2017, the United Kingdom’s Financial Conduct Authority announced its intention to cease sustaining LIBOR after 2021. There remains uncertainty regarding the future utilization of LIBOR and the nature of any replacement rate. As such, the potential effect of a transition away from LIBOR on the Fund or the Fund’s investments that use or may use a floating rate based on LIBOR cannot yet be determined.
h. Income and Deferred Taxes
It is the Fund’s policy to qualify as a regulated investment company under the Internal Revenue Code. The Fund intends to distribute to shareholders substantially all of its taxable income and net realized gains to relieve it from federal income and if applicable, excise taxes. As a result, no provision for U.S. federal income taxes is required.
The Fund may be subject to foreign taxation related to income received, capital gains on the sale of securities and certain foreign currency transactions in the foreign jurisdictions in which it invests. Foreign taxes, if any, are recorded based on the tax regulations and rates that exist in the foreign markets in which the Fund invests. When a capital gain tax is determined to apply, the Fund records an estimated deferred tax liability in an amount that would be payable if the securities were disposed of on the valuation date.
The Fund may recognize an income tax liability related to its uncertain tax positions under U.S. GAAP when the uncertain tax position has a less than 50% probability that it will be sustained upon examination by the tax authorities based on its technical merits. As of December 31, 2019, the Fund has determined that no tax liability is required in its financial statements related to uncertain tax positions for any open tax years (or expected to be taken in future tax years). Open tax years are those that remain subject to examination and are based on the statute of limitations in each jurisdiction in which the Fund invests.
i. Security Transactions, Investment Income, Expenses and Distributions
Security transactions are accounted for on trade date. Realized gains and losses on security transactions are determined on a specific identification basis. Interest income
and estimated expenses are accrued daily. Amortization of premium and accretion of discount on debt securities are included in interest income. Facility fees are recognized as income over the expected term of the loan. Dividend income is recorded on theex-dividend date except for certain dividends from securities where the dividend rate is not available. In such cases, the dividend is recorded as soon as the information is received by the Fund. Distributions to shareholders are recorded on theex-dividend date. Distributable earnings are determined according to income tax regulations (tax basis) and may differ from earnings recorded in accordance with U.S. GAAP. These differences may be permanent or temporary. Permanent differences are reclassified among capital accounts to reflect their tax character. These reclassifications have no impact on net assets or the results of operations. Temporary differences are not reclassified, as they may reverse in subsequent periods.
Common expenses incurred by the Trust are allocated among the Funds based on the ratio of net assets of each Fund to the combined net assets of the Trust or based on the ratio of number of shareholders of each Fund to the combined number of shareholders of the Trust. Fund specific expenses are charged directly to the Fund that incurred the expense.
Realized and unrealized gains and losses and net investment income, excluding class specific expenses, are allocated daily to each class of shares based upon the relative proportion of net assets of each class. Differences in per share distributions by class are generally due to differences in class specific expenses.
j. Accounting Estimates
The preparation of financial statements in accordance with U.S. GAAP requires management to make estimates and assumptions that affect the reported amounts of assets and liabilities at the date of the financial statements and the amounts of income and expenses during the reporting period. Actual results could differ from those estimates.
k. Guarantees and Indemnifications
Under the Trust’s organizational documents, its officers and trustees are indemnified by the Trust against certain liabilities arising out of the performance of their duties to the Trust. Additionally, in the normal course of business, the Trust, on behalf of the Fund, enters into contracts with service providers that contain general indemnification clauses. The Trust’s maximum exposure under these arrangements is
FRANKLIN TEMPLETON VARIABLE INSURANCE PRODUCTS TRUST
NOTES TO FINANCIAL STATEMENTS
Franklin Income VIP Fund(continued)
1. Organization and Significant Accounting Policies(continued)
k. Guarantees and Indemnifications(continued)
unknown as this would involve future claims that may be made against the Trust that have not yet occurred. Currently, the Trust expects the risk of loss to be remote.
2. Shares of Beneficial Interest
At December 31, 2019, there were an unlimited number of shares authorized (without par value). Transactions in the Fund’s shares were as follows:
| | | | | | | | | | | | | | | | |
| | | | | | Year Ended December 31, | | | | |
| | | 2019 | | | 2018 | |
| | | Shares | | | Amount | | | Shares | | | Amount | |
| | | | |
Class 1 Shares: | | | | | | | | | | | | | | | | |
Shares sold | | | 1,872,752 | | | $ | 30,211,199 | | | | 1,947,322 | | | $ | 31,806,598 | |
Shares issued in reinvestment of distributions | | | 1,709,790 | | | | 26,604,329 | | | | 2,128,651 | | | | 34,377,723 | |
Shares redeemed | | | (25,004,206 | ) | | | (417,140,348 | ) | | | (7,908,010 | ) | | | (128,847,778) | |
| | | | |
| | | | |
Net increase (decrease) | | | (21,421,664 | ) | | $ | (360,324,820 | ) | | | (3,832,037 | ) | | $ | (62,663,457) | |
| | | | |
| | | | |
Class 2 Shares: | | | | | | | | | | | | | | | | |
Shares sold | | | 16,435,568 | | | $ | 256,969,286 | | | | 11,659,052 | | | $ | 185,115,657 | |
Shares issued in reinvestment of distributions | | | 20,097,021 | | | | 301,656,285 | | | | 14,573,705 | | | | 227,495,537 | |
Shares redeemed | | | (42,487,994 | ) | | | (662,469,507 | ) | | | (60,726,257 | ) | | | (956,033,317) | |
| | | | |
| | | | |
Net increase (decrease) | | | (5,955,405 | ) | | $ | (103,843,936 | ) | | | (34,493,500 | ) | | $ | (543,422,123) | |
| | | | |
| | | | |
Class 4 Shares: | | | | | | | | | | | | | | | | |
Shares sold | | | 2,582,430 | | | $ | 41,387,759 | | | | 2,953,880 | | | $ | 48,028,259 | |
Shares issued in reinvestment of distributions | | | 1,370,224 | | | | 21,101,452 | | | | 934,885 | | | | 14,948,805 | |
Shares redeemed | | | (3,658,374 | ) | | | (58,335,226 | ) | | | (4,625,977 | ) | | | (74,794,820) | |
| | | | |
| | | | |
Net increase (decrease) | | | 294,280 | | | $ | 4,153,985 | | | | (737,212 | ) | | $ | (11,817,756) | |
| | | | |
3. Transactions with Affiliates
Franklin Resources, Inc. is the holding company for various subsidiaries that together are referred to as Franklin Templeton. Certain officers and trustees of the Fund are also officers and/or directors of the following subsidiaries:
| | |
| Subsidiary | | Affiliation |
| |
Franklin Advisers, Inc. (Advisers) | | Investment manager |
| |
Franklin Templeton Services, LLC (FT Services) | | Administrative manager |
| |
Franklin Templeton Distributors, Inc. (Distributors) | | Principal underwriter |
| |
Franklin Templeton Investor Services, LLC (Investor Services) | | Transfer agent |
FRANKLIN TEMPLETON VARIABLE INSURANCE PRODUCTS TRUST
NOTES TO FINANCIAL STATEMENTS
Franklin Income VIP Fund(continued)
a. Management Fees
The Fund pays an investment management fee to Advisers based on the average daily net assets of the Fund as follows:
| | |
| Annualized Fee Rate | | Net Assets |
| |
0.625% | | Up to and including $100 million |
| |
0.500% | | Over $100 million, up to and including $250 million |
| |
0.450% | | Over $250 million, up to and including $7.5 billion |
| |
0.440% | | Over $7.5 billion, up to and including $10 billion |
| |
0.430% | | Over $10 billion, up to and including $12.5 billion |
| |
0.420% | | Over $12.5 billion, up to and including $15 billion |
| |
0.400% | | In excess of $15 billion |
For the year ended December 31, 2019, the gross effective investment management fee rate was 0.455% of the Fund’s average daily net assets.
b. Administrative Fees
Under an agreement with Advisers, FT Services provides administrative services to the Fund. The fee is paid by Advisers based on the Fund’s average daily net assets, and is not an additional expense of the Fund.
c. Distribution Fees
The Board has adopted distribution plans for Class 2 and Class 4 shares pursuant to Rule12b-1 under the 1940 Act. Under the Fund’s compensation distribution plans, the Fund pays Distributors for costs incurred in connection with the servicing, sale and distribution of the Fund’s shares up to 0.35% per year of its average daily net assets of each class. The Board has agreed to limit the current rate to 0.25% per year for Class 2. The plan year, for purposes of monitoring compliance with the maximum annual plan rates, is February 1 through January 31.
d. Transfer Agent Fees
Investor Services, under terms of an agreement, performs shareholder servicing for the Fund and is not paid by the Fund for the services.
e. Investments in Affiliated Management Investment Companies
The Fund invests in one or more affiliated management investment companies for purposes other than exercising a controlling influence over the management or policies. Management fees paid by the Fund are waived on assets invested in the affiliated management investment companies, as noted in the Statement of Operations, in an amount not to exceed the management and administrative fees paid directly or indirectly by each affiliate. During the year ended December 31, 2019, the Fund held investments in affiliated management investment companies as follows:
| | | | | | | | | | | | | | | | | | | | | | | | | | | | | | | | |
| | | Value at
Beginning of Year | | | Purchases | | | Sales | | | Realized Gain (Loss) | | | Net Change in Unrealized Appreciation (Depreciation) | | | Value at End of Year | | | Number of Shares Held at End of Year | | | Investment Income | |
| | | | | | | |
Non-Controlled Affiliates | | | | | | | | | | | | | | | | | | | | | | | | | | | | | |
| | | | | | | | |
| | | | | | | | | | | | | | | | | | | | | | | | Dividends | |
Institutional Fiduciary Trust Money Market Portfolio, 1.26% | | $ | 157,193,174 | | | $ | 1,445,763,458 | | | $ | (1,518,985,496 | ) | | | $ — | | | | $ — | | | $ | 83,971,136 | | | | 83,971,136 | | | | $2,711,159 | |
FRANKLIN TEMPLETON VARIABLE INSURANCE PRODUCTS TRUST
NOTES TO FINANCIAL STATEMENTS
Franklin Income VIP Fund(continued)
3. Transactions with Affiliates(continued)
e. Investments in Affiliated Management Investment Companies(continued)
| | | | | | | | | | | | | | | | | | | | | | | | | | | | | | |
| | | Value at
Beginning of Year | | | Purchases | | | Sales | | | Realized
Gain (Loss) | | | Net Change in Unrealized Appreciation (Depreciation) | | | Value at End of Year | | | Number of Shares Held at End of Year | | | Investment
Income |
| | | | | | | |
Non-Controlled Affiliates(continued) | | | | | | | | | | | | | | | | | | | | | | | | | | | |
| | | | | | | | |
| | | | | | | | | | | | | | | | | | | | | | | | Income from securities
loaned |
Institutional Fiduciary Trust Money Market Portfolio, 1.26% | | $ | 1,099,000 | | | $ | 82,069,000 | | | $ | (82,421,000 | ) | | | $ — | | | | $ — | | | $ | 747,000 | | | | 747,000 | | | $ 27,098 |
| | | | | | | | | | |
| | | | | | | | |
Total Affiliated Securities | | $ | 158,292,174 | | | $ | 1,527,832,458 | | | $ | (1,601,406,496 | ) | | | $ — | | | | $ — | | | $ | 84,718,136 | | | | | | | $2,738,257 |
| | | | | | | | | | |
4. Expense Offset Arrangement
The Fund has entered into an arrangement with its custodian whereby credits realized as a result of uninvested cash balances are used to reduce a portion of the Fund’s custodian expenses. During the year ended December 31, 2019, the custodian fees were reduced as noted in the Statement of Operations.
5. Income Taxes
The tax character of distributions paid during the years ended December 31, 2019 and 2018, was as follows:
| | | | | | | | |
| | | 2019 | | | | | 2018 |
Distributions paid from: | | | | | | | | |
Ordinary income | | $ | 268,440,004 | | | | | $ 276,822,065 |
Long term capital gain | | | 80,922,062 | | | | | — |
| | | |
| | | |
| | $ | 349,362,066 | | | | | $ 276,822,065 |
| | | |
At December 31, 2019, the cost of investments, net unrealized appreciation (depreciation), undistributed ordinary income and undistributed long term capital gains for income tax purposes were as follows:
| | | | |
Cost of investments | | $ | 4,539,905,082 | |
| | | | |
| |
Unrealized appreciation | | $ | 748,366,284 | |
Unrealized depreciation | | | (363,289,222) | |
| | | | |
| |
Net unrealized appreciation (depreciation) | | $ | 385,077,062 | |
| | | | |
| |
Distributable earnings: | | | | |
Undistributed ordinary income | | $ | 249,420,965 | |
Undistributed long term capital gains | | | 3,475,287 | |
| | | | |
| |
Total distributable earnings | | $ | 252,896,252 | |
| | | | |
Differences between income and/or capital gains as determined on a book basis and a tax basis are primarily due to differing treatments of equity-linked securities, foreign currency transactions and wash sales.
FRANKLIN TEMPLETON VARIABLE INSURANCE PRODUCTS TRUST
NOTES TO FINANCIAL STATEMENTS
Franklin Income VIP Fund(continued)
6. Investment Transactions
Purchases and sales of investments (excluding short term securities) for the year ended December 31, 2019, aggregated $1,235,622,655 and $1,795,514,964, respectively.
At December 31, 2019, in connection with securities lending transactions, the Fund loaned corporate bonds and received $934,657 of cash collateral. The gross amount of recognized liability for such transactions is included in payable upon return of securities loaned in the Statement of Assets and Liabilities. The agreements can be terminated at any time.
7. Credit Risk
At December 31, 2019, the Fund had 26.7% of its portfolio invested in high yield, senior secured floating rate loans, or other securities rated below investment grade and unrated securities, if any. These securities may be more sensitive to economic conditions causing greater price volatility and are potentially subject to a greater risk of loss due to default than higher rated securities.
8. Other Derivative Information
At December 31, 2019, investments in derivative contracts are reflected in the Statement of Assets and Liabilities as follows:
| | | | | | | | | | |
| | | Asset Derivatives | | | Liability Derivatives |
| | | | |
Derivative Contracts Not Accounted for as Hedging Instruments | | Statement of Assets and Liabilities Location | | Fair Value | | | Statement of Assets and Liabilities Location | | Fair Value |
| | | | |
Equity contracts | | Investments in securities, at value | | $ | 11,270,000 | a | | Options written, at value | | $ — |
| | | | | | | | | | |
aPurchased option contracts are included in investments in securities, at value in the Statement of Assets and Liabilities.
For the year ended December 31, 2019, the effect of derivative contracts in the Statement of Operations was as follows:
| | | | | | | | | | | | |
Derivative Contracts Not Accounted for as Hedging Instruments | | Statement of Operations Location | | Net Realized Gain (Loss) for the Year | | | Statement of Operations Location | | Net Change in Unrealized Appreciation (Depreciation) for the Year | |
| |
| | | | |
| | Net realized gain (loss) from: | | | | | | Net change in unrealized appreciation (depreciation) on: | | | | |
Equity contracts | | Investments | | $ | — | | | Investments | | $ | (22,734,076 | )a |
| | Written options | | | 2,885,179 | | | Written options | | | — | |
| | | | | | | | | | | | |
Totals | | | | $ | 2,885,179 | | | | | $ | (22,734,076 | ) |
| | | | | | | | | | | | |
aPurchased option contracts are included in net realized gain (loss) from investments and net change in unrealized appreciation (depreciation) on investments in the Statement of Operations.
For the year ended December 31, 2019, the average month end notional amount of options represented 378,731 shares.
See Note 1(d) regarding derivative financial instruments.
FRANKLIN TEMPLETON VARIABLE INSURANCE PRODUCTS TRUST
NOTES TO FINANCIAL STATEMENTS
Franklin Income VIP Fund(continued)
9. Credit Facility
The Fund, together with other U.S. registered and foreign investment funds (collectively, Borrowers), managed by Franklin Templeton, are borrowers in a joint syndicated senior unsecured credit facility totaling $2 billion (Global Credit Facility) which matured on February 7, 2020. This Global Credit Facility provides a source of funds to the Borrowers for temporary and emergency purposes, including the ability to meet future unanticipated or unusually large redemption requests. Effective February 7, 2020, the Borrowers renewed the Global Credit Facility for a one year term, maturing February 5, 2021, for a total of $2 billion.
Under the terms of the Global Credit Facility, the Fund shall, in addition to interest charged on any borrowings made by the Fund and other costs incurred by the Fund, pay its share of fees and expenses incurred in connection with the implementation and maintenance of the Global Credit Facility, based upon its relative share of the aggregate net assets of all of the Borrowers, including an annual commitment fee of 0.15% based upon the unused portion of the Global Credit Facility. These fees are reflected in other expenses in the Statement of Operations. During the year ended December 31, 2019, the Fund did not use the Global Credit Facility.
10. Fair Value Measurements
The Fund follows a fair value hierarchy that distinguishes between market data obtained from independent sources (observable inputs) and the Fund’s own market assumptions (unobservable inputs). These inputs are used in determining the value of the Fund’s financial instruments and are summarized in the following fair value hierarchy:
| | • | | Level 1 – quoted prices in active markets for identical financial instruments |
| | • | | Level 2 – other significant observable inputs (including quoted prices for similar financial instruments, interest rates, prepayment speed, credit risk, etc.) |
| | • | | Level 3 – significant unobservable inputs (including the Fund’s own assumptions in determining the fair value of financial instruments) |
The input levels are not necessarily an indication of the risk or liquidity associated with financial instruments at that level.
FRANKLIN TEMPLETON VARIABLE INSURANCE PRODUCTS TRUST
NOTES TO FINANCIAL STATEMENTS
Franklin Income VIP Fund(continued)
A summary of inputs used as of December 31, 2019, in valuing the Fund’s assets carried at fair value, is as follows:
| | | | | | | | | | | | | | |
| | | Level 1 | | | Level 2 | | | Level 3 | | | Total |
| | | | |
Assets: | | | | | | | | | | | | | | |
Investments in Securities:a | | | | | | | | | | | | | | |
Equity Investments:b | | | | | | | | | | | | | | |
Financials | | $ | 322,886,679 | | | $ | 19,118,199 | | | $ | — | | | $ 342,004,878 |
All Other Equity Investments | | | 1,678,392,091 | | | | — | | | | — | | | 1,678,392,091 |
Equity-Linked Securities | | | — | | | | 516,079,231 | | | | — | | | 516,079,231 |
Corporate Bonds | | | — | | | | 1,747,269,004 | | | | — | | | 1,747,269,004 |
Senior Floating Rate Interests | | | — | | | | 43,230,344 | | | | — | | | 43,230,344 |
U.S. Government and Agency Securities | | | — | | | | 355,374,152 | | | | — | | | 355,374,152 |
Mortgage-Backed Securities | | | — | | | | 146,456,651 | | | | — | | | 146,456,651 |
Escrows and Litigation Trusts | | | — | | | | — | | | | — | c | | — |
Options Purchased | | | 11,270,000 | | | | — | | | | — | | | 11,270,000 |
Short Term Investments | | | 84,718,136 | | | | 187,657 | | | | — | | | 84,905,793 |
| | | |
| | | | |
Total Investments in Securities | | $ | 2,097,266,906 | | | $ | 2,827,715,238 | | | $ | — | | | $ 4,924,982,144 |
| | | |
aFor detailed categories, see the accompanying Statement of Investments.
bIncludes common, preferred and convertible preferred stocks.
cIncludes securities determined to have no value at December 31, 2019.
A reconciliation of assets in which Level 3 inputs are used in determining fair value is presented when there are significant Level 3 financial instruments at the beginning and/or end of the year.
11. Subsequent Events
The Fund has evaluated subsequent events through the issuance of the financial statements and determined that no events have occurred that require disclosure other than those already disclosed in the financial statements.
Abbreviations
| | | | |
| Currency | | Selected Portfolio |
| | |
USD United States Dollar | | ADR | | American Depositary Receipt |
| | |
| | FNMA | | Federal National Mortgage Association |
| | |
| | FRN | | Floating Rate Note |
| | |
| | LIBOR | | London InterBank Offered Rate |
FRANKLIN TEMPLETON VARIABLE INSURANCE PRODUCTS TRUST
Report of Independent Registered Public Accounting Firm
To the Board of Trustees of Franklin Templeton Variable Insurance Products Trust and Shareholders of Franklin Income VIP Fund
Opinion on the Financial Statements
We have audited the accompanying statement of assets and liabilities, including the statement of investments, of Franklin Income VIP Fund (the “Fund”) as of December 31, 2019, the related statement of operations for the year ended December 31, 2019, the statement of changes in net assets for each of the two years in the period ended December 31, 2019, including the related notes, and the financial highlights for each of the five years in the period ended December 31, 2019 (collectively referred to as the “financial statements”). In our opinion, the financial statements present fairly, in all material respects, the financial position of the Fund as of December 31, 2019, the results of its operations for the year then ended, the changes in its net assets for each of the two years in the period ended December 31, 2019 and the financial highlights for each of the five years in the period ended December 31, 2019 in conformity with accounting principles generally accepted in the United States of America.
Basis for Opinion
These financial statements are the responsibility of the Fund’s management. Our responsibility is to express an opinion on the Fund’s financial statements based on our audits. We are a public accounting firm registered with the Public Company Accounting Oversight Board (United States) (PCAOB) and are required to be independent with respect to the Fund in accordance with the U.S. federal securities laws and the applicable rules and regulations of the Securities and Exchange Commission and the PCAOB.
We conducted our audits of these financial statements in accordance with the standards of the PCAOB. Those standards require that we plan and perform the audit to obtain reasonable assurance about whether the financial statements are free of material misstatement, whether due to error or fraud.
Our audits included performing procedures to assess the risks of material misstatement of the financial statements, whether due to error or fraud, and performing procedures that respond to those risks. Such procedures included examining, on a test basis, evidence regarding the amounts and disclosures in the financial statements. Our audits also included evaluating the accounting principles used and significant estimates made by management, as well as evaluating the overall presentation of the financial statements. Our procedures included confirmation of securities owned as of December 31, 2019 by correspondence with the custodian, transfer agent and brokers; when replies were not received from brokers, we performed other auditing procedures. We believe that our audits provide a reasonable basis for our opinion.
PricewaterhouseCoopers LLP
San Francisco, California
February 20, 2020
We have served as the auditor of one or more investment companies in the Franklin Templeton Group of Funds since 1948.
FRANKLIN TEMPLETON VARIABLE INSURANCE PRODUCTS TRUST
Tax Information (unaudited)
Franklin Income VIP Fund
Under Section 852(b)(3)(C) of the Internal Revenue Code, the Fund hereby reports the maximum amount allowable but no less than $80,922,062 as a long term capital gain dividend for the fiscal year ended December 31, 2019.
Under Section 854(b)(1)(A) of the Internal Revenue Code, the Fund hereby reports 20.62% of the ordinary income dividends as income qualifying for the dividends received deduction for the fiscal year ended December 31, 2019.
This page intentionally left blank.
Franklin Mutual Global Discovery VIP Fund
This annual report for Franklin Mutual Global Discovery VIP Fund covers the fiscal year ended December 31, 2019.
Class 4 Performance Summary as of December 31, 2019
Average annual total return of Class 4 shares* represents the average annual change in value, assuming reinvestment of dividends and capital gains. Average returns smooth out variations in returns, which can be significant; they are not the same asyear-by-year results.
| | | | | | | | | | | | | | | | | | | | |
Periods ended 12/31/19 | | 1-Year | | | | | | 5-Year | | | | | | 10-Year | |
| | | | | |
Average Annual Total Return | | | +24.28% | | | | | | | | +5.22% | | | | | | | | +7.87% | |
*The Fund has a fee waiver associated with any investment it makes in a Franklin Templeton money fund and/or other Franklin Templeton fund, contractually guaranteed through 4/30/20. Fund investment results reflect the fee waiver; without this waiver, the results would have been lower.
Performance reflects the Fund’s Class 4 operating expenses, but doesnotinclude any contract fees, expenses or sales charges. If they had been included, performance would be lower. These charges and deductions, particularly for variable life policies, can have a significant effect on contract values and insurance benefits. See the contract prospectus for a complete description of these expenses, including sales charges.
Performance data represent past performance, which does not guarantee future results. Investment return and principal value will fluctuate, and you may have a gain or loss when you sell your shares. Current performance may differ from figures shown.
Total Return Index Comparison for a Hypothetical $10,000 Investment (1/1/10–12/31/19)
The graph below shows the change in value of a hypothetical $10,000 investment in the Fund over the indicated period and includes reinvestment of any income or distributions. The Fund’s performance* is compared to the performance of the MSCI World Index. One cannot invest directly in an index, and an index is not representative of the Fund’s portfolio.Please see Important Notes to Performance Information preceding the Fund Summaries.
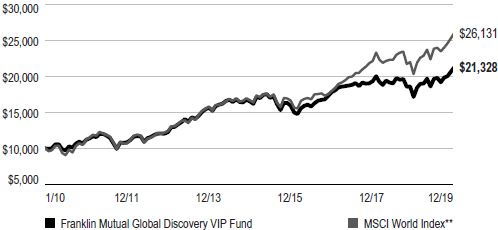
**Source: Morningstar. Please see Index Descriptions following the Fund Summaries.
FRANKLIN MUTUAL GLOBAL DISCOVERY VIP FUND
Fund Goal and Main Investments
The Fund seeks capital appreciation. Under normal market conditions, the Fund invests primarily in U.S. and foreign equity securities that we believe are available at market prices less than their intrinsic value. The equity securities in which the Fund invests are primarily common stock. To a lesser extent, the Fund also invests in merger arbitrage securities and the debt and equity of distressed companies. The Fund may invest substantially and potentially up to 100% of its assets in foreign securities, which may include sovereign debt and participations in foreign government debt.
Fund Risks
All investments involve risks, including possible loss of principal. Value securities may not increase in price as anticipated, or may decline further in value. The Fund’s investments in foreign securities involve more risks than U.S. securities, including political and economic developments, trading practices, availability of information, limited markets, and currency exchange fluctuations and policies. Because the Fund may invest at least a significant portion of its assets in companies in a specific region, including Europe, the Fund is subject to greater risks of adverse developments in that region and/or the surrounding regions than a fund that is more broadly diversified geographically. Securities issued by smaller and midsize companies may be more volatile in price than those of larger companies, involve substantial risks and should be considered speculative. Derivatives involve costs and can create economic leverage in the Fund’s portfolio which may result in significant volatility and cause the Fund to participate in losses (as well as gains) in an amount that exceeds the Fund’s initial investment. The Fund’s investments in companies engaged in mergers, reorganizations or liquidations also involve special risks as pending deals may not be completed on time or on favorable terms, as well as lower-rated bonds, which entail higher credit risk. The Fund is actively managed but there is no guarantee that the manager’s investment decisions will produce the desired results. The Fund’s prospectus also includes a description of the main investment risks.
Geographic Composition*
Based on Total Net Assets as of 12/31/19
*Figures are stated as a percentage of total and may not equal 100% or may be negative due to rounding, use of any derivatives, unsettled trades or other factors.
Performance Overview
You can find the Fund’sone-year total return in the Performance Summary. In comparison, the Fund’s benchmark, the MSCI World Index posted a +28.40% total return for the same period.1
Economic and Market Overview
Global developed and emerging market stocks, as measured by the MSCI All Country World Index, posted strong returns during the reporting period. Although global economic growth slowed from 2018, interest-rate cuts from many central banks and the easing of trade tensions nearperiod-end contributed to the generally positive environment for equities worldwide. Reflecting investor optimism and slowing but resilient economic growth, stocks advanced in every major region of the globe.
In the U.S., solid economic growth also supported equities, as healthy consumer spending and a strong labor market
1. Source: Morningstar. One cannot invest directly in an index, and an index is not representative of the Fund’s portfolio. Please see Index Descriptions following the Fund Summaries.
The dollar value, number of shares or principal amount, and names of all portfolio holdings are listed in the Fund’s Statement of Investments (SOI).
FRANKLIN MUTUAL GLOBAL DISCOVERY VIP FUND
kept the economy afloat. The unemployment rate fell during the year, reaching 3.5% in September, November and December 2019, the lowest recorded unemployment rate in 50 years.2 Wages also grew, albeit at a moderate pace, and inflation remained persistently low. In addition, deficit spending by the U.S. government boosted current growth at the expense of long-term debt. Despite the strength in the consumer sector, some parts of the economy struggled, particularly heavy industry. Annual industrial production contracted late in the reporting period, manufacturing output stalled and capital spending declined.
The U.S. Federal Reserve (Fed) provided a substantial boost to equity markets early in the reporting period as it shifted to a more accommodative monetary policy. In January 2019, the Fed signaled the end of its tightening cycle and cut the federal funds rate three times thereafter, lowering it to a range of 1.50%–1.75%. Stocks responded positively to the interest-rate cuts and gained further in December 2019 after the Fed indicated it would likely leave interest rates unchanged in 2020.
Growth slowed overall in the eurozone, particularly in Germany and Italy. Germany, which is heavily reliant on exports, was adversely affected by the trade conflict between the U.S. and China and the resulting slowdown in global trade. In Italy, political uncertainty and budget concerns caused the country’s annual gross domestic product (GDP) growth to stall in 2019’s first quarter before accelerating in the second quarter. Despite sluggish economic conditions, European developed market equities, as measured by the MSCI Europe Index, posted strong returns overall, as easing trade tensions buoyed investor optimism and an electoral victory by the Conservative Party in the U.K. alleviated uncertainty surrounding Brexit. Although the European Central Bank left its headline refinancing rate unchanged, it lowered the deposit rate and restarted its bond-buying stimulus program, further supporting stocks.
Economic growth in Asia was relatively solid overall, despite slowdowns in several large emerging market countries, such as China and India. Japan’s economy grew amid the Bank of Japan’s sizable stimulus program. The trade war between the U.S. and China provided the backdrop for Asian stocks, which rose and fell in sync with investor sentiment regarding a trade deal. A phase one trade agreement between the two countries reached in December 2019 propelled Asian developed and emerging market stocks, which ultimately ended with strong returns over the12-month period, as measured by the MSCI All Country Asia Index.
Emerging market stocks overall experienced several sharp selloffs and subsequent rebounds throughout the reporting period before ending with gains. In aggregate, economic growth slowed somewhat from 2018 but remained solid, although there was some variation among individual countries. Many central banks in emerging markets cut interest rates throughout the reporting period which, along with resilient GDP growth, provided a supportive environment for equities. Russian stocks posted the highest returns among emerging markets as the threat of further sanctions receded and a solid fiscal environment reassured investors. Overall, global emerging markets, as measured by the MSCI Emerging Markets Index, posted robust returns for the period.
Investment Strategy
At Franklin Mutual Advisors, we are committed to our distinctive value approach to investing. Our major investment strategy is investing in undervalued stocks. When selecting undervalued equities, we are attracted to what we believe are fundamentally strong companies with healthy balance sheets, high-quality assets, substantial free cash flow and shareholder-oriented management teams and whose stocks are trading at discounts to our assessment of the companies’ intrinsic or business value. We also look for asset-rich companies whose shares may be trading at depressed levels due to concerns over short-term earnings disappointments, litigation, management strategy or other perceived negatives. While the vast majority of our undervalued equity investments are made in publicly traded companies globally, we may invest occasionally in privately held companies as well.
We complement this more traditional investment strategy with two others. One is distressed investing, which is complex and can take many forms. The most common distressed investment the Fund undertakes is the purchase of financially troubled or bankrupt companies’ debt at a substantial discount to face value. After the financially distressed company is reorganized, often in bankruptcy court, the old debt is typically replaced with new securities issued by the financially stronger company.
The other piece of our investment strategy is participating in arbitrage situations, another highly specialized field. When companies announce proposed mergers or takeovers, commonly referred to as “deals,” the target company may trade at a discount to the bid it ultimately accepts. One form of arbitrage involves purchasing the target company’s stock
2. Source: U.S. Bureau of Labor Statistics.
FRANKLIN MUTUAL GLOBAL DISCOVERY VIP FUND
when it is trading below the value we believe it would receive in a deal. In keeping with our commitment to a relatively conservative investment approach, we typically focus our arbitrage efforts on announced deals, and eschew rumored deals or other situations we consider relatively risky.
In addition, it is our practice to hedge the Fund’s currency exposure when we deem it advantageous for our shareholders.
|
What is meant by "hedge"? To hedge an investment is to take a position intended to offset potential losses that may be incurred by a companion financial instrument. Hedging an investment may also offset potential gains. |
Manager’s Discussion
The end of a decade is a natural time for reflection about the years that have just passed and to look ahead to what the next 10 might have in store. Across Wall Street, we see many prognostications, and while we are not in the forecasting business, we do allow ourselves to think about investment opportunities over such an extended time period. But experience has taught us that while trying to predict the exact course of markets and/or economic and political events that will drive them may be fun, it is not all that useful.
As 2010 began, the global economy was still recovering from the Global Financial Crisis. The U.S. government owned significant portions of the banking and automotive sectors. The Fed had already started quantitative easing (QE), with QE 2 and QE 3 still to come. In Europe, concerns about Greece’s finances were emerging, and in China the effects of 2009’s massive stimulus programs were starting to take hold.
Over the subsequent years we saw ongoing, global QE, culminating in trillions of dollars of debt yielding negative interest rates. The European Union (EU) was in continuous upheaval, with Greece threatening to leave, but eventually staying in the eurozone; the U.K. pursuing and achieving Brexit; and ongoing strain between core members Germany, France, Italy and Spain. In the U.S., average annual economic growth was restrained and finished the decade below 2%, trailing the minimum 3% expectation of prior decades. Strong corporate profits and lower corporate tax rates were bright spots.
Equity markets delivered a very good decade—one of the best in history—with the MSCI World Index and the S&P 500 posting average annual total returns of +10.08% and
Top 10 Sectors/Industries
12/31/19
| | | | |
| | | % of Total
Net Assets | |
| |
Banks | | | 11.7% | |
| |
Oil, Gas & Consumable Fuels | | | 11.2% | |
| |
Pharmaceuticals | | | 10.2% | |
| |
Insurance | | | 9.1% | |
| |
Technology Hardware, Storage & Peripherals | | | 5.0% | |
| |
Software | | | 4.3% | |
| |
Automobiles | | | 3.8% | |
| |
Tobacco | | | 3.2% | |
| |
Health Care Equipment & Supplies | | | 2.9% | |
| |
Media | | | 2.8% | |
+13.56%, respectively.1 During the decade, Franklin Mutual Global Discovery VIP Fund posted a solid return that nonetheless lagged the MSCI World Index, its benchmark. The Fund’s value strategy, which seeks to identify mispriced securities and limit downside risk, was out of favor in an environment that generally encouraged investors to assume more risk. Conversely, in the prior decade, the Fund outperformed the MSCI World Index. Our active investment approach focusing on individual opportunities was more conducive to the prior decade’s greater volatility.
In our view, going forward we expect more political and monetary uncertainty and economic growth in unexpected places. Corporate profits will have good years and bad years. Some industries will be massively disrupted, while others will find a way to adjust and prosper, even within the context of artificial intelligence and machine learning. Recent events, such as the coronavirus outbreak, have caused, and may continue to cause, uncertainty and volatility in the Chinese economy, potentially leading to vulnerability in 2020 global growth expectations. As for investment positioning, we intend to avoid forecasts that would lead us to make the Fund’s success dependent on a specific set of outcomes. Rather, we will seek to continue with our time-tested value process and complement it with new tools that enhance our security evaluation and selection process. To that end, we have integrated risk and quantitative portfolio analysis tools that provide us with fresh insights about performance, and help us identify companies and securities that we believe satisfy our investors’ goals of risk-adjusted returns that are not wholly dependent on any one economic or political scenario.
FRANKLIN MUTUAL GLOBAL DISCOVERY VIP FUND
Fund Performance
Turning to Fund performance, top positive contributors included U.S.-based companies Charter Communications, Citigroup and Walt Disney.
Shares of cable operator Charter Communications surged after the company reported operating and financial results that were broadly ahead of consensus estimates. Capital expenditures were lower than expected and drove free cash flow, which was used during the period to buy back $3.1 billion of the company’s stock. The market was anticipating share repurchases totaling $2.25 billion. Revenue accelerated 5.1% compared with consensus forecasts of 4.5%. The increased revenue, however, did not reflect the impact of a broad-based increase in subscriber fees implemented during the period, which could drive revenue growth and margin expansion in 2020. According to the company’s management, there has not been a meaningful decrease in customers as a result of the higher subscriber fees.
Investors bid up shares of bank and financial service provider Citigroup following the release of third-quarter earnings that beat consensus expectations. Highlights included increases in deposits of 6% quarter-over-quarter and 11% year-over-year; growth in revenues and purchase volumes in the North America-branded cards division by 11% and 7% year-over-year, respectively; and strong results in the bank’s Asian operations across the board. Management also repurchased 76 million, or 3.3%, of outstanding shares of the company during the period.
Shares of family entertainment and media enterprise Walt Disney surged in late 2019. The rally was kicked off by an earnings report characterized byacross-the-board outperformance of Disney legacy assets and a better-than-expected outlook for fiscal-year 2020 earnings. The company’s stock continued to rise following the successful launch of Disney+, which reported more than 10 million subscribers on the first day of service, exceeding forecasts. The box office performance of Frozen II, which set a record for Thanksgiving-weekend receipts, also helped boost the stock’s performance.
During the period under review, Fund investments that detracted from performance included U.S.-based companies Occidental Petroleum (not held atperiod-end), Walgreens Boots Alliance and Clear Channel Outdoor Holdings (not held atperiod-end).
The stock of Occidental Petroleum, a petroleum and chemical products company, traded lower in 2019 as investors struggled to accept its acquisition of Anadarko
Top 10 Holdings
12/31/19
| | | | |
Company Sector/Industry, Country | | % of Total
Net Assets | |
| |
GlaxoSmithKline PLC Pharmaceuticals, U.K. | | | 3.3% | |
| |
Novartis AG Pharmaceuticals, Switzerland | | | 2.9% | |
| |
Medtronic PLC Health Care Equipment & Supplies, U.S. | | | 2.9% | |
| |
The Walt Disney Co. Entertainment, U.S. | | | 2.6% | |
| |
Volkswagen AG Automobiles, Germany | | | 2.5% | |
| |
Samsung Electronics Co. Ltd. Technology Hardware, Storage & Peripherals, South Korea | | | 2.5% | |
| |
Kinder Morgan Inc. Oil, Gas & Consumable Fuels, U.S. | | | 2.4% | |
| |
British American Tobacco PLC Tobacco, U.K. | | | 2.3% | |
| |
Citigroup Inc. Banks, U.S. | | | 2.1% | |
| |
The Hartford Financial Services Group Inc. Insurance, U.S. | | | 2.0% | |
Petroleum, during a period in which energy stocks were under pressure from falling crude oil prices. We think the Anadarko deal should be highly beneficial to the company’s per share metrics, although the acquisition will make the company more dependent on oil prices, while significantly weakening its balance sheet. The acquired Permian Basin assets complement Occidental’s existing portfolio, and the considerable free cash flow generated from Anadarko’s Gulf of Mexico operations can help reduce debt and support its dividend. Occidental’s management is strengthening the company’s financial position by disposing ofnon-core assets, which is key to restoring investor confidence, in our view.
Shares of drug store services provider Walgreens Boots Alliance began to sell off early in 2019, when the chief financial officer cited negative industry trends in drug prices and pharmacy benefit manager (PBM) reimbursement rates. Shares also fell in reaction to the company’s limited success in offsetting those challenges by increasing its volume of drug sales or renegotiating with PBMs. These pressures, and weakness in both its U.S. and U.K. stores, resulted in a cut to full-year guidance in April. However, Walgreens is reducing costs throughout the enterprise, and is attempting to reduce exposure to lower margin categories within the
FRANKLIN MUTUAL GLOBAL DISCOVERY VIP FUND
front of its stores, which we believe can help boost growth and profitability over the longer term. The company’s share price rallied in early November based on news that global investment firm KKR had approached the company about taking it private via a leveraged buyout that would likely be the largest in history. However, the stock retreated later when deal terms failed to materialize.
Shares of outdoor advertising company Clear Channel Outdoor Holdings weakened after the company sold 100 million shares of stock in July, shortly after emerging from bankruptcy and separating from mass media company iHeart Communications. The company Clear Channel Outdoor announced it is using the stock proceeds to repurchase the debt of Clear Channel Worldwide Holdings, a subsidiary. Following the equity issuance, which was dilutive and at a depressed price, Clear Channel Outdoor reported mixed earnings. The strength of domestic operations was overshadowed by significantly lower international results, driven primarily by a 51%-owned China joint venture.
During the period, the Fund held currency forwards and futures seeking to hedge most of the currency risk of the portfolio’snon-U.S. dollar investments. The hedges had a modestly positive overall impact on the Fund’s performance.
|
What is a currency forward? A currency forward is a direct agreement between the Fund and a counterparty to buy or sell a foreign currency in exchange for another currency at a specific exchange rate on a future date. |
|
What is a future? A future is an agreement between the Fund and a counterparty made through a U.S. or foreign futures exchange to buy or sell an underlying instrument or asset at a specific price on a future date. |
Thank you for your participation in Franklin Mutual Global Discovery VIP Fund. We look forward to serving your future investment needs.
The foregoing information reflects our analysis, opinions and portfolio holdings as of December 31, 2019, the end of the reporting period. The way we implement our main investment strategies and the resulting portfolio holdings may change depending on factors such as market and economic conditions. These opinions may not be relied upon as investment advice or an offer for a particular security. The information is not a complete analysis of every aspect of any market, country, industry, security or the Fund. Statements of fact are from sources considered reliable, but the investment manager makes no representation or warranty as to their completeness or accuracy. Although historical performance is no guarantee of future results, these insights may help you understand our investment management philosophy.
FRANKLIN MUTUAL GLOBAL DISCOVERY VIP FUND
Class 4 Fund Expenses
As an investor in a variable insurance contract (Contract) that indirectly provides for investment in an underlying mutual fund, you can incur transaction and/or ongoing expenses at both the Fund level and the Contract Level: (1) transaction expenses can include sales charges (loads) on purchases, surrender fees, transfer fees and premium taxes; and (2) ongoing expenses can include management fees, distribution and service(12b-1) fees, contract fees, annual maintenance fees, mortality and expense risk fees and other fees and expenses. All mutual funds and Contracts have some types of ongoing expenses. The table below shows Fund-level ongoing expenses and can help you understand these costs and compare them with those of other mutual funds offered through the Contract. The table assumes a $1,000 investment held for the six months indicated. Please refer to the Fund prospectus for additional information on operating expenses.
Actual Fund Expenses
The table below provides information about the actual account values and actual expenses in the columns under the heading “Actual.” In these columns the Fund’s actual return, which includes the effect of ongoing Fund expenses but does not include the effect of ongoing Contract expenses, is used to calculate the “Ending Account Value.” You can estimate the Fund-level expenses you paid during the period by following these steps (of course, your account value and expenses will differ from those in this illustration): Divide your account value by $1,000 (if your account had an $8,600 value, then $8,600÷ $1,000 =8.6). Then multiply the result by the number under the headings “Actual” and “Fund-Level Expenses Paid During Period” (if Fund-Level Expenses Paid During Period were $ 7.50, then 8.6 x $ 7.50 = $64.50). In this illustration, the estimated expenses paid this period at the Fund level are $64.50.
Hypothetical Example for Comparison with Other Mutual Funds
Under the heading “Hypothetical” in the table, information is provided about hypothetical account values and hypothetical expenses based on the Fund’s actual expense ratio and an assumed rate of return of 5% per year before expenses, which is not the Fund’s actual return. This information may not be used to estimate the actual ending account balance or expenses you paid for the period, but it can help you compare ongoing costs of investing in the Fund with those of other mutual funds offered through the Contract. To do so, compare this 5% hypothetical example with the 5% hypothetical examples that appear in the shareholder reports of other funds offered through the Contract.
Please note that expenses shown in the table are meant to highlight ongoing costs at the Fund level only and do not reflect any ongoing expenses at the Contract level, or transaction expenses at either the Fund or Contract levels. In addition, while the Fund does not have transaction expenses, if the transaction and ongoing expenses at the Contract level were included, the expenses shown below would be higher. You should consult your Contract prospectus or disclosure document for more information.
| | | | | | | | | | | | |
| | | | | Actual (actual return after expenses) | | Hypothetical (5% annual return before expenses) | | |
| | | | | | | | |
Share Class | | Beginning Account Value 7/1/19 | | Ending
Account
Value 12/31/19 | | Fund-Level
Expenses Paid During Period
7/1/19–12/31/191, 2 | | Ending Account Value 12/31/19 | | Fund-Level
Expenses Paid During Period 7/1/19–12/31/191,2 | | Net
Annualized
Expense
Ratio2 |
| | | | | | |
Class 4 | | $1,000 | | $1,084.70 | | $6.78 | | $1,018.70 | | $6.56 | | 1.29% |
1. Expenses are equal to the annualized expense ratio for thesix-month period as indicated above—in the far right column—multiplied by the simple average account value over the period indicated, and then multiplied by 184/365 to reflect theone-half year period.
2. Reflects expenses after fee waivers and expense reimbursements. Does not include any ongoing expenses of the Contract for which the Fund is an investment option or acquired fund fees and expenses.
FRANKLIN TEMPLETON VARIABLE INSURANCE PRODUCTS TRUST
Financial Highlights
Franklin Mutual Global Discovery VIP Fund
| | | | | | | | | | | | | | | | | | | | |
| | | Year Ended December 31, | |
| | | | | |
| | | 2019 | | | 2018 | | | 2017 | | | 2016 | | | 2015 | |
| | | | | |
| Class 1 | | | | | | | | | | | | | | | | | | | | |
| | | | | |
Per share operating performance (for a share outstanding throughout the year) | | | | | | | | | | | | | | | | | | | | |
| | | | | |
Net asset value, beginning of year | | | $17.47 | | | | $20.38 | | | | $20.22 | | | | $19.85 | | | | $22.61 | |
| | | | | |
Income from investment operationsa: | | | | | | | | | | | | | | | | | | | | |
| | | | | |
Net investment incomeb | | | 0.43 | | | | 0.36 | | | | 0.47 | | | | 0.41 | | | | 0.37 | |
| | | | | |
Net realized and unrealized gains (losses) | | | 3.64 | | | | (2.50 | ) | | | 1.29 | | | | 1.92 | | | | (1.17 | ) |
| | | | | |
Total from investment operations | | | 4.07 | | | | (2.14 | ) | | | 1.76 | | | | 2.33 | | | | (0.80 | ) |
| | | | | |
Less distributions from: | | | | | | | | | | | | | | | | | | | | |
| | | | | |
Net investment income | | | (0.37 | ) | | | (0.52 | ) | | | (0.42 | ) | | | (0.39 | ) | | | (0.69 | ) |
| | | | | |
Net realized gains | | | (2.00 | ) | | | (0.25 | ) | | | (1.18 | ) | | | (1.57 | ) | | | (1.27 | ) |
| | | | | |
Total distributions | | | (2.37 | ) | | | (0.77 | ) | | | (1.60 | ) | | | (1.96 | ) | | | (1.96 | ) |
| | | | | |
Net asset value, end of year | | | $19.17 | | | | $17.47 | | | | $20.38 | | | | $20.22 | | | | $19.85 | |
| | | | | |
Total returnc | | | 24.71% | | | | (11.01)% | | | | 8.99% | | | | 12.32% | | | | (3.39)% | |
| | | | | |
Ratios to average net assets | | | | | | | | | | | | | | | | | | | | |
| | | | | |
Expensesd,e | | | 0.94% | | | | 0.96% | | | | 1.01% | | | | 1.01% | | | | 1.02% | |
| | | | | |
Expenses incurred in connection with securities sold short | | | 0.02% | | | | 0.01% | | | | —% | | | | 0.01% | | | | 0.02% | |
| | | | | |
Net investment income | | | 2.22% | | | | 1.81% | | | | 2.29% | | | | 2.10% | | | | 1.71% | |
| | | | | |
Supplemental data | | | | | | | | | | | | | | | | | | | | |
| | | | | |
Net assets, end of year (000’s) | | | $3,878 | | | | $3,282 | | | | $3,189 | | | | $3,084 | | | | $2,632 | |
| | | | | |
Portfolio turnover rate | | | 21.82% | | | | 29.84% | | | | 17.49% | | | | 17.54% | | | | 21.88% | |
aThe amount shown for a share outstanding throughout the period may not correlate with the Statement of Operations for the period due to the timing of sales and repurchases of the Fund’s shares in relation to income earned and/or fluctuating fair value of the investments of the Fund.
bBased on average daily shares outstanding.
cTotal return does not include fees, charges or expenses imposed by the variable annuity and life insurance contracts for which Franklin Templeton Variable Insurance Products Trust serves as an underlying investment vehicle.
dIncludes dividend and/or interest expense on securities sold short and security borrowing fees, if any. See below for the ratios of such expenses to average net assets for the periods presented. See Note 1(d).
eBenefit of waiver and payments by affiliates and expense reduction rounds to less than 0.01%.
| | | | |
| | | |
MGD-8 | | Annual Report | The accompanying notes are an integral part of these financial statements. | | |
FRANKLIN TEMPLETON VARIABLE INSURANCE PRODUCTS TRUST
FINANCIAL HIGHLIGHTS
Franklin Mutual Global Discovery VIP Fund(continued)
| | | | | | | | | | | | | | | | | | | | |
| | | Year Ended December 31, | |
| | | | | |
| | | 2019 | | | 2018 | | | 2017 | | | 2016 | | | 2015 | |
| | | | | |
| Class 2 | | | | | | | | | | | | | | | | | | | | |
| | | | | |
Per share operating performance (for a share outstanding throughout the year) | | | | | | | | | | | | | | | | | | | | |
| | | | | |
Net asset value, beginning of year | | | $16.96 | | | | $19.80 | | | | $19.69 | | | | $19.37 | | | | $22.11 | |
| | | | | |
Income from investment operationsa: | | | | | | | | | | | | | | | | | | | | |
| | | | | |
Net investment incomeb | | | 0.37 | | | | 0.30 | | | | 0.41 | | | | 0.35 | | | | 0.32 | |
| | | | | |
Net realized and unrealized gains (losses) | | | 3.53 | | | | (2.42 | ) | | | 1.25 | | | | 1.87 | | | | (1.16 | ) |
| | | | | |
Total from investment operations | | | 3.90 | | | | (2.12 | ) | | | 1.66 | | | | 2.22 | | | | (0.84 | ) |
| | | | | |
Less distributions from: | | | | | | | | | | | | | | | | | | | | |
| | | | | |
Net investment income | | | (0.32 | ) | | | (0.47 | ) | | | (0.37 | ) | | | (0.33 | ) | | | (0.63 | ) |
| | | | | |
Net realized gains | | | (2.00 | ) | | | (0.25 | ) | | | (1.18 | ) | | | (1.57 | ) | | | (1.27 | ) |
| | | | | |
Total distributions | | | (2.32 | ) | | | (0.72 | ) | | | (1.55 | ) | | | (1.90 | ) | | | (1.90 | ) |
| | | | | |
Net asset value, end of year | | | $18.54 | | | | $16.96 | | | | $19.80 | | | | $19.69 | | | | $19.37 | |
| | | | | |
Total returnc | | | 24.37% | | | | (11.22)% | | | | 8.71% | | | | 12.06% | | | | (3.65)% | |
| | | | | |
Ratios to average net assets | | | | | | | | | | | | | | | | | | | | |
| | | | | |
Expensesd,e | | | 1.19% | | | | 1.21% | | | | 1.26% | | | | 1.26% | | | | 1.27% | |
| | | | | |
Expenses incurred in connection with securities sold short | | | 0.02% | | | | 0.01% | | | | —% | | | | 0.01% | | | | 0.02% | |
| | | | | |
Net investment income | | | 1.97% | | | | 1.56% | | | | 2.04% | | | | 1.85% | | | | 1.46% | |
| | | | | |
Supplemental data | | | | | | | | | | | | | | | | | | | | |
| | | | | |
Net assets, end of year (000’s) | | | $539,759 | | | | $500,607 | | | | $631,179 | | | | $630,397 | | | | $629,366 | |
| | | | | |
Portfolio turnover rate | | | 21.82% | | | | 29.84% | | | | 17.49% | | | | 17.54% | | | | 21.88% | |
aThe amount shown for a share outstanding throughout the period may not correlate with the Statement of Operations for the period due to the timing of sales and repurchases of the Fund’s shares in relation to income earned and/or fluctuating fair value of the investments of the Fund.
bBased on average daily shares outstanding.
cTotal return does not include fees, charges or expenses imposed by the variable annuity and life insurance contracts for which Franklin Templeton Variable Insurance Products Trust serves as an underlying investment vehicle.
dIncludes dividend and/or interest expense on securities sold short and security borrowing fees, if any. See below for the ratios of such expenses to average net assets for the periods presented. See Note 1(d).
eBenefit of waiver and payments by affiliates and expense reduction rounds to less than 0.01%.
| | | | |
| | | |
| | The accompanying notes are an integral part of these financial statements. | Annual Report | | MGD-9 |
FRANKLIN TEMPLETON VARIABLE INSURANCE PRODUCTS TRUST
FINANCIAL HIGHLIGHTS
Franklin Mutual Global Discovery VIP Fund(continued)
| | | | | | | | | | | | | | | | | | | | |
| | | Year Ended December 31, | |
| | | | | |
| | | 2019 | | | 2018 | | | 2017 | | | 2016 | | | 2015 | |
| | | | | |
Class 4 | | | | | | | | | | | | | | | | | | | | |
| | | | | |
Per share operating performance (for a share outstanding throughout the year) | | | | | | | | | | | | | | | | | | | | |
| | | | | |
Net asset value, beginning of year | | | $17.30 | | | | $20.17 | | | | $20.02 | | | | $19.66 | | | | $22.39 | |
| | | | | |
Income from investment operationsa: | | | | | | | | | | | | | | | | | | | | |
| | | | | |
Net investment incomeb | | | 0.36 | | | | 0.29 | | | | 0.40 | | | | 0.34 | | | | 0.30 | |
| | | | | |
Net realized and unrealized gains (losses) | | | 3.61 | | | | (2.47 | ) | | | 1.27 | | | | 1.89 | | | | (1.17 | ) |
| | | | | |
Total from investment operations | | | 3.97 | | | | (2.18 | ) | | | 1.67 | | | | 2.23 | | | | (0.87 | ) |
| | | | | |
Less distributions from: | | | | | | | | | | | | | | | | | | | | |
| | | | | |
Net investment income | | | (0.29 | ) | | | (0.44 | ) | | | (0.34 | ) | | | (0.30 | ) | | | (0.59 | ) |
| | | | | |
Net realized gains | | | (2.00 | ) | | | (0.25 | ) | | | (1.18 | ) | | | (1.57 | ) | | | (1.27 | ) |
| | | | | |
Total distributions | | | (2.29 | ) | | | (0.69 | ) | | | (1.52 | ) | | | (1.87 | ) | | | (1.86 | ) |
| | | | | |
Net asset value, end of year | | | $18.98 | | | | $17.30 | | | | $20.17 | | | | $20.02 | | | | $19.66 | |
| | | | | |
Total returnc | | | 24.28% | | | | (11.31)% | | | | 8.61% | | | | 11.91% | | | | (3.74)% | |
| | | | | |
Ratios to average net assets | | | | | | | | | | | | | | | | | | | | |
| | | | | |
Expensesd,e | | | 1.29% | | | | 1.31% | | | | 1.36% | | | | 1.36% | | | | 1.37% | |
| | | | | |
Expenses incurred in connection with securities sold short | | | 0.02% | | | | 0.01% | | | | —% | | | | 0.01% | | | | 0.02% | |
| | | | | |
Net investment income | | | 1.87% | | | | 1.46% | | | | 1.94% | | | | 1.75% | | | | 1.36% | |
| | | | | |
Supplemental data | | | | | | | | | | | | | | | | | | | | |
| | | | | |
Net assets, end of year (000’s) | | | $30,865 | | | | $30,094 | | | | $41,713 | | | | $45,262 | | | | $49,054 | |
| | | | | |
Portfolio turnover rate | | | 21.82% | | | | 29.84% | | | | 17.49% | | | | 17.54% | | | | 21.88% | |
aThe amount shown for a share outstanding throughout the period may not correlate with the Statement of Operations for the period due to the timing of sales and repurchases of the Fund’s shares in relation to income earned and/or fluctuating fair value of the investments of the Fund.
bBased on average daily shares outstanding.
cTotal return does not include fees, charges or expenses imposed by the variable annuity and life insurance contracts for which Franklin Templeton Variable Insurance Products Trust serves as an underlying investment vehicle.
dIncludes dividend and/or interest expense on securities sold short and security borrowing fees, if any. See below for the ratios of such expenses to average net assets for the periods presented. See Note 1(d).
eBenefit of waiver and payments by affiliates and expense reduction rounds to less than 0.01%.
| | | | |
| | | |
MGD-10 | | Annual Report | The accompanying notes are an integral part of these financial statements. | | |
FRANKLIN TEMPLETON VARIABLE INSURANCE PRODUCTS TRUST
Statement of Investments, December 31, 2019
Franklin Mutual Global Discovery VIP Fund
| | | | | | | | | | | | |
| | | Country | | | Shares/ Rights/ Units/ Warrants | | | Value | |
| | | |
Common Stocks and Other Equity Interests 93.6% | | | | | | | | | | | | |
Aerospace & Defense 1.1% | | | | | | | | | | | | |
BAE Systems PLC | | | United Kingdom | | | | 847,691 | | | $ | 6,341,147 | |
| | | | | | | | | | | | |
| | | |
Auto Components 0.0%† | | | | | | | | | | | | |
a,b,cInternational Automotive Components Group Brazil LLC | | | Brazil | | | | 424,073 | | | | 15,394 | |
| | | | | | | | | | | | |
| | | |
Automobiles 1.3% | | | | | | | | | | | | |
General Motors Co. | | | United States | | | | 198,100 | | | | 7,250,460 | |
| | | | | | | | | | | | |
| | | |
Banks 11.7% | | | | | | | | | | | | |
CIT Group Inc. | | | United States | | | | 95,582 | | | | 4,361,407 | |
Citigroup Inc. | | | United States | | | | 152,950 | | | | 12,219,176 | |
Citizens Financial Group Inc. | | | United States | | | | 259,123 | | | | 10,522,985 | |
First Horizon National Corp. | | | United States | | | | 353,473 | | | | 5,853,513 | |
ING Groep NV | | | Netherlands | | | | 489,415 | | | | 5,866,156 | |
JPMorgan Chase & Co. | | | United States | | | | 64,286 | | | | 8,961,468 | |
Standard Chartered PLC | | | United Kingdom | | | | 892,332 | | | | 8,419,493 | |
Wells Fargo & Co. | | | United States | | | | 209,020 | | | | 11,245,276 | |
| | | | | | | | | | | | |
| | | |
| | | | | | | | | | | 67,449,474 | |
| | | | | | | | | | | | |
| | | |
Building Products 1.5% | | | | | | | | | | | | |
Johnson Controls International PLC | | | United States | | | | 206,500 | | | | 8,406,615 | |
| | | | | | | | | | | | |
| | | |
Capital Markets 1.8% | | | | | | | | | | | | |
Credit Suisse Group AG | | | Switzerland | | | | 499,643 | | | | 6,766,725 | |
Deutsche Bank AG | | | Germany | | | | 207,029 | | | | 1,605,938 | |
Guotai Junan Securities Co. Ltd. | | | China | | | | 1,275,797 | | | | 2,259,410 | |
| | | | | | | | | | | | |
| | | |
| | | | | | | | | | | 10,632,073 | |
| | | | | | | | | | | | |
| | | |
Chemicals 1.5% | | | | | | | | | | | | |
BASF SE | | | Germany | | | | 113,111 | | | | 8,543,235 | |
| | | | | | | | | | | | |
| | | |
Communications Equipment 0.9% | | | | | | | | | | | | |
Cisco Systems Inc. | | | United States | | | | 110,580 | | | | 5,303,417 | |
| | | | | | | | | | | | |
| | | |
Construction Materials 1.3% | | | | | | | | | | | | |
LafargeHolcim Ltd., B | | | Switzerland | | | | 133,134 | | | | 7,388,308 | |
| | | | | | | | | | | | |
| | | |
Consumer Finance 1.4% | | | | | | | | | | | | |
Capital One Financial Corp. | | | United States | | | | 76,488 | | | | 7,871,380 | |
| | | | | | | | | | | | |
| | | |
Containers & Packaging 1.1% | | | | | | | | | | | | |
International Paper Co. | | | United States | | | | 134,900 | | | | 6,212,145 | |
| | | | | | | | | | | | |
| | | |
Diversified Financial Services 1.9% | | | | | | | | | | | | |
aM&G PLC | | | United Kingdom | | | | 998,386 | | | | 3,136,525 | |
Voya Financial Inc. | | | United States | | | | 129,550 | | | | 7,899,959 | |
| | | | | | | | | | | | |
| | | |
| | | | | | | | | | | 11,036,484 | |
| | | | | | | | | | | | |
| | | |
Diversified Telecommunication Services 0.6% | | | | | | | | | | | | |
Koninklijke KPN NV | | | Netherlands | | | | 1,251,951 | | | | 3,693,925 | |
| | | | | | | | | | | | |
| | | |
Electric Utilities 1.5% | | | | | | | | | | | | |
Enel SpA | | | Italy | | | | 1,094,464 | | | | 8,680,078 | |
| | | | | | | | | | | | |
FRANKLIN TEMPLETON VARIABLE INSURANCE PRODUCTS TRUST
STATEMENT OF INVESTMENTS
Franklin Mutual Global Discovery VIP Fund(continued)
| | | | | | | | | | | | |
| | | Country | | | Shares/ Rights/ Units/ Warrants | | | Value | |
| | | |
Common Stocks and Other Equity Interests(continued) | | | | | | | | | | | | |
Energy Equipment & Services 1.2% | | | | | | | | | | | | |
Schlumberger Ltd. | | | United States | | | | 173,200 | | | $ | 6,962,640 | |
| | | | | | | | | | | | |
| | | |
Entertainment 2.6% | | | | | | | | | | | | |
The Walt Disney Co. | | | United States | | | | 102,991 | | | | 14,895,588 | |
| | | | | | | | | | | | |
| | | |
Food & Staples Retailing 1.1% | | | | | | | | | | | | |
Walgreens Boots Alliance Inc. | | | United States | | | | 102,904 | | | | 6,067,220 | |
| | | | | | | | | | | | |
| | | |
Food Products 1.5% | | | | | | | | | | | | |
The Kraft Heinz Co. | | | United States | | | | 274,500 | | | | 8,819,685 | |
| | | | | | | | | | | | |
| | | |
Health Care Equipment & Supplies 2.9% | | | | | | | | | | | | |
Medtronic PLC | | | United States | | | | 146,210 | | | | 16,587,524 | |
| | | | | | | | | | | | |
| | | |
Health Care Providers & Services 1.9% | | | | | | | | | | | | |
CVS Health Corp. | | | United States | | | | 148,791 | | | | 11,053,683 | |
| | | | | | | | | | | | |
| | | |
Hotels, Restaurants & Leisure 2.4% | | | | | | | | | | | | |
Accor SA | | | France | | | | 186,049 | | | | 8,710,914 | |
Sands China Ltd. | | | Macau | | | | 916,400 | | | | 4,898,177 | |
| | | | | | | | | | | | |
| | | |
| | | | | | | | | | | 13,609,091 | |
| | | | | | | | | | | | |
Independent Power & Renewable Electricity Producers 0.1% | | | | | | | | | | | | |
Vistra Energy Corp. | | | United States | | | | 27,527 | | | | 632,846 | |
| | | | | | | | | | | | |
| | | |
Industrial Conglomerates 1.2% | | | | | | | | | | | | |
General Electric Co. | | | United States | | | | 624,350 | | | | 6,967,746 | |
| | | | | | | | | | | | |
| | | |
Insurance 9.1% | | | | | | | | | | | | |
aAlleghany Corp. | | | United States | | | | 2,730 | | | | 2,182,826 | |
American International Group Inc. | | | United States | | | | 177,333 | | | | 9,102,503 | |
China Pacific Insurance Group Co. Ltd., H | | | China | | | | 1,523,508 | | | | 6,002,297 | |
Chubb Ltd. | | | United States | | | | 38,866 | | | | 6,049,882 | |
Everest Re Group Ltd. | | | United States | | | | 10,778 | | | | 2,983,781 | |
The Hartford Financial Services Group Inc. | | | United States | | | | 192,796 | | | | 11,716,213 | |
NN Group NV | | | Netherlands | | | | 280,241 | | | | 10,628,823 | |
RSA Insurance Group PLC | | | United Kingdom | | | | 501,149 | | | | 3,754,152 | |
| | | | | | | | | | | | |
| | | |
| | | | | | | | | | | 52,420,477 | |
| | | | | | | | | | | | |
| | | |
IT Services 1.4% | | | | | | | | | | | | |
Cognizant Technology Solutions Corp., A | | | United States | | | | 126,860 | | | | 7,867,857 | |
| | | | | | | | | | | | |
| | | |
Machinery 0.7% | | | | | | | | | | | | |
CNH Industrial NV | | | United Kingdom | | | | 361,439 | | | | 3,968,237 | |
| | | | | | | | | | | | |
| | | |
Media 2.8% | | | | | | | | | | | | |
aCharter Communications Inc., A | | | United States | | | | 19,886 | | | | 9,646,301 | |
aDISH Network Corp., A | | | United States | | | | 139,003 | | | | 4,930,437 | |
aiHeartMedia Inc., A | | | United States | | | | 95,199 | | | | 1,608,863 | |
a,biHeartMedia Inc., B | | | United States | | | | 1,606 | | | | 23,070 | |
| | | | | | | | | | | | |
| | | |
| | | | | | | | | | | 16,208,671 | |
| | | | | | | | | | | | |
FRANKLIN TEMPLETON VARIABLE INSURANCE PRODUCTS TRUST
STATEMENT OF INVESTMENTS
Franklin Mutual Global Discovery VIP Fund(continued)
| | | | | | | | | | | | |
| | | Country | | | Shares/ Rights/ Units/ Warrants | | | Value | |
Common Stocks and Other Equity Interests(continued) | | | | | | | | | | | | |
Oil, Gas & Consumable Fuels 11.2% | | | | | | | | | | | | |
BP PLC | | | United Kingdom | | | | 1,710,858 | | | $ | 10,686,201 | |
Caltex Australia Ltd. | | | Australia | | | | 137,968 | | | | 3,286,538 | |
Canadian Natural Resources Ltd. | | | Canada | | | | 308,400 | | | | 9,974,434 | |
Crescent Point Energy Corp. | | | Canada | | | | 670,900 | | | | 2,991,307 | |
JXTG Holdings Inc. | | | Japan | | | | 897,639 | | | | 4,112,578 | |
Kinder Morgan Inc. | | | United States | | | | 640,670 | | | | 13,562,984 | |
Plains All American Pipeline LP | | | United States | | | | 195,500 | | | | 3,595,245 | |
Royal Dutch Shell PLC, A (EUR Traded) | | | United Kingdom | | | | 94,818 | | | | 2,782,220 | |
Royal Dutch Shell PLC, A (GBP Traded) | | | United Kingdom | | | | 226,238 | | | | 6,696,974 | |
The Williams Cos. Inc. | | | United States | | | | 269,101 | | | | 6,383,076 | |
| | | | | | | | | | | | |
| | | |
| | | | | | | | | | | 64,071,557 | |
| | | | | | | | | | | | |
| | | |
Pharmaceuticals 10.2% | | | | | | | | | | | | |
Allergan PLC | | | United States | | | | 27,100 | | | | 5,180,707 | |
aBristol-Myers Squibb Co., rts., 2/01/49 | | | United States | | | | 83,100 | | | | 250,131 | |
Eli Lilly & Co. | | | United States | | | | 80,284 | | | | 10,551,726 | |
GlaxoSmithKline PLC | | | United Kingdom | | | | 807,616 | | | | 19,029,020 | |
Merck & Co. Inc. | | | United States | | | | 75,545 | | | | 6,870,818 | |
Novartis AG, ADR | | | Switzerland | | | | 176,997 | | | | 16,759,846 | |
| | | | | | | | | | | | |
| | | |
| | | | | | | | | | | 58,642,248 | |
| | | | | | | | | | | | |
| | | |
Semiconductors & Semiconductor Equipment 1.0% | | | | | | | | | | | | |
aRenesas Electronics Corp. | | | Japan | | | | 791,797 | | | | 5,464,438 | |
| | | | | | | | | | | | |
| | | |
Software 4.3% | | | | | | | | | | | | |
aAvaya Holdings Corp. | | | United States | | | | 4 | | | | 54 | |
aAvaya Holdings Corp., wts., 12/15/22 | | | United States | | | | 5,179 | | | | 6,215 | |
aCheck Point Software Technologies Ltd. | | | Israel | | | | 90,067 | | | | 9,993,834 | |
NortonLifeLock Inc. | | | United States | | | | 357,461 | | | | 9,122,405 | |
Oracle Corp. | | | United States | | | | 110,700 | | | | 5,864,886 | |
| | | | | | | | | | | | |
| | | |
| | | | | | | | | | | 24,987,394 | |
| | | | | | | | | | | | |
| | | |
Specialty Retail 0.8% | | | | | | | | | | | | |
Dufry AG | | | Switzerland | | | | 44,773 | | | | 4,442,829 | |
| | | | | | | | | | | | |
| | | |
Technology Hardware, Storage & Peripherals 5.0% | | | | | | | | | | | | |
Hewlett Packard Enterprise Co. | | | United States | | | | 376,580 | | | | 5,972,559 | |
Samsung Electronics Co. Ltd. | | | South Korea | | | | 297,113 | | | | 14,341,738 | |
Western Digital Corp. | | | United States | | | | 132,012 | | | | 8,378,801 | |
| | | | | | | | | | | | |
| | | |
| | | | | | | | | | | 28,693,098 | |
| | | | | | | | | | | | |
| | | |
Textiles, Apparel & Luxury Goods 0.7% | | | | | | | | | | | | |
Cie Financiere Richemont SA | | | Switzerland | | | | 50,194 | | | | 3,945,389 | |
| | | | | | | | | | | | |
| | | |
Tobacco 3.2% | | | | | | | | | | | | |
Altria Group Inc. | | | United States | | | | 107,584 | | | | 5,369,517 | |
British American Tobacco PLC | | | United Kingdom | | | | 224,633 | | | | 9,614,203 | |
British American Tobacco PLC, ADR | | | United Kingdom | | | | 83,985 | | | | 3,566,003 | |
| | | | | | | | | | | | |
| | | |
| | | | | | | | | | | 18,549,723 | |
| | | | | | | | | | | | |
FRANKLIN TEMPLETON VARIABLE INSURANCE PRODUCTS TRUST
STATEMENT OF INVESTMENTS
Franklin Mutual Global Discovery VIP Fund(continued)
| | | | | | | | | | | | |
| | | Country | | | Shares/
Rights/
Units/
Warrants | | | Value | |
| | | |
Common Stocks and Other Equity Interests(continued) | | | | | | | | | | | | |
Wireless Telecommunication Services 0.7% | | | | | | | | | | | | |
Vodafone Group PLC | | | United Kingdom | | | | 1,960,056 | | | $ | 3,809,884 | |
| | | | | | | | | | | | |
| | | |
Total Common Stocks and Other Equity Interests
(Cost $424,606,367) | | | | | | | | | | | 537,491,960 | |
| | | | | | | | | | | | |
| | | |
Preferred Stocks (Cost $12,962,908) 2.5% | | | | | | | | | | | | |
Automobiles 2.5% | | | | | | | | | | | | |
dVolkswagen AG, 2.758%, pfd. | | | Germany | | | | 72,588 | | | | 14,346,608 | |
| | | | | | | | | | | | |
| | | | | | | | | | | | |
| | | |
| | | | | | Principal
Amount | | | | |
Corporate Notes 0.6% | | | | | | | | | | | | |
Frontier Communications Corp., | | | | | | | | | | | | |
senior note, 10.50%, 9/15/22 | | | United States | | | $ | 3,610,000 | | | | 1,770,026 | |
senior note, 11.00%, 9/15/25 | | | United States | | | | 4,065,000 | | | | 1,981,688 | |
| | | | | | | | | | | | |
| | | |
Total Corporate Notes (Cost $7,129,469) | | | | | | | | | | | 3,751,714 | |
| | | | | | | | | | | | |
| | | |
| | | | | | Shares | | | | |
Companies in Liquidation 0.0%† | | | | | | | | | | | | |
a,b,eiHeartCommunications Inc., Contingent Distribution | | | United States | | | | 9,103,035 | | | | — | |
a,b,eTribune Media, Litigation Trust, Contingent Distribution | | | United States | | | | 57,197 | | | | — | |
a,b,eVistra Energy Corp., Litigation Trust, Contingent Distribution | | | United States | | | | 5,912,264 | | | | 3,251 | |
a,b,eWalter Energy Inc., Litigation Trust, Contingent Distribution | | | United States | | | | 966,000 | | | | — | |
| | | | | | | | | | | | |
| | | |
Total Companies in Liquidation (Cost $185,800) | | | | | | | | | | | 3,251 | |
| | | | | | | | | | | | |
| | | |
Total Investments before Short Term Investments
(Cost $444,884,544) | | | | | | | | | | | 555,593,533 | |
| | | | | | | | | | | | |
FRANKLIN TEMPLETON VARIABLE INSURANCE PRODUCTS TRUST
STATEMENT OF INVESTMENTS
Franklin Mutual Global Discovery VIP Fund(continued)
| | | | | | | | | | | | |
| | | Country | | | Principal
Amount | | | Value | |
| | | |
Short Term Investments 3.2% | | | | | | | | | | | | |
| | | |
U.S. Government and Agency Securities 3.2% | | | | | | | | | | | | |
fFHLB, 1/02/20 | | | United States | | | $ | 2,000,000 | | | $ | 2,000,000 | |
fU.S. Treasury Bill, | | | | | | | | | | | | |
1/02/20 - 5/21/20 | | | United States | | | | 13,000,000 | | | | 12,974,591 | |
g3/05/20 - 5/28/20 | | | United States | | | | 3,500,000 | | | | 3,486,393 | |
| | | | | | | | | | | | |
| | | |
Total U.S. Government and Agency Securities
(Cost $18,454,593) | | | | | | | | | | | 18,460,984 | |
| | | | | | | | | | | | |
| | | |
Total Investments (Cost $463,339,137) 99.9% | | | | | | | | | | | 574,054,517 | |
| | | |
Securities Sold Short (0.4)% | | | | | | | | | | | (2,077,945 | ) |
| | | |
Other Assets, less Liabilities 0.5% | | | | | | | | | | | 2,526,223 | |
| | | | | | | | | | | | |
| | | |
Net Assets 100.0% | | | | | | | | | | $ | 574,502,795 | |
| | | | | | | | | | | | |
| | | |
| | | | | | Shares | | | | |
| | | |
hSecurities Sold Short (Proceeds $1,702,994) (0.4)% | | | | | | | | | | | | |
Common Stocks (0.4)% | | | | | | | | | | | | |
Biotechnology (0.4)% | | | | | | | | | | | | |
AbbVie Inc. | | | United States | | | | 23,469 | | | | (2,077,945 | ) |
| | | | | | | | | | | | |
†Rounds to less than 0.1% of net assets.
aNon-income producing.
bFair valued using significant unobservable inputs. See Note 12 regarding fair value measurements.
cSee Note 9 regarding restricted securities.
dVariable rate security. The rate shown represents the yield at period end.
eContingent distributions represent the right to receive additional distributions, if any, during the reorganization of the underlying company. Shares represent total underlying principal of debt securities.
fThe security was issued on a discount basis with no stated coupon rate.
gA portion or all of the security has been segregated as collateral for securities sold short and open forward exchange contracts. At December 31, 2019, the aggregate value of these securities pledged amounted to $1,893,070, representing 0.3% of net assets.
hSee Note 1(d) regarding securities sold short.
At December 31, 2019, the Fund had the following futures contracts outstanding. See Note 1(c).
Futures Contracts
| | | | | | | | | | | | | | | | | | | | | | | | |
| Description | | | Type | | |
| Number of
Contracts |
| |
| Notional
Amount |
* | |
| Expiration
Date |
| |
| Value/
Unrealized Appreciation (Depreciation) |
|
| | | | | | |
Currency Contracts | | | | | | | | | | | | | | | | | | | | | | | | |
EUR/USD | | | Short | | | | 181 | | | $ | 25,525,525 | | | | 3/16/20 | | | | | | | $ | (245,242 | ) |
GBP/USD | | | Short | | | | 139 | | | | 11,547,425 | | | | 3/16/20 | | | | | | | | (89,209 | ) |
| | | | | | | | | | | | | | | | | | | | | | | | |
| | | | | | |
Total Futures Contracts | | | | | | | | | | | | | | | | | | | | | | $ | (334,451 | ) |
| | | | | | | | | | | | | | | | | | | | | | | | |
*As of period end.
FRANKLIN TEMPLETON VARIABLE INSURANCE PRODUCTS TRUST
STATEMENT OF INVESTMENTS
Franklin Mutual Global Discovery VIP Fund(continued)
At December 31, 2019, the Fund had the following forward exchange contracts outstanding. See Note 1(c).
Forward Exchange Contracts
| | | | | | | | | | | | | | | | | | | | | | | | | | | | |
| Currency | | Counterpartya | | | Type | | | Quantity | | | Contract
Amount | | | Settlement
Date | | | Unrealized
Appreciation | | | Unrealized
Depreciation | |
| | | | | | |
OTC Forward Exchange Contracts | | | | | | | | | | | | | | | | | | | | | | | | | |
| | | | | | | |
Swiss Franc | | | HSBK | | | | Sell | | | | 39,201 | | | $ | 39,779 | | | | 1/13/20 | | | | $ — | | | $ | (771 | ) |
Swiss Franc | | | UBSW | | | | Sell | | | | 6,436,481 | | | | 6,509,922 | | | | 1/13/20 | | | | — | | | | (148,038 | ) |
Euro | | | BOFA | | | | Sell | | | | 41,939,500 | | | | 46,650,801 | | | | 1/15/20 | | | | — | | | | (427,524 | ) |
Euro | | | SSBT | | | | Sell | | | | 437,264 | | | | 488,143 | | | | 1/15/20 | | | | — | | | | (2,699 | ) |
Euro | | | UBSW | | | | Sell | | | | 141,904 | | | | 158,957 | | | | 1/15/20 | | | | — | | | | (335 | ) |
British Pound | | | BOFA | | | | Sell | | | | 166,758 | | | | 223,234 | | | | 1/16/20 | | | | 2,267 | | | | — | |
British Pound | | | BOFA | | | | Sell | | | | 1,207,372 | | | | 1,576,422 | | | | 1/16/20 | | | | — | | | | (23,443 | ) |
British Pound | | | HSBK | | | | Sell | | | | 97,014 | | | | 129,849 | | | | 1/16/20 | | | | 1,298 | | | | — | |
British Pound | | | HSBK | | | | Sell | | | | 12,594,167 | | | | 16,294,993 | | | | 1/16/20 | | | | — | | | | (393,283 | ) |
British Pound | | | UBSW | | | | Sell | | | | 166,758 | | | | 223,375 | | | | 1/16/20 | | | | 2,408 | | | | — | |
South Korean Won | | | HSBK | | | | Sell | | | | 16,153,194,107 | | | | 13,656,198 | | | | 1/17/20 | | | | — | | | | (322,001 | ) |
South Korean Won | | | UBSW | | | | Sell | | | | 356,186,851 | | | | 300,757 | | | | 1/17/20 | | | | — | | | | (7,470 | ) |
Australian Dollar | | | HSBK | | | | Sell | | | | 353,607 | | | | 243,600 | | | | 2/14/20 | | | | — | | | | (4,786 | ) |
Australian Dollar | | | UBSW | | | | Sell | | | | 4,270,804 | | | | 2,950,001 | | | | 2/14/20 | | | | — | | | | (49,981 | ) |
| | | | | | | | | | | | | | | | | | | | | | | | |
| | | | | | |
Total Forward Exchange Contracts | | | | | | | | | | | | | | | | | | | | $ 5,973 | | | $ | (1,380,331 | ) |
| | | | | | | | | | | | | | | | | | | | | | | | |
| | | | | |
Net unrealized appreciation (depreciation) | | | | | | | | | | | | | | | | | | | $ | (1,374,358 | ) |
| | | | | | | | | | | | | | | | | | | | | | | | | | | | |
aMay be comprised of multiple contracts with the same counterparty, currency and settlement date.
See Note 10 regarding other derivative information.
See Abbreviations on pageMGD-30.
| | | | |
| | | |
MGD-16 | | Annual Report | The accompanying notes are an integral part of these financial statements. | | |
FRANKLIN TEMPLETON VARIABLE INSURANCE PRODUCTS TRUST
FINANCIAL STATEMENTS
Statement of Assets and Liabilities
December 31, 2019
| | | | | | | | |
| | | Franklin Mutual Global Discovery VIP Fund | |
Assets: | | | | | | | | |
Investments in securities: | | | | | | | | |
Cost - Unaffiliated issuers | | | | | | $ | 463,339,137 | |
Value - Unaffiliated issuers | | | | | | $ | 574,054,517 | |
Cash | | | | | | | 82,689 | |
Receivables: | | | | | | | | |
Investment securities sold | | | | | | | 741,428 | |
Capital shares sold | | | | | | | 20,862 | |
Dividends and interest | | | | | | | 1,982,038 | |
European Union tax reclaims | | | | | | | 319,576 | |
Deposits with brokers for: | | | | | | | | |
Securities sold short | | | | | | | 2,119,026 | |
Futures contracts | | | | | | | 693,960 | |
Unrealized appreciation on OTC forward exchange contracts | | | | | | | 5,973 | |
Other assets | | | | | | | 70 | |
| | |
Total assets | | | | | | | 580,020,139 | |
Liabilities: | | | | | | | | |
Payables: | | | | | | | | |
Investment securities purchased | | | | | | | 795,081 | |
Capital shares redeemed | | | | | | | 295,413 | |
Management fees | | | | | | | 423,174 | |
Distribution fees | | | | | | | 122,611 | |
Variation margin on futures contracts | | | | | | | 187,138 | |
Securities sold short, at value (proceeds $1,702,994) | | | | | | | 2,077,945 | |
Unrealized depreciation on OTC forward exchange contracts | | | | | | | 1,380,331 | |
Accrued expenses and other liabilities | | | | | | | 235,651 | |
| | |
Total liabilities | | | | | | | 5,517,344 | |
| | |
Net assets, at value | | | | | | $ | 574,502,795 | |
Net assets consist of: | | | | | | | | |
Paid-in capital | | | | | | $ | 446,095,828 | |
Total distributable earnings (losses) | | | | | | | 128,406,967 | |
| | |
Net assets, at value | | | | | | $ | 574,502,795 | |
Class 1: | | | | | | | | |
Net assets, at value | | | | | | $ | 3,878,175 | |
Shares outstanding | | | | | | | 202,352 | |
Net asset value and maximum offering price per share | | | | | | | $19.17 | |
Class 2: | | | | | | | | |
Net assets, at value | | | | | | $ | 539,759,410 | |
Shares outstanding | | | | | | | 29,114,287 | |
Net asset value and maximum offering price per share | | | | | | | $18.54 | |
Class 4: | | | | | | | | |
Net assets, at value | | | | | | $ | 30,865,210 | |
Shares outstanding | | | | | | | 1,626,608 | |
Net asset value and maximum offering price per share | | | | | | | $18.98 | |
| | | | |
| | | |
| | The accompanying notes are an integral part of these financial statements. | Annual Report | | MGD-17 |
FRANKLIN TEMPLETON VARIABLE INSURANCE PRODUCTS TRUST
FINANCIAL STATEMENTS
Statement of Operations
for the year ended December 31, 2019
| | | | |
| | | Franklin Mutual Global Discovery VIP Fund | |
| |
Investment income: | | | | |
Dividends: (net of foreign taxes)* | | | | |
Unaffiliated issuers | | $ | 15,939,529 | |
Interest: | | | | |
Unaffiliated issuers | | | 1,732,097 | |
Income from securities loaned: | | | | |
Unaffiliated issuers (net of fees and rebates) | | | 123,051 | |
Non-controlled affiliates (Note 3e) | | | 23,202 | |
| | | | |
| |
Total investment income | | | 17,817,879 | |
| | | | |
Expenses: | | | | |
Management fees (Note 3a) | | | 4,934,366 | |
Distribution fees: (Note 3c) | | | | |
Class 2 | | | 1,322,538 | |
Class 4 | | | 108,329 | |
Custodian fees (Note 4) | | | 33,116 | |
Reports to shareholders | | | 115,303 | |
Professional fees | | | 57,437 | |
Trustees’ fees and expenses | | | 3,385 | |
Dividends on securities sold short | | | 97,358 | |
Other | | | 43,659 | |
| | | | |
Total expenses | | | 6,715,491 | |
Expense reductions (Note 4) | | | (4,004 | ) |
Expenses waived/paid by affiliates (Note 3e) | | | (4,124 | ) |
| | | | |
| |
Net expenses | | | 6,707,363 | |
| | | | |
| |
Net investment income | | | 11,110,516 | |
| | | | |
Realized and unrealized gains (losses): | | | | |
Net realized gain (loss) from: | | | | |
Investments: | | | | |
Unaffiliated issuers | | | 6,602,456 | |
Foreign currency transactions | | | 32,221 | |
Forward exchange contracts | | | 2,765,809 | |
Futures contracts | | | 1,382,877 | |
Securities sold short | | | (582,788 | ) |
| | | | |
| |
Net realized gain (loss) | | | 10,200,575 | |
| | | | |
Net change in unrealized appreciation (depreciation) on: | | | | |
Investments: | | | | |
Unaffiliated issuers | | | 102,910,728 | |
Translation of other assets and liabilities denominated in foreign currencies | | | 1,579 | |
Forward exchange contracts | | | (197,547 | ) |
Futures contracts | | | (361,482 | ) |
Securities sold short | | | (1,454,026 | ) |
Net change in unrealized appreciation (depreciation) | | | 100,899,252 | |
| | | | |
| |
Net realized and unrealized gain (loss) | | | 111,099,827 | |
| | | | |
| |
Net increase (decrease) in net assets resulting from operations | | $ | 122,210,343 | |
| | | | |
| |
*Foreign taxes withheld on dividends | | $ | 800,948 | |
| | | | |
| | | |
MGD-18 | | Annual Report | The accompanying notes are an integral part of these financial statements. | | |
FRANKLIN TEMPLETON VARIABLE INSURANCE PRODUCTS TRUST
FINANCIAL STATEMENTS
Statements of Changes in Net Assets
| | | | | | | | |
| | | Franklin Mutual Global Discovery VIP Fund | |
| |
| | | Year Ended December 31, | |
| | |
| | | 2019 | | | 2018 | |
| | |
Increase (decrease) in net assets: | | | | | | | | |
Operations: | | | | | | | | |
Net investment income | | | $ 11,110,516 | | | | $ 9,851,636 | |
Net realized gain (loss) | | | 10,200,575 | | | | 54,878,424 | |
Net change in unrealized appreciation (depreciation) | | | 100,899,252 | | | | (132,139,062 | ) |
| | | | |
| | |
Net increase (decrease) in net assets resulting from operations | | | 122,210,343 | | | | (67,409,002 | ) |
| | | | |
Distributions to shareholders: | | | | | | | | |
Class 1 | | | (427,555 | ) | | | (139,418 | ) |
Class 2 | | | (61,286,007 | ) | | | (21,021,401 | ) |
Class 4 | | | (3,431,154 | ) | | | (1,188,087 | ) |
| | | | |
| | |
Total distributions to shareholders | | | (65,144,716 | ) | | | (22,348,906 | ) |
| | | | |
Capital share transactions: (Note 2) | | | | | | | | |
Class 1 | | | 231,219 | | | | 642,511 | |
Class 2 | | | (14,266,368 | ) | | | (46,304,313 | ) |
Class 4 | | | (2,510,695 | ) | | | (6,678,610 | ) |
| | | | |
| | |
Total capital share transactions | | | (16,545,844 | ) | | | (52,340,412 | ) |
| | | | |
Net increase (decrease) in net assets | | | 40,519,783 | | | | (142,098,320 | ) |
Net assets: | | | | | | | | |
Beginning of year | | | 533,983,012 | | | | 676,081,332 | |
| | | | |
| | |
End of year | | | $574,502,795 | | | | $533,983,012 | |
| | | | |
| | | | |
| | | |
| | The accompanying notes are an integral part of these financial statements. | Annual Report | | MGD-19 |
FRANKLIN TEMPLETON VARIABLE INSURANCE PRODUCTS TRUST
Notes to Financial Statements
Franklin Mutual Global Discovery VIP Fund
1. Organization and Significant Accounting Policies
Franklin Templeton Variable Insurance Products Trust (Trust) is registered under the Investment Company Act of 1940 (1940 Act) as anopen-end management investment company, consisting of eighteen separate funds and applies the specialized accounting and reporting guidance in U.S. Generally Accepted Accounting Principles (U.S. GAAP). Franklin Mutual Global Discovery VIP Fund (Fund) is included in this report. Shares of the Fund are generally sold only to insurance company separate accounts to fund the benefits of variable life insurance policies or variable annuity contracts. At December 31, 2019, 44.3% of the Fund’s shares were held through one insurance company. Investment activities of these insurance company separate accounts could have a material impact on the Fund. The Fund offers three classes of shares: Class 1, Class 2, and Class 4. Each class of shares may differ by its distribution fees, voting rights on matters affecting a single class and its exchange privilege.
The following summarizes the Fund’s significant accounting policies.
a. Financial Instrument Valuation
The Fund’s investments in financial instruments are carried at fair value daily. Fair value is the price that would be received to sell an asset or paid to transfer a liability in an orderly transaction between market participants on the measurement date. The Fund calculates the net asset value (NAV) per share each business day as of 4 p.m. Eastern time or the regularly scheduled close of the New York Stock Exchange (NYSE), whichever is earlier. Under compliance policies and procedures approved by the Trust’s Board of Trustees (the Board), the Fund’s administrator has responsibility for oversight of valuation, including leading the cross-functional Valuation Committee (VC). The Fund may utilize independent pricing services, quotations from securities and financial instrument dealers, and other market sources to determine fair value.
Equity securities and derivative financial instruments listed on an exchange or on the NASDAQ National Market System are valued at the last quoted sale price or the official closing price of the day, respectively. Foreign equity securities are valued as of the close of trading on the foreign stock exchange on which the security is primarily traded, or as of 4 p.m. Eastern time. The value is then converted into its U.S. dollar equivalent at the foreign exchange rate in effect at 4 p.m. Eastern time on the day that the value of the security is
determined.Over-the-counter (OTC) securities are valued within the range of the most recent quoted bid and ask prices. Securities that trade in multiple markets or on multiple exchanges are valued according to the broadest and most representative market. Certain equity securities are valued based upon fundamental characteristics or relationships to similar securities.
Debt securities generally trade in the OTC market rather than on a securities exchange. The Fund’s pricing services use multiple valuation techniques to determine fair value. In instances where sufficient market activity exists, the pricing services may utilize a market-based approach through which quotes from market makers are used to determine fair value. In instances where sufficient market activity may not exist or is limited, the pricing services also utilize proprietary valuation models which may consider market characteristics such as benchmark yield curves, credit spreads, estimated default rates, anticipated market interest rate volatility, coupon rates, anticipated timing of principal repayments, underlying collateral, and other unique security features in order to estimate the relevant cash flows, which are then discounted to calculate the fair value.
Investments inopen-end mutual funds are valued at the closing NAV.
Certain derivative financial instruments trade in the OTC market. The Fund’s pricing services use various techniques including industry standard option pricing models and proprietary discounted cash flow models to determine the fair value of those instruments. The Fund’s net benefit or obligation under the derivative contract, as measured by the fair value of the contract, is included in net assets.
The Fund has procedures to determine the fair value of financial instruments for which market prices are not reliable or readily available. Under these procedures, the Fund primarily employs a market-based approach which may use related or comparable assets or liabilities, recent transactions, market multiples, book values, and other relevant information for the investment to determine the fair value of the investment. An income-based valuation approach may also be used in which the anticipated future cash flows of the investment are discounted to calculate fair value. Discounts may also be applied due to the nature or duration of any restrictions on the disposition of the investments. Due to the
FRANKLIN TEMPLETON VARIABLE INSURANCE PRODUCTS TRUST
FINANCIAL STATEMENTS
Franklin Mutual Global Discovery VIP Fund(continued)
inherent uncertainty of valuations of such investments, the fair values may differ significantly from the values that would have been used had an active market existed.
Trading in securities on foreign securities stock exchanges and OTC markets may be completed before 4 p.m. Eastern time. In addition, trading in certain foreign markets may not take place on every Fund’s business day. Occasionally, events occur between the time at which trading in a foreign security is completed and 4 p.m. Eastern time that might call into question the reliability of the value of a portfolio security held by the Fund. As a result, differences may arise between the value of the Fund’s portfolio securities as determined at the foreign market close and the latest indications of value at 4 p.m. Eastern time. In order to minimize the potential for these differences, the VC monitors price movements following the close of trading in foreign stock markets through a series of country specific market proxies (such as baskets of American Depositary Receipts, futures contracts and exchange traded funds). These price movements are measured against established trigger thresholds for each specific market proxy to assist in determining if an event has occurred that may call into question the reliability of the values of the foreign securities held by the Fund. If such an event occurs, the securities may be valued using fair value procedures, which may include the use of independent pricing services.
When the last day of the reporting period is anon-business day, certain foreign markets may be open on those days that the Fund’s NAV is not calculated, which could result in differences between the value of the Fund’s portfolio securities on the last business day and the last calendar day of the reporting period. Any significant security valuation changes due to an open foreign market are adjusted and reflected by the Fund for financial reporting purposes.
b. Foreign Currency Translation
Portfolio securities and other assets and liabilities denominated in foreign currencies are translated into U.S. dollars based on the exchange rate of such currencies against U.S. dollars on the date of valuation. The Fund may enter into foreign currency exchange contracts to facilitate transactions denominated in a foreign currency. Purchases and sales of securities, income and expense items denominated in foreign currencies are translated into U.S. dollars at the exchange rate in effect on the transaction date. Portfolio securities and assets and liabilities denominated in
foreign currencies contain risks that those currencies will decline in value relative to the U.S. dollar. Occasionally, events may impact the availability or reliability of foreign exchange rates used to convert the U.S. dollar equivalent value. If such an event occurs, the foreign exchange rate will be valued at fair value using procedures established and approved by the Board.
The Fund does not separately report the effect of changes in foreign exchange rates from changes in market prices on securities held. Such changes are included in net realized and unrealized gain or loss from investments in the Statement of Operations.
Realized foreign exchange gains or losses arise from sales of foreign currencies, currency gains or losses realized between the trade and settlement dates on securities transactions and the difference between the recorded amounts of dividends, interest, and foreign withholding taxes and the U.S. dollar equivalent of the amounts actually received or paid. Net unrealized foreign exchange gains and losses arise from changes in foreign exchange rates on foreign denominated assets and liabilities other than investments in securities held at the end of the reporting period.
c. Derivative Financial Instruments
The Fund invested in derivative financial instruments in order to manage risk or gain exposure to various other investments or markets. Derivatives are financial contracts based on an underlying or notional amount, require no initial investment or an initial net investment that is smaller than would normally be required to have a similar response to changes in market factors, and require or permit net settlement. Derivatives contain various risks including the potential inability of the counterparty to fulfill their obligations under the terms of the contract, the potential for an illiquid secondary market, and/or the potential for market movements which expose the Fund to gains or losses in excess of the amounts shown in the Statement of Assets and Liabilities. Realized gain and loss and unrealized appreciation and depreciation on these contracts for the period are included in the Statement of Operations.
Derivative counterparty credit risk is managed through a formal evaluation of the creditworthiness of all potential counterparties. The Fund attempts to reduce its exposure to counterparty credit risk on OTC derivatives, whenever possible, by entering into International Swaps and Derivatives Association (ISDA) master agreements with certain
FRANKLIN TEMPLETON VARIABLE INSURANCE PRODUCTS TRUST
FINANCIAL STATEMENTS
Franklin Mutual Global Discovery VIP Fund(continued)
1. Organization and Significant Accounting Policies(continued)
c. Derivative Financial Instruments(continued)
counterparties. These agreements contain various provisions, including but not limited to collateral requirements, events of default, or early termination. Termination events applicable to the counterparty include certain deteriorations in the credit quality of the counterparty. Termination events applicable to the Fund include failure of the Fund to maintain certain net asset levels and/or limit the decline in net assets over various periods of time. In the event of default or early termination, the ISDA master agreement gives thenon-defaulting party the right to net andclose-out all transactions traded, whether or not arising under the ISDA agreement, to one net amount payable by one counterparty to the other. However, absent an event of default or early termination, OTC derivative assets and liabilities are presented gross and not offset in the Statement of Assets and Liabilities. Early termination by the counterparty may result in an immediate payment by the Fund of any net liability owed to that counterparty under the ISDA agreement. At December 31, 2019, the Fund had OTC derivatives in a net liability position of $1,374,358 and the aggregate value of collateral pledged for such contracts was $646,932.
Collateral requirements differ by type of derivative. Collateral or initial margin requirements are set by the broker or exchange clearing house for exchange traded and centrally cleared derivatives. Initial margin deposited is held at the exchange and can be in the form of cash and/or securities. For OTC derivatives traded under an ISDA master agreement, posting of collateral is required by either the Fund or the applicable counterparty if the total net exposure of all OTC derivatives with the applicable counterparty exceeds the minimum transfer amount, which typically ranges from $100,000 to $250,000, and can vary depending on the counterparty and the type of the agreement. Generally, collateral is determined at the close of Fund business each day and any additional collateral required due to changes in derivative values may be delivered by the Fund or the counterparty the next business day, or within a few business days. Collateral pledged and/or received by the Fund for OTC derivatives, if any, is held in segregated accounts with the Fund’s custodian/counterparty broker and can be in the form of cash and/or securities. Unrestricted cash may be invested according to the Fund’s investment objectives. To the extent that the amounts due to the Fund from its counterparties are
not subject to collateralization or are not fully collateralized, the Fund bears the risk of loss from counterparty non-performance.
The Fund entered into exchange traded futures contracts primarily to manage exposure to certain foreign currencies. A futures contract is an agreement between the Fund and a counterparty to buy or sell an asset at a specified price on a future date. Required initial margins are pledged by the Fund, and the daily change in fair value is accounted for as a variation margin payable or receivable in the Statement of Assets and Liabilities.
The Fund entered into OTC forward exchange contracts primarily to manage exposure to certain foreign currencies. A forward exchange contract is an agreement between the Fund and a counterparty to buy or sell a foreign currency at a specific exchange rate on a future date.
See Note 10 regarding other derivative information.
d. Securities Sold Short
The Fund is engaged in selling securities short, which obligates the Fund to replace a borrowed security with the same security at current fair value. The Fund incurs a loss if the price of the security increases between the date of the short sale and the date on which the Fund replaces the borrowed security. The Fund realizes a gain if the price of the security declines between those dates. Gains are limited to the price at which the Fund sold the security short, while losses are potentially unlimited in size.
The Fund is required to establish a margin account with the broker lending the security sold short. While the short sale is outstanding, the broker retains the proceeds of the short sale to the extent necessary to meet margin requirements until the short position is closed out. A deposit must also be maintained with the Fund’s custodian/counterparty broker consisting of cash and/or securities having a value equal to a specified percentage of the value of the securities sold short. The Fund is obligated to pay fees for borrowing the securities sold short and is required to pay the counterparty any dividends and/or interest due on securities sold short. Such dividends and/or interest and any security borrowing fees are recorded as an expense to the Fund.
FRANKLIN TEMPLETON VARIABLE INSURANCE PRODUCTS TRUST
FINANCIAL STATEMENTS
Franklin Mutual Global Discovery VIP Fund(continued)
e. Securities Lending
The Fund participates in an agency based securities lending program to earn additional income. The Fund receives cash collateral against the loaned securities in an amount equal to at least 102% of the fair value of the loaned securities. Collateral is maintained over the life of the loan in an amount not less than 100% of the fair value of loaned securities, as determined at the close of Fund business each day; any additional collateral required due to changes in security values is delivered to the Fund on the next business day. The collateral is deposited into a joint cash account with other funds and is used to invest in a money market fund managed by Franklin Advisers, Inc., an affiliate of the Fund. The Fund may receive income from the investment of cash collateral, in addition to lending fees and rebates paid by the borrower. Income from securities loaned, net of fees paid to the securities lending agent and/or third-party vendor, is reported separately in the Statement of Operations. The Fund bears the market risk with respect to the collateral investment, securities loaned, and the risk that the agent may default on its obligations to the Fund. If the borrower defaults on its obligation to return the securities loaned, the Fund has the right to repurchase the securities in the open market using the collateral received. The securities lending agent has agreed to indemnify the Fund in the event of default by a third party borrower. At December 31, 2019, the Fund had no securities on loan.
f. Income and Deferred Taxes
It is the Fund’s policy to qualify as a regulated investment company under the Internal Revenue Code. The Fund intends to distribute to shareholders substantially all of its taxable income and net realized gains to relieve it from federal income and if applicable, excise taxes. As a result, no provision for U.S. federal income taxes is required.
The Fund may be subject to foreign taxation related to income received, capital gains on the sale of securities and certain foreign currency transactions in the foreign jurisdictions in which it invests. Foreign taxes, if any, are recorded based on the tax regulations and rates that exist in the foreign markets in which the Fund invests. When a capital gain tax is determined to apply, the Fund records an estimated deferred tax liability in an amount that would be payable if the securities were disposed of on the valuation date.
As a result of several court cases, in certain countries across the European Union, the Fund filed additional tax reclaims for previously withheld taxes on dividends earned in those countries (EU reclaims). These additional filings are subject to various administrative proceedings by the local jurisdictions’ tax authorities within the European Union, as well as a number of related judicial proceedings. Income recognized, if any, for EU reclaims is reflected as other income in the Statement of Operations and any related receivable, if any, is reflected as European Union tax reclaims in the Statement of Assets and Liabilities. When uncertainty exists as to the ultimate resolution of these proceedings, the likelihood of receipt of these EU reclaims, and the potential timing of payment, no amounts are reflected in the financial statements. For U.S. income tax purposes, when EU reclaims are received by the Fund and the Fund previously passed foreign tax credit on to its shareholders, the Fund must either amend historic tax reporting to shareholders or enter into a closing agreement with the Internal Revenue Service (IRS) in order to pay the associated tax liability on behalf of the Fund’s shareholders.
The Fund may recognize an income tax liability related to its uncertain tax positions under U.S. GAAP when the uncertain tax position has a less than 50% probability that it will be sustained upon examination by the tax authorities based on its technical merits. As of December 31, 2019, the Fund has determined that no tax liability is required in its financial statements related to uncertain tax positions for any open tax years (or expected to be taken in future tax years). Open tax years are those that remain subject to examination and are based on the statute of limitations in each jurisdiction in which the Fund invests.
g. Security Transactions, Investment Income, Expenses and Distributions
Security transactions are accounted for on trade date. Realized gains and losses on security transactions are determined on a specific identification basis. Interest income and estimated expenses are accrued daily. Amortization of premium and accretion of discount on debt securities are included in interest income. Dividend income and dividends declared on securities sold short are recorded on theex-dividend date except for certain dividends from securities where the dividend rate is not available. In such cases, the dividend is recorded as soon as the information is received by the Fund. Distributions to shareholders are recorded on theex-dividend date. Distributable earnings are determined
FRANKLIN TEMPLETON VARIABLE INSURANCE PRODUCTS TRUST
FINANCIAL STATEMENTS
Franklin Mutual Global Discovery VIP Fund(continued)
1. Organization and Significant Accounting Policies(continued)
g Security Transactions, Investment Income, Expenses and Distributions(continued)
according to income tax regulations (tax basis) and may differ from earnings recorded in accordance with U.S. GAAP. These differences may be permanent or temporary. Permanent differences are reclassified among capital accounts to reflect their tax character. These reclassifications have no impact on net assets or the results of operations. Temporary differences are not reclassified, as they may reverse in subsequent periods.
Common expenses incurred by the Trust are allocated among the Funds based on the ratio of net assets of each Fund to the combined net assets of the Trust or based on the ratio of number of shareholders of each Fund to the combined number of shareholders of the Trust. Fund specific expenses are charged directly to the Fund that incurred the expense.
Realized and unrealized gains and losses and net investment income, excluding class specific expenses, are allocated daily to each class of shares based upon the relative proportion of net assets of each class. Differences in per share distributions by class are generally due to differences in class specific expenses.
h. Accounting Estimates
The preparation of financial statements in accordance with U.S. GAAP requires management to make estimates and assumptions that affect the reported amounts of assets and liabilities at the date of the financial statements and the amounts of income and expenses during the reporting period. Actual results could differ from those estimates.
i. Guarantees and Indemnifications
Under the Trust’s organizational documents, its officers and trustees are indemnified by the Trust against certain liabilities arising out of the performance of their duties to the Trust. Additionally, in the normal course of business, the Trust, on behalf of the Fund, enters into contracts with service providers that contain general indemnification clauses. The Trust’s maximum exposure under these arrangements is unknown as this would involve future claims that may be made against the Trust that have not yet occurred. Currently, the Trust expects the risk of loss to be remote.
2. Shares of Beneficial Interest
At December 31, 2019, there were an unlimited number of shares authorized (without par value). Transactions in the Fund’s shares were as follows:
| | | | | | | | | | | | | | | | |
| | | Year Ended December 31, | |
| | | | |
| | |
| | | 2019 | | | 2018 | |
| | | | |
| | | | |
| | | Shares | | | Amount | | | Shares | | | Amount | |
| |
| | | | |
Class 1 Shares: | | | | | | | | | | | | | | | | |
Shares sold | | | 24,462 | | | $ | 464,734 | | | | 45,098 | | | $ | 915,165 | |
Shares issued in reinvestment of distributions | | | 24,488 | | | | 427,555 | | | | 6,995 | | | | 139,418 | |
Shares redeemed | | | (34,522 | ) | | | (661,070 | ) | | | (20,687 | ) | | | (412,072 | ) |
| | | | |
| | | | |
Net increase (decrease) | | | 14,428 | | | $ | 231,219 | | | | 31,406 | | | $ | 642,511 | |
| | | | |
| | | | |
Class 2 Shares: | | | | | | | | | | | | | | | | |
Shares sold | | | 753,358 | | | $ | 13,863,507 | | | | 1,060,981 | | | $ | 20,521,165 | |
Shares issued in reinvestment of distributions | | | 3,626,391 | | | | 61,286,007 | | | | 1,085,816 | | | | 21,021,401 | |
Shares redeemed | | | (4,790,566 | ) | | | (89,415,882 | ) | | | (4,500,413 | ) | | | (87,846,879 | ) |
| | | | |
| | | | |
Net increase (decrease) | | | (410,817 | ) | | $ | (14,266,368 | ) | | | (2,353,616 | ) | | $ | (46,304,313 | ) |
| | | | |
FRANKLIN TEMPLETON VARIABLE INSURANCE PRODUCTS TRUST
FINANCIAL STATEMENTS
Franklin Mutual Global Discovery VIP Fund(continued)
| | | | | | | | | | | | | | | | |
| | | Year Ended December 31, | |
| | | | |
| | |
| | | 2019 | | | 2018 | |
| | | | |
| | | | |
| | | Shares | | | Amount | | | Shares | | | Amount | |
| | | | |
Class 4 Shares: | | | | | | | | | | | | | | | | |
Shares sold | | | 22,659 | | | $ | 428,560 | | | | 49,992 | | | $ | 917,196 | |
Shares issued in reinvestment of distributions | | | 198,332 | | | | 3,431,154 | | | | 60,157 | | | | 1,188,087 | |
Shares redeemed | | | (334,363 | ) | | | (6,370,409 | ) | | | (438,307 | ) | | | (8,783,893 | ) |
| | | | |
| | | | |
Net increase (decrease) | | | (113,372 | ) | | $ | (2,510,695 | ) | | | (328,158 | ) | | $ | (6,678,610 | ) |
| | | | |
3. Transactions with Affiliates
Franklin Resources, Inc. is the holding company for various subsidiaries that together are referred to as Franklin Templeton. Certain officers and trustees of the Fund are also officers and/or directors of the following subsidiaries:
| | |
| Subsidiary | | Affiliation |
| |
Franklin Mutual Advisers, LLC (Franklin Mutual) | | Investment manager |
| |
Franklin Templeton Services, LLC (FT Services) | | Administrative manager |
| |
Franklin Templeton Distributors, Inc. (Distributors) | | Principal underwriter |
| |
Franklin Templeton Investor Services, LLC (Investor Services) | | Transfer agent |
a. Management Fees
The Fund pays an investment management fee to Franklin Mutual based on the average daily net assets of the Fund as follows:
| | |
| Annualized Fee Rate | | Net Assets |
| |
0.875% | | Up to and including $4 billion |
| |
0.845% | | Over $4 billion, up to and including $7 billion |
| |
0.825% | | Over $7 billion, up to and including $10 billion |
| |
0.805% | | Over $10 billion, up to and including $13 billion |
| |
0.785% | | Over $13 billion, up to and including $16 billion |
| |
0.765% | | Over $16 billion, up to and including $19 billion |
| |
0.745% | | Over $19 billion, up to and including $22 billion |
| |
0.725% | | Over $22 billion, up to and including $25 billion |
| |
0.705% | | Over $25 billion, up to and including $28 billion |
| |
0.685% | | In excess of $28 billion |
b. Administrative Fees
Under an agreement with Franklin Mutual, FT Services provides administrative services to the Fund. The fee is paid by Franklin Mutual based on the Fund’s average daily net assets, and is not an additional expense of the Fund.
FRANKLIN TEMPLETON VARIABLE INSURANCE PRODUCTS TRUST
FINANCIAL STATEMENTS
Franklin Mutual Global Discovery VIP Fund(continued)
3. Transactions with Affiliates(continued)
c. Distribution Fees
The Board has adopted distribution plans for Class 2 and Class 4 shares pursuant to Rule12b-1 under the 1940 Act. Under the Fund’s compensation distribution plans, the Fund pays Distributors for costs incurred in connection with the servicing, sale and distribution of the Fund’s shares up to 0.35% per year of its average daily net assets of each class. The Board has agreed to limit the current rate to 0.25% per year for Class 2. The plan year, for purposes of monitoring compliance with the maximum annual plan rates, is February 1 through January 31.
d. Transfer Agent Fees
Investor Services, under terms of an agreement, performs shareholder servicing for the Fund and is not paid by the Fund for the services.
e. Investments in Affiliated Management Investment Companies
The Fund invests in one or more affiliated management investment companies for purposes other than exercising a controlling influence over the management or policies. Management fees paid by the Fund are waived on assets invested in the affiliated management investment companies, as noted in the Statement of Operations, in an amount not to exceed the management and administrative fees paid directly or indirectly by each affiliate. During the year ended December 31, 2019, the Fund held investments in affiliated management investment companies as follows:
| | | | | | | | | | | | | | | | | | | | | | | | | | | | | | | | |
| | | Value at Beginning of Year | | | Purchases | | | Sales | | | Realized Gain (Loss) | | | Net Change in Unrealized Appreciation (Depreciation) | | | Value at End of Year | | | Number of Shares Held at End of Year | | | Income from securities
loaned | |
| | | | | | | | |
Non-Controlled Affiliates | | | | | | | | | | | | | | | | | | | | | | | | | | | | | | | | |
Institutional Fiduciary Trust Money Market Portfolio, 1.26% | | | $ — | | | $ | 67,077,000 | | | $ | (67,077,000 | ) | | | $ — | | | | $ — | | | | $ — | | | | — | | | | $23,202 | |
| | | | | | | | | | | | |
f. Interfund Transactions
The Fund engaged in purchases and sales of investments with funds or other accounts that have common investment managers (or affiliated investment managers), directors, trustees or officers. During the year ended December 31, 2019, these purchase and sale transactions aggregated $0 and $1,292,720, respectively.
4. Expense Offset Arrangement
The Fund has entered into an arrangement with its custodian whereby credits realized as a result of uninvested cash balances are used to reduce a portion of the Fund’s custodian expenses. During the year ended December 31, 2019, the custodian fees were reduced as noted in the Statement of Operations.
5. Income Taxes
The tax character of distributions paid during the years ended December 31, 2019 and 2018, was as follows:
| | | | | | | | |
| | | 2019 | | | 2018 | |
| | | | |
Distributions paid from: | | | | | | | | |
Ordinary income | | $ | 16,065,752 | | | $ | 14,592,064 | |
FRANKLIN TEMPLETON VARIABLE INSURANCE PRODUCTS TRUST
FINANCIAL STATEMENTS
Franklin Mutual Global Discovery VIP Fund(continued)
| | | | | | | | |
| | | 2019 | | | 2018 | |
| | | | |
Long term capital gain | | | 49,078,964 | | | | 7,756,842 | |
| | | | |
| | |
| | $ | 65,144,716 | | | $ | 22,348,906 | |
| | | | |
At December 31, 2019, the cost of investments, net unrealized appreciation (depreciation), undistributed ordinary income and undistributed long term capital gains for income tax purposes were as follows:
| | | | |
Cost of investments | | $ | 461,668,406 | |
| | | | |
| |
Unrealized appreciation | | $ | 136,550,325 | |
Unrealized depreciation | | | (27,950,179 | ) |
| | | | |
| |
Net unrealized appreciation (depreciation) | | $ | 108,600,146 | |
| | | | |
| |
Distributable earnings: | | | | |
Undistributed ordinary income | | $ | 13,951,901 | |
Undistributed long term capital gains | | | 5,579,033 | |
| | | | |
| |
Total distributable earnings | | $ | 19,530,934 | |
| | | | |
Differences between income and/or capital gains as determined on a book basis and a tax basis are primarily due to differing treatments of foreign currency transactions and pass-through entity income.
6. Investment Transactions
Purchases and sales of investments (excluding short term securities and securities sold short) for the year ended December 31, 2019, aggregated $115,811,528 and $164,645,377, respectively.
7. Credit Risk and Defaulted Securities
The Fund may purchase thepre-default or defaulted debt of distressed companies. Distressed companies are financially troubled and could be or are already involved in financial restructuring or bankruptcy. Risks associated with purchasing these securities include the possibility that the bankruptcy or other restructuring process takes longer than expected, or that distributions in restructuring are less than anticipated, either or both of which may result in unfavorable consequences to the Fund. If it becomes probable that the income on debt securities, including those of distressed companies, will not be collected, the Fund discontinues accruing income and recognizes an adjustment for uncollectible interest.
At December 31, 2019, the Fund did not hold any distressed company securities for which interest recognition has been discontinued.
8. Concentration of Risk
Investing in foreign securities may include certain risks and considerations not typically associated with investing in U.S. securities, such as fluctuating currency values and changing local, regional and global economic, political and social conditions, which may result in greater market volatility. Current political and financial uncertainty surrounding the European Union may increase market volatility and the economic risk of investing in securities in Europe. In addition, certain foreign securities may not be as liquid as U.S. securities.
FRANKLIN TEMPLETON VARIABLE INSURANCE PRODUCTS TRUST
FINANCIAL STATEMENTS
Franklin Mutual Global Discovery VIP Fund(continued)
9. Restricted Securities
The Fund invests in securities that are restricted under the Securities Act of 1933 (1933 Act). Restricted securities are often purchased in private placement transactions, and cannot be sold without prior registration unless the sale is pursuant to an exemption under the 1933 Act. Disposal of these securities may require greater effort and expense, and prompt sale at an acceptable price may be difficult. The Fund may have registration rights for restricted securities. The issuer generally incurs all registration costs.
At December 31, 2019, investments in restricted securities, excluding securities exempt from registration under the 1933 Act, were as follows:
| | | | | | | | | | | | |
| Shares | | Issuer | | Acquisition
Date | | | Cost | | | Value |
| | | | |
| 424,073 | | International Automotive Components Group Brazil LLC, (Value is 0.0%† of Net Assets) | | | 4/13/06 -12/26/08 | | | $ | 281,629 | | | $15,394 |
| | | | | | | | | |
†Rounds to less than 0.1% of net assets.
10. Other Derivative Information
At December 31, 2019, investments in derivative contracts are reflected in the Statement of Assets and Liabilities as follows:
| | | | | | | | | | | | |
| | | Asset Derivatives | | | Liability Derivatives | |
| | | | | | |
| | | | |
Derivative Contracts Not Accounted for as Hedging Instruments | | Statement of Assets and Liabilities Location | | Fair Value | | | Statement of Assets and Liabilities Location | | Fair Value | |
| | | | |
Foreign exchange contracts | | Variation margin on futures contracts | | | $ — | | | Variation margin on futures contracts | | $ | 334,451 | a |
| | | | |
| | Unrealized appreciation on OTC
forward exchange contracts | | | 5,973 | | | Unrealized depreciation on OTC
forward exchange contracts | | | 1,380,331 | |
| | | | | | | | | | | | |
| | | | |
Totals | | | | | $5,973 | | | | | $ | 1,714,782 | |
| | | | | | | | | | | | |
aThis amount reflects the cumulative appreciation (depreciation) of futures contracts as reported in the Statement of Investments. Only the variation margin receivable/ payable at year end is separately reported within the Statement of Assets and Liabilities. Prior variation margin movements were recorded to cash upon receipt or payment.
For the year ended December 31, 2019, the effect of derivative contracts in the Statement of Operations was as follows:
| | | | | | | | | | | | |
Derivative Contracts Not Accounted for as Hedging Instruments | | Statement of Operations Location | | Net Realized Gain (Loss) for the Year | | | Statement of Operations Location | | Net Change in Unrealized Appreciation (Depreciation) for the Year | |
| | | | |
| | Net realized gain (loss) from: | | | | | | Net change in unrealized appreciation (depreciation) on: | | | | |
| | | | |
Foreign exchange contracts | | Forward exchange contracts | | | $2,765,809 | | | Forward exchange contracts | | | $(197,547 | ) |
| | | | |
| | Futures contracts | | | 1,382,877 | | | Futures contracts | | | (361,482 | ) |
| | | | | | | | | | | | |
| | | | |
Totals | | | | | $4,148,686 | | | | | | $(559,029 | ) |
| | | | | | | | | | | | |
For the year ended December 31, 2019, the average month end notional amount of futures contracts represented $37,005,142. The average month end contract value of forward exchange contracts was $85,569,664.
FRANKLIN TEMPLETON VARIABLE INSURANCE PRODUCTS TRUST
FINANCIAL STATEMENTS
Franklin Mutual Global Discovery VIP Fund(continued)
See Note 1(c) regarding derivative financial instruments.
11. Credit Facility
The Fund, together with other U.S. registered and foreign investment funds (collectively, Borrowers), managed by Franklin Templeton, are borrowers in a joint syndicated senior unsecured credit facility totaling $2 billion (Global Credit Facility) which matured on February 7, 2020. This Global Credit Facility provides a source of funds to the Borrowers for temporary and emergency purposes, including the ability to meet future unanticipated or unusually large redemption requests. Effective February 7, 2020, the Borrowers renewed the Global Credit Facility for a one year term, maturing February 5, 2021, for a total of $2 billion.
Under the terms of the Global Credit Facility, the Fund shall, in addition to interest charged on any borrowings made by the Fund and other costs incurred by the Fund, pay its share of fees and expenses incurred in connection with the implementation and maintenance of the Global Credit Facility, based upon its relative share of the aggregate net assets of all of the Borrowers, including an annual commitment fee of 0.15% based upon the unused portion of the Global Credit Facility. These fees are reflected in other expenses in the Statement of Operations. During the year ended December 31, 2019, the Fund did not use the Global Credit Facility.
12. Fair Value Measurements
The Fund follows a fair value hierarchy that distinguishes between market data obtained from independent sources (observable inputs) and the Fund’s own market assumptions (unobservable inputs). These inputs are used in determining the value of the Fund’s financial instruments and are summarized in the following fair value hierarchy:
| | • | | Level 1 – quoted prices in active markets for identical financial instruments |
| | • | | Level 2 – other significant observable inputs (including quoted prices for similar financial instruments, interest rates, prepayment speed, credit risk, etc.) |
| | • | | Level 3 – significant unobservable inputs (including the Fund’s own assumptions in determining the fair value of financial instruments) |
The input levels are not necessarily an indication of the risk or liquidity associated with financial instruments at that level.
FRANKLIN TEMPLETON VARIABLE INSURANCE PRODUCTS TRUST
FINANCIAL STATEMENTS
Franklin Mutual Global Discovery VIP Fund(continued)
12. Fair Value Measurements(continued)
A summary of inputs used as of December 31, 2019, in valuing the Fund’s assets and liabilities carried at fair value, is as follows:
| | | | | | | | | | | | | | | | |
| | | Level 1 | | | Level 2 | | | Level 3 | | | Total | |
| | | | |
Assets: | | | | | | | | | | | | | | | | |
Investments in Securities:a | | | | | | | | | | | | | | | | |
Equity Investments:b | | | | | | | | | | | | | | | | |
Auto Components | | $ | — | | | $ | — | | | $ | 15,394 | | | $ | 15,394 | |
Media | | | 16,185,601 | | | | — | | | | 23,070 | | | | 16,208,671 | |
All Other Equity Investments | | | 535,614,503 | | | | — | | | | — | | | | 535,614,503 | |
Corporate Notes | | | — | | | | 3,751,714 | | | | — | | | | 3,751,714 | |
Companies in Liquidation | | | — | | | | — | | | | 3,251 | c | | | 3,251 | |
Short Term Investments | | | 16,460,984 | | | | 2,000,000 | | | | — | | | | 18,460,984 | |
| | | | |
| | | | |
Total Investments in Securities | | $ | 568,261,088 | | | $ | 5,751,714 | | | $ | 41,715 | | | $ | 574,054,517 | |
| | | | |
Other Financial Instruments: | | | | | | | | | | | | | | | | |
| | | | |
Forward Exchange Contracts | | $ | — | | | $ | 5,973 | | | $ | — | | | $ | 5,973 | |
| | | | |
| | | | |
Liabilities: | | | | | | | | | | | | | | | | |
Other Financial Instruments: | | | | | | | | | | | | | | | | |
Securities Sold Short | | $ | 2,077,945 | | | $ | — | | | $ | — | | | $ | 2,077,945 | |
Futures Contracts | | | 334,451 | | | | — | | | | — | | | | 334,451 | |
Forward Exchange Contracts | | | — | | | | 1,380,331 | | | | — | | | | 1,380,331 | |
| | | | |
| | | | |
Total Other Financial Instruments | | $ | 2,412,396 | | | $ | 1,380,331 | | | $ | — | | | $ | 3,792,727 | |
| | | | |
aFor detailed categories, see the accompanying Statement of Investments.
bIncludes common and preferred stocks as well as other equity interests.
cIncludes securities determined to have no value at December 31, 2019.
A reconciliation of assets in which Level 3 inputs are used in determining fair value is presented when there are significant Level 3 financial instruments at the beginning and/or end of the year.
13. Subsequent Events
The Fund has evaluated subsequent events through the issuance of the financial statements and determined that no events have occurred that require disclosure other than those already disclosed in the financial statements.
Abbreviations
| | | | | | | | | | |
| Counterparty | | Currency | | Selected Portfolio |
| | | | | |
BOFA | | Bank of America Corp. | | EUR | | Euro | | ADR | | American Depositary Receipt |
| | | | | |
HSBK | | HSBC Bank PLC | | GBP | | British Pound | | FHLB | | Federal Home Loan Bank |
| | | | | |
SSBT | | State Street Bank and Trust Co., N.A. | | USD | | United States Dollar | | | | |
| | | | | |
UBSW | | UBS AG | | | | | | | | |
FRANKLIN TEMPLETON VARIABLE INSURANCE PRODUCTS TRUST
Report of Independent Registered Public Accounting Firm
To the Board of Trustees of Franklin Templeton Variable Insurance Products Trust and Shareholders of Franklin Mutual Global Discovery VIP Fund
Opinion on the Financial Statements
We have audited the accompanying statement of assets and liabilities, including the statement of investments, of Franklin Mutual Global Discovery VIP Fund (the “Fund” ) as of December 31, 2019, the related statement of operations for the year ended December 31, 2019, the statement of changes in net assets for each of the two years in the period ended December 31, 2019, including the related notes, and the financial highlights for each of the five years in the period ended December 31, 2019 (collectively referred to as the “financial statements”). In our opinion, the financial statements present fairly, in all material respects, the financial position of the Fund as of December 31, 2019, the results of its operations for the year then ended, the changes in its net assets for each of the two years in the period ended December 31, 2019 and the financial highlights for each of the five years in the period ended December 31, 2019 in conformity with accounting principles generally accepted in the United States of America.
Basis for Opinion
These financial statements are the responsibility of the Fund’s management. Our responsibility is to express an opinion on the Fund’s financial statements based on our audits. We are a public accounting firm registered with the Public Company Accounting Oversight Board (United States) (PCAOB) and are required to be independent with respect to the Fund in accordance with the U.S. federal securities laws and the applicable rules and regulations of the Securities and Exchange Commission and the PCAOB.
We conducted our audits of these financial statements in accordance with the standards of the PCAOB. Those standards require that we plan and perform the audit to obtain reasonable assurance about whether the financial statements are free of material misstatement, whether due to error or fraud.
Our audits included performing procedures to assess the risks of material misstatement of the financial statements, whether due to error or fraud, and performing procedures that respond to those risks. Such procedures included examining, on a test basis, evidence regarding the amounts and disclosures in the financial statements. Our audits also included evaluating the accounting principles used and significant estimates made by management, as well as evaluating the overall presentation of the financial statements. Our procedures included confirmation of securities owned as of December 31, 2019 by correspondence with the custodian and brokers; when replies were not received from brokers, we performed other auditing procedures. We believe that our audits provide a reasonable basis for our opinion.
PricewaterhouseCoopers LLP
San Francisco, California
February 20, 2020
We have served as the auditor of one or more investment companies in the Franklin Templeton Group of Funds since 1948.
FRANKLIN TEMPLETON VARIABLE INSURANCE PRODUCTS TRUST
Tax Information (unaudited)
Franklin Mutual Global Discovery VIP Fund
Under Section 852(b)(3)(C) of the Internal Revenue Code, the Fund hereby reports the maximum amount allowable but no less than $49,078,964 as a long term capital gain dividend for the fiscal year ended December 31, 2019.
Under Section 854(b)(1)(A) of the Internal Revenue Code, the Fund hereby reports 39.13% of the ordinary income dividends as income qualifying for the dividends received deduction for the fiscal year ended December 31, 2019.
Franklin Mutual Shares VIP Fund
This annual report for Franklin Mutual Shares VIP Fund covers the fiscal year ended December 31, 2019.
Class 4 Performance Summary as of December 31, 2019
Average annual total return of Class 4 shares* represents the average annual change in value, assuming reinvestment of dividends and capital gains. Average returns smooth out variations in returns, which can be significant; they are not the same asyear-by-year results.
| | | | | | | | | | | | |
Periods ended 12/31/19 | | 1-Year | | | 5-Year | | | 10-Year | |
| | | |
Average Annual Total Return | | | +22.44% | | | | +5.80% | | | | +8.58% | |
*The Fund has a fee waiver associated with any investment it makes in a Franklin Templeton money fund and/or other Franklin Templeton fund, contractually guaranteed through 4/30/20. Fund investment results reflect the fee waiver; without this waiver, the results would have been lower.
Performance reflects the Fund’s Class 4 operating expenses, but doesnot include any contract fees, expenses or sales charges. If they had been included, performance would be lower. These charges and deductions, particularly for variable life policies, can have a significant effect on contract values and insurance benefits. See the contract prospectus for a complete description of these expenses, including sales charges.
Performance data represent past performance, which does not guarantee future results. Investment return and principal value will fluctuate, and you may have a gain or loss when you sell your shares. Current performance may differ from figures shown.
Total Return Index Comparison for a Hypothetical $10,000 Investment (1/1/10–12/31/19)
The graph below shows the change in value of a hypothetical $10,000 investment in the Fund over the indicated period and includes reinvestment of any income or distributions. The Fund’s performance* is compared to the performance of the Standard & Poor’s® 500 Index (S&P 500®). One cannot invest directly in an index, and an index is not representative of the Fund’s portfolio.Please see ImportantNotes to Performance Information preceding the Fund Summaries.

**Source: Morningstar. Please see Index Descriptions following the Fund Summaries.
FRANKLIN MUTUAL SHARES VIP FUND
Fund Goal and Main Investments
The Fund seeks capital appreciation, with income as a secondary goal, by investing primarily in U.S. and foreign equity securities that we believe are available at market prices less than their intrinsic value. The equity securities in which the Fund invests are primarily common stock. To a lesser extent, the Fund also invests in merger arbitrage securities and the debt and equity of distressed companies. The Fund may invest up to 35% of its assets in foreign securities, which may include sovereign debt and participations in foreign government debt.
Fund Risks
All investments involve risks, including possible loss of principal. Value securities may not increase in price as anticipated or may decline further in value. The Fund’s investments in foreign securities involve more risks than investing in U.S. securities, including currency exchange rates and policies, country or government specific issues, less favorable trading practices regulation and greater price volatility. Securities issued by smaller and midsize companies may be more volatile in price than those of larger companies, involve substantial risks and should be considered speculative. Derivatives involve costs and can create economic leverage in the Fund’s portfolio which may result in significant volatility and cause the Fund to participate in losses (as well as gains) in an amount that exceeds the Fund’s initial investment. The Fund may also invest in companies engaged in mergers, reorganizations or liquidations, which involve special risks as pending deals may not be completed on time or on favorable terms, as well as lower-rated bonds, which entail higher credit risk. To the extent that the Fund focuses on particular countries, regions, industries, sectors or types of investment from time to time, the Fund may be subject to greater risks of adverse developments in such areas of focus than a fund that invests in a wider variety of countries, regions, industries, sectors or investments. The Fund is actively managed but there is no guarantee that the manager’s investment decisions will produce the desired results. The Fund’s prospectus also includes a description of the main investment risks.
Geographic Composition*
Based on Total Net Assets as of 12/31/19
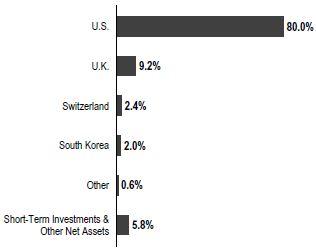
*Figures are stated as a percentage of total and may not equal 100% or may be negative due to rounding, use of any derivatives, unsettled trades or other factors.
Performance Overview
You can find the Fund’sone-year total return in the Performance Summary. In comparison, the Fund’s benchmark, the S&P 500 posted a +31.49% total return for the period under review.1
Economic and Market Overview
Global developed and emerging market stocks, as measured by the MSCI All Country World Index, posted strong returns during the reporting period. Although global economic growth slowed from 2018, interest-rate cuts from many central banks and the easing of trade tensions nearperiod-end contributed to the generally positive environment for equities worldwide. Reflecting investor optimism and slowing but resilient economic growth, stocks advanced in every major region of the globe.
In the U.S., solid economic growth also supported equities, as healthy consumer spending and a strong labor market kept the economy afloat. The unemployment rate fell during the year, reaching 3.5% in September, November and December 2019, the lowest recorded unemployment rate in 50 years.2 Wages also grew, albeit at a moderate pace, and inflation remained persistently low. In addition, deficit spending by the U.S. government boosted current growth at
1.Source: Morningstar. One cannot invest directly in an index, and an index is not representative of the Fund’s portfolio. Please see Index Descriptions following the Fund Summaries.
2. Source: U.S. Bureau of Labor Statistics.
The dollar value, number of shares or principal amount, and names of all portfolio holdings are listed in the Fund’s Statement of Investments (SOI).
FRANKLIN MUTUAL SHARES VIP FUND
the expense of long-term debt. Despite the strength in the consumer sector, some parts of the economy struggled, particularly heavy industry. Annual industrial production contracted late in the reporting period, manufacturing output stalled and capital spending declined.
The U.S. Federal Reserve (Fed) provided a substantial boost to equity markets early in the reporting period as it shifted to a more accommodative monetary policy. In January 2019, the Fed signaled the end of its tightening cycle and cut the federal funds rate three times thereafter, lowering it to a range of 1.50%–1.75%. Stocks responded positively to the interest-rate cuts and gained further in December 2019 after the Fed indicated it would likely leave interest rates unchanged in 2020.
Growth slowed overall in the eurozone, particularly in Germany and Italy. Germany, which is heavily reliant on exports, was adversely affected by the trade conflict between the U.S. and China and the resulting slowdown in global trade. In Italy, political uncertainty and budget concerns caused the country’s annual gross domestic product (GDP) growth to stall in 2019’s first quarter before accelerating in the second quarter. Despite sluggish economic conditions, European developed market equities, as measured by the MSCI Europe Index, posted strong returns overall, as easing trade tensions buoyed investor optimism and an electoral victory by the Conservative Party in the U.K. alleviated uncertainty surrounding Brexit. Although the European Central Bank left its headline refinancing rate unchanged, it lowered the deposit rate and restarted its bond-buying stimulus program, further supporting stocks.
Economic growth in Asia was relatively solid overall, despite slowdowns in several large emerging market countries, such as China and India. Japan’s economy grew amid the Bank of Japan’s sizable stimulus program. The trade war between the U.S. and China provided the backdrop for Asian stocks, which rose and fell in sync with investor sentiment regarding a trade deal. A phase one trade agreement between the two countries reached in December 2019 propelled Asian developed and emerging market stocks, which ultimately ended with strong returns over the12-month period, as measured by the MSCI All Country Asia Index.
Emerging market stocks overall experienced several sharp selloffs and subsequent rebounds throughout the reporting period before ending with gains. In aggregate, economic growth slowed somewhat from 2018 but remained solid, although there was some variation among individual countries. Many central banks in emerging markets cut interest rates throughout the reporting period which, along with resilient GDP growth, provided a supportive
Top 10 Sectors/Industries
12/31/19
| | |
| | | % of Total Net Assets |
| |
Pharmaceuticals | | 9.9% |
| |
Banks | | 9.7% |
| |
Insurance | | 8.2% |
| |
Oil, Gas & Consumable Fuels | | 7.7% |
| |
Media | | 6.3% |
| |
Technology Hardware, Storage & Peripherals | | 4.3% |
| |
Tobacco | | 3.1% |
| |
Health Care Equipment & Supplies | | 3.1% |
| |
Software | | 3.1% |
| |
Food Products | | 3.0% |
environment for equities. Russian stocks posted the highest returns among emerging markets as the threat of further sanctions receded and a solid fiscal environment reassured investors. Overall, global emerging markets, as measured by the MSCI Emerging Markets Index, posted robust returns for the period.
Investment Strategy
At Franklin Mutual Advisors, we are committed to our distinctive value approach to investing. Our major investment strategy is investing in undervalued stocks. When selecting undervalued equities, we are attracted to what we believe are fundamentally strong companies with healthy balance sheets, high-quality assets, substantial free cash flow and shareholder-oriented management teams and whose stocks are trading at discounts to our assessment of the companies’ intrinsic or business value. We also look for asset-rich companies whose shares may be trading at depressed levels due to concerns over short-term earnings disappointments, litigation, management strategy or other perceived negatives. While the vast majority of our undervalued equity investments are made in publicly traded companies globally, we may invest occasionally in privately held companies as well.
We complement this more traditional investment strategy with two others. One is distressed investing, which is complex and can take many forms. The most common distressed investment the Fund undertakes is the purchase of financially troubled or bankrupt companies’ debt at a substantial discount to face value. After the financially distressed company is reorganized, often in bankruptcy court, the old debt is typically replaced with new securities issued by the financially stronger company.
FRANKLIN MUTUAL SHARES VIP FUND
The other piece of our investment strategy is participating in arbitrage situations, another highly specialized field. When companies announce proposed mergers or takeovers, commonly referred to as “deals,” the target company may trade at a discount to the bid it ultimately accepts. One form of arbitrage involves purchasing the target company’s stock when it is trading below the value we believe it would receive in a deal. In keeping with our commitment to a relatively conservative investment approach, we typically focus our arbitrage efforts on announced deals, and eschew rumored deals or other situations we consider relatively risky.
In addition, it is our practice to hedge the Fund’s currency exposure when we deem it advantageous for our shareholders.
|
What is meant by “hedge”? |
|
To hedge an investment is to take a position intended to offset potential losses that may be incurred by a companion financial instrument. Hedging an investment may also offset potential gains. |
Manager’s Discussion
The end of a decade is a natural time for reflection about the years that have just passed and to look ahead to what the next 10 might have in store. Across Wall Street, we see many prognostications, and while we are not in the forecasting business, we do allow ourselves to think about investment opportunities over such an extended time period. But experience has taught us that while trying to predict the exact course of markets and/or economic and political events that will drive them may be fun, it is not all that useful.
As 2010 began, the global economy was still recovering from the Global Financial Crisis. The U.S. government owned significant portions of the banking and automotive sectors. The Fed had already started quantitative easing (QE), with QE 2 and QE 3 still to come. In Europe, concerns about Greece’s finances were emerging, and in China the effects of 2009’s massive stimulus programs were starting to take hold.
Over the subsequent years we saw ongoing, global QE, culminating in trillions of dollars of debt yielding negative interest rates. The European Union (EU) was in continuous upheaval, with Greece threatening to leave, but eventually staying in the eurozone; the U.K. pursuing and achieving Brexit; and ongoing strain between core members Germany, France, Italy and Spain. In the U.S., average annual economic growth was restrained and finished the decade below 2%, trailing the minimum 3% expectation of prior
decades. Strong corporate profits and lower corporate tax rates were bright spots.
Equity markets delivered a very good decade—one of the best in history—with the S&P 500 and the MSCI World Index posting average annual total returns of +13.56% and +10.08%, respectively.1 During the decade, Franklin Mutual Shares VIP Fund posted a solid return that nonetheless lagged the S&P 500, its benchmark. The Fund’s value strategy, which seeks to identify mispriced securities and limits downside risk, was out of favor in an environment that generally encouraged investors to assume more risk. Conversely, in the prior decade, the Fund outperformed the MSCI World Index. Our active investment approach focusing on individual opportunities was more conducive to the prior decade’s greater volatility.
In our view, going forward we expect more political and monetary uncertainty and economic growth in unexpected places. Corporate profits will have good years and bad years. Some industries will be massively disrupted, while others will find a way to adjust and prosper, even within the context of artificial intelligence and machine learning. Recent events, such as the coronavirus outbreak, have caused, and may continue to cause, uncertainty and volatility in the Chinese economy, potentially leading to vulnerability in 2020 global growth expectations. As for investment positioning, we intend to avoid forecasts that would lead us to make the Fund’s success dependent on a specific set of outcomes. Rather, we will seek to continue with our time-tested value process and complement it with new tools that enhance our security evaluation and selection process. To that end, we have integrated risk and quantitative portfolio analysis tools that provide us with fresh insights about performance, and help us identify companies and securities that we believe satisfy our investors’ goals of risk-adjusted returns that are not wholly dependent on any one economic or political scenario.
Fund Performance
Turning to Fund performance, top positive contributors included U.S.-based companies Charter Communications, Citigroup and Walt Disney.
Shares of cable operator Charter Communications surged after the company reported operating and financial results that were broadly ahead of consensus estimates. Capital expenditures were lower than expected and drove free cash flow, which was used during the period to buy back $3.1 billion of the company’s stock. The market was anticipating share repurchases totaling $2.25 billion. Revenue accelerated 5.1% compared with consensus
FRANKLIN MUTUAL SHARES VIP FUND
forecasts of 4.5%. The increased revenue, however, did not reflect the impact of a broad-based increase in subscriber fees implemented during the period, which could drive revenue growth and margin expansion in 2020. According to the company’s management, there has not been a meaningful decrease in customers as a result of the higher subscriber fees.
Investors bid up shares of bank and financial service provider Citigroup following the release of third-quarter earnings that beat consensus expectations. Highlights included increases in deposits of 6% quarter-over-quarter and 11% year-over-year; growth in revenues and purchase volumes in the North America-branded cards division by 11% and 7% year-over-year, respectively; and strong results in the bank’s Asian operations across the board. Management also repurchased 76 million, or 3.3%, of outstanding shares of the company during the period.
Shares of family entertainment and media enterprise Walt Disney surged in late 2019. The rally was kicked off by an earnings report characterized byacross-the-board outperformance of Disney legacy assets and a better-than-expected outlook for fiscal-year 2020 earnings. The company’s stock continued to rise following the successful launch of Disney+, which reported more than 10 million subscribers on the first day of service, exceeding forecasts. The box office performance of Frozen II, which set a record for Thanksgiving-weekend receipts, also helped boost the stock’s performance.
During the period under review, Fund investments that detracted from performance included U.S.-based companies Fluor (not held atperiod-end), Occidental Petroleum and Walgreens Boots Alliance.
The share price of Fluor, a global engineering and construction company, fell significantly during the period. The company withdrew 2019 guidance after reporting significant project charges and materially lower-than-expected earnings and revenues. Following these disappointing results, the company announced the return of the former chief executive officer (CEO) as executive chairman, promoted the general counsel to CEO, rehired the former chief financial officer and initiated a strategic review that recommends simplifying the company’s business model by divesting ofnon-core businesses.
The stock of Occidental Petroleum, a petroleum and chemical products company, traded lower in 2019 as investors struggled to accept its acquisition of Anadarko Petroleum, during a period in which energy stocks were under pressure from falling crude oil prices. We think the
Top 10 Holdings
12/31/19
| | |
Company Sector/Industry, Country | | % of Total Net Assets |
| |
Medtronic PLC Health Care Equipment & Supplies, U.S. | | 3.1% |
| |
Novartis AG Pharmaceuticals, Switzerland | | 2.4% |
| |
Charter Communications Inc. Media, U.S. | | 2.3% |
| |
Alleghany Corp. Insurance, U.S. | | 2.3% |
| |
GlaxoSmithKline PLC Pharmaceuticals, U.K. | | 2.2% |
| |
JPMorgan Chase & Co. Banks, U.S. | | 2.2% |
| |
American International Group Inc. Insurance, U.S. | | 2.2% |
| |
The Walt Disney Co. Entertainment, U.S. | | 2.2% |
| |
Citigroup Inc. Banks, U.S. | | 2.2% |
| |
Wells Fargo & Co. Banks, U.S. | | 2.1% |
Anadarko deal should be highly beneficial to the company’s per share metrics, although the acquisition will make the company more dependent on oil prices, while significantly weakening its balance sheet. The acquired Permian Basin assets complement Occidental’s existing portfolio, and the considerable free cash flow generated from Anadarko’s Gulf of Mexico operations can help reduce debt and support its dividend. Occidental’s management is strengthening the company’s financial position by disposing ofnon-core assets, which is key to restoring investor confidence, in our view.
Shares of drug store services provider Walgreens Boots Alliance began to sell off early in 2019, when the chief financial officer cited negative industry trends in drug prices and pharmacy benefit manager (PBM) reimbursement rates. Shares also fell in reaction to the company’s limited success in offsetting those challenges by increasing its volume of drug sales or renegotiating with PBMs. These pressures, and weakness in both its U.S. and U.K. stores, resulted in a cut to full-year guidance in April. However, Walgreens is reducing costs throughout the enterprise, and is attempting to reduce exposure to lower margin categories within the front of its stores, which we believe can help boost growth and profitability over the longer term. The company’s share price rallied in early November based on news that global
FRANKLIN MUTUAL SHARES VIP FUND
Investment firm KKR had approached the company about taking it private via a leveraged buyout that would likely be the largest in history. However, the stock retreated later when deal terms failed to materialize.
During the period, the Fund held currency forwards and futures seeking to hedge most of the currency risk of the portfolio’snon-U.S. dollar investments. The hedges had a modestly positive overall impact on the Fund’s performance.
|
|
What is a currency forward? |
A currency forward is a direct agreement between the Fund and a counterparty to buy or sell a foreign currency in exchange for another currency at a specific exchange rate on a future date. |
|
|
What is a future? |
A future is an agreement between the Fund and a counterparty made through a U.S. or foreign futures exchange to buy or sell an underlying instrument or asset at a specific price on a future date. |
Thank you for your participation in Franklin Mutual Shares VIP Fund. We look forward to serving your future investment needs.
The foregoing information reflects our analysis, opinions and portfolio holdings as of December 31, 2019, the end of the reporting period. The way we implement our main investment strategies and the resulting portfolio holdings may change depending on factors such as market and economic conditions. These opinions may not be relied upon as investment advice or an offer for a particular security. The information is not a complete analysis of every aspect of any market, country, industry, security or the Fund. Statements of fact are from sources considered reliable, but the investment manager makes no representation or warranty as to their completeness or accuracy. Although historical performance is no guarantee of future results, these insights may help you understand our investment management philosophy.
FRANKLIN MUTUAL SHARES VIP FUND
Class 4 Fund Expenses
As an investor in a variable insurance contract (Contract) that indirectly provides for investment in an underlying mutual fund, you can incur transaction and/or ongoing expenses at both the Fund level and the Contract Level: (1) transaction expenses can include sales charges (loads) on purchases, surrender fees, transfer fees and premium taxes; and (2) ongoing expenses can include management fees, distribution and service(12b-1) fees, contract fees, annual maintenance fees, mortality and expense risk fees and other fees and expenses. All mutual funds and Contracts have some types of ongoing expenses. The table below shows Fund-level ongoing expenses and can help you understand these costs and compare them with those of other mutual funds offered through the Contract. The table assumes a $1,000 investment held for the six months indicated. Please refer to the Fund prospectus for additional information on operating expenses.
Actual Fund Expenses
The table below provides information about the actual account values and actual expenses in the columns under the heading “Actual.” In these columns the Fund’s actual return, which includes the effect of ongoing Fund expenses but does not include the effect of ongoing Contract expenses, is used to calculate the “Ending Account Value.” You can estimate the Fund-level expenses you paid during the period by following these steps (of course, your account value and expenses will differ from those in this illustration): Divide your account value by $1,000 (if your account had an $8,600 value, then $8,600÷ $1,000 = 8.6). Then multiply the result by the number under the headings “Actual” and “Fund-Level Expenses Paid During Period” (if Fund-Level Expenses Paid During Period were $ 7.50, then 8.6 x $ 7.50 = $64.50). In this illustration, the estimated expenses paid this period at the Fund level are $64.50.
Hypothetical Example for Comparison with Other Mutual Funds
Under the heading “Hypothetical” in the table, information is provided about hypothetical account values and hypothetical expenses based on the Fund’s actual expense ratio and an assumed rate of return of 5% per year before expenses, which is not the Fund’s actual return. This information may not be used to estimate the actual ending account balance or expenses you paid for the period, but it can help you compare ongoing costs of investing in the Fund with those of other mutual funds offered through the Contract. To do so, compare this 5% hypothetical example with the 5% hypothetical examples that appear in the shareholder reports of other funds offered through the Contract.
Please note that expenses shown in the table are meant to highlight ongoing costs at the Fund level only and do not reflect any ongoing expenses at the Contract level, or transaction expenses at either the Fund or Contract levels. In addition, while the Fund does not have transaction expenses, if the transaction and ongoing expenses at the Contract level were included, the expenses shown below would be higher. You should consult your Contract prospectus or disclosure document for more information.
| | | | | | | | | | | | | | | | | | |
| | | | | | | Actual
(actual return after expenses) | | Hypothetical
(5% annual return before expenses) | | | | |
Share Class | | Beginning
Account
Value 7/1/19 | | | | Ending
Account
Value 12/31/19 | | Fund-Level
Expenses Paid During
Period
7/1/19–12/31/191, 2 | | | | Ending Account Value 12/31/19 | | Fund-Level
Expenses Paid During Period 7/1/19–12/31/191, 2 | | | | Net
Annualized
Expense
Ratio2 |
| Class 4 | | $1,000 | | | | $1,080.90 | | $5.56 | | | | $1,019.86 | | $5.40 | | | | 1.06% |
1. Expenses are equal to the annualized expense ratio for thesix-month period as indicated above—in the far right column—multiplied by the simple average account value over the period indicated, and then multiplied by 184/365 to reflect theone-half year period.
2. Reflects expenses after fee waivers and expense reimbursements. Does not include any ongoing expenses of the Contract for which the Fund is an investment option or acquired fund fees and expenses.
FRANKLIN TEMPLETON VARIABLE INSURANCE PRODUCTS TRUST
Financial Highlights
Franklin Mutual Shares VIP Fund
| | | | | | | | | | | | | | | | | | | | |
| | | | | | Year Ended December 31, | | | | |
| | | 2019 | | | 2018 | | | 2017 | | | 2016 | | | 2015 | |
| | | | | |
Class 1 | | | | | | | | | | | | | | | | | | | | |
| | | | | |
Per share operating performance (for a share outstanding throughout the year) | | | | | | | | | | | | | | | | | | | | |
| | | | | |
Net asset value, beginning of year | | | $17.71 | | | | $20.71 | | | | $20.40 | | | | $19.48 | | | | $22.91 | |
| | | | | |
Income from investment operationsa: | | | | | | | | | | | | | | | | | | | | |
| | | | | |
Net investment incomeb | | | 0.46 | | | | 0.36 | | | | 0.49 | | | | 0.50 | | | | 0.44 | |
| | | | | |
Net realized and unrealized gains (losses) | | | 3.39 | | | | (2.04 | ) | | | 1.22 | | | | 2.56 | | | | (1.54 | ) |
| | | | | |
Total from investment operations | | | 3.85 | | | | (1.68 | ) | | | 1.71 | | | | 3.06 | | | | (1.10 | ) |
| | | | | |
Less distributions from: | | | | | | | | | | | | | | | | | | | | |
| | | | | |
Net investment income | | | (0.42 | ) | | | (0.55 | ) | | | (0.53 | ) | | | (0.46 | ) | | | (0.77 | ) |
| | | | | |
Net realized gains | | | (1.95 | ) | | | (0.77 | ) | | | (0.87 | ) | | | (1.68 | ) | | | (1.56 | ) |
| | | | | |
Total distributions | | | (2.37 | ) | | | (1.32 | ) | | | (1.40 | ) | | | (2.14 | ) | | | (2.33 | ) |
| | | | | |
Net asset value, end of year | | | $19.19 | | | | $17.71 | | | | $20.71 | | | | $20.40 | | | | $19.48 | |
| | | | | |
Total returnc | | | 22.92% | | | | (8.86)% | | | | 8.64% | | | | 16.35% | | | | (4.69)% | |
| | | | | |
Ratios to average net assets | | | | | | | | | | | | | | | | | | | | |
| | | | | |
Expensesd,e | | | 0.71% | | | | 0.71% | | | | 0.72% | | | | 0.72% | | | | 0.73% | |
| | | | | |
Expenses incurred in connection with securities sold short | | | 0.02% | | | | 0.01% | | | | —% | | | | 0.01% | | | | 0.02% | |
| | | | | |
Net investment income | | | 2.35% | | | | 1.77% | | | | 2.34% | | | | 2.57% | | | | 2.00% | |
| | | | | |
Supplemental data | | | | | | | | | | | | | | | | | | | | |
| | | | | |
Net assets, end of year (000’s) | | | $158,431 | | | | $537,324 | | | | $653,700 | | | | $610,395 | | | | $643,438 | |
| | | | | |
Portfolio turnover rate | | | 38.50% | | | | 24.67% | | | | 18.32% | | | | 24.45% | | | | 19.88% | |
aThe amount shown for a share outstanding throughout the period may not correlate with the Statement of Operations for the period due to the timing of sales and repurchases of the Fund’s shares in relation to income earned and/or fluctuating fair value of the investments of the Fund.
bBased on average daily shares outstanding.
cTotal return does not include fees, charges or expenses imposed by the variable annuity and life insurance contracts for which Franklin Templeton Variable Insurance Products Trust serves as an underlying investment vehicle.
dIncludes dividend and/or interest expense on securities sold short and security borrowing fees, if any. See below for the ratios of such expenses to average net assets for the periods presented. See Note 1(e).
eBenefit of waiver and payments by affiliates and expense reduction rounds to less than 0.01%.
| | | | |
| | | |
MS-8 | | Annual Report | The accompanying notes are an integral part of these financial statements. | | |
FRANKLIN TEMPLETON VARIABLE INSURANCE PRODUCTS TRUST
FINANCIAL HIGHLIGHTS
Franklin Mutual Shares VIP Fund(continued)
| | | | | | | | | | | | | | | | | | | | |
| | | | | | Year Ended December 31, | | | | |
| | | 2019 | | | 2018 | | | 2017 | | | 2016 | | | 2015 | |
| | | | | |
Class 2 | | | | | | | | | | | | | | | | | | | | |
| | | | | |
Per share operating performance (for a share outstanding throughout the year) | | | | | | | | | | | | | | | | | | | | |
| | | | | |
Net asset value, beginning of year | | | $17.40 | | | | $20.36 | | | | $20.08 | | | | $19.20 | | | | $22.60 | |
| | | | | |
Income from investment operationsa: | | | | | | | | | | | | | | | | | | | | |
| | | | | |
Net investment incomeb | | | 0.40 | | | | 0.31 | | | | 0.43 | | | | 0.45 | | | | 0.38 | |
| | | | | |
Net realized and unrealized gains (losses) | | | 3.32 | | | | (2.00 | ) | | | 1.20 | | | | 2.52 | | | | (1.51 | ) |
| | | | | |
Total from investment operations | | | 3.72 | | | | (1.69 | ) | | | 1.63 | | | | 2.97 | | | | (1.13 | ) |
| | | | | |
Less distributions from: | | | | | | | | | | | | | | | | | | | | |
| | | | | |
Net investment income | | | (0.36 | ) | | | (0.50 | ) | | | (0.48 | ) | | | (0.41 | ) | | | (0.71 | ) |
| | | | | |
Net realized gains | | | (1.95 | ) | | | (0.77 | ) | | | (0.87 | ) | | | (1.68 | ) | | | (1.56 | ) |
| | | | | |
Total distributions | | | (2.31 | ) | | | (1.27 | ) | | | (1.35 | ) | | | (2.09 | ) | | | (2.27 | ) |
| | | | | |
Net asset value, end of year | | | $18.81 | | | | $17.40 | | | | $20.36 | | | | $20.08 | | | | $19.20 | |
| | | | | |
Total returnc | | | 22.57% | | | | (9.07)% | | | | 8.35% | | | | 16.06% | | | | (4.94)% | |
| | | | | |
Ratios to average net assets | | | | | | | | | | | | | | | | | | | | |
| | | | | |
Expensesd,e | | | 0.96% | | | | 0.96% | | | | 0.97% | | | | 0.97% | | | | 0.98% | |
| | | | | |
Expenses incurred in connection with securities sold short | | | 0.02% | | | | 0.01% | | | | —% | | | | 0.01% | | | | 0.02% | |
| | | | | |
Net investment income | | | 2.10% | | | | 1.52% | | | | 2.09% | | | | 2.32% | | | | 1.75% | |
| | | | | |
Supplemental data | | | | | | | | | | | | | | | | | | | | |
| | | | | |
Net assets, end of year (000’s) | | | $2,931,753 | | | | $2,516,834 | | | | $3,476,913 | | | | $3,621,358 | | | | $3,353,505 | |
| | | | | |
Portfolio turnover rate | | | 38.50% | | | | 24.67% | | | | 18.32% | | | | 24.45% | | | | 19.88% | |
aThe amount shown for a share outstanding throughout the period may not correlate with the Statement of Operations for the period due to the timing of sales and repurchases of the Fund’s shares in relation to income earned and/or fluctuating fair value of the investments of the Fund.
bBased on average daily shares outstanding.
cTotal return does not include fees, charges or expenses imposed by the variable annuity and life insurance contracts for which Franklin Templeton Variable Insurance Products Trust serves as an underlying investment vehicle.
dIncludes dividend and/or interest expense on securities sold short and security borrowing fees, if any. See below for the ratios of such expenses to average net assets for the periods presented. See Note 1(e).
eBenefit of waiver and payments by affiliates and expense reduction rounds to less than 0.01%.
| | | | |
| | | |
| | The accompanying notes are an integral part of these financial statements. | Annual Report | | MS-9 |
FRANKLIN TEMPLETON VARIABLE INSURANCE PRODUCTS TRUST
FINANCIAL HIGHLIGHTS
Franklin Mutual Shares VIP Fund(continued)
| | | | | | | | | | | | | | | | | | | | |
| | | | | | Year Ended December 31, | | | | |
| | | 2019 | | | 2018 | | | 2017 | | | 2016 | | | 2015 | |
| | | | | |
Class 4 | | | | | | | | | | | | | | | | | | | | |
| | | | | |
Per share operating performance | | | | | | | | | | | | | | | | | | | | |
(for a share outstanding throughout the year) | | | | | | | | | | | | | | | | | | | | |
| | | | | |
Net asset value, beginning of year | | | $17.55 | | | | $20.53 | | | | $20.23 | | | | $19.32 | | | | $22.72 | |
| | | | | |
Income from investment operationsa: | | | | | | | | | | | | | | | | | | | | |
| | | | | |
Net investment incomeb | | | 0.38 | | | | 0.29 | | | | 0.41 | | | | 0.44 | | | | 0.36 | |
| | | | | |
Net realized and unrealized gains (losses) | | | 3.36 | | | | (2.02 | ) | | | 1.21 | | | | 2.53 | | | | (1.52 | ) |
| | | | | |
Total from investment operations | | | 3.74 | | | | (1.73 | ) | | | 1.62 | | | | 2.97 | | | | (1.16 | ) |
| | | | | |
Less distributions from: | | | | | | | | | | | | | | | | | | | | |
| | | | | |
Net investment income | | | (0.35 | ) | | | (0.48 | ) | | | (0.45 | ) | | | (0.38 | ) | | | (0.68 | ) |
| | | | | |
Net realized gains | | | (1.95 | ) | | | (0.77 | ) | | | (0.87 | ) | | | (1.68 | ) | | | (1.56 | ) |
| | | | | |
Total distributions | | | (2.30 | ) | | | (1.25 | ) | | | (1.32 | ) | | | (2.06 | ) | | | (2.24 | ) |
| | | | | |
Net asset value, end of year | | | $18.99 | | | | $17.55 | | | | $20.53 | | | | $20.23 | | | | $19.32 | |
| | | | | |
Total returnc | | | 22.44% | | | | (9.16)% | | | | 8.25% | | | | 15.94% | | | | (5.05)% | |
| | | | | |
Ratios to average net assets | | | | | | | | | | | | | | | | | | | | |
| | | | | |
Expensesd,e | | | 1.06% | | | | 1.06% | | | | 1.07% | | | | 1.07% | | | | 1.08% | |
| | | | | |
Expenses incurred in connection with securities sold short | | | 0.02% | | | | 0.01% | | | | —% | | | | 0.01% | | | | 0.02% | |
| | | | | |
Net investment income | | | 2.00% | | | | 1.42% | | | | 1.99% | | | | 2.22% | | | | 1.65% | |
| | | | | |
Supplemental data | | | | | | | | | | | | | | | | | | | | |
| | | | | |
Net assets, end of year (000’s) | | | $120,345 | | | | $105,047 | | | | $122,942 | | | | $122,476 | | | | $130,978 | |
| | | | | |
Portfolio turnover rate | | | 38.50% | | | | 24.67% | | | | 18.32% | | | | 24.45% | | | | 19.88% | |
aThe amount shown for a share outstanding throughout the period may not correlate with the Statement of Operations for the period due to the timing of sales and repurchases of the Fund’s shares in relation to income earned and/or fluctuating fair value of the investments of the Fund.
bBased on average daily shares outstanding.
cTotal return does not include fees, charges or expenses imposed by the variable annuity and life insurance contracts for which Franklin Templeton Variable Insurance Products Trust serves as an underlying investment vehicle.
dIncludes dividend and/or interest expense on securities sold short and security borrowing fees, if any. See below for the ratios of such expenses to average net assets for the periods presented. See Note 1(e).
eBenefit of waiver and payments by affiliates and expense reduction rounds to less than 0.01%.
| | | | |
| | | |
MS-10 | | Annual Report | The accompanying notes are an integral part of these financial statements. | | |
FRANKLIN TEMPLETON VARIABLE INSURANCE PRODUCTS TRUST
Statement of Investments, December 31, 2019
Franklin Mutual Shares VIP Fund
| | | | | | | | | | |
| | | Country | | Shares/
Rights/
Units/
Warrants | | | Value | |
| | | |
Common Stocks and Other Equity Interests 90.4% | | | | | | | | | | |
Aerospace & Defense 2.2% | | | | | | | | | | |
BAE Systems PLC | | United Kingdom | | | 4,356,429 | | | $ | 32,588,239 | |
Huntington Ingalls Industries Inc. | | United States | | | 152,745 | | | | 38,320,665 | |
| | | | | | | | | | |
| | | |
| | | | | | | | | 70,908,904 | |
| | | | | | | | | | |
Auto Components 0.0%† | | | | | | | | | | |
| | | |
a,b,c International Automotive Components Group Brazil LLC | | Brazil | | | 1,730,515 | | | | 62,818 | |
| | | | | | | | | | |
Automobiles 1.2% | | | | | | | | | | |
| | | |
General Motors Co. | | United States | | | 1,031,445 | | | | 37,750,887 | |
| | | | | | | | | | |
Banks 9.7% | | | | | | | | | | |
| | | |
Cadence Bancorp | | United States | | | 423,846 | | | | 7,684,328 | |
| | | |
CIT Group Inc. | | United States | | | 600,346 | | | | 27,393,788 | |
| | | |
Citigroup Inc. | | United States | | | 870,481 | | | | 69,542,727 | |
| | | |
Citizens Financial Group Inc. | | United States | | | 1,204,366 | | | | 48,909,303 | |
| | | |
JPMorgan Chase & Co. | | United States | | | 517,782 | | | | 72,178,811 | |
| | | |
Synovus Financial Corp. | | United States | | | 498,092 | | | | 19,525,207 | |
| | | |
Wells Fargo & Co. | | United States | | | 1,234,125 | | | | 66,395,925 | |
| | | | | | | | | | |
| | | |
| | | | | | | | | 311,630,089 | |
| | | | | | | | | | |
Building Products 1.1% | | | | | | | | | | |
Johnson Controls International PLC | | United States | | | 869,230 | | | | 35,386,353 | |
| | | | | | | | | | |
Communications Equipment 0.8% | | | | | | | | | | |
Cisco Systems Inc. | | United States | | | 551,664 | | | | 26,457,805 | |
| | | | | | | | | | |
Consumer Finance 1.5% | | | | | | | | | | |
Capital One Financial Corp. | | United States | | | 476,337 | | | | 49,019,841 | |
| | | | | | | | | | |
Containers & Packaging 1.7% | | | | | | | | | | |
International Paper Co. | | United States | | | 901,475 | | | | 41,512,924 | |
WestRock Co. | | United States | | | 268,071 | | | | 11,502,926 | |
| | | | | | | | | | |
| | | |
| | | | | | | | | 53,015,850 | |
| | | | | | | | | | |
Diversified Financial Services 1.4% | | | | | | | | | | |
Voya Financial Inc. | | United States | | | 758,210 | | | | 46,235,646 | |
| | | | | | | | | | |
Diversified Telecommunication Services 0.6% | | | | | | | | | | |
Koninklijke KPN NV | | Netherlands | | | 7,044,218 | | | | 20,784,212 | |
| | | | | | | | | | |
Electrical Equipment 1.8% | | | | | | | | | | |
aSensata Technologies Holding PLC | | United States | | | 1,052,926 | | | | 56,721,124 | |
| | | | | | | | | | |
Electronic Equipment, Instruments & Components 1.0% | | | | | | | | | | |
| | | |
Corning Inc. | | United States | | | 1,131,869 | | | | 32,948,707 | |
| | | | | | | | | | |
Energy Equipment & Services 1.6% | | | | | | | | | | |
| | | |
Baker Hughes Co., A | | United States | | | 663,295 | | | | 17,000,251 | |
Schlumberger Ltd. | | United States | | | 893,500 | | | | 35,918,700 | |
| | | | | | | | | | |
| | | |
| | | | | | | | | 52,918,951 | |
| | | | | | | | | | |
Entertainment 2.2% | | | | | | | | | | |
| | | |
The Walt Disney Co. | | United States | | | 482,642 | | | | 69,804,512 | |
| | | | | | | | | | |
FRANKLIN TEMPLETON VARIABLE INSURANCE PRODUCTS TRUST
STATEMENT OF INVESTMENTS
Franklin Mutual Shares VIP Fund(continued)
| | | | | | | | | | |
| | | Country | | Shares/
Rights/
Units/
Warrants | | | Value | |
| | | |
Common Stocks and Other Equity Interests(continued) | | | | | | | | | | |
| | | |
Equity Real Estate Investment Trusts (REITs) 1.4% | | | | | | | | | | |
| | | |
Alexander’s Inc. | | United States | | | 31,168 | | | $ | 10,296,349 | |
| | | |
Vornado Realty Trust | | United States | | | 496,915 | | | | 33,044,847 | |
| | | | | | | | | | |
| | | |
| | | | | | | | | 43,341,196 | |
| | | | | | | | | | |
Food & Staples Retailing 2.7% | | | | | | | | | | |
| | | |
The Kroger Co. | | United States | | | 1,747,360 | | | | 50,655,966 | |
| | | |
Walgreens Boots Alliance Inc. | | United States | | | 595,730 | | | | 35,124,241 | |
| | | | | | | | | | |
| | | |
| | | | | | | | | 85,780,207 | |
| | | | | | | | | | |
Food Products 3.0% | | | | | | | | | | |
| | | |
Archer-Daniels-Midland Co. | | United States | | | 657,200 | | | | 30,461,220 | |
| | | |
Conagra Brands Inc. | | United States | | | 382,465 | | | | 13,095,602 | |
| | | |
The Kraft Heinz Co. | | United States | | | 1,686,635 | | | | 54,191,582 | |
| | | | | | | | | | |
| | | |
| | | | | | | | | 97,748,404 | |
| | | | | | | | | | |
Health Care Equipment & Supplies 3.1% | | | | | | | | | | |
| | | |
Medtronic PLC | | United States | | | 871,507 | | | | 98,872,469 | |
| | | | | | | | | | |
Health Care Providers & Services 1.7% | | | | | | | | | | |
| | | |
CVS Health Corp. | | United States | | | 731,362 | | | | 54,332,883 | |
| | | | | | | | | | |
Household Durables 3.0% | | | | | | | | | | |
| | | |
Lennar Corp., A | | United States | | | 570,094 | | | | 31,805,544 | |
| | | |
Newell Brands Inc. | | United States | | | 2,394,574 | | | | 46,023,713 | |
| | | |
Toll Brothers Inc. | | United States | | | 460,200 | | | | 18,182,502 | |
| | | | | | | | | | |
| | | |
| | | | | | | | | 96,011,759 | |
| | | | | | | | | | |
Household Products 0.7% | | | | | | | | | | |
| | | |
Energizer Holdings Inc. | | United States | | | 428,700 | | | | 21,529,314 | |
| | | | | | | | | | |
Independent Power & Renewable Electricity Producers 0.1% | | | | | | | | | | |
| | | |
Vistra Energy Corp. | | United States | | | 170,478 | | | | 3,919,289 | |
| | | | | | | | | | |
Industrial Conglomerates 1.1% | | | | | | | | | | |
| | | |
General Electric Co. | | United States | | | 3,184,898 | | | | 35,543,462 | |
| | | | | | | | | | |
Insurance 8.2% | | | | | | | | | | |
| | | |
aAlleghany Corp. | | United States | | | 91,903 | | | | 73,482,882 | |
| | | |
American International Group Inc. | | United States | | | 1,371,086 | | | | 70,377,845 | |
| | | |
Chubb Ltd. | | United States | | | 46,099 | | | | 7,175,770 | |
| | | |
Everest Re Group Ltd. | | United States | | | 116,329 | | | | 32,204,520 | |
| | | |
The Hartford Financial Services Group Inc. | | United States | | | 904,974 | | | | 54,995,270 | |
| | | |
MetLife Inc. | | United States | | | 506,303 | | | | 25,806,264 | |
| | | | | | | | | | |
| | | |
| | | | | | | | | 264,042,551 | |
| | | | | | | | | | |
IT Services 1.6% | | | | | | | | | | |
| | | |
Cognizant Technology Solutions Corp., A | | United States | | | 804,421 | | | | 49,890,190 | |
| | | | | | | | | | |
Machinery 0.8% | | | | | | | | | | |
| | | |
CNH Industrial NV | | United Kingdom | | | 605,230 | | | | 6,644,817 | |
| | | |
CNH Industrial NV, special voting. | | United Kingdom | | | 1,844,814 | | | | 20,254,205 | |
| | | | | | | | | | |
| | | |
| | | | | | | | | 26,899,022 | |
| | | | | | | | | | |
FRANKLIN TEMPLETON VARIABLE INSURANCE PRODUCTS TRUST
STATEMENT OF INVESTMENTS
Franklin Mutual Shares VIP Fund(continued)
| | | | | | | | | | |
| | | Country | | Shares/
Rights/
Units/
Warrants | | | Value | |
| | | |
Common Stocks and Other Equity Interests(continued) | | | | | | | | | | |
| | | |
Media 6.3% | | | | | | | | | | |
| | | |
aCharter Communications Inc., A | | United States | | | 153,748 | | | $ | 74,580,080 | |
| | | |
Comcast Corp., A | | United States | | | 1,246,110 | | | | 56,037,567 | |
| | | |
aDiscovery Inc., C | | United States | | | 1,152,073 | | | | 35,126,706 | |
| | | |
aDISH Network Corp., A | | United States | | | 696,483 | | | | 24,704,252 | |
| | | |
aiHeartMedia Inc., A | | United States | | | 717,645 | | | | 12,128,200 | |
| | | |
a,biHeartMedia Inc., B | | United States | | | 12,783 | | | | 183,628 | |
| | | | | | | | | | |
| | | |
| | | | | | | | | 202,760,433 | |
| | | | | | | | | | |
Oil, Gas & Consumable Fuels 7.7% | | | | | | | | | | |
| | | |
BP PLC | | United Kingdom | | | 7,231,237 | | | | 45,167,074 | |
| | | |
Kinder Morgan Inc. | | United States | | | 2,748,517 | | | | 58,186,105 | |
| | | |
Marathon Oil Corp. | | United States | | | 2,662,301 | | | | 36,154,048 | |
| | | |
Occidental Petroleum Corp. | | United States | | | 508,819 | | | | 20,968,431 | |
| | | |
Plains All American Pipeline LP | | United States | | | 930,400 | | | | 17,110,056 | |
| | | |
Royal Dutch Shell PLC, A (EUR Traded) | | United Kingdom | | | 409,528 | | | | 12,016,673 | |
| | | |
Royal Dutch Shell PLC, A (GBP Traded) | | United Kingdom | | | 696,358 | | | | 20,613,211 | |
| | | |
The Williams Cos. Inc. | | United States | | | 1,534,284 | | | | 36,393,216 | |
| | | | | | | | | | |
| | | |
| | | | | | | | | 246,608,814 | |
| | | | | | | | | | |
Pharmaceuticals 9.9% | | | | | | | | | | |
| | | |
Allergan PLC | | United States | | | 187,800 | | | | 35,901,726 | |
| | | |
aBristol-Myers Squibb Co., rts., 2/01/49 | | United States | | | 401,188 | | | | 1,207,576 | |
| | | |
Eli Lilly & Co. | | United States | | | 500,301 | | | | 65,754,561 | |
| | | |
GlaxoSmithKline PLC | | United Kingdom | | | 3,070,511 | | | | 72,347,273 | |
| | | |
Merck & Co. Inc. | | United States | | | 456,132 | | | | 41,485,205 | |
| | | |
Novartis AG, ADR | | Switzerland | | | 808,869 | | | | 76,591,806 | |
| | | |
Perrigo Co. PLC | | United States | | | 446,400 | | | | 23,061,024 | |
| | | | | | | | | | |
| | | |
| | | | | | | | | 316,349,171 | |
| | | | | | | | | | |
Software 3.1% | | | | | | | | | | |
| | | |
aAvaya Holdings Corp. | | United States | | | 116 | | | | 1,566 | |
| | | |
aAvaya Holdings Corp., wts., 12/15/22 | | United States | | | 91,551 | | | | 109,861 | |
| | | |
NortonLifeLock Inc. | | United States | | | 2,284,561 | | | | 58,301,997 | |
| | | |
Oracle Corp. | | United States | | | 756,881 | | | | 40,099,555 | |
| | | | | | | | | | |
| | | |
| | | | | | | | | 98,512,979 | |
| | | | | | | | | | |
Specialty Retail 0.2% | | | | | | | | | | |
| | | |
a,bTRU Kids Parent LLC | | United States | | | 2,040 | | | | 7,609,922 | |
| | | |
a,bWayne Services Legacy Inc. | | United States | | | 2,039 | | | | — | |
| | | | | | | | | | |
| | | |
| | | | | | | | | 7,609,922 | |
| | | | | | | | | | |
Technology Hardware, Storage & Peripherals 4.3% | | | | | | | | | | |
| | | |
Hewlett Packard Enterprise Co. | | United States | | | 2,038,215 | | | | 32,326,090 | |
| | | |
Samsung Electronics Co. Ltd. | | South Korea | | | 1,327,497 | | | | 64,078,697 | |
| | | |
Western Digital Corp. | | United States | | | 644,800 | | | | 40,925,456 | |
| | | | | | | | | | |
| | | |
| | | | | | | | | 137,330,243 | |
| | | | | | | | | | |
FRANKLIN TEMPLETON VARIABLE INSURANCE PRODUCTS TRUST
STATEMENT OF INVESTMENTS
Franklin Mutual Shares VIP Fund(continued)
| | | | | | | | | | |
| | | Country | | Shares/
Rights/
Units/
Warrants | | | Value | |
| | | |
Common Stocks and Other Equity Interests(continued) | | | | | | | | | | |
| | | |
Textiles, Apparel & Luxury Goods 1.2% | | | | | | | | | | |
PVH Corp. | | United States | | | 364,405 | | | $ | 38,317,186 | |
| | | | | | | | | | |
| | | |
Tobacco 3.1% | | | | | | | | | | |
Altria Group Inc. | | United States | | | 570,425 | | | | 28,469,912 | |
British American Tobacco PLC | | United Kingdom | | | 1,052,864 | | | | 45,062,159 | |
British American Tobacco PLC, ADR | | United Kingdom | | | 372,933 | | | | 15,834,735 | |
Imperial Brands PLC | | United Kingdom | | | 393,858 | | | | 9,749,549 | |
| | | | | | | | | | |
| | | |
| | | | | | | | | 99,116,355 | |
| | | | | | | | | | |
| | | |
Wireless Telecommunication Services 0.4% | | | | | | | | | | |
| | | |
Vodafone Group PLC | | United Kingdom | | | 7,301,663 | | | | 14,192,701 | |
| | | | | | | | | | |
| | | |
Total Common Stocks and Other Equity Interests (Cost $2,059,518,038) | | | | | | | | | 2,902,354,249 | |
| | | | | | | | | | |
| | | |
| | | | | Principal
Amount | | | | |
| | | |
Corporate Notes and Senior Floating Rate Interests 3.8% | | | | | | | | | | |
dBanff Merger Sub Inc., senior note, 144A, 9.75%, 9/01/26
| | United States | | $ | 18,444,000 | | | | 18,721,121 | |
Frontier Communications Corp., | | | | | | | | | | |
senior note, 10.50%, 9/15/22 | | United States | | | 22,633,000 | | | | 11,097,232 | |
senior note, 11.00%, 9/15/25 | | United States | | | 25,535,000 | | | | 12,448,313 | |
dsenior secured note, first lien, 144A, 8.00%, 4/01/27 | | United States | | | 6,148,000 | | | | 6,436,034 | |
eVeritas U.S. Inc. | | | | | | | | | | |
Term Loan B1, 6.299%,(1-month USD LIBOR + 4.50%), 1/27/23 | | United States | | | 14,532,614 | | | | 14,048,198 | |
Term Loan B1, 6.445%,(3-month USD LIBOR + 4.50%), 1/27/23 | | United States | | | 2,791,821 | | | | 2,698,761 | |
dVeritas U.S. Inc./Veritas Bermuda Ltd., | | | | | | | | | | |
senior note, 144A, 7.50%, 2/01/23 | | United States | | | 2,856,000 | | | | 2,857,185 | |
senior note, 144A, 10.50%, 2/01/24 | | United States | | | 23,445,000 | | | | 21,754,967 | |
eWindstream Services LLC, | | | | | | | | | | |
fRevolving Commitment, 7.75%, (Prime + 3.00%), 4/24/20 | | United States | | | 26,279,371 | | | | 24,636,911 | |
Term Loan B6, 9.75%, (Prime + 5.00%), 3/30/21 | | United States | | | 6,671,000 | | | | 6,400,584 | |
| | | | | | | | | | |
| | |
Total Corporate Notes and Senior Floating Rate Interests (Cost $141,734,288) | | | | | | | 121,099,306 | |
| | | | | | | | | | |
| | | |
Corporate Notes in Reorganization (Cost $9,381,238) 0.0%† | | | | | | | | | | |
d,gMcDermott Technology Americas Inc., senior note, 144A, 10.625%, 5/01/24 | | United States | | | 9,797,000 | | | | 860,274 | |
| | | | | | | | | | |
| | | |
| | | | | Shares | | | | |
| | | |
Companies in Liquidation 0.0%† | | | | | | | | | | |
a,b,hClear Channel Communications Inc., Contingent Distribution | | United States | | | 26,449,000 | | | | — | |
a,b,hiHeartCommunications Inc., Contingent Distribution | | United States | | | 45,914,872 | | | | — | |
a,b,hTribune Media, Litigation Trust, Contingent Distribution | | United States | | | 395,935 | | | | — | |
a,b,hVistra Energy Corp., Litigation Trust, Contingent Distribution | | United States | | | 90,618,405 | | | | 49,840 | |
FRANKLIN TEMPLETON VARIABLE INSURANCE PRODUCTS TRUST
STATEMENT OF INVESTMENTS
Franklin Mutual Shares VIP Fund(continued)
| | | | | | | | | | | | |
| | | Country | | | Shares | | | Value | |
| |
| | | |
Companies in Liquidation(continued) | | | | | | | | | | | | |
a,b,hWalter Energy Inc., Litigation Trust, Contingent Distribution | | | United States | | | | 6,301,000 | | | $ | — | |
| | | | | | | | | | | | |
| | | |
Total Companies in Liquidation (Cost $2,834,274) | | | | | | | | | | | 49,840 | |
| | | | | | | | | | | | |
| | | |
Total Investments before Short Term Investments
(Cost $2,213,467,838) | | | | | | | | | | | 3,024,363,669 | |
| | | | | | | | | | | | |
| | | |
| | | | | | Principal
Amount | | | | |
| | | |
Short Term Investments 5.9% | | | | | | | | | | | | |
| | | |
U.S. Government and Agency Securities 5.9% | | | | | | | | | | | | |
iFHLB, 1/02/20 | | | United States | | | $ | 48,900,000 | | | | 48,900,000 | |
iU.S. Treasury Bill, | | | | | | | | | | | | |
j3/05/20 - 3/19/20 | | | United States | | | | 35,500,000 | | | | 35,398,533 | |
1/02/20 - 6/25/20 | | | United States | | | | 105,000,000 | | | | 104,631,101 | |
| | | | | | | | | | | | |
| | | |
Total U.S. Government and Agency Securities
(Cost $188,860,811) | | | | | | | | | | | 188,929,634 | |
| | | | | | | | | | | | |
| | | |
Total Investments (Cost $2,402,328,649) 100.1% | | | | | | | | | | | 3,213,293,303 | |
| | | |
Securities Sold Short (0.4)% | | | | | | | | | | | (14,400,942 | ) |
| | | |
Other Assets, less Liabilities 0.3%. | | | | | | | | | | | 11,637,020 | |
| | | | | | | | | | | | |
| | | |
Net Assets 100.0% | | | | | | | | | | $ | 3,210,529,381 | |
| | | | | | | | | | | | |
| | | |
| | | | | | Shares | | | | |
| | | |
kSecurities Sold Short (Proceeds $12,428,238) (0.4)% | | | | | | | | | | | | |
Common Stocks (0.4)% | | | | | | | | | | | | |
Biotechnology (0.4)% | | | | | | | | | | | | |
AbbVie Inc. | | | United States | | | | 162,649 | | | | (14,400,942 | ) |
| | | | | | | | | | | | |
†Rounds to less than 0.1% of net assets.
aNon-income producing.
bFair valued using significant unobservable inputs. See Note 11 regarding fair value measurements.
cSee Note 8 regarding restricted securities.
dSecurity was purchased pursuant to Rule 144A under the Securities Act of 1933 and may be sold in transactions exempt from registration only to qualified institutional buyers or in a public offering registered under the Securities Act of 1933. At December 31, 2019, the aggregate value of these securities was $50,629,581, representing 1.6% of net assets.
eSee Note 1(g) regarding senior floating rate interests.
fA portion or all of the security purchased on a delayed delivery basis. See Note 1(c).
gSee Note 7 regarding credit risk and defaulted securities.
hContingent distributions represent the right to receive additional distributions, if any, during the reorganization of the underlying company. Shares represent total underlying principal of debt securities.
iThe security was issued on a discount basis with no stated coupon rate.
jA portion or all of the security has been segregated as collateral for securities sold short and open forward exchange contracts. At December 31, 2019, the aggregate value of these securities pledged amounted to $9,086,774, representing 0.3% of net assets.
kSee Note 1(e) regarding securities sold short.
FRANKLIN TEMPLETON VARIABLE INSURANCE PRODUCTS TRUST
STATEMENT OF INVESTMENTS
Franklin Mutual Shares VIP Fund(continued)
At December 31, 2019, the Fund had the following futures contracts outstanding. See Note 1(d).
Futures Contracts
| | | | | | | | | | | | | | | | | | | | |
| Description | | | Type | | |
| Number of
Contracts |
| |
| Notional
Amount |
* | |
| Expiration
Date |
| |
| Value/
Unrealized
Appreciation
(Depreciation) |
|
| |
| | | | | |
Currency Contracts | | | | | | | | | | | | | | | | | | | | |
EUR/USD | | | Short | | | | 211 | | | | $29,756,275 | | | | 3/16/20 | | | | $(285,724 | ) |
GBP/USD | | | Short | | | | 675 | | | | 56,075,625 | | | | 3/16/20 | | | | (434,543 | ) |
| | | | | | | | | | | | | | | | | | | | |
| | | | | |
Total Futures Contracts | | | | | | | | | | | | | | | | | | | $(720,267 | ) |
| | | | | | | | | | | | | | | | | | | | |
*As of period end.
At December 31, 2019, the Fund had the following forward exchange contracts outstanding. See Note 1(d).
Forward Exchange Contracts
| | | | | | | | | | | | | | | | | | | | | | | | |
| | | | | | | | | | Contract | | | Settlement | | | Unrealized | | | Unrealized | |
| Currency | | Counterpartya | | Type | | Quantity | | | Amount | | | Date | | �� | Appreciation | | | Depreciation | |
| |
| | | | | | | |
OTC Forward Exchange Contracts | | | | | | | | | | | | | | | | | | | | | | | | |
| | | | | | | |
Euro | | BOFA | | Buy | | | 2,357,999 | | | $ | 2,634,337 | | | | 1/15/20 | | | $ | 12,587 | | | $ | — | |
| | | | | | | |
Euro | | BOFA | | Sell | | | 23,751,736 | | | | 26,419,769 | | | | 1/15/20 | | | | — | | | | (242,255 | ) |
| | | | | | | |
Euro | | HSBK | | Buy | | | 265,000 | | | | 297,743 | | | | 1/15/20 | | | | — | | | | (273 | ) |
| | | | | | | |
Euro | | HSBK | | Buy | | | 2,309,661 | | | | 2,567,345 | | | | 1/15/20 | | | | 25,317 | | | | — | |
| | | | | | | |
British Pound | | BOFA | | Buy | | | 2,654,040 | | | | 3,440,886 | | | | 1/16/20 | | | | 75,929 | | | | — | |
| | | | | | | |
British Pound | | BOFA | | Sell | | | 1,148,314 | | | | 1,502,132 | | | | 1/16/20 | | | | — | | | | (19,476 | ) |
| | | | | | | |
British Pound | | HSBK | | Sell | | | 23,503,287 | | | | 30,378,116 | | | | 1/16/20 | | | | — | | | | (765,611 | ) |
| | | | | | | |
South Korean Won | | HSBK | | Sell | | | 45,586,583,448 | | | | 38,567,286 | | | | 1/17/20 | | | | — | | | | (881,159 | ) |
| | | | | | | |
South Korean Won | | UBSW | | Sell | | | 28,177,114,854 | | | | 23,792,210 | | | | 1/17/20 | | | | — | | | | (590,915 | ) |
| | | | | | | | | |
| | | | | | |
Total Forward Exchange Contracts | | | | | | | | | | | | | | | | $ | 113,833 | | | $ | (2,499,689 | ) |
| | | | | | | | | |
| | | | | | |
Net unrealized appreciation (depreciation) | | | | | | | | | | | | | | | | | | | | $ | (2,385,856 | ) |
| | | | | | | | | | | | | |
aMay be comprised of multiple contracts with the same counterparty, currency and settlement date.
See Note 9 regarding other derivative information.
See Abbreviations on pageMS-31.
| | | | |
| | | |
MS-16 | | Annual Report | The accompanying notes are an integral part of these financial statements. | | |
FRANKLIN TEMPLETON VARIABLE INSURANCE PRODUCTS TRUST
FINANCIAL STATEMENTS
Statement of Assets and Liabilities
December 31, 2019
| | | | |
| | | Franklin Mutual
Shares VIP Fund | |
| |
| |
Assets: | | | | |
Investments in securities: | | | | |
Cost - Unaffiliated issuers | | | $2,402,328,649 | |
| | | | |
Value - Unaffiliated issuers | | | $3,213,293,303 | |
Cash | | | 377,832 | |
Foreign currency, at value (cost $389,179) | | | 396,623 | |
Receivables: | | | | |
Investment securities sold | | | 4,917,521 | |
Capital shares sold | | | 76,963 | |
Dividends and interest | | | 10,432,193 | |
European Union tax reclaims | | | 1,795,174 | |
Deposits with brokers for: | | | | |
Securities sold short | | | 14,698,388 | |
Futures contracts | | | 2,116,140 | |
Unrealized appreciation on OTC forward exchange contracts | | | 113,833 | |
Other assets | | | 847,490 | |
| | | | |
| |
Total assets | | | 3,249,065,460 | |
| | | | |
| |
Liabilities: | | | | |
Payables: | | | | |
Investment securities purchased | | | 16,568,985 | |
Capital shares redeemed | | | 1,332,326 | |
Management fees | | | 1,823,724 | |
Distribution fees | | | 652,012 | |
Variation margin on futures contracts | | | 695,853 | |
Securities sold short, at value (proceeds $12,428,238) | | | 14,400,942 | |
Unrealized depreciation on OTC forward exchange contracts | | | 2,499,689 | |
Accrued expenses and other liabilities | | | 562,548 | |
| | | | |
| |
Total liabilities | | | 38,536,079 | |
| | | | |
| |
Net assets, at value | | | $3,210,529,381 | |
| | | | |
| |
Net assets consist of: | | | | |
Paid-in capital | | | $2,261,034,664 | |
Total distributable earnings (losses) | | | 949,494,717 | |
| | | | |
| |
Net assets, at value | | | $3,210,529,381 | |
| | | | |
| |
Class 1: | | | | |
Net assets, at value | | | $ 158,431,333 | |
| | | | |
Shares outstanding | | | 8,256,970 | |
| | | | |
Net asset value and maximum offering price per share | | | $19.19 | |
| | | | |
| |
Class 2: | | | | |
Net assets, at value | | | $2,931,752,809 | |
| | | | |
Shares outstanding | | | 155,882,081 | |
| | | | |
Net asset value and maximum offering price per share | | | $18.81 | |
| | | | |
| |
Class 4: | | | | |
Net assets, at value | | | $ 120,345,239 | |
| | | | |
Shares outstanding | | | 6,337,390 | |
| | | | |
Net asset value and maximum offering price per share | | | $18.99 | |
| | | | |
| | | | |
| | | |
| | The accompanying notes are an integral part of these financial statements. | Annual Report | | MS-17 |
FRANKLIN TEMPLETON VARIABLE INSURANCE PRODUCTS TRUST
FINANCIAL STATEMENTS
Statement of Operations
for the year ended December 31, 2019
| | | | |
| | | Franklin Mutual
Shares VIP Fund | |
| |
| |
Investment income: | | | | |
Dividends: (net of foreign taxes)* | | | | |
Unaffiliated issuers | | | $ 79,438,336 | |
Interest: | | | | |
Unaffiliated issuers | | | 21,341,565 | |
Income from securities loaned: | | | | |
Unaffiliated issuers (net of fees and rebates) | | | 253,088 | |
Non-controlled affiliates (Note 3e) | | | 47,926 | |
Other income (Note 1h) | | | 223,118 | |
| | | | |
| |
Total investment income | | | 101,304,033 | |
| | | | |
| |
Expenses: | | | | |
Management fees (Note 3a) | | | 22,367,019 | |
Distribution fees: (Note 3c) | | | | |
Class 2 | | | 7,049,418 | |
Class 4 | | | 402,943 | |
Custodian fees (Note 4) | | | 85,083 | |
Reports to shareholders | | | 485,988 | |
Professional feesa | | | (194,465 | ) |
Trustees’ fees and expenses | | | 19,788 | |
Dividends and interest on securities sold short | | | 569,637 | |
Other | | | 61,769 | |
| | | | |
Total expenses | | | 30,847,180 | |
Expense reductions (Note 4) | | | (17,169 | ) |
Expenses waived/paid by affiliates (Note 3e) | | | (8,871 | ) |
| | | | |
| |
Net expenses | | | 30,821,140 | |
| | | | |
| |
Net investment income | | | 70,482,893 | |
| | | | |
| |
Realized and unrealized gains (losses): | | | | |
Net realized gain (loss) from: | | | | |
Investments: | | | | |
Unaffiliated issuers | | | 95,233,800 | |
Realized gain distributions from REITs | | | 141,370 | |
Foreign currency transactions | | | 495,056 | |
Forward exchange contracts | | | 5,238,183 | |
Futures contracts | | | 1,329,818 | |
Securities sold short | | | (6,921,402 | ) |
| | | | |
| |
Net realized gain (loss) | | | 95,516,825 | |
| | | | |
| |
Net change in unrealized appreciation (depreciation) on: | | | | |
Investments: | | | | |
Unaffiliated issuers | | | 508,856,878 | |
Translation of other assets and liabilities denominated in foreign currencies | | | (20,880 | ) |
Forward exchange contracts | | | (1,434,738 | ) |
Futures contracts | | | (884,259 | ) |
Securities sold short | | | (8,907,834 | ) |
| | | | |
| |
Net change in unrealized appreciation (depreciation) | | | 497,609,167 | |
| | | | |
| |
Net realized and unrealized gain (loss) | | | 593,125,992 | |
| | | | |
| |
Net increase (decrease) in net assets resulting from operations | | | $663,608,885 | |
| | | | |
| | | | |
| | | |
MS-18 | | Annual Report | The accompanying notes are an integral part of these financial statements. | | |
FRANKLIN TEMPLETON VARIABLE INSURANCE PRODUCTS TRUST
FINANCIAL STATEMENTS
Statement of Operations(continued)
For the year ended December 31, 2019
| | | | |
| |
*Foreign taxes withheld on dividends | | $ | 1,359,043 | |
aIncludes unaffiliated reimbursement of legal fees incurred in connection with certain fund holdings.
| | | | |
| | | |
| | The accompanying notes are an integral part of these financial statements. | Annual Report | | MS-19 |
FRANKLIN TEMPLETON VARIABLE INSURANCE PRODUCTS TRUST
FINANCIAL STATEMENTS
Statements of Changes in Net Assets
| | | | | | | | |
| | | Franklin Mutual Shares VIP Fund | |
| |
| | | Year Ended December 31, | |
| | |
| | | 2019 | | | 2018 | |
| | |
Increase (decrease) in net assets: | | | | | | | | |
Operations: | | | | | | | | |
Net investment income | | | $ 70,482,893 | | | | $ 60,982,102 | |
Net realized gain (loss) | | | 95,516,825 | | | | 308,792,402 | |
Net change in unrealized appreciation (depreciation) | | | 497,609,167 | | | | (689,920,400 | ) |
| | | | |
| | |
Net increase (decrease) in net assets resulting from operations | | | 663,608,885 | | | | (320,145,896 | ) |
| | | | |
| | |
Distributions to shareholders: | | | | | | | | |
Class 1 | | | (35,828,591 | ) | | | (37,929,843 | ) |
Class 2 | | | (330,340,832 | ) | | | (194,310,469 | ) |
Class 4 | | | (13,089,406 | ) | | | (7,177,027 | ) |
| | | | |
| | |
Total distributions to shareholders | | | (379,258,829 | ) | | | (239,417,339 | ) |
| | | | |
| | |
Capital share transactions: (Note 2) | | | | | | | | |
Class 1 | | | (436,530,771 | ) | | | (27,996,947 | ) |
Class 2 | | | 198,182,849 | | | | (506,425,142 | ) |
Class 4 | | | 5,322,730 | | | | (365,846 | ) |
| | | | |
| | |
Total capital share transactions. | | | (233,025,192 | ) | | | (534,787,935 | ) |
| | | | |
| | |
Net increase (decrease) in net assets | | | 51,324,864 | | | | (1,094,351,170 | ) |
Net assets: | | | | | | | | |
Beginning of year | | | 3,159,204,517 | | | | 4,253,555,687 | |
| | | | |
| | |
End of year | | | $3,210,529,381 | | | | $3,159,204,517 | |
| | | | |
| | | | |
| | | |
MS-20 | | Annual Report | The accompanying notes are an integral part of these financial statements. | | |
FRANKLIN TEMPLETON VARIABLE INSURANCE PRODUCTS TRUST
Notes to Financial Statements
Franklin Mutual Shares VIP Fund
1. Organization and Significant Accounting Policies
Franklin Templeton Variable Insurance Products Trust (Trust) is registered under the Investment Company Act of 1940 (1940 Act) as anopen-end management investment company, consisting of eighteen separate funds and applies the specialized accounting and reporting guidance in U.S. Generally Accepted Accounting Principles (U.S. GAAP). Franklin Mutual Shares VIP Fund (Fund) is included in this report. Shares of the Fund are generally sold only to insurance company separate accounts to fund the benefits of variable life insurance policies or variable annuity contracts. The Fund offers three classes of shares: Class 1, Class 2 and Class 4. Each class of shares may differ by its distribution fees, voting rights on matters affecting a single class and its exchange privilege.
The following summarizes the Fund’s significant accounting policies.
a. Financial Instrument Valuation
The Fund’s investments in financial instruments are carried at fair value daily. Fair value is the price that would be received to sell an asset or paid to transfer a liability in an orderly transaction between market participants on the measurement date. The Fund calculates the net asset value (NAV) per share each business day as of 4 p.m. Eastern time or the regularly scheduled close of the New York Stock Exchange (NYSE), whichever is earlier. Under compliance policies and procedures approved by the Trust’s Board of Trustees (the Board), the Fund’s administrator has responsibility for oversight of valuation, including leading the cross-functional Valuation Committee (VC). The Fund may utilize independent pricing services, quotations from securities and financial instrument dealers, and other market sources to determine fair value.
Equity securities and derivative financial instruments listed on an exchange or on the NASDAQ National Market System are valued at the last quoted sale price or the official closing price of the day, respectively. Foreign equity securities are valued as of the close of trading on the foreign stock exchange on which the security is primarily traded, or as of 4 p.m. Eastern time. The value is then converted into its U.S. dollar equivalent at the foreign exchange rate in effect at 4 p.m. Eastern time on the day that the value of the security is determined.Over-the-counter (OTC) securities are valued within the range of the most recent quoted bid and ask prices. Securities that trade in multiple markets or on multiple
exchanges are valued according to the broadest and most representative market. Certain equity securities are valued based upon fundamental characteristics or relationships to similar securities.
Debt securities generally trade in the OTC market rather than on a securities exchange. The Fund’s pricing services use multiple valuation techniques to determine fair value. In instances where sufficient market activity exists, the pricing services may utilize a market-based approach through which quotes from market makers are used to determine fair value. In instances where sufficient market activity may not exist or is limited, the pricing services also utilize proprietary valuation models which may consider market characteristics such as benchmark yield curves, credit spreads, estimated default rates, anticipated market interest rate volatility, coupon rates, anticipated timing of principal repayments, underlying collateral, and other unique security features in order to estimate the relevant cash flows, which are then discounted to calculate the fair value.
Investments inopen-end mutual funds are valued at the closing NAV.
Certain derivative financial instruments trade in the OTC market. The Fund’s pricing services use various techniques including industry standard option pricing models and proprietary discounted cash flow models to determine the fair value of those instruments. The Fund’s net benefit or obligation under the derivative contract, as measured by the fair value of the contract, is included in net assets.
The Fund has procedures to determine the fair value of financial instruments for which market prices are not reliable or readily available. Under these procedures, the Fund primarily employs a market-based approach which may use related or comparable assets or liabilities, recent transactions, market multiples, book values, and other relevant information for the investment to determine the fair value of the investment. An income-based valuation approach may also be used in which the anticipated future cash flows of the investment are discounted to calculate fair value. Discounts may also be applied due to the nature or duration of any restrictions on the disposition of the investments. Due to the inherent uncertainty of valuations of such investments, the fair values may differ significantly from the values that would have been used had an active market existed.
FRANKLIN TEMPLETON VARIABLE INSURANCE PRODUCTS TRUST
NOTES TO FINANCIAL STATEMENTS
Franklin Mutual Shares VIP Fund(continued)
1. Organization and Significant Accounting Policies(continued)
a. Financial Instrument Valuation(continued)
Trading in securities on foreign securities stock exchanges and OTC markets may be completed before 4 p.m. Eastern time. In addition, trading in certain foreign markets may not take place on every Fund’s business day. Occasionally, events occur between the time at which trading in a foreign security is completed and 4 p.m. Eastern time that might call into question the reliability of the value of a portfolio security held by the Fund. As a result, differences may arise between the value of the Fund’s portfolio securities as determined at the foreign market close and the latest indications of value at 4 p.m. Eastern time. In order to minimize the potential for these differences, the VC monitors price movements following the close of trading in foreign stock markets through a series of country specific market proxies (such as baskets of American Depositary Receipts, futures contracts and exchange traded funds). These price movements are measured against established trigger thresholds for each specific market proxy to assist in determining if an event has occurred that may call into question the reliability of the values of the foreign securities held by the Fund. If such an event occurs, the securities may be valued using fair value procedures, which may include the use of independent pricing services.
When the last day of the reporting period is anon-business day, certain foreign markets may be open on those days that the Fund’s NAV is not calculated, which could result in differences between the value of the Fund’s portfolio securities on the last business day and the last calendar day of the reporting period. Any significant security valuation changes due to an open foreign market are adjusted and reflected by the Fund for financial reporting purposes.
b. Foreign Currency Translation
Portfolio securities and other assets and liabilities denominated in foreign currencies are translated into U.S. dollars based on the exchange rate of such currencies against U.S. dollars on the date of valuation. The Fund may enter into foreign currency exchange contracts to facilitate transactions denominated in a foreign currency. Purchases and sales of securities, income and expense items denominated in foreign currencies are translated into U.S. dollars at the exchange rate in effect on the transaction date. Portfolio securities and assets and liabilities denominated in
foreign currencies contain risks that those currencies will decline in value relative to the U.S. dollar. Occasionally, events may impact the availability or reliability of foreign exchange rates used to convert the U.S. dollar equivalent value. If such an event occurs, the foreign exchange rate will be valued at fair value using procedures established and approved by the Board.
The Fund does not separately report the effect of changes in foreign exchange rates from changes in market prices on securities held. Such changes are included in net realized and unrealized gain or loss from investments in the Statement of Operations.
Realized foreign exchange gains or losses arise from sales of foreign currencies, currency gains or losses realized between the trade and settlement dates on securities transactions and the difference between the recorded amounts of dividends, interest, and foreign withholding taxes and the U.S. dollar equivalent of the amounts actually received or paid. Net unrealized foreign exchange gains and losses arise from changes in foreign exchange rates on foreign denominated assets and liabilities other than investments in securities held at the end of the reporting period.
c. Securities Purchased on a Delayed Delivery Basis
The Fund purchases securities on a delayed delivery basis, with payment and delivery scheduled for a future date. These transactions are subject to market fluctuations and are subject to the risk that the value at delivery may be more or less than the trade date purchase price. Although the Fund will generally purchase these securities with the intention of holding the securities, it may sell the securities before the settlement date. Sufficient assets have been segregated for these securities.
d. Derivative Financial Instruments
The Fund invested in derivative financial instruments in order to manage risk or gain exposure to various other investments or markets. Derivatives are financial contracts based on an underlying or notional amount, require no initial investment or an initial net investment that is smaller than would normally be required to have a similar response to changes in market factors, and require or permit net settlement. Derivatives contain various risks including the potential inability of the counterparty to fulfill their obligations under the terms of the contract, the potential for an illiquid secondary market, and/or the potential for market movements which expose the Fund to
FRANKLIN TEMPLETON VARIABLE INSURANCE PRODUCTS TRUST
NOTES TO FINANCIAL STATEMENTS
Franklin Mutual Shares VIP Fund(continued)
gains or losses in excess of the amounts shown in the Statement of Assets and Liabilities. Realized gain and loss and unrealized appreciation and depreciation on these contracts for the period are included in the Statement of Operations.
Derivative counterparty credit risk is managed through a formal evaluation of the creditworthiness of all potential counterparties. The Fund attempts to reduce its exposure to counterparty credit risk on OTC derivatives, whenever possible, by entering into International Swaps and Derivatives Association (ISDA) master agreements with certain counterparties. These agreements contain various provisions, including but not limited to collateral requirements, events of default, or early termination. Termination events applicable to the counterparty include certain deteriorations in the credit quality of the counterparty. Termination events applicable to the Fund include failure of the Fund to maintain certain net asset levels and/or limit the decline in net assets over various periods of time. In the event of default or early termination, the ISDA master agreement gives thenon-defaulting party the right to net andclose-out all transactions traded, whether or not arising under the ISDA agreement, to one net amount payable by one counterparty to the other. However, absent an event of default or early termination, OTC derivative assets and liabilities are presented gross and not offset in the Statement of Assets and Liabilities. Early termination by the counterparty may result in an immediate payment by the Fund of any net liability owed to that counterparty under the ISDA agreement. At December 31, 2019, the Fund had OTC derivatives in a net liability position of $2,385,856 and the aggregate value of collateral pledged for such contracts was $1,727,954.
Collateral requirements differ by type of derivative. Collateral or initial margin requirements are set by the broker or exchange clearing house for exchange traded and centrally cleared derivatives. Initial margin deposited is held at the exchange and can be in the form of cash and/or securities. For OTC derivatives traded under an ISDA master agreement, posting of collateral is required by either the Fund or the applicable counterparty if the total net exposure of all OTC derivatives with the applicable counterparty exceeds the minimum transfer amount, which typically ranges from $100,000 to $250,000, and can vary depending on the counterparty and the type of the agreement. Generally, collateral is determined at the close of Fund business each day and any additional collateral required due to changes in derivative values may be delivered by the Fund or the
counterparty the next business day, or within a few business days. Collateral pledged and/or received by the Fund for OTC derivatives, if any, is held in segregated accounts with the Fund’s custodian/counterparty broker and can be in the form of cash and/or securities. Unrestricted cash may be invested according to the Fund’s investment objectives. To the extent that the amounts due to the Fund from its counterparties are not subject to collateralization or are not fully collateralized, the Fund bears the risk of loss from counterpartynon-performance.
The Fund entered into exchange traded futures contracts primarily to manage exposure to certain foreign currencies. A futures contract is an agreement between the Fund and a counterparty to buy or sell an asset at a specified price on a future date. Required initial margins are pledged by the Fund, and the daily change in fair value is accounted for as a variation margin payable or receivable in the Statement of Assets and Liabilities.
The Fund entered into OTC forward exchange contracts primarily to manage exposure to certain foreign currencies. A forward exchange contract is an agreement between the Fund and a counterparty to buy or sell a foreign currency at a specific exchange rate on a future date.
See Note 9 regarding other derivative information.
e. Securities Sold Short
The Fund is engaged in selling securities short, which obligates the Fund to replace a borrowed security with the same security at current fair value. The Fund incurs a loss if the price of the security increases between the date of the short sale and the date on which the Fund replaces the borrowed security. The Fund realizes a gain if the price of the security declines between those dates. Gains are limited to the price at which the Fund sold the security short, while losses are potentially unlimited in size.
The Fund is required to establish a margin account with the broker lending the security sold short. While the short sale is outstanding, the broker retains the proceeds of the short sale to the extent necessary to meet margin requirements until the short position is closed out. A deposit must also be maintained with the Fund’s custodian/counterparty broker consisting of cash and/or securities having a value equal to a specified percentage of the value of the securities sold short. The Fund is obligated to pay fees for borrowing the securities sold short and is required to pay the counterparty any
FRANKLIN TEMPLETON VARIABLE INSURANCE PRODUCTS TRUST
NOTES TO FINANCIAL STATEMENTS
Franklin Mutual Shares VIP Fund(continued)
1. Organization and Significant Accounting Policies(continued)
e. Securities Sold Short(continued)
dividends and/or interest due on securities sold short. Such dividends and/or interest and any security borrowing fees are recorded as an expense to the Fund.
f. Securities Lending
The Fund participates in an agency based securities lending program to earn additional income. The Fund receives cash collateral against the loaned securities in an amount equal to at least 102% of the fair value of the loaned securities. Collateral is maintained over the life of the loan in an amount not less than 100% of the fair value of loaned securities, as determined at the close of Fund business each day; any additional collateral required due to changes in security values is delivered to the Fund on the next business day. The collateral is deposited into a joint cash account with other funds and is used to invest in a money market fund managed by Franklin Advisers, Inc., an affiliate of the Fund. The Fund may receive income from the investment of cash collateral, in addition to lending fees and rebates paid by the borrower. Income from securities loaned, net of fees paid to the securities lending agent and/or third-party vendor, is reported separately in the Statement of Operations. The Fund bears the market risk with respect to the collateral investment, securities loaned, and the risk that the agent may default on its obligations to the Fund. If the borrower defaults on its obligation to return the securities loaned, the Fund has the right to repurchase the securities in the open market using the collateral received. The securities lending agent has agreed to indemnify the Fund in the event of default by a third party borrower. At December 31, 2019, the Fund had no securities on loan.
g. Senior Floating Rate Interests
The Fund invests in senior secured corporate loans that pay interest at rates which are periodically reset by reference to a base lending rate plus a spread. These base lending rates are generally the prime rate offered by a designated U.S. bank or the London InterBank Offered Rate (LIBOR). Senior secured corporate loans often require prepayment of principal from excess cash flows or at the discretion of the borrower. As a result, actual maturity may be substantially less than the stated maturity. Senior secured corporate loans in which the Fund invests are generally readily marketable,
but may be subject to certain restrictions on resale. On July 27, 2017, the United Kingdom’s Financial Conduct Authority announced its intention to cease sustaining LIBOR after 2021. There remains uncertainty regarding the future utilization of LIBOR and the nature of any replacement rate. As such, the potential effect of a transition away from LIBOR on the Fund or the Fund’s investments that use or may use a floating rate based on LIBOR cannot yet be determined.
h. Income and Deferred Taxes
It is the Fund’s policy to qualify as a regulated investment company under the Internal Revenue Code. The Fund intends to distribute to shareholders substantially all of its taxable income and net realized gains to relieve it from federal income and if applicable, excise taxes. As a result, no provision for U.S. federal income taxes is required.
The Fund may be subject to foreign taxation related to income received, capital gains on the sale of securities and certain foreign currency transactions in the foreign jurisdictions in which it invests. Foreign taxes, if any, are recorded based on the tax regulations and rates that exist in the foreign markets in which the Fund invests. When a capital gain tax is determined to apply, the Fund records an estimated deferred tax liability in an amount that would be payable if the securities were disposed of on the valuation date.
As a result of several court cases, in certain countries across the European Union, the Fund filed additional tax reclaims for previously withheld taxes on dividends earned in those countries (EU reclaims). These additional filings are subject to various administrative proceedings by the local jurisdictions’ tax authorities within the European Union, as well as a number of related judicial proceedings. Income recognized, if any, for EU reclaims is reflected as other income in the Statement of Operations and any related receivable, if any, is reflected as European Union tax reclaims in the Statement of Assets and Liabilities. When uncertainty exists as to the ultimate resolution of these proceedings, the likelihood of receipt of these EU reclaims, and the potential timing of payment, no amounts are reflected in the financial statements. For U.S. income tax purposes, when EU reclaims are received by the Fund and the Fund previously passed foreign tax credit on to its shareholders, the Fund must either amend historic tax reporting to shareholders or enter into a
FRANKLIN TEMPLETON VARIABLE INSURANCE PRODUCTS TRUST
NOTES TO FINANCIAL STATEMENTS
Franklin Mutual Shares VIP Fund(continued)
closing agreement with the Internal Revenue Service (IRS) in order to pay the associated tax liability on behalf of the Fund’s shareholders.
The Fund may recognize an income tax liability related to its uncertain tax positions under U.S. GAAP when the uncertain tax position has a less than 50% probability that it will be sustained upon examination by the tax authorities based on its technical merits. As of December 31, 2019, the Fund has determined that no tax liability is required in its financial statements related to uncertain tax positions for any open tax years (or expected to be taken in future tax years). Open tax years are those that remain subject to examination and are based on the statute of limitations in each jurisdiction in which the Fund invests.
i. Security Transactions, Investment Income, Expenses and Distributions
Security transactions are accounted for on trade date. Realized gains and losses on security transactions are determined on a specific identification basis. Interest income and estimated expenses are accrued daily. Amortization of premium and accretion of discount on debt securities are included in interest income. Dividend income and dividends declared on securities sold short are recorded on theex-dividend date except for certain dividends from securities where the dividend rate is not available. In such cases, the dividend is recorded as soon as the information is received by the Fund. Distributions to shareholders are recorded on theex-dividend date. Distributable earnings are determined according to income tax regulations (tax basis) and may differ from earnings recorded in accordance with U.S. GAAP. These differences may be permanent or temporary. Permanent differences are reclassified among capital accounts to reflect their tax character. These reclassifications have no impact on net assets or the results of operations. Temporary differences are not reclassified, as they may reverse in subsequent periods.
Common expenses incurred by the Trust are allocated among the Funds based on the ratio of net assets of each Fund to the combined net assets of the Trust or based on the ratio of number of shareholders of each Fund to the combined number of shareholders of the Trust. Fund specific expenses are charged directly to the Fund that incurred the expense.
Realized and unrealized gains and losses and net investment income, excluding class specific expenses, are allocated daily to each class of shares based upon the relative proportion of net assets of each class. Differences in per share distributions by class are generally due to differences in class specific expenses.
j. Accounting Estimates
The preparation of financial statements in accordance with U.S. GAAP requires management to make estimates and assumptions that affect the reported amounts of assets and liabilities at the date of the financial statements and the amounts of income and expenses during the reporting period. Actual results could differ from those estimates.
k. Guarantees and Indemnifications
Under the Trust’s organizational documents, its officers and trustees are indemnified by the Trust against certain liabilities arising out of the performance of their duties to the Trust. Additionally, in the normal course of business, the Trust, on behalf of the Fund, enters into contracts with service providers that contain general indemnification clauses. The Trust’s maximum exposure under these arrangements is unknown as this would involve future claims that may be made against the Trust that have not yet occurred. Currently, the Trust expects the risk of loss to be remote.
FRANKLIN TEMPLETON VARIABLE INSURANCE PRODUCTS TRUST
NOTES TO FINANCIAL STATEMENTS
Franklin Mutual Shares VIP Fund(continued)
2. Shares of Beneficial Interest
At December 31, 2019, there were an unlimited number of shares authorized (without par value). Transactions in the Fund’s shares were as follows:
| | | | | | | | | | | | | | | | |
| | | | | | Year Ended December 31, | | | | |
| | | 2019 | | | 2018 | |
| | | Shares | | | Amount | | | Shares | | | Amount | |
| | | | |
Class 1 Shares: | | | | | | | | | | | | | | | | |
| | | | |
Shares sold | | | 765,653 | | | $ | 14,772,259 | | | | 1,228,202 | | | $ | 23,646,682 | |
| | | | |
Shares issued in reinvestment of distributions | | | 2,031,099 | | | | 35,828,591 | | | | 1,881,441 | | | | 37,929,843 | |
| | | | |
Shares redeemed | | | (24,880,289 | ) | | | (487,131,621 | ) | | | (4,336,171 | ) | | | (89,573,472 | ) |
| | | | |
Net increase (decrease) | | | (22,083,537 | ) | | $ | (436,530,771 | ) | | | (1,226,528 | ) | | $ | (27,996,947 | ) |
| | | | |
Class 2 Shares: | | | | | | | | | | | | | | | | |
| | | | |
Shares sold | | | 29,854,091 | | | $ | 583,466,693 | | | | 14,955,793 | | | $ | 302,887,079 | |
| | | | |
Shares issued in reinvestment of distributions | | | 19,094,846 | | | | 330,340,832 | | | | 9,803,757 | | | | 194,310,469 | |
| | | | |
Shares redeemed | | | (37,705,675 | ) | | | (715,624,676 | ) | | | (50,860,562 | ) | | | (1,003,622,690 | ) |
| | | | |
Net increase (decrease) | | | 11,243,262 | | | $ | 198,182,849 | | | | (26,101,012 | ) | | $ | (506,425,142 | ) |
| | | | |
Class 4 Shares: | | | | | | | | | | | | | | | | |
| | | | |
Shares sold | | | 625,179 | | | $ | 11,842,479 | | | | 743,333 | | | $ | 14,855,135 | |
| | | | |
Shares issued in reinvestment of distributions | | | 749,250 | | | | 13,089,406 | | | | 358,852 | | | | 7,177,027 | |
| | | | |
Shares redeemed | | | (1,022,438 | ) | | | (19,609,155 | ) | | | (1,104,232 | ) | | | (22,398,008 | ) |
| | | | |
Net increase (decrease) | | | 351,991 | | | $ | 5,322,730 | | | | (2,047 | ) | | $ | (365,846 | ) |
3. Transactions with Affiliates
Franklin Resources, Inc. is the holding company for various subsidiaries that together are referred to as Franklin Templeton. Certain officers and trustees of the Fund are also officers and/or directors of the following subsidiaries:
| | |
| Subsidiary | | Affiliation |
| |
Franklin Mutual Advisers, LLC (Franklin Mutual) | | Investment manager |
| |
Franklin Templeton Services, LLC (FT Services) | | Administrative manager |
| |
Franklin Templeton Distributors, Inc. (Distributors) | | Principal underwriter |
| |
Franklin Templeton Investor Services, LLC (Investor Services) | | Transfer agent |
FRANKLIN TEMPLETON VARIABLE INSURANCE PRODUCTS TRUST
NOTES TO FINANCIAL STATEMENTS
Franklin Mutual Shares VIP Fund(continued)
a. Management Fees
The Fund pays an investment management fee to Franklin Mutual based on the average daily net assets of the Fund as follows:
| | |
| Annualized Fee Rate | | Net Assets |
| |
0.675% | | Up to and including $5 billion |
| |
0.645% | | Over $5 billion, up to and including $10 billion |
| |
0.625% | | Over $10 billion, up to and including $15 billion |
| |
0.595% | | Over $15 billion, up to and including $20 billion |
| |
0.585% | | Over $20 billion, up to and including $25 billion |
| |
0.565% | | Over $25 billion, up to and including $30 billion |
| |
0.555% | | Over $30 billion, up to and including $35 billion |
| |
0.545% | | In excess of $35 billion |
b. Administrative Fees
Under an agreement with Franklin Mutual, FT Services provides administrative services to the Fund. The fee is paid by Franklin Mutual based on the Fund’s average daily net assets, and is not an additional expense of the Fund.
c. Distribution Fees
The Board has adopted distribution plans for Class 2 and Class 4 shares pursuant to Rule12b-1 under the 1940 Act. Under the Fund’s compensation distribution plans, the Fund pays Distributors for costs incurred in connection with the servicing, sale and distribution of the Fund’s shares up to 0.35% per year of its average daily net assets of each class. The Board has agreed to limit the current rate to 0.25% per year for Class 2. The plan year, for purposes of monitoring compliance with the maximum annual plan rates, is February 1 through January 31.
d. Transfer Agent Fees
Investor Services, under terms of an agreement, performs shareholder servicing for the Fund and is not paid by the Fund for the services.
e. Investments in Affiliated Management Investment Companies
The Fund invests in one or more affiliated management investment companies for purposes other than exercising a controlling influence over the management or policies. Management fees paid by the Fund are waived on assets invested in the affiliated management investment companies, as noted in the Statement of Operations, in an amount not to exceed the management and administrative fees paid directly or indirectly by each affiliate. During the year ended December 31, 2019, the Fund held investments in affiliated management investment companies as follows:
| | | | | | | | | | | | | | | | | | | | | | | | | | | | | | | | |
| | | Value at
Beginning
of Year | | | Purchases | | | Sales | | | Realized
Gain (Loss) | | | Net Change in
Unrealized
Appreciation
(Depreciation) | | | Value at
End of
Year | | | Number of
Shares
Held at End
of Year | | | Income from
securities
loaned | |
| | | | | | | | |
Non-Controlled Affiliates | | | | | | | | | | | | | | | | | | | | | | | | | | | | | | | | |
| | | | | | | | |
Institutional Fiduciary Trust Money Market Portfolio, 1.26% | | | $ — | | | | $121,376,000 | | | | $(121,376,000) | | | | $ — | | | | $ — | | | | $ — | | | | — | | | | $47,926 | |
FRANKLIN TEMPLETON VARIABLE INSURANCE PRODUCTS TRUST
NOTES TO FINANCIAL STATEMENTS
Franklin Mutual Shares VIP Fund(continued)
3. Transactions with Affiliates(continued)
f. Interfund Transactions
The Fund engaged in purchases and sales of investments with funds or other accounts that have common investment managers (or affiliated investment managers), directors, trustees or officers. During the year ended December 31, 2019, these purchase and sale transactions aggregated $0 and $4,607,489, respectively.
4. Expense Offset Arrangement
The Fund has entered into an arrangement with its custodian whereby credits realized as a result of uninvested cash balances are used to reduce a portion of the Fund’s custodian expenses. During the year ended December 31, 2019, the custodian fees were reduced as noted in the Statement of Operations.
5. Income Taxes
The tax character of distributions paid during the years ended December 31, 2019 and 2018, was as follows:
| | | | | | | | |
| | | 2019 | | | 2018 | |
| | | | |
Distributions paid from: | | | | | | | | |
Ordinary income | | $ | 66,965,945 | | | $ | 94,583,983 | |
Long term capital gain | | | 312,292,884 | | | | 144,833,356 | |
| | $ | 379,258,829 | | | $ | 239,417,339 | |
At December 31, 2019, the cost of investments, net unrealized appreciation (depreciation), undistributed ordinary income and undistributed long term capital gains for income tax purposes were as follows:
| | | | |
| Cost of investments | | $ | 2,418,505,668 | |
| |
Unrealized appreciation | | $ | 895,224,355 | |
| Unrealized depreciation | | | (117,941,295 | ) |
| |
| Net unrealized appreciation (depreciation) | | $ | 777,283,060 | |
| |
Distributable earnings: | | | | |
Undistributed ordinary income | | $ | 91,385,739 | |
| |
| Undistributed long term capital gains | | | 79,022,349 | |
| |
| Total distributable earnings | | $ | 170,408,088 | |
Differences between income and/or capital gains as determined on a book basis and a tax basis are primarily due to differing treatments of foreign currency transactions and wash sales.
6. Investment Transactions
Purchases and sales of investments (excluding short term securities and securities sold short) for the year ended December 31, 2019, aggregated $1,167,301,560 and $1,477,326,286, respectively.
FRANKLIN TEMPLETON VARIABLE INSURANCE PRODUCTS TRUST
NOTES TO FINANCIAL STATEMENTS
Franklin Mutual Shares VIP Fund(continued)
7. Credit Risk and Defaulted Securities
The Fund may purchase thepre-default or defaulted debt of distressed companies. Distressed companies are financially troubled and could be or are already involved in financial restructuring or bankruptcy. Risks associated with purchasing these securities include the possibility that the bankruptcy or other restructuring process takes longer than expected, or that distributions in restructuring are less than anticipated, either or both of which may result in unfavorable consequences to the Fund. If it becomes probable that the income on debt securities, including those of distressed companies, will not be collected, the Fund discontinues accruing income and recognizes an adjustment for uncollectible interest.
At December 31, 2019, the aggregate long value of distressed company securities for which interest recognition has been discontinued represents less than 0.1% of the Fund’s net assets. For information as to specific securities, see the accompanying Statement of Investments.
8. Restricted Securities
The Fund invests in securities that are restricted under the Securities Act of 1933 (1933 Act). Restricted securities are often purchased in private placement transactions, and cannot be sold without prior registration unless the sale is pursuant to an exemption under the 1933 Act. Disposal of these securities may require greater effort and expense, and prompt sale at an acceptable price may be difficult. The Fund may have registration rights for restricted securities. The issuer generally incurs all registration costs.
At December 31, 2019, investments in restricted securities, excluding securities exempt from registration under the 1933 Act, were as follows:
| | | | | | | | | | | | | | |
| Shares | | Issuer | | Acquisition Date | | | Cost | | | Value | |
| | | | |
| 1,730,515 | | International Automotive Components Group Brazil LLC, (Value is 0.0%†of Net Assets) | | | 4/13/06 -12/26/08 | | | $ | 1,149,241 | | | $ | 62,818 | |
†Rounds to less than 0.1% of net assets.
9. Other Derivative Information
At December 31, 2019, investments in derivative contracts are reflected in the Statement of Assets and Liabilities as follows:
| | | | | | | | | | | | | | |
| | | Asset Derivatives | | | | | Liability Derivatives | |
| | | | | |
Derivative Contracts Not Accounted for as
Hedging Instruments | | Statement of Assets and Liabilities Location | | Fair Value | | | | | Statement of Assets and Liabilities Location | | Fair Value | |
Foreign exchange contracts | | Variation margin on futures contracts | | $ — | | | | | | Variation margin on futures contracts | | $ | 720,267 | a |
| | Unrealized appreciation on OTC forward exchange contracts | | 113,833 | | | | | | Unrealized depreciation on OTC forward exchange contracts | | | 2,499,689 | |
Totals | | | | $113,833 | | | | | | | | $ | 3,219,956 | |
aThis amount reflects the cumulative appreciation (depreciation) of futures contracts as reported in the Statement of Investments. Only the variation margin receivable/ payable at year end is separately reported within the Statement of Assets and Liabilities. Prior variation margin movements were recorded to cash upon receipt or payment.
FRANKLIN TEMPLETON VARIABLE INSURANCE PRODUCTS TRUST
NOTES TO FINANCIAL STATEMENTS
Franklin Mutual Shares VIP Fund(continued)
9. Other Derivative Information(continued)
For the year ended December 31, 2019, the effect of derivative contracts in the Statement of Operations was as follows:
| | | | | | | | | | | | |
Derivative Contracts Not Accounted for as Hedging Instruments | | Statement of Operations Location | | Net Realized
Gain (Loss) for
the Year | | | Statement of Operations Location | | Net Change in
Unrealized
Appreciation
(Depreciation)
for the Year | |
| |
| | | | |
| | Net realized gain (loss) from: | | | | | | Net change in unrealized appreciation (depreciation) on: | | | | |
| | | | |
Foreign exchange contracts | | Forward exchange contracts | | | $5,238,183 | | | Forward exchange contracts | | | $(1,434,738) | |
| | | | |
| | Futures contracts | | | 1,329,818 | | | Futures contracts | | | (884,259) | |
| | | | | | | | | | | | |
Totals | | | | | $6,568,001 | | | | | | $(2,318,997) | |
| | | | | | | | | | | | |
For the year ended December 31, 2019, the average month end notional amount of futures contracts represented $96,195,661. The average month end contract value of forward exchange contracts was $116,464,877.
See Note 1(d) regarding derivative financial instruments.
10. Credit Facility
The Fund, together with other U.S. registered and foreign investment funds (collectively, Borrowers), managed by Franklin Templeton, are borrowers in a joint syndicated senior unsecured credit facility totaling $2 billion (Global Credit Facility) which matured on February 7, 2020. This Global Credit Facility provides a source of funds to the Borrowers for temporary and emergency purposes, including the ability to meet future unanticipated or unusually large redemption requests. Effective February 7, 2020, the Borrowers renewed the Global Credit Facility for a one year term, maturing February 5, 2021, for a total of $2 billion.
Under the terms of the Global Credit Facility, the Fund shall, in addition to interest charged on any borrowings made by the Fund and other costs incurred by the Fund, pay its share of fees and expenses incurred in connection with the implementation and maintenance of the Global Credit Facility, based upon its relative share of the aggregate net assets of all of the Borrowers, including an annual commitment fee of 0.15% based upon the unused portion of the Global Credit Facility. These fees are reflected in other expenses in the Statement of Operations. During the year ended December 31, 2019, the Fund did not use the Global Credit Facility.
11. Fair Value Measurements
The Fund follows a fair value hierarchy that distinguishes between market data obtained from independent sources (observable inputs) and the Fund’s own market assumptions (unobservable inputs). These inputs are used in determining the value of the Fund’s financial instruments and are summarized in the following fair value hierarchy:
| | • | | Level 1 – quoted prices in active markets for identical financial instruments |
| | • | | Level 2 – other significant observable inputs (including quoted prices for similar financial instruments, interest rates, prepayment speed, credit risk, etc.) |
| | • | | Level 3 – significant unobservable inputs (including the Fund’s own assumptions in determining the fair value of financial instruments) |
The input levels are not necessarily an indication of the risk or liquidity associated with financial instruments at that level.
FRANKLIN TEMPLETON VARIABLE INSURANCE PRODUCTS TRUST
NOTES TO FINANCIAL STATEMENTS
Franklin Mutual Shares VIP Fund(continued)
A summary of inputs used as of December 31, 2019, in valuing the Fund’s assets and liabilities carried at fair value, is as follows:
| | | | | | | | | | | | | | | | |
| | | Level 1 | | | Level 2 | | | Level 3 | | | Total | |
| | | | |
Assets: | | | | | | | | | | | | | | | | |
| | | | |
Investments in Securities:a | | | | | | | | | | | | | | | | |
| | | | |
Equity Investments:b | | | | | | | | | | | | | | | | |
| | | | |
Auto Components | | $ | — | | | $ | — | | | $ | 62,818 | | | $ | 62,818 | |
| | | | |
Machinery | | | 6,644,817 | | | | 20,254,205 | | | | — | | | | 26,899,022 | |
| | | | |
Media | | | 202,576,805 | | | | — | | | | 183,628 | | | | 202,760,433 | |
| | | | |
Specialty Retail | | | — | | | | — | | | | 7,609,922c | | | | 7,609,922 | |
| | | | |
All Other Equity Investments | | | 2,665,022,054 | | | | — | | | | — | | | | 2,665,022,054 | |
| | | | |
Corporate Notes and Senior Floating Rate Interests | | | — | | | | 121,959,580 | | | | — | | | | 121,959,580 | |
| | | | |
Companies in Liquidation | | | — | | | | — | | | | 49,840c | | | | 49,840 | |
| | | | |
Short Term Investments | | | 140,029,634 | | | | 48,900,000 | | | | — | | | | 188,929,634 | |
| | | | |
Total Investments in Securities | | $ | 3,014,273,310 | | | $ | 191,113,785 | | | $ | 7,906,208 | | | $ | 3,213,293,303 | |
| | | | |
Other Financial Instruments: | | | | | | | | | | | | | | | | |
| | | | |
Forward Exchange Contracts | | $ | — | | | $ | 113,833 | | | $ | — | | | $ | 113,833 | |
| | | | |
Liabilities: | | | | | | | | | | | | | | | | |
| | | | |
Other Financial Instruments: | | | | | | | | | | | | | | | | |
| | | | |
Securities Sold Short | | $ | 14,400,942 | | | $ | — | | | $ | — | | | $ | 14,400,942 | |
| | | | |
Futures Contracts | | | 720,267 | | | | — | | | | — | | | | 720,267 | |
| | | | |
Forward Exchange Contracts | | | — | | | | 2,499,689 | | | | — | | | | 2,499,689 | |
| | | | |
Total Other Financial Instruments | | $ | 15,121,209 | | | $ | 2,499,689 | | | $ | — | | | $ | 17,620,898 | |
aFor detailed categories, see the accompanying Statement of Investments.
bIncludes common stocks as well as other equity interests.
cIncludes securities determined to have no value at December 31, 2019.
A reconciliation of assets in which Level 3 inputs are used in determining fair value is presented when there are significant Level 3 financial instruments at the beginning and/or end of the year.
12. Subsequent Events
The Fund has evaluated subsequent events through the issuance of the financial statements and determined that no events have occurred that require disclosure other than those already disclosed in the financial statements.
Abbreviations
| | | | | | | | | | | | |
| Counterparty | | Currency | | Selected Portfolio | | |
| | | | | | |
BOFA | | Bank of America Corp. | | EUR | | Euro | | ADR | | American Depositary Receipt | | |
HSBK | | HSBC Bank PLC | | GBP | | British Pound | | FHLB | | Federal Home Loan Bank | | |
UBSW | | UBS AG | | USD | | United States Dollar | | LIBOR | | London InterBank Offered Rate | | |
FRANKLIN TEMPLETON VARIABLE INSURANCE PRODUCTS TRUST
Report of Independent Registered Public Accounting Firm
To the Board of Trustees of Franklin Templeton Variable Insurance Products Trust and Shareholders of Franklin Mutual Shares VIP Fund
Opinion on the Financial Statements
We have audited the accompanying statement of assets and liabilities, including the statement of investments, of Franklin Mutual Shares VIP Fund (the “Fund”) as of December 31, 2019, the related statement of operations for the year ended December 31, 2019, the statement of changes in net assets for each of the two years in the period ended December 31, 2019, including the related notes, and the financial highlights for each of the five years in the period ended December 31, 2019 (collectively referred to as the “financial statements”). In our opinion, the financial statements present fairly, in all material respects, the financial position of the Fund as of December 31, 2019, the results of its operations for the year then ended, the changes in its net assets for each of the two years in the period ended December 31, 2019 and the financial highlights for each of the five years in the period ended December 31, 2019 in conformity with accounting principles generally accepted in the United States of America.
Basis for Opinion
These financial statements are the responsibility of the Fund’s management. Our responsibility is to express an opinion on the Fund’s financial statements based on our audits. We are a public accounting firm registered with the Public Company Accounting Oversight Board (United States) (PCAOB) and are required to be independent with respect to the Fund in accordance with the U.S. federal securities laws and the applicable rules and regulations of the Securities and Exchange Commission and the PCAOB.
We conducted our audits of these financial statements in accordance with the standards of the PCAOB. Those standards require that we plan and perform the audit to obtain reasonable assurance about whether the financial statements are free of material misstatement, whether due to error or fraud.
Our audits included performing procedures to assess the risks of material misstatement of the financial statements, whether due to error or fraud, and performing procedures that respond to those risks. Such procedures included examining, on a test basis, evidence regarding the amounts and disclosures in the financial statements. Our audits also included evaluating the accounting principles used and significant estimates made by management, as well as evaluating the overall presentation of the financial statements. Our procedures included confirmation of securities owned as of December 31, 2019 by correspondence with the custodian and brokers; when replies were not received from brokers, we performed other auditing procedures. We believe that our audits provide a reasonable basis for our opinion.
PricewaterhouseCoopers LLP
San Francisco, California
February 20, 2020
We have served as the auditor of one or more investment companies in the Franklin Templeton Group of Funds since 1948.
FRANKLIN TEMPLETON VARIABLE INSURANCE PRODUCTS TRUST
Tax Information (unaudited)
Franklin Mutual Shares VIP Fund
Under Section 852(b)(3)(C) of the Internal Revenue Code, the Fund hereby reports the maximum amount allowable but no less than $312,292,884 as a long term capital gain dividend for the fiscal year ended December 31, 2019.
Under Section 854(b)(1)(A) of the Internal Revenue Code, the Fund hereby reports 72.64% of the ordinary income dividends as income qualifying for the dividends received deduction for the fiscal year ended December 31, 2019.
This page intentionally left blank.
Franklin Rising Dividends VIP Fund
This annual report for Franklin Rising Dividends VIP Fund covers the fiscal year ended December 31, 2019.
Class 4 Performance Summary as of December 31, 2019
Average annual total return of Class 4 shares* represents the average annual change in value, assuming reinvestment of dividends and capital gains. Average returns smooth out variations in returns, which can be significant; they are not the same asyear-by-year results.
| | | | | | | | | | | | |
| Periods ended 12/31/19 | | 1-Year | | | 5-Year | | | 10-Year | |
| | | |
Average Annual Total Return | | | +29.16% | | | | +10.48% | | | | +12.70% | |
*The Fund has a fee waiver associated with any investment it makes in a Franklin Templeton money fund and/or other Franklin Templeton fund, contractually guaranteed through 4/30/20. Fund investment results reflect the fee waiver; without this waiver, the results would have been lower.
Performance reflects the Fund’s Class 4 operating expenses, but doesnotinclude any contract fees, expenses or sales charges. If they had been included, performance would be lower. These charges and deductions, particularly for variable life policies, can have a significant effect on contract values and insurance benefits. See the contract prospectus for a complete description of these expenses, including sales charges.
Performance data represent past performance, which does not guarantee future results. Investment return and principal value will fluctuate, and you may have a gain or loss when you sell your shares. Current performance may differ from figures shown.
Total Return Index Comparison for a Hypothetical $10,000 Investment (1/1/10–12/31/19)
The graph below shows the change in value of a hypothetical $10,000 investment in the Fund over the indicated period and includes reinvestment of any income or distributions. The Fund’s performance* is compared to the performance of the Standard & Poor’s® 500 Index (S&P 500®). One cannot invest directly in an index, and an index is not representative of the Fund’s portfolio.Please see Important Notes to Performance Information preceding the Fund Summaries.
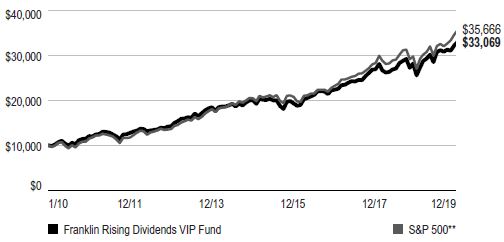
**Source: Morningstar. Please see Index Descriptions following the Fund Summaries.
FRANKLIN RISING DIVIDENDS VIP FUND
Fund Goal and Main Investments
The Fund seeks long-term capital appreciation, with preservation of capital as an important consideration. Under normal market conditions, the Fund invests at least 80% of its net assets in equity securities of financially sound companies that have paid consistently rising dividends.
Fund Risks
All investments involve risks, including possible loss of principal. Value securities may not increase in price as anticipated or may decline further in value. For stocks paying dividends, dividends are not guaranteed, and can increase, decrease or be totally eliminated without notice. Securities issued by smaller and midsize companies may be more volatile in price than those of larger companies, involve substantial risks and should be considered relatively more speculative. To the extent that the Fund focuses on particular countries, regions, industries, sectors or types of investment from time to time, the Fund may be subject to greater risks of adverse developments in such areas of focus than a fund that invests in a wider variety of countries, regions, industries, sectors or investments. Foreign investing carries additional risks such as currency and market volatility and political or social instability, risks that are heightened in developing countries. The Fund is actively managed but there is no guarantee that the manager’s investment decisions will produce the desired results. The Fund’s prospectus also includes a description of the main investment risks.
Performance Overview
You can find the Fund’sone-year total return in the Performance Summary. In comparison, the S&P 500 posted a +31.49% total return for the same period.1 Please note the Fund employs abottom-up stock selection process, and the managers invest in securities without regard to benchmark comparisons.
Economic and Market Overview
U.S. equities, as measured by the S&P 500, posted strong returns during the reporting period, driven by the U.S. Federal Reserve’s (Fed’s) monetary policy easing, solid domestic economic growth and diminished concerns about
the global economy and trade relations. Stocks gained sharply early in the year and experienced heightened volatility in May and September before reaching record price highs near the end of 2019. The decline in market volatility reflected many market participants’ shift from growth concerns to a more optimistic outlook.
The Fed provided a substantial boost to equity markets early in the reporting period as it shifted to a more accommodative monetary policy. In January 2019, the Fed signaled the end of its tightening cycle and cut the federal funds rate three times thereafter, lowering it to a range of 1.50%–1.75%. Stocks responded positively to the interest-rate cuts and gained further in December 2019 after the Fed indicated it would likely leave interest rates unchanged in 2020.
Solid U.S. economic growth also supported equities, as healthy consumer spending and a strong labor market kept the economy afloat. The unemployment rate fell during the year, reaching 3.5% in September, November and December 2019, the lowest recorded unemployment rate in 50 years.2 Wages also grew, albeit at a moderate pace, and inflation remained persistently low. In addition, deficit spending by the U.S. government boosted current growth at the expense of long-term debt. Despite the strength in the consumer sector, some parts of the economy struggled, particularly heavy industry. Annual industrial production contracted late in the reporting period, manufacturing output stalled and capital spending declined.
International and trade developments also impacted U.S. stocks during the period. Investors were concerned about slowing global growth and the impact it might have on U.S. equities, but some market participants’ predictions of a global recession did not materialize as growth proved resilient amid a series of interest-rate cuts by many central banks. The trade war between the U.S. and China was a dominant theme over the period, and stocks fluctuated as many investors responded to the latest developments, both positive and negative. However, byperiod-end, markets were reassured by a phase one trade agreement between the two countries, which lowered certain tariffs and addressed some of the principal areas of conflict.
1. Source: Morningstar. One cannot invest directly in an index, and an index is not representative of the Fund’s portfolio. Please see Index Descriptions following the Fund Summaries.
2. Source: Bureau of Labor Statistics.
The dollar value, number of shares or principal amount, and names of all portfolio holdings are listed in the Fund’s Statement of Investments (SOI).
FRANKLIN RISING DIVIDENDS VIP FUND
Investment Strategy
We are a research-driven, fundamental investment adviser, pursuing a disciplined value-oriented strategy. Asbottom-up investors concentrating primarily on individual securities, we seek fundamentally sound companies that we believe meet our screening criteria, which include consistent, substantial dividend increases; reinvested earnings; and strong balance sheets. We attempt to acquire such stocks at attractive prices, often when they are out of favor with other investors. In following these criteria, we do not necessarily focus on companies whose securities pay a high dividend but rather on companies that consistently raise their dividends.
Manager’s Discussion
During the fiscal year ended December 31, 2019, some holdings that contributed to absolute performance included Dover, Accenture and Microsoft. Microsoft is listed among the Fund’s largest positions in the Top 10 Holdings table on pageFRD-4.
Strong earnings supported share price performance of electrical equipment company Dover during the period. Despite a weaker economic environment, Dover posted solid organic revenue growth and robust free cash flow in recent quarters. Order growth also improved, which we believe can bolster Dover’s overall growth in 2020.
The stock performance of technology outsourcing firm Accenture supported relative returns in 2019, as investors responded favorably to strong earnings growth, boosting the company’s stock price. The company’s robust financial results have been driven by strong growth in digital, cloud and security-related services. Late in 2019, Accenture also increased its full-year 2020 revenue growth forecast on strong consulting and outsourcing bookings growth.
Business software company Microsoft contributed to performance as it posted solid financial results across its businesses during the year. We believe the company can continue to demonstrate solid growth as the transition to cloud computing leads customers to potentially adopt more of its software and services. We also believe that the company can continue to raise its dividend over time as earnings per share continue to grow.
Conversely, some holdings that detracted from absolute performance included Albemarle, Occidental Petroleum and Gap.
Shares of Albemarle, a specialty chemicals producer, declined in price amid concerns about lithium oversupply and pricing implications. In response, Albemarle announced
Portfolio Composition
Based on Total Net Assets as of 12/31/19
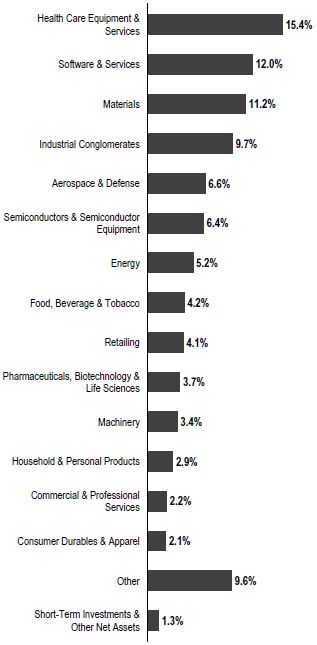
steps to curtail capital expenditures to moderate supply growth over the next few years. While lithium pricing may soften over the coming year, we believe the company’s leading resource base provides solid growth prospects as demand continues to accelerate.
The performance of Occidental Petroleum stock also detracted from performance. The company acquired oil and gas exploration and production firm Anadarko Petroleum (not a Fund holding) during the period. While the transaction gives Occidental Petroleum a greater presence in the U.S.
FRANKLIN RISING DIVIDENDS VIP FUND
Top 10 Holdings
12/31/19
| | |
Company Sector/Industry | | % of Total
Net Assets |
|
| |
Microsoft Corp. Software & Services | | 7.2% |
|
| |
Roper Technologies Inc. Industrial Conglomerates | | 5.5% |
|
| |
Stryker Corp. Health Care Equipment & Services | | 3.8% |
|
| |
Accenture PLC Software & Services | | 3.8% |
|
| |
Linde PLC (United Kingdom) Materials | | 3.7% |
|
| |
Honeywell International Inc. Industrial Conglomerates | | 3.6% |
|
| |
Becton, Dickinson and Co. Health Care Equipment & Services | | 3.5% |
|
| |
Air Products and Chemicals Inc. Materials | | 3.4% |
|
| |
Texas Instruments Inc. Semiconductors & Semiconductor Equipment | | 3.2% |
|
| |
Analog Devices Inc. Semiconductors & Semiconductor Equipment | | 3.2% |
|
shale-producing Permian Basin and allows the company to reduce costs, concerns about the financing needed to complete the transaction weighed on Occidental’s stock price.
Shares of apparel retailer Gap weighed on relative performance amid a more challenging environment for retail stocks in general. Gap has also missed earnings guidance in recent quarters due to weaker same-store sales comparisons and pressure from higher tariff and labor costs. Gap’s decision to spin off its Old Navy brand has also created greater uncertainty around the stock.
Thank you for your participation in Franklin Rising Dividends VIP Fund. We look forward to continuing to serve your investment needs.
The foregoing information reflects our analysis, opinions and portfolio holdings as of December 31, 2019, the end of the reporting period. The way we implement our main investment strategies and the resulting portfolio holdings may change depending on factors such as market and economic conditions. These opinions may not be relied upon as investment advice or an offer for a particular security. The information is not a complete analysis of every aspect of any market, country, industry, security or the Fund. Statements of fact are from sources considered reliable, but the investment manager makes no representation or warranty as to their completeness or accuracy. Although historical performance is no guarantee of future results, these insights may help you understand our investment management philosophy.
FRANKLIN RISING DIVIDENDS VIP FUND
Class 4 Fund Expenses
As an investor in a variable insurance contract (Contract) that indirectly provides for investment in an underlying mutual fund, you can incur transaction and/or ongoing expenses at both the Fund level and the Contract Level: (1) transaction expenses can include sales charges (loads) on purchases, surrender fees, transfer fees and premium taxes; and (2) ongoing expenses can include management fees, distribution and service(12b-1) fees, contract fees, annual maintenance fees, mortality and expense risk fees and other fees and expenses. All mutual funds and Contracts have some types of ongoing expenses. The table below shows Fund-level ongoing expenses and can help you understand these costs and compare them with those of other mutual funds offered through the Contract. The table assumes a $1,000 investment held for the six months indicated. Please refer to the Fund prospectus for additional information on operating expenses.
Actual Fund Expenses
The table below provides information about the actual account values and actual expenses in the columns under the heading “Actual.” In these columns the Fund’s actual return, which includes the effect of ongoing Fund expenses but does not include the effect of ongoing Contract expenses, is used to calculate the “Ending Account Value.” You can estimate the Fund-level expenses you paid during the period by following these steps (of course, your account value and expenses will differ from those in this illustration): Divide your account value by $1,000 (if your account had an $8,600 value, then $8,600÷ $1,000 =8.6). Then multiply the result by the number under the headings “Actual” and “Fund-Level Expenses Paid During Period” (if Fund-Level Expenses Paid During Period were $ 7.50, then 8.6 x $ 7.50 = $64.50). In this illustration, the estimated expenses paid this period at the Fund level are $64.50.
Hypothetical Example for Comparison with Other Mutual Funds
Under the heading “Hypothetical” in the table, information is provided about hypothetical account values and hypothetical expenses based on the Fund’s actual expense ratio and an assumed rate of return of 5% per year before expenses, which is not the Fund’s actual return. This information may not be used to estimate the actual ending account balance or expenses you paid for the period, but it can help you compare ongoing costs of investing in the Fund with those of other mutual funds offered through the Contract. To do so, compare this 5% hypothetical example with the 5% hypothetical examples that appear in the shareholder reports of other funds offered through the Contract.
Please note that expenses shown in the table are meant to highlight ongoing costs at the Fund level only and do not reflect any ongoing expenses at the Contract level, or transaction expenses at either the Fund or Contract levels. In addition, while the Fund does not have transaction expenses, if the transaction and ongoing expenses at the Contract level were included, the expenses shown below would be higher. You should consult your Contract prospectus or disclosure document for more information.
| | | | | | | | | | | | |
| | | | | Actual | | Hypothetical | | |
| | | | | (actual return after expenses) | | (5% annual return before expenses) | | |
| | | | | | | | |
Share
Class | | Beginning
Account
Value 7/1/19 | | Ending
Account
Value 12/31/19 | | Fund-Level
Expenses
Paid During
Period
7/1/19–12/31/191, 2 | | Ending
Account
Value 12/31/19 | | Fund-Level
Expenses
Paid During
Period 7/1/19–12/31/191, 2 | | Net
Annualized
Expense
Ratio2 |
| | | | | | |
| | | | | | |
| Class 4 | | $1,000 | | $1,073.80 | | $5.12 | | $1,020.27 | | $4.99 | | 0.98% |
1. Expenses are equal to the annualized expense ratio for thesix-month period as indicated above—in the far right column—multiplied by the simple average account value over the period indicated, and then multiplied by 184/365 to reflect theone-half year period.
2. Reflects expenses after fee waivers and expense reimbursements. Does not include any ongoing expenses of the Contract for which the Fund is an investment option or acquired fund fees and expenses.
FRANKLIN TEMPLETON VARIABLE INSURANCE PRODUCTS TRUST
Financial Highlights
Franklin Rising Dividends VIP Fund
| | | | | | | | | | | | | | | | | | |
| | | | | Year Ended December 31, | | | |
| | | |
| | | 2019 | | 2018 | | | 2017 | | | 2016 | | | 2015 |
|
| | | | | |
Class 1 | | | | | | | | | | | | | | | | | | |
| | | | | |
Per share operating performance (for a share outstanding throughout the year) | | | | | | | | | | | | | | | | | | |
| | | | | |
Net asset value, beginning of year | | | $25.75 | | | | $29.21 | | | | $25.51 | | | | $25.26 | | | $29.63 |
| | | |
| | | | | |
Income from investment operationsa: | | | | | | | | | | | | | | | | | | |
| | | | | |
Net investment incomeb | | | 0.37 | | | | 0.39 | | | | 0.40 | | | | 0.42 | | | 0.45 |
| | | | | |
Net realized and unrealized gains (losses) | | | 6.77 | | | | (1.65 | ) | | | 4.76 | | | | 3.45 | | | (1.33) |
| | | |
| | | | | |
Total from investment operations | | | 7.14 | | | | (1.26 | ) | | | 5.16 | | | | 3.87 | | | (0.88) |
| | | |
| | | | | |
Less distributions from: | | | | | | | | | | | | | | | | | | |
| | | | | |
Net investment income | | | (0.45 | ) | | | (0.44 | ) | | | (0.48 | ) | | | (0.44 | ) | | (0.48) |
| | | | | |
Net realized gains | | | (4.54 | ) | | | (1.76 | ) | | | (0.98 | ) | | | (3.18 | ) | | (3.01) |
| | | |
| | | | | |
Total distributions | | | (4.99 | ) | | | (2.20 | ) | | | (1.46 | ) | | | (3.62 | ) | | (3.49) |
| | | |
| | | | | |
Net asset value, end of year | | | $27.90 | | | | $25.75 | | | | $29.21 | | | | $25.51 | | | $25.26 |
| | | |
| | | | | |
Total returnc | | | 29.58% | | | | (4.84)% | | | | 20.85% | | | | 16.33% | | | (3.42)% |
| | | | | |
Ratios to average net assets | | | | | | | | | | | | | | | | | | |
| | | | | |
Expenses before waiver and payments by affiliates | | | 0.63% | | | | 0.62% | | | | 0.62% | | | | 0.63% | | | 0.63% |
| | | | | |
Expenses net of waiver and payments by affiliates | | | 0.63% | d,e | | | 0.62% | d,e | | | 0.62% | d,e | | | 0.62% | d | | 0.63%e |
| | | | | |
Net investment income | | | 1.34% | | | | 1.38% | | | | 1.49% | | | | 1.67% | | | 1.65% |
| | | | | |
Supplemental data | | | | | | | | | | | | | | | | | | |
| | | | | |
Net assets, end of year (000’s) | | | $150,864 | | | | $157,838 | | | | $216,015 | | | | $181,072 | | | $143,376 |
| | | | | |
Portfolio turnover rate | | | 7.26% | f | | | 3.09% | f | | | 3.36% | | | | 6.66% | | | 4.74% |
aThe amount shown for a share outstanding throughout the period may not correlate with the Statement of Operations for the period due to the timing of sales and repurchases of the Fund’s shares in relation to income earned and/or fluctuating fair value of the investments of the Fund.
bBased on average daily shares outstanding.
cTotal return does not include fees, charges or expenses imposed by the variable annuity and life insurance contracts for which Franklin Templeton Variable Insurance Products Trust serves as an underlying investment vehicle.
dBenefit of expense reduction rounds to less than 0.01%.
eBenefit of waiver and payments by affiliates rounds to less than 0.01%.
fExcludes the value of portfolio securities delivered as a result of redemptionsin-kind. See Note 8.
| | | | |
| | | |
FRD-6 | | Annual Report | The accompanying notes are an integral part of these financial statements. | | |
FRANKLIN TEMPLETON VARIABLE INSURANCE PRODUCTS TRUST
FINANCIAL HIGHLIGHTS
Franklin Rising Dividends VIP Fund(continued)
| | | | | | | | | | | | | | | | | | | | |
| | | | | | Year Ended December 31, | | | | |
| | | | | |
| | | 2019 | | | 2018 | | | 2017 | | | 2016 | | | 2015 | |
| | | | | |
Class 2 | | | | | | | | | | | | | | | | | | | | |
| | | | | |
Per share operating performance (for a share outstanding throughout the year) | | | | | | | | | | | | | | | | | | | | |
Net asset value, beginning of year | | | $25.04 | | | | $28.46 | | | | $24.89 | | | | $24.72 | | | | $29.06 | |
| | | | | |
Income from investment operationsa: | | | | | | | | | | | | | | | | | | | | |
| | | | | |
Net investment incomeb | | | 0.29 | | | | 0.31 | | | | 0.33 | | | | 0.35 | | | | 0.37 | |
| | | | | |
Net realized and unrealized gains (losses) | | | 6.57 | | | | (1.61 | ) | | | 4.63 | | | | 3.37 | | | | (1.29 | ) |
| | | | | |
Total from investment operations | | | 6.86 | | | | (1.30 | ) | | | 4.96 | | | | 3.72 | | | | (0.92 | ) |
| | | | | |
Less distributions from: | | | | | | | | | | | | | | | | | | | | |
| | | | | |
Net investment income | | | (0.37 | ) | | | (0.36 | ) | | | (0.41 | ) | | | (0.37 | ) | | | (0.41 | ) |
| | | | | |
Net realized gains | | | (4.54 | ) | | | (1.76 | ) | | | (0.98 | ) | | | (3.18 | ) | | | (3.01 | ) |
| | | | | |
Total distributions | | | (4.91 | ) | | | (2.12 | ) | | | (1.39 | ) | | | (3.55 | ) | | | (3.42 | ) |
| | | | | |
Net asset value, end of year | | | $26.99 | | | | $25.04 | | | | $28.46 | | | | $24.89 | | | | $24.72 | |
| | | | | |
Total returnc | | | 29.23% | | | | (5.07)% | | �� | | 20.56% | | | | 16.04% | | | | (3.65)% | |
| | | | | |
Ratios to average net assets | | | | | | | | | | | | | | | | | | | | |
| | | | | |
Expenses before waiver and payments by affiliates | | | 0.88% | | | | 0.87% | | | | 0.87% | | | | 0.88% | | | | 0.88% | |
| | | | | |
Expenses net of waiver and payments by affiliates | | | 0.88% | d,e | | | 0.87% | d,e | | | 0.87% | d,e | | | 0.87% | d | | | 0.88% | e |
| | | | | |
Net investment income | | | 1.09% | | | | 1.13% | | | | 1.24% | | | | 1.42% | | | | 1.40% | |
| | | | | |
Supplemental data | | | | | | | | | | | | | | | | | | | | |
| | | | | |
Net assets, end of year (000’s) | | | $1,387,688 | | | | $1,106,334 | | | | $1,640,883 | | | | $1,530,374 | | | | $1,310,783 | |
| | | | | |
Portfolio turnover rate | | | 7.26% | f | | | 3.09% | f | | | 3.36% | | | | 6.66% | | | | 4.74% | |
aThe amount shown for a share outstanding throughout the period may not correlate with the Statement of Operations for the period due to the timing of sales and repurchases of the Fund’s shares in relation to income earned and/or fluctuating fair value of the investments of the Fund.
bBased on average daily shares outstanding.
cTotal return does not include fees, charges or expenses imposed by the variable annuity and life insurance contracts for which Franklin Templeton Variable Insurance Products Trust serves as an underlying investment vehicle.
dBenefit of expense reduction rounds to less than 0.01%.
eBenefit of waiver and payments by affiliates rounds to less than 0.01%.
fExcludes the value of portfolio securities delivered as a result of redemptionsin-kind. See Note 8.
| | | | |
| | | |
| | The accompanying notes are an integral part of these financial statements. | Annual Report | | FRD-7 |
FRANKLIN TEMPLETON VARIABLE INSURANCE PRODUCTS TRUST
FINANCIAL HIGHLIGHTS
Franklin Rising Dividends VIP Fund(continued)
| | | | | | | | | | | | | | | | | | | | |
| | | | | | Year Ended December 31, | | | | |
| | | 2019 | | | 2018 | | | 2017 | | | 2016 | | | 2015 | |
| | | | | |
Class 4 | | | | | | | | | | | | | | | | | | | | |
| | | | | |
Per share operating performance (for a share outstanding throughout the year) | | | | | | | | | | | | | | | | | | | | |
| | | | | |
Net asset value, beginning of year | | | $25.11 | | | | $28.54 | | | | $24.98 | | | | $24.81 | | | | $29.19 | |
| | | | | |
Income from investment operationsa: | | | | | | | | | | | | | | | | | | | | |
| | | | | |
Net investment incomeb | | | 0.26 | | | | 0.29 | | | | 0.30 | | | | 0.32 | | | | 0.35 | |
| | | | | |
Net realized and unrealized gains (losses) | | | 6.60 | | | | (1.62 | ) | | | 4.65 | | | | 3.39 | | | | (1.31 | ) |
| | | | | |
Total from investment operations | | | 6.86 | | | | (1.33 | ) | | | 4.95 | | | | 3.71 | | | | (0.96 | ) |
| | | | | |
Less distributions from: | | | | | | | | | | | | | | | | | | | | |
| | | | | |
Net investment income | | | (0.35 | ) | | | (0.34 | ) | | | (0.41 | ) | | | (0.36 | ) | | | (0.41 | ) |
| | | | | |
Net realized gains | | | (4.54 | ) | | | (1.76 | ) | | | (0.98 | ) | | | (3.18 | ) | | | (3.01 | ) |
| | | | | |
Total distributions | | | (4.89 | ) | | | (2.10 | ) | | | (1.39 | ) | | | (3.54 | ) | | | (3.42 | ) |
| | | | | |
Net asset value, end of year | | | $27.08 | | | | $25.11 | | | | $28.54 | | | | $24.98 | | | | $24.81 | |
| | | | | |
Total returnc | | | 29.16% | | | | (5.16)% | | | | 20.40% | | | | 15.93% | | | | (3.75)% | |
| | | | | |
Ratios to average net assets | | | | | | | | | | | | | | | | | | | | |
| | | | | |
Expenses before waiver and payments by affiliates | | | 0.98% | | | | 0.97% | | | | 0.97% | | | | 0.98% | | | | 0.98% | |
| | | | | |
Expenses net of waiver and payments by affiliates | | | 0.98% | d,e | | | 0.97% | d,e | | | 0.97% | d,e | | | 0.97% | d | | | 0.98% | e |
| | | | | |
Net investment income | | | 0.99% | | | | 1.03% | | | | 1.14% | | | | 1.32% | | | | 1.30% | |
| | | | | |
Supplemental data | | | | | | | | | | | | | | | | | | | | |
| | | | | |
Net assets, end of year (000’s) | | | $46,539 | | | | $32,825 | | | | $36,407 | | | | $28,579 | | | | $20,453 | |
| | | | | |
Portfolio turnover rate | | | 7.26% | f | | | 3.09% | f | | | 3.36% | | | | 6.66% | | | | 4.74% | |
aThe amount shown for a share outstanding throughout the period may not correlate with the Statement of Operations for the period due to the timing of sales and repurchases of the Fund’s shares in relation to income earned and/or fluctuating fair value of the investments of the Fund.
bBased on average daily shares outstanding.
cTotal return does not include fees, charges or expenses imposed by the variable annuity and life insurance contracts for which Franklin Templeton Variable Insurance Products Trust serves as an underlying investment vehicle.
dBenefit of expense reduction rounds to less than 0.01%.
eBenefit of waiver and payments by affiliates rounds to less than 0.01%.
fExcludes the value of portfolio securities delivered as a result of redemptionsin-kind. See Note 8.
| | | | |
| | | |
FRD-8 | | Annual Report | The accompanying notes are an integral part of these financial statements. | | |
FRANKLIN TEMPLETON VARIABLE INSURANCE PRODUCTS TRUST
Statement of Investments, December 31, 2019
Franklin Rising Dividends VIP Fund
| | | | | | | | |
| | | Shares | | | Value | |
| | |
Common Stocks 98.7% | | | | | | | | |
Aerospace & Defense 6.6% | | | | | | | | |
The Boeing Co. | | | 54,325 | | | $ | 17,696,912 | |
General Dynamics Corp. | | | 159,352 | | | | 28,101,725 | |
Raytheon Co. | | | 111,624 | | | | 24,528,258 | |
United Technologies Corp. | | | 223,607 | | | | 33,487,384 | |
| | |
| | | | | | | 103,814,279 | |
| | |
Building Products 1.4% | | | | | | | | |
Johnson Controls International PLC | | | 552,410 | | | | 22,488,611 | |
| | |
Commercial & Professional Services 2.2% | | | | | | | | |
Cintas Corp. | | | 104,872 | | | | 28,218,958 | |
Matthews International Corp., A | | | 182,117 | | | | 6,951,406 | |
| | |
| | | | | | | 35,170,364 | |
| | |
Consumer Durables & Apparel 2.1% | | | | | | | | |
NIKE Inc., B | | | 320,284 | | | | 32,447,972 | |
| | |
Consumer Services 1.7% | | | | | | | | |
McDonald’s Corp. | | | 135,599 | | | | 26,795,718 | |
| | |
Diversified Financials 0.3% | | | | | | | | |
State Street Corp. | | | 57,541 | | | | 4,551,493 | |
| | |
Electrical Equipment 0.6% | | | | | | | | |
nVent Electric PLC | | | 383,926 | | | | 9,820,827 | |
| | |
Energy 5.2% | | | | | | | | |
aApergy Corp. | | | 186,565 | | | | 6,302,166 | |
Chevron Corp. | | | 174,594 | | | | 21,040,323 | |
EOG Resources Inc. | | | 190,961 | | | | 15,994,893 | |
Exxon Mobil Corp. | | | 160,861 | | | | 11,224,881 | |
Occidental Petroleum Corp. | | | 308,985 | | | | 12,733,272 | |
Schlumberger Ltd. | | | 358,692 | | | | 14,419,418 | |
| | |
| | | | | | | 81,714,953 | |
| | |
Food & Staples Retailing 1.5% | | | | | | | | |
Walgreens Boots Alliance Inc. | | | 18,077 | | | | 1,065,820 | |
Walmart Inc. | | | 196,608 | | | | 23,364,895 | |
| | |
| | | | | | | 24,430,715 | |
| | |
Food, Beverage & Tobacco 4.2% | | | | | | | | |
Bunge Ltd. | | | 269,004 | | | | 15,481,180 | |
McCormick & Co. Inc. | | | 150,647 | | | | 25,569,316 | |
PepsiCo Inc. | | | 191,430 | | | | 26,162,738 | |
| | |
| | | | | | | 67,213,234 | |
| | |
Health Care Equipment & Services 15.4% | | | | | | | | |
Abbott Laboratories | | | 349,995 | | | | 30,400,566 | |
Becton, Dickinson and Co. | | | 202,415 | | | | 55,050,808 | |
CVS Health Corp. | | | 167,393 | | | | 12,435,626 | |
Dentsply Sirona Inc. | | | 59,392 | | | | 3,360,993 | |
Medtronic PLC | | | 438,254 | | | | 49,719,916 | |
FRANKLIN TEMPLETON VARIABLE INSURANCE PRODUCTS TRUST
STATEMENT OF INVESTMENTS
Franklin Rising Dividends VIP Fund(continued)
| | | | | | | | |
| | | Shares | | | Value | |
| | |
Common Stocks(continued) | | | | | | | | |
Health Care Equipment & Services(continued) | | | | | | | | |
Stryker Corp. | | | 288,545 | | | $ | 60,577,137 | |
West Pharmaceutical Services Inc. | | | 219,601 | | | | 33,012,618 | |
| | |
| | | | | | | 244,557,664 | |
| | |
Household & Personal Products 2.9% | | | | | | | | |
Colgate-Palmolive Co. | | | 273,440 | | | | 18,823,610 | |
The Procter & Gamble Co. | | | 220,394 | | | | 27,527,210 | |
| | |
| | | | | | | 46,350,820 | |
| | |
Industrial Conglomerates 9.7% | | | | | | | | |
Carlisle Cos. Inc. | | | 69,002 | | | | 11,167,284 | |
Honeywell International Inc. | | | 318,575 | | | | 56,387,775 | |
Roper Technologies Inc. | | | 245,183 | | | | 86,851,174 | |
| | |
| | | | | | | 154,406,233 | |
| | |
Insurance 1.7% | | | | | | | | |
Aflac Inc. | | | 257,104 | | | | 13,600,802 | |
Erie Indemnity Co., A | | | 76,670 | | | | 12,727,220 | |
| | |
| | | | | | | 26,328,022 | |
| | |
Machinery 3.4% | | | | | | | | |
Donaldson Co. Inc. | | | 205,297 | | | | 11,829,213 | |
Dover Corp. | | | 233,088 | | | | 26,865,723 | |
Pentair PLC | | | 340,594 | | | | 15,623,047 | |
| | |
| | | | | | | 54,317,983 | |
| | |
Materials 11.2% | | | | | | | | |
Air Products and Chemicals Inc. | | | 229,667 | | | | 53,969,448 | |
Albemarle Corp. | | | 528,947 | | | | 38,634,289 | |
Ecolab Inc. | | | 100,809 | | | | 19,455,129 | |
Linde PLC (United Kingdom) | | | 275,532 | | | | 58,660,763 | |
Nucor Corp. | | | 130,102 | | | | 7,322,140 | |
| | |
| | | | | | | 178,041,769 | |
| | |
Media & Entertainment 0.1% | | | | | | | | |
John Wiley & Sons Inc., A | | | 31,848 | | | | 1,545,265 | |
| | |
Pharmaceuticals, Biotechnology & Life Sciences 3.7% | | | | | | | | |
AbbVie Inc. | | | 134,736 | | | | 11,929,525 | |
Johnson & Johnson | | | 220,129 | | | | 32,110,217 | |
Perrigo Co. PLC | | | 119,563 | | | | 6,176,625 | |
Pfizer Inc. | | | 204,715 | | | | 8,020,734 | |
| | |
| | | | | | | 58,237,101 | |
| | |
Retailing 4.1% | | | | | | | | |
Lowe’s Cos. Inc. | | | 102,872 | | | | 12,319,951 | |
Ross Stores Inc. | | | 166,730 | | | | 19,410,706 | |
Target Corp. | | | 128,337 | | | | 16,454,087 | |
Tiffany & Co. | | | 120,530 | | | | 16,108,834 | |
| | |
| | | | | | | 64,293,578 | |
FRANKLIN TEMPLETON VARIABLE INSURANCE PRODUCTS TRUST
STATEMENT OF INVESTMENTS
Franklin Rising Dividends VIP Fund(continued)
| | | | | | | | |
| | | Shares | | | Value | |
| | |
Common Stocks(continued) | | | | | | | | |
Semiconductors & Semiconductor Equipment 6.4% | | | | | | | | |
Analog Devices Inc. | | | 422,419 | | | $ | 50,200,274 | |
Texas Instruments Inc. | | | 395,268 | | | | 50,708,932 | |
| | |
| | | | | | | 100,909,206 | |
Software & Services 12.0% | | | | | | | | |
Accenture PLC, A | | | 285,378 | | | | 60,092,045 | |
Microsoft Corp. | | | 723,328 | | | | 114,068,826 | |
Visa Inc., A | | | 80,662 | | | | 15,156,390 | |
| | |
| | | | | | | 189,317,261 | |
Trading Companies & Distributors 0.7% | | | | | | | | |
W.W. Grainger Inc. | | | 34,393 | | | | 11,642,718 | |
| | |
Transportation 1.6% | | | | | | | | |
Norfolk Southern Corp. | | | 45,047 | | | | 8,744,974 | |
United Parcel Service Inc., B | | | 143,967 | | | | 16,852,777 | |
| | |
| | | | | | | 25,597,751 | |
| | |
Total Common Stocks (Cost $759,125,903) | | | | | | | 1,563,993,537 | |
| | |
Short Term Investments (Cost $17,735,928) 1.1% | | | | | | | | |
| | |
Money Market Funds 1.1% | | | | | | | | |
b,c Institutional Fiduciary Trust Money Market Portfolio, 1.26% | | | 17,735,928 | | | | 17,735,928 | |
| | |
Total Investments (Cost $776,861,831) 99.8% | | | | | | | 1,581,729,465 | |
Other Assets, less Liabilities 0.2% | | | | | | | 3,361,835 | |
| | |
Net Assets 100.0% | | | | | | $ | 1,585,091,300 | |
aNon-income producing.
bSee Note 3(e) regarding investments in affiliated management investment companies.
cThe rate shown is the annualizedseven-day effective yield at period end.
| | | | |
| | | |
| | The accompanying notes are an integral part of these financial statements. | Annual Report | | FRD-11 |
FRANKLIN TEMPLETON VARIABLE INSURANCE PRODUCTS TRUST
FINANCIAL STATEMENTS
Statement of Assets and Liabilities
December 31, 2019
| | | | |
| | | Franklin Rising
Dividends VIP
Fund | |
| |
Assets: | | | | |
Investments in securities: | | | | |
Cost - Unaffiliated issuers | | $ | 759,125,903 | |
Cost -Non-controlled affiliates (Note 3e) | | | 17,735,928 | |
Value - Unaffiliated issuers | | $ | 1,563,993,537 | |
Value -Non-controlled affiliates (Note 3e) | | | 17,735,928 | |
Receivables: | | | | |
Investment securities sold | | | 6,295,282 | |
Capital shares sold | | | 306,378 | |
Dividends | | | 2,118,202 | |
Other assets | | | 163 | |
Total assets | | | 1,590,449,490 | |
| |
Liabilities: | | | | |
Payables: | | | | |
Investment securities purchased | | | 3,159,159 | |
Capital shares redeemed | | | 885,425 | |
Management fees | | | 821,044 | |
Distribution fees | | | 305,489 | |
Accrued expenses and other liabilities | | | 187,073 | |
Total liabilities | | | 5,358,190 | |
Net assets, at value | | | $1,585,091,300 | |
| |
Net assets consist of: | | | | |
Paid-in capital | | $ | 693,868,963 | |
Total distributable earnings (losses) | | | 891,222,337 | |
Net assets, at value | | | $1,585,091,300 | |
| |
Class 1: | | | | |
Net assets, at value | | | $ 150,864,298 | |
Shares outstanding | | | 5,407,633 | |
Net asset value and maximum offering price per share | | | $27.90 | |
| |
Class 2: | | | | |
Net assets, at value | | | $1,387,688,420 | |
Shares outstanding | | | 51,407,676 | |
Net asset value and maximum offering price per share | | | $26.99 | |
| |
Class 4: | | | | |
Net assets, at value | | $ | 46,538,582 | |
Shares outstanding | | | 1,718,696 | |
Net asset value and maximum offering price per share | | | $27.08 | |
| | | | |
| | | |
FRD-12 | | Annual Report | The accompanying notes are an integral part of these financial statements. | | |
FRANKLIN TEMPLETON VARIABLE INSURANCE PRODUCTS TRUST
FINANCIAL STATEMENTS
Statement of Operations
for the year ended December 31, 2019
| | | | |
| | | Franklin Rising Dividends VIP Fund | |
| |
| |
Investment income: | | | | |
Dividends: | | | | |
Unaffiliated issuers | | | $ 29,959,717 | |
Non-controlled affiliates (Note 3e) | | | 615,331 | |
| | | | |
| |
Total investment income | | | 30,575,048 | |
| | | | |
Expenses: | | | | |
Management fees (Note 3a) | | | 9,600,864 | |
Distribution fees: (Note 3c) | | | | |
Class 2 | | | 3,334,309 | |
Class 4 | | | 136,693 | |
Custodian fees (Note 4) | | | 13,898 | |
Reports to shareholders | | | 176,250 | |
Professional fees | | | 57,984 | |
Trustees’ fees and expenses | | | 9,165 | |
Other | | | 35,092 | |
| | | | |
| |
Total expenses | | | 13,364,255 | |
Expense reductions (Note 4) | | | (1,496 | ) |
Expenses waived/paid by affiliates (Note 3e) | | | (109,752 | ) |
| | | | |
| |
Net expenses | | | 13,253,007 | |
| | | | |
| |
Net investment income | | | 17,322,041 | |
| | | | |
| |
Realized and unrealized gains (losses): | | | | |
Net realized gain (loss) from: | | | | |
Investments:+ | | | | |
Unaffiliated issuers | | | 82,812,044 | |
| | | | |
Net change in unrealized appreciation (depreciation) on: | | | | |
Investments: | | | | |
Unaffiliated issuers | | | 279,796,675 | |
| | | | |
| |
Net realized and unrealized gain (loss) | | | 362,608,719 | |
| | | | |
| |
Net increase (decrease) in net assets resulting from operations | | | $379,930,760 | |
| | | | |
| |
+Includes gains from a redemptionin-kind (Note 8) | | | $ 10,655,992 | |
| | | | |
| | | |
| | The accompanying notes are an integral part of these financial statements. | Annual Report | | FRD-13 |
FRANKLIN TEMPLETON VARIABLE INSURANCE PRODUCTS TRUST
FINANCIAL STATEMENTS
Statements of Changes in Net Assets
| | | | | | | | |
| | | Franklin Rising Dividends VIP Fund | |
| |
| | | Year Ended December 31, | |
| | |
| | | 2019 | | | 2018 | |
| | |
Increase (decrease) in net assets: | | | | | | | | |
Operations: | | | | | | | | |
Net investment income | | | $ 17,322,041 | | | $ | 20,055,601 | |
Net realized gain (loss) | | | 82,812,044 | | | | 314,858,432 | |
Net change in unrealized appreciation (depreciation) | | | 279,796,675 | | | | (398,447,639 | ) |
| | | | |
| | |
Net increase (decrease) in net assets resulting from operations | | | 379,930,760 | | | | (63,533,606 | ) |
| | | | |
Distributions to shareholders: | | | | | | | | |
Class 1 | | | (28,799,833 | ) | | | (13,329,516 | ) |
Class 2 | | | (227,983,493 | ) | | | (115,786,937 | ) |
Class 4 | | | (6,300,776 | ) | | | (2,574,964 | ) |
| | | | |
| | |
Total distributions to shareholders | | | (263,084,102 | ) | | | (131,691,417 | ) |
| | | | |
| | |
Capital share transactions: (Note 2) | | | | | | | | |
Class 1 | | | (21,678,109 | ) | | | (37,447,873 | ) |
Class 2 | | | 182,626,753 | | | | (364,402,663 | ) |
Class 4 | | | 10,299,225 | | | | 766,328 | |
| | | | |
| | |
Total capital share transactions | | | 171,247,869 | | | | (401,084,208 | ) |
| | | | |
Net increase (decrease) in net assets | | | 288,094,527 | | | | (596,309,231 | ) |
Net assets: | | | | | | | | |
Beginning of year | | | 1,296,996,773 | | | | 1,893,306,004 | |
| | | | |
| | |
End of year | | | $1,585,091,300 | | | $ | 1,296,996,773 | |
| | | | |
| | | | |
| | | |
FRD-14 | | Annual Report | The accompanying notes are an integral part of these financial statements. | | |
FRANKLIN TEMPLETON VARIABLE INSURANCE PRODUCTS TRUST
Notes to Financial Statements
Franklin Rising Dividends VIP Fund
1. Organization and Significant Accounting Policies
Franklin Templeton Variable Insurance Products Trust (Trust) is registered under the Investment Company Act of 1940 (1940 Act) as anopen-end management investment company, consisting of eighteen separate funds and applies the specialized accounting and reporting guidance in U.S. Generally Accepted Accounting Principles (U.S. GAAP). Franklin Rising Dividends VIP Fund (Fund) is included in this report. Shares of the Fund are generally sold only to insurance company separate accounts to fund the benefits of variable life insurance policies or variable annuity contracts. The Fund offers three classes of shares: Class 1, Class 2 and Class 4. Each class of shares may differ by its distribution fees, voting rights on matters affecting a single class and its exchange privilege.
The following summarizes the Fund’s significant accounting policies.
a. Financial Instrument Valuation
The Fund’s investments in financial instruments are carried at fair value daily. Fair value is the price that would be received to sell an asset or paid to transfer a liability in an orderly transaction between market participants on the measurement date. The Fund calculates the net asset value (NAV) per share each business day as of 4 p.m. Eastern time or the regularly scheduled close of the New York Stock Exchange (NYSE), whichever is earlier. Under compliance policies and procedures approved by the Trust’s Board of Trustees (the Board), the Fund’s administrator has responsibility for oversight of valuation, including leading the cross-functional Valuation Committee (VC). The Fund may utilize independent pricing services, quotations from securities and financial instrument dealers, and other market sources to determine fair value.
Equity securities listed on an exchange or on the NASDAQ National Market System are valued at the last quoted sale price or the official closing price of the day, respectively. Foreign equity securities are valued as of the close of trading on the foreign stock exchange on which the security is primarily traded, or as of 4 p.m. Eastern time. The value is then converted into its U.S. dollar equivalent at the foreign exchange rate in effect at 4 p.m. Eastern time on the day that the value of the security is determined.Over-the-counter (OTC) securities are valued within the range of the most recent quoted bid and ask prices. Securities that trade in multiple markets or on multiple exchanges are valued
according to the broadest and most representative market. Certain equity securities are valued based upon fundamental characteristics or relationships to similar securities.
Investments inopen-end mutual funds are valued at the closing NAV.
The Fund has procedures to determine the fair value of financial instruments for which market prices are not reliable or readily available. Under these procedures, the Fund primarily employs a market-based approach which may use related or comparable assets or liabilities, recent transactions, market multiples, book values, and other relevant information for the investment to determine the fair value of the investment. An income-based valuation approach may also be used in which the anticipated future cash flows of the investment are discounted to calculate fair value. Discounts may also be applied due to the nature or duration of any restrictions on the disposition of the investments. Due to the inherent uncertainty of valuations of such investments, the fair values may differ significantly from the values that would have been used had an active market existed.
Trading in securities on foreign securities stock exchanges and OTC markets may be completed before 4 p.m. Eastern time. In addition, trading in certain foreign markets may not take place on every Fund’s business day. Occasionally, events occur between the time at which trading in a foreign security is completed and 4 p.m. Eastern time that might call into question the reliability of the value of a portfolio security held by the Fund. As a result, differences may arise between the value of the Fund’s portfolio securities as determined at the foreign market close and the latest indications of value at 4 p.m. Eastern time. In order to minimize the potential for these differences, the VC monitors price movements following the close of trading in foreign stock markets through a series of country specific market proxies (such as baskets of American Depositary Receipts, futures contracts and exchange traded funds). These price movements are measured against established trigger thresholds for each specific market proxy to assist in determining if an event has occurred that may call into question the reliability of the values of the foreign securities held by the Fund. If such an event occurs, the securities may be valued using fair value procedures, which may include the use of independent pricing services.
FRANKLIN TEMPLETON VARIABLE INSURANCE PRODUCTS TRUST
NOTES TO FINANCIAL STATEMENTS
Franklin Rising Dividends VIP Fund(continued)
1. Organization and Significant Accounting Policies(continued)
a. Financial Instrument Valuation(continued)
When the last day of the reporting period is anon-business day, certain foreign markets may be open on those days that the Fund’s NAV is not calculated, which could result in differences between the value of the Fund’s portfolio securities on the last business day and the last calendar day of the reporting period. Any significant security valuation changes due to an open foreign market are adjusted and reflected by the Fund for financial reporting purposes.
b. Foreign Currency Translation
Portfolio securities and other assets and liabilities denominated in foreign currencies are translated into U.S. dollars based on the exchange rate of such currencies against U.S. dollars on the date of valuation. The Fund may enter into foreign currency exchange contracts to facilitate transactions denominated in a foreign currency. Purchases and sales of securities, income and expense items denominated in foreign currencies are translated into U.S. dollars at the exchange rate in effect on the transaction date. Portfolio securities and assets and liabilities denominated in foreign currencies contain risks that those currencies will decline in value relative to the U.S. dollar. Occasionally, events may impact the availability or reliability of foreign exchange rates used to convert the U.S. dollar equivalent value. If such an event occurs, the foreign exchange rate will be valued at fair value using procedures established and approved by the Board.
The Fund does not separately report the effect of changes in foreign exchange rates from changes in market prices on securities held. Such changes are included in net realized and unrealized gain or loss from investments in the Statement of Operations.
Realized foreign exchange gains or losses arise from sales of foreign currencies, currency gains or losses realized between the trade and settlement dates on securities transactions and the difference between the recorded amounts of dividends, interest, and foreign withholding taxes and the U.S. dollar equivalent of the amounts actually received or paid. Net unrealized foreign exchange gains and losses arise from changes in foreign exchange rates on foreign denominated assets and liabilities other than investments in securities held at the end of the reporting period.
c. Income and Deferred Taxes
It is the Fund’s policy to qualify as a regulated investment company under the Internal Revenue Code. The Fund intends to distribute to shareholders substantially all of its taxable income and net realized gains to relieve it from federal income and if applicable, excise taxes. As a result, no provision for U.S. federal income taxes is required.
The Fund may be subject to foreign taxation related to income received, capital gains on the sale of securities and certain foreign currency transactions in the foreign jurisdictions in which it invests. Foreign taxes, if any, are recorded based on the tax regulations and rates that exist in the foreign markets in which the Fund invests. When a capital gain tax is determined to apply, the Fund records an estimated deferred tax liability in an amount that would be payable if the securities were disposed of on the valuation date.
The Fund may recognize an income tax liability related to its uncertain tax positions under U.S. GAAP when the uncertain tax position has a less than 50% probability that it will be sustained upon examination by the tax authorities based on its technical merits. As of December 31, 2019, the Fund has determined that no tax liability is required in its financial statements related to uncertain tax positions for any open tax years (or expected to be taken in future tax years). Open tax years are those that remain subject to examination and are based on the statute of limitations in each jurisdiction in which the Fund invests.
d. Security Transactions, Investment Income, Expenses and Distributions
Security transactions are accounted for on trade date. Realized gains and losses on security transactions are determined on a specific identification basis. Estimated expenses are accrued daily. Dividend income is recorded on theex-dividend date except for certain dividends from securities where the dividend rate is not available. In such cases, the dividend is recorded as soon as the information is received by the Fund. Distributions to shareholders are recorded on theex-dividend date. Distributable earnings are determined according to income tax regulations (tax basis) and may differ from earnings recorded in accordance with U.S. GAAP. These differences may be permanent or temporary. Permanent differences are reclassified among capital accounts to reflect their tax character. These
FRANKLIN TEMPLETON VARIABLE INSURANCE PRODUCTS TRUST
NOTES TO FINANCIAL STATEMENTS
Franklin Rising Dividends VIP Fund(continued)
reclassifications have no impact on net assets or the results of operations. Temporary differences are not reclassified, as they may reverse in subsequent periods.
Common expenses incurred by the Trust are allocated among the Funds based on the ratio of net assets of each Fund to the combined net assets of the Trust or based on the ratio of number of shareholders of each Fund to the combined number of shareholders of the Trust. Fund specific expenses are charged directly to the Fund that incurred the expense.
Realized and unrealized gains and losses and net investment income, excluding class specific expenses, are allocated daily to each class of shares based upon the relative proportion of net assets of each class. Differences in per share distributions by class are generally due to differences in class specific expenses.
e. Accounting Estimates
The preparation of financial statements in accordance with U.S. GAAP requires management to make estimates and assumptions that affect the reported amounts of assets and
liabilities at the date of the financial statements and the amounts of income and expenses during the reporting period. Actual results could differ from those estimates.
f. Guarantees and Indemnifications
Under the Trust’s organizational documents, its officers and trustees are indemnified by the Trust against certain liabilities arising out of the performance of their duties to the Trust. Additionally, in the normal course of business, the Trust, on behalf of the Fund, enters into contracts with service providers that contain general indemnification clauses. The Trust’s maximum exposure under these arrangements is unknown as this would involve future claims that may be made against the Trust that have not yet occurred. Currently, the Trust expects the risk of loss to be remote.
2. Shares of Beneficial Interest
At December 31, 2019, there were an unlimited number of shares authorized (without par value). Transactions in the Fund’s shares were as follows:
| | | | | | | | | | | | | | |
| | | Year Ended December 31, |
| | |
| | | 2019 | | | 2018 |
| | | | |
| | | Shares | | | Amount | | | Shares | | | Amount |
| | | | |
Class 1 Shares: | | | | | | | | | | | | | | |
| | | | |
Shares sold | | | 238,379 | | | $ | 6,420,546 | | | | 296,177 | | | $ 8,482,359 |
| | | | |
Shares issued in reinvestment of distributions | | | 1,132,514 | | | | 28,799,833 | | | | 481,211 | | | 13,329,516 |
| | | | |
Shares redeemed | | | (2,092,688 | ) | | | (56,898,488 | ) | | | (2,043,710 | ) | | (59,259,748) |
| | | |
| | | | |
Net increase (decrease) | | | (721,795 | ) | | $ | (21,678,109 | ) | | | (1,266,322 | ) | | $ (37,447,873) |
| | | |
| | | | |
Class 2 Shares: | | | | | | | | | | | | | | |
| | | | |
Shares sold | | | 7,298,801 | | | $ | 200,248,939 | | | | 3,479,467 | | | $ 95,894,196 |
| | | | |
Shares issued in reinvestment of distributions | | | 9,252,577 | | | | 227,983,493 | | | | 4,293,174 | | | 115,786,937 |
| | | | |
Shares redeemedin-kind (Note 8) | | | (897,175 | ) | | | (22,646,135 | ) | | | (5,455,397 | ) | | (147,395,561) |
| | | | |
Shares redeemed | | | (8,430,854 | ) | | | (222,959,544 | ) | | | (15,794,114 | ) | | (428,688,235) |
| | | |
| | | | |
Net increase (decrease) | | | 7,223,349 | | | $ | 182,626,753 | | | | (13,476,870 | ) | | $(364,402,663) |
| | | |
FRANKLIN TEMPLETON VARIABLE INSURANCE PRODUCTS TRUST
NOTES TO FINANCIAL STATEMENTS
Franklin Rising Dividends VIP Fund(continued)
2. Shares of Beneficial Interest(continued)
| | | | | | | | | | | | | | | | |
| | | Year Ended December 31, | |
| | |
| | | 2019 | | | 2018 | |
| | | | |
| | | Shares | | | Amount | | | Shares | | | Amount | |
| | | | |
Class 4 Shares: | | | | | | | | | | | | | | | | |
Shares sold | | | 415,831 | | | $ | 10,934,186 | | | | 206,879 | | | $ | 5,727,225 | |
| | | | |
Shares issued in reinvestment of distributions | | | 254,783 | | | | 6,300,776 | | | | 95,123 | | | | 2,574,964 | |
| | | | |
Shares redeemed | | | (258,933 | ) | | | (6,935,737 | ) | | | (270,440 | ) | | | (7,535,861 | ) |
| | | | |
Net increase (decrease) | | | 411,681 | | | $ | 10,299,225 | | | | 31,562 | | | $ | 766,328 | |
3. Transactions with Affiliates
Franklin Resources, Inc. is the holding company for various subsidiaries that together are referred to as Franklin Templeton. Certain officers and trustees of the Fund are also officers and/or directors of the following subsidiaries:
| | |
| Subsidiary | | Affiliation |
| |
Franklin Advisers, Inc. (Advisers) | | Investment manager |
| |
Franklin Templeton Services, LLC (FT Services) | | Administrative manager |
| |
Franklin Templeton Distributors, Inc. (Distributors) | | Principal underwriter |
| |
Franklin Templeton Investor Services, LLC (Investor Services) | | Transfer agent |
a. Management Fees
The Fund pays an investment management fee to Advisers based on the average daily net assets of the Fund as follows:
| | |
| Annualized Fee Rate | | Net Assets |
| |
0.750% | | Up to and including $500 million |
| |
0.625% | | Over $500 million, up to and including $1 billion |
| |
0.500% | | Over $1 billion, up to and including $5 billion |
| |
0.490% | | In excess of $5 billion |
For the year ended December 31, 2019, the gross effective investment management fee rate was 0.621% of the Fund’s average daily net assets.
b. Administrative Fees
Under an agreement with Advisers, FT Services provides administrative services to the Fund. The fee is paid by Advisers based on the Fund’s average daily net assets, and is not an additional expense of the Fund.
c. Distribution Fees
The Board has adopted distribution plans for Class 2 and Class 4 shares pursuant to Rule12b-1 under the 1940 Act. Under the Fund’s compensation distribution plans, the Fund pays Distributors for costs incurred in connection with the servicing, sale and distribution of the Fund’s shares up to 0.35% per year of its average daily net assets of each class. The Board has agreed to limit the current rate to 0.25% per year for Class 2. The plan year, for purposes of monitoring compliance with the maximum annual plan rates, is February 1 through January 31.
FRANKLIN TEMPLETON VARIABLE INSURANCE PRODUCTS TRUST
NOTES TO FINANCIAL STATEMENTS
Franklin Rising Dividends VIP Fund(continued)
d. Transfer Agent Fees
Investor Services, under terms of an agreement, performs shareholder servicing for the Fund and is not paid by the Fund for the services.
e. Investments in Affiliated Management Investment Companies
The Fund invests in one or more affiliated management investment companies for purposes other than exercising a controlling influence over the management or policies. Management fees paid by the Fund are waived on assets invested in the affiliated management investment companies, as noted in the Statement of Operations, in an amount not to exceed the management and administrative fees paid directly or indirectly by each affiliate. During the year ended December 31, 2019, the Fund held investments in affiliated management investment companies as follows:
| | | | | | | | | | | | | | | | | | | | | | | | | | | | | | | | |
| | | Value at
Beginning of Year | | | Purchases | | | Sales | | | Realized
Gain (Loss) | | | Net Change in Unrealized
Appreciation (Depreciation) | | | Value at
End of Year | | | Number of
Shares
Held at End of Year | | | Dividend Income | |
| | | | | | | | |
Non-Controlled Affiliates | | | | | | | | | | | | | | | | | | | | | | | | | | | | | | | | |
| | | | | | | | |
Institutional Fiduciary Trust Money Market Portfolio, 1.26% | | $ | 8,504,577 | | | $ | 239,899,829 | | | $ | (230,668,478 | ) | | | $ — | | | | $ — | | | $ | 17,735,928 | | | | 17,735,928 | | | $ | 615,331 | |
4. Expense Offset Arrangement
The Fund has entered into an arrangement with its custodian whereby credits realized as a result of uninvested cash balances are used to reduce a portion of the Fund’s custodian expenses. During the year ended December 31, 2019, the custodian fees were reduced as noted in the Statement of Operations.
5. Income Taxes
The tax character of distributions paid during the years ended December 31, 2019 and 2018, was as follows:
| | | | | | | | |
| | | 2019 | | | 2018 | |
| | |
Distributions paid from: | | | | | | | | |
| | |
Ordinary income | | $ | 20,051,545 | | | $ | 28,678,971 | |
| | |
Long term capital gain | | | 243,032,557 | | | | 103,012,446 | |
| | |
| | $ | 263,084,102 | | | $ | 131,691,417 | |
FRANKLIN TEMPLETON VARIABLE INSURANCE PRODUCTS TRUST
NOTES TO FINANCIAL STATEMENTS
Franklin Rising Dividends VIP Fund(continued)
5. Income Taxes(continued)
At December 31, 2019, the cost of investments, net unrealized appreciation (depreciation), undistributed ordinary income and undistributed long term capital gains for income tax purposes were as follows:
| | | | |
Cost of investments | | $ | 779,980,316 | |
| | | | |
| |
Unrealized appreciation | | $ | 860,356,117 | |
| |
Unrealized depreciation | | | (58,606,968 | ) |
| | | | |
| |
Net unrealized appreciation (depreciation) | | $ | 801,749,149 | |
| | | | |
| |
Distributable earnings: | | | | |
| |
Undistributed ordinary income | | $ | 20,920,086 | |
| |
Undistributed long term capital gains | | | 68,249,399 | |
| | | | |
| |
Total distributable earnings | | $ | 89,169,485 | |
| | | | |
Differences between income and/or capital gains as determined on a book basis and a tax basis are primarily due to differing treatment of gains realized onin-kind shareholder redemptions.
6. Investment Transactions
Purchases and sales of investments (excluding short term securities) for the year ended December 31, 2019, aggregated $109,585,740 and $180,665,168, respectively. Sales of investments excludesin-kind transactions of $22,345,743.
7. Credit Facility
The Fund, together with other U.S. registered and foreign investment funds (collectively, Borrowers), managed by Franklin Templeton, are borrowers in a joint syndicated senior unsecured credit facility totaling $2 billion (Global Credit Facility) which matured on February 7, 2020. This Global Credit Facility provides a source of funds to the Borrowers for temporary and emergency purposes, including the ability to meet future unanticipated or unusually large redemption requests. Effective February 7, 2020, the Borrowers renewed the Global Credit Facility for a one year term, maturing February 5, 2021, for a total of $2 billion.
Under the terms of the Global Credit Facility, the Fund shall, in addition to interest charged on any borrowings made by the Fund and other costs incurred by the Fund, pay its share of fees and expenses incurred in connection with the implementation and maintenance of the Global Credit Facility, based upon its relative share of the aggregate net assets of all of the Borrowers, including an annual commitment fee of 0.15% based upon the unused portion of the Global Credit Facility. These fees are reflected in other expenses in the Statement of Operations. During the year ended December 31, 2019, the Fund did not use the Global Credit Facility.
8. RedemptionsIn-Kind
During the years ended December 31, 2019 and 2018, the Fund realized $10,655,992 and $70,642,118, respectively, of net gains resulting from redemptionsin-kind in which a shareholder redeemed fund shares for cash and securities held by the Fund. Because such gains are not taxable to the Fund and are not distributed to remaining shareholders, they are reclassified from accumulated net realized gains topaid-in capital.
FRANKLIN TEMPLETON VARIABLE INSURANCE PRODUCTS TRUST
NOTES TO FINANCIAL STATEMENTS
Franklin Rising Dividends VIP Fund(continued)
9. Fair Value Measurements
The Fund follows a fair value hierarchy that distinguishes between market data obtained from independent sources (observable inputs) and the Fund’s own market assumptions (unobservable inputs). These inputs are used in determining the value of the Fund’s financial instruments and are summarized in the following fair value hierarchy:
| | • | | Level 1 – quoted prices in active markets for identical financial instruments |
| | • | | Level 2 – other significant observable inputs (including quoted prices for similar financial instruments, interest rates, prepayment speed, credit risk, etc.) |
| | • | | Level 3 – significant unobservable inputs (including the Fund’s own assumptions in determining the fair value of financial instruments) |
The input levels are not necessarily an indication of the risk or liquidity associated with financial instruments at that level.
At December 31, 2019, all of the Fund’s investments in financial instruments carried at fair value were valued using Level 1 inputs. For detailed categories, see the accompanying Statement of Investments.
10. Subsequent Events
The Fund has evaluated subsequent events through the issuance of the financial statements and determined that no events have occurred that require disclosure other than those already disclosed in the financial statements.
FRANKLIN TEMPLETON VARIABLE INSURANCE PRODUCTS TRUST
Report of Independent Registered Public Accounting Firm
To the Board of Trustees of Franklin Templeton Variable Insurance Products Trust and Shareholders of Franklin Rising Dividends VIP Fund
Opinion on the Financial Statements
We have audited the accompanying statement of assets and liabilities, including the statement of investments, of Franklin Rising Dividends VIP Fund (the “Fund”) as of December 31, 2019, the related statement of operations for the year ended December 31, 2019, the statement of changes in net assets for each of the two years in the period ended December 31, 2019, including the related notes, and the financial highlights for each of the five years in the period ended December 31, 2019 (collectively referred to as the “financial statements”). In our opinion, the financial statements present fairly, in all material respects, the financial position of the Fund as of December 31, 2019, the results of its operations for the year then ended, the changes in its net assets for each of the two years in the period ended December 31, 2019 and the financial highlights for each of the five years in the period ended December 31, 2019 in conformity with accounting principles generally accepted in the United States of America.
Basis for Opinion
These financial statements are the responsibility of the Fund’s management. Our responsibility is to express an opinion on the Fund’s financial statements based on our audits. We are a public accounting firm registered with the Public Company Accounting Oversight Board (United States) (PCAOB) and are required to be independent with respect to the Fund in accordance with the U.S. federal securities laws and the applicable rules and regulations of the Securities and Exchange Commission and the PCAOB.
We conducted our audits of these financial statements in accordance with the standards of the PCAOB. Those standards require that we plan and perform the audit to obtain reasonable assurance about whether the financial statements are free of material misstatement, whether due to error or fraud.
Our audits included performing procedures to assess the risks of material misstatement of the financial statements, whether due to error or fraud, and performing procedures that respond to those risks. Such procedures included examining, on a test basis, evidence regarding the amounts and disclosures in the financial statements. Our audits also included evaluating the accounting principles used and significant estimates made by management, as well as evaluating the overall presentation of the financial statements. Our procedures included confirmation of securities owned as of December 31, 2019 by correspondence with the custodian, transfer agent and brokers; when replies were not received from brokers, we performed other auditing procedures. We believe that our audits provide a reasonable basis for our opinion.
PricewaterhouseCoopers LLP
San Francisco, California
February 20, 2020
We have served as the auditor of one or more investment companies in the Franklin Templeton Group of Funds since 1948.
FRANKLIN TEMPLETON VARIABLE INSURANCE PRODUCTS TRUST
Tax Information (unaudited)
Franklin Rising Dividends VIP Fund
Under Section 852(b)(3)(C) of the Internal Revenue Code, the Fund hereby reports the maximum amount allowable but no less than $243,032,557 as a long term capital gain dividend for the fiscal year ended December 31, 2019.
Under Section 854(b)(1)(A) of the Internal Revenue Code, the Fund hereby reports 100% of the ordinary income dividends as income qualifying for the dividends received deduction for the fiscal year ended December 31, 2019.
This page intentionally left blank.
Franklin Small Cap Value VIP Fund
This annual report for Franklin Small Cap Value VIP Fund covers the fiscal year ended December 31, 2019.
Class 4 Performance Summary as of December 31, 2019
Average annual total return of Class 4 shares* represents the average annual change in value, assuming reinvestment of dividends and capital gains. Average returns smooth out variations in returns, which can be significant; they are not the same asyear-by-year results.
| | | | | | | | | | | | |
| Periods ended 12/31/19 | | 1-Year | | | 5-Year | | | 10-Year | |
| | | |
Average Annual Total Return | | | +26.23% | | | | +7.88% | | | | +11.28% | |
*The Fund has a fee waiver associated with any investment it makes in a Franklin Templeton money fund and/or other Franklin Templeton fund, contractually guaranteed through 4/30/20. Fund investment results reflect the fee waiver; without this waiver, the results would have been lower.
Performance reflects the Fund’s Class 4 operating expenses, but doesnotinclude any contract fees, expenses or sales charges. If they had been included, performance would be lower. These charges and deductions, particularly for variable life policies, can have a significant effect on contract values and insurance benefits. See the contract prospectus for a complete description of these expenses, including sales charges.
Performance data represent past performance, which does not guarantee future results. Investment return and principal value will fluctuate, and you may have a gain or loss when you sell your shares. Current performance may differ from figures shown.
Total Return Index Comparison for a Hypothetical $10,000 Investment (1/1/10–12/31/19)
The graph below shows the change in value of a hypothetical $10,000 investment in the Fund over the indicated period and includes reinvestment of any income or distributions. The Fund’s performance* is compared to the performance of the Russell 2000® Value Index. One cannot invest directly in an index, and an index is not representative of the Fund’s portfolio.Please see Important Notes to Performance Information preceding the Fund Summaries.
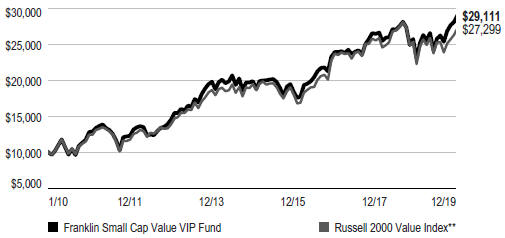
**Source: Morningstar. Please see Index Descriptions following the Fund Summaries.
FRANKLIN SMALL CAP VALUE VIP FUND
Fund Goal and Main Investments
The Fund seeks long-term total return. Under normal market conditions, the Fund invests at least 80% of its net assets in investments of small capitalization companies. For this Fund, small capitalization companies are those with market capitalizations not exceeding either the highest market capitalization in the Russell 2000® Index or the12-month average of the highest market capitalization in the Russell 2000® Index, whichever is greater, at the time of purchase. The Fund generally invests in equity securities of companies that the manager believes are undervalued at the time of purchase and have the potential for capital appreciation.
Fund Risks
All investments involve risks, including possible loss of principal. Value securities may not increase in price as anticipated, or may decline further in value. The Fund’s investments in smaller company stocks carry special risks as such stocks have historically exhibited greater price volatility than large-company stocks, particularly over the short term. Additionally, smaller companies often have relatively small revenues, limited product lines and a small market share. In addition, the Fund may invest up to 25% of its total assets in foreign securities, which involve special risks, including currency fluctuations and economic and political uncertainty. The Fund also may invest in equity real estate investment trusts (REITs). The Fund is actively managed but there is no guarantee that the manager’s investment decisions will produce the desired results. The Fund’s prospectus also includes a description of the main investment risks.
Performance Overview
You can find the Fund’sone-year total return in the Performance Summary. In comparison, the Russell 2000® Value Index posted a +22.39% total return for the same period.1 Please note the Fund employs abottom-up stock selection process, and the managers invest in securities without regard to benchmark comparisons.
Economic and Market Overview
U.S. equities, as measured by the Standard & Poor’s® 500 Index (S&P 500®), posted strong returns during the reporting period, driven by the U.S. Federal Reserve’s (Fed’s)
monetary policy easing, solid domestic economic growth and diminished concerns about the global economy and trade relations. Stocks gained sharply early in the year and experienced heightened volatility in May and September before reaching record price highs near the end of 2019. The decline in market volatility reflected many market participants’ shift from growth concerns to a more optimistic outlook.
The Fed provided a substantial boost to equity markets early in the reporting period as it shifted to a more accommodative monetary policy. In January 2019, the Fed signaled the end of its tightening cycle and cut the federal funds rate three times thereafter, lowering it to a range of 1.50%–1.75%. Stocks responded positively to the interest-rate cuts and gained further in December 2019 after the Fed indicated it would likely leave interest rates unchanged in 2020.
Solid U.S. economic growth also supported equities, as healthy consumer spending and a strong labor market kept the economy afloat. The unemployment rate fell during the year, reaching 3.5% in September, November and December 2019, the lowest recorded unemployment rate in 50 years.2 Wages also grew, albeit at a moderate pace, and inflation remained persistently low. In addition, deficit spending by the U.S. government boosted current growth at the expense of long-term debt. Despite the strength in the consumer sector, some parts of the economy struggled, particularly heavy industry. Annual industrial production contracted late in the reporting period, manufacturing output stalled and capital spending declined.
International and trade developments also impacted U.S. stocks during the period. Investors were concerned about slowing global growth and the impact it might have on U.S. equities, but some market participants’ predictions of a global recession did not materialize as growth proved resilient amid a series of interest-rate cuts by many central banks. The trade war between the U.S. and China was a dominant theme over the period, and stocks fluctuated as many investors responded to the latest developments, both positive and negative. However, byperiod-end, markets were reassured by a phase one trade agreement between the two countries, which lowered certain tariffs and addressed some of the principal areas of conflict.
1. Source: Morningstar. One cannot invest directly in an index, and an index is not representative of the Fund’s portfolio. Please see Index Descriptions following the Fund Summaries.
2. Source: Bureau of Labor Statistics.
The dollar value, number of shares or principal amount, and names of all portfolio holdings are listed in the Fund’s Statement of Investments (SOI).
FRANKLIN SMALL CAP VALUE VIP FUND
Investment Strategy
Our strategy is to invest insmall-cap companies that we believe are undervalued at the time of purchase and have the potential for capital appreciation. A stock is undervalued, or is a “value,” when it trades at less than the price at which the investment manager believes it would trade if the market reflected all factors relating to the company’s worth. Following this strategy, the Fund invests in companies that the investment manager believes have, for example: stock prices that are low relative to current, or historical or future earnings, book value, cash flow or sales; recent sharp price declines but the potential for good long-term earnings prospects; and valuable intangibles not reflected in the stock price. The Fund also may invest in equity real estate investment trusts (REITs).
The Fund may invest up to 25% of its total assets in foreign securities.
Manager’s Discussion
For the fiscal year ended December 31, 2019, some contributors to Fund performance included Versum Materials, Crocs and Coherent.
Versum Materials, a specialty materials and equipment company that primarily supplies the semiconductor end market, agreed to be acquired by Merck (not a Fund holding) for $53 per share. The revised offer was higher than Merck’s initial $48 bid and substantially higher than Entegris’s (not a Fund holding) competing proposal of approximately $41 per share. Merck’s offer represented a 68% premium to Versum’s share price on the day prior to the announcement of the Entegris merger proposal. We exited the position at a significant premium to our purchase price.
Crocs, a designer and manufacturer of footwear, posted strong returns as accelerating brand momentum resulted in stronger-than-expected sales and margin expansion. The company’s investment in advertising and partnerships, along with a focus on tight inventory management and cost rationalization, could potentially drive future increases in revenues and earnings. However, we exited the position as it exceeded our price target.
Shares of Coherent, a developer and seller of lasers, laser-based technologies and laser-based system solutions, rose due to an improved 2020 capital expenditure outlook for organic light-emitting diode (OLED) displays. A temporary easing of the trade rhetoric between the U.S. and China was an added contributor. We maintain a position in the company as the introduction of new form factors in display technology (such as foldable OLED displays) and increased use of
Portfolio Composition
Based on Total Net Assets as of 12/31/19
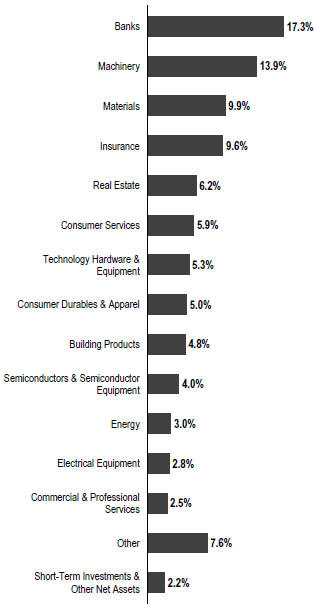
lasers in manufacturing and aerospace and defense could lead to an increase in revenues and earnings.
Detractors from performance included OceanaGold, Caleres and Greenbrier Companies.
Shares ofmid-tier gold producer OceanaGold declined meaningfully on concerns about the renewal of its production permit for the Didipio mine in the Philippines, amid pressure from local environmental groups. OceanaGold’s management asserts that the company exceeds all environmental requirements. However, operations have been
FRANKLIN SMALL CAP VALUE VIP FUND
Top 10 Holdings
12/31/19
| | |
Company Sector/Industry | | % of Total
Net Assets |
| |
The Hanover Insurance Group Inc. Insurance | | 3.0% |
| |
Columbia Banking System Inc. Banks | | 2.9% |
| |
Wyndham Hotels and Resorts Inc. Consumer Services | | 2.8% |
| |
Horace Mann Educators Corp. Insurance | | 2.8% |
| |
First Horizon National Corp. Banks | | 2.7% |
| |
Old Republic International Corp. Insurance | | 2.7% |
| |
Eagle Materials Inc. Materials | | 2.6% |
| |
Carter’s Inc. Consumer Durables & Apparel | | 2.5% |
| |
Mueller Water Products Inc. Machinery | | 2.5% |
| |
Regal Beloit Corp. Electrical Equipment | | 2.5% |
halted while the permit is under review. We reduced our position to reflect the increased level of risk to the long-term outlook.
The shares of footwear retailer and wholesaler Caleres came under pressure due to underperformance in its branded portfolio division, the impact of tariffs on footwear and a challenging promotional environment within its Famous Footwear segment. While we view Caleres’ stock as relatively attractive, based on its valuation and modest growth potential, we would like to see a greater emphasis on operational improvements that have the potential to increase earnings.
Shares of Greenbrier Companies, a manufacturer of railroad freight car equipment, declined due to weak economic activity and manufacturing challenges that drove down earnings in early 2019. We believe the company’s balance sheet is strong enough to weather a potential slowdown in railcar demand. In our view, the stock was attractively valued on aprice-to-book basis at the end of the period.
Thank you for your participation in Franklin Small Cap Value VIP Fund. We look forward to serving your future investment needs.
The foregoing information reflects our analysis, opinions and portfolio holdings as of December 31, 2019, the end of the reporting period. The way we implement our main investment strategies and the resulting portfolio holdings may change depending on factors such as market and economic conditions. These opinions may not be relied upon as investment advice or an offer for a particular security. The information is not a complete analysis of every aspect of any market, country, industry, security or the Fund. Statements of fact are from sources considered reliable, but the investment manager makes no representation or warranty as to their completeness or accuracy. Although historical performance is no guarantee of future results, these insights may help you understand our investment management philosophy.
FRANKLIN SMALL CAP VALUE VIP FUND
Class 4 Fund Expenses
As an investor in a variable insurance contract (Contract) that indirectly provides for investment in an underlying mutual fund, you can incur transaction and/or ongoing expenses at both the Fund level and the Contract Level: (1) transaction expenses can include sales charges (loads) on purchases, surrender fees, transfer fees and premium taxes; and (2) ongoing expenses can include management fees, distribution and service(12b-1) fees, contract fees, annual maintenance fees, mortality and expense risk fees and other fees and expenses. All mutual funds and Contracts have some types of ongoing expenses. The table below shows Fund-level ongoing expenses and can help you understand these costs and compare them with those of other mutual funds offered through the Contract. The table assumes a $1,000 investment held for the six months indicated. Please refer to the Fund prospectus for additional information on operating expenses.
Actual Fund Expenses
The table below provides information about the actual account values and actual expenses in the columns under the heading “Actual.” In these columns the Fund’s actual return, which includes the effect of ongoing Fund expenses but does not include the effect of ongoing Contract expenses, is used to calculate the “Ending Account Value.” You can estimate the Fund-level expenses you paid during the period by following these steps (of course, your account value and expenses will differ from those in this illustration): Divide your account value by $1,000 (if your account had an $8,600 value, then $8,600÷ $1,000 =8.6). Then multiply the result by the number under the headings “Actual” and “Fund-Level Expenses Paid During Period” (if Fund-Level Expenses Paid During Period were $ 7.50, then 8.6 x $ 7.50 = $64.50). In this illustration, the estimated expenses paid this period at the Fund level are $64.50.
Hypothetical Example for Comparison with Other Mutual Funds
Under the heading “Hypothetical” in the table, information is provided about hypothetical account values and hypothetical expenses based on the Fund’s actual expense ratio and an assumed rate of return of 5% per year before expenses, which is not the Fund’s actual return. This information may not be used to estimate the actual ending account balance or expenses you paid for the period, but it can help you compare ongoing costs of investing in the Fund with those of other mutual funds offered through the Contract. To do so, compare this 5% hypothetical example with the 5% hypothetical examples that appear in the shareholder reports of other funds offered through the Contract.
Please note that expenses shown in the table are meant to highlight ongoing costs at the Fund level only and do not reflect any ongoing expenses at the Contract level, or transaction expenses at either the Fund or Contract levels. In addition, while the Fund does not have transaction expenses, if the transaction and ongoing expenses at the Contract level were included, the expenses shown below would be higher. You should consult your Contract prospectus or disclosure document for more information.
| | | | | | | | | | | | | | | | | | |
| | | | | | | Actual (actual return after expenses) | | | | Hypothetical (5% annual return before expenses) | | | | |
Share Class | | Beginning
Account Value 7/1/19 | | | | Ending Account
Value 12/31/19 | | Fund-Level Expenses
Paid During Period
7/1/19–12/31/191, 2 | | | | Ending Account
Value 12/31/19 | | Fund-Level Expenses
Paid During Period 7/1/19–12/31/191, 2 | | | | Net
Annualized
Expense
Ratio2 |
| Class 4 | | $1,000 | | | | $1,127.20 | | $5.47 | | | | $1,020.06 | | $5.19 | | | | 1.02% |
1. Expenses are equal to the annualized expense ratio for thesix-month period as indicated above—in the far right column—multiplied by the simple average account value over the period indicated, and then multiplied by 184/365 to reflect theone-half year period.
2. Reflects expenses after fee waivers and expense reimbursements. Does not include any ongoing expenses of the Contract for which the Fund is an investment option or acquired fund fees and expenses.
FSV P1 P2 P4 12/19
SUPPLEMENT DATED DECEMBER 31, 2019
TO THE PROSPECTUS DATED MAY 1, 2019
OF
FRANKLIN SMALL CAP VALUE VIP FUND
(A series of Franklin Templeton Variable Insurance Products Trust)
The prospectus is amended as follows:
I. The portfolio management team under the “Fund Summary – Portfolio Managers” section on pageFSV-S4 is revised as follows:
Steven B. RaineriPortfolio Manager of Franklin Mutual and portfolio manager of the Fund since 2012.
Christopher Meeker, CFAPortfolio Manager of Franklin Mutual and portfolio manager of the Fund since 2015.
Nicholas Karzon, CFAResearch Analyst of Franklin Mutual and portfolio manager of the Fund since December 2019.
II. The portfolio management team under the “Fund Details – Management” section on pageFSV-D5 is revised as follows:
The Fund is managed by a team of dedicated professionals focused on investments of small cap value companies. The portfolio managers of the team are as follows:
Steven B. Raineri
Portfolio Manager of Franklin Mutual
Mr. Raineri has been a lead portfolio manager of the Fund since 2012. Mr. Raineri has primary responsibility for the investments of the Fund. He has final authority over all aspects of the Fund’s investment portfolio, including but not limited to, purchases and sales of individual securities, portfolio risk assessment, and the management of daily cash balances in accordance with anticipated investment management requirements. The degree to which he may perform these functions, and the nature of these functions, may change from time to time. He joined Franklin Templeton in 2005.
Christopher Meeker, CFA
Portfolio Manager of Franklin Mutual
Mr. Meeker has been a portfolio manager of the Fund since 2015, providing support to the lead portfolio manager as needed. He joined Franklin Templeton in 2012.
Nicholas Karzon, CFA
Research Analyst of Franklin Mutual
Mr. Karzon has been a portfolio manager of the Fund since December 2019, providing support to the lead portfolio manager as needed. He joined Franklin Templeton in 2014.
CFA® and Chartered Financial Analyst® are trademarks owned by CFA Institute.
Please keep this supplement with your prospectus for future reference.
FRANKLIN TEMPLETON VARIABLE INSURANCE PRODUCTS TRUST
Financial Highlights
Franklin Small Cap Value VIP Fund
| | | | | | | | | | | | | | | | | | | | |
| | | | | | Year Ended December 31, | | | | |
| | | 2019 | | | 2018 | | | 2017 | | | 2016 | | | 2015 | |
| | | | | |
Class 1 | | | | | | | | | | | | | | | | | | | | |
| | | | | |
Per share operating performance (for a share outstanding throughout the year) | | | | | | | | | | | | | | | | | | | | |
| | | | | |
Net asset value, beginning of year | | | $15.14 | | | | $20.43 | | | | $19.93 | | | | $18.12 | | | | $22.81 | |
| | | | | |
Income from investment operationsa: | | | | | | | | | | | | | | | | | | | | |
| | | | | |
Net investment incomeb | | | 0.24 | c | | | 0.21 | | | | 0.21 | d | | | 0.15 | | | | 0.21 | |
| | | | | |
Net realized and unrealized gains (losses) | | | 3.35 | | | | (2.29 | ) | | | 1.82 | | | | 4.79 | | | | (1.53 | ) |
| | | | | |
Total from investment operations | | | 3.59 | | | | (2.08 | ) | | | 2.03 | | | | 4.94 | | | | (1.32 | ) |
| | | | | |
Less distributions from: | | | | | | | | | | | | | | | | | | | | |
| | | | | |
Net investment income | | | (0.22 | ) | | | (0.23 | ) | | | (0.15 | ) | | | (0.21 | ) | | | (0.20 | ) |
| | | | | |
Net realized gains | | | (2.78 | ) | | | (2.98 | ) | | | (1.38 | ) | | | (2.92 | ) | | | (3.17 | ) |
| | | | | |
Total distributions | | | (3.00 | ) | | | (3.21 | ) | | | (1.53 | ) | | | (3.13 | ) | | | (3.37 | ) |
| | | | | |
Net asset value, end of year | | | $15.73 | | | | $15.14 | | | | $20.43 | | | | $19.93 | | | | $18.12 | |
| | | | | |
Total returne | | | 26.72% | | | | (12.69 | )% | | | 10.92% | | | | 30.54% | | | | (7.18)% | |
| | | | | |
Ratios to average net assets | | | | | | | | | | | | | | | | | | | | |
| | | | | |
Expenses before waiver and payments by affiliates | | | 0.67% | | | | 0.66% | | | | 0.66% | | | | 0.66% | | | | 0.65% | |
| | | | | |
Expenses net of waiver and payments by affiliatesf | | | 0.67% | g | | | 0.65% | | | | 0.65% | | | | 0.64% | | | | 0.64% | |
| | | | | |
Net investment income | | | 1.58% | c | | | 1.13% | | | | 1.06% | d | | | 0.84% | | | | 1.04% | |
| | | | | |
Supplemental data | | | | | | | | | | | | | | | | | | | | |
| | | | | |
Net assets, end of year (000’s) | | | $46,980 | | | | $40,644 | | | | $51,245 | | | | $47,831 | | | | $45,897 | |
| | | | | |
Portfolio turnover rate | | | 54.36% | | | | 47.82% | | | | 33.36% | | | | 34.60% | | | | 27.05% | |
aThe amount shown for a share outstanding throughout the period may not correlate with the Statement of Operations for the period due to the timing of sales and repurchases of the Fund’s shares in relation to income earned and/or fluctuating fair value of the investments of the Fund.
bBased on average daily shares outstanding.
cNet investment income per share includes approximately $0.05 per share related to income received in the form of special dividends in connection with certain Fund holdings. Excluding this amount, the ratio of net investment income to average net assets would have been 1.23%.
dNet investment income per share includes approximately $0.06 per share related to income received in the form of special dividends in connection with certain Fund holdings. Excluding this amount, the ratio of net investment income to average net assets would have been 0.75%.
eTotal return does not include fees, charges or expenses imposed by the variable annuity and life insurance contracts for which Franklin Templeton Variable Insurance Products Trust serves as an underlying investment vehicle.
fBenefit of expense reduction rounds to less than 0.01%.
gBenefit of waiver and payments by affiliates rounds to less than 0.01%.
| | | | |
| | | |
| | The accompanying notes are an integral part of these financial statements. | Annual Report | | FSV-7 |
FRANKLIN TEMPLETON VARIABLE INSURANCE PRODUCTS TRUST
FINANCIAL HIGHLIGHTS
Franklin Small Cap Value VIP Fund (continued)
| | | | | | | | | | | | | | | | | | | | |
| | | | | | Year Ended December 31, | | | | |
| | | 2019 | | | 2018 | | | 2017 | | | 2016 | | | 2015 | |
| | | | | |
Class 2 | | | | | | | | | | | | | | | | | | | | |
| | | | | |
Per share operating performance (for a share outstanding throughout the year) | | | | | | | | | | | | | | | | | | | | |
| | | | | |
Net asset value, beginning of year | | | $14.60 | | | | $19.80 | | | | $19.36 | | | | $17.68 | | | | $22.32 | |
| | | | | |
Income from investment operationsa: | | | | | | | | | | | | | | | | | | | | |
| | | | | |
Net investment incomeb | | | 0.20 | c | | | 0.16 | | | | 0.15 | d | | | 0.10 | | | | 0.16 | |
| | | | | |
Net realized and unrealized gains (losses) | | | 3.20 | | | | (2.20 | ) | | | 1.77 | | | | 4.66 | | | | (1.49 | ) |
| | | | | |
Total from investment operations | | | 3.40 | | | | (2.04 | ) | | | 1.92 | | | | 4.76 | | | | (1.33 | ) |
| | | | | |
Less distributions from: | | | | | | | | | | | | | | | | | | | | |
| | | | | |
Net investment income | | | (0.17 | ) | | | (0.18 | ) | | | (0.10 | ) | | | (0.16 | ) | | | (0.14 | ) |
| | | | | |
Net realized gains | | | (2.78 | ) | | | (2.98 | ) | | | (1.38 | ) | | | (2.92 | ) | | | (3.17 | ) |
| | | | | |
Total distributions. | | | (2.95 | ) | | | (3.16 | ) | | | (1.48 | ) | | | (3.08 | ) | | | (3.31 | ) |
| | | | | |
Net asset value, end of year | | | $15.05 | | | | $14.60 | | | | $19.80 | | | | $19.36 | | | | $17.68 | |
| | | | | |
Total returne | | | 26.35% | | | | (12.88 | )% | | | 10.65% | | | | 30.19% | | | | (7.39)% | |
| | | | | |
Ratios to average net assets | | | | | | | | | | | | | | | | | | | | |
| | | | | |
Expenses before waiver and payments by affiliates | | | 0.92% | | | | 0.91% | | | | 0.91% | | | | 0.91% | | | | 0.90% | |
| | | | | |
Expenses net of waiver and payments by affiliatesf | | | 0.92% | g | | | 0.90% | | | | 0.90% | | | | 0.89% | | | | 0.89% | |
| | | | | |
Net investment income | | | 1.33% | c | | | 0.88% | | | | 0.81% | d | | | 0.59% | | | | 0.79% | |
| | | | | |
Supplemental data | | | | | | | | | | | | | | | | | | | | |
| | | | | |
Net assets, end of year (000’s) | | | $1,123,093 | | | | $978,675 | | | | $1,302,055 | | | | $1,366,807 | | | | $1,172,173 | |
| | | | | |
Portfolio turnover rate | | | 54.36% | | | | 47.82% | | | | 33.36% | | | | 34.60% | | | | 27.05% | |
aThe amount shown for a share outstanding throughout the period may not correlate with the Statement of Operations for the period due to the timing of sales and repurchases of the Fund’s shares in relation to income earned and/or fluctuating fair value of the investments of the Fund.
bBased on average daily shares outstanding.
cNet investment income per share includes approximately $0.05 per share related to income received in the form of special dividends in connection with certain Fund holdings. Excluding this amount, the ratio of net investment income to average net assets would have been 0.98%.
dNet investment income per share includes approximately $0.06 per share related to income received in the form of special dividends in connection with certain Fund holdings. Excluding this amount, the ratio of net investment income to average net assets would have been 0.50%.
eTotal return does not include fees, charges or expenses imposed by the variable annuity and life insurance contracts for which Franklin Templeton Variable Insurance Products Trust serves as an underlying investment vehicle.
fBenefit of expense reduction rounds to less than 0.01%.
gBenefit of waiver and payments by affiliates rounds to less than 0.01%.
| | | | |
| | | |
FSV-8 | | Annual Report | The accompanying notes are an integral part of these financial statements. | | |
FRANKLIN TEMPLETON VARIABLE INSURANCE PRODUCTS TRUST
FINANCIAL HIGHLIGHTS
Franklin Small Cap Value VIP Fund (continued)
| | | | | | | | | | | | | | | | | | | | |
| | | | | | Year Ended December 31, | | | | |
| | | 2019 | | | 2018 | | | 2017 | | | 2016 | | | 2015 | |
| | | | | |
Class 4 | | | | | | | | | | | | | | | | | | | | |
| | | | | |
Per share operating performance (for a share outstanding throughout the year) | | | | | | | | | | | | | | | | | | | | |
| | | | | |
Net asset value, beginning of year | | | $14.96 | | | | $20.22 | | | | $19.74 | | | | $17.96 | | | | $22.63 | |
| | | | | |
Income from investment operationsa: | | | | | | | | | | | | | | | | | | | | |
| | | | | |
Net investment incomeb | | | 0.19 | c | | | 0.15 | | | | 0.14 | d | | | 0.09 | | | | 0.14 | |
| | | | | |
Net realized and unrealized gains (losses) | | | 3.30 | | | | (2.28 | ) | | | 1.81 | | | | 4.75 | | | | (1.52 | ) |
| | | | | |
Total from investment operations | | | 3.49 | | | | (2.13 | ) | | | 1.95 | | | | 4.84 | | | | (1.38 | ) |
| | | | | |
Less distributions from: | | | | | | | | | | | | | | | | | | | | |
| | | | | |
Net investment income | | | (0.16 | ) | | | (0.15 | ) | | | (0.09 | ) | | | (0.14 | ) | | | (0.12 | ) |
| | | | | |
Net realized gains | | | (2.78 | ) | | | (2.98 | ) | | | (1.38 | ) | | | (2.92 | ) | | | (3.17 | ) |
| | | | | |
Total distributions | | | (2.94 | ) | | | (3.13 | ) | | | (1.47 | ) | | | (3.06 | ) | | | (3.29 | ) |
| | | | | |
Net asset value, end of year | | | $15.51 | | | | $14.96 | | | | $20.22 | | | | $19.74 | | | | $17.96 | |
| | | | | |
Total returne | | | 26.23% | | | | (13.01 | )% | | | 10.56% | | | | 30.12% | | | | (7.52)% | |
| | | | | |
Ratios to average net assets | | | | | | | | | | | | | | | | | | | | |
| | | | | |
Expenses before waiver and payments by affiliates | | | 1.02% | | | | 1.01% | | | | 1.01% | | | | 1.01% | | | | 1.00% | |
| | | | | |
Expenses net of waiver and payments by affiliatesf | | | 1.02% | g | | | 1.00% | | | | 1.00% | | | | 0.99% | | | | 0.99% | |
| | | | | |
Net investment income | | | 1.23% | c | | | 0.78% | | | | 0.71% | d | | | 0.49% | | | | 0.69% | |
| | | | | |
Supplemental data | | | | | | | | | | | | | | | | | | | | |
| | | | | |
Net assets, end of year (000’s) | | | $29,238 | | | | $24,592 | | | | $32,053 | | | | $32,751 | | | | $26,128 | |
| | | | | |
Portfolio turnover rate | | | 54.36% | | | | 47.82% | | | | 33.36% | | | | 34.60% | | | | 27.05% | |
aThe amount shown for a share outstanding throughout the period may not correlate with the Statement of Operations for the period due to the timing of sales and repurchases of the Fund’s shares in relation to income earned and/or fluctuating fair value of the investments of the Fund.
bBased on average daily shares outstanding.
cNet investment income per share includes approximately $0.05 per share related to income received in the form of special dividends in connection with certain Fund holdings. Excluding this amount, the ratio of net investment income to average net assets would have been 0.88%.
dNet investment income per share includes approximately $0.06 per share related to income received in the form of special dividends in connection with certain Fund holdings. Excluding this amount, the ratio of net investment income to average net assets would have been 0.40%.
eTotal return does not include fees, charges or expenses imposed by the variable annuity and life insurance contracts for which Franklin Templeton Variable Insurance Products Trust serves as an underlying investment vehicle.
fBenefit of expense reduction rounds to less than 0.01%.
gBenefit of waiver and payments by affiliates rounds to less than 0.01%.
| | | | |
| | | |
| | The accompanying notes are an integral part of these financial statements. | Annual Report | | FSV-9 |
FRANKLIN TEMPLETON VARIABLE INSURANCE PRODUCTS TRUST
Statement of Investments, December 31, 2019
Franklin Small Cap Value VIP Fund
| | | | | | | | |
| | | Shares | | | Value | |
| | |
Common Stocks 97.6% | | | | | | | | |
| | |
Automobiles & Components 1.3% | | | | | | | | |
| | |
Gentex Corp. | | | 36,000 | | | $ | 1,043,280 | |
LCI Industries | | | 22,770 | | | | 2,439,350 | |
Thor Industries Inc. | | | 161,800 | | | | 12,020,122 | |
| | | | | | | | |
| | |
| | | | | | | 15,502,752 | |
| | | | | | | | |
| | |
Banks 17.3% | | | | | | | | |
| | |
Atlantic Union Bankshares Corp. | | | 183,648 | | | | 6,895,982 | |
Bryn Mawr Bank Corp. | | | 473,732 | | | | 19,536,708 | |
CenterState Bank Corp. | | | 590,300 | | | | 14,745,694 | |
Columbia Banking System Inc. | | | 851,300 | | | | 34,635,141 | |
First Horizon National Corp. | | | 1,971,637 | | | | 32,650,309 | |
First of Long Island Corp. | | | 614,355 | | | | 15,408,023 | |
German American Bancorp Inc. | | | 183,833 | | | | 6,548,131 | |
Glacier Bancorp Inc. | | | 209,600 | | | | 9,639,504 | |
Lakeland Financial Corp. | | | 516,362 | | | | 25,265,593 | |
Peoples Bancorp Inc. | | | 289,712 | | | | 10,041,418 | |
TCF Financial Corp. | | | 293,542 | | | | 13,737,766 | |
TrustCo Bank Corp. NY | | | 782,700 | | | | 6,786,009 | |
Washington Trust Bancorp Inc. | | | 217,565 | | | | 11,702,821 | |
| | | | | | | | |
| | |
| | | | | | | 207,593,099 | |
| | | | | | | | |
| | |
Building Products 4.8% | | | | | | | | |
| | |
aGibraltar Industries Inc. | | | 519,013 | | | | 26,179,016 | |
Insteel Industries Inc. | | | 390,746 | | | | 8,397,131 | |
Universal Forest Products Inc. | | | 488,640 | | | | 23,308,128 | |
| | | | | | | | |
| | |
| | | | | | | 57,884,275 | |
| | | | | | | | |
| | |
Commercial & Professional Services 2.5% | | | | | | | | |
| | |
aHuron Consulting Group Inc. | | | 107,157 | | | | 7,363,829 | |
| | |
McGrath RentCorp | | | 303,168 | | | | 23,204,479 | |
| | | | | | | | |
| | |
| | | | | | | 30,568,308 | |
| | | | | | | | |
| | |
Consumer Durables & Apparel 5.0% | | | | | | | | |
| | |
Brunswick Corp. | | | 200,100 | | | | 12,001,998 | |
| | |
Carter’s Inc. | | | 276,293 | | | | 30,209,877 | |
| | |
Toll Brothers Inc. | | | 334,805 | | | | 13,228,145 | |
| | |
aUnifi Inc. | | | 171,800 | | | | 4,339,668 | |
| | | | | | | | |
| | |
| | | | | | | 59,779,688 | |
| | | | | | | | |
| | |
Consumer Services 5.9% | | | | | | | | |
| | |
Brinker International Inc. | | | 412,040 | | | | 17,305,680 | |
| | |
Jack in the Box Inc. | | | 241,700 | | | | 18,859,851 | |
| | |
Wyndham Hotels and Resorts Inc. | | | 543,100 | | | | 34,112,111 | |
| | | | | | | | |
| | |
| | | | | | | 70,277,642 | |
| | | | | | | | |
| | |
Diversified Financials 0.7% | | | | | | | | |
| | |
Houlihan Lokey Inc. | | | 177,100 | | | | 8,654,877 | |
| | | | | | | | |
FRANKLIN TEMPLETON VARIABLE INSURANCE PRODUCTS TRUST
STATEMENT OF INVESTMENTS
Franklin Small Cap Value VIP Fund(continued)
| | | | | | | | |
| | | Shares | | | Value | |
| | |
Common Stocks(continued) | | | | | | | | |
| | |
Electrical Equipment 2.8% | | | | | | | | |
Encore Wire Corp. | | | 75,262 | | | $ | 4,320,039 | |
Regal Beloit Corp. | | | 343,900 | | | | 29,441,279 | |
| | | | | | | | |
| | |
| | | | | | | 33,761,318 | |
| | | | | | | | |
| | |
Energy 3.0% | | | | | | | | |
Crescent Point Energy Corp. (Canada) | | | 3,534,800 | | | | 15,760,428 | |
Hunting PLC (United Kingdom) | | | 3,199,919 | | | | 17,689,966 | |
aNatural Gas Services Group Inc. | | | 173,987 | | | | 2,133,080 | |
| | | | | | | | |
| | |
| | | | | | | 35,583,474 | |
| | | | | | | | |
| | |
Food & Staples Retailing 0.6% | | | | | | | | |
aBJ’s Wholesale Club Holdings Inc. | | | 332,400 | | | | 7,558,776 | |
| | | | | | | | |
| | |
Food, Beverage & Tobacco 1.3% | | | | | | | | |
Glanbia PLC (Ireland) | | | 284,200 | | | | 3,270,027 | |
Maple Leaf Foods Inc. (Canada) | | | 606,057 | | | | 12,078,204 | |
| | | | | | | | |
| | |
| | | | | | | 15,348,231 | |
| | | | | | | | |
| | |
Health Care Equipment & Services 0.6% | | | | | | | | |
aInteger Holdings Corp. | | | 94,500 | | | | 7,600,635 | |
| | | | | | | | |
| | |
Insurance 9.6% | | | | | | | | |
CNO Financial Group Inc. | | | 159,400 | | | | 2,889,922 | |
The Hanover Insurance Group Inc. | | | 265,500 | | | | 36,285,885 | |
Horace Mann Educators Corp. | | | 760,444 | | | | 33,200,985 | |
Old Republic International Corp. | | | 1,449,500 | | | | 32,425,315 | |
Selective Insurance Group Inc. | | | 167,300 | | | | 10,906,287 | |
| | | | | | | | |
| | |
| | | | | | | 115,708,394 | |
| | | | | | | | |
| | |
Machinery 13.7% | | | | | | | | |
Astec Industries Inc. | | | 220,765 | | | | 9,272,130 | |
Barnes Group Inc. | | | 117,100 | | | | 7,255,516 | |
Columbus McKinnon Corp. | | | 152,931 | | | | 6,121,828 | |
Federal Signal Corp. | | | 181,451 | | | | 5,851,795 | |
The Greenbrier Cos. Inc. | | | 227,040 | | | | 7,362,907 | |
Kennametal Inc. | | | 557,374 | | | | 20,561,527 | |
Mueller Industries Inc. | | | 266,662 | | | | 8,466,518 | |
Mueller Water Products Inc., A | | | 2,519,049 | | | | 30,178,207 | |
Oshkosh Corp. | | | 299,000 | | | | 28,300,350 | |
aRexnord Corp. | | | 708,800 | | | | 23,121,056 | |
aSPX Flow Inc. | | | 357,680 | | | | 17,479,822 | |
| | | | | | | | |
| | |
| | | | | | | 163,971,656 | |
| | | | | | | | |
| | |
Materials 9.9% | | | | | | | | |
Carpenter Technology Corp. | | | 184,024 | | | | 9,160,714 | |
Eagle Materials Inc. | | | 336,600 | | | | 30,516,156 | |
Minerals Technologies Inc. | | | 410,552 | | | | 23,660,112 | |
OceanaGold Corp. (Australia) | | | 4,344,481 | | | | 8,531,054 | |
PH Glatfelter Co. | | | 758,294 | | | | 13,876,780 | |
PolyOne Corp. | | | 393,400 | | | | 14,473,186 | |
FRANKLIN TEMPLETON VARIABLE INSURANCE PRODUCTS TRUST
STATEMENT OF INVESTMENTS
Franklin Small Cap Value VIP Fund(continued)
| | | | | | | | |
| | | Shares | | | Value | |
| | |
Common Stocks(continued) | | | | | | | | |
| | |
Materials(continued) | | | | | | | | |
| | |
Reliance Steel & Aluminum Co. | | | 151,900 | | | $ | 18,191,544 | |
| | | | | | | | |
| | |
| | | | | | | 118,409,546 | |
| | | | | | | | |
| | |
Media & Entertainment 1.1% | | | | | | | | |
| | |
Cinemark Holdings Inc. | | | 380,300 | | | | 12,873,155 | |
| | | | | | | | |
| | |
Real Estate 6.2% | | | | | | | | |
| | |
Brandywine Realty Trust | | | 1,064,700 | | | | 16,769,025 | |
| | |
Highwoods Properties Inc. | | | 478,400 | | | | 23,398,544 | |
| | |
Retail Properties of America Inc., A | | | 1,587,211 | | | | 21,268,627 | |
| | |
Sunstone Hotel Investors Inc. | | | 925,297 | | | | 12,880,134 | |
| | | | | | | | |
| | |
| | | | | | | 74,316,330 | |
| | | | | | | | |
| | |
Retailing 0.6% | | | | | | | | |
| | |
Caleres Inc. | | | 280,733 | | | | 6,667,409 | |
| | | | | | | | |
| | |
Semiconductors & Semiconductor Equipment 4.0% | | | | | | | | |
| | |
aAdvanced Energy Industries Inc. | | | 267,532 | | | | 19,048,279 | |
| | |
MKS Instruments Inc. | | | 135,494 | | | | 14,905,695 | |
| | |
aSynaptics Inc. | | | 220,781 | | | | 14,520,766 | |
| | | | | | | | |
| | |
| | | | | | | 48,474,740 | |
| | | | | | | | |
| | |
Technology Hardware & Equipment 5.3% | | | | | | | | |
| | |
aCoherent Inc. | | | 156,808 | | | | 26,085,011 | |
| | |
aFARO Technologies Inc. | | | 12,000 | | | | 604,200 | |
| | |
aII-VI Inc. | | | 361,000 | | | | 12,154,870 | |
| | |
aPlexus Corp. | | | 328,000 | | | | 25,236,320 | |
| | | | | | | | |
| | |
| | | | | | | 64,080,401 | |
| | | | | | | | |
| | |
Transportation 0.1% | | | | | | | | |
| | |
Heartland Express Inc. | | | 30,600 | | | | 644,130 | |
| | | | | | | | |
| | |
Utilities 1.3% | | | | | | | | |
| | |
Black Hills Corp. | | | 91,600 | | | | 7,194,264 | |
| | |
IDACORP Inc. | | | 50,389 | | | | 5,381,545 | |
| | |
Spire Inc. | | | 39,355 | | | | 3,278,665 | |
| | | | | | | | |
| | |
| | | | | | | 15,854,474 | |
| | | | | | | | |
| | |
Total Common Stocks (Cost $967,253,354) | | | | | | | 1,171,113,310 | |
| | | | | | | | |
| | |
| | | Principal
Amount | | | | |
| | |
Corporate Bonds (Cost $2,378,000) 0.2% | | | | | | | | |
| | |
Machinery 0.2% | | | | | | | | |
| | |
Mueller Industries Inc., sub. bond, 6.00%, 3/01/27 | | $ | 2,378,000 | | | | 2,441,249 | |
| | | | | | | | |
| | |
Total Investments before Short Term Investments (Cost $969,631,354) | | | | | | | 1,173,554,559 | |
| | | | | | | | |
FRANKLIN TEMPLETON VARIABLE INSURANCE PRODUCTS TRUST
STATEMENT OF INVESTMENTS
Franklin Small Cap Value VIP Fund(continued)
| | | | | | | | |
| | | Shares | | | Value | |
| | |
Short Term Investments (Cost $24,977,897) 2.1% | | | | | | | | |
| | |
Money Market Funds 2.1% | | | | | | | | |
| | |
b,cInstitutional Fiduciary Trust Money Market Portfolio, 1.26% | | | 24,977,897 | | | $ | 24,977,897 | |
| | | | | | | | |
| | |
Total Investments (Cost $994,609,251) 99.9% | | | | | | | 1,198,532,456 | |
| | |
Other Assets, less Liabilities 0.1% | | | | | | | 778,975 | |
| | | | | | | | |
| | |
Net Assets 100.0% | | | | | | $ | 1,199,311,431 | |
| | | | | | | | |
aNon-income producing.
bSee Note 3(e) regarding investments in affiliated management investment companies.
cThe rate shown is the annualizedseven-day effective yield at period end.
| | | | |
| | | |
| | The accompanying notes are an integral part of these financial statements. | Annual Report | | FSV-13 |
FRANKLIN TEMPLETON VARIABLE INSURANCE PRODUCTS TRUST
FINANCIAL STATEMENTS
Statement of Assets and Liabilities
December 31, 2019
| | | | |
| | | Franklin Small
Cap Value VIP Fund | |
| |
Assets: | | | | |
Investments in securities: | | | | |
Cost - Unaffiliated issuers | | $ | 969,631,354 | |
Cost -Non-controlled affiliates (Note 3e) | | | 24,977,897 | |
| | | | |
| |
Value - Unaffiliated issuers | | $ | 1,173,554,559 | |
Value -Non-controlled affiliates (Note 3e) | | | 24,977,897 | |
Receivables: | | | | |
Investment securities sold | | | 432,306 | |
Capital shares sold | | | 691,889 | |
Dividends and interest | | | 1,672,552 | |
Other assets | | | 137 | |
| | | | |
| |
Total assets | | | 1,201,329,340 | |
| | | | |
| |
Liabilities: | | | | |
Payables: | | | | |
Investment securities purchased | | | 288,543 | |
Capital shares redeemed | | | 579,311 | |
Management fees | | | 637,606 | |
Distribution fees | | | 244,709 | |
Reports to shareholders | | | 205,398 | |
Accrued expenses and other liabilities | | | 62,342 | |
| | | | |
| |
Total liabilities | | | 2,017,909 | |
| | | | |
| |
Net assets, at value | | $ | 1,199,311,431 | |
| | | | |
| |
Net assets consist of: | | | | |
Paid-in capital | | $ | 919,933,522 | |
Total distributable earnings (losses) | | | 279,377,909 | |
| | | | |
| |
Net assets, at value | | $ | 1,199,311,431 | |
| | | | |
| |
Class 1: | | | | |
Net assets, at value | | $ | 46,979,609 | |
| | | | |
Shares outstanding | | | 2,987,402 | |
| | | | |
Net asset value and maximum offering price per share | | | $15.73 | |
| | | | |
Class 2: | | | | |
Net assets, at value | | $ | 1,123,093,483 | |
| | | | |
Shares outstanding | | | 74,620,134 | |
| | | | |
Net asset value and maximum offering price per share | | | $15.05 | |
| | | | |
| |
Class 4: | | | | |
Net assets, at value | | $ | 29,238,339 | |
| | | | |
Shares outstanding | | | 1,884,787 | |
| | | | |
Net asset value and maximum offering price per share | | | $15.51 | |
| | | | |
| | | | |
| | | |
FSV-14 | | Annual Report | The accompanying notes are an integral part of these financial statements. | | |
FRANKLIN TEMPLETON VARIABLE INSURANCE PRODUCTS TRUST
FINANCIAL STATEMENTS
Statement of Operations
for the year ended December 31, 2019
| | | | |
| | | Franklin Small
Cap Value VIP Fund | |
| |
Investment income: | | | | |
Dividends: (net of foreign taxes)* | | | | |
Unaffiliated issuers | | | $ 24,609,000 | |
Non-controlled affiliates (Note 3e) | | | 527,278 | |
Interest: | | | | |
Unaffiliated issuers | | | 427,670 | |
| |
Total investment income | | | 25,563,948 | |
| |
Expenses: | | | | |
Management fees (Note 3a) | | | 7,295,196 | |
Distribution fees: (Note 3c) | | | | |
Class 2 | | | 2,664,003 | |
Class 4 | | | 94,836 | |
Custodian fees (Note 4) | | | 16,172 | |
Reports to shareholders | | | 265,038 | |
Professional fees | | | 64,649 | |
Trustees’ fees and expenses | | | 6,716 | |
Other | | | 27,355 | |
| |
Total expenses | | | 10,433,965 | |
Expense reductions (Note 4) | | | (333 | ) |
Expenses waived/paid by affiliates (Note 3e) | | | (99,612 | ) |
| |
Net expenses | | | 10,334,020 | |
| |
Net investment income | | | 15,229,928 | |
| |
Realized and unrealized gains (losses): | | | | |
Net realized gain (loss) from: | | | | |
Investments: | | | | |
Unaffiliated issuers | | | 61,218,063 | |
Foreign currency transactions | | | (149,737 | ) |
| |
Net realized gain (loss) | | | 61,068,326 | |
| |
Net change in unrealized appreciation (depreciation) on: | | | | |
Investments: | | | | |
Unaffiliated issuers | | | 187,554,405 | |
Translation of other assets and liabilities denominated in foreign currencies | | | 367 | |
| |
Net change in unrealized appreciation (depreciation) | | | 187,554,772 | |
| |
Net realized and unrealized gain (loss) | | | 248,623,098 | |
| |
Net increase (decrease) in net assets resulting from operations | | | $263,853,026 | |
| | | | |
*Foreign taxes withheld on dividends | | $ | 92,739 | |
| | | | |
| | | |
| | The accompanying notes are an integral part of these financial statements. | Annual Report | | FSV-15 |
FRANKLIN TEMPLETON VARIABLE INSURANCE PRODUCTS TRUST
FINANCIAL STATEMENTS
Statements of Changes in Net Assets
| | | | | | | | |
| | | Franklin Small Cap Value VIP Fund | |
| | | Year Ended December 31, | |
| | | 2019 | | | 2018 | |
| | |
Increase (decrease) in net assets: | | | | | | | | |
Operations: | | | | | | | | |
Net investment income | | | $ 15,229,928 | | | | $ 11,431,886 | |
Net realized gain (loss) | | | 61,068,326 | | | | 192,518,890 | |
Net change in unrealized appreciation (depreciation) | | | 187,554,772 | | | | (356,985,491 | ) |
| | |
Net increase (decrease) in net assets resulting from operations | | | 263,853,026 | | | | (153,034,715 | ) |
| | |
Distributions to shareholders: | | | | | | | | |
Class 1 | | | (7,896,338 | ) | | | (7,555,429 | ) |
Class 2 | | | (189,976,242 | ) | | | (194,090,505 | ) |
Class 4 | | | (4,683,798 | ) | | | (4,574,106 | ) |
| | |
Total distributions to shareholders | | | (202,556,378 | ) | | | (206,220,040 | ) |
| | |
Capital share transactions: (Note 2) | | | | | | | | |
Class 1 | | | 3,898,876 | | | | 2,769,926 | |
Class 2 | | | 87,139,038 | | | | 14,343,221 | |
Class 4 | | | 3,066,346 | | | | 698,981 | |
| | |
Total capital share transactions | | | 94,104,260 | | | | 17,812,128 | |
| | |
Net increase (decrease) in net assets | | | 155,400,908 | | | | (341,442,627 | ) |
| | |
Net assets: | | | | | | | | |
Beginning of year | | | 1,043,910,523 | | | | 1,385,353,150 | |
| | |
End of year | | | $1,199,311,431 | | | | $1,043,910,523 | |
| | | | |
| | | |
FSV-16 | | Annual Report | The accompanying notes are an integral part of these financial statements. | | |
FRANKLIN TEMPLETON VARIABLE INSURANCE PRODUCTS TRUST
Notes to Financial Statements
Franklin Small Cap Value VIP Fund
1. Organization and Significant Accounting Policies
Franklin Templeton Variable Insurance Products Trust (Trust) is registered under the Investment Company Act of 1940 (1940 Act) as anopen-end management investment company, consisting of eighteen separate funds and applies the specialized accounting and reporting guidance in U.S. Generally Accepted Accounting Principles (U.S. GAAP). Franklin Small Cap Value VIP Fund (Fund) is included in this report. Shares of the Fund are generally sold only to insurance company separate accounts to fund the benefits of variable life insurance policies or variable annuity contracts. The Fund offers three classes of shares: Class 1, Class 2 and Class 4. Each class of shares may differ by its distribution fees, voting rights on matters affecting a single class and its exchange privilege.
The following summarizes the Fund’s significant accounting policies.
a. Financial Instrument Valuation
The Fund’s investments in financial instruments are carried at fair value daily. Fair value is the price that would be received to sell an asset or paid to transfer a liability in an orderly transaction between market participants on the measurement date. The Fund calculates the net asset value (NAV) per share each business day as of 4 p.m. Eastern time or the regularly scheduled close of the New York Stock Exchange (NYSE), whichever is earlier. Under compliance policies and procedures approved by the Trust’s Board of Trustees (the Board), the Fund’s administrator has responsibility for oversight of valuation, including leading the cross-functional Valuation Committee (VC). The Fund may utilize independent pricing services, quotations from securities and financial instrument dealers, and other market sources to determine fair value.
Equity securities listed on an exchange or on the NASDAQ National Market System are valued at the last quoted sale price or the official closing price of the day, respectively. Foreign equity securities are valued as of the close of trading on the foreign stock exchange on which the security is primarily traded, or as of 4 p.m. Eastern time. The value is then converted into its U.S. dollar equivalent at the foreign exchange rate in effect at 4 p.m. Eastern time on the day that the value of the security is determined.Over-the-counter (OTC) securities are valued within the range of the most recent quoted bid and ask prices. Securities that trade in multiple markets or on multiple exchanges are valued
according to the broadest and most representative market. Certain equity securities are valued based upon fundamental characteristics or relationships to similar securities.
Debt securities generally trade in the OTC market rather than on a securities exchange. The Fund’s pricing services use multiple valuation techniques to determine fair value. In instances where sufficient market activity exists, the pricing services may utilize a market-based approach through which quotes from market makers are used to determine fair value. In instances where sufficient market activity may not exist or is limited, the pricing services also utilize proprietary valuation models which may consider market characteristics such as benchmark yield curves, credit spreads, estimated default rates, anticipated market interest rate volatility, coupon rates, anticipated timing of principal repayments, underlying collateral, and other unique security features in order to estimate the relevant cash flows, which are then discounted to calculate the fair value.
Investments inopen-end mutual funds are valued at the closing NAV.
The Fund has procedures to determine the fair value of financial instruments for which market prices are not reliable or readily available. Under these procedures, the Fund primarily employs a market-based approach which may use related or comparable assets or liabilities, recent transactions, market multiples, book values, and other relevant information for the investment to determine the fair value of the investment. An income-based valuation approach may also be used in which the anticipated future cash flows of the investment are discounted to calculate fair value. Discounts may also be applied due to the nature or duration of any restrictions on the disposition of the investments. Due to the inherent uncertainty of valuations of such investments, the fair values may differ significantly from the values that would have been used had an active market existed.
Trading in securities on foreign securities stock exchanges and OTC markets may be completed before 4 p.m. Eastern time. In addition, trading in certain foreign markets may not take place on every Fund’s business day. Occasionally, events occur between the time at which trading in a foreign security is completed and 4 p.m. Eastern time that might call into question the reliability of the value of a portfolio security held by the Fund. As a result, differences may arise between the value of the Fund’s portfolio securities as determined at the foreign market close and the latest indications of value at
FRANKLIN TEMPLETON VARIABLE INSURANCE PRODUCTS TRUST
NOTES TO FINANCIAL STATEMENTS
Franklin Small Cap Value VIP Fund (continued)
1. Organization and Significant Accounting Policies(continued)
a. Financial Instrument Valuation(continued)
4 p.m. Eastern time. In order to minimize the potential for these differences, the VC monitors price movements following the close of trading in foreign stock markets through a series of country specific market proxies (such as baskets of American Depositary Receipts, futures contracts and exchange traded funds). These price movements are measured against established trigger thresholds for each specific market proxy to assist in determining if an event has occurred that may call into question the reliability of the values of the foreign securities held by the Fund. If such an event occurs, the securities may be valued using fair value procedures, which may include the use of independent pricing services.
When the last day of the reporting period is anon-business day, certain foreign markets may be open on those days that the Fund’s NAV is not calculated, which could result in differences between the value of the Fund’s portfolio securities on the last business day and the last calendar day of the reporting period. Any significant security valuation changes due to an open foreign market are adjusted and reflected by the Fund for financial reporting purposes.
b. Foreign Currency Translation
Portfolio securities and other assets and liabilities denominated in foreign currencies are translated into U.S. dollars based on the exchange rate of such currencies against U.S. dollars on the date of valuation. The Fund may enter into foreign currency exchange contracts to facilitate transactions denominated in a foreign currency. Purchases and sales of securities, income and expense items denominated in foreign currencies are translated into U.S. dollars at the exchange rate in effect on the transaction date. Portfolio securities and assets and liabilities denominated in foreign currencies contain risks that those currencies will decline in value relative to the U.S. dollar. Occasionally, events may impact the availability or reliability of foreign exchange rates used to convert the U.S. dollar equivalent value. If such an event occurs, the foreign exchange rate will be valued at fair value using procedures established and approved by the Board.
The Fund does not separately report the effect of changes in foreign exchange rates from changes in market prices on securities held. Such changes are included in net realized and unrealized gain or loss from investments in the Statement of Operations.
Realized foreign exchange gains or losses arise from sales of foreign currencies, currency gains or losses realized between the trade and settlement dates on securities transactions and the difference between the recorded amounts of dividends, interest, and foreign withholding taxes and the U.S. dollar equivalent of the amounts actually received or paid. Net unrealized foreign exchange gains and losses arise from changes in foreign exchange rates on foreign denominated assets and liabilities other than investments in securities held at the end of the reporting period.
c. Income and Deferred Taxes
It is the Fund’s policy to qualify as a regulated investment company under the Internal Revenue Code. The Fund intends to distribute to shareholders substantially all of its taxable income and net realized gains to relieve it from federal income and if applicable, excise taxes. As a result, no provision for U.S. federal income taxes is required.
The Fund may be subject to foreign taxation related to income received, capital gains on the sale of securities and certain foreign currency transactions in the foreign jurisdictions in which it invests. Foreign taxes, if any, are recorded based on the tax regulations and rates that exist in the foreign markets in which the Fund invests. When a capital gain tax is determined to apply, the Fund records an estimated deferred tax liability in an amount that would be payable if the securities were disposed of on the valuation date.
The Fund may recognize an income tax liability related to its uncertain tax positions under U.S. GAAP when the uncertain tax position has a less than 50% probability that it will be sustained upon examination by the tax authorities based on its technical merits. As of December 31, 2019, the Fund has determined that no tax liability is required in its financial statements related to uncertain tax positions for any open tax years (or expected to be taken in future tax years). Open tax years are those that remain subject to examination and are based on the statute of limitations in each jurisdiction in which the Fund invests.
FRANKLIN TEMPLETON VARIABLE INSURANCE PRODUCTS TRUST
NOTES TO FINANCIAL STATEMENTS
Franklin Small Cap Value VIP Fund(continued)
d. Security Transactions, Investment Income, Expenses and Distributions
Security transactions are accounted for on trade date. Realized gains and losses on security transactions are determined on a specific identification basis. Interest income and estimated expenses are accrued daily. Amortization of premium and accretion of discount on debt securities are included in interest income. Dividend income and capital gain distributions are recorded on theex-dividend date except for certain dividends from securities where the dividend rate is not available. In such cases, the dividend is recorded as soon as the information is received by the Fund. Distributions to shareholders are recorded on theex-dividend date. Distributable earnings are determined according to income tax regulations (tax basis) and may differ from earnings recorded in accordance with U.S. GAAP. These differences may be permanent or temporary. Permanent differences are reclassified among capital accounts to reflect their tax character. These reclassifications have no impact on net assets or the results of operations. Temporary differences are not reclassified, as they may reverse in subsequent periods.
Common expenses incurred by the Trust are allocated among the Funds based on the ratio of net assets of each Fund to the combined net assets of the Trust or based on the ratio of number of shareholders of each Fund to the combined number of shareholders of the Trust. Fund specific expenses are charged directly to the Fund that incurred the expense.
Realized and unrealized gains and losses and net investment income, excluding class specific expenses, are allocated daily to each class of shares based upon the relative proportion of net assets of each class. Differences in per share distributions by class are generally due to differences in class specific expenses.
e. Accounting Estimates
The preparation of financial statements in accordance with U.S. GAAP requires management to make estimates and assumptions that affect the reported amounts of assets and liabilities at the date of the financial statements and the amounts of income and expenses during the reporting period. Actual results could differ from those estimates.
f. Guarantees and Indemnifications
Under the Trust’s organizational documents, its officers and trustees are indemnified by the Trust against certain liabilities arising out of the performance of their duties to the Trust. Additionally, in the normal course of business, the Trust, on behalf of the Fund enters into contracts with service providers that contain general indemnification clauses. The Trust’s maximum exposure under these arrangements is unknown as this would involve future claims that may be made against the Trust that have not yet occurred. Currently, the Trust expects the risk of loss to be remote.
2. Shares of Beneficial Interest
At December 31, 2019, there were an unlimited number of shares authorized (without par value). Transactions in the Fund’s shares were as follows:
| | | | | | | | | | | | | | | | |
| | | | | | Year Ended December 31, | | | | |
| | |
| | | 2019 | | | 2018 | |
| | | | |
| | | Shares | | | Amount | | | Shares | | | Amount | |
| | | | |
Class 1 Shares: | | | | | | | | | | | | | | | | |
| | | | |
Shares sold | | | 262,210 | | | $ | 4,085,267 | | | | 140,744 | | | $ | 2,624,857 | |
Shares issued in reinvestment of distributions | | | 578,063 | | | | 7,896,338 | | | | 419,746 | | | | 7,555,429 | |
Shares redeemed | | | (537,480 | ) | | | (8,082,729 | ) | | | (384,144 | ) | | | (7,410,360 | ) |
| | | | |
Net increase (decrease) | | | 302,793 | | | $ | 3,898,876 | | | | 176,346 | | | $ | 2,769,926 | |
| | | | |
Class 2 Shares: | | | | | | | | | | | | | | | | |
| | | | |
Shares sold | | | 5,696,678 | | | $ | 84,262,242 | | | | 3,241,202 | | | $ | 57,622,650 | |
Shares issued in reinvestment of distributions | | | 14,513,082 | | | | 189,976,242 | | | | 11,167,463 | | | | 194,090,505 | |
Shares redeemed | | | (12,637,486 | ) | | | (187,099,446 | ) | | | (13,111,818 | ) | | | (237,369,934 | ) |
| | | | |
Net increase (decrease) | | | 7,572,274 | | | $ | 87,139,038 | | | | 1,296,847 | | | $ | 14,343,221 | |
FRANKLIN TEMPLETON VARIABLE INSURANCE PRODUCTS TRUST
NOTES TO FINANCIAL STATEMENTS
Franklin Small Cap Value VIP Fund(continued)
2. Shares of Beneficial Interest (continued)
| | | | | | | | | | | | | | | | |
| | | Year Ended December 31, | |
| | |
| | | 2019 | | | 2018 | |
| | | | |
| | | Shares | | | Amount | | | Shares | | | Amount | |
| | | | |
Class 4 Shares: | | | | | | | | | | | | | | | | |
Shares sold | | | 279,692 | | | $ | 4,200,102 | | | | 142,312 | | | $ | 2,499,385 | |
Shares issued in reinvestment of distributions | | | 346,948 | | | | 4,683,798 | | | | 256,684 | | | | 4,574,106 | |
Shares redeemed | | | (385,667 | ) | | | (5,817,554 | ) | | | (340,602 | ) | | | (6,374,510 | ) |
| | | | |
Net increase (decrease) | | | 240,973 | | | $ | 3,066,346 | | | | 58,394 | | | $ | 698,981 | |
3. Transactions with Affiliates
Franklin Resources, Inc. is the holding company for various subsidiaries that together are referred to as Franklin Templeton. Certain officers and trustees of the Fund are also officers and/or directors of the following subsidiaries:
| | | | |
| Subsidiary | | Affiliation | | |
| | |
Franklin Mutual Advisers, LLC (Franklin Mutual) | | Investment manager | | |
| | |
Franklin Templeton Services, LLC (FT Services) | | Administrative manager | | |
| | |
Franklin Templeton Distributors, Inc. (Distributors) | | Principal underwriter | | |
| | |
Franklin Templeton Investor Services, LLC (Investor Services) | | Transfer agent | | |
a. Management Fees
The Fund pays an investment management fee to Franklin Mutual based on the average daily net assets of the Fund as follows:
| | | | |
| Annualized Fee Rate | | Net Assets | | |
| | |
0.750% | | Up to and including $200 million | | |
| | |
0.635% | | Over $200 million, up to and including $700 million | | |
| | |
0.600% | | Over $700 million, up to and including $1.2 billion | | |
| | |
0.575% | | Over $1.2 billion, up to and including $1.3 billion | | |
| | |
0.475% | | In excess of $1.3 billion | | |
For the year ended December 31, 2019, the gross effective investment management fee rate was 0.642% of the Fund’s average daily net assets.
b. Administrative Fees
Under an agreement with Franklin Mutual, FT Services provides administrative services to the Fund. The fee is paid by Franklin Mutual based on the Fund’s average daily net assets, and is not an additional expense of the Fund.
FRANKLIN TEMPLETON VARIABLE INSURANCE PRODUCTS TRUST
NOTES TO FINANCIAL STATEMENTS
Franklin Small Cap Value VIP Fund(continued)
c. Distribution Fees
The Board has adopted distribution plans for Class 2 and Class 4 shares pursuant to Rule12b-1 under the 1940 Act. Under the Fund’s compensation distribution plans, the Fund pays Distributors for costs incurred in connection with the servicing, sale and distribution of the Fund’s shares up to 0.35% per year of its average daily net assets of each class. The Board has agreed to limit the current rate to 0.25% per year for Class 2. The plan year, for purposes of monitoring compliance with the maximum annual plan rates, is February 1 through January 31.
d. Transfer Agent Fees
Investor Services, under terms of an agreement, performs shareholder servicing for the Fund and is not paid by the Fund for the services.
e. Investments in Affiliated Management Investment Companies
The Fund invests in one or more affiliated management investment companies for purposes other than exercising a controlling influence over the management or policies. Management fees paid by the Fund are waived on assets invested in the affiliated management investment companies, as noted in the Statement of Operations, in an amount not to exceed the management and administrative fees paid directly or indirectly by each affiliate. During the year ended December 31, 2019, the Fund held investments in affiliated management investment companies as follows:
| | | | | | | | | | | | | | | | | | | | | | | | | | | | | | | | |
| | | Value at Beginning of Year | | | Purchases | | | Sales | | | Realized Gain (Loss) | | | Net Change in Unrealized Appreciation (Depreciation) | | | Value at End of Year | | | Number of Shares Held at End of Year | | | Dividend
Income | |
Non-Controlled Affiliates | | | | | | | | | | | | | | | | | | | | | | | | | | | | | | | | |
| | | | | | | | |
Institutional Fiduciary Trust Money Market Portfolio, 1.26% | | | $45,444,842 | | | | $272,960,890 | | | | $(293,427,835) | | | | $ — | | | | $ — | | | | $24,977,897 | | | | 24,977,897 | | | | $527,278 | |
4. Expense Offset Arrangement
The Fund has entered into an arrangement with its custodian whereby credits realized as a result of uninvested cash balances are used to reduce a portion of the Fund’s custodian expenses. During the year ended December 31, 2019, the custodian fees were reduced as noted in the Statement of Operations.
5. Income Taxes
The tax character of distributions paid during the years ended December 31, 2019 and 2018, was as follows:
| | | | | | | | |
| | | 2019 | | | 2018 | |
| | |
Distributions paid from: | | | | | | | | |
| | |
Ordinary income | | $ | 23,319,400 | | | $ | 23,876,649 | |
| | |
Long term capital gain | | | 179,236,978 | | | | 182,343,391 | |
| | |
| | $ | 202,556,378 | | | $ | 206,220,040 | |
FRANKLIN TEMPLETON VARIABLE INSURANCE PRODUCTS TRUST
NOTES TO FINANCIAL STATEMENTS
Franklin Small Cap Value VIP Fund(continued)
5. Income Taxes(continued)
At December 31, 2019, the cost of investments, net unrealized appreciation (depreciation), undistributed ordinary income and undistributed long term capital gains for income tax purposes were as follows:
| | | | |
| Cost of investments | | $ | 998,714,383 | |
| |
Unrealized appreciation | | $ | 221,883,900 | |
| |
| Unrealized depreciation | | | (22,065,827 | ) |
| |
| Net unrealized appreciation (depreciation) | | $ | 199,818,073 | |
| |
Distributable earnings: | | | | |
| |
Undistributed ordinary income | | $ | 20,694,217 | |
| |
| Undistributed long term capital gains | | | 58,865,254 | |
| |
| Total distributable earnings | | $ | 79,559,471 | |
Differences between income and/or capital gains as determined on a book basis and a tax basis are primarily due to differing treatment of wash sales.
6. Investment Transactions
Purchases and sales of investments (excluding short term securities) for the year ended December 31, 2019, aggregated $598,873,062 and $671,429,267, respectively.
7. Credit Facility
The Fund, together with other U.S. registered and foreign investment funds (collectively, Borrowers), managed by Franklin Templeton, are borrowers in a joint syndicated senior unsecured credit facility totaling $2 billion (Global Credit Facility) which matured on February 7, 2020. This Global Credit Facility provides a source of funds to the Borrowers for temporary and emergency purposes, including the ability to meet future unanticipated or unusually large redemption requests. Effective February 7, 2020, the Borrowers renewed the Global Credit Facility for a one year term, maturing February 5, 2021, for a total of $2 billion.
Under the terms of the Global Credit Facility, the Fund shall, in addition to interest charged on any borrowings made by the Fund and other costs incurred by the Fund, pay its share of fees and expenses incurred in connection with the implementation and maintenance of the Global Credit Facility, based upon its relative share of the aggregate net assets of all of the Borrowers, including an annual commitment fee of 0.15% based upon the unused portion of the Global Credit Facility. These fees are reflected in other expenses in the Statement of Operations. During the year ended December 31, 2019, the Fund did not use the Global Credit Facility.
8. Fair Value Measurements
The Fund follows a fair value hierarchy that distinguishes between market data obtained from independent sources (observable inputs) and the Fund’s own market assumptions (unobservable inputs). These inputs are used in determining the value of the Fund’s financial instruments and are summarized in the following fair value hierarchy:
| | • | | Level 1 – quoted prices in active markets for identical financial instruments |
| | • | | Level 2 – other significant observable inputs (including quoted prices for similar financial instruments, interest rates, prepayment speed, credit risk, etc.) |
FRANKLIN TEMPLETON VARIABLE INSURANCE PRODUCTS TRUST
NOTES TO FINANCIAL STATEMENTS
Franklin Small Cap Value VIP Fund(continued)
| | • | | Level 3 – significant unobservable inputs (including the Fund’s own assumptions in determining the fair value of financial instruments) |
The input levels are not necessarily an indication of the risk or liquidity associated with financial instruments at that level.
A summary of inputs used as of December 31, 2019, in valuing the Fund’s assets carried at fair value, is as follows:
| | | | | | | | | | | | | | | | |
| | | Level 1 | | | Level 2 | | | Level 3 | | | Total | |
| | | | |
Assets: | | | | | | | | | | | | | | | | |
| | | | |
Investments in Securities:a | | | | | | | | | | | | | | | | |
| | | | |
Equity Investments | | $ | 1,171,113,310 | | | $ | — | | | $ | — | | | $ | 1,171,113,310 | |
| | | | |
Corporate Bonds | | | — | | | | 2,441,249 | | | | — | | | | 2,441,249 | |
| | | | |
Short Term Investments | | | 24,977,897 | | | | — | | | | — | | | | 24,977,897 | |
| | | | |
Total Investments in Securities | | $ | 1,196,091,207 | | | $ | 2,441,249 | | | $ | — | | | $ | 1,198,532,456 | |
aFor detailed categories, see the accompanying Statement of Investments.
9. Subsequent Events
The Fund has evaluated subsequent events through the issuance of the financial statements and determined that no events have occurred that require disclosure other than those already disclosed in the financial statements.
FRANKLIN TEMPLETON VARIABLE INSURANCE PRODUCTS TRUST
Report of Independent Registered Public Accounting Firm
To the Board of Trustees of Franklin Templeton Variable Insurance Products Trust and Shareholders of Franklin Small Cap Value VIP Fund
Opinion on the Financial Statements
We have audited the accompanying statement of assets and liabilities, including the statement of investments, of Franklin Small Cap Value VIP Fund (the “Fund”) as of December 31, 2019, the related statement of operations for the year ended December 31, 2019, the statement of changes in net assets for each of the two years in the period ended December 31, 2019, including the related notes, and the financial highlights for each of the five years in the period ended December 31, 2019 (collectively referred to as the “financial statements”). In our opinion, the financial statements present fairly, in all material respects, the financial position of the Fund as of December 31, 2019, the results of its operations for the year then ended, the changes in its net assets for each of the two years in the period ended December 31, 2019 and the financial highlights for each of the five years in the period ended December 31, 2019 in conformity with accounting principles generally accepted in the United States of America.
Basis for Opinion
These financial statements are the responsibility of the Fund’s management. Our responsibility is to express an opinion on the Fund’s financial statements based on our audits. We are a public accounting firm registered with the Public Company Accounting Oversight Board (United States) (PCAOB) and are required to be independent with respect to the Fund in accordance with the U.S. federal securities laws and the applicable rules and regulations of the Securities and Exchange Commission and the PCAOB.
We conducted our audits of these financial statements in accordance with the standards of the PCAOB. Those standards require that we plan and perform the audit to obtain reasonable assurance about whether the financial statements are free of material misstatement, whether due to error or fraud.
Our audits included performing procedures to assess the risks of material misstatement of the financial statements, whether due to error or fraud, and performing procedures that respond to those risks. Such procedures included examining, on a test basis, evidence regarding the amounts and disclosures in the financial statements. Our audits also included evaluating the accounting principles used and significant estimates made by management, as well as evaluating the overall presentation of the financial statements. Our procedures included confirmation of securities owned as of December 31, 2019 by correspondence with the custodian, transfer agent and brokers; when replies were not received from brokers, we performed other auditing procedures. We believe that our audits provide a reasonable basis for our opinion.
PricewaterhouseCoopers LLP
San Francisco, California
February 20, 2020
We have served as the auditor of one or more investment companies in the Franklin Templeton Group of Funds since 1948.
FRANKLIN TEMPLETON VARIABLE INSURANCE PRODUCTS TRUST
Tax Information (unaudited)
Franklin Small Cap Value VIP Fund
Under Section 852(b)(3)(C) of the Internal Revenue Code, the Fund hereby reports the maximum amount allowable but no less than $179,236,978 as a long term capital gain dividend for the fiscal year ended December 31, 2019.
Under Section 854(b)(1)(A) of the Internal Revenue Code, the Fund hereby reports 90.88% of the ordinary income dividends as income qualifying for the dividends received deduction for the fiscal year ended December 31, 2019.
This page intentionally left blank.
FranklinSmall-Mid Cap Growth VIP Fund
This annual report for FranklinSmall-Mid Cap Growth VIP Fund covers the fiscal year ended December 31, 2019.
Class 4 Performance Summary as of December 31, 2019
Average annual total return of Class 4 shares* represents the average annual change in value, assuming reinvestment of dividends and capital gains. Average returns smooth out variations in returns, which can be significant; they are not the same asyear-by-year results.
| | | | | | | | | | | | |
| Periods ended 12/31/19 | | 1-Year | | | 5-Year | | | 10-Year | |
| | | |
Average Annual Total Return | | | +31.26% | | | | +8.77% | | | | +11.72% | |
*The Fund has a fee waiver associated with any investment it makes in a Franklin Templeton money fund and/or other Franklin Templeton fund, contractually guaranteed through 4/30/20. Fund investment results reflect the fee waiver; without this waiver, the results would have been lower.
Performance reflects the Fund’s Class 4 operating expenses, but doesnotinclude any contract fees, expenses or sales charges. If they had been included, performance would be lower. These charges and deductions, particularly for variable life policies, can have a significant effect on contract values and insurance benefits. See the contract prospectus for a complete description of these expenses, including sales charges.
Performance data represent past performance, which does not guarantee future results. Investment return and principal value will fluctuate, and you may have a gain or loss when you sell your shares. Current performance may differ from figures shown.
Total Return Index Comparison for a Hypothetical $10,000 Investment (1/1/10–12/31/19)
The graph below shows the change in value of a hypothetical $10,000 investment in the Fund over the indicated period and includes reinvestment of any income or distributions. The Fund’s performance* is compared to the performance of Russell Midcap® Growth Index and the Standard & Poor’s® 500 Index (S&P 500®). One cannot invest directly in an index, and an index is not representative of the Fund’s portfolio.Please see Important Notes to Performance Information preceding the Fund Summaries.
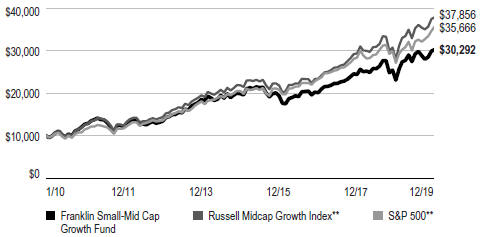
**Source: Morningstar. Please see Index Descriptions following the Fund Summaries.
FRANKLINSMALL-MID CAP GROWTH VIP FUND
Fund Goal and Main Investments
The Fund seeks long-term capital growth. Under normal market conditions, the Fund invests at least 80% of its net assets in equity securities of small-capitalization andmid-capitalization companies. For this Fund,small-cap companies are those within the market capitalization range of companies in the Russell 2500TM Index at the time of purchase, and midcap companies are those within the market capitalization range of companies in the Russell Midcap® Index at the time of purchase.1
Fund Risks
All investments involve risks, including possible loss of principal. Growth stock prices reflect projections of future earnings or revenues, and can, therefore, fall dramatically if the company fails to meet those projections. Smaller, midsized and relatively new or unseasoned companies can be particularly sensitive to changing economic conditions, and their prospects for growth are less certain than those of larger, more established companies. Historically, these securities have experienced more price volatility than larger-company stocks, especially over the short term. To the extent the Fund focuses on particular countries, regions, industries, sectors or types of investment from time to time, it may be subject to greater risk of adverse developments in such areas of focus than a fund that invests in a wider variety of countries, regions, industries, sectors or investments. From time to time, the trading market for a particular security or type of security in which the Fund invests may become less liquid or even illiquid. The Fund is actively managed but there is no guarantee that the manager’s investment decisions will produce the desired results. The Fund’s prospectus also includes a description of the main investment risks.
Performance Overview
You can find the Fund’sone-year total return in the Performance Summary. In comparison, the Fund’s narrow benchmark, the Russell Midcap® Growth Index, posted a +35.47% total return, and its broad benchmark, the S&P 500 posted a +31.49% total return for the same period.2
Portfolio Composition
Based on Total Net Assets as of 12/31/19
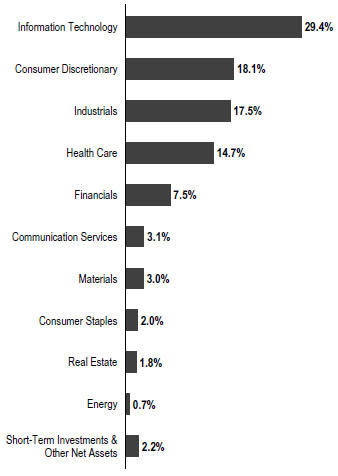
Economic and Market Overview
U.S. equities, as measured by the S&P 500, posted strong returns during the reporting period, driven by the U.S. Federal Reserve’s (Fed’s) monetary policy easing, solid domestic economic growth and diminished concerns about the global economy and trade relations. Stocks gained sharply early in the year and experienced heightened volatility in May and September before reaching record price highs near the end of 2019. The decline in market volatility reflected many market participants’ shift from growth concerns to a more optimistic outlook.
The Fed provided a substantial boost to equity markets early in the reporting period as it shifted to a more accommodative monetary policy. In January 2019, the Fed signaled the end of its tightening cycle and cut the federal funds rate three
1. Please see Index Descriptions following the Fund Summaries.
2. Source: Morningstar. One cannot invest directly in an index, and an index is not representative of the Fund’s portfolio. Please see Index Descriptions following the Fund Summaries.
The dollar value, number of shares or principal amount, and names of all portfolio holdings are listed in the Fund’s Statement of Investments (SOI).
FRANKLINSMALL-MID CAP GROWTH VIP FUND
times thereafter, lowering it to a range of 1.50%–1.75%. Stocks responded positively to the interest-rate cuts and gained further in December 2019 after the Fed indicated it would likely leave interest rates unchanged in 2020.
Solid U.S. economic growth also supported equities, as healthy consumer spending and a strong labor market kept the economy afloat. The unemployment rate fell during the year, reaching 3.5% in September and November 2019, the lowest recorded unemployment rate in 50 years.3 Wages also grew, albeit at a moderate pace, and inflation remained persistently low. In addition, deficit spending by the U.S. government boosted current growth at the expense of long-term debt. Despite the strength in the consumer sector, some parts of the economy struggled, particularly heavy industry. Annual industrial production contracted late in the reporting period, manufacturing output stalled and capital spending declined.
International and trade developments also impacted U.S. stocks during the period. Investors were concerned about slowing global growth and the impact it might have on U.S. equities, but some market participants’ predictions of a global recession did not materialize as growth proved resilient amid a series of interest-rate cuts by many central banks. The trade war between the U.S. and China was a dominant theme over the period, and stocks fluctuated as many investors responded to the latest developments, both positive and negative. However, byperiod-end, markets were reassured by a phase one trade agreement between the two countries, which lowered certain tariffs and addressed some of the principal areas of conflict.
Investment Strategy
We use fundamental,bottom-up research to seek companies meeting our criteria of growth potential, quality and valuation. In seeking sustainable growth characteristics, we look for companies we believe can produce sustainable earnings and cash flow growth, evaluating the long-term market opportunity and competitive structure of an industry to target leaders and emerging leaders. We define quality companies as those with strong and improving competitive positions in attractive markets. We also believe important attributes of quality are experienced and talented management teams as well as financial strength reflected in the capital structure, gross and operating margins, free cash flow generation and returns on capital employed. In assessing value, we consider whether security prices fully
Top 10 Holdings
12/31/19
| | |
Company Sector/Industry | | % of Total Net Assets |
| |
CoStar Group Inc. Industrials | | 2.1% |
| |
Verisk Analytics Inc. Industrials | | 1.9% |
| |
SBA Communications Corp. Real Estate | | 1.8% |
| |
Global Payments Inc. Information Technology | | 1.8% |
| |
MSCI Inc. Financials | | 1.8% |
| |
IDEX Corp. Industrials | | 1.7% |
| |
IAC/InterActiveCorp Communication Services | | 1.6% |
| |
Mettler-Toledo International Inc. Health Care | | 1.6% |
| |
Black Knight Inc. Information Technology | | 1.6% |
| |
IDEXX Laboratories Inc. Health Care | | 1.6% |
reflect the balance of the sustainable growth opportunities relative to business and financial risks.
Manager’s Discussion
During the period under review, nearly all sectors represented in the portfolio contributed to the Fund’s strong absolute returns. Relative to the Russell Midcap® Growth Index, however, the Fund slightly underperformed. Detractors from relative performance included stock selection in the information technology (IT) and consumer discretionary sectors, as well as stock selection and an underweight in health care. In contrast, stock selection in financials along with stock selection and underweights in consumer staples and communication services contributed.
In IT, relative detractors included education technology company 2U andsoftware-as-a-service provider New Relic. 2U’s stock declined after disappointing earnings for 2019’s second quarter. We liquidated our position after discussions with 2U executives and industry consultants led us to believe the company’s growth profile had reset lower due to broad challenges across its graduate- and short-course portfolios. We also sold off our position in New Relic, whose shares
3. Source: Bureau of Labor Statistics.
FRANKLINSMALL-MID CAP GROWTH VIP FUND
declined following lower-than-expected sales figures for 2019’s second quarter. Management cited the launch of a new data analysis platform and a reorganization of its sales teams as reasons for the poor performance. Guidance for sales and cash flow for the remainder of its 2020 fiscal year also came in below expectations.
In consumer discretionary, postsecondary education services provider Grand Canyon Education and online travel booking company Expedia Group detracted from relative results. An underweighted position in well-performing fast-casual restaurant operator Chipotle Mexican Grill detracted as well.
In health care, medical device manufacturer ABIOMED (not held atperiod-end) detracted from relative performance. Shares declined after the company was forced to cut guidance after the U.S. Food and Drug Administration (FDA) issued a letter in February 2019 expressing concern about the safety of the Impella RP heart pump. The FDA issued a correction later in the year that stated the pump was safe.Off-benchmark positions in remote dentistry services provider SmileDirectClub (not held atperiod-end) and cannabinoid-based biopharmaceutical company GW Pharmaceuticals also detracted.
In contrast, relative contributors in financials included electronic trading platform MarketAxess Holding. MarketAxess benefited from healthy trading levels in 2019 due partially to increased uncertainty and volatility in the broader market, and the company’s volumes outpaced the industry as more trading activity shifts from voice to electronic platforms. Higher demand for U.S. bonds also drove increased trading levels from international clients. The company also acquired LiquidityEdge, a trading platform for rates, whose protocols and liquidity MarketAxess plans to leverage to strengthen its core credit trading business. Other contributors in the sector included index and portfolio risk and performance analytics provider MSCI and global alternative asset manager Ares Management (not part of the Index).
The consumer staples sector benefited from the Fund’s lack of position in a major cleaning company, as well as smaller relative contributors such as BellRing Brands, a nutritional food and supplements company which spun off from its parent company Post Holdings in late 2019.
In communication services, a lack of positions in several poor-performing media and communication platforms boosted relative results.
Elsewhere,off-benchmark positions in clinical stage biopharmaceutical firm Reata Pharmaceuticals and cancer-focused biopharmaceutical company Array BioPharma (not held atperiod-end) contributed to relative results. Reata Pharmaceuticals’ share price surged after the company announced positive results for a clinical trial for omaveloxolone, a treatment for neuromuscular disorder Friedreich’s ataxia. Array BioPharma was acquired by pharmaceuticals firm Pfizer (not a Fund holding) for a significant premium over the preannouncement stock closing price. Real estate information provider CoStar Group and ecommerce platform Shopify also contributed.
Thank you for your participation in FranklinSmall-Mid Cap Growth VIP Fund. We look forward to serving your future investment needs.
The foregoing information reflects our analysis, opinions and portfolio holdings as of December 31, 2019, the end of the reporting period. The way we implement our main investment strategies and the resulting portfolio holdings may change depending on factors such as market and economic conditions. These opinions may not be relied upon as investment advice or an offer for a particular security. The information is not a complete analysis of every aspect of any market, country, industry, security or the Fund. Statements of fact are from sources considered reliable, but the investment manager makes no representation or warranty as to their completeness or accuracy. Although historical performance is no guarantee of future results, these insights may help you understand our investment management philosophy.
FRANKLIN SMALL-MID CAP GROWTH VIP FUND
Class 4 Fund Expenses
As an investor in a variable insurance contract (Contract) that indirectly provides for investment in an underlying mutual fund, you can incur transaction and/or ongoing expenses at both the Fund level and the Contract Level: (1) transaction expenses can include sales charges (loads) on purchases, surrender fees, transfer fees and premium taxes; and (2) ongoing expenses can include management fees, distribution and service (12b-1) fees, contract fees, annual maintenance fees, mortality and expense risk fees and other fees and expenses. All mutual funds and Contracts have some types of ongoing expenses. The table below shows Fund-level ongoing expenses and can help you understand these costs and compare them with those of other mutual funds offered through the Contract. The table assumes a $1,000 investment held for the six months indicated. Please refer to the Fund prospectus for additional information on operating expenses.
Actual Fund Expenses
The table below provides information about the actual account values and actual expenses in the columns under the heading “Actual.” In these columns the Fund’s actual return, which includes the effect of ongoing Fund expenses but does not include the effect of ongoing Contract expenses, is used to calculate the “Ending Account Value.” You can estimate the Fund-level expenses you paid during the period by following these steps(of course, your account value and expenses will differ from those in this illustration): Divide your account value by $1,000 (if your account had an $8,600 value, then $8,600 ÷ $1,000 = 8.6). Then multiply the result by the number under the headings “Actual” and “Fund-Level Expenses Paid During Period” (if Fund-Level Expenses Paid During Period were $ 7.50, then 8.6 x $ 7.50 = $64.50). In this illustration, the estimated expenses paid this period at the Fund level are $64.50.
Hypothetical Example for Comparison with Other Mutual Funds
Under the heading “Hypothetical” in the table, information is provided about hypothetical account values and hypothetical expenses based on the Fund’s actual expense ratio and an assumed rate of return of 5% per year before expenses, which is not the Fund’s actual return. This information may not be used to estimate the actual ending account balance or expenses you paid for the period, but it can help you compare ongoing costs of investing in the Fund with those of other mutual funds offered through the Contract. To do so, compare this 5% hypothetical example with the 5% hypothetical examples that appear in the shareholder reports of other funds offered through the Contract.
Please note that expenses shown in the table are meant to highlight ongoing costs at the Fund level only and do not reflect any ongoing expenses at the Contract level, or transaction expenses at either the Fund or Contract levels. In addition, while the Fund does not have transaction expenses, if the transaction and ongoing expenses at the Contract level were included, the expenses shown below would be higher. You should consult your Contract prospectus or disclosure document for more information.
| | | | | | | | | | | | |
| | | | | Actual
(actual return after expenses) | | Hypothetical
(5% annual return before expenses) | | |
Share Class | | Beginning
Account Value 7/1/19 | | Ending Account
Value 12/31/19 | | Fund-Level Expenses Paid During Period 7/1/19–12/31/191, 2 | | Ending Account
Value 12/31/19 | | Fund-Level Expenses
Paid During Period 7/1/19–12/31/191, 2 | | Net Annualized Expense Ratio2 |
| | | | | | |
| Class 4 | | $1,000 | | $1,036.80 | | $6.06 | | $1,019.26 | | $6.01 | | 1.18% |
1. Expenses are equal to the annualized expense ratio for the six-month period as indicated above—in the far right column—multiplied by the simple average account value over the period indicated, and then multiplied by 184/365 to reflect the one-half year period.
2. Reflects expenses after fee waivers and expense reimbursements. Does not include any ongoing expenses of the Contract for which the Fund is an investment option or acquired fund fees and expenses.
FRANKLIN TEMPLETON VARIABLE INSURANCE PRODUCTS TRUST
Financial Highlights
Franklin Small-Mid Cap Growth VIP Fund
| | | | | | | | | | | | | | | | | | | | |
| | | | | | Year Ended December 31, | |
| | | | |
| | | 2019 | | | 2018 | | | 2017 | | | 2016 | | | 2015 | |
| |
| | | | | |
Class 1 | | | | | | | | | | | | | | | | | | | | |
| | | | | |
Per share operating performance | | | | | | | | | | | | | | | | | | | | |
(for a share outstanding throughout the year) | | | | | | | | | | | | | | | | | | | | |
| | | | | |
Net asset value, beginning of year | | | $17.04 | | | | $19.71 | | | | $17.77 | | | | $19.09 | | | | $24.95 | |
| | | | |
| | | | | |
Income from investment operationsa: | | | | | | | | | | | | | | | | | | | | |
| | | | | |
Net investment income (loss)b | | | (0.04 | ) | | | (0.05 | ) | | | (0.04 | ) | | | (0.03 | ) | | | — | c,d |
| | | | | |
Net realized and unrealized gains (losses) | | | 5.31 | | | | (0.70 | ) | | | 3.74 | | | | 0.77 | | | | (0.03 | ) |
| | | | |
| | | | | |
Total from investment operations | | | 5.27 | | | | (0.75 | ) | | | 3.70 | | | | 0.74 | | | | (0.03 | ) |
| | | | |
| | | | | |
Less distributions from: | | | | | | | | | | | | | | | | | | | | |
| | | | | |
Net realized gains | | | (2.57 | ) | | | (1.92 | ) | | | (1.76 | ) | | | (2.06 | ) | | | (5.83 | ) |
| | | | |
| | | | | |
Net asset value, end of year | | | $19.74 | | | | $17.04 | | | | $19.71 | | | | $17.77 | | | | $19.09 | |
| | | | |
| | | | | |
Total returne | | | 31.80% | | | | (5.15)% | | | | 21.75% | | | | 4.40% | | | | (2.44)% | |
| | | | | |
Ratios to average net assets | | | | | | | | | | | | | | | | | | | | |
| | | | | |
Expenses before waiver and payments by affiliates | | | 0.84% | | | | 0.86% | | | | 0.85% | | | | 0.84% | | | | 0.81% | |
| | | | | |
Expenses net of waiver and payments by affiliates | | | 0.83% | f | | | 0.85% | f | | | 0.84% | f | | | 0.82% | f | | | 0.81% | g |
| | | | | |
Net investment income (loss) | | | (0.19)% | | | | (0.24)% | | | | (0.24)% | | | | (0.16)% | | | | 0.01% | d |
| | | | | |
Supplemental data | | | | | | | | | | | | | | | | | | | | |
| | | | | |
Net assets, end of year (000’s) | | | $43,169 | | | | $33,518 | | | | $36,864 | | | | $31,756 | | | | $87,866 | |
| | | | | |
Portfolio turnover rate | | | 59.07% | | | | 44.78% | | | | 40.49% | | | | 32.23%h | | | | 37.85% | |
aThe amount shown for a share outstanding throughout the period may not correlate with the Statement of Operations for the period due to the timing of sales and repurchases of the Fund’s shares in relation to income earned and/or fluctuating fair value of the investments of the Fund.
bBased on average daily shares outstanding.
cAmount rounds to less than $0.01 per share.
dNet investment income per share includes approximately $0.05 per share related to income received in the form of special dividends in connection with certain fund holdings. Excluding this amount, the ratio of net investment income to average net assets would have been (0.24)%.
eTotal return does not include fees, charges or expenses imposed by the variable annuity and life insurance contracts for which Franklin Templeton Variable Insurance Products Trust serves as an underlying investment vehicle.
fBenefit of expense reduction rounds to less than 0.01%.
gBenefit of waiver and payments by affiliates rounds to less than 0.01%
hExcludes the value of portfolio securities delivered as a result of a redemption in-kind.
| | | | |
| | | |
FSC-6 | | Annual Report | The accompanying notes are an integral part of these financial statements. | | |
FRANKLIN TEMPLETON VARIABLE INSURANCE PRODUCTS TRUST
FINANCIAL HIGHLIGHTS
Franklin Small-Mid Cap Growth VIP Fund(continued)
| | | | | | | | | | | | | | | | | | | | |
| | | | | | Year Ended December 31, | |
| | | | |
| | | 2019 | | | 2018 | | | 2017 | | | 2016 | | | 2015 | |
| |
| | | | | |
Class 2 | | | | | | | | | | | | | | | | | | | | |
| | | | | |
Per share operating performance | | | | | | | | | | | | | | | | | | | | |
(for a share outstanding throughout the year) | | | | | | | | | | | | | | | | | | | | |
| | | | | |
Net asset value, beginning of year | | | $15.22 | | | | $17.83 | | | | $16.27 | | | | $17.69 | | | | $23.56 | |
| | | | |
| | | | | |
Income from investment operationsa: | | | | | | | | | | | | | | | | | | | | |
| | | | | |
Net investment income (loss)b | | | (0.08 | ) | | | (0.09 | ) | | | (0.08 | ) | | | (0.07 | ) | | | (0.05 | )c |
| | | | | |
Net realized and unrealized gains (losses) | | | 4.72 | | | | (0.60 | ) | | | 3.40 | | | | 0.71 | | | | 0.01 | |
| | | | |
| | | | | |
Total from investment operations | | | 4.64 | | | | (0.69 | ) | | | 3.32 | | | | 0.64 | | | | (0.04 | ) |
| | | | |
| | | | | |
Less distributions from: | | | | | | | | | | | | | | | | | | | | |
| | | | | |
Net realized gains | | | (2.57 | ) | | | (1.92 | ) | | | (1.76 | ) | | | (2.06 | ) | | | (5.83 | ) |
| | | | |
| | | | | |
Net asset value, end of year | | | $17.29 | | | | $15.22 | | | | $17.83 | | | | $16.27 | | | | $17.69 | |
| | | | |
| | | | | |
Total returnd | | | 31.44% | | | | (5.37)% | | | | 21.40% | | | | 4.17% | | | | (2.66)% | |
| | | | | |
Ratios to average net assets | | | | | | | | | | | | | | | | | | | | |
| | | | | |
Expenses before waiver and payments by affiliates | | | 1.09% | | | | 1.11% | | | | 1.10% | | | | 1.09% | | | | 1.06% | |
| | | | | |
Expenses net of waiver and payments by affiliates | | | 1.08% | e | | | 1.10% | e | | | 1.09% | e | | | 1.07% | e | | | 1.06% | f |
| | | | | |
Net investment income (loss) | | | (0.44)% | | | | (0.49)% | | | | (0.49)% | | | | (0.41)% | | | | (0.24)% | c |
| | | | | |
Supplemental data | | | | | | | | | | | | | | | | | | | | |
| | | | | |
Net assets, end of year (000’s) | | | $372,442 | | | | $310,300 | | | | $390,094 | | | | $392,777 | | | | $478,649 | |
| | | | | |
Portfolio turnover rate | | | 59.07% | | | | 44.78% | | | | 40.49% | | | | 32.23%g | | | | 37.85% | |
aThe amount shown for a share outstanding throughout the period may not correlate with the Statement of Operations for the period due to the timing of sales and repurchases of the Fund’s shares in relation to income earned and/or fluctuating fair value of the investments of the Fund.
bBased on average daily shares outstanding.
cNet investment income per share includes approximately $0.05 per share related to income received in the form of special dividends in connection with certain Fund holdings. Excluding this amount, the ratio of net investment income to average net assets would have been (0.49)%
dTotal return does not include fees, charges or expenses imposed by the variable annuity and life insurance contracts for which Franklin Templeton Variable Insurance Products Trust serves as an underlying investment vehicle.
eBenefit of expense reduction rounds to less than 0.01%.
fBenefit of waiver and payments by affiliates rounds to less than 0.01%.
gExcludes the value of portfolio securities delivered as a result of a redemption in-kind.
| | | | |
| | | |
| | The accompanying notes are an integral part of these financial statements. | Annual Report | | FSC-7 |
FRANKLIN TEMPLETON VARIABLE INSURANCE PRODUCTS TRUST
FINANCIAL HIGHLIGHTS
Franklin Small-Mid Cap Growth VIP Fund(continued)
| | | | | | | | | | | | | | | | | | | | |
| | | Year Ended December 31, | |
| | | | |
| | | 2019 | | | 2018 | | | 2017 | | | 2016 | | | 2015 | |
| |
| | | | | |
Class 4 | | | | | | | | | | | | | | | | | | | | |
| | | | | |
Per share operating performance | | | | | | | | | | | | | | | | | | | | |
(for a share outstanding throughout the year) | | | | | | | | | | | | | | | | | | | | |
| | | | | |
Net asset value, beginning of year | | | $15.81 | | | | $18.47 | | | | $16.81 | | | | $18.23 | | | | $24.14 | |
| | | | |
| | | | | |
Income from investment operationsa: | | | | | | | | | | | | | | | | | | | | |
| | | | | |
Net investment income (loss)b | | | (0.10 | ) | | | (0.11 | ) | | | (0.10 | ) | | | (0.09 | ) | | | (0.07 | )c |
| | | | | |
Net realized and unrealized gains (losses) | | | 4.90 | | | | (0.63 | ) | | | 3.52 | | | | 0.73 | | | | (0.01 | ) |
| | | | |
| | | | | |
Total from investment operations | | | 4.80 | | | | (0.74 | ) | | | 3.42 | | | | 0.64 | | | | (0.08 | ) |
| | | | |
| | | | | |
Less distributions from: | | | | | | | | | | | | | | | | | | | | |
| | | | | |
Net realized gains | | | (2.57 | ) | | | (1.92 | ) | | | (1.76 | ) | | | (2.06 | ) | | | (5.83 | ) |
| | | | |
| | | | | |
Net asset value, end of year | | | $18.04 | | | | $15.81 | | | | $18.47 | | | | $16.81 | | | | $18.23 | |
| | | | |
| | | | | |
Total returnd | | | 31.26% | | | | (5.46)% | | | | 21.30% | | | | 4.04% | | | | (2.77)% | |
| | | | | |
Ratios to average net assets | | | | | | | | | | | | | | | | | | | | |
| | | | | |
Expenses before waiver and payments by affiliates | | | 1.19% | | | | 1.21% | | | | 1.20% | | | | 1.19% | | | | 1.16% | |
| | | | | |
Expenses net of waiver and payments by affiliates | | | 1.18% | e | | | 1.20% | e | | | 1.19% | e | | | 1.17% | e | | | 1.16%f | |
| | | | | |
Net investment income (loss) | | | (0.54)% | | | | (0.59)% | | | | (0.59)% | | | | (0.51)% | | | | (0.34)%c | |
| | | | | |
Supplemental data | | | | | | | | | | | | | | | | | | | | |
| | | | | |
Net assets, end of year (000’s) | | | $17,662 | | | | $13,759 | | | | $15,829 | | | | $13,825 | | | | $15,105 | |
| | | | | |
Portfolio turnover rate | | | 59.07% | | | | 44.78% | | | | 40.49% | | | | 32.23%g | | | | 37.85% | |
aThe amount shown for a share outstanding throughout the period may not correlate with the Statement of Operations for the period due to the timing of sales and repurchases of the Fund’s shares in relation to income earned and/or fluctuating fair value of the investments of the Fund.
bBased on average daily shares outstanding.
cNet investment income per share includes approximately $0.05 per share related to income received in the form of special dividends in connection with certain Fund holdings. Excluding this amount, the ratio of net investment income to average net assets would have been (0.59)%.
dTotal return does not include fees, charges or expenses imposed by the variable annuity and life insurance contracts for which Franklin Templeton Variable Insurance Products Trust serves as an underlying investment vehicle.
eBenefit of expense reduction rounds to less than 0.01%.
fBenefit of waiver and payments by affiliates rounds to less than 0.01%.
gExcludes the value of portfolio securities delivered as a result of a redemption in-kind.
| | | | |
| | | |
FSC-8 | | Annual Report | The accompanying notes are an integral part of these financial statements. | | |
FRANKLIN TEMPLETON VARIABLE INSURANCE PRODUCTS TRUST
_
Statement of Investments, December 31, 2019
Franklin Small-Mid Cap Growth VIP Fund
| | | | | | | | |
| | | Shares | | | Value | |
| | |
Common Stocks 97.8% | | | | | | | | |
Communication Services 3.1% | | | | | | | | |
aIAC/InterActiveCorp. | | | 28,500 | | | $ | 7,099,635 | |
aPinterest Inc., A | | | 178,500 | | | | 3,327,240 | |
aSpotify Technology SA | | | 20,000 | | | | 2,991,000 | |
| | | | | | | | |
| | |
| | | | | | | 13,417,875 | |
| | | | | | | | |
Consumer Discretionary 18.1% | | | | | | | | |
Aptiv PLC | | | 25,977 | | | | 2,467,036 | |
aBurlington Stores Inc. | | | 27,500 | | | | 6,270,825 | |
aChipotle Mexican Grill Inc. | | | 6,605 | | | | 5,529,111 | |
Dollar General Corp. | | | 33,500 | | | | 5,225,330 | |
Domino’s Pizza Inc. | | | 11,000 | | | | 3,231,580 | |
a,b,cDraftKings Inc. | | | 733,541 | | | | 2,241,958 | |
Expedia Group Inc. | | | 52,100 | | | | 5,634,094 | |
aFive Below Inc. | | | 30,400 | | | | 3,886,944 | |
aGrand Canyon Education Inc. | | | 15,057 | | | | 1,442,310 | |
Levi Strauss & Co., A | | | 150,000 | | | | 2,893,500 | |
MGM Resorts International | | | 134,500 | | | | 4,474,815 | |
aNVR Inc. | | | 932 | | | | 3,549,438 | |
aO’Reilly Automotive Inc. | | | 11,307 | | | | 4,955,406 | |
a,dPeloton Interactive Inc., A | | | 81,500 | | | | 2,314,600 | |
a,dRevolve Group Inc. | | | 64,500 | | | | 1,184,220 | |
aRH | | | 6,900 | | | | 1,473,150 | |
Tractor Supply Co. | | | 60,737 | | | | 5,675,265 | |
aUlta Beauty Inc. | | | 18,100 | | | | 4,581,834 | |
aUnder Armour Inc., A | | | 109,500 | | | | 2,365,200 | |
Vail Resorts Inc. | | | 23,600 | | | | 5,659,988 | |
Wingstop Inc. | | | 37,500 | | | | 3,233,625 | |
| | | | | | | | |
| | | | | | | 78,290,229 | |
| | | | | | | | |
Consumer Staples 2.0% | | | | | | | | |
aBellRing Brands Inc., A | | | 55,500 | | | | 1,181,595 | |
Church & Dwight Co. Inc. | | | 59,500 | | | | 4,185,230 | |
McCormick & Co. Inc. | | | 19,500 | | | | 3,309,735 | |
| | | | | | | | |
| | | | | | | 8,676,560 | |
| | | | | | | | |
Energy 0.7% | | | | | | | | |
Diamondback Energy Inc. | | | 30,400 | | | | 2,822,944 | |
| | | | | | | | |
Financials 7.5% | | | | | | | | |
Ares Management Corp., A | | | 88,500 | | | | 3,158,565 | |
CBOE Global Markets Inc. | | | 42,000 | | | | 5,040,000 | |
MarketAxess Holdings Inc. | | | 15,796 | | | | 5,988,422 | |
MSCI Inc. | | | 30,000 | | | | 7,745,400 | |
TCF Financial Corp. | | | 61,000 | | | | 2,854,800 | |
Tradeweb Markets Inc. | | | 87,500 | | | | 4,055,625 | |
Western Alliance Bancorp | | | 63,000 | | | | 3,591,000 | |
| | | | | | | | |
| | | | | | | 32,433,812 | |
| | | | | | | | |
FRANKLIN TEMPLETON VARIABLE INSURANCE PRODUCTS TRUST
STATEMENT OF INVESTMENTS
Franklin Small-Mid Cap Growth VIP Fund(continued)
| | | | | | | | |
| | | Shares | | | Value | |
| | |
Common Stocks(continued) | | | | | | | | |
Health Care 14.7% | | | | | | | | |
aArgenx SE, ADR (Netherlands) | | | 9,000 | | | $ | 1,444,680 | |
aAvantor Inc. | | | 190,500 | | | | 3,457,575 | |
aDexCom Inc. | | | 29,688 | | | | 6,493,953 | |
aElanco Animal Health Inc. | | | 98,500 | | | | 2,900,825 | |
aGuardant Health Inc. | | | 28,800 | | | | 2,250,432 | |
aGW Pharmaceuticals PLC, ADR (United Kingdom) | | | 21,600 | | | | 2,258,496 | |
aHealthEquity Inc. | | | 51,500 | | | | 3,814,605 | |
aHeron Therapeutics Inc. | | | 172,400 | | | | 4,051,400 | |
aIDEXX Laboratories Inc. | | | 25,750 | | | | 6,724,098 | |
aiRhythm Technologies Inc. | | | 25,500 | | | | 1,736,295 | |
a,dLivongo Health Inc. | | | 73,000 | | | | 1,829,380 | |
aMasimo Corp. | | | 14,000 | | | | 2,212,840 | |
aMettler-Toledo International Inc. | | | 8,655 | | | | 6,865,838 | |
aNeurocrine Biosciences Inc. | | | 19,144 | | | | 2,057,789 | |
aPenumbra Inc. | | | 22,748 | | | | 3,736,814 | |
aPTC Therapeutics Inc. | | | 40,000 | | | | 1,921,200 | |
aReata Pharmaceuticals Inc. | | | 19,800 | | | | 4,047,714 | |
aRevance Therapeutics Inc. | | | 74,001 | | | | 1,201,036 | |
aSage Therapeutics Inc. | | | 7,500 | | | | 541,425 | |
aVeeva Systems Inc. | | | 30,600 | | | | 4,304,196 | |
| | | | | | | 63,850,591 | |
Industrials 17.5% | | | | | | | | |
BWX Technologies Inc. | | | 63,500 | | | | 3,942,080 | |
aCoStar Group Inc. | | | 15,535 | | | | 9,294,590 | |
Fortive Corp. | | | 75,100 | | | | 5,736,889 | |
IDEX Corp. | | | 42,500 | | | | 7,310,000 | |
L3Harris Technologies Inc. | | | 19,500 | | | | 3,858,465 | |
aLyft Inc., A | | | 55,500 | | | | 2,387,610 | |
aMercury Systems Inc. | | | 51,000 | | | | 3,524,610 | |
Old Dominion Freight Line Inc. | | | 11,500 | | | | 2,182,470 | |
Republic Services Inc. | | | 54,000 | | | | 4,840,020 | |
Rockwell Automation Inc. | | | 31,500 | | | | 6,384,105 | |
Roper Technologies Inc. | | | 17,243 | | | | 6,107,988 | |
Stanley Black & Decker Inc. | | | 25,296 | | | | 4,192,559 | |
TransUnion | | | 55,500 | | | | 4,751,355 | |
aUnivar Solutions Inc. | | | 57,800 | | | | 1,401,072 | |
aUpwork Inc. | | | 161,000 | | | | 1,717,870 | |
Verisk Analytics Inc. | | | 54,861 | | | | 8,192,942 | |
| | | | | | | 75,824,625 | |
Information Technology 29.4% | | | | | | | | |
a Advanced Micro Devices Inc. | | | 23,900 | | | | 1,096,054 | |
aAdyen NV (Netherlands) | | | 2,900 | | | | 2,377,362 | |
aAlteryx Inc. | | | 37,300 | | | | 3,732,611 | |
Amphenol Corp., A | | | 54,200 | | | | 5,866,066 | |
aANSYS Inc. | | | 21,200 | | | | 5,457,092 | |
aAtlassian Corp. PLC | | | 40,000 | | | | 4,813,600 | |
FRANKLIN TEMPLETON VARIABLE INSURANCE PRODUCTS TRUST
STATEMENT OF INVESTMENTS
Franklin Small-Mid Cap Growth VIP Fund(continued)
| | | | | | | | |
| | | Shares | | | Value | |
| | |
Common Stocks(continued) | | | | | | | | |
Information Technology(continued) | | | | | | | | |
a Bill.Com Holdings Inc. | | | 16,800 | | | $ | 639,240 | |
a,b,cBill.Com Holdings Inc. | | | 48,148 | | | | 1,763,456 | |
aBlack Knight Inc. | | | 106,000 | | | | 6,834,880 | |
aCloudFlare Inc., A | | | 101,300 | | | | 1,728,178 | |
aDocuSign Inc. | | | 89,500 | | | | 6,632,845 | |
aEPAM Systems Inc. | | | 20,500 | | | | 4,349,280 | |
Global Payments Inc. | | | 42,600 | | | | 7,777,056 | |
aGoDaddy Inc., A | | | 98,117 | | | | 6,664,107 | |
aKeysight Technologies Inc. | | | 20,800 | | | | 2,134,704 | |
KLA Corp. | | | 32,237 | | | | 5,743,666 | |
aLattice Semiconductor Corp. | | | 112,195 | | | | 2,147,412 | |
Microchip Technology Inc. | | | 31,327 | | | | 3,280,563 | |
Monolithic Power Systems | | | 30,500 | | | | 5,429,610 | |
NXP Semiconductors NV (Netherlands) | | | 10,600 | | | | 1,348,956 | |
aOkta Inc., A | | | 18,400 | | | | 2,122,808 | |
aPaylocity Holding Corp. | | | 39,500 | | | | 4,772,390 | |
aQ2 Holdings Inc. | | | 39,996 | | | | 3,242,876 | |
aSemtech Corp. | | | 17,000 | | | | 899,300 | |
aSiTime Corp. (Japan) | | | 59,100 | | | | 1,507,050 | |
aSquare Inc., A | | | 42,000 | | | | 2,627,520 | |
aSynopsys Inc. | | | 47,000 | | | | 6,542,400 | |
aTrimble Inc. | | | 66,500 | | | | 2,772,385 | |
aTwilio Inc., A | | | 56,000 | | | | 5,503,680 | |
aViaSat Inc. | | | 51,266 | | | | 3,752,415 | |
aWEX Inc. | | | 18,500 | | | | 3,875,010 | |
aWix.com Ltd. (Israel) | | | 16,000 | | | | 1,958,080 | |
Xilinx Inc. | | | 37,000 | | | | 3,617,490 | |
aZendesk Inc. | | | 53,700 | | | | 4,115,031 | |
| | |
| | | | | | | 127,125,173 | |
| | |
Materials 3.0% | | | | | | | | |
Ball Corp. | | | 70,700 | | | | 4,572,169 | |
aIngevity Corp. | | | 44,741 | | | | 3,909,469 | |
Martin Marietta Materials Inc. | | | 16,500 | | | | 4,614,060 | |
| | |
| | | | | | | 13,095,698 | |
| | |
Real Estate 1.8% | | | | | | | | |
SBA Communications Corp., A | | | 33,057 | | | | 7,966,406 | |
| | |
Total Common Stocks (Cost $312,287,852) | | | | | | | 423,503,913 | |
| | |
Short Term Investments 3.5% | | | | | | | | |
| | |
Money Market Funds (Cost $10,406,987) 2.4% | | | | | | | | |
e,fInstitutional Fiduciary Trust Money Market Portfolio, 1.26% | | | 10,406,987 | | | | 10,406,987 | |
FRANKLIN TEMPLETON VARIABLE INSURANCE PRODUCTS TRUST
STATEMENT OF INVESTMENTS
Franklin Small-Mid Cap Growth VIP Fund(continued)
| | | | | | | | |
| | | Shares | | | Value | |
| | |
Short Term Investments(continued) | | | | | | | | |
| | |
gInvestments from Cash Collateral Received for Loaned Securities 1.1% | | | | | | | | |
Money Market Funds (Cost $4,879,541) 1.1% | | | | | | | | |
e,fInstitutional Fiduciary Trust Money Market Portfolio, 1.26% | | | 4,879,541 | | | $ | 4,879,541 | |
| | | | | | | | |
| | |
Total Investments (Cost $327,574,380) 101.3% | | | | | | | 438,790,441 | |
| | |
Other Assets, less Liabilities (1.3)% | | | | | | | (5,517,932 | ) |
| | | | | | | | |
| | |
Net Assets 100.0% | | | | | | $ | 433,272,509 | |
| | | | | | | | |
See Abbreviations on page FSC-24.
aNon-income producing.
bFair valued using significant unobservable inputs. See Note 9 regarding fair value measurements.
cSee Note 7 regarding restricted securities.
dA portion or all of the security is on loan at December 31, 2019. See Note 1(c).
eSee Note 3(e) regarding investments in affiliated management investment companies.
fThe rate shown is the annualized seven-day effective yield at period end.
gSee Note 1(c) regarding securities on loan.
| | | | |
| | | |
FSC-12 | | Annual Report | The accompanying notes are an integral part of these financial statements. | | |
FRANKLIN TEMPLETON VARIABLE INSURANCE PRODUCTS TRUST
FINANCIAL STATEMENTS
Statement of Assets and Liabilities
December 31, 2019
| | | | |
| | | Franklin Small-Mid Cap Growth VIP Fund | |
Assets: | | | | |
Investments in securities: | | | | |
Cost - Unaffiliated issuers | | | $312,287,852 | |
Cost - Non-controlled affiliates (Note 3e) | | | 15,286,528 | |
| |
Value - Unaffiliated issuers+ | | | $423,503,913 | |
Value - Non-controlled affiliates (Note 3e) | | | 15,286,528 | |
Receivables: | | | | |
Investment securities sold | | | 15,696 | |
Capital shares sold | | | 14,442 | |
Dividends and interest | | | 134,686 | |
Other assets | | | 49 | |
| |
Total assets | | | 438,955,314 | |
| |
Liabilities: | | | | |
Payables: | | | | |
Capital shares redeemed | | | 282,565 | |
Management fees | | | 287,779 | |
Distribution fees | | | 84,249 | |
Payable upon return of securities loaned | | | 4,879,541 | |
Accrued expenses and other liabilities | | | 148,671 | |
| |
Total liabilities | | | 5,682,805 | |
| |
Net assets, at value | | | $433,272,509 | |
| |
Net assets consist of: | | | | |
Paid-in capital | | | $260,632,765 | |
Total distributable earnings (losses) | | | 172,639,744 | |
| |
Net assets, at value | | | $433,272,509 | |
| |
Class 1: | | | | |
Net assets, at value | | | $ 43,168,760 | |
Shares outstanding | | | 2,187,123 | |
Net asset value and maximum offering price per share | | | $19.74 | |
| |
Class 2: | | | | |
Net assets, at value | | | $372,442,179 | |
Shares outstanding | | | 21,541,516 | |
Net asset value and maximum offering price per share | | | $17.29 | |
| |
Class 4: | | | | |
Net assets, at value | | | $ 17,661,570 | |
Shares outstanding | | | 978,862 | |
Net asset value and maximum offering price per share | | | $18.04 | |
| |
+Includes securities loaned | | | $ 4,887,803 | |
| | | | |
| | | |
| | The accompanying notes are an integral part of these financial statements. | Annual Report | | FSC-13 |
FRANKLIN TEMPLETON VARIABLE INSURANCE PRODUCTS TRUST
FINANCIAL STATEMENTS
Statement of Operations
for the year ended December 31, 2019
| | | | |
| | | Franklin Small-Mid Cap Growth VIP Fund | |
Investment income: | | | | |
Dividends: (net of foreign taxes)* | | | | |
Unaffiliated issuers | | | $ 2,321,013 | |
Non-controlled affiliates (Note 3e) | | | 263,730 | |
Income from securities loaned: | | | | |
Unaffiliated issuers (net of fees and rebates) | | | 103,423 | |
Non-controlled affiliates (Note 3e) | | | 53,015 | |
| |
Total investment income | | | 2,741,181 | |
| |
Expenses: | | | | |
Management fees (Note 3a) | | | 3,406,669 | |
Distribution fees: (Note 3c) | | | | |
Class 2 | | | 919,701 | |
Class 4 | | | 58,641 | |
Custodian fees (Note 4) | | | 3,406 | |
Reports to shareholders | | | 122,129 | |
Professional fees | | | 55,888 | |
Trustees’ fees and expenses | | | 2,513 | |
Other | | | 17,763 | |
| |
Total expenses | | | 4,586,710 | |
Expense reductions (Note 4) | | | (69 | ) |
Expenses waived/paid by affiliates (Note 3e) | | | (60,763 | ) |
| |
Net expenses | | | 4,525,878 | |
| |
Net investment income (loss) | | | (1,784,697 | ) |
| |
Realized and unrealized gains (losses): | | | | |
Net realized gain (loss) from: | | | | |
Investments: | | | | |
Unaffiliated issuers | | | 63,676,743 | |
Foreign currency transactions | | | (1,441 | ) |
Net realized gain (loss) | | | 63,675,302 | |
| |
Net change in unrealized appreciation (depreciation) on: | | | | |
Investments: | | | | |
Unaffiliated issuers | | | 48,782,330 | |
| |
Net realized and unrealized gain (loss) | | | 112,457,632 | |
Net increase (decrease) in net assets resulting from operations | | | $110,672,935 | |
| | | | |
*Foreign taxes withheld on dividends | | | $ 37 | |
| | | | |
| | | |
FSC-14 | | Annual Report | The accompanying notes are an integral part of these financial statements. | | |
FRANKLIN TEMPLETON VARIABLE INSURANCE PRODUCTS TRUST
FINANCIAL STATEMENTS
Statements of Changes in Net Assets
| | | | | | | | |
| | | Franklin Small-Mid Cap Growth VIP Fund | |
| | | Year Ended December 31, | |
| | | 2019 | | | 2018 | |
| |
Increase (decrease) in net assets: | | | | | | | | |
Operations: | | | | | | | | |
Net investment income (loss) | | | $ (1,784,697 | ) | | | $ (2,030,124 | ) |
Net realized gain (loss) | | | 63,675,302 | | | | 59,101,775 | |
Net change in unrealized appreciation (depreciation) | | | 48,782,330 | | | | (74,199,939 | ) |
| | | | |
| | |
Net increase (decrease) in net assets resulting from operations | | | 110,672,935 | | | | (17,128,288 | ) |
| | | | |
Distributions to shareholders: | | | | | | | | |
Class 1 | | | (5,113,428 | ) | | | (3,540,738 | ) |
Class 2 | | | (51,808,967 | ) | | | (39,501,499 | ) |
Class 4 | | | (2,209,122 | ) | | | (1,517,449 | ) |
| | | | |
| | |
Total distributions to shareholders | | | (59,131,517 | ) | | | (44,559,686 | ) |
| | | | |
| | |
Capital share transactions: (Note 2) | | | | | | | | |
Class 1 | | | 4,136,766 | | | | 1,966,782 | |
Class 2 | | | 18,159,781 | | | | (25,664,064 | ) |
Class 4 | | | 1,857,466 | | | | 175,962 | |
| | | | |
| | |
Total capital share transactions | | | 24,154,013 | | | | (23,521,320 | ) |
| | | | |
Net increase (decrease) in net assets | | | 75,695,431 | | | | (85,209,294 | ) |
Net assets: | | | | | | | | |
Beginning of year | | | 357,577,078 | | | | 442,786,372 | |
| | | | |
End of year | | | $433,272,509 | | | | $357,577,078 | |
| | | | |
| | | | |
| | | |
| | The accompanying notes are an integral part of these financial statements. | Annual Report | | FSC-15 |
FRANKLIN TEMPLETON VARIABLE INSURANCE PRODUCTS TRUST
Notes to Financial Statements
Franklin Small-Mid Cap Growth VIP Fund
1. Organization and Significant Accounting Policies
Franklin Templeton Variable Insurance Products Trust (Trust) is registered under the Investment Company Act of 1940 (1940 Act) as an open-end management investment company, consisting of eighteen separate funds and applies the specialized accounting and reporting guidance in U.S. Generally Accepted Accounting Principles (U.S. GAAP). Franklin Small-Mid Cap Growth VIP Fund (Fund) is included in this report. Shares of the Fund are generally sold only to insurance company separate accounts to fund the benefits of variable life insurance policies or variable annuity contracts. At December 31, 2019, 43.8% of the Fund’s shares were held through one insurance company. Investment activities of these insurance company separate accounts could have a material impact on the Fund. The Fund offers three classes of shares: Class 1, Class 2 and Class 4. Each class of shares may differ by its distribution fees, voting rights on matters affecting a single class and its exchange privilege.
The following summarizes the Fund’s significant accounting policies.
a. Financial Instrument Valuation
The Fund’s investments in financial instruments are carried at fair value daily. Fair value is the price that would be received to sell an asset or paid to transfer a liability in an orderly transaction between market participants on the measurement date. The Fund calculates the net asset value (NAV) per share each business day as of 4 p.m. Eastern time or the regularly scheduled close of the New York Stock Exchange (NYSE), whichever is earlier. Under compliance policies and procedures approved by the Trust’s Board of Trustees (the Board), the Fund’s administrator has responsibility for oversight of valuation, including leading the cross-functional Valuation Committee (VC). The Fund may utilize independent pricing services, quotations from securities and financial instrument dealers, and other market sources to determine fair value.
Equity securities listed on an exchange or on the NASDAQ National Market System are valued at the last quoted sale price or the official closing price of the day, respectively. Foreign equity securities are valued as of the close of trading on the foreign stock exchange on which the security is primarily traded, or as of 4 p.m. Eastern time. The value is then converted into its U.S. dollar equivalent at the foreign exchange rate in effect at 4 p.m. Eastern time on the day that the value of the security is determined. Over-the-counter
(OTC) securities are valued within the range of the most recent quoted bid and ask prices. Securities that trade in multiple markets or on multiple exchanges are valued according to the broadest and most representative market. Certain equity securities are valued based upon fundamental characteristics or relationships to similar securities.
Investments in open-end mutual funds are valued at the closing NAV.
The Fund has procedures to determine the fair value of financial instruments for which market prices are not reliable or readily available. Under these procedures, the Fund primarily employs a market-based approach which may use related or comparable assets or liabilities, recent transactions, market multiples, book values, and other relevant information for the investment to determine the fair value of the investment. An income-based valuation approach may also be used in which the anticipated future cash flows of the investment are discounted to calculate fair value. Discounts may also be applied due to the nature or duration of any restrictions on the disposition of the investments. Due to the inherent uncertainty of valuations of such investments, the fair values may differ significantly from the values that would have been used had an active market existed.
Trading in securities on foreign securities stock exchanges and OTC markets may be completed before 4 p.m. Eastern time. In addition, trading in certain foreign markets may not take place on every Fund’s business day. Occasionally, events occur between the time at which trading in a foreign security is completed and 4 p.m. Eastern time that might call into question the reliability of the value of a portfolio security held by the Fund. As a result, differences may arise between the value of the Fund’s portfolio securities as determined at the foreign market close and the latest indications of value at 4 p.m. Eastern time. In order to minimize the potential for these differences, the VC monitors price movements following the close of trading in foreign stock markets through a series of country specific market proxies (such as baskets of American Depositary Receipts, futures contracts and exchange traded funds). These price movements are measured against established trigger thresholds for each specific market proxy to assist in determining if an event has occurred that may call into question the reliability of the values of the foreign securities held by the Fund. If such an event occurs, the securities may be valued using fair value procedures, which may include the use of independent pricing services.
FRANKLIN TEMPLETON VARIABLE INSURANCE PRODUCTS TRUST
NOTES TO FINANCIAL STATEMENTS
Franklin Small-Mid Cap Growth VIP Fund(continued)
When the last day of the reporting period is a non-business day, certain foreign markets may be open on those days that the Fund’s NAV is not calculated, which could result in differences between the value of the Fund’s portfolio securities on the last business day and the last calendar day of the reporting period. Any significant security valuation changes due to an open foreign market are adjusted and reflected by the Fund for financial reporting purposes.
b. Foreign Currency Translation
Portfolio securities and other assets and liabilities denominated in foreign currencies are translated into U.S. dollars based on the exchange rate of such currencies against U.S. dollars on the date of valuation. The Fund may enter into foreign currency exchange contracts to facilitate transactions denominated in a foreign currency. Purchases and sales of securities, income and expense items denominated in foreign currencies are translated into U.S. dollars at the exchange rate in effect on the transaction date. Portfolio securities and assets and liabilities denominated in foreign currencies contain risks that those currencies will decline in value relative to the U.S. dollar. Occasionally, events may impact the availability or reliability of foreign exchange rates used to convert the U.S. dollar equivalent value. If such an event occurs, the foreign exchange rate will be valued at fair value using procedures established and approved by the Board.
The Fund does not separately report the effect of changes in foreign exchange rates from changes in market prices on securities held. Such changes are included in net realized and unrealized gain or loss from investments in the Statement of Operations.
Realized foreign exchange gains or losses arise from sales of foreign currencies, currency gains or losses realized between the trade and settlement dates on securities transactions and the difference between the recorded amounts of dividends, interest, and foreign withholding taxes and the U.S. dollar equivalent of the amounts actually received or paid. Net unrealized foreign exchange gains and losses arise from changes in foreign exchange rates on foreign denominated assets and liabilities other than investments in securities held at the end of the reporting period.
c. Securities Lending
The Fund participates in an agency based securities lending program to earn additional income. The Fund receives cash collateral against the loaned securities in an amount equal to at least 102% of the fair value of the loaned securities. Collateral is maintained over the life of the loan in an amount not less than 100% of the fair value of loaned securities, as determined at the close of Fund business each day; any additional collateral required due to changes in security values is delivered to the Fund on the next business day. The collateral is deposited into a joint cash account with other funds and is used to invest in a money market fund managed by Franklin Advisers, Inc., an affiliate of the Fund. The Fund may receive income from the investment of cash collateral, in addition to lending fees and rebates paid by the borrower. Income from securities loaned, net of fees paid to the securities lending agent and/or third-party vendor, is reported separately in the Statement of Operations. The Fund bears the market risk with respect to the collateral investment, securities loaned, and the risk that the agent may default on its obligations to the Fund. If the borrower defaults on its obligation to return the securities loaned, the Fund has the right to repurchase the securities in the open market using the collateral received. The securities lending agent has agreed to indemnify the Fund in the event of default by a third party borrower.
d. Income and Deferred Taxes
It is the Fund’s policy to qualify as a regulated investment company under the Internal Revenue Code. The Fund intends to distribute to shareholders substantially all of its taxable income and net realized gains to relieve it from federal income and if applicable, excise taxes. As a result, no provision for U.S. federal income taxes is required.
The Fund may be subject to foreign taxation related to income received, capital gains on the sale of securities and certain foreign currency transactions in the foreign jurisdictions in which it invests. Foreign taxes, if any, are recorded based on the tax regulations and rates that exist in the foreign markets in which the Fund invests. When a capital gain tax is determined to apply, the Fund records an estimated deferred tax liability in an amount that would be payable if the securities were disposed of on the valuation date.
FRANKLIN TEMPLETON VARIABLE INSURANCE PRODUCTS TRUST
NOTES TO FINANCIAL STATEMENTS
Franklin Small-Mid Cap Growth VIP Fund(continued)
1. Organization and Significant Accounting Policies(continued)
d. Income and Deferred Taxes(continued)
The Fund may recognize an income tax liability related to its uncertain tax positions under U.S. GAAP when the uncertain tax position has a less than 50% probability that it will be sustained upon examination by the tax authorities based on its technical merits. As of December 31, 2019, the Fund has determined that no tax liability is required in its financial statements related to uncertain tax positions for any open tax years (or expected to be taken in future tax years). Open tax years are those that remain subject to examination and are based on the statute of limitations in each jurisdiction in which the Fund invests.
e. Security Transactions, Investment Income, Expenses and Distributions
Security transactions are accounted for on trade date. Realized gains and losses on security transactions are determined on a specific identification basis. Estimated expenses are accrued daily. Dividend income is recorded on the ex-dividend date except for certain dividends from securities where the dividend rate is not available. In such cases, the dividend is recorded as soon as the information is received by the Fund. Distributions to shareholders are recorded on the ex-dividend date. Distributable earnings are determined according to income tax regulations (tax basis) and may differ from earnings recorded in accordance with U.S. GAAP. These differences may be permanent or temporary. Permanent differences are reclassified among capital accounts to reflect their tax character. These reclassifications have no impact on net assets or the results of operations. Temporary differences are not reclassified, as they may reverse in subsequent periods.
Common expenses incurred by the Trust are allocated among the Funds based on the ratio of net assets of each Fund to the combined net assets of the Trust or based on the ratio of number of shareholders of each Fund to the combined number of shareholders of the Trust. Fund specific expenses are charged directly to the Fund that incurred the expense.
Realized and unrealized gains and losses and net investment income, excluding class specific expenses, are allocated daily to each class of shares based upon the relative proportion of net assets of each class. Differences in per share distributions by class are generally due to differences in class specific expenses.
f. Accounting Estimates
The preparation of financial statements in accordance with U.S. GAAP requires management to make estimates and assumptions that affect the reported amounts of assets and liabilities at the date of the financial statements and the amounts of income and expenses during the reporting period. Actual results could differ from those estimates.
g. Guarantees and Indemnifications
Under the Trust’s organizational documents, its officers and trustees are indemnified by the Trust against certain liabilities arising out of the performance of their duties to the Trust. Additionally, in the normal course of business, the Trust, on behalf of the Fund, enters into contracts with service providers that contain general indemnification clauses. The Trust’s maximum exposure under these arrangements is unknown as this would involve future claims that may be made against the Trust that have not yet occurred. Currently, the Trust expects the risk of loss to be remote.
FRANKLIN TEMPLETON VARIABLE INSURANCE PRODUCTS TRUST
NOTES TO FINANCIAL STATEMENTS
Franklin Small-Mid Cap Growth VIP Fund(continued)
2. Shares of Beneficial Interest
At December 31, 2019, there were an unlimited number of shares authorized (without par value). Transactions in the Fund’s shares were as follows:
| | | | | | | | | | | | | | | | |
| | | Year Ended December 31, | |
| | | | |
| | | 2019 | | | 2018 | |
| | | | |
| | | Shares | | | Amount | | | Shares | | | Amount | |
| |
Class 1 Shares: | | | | | | | | | | | | | | | | |
Shares sold | | | 318,754 | | | $ | 6,251,939 | | | | 148,944 | | | $ | 2,929,602 | |
Shares issued in reinvestment of distributions | | | 273,885 | | | | 5,113,428 | | | | 179,278 | | | | 3,540,738 | |
Shares redeemed | | | (372,027 | ) | | | (7,228,601 | ) | | | (231,919 | ) | | | (4,503,558 | ) |
| | | | |
| | | | |
Net increase (decrease) | | | 220,612 | | | $ | 4,136,766 | | | | 96,303 | | | $ | 1,966,782 | |
| | | | |
| | | | |
Class 2 Shares: | | | | | | | | | | | | | | | | |
Shares sold | | | 1,911,894 | | | $ | 33,367,659 | | | | 706,305 | | | $ | 12,308,866 | |
Shares issued in reinvestment of distributions | | | 3,162,941 | | | | 51,808,967 | | | | 2,236,778 | | | | 39,501,499 | |
Shares redeemed | | | (3,921,307 | ) | | | (67,016,845 | ) | | | (4,433,380 | ) | | | (77,474,429 | ) |
| | | | |
| | | | |
Net increase (decrease) | | | 1,153,528 | | | $ | 18,159,781 | | | | (1,490,297 | ) | | $ | (25,664,064 | ) |
| | | | |
| | | | |
Class 4 Shares: | | | | | | | | | | | | | | | | |
Shares sold | | | 191,080 | | | $ | 3,405,783 | | | | 136,649 | | | $ | 2,474,956 | |
Shares issued in reinvestment of distributions | | | 129,188 | | | | 2,209,122 | | | | 82,695 | | | | 1,517,449 | |
Shares redeemed | | | (211,768 | ) | | | (3,757,439 | ) | | | (205,969 | ) | | | (3,816,443 | ) |
| | | | |
| | | | |
Net increase (decrease) | | | 108,500 | | | $ | 1,857,466 | | | | 13,375 | | | $ | 175,962 | |
| | | | |
3. Transactions with Affiliates
Franklin Resources, Inc. is the holding company for various subsidiaries that together are referred to as Franklin Templeton. Certain officers and trustees of the Fund are also officers and/or directors of the following subsidiaries:
| | |
| Subsidiary | | Affiliation |
Franklin Advisers, Inc. (Advisers) | | Investment manager |
Franklin Templeton Services, LLC (FT Services) | | Administrative manager |
Franklin Templeton Distributors, Inc. (Distributors) | | Principal underwriter |
Franklin Templeton Investor Services, LLC (Investor Services) | | Transfer agent |
FRANKLIN TEMPLETON VARIABLE INSURANCE PRODUCTS TRUST
NOTES TO FINANCIAL STATEMENTS
Franklin Small-Mid Cap Growth VIP Fund(continued)
3. Transactions with Affiliates (continued)
a. Management Fees
The Fund pays an investment management fee to Advisers based on the average daily net assets of the Fund as follows:
| | |
| Annualized Fee Rate | | Net Assets |
0.800% | | Up to and including $500 million |
0.700% | | Over $500 million, up to and including $1 billion |
0.650% | | Over $1 billion, up to and including $1.5 billion |
0.600% | | Over $1.5 billion, up to and including $6.5 billion |
0.575% | | Over $6.5 billion, up to and including $11.5 billion |
0.550% | | Over $11.5 billion, up to and including $16.5 billion |
0.540% | | Over $16.5 billion, up to and including $19 billion |
0.530% | | Over $19 billion, up to and including $21.5 billion |
0.520% | | In excess of $21.5 billion |
b. Administrative Fees
Under an agreement with Advisers, FT Services provides administrative services to the Fund. The fee is paid by Advisers based on the Fund’s average daily net assets, and is not an additional expense of the Fund.
c. Distribution Fees
The Board has adopted distribution plans for Class 2 and Class 4 shares pursuant to Rule 12b-1 under the 1940 Act. Under the Fund’s compensation distribution plans, the Fund pays Distributors for costs incurred in connection with the servicing, sale and distribution of the Fund’s shares up to 0.35% per year of its average daily net assets of each class. The Board has agreed to limit the current rate to 0.25% per year for Class 2. The plan year, for purposes of monitoring compliance with the maximum annual plan rates, is February 1 through January 31.
d. Transfer Agent Fees
Investor Services, under terms of an agreement, performs shareholder servicing for the Fund and is not paid by the Fund for the services.
FRANKLIN TEMPLETON VARIABLE INSURANCE PRODUCTS TRUST
NOTES TO FINANCIAL STATEMENTS
Franklin Small-Mid Cap Growth VIP Fund(continued)
e. Investments in Affiliated Management Investment Companies
The Fund invests in one or more affiliated management investment companies for purposes other than exercising a controlling influence over the management or policies. Management fees paid by the Fund are waived on assets invested in the affiliated management investment companies, as noted in the Statement of Operations, in an amount not to exceed the management and administrative fees paid directly or indirectly by each affiliate. During the year ended December 31, 2019, the Fund held investments in affiliated management investment companies as follows:
| | | | | | | | | | | | | | | | | | | | | | | | | | | | | | | | |
| | | Value at
Beginning
of Year | | | Purchases | | | Sales | | | Realized
Gain (Loss) | | | Net Change in Unrealized
Appreciation (Depreciation) | | | Value at
End of Year | | | Number of
Shares
Held at End of Year | | | Investment
Income | |
| | | | | | | | |
Non-Controlled Affiliates | | | | | | | | | | | | | | | | | | | | | | | | | | | | | | | | |
| | | | | | | | |
| | | | | | | | | | | | | | | | | | | | | | | | | | | | | | | Dividends | |
| | | | | | | | | | | | | | | | | | | | | | | | | | | | | | | | |
| | | | | | | | |
Institutional Fiduciary Trust Money Market Portfolio, 1.26% | | | $12,085,918 | | | | $114,308,590 | | | | $(115,987,521 | ) | | | $ — | | | | $ — | | | | $10,406,987 | | | | 10,406,987 | | | | $263,730 | |
| | | | | | | | |
| | | | | | | | | | | | | | | | | | | | | | | | | | | | | |
| Income from
securities
loaned |
|
| | | | | | | | | | | | | | | | | | | | | | | | | | | | | | | | |
| | | | | | | | |
Institutional Fiduciary Trust Money Market Portfolio, 1.26% | | | — | | | | 51,372,997 | | | | (46,493,456 | ) | | | — | | | | — | | | | 4,879,541 | | | | 4,879,541 | | | | 53,015 | |
| | | | | | | | | | | | |
| | | | | | | | |
Total Affiliated Securities | | | $12,085,918 | | | | $165,681,587 | | | | $(162,480,977 | ) | | | $ — | | | | $ — | | | | $15,286,528 | | | | | | | | $316,745 | |
| | | | | | | | | | | | |
f. Interfund Transactions
The Fund engaged in purchases and sales of investments with funds or other accounts that have common investment managers (or affiliated investment managers), directors, trustees or officers. During the year ended December 31, 2019, these purchase and sale transactions aggregated $0 and $295,036, respectively.
4. Expense Offset Arrangement
The Fund has entered into an arrangement with its custodian whereby credits realized as a result of uninvested cash balances are used to reduce a portion of the Fund’s custodian expenses. During the year ended December 31, 2019, the custodian fees were reduced as noted in the Statement of Operations.
5. Income Taxes
The tax character of distributions paid during the years ended December 31, 2019 and 2018, was as follows:
| | | | | | | | |
| | | 2019 | | | 2018 |
| | | | |
| | |
Distributions paid from: | | | | | | | | |
| | |
Ordinary income | | $ | — | | | $ | 4,739,598 | |
| | |
Long term capital gain | | | 59,131,517 | | | | 39,820,088 | |
| | | | |
| | |
| | $ | 59,131,517 | | | $ | 44,559,686 | |
| | | | |
FRANKLIN TEMPLETON VARIABLE INSURANCE PRODUCTS TRUST
NOTES TO FINANCIAL STATEMENTS
Franklin Small-Mid Cap Growth VIP Fund(continued)
5. Income Taxes(continued)
At December 31, 2019, the cost of investments, net unrealized appreciation (depreciation), undistributed ordinary income and undistributed long term capital gains for income tax purposes were as follows:
| | | | |
Cost of investments | | $ | 327,888,701 | |
| |
Unrealized appreciation | | $ | 117,591,450 | |
| |
Unrealized depreciation | | | (6,689,710 | ) |
| |
Net unrealized appreciation (depreciation) | | $ | 110,901,740 | |
| |
Distributable earnings: | | | | |
Undistributed ordinary income | | $ | 4,541,205 | |
| |
Undistributed long term capital gains | | | 57,196,798 | |
| |
Total distributable earnings | | $ | 61,738,003 | |
Differences between income and/or capital gains as determined on a book basis and a tax basis are primarily due to differing treatment of wash sales.
6. Investment Transactions
Purchases and sales of investments (excluding short term securities) for the year ended December 31, 2019, aggregated $242,597,679 and $278,418,875, respectively.
At December 31, 2019, in connection with securities lending transactions, the Fund loaned equity investments and received $4,879,541 of cash collateral. The gross amount of recognized liability for such transactions is included in payable upon return of securities loaned in the Statement of Assets and Liabilities. The agreements can be terminated at any time.
7. Restricted Securities
The Fund invests in securities that are restricted under the Securities Act of 1933 (1933 Act). Restricted securities are often purchased in private placement transactions, and cannot be sold without prior registration unless the sale is pursuant to an exemption under the 1933 Act. Disposal of these securities may require greater effort and expense, and prompt sale at an acceptable price may be difficult. The Fund may have registration rights for restricted securities. The issuer generally incurs all registration costs.
At December 31, 2019, investments in restricted securities, excluding securities exempt from registration under the 1933 Act, were as follows:
| | | | | | | | | | | | | | | | |
| Shares | | | Issuer | | Acquisition Date | | | Cost | | | Value | |
| | | | |
| | 48,148 | | | Bill.Com Holdings Inc. | | | 12/21/18 | | | $ | 799,998 | | | $ | 1,763,456 | |
| | | | |
| | 733,541 | | | DraftKings Inc. | | | 8/07/15 | | | | 2,800,003 | | | | 2,241,958 | |
| | | | |
| | | | Total Restricted Securities(Value is 0.9% of Net Assets) | | | | | | $ | 3,600,001 | | | $ | 4,005,414 | |
FRANKLIN TEMPLETON VARIABLE INSURANCE PRODUCTS TRUST
NOTES TO FINANCIAL STATEMENTS
Franklin Small-Mid Cap Growth VIP Fund(continued)
8. Credit Facility
The Fund, together with other U.S. registered and foreign investment funds (collectively, Borrowers), managed by Franklin Templeton, are borrowers in a joint syndicated senior unsecured credit facility totaling $2 billion (Global Credit Facility) which matured on February 7, 2020. This Global Credit Facility provides a source of funds to the Borrowers for temporary and emergency purposes, including the ability to meet future unanticipated or unusually large redemption requests. Effective February 7, 2020, the Borrowers renewed the Global Credit Facility for a one year term, maturing February 5, 2021, for a total of $2 billion.
Under the terms of the Global Credit Facility, the Fund shall, in addition to interest charged on any borrowings made by the Fund and other costs incurred by the Fund, pay its share of fees and expenses incurred in connection with the implementation and maintenance of the Global Credit Facility, based upon its relative share of the aggregate net assets of all of the Borrowers, including an annual commitment fee of 0.15% based upon the unused portion of the Global Credit Facility. These fees are reflected in other expenses in the Statement of Operations. During the year ended December 31, 2019, the Fund did not use the Global Credit Facility.
9. Fair Value Measurements
The Fund follows a fair value hierarchy that distinguishes between market data obtained from independent sources (observable inputs) and the Fund’s own market assumptions (unobservable inputs). These inputs are used in determining the value of the Fund’s financial instruments and are summarized in the following fair value hierarchy:
| | • | | Level 1 – quoted prices in active markets for identical financial instruments |
| | • | | Level 2 – other significant observable inputs (including quoted prices for similar financial instruments, interest rates, prepayment speed, credit risk, etc.) |
| | • | | Level 3 – significant unobservable inputs (including the Fund’s own assumptions in determining the fair value of financial instruments) |
The input levels are not necessarily an indication of the risk or liquidity associated with financial instruments at that level.
A summary of inputs used as of December 31, 2019, in valuing the Fund’s assets carried at fair value, is as follows:
| | | | | | | | | | | | | | | | |
| | | Level 1 | | | Level 2 | | | Level 3 | | | Total | |
| | | | |
Assets: | | | | | | | | | | | | | | | | |
| | | | |
Investments in Securities:a | | | | | | | | | | | | | | | | |
| | | | |
Equity Investments: | | | | | | | | | | | | | | | | |
| | | | |
Consumer Discretionary | | $ | 76,048,271 | | | $ | — | | | $ | 2,241,958 | | | $ | 78,290,229 | |
| | | | |
Information Technology | | | 125,361,717 | | | | — | | | | 1,763,456 | | | | 127,125,173 | |
| | | | |
All Other Equity Investments | | | 218,088,511 | | | | — | | | �� | — | | | | 218,088,511 | |
| | | | |
Short Term Investments | | | 15,286,528 | | | | — | | | | — | | | | 15,286,528 | |
| | | | |
Total Investments in Securities | | $ | 434,785,027 | | | $ | — | | | $ | 4,005,414 | | | $ | 438,790,441 | |
aFor detailed categories, see the accompanying Statement of Investments.
A reconciliation of assets in which Level 3 inputs are used in determining fair value is presented when there are significant Level 3 financial instruments at the beginning and/or end of the year.
FRANKLIN TEMPLETON VARIABLE INSURANCE PRODUCTS TRUST
NOTES TO FINANCIAL STATEMENTS
Franklin Small-Mid Cap Growth VIP Fund(continued)
10. Subsequent Events
The Fund has evaluated subsequent events through the issuance of the financial statements and determined that no events have occurred that require disclosure other than those already disclosed in the financial statements.
Abbreviations
Selected Portfolio
ADR American Depositary Receipt
FRANKLIN TEMPLETON VARIABLE INSURANCE PRODUCTS TRUST
Report of Independent Registered Public Accounting Firm
To the Board of Trustees of Franklin Templeton Variable Insurance Products Trust and Shareholders of Franklin Small-Mid Cap Growth VIP Fund
Opinion on the Financial Statements
We have audited the accompanying statement of assets and liabilities, including the statement of investments, of Franklin Small-Mid Cap Growth VIP Fund (the “Fund”) as of December 31, 2019, the related statement of operations for the year ended December 31, 2019, the statement of changes in net assets for each of the two years in the period ended December 31, 2019, including the related notes, and the financial highlights for each of the five years in the period ended December 31, 2019 (collectively referred to as the “financial statements”). In our opinion, the financial statements present fairly, in all material respects, the financial position of the Fund as of December 31, 2019, the results of its operations for the year then ended, the changes in its net assets for each of the two years in the period ended December 31, 2019 and the financial highlights for each of the five years in the period ended December 31, 2019 in conformity with accounting principles generally accepted in the United States of America.
Basis for Opinion
These financial statements are the responsibility of the Fund’s management. Our responsibility is to express an opinion on the Fund’s financial statements based on our audits. We are a public accounting firm registered with the Public Company Accounting Oversight Board (United States) (PCAOB) and are required to be independent with respect to the Fund in accordance with the U.S. federal securities laws and the applicable rules and regulations of the Securities and Exchange Commission and the PCAOB.
We conducted our audits of these financial statements in accordance with the standards of the PCAOB. Those standards require that we plan and perform the audit to obtain reasonable assurance about whether the financial statements are free of material misstatement, whether due to error or fraud.
Our audits included performing procedures to assess the risks of material misstatement of the financial statements, whether due to error or fraud, and performing procedures that respond to those risks. Such procedures included examining, on a test basis, evidence regarding the amounts and disclosures in the financial statements. Our audits also included evaluating the accounting principles used and significant estimates made by management, as well as evaluating the overall presentation of the financial statements. Our procedures included confirmation of securities owned as of December 31, 2019 by correspondence with the custodian, transfer agent and brokers; when replies were not received from brokers, we performed other auditing procedures. We believe that our audits provide a reasonable basis for our opinion.
PricewaterhouseCoopers LLP
San Francisco, California
February 20, 2020
We have served as the auditor of one or more investment companies in the Franklin Templeton Group of Funds since 1948.
FRANKLIN TEMPLETON VARIABLE INSURANCE PRODUCTS TRUST
Tax Information (unaudited)
Franklin Small-Mid Cap Growth VIP Fund
Under Section 852(b)(3)(C) of the Internal Revenue Code, the Fund hereby reports the maximum amount allowable but no less than $59,131,517 as a long term capital gain dividend for the fiscal year ended December 31, 2019.
Franklin Strategic Income VIP Fund
This annual report for Franklin Strategic Income VIP Fund covers the fiscal year ended December 31, 2019.
Class 4 Performance Summary as of December 31, 2019
Average annual total return of Class 4 shares* represents the average annual change in value, assuming reinvestment of dividends and capital gains. Average returns smooth out variations in returns, which can be significant; they are not the same as year-by-year results.
| | | | | | | | | | | | |
| Periods ended 12/31/19 | | 1-Year | | | 5-Year | | | 10-Year | |
| | | |
Average Annual Total Return | | | +7.93% | | | | +2.69% | | | | +4.37% | |
*The Fund has a fee waiver associated with any investment in a Franklin Templeton money fund and/or other Franklin Templeton fund, contractually guaranteed through 4/30/20. Fund investment results reflect the fee waiver; without this waiver, the results would have been lower.
Performance reflects the Fund’s Class 4 operating expenses, but doesnotinclude any contract fees, expenses or sales charges. If they had been included, performance would be lower. These charges and deductions, particularly for variable life policies, can have a significant effect on contract values and insurance benefits. See the contract prospectus for a complete description of these expenses, including sales charges.
Performance data represent past performance, which does not guarantee future results. Investment return and principal value will fluctuate, and you may have a gain or loss when you sell your shares. Current performance may differ from figures shown.
Total Return Index Comparison for a Hypothetical $10,000 Investment (1/1/10–12/31/19)
The graph below shows the change in value of a hypothetical $10,000 investment in the Fund over the indicated period and includes reinvestment of any income or distributions. The Fund’s performance* is compared to the performance of the Bloomberg Barclays U.S. Aggregate Bond Index and the Lipper Multi-Sector Income Funds Classification Average. One cannot invest directly in an index, and an index is not representative of the Fund’s portfolio.Please see Important Notes to Performance Information preceding the Fund Summaries.
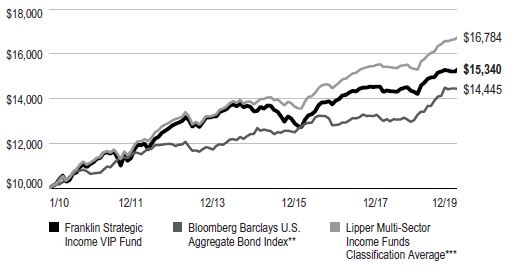
**Source: Morningstar. Please see Index Descriptions following the Fund Summaries.
***Source: Lipper, a Thomson Reuters Company. Please see Index Descriptions following the Fund Summaries.
FRANKLIN STRATEGIC INCOME VIP FUND
Fund Goal and Main Investments
The Fund seeks a high level of current income, with capital appreciation over the long term as a secondary goal. Under normal market conditions, the Fund invests primarily to predominantly in U.S. and foreign debt securities, including those in emerging markets.
Fund Risks
All investments involve risks, including possible loss of principal. Bond prices generally move in the opposite direction of interest rates. Thus, as prices of bonds in the Fund adjust to a rise in interest rates, the Fund’s share price may decline. Changes in the financial strength of a bond issuer or in a bond’s credit rating may affect its value. High yields reflect the higher credit risks associated with certain lower rated securities held in the portfolio. Floating rate loans and high yield corporate bonds are rated below investment grade and are subject to greater risk of default, which could result in loss of principal—a risk that may be heightened in a slowing economy. The risks of foreign securities include currency fluctuations and political uncertainty. Investments in developing markets involve heightened risks related to the same factors, in addition to those associated with their relatively small size and lesser liquidity. Investing in derivative securities and the use of foreign currency techniques involve special risks as such may not achieve the anticipated benefits and/or may result in losses to the Fund. The Fund is actively managed but there is no guarantee that the manager’s investment decisions will produce the desired results. The Fund’s prospectus also includes a description of the main investment risks.
Performance Overview
You can find the Fund’s one-year total return in the Performance Summary. For comparison, the Fund’s benchmark, the Bloomberg Barclays U.S. Aggregate Bond Index, posted a +8.72% total return for the period under review.1 The Fund’s peers, as measured by the Lipper Multi-Sector Income Funds Classification Average, posted a +9.77% return.2
Economic and Market Overview
Bond prices rose sharply during the reporting period, as interest-rate cuts and many investors’ search for income pushed down yields on most bond categories. Notably, U.S. bonds, as measured by the Bloomberg Barclays U.S. Aggregate Bond Index, performed well alongside high returns from U.S. equities, as measured by the Standard & Poor’s® 500 Index.
The primary driver of U.S. bond performance was a shift in the U.S. Federal Reserve’s (Fed’s) monetary policy. After a period of tightening in 2018, the Fed shifted course, announcing in January 2019 that it would not be raising interest rates in the near future. Three interest-rate cuts followed thereafter, with the Fed lowering the federal funds rate to a range of 1.50%–1.75%. Falling interest rates typically increase the value of existing bonds, since their relatively higher yields become more attractive to investors.
Both long-term and short-term U.S. bonds, as measured by subindexes of the Bloomberg Barclays U.S. Aggregate Bond Index, gained during the period, with long-term bonds posting stronger returns due to their higher sensitivity to interest-rate changes. Interest rates on long-term U.S. Treasuries initially fell more than interest rates on short-term U.S. Treasuries, leading to a flattening of the yield curve, which charts the yields of U.S. Treasuries at varying maturity dates. In August 2019, the yield on 10-year U.S. Treasuries fell below the yield on two-year U.S. Treasuries. While some investors considered this inversion a sign that the economy was moving toward a recession, the two-year and 10-year U.S. Treasury yield curve steepened again shortly thereafter amid positive economic signals.
U.S. Treasury bonds, as measured by the Bloomberg Barclays U.S. Treasury Index, gained during the period, which was characterized by high levels of Treasury issuance due to the government’s deficit spending. A strong U.S. dollar during most of the period and comparatively higher Treasury yields relative to sovereign debt issued by other developed market countries made Treasuries attractive to foreign investors.
Corporate bonds also posted noteworthy returns, driven by the combination of a relatively strong economy and lower interest rates. Both investment-grade and high-yield
1. Source: Morningstar.
2. Source: Lipper, a Thomson Reuters Company.
One cannot invest directly in an index, and an index is not representative of the Fund’s portfolio. Please see Index Descriptions following the Fund Summaries.
The dollar value, number of shares or principal amount, and names of all portfolio holdings are listed in the Fund’s Statement of Investments (SOI).
FRANKLIN STRATEGIC INCOME VIP FUND
corporate bonds gained significantly, as measured by the Bloomberg Barclays U.S. Corporate Bond Index and Bloomberg Barclays U.S. Corporate High Yield Bond Index, respectively, as solid corporate profits and steady economic growth helped strengthen investors’ confidence in corporate creditworthiness. The positive environment for debt extended to mortgage-backed securities, as prepayments due to homeowner refinancing declined after hitting a three-year high in August 2019.
Investment Strategy
We allocate our investments among the various types of debt available based on our assessment of changing economic, global market, industry and issuer conditions. We use a top-down analysis of macroeconomic trends, combined with a bottom-up fundamental analysis of market sectors, industries and issuers, seeking to take advantage of varying sector reactions to economic events. For example, we may evaluate business cycles, yield curves, country risk, and the relative interest rates among currencies, and values between and within markets. In selecting debt securities, we generally conduct our own analysis of the security’s intrinsic value rather than simply relying on the coupon rate or rating. We may also enter into various transactions involving certain currency-, interest rate- or credit-related derivative instruments.
|
What is the yield curve? A yield curve is a line that plots the yield to maturity of bonds having equal credit quality against their maturity dates. |
Manager’s Discussion
The Fund allocated assets across the broad fixed income markets with an emphasis on spread sectors, both corporate and securitized. Our largest allocations were in high-yield corporate credit, non-agency residential mortgage-backed securities (RMBS) and sovereign emerging market bonds, with smaller exposures to collateralized loan obligations (CLOs), senior secured floating-rate loans and investment-grade corporate credit. Over the period we pared exposure to high-yield and investment-grade corporate credit as well as senior secured floating-rate loans, while we increased our CLO exposure. The Fund added to RMBS over the period. For our RMBS exposure we preferred to remain allocated to the seasoned credit risk transfer where fundamental and technical forces remained positive. Our foreign-currency exposure was held through a basket of shorts with major positions in the euro, Australian dollar, Canadian dollar, Chinese Renminbi, New Zealand dollar and South Korean won versus a basket of longs with major positions in the
Portfolio Composition*
Based on Consolidated Net Assets
| | | | |
| | | 12/31/19 | |
| |
High-Yield Corporate Bonds | | | 16.89% | |
| |
Residential Mortgage-Backed Securities | | | 12.89% | |
| |
Non-Local Currency Emerging Market Bonds | | | 11.88% | |
| |
Collateralized Loan Obligations | | | 10.60% | |
| |
Floating-Rate Loans | | | 9.96% | |
| |
Investment-Grade Corporate Bonds | | | 9.13% | |
| |
Agency Mortgage-Backed Securities | | | 8.24% | |
| |
Interest-Rate Derivatives | | | 6.75% | |
| |
Municipal Bonds | | | 4.80% | |
| |
Treasury Inflation-Protected Securities | | | 4.04% | |
| |
Non-U.S. Developed Bonds | | | 3.82% | |
| |
Local Currency Emerging Market Bonds | | | 3.73% | |
| |
Asset-Backed Securities | | | 1.91% | |
| |
Commercial Mortgage-Backed Securities | | | 1.64% | |
| |
U.S. Treasuries | | | 1.46% | |
| |
Marketplace Loans | | | 0.65% | |
| |
Covered Bonds | | | 0.13% | |
| |
Currency Derivatives | | | -0.18% | |
| |
Other | | | 1.82% | |
| |
Short-Term Investments & Other Net Assets | | | 1.44% | |
*Notional exposure figures are intended to estimate the portfolio’s exposure, including any hedged or increased exposure through certain derivatives held in the portfolio (or their underlying reference assets). Portfolio breakdown percentages may not total 100% or may be negative due to rounding, use of any derivatives, unsettled trades or other factors. Interest-rate derivatives sector consists of Treasury, interest rate and other derivatives that are primarily used for duration management.
Japanese yen, Norwegian krone, Indonesian rupiah, Colombian, Uruguayan and Mexican peso, South African rand, Brazilian real and other emerging-market currencies.
The Fund’s U.S. dollar yield curve positioning was a significant contributor to performance. Allocations across corporate credit provided sizable contributions to results over the period, including high-yield and investment-grade corporate credit, senior secured floating-rate loans and CLOs. Sovereign emerging-market and developed market debt, non-dollar developed market bonds, tax-exempt municipal bonds and RMBS also benefited returns. Foreign currency exposure detracted from overall returns as performance gains mainly from our long Mexican peso, Swedish krona and Norwegian krone exposures and short euro, Chinese renminbi and South Korean won positions, were offset by negative returns from long positions in the Japanese yen, Uruguayan peso and Brazilian real and short Canadian dollar position. Additionally, the Fund’s exposure to fixed-rate agency MBS detracted from performance.
FRANKLIN STRATEGIC INCOME VIP FUND
The Fund utilized derivatives, including credit default swaps, currency forwards and government bond futures, for hedging purposes and to take active exposures. These derivative transactions may provide the same, or similar, net long or short exposure to select currencies, interest rates, countries, duration or credit risks compared to holding securities.
|
What are swap agreements? |
|
Swap agreements, such as interest-rate, currency and credit default swaps, are contracts between the Fund and another party (the swap counterparty). In a basic swap transaction, the Fund agrees with the swap counterparty to exchange the returns (or differentials in rates of return) earned or realized on a particular “notional amount” of underlying instruments. The notional amount is the set amount selected by the parties as the basis on which to calculate the obligations that they have agreed to exchange. The parties typically do not actually exchange the notional amount. Instead, they agree to exchange the returns that would be earned or realized if the notional amount were invested in given instruments or at given interest rates. |
|
|
What is a currency forward? |
|
A currency forward is a direct agreement between the Fund and a counterparty to buy or sell a foreign currency in exchange for another currency at a specific exchange rate on a future date. |
|
What is a futures contract? |
|
A futures contract is an agreement between the Fund and a counterparty made through a U.S. or foreign futures exchange to buy or sell an underlying instrument or asset at a specific price on a future date. |
|
What is meant by “hedge”? |
|
To hedge an investment is to take a position intended to offset potential losses that may be incurred by a companion financial instrument. Hedging an investment may also offset potential gains. |
Thank you for your participation in Franklin Strategic Income VIP Fund. We look forward to serving your future investment needs.
The foregoing information reflects our analysis, opinions and portfolio holdings as of December 31, 2019, the end of the reporting period. The way we implement our main investment strategies and the resulting portfolio holdings may change depending on factors such as market and economic conditions. These opinions may not be relied upon as investment advice or an offer for a particular security. The information is not a complete analysis of every aspect of any market, country, industry, security or the Fund. Statements of fact are from sources considered reliable, but the investment manager makes no representation or warranty as to their completeness or accuracy. Although historical performance is no guarantee of future results, these insights may help you understand our investment management philosophy.
FRANKLIN STRATEGIC INCOME VIP FUND
Class 4 Fund Expenses
As an investor in a variable insurance contract (Contract) that indirectly provides for investment in an underlying mutual fund, you can incur transaction and/or ongoing expenses at both the Fund level and the Contract Level: (1) transaction expenses can include sales charges (loads) on purchases, surrender fees, transfer fees and premium taxes; and (2) ongoing expenses can include management fees, distribution and service (12b-1) fees, contract fees, annual maintenance fees, mortality and expense risk fees and other fees and expenses. All mutual funds and Contracts have some types of ongoing expenses. The table below shows Fund-level ongoing expenses and can help you understand these costs and compare them with those of other mutual funds offered through the Contract. The table assumes a $1,000 investment held for the six months indicated. Please refer to the Fund prospectus for additional information on operating expenses.
Actual Fund Expenses
The table below provides information about the actual account values and actual expenses in the columns under the heading “Actual.” In these columns the Fund’s actual return, which includes the effect of ongoing Fund expenses but does not include the effect of ongoing Contract expenses, is used to calculate the “Ending Account Value.” You can estimate the Fund-level expenses you paid during the period by following these steps(of course, your account value and expenses will differ from those in this illustration): Divide your account value by $1,000(if your account had an $8,600 value, then $8,600 ÷ $1,000 = 8.6). Then multiply the result by the number under the headings “Actual” and “Fund-Level Expenses Paid During Period” (if Fund-Level Expenses Paid During Period were $ 7.50, then 8.6 x $ 7.50 = $64.50). In this illustration, the estimated expenses paid this period at the Fund level are $64.50.
Hypothetical Example for Comparison with Other Mutual Funds
Under the heading “Hypothetical” in the table, information is provided about hypothetical account values and hypothetical expenses based on the Fund’s actual expense ratio and an assumed rate of return of 5% per year before expenses, which is not the Fund’s actual return. This information may not be used to estimate the actual ending account balance or expenses you paid for the period, but it can help you compare ongoing costs of investing in the Fund with those of other mutual funds offered through the Contract. To do so, compare this 5% hypothetical example with the 5% hypothetical examples that appear in the shareholder reports of other funds offered through the Contract.
Please note that expenses shown in the table are meant to highlight ongoing costs at the Fund level only and do not reflect any ongoing expenses at the Contract level, or transaction expenses at either the Fund or Contract levels. In addition, while the Fund does not have transaction expenses, if the transaction and ongoing expenses at the Contract level were included, the expenses shown below would be higher. You should consult your Contract prospectus or disclosure document for more information.
| | | | | | | | | | | | |
| | | | | Actual (actual return after expenses) | | Hypothetical (5% annual return before expenses) | | |
Share Class | | Beginning
Account
Value 7/1/19 | | Ending
Account
Value 12/31/19 | | Fund-Level
Expenses
Paid During
Period
7/1/19–12/31/191, 2 | | Ending
Account
Value 12/31/19 | | Fund-Level
Expenses
Paid During
Period
7/1/19–12/31/191, 2 | | Net
Annualized
Expense
Ratio2 |
| | | | | | |
Class 4 | | $1,000 | | $1,011.20 | | $5.27 | | $1,019.96 | | $5.30 | | 1.04% |
1. Expenses are equal to the annualized expense ratio for the six-month period as indicated above—in the far right column—multiplied by the simple average account value over the period indicated, and then multiplied by 184/365 to reflect the one-half year period.
2. Reflects expenses after fee waivers and expense reimbursements. Does not include any ongoing expenses of the Contract for which the Fund is an investment option or acquired fund fees and expenses.
FRANKLIN TEMPLETON VARIABLE INSURANCE PRODUCTS TRUST
Consolidated Financial Highlights
Franklin Strategic Income VIP Fund
| | | | | | | | | | | | | | | | | | | | |
| | | Year Ended December 31, | |
| | | 2019 | | | 2018 | | | 2017 | | | 2016 | | | 2015 | |
| | | | | |
Class 1 | | | | | | | | | | | | | | | | | | | | |
| | | | | |
Per share operating performance | | | | | | | | | | | | | | | | | | | | |
(for a share outstanding throughout the year) | | | | | | | | | | | | | | | | | | | | |
| | | | | |
Net asset value, beginning of year | | | $10.65 | | | | $11.15 | | | | $11.01 | | | | $10.55 | | | | $11.90 | |
| | | | | |
Income from investment operationsa: | | | | | | | | | | | | | | | | | | | | |
| | | | | |
Net investment incomeb | | | 0.45 | | | | 0.47 | | | | 0.45 | | | | 0.48 | | | | 0.53 | |
| | | | | |
Net realized and unrealized gains (losses) | | | 0.43 | | | | (0.65 | ) | | | 0.04 | | | | 0.37 | | | | (0.91 | ) |
| | | | | |
Total from investment operations | | | 0.88 | | | | (0.18 | ) | | | 0.49 | | | | 0.85 | | | | (0.38 | ) |
| | | | | |
Less distributions from: | | | | | | | | | | | | | | | | | | | | |
| | | | | |
Net investment income and net foreign currency gains | | | (0.60 | ) | | | (0.32 | ) | | | (0.35 | ) | | | (0.39 | ) | | | (0.77 | ) |
| | | | | |
Net realized gains | | | — | | | | — | | | | — | | | | — | | | | (0.20 | ) |
| | | | | |
Total distributions | | | (0.60 | ) | | | (0.32 | ) | | | (0.35 | ) | | | (0.39 | ) | | | (0.97 | ) |
| | | | | |
Net asset value, end of year | | | $10.93 | | | | $10.65 | | | | $11.15 | | | | $11.01 | | | | $10.55 | |
| | | | | |
Total returnc | | | 8.41% | | | | (1.65)% | | | | 4.46% | | | | 8.25% | | | | (3.62)% | |
| | | | | |
Ratios to average net assets | | | | | | | | | | | | | | | | | | | | |
| | | | | |
Expenses before waiver and payments by affiliates | | | 0.71% | | | | 0.67% | | | | 0.68% | | | | 0.67% | | | | 0.63% | |
| | | | | |
Expenses net of waiver and payments by affiliatesd | | | 0.68% | | | | 0.63% | | | | 0.63% | | | | 0.60% | | | | 0.62% | |
| | | | | |
Net investment income | | | 4.09% | | | | 4.28% | | | | 4.00% | | | | 4.42% | | | | 4.71% | |
| | | | | |
Supplemental data | | | | | | | | | | | | | | | | | | | | |
| | | | | |
Net assets, end of year (000’s) | | | $285,437 | | | | $302,610 | | | | $361,465 | | | | $396,170 | | | | $441,658 | |
| | | | | |
Portfolio turnover rate | | | 114.89% | e | | | 107.90% | f | | | 108.73% | | | | 128.51% | | | | 85.85% | |
| | | | | |
Portfolio turnover rate excluding mortgage dollar rollsg | | | 72.45% | e | | | 40.38% | f | | | 48.11% | | | | 77.93% | | | | 51.47% | |
aThe amount shown for a share outstanding throughout the period may not correlate with the Consolidated Statement of Operations for the period due to the timing of sales and repurchases of the Fund’s shares in relation to income earned and/or fluctuating fair value of the investments of the Fund.
bBased on average daily shares outstanding.
cTotal return does not include fees, charges or expenses imposed by the variable annuity and life insurance contracts for which Franklin Templeton Variable Insurance Products Trust serves as an underlying investment vehicle.
dBenefit of expense reduction rounds to less than 0.01%.
eExcludes the value of portfolio activity as a result of in-kind transactions. See Note 6.
fExcludes the value of portfolio securities delivered as a result of a redemption in-kind. See Note 11.
gSee Note 1(h) regarding mortgage dollar rolls.
| | | | |
| | |
FSI-6 | | Annual Report | The accompanying notes are an integral part of these consolidated financial statements. |
FRANKLIN TEMPLETON VARIABLE INSURANCE PRODUCTS TRUST
CONSOLIDATED FINANCIAL HIGHLIGHTS
Franklin Strategic Income VIP Fund(continued)
| | | | | | | | | | | | | | | | | | | | |
| | | | | | Year Ended December 31, | |
| | | 2019 | | | 2018 | | | 2017 | | | 2016 | | | 2015 | |
| | | | | |
Class 2 | | | | | | | | | | | | | | | | | | | | |
| | | | | |
Per share operating performance | | | | | | | | | | | | | | | | | | | | |
(for a share outstanding throughout the year) | | | | | | | | | | | | | | | | | | | | |
| | | | | |
Net asset value, beginning of year | | | $10.28 | | | | $10.76 | | | | $10.64 | | | | $10.21 | | | | $11.55 | |
| | | | | |
Income from investment operationsa: | | | | | | | | | | | | | | | | | | | | |
| | | | | |
Net investment incomeb | | | 0.40 | | | | 0.42 | | | | 0.40 | | | | 0.43 | | | | 0.49 | |
| | | | | |
Net realized and unrealized gains (losses) | | | 0.42 | | | | (0.61 | ) | | | 0.04 | | | | 0.36 | | | | (0.89 | ) |
| | | | | |
Total from investment operations | | | 0.82 | | | | (0.19 | ) | | | 0.44 | | | | 0.79 | | | | (0.40 | ) |
| | | | | |
Less distributions from: | | | | | | | | | | | | | | | | | | | | |
| | | | | |
Net investment income and net foreign currency gains | | | (0.55 | ) | | | (0.29 | ) | | | (0.32 | ) | | | (0.36 | ) | | | (0.74 | ) |
| | | | | |
Net realized gains | | | — | | | | — | | | | — | | | | — | | | | (0.20 | ) |
| | | | | |
Total distributions | | | (0.55 | ) | | | (0.29 | ) | | | (0.32 | ) | | | (0.36 | ) | | | (0.94 | ) |
| | | | | |
Net asset value, end of year | | | $10.55 | | | | $10.28 | | | | $10.76 | | | | $10.64 | | | | $10.21 | |
| | | | | |
Total returnc | | | 8.05% | | | | (1.77)% | | | | 4.17% | | | | 7.94% | | | | (3.87 | )% |
| | | | | |
Ratios to average net assets | | | | | | | | | | | | | | | | | | | | |
| | | | | |
Expenses before waiver and payments by affiliates | | | 0.96% | | | | 0.92% | | | | 0.93% | | | | 0.92% | | | | 0.88% | |
| | | | | |
Expenses net of waiver and payments by affiliatesd | | | 0.93% | | | | 0.88% | | | | 0.88% | | | | 0.85% | | | | 0.87% | |
| | | | | |
Net investment income | | | 3.84% | | | | 4.03% | | | | 3.75% | | | | 4.17% | | | | 4.46% | |
| | | | | |
Supplemental data | | | | | | | | | | | | | | | | | | | | |
| | | | | |
Net assets, end of year (000’s) | | | $94,928 | | | | $89,264 | | | | $214,271 | | | | $203,418 | | | | $202,192 | |
| | | | | |
Portfolio turnover rate | | | 114.89% | e | | | 107.90% | f | | | 108.73% | | | | 128.51% | | | | 85.85% | |
| | | | | |
Portfolio turnover rate excluding mortgage dollar rollsg | | | 72.45% | e | | | 40.38% | f | | | 48.11% | | | | 77.93% | | | | 51.47% | |
aThe amount shown for a share outstanding throughout the period may not correlate with the Consolidated Statement of Operations for the period due to the timing of sales and repurchases of the Fund’s shares in relation to income earned and/or fluctuating fair value of the investments of the Fund.
bBased on average daily shares outstanding.
cTotal return does not include fees, charges or expenses imposed by the variable annuity and life insurance contracts for which Franklin Templeton Variable Insurance Products Trust serves as an underlying investment vehicle.
dBenefit of expense reduction rounds to less than 0.01%.
eExcludes the value of portfolio activity as a result of in-kind transactions. See Note 6.
fExcludes the value of portfolio securities delivered as a result of a redemption in-kind. See Note 11.
gSee Note 1(h) regarding mortgage dollar rolls.
| | | | |
| | | |
| | The accompanying notes are an integral part of these consolidated financial statements. | Annual Report | | FSI-7 |
FRANKLIN TEMPLETON VARIABLE INSURANCE PRODUCTS TRUST
CONSOLIDATED FINANCIAL HIGHLIGHTS
Franklin Strategic Income VIP Fund(continued)
| | | | | | | | | | | | | | | | | | | | |
| | | Year Ended December 31, | |
| | | | |
| | | 2019 | | | 2018 | | | 2017 | | | 2016 | | | 2015 | |
| |
| | | |
Class 4 | | | | | | | | | | | | |
| | | | | |
Per share operating performance | | | | | | | | | | | | | | | | | | | | |
| | | |
(for a share outstanding throughout the year) | | | | | | | | | | | | |
Net asset value, beginning of year | | | $10.56 | | | | $11.04 | | | | $10.90 | | | | $10.44 | | | | $11.78 | |
| | | | |
| | | |
Income from investment operationsa: | | | | | | | | | | | | |
| | | | | |
Net investment incomeb | | | 0.41 | | | | 0.43 | | | | 0.40 | | | | 0.43 | | | | 0.49 | |
| | | | | |
Net realized and unrealized gains (losses) | | | 0.42 | | | | (0.64 | ) | | | 0.04 | | | | 0.38 | | | | (0.91 | ) |
| | | | |
| | | | | |
Total from investment operations | | | 0.83 | | | | (0.21 | ) | | | 0.44 | | | | 0.81 | | | | (0.42 | ) |
| | | | |
| | | | | |
Less distributions from: | | | | | | | | | | | | | | | | | | | | |
| | | | | |
Net investment income and net foreign currency gains | | | (0.56 | ) | | | (0.27 | ) | | | (0.30 | ) | | | (0.35 | ) | | | (0.72 | ) |
| | | | | |
Net realized gains | | | — | | | | — | | | | — | | | | — | | | | (0.20 | ) |
| | | | |
| | | | | |
Total distributions | | | (0.56 | ) | | | (0.27 | ) | | | (0.30 | ) | | | (0.35 | ) | | | (0.92 | ) |
| | | | |
| | | | | |
Net asset value, end of year | | | $10.83 | | | | $10.56 | | | | $11.04 | | | | $10.90 | | | | $10.44 | |
| | | | |
| | | | | |
Total returnc | | | 7.93% | | | | (1.88)% | | | | 4.08% | | | | 7.86% | | | | (3.98)% | |
| | | |
Ratios to average net assets | | | | | | | | | | | | |
| | | | | |
Expenses before waiver and payments by affiliates | | | 1.06% | | | | 1.02% | | | | 1.03% | | | | 1.02% | | | | 0.98% | |
| | | | | |
Expenses net of waiver and payments by affiliatesd | | | 1.03% | | | | 0.98% | | | | 0.98% | | | | 0.95% | | | | 0.97% | |
| | | | | |
Net investment income | | | 3.74% | | | | 3.93% | | | | 3.65% | | | | 4.07% | | | | 4.36% | |
| | | |
Supplemental data | | | | | | | | | | | | |
| | | | | |
Net assets, end of year (000’s) | | | $54,485 | | | | $60,763 | | | | $74,013 | | | | $80,175 | | | | $92,965 | |
| | | | | |
Portfolio turnover rate | | | 114.89% | e | | | 107.90% | f | | | 108.73% | | | | 128.51% | | | | 85.85% | |
| | | | | |
Portfolio turnover rate excluding mortgage dollar rollsg | | | 72.45% | e | | | 40.38% | f | | | 48.11% | | | | 77.93% | | | | 51.47% | |
aThe amount shown for a share outstanding throughout the period may not correlate with the Consolidated Statement of Operations for the period due to the timing of sales and repurchases of the Fund’s shares in relation to income earned and/or fluctuating fair value of the investments of the Fund.
bBased on average daily shares outstanding.
cTotal return does not include fees, charges or expenses imposed by the variable annuity and life insurance contracts for which Franklin Templeton Variable Insurance Products Trust serves as an underlying investment vehicle.
dBenefit of expense reduction rounds to less than 0.01%.
eExcludes the value of portfolio activity as a result of in-kind transactions. See Note 6.
fExcludes the value of portfolio securities delivered as a result of a redemption in-kind. See Note 11.
gSee Note 1(h) regarding mortgage dollar rolls.
| | | | |
| | | |
FSI-8 | | Annual Report | The accompanying notes are an integral part of these consolidated financial statements. | | |
FRANKLIN TEMPLETON VARIABLE INSURANCE PRODUCTS TRUST
Consolidated Statement of Investments, December 31, 2019
Franklin Strategic Income VIP Fund
| | | | | | | | | | | | |
| | | Country/
Organization | | | Shares/
Warrants | | | Value | |
| | | |
Common Stocks and Other Equity Interests 0.3% | | | | | | | | | | | | |
Commercial & Professional Services 0.0%† | | | | | | | | | | | | |
a,b Remington Outdoor Co. Inc. | | | United States | | | | 74,576 | | | $ | 46,610 | |
| | | | | | | | | | | | |
Consumer Services 0.0%† | | | | | | | | | | | | |
a,b,c Turtle Bay Resort | | | United States | | | | 1,901,449 | | | | 41,832 | |
| | | | | | | | | | | | |
Energy 0.2% | | | | | | | | | | | | |
Amplify Energy Corp. | | | United States | | | | 431 | | | | 2,849 | |
a,b Amplify Energy Corp., wts., 4/21/20 | | | United States | | | | 4,121 | | | | — | |
aBirch Permian Holdings Inc. | | | United States | | | | 4,478 | | | | 44,780 | |
aBirch Permian Holdings Inc. | | | United States | | | | 34,907 | | | | 344,707 | |
aHalcon Resources Corp. | | | United States | | | | 183 | | | | 2,461 | |
a,b Halcon Resources Corp., wts., 9/09/20 | | | United States | | | | 6,591 | | | | — | |
a,b Halcon Resources Corp., wts., A, 10/08/22 | | | United States | | | | 879 | | | | 805 | |
a,b Halcon Resources Corp., wts., B, 10/08/22 | | | United States | | | | 1,098 | | | | 706 | |
a,b Halcon Resources Corp., wts., C, 10/08/22 | | | United States | | | | 1,412 | | | | 562 | |
Riviera Resources Inc. | | | United States | | | | 6,620 | | | | 52,827 | |
aWeatherford International PLC | | | United States | | | | 13,794 | | | | 385,542 | |
| | | | | | | | | | | | |
| | | |
| | | | | | | | | | | 835,239 | |
| | | | | | | | | | | | |
Materials 0.1% | | | | | | | | | | | | |
a,b,d Appvion Operations Inc. | | | United States | | | | 18,684 | | | | 254,512 | |
aVerso Corp., A | | | United States | | | | 5,620 | | | | 101,329 | |
aVerso Corp., wts., 7/25/23 | | | United States | | | | 592 | | | | 2,072 | |
| | | | | | | | | | | | |
| | | |
| | | | | | | | | | | 357,913 | |
| | | | | | | | | | | | |
Media & Entertainment 0.0%† | | | | | | | | | | | | |
aClear Channel Outdoor Holdings Inc. | | | United States | | | | 20,804 | | | | 59,499 | |
aiHeartMedia Inc., A | | | United States | | | | 8,384 | | | | 141,690 | |
a,b iHeartMedia Inc., B | | | United States | | | | 142 | | | | 2,040 | |
| | | | | | | | | | | | |
| | | |
| | | | | | | | | | | 203,229 | |
| | | | | | | | | | | | |
Retailing 0.0%† | | | | | | | | | | | | |
a,b,d K2016470219 South Africa Ltd., A | | | South Africa | | | | 14,792,309 | | | | 10,563 | |
a,b,d K2016470219 South Africa Ltd., B | | | South Africa | | | | 1,472,041 | | | | 1,051 | |
| | | | | | | | | | | | |
| | | |
| | | | | | | | | | | 11,614 | |
| | | | | | | | | | | | |
| | | |
Total Common Stocks and Other Equity Interests
(Cost $6,847,916) | | | | | | | | | | | 1,496,437 | |
| | | | | | | | | | | | |
| | | |
Management Investment Companies
(Cost $11,072,145) 2.1% | | | | | | | | | | | | |
Diversified Financials 2.1% | | | | | | | | | | | | |
e Franklin Floating Rate Income Fund | | | United States | | | | 1,118,951 | | | | 9,264,918 | |
| | | | | | | | | | | | |
FRANKLIN TEMPLETON VARIABLE INSURANCE PRODUCTS TRUST
CONSOLIDATED STATEMENT OF INVESTMENTS
Franklin Strategic Income VIP Fund(continued)
| | | | | | | | | | | | | | |
| | | Country/
Organization | | | Principal
Amount* | | | | | Value | |
| | | | |
Corporate Bonds 29.6% | | | | | | | | | | | | | | |
Banks 2.9% | | | | | | | | | | | | | | |
fAkbank T.A.S., senior note, 144A, 5.125%, 3/31/25 | | | Turkey | | | | 1,200,000 | | | | | $ | 1,177,111 | |
Bank of America Corp., | | | | | | | | | | | | | | |
senior bond, 3.248%, 10/21/27 | | | United States | | | | 647,000 | | | | | | 674,251 | |
senior note, 3.50%, 4/19/26 | | | United States | | | | 2,480,000 | | | | | | 2,637,037 | |
gBDO Unibank Inc., senior note, Reg S, 2.95%, 3/06/23 | | | Philippines | | | | 200,000 | | | | | | 202,152 | |
Citigroup Inc., | | | | | | | | | | | | | | |
senior note, 3.30%, 4/27/25 | | | United States | | | | 243,000 | | | | | | 255,020 | |
senior note, 3.40%, 5/01/26 | | | United States | | | | 1,106,000 | | | | | | 1,161,639 | |
Industrial & Commercial Bank of China Ltd., senior note, 3.538%, 11/08/27 | | | China | | | | 900,000 | | | | | | 932,103 | |
JPMorgan Chase & Co., | | | | | | | | | | | | | | |
hjunior sub. bond, R, 6.00% to 8/01/23, FRN thereafter, Perpetual | | | United States | | | | 213,000 | | | | | | 228,861 | |
senior bond, 3.20%, 6/15/26 | | | United States | | | | 1,213,000 | | | | | | 1,267,065 | |
sub. note, 3.375%, 5/01/23 | | | United States | | | | 809,000 | | | | | | 840,755 | |
sub. note, 3.875%, 9/10/24 | | | United States | | | | 809,000 | | | | | | 865,990 | |
gTurkiye Vakiflar Bankasi TAO, secured note, Reg S, 2.375%, 11/04/22 | | | Turkey | | | | 500,000 | | | EUR | | | 566,797 | |
Wells Fargo & Co., senior note, 3.00%, 4/22/26 | | | United States | | | | 2,021,000 | | | | | | 2,077,696 | |
| | | | | | | | | | | | | | |
| | | | |
| | | | | | | | | | | | | 12,886,477 | |
| | | | | | | | | | | | | | |
Capital Goods 0.8% | | | | | | | | | | | | | | |
fBeacon Roofing Supply Inc., senior note, 144A, 4.875%, 11/01/25 | | | United States | | | | 1,094,000 | | | | | | 1,101,751 | |
CNH Industrial NV, senior bond, 3.85%, 11/15/27 | | | United Kingdom | | | | 566,000 | | | | | | 590,629 | |
fHerc Holdings Inc., senior note, 144A, 5.50%, 7/15/27 | | | United States | | | | 500,000 | | | | | | 527,513 | |
i Onsite Rental Group Operations Pty. Ltd., secured note, PIK, 6.10%, 10/26/23 | | | Australia | | | | 262,519 | | | | | | 240,861 | |
fVertiv Group Corp., senior note, 144A, 9.25%, 10/15/24 | | | United States | | | | 994,000 | | | | | | 1,070,623 | |
| | | | | | | | | | | | | | |
| | | | |
| | | | | | | | | | | | | 3,531,377 | |
| | | | | | | | | | | | | | |
Commercial & Professional Services 0.6% | | | | | | | | | | | | | | |
fIntrado Corp., senior note, 144A, 8.50%, 10/15/25 | | | United States | | | | 1,521,000 | | | | | | 1,220,603 | |
United Rentals North America Inc., senior bond, 5.875%, 9/15/26 | | | United States | | | | 1,194,000 | | | | | | 1,283,878 | |
| | | | | | | | | | | | | | |
| | | | |
| | | | | | | | | | | | | 2,504,481 | |
| | | | | | | | | | | | | | |
Consumer Durables & Apparel 0.8% | | | | | | | | | | | | | | |
fHanesbrands Inc., senior bond, 144A, 4.875%, 5/15/26 | | | United States | | | | 1,482,000 | | | | | | 1,571,809 | |
KB Home, senior note, 7.00%, 12/15/21 | | | United States | | | | 970,000 | | | | | | 1,043,138 | |
Toll Brothers Finance Corp., senior bond, 5.625%, 1/15/24 | | | United States | | | | 889,000 | | | | | | 977,158 | |
| | | | | | | | | | | | | | |
| | | | |
| | | | | | | | | | | | | 3,592,105 | |
| | | | | | | | | | | | | | |
Consumer Services 1.3% | | | | | | | | | | | | | | |
f1011778 BC ULC/New Red Finance Inc., | | | | | | | | | | | | | | |
secured note, second lien, 144A, 5.00%, 10/15/25 | | | Canada | | | | 970,000 | | | | | | 1,003,547 | |
senior secured note, first lien, 144A, 4.25%, 5/15/24 | | | Canada | | | | 428,000 | | | | | | 439,592 | |
fGolden Nugget Inc., senior note, 144A, 6.75%, 10/15/24 | | | United States | | | | 1,132,000 | | | | | | 1,174,439 | |
f KFC Holding Co./Pizza Hut Holdings LLC/Taco Bell of America LLC, | | | | | | | | | | | | | | |
senior note, 144A, 5.00%, 6/01/24 | | | United States | | | | 728,000 | | | | | | 755,908 | |
senior note, 144A, 5.25%, 6/01/26 | | | United States | | | | 851,000 | | | | | | 899,954 | |
FRANKLIN TEMPLETON VARIABLE INSURANCE PRODUCTS TRUST
CONSOLIDATED STATEMENT OF INVESTMENTS
Franklin Strategic Income VIP Fund(continued)
| | | | | | | | | | |
| | | Country/
Organization | | Principal
Amount* | | | | Value | |
| | | | |
Corporate Bonds(continued) | | | | | | | | | | |
Consumer Services(continued) | | | | | | | | | | |
fWynn Las Vegas LLC/Wynn Las Vegas Capital Corp., | | | | | | | | | | |
senior bond, 144A, 5.50%, 3/01/25 | | United States | | 970,000 | | | | $ | 1,041,528 | |
senior bond, 144A, 5.25%, 5/15/27 | | United States | | 200,000 | | | | | 212,750 | |
| | | | | | | | | | |
| | | | |
| | | | | | | | | 5,527,718 | |
Diversified Financials 2.2% | | | | | | | | | | |
Capital One Financial Corp., senior note, 3.20%, 2/05/25 | | United States | | 1,617,000 | | | | | 1,674,631 | |
The Goldman Sachs Group Inc., | | | | | | | | | | |
senior note, 3.50%, 1/23/25 | | United States | | 1,725,000 | | | | | 1,809,665 | |
senior note, 3.75%, 2/25/26 | | United States | | 1,213,000 | | | | | 1,283,720 | |
Morgan Stanley, | | | | | | | | | | |
senior bond, 3.591% to 7/22/27, FRN thereafter, 7/22/28 | | United States | | 809,000 | | | | | 859,860 | |
senior note, 3.875%, 1/27/26 | | United States | | 2,395,000 | | | | | 2,572,220 | |
Springleaf Finance Corp., senior note, 6.625%, 1/15/28 | | United States | | 1,000,000 | | | | | 1,130,650 | |
gTNB Global Ventures Capital Bhd., senior note, Reg S, 3.244%, 10/19/26 | | Malaysia | | 400,000 | | | | | 402,432 | |
| | | | | | | | | | |
| | | | |
| | | | | | | | | 9,733,178 | |
Energy 2.8% | | | | | | | | | | |
fAker BP ASA, senior note, 144A, 4.75%, 6/15/24 | | Norway | | 600,000 | | | | | 623,994 | |
fCalifornia Resources Corp., secured note, second lien, 144A, 8.00%, 12/15/22 | | United States | | 579,000 | | | | | 257,655 | |
Cheniere Energy Partners LP, senior secured note, first lien, 5.25%, 10/01/25 | | United States | | 970,000 | | | | | 1,013,243 | |
CONSOL Energy Inc., senior note, 5.875%, 4/15/22 | | United States | | 1,317,000 | | | | | 1,321,214 | |
Ecopetrol SA, senior bond, 4.125%, 1/16/25 | | Colombia | | 800,000 | | | | | 842,340 | |
Energy Transfer Operating LP, | | | | | | | | | | |
senior bond, 4.05%, 3/15/25 | | United States | | 200,000 | | | | | 210,206 | |
senior note, 7.50%, 10/15/20 | | United States | | 1,536,000 | | | | | 1,596,488 | |
f,i EnQuest PLC, senior note, 144A, PIK, 7.00%, 4/15/22 | | United Kingdom | | 820,556 | | | | | 710,802 | |
Enterprise Products Operating LLC, senior bond, 4.80%, 2/01/49 | | United States | | 150,000 | | | | | 175,927 | |
f,j Gazprom PJSC Via Gaz Capital SA, senior note, 144A, (OJSC Gazprom), loan participation, 3.85%, 2/06/20 | | Russia | | 1,213,000 | | | | | 1,214,899 | |
Martin Midstream Partners LP/Martin Midstream Finance Corp.,
senior note, 7.25%, 2/15/21 | | United States | �� | 1,617,000 | | | | | 1,476,159 | |
Oceaneering International Inc., senior note, 4.65%, 11/15/24 | | United States | | 200,000 | | | | | 196,500 | |
kSanchez Energy Corp., senior note, 6.125%, 1/15/23 | | United States | | 243,000 | | | | | 12,150 | |
fSchlumberger Holdings Corp, senior note, 144A, 3.90%, 5/17/28 | | United States | | 400,000 | | | | | 425,984 | |
Sunoco LP/Sunoco Finance Corp., senior note, 4.875%, 1/15/23 | | United States | | 485,000 | | | | | 497,336 | |
fWeatherford International Ltd., senior note, 144A, 11.00%, 12/01/24 | | United States | | 417,000 | | | | | 451,924 | |
fWoodside Finance Ltd., | | | | | | | | | | |
senior bond, 144A, 3.70%, 3/15/28 | | Australia | | 647,000 | | | | | 669,952 | |
senior note, 144A, 3.70%, 9/15/26 | | Australia | | 405,000 | | | | | 421,719 | |
| | | | | | | | | | |
| | | | |
| | | | | | | | | 12,118,492 | |
FRANKLIN TEMPLETON VARIABLE INSURANCE PRODUCTS TRUST
CONSOLIDATED STATEMENT OF INVESTMENTS
Franklin Strategic Income VIP Fund(continued)
| | | | | | | | | | |
| | | Country/
Organization | | Principal Amount* | | | | Value | |
| | | | |
Corporate Bonds(continued) | | | | | | | | | | |
| | | | |
Food & Staples Retailing 0.7% | | | | | | | | | | |
fCencosud SA, senior note, 144A, 4.375%, 7/17/27 | | Chile | | 800,000 | | | | $ | 790,154 | |
The Kroger Co., senior bond, 4.45%, 2/01/47 | | United States | | 150,000 | | | | | 159,385 | |
Walgreens Boots Alliance Inc., senior note, 3.80%, 11/18/24 | | United States | | 2,087,000 | | | | | 2,170,784 | |
| | | | | | | | | | |
| | | | | | | | | 3,120,323 | |
| | | | | | | | | | |
| | | | |
Food, Beverage & Tobacco 0.1% | | | | | | | | | | |
BAT Capital Corp., senior bond, 4.54%, 8/15/47 | | United Kingdom | | 50,000 | | | | | 50,229 | |
Bunge Ltd. Finance Corp., senior note, 3.25%, 8/15/26 | | United States | | 200,000 | | | | | 200,006 | |
Reynolds American Inc., senior note, 4.45%, 6/12/25 | | United Kingdom | | 200,000 | | | | | 215,324 | |
| | | | | | | | | | |
| | | | | | | | | 465,559 | |
| | | | | | | | | | |
Health Care Equipment & Services 1.5% | | | | | | | | | | |
Anthem Inc., senior bond, 3.70%, 9/15/49 | | United States | | 150,000 | | | | | 149,935 | |
Centene Corp., | | | | | | | | | | |
fsenior bond, 144A, 4.625%, 12/15/29 | | United States | | 200,000 | | | | | 211,140 | |
senior note, 4.75%, 5/15/22 | | United States | | 750,000 | | | | | 766,335 | |
fsenior note, 144A, 5.375%, 6/01/26 | | United States | | 324,000 | | | | | 344,444 | |
fsenior note, 144A, 4.25%, 12/15/27 | | United States | | 300,000 | | | | | 309,180 | |
CHS/Community Health Systems Inc., | | | | | | | | | | |
senior note, 6.875%, 2/01/22 | | United States | | 183,000 | | | | | 148,688 | |
senior secured note, first lien, 6.25%, 3/31/23 | | United States | | 405,000 | | | | | 412,088 | |
Cigna Corp., senior bond, 4.90%, 12/15/48 | | United States | | 150,000 | | | | | 179,357 | |
DaVita Inc., | | | | | | | | | | |
senior bond, 5.125%, 7/15/24 | | United States | | 305,000 | | | | | 313,261 | |
senior bond, 5.00%, 5/01/25 | | United States | | 728,000 | | | | | 750,448 | |
HCA Inc., senior note, 5.375%, 9/01/26 | | United States | | 713,000 | | | | | 795,904 | |
fMEDNAX Inc., senior note, 144A, 6.25%, 1/15/27 | | United States | | 1,100,000 | | | | | 1,130,277 | |
f,i Polaris Intermediate Corp., senior note, 144A, PIK, 8.50%, 12/01/22 | | United States | | 500,000 | | | | | 466,872 | |
Stryker Corp., senior bond, 3.50%, 3/15/26 | | United States | | 405,000 | | | | | 430,960 | |
| | | | | | | | | | |
| | | | | | | | | 6,408,889 | |
| | | | | | | | | | |
| | | | |
Materials 4.5% | | | | | | | | | | |
fAlpek SAB de CV, senior note, 144A, 4.25%, 9/18/29 | | Mexico | | 800,000 | | | | | 817,400 | |
fArdagh Packaging Finance PLC/Ardagh MP Holdings USA Inc., senior note, 144A, 6.00%, 2/15/25 | | Luxembourg | | 900,000 | | | | | 946,125 | |
fBraskem Netherlands Finance BV, senior bond, 144A, 4.50%, 1/31/30 | | Brazil | | 500,000 | | | | | 496,950 | |
fCemex Finance LLC, senior secured note, first lien, 144A, 6.00%, 4/01/24 | | Mexico | | 299,000 | | | | | 308,119 | |
fCemex SAB de CV, senior secured bond, first lien, 144A, 5.70%, 1/11/25 | | Mexico | | 1,013,000 | | | | | 1,043,390 | |
gCNAC HK Finbridge Co. Ltd., senior note, Reg S, 4.875%, 3/14/25 | | China | | 800,000 | | | | | 869,436 | |
Crown Americas LLC/Crown Americas Capital Corp. VI, senior note, 4.75%, 2/01/26 | | United States | | 566,000 | | | | | 599,449 | |
fFirst Quantum Minerals Ltd., senior note, 144A, 7.25%, 4/01/23 | | Zambia | | 1,294,000 | | | | | 1,342,350 | |
fFMG Resources (August 2006) Pty. Ltd., | | | | | | | | | | |
senior note, 144A, 5.125%, 3/15/23 | | Australia | | 324,000 | | | | | 343,032 | |
senior note, 144A, 5.125%, 5/15/24 | | Australia | | 647,000 | | | | | 692,271 | |
FRANKLIN TEMPLETON VARIABLE INSURANCE PRODUCTS TRUST
CONSOLIDATED STATEMENT OF INVESTMENTS
Franklin Strategic Income VIP Fund(continued)
| | | | | | | | | | |
| | | Country/
Organization | | Principal
Amount* | | | | Value | |
| | | | |
Corporate Bonds(continued) | | | | | | | | | | |
Materials(continued) | | | | | | | | | | |
Freeport-McMoRan Inc., senior note, 4.55%, 11/14/24 | | United States | | 1,017,000 | | | | $ | 1,077,171 | |
f Glencore Funding LLC, | | | | | | | | | | |
senior note, 144A, 4.125%, 5/30/23 | | Switzerland | | 485,000 | | | | | 505,726 | |
senior note, 144A, 4.625%, 4/29/24 | | Switzerland | | 250,000 | | | | | 265,725 | |
LYB International Finance BV, senior note, 4.00%, 7/15/23 | | United States | | 1,698,000 | | | | | 1,795,998 | |
fMauser Packaging Solutions Holding Co., senior note, 144A, 7.25%, 4/15/25 | | United States | | 1,278,000 | | | | | 1,265,207 | |
f New Gold Inc., senior note, 144A, 6.375%, 5/15/25 | | Canada | | 566,000 | | | | | 525,092 | |
fNovelis Corp., senior bond, 144A, 5.875%, 9/30/26 | | United States | | 1,059,000 | | | | | 1,129,347 | |
f Owens-Brockway Glass Container Inc., | | | | | | | | | | |
senior note, 144A, 5.00%, 1/15/22 | | United States | | 732,000 | | | | | 761,112 | |
senior note, 144A, 5.875%, 8/15/23 | | United States | | 566,000 | | | | | 605,385 | |
Reynolds Group Issuer Inc./Reynolds Group Issuer LLC/Reynolds Group Issuer Luxembourg SA, | | | | | | | | | | |
fsenior note, 144A, 7.00%, 7/15/24 | | United States | | 105,000 | | | | | 108,741 | |
senior secured note, first lien, 5.75%, 10/15/20 | | United States | | 548,375 | | | | | 549,746 | |
fsenior secured note, first lien, 144A, 5.125%, 7/15/23 | | United States | | 566,000 | | | | | 580,623 | |
fSABIC Capital II BV, senior note, 144A, 4.50%, 10/10/28 | | Saudi Arabia | | 600,000 | | | | | 670,184 | |
f Sealed Air Corp., | | | | | | | | | | |
senior bond, 144A, 5.125%, 12/01/24 | | United States | | 809,000 | | | | | 873,720 | |
senior bond, 144A, 5.50%, 9/15/25 | | United States | | 124,000 | | | �� | | 136,761 | |
senior note, 144A, 4.875%, 12/01/22 | | United States | | 85,000 | | | | | 90,233 | |
fSunCoke Energy Partners LP/SunCoke Energy Partners Finance Corp., senior note, 144A, 7.50%, 6/15/25 | | United States | | 1,100,000 | | | | | 1,060,576 | |
| | | | | | | | | | |
| | | | |
| | | | | | | | | 19,459,869 | |
| | | | | | | | | | |
Media & Entertainment 2.4% | | | | | | | | | | |
fAltice Financing SA, secured bond, 144A, 7.50%, 5/15/26 | | Luxembourg | | 200,000 | | | | | 215,370 | |
CCO Holdings LLC/CCO Holdings Capital Corp., | | | | | | | | | | |
senior bond, 5.25%, 9/30/22 | | United States | | 689,000 | | | | | 697,978 | |
fsenior bond, 144A, 5.375%, 5/01/25 | | United States | | 728,000 | | | | | 753,178 | |
f Clear Channel Worldwide Holdings Inc., | | | | | | | | | | |
senior secured note, first lien, 144A, 5.125%, 8/15/27 | | United States | | 600,000 | | | | | 625,890 | |
senior sub. note, 144A, 9.25%, 2/15/24 | | United States | | 256,000 | | | | | 284,054 | |
fCSC Holdings LLC, senior secured note, first lien, 144A, 5.50%, 5/15/26 | | United States | | 1,378,000 | | | | | 1,462,144 | |
f Diamond Sports Group LLC/Diamond Sports Finance Co., | | | | | | | | | | |
first lien, 144A, 5.375%, 8/15/26 | | United States | | 400,000 | | | | | 405,370 | |
senior note, 144A, 6.625%, 8/15/27 | | United States | | 300,000 | | | | | 292,305 | |
DISH DBS Corp., | | | | | | | | | | |
senior bond, 6.75%, 6/01/21 | | United States | | 405,000 | | | | | 426,518 | |
senior note, 5.875%, 11/15/24 | | United States | | 670,000 | | | | | 686,053 | |
iHeartCommunications Inc., | | | | | | | | | | |
secured note, 6.375%, 5/01/26 | | United States | | 48,209 | | | | | 52,397 | |
senior note, 8.375%, 5/01/27 | | United States | | 87,378 | | | | | 96,714 | |
FRANKLIN TEMPLETON VARIABLE INSURANCE PRODUCTS TRUST
CONSOLIDATED STATEMENT OF INVESTMENTS
Franklin Strategic Income VIP Fund(continued)
| | | | | | | | | | |
| | | Country/
Organization | | Principal
Amount* | | | | Value | |
| | | | |
Corporate Bonds(continued) | | | | | | | | | | |
Media & Entertainment(continued) | | | | | | | | | | |
fLive Nation Entertainment Inc., senior note, 144A, 4.75%, 10/15/27 | | United States | | 400,000 | | | | $ | 414,740 | |
Netflix Inc., senior bond, 5.875%, 2/15/25 | | United States | | 1,000,000 | | | | | 1,117,085 | |
fNexstar Broadcasting Inc., senior note, 144A, 5.625%, 8/01/24 | | United States | | 1,417,000 | | | | | 1,480,177 | |
fUnivision Communications Inc., senior secured note, first lien, 144A, 5.125%, 2/15/25 | | United States | | 1,321,000 | | | | | 1,309,441 | |
| | | | | | | | | | |
| | | | |
| | | | | | | | | 10,319,414 | |
| | | | | | | | | | |
Pharmaceuticals, Biotechnology & Life Sciences 1.7% | | | | | | | | | | |
fAbbVie Inc., senior note, 144A, 2.95%, 11/21/26 | | United States | | 600,000 | | | | | 609,897 | |
Allergan Funding SCS, senior bond, 3.80%, 3/15/25 | | United States | | 1,778,000 | | | | | 1,864,814 | |
f Bausch Health Cos. Inc., | | | | | | | | | | |
senior bond, 144A, 6.125%, 4/15/25 | | United States | | 243,000 | | | | | 251,581 | |
senior note, 144A, 8.50%, 1/31/27 | | United States | | 809,000 | | | | | 922,786 | |
senior note, first lien, 144A, 7.00%, 3/15/24 | | United States | | 200,000 | | | | | 208,417 | |
fBayer U.S. Finance II LLC, senior bond, 144A, 4.375%, 12/15/28 | | Germany | | 889,000 | | | | | 969,975 | |
f,i Eagle Holdings Co. II LLC, senior note, 144A, PIK, 7.625%, 5/15/22 | | United States | | 566,000 | | | | | 576,320 | |
fEndo DAC/Endo Finance LLC/Endo Finco Inc., | | | | | | | | | | |
senior bond, 144A, 6.00%, 2/01/25 | | United States | | 970,000 | | | | | 656,874 | |
senior note, 144A, 6.00%, 7/15/23 | | United States | | 328,000 | | | | | 237,797 | |
fJaguar Holding Co. II/Pharmaceutical Product Development LLC, senior note, 144A, 6.375%, 8/01/23 | | United States | | 970,000 | | | | | 1,003,637 | |
| | | | | | | | | | |
| | | | |
| | | | | | | | | 7,302,098 | |
| | | | | | | | | | |
Real Estate 0.5% | | | | | | | | | | |
gChina Overseas Finance Cayman VI Ltd., senior note, Reg S, 5.95%, 5/08/24 | | China | | 700,000 | | | | | 787,617 | |
Equinix Inc., senior bond, 5.875%, 1/15/26 | | United States | | 100,000 | | | | | 106,311 | |
MPT Operating Partnership LP/MPT Finance Corp., | | | | | | | | | | |
senior bond, 5.25%, 8/01/26 | | United States | | 247,000 | | | | | 261,514 | |
senior bond, 5.00%, 10/15/27 | | United States | | 889,000 | | | | | 944,585 | |
| | | | | | | | | | |
| | | | |
| | | | | | | | | 2,100,027 | |
| | | | | | | | | | |
Retailing 0.2% | | | | | | | | | | |
b,f,i K2016470219 South Africa Ltd., senior secured note, 144A, PIK, 3.00%, 12/31/22 | | South Africa | | 962,008 | | | | | 1,202 | |
b,f,i K2016470260 South Africa Ltd., senior secured note, 144A, PIK, 25.00%, 12/31/22 | | South Africa | | 313,364 | | | | | 1,567 | |
fParty City Holdings Inc., senior note, 144A, 6.625%, 8/01/26 | | United States | | 1,085,000 | | | | | 767,445 | |
| | | | | | | | | | |
| | | | |
| | | | | | | | | 770,214 | |
| | | | | | | | | | |
Semiconductors & Semiconductor Equipment 0.0%† | | | | | | | | | | |
Maxim Integrated Products Inc., senior note, 3.375%, 3/15/23 | | United States | | 100,000 | | | | | 102,291 | |
| | | | | | | | | | |
| | | | |
Software & Services 0.2% | | | | | | | | | | |
fNorton Lifelock Inc., senior note, 144A, 5.00%, 4/15/25 | | United States | | 978,000 | | | | | 999,342 | |
| | | | | | | | | | |
| | | | |
Technology Hardware & Equipment 0.3% | | | | | | | | | | |
fBlackboard Inc., secured note, second lien, 144A, 10.375%, 11/15/24 | | United States | | 200,000 | | | | | 200,500 | |
fCommScope Technologies LLC, senior bond, 144A, 5.00%, 3/15/27 | | United States | | 1,374,000 | | | | | 1,295,029 | |
| | | | | | | | | | |
| | | | |
| | | | | | | | | 1,495,529 | |
| | | | | | | | | | |
FRANKLIN TEMPLETON VARIABLE INSURANCE PRODUCTS TRUST
CONSOLIDATED STATEMENT OF INVESTMENTS
Franklin Strategic Income VIP Fund(continued)
| | | | | | | | | | |
| | | Country/ Organization | | Principal Amount* | | | | Value | |
| | | | |
Corporate Bonds(continued) | | | | | | | | | | |
Telecommunication Services 1.1% | | | | | | | | | | |
Bell Canada Inc., senior bond, 4.464%, 4/01/48 | | Canada | | 150,000 | | | | $ | 173,693 | |
fDigicel Group Two Ltd., senior note, 144A, 8.25%, 9/30/22 | | Bermuda | | 486,000 | | | | | 118,229 | |
fDigicel Ltd., senior note, 144A, 6.00%, 4/15/21 | | Bermuda | | 1,000,000 | | | | | 780,000 | |
Sprint Communications Inc., | | | | | | | | | | |
senior note, 6.00%, 11/15/22 | | United States | | 405,000 | | | | | 425,465 | |
fsenior note, 144A, 7.00%, 3/01/20 | | United States | | 647,000 | | | | | 651,212 | |
Sprint Corp., senior bond, 7.875%, 9/15/23 | | United States | | 405,000 | | | | | 447,693 | |
Telefonica Emisiones SA, senior bond, 4.895%, 3/06/48 | | Spain | | 150,000 | | | | | 171,729 | |
TELUS Corp., senior bond, 4.60%, 11/16/48 | | Canada | | 150,000 | | | | | 177,001 | |
T-Mobile USA Inc., | | | | | | | | | | |
senior bond, 6.50%, 1/15/24 | | United States | | 405,000 | | | | | 417,660 | |
senior bond, 6.375%, 3/01/25 | | United States | | 1,051,000 | | | | | 1,088,221 | |
senior note, 6.00%, 4/15/24 | | United States | | 200,000 | | | | | 206,998 | |
| | | | | | | | | | |
| | | | |
| | | | | | | | | 4,657,901 | |
| | | | | | | | | | |
Transportation 1.6% | | | | | | | | | | |
CSX Corp., senior bond, 4.10%, 3/15/44 | | United States | | 150,000 | | | | | 163,739 | |
fDAE Funding LLC, senior note, 144A, 5.00%, 8/01/24 | | United Arab Emirates | | 1,294,000 | | | | | 1,361,845 | |
FedEx Corp., senior bond, 4.05%, 2/15/48 | | United States | | 150,000 | | | | | 144,735 | |
fKazakhstan Temir Zholy Finance BV, senior bond, 144A, 6.95%, 7/10/42 | | Kazakhstan | | 1,700,000 | | | | | 2,286,721 | |
fMexico City Airport Trust, senior secured bond, first lien, 144A, 5.50%, 7/31/47 | | Mexico | | 1,200,000 | | | | | 1,241,634 | |
g,j RZD Capital PLC, (Russian Railways), loan participation, senior bond, Reg S, 5.70%, 4/05/22 | | Russia | | 1,700,000 | | | | | 1,829,229 | |
| | | | | | | | | | |
| | | | |
| | | | | | | | | 7,027,903 | |
| | | | | | | | | | |
Utilities 3.4% | | | | | | | | | | |
Calpine Corp., | | | | | | | | | | |
senior bond, 5.75%, 1/15/25 | | United States | | 970,000 | | | | | 997,888 | |
fsenior note, 144A, 5.125%, 3/15/28 | | United States | | 200,000 | | | | | 204,640 | |
gCGNPC International Ltd., senior note, Reg S, 3.75%, 12/11/27 | | China | | 300,000 | | | | | 316,024 | |
Clearway Energy Operating LLC, senior note, 5.75%, 10/15/25 | | United States | | 1,132,000 | | | | | 1,193,790 | |
fColbun SA, senior note, 144A, 3.95%, 10/11/27 | | Chile | | 800,000 | | | | | 834,508 | |
f,h EDF SA, junior sub. note, 144A, 5.25% to 1/29/23, FRN thereafter, Perpetual | | France | | 2,425,000 | | | | | 2,547,984 | |
fInterGen NV, secured bond, 144A, 7.00%, 6/30/23 | | Netherlands | | 700,000 | | | | | 684,250 | |
fIsrael Electric Corp. Ltd., secured bond, 144A, 4.25%, 8/14/28 | | Israel | | 1,000,000 | | | | | 1,091,575 | |
The Southern Co., senior bond, 3.25%, 7/01/26 | | United States | | 2,410,000 | | | | | 2,510,062 | |
fState Grid Overseas Investment 2016 Ltd., senior note, 144A, 3.50%, 5/04/27 | | China | | 1,651,000 | | | | | 1,729,093 | |
fTalen Energy Supply LLC, senior secured note, 144A, 7.25%, 5/15/27 | | United States | | 1,300,000 | | | | | 1,370,265 | |
fThree Gorges Finance I Cayman Islands Ltd., senior note, 144A, 3.15%, 6/02/26 | | China | | 1,051,000 | | | | | 1,076,032 | |
Virginia Electric & Power Co., senior bond, 6.35%, 11/30/37 | | United States | | 85,000 | | | | | 117,873 | |
| | | | | | | | | | |
| | | | |
| | | | | | | | | 14,673,984 | |
| | | | | | | | | | |
| | | | |
Total Corporate Bonds (Cost $128,965,730) | | | | | | | | | 128,797,171 | |
| | | | | | | | | | |
FRANKLIN TEMPLETON VARIABLE INSURANCE PRODUCTS TRUST
CONSOLIDATED STATEMENT OF INVESTMENTS
Franklin Strategic Income VIP Fund(continued)
| | | | | | | | | | |
| | | Country/ Organization | | Principal
Amount* | | | | Value | |
| | | | |
l,m Senior Floating Rate Interests 7.0% | | | | | | | | | | |
Automobiles & Components 0.6% | | | | | | | | | | |
Adient U.S. LLC, Initial Term Loans, 6.144% - 6.195%, (3-month USD LIBOR + 4.25%), 5/06/24 | | United States | | 1,164,150 | | | | $ | 1,172,639 | |
Thor Industries Inc., Initial USD Term Loans, 5.50%, (1-month USD LIBOR + 3.75%), 2/01/26 | | United States | | 1,279,890 | | | | | 1,285,890 | |
| | | | | | | | | | |
| | | | |
| | | | | | | | | 2,458,529 | |
| | | | | | | | | | |
Capital Goods 0.1% | | | | | | | | | | |
Altra Industrial Motion Corp., Term Loan, 3.799%, (1-month USD LIBOR + 2.00%), 10/01/25 | | United States | | 224,146 | | | | | 225,080 | |
Doncasters U.S. Finance LLC, Second-Lien Term Loans, 10.195%, (3-month USD LIBOR + 8.25%), 10/09/20 | | United States | | 742,509 | | | | | 82,914 | |
Harsco Corp., Term Loan B-2, 4.063%, (1-month USD LIBOR + 2.25%), 12/10/24 | | United States | | 110,062 | | | | | 110,750 | |
Onsite Rental Group Operations Pty. Ltd., Term Loan, 6.292%, (1-month USD LIBOR + 4.50%), 10/25/22 | | Australia | | 192,010 | | | | | 187,529 | |
| | | | | | | | | | |
| | | | |
| | | | | | | | | 606,273 | |
| | | | | | | | | | |
Commercial & Professional Services 0.0%† | | | | | | | | | | |
n,o Pitney Bowes Inc., Term Loan B, TBD, 1/15/25 | | United States | | 100,000 | | | | | 99,094 | |
nPrime Security Services Borrower LLC, Term B-1, 4.944%, (1-month USD LIBOR + 3.25%), 9/12/26 | | United States | | 125,000 | | | | | 125,486 | |
| | | | | | | | | | |
| | | | |
| | | | | | | | | 224,580 | |
| | | | | | | | | | |
Consumer Services 0.4% | | | | | | | | | | |
Aristocrat Technologies Inc., Term B-3 Loans, 3.716%, (3-month USD LIBOR + 1.75%), 10/19/24 | | United States | | 775,372 | | | | | 779,953 | |
Avis Budget Car Rental LLC, Tranche B Term Loans, 3.80%, (1-month USD LIBOR + 2.00%), 2/13/25 | | United States | | 1,008,728 | | | | | 1,015,820 | |
Eldorado Resorts Inc., Initial Term Loan, 4.00% - 4.063%, (1-month USD LIBOR + 2.25%), 4/17/24 | | United States | | 179,897 | | | | | 180,038 | |
| | | | | | | | | | |
| | | | |
| | | | | | | | | 1,975,811 | |
| | | | | | | | | | |
Diversified Financials 0.3% | | | | | | | | | | |
Russell Investments U.S. Institutional Holdco Inc., Initial Term Loan, 5.049%, (1-month USD LIBOR + 3.25%), 6/01/23 | | United States | | 1,160,977 | | | | | 1,163,444 | |
| | | | | | | | | | |
Energy 1.3% | | | | | | | | | | |
Fieldwood Energy LLC, Closing Date Loans, 7.177%, (3-month USD LIBOR + 5.25%), 4/11/22 | | United States | | 2,603,076 | | | | | 2,189,109 | |
Utex Industries Inc., | | | | | | | | | | |
First Lien Initial Term Loan, 5.799%, (1-month USD LIBOR + 4.00%), 5/21/21 | | United States | | 515,671 | | | | | 382,886 | |
Second Lien Initial Term Loan, 9.049%, (1-month USD LIBOR + 7.25%), 5/20/22 | | United States | | 53,878 | | | | | 28,960 | |
Wolverine Fuels Holding LLC, | | | | | | | | | | |
First Lien Initial Term Loan, 7.659%, (3-month USD LIBOR + 5.75%), 8/14/20 | | United States | | 1,702,456 | | | | | 1,666,278 | |
Second Lien Initial Term Loan, 12.659%, (3-month USD LIBOR + 10.75%), 2/16/21 | | United States | | 1,571,327 | | | | | 1,484,904 | |
| | | | | | | | | | |
| | | | |
| | | | | | | | | 5,752,137 | |
| | | | | | | | | | |
FRANKLIN TEMPLETON VARIABLE INSURANCE PRODUCTS TRUST
CONSOLIDATED STATEMENT OF INVESTMENTS
Franklin Strategic Income VIP Fund(continued)
| | | | | | | | | | |
| | | Country/
Organization | | Principal
Amount* | | | | Value | |
| | | | |
l,mSenior Floating Rate Interests(continued) | | | | | | | | | | |
| | | | |
Food & Staples Retailing 0.2% | | | | | | | | | | |
Aramark Corp., | | | | | | | | | | |
U.S. Term B-3 Loan, 3.549%, (1-month USD LIBOR + 1.75%), 3/11/25 | | United States | | 359,644 | | | | $ | 361,611 | |
n,o U.S. Term B-4 Loan, TBD, 12/31/26 | | United States | | 500,000 | | | | | 503,281 | |
| | | | | | | | | | |
| | | | |
| | | | | | | | | 864,892 | |
| | | | | | | | | | |
| | | | |
Food, Beverage & Tobacco 0.2% | | | | | | | | | | |
CSM Bakery Supplies LLC, Second Lien Term Loan, 9.78%, (3-month USD LIBOR + 7.75%), 7/03/21 | | United States | | 478,111 | | | | | 460,182 | |
nJBS USA Lux SA, New Term Loans, 3.799%, (1-month USD LIBOR + 2.00%), 5/01/26 | | United States | | 209,563 | | | | | 211,303 | |
| | | | | | | | | | |
| | | | |
| | | | | | | | | 671,485 | |
| | | | | | | | | | |
| | | | |
Health Care Equipment & Services 0.1% | | | | | | | | | | |
HCA Inc., Term Loan B13, 3.549%, (1-month USD LIBOR + 1.75%), 3/18/26 | | United States | | 483,959 | | | | | 487,287 | |
| | | | | | | | | | |
| | | | |
Household & Personal Products 0.6% | | | | | | | | | | |
bFGI Operating Co. LLC (Freedom Group), | | | | | | | | | | |
i Term Loan, PIK, 12.00%, (3-month USD LIBOR + 10.00%), 5/15/22 | | United States | | 849,545 | | | | | 799,658 | |
Term Loan FILO, 9.409% - 9.50%, (3-month USD LIBOR + 7.50%), 5/15/21 | | United States | | 1,616,351 | | | | | 1,616,532 | |
| | | | | | | | | | |
| | | | |
| | | | | | | | | 2,416,190 | |
| | | | | | | | | | |
| | | | |
Materials 0.2% | | | | | | | | | | |
Appvion Operations, Inc., | | | | | | | | | | |
Term Loan, 8.10%, (3-month USD LIBOR + 6.00%), 6/15/26 | | United States | | 18,480 | | | | | 18,665 | |
Term Loan, 8.22%, (6-month USD LIBOR + 6.00%), 6/15/26 | | United States | | 397,237 | | | | | 401,209 | |
Axalta Coating Systems U.S. Holdings Inc., Term B-3 Dollar Loan, 3.695%, (3-month USD LIBOR + 1.75%), 6/01/24 | | United States | | 268,206 | | | | | 269,179 | |
| | | | | | | | | | |
| | | | |
| | | | | | | | | 689,053 | |
| | | | | | | | | | |
| | | | |
Media & Entertainment 1.1% | | | | | | | | | | |
Charter Communications Operating LLC, Term A-2 Loan, 3.30%, (1-month USD LIBOR + 1.50%), 3/31/23 | | United States | | 845,479 | | | | | 843,102 | |
CSC Holdings LLC, March 2017 Incremental Term Loans, 3.99%, (1-month USD LIBOR + 2.25%), 7/17/25 | | United States | | 1,203,344 | | | | | 1,206,353 | |
Diamond Sports Group LLC, Term Loan, 5.03%, (1-month USD LIBOR + 3.25%), 8/24/26 | | United States | | 453,976 | | | | | 453,976 | |
Gray Television Inc., | | | | | | | | | | |
Term B-2 Loan, 3.947%, (1-month USD LIBOR + 2.25%), 2/07/24 | | United States | | 843,033 | | | | | 846,260 | |
Term C Loan, 4.197%, (1-month USD LIBOR + 2.50%), 1/02/26 | | United States | | 536,353 | | | | | 539,772 | |
iHeartCommunications Inc., Term Loan, 5.691%, (1-month USD LIBOR + 4.00%), 5/04/26 | | United States | | 136,140 | | | | | 137,623 | |
Lions Gate Capital Holdings LLC, Term A Loan, 3.549%, (1-month USD LIBOR + 1.75%), 3/22/23 | | Canada | | 246,301 | | | | | 244,659 | |
Mediacom Illinois LLC, Tranche N Term Loan, 3.38%, (1-week USD LIBOR + 1.75%), 2/15/24 | | United States | | 451,476 | | | | | 454,579 | |
| | | | | | | | | | |
| | | | |
| | | | | | | | | 4,726,324 | |
| | | | | | | | | | |
FRANKLIN TEMPLETON VARIABLE INSURANCE PRODUCTS TRUST
CONSOLIDATED STATEMENT OF INVESTMENTS
Franklin Strategic Income VIP Fund(continued)
| | | | | | | | | | |
| | | Country/ Organization | | Principal Amount* | | | | Value | |
| | | | |
l,mSenior Floating Rate Interests(continued) | | | | | | | | | | |
Retailing 0.2% | | | | | | | | | | |
nBass Pro Group LLC, Initial Term Loans, 6.799%, (1-month USD LIBOR + 5.00%), 9/25/24 | | United States | | 200,000 | | | | $ | 199,550 | |
General Nutrition Centers, Inc., | | | | | | | | | | |
Tranche B-2 Term Loans, 10.55%, (1-month USD LIBOR + 8.75%), 3/04/21 | | United States | | 218,455 | | | | | 206,531 | |
Tranche B-2 Term Loans, 10.60%, (2-month USD LIBOR + 8.75%), 3/04/21 | | United States | | 341,366 | | | | | 322,733 | |
nHarbor Freight Tools USA Inc., Refinancing Loans, 4.299%, (1-month USD LIBOR + 2.50%), 8/19/23 | | United States | | 200,000 | | | | | 199,313 | |
| | | | | | | | | | |
| | | | |
| | | | | | | | | 928,127 | |
| | | | | | | | | | |
Semiconductors & Semiconductor Equipment 0.4% | | | | | | | | | | |
MKS Instruments Inc., Tranche B-6 Term Loan, 3.549%, (1-month USD LIBOR + 1.75%), 2/02/26 | | United States | | 507,311 | | | | | 508,579 | |
ON Semiconductor Corp., 2019 Replacement Term B-4 Loans, 3.799%, (1-month USD LIBOR + 2.00%), 9/18/26 | | United States | | 1,137,106 | | | | | 1,146,737 | |
| | | | | | | | | | |
| | | | |
| | | | | | | | | 1,655,316 | |
| | | | | | | | | | |
Software & Services 0.2% | | | | | | | | | | |
n,o Infor (US) Inc. (Lawson), First Lien Term Loan, TBD, 2/01/22 | | United States | | 149,615 | | | | | 150,457 | |
WEX Inc., Term B-3 Loan, 4.049%, (1-month USD LIBOR + 2.25%), 5/17/26 | | United States | | 640,128 | | | | | 645,128 | |
| | | | | | | | | | |
| | | | |
| | | | | | | | | 795,585 | |
| | | | | | | | | | |
Telecommunication Services 0.2% | | | | | | | | | | |
Global Tel*Link Corp., | | | | | | | | | | |
First Lien Term Loan, 6.049%, (1-month USD LIBOR + 4.25%), 11/29/25 | | United States | | 396,992 | | | | | 362,752 | |
Second Lien Term Loan, 10.049%, (1-month USD LIBOR + 8.25%), 11/29/26 | | United States | | 183,038 | | | | | 159,014 | |
Securus Technologies Holdings Inc., | | | | | | | | | | |
Initial Term Loan, 6.299%, (1-month USD LIBOR + 4.50%), 11/01/24 | | United States | | 248,092 | | | | | 184,828 | |
Second Lien Initial Loan, 10.049%, (1-month USD LIBOR + 8.25%), 11/01/25 | | United States | | 597,127 | | | | | 288,860 | |
| | | | | | | | | | |
| | | | |
| | | | | | | | | 995,454 | |
| | | | | | | | | | |
Transportation 0.3% | | | | | | | | | | |
Allegiant Travel Co., Class B Term Loans, 6.394%, (3-month USD LIBOR + 4.50%), 2/05/24 | | United States | | 231,542 | | | | | 232,989 | |
Hertz Corp., Tranche B-1 Term Loan, 4.55%, (1-month USD LIBOR + 2.75%), 6/30/23 | | United States | | 1,245,713 | | | | | 1,253,110 | |
| | | | | | | | | | |
| | | | |
| | | | | | | | | 1,486,099 | |
| | | | | | | | | | |
FRANKLIN TEMPLETON VARIABLE INSURANCE PRODUCTS TRUST
CONSOLIDATED STATEMENT OF INVESTMENTS
Franklin Strategic Income VIP Fund(continued)
| | | | | | | | | | | | | | |
| | | Country/
Organization | | | Principal Amount* | | | | | Value | |
| | | | |
l,mSenior Floating Rate Interests (continued) | | | | | | | | | | | | | | |
Utilities 0.6% | | | | | | | | | | | | | | |
EFS Cogen Holdings I LLC (Linden), | | | | | | | | | | | | | | |
Term B Advance, 5.05%, (1-month USD LIBOR + 3.25%), 6/28/23 | | | United States | | | | 782,085 | | | | | $ | 786,191 | |
Term B Advance, 5.20%, (3-month USD LIBOR + 3.25%), 6/28/23 | | | United States | | | | 1,898,271 | | | | | | 1,908,237 | |
| | | | | | | | | | | | | | |
| | | | |
| | | | | | | | | | | | | 2,694,428 | |
| | | | | | | | | | | | | | |
| | | | |
Total Senior Floating Rate Interests (Cost $31,969,542) | | | | | | | | | | | | | 30,591,014 | |
| | | | | | | | | | | | | | |
| | | | |
Foreign Government and Agency Securities 12.5% | | | | | | | | | | | | | | |
f The African Export-Import Bank, senior bond, 144A, 3.994%, 9/21/29 | | | Supranational | p | | | 900,000 | | | | | | 915,282 | |
fAngolan Government International Bond, senior note, 144A, 8.25%, 5/09/28 | | | Angola | | | | 2,500,000 | | | | | | 2,706,770 | |
gBanque Centrale de Tunisie International Bond, senior note, Reg S, 5.625%, 2/17/24 | | | Tunisia | | | | 2,400,000 | | | EUR | | | 2,683,204 | |
fBanque Ouest Africaine de Developpement, senior note, 144A, 5.00%, 7/27/27 | | | Supranational | p | | | 800,000 | | | | | | 850,000 | |
fDominican Republic, senior note, 144A, 8.90%, 2/15/23 | | | Dominican Republic | | | | 81,500,000 | | | DOP | | | 1,548,515 | |
f The Export-Import Bank of India, senior note, 144A, 3.875%, 2/01/28 | | | India | | | | 1,455,000 | | | | | | 1,523,941 | |
fGovernment of Belarus International Bond, | | | | | | | | | | | | | | |
senior bond, 144A, 6.20%, 2/28/30 | | | Belarus | | | | 1,200,000 | | | | | | 1,277,814 | |
senior note, 144A, 7.625%, 6/29/27 | | | Belarus | | | | 800,000 | | | | | | 911,949 | |
Government of China, 3.29%, 5/23/29 | | | China | | | | 26,200,000 | | | CNY | | | 3,801,431 | |
Government of Colombia, | | | | | | | | | | | | | | |
senior bond, 9.85%, 6/28/27 | | | Colombia | | | | 5,315,000,000 | | | COP | | | 2,032,920 | |
senior bond, 4.50%, 3/15/29 | | | Colombia | | | | 500,000 | | | | | | 554,635 | |
senior bond, 5.00%, 6/15/45 | | | Colombia | | | | 1,900,000 | | | | | | 2,213,376 | |
fGovernment of Gabon, 144A, 6.375%, 12/12/24 | | | Gabon | | | | 2,700,000 | | | | | | 2,826,643 | |
Government of Indonesia, | | | | | | | | | | | | | | |
senior bond, FR64, 6.125%, 5/15/28 | | | Indonesia | | | | 26,500,000,000 | | | IDR | | | 1,803,508 | |
senior bond, FR70, 8.375%, 3/15/24 | | | Indonesia | | | | 19,648,000,000 | | | IDR | | | 1,514,095 | |
fGovernment of Iraq, 144A, 5.80%, 1/15/28 | | | Iraq | | | | 2,700,000 | | | | | | 2,649,702 | |
fGovernment of Kazakhstan, senior bond, 144A, 4.875%, 10/14/44 | | | Kazakhstan | | | | 1,800,000 | | | | | | 2,228,562 | |
Government of Mexico, | | | | | | | | | | | | | | |
senior bond, M, 6.50%, 6/10/21 | | | Mexico | | | | 293,000 | q | | MXN | | | 1,543,649 | |
senior note, 4.15%, 3/28/27 | | | Mexico | | | | 1,300,000 | | | | | | 1,393,613 | |
Government of Peru, senior bond, 6.55%, 3/14/37 | | | Peru | | | | 1,000,000 | | | | | | 1,463,395 | |
fGovernment of Russia, senior note, 144A, 4.875%, 9/16/23 | | | Russia | | | | 800,000 | | | | | | 873,496 | |
Government of South Africa, senior bond, 7.00%, 2/28/31 | | | South Africa | | | | 34,100,000 | | | ZAR | | | 2,062,897 | |
f,g Government of Spain, | | | | | | | | | | | | | | |
senior bond, 144A, Reg S, 1.45%, 4/30/29 | | | Spain | | | | 1,600,000 | | | EUR | | | 1,961,856 | |
senior bond, 144A, Reg S, 2.70%, 10/31/48 | | | Spain | | | | 3,350,000 | | | EUR | | | 4,994,028 | |
fGovernment of Ukraine, | | | | | | | | | | | | | | |
144A, 7.75%, 9/01/22 | | | Ukraine | | | | 200,000 | | | | | | 215,750 | |
144A, 7.75%, 9/01/23 | | | Ukraine | | | | 369,000 | | | | | | 401,595 | |
144A, 7.75%, 9/01/24 | | | Ukraine | | | | 369,000 | | | | | | 402,649 | |
a,r 144A, VRI, GDP Linked Security, 5/31/40 | | | Ukraine | | | | 978,000 | | | | | | 937,657 | |
FRANKLIN TEMPLETON VARIABLE INSURANCE PRODUCTS TRUST
CONSOLIDATED STATEMENT OF INVESTMENTS
Franklin Strategic Income VIP Fund(continued)
| | | | | | | | | | | | | | |
| | | Country/
Organization | | | Principal
Amount* | | | | | Value | |
| | | | |
Foreign Government and Agency Securities(continued) | | | | | | | | | | | | | | |
fGovernment of Ukraine, (continued) | | | | | | | | | | | | | | |
senior bond, 144A, 7.375%, 9/25/32 | | | Ukraine | | | | 500,000 | | | | | $ | 534,608 | |
Government of Uruguay, | | | | | | | | | | | | | | |
senior bond, 4.375%, 1/23/31 | | | Uruguay | | | | 800,000 | | | | | | 896,200 | |
ssenior bond, Index Linked, 3.70%, 6/26/37 | | | Uruguay | | | | 78,775,448 | | | UYU | | | 2,066,692 | |
Nota do Tesouro Nacional, | | | | | | | | | | | | | | |
10.00%, 1/01/21 | | | Brazil | | | | 2,900 | t | | BRL | | | 758,530 | |
10.00%, 1/01/23 | | | Brazil | | | | 2,800 | t | | BRL | | | 774,530 | |
fPanama Notas del Tesoro, senior note, 144A, 3.75%, 4/17/26 | | | Panama | | | | 800,000 | | | | | | 837,600 | |
| | | | | | | | | | | | | | |
| | | | |
Total Foreign Government and Agency Securities
(Cost $53,099,799) | | | | | | | | | | | | | 54,161,092 | |
| | | | | | | | | | | | | | |
| | | | |
U.S. Government and Agency Securities 5.5% | | | | | | | | | | | | | | |
U.S. Treasury Bond, 7.875%, 2/15/21 | | | United States | | | | 728,000 | | | | | | 777,681 | |
U.S. Treasury Note, | | | | | | | | | | | | | | |
2.75%, 2/15/24 | | | United States | | | | 809,000 | | | | | | 843,357 | |
2.125%, 9/30/24 | | | United States | | | | 4,600,000 | | | | | | 4,688,591 | |
sIndex Linked, 0.125%, 7/15/24 | | | United States | | | | 7,462,342 | | | | | | 7,508,016 | |
sIndex Linked, 0.375%, 7/15/25 | | | United States | | | | 4,557,464 | | | | | | 4,651,243 | |
sIndex Linked, 0.375%, 7/15/27 | | | United States | | | | 5,291,324 | | | | | | 5,398,828 | |
| | | | | | | | | | | | | | |
| | | | |
Total U.S. Government and Agency Securities
(Cost $23,684,215) | | | | | | | | | | | | | 23,867,716 | |
| | | | | | | | | | | | | | |
| | | | |
Asset-Backed Securities and Commercial Mortgage-Backed Securities 27.6% | | | | | | | | | | | | | | |
Banks 0.4% | | | | | | | | | | | | | | |
uCommercial Mortgage Trust, 2006-GG7, AJ, FRN, 5.619%, 7/10/38 | | | United States | | | | 425,000 | | | | | | 393,747 | |
CSAIL Commercial Mortgage Trust, 2015-C1, A4, 3.505%, 4/15/50 | | | United States | | | | 740,000 | | | | | | 777,085 | |
uCWABS Asset-Backed Certificates Trust, 2005-11, AF4, FRN, 5.21%, 3/25/34 | | | United States | | | | 537,156 | | | | | | 539,298 | |
vMerrill Lynch Mortgage Investors Trust, 2005-A6, 2A3, FRN, 2.172%, (1-month USD LIBOR + 0.38%), 8/25/35 | | | United States | | | | 56,580 | | | | | | 56,947 | |
| | | | | | | | | | | | | | |
| | | | |
| | | | | | | | | | | | | 1,767,077 | |
| | | | | | | | | | | | | | |
Diversified Financials 27.2% | | | | | | | | | | | | | | |
vAmerican Express Credit Account Master Trust, 2017-2, A, FRN, 2.19%, (1-month USD LIBOR + 0.45%), 9/16/24 | | | United States | | | | 670,000 | | | | | | 673,542 | |
f,v AMMC CLO XI Ltd., 2012-11A, BR2, 144A, FRN, 3.536%, (3-month USD LIBOR + 1.60%), 4/30/31 | | | United States | | | | 350,000 | | | | | | 343,385 | |
f,v Antares CLO Ltd., 2018-1A, B, 144A, FRN, 3.616%, (3-month USD LIBOR + 1.65%), 4/20/31 | | | United States | | | | 1,455,000 | | | | | | 1,428,097 | |
f,u ARES L CLO Ltd., 2018-50A, B, 144A, FRN, 3.701%, 1/15/32 | | | United States | | | | 500,000 | | | | | | 494,265 | |
f,u ARES LII CLO Ltd., | | | | | | | | | | | | | | |
2019-52A, A2, 144A, FRN, 3.603%, 4/22/31 | | | United States | | | | 250,000 | | | | | | 249,348 | |
2019-52A, B, 144A, FRN, 3.803%, 4/22/31 | | | United States | | | | 500,000 | | | | | | 500,470 | |
FRANKLIN TEMPLETON VARIABLE INSURANCE PRODUCTS TRUST
CONSOLIDATED STATEMENT OF INVESTMENTS
Franklin Strategic Income VIP Fund(continued)
| | | | | | | | | | | | | | |
| | | Country/
Organization | | | Principal
Amount* | | | | | Value | |
| | | | |
Asset-Backed Securities and Commercial Mortgage-Backed Securities (continued) | | | | | | | | | | | | | | |
| | | | |
Diversified Financials(continued) | | | | | | | | | | | | | | |
f,v Ares XLIII CLO Ltd., 2017-43A, A, 144A, FRN, 3.221%, (3-month USD LIBOR + 1.22%), 10/15/29 | | | United States | | | | 432,000 | | | | | $ | 432,220 | |
Banc of America Commercial Mortgage Trust, | | | | | | | | | | | | | | |
2015-UBS7, A3, 3.441%, 9/15/48 | | | United States | | | | 849,000 | | | | | | 891,987 | |
2015-UBS7, A4, 3.705%, 9/15/48 | | | United States | | | | 946,000 | | | | | | 1,007,391 | |
u2015-UBS7, B, FRN, 4.361%, 9/15/48 | | | United States | | | | 615,000 | | | | | | 657,557 | |
f,u BCC Middle Market CLO LLC, 2018-1A, A2, 144A, FRN, 4.116%, 10/20/30 | | | United States | | | | 700,000 | | | | | | 694,890 | |
f,u Betony CLO 2 Ltd., 2018-1A, A1, 144A, FRN, 3.016%, 4/30/31 | | | United States | | | | 1,250,000 | | | | | | 1,240,337 | |
f,u BlueMountain CLO Ltd., | | | | | | | | | | | | | | |
2012-2A, BR2, 144A, FRN, 3.349%, 11/20/28 | | | United States | | | | 510,000 | | | | | | 506,792 | |
2012-2A, CR2, 144A, FRN, 3.899%, 11/20/28 | | | United States | | | | 270,000 | | | | | | 267,646 | |
2018-1A, D, 144A, FRN, 4.986%, 7/30/30 | | | United States | | | | 1,000,000 | | | | | | 960,330 | |
f,u BlueMountain EUR CLO, | | | | | | | | | | | | | | |
5A, A, 144A, FRN, 0.91%, 1/15/33 | | | Ireland | | | | 1,900,000 | | | EUR | | | 2,129,166 | |
5A, B, 144A, FRN, 1.55%, 1/15/33 | | | Ireland | | | | 600,000 | | | EUR | | | 672,472 | |
f,v BlueMountain Fuji U.S. CLO II Ltd., 2017-2A, A1A, 144A, FRN, 3.166%, (3-month USD LIBOR + 1.20%), 10/20/30 | | | United States | | | | 1,455,000 | | | | | | 1,455,902 | |
f,v BlueMountain Fuji U.S. CLO III Ltd., 2017-3A, A2, 144A, FRN, 3.151%, (3-month USD LIBOR + 1.15%), 1/15/30 | | | United States | | | | 200,000 | | | | | | 195,650 | |
fBRAVO Residential Funding Trust, | | | | | | | | | | | | | | |
2019-1, A1C, 144A, 3.50%, 3/25/58 | | | United States | | | | 941,241 | | | | | | 954,681 | |
u2019-2, A3, 144A, FRN, 3.50%, 10/25/44 | | | United States | | | | 1,043,286 | | | | | | 1,061,938 | |
f,u Burnham Park CLO Ltd., | | | | | | | | | | | | | | |
2016-1A, BR, 144A, FRN, 3.466%, 10/20/29 | | | United States | | | | 460,000 | | | | | | 454,632 | |
2016-1A, CR, 144A, FRN, 4.116%, 10/20/29 | | | United States | | | | 460,000 | | | | | | 451,821 | |
f,u Buttermilk Park CLO Ltd., 2018-1A, C, 144A, FRN, 4.101%, 10/15/31 | | | United States | | | | 1,408,860 | | | | | | 1,375,780 | |
vCapital One Multi-Asset Execution Trust, | | | | | | | | | | | | | | |
2016-A2, A2, FRN, 2.37%, (1-month USD LIBOR + 0.63%), 2/15/24 | | | United States | | | | 3,225,000 | | | | | | 3,245,900 | |
2016-A7, A7, FRN, 2.25%, (1-month USD LIBOR + 0.51%), 9/16/24 | | | United States | | | | 320,000 | | | | | | 322,180 | |
f,v Carlyle Global Market Strategies CLO Ltd., 2014-4RA, C, 144A, FRN, 4.901%, (3-month USD LIBOR + 2.90%), 7/15/30 | | | United States | | | | 300,000 | | | | | | 268,710 | |
f,u Carlyle GMS Finance MM CLO LLC, 2015-1A, A2R, 144A, FRN, 4.201%, 10/15/31 | | | United States | | | | 1,213,000 | | | | | | 1,203,296 | |
f,v Carlyle U.S. CLO Ltd., 2017-2A, A1B, 144A, FRN, 3.186%, (3-month USD LIBOR + 1.22%), 7/20/31 | | | United States | | | | 1,150,000 | | | | | | 1,147,090 | |
f,v Catamaran CLO Ltd., 2014-2A, BR, 144A, FRN, 4.953%, (3-month USD LIBOR + 2.95%), 10/18/26 | | | United States | | | | 1,253,000 | | | | | | 1,253,401 | |
f,u CGRBS Commercial Mortgage Trust, 2013-VN05, C, 144A, FRN, 3.584%, 3/13/35 | | | United States | | | | 704,000 | | | | | | 732,832 | |
f,u CIM Trust, | | | | | | | | | | | | | | |
2019-INV1, A1, 144A, FRN, 4.00%, 2/25/49 | | | United States | | | | 1,189,136 | | | | | | 1,209,867 | |
2019-INV2, A3, 144A, FRN, 4.00%, 5/25/49 | | | United States | | | | 1,783,314 | | | | | | 1,827,537 | |
uCitibank Credit Card Issuance Trust, | | | | | | | | | | | | | | |
2016-A3, A3, FRN, 2.20%, 12/07/23 | | | United States | | | | 350,000 | | | | | | 352,206 | |
2017-A7, A7, FRN, 2.08%, 8/08/24 | | | United States | | | | 2,685,000 | | | | | | 2,695,262 | |
FRANKLIN TEMPLETON VARIABLE INSURANCE PRODUCTS TRUST
CONSOLIDATED STATEMENT OF INVESTMENTS
Franklin Strategic Income VIP Fund(continued)
| | | | | | | | | | | | | | |
| | | Country/
Organization | | | Principal
Amount* | | | | | Value | |
| | | | |
Asset-Backed Securities and Commercial Mortgage-Backed Securities (continued) | | | | | | | | | | | | | | |
Diversified Financials(continued) | | | | | | | | | | | | | | |
f,u Cole Park CLO Ltd., 2015-1A, BR, 144A, FRN, 3.566%, 10/20/28 | | | United States | | | | 270,000 | | | | | $ | 268,331 | |
f,u Consumer Loan Underlying Bond CLUB Certificate Issuer Trust, 2019-52, PT, 144A, FRN, 11.118%, 1/15/45 | | | United States | | | | 1,079,392 | | | | | | 1,057,240 | |
f,u Consumer Loan Underlying Bond CLUB Certificate Issuer Trust I, | | | | | | | | | | | | | | |
2019-51, PT, 144A, FRN, 16.852%, 1/15/45 | | | United States | | | | 1,053,641 | | | | | | 1,016,973 | |
2019-S8, PT, 144A, FRN, 11.541%, 1/15/45 | | | United States | | | | 795,174 | | | | | | 742,566 | |
uDiscover Card Execution Note Trust, 2017-A7, A7, FRN, 2.10%, 4/15/25 | | | United States | | | | 390,000 | | | | | | 390,264 | |
f,u Dryden 38 Senior Loan Fund, 2015-38A, CR, 144A, FRN, 4.001%, 7/15/30 | | | United States | | | | 863,000 | | | | | | 839,639 | |
f,v Dryden 41 Senior Loan Fund, 2015-41A, AR, 144A, FRN, 2.956%, (3-month USD LIBOR + 0.97%), 4/15/31 | | | United States | | | | 1,100,000 | | | | | | 1,091,695 | |
f,v Dryden 55 CLO Ltd., | | | | | | | | | | | | | | |
2018-55A, A1, 144A, FRN, 3.021%, (3-month USD LIBOR + 1.02%), 4/15/31 | | | United States | | | | 900,000 | | | | | | 895,059 | |
2018-55A, D, 144A, FRN, 4.851%, (3-month USD LIBOR + 2.85%), 4/15/31 | | | United States | | | | 300,000 | | | | | | 284,892 | |
f,u Eaton Vance CLO Ltd., 2014-1RA, C, 144A, FRN, 4.101%, 7/15/30 | | | United States | | | | 315,610 | | | | | | 308,474 | |
f,u Eleven Madison Trust 2015-11MD Mortgage Trust, 2015-11MD, A, 144A, FRN, 3.555%, 9/10/35 | | | United States | | | | 1,091,000 | | | | | | 1,143,399 | |
FHLMC Structured Agency Credit Risk Debt Notes, | | | | | | | | | | | | | | |
v 2013-DN2, M2, FRN, 6.042%, (1-month USD LIBOR + 4.25%), 11/25/23 | | | United States | | | | 1,715,076 | | | | | | 1,849,656 | |
v2014-DN1, M2, FRN, 3.992%, (1-month USD LIBOR + 2.20%), 2/25/24 | | | United States | | | | 604,467 | | | | | | 611,191 | |
v2014-DN2, M3, FRN, 5.392%, (1-month USD LIBOR + 3.60%), 4/25/24 | | | United States | | | | 2,290,000 | | | | | | 2,435,372 | |
v2014-DN3, M3, FRN, 5.792%, (1-month USD LIBOR + 4.00%), 8/25/24 | | | United States | | | | 162,276 | | | | | | 173,029 | |
v2014-DN4, M3, FRN, 6.342%, (1-month USD LIBOR + 4.55%), 10/25/24 | | | United States | | | | 1,202,738 | | | | | | 1,290,820 | |
v2014-HQ1, M3, FRN, 5.892%, (1-month USD LIBOR + 4.10%), 8/25/24 | | | United States | | | | 299,114 | | | | | | 316,933 | |
v2014-HQ2, M2, FRN, 3.992%, (1-month USD LIBOR + 2.20%), 9/25/24 | | | United States | | | | 422,766 | | | | | | 427,875 | |
v2014-HQ3, M3, FRN, 6.542%, (1-month USD LIBOR + 4.75%), 10/25/24 | | | United States | | | | 598,635 | | | | | | 634,391 | |
v2015-DNA1, M3, FRN, 5.092%, (1-month USD LIBOR + 3.30%), 10/25/27 | | | United States | | | | 250,000 | | | | | | 266,657 | |
v2015-DNA3, M3, FRN, 6.492%, (1-month USD LIBOR + 4.70%), 4/25/28 | | | United States | | | | 1,819,000 | | | | | | 2,016,941 | |
v2015-HQ1, M3, FRN, 5.592%, (1-month USD LIBOR + 3.80%), 3/25/25 | | | United States | | | | 654,972 | | | | | | 672,140 | |
v2015-HQA1, M3, FRN, 6.492%, (1-month USD LIBOR + 4.70%), 3/25/28 | | | United States | | | | 1,835,000 | | | | | | 1,954,749 | |
v2016-DNA2, M3, FRN, 6.442%, (1-month USD LIBOR + 4.65%), 10/25/28 | | | United States | | | | 1,561,028 | | | | | | 1,682,515 | |
u2017-DNA1, M2, FRN, 5.042%, 7/25/29 | | | United States | | | | 990,000 | | | | | | 1,041,452 | |
u2017-DNA2, M2, FRN, 5.242%, 10/25/29 | | | United States | | | | 1,340,000 | | | | | | 1,428,745 | |
FRANKLIN TEMPLETON VARIABLE INSURANCE PRODUCTS TRUST
CONSOLIDATED STATEMENT OF INVESTMENTS
Franklin Strategic Income VIP Fund(continued)
| | | | | | | | | | |
| | | Country/
Organization | | Principal
Amount* | | | | Value | |
| | | | |
Asset-Backed Securities and Commercial Mortgage-Backed Securities (continued) | | | | | | | | | | |
| | | | |
Diversified Financials(continued) | | | | | | | | | | |
FHLMC Structured Agency Credit Risk Debt Notes, (continued) | | | | | | | | | | |
v2017-DNA3, M2, FRN, 4.292%, (1-month USD LIBOR + 2.50%), 3/25/30 | | United States | | 2,920,000 | | | | $ | 2,991,328 | |
u2017-HQA1, M2, FRN, 5.342%, 8/25/29 | | United States | | 1,180,000 | | | | | 1,240,378 | |
f,v Flagship CLO VIII Ltd., 2014-8A, ARR, 144A, FRN, 2.851%, (3-month USD LIBOR + 0.85%), 1/16/26 | | United States | | 379,761 | | | | | 379,826 | |
FNMA Connecticut Avenue Securities, | | | | | | | | | | |
v2013-C01, M2, FRN, 7.042%, (1-month USD LIBOR + 5.25%), 10/25/23 | | United States | | 306,249 | | | | | 338,238 | |
v2014-C01, M2, FRN, 6.192%, (1-month USD LIBOR + 4.40%), 1/25/24 | | United States | | 473,305 | | | | | 514,725 | |
v2014-C02, 1M2, FRN, 4.392%, (1-month USD LIBOR + 2.60%), 5/25/24 | | United States | | 1,302,284 | | | | | 1,357,073 | |
v2014-C02, 2M2, FRN, 4.392%, (1-month USD LIBOR + 2.60%), 5/25/24 | | United States | | 647,643 | | | | | 671,647 | |
v2014-C03, 1M2, FRN, 4.792%, (1-month USD LIBOR + 3.00%), 7/25/24 | | United States | | 2,628,407 | | | | | 2,766,834 | |
v2014-C03, 2M2, FRN, 4.692%, (1-month USD LIBOR + 2.90%), 7/25/24 | | United States | | 127,124 | | | | | 132,577 | |
v2015-C01, 1M2, FRN, 6.092%, (1-month USD LIBOR + 4.30%), 2/25/25 | | United States | | 835,466 | | | | | 890,164 | |
v2015-C01, 2M2, FRN, 6.342%, (1-month USD LIBOR + 4.55%), 2/25/25 | | United States | | 681,652 | | | | | 708,773 | |
v2015-C02, 1M2, FRN, 5.792%, (1-month USD LIBOR + 4.00%), 5/25/25 | | United States | | 1,845,428 | | | | | 1,959,498 | |
v2015-C02, 2M2, FRN, 5.792%, (1-month USD LIBOR + 4.00%), 5/25/25 | | United States | | 820,182 | | | | | 850,373 | |
v2015-C03, 1M2, FRN, 6.792%, (1-month USD LIBOR + 5.00%), 7/25/25 | | United States | | 2,698,239 | | | | | 2,940,097 | |
v2015-C03, 2M2, FRN, 6.792%, (1-month USD LIBOR + 5.00%), 7/25/25 | | United States | | 1,206,175 | | | | | 1,282,364 | |
u2016-C02, 1M2, FRN, 7.792%, 9/25/28 | | United States | | 752,065 | | | | | 828,231 | |
u2016-C04, 1M2, FRN, 6.042%, 1/25/29 | | United States | | 1,590,000 | | | | | 1,691,926 | |
u2016-C05, 2M2, FRN, 6.242%, 1/25/29 | | United States | | 1,491,681 | | | | | 1,577,138 | |
u2016-C06, 1M2, FRN, 6.042%, 4/25/29 | | United States | | 440,000 | | | | | 472,998 | |
u2016-C07, 2M2, FRN, 6.142%, 5/25/29 | | United States | | 981,320 | | | | | 1,035,636 | |
v2017-C01, 1M2, FRN, 5.342%, (1-month USD LIBOR + 3.55%), 7/25/29 | | United States | | 1,858,000 | | | | | 1,967,845 | |
u2017-C03, 1M2, FRN, 4.792%, 10/25/29 | | United States | | 2,720,000 | | | | | 2,843,996 | |
u2017-C03, 2M2, FRN, 4.642%, 11/25/29 | | United States | | 450,000 | | | | | 465,777 | |
u2017-C05, 1M2, FRN, 3.992%, 1/25/30 | | United States | | 1,020,000 | | | | | 1,038,371 | |
fGalaxy XVIII CLO Ltd., | | | | | | | | | | |
u2018-28A, A2, 144A, FRN, 3.071%, 7/15/31 | | United States | | 900,000 | | | | | 899,010 | |
v2018-28A, C, 144A, FRN, 3.951%, (3-month USD LIBOR + 1.95%), 7/15/31 | | United States | | 250,000 | | | | | 238,475 | |
FRANKLIN TEMPLETON VARIABLE INSURANCE PRODUCTS TRUST
CONSOLIDATED STATEMENT OF INVESTMENTS
Franklin Strategic Income VIP Fund(continued)
| | | | | | | | | | |
| | | Country/
Organization | | Principal
Amount* | | | | Value | |
| | | | |
Asset-Backed Securities and Commercial Mortgage-Backed Securities(continued) | | | | | | | | | | |
Diversified Financials(continued) | | | | | | | | | | |
f,u Galaxy XXVI CLO Ltd., 2018-26A, A, 144A, FRN, 3.099%, 11/22/31 | | United States | | 700,000 | | | | $ | 697,935 | |
f,v Galaxy XXVII CLO Ltd., 2018-27A, C, 144A, FRN, 3.704%, (3-month USD LIBOR + 1.80%), 5/16/31 | | United States | | 400,000 | | | | | 383,988 | |
GS Mortgage Securities Trust, | | | | | | | | | | |
u2016-GS3, B, FRN, 3.395%, 10/10/49 | | United States | | 728,000 | | | | | 745,019 | |
2017-GS6, B, 3.869%, 5/10/50 | | United States | | 704,000 | | | | | 739,589 | |
f,v LCM 26 Ltd., 26A, B, 144A, FRN, 3.366%, (3-month USD LIBOR + 1.40%), 1/20/31 | | United States | | 250,000 | | | | | 242,533 | |
f,u LCM XVI LP, 2016A, BR2, 144A, FRN, 3.751%, 10/15/31 | | United States | | 351,320 | | | | | 350,400 | |
f,u LCM XVII LP, | | | | | | | | | | |
2017A, BRR, 144A, FRN, 3.601%, 10/15/31 | | United States | | 350,000 | | | | | 342,874 | |
2017A, CRR, 144A, FRN, 4.101%, 10/15/31 | | United States | | 320,000 | | | | | 305,683 | |
f,v LCM XVIII LP, 2018A, DR, 144A, FRN, 4.766%, (3-month USD LIBOR + 2.80%), 4/20/31 | | United States | | 770,000 | | | | | 718,726 | |
f,v LCM XXIV Ltd., 24A, A, 144A, FRN, 3.276%, (3-month USD LIBOR + 1.31%), 3/20/30 | | United States | | 480,000 | | | | | 481,680 | |
f,u Madison Park Euro Funding VIII DAC, | | | | | | | | | | |
8A, ARN, 144A, FRN, 0.95%, 4/15/32 | | Ireland | | 2,700,000 | | EUR | | | 3,025,222 | |
8A, BRN, 144A, FRN, 1.70%, 4/15/32 | | Ireland | | 400,000 | | EUR | | | 448,197 | |
f,u Madison Park Euro Funding XIV DAC, 2014A, A1N, 144A, FRN, 1.12%, 7/15/32 | | Ireland | | 1,000,000 | | EUR | | | 1,126,089 | |
f,v Madison Park Funding XXIII Ltd., | | | | | | | | | | |
2017-23A, B, 144A, FRN, 3.636%, (3-month USD LIBOR + 1.70%), 7/27/30 | | United States | | 400,000 | | | | | 399,828 | |
2017-23A, C, 144A, FRN, 4.286%, (3-month USD LIBOR + 2.35%), 7/27/30 | | United States | | 500,000 | | | | | 500,360 | |
f,u Mill City Mortgage Loan Trust, 2018-4, A1B, 144A, FRN, 3.50%, 4/25/66 | | United States | | 1,470,000 | | | | | 1,507,168 | |
vMortgageIT Trust, 2004-1, A2, FRN, 2.692%, (1-month USD LIBOR + 0.90%), 11/25/34 | | United States | | 114,163 | | | | | 115,219 | |
f,u Mountain View Funding CLO XIV Ltd., | | | | | | | | | | |
2019-1A, A1, 144A, FRN, 3.441%, 4/15/29 | | United States | | 500,000 | | | | | 501,025 | |
2019-1A, C, 144A, FRN, 4.901%, 4/15/29 | | United States | | 500,000 | | | | | 500,485 | |
f,v NZCG Funding Ltd., 2015-1A, A2R, 144A, FRN, 3.467%, (3-month USD LIBOR + 1.55%), 2/26/31 | | United States | | 2,182,000 | | | | | 2,144,928 | |
f,u Octagon Investment Partners 24 Ltd., 2015-1A, BS, 144A, FRN, 3.866%, 4/21/31 | | United States | | 390,000 | | | | | 389,965 | |
f,u Octagon Investment Partners 28 Ltd., 2016-1A, BR, 144A, FRN, 3.736%, 10/24/30 | | United States | | 250,000 | | | | | 250,557 | |
f,v Octagon Investment Partners 30 Ltd., 144A, FRN, 3.286%, (3-month USD LIBOR + 1.32%), 3/17/30 | | United States | | 480,000 | | | | | 480,197 | |
f,v Octagon Investment Partners 36 Ltd., 2018-1A, A1, 144A, FRN, 2.971%, (3-month USD LIBOR + 0.97%), 4/15/31 | | United States | | 500,000 | | | | | 496,385 | |
f,v Octagon Investment Partners 37 Ltd., 2018-2A, C, 144A, FRN, 4.79%, (3-month USD LIBOR + 2.85%), 7/25/30 | | United States | | 400,000 | | | | | 380,644 | |
f,u Octagon Investment Partners 38 Ltd., 2018-1A, C, 144A, FRN, 4.916%, 7/20/30 | | United States | | 1,000,000 | | | | | 963,410 | |
f,v Octagon Investment Partners XVI Ltd., 2013-1A, DR, 144A, FRN, 5.002%, (3-month USD LIBOR + 3.00%), 7/17/30 | | United States | | 400,000 | | | | | 382,776 | |
FRANKLIN TEMPLETON VARIABLE INSURANCE PRODUCTS TRUST
CONSOLIDATED STATEMENT OF INVESTMENTS
Franklin Strategic Income VIP Fund(continued)
| | | | | | | | | | |
| | | Country/
Organization | | Principal
Amount* | | | | Value | |
Asset-Backed Securities and Commercial Mortgage-Backed Securities(continued) | | | | | | | | | | |
Diversified Financials(continued) | | | | | | | | | | |
f,v Octagon Investment Partners XXIII Ltd., 2015-1A, BR, 144A, FRN, 3.201%, (3-month USD LIBOR + 1.20%), 7/15/27 | | United States | | 400,000 | | | | $ | 393,652 | |
vOpteum Mortgage Acceptance Corp. Trust, 2005-4, 1APT, FRN, 2.102%, (1-month USD LIBOR + 0.31%), 11/25/35 | | United States | | 135,852 | | | | | 136,677 | |
f,u Provident Funding Mortgage Trust, 2019-1, A2, 144A, FRN, 3.00%, 12/25/49 | | United States | | 968,477 | | | | | 976,005 | |
f,v Race Point IX CLO Ltd., 2015-9A, A1AR, 144A, FRN, 3.211%, (3-month USD LIBOR + 1.21%), 10/15/30 | | United States | | 400,000 | | | | | 399,740 | |
f,u Strata CLO I Ltd., 2018-1A, B, 144A, FRN, 4.201%, 1/15/31 | | United States | | 1,300,000 | | | | | 1,298,063 | |
vStructured Asset Securities Corp., 2005-2XS, 2A2, FRN, 3.191%, (1-month USD LIBOR + 1.50%), 2/25/35 | | United States | | 134,890 | | | | | 136,479 | |
uThornburg Mortgage Securities Trust, 2005-1, A3, FRN, 4.459%, 4/25/45 | | United States | | 99,235 | | | | | 99,731 | |
fUpgrade Master Pass-Thru Trust, 2019-PT2, A, 144A, 4.846%, 2/15/26 | | United States | | 604,538 | | | | | 607,509 | |
fVoya CLO Ltd., | | | | | | | | | | |
v2013-2A, BR, 144A, FRN, 3.79%, (3-month USD LIBOR + 1.85%), 4/25/31 | | United States | | 780,000 | | | | | 746,281 | |
v2014-1A, CR2, 144A, FRN, 4.803%, (3-month USD LIBOR + 2.80%), 4/18/31 | | United States | | 1,000,000 | | | | | 946,490 | |
u2015-2A, BR, 144A, FRN, 3.434%, 7/23/27 | | United States | | 820,000 | | | | | 813,612 | |
u2016-3A, A1R, 144A, FRN, 3.193%, 10/18/31 | | United States | | 900,000 | | | | | 899,073 | |
v2017-2A, B, 144A, FRN, 4.351%, (3-month USD LIBOR + 2.35%), 6/07/30 | | United States | | 1,455,000 | | | | | 1,440,886 | |
u2018-2A, A1, 144A, FRN, 3.001%, 7/15/31 | | United States | | 400,000 | | | | | 397,900 | |
| | | | | | | | | | |
| | | | |
| | | | | | | | | 118,195,856 | |
| | | | |
Total Asset-Backed Securities and Commercial Mortgage-Backed Securities (Cost $121,391,817) | | | | | | | | | 119,962,933 | |
| | | | | | | | | | |
| | | | |
Mortgage-Backed Securities 8.2% | | | | | | | | | | |
wFederal Home Loan Mortgage Corp. (FHLMC) Adjustable Rate 0.0%† | | | | | | | | | | |
FHLMC, 4.973%, (US 1 Year CMT T-Note +/- MBS Margin), 1/01/33 | | United States | | 5,515 | | | | | 5,651 | |
| | | | | | | | | | |
Federal Home Loan Mortgage Corp. (FHLMC) Fixed Rate 2.2% | | | | | | | | | | |
FHLMC 30 Year, 2.50%, 10/01/49 | | United States | | 1,199,881 | | | | | 1,186,329 | |
xFHLMC 30 Year, 2.50%, 12/01/49 | | United States | | 1,000,000 | | | | | 988,272 | |
xFHLMC 30 Year, 3.00%, 12/01/49 | | United States | | 6,900,000 | | | | | 6,994,048 | |
FHLMC Gold 30 Year, 5.00%, 4/01/34 - 8/01/35 | | United States | | 187,595 | | | | | 206,790 | |
FHLMC Gold 30 Year, 5.50%, 3/01/33 - 1/01/35 | | United States | | 132,684 | | | | | 145,523 | |
FHLMC Gold 30 Year, 6.00%, 4/01/33 - 2/01/36 | | United States | | 84,923 | | | | | 95,682 | |
FHLMC Gold 30 Year, 6.50%, 11/01/27 - 7/01/32 | | United States | | 16,326 | | | | | 18,145 | |
FHLMC Gold 30 Year, 7.00%, 9/01/21 - 4/01/30 | | United States | | 5,441 | | | | | 5,756 | |
FHLMC Gold 30 Year, 7.50%, 8/01/30 | | United States | | 168 | | | | | 197 | |
| | | | | | | | | | |
| | | | |
| | | | | | | | | 9,640,742 | |
wFederal National Mortgage Association (FNMA) Adjustable Rate 0.0%† | | | | | | | | | | |
FNMA, 4.031%, (US 1 Year CMT T-Note +/- MBS Margin), 12/01/34 | | United States | | 66,345 | | | | | 70,179 | |
| | | | | | | | | | |
FRANKLIN TEMPLETON VARIABLE INSURANCE PRODUCTS TRUST
CONSOLIDATED STATEMENT OF INVESTMENTS
Franklin Strategic Income VIP Fund(continued)
| | | | | | | | | | |
| | | Country/
Organization | | Principal
Amount* | | | | Value | |
| | | | |
Mortgage-Backed Securities(continued) | | | | | | | | | | |
Federal National Mortgage Association (FNMA) Fixed Rate 3.4% | | | | | | | | | | |
FNMA 15 Year, 2.50%, 7/01/22 - 12/01/34 | | United States | | 1,959,415 | | | | $ | 1,977,337 | |
FNMA 15 Year, 4.50%, 3/01/20 | | United States | | 71 | | | | | 73 | |
FNMA 30 Year, 3.00%, 9/01/48 | | United States | | 3,262,385 | | | | | 3,339,904 | |
FNMA 30 Year, 3.00%, 11/01/48 | | United States | | 4,034,736 | | | | | 4,125,001 | |
FNMA 30 Year, 4.50%, 5/01/48 | | United States | | 4,874,251 | | | | | 5,229,999 | |
FNMA 30 Year, 5.00%, 4/01/30 | | United States | | 41,287 | | | | | 44,452 | |
FNMA 30 Year, 6.50%, 6/01/28 - 10/01/37 | | United States | | 107,922 | | | | | 122,128 | |
| | | | | | | | | | |
| | | | | | | | | 14,838,894 | |
| | | | | | | | | | |
Government National Mortgage Association (GNMA) Fixed Rate 2.6% | | | | | | | | | | |
GNMA I SF 30 Year, 5.00%, 11/15/33 - 7/15/34 | | United States | | 173,744 | | | | | 191,842 | |
GNMA I SF 30 Year, 7.00%, 10/15/28 - 6/15/32 | | United States | | 13,403 | | | | | 13,530 | |
GNMA I SF 30 Year, 7.50%, 9/15/30 | | United States | | 1,128 | | | | | 1,305 | |
GNMA II SF 30 Year, 3.50%, 11/20/49 | | United States | | 4,280,954 | | | | | 4,435,803 | |
xGNMA II SF 30 Year, 3.50%, 12/01/49 | | United States | | 1,700,000 | | | | | 1,751,875 | |
GNMA II SF 30 Year, 3.50%, 12/20/49 | | United States | | 4,410,000 | | | | | 4,569,519 | |
GNMA II SF 30 Year, 5.00%, 9/20/33 - 11/20/33 | | United States | | 46,411 | | | | | 51,367 | |
GNMA II SF 30 Year, 6.00%, 11/20/34 | | United States | | 63,518 | | | | | 73,398 | |
GNMA II SF 30 Year, 6.50%, 4/20/31 - 2/20/34 | | United States | | 32,805 | | | | | 37,413 | |
GNMA II SF 30 Year, 7.50%, 1/20/28 - 4/20/32 | | United States | | 8,347 | | | | | 9,431 | |
| | | | | | | | | | |
| | | | | | | | | 11,135,483 | |
| | | | | | | | | | |
| | | | |
Total Mortgage-Backed Securities (Cost $35,223,310) | | | | | | | | | 35,690,949 | |
| | | | | | | | | | |
| | | | |
Municipal Bonds 4.3% | | | | | | | | | | |
Birmingham Water Works Board Water Revenue, Senior, Refunding, 3.573%, 1/01/45 | | United States | | 1,145,000 | | | | | 1,159,748 | |
Board of Regents of the Texas A & M University System Revenue, Permanent University Fund, Refunding, 3.10%, 7/01/49 | | United States | | 765,000 | | | | | 746,280 | |
Broward County Airport System Revenue, Refunding, Series C, 3.477%, 10/01/43 | | United States | | 310,000 | | | | | 311,634 | |
California Health Facilities Financing Authority Revenue, | | | | | | | | | | |
Senior, 2.934%, 6/01/32 | | United States | | 295,000 | | | | | 294,298 | |
Senior, 2.984%, 6/01/33 | | United States | | 250,000 | | | | | 248,272 | |
Senior, 3.034%, 6/01/34 | | United States | | 190,000 | | | | | 188,594 | |
City of Austin Electric Utility System Revenue, Travis and Williamson Counties, Refunding, 6.262%, 11/15/32 | | United States | | 580,000 | | | | | 717,083 | |
Foothill/Eastern Transportation Corridor Agency Toll Road Revenue, Refunding, Series A, 4.094%, 1/15/49 | | United States | | 150,000 | | | | | 150,000 | |
Gilroy USD, GO, Santa Clara County, Refunding, 3.364%, 8/01/47 | | United States | | 630,000 | | | | | 618,528 | |
Greenville City School District GO, County of Darke, School Improvement, Refunding, 3.541%, 1/01/51 | | United States | | 715,000 | | | | | 701,458 | |
Honolulu City and County Wastewater System Revenue, Second Bond Resolution, Refunding, Junior, Series B, 2.585%, 7/01/28 | | United States | | 115,000 | | | | | 116,786 | |
Kaiser Foundation Hospitals, 3.266%, 11/01/49 | | United States | | 955,000 | | | | | 961,232 | |
Massachusetts State College Building Authority Revenue, Refunding, Series C, 3.373%, 5/01/43 | | United States | | 500,000 | | | | | 493,260 | |
FRANKLIN TEMPLETON VARIABLE INSURANCE PRODUCTS TRUST
CONSOLIDATED STATEMENT OF INVESTMENTS
Franklin Strategic Income VIP Fund(continued)
| | | | | | | | | | |
| | | Country/
Organization | | Principal
Amount* | | | | Value | |
| | | | |
Municipal Bonds(continued) | | | | | | | | | | |
Massachusetts State School Building Authority Dedicated Sales Tax Revenue, Subordinated, Refunding, Series B, 3.395%, 10/15/40 | | United States | | 575,000 | | | | $ | 575,368 | |
Metro Wastewater Reclamation District Sewer Revenue, Refunding, Series B, 3.158%, 4/01/41 | | United States | | 475,000 | | | | | 471,566 | |
Metropolitan St. Louis Sewer District Wastewater System Revenue, Refunding, Series C, 3.259%, 5/01/45 | | United States | | 1,375,000 | | | | | 1,376,581 | |
New Jersey State Transportation Trust Fund Authority Revenue, Transportation System, Series B, 4.131%, 6/15/42 | | United States | | 345,000 | | | | | 342,688 | |
New York State Dormitory Authority Revenues, Non State Supported Debt, State University of New York Dormitory Facilities, Series B, 3.142%, 7/01/43 | | United States | | 305,000 | | | | | 302,795 | |
New York State GO, Refunding, Series B, 3.20%, 2/15/39 | | United States | | 1,140,000 | | | | | 1,141,254 | |
New York State Urban Development Corp. Sales Tax Revenue, Bidding Group 2, Series B, 2.97%, 3/15/34 | | United States | | 1,865,000 | | | | | 1,862,072 | |
Ohio State Hospital Facility Revenue, Cleveland Clinic Health System Obligated Group, Refunding, Series G, 3.276%, 1/01/42 | | United States | | 190,000 | | | | | 191,233 | |
Oregon State Department of Transportation Highway User Tax Revenue, senior lien, Refunding, Series B, 3.168%, 11/15/38 | | United States | | 380,000 | | | | | 378,902 | |
Orlando Health Obligated Group, 3.777%, 10/01/28 | | United States | | 330,000 | | | | | 350,506 | |
Pennsylvania State Turnpike Commission Turnpike Revenue, Motor License Fund-Enhanced, Subordinate, Refunding, First Series, 3.579%, 12/01/43 | | United States | | 955,000 | | | | | 953,854 | |
Regional Transportation District Sales Tax Revenue, Fastracks Project, Refunding, Series A, 3.258%, 11/01/38 | | United States | | 305,000 | | | | | 305,485 | |
RWJ Barnabas Health Inc., 3.477%, 7/01/49 | | United States | | 255,000 | | | | | 251,844 | |
Salt Lake City Sales and Excise Tax Revenue, Refunding, Series B, 3.102%, 4/01/38 | | United States | | 270,000 | | | | | 264,354 | |
San Bernardino Community College District GO, Election of 2018, Series A-1, 3.271%, 8/01/39 | | United States | | 210,000 | | | | | 207,877 | |
San Diego County Regional Transportation Commission Revenue, Refunding, 3.248%, 4/01/48 | | United States | | 230,000 | | | | | 230,306 | |
ySan Francisco City and County Public Utilities Commission Water Revenue, Refunding, 3.473%, 11/01/43 | | United States | | 230,000 | | | | | 229,936 | |
San Jose RDA Successor Agency Tax Allocation, Senior, Refunding, Series A-T, 3.25%, 8/01/29 | | United States | | 440,000 | | | | | 456,953 | |
Texas State GO, Transportation Commission, Highway Improvement, Refunding, 3.211%, 4/01/44 | | United States | | 575,000 | | | | | 581,204 | |
Texas State University System Financing Revenue, | | | | | | | | | | |
Refunding, Series B, 2.938%, 3/15/33 | | United States | | 225,000 | | | | | 226,175 | |
Refunding, Serise B, 3.289%, 3/15/40 | | United States | | 190,000 | | | | | 188,180 | |
University of Pittsburgh of the Commonwealth System of Higher Education Revenue, Refunding, Series C, 3.005%, 9/15/41 | | United States | | 535,000 | | | | | 524,648 | |
Utah Transit Authority Sales Tax Revenue, Refunding, Series B, 3.443%, 12/15/42 | | United States | | 380,000 | | | | | 386,123 | |
| | | | | | | | | | |
| | | | |
Total Municipal Bonds (Cost $18,483,375) | | | | | | | | | 18,507,077 | |
| | | | | | | | | | |
FRANKLIN TEMPLETON VARIABLE INSURANCE PRODUCTS TRUST
CONSOLIDATED STATEMENT OF INVESTMENTS
Franklin Strategic Income VIP Fund(continued)
| | | | | | | | | | |
| | | Country/
Organization | | Shares/
Units | | | | Value | |
| | | | |
Escrows and Litigation Trusts 0.0%† | | | | | | | | | | |
a,b Clear Channel Communications Inc., Escrow Account | | United States | | 485,000 | | | | $ | — | |
a,b iHeartCommunications Inc., Escrow Account | | United States | | 324,000 | | | | | — | |
a,b,d Remington Outdoor Co. Inc., Litigation Units | | United States | | 7,021 | | | | | — | |
a,b T-Mobile USA Inc., Escrow Account | | United States | | 1,654,665 | | | | | — | |
aVistra Energy Corp., Escrow Account | | United States | | 3,000,000 | | | | | 6,000 | |
| | | | | | | | | | |
| | | | |
Total Escrows and Litigation Trusts (Cost $82,648) | | | | | | | | | 6,000 | |
| | | | | | | | | | |
| | | | |
Total Investments before Short Term Investments (Cost $430,820,497) | | | | | | | | | 422,345,307 | |
| | | | | | | | | | |
| | | | |
| | | | | Shares | | | | | |
| | | | |
Short Term Investments (Cost $11,463,714) 2.7% | | | | | | | | | | |
| | | | |
Money Market Funds 2.7% | | | | | | | | | | |
e,z Institutional Fiduciary Trust Money Market Portfolio, 1.26% | | United States | | 11,463,714 | | | | | 11,463,714 | |
| | | | | | | | | | |
| | | | |
Total Investments (Cost $442,284,211) 99.8% | | | | | | | | | 433,809,021 | |
| | | | |
Other Assets, less Liabilities 0.2% | | | | | | | | | 1,041,105 | |
| | | | | | | | | | |
| | | | |
Net Assets 100.0% | | | | | | | | $ | 434,850,126 | |
| | | | | | | | | | |
FRANKLIN TEMPLETON VARIABLE INSURANCE PRODUCTS TRUST
CONSOLIDATED STATEMENT OF INVESTMENTS
Franklin Strategic Income VIP Fund(continued)
†Rounds to less than 0.1% of net assets.
*The principal amount is stated in U.S. dollars unless otherwise indicated.
aNon-income producing.
bFair valued using significant unobservable inputs. See Note 12 regarding fair value measurements.
cThe security is owned by FT Holdings Corporation III, a wholly-owned subsidiary of the Fund. See Note 1(g).
dSee Note 8 regarding restricted securities.
eSee Note 3(e) regarding investments in affiliated management investment companies.
fSecurity was purchased pursuant to Rule 144A under the Securities Act of 1933 and may be sold in transactions exempt from registration only to qualified institutional buyers or in a public offering registered under the Securities Act of 1933. At December 31, 2019, the aggregate value of these securities was $153,934,036, representing 35.4% of net assets.
gSecurity was purchased pursuant to Regulation S under the Securities Act of 1933, which exempts from registration securities offered and sold outside of the United States. Such a security cannot be sold in the United States without either an effective registration statement filed pursuant to the Securities Act of 1933, or pursuant to an exemption from registration. At December 31, 2019, the aggregate value of these securities was $14,612,775, representing 3.4% of net assets.
hPerpetual security with no stated maturity date.
iIncome may be received in additional securities and/or cash.
jSee Note 1(f) regarding loan participation notes.
kSee Note 7 regarding defaulted securities.
lThe coupon rate shown represents the rate at period end.
mSee Note 1(i) regarding senior floating rate interests.
nSecurity purchased on a delayed delivery basis. See Note 1(c).
oA portion or all of the security represents an unsettled loan commitment. The coupon rate is to-be determined (TBD) at the time of settlement and will be based upon a reference index/floor plus a spread.
pA supranational organization is an entity formed by two or more central governments through international treaties.
qPrincipal amount is stated in 100 Mexican Peso Units.
rThe principal represents the notional amount. See Note 1(d) regarding value recovery instruments.
sPrincipal amount of security is adjusted for inflation. See Note 1(k).
tPrincipal amount is stated in 1,000 Brazilian Real Units.
uAdjustable rate security with an interest rate that is not based on a published reference index and spread. The rate is based on the structure of the agreement and current market conditions. The coupon rate shown represents the rate at period end.
vThe coupon rate shown represents the rate inclusive of any caps or floors, if applicable, in effect at period end.
wAdjustable Rate Mortgage-Backed Security (ARM); the rate shown is the effective rate at period end. ARM rates are not based on a published reference rate and spread, but instead pass-through weighted average interest income inclusive of any caps or floors, if applicable, from the underlying mortgage loans in which the majority of mortgages pay interest based on the index shown at their designated reset dates plus a spread, less the applicable servicing and guaranty fee (MBS margin).
xSecurity purchased on a to-be-announced (TBA) basis. See Note 1(c).
ySecurity purchased on a when-issued basis. See Note 1(c).
zThe rate shown is the annualized seven-day effective yield at period end.
At December 31, 2019, the Fund had the following futures contracts outstanding. See Note 1(d).
Futures Contracts
| | | | | | | | | | | | | | | | | | | | |
| Description | | Type | | | Number of
Contracts | | | Notional
Amount* | | | Expiration
Date | | | Value/
Unrealized
Appreciation
(Depreciation) | |
| | | | | |
Interest Rate Contracts | | | | | | | | | | | | | | | | | | | | |
| | | | | |
Australian 10 Yr. Bond | | | Long | | | | 77 | | | $ | 7,723,607 | | | | 3/16/20 | | | | $(109,738 | ) |
Canada 10 Yr. Bond | | | Long | | | | 54 | | | | 5,716,864 | | | | 3/20/20 | | | | (106,114 | ) |
Euro-BTP | | | Long | | | | 44 | | | | 7,029,518 | | | | 3/06/20 | | | | 27,201 | |
Euro-OAT | | | Short | | | | 36 | | | | 6,571,383 | | | | 3/06/20 | | | | 47,968 | |
U.S. Treasury 5 Yr. Note | | | Long | | | | 60 | | | | 7,116,562 | | | | 3/31/20 | | | | (22,576 | ) |
| | | | | | | | | | | | | | | | | | | | |
| | | | | |
Total Futures Contracts | | | | | | | | | | | | | | | | | | | $(163,259 | ) |
| | | | | | | | | | | | | | | | | | | | |
*As of period end.
FRANKLIN TEMPLETON VARIABLE INSURANCE PRODUCTS TRUST
CONSOLIDATED STATEMENT OF INVESTMENTS
Franklin Strategic Income VIP Fund(continued)
At December 31, 2019, the Fund had the following forward exchange contracts outstanding. See Note 1(d).
Forward Exchange Contracts
| | | | | | | | | | | | | | | | | | | | | | | | | | | | |
| Currency | | Counterpartya | | | Type | | | Quantity | | | Contract Amount | | | Settlement
Date | | | Unrealized
Appreciation | | | Unrealized
Depreciation | |
| | | | |
OTC Forward Exchange Contracts | | | | | | | | | | | | | | | | | |
Australian Dollar | | | JPHQ | | | | Buy | | | | 2,200,000 | | | $ | 1,516,488 | | | | 1/09/20 | | | $ | 27,502 | | | $ | — | |
Australian Dollar | | | JPHQ | | | | Sell | | | | 3,200,000 | | | | 2,159,312 | | | | 1/09/20 | | | | — | | | | (86,492 | ) |
Canadian Dollar | | | JPHQ | | | | Buy | | | | 500,000 | | | | 380,134 | | | | 1/21/20 | | | | 4,940 | | | | — | |
Canadian Dollar | | | JPHQ | | | | Sell | | | | 4,000,000 | | | | 3,064,711 | | | | 1/21/20 | | | | — | | | | (15,874 | ) |
Australian Dollar | | | JPHQ | | | | Sell | | | | 2,710,000 | | | | 1,843,242 | | | | 1/28/20 | | | | — | | | | (59,610 | ) |
Australian Dollar | | | JPHQ | | | | Sell | | | | 3,050,000 | | | | 2,147,468 | | | | 1/28/20 | | | | 5,882 | | | | — | |
Japanese Yen | | | JPHQ | | | | Buy | | | | 1,521,800,000 | | | | 14,421,093 | | | | 1/29/20 | | | | — | | | | (394,867 | ) |
Canadian Dollar | | | JPHQ | | | | Buy | | | | 200,000 | | | | 151,136 | | | | 1/30/20 | | | | 2,901 | | | | — | |
Canadian Dollar | | | JPHQ | | | | Sell | | | | 2,300,000 | | | | 1,733,011 | | | | 1/30/20 | | | | — | | | | (38,411 | ) |
Euro | | | JPHQ | | | | Sell | | | | 4,176,907 | | | | 4,690,090 | | | | 1/30/20 | | | | — | | | | (3,129 | ) |
Euro | | | JPHQ | | | | Sell | | | | 5,824,713 | | | | 6,587,653 | | | | 1/30/20 | | | | 42,941 | | | | — | |
Mexican Peso | | | JPHQ | | | | Sell | | | | 1,700,000 | | | | 87,568 | | | | 1/30/20 | | | | — | | | | (1,852 | ) |
Norwegian Krone | | | JPHQ | | | | Buy | | | | 26,200,000 | | | | 2,911,474 | | | | 1/30/20 | | | | 73,849 | | | | — | |
Australian Dollar | | | JPHQ | | | | Sell | | | | 1,350,000 | | | | 924,811 | | | | 2/11/20 | | | | — | | | | (23,417 | ) |
Chinese Yuan Renminbi | | | JPHQ | | | | Sell | | | | 60,750,000 | | | | 8,510,610 | | | | 2/24/20 | | | | — | | | | (204,805 | ) |
Brazilian Real | | | JPHQ | | | | Sell | | | | 1,600,000 | | | | 386,591 | | | | 3/04/20 | | | | — | | | | (10,503 | ) |
South Korean Won | | | JPHQ | | | | Sell | | | | 1,700,000,000 | | | | 1,431,181 | | | | 3/04/20 | | | | — | | | | (41,600 | ) |
Indonesian Rupiah | | | JPHQ | | | | Sell | | | | 7,200,000,000 | | | | 504,414 | | | | 3/05/20 | | | | — | | | | (13,200 | ) |
Japanese Yen | | | JPHQ | | | | Buy | | | | 57,100,000 | | | | 523,951 | | | | 3/13/20 | | | | 3,662 | | | | — | |
Japanese Yen | | | JPHQ | | | | Buy | | | | 420,000,000 | | | | 3,940,793 | | | | 3/13/20 | | | | — | | | | (59,925 | ) |
Canadian Dollar | | | JPHQ | | | | Sell | | | | 1,500,000 | | | | 1,139,473 | | | | 3/16/20 | | | | — | | | | (15,924 | ) |
Euro | | | DBAB | | | | Sell | | | | 650,000 | | | | 728,683 | | | | 3/16/20 | | | | — | | | | (3,750 | ) |
Euro | | | JPHQ | | | | Sell | | | | 12,100,083 | | | | 13,500,153 | | | | 3/16/20 | | | | — | | | | (134,460 | ) |
Norwegian Krone | | | JPHQ | | | | Buy | | | | 39,200,000 | | | | 4,377,443 | | | | 3/16/20 | | | | 89,535 | | | | — | |
Swedish Krona | | | JPHQ | | | | Buy | | | | 27,800,000 | | | | 2,836,315 | | | | 3/16/20 | | | | 142,688 | | | | — | |
Swedish Krona | | | JPHQ | | | | Sell | | | | 27,800,000 | | | | 2,922,808 | | | | 3/16/20 | | | | — | | | | (56,195 | ) |
New Zealand Dollar | | | JPHQ | | | | Sell | | | | 3,000,000 | | | | 1,980,941 | | | | 3/19/20 | | | | — | | | | (40,224 | ) |
Turkish Lira | | | JPHQ | | | | Buy | | | | 5,800,000 | | | | 919,686 | | | | 4/15/20 | | | | 29,141 | | | | — | |
Mexican Peso | | | JPHQ | | | | Buy | | | | 1,300,000 | | | | 66,117 | | | | 6/16/20 | | | | 901 | | | | — | |
| | | | | | | | | | | | | | | | | | | | | | | | |
| | | | |
Total Forward Exchange Contracts | | | | | | | | | | | | $ 423,942 | | | $ | (1,204,238 | ) |
| | | | | | | | | | | | | | | | | | | | | | | | |
| | | | |
Net unrealized appreciation (depreciation) | | | | | | | | | | | | | | | $ | (780,296 | ) |
| | | | | | | | | | | | | | | | | | | | | | | | | | | | |
aMay be comprised of multiple contracts with the same counterparty, currency and settlement date.
FRANKLIN TEMPLETON VARIABLE INSURANCE PRODUCTS TRUST
CONSOLIDATED STATEMENT OF INVESTMENTS
Franklin Strategic Income VIP Fund(continued)
At December 31, 2019, the Fund had the following credit default swap contracts outstanding. See Note 1(d).
Credit Default Swap Contracts
| | | | | | | | | | | | | | | | | | | | | | | | | | | | | | | | | | | | |
| Description | | Periodic Payment Rate Received (Paid) | | | Payment Frequency | | | Counter- party | | | Maturity Date | | | Notional Amounta | | | Value | | | Unamortized Upfront Payments (Receipts) | | | Unrealized Appreciation (Depreciation) | | | Ratingb | |
| | | | | | | | |
Centrally Cleared Swap Contracts | | | | | | | | | | | | | | | | | | | | | | | | | | | | | | | | | |
| | | | | | | | |
Contracts to Sell Protectionc,d | | | | | | | | | | | | | | | | | | | | | | | | | | | | | | | | | |
| | | | | | | | | |
Traded Index | | | | | | | | | | | | | | | | | | | | | | | | | | | | | | | | | | | | |
CDX.EM.31 | | | 1.00 | % | | | Quarterly | | | | | | | | 6/20/24 | | | $ | 4,500,000 | | | $ | (117,781 | ) | | $ | (105,369 | ) | | $ | (12,412 | ) | |
| Investment
Grade |
|
| | | | | | | | | | | | | | | | | | | | | | | | | | | | |
| | | | | | | | |
OTC Swap Contracts | | | | | | | | | | | | | | | | | | | | | | | | | | | | | | | | | |
| | | | | | | | |
Contracts to Buy Protectionc | | | | | | | | | | | | | | | | | | | | | | | | | | | | | | | | | |
| | | | | | | | | |
Single Name | | | | | | | | | | | | | | | | | | | | | | | | | | | | | | | | | | | | |
Ally Financial Inc. | | | (5.00 | )% | | | Quarterly | | | | JPHQ | | | | 12/20/24 | | | $ | 1,810,000 | | | $ | (366,933 | ) | | $ | (336,411 | ) | | $ | (30,522 | ) | | | | |
Government of Italy | | | (1.00 | )% | | | Quarterly | | | | BZWS | | | | 6/20/23 | | | | 1,500,000 | | | | (21,317 | ) | | | 11,338 | | | | (32,655 | ) | | | | |
| | | | | | | | | |
Contracts to Sell Protectionc,d | | | | | | | | | | | | | | | | | | | | | | | | | | | | | | | | | | | | |
| | | | | | | | | |
Single Name | | | | | | | | | | | | | | | | | | | | | | | | | | | | | | | | | | | | |
Government of Argentina | | | 5.00 | % | | | Quarterly | | | | CITI | | | | 12/20/21 | | | | 4,300,000 | | | | (2,335,477 | ) | | | (2,228,602 | ) | | | (106,875 | ) | | | CC | |
Government of Indonesia | | | 1.00 | % | | | Quarterly | | | | CITI | | | | 12/20/24 | | | | 2,300,000 | | | | 41,227 | | | | 14,967 | | | | 26,260 | | | | NR | |
Government of Italy | | | 1.00 | % | | | Quarterly | | | | BZWS | | | | 6/20/23 | | | | 1,500,000 | | | | 2,438 | | | | (49,718 | ) | | | 52,156 | | | | NR | |
Government of Russia | | | 1.00 | % | | | Quarterly | | | | CITI | | | | 12/20/24 | | | | 1,300,000 | | | | 27,915 | | | | 12,816 | | | | 15,099 | | | | BBB- | |
| | | | | | | | | |
Traded Index | | | | | | | | | | | | | | | | | | | | | | | | | | | | | | | | | | | | |
| | | | | | | | | |
eBNP Paribas Bespoke Bordeaux Index, Mezzanine Tranche 7-10% | | | 2.10 | % | | | Quarterly | | | | BNDP | | | | 6/20/20 | | | | 750,000 | | | | 6,100 | | | | — | | | | 6,100 | | |
| Non-
Investment
Grade |
|
| | | | | | | | | |
eBNP Paribas Bespoke Rodez2 Index, Mezzanine Tranche 5-7% | | | 3.20 | % | | | Quarterly | | | | BNDP | | | | 12/20/20 | | | | 300,000 | | | | 7,310 | | | | — | | | | 7,310 | | |
| Non-
Investment
Grade |
|
| | | | | | | | | |
eCitibank Bespoke Bogota Index, Mezzanine Tranche 7-10% | | | 1.35 | % | | | Quarterly | | | | CITI | | | | 6/20/20 | | | | 750,000 | | | | 2,543 | | | | — | | | | 2,543 | | |
| Non-
Investment
Grade |
|
| | | | | | | | | |
eCitibank Bespoke Palma Index, Mezzanine Tranche 5-7% | | | 2.30 | % | | | Quarterly | | | | CITI | | | | 6/20/21 | | | | 620,000 | | | | 12,709 | | | | — | | | | 12,709 | | |
| Non-
Investment
Grade |
|
| | | | | | | | | |
eCitibank Bespoke Singapore Index, Equity Tranche 0-3% | | | 0.00 | % | | | Quarterly | | | | CITI | | | | 6/20/20 | | | | 300,000 | | | | (18,965 | ) | | | (19,725 | ) | | | 760 | | |
| Non-
Investment
Grade |
|
| | | | | | | | | |
eCitibank Bespoke Sydney Index, Equity Tranche 0-3% | | | 0.00 | % | | | Quarterly | | | | CITI | | | | 6/20/20 | | | | 359,511 | | | | (27,543 | ) | | | (26,986 | ) | | | (557 | ) | |
| Non-
Investment
Grade |
|
FRANKLIN TEMPLETON VARIABLE INSURANCE PRODUCTS TRUST
CONSOLIDATED STATEMENT OF INVESTMENTS
Franklin Strategic Income VIP Fund(continued)
Credit Default Swap Contracts(continued)
| | | | | | | | | | | | | | | | | | | | | | | | | | | | | | | | | | |
| Description | | Periodic
Payment Rate
Received
(Paid) | | | Payment
Frequency | | | Counter-
party | | | Maturity
Date | | | Notional
Amounta | | | Value | | | Unamortized
Upfront
Payments
(Receipts) | | | Unrealized
Appreciation
(Depreciation) | | | Ratingb |
| | | | | | | | |
OTC Swap Contracts(continued) | | | | | | | | | | | | | | | | | | | | | | | | | | | | | | | |
Contracts to Sell Protectionc,d(continued) | | | | | | | | | | | | | | | | | | | | | | | | | | | | | | | |
Traded Index(continued) | | | | | | | | | | | | | | | | | | | | | | | | | | | | | | | | | | |
MCDX.NA.31 | | | 1.00 | % | | | Quarterly | | | | CITI | | | | 12/20/23 | | | $ | 2,270,000 | | | $ | 40,013 | | | $ | 18,257 | | | $ | 21,756 | | | Investment Grade |
| | | | | | | | | |
eMorgan Stanley Bespoke Pecan Index, Mezzanine Tranche 5-10% | | | 3.98 | % | | | Quarterly | | | | MSCO | | | | 12/20/21 | | | | 850,000 | | | | 36,585 | | | | — | | | | 36,585 | | | Non- Investment Grade |
| | | | | | | | | |
eMorgan Stanley Bespoke Pecan Index, Mezzanine Tranche 5-10% | | | 4.10 | % | | | Quarterly | | | | MSCO | | | | 12/20/21 | | | | 850,000 | | | | 36,807 | | | | — | | | | 36,807 | | | Non- Investment Grade |
| | | | | | | | | | | | | | | | | | | | | | | | | | |
| | | | | | | | | |
Total OTC Swap Contracts | | | | | | | | | | | | | | | | | | | | | | $ | (2,556,588 | ) | | $ | (2,604,064 | ) | | $ | 47,476 | | | |
| | | | | | | | | | | | | | | | | | | | | | | | | | |
Total Credit Default Swap Contracts | | | | | | | | | | | | | | | | | | | | | | $ | (2,674,369 | ) | | $ | (2,709,433 | ) | | $ | 35,064 | | | |
| | | | | | | | | | | | | | | | | | | | | | | | | | |
aFor contracts to sell protection, the notional amount is equal to the maximum potential amount of the future payments and no recourse provisions have been entered into in association with the contracts.
bBased on Standard and Poor’s (S&P) Rating for single name swaps and internal ratings for index swaps. Internal ratings based on mapping into equivalent ratings from external vendors.
cPerformance triggers for settlement of contract include default, bankruptcy or restructuring for single name swaps. and failure to pay or bankruptcy of the underlying securities for traded index swaps.
dThe fund enters contracts to sell protection to create a long credit position.
eRepresents a custom index comprised of a basket of underlying instruments.
At December 31, 2019, the Fund had the following cross-currency swap contracts outstanding. See Note 1(d).
Cross-Currency Swap Contracts
| | | | | | | | | | | | | | | | | | | | | | | | |
| Description | | Payment
Frequency | | | Coun-
terparty | | | Maturity Date | | | Notional Amount | | | Value/ Unrealized Appreciation (Depreciation) | |
| | | |
OTC Swap Contracts | | | | | | | | | | | | |
Receive Floating 3-month USD LIBOR + 2.87% | | | Quarterly | | | | | | | | 464,800 | | | | USD | | | | | |
Pay Fixed 2.50% | | | Annual | | | | CITI | | | | 5/04/21 | | | | 400,000 | | | | EUR | | | | $12,412 | |
Receive Floating 3-month USD LIBOR + 1.334% | | | Quarterly | | | | | | | | 1,120,000 | | | | USD | | | | | |
Pay Floating 3-month EUR LIBOR + 1.12% | | | Quarterly | | | | CITI | | | | 7/10/21 | | | | 1,000,000 | | | | EUR | | | | 4,310 | |
| | | | | | | | | | | | | | | | | | | | | | | | |
| | | | |
Total Cross Currency Swap Contracts | | | | | | | | | | | | | | | $16,722 | |
| | | | | | | | | | | | | | | | | | | | | | | | |
FRANKLIN TEMPLETON VARIABLE INSURANCE PRODUCTS TRUST
CONSOLIDATED STATEMENT OF INVESTMENTS
Franklin Strategic Income VIP Fund(continued)
At December 31, 2019, the Fund had the following interest rate swap contracts outstanding. See Note 1(d).
Interest Rate Swap Contracts
| | | | | | | | | | | | | | | | | | | | |
| Description | | Payment
Frequency | | | Maturity Date | | | Notional Amount* | | | | | | Value/ Unrealized Appreciation (Depreciation) | |
| | | |
Centrally Cleared Swap Contracts | | | | | | | | | | | | |
Receive Fixed 2.773% | | | Quarterly | | | | | | | | | |
Pay Floating 3-month CNY CNRR | | | Quarterly | | | | 8/23/24 | | | | 18,850,000 | | | | CNY | | | | $(20,219 | ) |
Receive Fixed 2.765% | | | Quarterly | | | | | | | | | |
Pay Floating 3-month CNY CNRR | | | Quarterly | | | | 8/26/24 | | | | 15,150,000 | | | | CNY | | | | (14,708 | ) |
Receive Fixed 2.79% | | | Quarterly | | | | | | | | | |
Pay Floating 3-month CNY CNRR | | | Quarterly | | | | 8/30/24 | | | | 24,000,000 | | | | CNY | | | | (19,556 | ) |
| | | | | | | | | | | | | | | | | | | | |
| | | |
Total Interest Rate Swap Contracts | | | | | | | | | | | | $(54,483 | ) |
| | | | | | | | | | | | | | | | | | | | |
*In U.S. dollars unless otherwise indicated.
At December 31, 2019, the Fund had the following total return swap contracts outstanding. See Note 1(d).
Total Return Swap Contracts
| | | | | | | | | | | | | | | | | | | | | | |
| Underlying Instruments | | Financing Rate | | Payment
Frequency | | | Counter-
party | | | Maturity
Date | | | Notional
Value | | | Value/
Unrealized
Appreciation
(Depreciation) | |
| | | |
OTC Swap Contracts | | | | | | | | | | |
| | | |
Longa | | | | | | | | | | |
Markit iBoxx USD Liquid Leveraged Loan Index | | 3-month USD LIBOR | | | Quarterly | | | | FBCO | | | | 3/20/20 | | | $ | 750,000 | | | | $33,128 | |
Markit iBoxx USD Liquid Leveraged Loan Index | | 3-month USD LIBOR | | | Quarterly | | | | GSCO | | | | 3/20/20 | | | | 1,100,000 | | | | 53,351 | |
Markit iBoxx USD Liquid Leveraged Loan Index | | 3-month USD LIBOR | | | Quarterly | | | | GSCO | | | | 9/20/20 | | | | 1,300,000 | | | | 3,514 | |
| | | | | | | | | | | | | | | | | | | | | | |
| | | | |
Total Total Return Swap Contracts | | | | | | | | | | | | | $89,993 | |
| | | | | | | | | | | | | | | | | | | | | | |
aThe Fund receives the total return on the underlying instrument and pays a variable financing rate.
See Note 9 regarding other derivative information.
See Abbreviations on page FSI-53.
| | | | |
| | | |
| | The accompanying notes are an integral part of these consolidated financial statements. | Annual Report | | FSI-33 |
FRANKLIN TEMPLETON VARIABLE INSURANCE PRODUCTS TRUST
CONSOLIDATED FINANCIAL STATEMENTS
Consolidated Statement of Assets and Liabilities
December 31, 2019
| | | | |
| | | Franklin Strategic Income VIP Fund | |
| |
Assets: | | | | |
Investments in securities: | | | | |
Cost - Unaffiliated issuers | | | $419,748,352 | |
Cost - Non-controlled affiliates (Note 3e) | | | 22,535,859 | |
| | | | |
| |
Value - Unaffiliated issuers | | | $413,080,389 | |
Value - Non-controlled affiliates (Note 3e) | | | 20,728,632 | |
Cash | | | 6,379,909 | |
Restricted cash for OTC derivative contracts (Note 1e) | | | 110,000 | |
Receivables: | | | | |
Investment securities sold | | | 1,519,230 | |
Capital shares sold | | | 265,645 | |
Dividends and interest | | | 3,479,909 | |
Deposits with brokers for: | | | | |
OTC derivative contracts | | | 3,320,000 | |
Futures contracts | | | 469,399 | |
Centrally cleared swap contracts | | | 831,145 | |
OTC swap contracts (upfront payments $68,130) | | | 57,378 | |
Unrealized appreciation on OTC forward exchange contracts | | | 423,942 | |
Unrealized appreciation on OTC swap contracts | | | 324,800 | |
FT Subsidiary deferred tax benefit (Note 1g) | | | 137,222 | |
Other assets | | | 899 | |
| | | | |
| |
Total assets | | | 451,128,499 | |
| | | | |
| |
Liabilities: | | | | |
Payables: | | | | |
Investment securities purchased | | | 11,452,244 | |
Capital shares redeemed | | | 95,676 | |
Management fees | | | 222,034 | |
Distribution fees | | | 36,027 | |
Variation margin on futures contracts | | | 67,450 | |
Variation margin on centrally cleared swap contracts | | | 1,033 | |
Deposits from brokers for: | | | | |
OTC derivative contracts | | | 110,000 | |
OTC swap contracts (upfront receipts $3,043,728) | | | 2,661,442 | |
Unrealized depreciation on OTC forward exchange contracts | | | 1,204,238 | |
Unrealized depreciation on OTC swap contracts | | | 170,609 | |
Deferred tax | | | 26,200 | |
Accrued expenses and other liabilities | | | 231,420 | |
| | | | |
| |
Total liabilities | | | 16,278,373 | |
| | | | |
| |
Net assets, at value | | | $434,850,126 | |
| | | | |
| |
Net assets consist of: | | | | |
Paid-in capital | | | $463,537,885 | |
Total distributable earnings (losses) | | | (28,687,759 | ) |
| | | | |
| |
Net assets, at value | | | $434,850,126 | |
| | | | |
| | | | |
| | | |
FSI-34 | | Annual Report | The accompanying notes are an integral part of these consolidated financial statements. | | |
FRANKLIN TEMPLETON VARIABLE INSURANCE PRODUCTS TRUST
CONSOLIDATED FINANCIAL STATEMENTS
Consolidated Statement of Assets and Liabilities(continued)
December 31, 2019
| | | | |
| | | Franklin Strategic Income VIP Fund | |
| |
Class 1: | | | | |
Net assets, at value | | | $285,437,319 | |
| | | | |
Shares outstanding | | | 26,117,176 | |
| | | | |
Net asset value and maximum offering price per share | | | $10.93 | |
| | | | |
| |
Class 2: | | | | |
Net assets, at value | | | $ 94,928,196 | |
| | | | |
Shares outstanding | | | 8,997,865 | |
| | | | |
Net asset value and maximum offering price per share | | | $10.55 | |
| | | | |
| |
Class 4: | | | | |
Net assets, at value | | | $ 54,484,611 | |
| | | | |
Shares outstanding | | | 5,029,789 | |
| | | | |
Net asset value and maximum offering price per share | | | $10.83 | |
| | | | |
| | | | |
| | | |
| | The accompanying notes are an integral part of these consolidated financial statements. | Annual Report | | FSI-35 |
FRANKLIN TEMPLETON VARIABLE INSURANCE PRODUCTS TRUST
CONSOLIDATED FINANCIAL STATEMENTS
Consolidated Statement of Operations
for the year ended December 31, 2019
| | | | |
| | | Franklin Strategic Income VIP Fund | |
| |
Investment income: | | | | |
Dividends: | | | | |
Unaffiliated issuers | | | $ 43,056 | |
Non-controlled affiliates (Note 3e) | | | 1,402,046 | |
Interest: (net of foreign taxes)~
Unaffiliated issuers | | | 19,936,506 | |
| | | | |
| |
Total investment income | | | 21,381,608 | |
| | | | |
| |
Expenses: | | | | |
Management fees (Note 3a) | | | 2,803,767 | |
Distribution fees: (Note 3c) | | | | |
Class 2 | | | 229,318 | |
Class 4 | | | 202,648 | |
Custodian fees (Note 4) | | | 10,343 | |
Reports to shareholders | | | 147,122 | |
Professional fees | | | 106,222 | |
Trustees’ fees and expenses | | | 2,771 | |
Other | | | 99,853 | |
| | | | |
| |
Total expenses | | | 3,602,044 | |
Expense reductions (Note 4) | | | (6,860 | ) |
Expenses waived/paid by affiliates (Note 3e) | | | (118,335 | ) |
| | | | |
| |
Net expenses | | | 3,476,849 | |
| | | | |
| |
Net investment income | | | 17,904,759 | |
| | | | |
| |
Realized and unrealized gains (losses): | | | | |
Net realized gain (loss) from: | | | | |
Investments: | | | | |
Unaffiliated issuers | | | (1,163,883 | ) |
Non-controlled affiliates (Note 3e) | | | (2,146,446 | ) |
Foreign currency transactions | | | (11,410 | ) |
Forward exchange contracts | | | 705,050 | |
Futures contracts | | | 2,909,366 | |
Swap contracts | | | (1,199,870 | ) |
| | | | |
| |
Net realized gain (loss) | | | (907,193 | ) |
| | | | |
| |
Net change in unrealized appreciation (depreciation) on: | | | | |
Investments: | | | | |
Unaffiliated issuers | | | 18,010,634 | |
Non-controlled affiliates (Note 3e) | | | 501,918 | |
Translation of other assets and liabilities denominated in foreign currencies | | | 8,152 | |
Forward exchange contracts | | | (1,043,046 | ) |
Futures contracts | | | (854,940 | ) |
Swap contracts | | | 2,155,087 | |
Change in FT Subsidiary deferred tax benefit (Note 1g) | | | (44,004 | ) |
Change in deferred taxes on unrealized appreciation | | | (17,839 | ) |
| | | | |
| |
Net change in unrealized appreciation (depreciation) | | | 18,715,962 | |
| | | | |
| |
Net realized and unrealized gain (loss) | | | 17,808,769 | |
| | | | |
| |
Net increase (decrease) in net assets resulting from operations | | | $35,713,528 | |
| | | | |
| |
~Foreign taxes withheld on interest | | | $ 25,472 | |
| | | | |
| | | |
FSI-36 | | Annual Report | The accompanying notes are an integral part of these consolidated financial statements. | | |
FRANKLIN TEMPLETON VARIABLE INSURANCE PRODUCTS TRUST
CONSOLIDATED FINANCIAL STATEMENTS
Consolidated Statements of Changes in Net Assets
for the year ended December 31, 2019
| | | | | | | | |
| | | Franklin Strategic Income VIP Fund | |
| |
| | | Year Ended December 31, | |
| | |
| | | 2019 | | | 2018 | |
| | |
Increase (decrease) in net assets: | | | | | | | | |
Operations: | | | | | | | | |
Net investment income | | $ | 17,904,759 | | | $ | 24,508,744 | |
Net realized gain (loss) | | | (907,193 | ) | | | (9,616,538 | ) |
Net change in unrealized appreciation (depreciation) | | | 18,715,962 | | | | (23,561,419 | ) |
| | | | |
| | |
Net increase (decrease) in net assets resulting from operations | | | 35,713,528 | | | | (8,669,213 | ) |
| | | | |
| | |
Distributions to shareholders: | | | | | | | | |
Class 1 | | | (16,055,733 | ) | | | (9,703,924 | ) |
Class 2 | | | (4,608,498 | ) | | | (5,724,625 | ) |
Class 4 | | | (2,951,572 | ) | | | (1,690,861 | ) |
| | | | |
| | |
Total distributions to shareholders | | | (23,615,803 | ) | | | (17,119,410 | ) |
| | | | |
Capital share transactions: (Note 2) | | | | | | | | |
Class 1 | | | (25,284,669 | ) | | | (43,986,518 | ) |
Class 2 | | | 3,227,556 | | | | (117,066,128 | ) |
Class 4 | | | (7,826,645 | ) | | | (10,271,574 | ) |
| | | | |
| | |
Total capital share transactions | | | (29,883,758 | ) | | | (171,324,220 | ) |
| | | | |
| | |
Net increase (decrease) in net assets | | | (17,786,033 | ) | | | (197,112,843 | ) |
Net assets: | | | | | | | | |
Beginning of year | | | 452,636,159 | | | | 649,749,002 | |
| | | | |
| | |
End of year | | $ | 434,850,126 | | | $ | 452,636,159 | |
| | | | |
| | | | |
| | | |
| | The accompanying notes are an integral part of these consolidated financial statements. | Annual Report | | FSI-37 |
FRANKLIN TEMPLETON VARIABLE INSURANCE PRODUCTS TRUST
Notes to Consolidated Financial Statements
Franklin Strategic Income VIP Fund
1. Organization and Significant Accounting Policies
Franklin Templeton Variable Insurance Products Trust (Trust) is registered under the Investment Company Act of 1940 (1940 Act) as an open-end management investment company, consisting of eighteen separate funds and applies the specialized accounting and reporting guidance in U.S. Generally Accepted Accounting Principles (U.S. GAAP). Franklin Strategic Income VIP Fund (Fund) is included in this report. Shares of the Fund are generally sold only to insurance company separate accounts to fund the benefits of variable life insurance policies or variable annuity contracts. At December 31, 2019, 79.0% of the Fund’s shares were held through one insurance company. Investment activities of these insurance company separate accounts could have a material impact on the Fund. The Fund offers three classes of shares: Class 1, Class 2 and Class 4. Each class of shares may differ by its distribution fees, voting rights on matters affecting a single class and its exchange privilege.
The following summarizes the Fund’s significant accounting policies.
a. Financial Instrument Valuation
The Fund’s investments in financial instruments are carried at fair value daily. Fair value is the price that would be received to sell an asset or paid to transfer a liability in an orderly transaction between market participants on the measurement date. The Fund calculates the net asset value (NAV) per share each business day as of 4 p.m. Eastern time or the regularly scheduled close of the New York Stock Exchange (NYSE), whichever is earlier. Under compliance policies and procedures approved by the Trust’s Board of Trustees (the Board), the Fund’s administrator has responsibility for oversight of valuation, including leading the cross-functional Valuation Committee (VC). The Fund may utilize independent pricing services, quotations from securities and financial instrument dealers, and other market sources to determine fair value.
Equity securities and derivative financial instruments listed on an exchange or on the NASDAQ National Market System are valued at the last quoted sale price or the official closing price of the day, respectively. Foreign equity securities are valued as of the close of trading on the foreign stock exchange on which the security is primarily traded, or as of 4 p.m. Eastern time. The value is then converted into its U.S. dollar equivalent at the foreign exchange rate in effect at 4 p.m. Eastern time on the day that the value of the security is
determined. Over-the-counter (OTC) securities are valued within the range of the most recent quoted bid and ask prices. Securities that trade in multiple markets or on multiple exchanges are valued according to the broadest and most representative market. Certain equity securities are valued based upon fundamental characteristics or relationships to similar securities.
Debt securities generally trade in the OTC market rather than on a securities exchange. The Fund’s pricing services use multiple valuation techniques to determine fair value. In instances where sufficient market activity exists, the pricing services may utilize a market-based approach through which quotes from market makers are used to determine fair value. In instances where sufficient market activity may not exist or is limited, the pricing services also utilize proprietary valuation models which may consider market characteristics such as benchmark yield curves, credit spreads, estimated default rates, anticipated market interest rate volatility, coupon rates, anticipated timing of principal repayments, underlying collateral, and other unique security features in order to estimate the relevant cash flows, which are then discounted to calculate the fair value. Securities denominated in a foreign currency are converted into their U.S. dollar equivalent at the foreign exchange rate in effect at 4 p.m. Eastern time on the date that the values of the foreign debt securities are determined.
Investments in open-end mutual funds are valued at the closing NAV.
Certain derivative financial instruments are centrally cleared or trade in the OTC market. The Fund’s pricing services use various techniques including industry standard option pricing models and proprietary discounted cash flow models to determine the fair value of those instruments. The Fund’s net benefit or obligation under the derivative contract, as measured by the fair value of the contract, is included in net assets.
The Fund has procedures to determine the fair value of financial instruments for which market prices are not reliable or readily available. Under these procedures, the Fund primarily employs a market-based approach which may use related or comparable assets or liabilities, recent transactions, market multiples, book values, and other relevant information for the investment to determine the fair value of the investment. An income-based valuation approach may also be used in which the anticipated future cash flows of the
FRANKLIN TEMPLETON VARIABLE INSURANCE PRODUCTS TRUST
NOTES TO CONSOLIDATED FINANCIAL STATEMENTS
Franklin Strategic Income VIP Fund(continued)
investment are discounted to calculate fair value. Discounts may also be applied due to the nature or duration of any restrictions on the disposition of the investments. Due to the inherent uncertainty of valuations of such investments, the fair values may differ significantly from the values that would have been used had an active market existed.
Trading in securities on foreign securities stock exchanges and OTC markets may be completed before 4 p.m. Eastern time. In addition, trading in certain foreign markets may not take place on every Fund’s business day. Occasionally, events occur between the time at which trading in a foreign security is completed and 4 p.m. Eastern time that might call into question the reliability of the value of a portfolio security held by the Fund. As a result, differences may arise between the value of the Fund’s portfolio securities as determined at the foreign market close and the latest indications of value at 4 p.m. Eastern time. In order to minimize the potential for these differences, the VC monitors price movements following the close of trading in foreign stock markets through a series of country specific market proxies (such as baskets of American Depositary Receipts, futures contracts and exchange traded funds). These price movements are measured against established trigger thresholds for each specific market proxy to assist in determining if an event has occurred that may call into question the reliability of the values of the foreign securities held by the Fund. If such an event occurs, the securities may be valued using fair value procedures, which may include the use of independent pricing services.
When the last day of the reporting period is a non-business day, certain foreign markets may be open on those days that the Fund’s NAV is not calculated, which could result in differences between the value of the Fund’s portfolio securities on the last business day and the last calendar day of the reporting period. Any significant security valuation changes due to an open foreign market are adjusted and reflected by the Fund for financial reporting purposes.
b. Foreign Currency Translation
Portfolio securities and other assets and liabilities denominated in foreign currencies are translated into U.S. dollars based on the exchange rate of such currencies against U.S. dollars on the date of valuation. The Fund may enter into foreign currency exchange contracts to facilitate transactions denominated in a foreign currency. Purchases and sales of securities, income and expense items
denominated in foreign currencies are translated into U.S. dollars at the exchange rate in effect on the transaction date. Portfolio securities and assets and liabilities denominated in foreign currencies contain risks that those currencies will decline in value relative to the U.S. dollar. Occasionally, events may impact the availability or reliability of foreign exchange rates used to convert the U.S. dollar equivalent value. If such an event occurs, the foreign exchange rate will be valued at fair value using procedures established and approved by the Board.
The Fund does not separately report the effect of changes in foreign exchange rates from changes in market prices on securities held. Such changes are included in net realized and unrealized gain or loss from investments in the Consolidated Statement of Operations.
Realized foreign exchange gains or losses arise from sales of foreign currencies, currency gains or losses realized between the trade and settlement dates on securities transactions and the difference between the recorded amounts of dividends, interest, and foreign withholding taxes and the U.S. dollar equivalent of the amounts actually received or paid. Net unrealized foreign exchange gains and losses arise from changes in foreign exchange rates on foreign denominated assets and liabilities other than investments in securities held at the end of the reporting period.
c. Securities Purchased on a When-Issued or Delayed Delivery and TBA Basis
The Fund purchases securities on a when-issued or delayed delivery and to-be-announced (TBA) basis, with payment and delivery scheduled for a future date. These transactions are subject to market fluctuations and are subject to the risk that the value at delivery may be more or less than the trade date purchase price. Although the Fund will generally purchase these securities with the intention of holding the securities, it may sell the securities before the settlement date. Sufficient assets have been segregated for these securities.
d. Derivative Financial Instruments
The Fund invested in derivative financial instruments in order to manage risk or gain exposure to various other investments or markets. Derivatives are financial contracts based on an underlying or notional amount, require no initial investment or an initial net investment that is smaller than would normally be required to have a similar response to changes in market factors, and require or permit net settlement. Derivatives
FRANKLIN TEMPLETON VARIABLE INSURANCE PRODUCTS TRUST
NOTES TO CONSOLIDATED FINANCIAL STATEMENTS
Franklin Strategic Income VIP Fund(continued)
1. Organization and Significant Accounting Policies(continued)
d. Derivative Financial Instruments(continued)
contain various risks including the potential inability of the counterparty to fulfill their obligations under the terms of the contract, the potential for an illiquid secondary market, and/or the potential for market movements which expose the Fund to gains or losses in excess of the amounts shown in the Consolidated Statement of Assets and Liabilities. Realized gain and loss and unrealized appreciation and depreciation on these contracts for the period are included in the Consolidated Statement of Operations.
Derivative counterparty credit risk is managed through a formal evaluation of the creditworthiness of all potential counterparties. The Fund attempts to reduce its exposure to counterparty credit risk on OTC derivatives, whenever possible, by entering into International Swaps and Derivatives Association (ISDA) master agreements with certain counterparties. These agreements contain various provisions, including but not limited to collateral requirements, events of default, or early termination. Termination events applicable to the counterparty include certain deteriorations in the credit quality of the counterparty. Termination events applicable to the Fund include failure of the Fund to maintain certain net asset levels and/or limit the decline in net assets over various periods of time. In the event of default or early termination, the ISDA master agreement gives the non-defaulting party the right to net and close-out all transactions traded, whether or not arising under the ISDA agreement, to one net amount payable by one counterparty to the other. However, absent an event of default or early termination, OTC derivative assets and liabilities are presented gross and not offset in the Consolidated Statement of Assets and Liabilities. Early termination by the counterparty may result in an immediate payment by the Fund of any net liability owed to that counterparty under the ISDA agreement.
Collateral requirements differ by type of derivative. Collateral or initial margin requirements are set by the broker or exchange clearing house for exchange traded and centrally cleared derivatives. Initial margin deposited is held at the exchange and can be in the form of cash and/or securities. For OTC derivatives traded under an ISDA master agreement, posting of collateral is required by either the Fund or the applicable counterparty if the total net exposure of all OTC derivatives with the applicable counterparty exceeds the minimum transfer amount, which typically ranges from
$100,000 to $250,000, and can vary depending on the counterparty and the type of the agreement. Generally, collateral is determined at the close of Fund business each day and any additional collateral required due to changes in derivative values may be delivered by the Fund or the counterparty the next business day, or within a few business days. Collateral pledged and/or received by the Fund for OTC derivatives, if any, is held in segregated accounts with the Fund’s custodian/counterparty broker and can be in the form of cash and/or securities. Unrestricted cash may be invested according to the Fund’s investment objectives. To the extent that the amounts due to the Fund from its counterparties are not subject to collateralization or are not fully collateralized, the Fund bears the risk of loss from counterparty non-performance.
The Fund entered into exchange traded futures contracts primarily to manage and/or gain exposure to interest rate risk. A futures contract is an agreement between the Fund and a counterparty to buy or sell an asset at a specified price on a future date. Required initial margins are pledged by the Fund, and the daily change in fair value is accounted for as a variation margin payable or receivable.
The Fund entered into OTC forward exchange contracts primarily to manage and/or gain exposure to certain foreign currencies. A forward exchange contract is an agreement between the Fund and a counterparty to buy or sell a foreign currency at a specific exchange rate on a future date.
The Fund entered into credit default swap contracts primarily to manage and/or gain exposure to credit risk. A credit default swap is an agreement between the Fund and a counterparty whereby the buyer of the contract receives credit protection and the seller of the contract guarantees the credit worthiness of a referenced debt obligation. These agreements may be privately negotiated in the over-the-counter market (OTC credit default swaps) or may be executed in a multilateral trade facility platform, such as a registered exchange (centrally cleared credit default swaps). The underlying referenced debt obligation may be a single issuer of corporate or sovereign debt, a credit index, a basket of issuers or indices, or a tranche of a credit index or basket of issuers or indices. In the event of a default of the underlying referenced debt obligation, the buyer is entitled to receive the notional amount of the credit default swap contract from the seller in exchange for the referenced debt obligation, a net settlement amount equal to the notional amount of the credit default swap less the recovery value of
FRANKLIN TEMPLETON VARIABLE INSURANCE PRODUCTS TRUST
NOTES TO CONSOLIDATED FINANCIAL STATEMENTS
Franklin Strategic Income VIP Fund(continued)
the referenced debt obligation, or other agreed upon amount. For centrally cleared credit default swaps, required initial margins are pledged by the Fund, and the daily change in fair value is accounted for as a variation margin payable or receivable in the Consolidated Statement of Assets and Liabilities. Over the term of the contract, the buyer pays the seller a periodic stream of payments, provided that no event of default has occurred. Such periodic payments are accrued daily as an unrealized appreciation or depreciation until the payments are made, at which time they are realized. Upfront payments and receipts are reflected in the Consolidated Statement of Assets and Liabilities and represent compensating factors between stated terms of the credit default swap agreement and prevailing market conditions (credit spreads and other relevant factors). These upfront payments and receipts are amortized over the term of the contract as a realized gain or loss in the Consolidated Statement of Operations.
The Fund entered into OTC cross currency swap contracts primarily to manage and/or gain exposure to certain foreign currencies. A cross currency swap is an agreement between the Fund and a counterparty to exchange cash flows (determined using either a fixed or floating rate) based on the notional amounts of two different currencies. The notional amounts are typically determined based on the spot exchange rates at the opening of the contract. Cross currency swaps may require the exchange of notional amounts at the opening and/or closing of the contract. Over the term of the contract, contractually required payments to be paid and to be received are accrued daily and recorded as unrealized depreciation and appreciation until the payments are made, at which time they are realized. Upfront payments and receipts are reflected in the Consolidated Statement of Assets and Liabilities and represent compensating factors between stated terms of the cross currency swap contract and prevailing market conditions (interest rate spreads and other relevant factors). These upfront payments and receipts are amortized over the term of the contract as a realized gain or loss in the Consolidated Statement of Operations.
The Fund entered into interest rate swap contracts primarily to manage interest rate risk. An interest rate swap is an agreement between the Fund and a counterparty to exchange cash flows based on the difference between two interest rates, applied to a notional amount. These agreements may be privately negotiated in the over-the-counter market (OTC interest rate swaps) or may be executed on a registered exchange (centrally cleared interest rate
swaps). For centrally cleared interest rate swaps, required initial margins are pledged by the Fund, and the daily change in fair value is accounted for as a variation margin payable or receivable in the Consolidated Statement of Assets and Liabilities. Over the term of the contract, contractually required payments to be paid and to be received are accrued daily and recorded as unrealized depreciation and appreciation until the payments are made, at which time they are realized.
The Fund entered into OTC total return swap contracts primarily to manage and/or gain exposure to credit and other market risks of an underlying instrument such as a stock, bond, index or basket of securities or indices. A total return swap is an agreement between the Fund and a counterparty to exchange a return linked to an underlying instrument for a floating or fixed rate payment, both based upon a notional amount. Over the term of the contract, contractually required payments to be paid or received are accrued daily and recorded as unrealized appreciation or depreciation until the payments are made, at which time they are recognized as realized gain or loss.
The Fund invests in value recovery instruments (VRI) primarily to gain exposure to economic growth. Periodic payments from VRI are dependent on established benchmarks for underlying variables. VRI has a notional amount, which is used to calculate amounts of payments to holders. Payments are recorded upon receipt as realized gains in the Consolidated Statement of Operations. The risks of investing in VRI include growth risk, liquidity, and the potential loss of investment.
See Note 9 regarding other derivative information.
e. Restricted Cash
At December 31, 2019, the Fund held restricted cash in connection with investments in certain derivative securities. Restricted cash is held in a segregated account with the Fund’s custodian and is reflected in the Consolidated Statement of Assets and Liabilities.
f. Loan Participation Notes
The Fund invests in loan participation notes (Participations). Participations are loans originally issued to a borrower by one or more financial institutions (the Lender) and subsequently sold to other investors, such as the Fund. Participations typically result in the Fund having a contractual relationship
FRANKLIN TEMPLETON VARIABLE INSURANCE PRODUCTS TRUST
NOTES TO CONSOLIDATED FINANCIAL STATEMENTS
Franklin Strategic Income VIP Fund(continued)
1. Organization and Significant Accounting Policies(continued)
f. Loan Participation Notes(continued)
only with the Lender and not with the borrower. The Fund has the right to receive from the Lender any payments of principal, interest and fees which the Lender received from the borrower. The Fund generally has no rights to either enforce compliance by the borrower with the terms of the loan agreement or to any collateral relating to the original loan. As a result, the Fund assumes the credit risk of both the borrower and the Lender that is selling the Participation. The Participations may also involve interest rate risk and liquidity risk, including the potential default or insolvency of the borrower and/or the Lender.
g. Investments in FT Holdings Corporation III (FT Subsidiary)
The Fund invests in certain financial instruments through its investment in FT Subsidiary. FT Subsidiary is a Delaware Corporation, is a wholly-owned subsidiary of the Fund, and is able to invest in certain financial instruments consistent with the investment objective of the Fund. At December 31, 2019, FT Subsidiary’s investment, Turtle Bay Resort, as well as any other assets and liabilities of FT Subsidiary are reflected in the Fund’s Consolidated Statement of Investments and Consolidated Statement of Assets and Liabilities.
At December 31, 2019, FT Subsidiary, which is a tax paying entity, recognized an unrealized loss on its Turtle Bay investment. An estimated deferred tax asset based on such unrealized loss is reflected as FT Subsidiary deferred tax benefit in the Consolidated Statement of Assets and Liabilities. The estimated benefit was calculated using a federal rate of 21%. When the Turtle Bay investment liquidates, the FT Subsidiary will recognize a capital loss which can be carried-back to offset prior year capital gains, resulting in a tax refund which will relieve the deferred tax asset.
The financial statements have been consolidated and include the accounts of the Fund and FT Subsidiary. All intercompany transactions and balances have been eliminated. At December 31, 2019, the net assets of FT Subsidiary were $6,351,182, representing 1.5% of the Fund’s consolidated net assets. The Fund’s investment in FT Subsidiary is limited to 25% of consolidated assets.
h. Mortgage Dollar Rolls
The Fund enters into mortgage dollar rolls, typically on a TBA basis. Mortgage dollar rolls are agreements between the Fund and a financial institution where the Fund sells (or buys) mortgage-backed securities for delivery on a specified date and simultaneously contracts to repurchase (or sell) substantially similar (same type, coupon, and maturity) securities at a future date and at a predetermined price. Gains or losses are realized on the initial sale, and the difference between the repurchase price and the sale price is recorded as an unrealized gain or loss to the Fund upon entering into the mortgage dollar roll. In addition, the Fund may invest the cash proceeds that are received from the initial sale. During the period between the sale and repurchase, the Fund is not entitled to principal and interest paid on the mortgage backed securities. Transactions in mortgage dollar rolls are accounted for as purchases and sales and may result in an increase to the Fund’s portfolio turnover rate. The risks of mortgage dollar roll transactions include the potential inability of the counterparty to fulfill its obligations.
i. Senior Floating Rate Interests
The Fund invests in senior secured corporate loans that pay interest at rates which are periodically reset by reference to a base lending rate plus a spread. These base lending rates are generally the prime rate offered by a designated U.S. bank or the London InterBank Offered Rate (LIBOR). Senior secured corporate loans often require prepayment of principal from excess cash flows or at the discretion of the borrower. As a result, actual maturity may be substantially less than the stated maturity. Senior secured corporate loans in which the Fund invests are generally readily marketable, but may be subject to certain restrictions on resale. On July 27, 2017, the United Kingdom’s Financial Conduct Authority announced its intention to cease sustaining LIBOR after 2021. There remains uncertainty regarding the future utilization of LIBOR and the nature of any replacement rate. As such, the potential effect of a transition away from LIBOR on the Fund or the Fund’s investments that use or may use a floating rate based on LIBOR cannot yet be determined.
j. Income and Deferred Taxes
It is the Fund’s policy to qualify as a regulated investment company under the Internal Revenue Code. The Fund intends to distribute to shareholders substantially all of its
FRANKLIN TEMPLETON VARIABLE INSURANCE PRODUCTS TRUST
NOTES TO CONSOLIDATED FINANCIAL STATEMENTS
Franklin Strategic Income VIP Fund(continued)
taxable income and net realized gains to relieve it from federal income and if applicable, excise taxes. As a result, no provision for U.S. federal income taxes is required.
The Fund may be subject to foreign taxation related to income received, capital gains on the sale of securities and certain foreign currency transactions in the foreign jurisdictions in which it invests. Foreign taxes, if any, are recorded based on the tax regulations and rates that exist in the foreign markets in which the Fund invests. When a capital gain tax is determined to apply, the Fund records an estimated deferred tax liability in an amount that would be payable if the securities were disposed of on the valuation date.
The Fund may recognize an income tax liability related to its uncertain tax positions under U.S. GAAP when the uncertain tax position has a less than 50% probability that it will be sustained upon examination by the tax authorities based on its technical merits. As of December 31, 2019, the Fund has determined that no tax liability is required in its financial statements related to uncertain tax positions for any open tax years (or expected to be taken in future tax years). Open tax years are those that remain subject to examination and are based on the statute of limitations in each jurisdiction in which the Fund invests.
k. Security Transactions, Investment Income, Expenses and Distributions
Security transactions are accounted for on trade date. Realized gains and losses on security transactions are determined on a specific identification basis. Interest income and estimated expenses are accrued daily. Amortization of premium and accretion of discount on debt securities are included in interest income. Paydown gains and losses are recorded as an adjustment to interest income. Facility fees are recognized as income over the expected term of the loan. Dividend income is recorded on the ex-dividend date except for certain dividends from securities where the dividend rate is not available. In such cases, the dividend is recorded as soon as the information is received by the Fund. Distributions to shareholders are recorded on the ex-dividend date. Distributable earnings are determined according to income tax regulations (tax basis) and may differ from earnings recorded in accordance with U.S. GAAP. These differences may be permanent or temporary. Permanent differences are reclassified among capital accounts to reflect their tax
character. These reclassifications have no impact on net assets or the results of operations. Temporary differences are not reclassified, as they may reverse in subsequent periods.
Common expenses incurred by the Trust are allocated among the Funds based on the ratio of net assets of each Fund to the combined net assets of the Trust or based on the ratio of number of shareholders of each Fund to the combined number of shareholders of the Trust. Fund specific expenses are charged directly to the Fund that incurred the expense.
Realized and unrealized gains and losses and net investment income, excluding class specific expenses, are allocated daily to each class of shares based upon the relative proportion of net assets of each class. Differences in per share distributions by class are generally due to differences in class specific expenses.
Inflation-indexed bonds are adjusted for inflation through periodic increases or decreases in the security’s interest accruals, face amount, or principal redemption value, by amounts corresponding to the rate of inflation as measured by an index. Any increase or decrease in the face amount or principal redemption value will be included as interest income in the Consolidated Statement of Operations.
l. Accounting Estimates
The preparation of financial statements in accordance with U.S. GAAP requires management to make estimates and assumptions that affect the reported amounts of assets and liabilities at the date of the financial statements and the amounts of income and expenses during the reporting period. Actual results could differ from those estimates.
m. Guarantees and Indemnifications
Under the Trust’s organizational documents, its officers and trustees are indemnified by the Trust against certain liabilities arising out of the performance of their duties to the Trust. Additionally, in the normal course of business, the Trust, on behalf of the Fund, enters into contracts with service providers that contain general indemnification clauses. The Trust’s maximum exposure under these arrangements is unknown as this would involve future claims that may be made against the Trust that have not yet occurred. Currently, the Trust expects the risk of loss to be remote.
FRANKLIN TEMPLETON VARIABLE INSURANCE PRODUCTS TRUST
NOTES TO CONSOLIDATED FINANCIAL STATEMENTS
Franklin Strategic Income VIP Fund(continued)
2. Shares of Beneficial Interest
At December 31, 2019, there were an unlimited number of shares authorized (without par value). Transactions in the Fund’s shares were as follows:
| | | | | | | | | | | | | | | | |
| | | Year Ended December 31, |
| | | 2019 | | 2018 |
| | | Shares | | Amount | | Shares | | Amount |
| | | | |
Class 1 Shares: | | | | | | | | | | | | | | | | |
Shares sold | | | 671,682 | | | $ | 7,349,679 | | | | 529,935 | | | $ | 5,819,800 | |
Shares issued in reinvestment of distributions | | | 1,499,135 | | | | 16,055,733 | | | | 904,373 | | | | 9,703,924 | |
Shares redeemed | | | (4,454,817 | ) | | | (48,690,081 | ) | | | (5,463,142 | ) | | | (59,510,242 | ) |
| | | | |
| | | | |
Net increase (decrease) | | | (2,284,000 | ) | | $ | (25,284,669 | ) | | | (4,028,834 | ) | | $ | (43,986,518 | ) |
| | | | |
| | | | |
Class 2 Shares: | | | | | | | | | | | | | | | | |
Shares sold | | | 1,948,126 | | | $ | 20,598,257 | | | | 1,939,103 | | | $ | 20,473,500 | |
Shares issued in reinvestment of distributions | | | 445,266 | | | | 4,608,498 | | | | 552,570 | | | | 5,724,625 | |
Shares redeemed in-kind (Note 11) | | | — | | | | — | | | | (10,844,970 | ) | | | (113,023,023 | ) |
Shares redeemed | | | (2,080,736 | ) | | | (21,979,199 | ) | | | (2,870,064 | ) | | | (30,241,230 | ) |
| | | | |
| | | | |
Net increase (decrease) | | | 312,656 | | | $ | 3,227,556 | | | | (11,223,361 | ) | | $ | (117,066,128 | ) |
| | | | |
| | | | |
Class 4 Shares: | | | | | | | | | | | | | | | | |
Shares sold | | | 332,522 | | | $ | 3,653,954 | | | | 351,399 | | | $ | 3,829,733 | |
Shares issued in reinvestment of distributions | | | 277,403 | | | | 2,951,572 | | | | 158,766 | | | | 1,690,861 | |
Shares redeemed | | | (1,334,939 | ) | | | (14,432,171 | ) | | | (1,457,847 | ) | | | (15,792,168 | ) |
| | | | |
| | | | |
Net increase (decrease) | | | (725,014 | ) | | $ | (7,826,645 | ) | | | (947,682 | ) | | $ | (10,271,574 | ) |
| | | | |
3. Transactions with Affiliates
Franklin Resources, Inc. is the holding company for various subsidiaries that together are referred to as Franklin Templeton. Certain officers and trustees of the Fund are also officers and/or directors of the following subsidiaries:
| | |
| Subsidiary | | Affiliation |
Franklin Advisers, Inc. (Advisers) | | Investment manager |
Franklin Templeton Services, LLC (FT Services) | | Administrative manager |
Franklin Templeton Distributors, Inc. (Distributors) | | Principal underwriter |
Franklin Templeton Investor Services, LLC (Investor Services) | | Transfer agent |
FRANKLIN TEMPLETON VARIABLE INSURANCE PRODUCTS TRUST
NOTES TO CONSOLIDATED FINANCIAL STATEMENTS
Franklin Strategic Income VIP Fund(continued)
a. Management Fees
The Fund pays an investment management fee to Advisers based on the average daily net assets of the Fund as follows:
| | |
| Annualized Fee Rate | | Net Assets |
0.625% | | Up to and including $500 million |
0.525% | | Over $500 million, up to and including $1 billion |
0.480% | | Over $1 billion, up to and including $1.5 billion |
0.435% | | Over $1.5 billion, up to and including $6.5 billion |
0.415% | | Over $6.5 billion, up to and including $11.5 billion |
0.400% | | Over $11.5 billion, up to and including $16.5 billion |
0.390% | | Over $16.5 billion, up to and including $19 billion |
0.380% | | Over $19 billion, up to and including $21.5 billion |
0.370% | | In excess of $21.5 billion |
b. Administrative Fees
Under an agreement with Advisers, FT Services provides administrative services to the Fund. The fee is paid by Advisers based on the Fund’s average daily net assets, and is not an additional expense of the Fund.
c. Distribution Fees
The Board has adopted distribution plans for Class 2 and Class 4 shares pursuant to Rule 12b-1 under the 1940 Act. Under the Fund’s compensation distribution plans, the Fund pays Distributors for costs incurred in connection with the servicing, sale and distribution of the Fund’s shares up to 0.25% and 0.35% per year of its average daily net assets of Class 2 and Class 4, respectively. The plan year, for purposes of monitoring compliance with the maximum annual plan rates, is February 1 through January 31.
d. Transfer Agent Fees
Investor Services, under terms of an agreement, performs shareholder servicing for the Fund and is not paid by the Fund for the services.
e. Investments in Affiliated Management Investment Companies
The Fund invests in one or more affiliated management investment companies for purposes other than exercising a controlling influence over the management or policies. Management fees paid by the Fund are waived on assets invested in the affiliated management investment companies, as noted in the Consolidated Statement of Operations, in an amount not to exceed the management and administrative fees paid directly or indirectly by each affiliate. During the year ended December 31, 2019, the Fund held investments in affiliated management investment companies as follows:
| | | | | | | | | | | | | | | | | | | | | | | | | | | | | | | | |
| | | Value at
Beginning of Year | | | Purchases | | | Sales | | | Realized
Gain (Loss) | | | Net Change in
Unrealized
Appreciation
(Depreciation) | | | Value at End of Year | | | Number of
Shares
Held at End
of Year | | | Dividend
Income | |
| | | | | | | | |
Non-Controlled Affiliates | | | | | | | | | | | | | | | | | | | | | | | | | | | | | | | | |
Franklin Floating Rate Income Funda | | $ | 12,230,563 | | | $ | — | | | $ | (2,001,600 | ) | | $ | (376,800 | ) | | $ | (587,245 | ) | | $ | 9,264,918 | | | | 1,118,951 | | | $ | 854,937 | |
Franklin Lower Tier Floating Rate Fund | | | 13,000,405 | | | | — | | | | (12,319,922 | )b | | | (1,769,646 | ) | | | 1,089,163 | | | | — | c | | | — | | | | 359,788 | |
FRANKLIN TEMPLETON VARIABLE INSURANCE PRODUCTS TRUST
NOTES TO CONSOLIDATED FINANCIAL STATEMENTS
Franklin Strategic Income VIP Fund(continued)
3. Transactions with Affiliates(continued)
e. Investments in Affiliated Management Investment Companies(continued)
| | | | | | | | | | | | | | | | | | | | | | | | | | | | | | | | |
| | | Value at
Beginning
of Year | | | Purchases | | | Sales | | | Realized
Gain (Loss) | | | Net Change in
Unrealized
Appreciation
(Depreciation) | | | Value at
End of Year | | | Number of
Shares
Held at End
of Year | | | Dividend
Income | |
Non-Controlled Affiliates(continued) | | | | | | | | | | | | | | | | | | | | | |
Institutional Fiduciary Trust Money Market Portfolio, 1.26% | | $ | 10,265,231 | | | $ | 172,567,900 | | | | $ (171,369,417 | ) | | $ | — | | | $ | — | | | $ | 11,463,714 | | | | 11,463,714 | | | $ | 187,321 | |
| | | | | | | | | | | | |
| | | | | | | | |
Total Affiliated Securities | | $ | 35,496,199 | | | $ | 172,567,900 | | | | $ (185,690,939 | ) | | $ | (2,146,446 | ) | | $ | 501,918 | | | $ | 20,728,632 | | | | | | | $ | 1,402,046 | |
| | | | | | | | | | | | |
aEffective May 31, 2019, Franklin Middle Tier Floating Rate Fund was renamed Franklin Floating Rate Income Fund.
bThe Fund sold shares of the affiliate through an in-kind transfer of common stocks and other equity interests, corporate bonds and senior floating rate interests securities and cash. See Note 6.
cAs of December 31, 2019, no longer held by the fund.
4. Expense Offset Arrangement
The Fund has entered into an arrangement with its custodian whereby credits realized as a result of uninvested cash balances are used to reduce a portion of the Fund’s custodian expenses. During the year ended December 31, 2019, the custodian fees were reduced as noted in the Consolidated Statement of Operations.
5. Income Taxes
For tax purposes, capital losses may be carried over to offset future capital gains.
At December 31, 2019, the capital loss carryforwards were as follows:
| | | | |
| Capital loss carryforwards not subject to expiration: | | | | |
Short term | | $ | 271,803 | |
Long term | | | 44,135,035 | |
| | | | |
| |
Total capital loss carryforwards | | $ | 44,406,838 | a |
| | | | |
aSubject to certain limitations under Internal Revenue Code Section 382.
The tax character of distributions paid during the years ended December 31, 2019 and 2018, was as follows:
| | | | | | | | |
| | | 2019 | | | 2018 | |
| | |
Distributions paid from ordinary income | | $ | 23,615,803 | | | $ | 17,119,410 | |
| | | | |
FRANKLIN TEMPLETON VARIABLE INSURANCE PRODUCTS TRUST
NOTES TO CONSOLIDATED FINANCIAL STATEMENTS
Franklin Strategic Income VIP Fund(continued)
At December 31, 2019, the cost of investments, net unrealized appreciation (depreciation) and undistributed ordinary income for income tax purposes were as follows:
| | | | |
Cost of investments | | $ | 440,938,896 | |
| | | | |
| |
Unrealized appreciation | | $ | 10,049,141 | |
Unrealized depreciation | | | (20,779,688 | ) |
| | | | |
| |
Net unrealized appreciation (depreciation) | | $ | (10,730,547 | ) |
| | | | |
| |
Distributable earnings: | | | | |
Undistributed ordinary income | | $ | 20,233,001 | |
| | | | |
Differences between income and/or capital gains as determined on a book basis and a tax basis are primarily due to differing treatments of foreign currency transactions, paydown losses, bond discounts and premiums and swaps.
6. Investment Transactions
Purchases and sales of investments (excluding short term securities) for the year ended December 31, 2019, aggregated $522,526,315 and $575,617,931, respectively. Purchases and sales of investments excludes in-kind transactions of $10,271,362 and $12,319,922, respectively.
7. Credit Risk and Defaulted Securities
At December 31, 2019, the Fund had 34.1% of its portfolio invested in high yield, senior secured floating rate loans, or other securities rated below investment grade and unrated securities, if any. These securities may be more sensitive to economic conditions causing greater price volatility and are potentially subject to a greater risk of loss due to default than higher rated securities.
The Fund held defaulted security and/or other securities for which the income has been deemed uncollectible. At December 31, 2019, the value of this security represents less than 0.1% of the Fund’s net assets. The Fund discontinues accruing income on securities for which income has been deemed uncollectible and provides an estimate for losses on interest receivable. The security has been identified in the accompanying Consolidated Statement of Investments.
8. Restricted Securities
The Fund invests in securities that are restricted under the Securities Act of 1933 (1933 Act). Restricted securities are often purchased in private placement transactions, and cannot be sold without prior registration unless the sale is pursuant to an exemption under the 1933 Act. Disposal of these securities may require greater effort and expense, and prompt sale at an acceptable price may be difficult. The Fund may have registration rights for restricted securities. The issuer generally incurs all registration costs.
At December 31, 2019, investments in restricted securities, excluding securities exempt from registration under the 1933 Act, were as follows:
| | | | | | | | | | | | | | | | |
Principal Amount/ Shares/ Units | | | Issuer | | Acquisition
Date | | | Cost | | | Value | |
| | | | |
| | 18,684 | | | aAppvion Operations Inc. | | | 4/12/19 | | | $ | 252,711 | | | $ | 254,512 | |
FRANKLIN TEMPLETON VARIABLE INSURANCE PRODUCTS TRUST
NOTES TO CONSOLIDATED FINANCIAL STATEMENTS
Franklin Strategic Income VIP Fund(continued)
8. Restricted Securities(continued)
| | | | | | | | | | | | | | | | |
Principal Amount/ Shares/ Units | | | Issuer | | Acquisition Date | | | Cost | | | Value | |
| | | | |
| | 14,792,309 | | | bK2016470219 South Africa Ltd., A | | | 2/08/13 - 2/01/17 | | | $ | 114,768 | | | $ | 10,563 | |
| | 1,472,041 | | | bK2016470219 South Africa Ltd., B | | | 2/01/17 | | | | 1,093 | | | | 1,051 | |
| | 7,021 | | | cRemington Outdoor Co. Inc., Litigation Units | | | 4/12/19 | | | | — | | | | — | |
| | | | | | | | | | | | |
| | | | |
| | | | Total Restricted Securities(Value is 0.1% of Net Assets) | | | | | | $ | 368,572 | | | $ | 266,126 | |
| | | | | | | | | | | | |
aThe Fund also invests in unrestricted securities of the issuer, valued at $419,874 as of December 31, 2019.
bThe Fund also invests in unrestricted securities of the issuer, valued at $1,202 as of December 31, 2019.
cThe Fund also invests in unrestricted securities of the issuer, valued at $ 46,610 as of December 31, 2019.
9. Other Derivative Information
At December 31, 2019, investments in derivative contracts are reflected in the Consolidated Statement of Assets and Liabilities as follows:
| | | | | | | | | | | | |
| | | Asset Derivatives | | | Liability Derivatives | |
| | | | |
Derivative Contracts Not Accounted for as Hedging Instruments | | Consolidated Statement of Assets and Liabilities Location | | Fair Value | | | Consolidated Statement of Assets and Liabilities Location | | Fair Value | |
| | | | |
Interest rate contracts | | Variation margin on futures contracts | | $ | 75,169 | a | | Variation margin on futures contracts | | $ | 238,428 | a |
| | | | |
| | Variation margin on centrally cleared swap contracts | | | — | | | Variation margin on centrally cleared swap contracts | | | 54,483 | a |
| | | | |
| | Unrealized appreciation on OTC swap contracts | | | 106,715 | | | Unrealized depreciation on OTC swap contracts | | | — | |
| | | | |
Foreign exchange contracts | | Unrealized appreciation on OTC forward exchange contracts | | | 423,942 | | | Unrealized depreciation on OTC forward exchange contracts | | | 1,204,238 | |
| | | | |
Credit contracts | | Variation margin on centrally cleared swap contracts | | | — | | | Variation margin on centrally cleared swap contracts | | | 12,412 | a |
| | | | |
| | OTC swap contracts (upfront payments) | | | 57,378 | | | OTC swap contracts (upfront receipts) | | | 2,661,442 | |
| | | | |
| | Unrealized appreciation on OTC swap contracts | | | 218,085 | | | Unrealized depreciation on OTC swap contracts | | | 170,609 | |
| | | | |
Value recovery instruments | | Investments in securities, at value | | | 937,657 | b | | | | | | |
| | | | | | | | | | | | |
Totals | | | | $ | 1,818,946 | | | | | $ | 4,341,612 | |
| | | | | | | | | | | | |
aThis amount reflects the cumulative appreciation (depreciation) of futures contracts and centrally cleared swap contracts as reported in the Consolidated Statement of Investments. Only the variation margin receivable/payable at year end is separately reported within the Consolidated Statement of Assets and Liabilities. Prior variation margin movements were recorded to cash upon receipt or payment.
bVRI are included in investments in securities, at value in the Consolidated Statement of Assets and Liabilities.
FRANKLIN TEMPLETON VARIABLE INSURANCE PRODUCTS TRUST
NOTES TO CONSOLIDATED FINANCIAL STATEMENTS
Franklin Strategic Income VIP Fund(continued)
For the year ended December 31, 2019, the effect of derivative contracts in the Consolidated Statement of Operations was as follows:
| | | | | | | | | | | | |
Derivative Contracts Not Accounted for as Hedging Instruments | | Consolidated Statement of
Operations Location | | Net Realized
Gain (Loss) for
the Year | | | Consolidated Statement of
Operations Location | | Net Change
in Unrealized
Appreciation
(Depreciation)
for the Year | |
| | Net realized gain (loss) from: | | | | | | Net change in unrealized appreciation (depreciation) on: | | | | |
Interest rate contracts | | Futures contracts | | | $ 2,909,366 | | | Futures contracts | | | $ (854,940 | ) |
| | Swap contracts | | | 924,836 | | | Swap contracts | | | 474,756 | |
Foreign exchange contracts | | Forward exchange contracts | | | 705,050 | | | Forward exchange contracts | | | (1,043,046 | ) |
Credit contracts | | Swap contracts | | | (2,124,706 | ) | | Swap contracts | | | 1,680,331 | |
Value recovery instruments | | Investments | | | 98,000 | a | | Investments | | | 301,784 | a |
| | | | | | | | | | | | |
Totals | | | | | $ 2,512,546 | | | | | | $ 558,885 | |
| | | | | | | | | | | | |
aVRI are included in net realized gain (loss) from investments and net change in unrealized appreciation (depreciation) on investments in the Consolidated Statement of Operations.
For the year ended December 31, 2019, the average month end notional amount of futures contracts and swap contracts and the average month end contract value for forward exchange contracts, and average month end fair value of VRI, were as follows:
| | | | |
Futures contracts | | $ | 64,842,977 | |
Swap contracts | | $ | 51,399,737 | |
Forward exchange contracts | | $ | 52,416,090 | |
VRI | | $ | 805,640 | |
| | | | | | |
| | | Gross Amounts of Assets and Liabilities Presented in the Consolidated Statement of Assets and Liabilities |
| | | Assetsa | | | | Liabilitiesa |
| | | |
Derivatives | | | | | | |
Forward exchange contracts | | $423,942 | | | | $1,204,238 |
Swap contracts | | 382,178 | | | | 2,832,051 |
| | |
| | | |
Total | | $806,120 | | | | $4,036,289 |
| | |
aAbsent an event of default or early termination, OTC derivative assets and liabilities are presented gross and not offset in the Consolidated Statement of Assets and Liabilities.
FRANKLIN TEMPLETON VARIABLE INSURANCE PRODUCTS TRUST
NOTES TO CONSOLIDATED FINANCIAL STATEMENTS
Franklin Strategic Income VIP Fund(continued)
9. Other Derivative Information(continued)
At December 31, 2019, OTC derivative assets, which may be offset against OTC derivative liabilities and collateral received from the counterparty, are as follows:
| | | | | | | | | | | | | | | | | | | | |
| | | | | | Amounts Not Offset in the | | | |
| | | | | | Consolidated Statement of Assets and Liabilities | | | |
| | | Gross Amounts of
Assets Presented in the Consolidated Statement of
Assets and Liabilities | | | Financial
Instruments
Available for
Offset | | | Financial
Instruments
Collateral
Receiveda | | | Cash
Collateral
Receiveda | | | Net Amount
(Not less
than zero) |
| | | | | |
Counterparty | | | | | | | | | | | | | | | | | | | | |
BNDP | | | $ 13,410 | | | | $ — | | | | $ — | | | | $ — | | | | $ 13,410 | |
BZWS | | | 63,494 | | | | (63,494 | ) | | | — | | | | — | | | | — | |
CITI | | | 141,889 | | | | (141,889 | ) | | | — | | | | — | | | | — | |
DBAB | | | — | | | | — | | | | — | | | | — | | | | — | |
FBCO | | | 33,128 | | | | — | | | | — | | | | — | | | | 33,128 | |
GSCO | | | 56,865 | | | | — | | | | — | | | | (56,865 | ) | | | — | |
JPHQ | | | 423,942 | | | | (423,942 | ) | | | — | | | | — | | | | — | |
MSCO | | | 73,392 | | | | — | | | | — | | | | — | | | | 73,392 | |
| | | | |
| | | | | |
Total | | | $806,120 | | | | $(629,325 | ) | | | $ — | | | | $(56,865 | ) | | | $119,930 | |
| | | | |
|
At December 31, 2019, OTC derivative liabilities, which may be offset against OTC derivative assets and collateral pledged to the counterparty, are as follows: | |
| | | | | | Amounts Not Offset in the | | | |
| | | | | | Consolidated Statement of Assets and Liabilities | | | |
| | | Gross Amounts of Liabilities Presented in the Consolidated Statement of
Assets and Liabilities | | | Financial
Instruments
Available for
Offset | | | Financial
Instruments
Collateral
Pledged | | | Cash
Collateral
Pledgeda | | | Net Amount
(Not less
than zero) |
| | | | | |
Counterparty | | | | | | | | | | | | | | | | | | | | |
BNDP | | | $ — | | | | $ — | | | | $ — | | | | $ — | | | | $ — | |
BZWS | | | 82,373 | | | | (63,494 | ) | | | — | | | | — | | | | 18,879 | |
CITI | | | 2,382,745 | | | | (141,889 | ) | | | — | | | | (2,240,856 | ) | | | — | |
DBAB | | | 3,750 | | | | — | | | | — | | | | — | | | | 3,750 | |
FBCO | | | — | | | | — | | | | — | | | | — | | | | — | |
GSCO | | | — | | | | — | | | | — | | | | — | | | | — | |
JPHQ | | | 1,567,421 | | | | (423,942 | ) | | | — | | | | (980,000 | ) | | | 163,479 | |
MSCO | | | — | | | | — | | | | — | | | | — | | | | — | |
| | | | |
| | | | | |
Total | | | $4,036,289 | | | | $(629,325 | ) | | | $ — | | | | $(3,220,856 | ) | | | $186,108 | |
| | | | |
aIn some instances, the collateral amounts disclosed in the table above were adjusted due to the requirement to limit collateral amounts to avoid the effect of overcollateralization. Actual collateral received and/or pledged may be more than the amounts disclosed herein.
See Note 1(d) regarding derivative financial instruments.
See Abbreviations on page FSI-53.
FRANKLIN TEMPLETON VARIABLE INSURANCE PRODUCTS TRUST
NOTES TO CONSOLIDATED FINANCIAL STATEMENTS
Franklin Strategic Income VIP Fund(continued)
10. Credit Facility
The Fund, together with other U.S. registered and foreign investment funds (collectively, Borrowers), managed by Franklin Templeton, are borrowers in a joint syndicated senior unsecured credit facility totaling $2 billion (Global Credit Facility) which matured on February 7, 2020. This Global Credit Facility provides a source of funds to the Borrowers for temporary and emergency purposes, including the ability to meet future unanticipated or unusually large redemption requests. Effective February 7, 2020, the Borrowers renewed the Global Credit Facility for a one year term, maturing February 5, 2021, for a total of $2 billion.
Under the terms of the Global Credit Facility, the Fund shall, in addition to interest charged on any borrowings made by the Fund and other costs incurred by the Fund, pay its share of fees and expenses incurred in connection with the implementation and maintenance of the Global Credit Facility, based upon its relative share of the aggregate net assets of all of the Borrowers, including an annual commitment fee of 0.15% based upon the unused portion of the Global Credit Facility. These fees are reflected in other expenses in the Consolidated Statement of Operations. During the year ended December 31, 2019, the Fund did not use the Global Credit Facility.
11. Redemption In-Kind
During the year ended December 31, 2018, the Fund realized $2,963,426 of net losses resulting from a redemption in-kind in which a shareholder redeemed fund shares for cash and securities held by the Fund. Because such losses are not taxable to the Fund, are not netted with capital gains that are distributed to remaining shareholders, they are reclassified from accumulated net realized losses to paid-in capital.
12. Fair Value Measurements
The Fund follows a fair value hierarchy that distinguishes between market data obtained from independent sources (observable inputs) and the Fund’s own market assumptions (unobservable inputs). These inputs are used in determining the value of the Fund’s financial instruments and are summarized in the following fair value hierarchy:
| | • | | Level 1 – quoted prices in active markets for identical financial instruments |
| | • | | Level 2 – other significant observable inputs (including quoted prices for similar financial instruments, interest rates, prepayment speed, credit risk, etc.) |
| | • | | Level 3 – significant unobservable inputs (including the Fund’s own assumptions in determining the fair value of financial instruments) |
The input levels are not necessarily an indication of the risk or liquidity associated with financial instruments at that level.
FRANKLIN TEMPLETON VARIABLE INSURANCE PRODUCTS TRUST
NOTES TO CONSOLIDATED FINANCIAL STATEMENTS
Franklin Strategic Income VIP Fund(continued)
12. Fair Value Measurements(continued)
A summary of inputs used as of December 31, 2019, in valuing the Fund’s assets and liabilities carried at fair value, is as follows:
| | | | | | | | | | | | | | | | |
| | | Level 1 | | | Level 2 | | | Level 3 | | | Total | |
| | | | |
Assets: | | | | | | | | | | | | | | | | |
Investments in Securities:a | | | | | | | | | | | | | | | | |
Equity Investments:b | | | | | | | | | | | | | | | | |
Commercial & Professional Services | | $ | — | | | $ | — | | | $ | 46,610 | | | $ | 46,610 | |
Consumer Services | | | — | | | | — | | | | 41,832 | | | | 41,832 | |
Energy | | | 443,679 | | | | 389,487 | | | | 2,073c | | | | 835,239 | |
Materials | | | 103,401 | | | | — | | | | 254,512 | | | | 357,913 | |
Media & Entertainment | | | 201,189 | | | | — | | | | 2,040 | | | | 203,229 | |
Retailing | | | — | | | | — | | | | 11,614 | | | | 11,614 | |
All Other Equity Investments | | | 9,264,918 | | | | — | | | | — | | | | 9,264,918 | |
Corporate Bonds: | | | | | | | | | | | | | | | | |
Retailing | | | — | | | | 767,445 | | | | 2,769 | | | | 770,214 | |
All Other Corporate Bonds | | | — | | | | 128,026,957 | | | | — | | | | 128,026,957 | |
Senior Floating Rate Interests: | | | | | | | | | | | | | | | | |
Household & Personal Products | | | — | | | | — | | | | 2,416,190 | | | | 2,416,190 | |
All Other Senior Floating Rate Interests | | | — | | | | 28,174,824 | | | | — | | | | 28,174,824 | |
Foreign Government and Agency Securities | | | — | | | | 54,161,093 | | | | — | | | | 54,161,093 | |
U.S. Government and Agency Securities | | | — | | | | 23,867,716 | | | | — | | | | 23,867,716 | |
Asset-Backed Securities and Commercial | | | | | | | | | | | | | | | | |
Mortgage-Backed Securities | | | — | | | | 119,962,933 | | | | — | | | | 119,962,933 | |
Mortgage-Backed Securities | | | — | | | | 35,690,949 | | | | — | | | | 35,690,949 | |
Municipal Bonds | | | — | | | | 18,507,076 | | | | — | | | | 18,507,076 | |
Escrows and Litigation Trusts | | | — | | | | 6,000 | | | | — | c | | | 6,000 | |
Short Term Investments | | | 11,463,714 | | | | — | | | | — | | | | 11,463,714 | |
| | | | |
Total Investments in Securities | | $ | 21,476,901 | | | $ | 409,554,480 | | | $ | 2,777,640 | | | $ | 433,809,021 | |
| | | | |
Other Financial Instruments: | | | | | | | | | | | | | | | | |
Futures Contracts | | $ | 75,169 | | | $ | — | | | $ | — | | | $ | 75,169 | |
Forward Exchange Contracts | | | — | | | | 423,942 | | | | — | | | | 423,942 | |
Swap Contracts. | | | — | | | | 324,800 | | | | — | | | | 324,800 | |
| | | | |
Total Other Financial Instruments | | $ | 75,169 | | | $ | 748,742 | | | $ | — | | | $ | 823,911 | |
| | | | |
Liabilities: | | | | | | | | | | | | | | | | |
Other Financial Instruments: | | | | | | | | | | | | | | | | |
Futures Contracts | | $ | 238,428 | | | $ | — | | | $ | — | | | $ | 238,428 | |
Forward Exchange Contracts | | | — | | | | 1,204,238 | | | | — | | | | 1,204,238 | |
Swap Contracts | | | — | | | | 237,504 | | | | — | | | | 237,504 | |
| | | | |
Total Other Financial Instruments | | $ | 238,428 | | | $ | 1,441,742 | | | $ | — | | | $ | 1,680,170 | |
aFor detailed categories, see the accompanying Consolidated Statement of Investments.
bIncludes common stocks and management investment companies as well as other equity interests.
cIncludes securities determined to have no value at December 31, 2019.
A reconciliation of assets in which Level 3 inputs are used in determining fair value is presented when there are significant Level 3 financial instruments at the beginning and/or end of the year.
FRANKLIN TEMPLETON VARIABLE INSURANCE PRODUCTS TRUST
NOTES TO CONSOLIDATED FINANCIAL STATEMENTS
Franklin Strategic Income VIP Fund(continued)
13. Subsequent Events
The Fund has evaluated subsequent events through the issuance of the consolidated financial statements and determined that no events have occurred that require disclosure other than those already disclosed in the consolidated financial statements.
| | | | | | | | | | |
| Abbreviations | | | | | | |
| | |
| Counterparty | | Currency | | Selected Portfolio |
| | | | | |
| BNDP | | BNP Paribas SA | | BRL | | Brazilian Real | | ARM | | Adjustable Rate Mortgage |
| | | | | |
| BZWS | | Barclays Bank PLC | | CNY | | Chinese Yuan | | CLO | | Collateralized Loan Obligation |
| | | | | |
| CITI | | Citigroup, Inc. | | COP | | Colombian Peso | | CMT | | 1 year Constant Maturity Treasury Index |
| | | | | |
| DBAB | | Deutsche Bank AG | | DOP | | Dominican Peso | | CNRR | | China Reverse Repo Rate |
| | | | | |
| FBCO | | Credit Suisse International | | EUR | | Euro | | FHLMC | | Federal Home Loan Mortgage Corp. |
| | | | | |
| GSCO | | The Goldman Sachs Group, Inc. | | IDR | | Indonesian Rupiah | | FNMA | | Federal National Mortgage Association |
| | | | | |
| JPHQ | | JP Morgan Chase & Co. | | MXN | | Mexican Peso | | FRN | | Floating Rate Note |
| | | | | |
| MSCO | | Morgan Stanley | | USD | | United States Dollar | | GDP | | Gross Domestic Product |
| | | | | |
| | | | UYU | | Uruguayan peso | | GNMA | | Government National Mortgage Association |
| | | | | |
| | | | ZAR | | South African rand | | LIBOR | | London InterBank Offered Rate |
| | | | | |
| | | | | | | | MBS | | Mortgage-Backed Security |
| | | | | |
| | | | | | | | PIK | | Payment-In-Kind |
| | | | | |
| | | | | | | | RDA | | Redevelopment Agency/Authority |
| | | | | |
| | | | | | | | SF | | Single Family |
| | | | | |
| | | | | | | | T-Note | | Treasury Note |
| | | | | |
| | | | | | | | VRI | | Value Recovery Instrument |
| | |
| Index | | |
| |
| CDX.EM.Series number | | CDX Emerging Markets Index |
| |
MCDX.NA.Series number | | MCDX North America Index |
FRANKLIN TEMPLETON VARIABLE INSURANCE PRODUCTS TRUST
Report of Independent Registered Public Accounting Firm
To the Board of Trustees of Franklin Templeton Variable Insurance Products Trust and Shareholders of Franklin Strategic Income VIP Fund
Opinion on the Financial Statements
We have audited the accompanying consolidated statement of assets and liabilities, including the consolidated statement of investments, of Franklin Strategic Income VIP Fund and its subsidiary (the “Fund”) as of December 31, 2019, the related consolidated statements of operations for the year ended December 31, 2019, the consolidated statement of changes in net assets for each of the two years in the period ended December 31, 2019, including the related notes, and the consolidated financial highlights for each of the five years in the period ended December 31, 2019 (collectively referred to as the “consolidated financial statements”). In our opinion, the consolidated financial statements present fairly, in all material respects, the financial position of the Fund as of December 31, 2019, the results of its operations for the year then ended, the changes in its net assets for each of the two years in the period ended December 31, 2019 and the financial highlights for each of the five years in the period ended December 31, 2019 in conformity with accounting principles generally accepted in the United States of America.
Basis for Opinion
These consolidated financial statements are the responsibility of the Fund’s management. Our responsibility is to express an opinion on the Fund’s consolidated financial statements based on our audits. We are a public accounting firm registered with the Public Company Accounting Oversight Board (United States) (PCAOB) and are required to be independent with respect to the Fund in accordance with the U.S. federal securities laws and the applicable rules and regulations of the Securities and Exchange Commission and the PCAOB.
We conducted our audits of these consolidated financial statements in accordance with the standards of the PCAOB. Those standards require that we plan and perform the audit to obtain reasonable assurance about whether the consolidated financial statements are free of material misstatement, whether due to error or fraud.
Our audits included performing procedures to assess the risks of material misstatement of the consolidated financial statements, whether due to error or fraud, and performing procedures that respond to those risks. Such procedures included examining, on a test basis, evidence regarding the amounts and disclosures in the consolidated financial statements. Our audits also included evaluating the accounting principles used and significant estimates made by management, as well as evaluating the overall presentation of the consolidated financial statements. Our procedures included confirmation of securities owned as of December 31, 2019 by correspondence with the custodian, transfer agent and brokers; when replies were not received from brokers, we performed other auditing procedures. We believe that our audits provide a reasonable basis for our opinion.
PricewaterhouseCoopers LLP
San Francisco, California
February 20, 2020
We have served as the auditor of one or more investment companies in the Franklin Templeton Group of Funds since 1948.
Templeton Developing Markets VIP Fund
This annual report for Templeton Developing Markets VIP Fund covers the fiscal year ended December 31, 2019.
Class 4 Performance Summary as of December 31, 2019
Average annual total return of Class 4 shares* represents the average annual change in value, assuming reinvestment of dividends and capital gains. Average returns smooth out variations in returns, which can be significant; they are not the same as year-by-year results.
| | | | | | |
Periods ended 12/31/19 | | 1-Year | | 5-Year | | 10-Year |
| | | |
Average Annual Total Return | | +26.49% | | +7.08% | | +3.59% |
*The Fund has a fee waiver associated with any investment it makes in a Franklin Templeton money fund and/or other Franklin Templeton fund, contractually guaranteed through 4/30/20. Fund investment results reflect the fee waiver; without this waiver, the results would have been lower.
Performance reflects the Fund’s Class 4 operating expenses, but doesnotinclude any contract fees, expenses or sales charges. If they had been included, performance would be lower. These charges and deductions, particularly for variable life policies, can have a significant effect on contract values and insurance benefits. See the contract prospectus for a complete description of these expenses, including sales charges.
Performance data represent past performance, which does not guarantee future results. Investment return and principal value will fluctuate, and you may have a gain or loss when you sell your shares. Current performance may differ from figures shown.
Total Return Index Comparison for a Hypothetical $10,000 Investment (1/1/10–12/31/19)
The graph below shows the change in value of a hypothetical $10,000 investment in the Fund over the indicated period and includes reinvestment of any income or distributions. The Fund’s performance* is compared to the performance of the MSCI Emerging Markets (EM) Index and the Standard & Poor’s®/International Finance Corporation Investable (S&P®/IFCI) Composite Index. One cannot invest directly in an index, and an index is not representative of the Fund’s portfolio.Please see Important Notes to Performance Information preceding the Fund Summaries.

**Source: Morningstar. Please see Index Descriptions following the Fund Summaries.
TEMPLETON DEVELOPING MARKETS VIP FUND
Fund Goal and Main Investments
The Fund seeks long-term capital appreciation. Under normal market conditions, the Fund invests at least 80% of its net assets in emerging market investments.
Fund Risks
All investments involve risks, including possible loss of principal. Special risks are associated with foreign investing, including currency fluctuations, economic instability and political developments. Investments in developing markets, of which frontier markets are a subset, involve heightened risks related to the same factors, in addition to those associated with these markets’ smaller size, lesser liquidity and lack of established legal, political, business and social frameworks to support securities markets. Because these frameworks are typically even less developed in frontier markets, as well as various factors including the increased potential for extreme price volatility, illiquidity, trade barriers and exchange controls, the risks associated with developing markets are magnified in frontier markets. The Fund is actively managed but there is no guarantee that the manager’s investment decisions will produce the desired results. The Fund’s prospectus also includes a description of the main investment risks.
Performance Overview
You can find the Fund’s one-year total return in the Performance Summary. In comparison, the MSCI EM Index posted a +18.90% total return, and the S&P/IFCI Composite Index posted a +18.09% total return for the same period.1 Please note, index performance numbers are for reference and we do not attempt to track an index but rather undertake investments on the basis of fundamental research.
Economic and Market Overview
Emerging market economies in general continued to grow faster than their developed market counterparts during the reporting period, though several emerging market countries’ growth rates fell to multi-year lows. China’s year-on-year growth rate in 2019’s third and fourth quarters reached the lowest level since 1992. Trade tensions with the U.S. and soft global demand weighed on the economy, while increased industrial production provided some support. Taiwan’s year-on-year growth rate slowed in 2019’s first quarter
Geographic Composition
Based on Total Net Assets as of 12/31/19
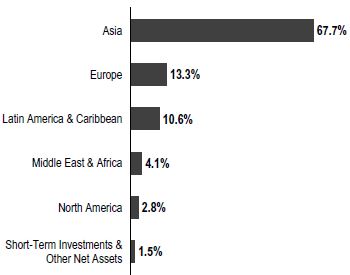
before accelerating in the next three quarters. South Korea’s year-on-year growth rate slowed in 2019’s first quarter, then improved in the next three quarters, aided by exports, services and consumption. India’s year-on-year growth rate moderated to a six-year low in 2019’s third quarter, as exports and manufacturing contracted. Turning to Europe, Russia’s year-on-year growth rate accelerated in 2019’s second and third quarters following a slowdown in the first quarter. Many sectors saw quarterly contractions, while manufacturing, real estate activities and financial and insurance activities growth accelerated. In Latin America, Brazil’s year-on-year growth rate accelerated in 2019’s second and third quarters, aided by household spending and construction, after moderating in the first quarter.
Many emerging market central banks adopted more accommodative monetary policies during the period in response to sluggish global economic growth and U.S.-China trade tensions. The People’s Bank of China (PBOC) implemented an interest-rate reform in August, designating the loan prime rate (LPR) as the new benchmark for household and business loans, effectively lowering interest rates. The PBOC subsequently lowered the LPR twice. Additionally, the PBOC lowered its cash reserve requirement ratio for some banks in an effort to improve market liquidity. Taiwan’s central bank left its benchmark interest rate unchanged during the period, while South Korea’s central bank lowered its benchmark interest rate twice amid deflationary pressures. India’s central bank cut its
1. Source: Morningstar. One cannot invest directly in an index, and an index is not representative of the Fund’s portfolio. Please see Index Descriptions following the Fund Summaries.
The dollar value, number of shares or principal amount, and names of all portfolio holdings are listed in the Fund’s Statement of Investments (SOI).
TEMPLETON DEVELOPING MARKETS VIP FUND
benchmark rate several times in an effort to boost slowing growth. Russia’s central bank cut its key rate several times as inflation slowed. Brazil’s central bank cut its benchmark interest rate several times to its lowest rate on record due to a slower-than-expected economic recovery and relatively benign inflation.
Emerging market equities rose during the 12-month period, though they lagged their developed market counterparts. Calendar-year 2019 was a strong but volatile year for emerging market stocks, which performed well in the first and fourth quarters but posted anemic or negative returns in the middle two quarters. Interest-rate cuts by the U.S. Federal Reserve and other central banks supported equities, as did signs of an imminent phase one of the U.S.-China trade deal near year-end. Factors holding back gains included persistent U.S.-China trade tensions, geopolitical instability and the global economic slowdown. Regionally, Asian emerging market equities were led by export-oriented Taiwan, partly due to strong pre-orders of the new iPhone. In Latin America, Brazil posted strong returns as investors responded positively to President Jair Bolsonaro’s economic policies. In Europe, Russian equities posted robust returns due to many companies’ greater emphasis on shareholder returns as well as the country’s perceived relative insulation from global trade conflicts. In this environment, emerging market stocks, as measured by the MSCI Emerging Markets Index, posted a +18.90% total return for the 12 months ended December 31, 2019.1
Investment Strategy
We employ a fundamental research, value-oriented, long-term investment approach. We focus on the market price of a company’s securities relative to our evaluation of its long-term earnings, asset value and cash flow potential. This includes an assessment of the potential impacts of material environmental, social and governance factors on the long-term risk and return profile of a company. We also consider a company’s profit and loss outlook, balance sheet strength, cash flow trends and asset value in relation to the current price of the company’s securities. Our analysis considers the company’s position in its sector, the economic framework and political environment.
Manager’s Discussion
Key stock contributors to absolute performance during the period were Taiwan Semiconductor Manufacturing Co. (TSMC), Samsung Electronics and Alibaba Group Holding.
TSMC is one of the world’s leading semiconductor manufacturers and counts major technology companies
Top 10 Countries
12/31/19
| | | | |
| | | % of Total
Net Assets | |
China | | | 26.2% | |
South Korea | | | 17.0% | |
Taiwan | | | 10.7% | |
Russia | | | 9.1% | |
Brazil | | | 8.0% | |
India | | | 7.5% | |
South Africa | | | 3.8% | |
U.S. | | | 2.8% | |
U.K. | | | 2.7% | |
Thailand | | | 2.2% | |
among its clients. The chip maker posted solid growth in its 2019 third-quarter revenues and earnings, and projected further revenue growth due to the rollout of premium smartphones and high-performance computing applications. An improving global outlook for memory chips and easing U.S.-China trade friction—which boosted sentiment towards companies within the global technology supply chain—further benefitted the company. As a supplier to smartphone maker Apple (not a Fund holding), TSMC also rose on better-than-expected sales for the latest iPhone.
Samsung is a South Korea-based consumer electronics and semiconductor manufacturer. It is one of the world’s largest smartphone and memory chip producers as well as a key supplier of organic light-emitting diode (LED) displays. The company’s share price was pressured early in the year by disappointing first- and second-quarter 2019 corporate results, weak investor confidence in the technology sector and increased macroeconomic uncertainties resulting from geopolitical issues. In the latter part of the period, shares recovered to near record highs due to expectations of better supply and demand dynamics leading to the bottoming of memory prices as well as improving market sentiment.
Alibaba is the leading e-commerce company in China. The company also provides cloud computing services and is involved in payment, financing and logistics services. Following a period of share-price volatility driven by the U.S.-China trade conflict, shares jumped in the final quarter to end 2019 at a record high. Operationally, Alibaba continued to report strong quarterly results throughout the year. Solid e-commerce sales growth trends in China also boded well for the company’s businesses. Strong investor demand for its secondary listing in Hong Kong and market optimism about its multiple digital ventures further drove investor confidence in the stock.
TEMPLETON DEVELOPING MARKETS VIP FUND
In contrast, key detractors included Massmart Holdings, Glenmark Pharmaceuticals and HDC Hyundai Development Co-Engineering & Construction (HDC).
Massmart is a leading South African wholesaler, distributor and retailer of food products, general merchandise, alcohol, and home improvement equipment and supplies. U.S.-based Walmart (not a Fund holding), the world’s largest retailer, owns a controlling stake in the company. Weak merchandising, online competition and slowing revenue growth amid a weak macroeconomic environment has delayed a turnaround in the group’s retail discount stores segment. Depreciation in regional currencies further pressured the business and, following the release of a profit decline warning, the company reported a loss for the first half of 2019 and did not pay out any dividends. The resignation of the chief executive officer (CEO) and chief financial officer further impacted sentiment. A new CEO was brought in from Walmart to turn around the business, and we have already seen some management changes aimed at driving sales and margins. The stock price has since stabilized on expectations that the new management will continue to take a proactive approach.
Glenmark Pharmaceuticals is a mid-size Indian pharmaceutical company with a presence in generics and research and development. The company’s shares fell sharply due to delays in U.S. approvals, including for the launch of a new product for the treatment of seasonal allergic rhinitis, and regulatory concerns at one of its formulation facilities. Weak 2019 second-quarter results further impacted sentiment, as lower U.S. revenues and higher research and development costs led to lower-than-expected revenue and earnings. Shares rebounded late in the year, however, following the release of better-than-expected third-quarter results driven by strong performance in India and the U.S.
HDC is a leading residential property developer in South Korea. With a strong brand name, “I-Park,” the company is estimated to have the largest market share in the residential construction business in South Korea. The downturn in the housing market and delayed development projects due to the government’s tightening regulations continued to impact investor sentiment in the stock. Disappointing third-quarter results, which included a decline in revenues and operating profits, also pressured shares. The company’s ultimately successful bid to acquire South Korea-based Asiana Airlines also hurt its share price. Though HDC has some exposure to non-residential businesses like hotels and duty-free stores,
Top 10 Holdings
12/31/19
| | | | |
Company Sector/Industry, Country | | % of Total
Net Assets | |
Taiwan Semiconductor Manufacturing Co. Ltd. Semiconductors & Semiconductor Equipment, Taiwan | | | 8.3% | |
Samsung Electronics Co. Ltd. Technology Hardware, Storage & Peripherals, South Korea | | | 7.8% | |
Alibaba Group Holding Ltd. Internet & Direct Marketing Retail, China | | | 5.9% | |
Tencent Holdings Ltd. Interactive Media & Services, China | | | 5.5% | |
ICICI Bank Ltd. Banks, India | | | 4.1% | |
Naspers Ltd. Internet & Direct Marketing Retail, South Africa | | | 3.2% | |
Naver Corp. Interactive Media & Services, South Korea | | | 3.0% | |
LUKOIL PJSC Oil, Gas & Consumable Fuels, Russia | | | 2.8% | |
Unilever PLC Personal Products, U.K. | | | 2.7% | |
Brilliance China Automotive Holdings Ltd. Automobiles, China | | | 2.6% | |
investors viewed the move unfavorably due to its divergence from the company’s core activity and concerns that acquisition costs could impact company finances.
In the last 12 months, the Fund increased its holdings in China, Brazil and Mexico due to their solid fundamentals. Investments in U.S.-listed companies that have significant exposure to emerging markets were also increased. In terms of sectors, additions were undertaken in financials and industrials.2 Key additions to the portfolio included Vale, a major global iron ore producer; China Merchants Bank, a Chinese Bank; and Samsung Life Insurance, one of the largest insurance companies in South Korea. We increased our existing positions in Cognizant Technology Solutions, a major global information technology services company, and Tencent Holdings, one of the largest internet services companies in China.
The Fund reduced its investments in South Africa, Taiwan and Peru in favor of stocks we deemed to be more attractively valued within our investment universe. Sectors which experienced the largest sales were consumer
2. The financials sector comprises banks, capital markets, diversified financial services and insurance in the SOI. The industrials sector comprises construction and engineering, industrial conglomerates and transportation infrastructure in the SOI.
TEMPLETON DEVELOPING MARKETS VIP FUND
discretionary, communication services and consumer staples.3 Key reductions included Naspers, an internet and media group based in South Africa; Prosus, the international internet assets spin-off of Naspers; and Ping An Bank, a Chinese bank. Key liquidations included Peruvian precious metals company Compania De Minas Buenaventura, cement producer Semen Indonesia, and beverages maker Nigerian Breweries, the last of which eliminated the Fund’s exposure to that market.
Thank you for your participation in Templeton Developing Markets VIP Fund. We look forward to serving your future investment needs.
The foregoing information reflects our analysis, opinions and portfolio holdings as of December 31, 2019, the end of the reporting period. The way we implement our main investment strategies and the resulting portfolio holdings may change depending on factors such as market and economic conditions. These opinions may not be relied upon as investment advice or an offer for a particular security. The information is not a complete analysis of every aspect of any market, country, industry, security or the Fund. Statements of fact are from sources considered reliable, but the investment manager makes no representation or warranty as to their completeness or accuracy. Although historical performance is no guarantee of future results, these insights may help you understand our investment management philosophy.
3. The consumer discretionary sector comprises auto components; automobiles; hotels, restaurants and leisure; internet and direct marketing retail; multiline retail; and textiles, apparel and luxury goods in the SOI. The communication services sector comprises entertainment, interactive media and services, media and wireless telecommunication services in the SOI. The consumer staples sector comprises beverages, food and staples retailing, food products and personal products in the SOI.
TEMPLETON DEVELOPING MARKETS VIP FUND
Class 4 Fund Expenses
As an investor in a variable insurance contract (Contract) that indirectly provides for investment in an underlying mutual fund, you can incur transaction and/or ongoing expenses at both the Fund level and the Contract Level: (1) transaction expenses can include sales charges (loads) on purchases, surrender fees, transfer fees and premium taxes; and (2) ongoing expenses can include management fees, distribution and service (12b-1) fees, contract fees, annual maintenance fees, mortality and expense risk fees and other fees and expenses. All mutual funds and Contracts have some types of ongoing expenses. The table below shows Fund-level ongoing expenses and can help you understand these costs and compare them with those of other mutual funds offered through the Contract. The table assumes a $1,000 investment held for the six months indicated. Please refer to the Fund prospectus for additional information on operating expenses.
Actual Fund Expenses
The table below provides information about the actual account values and actual expenses in the columns under the heading “Actual.” In these columns the Fund’s actual return, which includes the effect of ongoing Fund expenses but does not include the effect of ongoing Contract expenses, is used to calculate the “Ending Account Value.” You can estimate the Fund-level expenses you paid during the period by following these steps (of course, your account value and expenses will differ from those in this illustration): Divide your account value by $1,000 (if your account had an $8,600 value, then $8,600 ÷ $1,000 = 8.6). Then multiply the result by the number under the headings “Actual” and “Fund-Level Expenses Paid During Period” (if Fund-Level Expenses Paid During Period were $ 7.50, then 8.6 x $ 7.50 = $64.50). In this illustration, the estimated expenses paid this period at the Fund level are $64.50.
Hypothetical Example for Comparison with Other Mutual Funds
Under the heading “Hypothetical” in the table, information is provided about hypothetical account values and hypothetical expenses based on the Fund’s actual expense ratio and an assumed rate of return of 5% per year before expenses, which is not the Fund’s actual return. This information may not be used to estimate the actual ending account balance or expenses you paid for the period, but it can help you compare ongoing costs of investing in the Fund with those of other mutual funds offered through the Contract. To do so, compare this 5% hypothetical example with the 5% hypothetical examples that appear in the shareholder reports of other funds offered through the Contract.
Please note that expenses shown in the table are meant to highlight ongoing costs at the Fund level only and do not reflect any ongoing expenses at the Contract level, or transaction expenses at either the Fund or Contract levels. In addition, while the Fund does not have transaction expenses, if the transaction and ongoing expenses at the Contract level were included, the expenses shown below would be higher. You should consult your Contract prospectus or disclosure document for more information.
| | | | | | | | | | | | | | |
| | | | | Actual (actual return after expenses) | | | | Hypothetical (5% annual return before expenses) |
Share Class | | Beginning Account Value 7/1/19 | | Ending Account Value 12/31/19 | | Fund-Level Expenses Paid During Period 7/1/19–12/31/191, 2 | | | | Ending Account Value 12/31/19 | | Fund-Level Expenses Paid During Period 7/1/19–12/31/191, 2 | | Net Annualized Expense Ratio2 |
| | | | | | | | |
Class 4 | | $1,000 | | $1,109.20 | | $7.97 | | | | $1,017.64 | | $7.63 | | 1.50% |
1. Expenses are equal to the annualized expense ratio for the six-month period as indicated above—in the far right column—multiplied by the simple average account value over the period indicated, and then multiplied by 184/365 to reflect the one-half year period.
2. Reflects expenses after fee waivers and expense reimbursements. Does not include any ongoing expenses of the Contract for which the Fund is an investment option or acquired fund fees and expenses.
FRANKLIN TEMPLETON VARIABLE INSURANCE PRODUCTS TRUST
Financial Highlights
Templeton Developing Markets VIP Fund
| | | | | | | | | | | | | | | | | | | | |
| | | Year Ended December 31, | |
| | | 2019 | | | 2018 | | | 2017 | | | 2016 | | | 2015 | |
| | | | | |
Class 1 | | | | | | | | | | | | | | | | | | | | |
| | | | | |
Per share operating performance | | | | | | | | | | | | | | | | | | | | |
(for a share outstanding throughout the year) | | | | | | | | | | | | | | | | | | | | |
| | | | | |
Net asset value, beginning of year | | | $ 8.62 | | | | $10.31 | | | | $ 7.42 | | | | $ 6.37 | | | | $ 9.27 | |
| | | | | |
Income from investment operationsa: | | | | | | | | | | | | | | | | | | | | |
| | | | | |
Net investment incomeb | | | 0.18 | | | | 0.09 | | | | 0.08 | | | | 0.05 | | | | 0.06 | |
| | | | | |
Net realized and unrealized gains (losses) | | | 2.12 | | | | (1.67 | ) | | | 2.92 | | | | 1.08 | | | | (1.63 | ) |
| | | | | |
Total from investment operations | | | 2.30 | | | | (1.58 | ) | | | 3.00 | | | | 1.13 | | | | (1.57 | ) |
| | | | | |
Less distributions from: | | | | | | | | | | | | | | | | | | | | |
| | | | | |
Net investment income | | | (0.12 | ) | | | (0.11 | ) | | | (0.11 | ) | | | (0.08 | ) | | | (0.20 | ) |
| | | | | |
Net realized gains | | | — | | | | — | | | | — | | | | — | | | | (1.13 | ) |
| | | | | |
Total distributions | | | (0.12 | ) | | | (0.11 | ) | | | (0.11 | ) | | | (0.08 | ) | | | (1.33 | ) |
| | | | | |
Net asset value, end of year | | | $ 10.80 | | | | $ 8.62 | | | | $10.31 | | | | $ 7.42 | | | | $ 6.37 | |
| | | | | |
Total returnc | | | 26.92% | | | | (15.44)% | | | | 40.65% | | | | 17.79% | | | | (19.42)% | |
| | | | | |
Ratios to average net assets | | | | | | | | | | | | | | | | | | | | |
| | | | | |
Expenses before waiver and payments by affiliates | | | 1.15% | | | | 1.24% | | | | 1.36% | | | | 1.38% | | | | 1.33% | |
| | | | | |
Expenses net of waiver and payments by affiliates | | | 1.15% | d | | | 1.24% | d | | | 1.35% | e | | | 1.36% | | | | 1.32% | |
| | | | | |
Net investment income | | | 1.83% | | | | 0.99% | | | | 0.86% | | | | 0.79% | | | | 0.74% | |
| | | | | |
Supplemental data | | | | | | | | | | | | | | | | | | | | |
| | | | | |
Net assets, end of year (000’s) | | | $97,271 | | | | $85,397 | | | | $105,493 | | | | $82,596 | | | | $77,000 | |
| | | | | |
Portfolio turnover rate | | | 18.04% | | | | 9.22% | | | | 10.76% | | | | 26.78% | | | | 71.69% | |
aThe amount shown for a share outstanding throughout the period may not correlate with the Statement of Operations for the period due to the timing of sales and repurchases of the Fund’s shares in relation to income earned and/or fluctuating fair value of the investments of the Fund.
bBased on average daily shares outstanding.
cTotal return does not include fees, charges or expenses imposed by the variable annuity and life insurance contracts for which Franklin Templeton Variable Insurance Products Trust serves as an underlying investment vehicle.
dBenefit of waiver and payments by affiliates rounds to less than 0.01%.
eBenefit of expense reduction rounds to less than 0.01%.
| | | | |
| | | |
| | The accompanying notes are an integral part of these financial statements. | Annual Report | | TD-7 |
FRANKLIN TEMPLETON VARIABLE INSURANCE PRODUCTS TRUST
FINANCIAL HIGHLIGHTS
Templeton Developing Markets VIP Fund(continued)
| | | | | | | | | | | | | | | | | | | | |
| | | Year Ended December 31, | |
| | | 2019 | | | 2018 | | | 2017 | | | 2016 | | | 2015 | |
| | | | | |
Class 2 | | | | | | | | | | | | | | | | | | | | |
| | | | | |
Per share operating performance | | | | | | | | | | | | | | | | | | | | |
(for a share outstanding throughout the year) | | | | | | | | | | | | | | | | | | | | |
| | | | | |
Net asset value, beginning of year | | | $ 8.54 | | | | $10.23 | | | | $ 7.36 | | | | $ 6.32 | | | | $ 9.20 | |
| | | | | |
Income from investment operationsa: | | | | | | | | | | | | | | | | | | | | |
| | | | | |
Net investment incomeb | | | 0.15 | | | | 0.07 | | | | 0.05 | | | | 0.04 | | | | 0.04 | |
| | | | | |
Net realized and unrealized gains (losses) | | | 2.11 | | | | (1.68 | ) | | | 2.91 | | | | 1.06 | | | | (1.61 | ) |
| | | | | |
Total from investment operations | | | 2.26 | | | | (1.61 | ) | | | 2.96 | | | | 1.10 | | | | (1.57 | ) |
| | | | | |
Less distributions from: | | | | | | | | | | | | | | | | | | | | |
| | | | | |
Net investment income | | | (0.09 | ) | | | (0.08 | ) | | | (0.09 | ) | | | (0.06 | ) | | | (0.18 | ) |
| | | | | |
Net realized gains | | | — | | | | — | | | | — | | | | — | | | | (1.13 | ) |
| | | | | |
Total distributions | | | (0.09 | ) | | | (0.08 | ) | | | (0.09 | ) | | | (0.06 | ) | | | (1.31 | ) |
| | | | | |
Net asset value, end of year | | | $10.71 | | | | $ 8.54 | | | | $10.23 | | | | $ 7.36 | | | | $ 6.32 | |
| | | | | |
Total returnc | | | 26.70% | | | | (15.79)% | | | | 40.41% | | | | 17.44% | | | | (19.60)% | |
| | | | | |
Ratios to average net assets | | | | | | | | | | | | | | | | | | | | |
| | | | | |
Expenses before waiver and payments by affiliates | | | 1.40% | | | | 1.49% | | | | 1.61% | | | | 1.63% | | | | 1.58% | |
| | | | | |
Expenses net of waiver and payments by affiliates | | | 1.40% | d | | | 1.49% | d | | | 1.60% | e | | | 1.61% | | | | 1.57% | |
| | | | | |
Net investment income | | | 1.58% | | | | 0.74% | | | | 0.61% | | | | 0.54% | | | | 0.49% | |
| | | | | |
Supplemental data | | | | | | | | | | | | | | | | | | | | |
| | | | | |
Net assets, end of year (000’s) | | | $231,645 | | | | $195,305 | | | | $270,433 | | | | $205,151 | | | | $192,120 | |
| | | | | |
Portfolio turnover rate | | | 18.04% | | | | 9.22% | | | | 10.76% | | | | 26.78% | | | | 71.69% | |
aThe amount shown for a share outstanding throughout the period may not correlate with the Statement of Operations for the period due to the timing of sales and repurchases of the Fund’s shares in relation to income earned and/or fluctuating fair value of the investments of the Fund.
bBased on average daily shares outstanding.
cTotal return does not include fees, charges or expenses imposed by the variable annuity and life insurance contracts for which Franklin Templeton Variable Insurance Products Trust serves as an underlying investment vehicle.
dBenefit of waiver and payments by affiliates rounds to less than 0.01%.
eBenefit of expense reduction rounds to less than 0.01%.
| | | | |
| | | |
TD-8 | | Annual Report | The accompanying notes are an integral part of these financial statements. | | |
FRANKLIN TEMPLETON VARIABLE INSURANCE PRODUCTS TRUST
FINANCIAL HIGHLIGHTS
Templeton Developing Markets VIP Fund(continued)
| | | | | | | | | | | | | | | | | | | | |
| | | Year Ended December 31, | |
| | | 2019 | | | 2018 | | | 2017 | | | 2016 | | | 2015 | |
| | | | | |
Class 4 | | | | | | | | | | | | | | | | | | | | |
| | | | | |
Per share operating performance | | | | | | | | | | | | | | | | | | | | |
(for a share outstanding throughout the year) | | | | | | | | | | | | | | | | | | | | |
| | | | | |
Net asset value, beginning of year | | | $ 8.59 | | | | $10.28 | | | | $ 7.39 | | | | $ 6.34 | | | | $ 9.22 | |
| | | | | |
Income from investment operationsa: | | | | | | | | | | | | | | | | | | | | |
| | | | | |
Net investment incomeb | | | 0.15 | | | | 0.06 | | | | 0.05 | | | | 0.03 | | | | 0.03 | |
| | | | | |
Net realized and unrealized gains (losses) | | | 2.11 | | | | (1.68 | ) | | | 2.92 | | | | 1.06 | | | | (1.62 | ) |
| | | | | |
Total from investment operations | | | 2.26 | | | | (1.62 | ) | | | 2.97 | | | | 1.09 | | | | (1.59 | ) |
| | | | | |
Less distributions from: | | | | | | | | | | | | | | | | | | | | |
| | | | | |
Net investment income | | | (0.08 | ) | | | (0.07 | ) | | | (0.08 | ) | | | (0.04 | ) | | | (0.16 | ) |
| | | | | |
Net realized gains | | | — | | | | — | | | | — | | | | — | | | | (1.13 | ) |
| | | | | |
Total distributions | | | (0.08 | ) | | | (0.07 | ) | | | (0.08 | ) | | | (0.04 | ) | | | (1.29 | ) |
| | | | | |
Net asset value, end of year | | | $10.77 | | | | $ 8.59 | | | | $10.28 | | | | $ 7.39 | | | | $ 6.34 | |
| | | | | |
Total returnc | | | 26.49% | | | | (15.81)% | | | | 40.30% | | | | 17.32% | | | | (19.70)% | |
| | | | | |
Ratios to average net assets | | | | | | | | | | | | | | | | | | | | |
| | | | | |
Expenses before waiver and payments by affiliates | | | 1.50% | | | | 1.59% | | | | 1.71% | | | | 1.73% | | | | 1.68% | |
| | | | | |
Expenses net of waiver and payments by affiliates | | | 1.50% | d | | | 1.59% | d | | | 1.70% | e | | | 1.71% | | | | 1.67% | |
| | | | | |
Net investment income | | | 1.48% | | | | 0.64% | | | | 0.51% | | | | 0.44% | | | | 0.39% | |
| | | | | |
Supplemental data | | | | | | | | | | | | | | | | | | | | |
| | | | | |
Net assets, end of year (000’s) | | | $5,590 | | | | $5,203 | | | | $7,199 | | | | $6,377 | | | | $7,109 | |
| | | | | |
Portfolio turnover rate | | | 18.04% | | | | 9.22% | | | | 10.76% | | | | 26.78% | | | | 71.69% | |
aThe amount shown for a share outstanding throughout the period may not correlate with the Statement of Operations for the period due to the timing of sales and repurchases of the Fund’s shares in relation to income earned and/or fluctuating fair value of the investments of the Fund.
bBased on average daily shares outstanding.
cTotal return does not include fees, charges or expenses imposed by the variable annuity and life insurance contracts for which Franklin Templeton Variable Insurance Products Trust serves as an underlying investment vehicle.
dBenefit of waiver and payments by affiliates rounds to less than 0.01%.
eBenefit of expense reduction rounds to less than 0.01%.
| | | | |
| | | |
| | The accompanying notes are an integral part of these financial statements. | Annual Report | | TD-9 |
FRANKLIN TEMPLETON VARIABLE INSURANCE PRODUCTS TRUST
Statement of Investments, December 31, 2019
Templeton Developing Markets VIP Fund
| | | | | | | | | | |
| | | Industry | | Shares/
Rights | | | Value | |
| | |
Common Stocks and Other Equity Interests 93.3% | | | | | | | | |
| | | |
Brazil 2.8% | | | | | | | | | | |
aB2W Cia Digital | | Internet & Direct Marketing Retail | | | 87,800 | | | $ | 1,373,083 | |
B3 SA - Brasil Bolsa Balcao | | Capital Markets | | | 105,900 | | | | 1,132,112 | |
Lojas Americanas SA | | Multiline Retail | | | 169,200 | | | | 829,267 | |
aLojas Americanas SA, rts., 1/08/20 | | Multiline Retail | | | 1,632 | | | | 3,049 | |
M. Dias Branco SA | | Food Products | | | 136,200 | | | | 1,292,706 | |
Mahle-Metal Leve SA | | Auto Components | | | 2,500 | | | | 17,913 | |
Totvs SA | | Software | | | 48,900 | | | | 785,295 | |
Vale SA | | Metals & Mining | | | 304,900 | | | | 4,043,083 | |
| | | | | | | | | | |
| | | | | | | | | 9,476,508 | |
| | | | | | | | | | |
Cambodia 0.9% | | | | | | | | | | |
NagaCorp Ltd. | | Hotels, Restaurants & Leisure | | | 1,787,400 | | | | 3,119,572 | |
| | | | | | | | | | |
| | | |
China 26.2% | | | | | | | | | | |
aAlibaba Group Holding Ltd., ADR | | Internet & Direct Marketing Retail | | | 93,210 | | | | 19,769,841 | |
BAIC Motor Corp. Ltd., H | | Automobiles | | | 1,686,100 | | | | 956,401 | |
aBaidu Inc., ADR | | Interactive Media & Services | | | 9,411 | | | | 1,189,550 | |
Brilliance China Automotive Holdings Ltd. | | Automobiles | | | 8,566,600 | | | | 8,882,888 | |
China Construction Bank Corp., H | | Banks | | | 7,168,000 | | | | 6,190,809 | |
China Merchants Bank Co. Ltd., A | | Banks | | | 337,500 | | | | 1,821,469 | |
China Merchants Bank Co. Ltd., H | | Banks | | | 507,700 | | | | 2,609,420 | |
China Mobile Ltd. | | Wireless Telecommunication Services | | | 447,000 | | | | 3,757,363 | |
China Petroleum & Chemical Corp., H | | Oil, Gas & Consumable Fuels | | | 2,500,900 | | | | 1,505,232 | |
China Resources Cement Holdings Ltd. | | Construction Materials | | | 2,675,000 | | | | 3,405,413 | |
CNOOC Ltd. | | Oil, Gas & Consumable Fuels | | | 2,411,500 | | | | 4,010,759 | |
COSCO SHIPPING Ports Ltd. | | Transportation Infrastructure | | | 865,196 | | | | 708,385 | |
Health & Happiness H&H International Holdings Ltd. | | Food Products | | | 418,400 | | | | 1,731,632 | |
NetEase Inc., ADR | | Entertainment | | | 4,253 | | | | 1,304,140 | |
Ping An Bank Co. Ltd., A | | Banks | | | 928,200 | | | | 2,192,798 | |
Ping An Insurance Group Co. of China Ltd., A | | Insurance | | | 225,745 | | | | 2,770,589 | |
aProsus NV | | Internet & Direct Marketing Retail | | | 26,357 | | | | 1,966,498 | |
Sunny Optical Technology Group Co. Ltd. | | Electronic Equipment, Instruments & Components | | | 159,000 | | | | 2,752,602 | |
Tencent Holdings Ltd. | | Interactive Media & Services | | | 381,100 | | | | 18,369,565 | |
Uni-President China Holdings Ltd. | | Food Products | | | 1,103,300 | | | | 1,158,194 | |
Weifu High-Technology Co. Ltd., B | | Auto Components | | | 334,339 | | | | 574,516 | |
| | | | | | | | | | |
| | | | | | | | | 87,628,064 | |
| | | | | | | | | | |
Czech Republic 0.5% | | | | | | | | | | |
Moneta Money Bank AS | | Banks | | | 390,403 | | | | 1,463,376 | |
| | | | | | | | | | |
| | | |
Hong Kong 0.1% | | | | | | | | | | |
Dairy Farm International Holdings Ltd. | | Food & Staples Retailing | | | 64,033 | | | | 365,628 | |
| | | | | | | | | | |
| | | |
Hungary 1.0% | | | | | | | | | | |
Richter Gedeon Nyrt | | Pharmaceuticals | | | 155,260 | | | | 3,375,904 | |
| | | | | | | | | | |
| | | |
India 7.5% | | | | | | | | | | |
Bajaj Holdings & Investment Ltd. | | Diversified Financial Services | | | 43,390 | | | | 2,071,507 | |
Biocon Ltd. | | Biotechnology | | | 574,280 | | | | 2,363,759 | |
Coal India Ltd. | | Oil, Gas & Consumable Fuels | | | 232,535 | | | | 688,757 | |
FRANKLIN TEMPLETON VARIABLE INSURANCE PRODUCTS TRUST
STATEMENT OF INVESTMENTS
Templeton Developing Markets VIP Fund(continued)
| | | | | | | | | | | | | | |
| | | Industry | | | Shares/ Rights | | | | | Value | |
|
Common Stocks and Other Equity Interests(continued) | |
India(continued) | | | | | | | | | | | | | | |
Glenmark Pharmaceuticals Ltd. | | | Pharmaceuticals | | | | 292,323 | | | | | $ | 1,423,413 | |
ICICI Bank Ltd. | | | Banks | | | | 1,806,409 | | | | | | 13,642,685 | |
Infosys Ltd. | | | IT Services | | | | 306,365 | | | | | | 3,139,216 | |
Tata Chemicals Ltd. | | | Chemicals | | | | 194,400 | | | | | | 1,817,452 | |
| | | | | | | | | | | | | | |
| | | | |
| | | | | | | | | | | | | 25,146,789 | |
| | | | | | | | | | | | | | |
Indonesia 1.1% | | | | | | | | | | | | | | |
Astra International Tbk PT | | | Automobiles | | | | 7,340,300 | | | | | | 3,661,558 | |
| | | | | | | | | | | | | | |
| | | | |
Kenya 0.3% | | | | | | | | | | | | | | |
Equity Group Holdings PLC | | | Banks | | | | 2,127,994 | | | | | | 1,123,312 | |
| | | | | | | | | | | | | | |
| | | | |
Macau 1.1% | | | | | | | | | | | | | | |
MGM China Holdings Ltd. | | | Hotels, Restaurants & Leisure | | | | 1,292,400 | | | | | | 2,109,689 | |
Sands China Ltd. | | | Hotels, Restaurants & Leisure | | | | 272,000 | | | | | | 1,453,845 | |
| | | | | | | | | | | | | | |
| | | | |
| | | | | | | | | | | | | 3,563,534 | |
| | | | | | | | | | | | | | |
Mexico 2.2% | | | | | | | | | | | | | | |
Banco Santander Mexico SA Institucion de Banca Multiple Grupo Financiero Santander, ADR | | | Banks | | | | 949,761 | | | | | | 6,439,380 | |
Nemak SAB de CV | | | Auto Components | | | | 2,014,800 | | | | | | 844,407 | |
| | | | | | | | | | | | | | |
| | | | |
| | | | | | | | | | | | | 7,283,787 | |
| | | | | | | | | | | | | | |
Pakistan 0.4% | | | | | | | | | | | | | | |
Habib Bank Ltd. | | | Banks | | | | 1,333,600 | | | | | | 1,366,295 | |
| | | | | | | | | | | | | | |
| | | | |
Peru 0.4% | | | | | | | | | | | | | | |
Intercorp Financial Services Inc. | | | Banks | | | | 31,950 | | | | | | 1,306,755 | |
| | | | | | | | | | | | | | |
| | | | |
Philippines 0.3% | | | | | | | | | | | | | | |
BDO Unibank Inc. | | | Banks | | | | 327,469 | | | | | | 1,020,918 | |
| | | | | | | | | | | | | | |
| | | | |
Russia 9.1% | | | | | | | | | | | | | | |
Gazprom PJSC, ADR | | | Oil, Gas & Consumable Fuels | | | | 566,200 | | | | | | 4,658,693 | |
LUKOIL PJSC, ADR | | | Oil, Gas & Consumable Fuels | | | | 95,250 | | | | | | 9,446,895 | |
aMail.Ru Group Ltd., GDR | | | Interactive Media & Services | | | | 112,799 | | | | | | 2,515,418 | |
Sberbank of Russia PJSC, ADR | | | Banks | | | | 498,847 | | | | | | 8,201,045 | |
aYandex NV, A | | | Interactive Media & Services | | | | 126,319 | | | | | | 5,493,613 | |
| | | | | | | | | | | | | | |
| | | | |
| | | | | | | | | | | | | 30,315,664 | |
| | | | | | | | | | | | | | |
Singapore 0.2% | | | | | | | | | | | | | | |
DBS Group Holdings Ltd. | | | Banks | | | | 25,706 | | | | | | 494,552 | |
| | | | | | | | | | | | | | |
| | | | |
South Africa 3.8% | | | | | | | | | | | | | | |
Massmart Holdings Ltd. | | | Food & Staples Retailing | | | | 595,221 | | | | | | 2,181,178 | |
Naspers Ltd., N | | | Internet & Direct Marketing Retail | | | | 64,938 | | | | | | 10,622,100 | |
| | | | | | | | | | | | | | |
| | | | |
| | | | | | | | | | | | | 12,803,278 | |
| | | | | | | | | | | | | | |
South Korea 17.0% | | | | | | | | | | | | | | |
Fila Korea Ltd. | | | Textiles, Apparel & Luxury Goods | | | | 59,210 | | | | | | 2,714,669 | |
Hankook Technology Group Co. Ltd. | | | Diversified Financial Services | | | | 37,500 | | | | | | 467,132 | |
Hankook Tire & Technology Co. Ltd. | | | Auto Components | | | | 21,600 | | | | | | 626,891 | |
Hanon Systems | | | Auto Components | | | | 94,741 | | | | | | 913,816 | |
HDC Hyundai Development Co-Engineering & Construction | | | Construction & Engineering | | | | 21,031 | | | | | | 466,652 | |
FRANKLIN TEMPLETON VARIABLE INSURANCE PRODUCTS TRUST
STATEMENT OF INVESTMENTS
Templeton Developing Markets VIP Fund(continued)
| | | | | | | | | | | | | | |
| | | Industry | | | Shares/ Rights | | | | | Value | |
|
Common Stocks and Other Equity Interests(continued) | |
South Korea(continued) | | | | | | | | | | | | | | |
KT Skylife Co. Ltd. | | | Media | | | | 166,071 | | | | | $ | 1,252,726 | |
LG Corp. | | | Industrial Conglomerates | | | | 96,342 | | | | | | 6,150,606 | |
Naver Corp. | | | Interactive Media & Services | | | | 61,961 | | | | | | 9,996,390 | |
POSCO | | | Metals & Mining | | | | 15,429 | | | | | | 3,156,566 | |
Samsung Electronics Co. Ltd. | | | Technology Hardware, Storage & Peripherals | | | | 538,229 | | | | | | 25,980,483 | |
Samsung Life Insurance Co. Ltd. | | | Insurance | | | | 41,400 | | | | | | 2,668,103 | |
SK Hynix Inc. | | | Semiconductors & Semiconductor Equipment | | | | 31,530 | | | | | | 2,566,608 | |
| | | | | | | | | | | | | | |
| | | | |
| | | | | | | | | | | | | 56,960,642 | |
| | | | | | | | | | | | | | |
Taiwan 10.7% | | | | | | | | | | | | | | |
Catcher Technology Co. Ltd. | | | Technology Hardware, Storage & Peripherals | | | | 114,000 | | | | | | 865,167 | |
CTBC Financial Holding Co. Ltd. | | | Banks | | | | 2,244,000 | | | | | | 1,680,505 | |
FIT Hon Teng Ltd. | | | Electronic Equipment, Instruments & Components | | | | 1,759,800 | | | | | | 591,696 | |
Hon Hai Precision Industry Co. Ltd. | | | Electronic Equipment, Instruments & Components | | | | 1,332,000 | | | | | | 4,043,516 | |
Largan Precision Co. Ltd. | | | Electronic Equipment, Instruments & Components | | | | 5,300 | | | | | | 885,962 | |
Taiwan Semiconductor Manufacturing Co. Ltd. | | | Semiconductors & Semiconductor Equipment | | | | 2,505,000 | | | | | | 27,720,738 | |
| | | | | | | | | | | | | | |
| | | | |
| | | | | | | | | | | | | 35,787,584 | |
| | | | | | | | | | | | | | |
Thailand 2.2% | | | | | | | | | | | | | | |
Kasikornbank PCL, fgn | | | Banks | | | | 705,000 | | | | | | 3,564,075 | |
Kiatnakin Bank PCL, fgn | | | Banks | | | | 1,009,800 | | | | | | 2,238,723 | |
Thai Beverage PCL, fgn | | | Beverages | | | | 2,335,600 | | | | | | 1,545,260 | |
| | | | | | | | | | | | | | |
| | | | |
| | | | | | | | | | | | | 7,348,058 | |
| | | | | | | | | | | | | | |
United Kingdom 2.7% | | | | | | | | | | | | | | |
Unilever PLC | | | Personal Products | | | | 155,816 | | | | | | 8,978,148 | |
| | | | | | | | | | | | | | |
| | | | |
United States 2.8% | | | | | | | | | | | | | | |
Cognizant Technology Solutions Corp., A | | | IT Services | | | | 112,421 | | | | | | 6,972,350 | |
aIMAX Corp. | | | Entertainment | | | | 123,155 | | | | | | 2,516,057 | |
| | | | | | | | | | | | | | |
| | | | |
| | | | | | | | | | | | | 9,488,407 | |
| | | | | | | | | | | | | | |
Total Common Stocks and Other Equity Interests (Cost $217,219,065) | | | | | | | | | | | | | 312,078,333 | |
| | | | | | | | | | | | | | |
| | | | |
Preferred Stocks 5.2% | | | | | | | | | | | | | | |
| | | | |
Brazil 5.2% | | | | | | | | | | | | | | |
bBanco Bradesco SA, 5.539%, ADR, pfd | | | Banks | | | | 933,515 | | | | | | 8,354,959 | |
bItau Unibanco Holding SA, 8.209%, ADR, pfd | | | Banks | | | | 808,743 | | | | | | 7,399,999 | |
bPetroleo Brasileiro SA, 3.15%, ADR, pfd | | | Oil, Gas & Consumable Fuels | | | | 118,600 | | | | | | 1,769,512 | |
| | | | | | | | | | | | | | |
| | | | |
Total Preferred Stocks
(Cost $8,582,220) | | | | | | | | | | | | | 17,524,470 | |
| | | | | | | | | | | | | | |
| | | | |
Total Investments before Short Term Investments (Cost $225,801,285) | | | | | | | | | | | | | 329,602,803 | |
| | | | | | | | | | | | | | |
FRANKLIN TEMPLETON VARIABLE INSURANCE PRODUCTS TRUST
STATEMENT OF INVESTMENTS
Templeton Developing Markets VIP Fund(continued)
| | | | | | | | |
| | | Shares | | | Value | |
| | |
Short Term Investments (Cost $3,522,232) 1.1% | | | | | | | | |
| | |
Money Market Funds 1.1% | | | | | | | | |
| | |
United States 1.1% | | | | | | | | |
| | |
c,dInstitutional Fiduciary Trust Money Market Portfolio, 1.26% | | | 3,522,232 | | | $ | 3,522,232 | |
| | | | | | | | |
| | |
Total Investments (Cost $229,323,517) 99.6% | | | | | | | 333,125,035 | |
| | |
Other Assets, less Liabilities 0.4% | | | | | | | 1,381,143 | |
| | | | | | | | |
| | |
Net Assets 100.0% | | | | | | $ | 334,506,178 | |
| | | | | | | | |
See Abbreviations on page TD-23.
aNon-income producing.
bVariable rate security. The rate shown represents the yield at period end.
cSee Note 3(e) regarding investments in affiliated management investment companies.
dThe rate shown is the annualized seven-day effective yield at period end.
| | | | |
| | | |
| | The accompanying notes are an integral part of these financial statements. | Annual Report | | TD-13 |
FRANKLIN TEMPLETON VARIABLE INSURANCE PRODUCTS TRUST
FINANCIAL STATEMENTS
Statement of Assets and Liabilities
December 31, 2019
| | | | |
| | | Templeton Developing Markets VIP Fund | |
| |
Assets: | | | | |
Investments in securities: | | | | |
Cost - Unaffiliated issuers | | | $225,801,285 | |
Cost - Non-controlled affiliates (Note 3e) | | | 3,522,232 | |
| | | | |
| |
Value - Unaffiliated issuers | | | $329,602,803 | |
Value - Non-controlled affiliates (Note 3e) | | | 3,522,232 | |
Receivables: | | | | |
Investment securities sold | | | 104,852 | |
Capital shares sold | | | 5,030,737 | |
Dividends | | | 1,460,873 | |
Foreign tax refund | | | 51,726 | |
Other assets | | | 37 | |
| | | | |
| |
Total assets | | | 339,773,260 | |
| | | | |
| |
Liabilities: | | | | |
Payables: | | | | |
Investment securities purchased | | | 388,676 | |
Capital shares redeemed | | | 3,776,749 | |
Management fees | | | 287,187 | |
Distribution fees | | | 49,267 | |
Deferred tax | | | 559,174 | |
Accrued expenses and other liabilities | | | 206,029 | |
| | | | |
| |
Total liabilities | | | 5,267,082 | |
| | | | |
| |
Net assets, at value | | | $334,506,178 | |
| | | | |
| |
Net assets consist of: | | | | |
Paid-in capital | | | $219,735,800 | |
Total distributable earnings (losses) | | | 114,770,378 | |
| | | | |
| |
Net assets, at value | | | $334,506,178 | |
| | | | |
| |
Class 1: | | | | |
Net assets, at value | | | $ 97,271,290 | |
| | | | |
Shares outstanding | | | 9,007,499 | |
| | | | |
Net asset value and maximum offering price per share | | | $10.80 | |
| | | | |
| |
Class 2: | | | | |
Net assets, at value | | | $231,644,964 | |
| | | | |
Shares outstanding | | | 21,626,916 | |
| | | | |
Net asset value and maximum offering price per share | | | $10.71 | |
| | | | |
| |
Class 4: | | | | |
Net assets, at value | | | $ 5,589,924 | |
| | | | |
Shares outstanding | | | 519,038 | |
| | | | |
Net asset value and maximum offering price per share | | | $10.77 | |
| | | | |
| | | | |
| | | |
TD-14 | | Annual Report | The accompanying notes are an integral part of these financial statements. | | |
FRANKLIN TEMPLETON VARIABLE INSURANCE PRODUCTS TRUST
FINANCIAL STATEMENTS
Statement of Operations
for the year ended December 31, 2019
| | | | |
| | | Templeton Developing Markets VIP Fund | |
| |
Investment income: | | | | |
Dividends: (net of foreign taxes)* | | | | |
Unaffiliated issuers | | | $9,178,310 | |
Non-controlled affiliates (Note 3e) | | | 124,872 | |
| | | | |
| |
Total investment income | | | 9,303,182 | |
| | | | |
Expenses: | | | | |
Management fees (Note 3a) | | | 3,277,762 | |
Distribution fees: (Note 3c) | | | | |
Class 2 | | | 540,073 | |
Class 4 | | | 19,027 | |
Custodian fees (Note 4) | | | 85,582 | |
Reports to shareholders | | | 139,691 | |
Professional fees | | | 91,078 | |
Trustees’ fees and expenses | | | 1,824 | |
Other | | | 30,167 | |
| | | | |
| |
Total expenses | | | 4,185,204 | |
Expenses waived/paid by affiliates (Note 3e) | | | (23,794 | ) |
| | | | |
| |
Net expenses | | | 4,161,410 | |
| | | | |
| |
Net investment income | | | 5,141,772 | |
| | | | |
| |
Realized and unrealized gains (losses): | | | | |
Net realized gain (loss) from: | | | | |
Investments:# | | | | |
Unaffiliated issuers | | | 16,811,756 | |
Foreign currency transactions | | | (37,399 | ) |
| | | | |
| |
Net realized gain (loss) | | | 16,774,357 | |
| | | | |
Net change in unrealized appreciation (depreciation) on: | | | | |
Investments: | | | | |
Unaffiliated issuers | | | 50,175,353 | |
Translation of other assets and liabilities denominated in foreign currencies | | | (2,559 | ) |
Change in deferred taxes on unrealized appreciation | | | 1,309 | |
| | | | |
| |
Net change in unrealized appreciation (depreciation) | | | 50,174,103 | |
| | | | |
| |
Net realized and unrealized gain (loss) | | | 66,948,460 | |
| | | | |
| |
Net increase (decrease) in net assets resulting from operations | | | $72,090,232 | |
| | | | |
| |
*Foreign taxes withheld on dividends. | | | $ 1,158,072 | |
#Net of foreign taxes | | | $ 480,604 | |
| | | | |
| | | |
| | The accompanying notes are an integral part of these financial statements. | Annual Report | | TD-15 |
FRANKLIN TEMPLETON VARIABLE INSURANCE PRODUCTS TRUST
FINANCIAL STATEMENTS
Statements of Changes in Net Assets
| | | | | | | | |
| | | Templeton Developing Markets VIP Fund |
| |
| | | Year Ended December 31, |
| | |
| | | 2019 | | 2018 |
Increase (decrease) in net assets: | | | | | | | | |
Operations: | | | | | | | | |
Net investment income | | $ | 5,141,772 | | | $ | 2,697,670 | |
Net realized gain (loss) | | | 16,774,357 | | | | 19,694,258 | |
Net change in unrealized appreciation (depreciation) | | | 50,174,103 | | | | (77,137,099 | ) |
| | | | |
| | |
Net increase (decrease) in net assets resulting from operations | | | 72,090,232 | | | | (54,745,171 | ) |
| | | | |
| | |
Distributions to shareholders: | | | | | | | | |
Class 1 | | | (1,134,638 | ) | | | (1,013,838 | ) |
Class 2 | | | (2,113,534 | ) | | | (1,947,210 | ) |
Class 4 | | | (46,961 | ) | | | (46,243 | ) |
| | | | |
| | |
Total distributions to shareholders | | | (3,295,133 | ) | | | (3,007,291 | ) |
| | | | |
| | |
Capital share transactions: (Note 2) | | | | | | | | |
Class 1 | | | (8,627,549 | ) | | | (3,414,259 | ) |
Class 2 | | | (10,720,631 | ) | | | (35,130,020 | ) |
Class 4 | | | (845,695 | ) | | | (923,409 | ) |
| | | | |
| | |
Total capital share transactions | | | (20,193,875 | ) | | | (39,467,688 | ) |
| | | | |
| | |
Net increase (decrease) in net assets | | | 48,601,224 | | | | (97,220,150 | ) |
Net assets: | | | | | | | | |
Beginning of year | | | 285,904,954 | | | | 383,125,104 | |
| | | | |
| | |
End of year | | $ | 334,506,178 | | | $ | 285,904,954 | |
| | | | |
| | | | |
| | | |
TD-16 | | Annual Report | The accompanying notes are an integral part of these financial statements. | | |
FRANKLIN TEMPLETON VARIABLE INSURANCE PRODUCTS TRUST
Notes to Financial Statements
Templeton Developing Markets VIP Fund
1. Organization and Significant Accounting Policies
Franklin Templeton Variable Insurance Products Trust (Trust) is registered under the Investment Company Act of 1940 (1940 Act) as an open-end management investment company, consisting of eighteen separate funds and applies the specialized accounting and reporting guidance in U.S. Generally Accepted Accounting Principles (U.S. GAAP). Templeton Developing Markets VIP Fund (Fund) is included in this report. Shares of the Fund are generally sold only to insurance company separate accounts to fund the benefits of variable life insurance policies or variable annuity contracts. The Fund offers three classes of shares: Class 1, Class 2 and Class 4. Each class of shares may differ by its distribution fees, voting rights on matters affecting a single class and its exchange privilege.
The following summarizes the Fund’s significant accounting policies.
a. Financial Instrument Valuation
The Fund’s investments in financial instruments are carried at fair value daily. Fair value is the price that would be received to sell an asset or paid to transfer a liability in an orderly transaction between market participants on the measurement date. The Fund calculates the net asset value (NAV) per share each business day as of 4 p.m. Eastern time or the regularly scheduled close of the New York Stock Exchange (NYSE), whichever is earlier. Under compliance policies and procedures approved by the Trust’s Board of Trustees (the Board), the Fund’s administrator has responsibility for oversight of valuation, including leading the cross-functional Valuation Committee (VC). The Fund may utilize independent pricing services, quotations from securities and financial instrument dealers, and other market sources to determine fair value.
Equity securities listed on an exchange or on the NASDAQ National Market System are valued at the last quoted sale price or the official closing price of the day, respectively. Foreign equity securities are valued as of the close of trading on the foreign stock exchange on which the security is primarily traded, or as of 4 p.m. Eastern time. The value is then converted into its U.S. dollar equivalent at the foreign exchange rate in effect at 4 p.m. Eastern time on the day that the value of the security is determined. Over-the-counter (OTC) securities are valued within the range of the most recent quoted bid and ask prices. Securities that trade in multiple markets or on multiple exchanges are valued
according to the broadest and most representative market. Certain equity securities are valued based upon fundamental characteristics or relationships to similar securities.
Investments in open-end mutual funds are valued at the closing NAV.
The Fund has procedures to determine the fair value of financial instruments for which market prices are not reliable or readily available. Under these procedures, the Fund primarily employs a market-based approach which may use related or comparable assets or liabilities, recent transactions, market multiples, book values, and other relevant information for the investment to determine the fair value of the investment. An income-based valuation approach may also be used in which the anticipated future cash flows of the investment are discounted to calculate fair value. Discounts may also be applied due to the nature or duration of any restrictions on the disposition of the investments. Due to the inherent uncertainty of valuations of such investments, the fair values may differ significantly from the values that would have been used had an active market existed.
Trading in securities on foreign securities stock exchanges and OTC markets may be completed before 4 p.m. Eastern time. In addition, trading in certain foreign markets may not take place on every Fund’s business day. Occasionally, events occur between the time at which trading in a foreign security is completed and 4 p.m. Eastern time that might call into question the reliability of the value of a portfolio security held by the Fund. As a result, differences may arise between the value of the Fund’s portfolio securities as determined at the foreign market close and the latest indications of value at 4 p.m. Eastern time. In order to minimize the potential for these differences, the VC monitors price movements following the close of trading in foreign stock markets through a series of country specific market proxies (such as baskets of American Depositary Receipts, futures contracts and exchange traded funds). These price movements are measured against established trigger thresholds for each specific market proxy to assist in determining if an event has occurred that may call into question the reliability of the values of the foreign securities held by the Fund. If such an event occurs, the securities may be valued using fair value procedures, which may include the use of independent pricing services.
FRANKLIN TEMPLETON VARIABLE INSURANCE PRODUCTS TRUST
NOTES TO FINANCIAL STATEMENTS
Templeton Developing Markets VIP Fund(continued)
1. Organization and Significant Accounting Policies(continued)
a. Financial Instrument Valuation(continued)
When the last day of the reporting period is a non-business day, certain foreign markets may be open on those days that the Fund’s NAV is not calculated, which could result in differences between the value of the Fund’s portfolio securities on the last business day and the last calendar day of the reporting period. Any significant security valuation changes due to an open foreign market are adjusted and reflected by the Fund for financial reporting purposes.
b. Foreign Currency Translation
Portfolio securities and other assets and liabilities denominated in foreign currencies are translated into U.S. dollars based on the exchange rate of such currencies against U.S. dollars on the date of valuation. The Fund may enter into foreign currency exchange contracts to facilitate transactions denominated in a foreign currency. Purchases and sales of securities, income and expense items denominated in foreign currencies are translated into U.S. dollars at the exchange rate in effect on the transaction date. Portfolio securities and assets and liabilities denominated in foreign currencies contain risks that those currencies will decline in value relative to the U.S. dollar. Occasionally, events may impact the availability or reliability of foreign exchange rates used to convert the U.S. dollar equivalent value. If such an event occurs, the foreign exchange rate will be valued at fair value using procedures established and approved by the Board.
The Fund does not separately report the effect of changes in foreign exchange rates from changes in market prices on securities held. Such changes are included in net realized and unrealized gain or loss from investments in the Statement of Operations.
Realized foreign exchange gains or losses arise from sales of foreign currencies, currency gains or losses realized between the trade and settlement dates on securities transactions and the difference between the recorded amounts of dividends, interest, and foreign withholding taxes and the U.S. dollar equivalent of the amounts actually received or paid. Net unrealized foreign exchange gains and losses arise from changes in foreign exchange rates on foreign denominated assets and liabilities other than investments in securities held at the end of the reporting period.
c. Income and Deferred Taxes
It is the Fund’s policy to qualify as a regulated investment company under the Internal Revenue Code. The Fund intends to distribute to shareholders substantially all of its taxable income and net realized gains to relieve it from federal income and if applicable, excise taxes. As a result, no provision for U.S. federal income taxes is required.
The Fund may be subject to foreign taxation related to income received, capital gains on the sale of securities and certain foreign currency transactions in the foreign jurisdictions in which it invests. Foreign taxes, if any, are recorded based on the tax regulations and rates that exist in the foreign markets in which the Fund invests. When a capital gain tax is determined to apply, the Fund records an estimated deferred tax liability in an amount that would be payable if the securities were disposed of on the valuation date.
The Fund may recognize an income tax liability related to its uncertain tax positions under U.S. GAAP when the uncertain tax position has a less than 50% probability that it will be sustained upon examination by the tax authorities based on its technical merits. As of December 31, 2019, the Fund has determined that no tax liability is required in its financial statements related to uncertain tax positions for any open tax years (or expected to be taken in future tax years). Open tax years are those that remain subject to examination and are based on the statute of limitations in each jurisdiction in which the Fund invests.
d. Security Transactions, Investment Income, Expenses and Distributions
Security transactions are accounted for on trade date. Realized gains and losses on security transactions are determined on a specific identification basis. Estimated expenses are accrued daily. Dividend income is recorded on the ex-dividend date except for certain dividends from securities where the dividend rate is not available. In such cases, the dividend is recorded as soon as the information is received by the Fund. Distributions to shareholders are recorded on the ex-dividend date. Distributable earnings are determined according to income tax regulations (tax basis) and may differ from earnings recorded in accordance with U.S. GAAP. These differences may be permanent or temporary. Permanent differences are reclassified among capital accounts to reflect their tax character. These
FRANKLIN TEMPLETON VARIABLE INSURANCE PRODUCTS TRUST
NOTES TO FINANCIAL STATEMENTS
Templeton Developing Markets VIP Fund(continued)
reclassifications have no impact on net assets or the results of operations. Temporary differences are not reclassified, as they may reverse in subsequent periods.
Common expenses incurred by the Trust are allocated among the Funds based on the ratio of net assets of each Fund to the combined net assets of the Trust or based on the ratio of number of shareholders of each Fund to the combined number of shareholders of the Trust. Fund specific expenses are charged directly to the Fund that incurred the expense.
Realized and unrealized gains and losses and net investment income, excluding class specific expenses, are allocated daily to each class of shares based upon the relative proportion of net assets of each class. Differences in per share distributions by class are generally due to differences in class specific expenses.
e. Accounting Estimates
The preparation of financial statements in accordance with U.S. GAAP requires management to make estimates and assumptions that affect the reported amounts of assets and
liabilities at the date of the financial statements and the amounts of income and expenses during the reporting period. Actual results could differ from those estimates.
f. Guarantees and Indemnifications
Under the Trust’s organizational documents, its officers and trustees are indemnified by the Trust against certain liabilities arising out of the performance of their duties to the Trust. Additionally, in the normal course of business, the Trust, on behalf of the Fund, enters into contracts with service providers that contain general indemnification clauses. The Trust’s maximum exposure under these arrangements is unknown as this would involve future claims that may be made against the Trust that have not yet occurred. Currently, the Trust expects the risk of loss to be remote.
2. Shares of Beneficial Interest
At December 31, 2019, there were an unlimited number of shares authorized (without par value). Transactions in the Fund’s shares were as follows:
| | | | | | | | | | | | | | | | |
| | | Year Ended December 31, |
| | | 2019 | | 2018 |
| | | Shares | | Amount | | Shares | | Amount |
| | | | |
Class 1 Shares: | | | | | | | | | | | | | | | | |
Shares sold | | | 544,413 | | | $ | 5,344,264 | | | | 1,801,012 | | | $ | 17,302,432 | |
Shares issued in reinvestment of distributions | | | 121,873 | | | | 1,134,638 | | | | 105,170 | | | | 1,013,838 | |
Shares redeemed | | | (1,570,097 | ) | | | (15,106,451 | ) | | | (2,222,370 | ) | | | (21,730,529 | ) |
| | | | |
| | | | |
Net increase (decrease) | | | (903,811 | ) | | $ | (8,627,549 | ) | | | (316,188 | ) | | $ | (3,414,259 | ) |
| | | | |
| | | | |
Class 2 Shares: | | | | | | | | | | | | | | | | |
Shares sold | | | 5,803,158 | | | $ | 55,845,696 | | | | 4,771,227 | | | $ | 45,978,347 | |
Shares issued in reinvestment of distributions | | | 228,490 | | | | 2,113,534 | | | | 203,470 | | | | 1,947,210 | |
Shares redeemed | | | (7,263,336 | ) | | | (68,679,861 | ) | | | (8,557,714 | ) | | | (83,055,577 | ) |
| | | | |
| | | | |
Net increase (decrease) | | | (1,231,688 | ) | | $ | (10,720,631 | ) | | | (3,583,017 | ) | | $ | (35,130,020 | ) |
| | | | |
| | | | |
Class 4 Shares: | | | | | | | | | | | | | | | | |
Shares sold | | | 26,510 | | | $ | 252,720 | | | | 48,260 | | | $ | 471,887 | |
Shares issued in reinvestment of distributions | | | 5,050 | | | | 46,961 | | | | 4,802 | | | | 46,243 | |
Shares redeemed | | | (118,358 | ) | | | (1,145,376 | ) | | | (147,608 | ) | | | (1,441,539 | ) |
| | | | |
| | | | |
Net increase (decrease) | | | (86,798 | ) | | $ | (845,695 | ) | | | (94,546 | ) | | $ | (923,409 | ) |
| | | | |
FRANKLIN TEMPLETON VARIABLE INSURANCE PRODUCTS TRUST
NOTES TO FINANCIAL STATEMENTS
Templeton Developing Markets VIP Fund(continued)
3. Transactions with Affiliates
Franklin Resources, Inc. is the holding company for various subsidiaries that together are referred to as Franklin Templeton. Certain officers and trustees of the Fund are also officers and/or trustees of the following subsidiaries:
| | |
| Subsidiary | | Affiliation |
Templeton Asset Management Ltd. (Asset Management) | | Investment manager |
Franklin Templeton Services, LLC (FT Services) | | Administrative manager |
Franklin Templeton Distributors, Inc. (Distributors) | | Principal underwriter |
Franklin Templeton Investor Services, LLC (Investor Services) | | Transfer agent |
a. Management Fees
The Fund pays an investment management fee to Asset Management based on the average daily net assets of the Fund as follows:
| | |
| Annualized Fee Rate | | Net Assets |
1.050% | | Up to and including $1 billion |
1.000% | | Over $1 billion, up to and including $5 billion |
0.950% | | Over $5 billion, up to and including $10 billion |
0.900% | | Over $10 billion, up to and including $15 billion |
0.850% | | Over $15 billion, up to and including $20 billion |
0.800% | | In excess of $20 billion |
b. Administrative Fees
Under an agreement with Asset Management, FT Services provides administrative services to the Fund. The fee is paid by Asset Management based on the Fund’s average daily net assets, and is not an additional expense of the Fund.
c. Distribution Fees
The Board has adopted distribution plans for Class 2 and Class 4 shares pursuant to Rule 12b-1 under the 1940 Act. Under the Fund’s compensation distribution plans, the Fund pays Distributors for costs incurred in connection with the servicing, sale and distribution of the Fund’s shares up to 0.25% and 0.35% per year of its average daily net assets of Class 2 and Class 4 respectively. The plan year, for purposes of monitoring compliance with the maximum annual plan rates, is February 1 through January 31.
d. Transfer Agent Fees
Investor Services, under terms of an agreement, performs shareholder servicing for the Fund and is not paid by the Fund for the services.
FRANKLIN TEMPLETON VARIABLE INSURANCE PRODUCTS TRUST
NOTES TO FINANCIAL STATEMENTS
Templeton Developing Markets VIP Fund(continued)
e. Investments in Affiliated Management Investment Companies
The Fund invests in one or more affiliated management investment companies for purposes other than exercising a controlling influence over the management or policies. Management fees paid by the Fund are waived on assets invested in the affiliated management investment companies, as noted in the Statement of Operations, in an amount not to exceed the management and administrative fees paid directly or indirectly by each affiliate. During the year ended December 31, 2019, the Fund held investments in affiliated management investment companies as follows:
| | | | | | | | | | | | | | | | | | | | | | | | | | | | | | | | |
| | | Value at
Beginning of Year | | | Purchases | | | Sales | | | Realized
Gain (Loss) | | | Net Change in Unrealized Appreciation (Depreciation) | | | Value at End of Year | | | Number of Shares Held at End of Year | | | Dividend
Income | |
| | | | | | | | |
Non-Controlled Affiliates | | | | | | | | | | | | | | | | | | | | | | | | | | | | | | | | |
Institutional Fiduciary Trust Money Market Portfolio, 1.26% | | $ | 5,427,431 | | | $ | 61,498,455 | | | $ | (63,403,654 | ) | | | $ — | | | | $ — | | | $ | 3,522,232 | | | | 3,522,232 | | | $ | 124,872 | |
| | | | | | | | | | | | |
4. Expense Offset Arrangement
The Fund has entered into an arrangement with its custodian whereby credits realized as a result of uninvested cash balances are used to reduce a portion of the Fund’s custodian expenses. During the year ended December 31, 2019, there were no credits earned.
5. Income Taxes
During the year ended December 31, 2019, the Fund utilized $6,657,029 of capital loss carryforwards.
The tax character of distributions paid during the years ended December 31, 2019 and 2018, was as follows:
| | | | | | | | |
| | | 2019 | | | 2018 | |
| | |
Distributions paid from ordinary income | | $ | 3,295,133 | | | $ | 3,007,291 | |
| | | | |
At December 31, 2019, the cost of investments, net unrealized appreciation (depreciation), undistributed ordinary income and undistributed long term capital gains for income tax purposes were as follows:
| | | | |
Cost of investments | | $ | 236,854,313 | |
| | | | |
| |
Unrealized appreciation | | $ | 117,899,365 | |
Unrealized depreciation | | | (21,628,643 | ) |
| | | | |
| |
Net unrealized appreciation (depreciation) | | $ | 96,270,722 | |
| | | | |
| |
Distributable earnings: | | | | |
Undistributed ordinary income | | $ | 11,804,377 | |
Undistributed long term capital gains | | | 7,281,404 | |
| | | | |
| |
Total distributable earnings | | $ | 19,085,781 | |
| | | | |
Differences between income and/or capital gains as determined on a book basis and a tax basis are primarily due to differing treatment of corporate actions.
FRANKLIN TEMPLETON VARIABLE INSURANCE PRODUCTS TRUST
NOTES TO FINANCIAL STATEMENTS
Templeton Developing Markets VIP Fund(continued)
6. Investment Transactions
Purchases and sales of investments (excluding short term securities) for the year ended December 31, 2019, aggregated $55,126,299 and $72,022,991, respectively.
7. Concentration of Risk
Investing in foreign securities may include certain risks and considerations not typically associated with investing in U.S. securities, such as fluctuating currency values and changing local, regional and global economic, political and social conditions, which may result in greater market volatility. Current political and financial uncertainty surrounding the European Union may increase market volatility and the economic risk of investing in securities in Europe. In addition, certain foreign securities may not be as liquid as U.S. securities.
The United States and other nations have imposed and could impose additional sanctions on certain issuers in Russia due to regional conflicts. These sanctions could result in the devaluation of Russia’s currency, a downgrade in Russian issuers’ credit ratings, or a decline in the value and liquidity of Russian stocks or other securities. Such sanctions could also adversely affect Russia’s economy. The Fund may be prohibited from investing in securities issued by companies subject to such sanctions. In addition, if the Fund holds the securities of an issuer that is subject to such sanctions, an immediate freeze of that issuer’s securities could result, impairing the ability of the Fund to buy, sell, receive or deliver those securities. There is also the risk that countermeasures could be taken by Russia’s government, which could involve the seizure of the Fund’s assets. These risks could affect the value of the Fund’s portfolio. While the Fund holds securities of certain issuers impacted by the sanctions, existing investments do not presently violate the applicable terms and conditions of the sanctions. The sanctions currently do not affect the Fund’s ability to sell these securities. At December 31, 2019, the Fund had 9.1% of its net assets invested in Russia.
8. Credit Facility
The Fund, together with other U.S. registered and foreign investment funds (collectively, Borrowers), managed by Franklin Templeton, are borrowers in a joint syndicated senior unsecured credit facility totaling $2 billion (Global Credit Facility) which matured on February 7, 2020. This Global Credit Facility provides a source of funds to the Borrowers for temporary and emergency purposes, including the ability to meet future unanticipated or unusually large redemption requests. Effective February 7, 2020, the Borrowers renewed the Global Credit Facility for a one year term, maturing February 5, 2021, for a total of $2 billion.
Under the terms of the Global Credit Facility, the Fund shall, in addition to interest charged on any borrowings made by the Fund and other costs incurred by the Fund, pay its share of fees and expenses incurred in connection with the implementation and maintenance of the Global Credit Facility, based upon its relative share of the aggregate net assets of all of the Borrowers, including an annual commitment fee of 0.15% based upon the unused portion of the Global Credit Facility. These fees are reflected in other expenses in the Statement of Operations. During the year ended December 31, 2019, the Fund did not use the Global Credit Facility.
9. Fair Value Measurements
The Fund follows a fair value hierarchy that distinguishes between market data obtained from independent sources (observable inputs) and the Fund’s own market assumptions (unobservable inputs). These inputs are used in determining the value of the Fund’s financial instruments and are summarized in the following fair value hierarchy:
| | • | | Level 1 – quoted prices in active markets for identical financial instruments |
FRANKLIN TEMPLETON VARIABLE INSURANCE PRODUCTS TRUST
NOTES TO FINANCIAL STATEMENTS
Templeton Developing Markets VIP Fund(continued)
| | • | | Level 2 – other significant observable inputs (including quoted prices for similar financial instruments, interest rates, prepayment speed, credit risk, etc.) |
| | • | | Level 3 – significant unobservable inputs (including the Fund’s own assumptions in determining the fair value of financial instruments) |
The input levels are not necessarily an indication of the risk or liquidity associated with financial instruments at that level.
A summary of inputs used as of December 31, 2019, in valuing the Fund’s assets carried at fair value, is as follows:
| | | | | | | | | | | | | | | | |
| | | Level 1 | | | Level 2 | | | Level 3 | | | Total | |
| | | | |
Assets: | | | | | | | | | | | | | | | | |
Investments in Securities:a | | | | | | | | | | | | | | | | |
Equity Investments:b | | | | | | | | | | | | | | | | |
Brazil | | $ | 26,997,929 | | | $ | 3,049 | | | $ | — | | | $ | 27,000,978 | |
Russia | | | 25,656,971 | | | | 4,658,693 | | | | — | | | | 30,315,664 | |
All Other Equity Investments | | | 272,286,161 | | | | — | | | | — | | | | 272,286,161 | |
Short Term Investments | | | 3,522,232 | | | | — | | | | — | | | | 3,522,232 | |
| | | | |
| | | | |
Total Investments in Securities | | $ | 328,463,293 | | | $ | 4,661,742 | | | $ | — | | | $ | 333,125,035 | |
| | | | |
aFor detailed categories, see the accompanying Statement of Investments.
bIncludes common and preferred stocks as well as other equity interests.
10. Subsequent Events
The Fund has evaluated subsequent events through the issuance of the financial statements and determined that no events have occurred that require disclosure other than those already disclosed in the financial statements.
Abbreviations
Selected Portfolio
| | | | |
| | | |
ADR | | American Depositary Receipt | | |
| | |
GDR | | Global Depositary Receipt | | |
FRANKLIN TEMPLETON VARIABLE INSURANCE PRODUCTS TRUST
Report of Independent Registered Public Accounting Firm
To the Board of Trustees of Franklin Templeton Variable Insurance Products Trust and Shareholders of Templeton Developing Markets VIP Fund
Opinion on the Financial Statements
We have audited the accompanying statement of assets and liabilities, including the statement of investments, of Templeton Developing Markets VIP Fund (the “Fund”) as of December 31, 2019, the related statement of operations for the year ended December 31, 2019, the statement of changes in net assets for each of the two years in the period ended December 31, 2019, including the related notes, and the financial highlights for each of the five years in the period ended December 31, 2019 (collectively referred to as the “financial statements”). In our opinion, the financial statements present fairly, in all material respects, the financial position of the Fund as of December 31, 2019, the results of its operations for the year then ended, the changes in its net assets for each of the two years in the period ended December 31, 2019 and the financial highlights for each of the five years in the period ended December 31, 2019 in conformity with accounting principles generally accepted in the United States of America.
Basis for Opinion
These financial statements are the responsibility of the Fund’s management. Our responsibility is to express an opinion on the Fund’s financial statements based on our audits. We are a public accounting firm registered with the Public Company Accounting Oversight Board (United States) (PCAOB) and are required to be independent with respect to the Fund in accordance with the U.S. federal securities laws and the applicable rules and regulations of the Securities and Exchange Commission and the PCAOB.
We conducted our audits of these financial statements in accordance with the standards of the PCAOB. Those standards require that we plan and perform the audit to obtain reasonable assurance about whether the financial statements are free of material misstatement, whether due to error or fraud.
Our audits included performing procedures to assess the risks of material misstatement of the financial statements, whether due to error or fraud, and performing procedures that respond to those risks. Such procedures included examining, on a test basis, evidence regarding the amounts and disclosures in the financial statements. Our audits also included evaluating the accounting principles used and significant estimates made by management, as well as evaluating the overall presentation of the financial statements. Our procedures included confirmation of securities owned as of December 31, 2019 by correspondence with the custodian, transfer agent and brokers; when replies were not received from brokers, we performed other auditing procedures. We believe that our audits provide a reasonable basis for our opinion.
PricewaterhouseCoopers LLP
San Francisco, California
February 20, 2020
We have served as the auditor of one or more investment companies in the Franklin Templeton Group of Funds since 1948.
FRANKLIN TEMPLETON VARIABLE INSURANCE PRODUCTS TRUST
Tax Information (unaudited)
Templeton Developing Markets VIP Fund
At December 31, 2019, more than 50% of the Fund’s total assets were invested in securities of foreign issuers. In most instances, foreign taxes were withheld from income paid to the Fund on these investments. The Fund elects to treat foreign taxes paid as allowed under Section 853 of the Internal Revenue Code. This election will allow shareholders of record as of the 2020 distribution date, to treat their proportionate share of foreign taxes paid by the Fund as having been paid directly by them. The shareholder shall consider these amounts as foreign taxes paid in the tax year in which they receive the Fund distribution.
This page intentionally left blank.
Templeton Foreign VIP Fund
This annual report for Templeton Foreign VIP Fund covers the fiscal year ended December 31, 2019.
Class 4 Performance Summary as of December 31, 2019
Average annual total return of Class 4 shares* represents the average annual change in value, assuming reinvestment of dividends and capital gains. Average returns smooth out variations in returns, which can be significant; they are not the same asyear-by-year results.
| | | | | | |
| Periods ended 12/31/19 | | 1-Year | | 5-Year | | 10-Year |
| | | |
Average Annual Total Return | | +12.49% | | +2.07% | | +3.28% |
*The Fund has a fee waiver associated with any investment it makes in a Franklin Templeton money fund and/or other Franklin Templeton fund, contractually guaranteed through 4/30/20. Fund investment results reflect the fee waiver; without this waiver, the results would have been lower.
Performance reflects the Fund’s Class 4 operating expenses, but doesnot include any contract fees, expenses or sales charges. If they had been included, performance would be lower. These charges and deductions, particularly for variable life policies, can have a significant effect on contract values and insurance benefits. See the contract prospectus for a complete description of these expenses, including sales charges.
Performance data represent past performance, which does not guarantee future results. Investment return and principal value will fluctuate, and you may have a gain or loss when you sell your shares. Current performance may differ from figures shown.
Total Return Index Comparison for a Hypothetical $10,000 Investment (1/1/10–12/31/19)
The graph below shows the change in value of a hypothetical $10,000 investment in the Fund over the indicated period and includes reinvestment of any income or distributions. The Fund’s performance* is compared to the performance of the MSCI All Country World Index (ACWI) ex USA Index. One cannot invest directly in an index, and an index is not representative of the Fund’s portfolio.Please seeImportant Notes to Performance Information preceding the Fund Summaries.
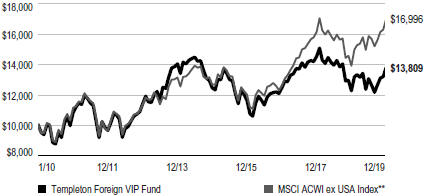
**Source: Morningstar. Please see Index Descriptions following the Fund Summaries.
TEMPLETON FOREIGN VIP FUND
Fund Goal and Main Investments
The Fund seeks long-term capital growth. Under normal market conditions, the Fund invests at least 80% of its net assets in investments of issuers located outside the U.S., including those in emerging markets.
Fund Risks
All investments involve risks, including possible loss of principal. Special risks are associated with foreign investing, including currency fluctuations, economic instability and political developments; investments in developing markets involve heightened risks related to the same factors. Currency rates may fluctuate significantly over short periods of time, and can reduce returns. Because the Fund may invest its assets in companies in a specific region, including Europe, it is subject to greater risks of adverse developments in that region and/or the surrounding regions than a fund that is more broadly diversified geographically. Current political and financial uncertainty surrounding the European Union may increase market volatility and the economic risk of investing in companies in Europe. Derivatives, including currency management strategies, involve costs and can create economic leverage in the portfolio which may result in significant volatility and cause the Fund to participate in losses (as well as enable gains) on an amount that exceeds the Fund’s initial investment. The Fund may not achieve the anticipated benefits, and may realize losses when a counterparty fails to perform as promised. The Fund is actively managed but there is no guarantee that the manager’s investment decisions will produce the desired results. The Fund’s prospectus also includes a description of the main investment risks.
Performance Overview
You can find the Fund’sone-year total return in the Performance Summary. In comparison, the Fund’s benchmark, the MSCI ACWI ex USA Index, posted a +22.13% total return for the same period.1 Please note, index performance information is provided for reference and we do not attempt to track the index but rather undertake investments on the basis of fundamental research.
Geographic Composition
Based on Total Net Assets as of 12/31/19
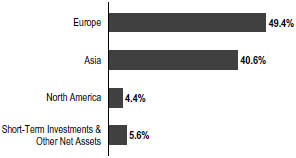
Economic and Market Overview
Global developed and emerging market stocks, as measured by the MSCI ACWI, posted strong returns during the reporting period. Although global economic growth slowed from 2018, interest-rate cuts from many central banks and the easing of trade tensions nearperiod-end contributed to the generally positive environment for equities worldwide. Reflecting investor optimism and slowing but resilient economic growth, stocks advanced in every major region of the globe.
In the U.S., solid economic growth also supported equities, as healthy consumer spending and a strong labor market kept the economy afloat. The unemployment rate fell during the year, reaching 3.5% in September, November and December 2019, the lowest recorded unemployment rate in 50 years.2 Wages also grew, albeit at a moderate pace, and inflation remained persistently low. In addition, deficit spending by the U.S. government boosted current growth at the expense of long-term debt. Despite the strength in the consumer sector, some parts of the economy struggled, particularly heavy industry. Annual industrial production contracted late in the reporting period, manufacturing output stalled and capital spending declined.
The U.S. Federal Reserve (Fed) provided a substantial boost to equity markets early in the reporting period as it shifted to a more accommodative monetary policy. In January 2019, the Fed signaled the end of its tightening cycle and cut the federal funds rate three times thereafter, lowering it to a range of 1.50%–1.75%. Stocks responded positively to the interest-rate cuts and gained further in December 2019 after
1. Source: Morningstar. One cannot invest directly in an index, and an index is not representative of the Fund’s portfolio. Please see Index Descriptions following the Fund Summaries.
2. Source: U.S. Bureau of Labor Statistics.
The dollar value, number of shares or principal amount, and names of all portfolio holdings are listed in the Fund’s Statement of Investments (SOI).
TEMPLETON FOREIGN VIP FUND
the Fed indicated it would likely leave interest rates unchanged in 2020.
Growth slowed overall in the eurozone, particularly in Germany and Italy. Germany, which is heavily reliant on exports, was adversely affected by the trade conflict between the U.S. and China and the resulting slowdown in global trade. In Italy, political uncertainty and budget concerns caused the country’s annual gross domestic product (GDP) growth to stall in 2019’s first quarter before accelerating in the second quarter. Despite sluggish economic conditions, European developed market equities, as measured by the MSCI Europe Index, posted strong returns overall, as easing trade tensions buoyed investor optimism and an electoral victory by the Conservative Party in the U.K. alleviated uncertainty surrounding Brexit. Although the European Central Bank left its headline refinancing rate unchanged, it lowered the deposit rate and restarted its bond-buying stimulus program, further supporting stocks.
Economic growth in Asia was relatively solid overall, despite slowdowns in several large emerging market countries, such as China and India. Japan’s economy grew amid the Bank of Japan’s sizable stimulus program. The trade war between the U.S. and China provided the backdrop for Asian stocks, which rose and fell in sync with investor sentiment regarding a trade deal. A phase one trade agreement between the two countries reached in December 2019 propelled Asian developed and emerging market stocks, which ultimately ended with strong returns over the12-month period, as measured by the MSCI All Country Asia Index.
Emerging market stocks overall experienced several sharp selloffs and subsequent rebounds throughout the reporting period before ending with gains. In aggregate, economic growth slowed somewhat from 2018 but remained solid, although there was some variation among individual countries. Many central banks in emerging markets cut interest rates throughout the reporting period which, along with resilient GDP growth, provided a supportive environment for equities. Russian stocks posted the highest returns among emerging markets as the threat of further sanctions receded and a solid fiscal environment reassured investors. Overall, global emerging markets, as measured by the MSCI Emerging Markets Index, posted robust returns for the period.
Top 10 Holdings
12/31/19
| | | | |
Company Sector/Industry, Country | | % of Total
Net Assets | |
| |
Samsung Electronics Co. Ltd. Technology Hardware, Storage & Peripherals, South Korea | | | 4.8% | |
| |
BNP Paribas SA Banks, France | | | 3.1% | |
| |
ING Groep NV Banks, Netherlands | | | 3.1% | |
| |
Standard Chartered PLC Banks, U.K. | | | 3.0% | |
| |
CK Hutchison Holdings Ltd. Industrial Conglomerates, Hong Kong | | | 2.7% | |
| |
KB Financial Group Inc. Banks, South Korea | | | 2.7% | |
| |
BP PLC Oil, Gas & Consumable Fuels, U.K. | | | 2.5% | |
| |
Bayer AG Pharmaceuticals, Germany | | | 2.5% | |
| |
Takeda Pharmaceutical Co. Ltd. Pharmaceuticals, Japan | | | 2.4% | |
| |
Wheaton Precious Metals Corp. Metals & Mining, Canada | | | 2.3% | |
Investment Strategy
Our investment philosophy is bottom up, value oriented and long term. When choosing investments for the Fund, we generally focus on the market price of a company’s securities relative to our evaluation of the company’s potential long-term earnings, asset value and cash flow. Our analysis includes an assessment of the potential impacts of material environmental, social and governance (ESG) factors on the long-term risk and return profile of a company. We also consider a company’s price/earnings ratio, price/cash flow ratio, profit margins and liquidation value.
The Fund may, from time to time, engage in currency-related derivatives to seek to hedge (protect) against currency risks. The Fund may also use a variety of equity-related derivatives for various purposes including enhancing Fund returns, increasing liquidity and gaining exposure to particular markets in more efficient or less expensive ways.
TEMPLETON FOREIGN VIP FUND
Manager’s Discussion
During the 12 months under review, stock selection in the information technology (IT) and materials sectors contributed to the Fund’s performance relative to the MSCI ACWI ex USA Index.3
Within IT, key contributors to relative results included South Korean electronics firm Samsung Electronics, Netherlands-based semiconductor solutions company NXP Semiconductors, Swiss metering and smart grid solutions company Landis + Gyr Group (not part of the index) and Taiwanese integrated circuits and wafer semiconductor devices firm Taiwan Semiconductor Manufacturing. Samsung Electronics helped drive relative performance as its shares advanced after it posted better-than-expected earnings and projected a gradual recovery in the memory chip market as 5G wireless technology rolls out globally. We believe Samsung Electronics remains inexpensive for a global technology leader and could potentially benefit from a cyclical upswing in the memory chip segment and an increasing capital return program.
In materials, Canadian mining companies Wheaton Precious Metals and Alamos Gold (not part of the index) benefited relative performance. Shares of both companies rallied as the price of gold broke out of asix-year trading range. Anticipating an eventual move higher in gold prices given record-high debt levels, historically low interest rates, escalating geopolitical turmoil and renewed central bank buying, we maintained a modest precious metals allocation as a portfolio hedge and diversifier.
Other notable contributors to the Fund’s relative performance included French lender BNP Paribas, which benefited from solid results at its fixed income unit and from more benign European economic conditions. In our view, BNP Paribas is a diverse, high-quality European bank with an excellent track record of managing credit risk and maintaining profitability in various economic conditions.
In contrast, stock selection in the communication services, health care and energy sectors, as well as overweightings in communication services and energy, detracted from the Fund’s relative performance.4
Within communication services, Chinese language internet search company Baidu, Chinese telecommunication firm
China Telecom, Luxembourg-based satellite operator SES and German telecommunication firm Telefonica Deutschland Holding hurt relative results. China Telecom’s shares declined amid concerns about elevated 5G capital expenditures and continued security scrutiny of Chinese telecommunication services companies. We continue to believe the stock offers undemanding valuations, attractive dividend yields and a solid competitive position in a secular growth market. Shares of SES declined as investors, in our view, reacted too negatively to a regulatory ruling that we believe will likely prove less value-destructive than initially feared. We remain positive on the stock given its strong balance sheet and healthy dividend yield, as well as our expectation of renewed growth from the firm’s core business over a long-term investment horizon.
In health care, Israeli generic drugmaker Teva Pharmaceutical Industries (not held atperiod-end) declined amid legal and regulatory setbacks that, in our assessment, impaired the balance of risks, leading us to sell the stock.
In the energy sector, U.K.-based integrated energy firm BP, Canadian exploration and production company Husky Energy and U.K.-listed oil and natural gas producer Royal Dutch Shell dampened relative results. BP reported higher oil and gas production but disappointed investors hoping for a dividend increase. The company has made solid progress selling assets to shore up its balance sheet and, in our view, could potentially benefit from firmer oil prices and rising production following years of investment.
From a regional perspective, stock selection in North America, particularly in Canada, contributed to the Fund’s relative performance. In contrast, stock selection in Asia, especially in China and Japan, detracted from relative performance. Stock selection in Europe also hindered performance, as relative weakness in the U.K., Germany and Italy more than offset relative strength in the Netherlands and France. In the Middle East and Africa region, our position in Israel hindered relative performance.
Thank you for your participation in Templeton Foreign VIP Fund. We look forward to serving your future investment needs.
3. The IT sector comprises electronic equipment, instruments and components; semiconductors and semiconductor equipment; and technology hardware, storage and peripherals in the SOI. The materials sector comprises chemicals and metals and mining in the SOI.
4. The communication services sector comprises diversified telecommunication services, interactive media and services, media and wireless telecommunication services in the SOI. The health care sector comprises health care providers and services and pharmaceuticals in the SOI. The energy sector comprises energy equipment and services and oil, gas and consumable fuels in the SOI.
TEMPLETON FOREIGN VIP FUND
The foregoing information reflects our analysis, opinions and portfolio holdings as of December 31, 2019, the end of the reporting period. The way we implement our main investment strategies and the resulting portfolio holdings may change depending on factors such as market and economic conditions. These opinions may not be relied upon as investment advice or an offer for a particular security. The information is not a complete analysis of every aspect of any market, country, industry, security or the Fund. Statements of fact are from sources considered reliable, but the investment manager makes no representation or warranty as to their completeness or accuracy. Although historical performance is no guarantee of future results, these insights may help you understand our investment management philosophy.
TEMPLETON FOREIGN VIP FUND
Class 4 Fund Expenses
As an investor in a variable insurance contract (Contract) that indirectly provides for investment in an underlying mutual fund, you can incur transaction and/or ongoing expenses at both the Fund level and the Contract Level: (1) transaction expenses can include sales charges (loads) on purchases, surrender fees, transfer fees and premium taxes; and (2) ongoing expenses can include management fees, distribution and service(12b-1) fees, contract fees, annual maintenance fees, mortality and expense risk fees and other fees and expenses. All mutual funds and Contracts have some types of ongoing expenses. The table below shows Fund-level ongoing expenses and can help you understand these costs and compare them with those of other mutual funds offered through the Contract. The table assumes a $1,000 investment held for the six months indicated. Please refer to the Fund prospectus for additional information on operating expenses.
Actual Fund Expenses
The table below provides information about the actual account values and actual expenses in the columns under the heading “Actual.” In these columns the Fund’s actual return, which includes the effect of ongoing Fund expenses but does not include the effect of ongoing Contract expenses, is used to calculate the “Ending Account Value.” You can estimate the Fund-level expenses you paid during the period by following these steps (of course, your account value and expenses will differ fromthose in this illustration): Divide your account value by $1,000 (if your account had an $8,600 value, then $8,600÷ $1,000 = 8.6). Then multiply the result by the number under the headings “Actual” and “Fund-Level Expenses Paid During Period” (if Fund-Level Expenses Paid During Period were $ 7.50, then 8.6 x $ 7.50 = $64.50). In this illustration, the estimated expensespaid this period at the Fund level are $64.50.
Hypothetical Example for Comparison with Other Mutual Funds
Under the heading “Hypothetical” in the table, information is provided about hypothetical account values and hypothetical expenses based on the Fund’s actual expense ratio and an assumed rate of return of 5% per year before expenses, which is not the Fund’s actual return. This information may not be used to estimate the actual ending account balance or expenses you paid for the period, but it can help you compare ongoing costs of investing in the Fund with those of other mutual funds offered through the Contract. To do so, compare this 5% hypothetical example with the 5% hypothetical examples that appear in the shareholder reports of other funds offered through the Contract.
Please note that expenses shown in the table are meant to highlight ongoing costs at the Fund level only and do not reflect any ongoing expenses at the Contract level, or transaction expenses at either the Fund or Contract levels. In addition, while the Fund does not have transaction expenses, if the transaction and ongoing expenses at the Contract level were included, the expenses shown below would be higher. You should consult your Contract prospectus or disclosure document for more information.
| | | | | | | | | | | | |
| | | | | Actual
(actual return after expenses) | | Hypothetical
(5% annual return before expenses) | | |
Share Class | | Beginning Account Value 7/1/19 | | Ending Account Value 12/31/19 | | Fund-Level Expenses Paid During Period 7/1/19–12/31/191, 2 | | Ending Account Value 12/31/19 | | Fund-Level
Expenses Paid During Period 7/1/19–12/31/191, 2 | | Net Annualized
Expense Ratio2 |
| | | | | | |
| Class 4 | | $1,000 | | $1,056.50 | | $6.06 | | $1,019.31 | | $5.96 | | 1.17% |
1. Expenses are equal to the annualized expense ratio for thesix-month period as indicated above—in the far right column—multiplied by the simple average account value over the period indicated, and then multiplied by 184/365 to reflect theone-half year period.
2. Reflects expenses after fee waivers and expense reimbursements. Does not include any ongoing expenses of the Contract for which the Fund is an investment option or acquired fund fees and expenses.
FRANKLIN TEMPLETON VARIABLE INSURANCE PRODUCTS TRUST
Financial Highlights
Templeton Foreign VIP Fund
| | | | | | | | | | | | | | | | | | | | |
| | | Year Ended December 31, | |
| | | 2019 | | | 2018 | | | 2017 | | | 2016 | | | 2015 | |
| | | | | |
Class 1 | | | | | | | | | | | | | | | | | | | | |
| | | | | |
Per share operating performance (for a share outstanding throughout the year) | | | | | | | | | | | | | | | | | | | | |
| | | | | |
Net asset value, beginning of year | | | $13.01 | | | | $15.80 | | | | $13.89 | | | | $13.46 | | | | $15.34 | |
| | | | | |
Income from investment operationsa: | | | | | | | | | | | | | | | | | | | | |
| | | | | |
Net investment incomeb | | | 0.44 | | | | 0.29 | | | | 0.30 | | | | 0.33 | | | | 0.31 | |
| | | | | |
Net realized and unrealized gains (losses) | | | 1.19 | | | | (2.64 | ) | | | 2.03 | | | | 0.62 | | | | (1.16 | ) |
| | | | | |
Total from investment operations | | | 1.63 | | | | (2.35 | ) | | | 2.33 | | | | 0.95 | | | | (0.85 | ) |
| | | | | |
Less distributions from: | | | | | | | | | | | | | | | | | | | | |
| | | | | |
Net investment income | | | (0.27 | ) | | | (0.44 | ) | | | (0.42 | ) | | | (0.29 | ) | | | (0.53 | ) |
| | | | | |
Net realized gains | | | (0.14 | ) | | | — | | | | — | | | | (0.23 | ) | | | (0.50 | ) |
| | | | | |
Total distributions | | | (0.41 | ) | | | (0.44 | ) | | | (0.42 | ) | | | (0.52 | ) | | | (1.03 | ) |
| | | | | |
Net asset value, end of year | | | $14.23 | | | | $13.01 | | | | $15.80 | | | | $13.89 | | | | $13.46 | |
| | | | | |
Total returnc | | | 12.84% | | | | (15.27)% | | | | 17.02% | | | | 7.49% | | | | (6.31)% | |
| | | | | |
Ratios to average net assets | | | | | | | | | | | | | | | | | | | | |
| | | | | |
Expenses before waiver and payments by affiliates | | | 0.85% | | | | 0.83% | | | | 0.82% | | | | 0.80% | | | | 0.78% | |
| | | | | |
Expenses net of waiver and payments by affiliates | | | 0.83% | | | | 0.81% | | | | 0.81% | d | | | 0.78% | | | | 0.78% | e |
| | | | | |
Net investment income | | | 3.25% | | | | 1.96% | | | | 1.99% | | | | 2.38% | | | | 2.05% | |
| | | | | |
Supplemental data | | | | | | | | | | | | | | | | | | | | |
| | | | | |
Net assets, end of year (000’s) | | | $121,948 | | | | $114,784 | | | | $152,684 | | | | $133,218 | | | | $214,172 | |
| | | | | |
Portfolio turnover rate | | | 28.52% | | | | 21.38% | | | | 26.81% | | | | 20.93% | | | | 15.15% | |
aThe amount shown for a share outstanding throughout the period may not correlate with the Statement of Operations for the period due to the timing of sales and repurchases of the Fund’s shares in relation to income earned and/or fluctuating fair value of the investments of the Fund.
bBased on average daily shares outstanding.
cTotal return does not include fees, charges or expenses imposed by the variable annuity and life insurance contracts for which Franklin Templeton Variable Insurance Products Trust serves as an underlying investment vehicle.
dBenefit of expense reduction rounds to less than 0.01%.
eBenefit of waiver and payments by affiliates rounds to less than 0.01%.
| | | | |
| | | |
| | The accompanying notes are an integral part of these financial statements. | Annual Report | | TF-7 |
FRANKLIN TEMPLETON VARIABLE INSURANCE PRODUCTS TRUST
FINANCIAL HIGHLIGHTS
Templeton Foreign VIP Fund(continued)
| | | | | | | | | | | | | | | | | | | | |
| | | Year Ended December 31, | |
| | | 2019 | | | 2018 | | | 2017 | | | 2016 | | | 2015 | |
| | | | | |
Class 2 | | | | | | | | | | | | | | | | | | | | |
| | | | | |
Per share operating performance (for a share outstanding throughout the year) | | | | | | | | | | | | | | | | | | | | |
| | | | | |
Net asset value, beginning of year | | | $12.74 | | | | $15.47 | | | | $13.61 | | | | $13.20 | | | | $15.05 | |
| | | | | |
Income from investment operationsa: | | | | | | | | | | | | | | | | | | | | |
| | | | | |
Net investment incomeb | | | 0.40 | | | | 0.25 | | | | 0.26 | | | | 0.28 | | | | 0.27 | |
| | | | | |
Net realized and unrealized gains (losses) | | | 1.16 | | | | (2.58 | ) | | | 1.98 | | | | 0.62 | | | | (1.13 | ) |
| | | | | |
Total from investment operations | | | 1.56 | | | | (2.33 | ) | | | 2.24 | | | | 0.90 | | | | (0.86 | ) |
| | | | | |
Less distributions from: | | | | | | | | | | | | | | | | | | | | |
| | | | | |
Net investment income | | | (0.23 | ) | | | (0.40 | ) | | | (0.38 | ) | | | (0.26 | ) | | | (0.49 | ) |
| | | | | |
Net realized gains | | | (0.14 | ) | | | — | | | | — | | | | (0.23 | ) | | | (0.50 | ) |
| | | | | |
Total distributions | | | (0.37 | ) | | | (0.40 | ) | | | (0.38 | ) | | | (0.49 | ) | | | (0.99 | ) |
| | | | | |
Net asset value, end of year | | | $13.93 | | | | $12.74 | | | | $15.47 | | | | $13.61 | | | | $13.20 | |
| | | | | |
Total returnc | | | 12.53% | | | | (15.44)% | | | | 16.69% | | | | 7.18% | | | | (6.49)% | |
| | | | | |
Ratios to average net assets | | | | | | | | | | | | | | | | | | | | |
| | | | | |
Expenses before waiver and payments by affiliates | | | 1.10% | | | | 1.08% | | | | 1.07% | | | | 1.05% | | | | 1.03% | |
| | | | | |
Expenses net of waiver and payments by affiliates | | | 1.08% | | | | 1.06% | | | | 1.06% | d | | | 1.03% | | | | 1.03% | e |
| | | | | |
Net investment income | | | 3.00% | | | | 1.71% | | | | 1.74% | | | | 2.13% | | | | 1.80% | |
| | | | | |
Supplemental data | | | | | | | | | | | | | | | | | | | | |
| | | | | |
Net assets, end of year (000’s) | | | $1,117,813 | | | | $1,060,101 | | | | $1,394,475 | | | | $1,436,518 | | | | $1,456,854 | |
| | | | | |
Portfolio turnover rate | | | 28.52% | | | | 21.38% | | | | 26.81% | | | | 20.93% | | | | 15.15% | |
aThe amount shown for a share outstanding throughout the period may not correlate with the Statement of Operations for the period due to the timing of sales and repurchases of the Fund’s shares in relation to income earned and/or fluctuating fair value of the investments of the Fund.
bBased on average daily shares outstanding.
cTotal return does not include fees, charges or expenses imposed by the variable annuity and life insurance contracts for which Franklin Templeton Variable Insurance Products Trust serves as an underlying investment vehicle.
dBenefit of expense reduction rounds to less than 0.01%.
eBenefit of waiver and payments by affiliates rounds to less than 0.01%.
| | | | |
| | | |
TF-8 | | Annual Report | The accompanying notes are an integral part of these financial statements. | | |
FRANKLIN TEMPLETON VARIABLE INSURANCE PRODUCTS TRUST
FINANCIAL HIGHLIGHTS
Templeton Foreign VIP Fund(continued)
| | | | | | | | | | | | | | | | | | | | |
| | | Year Ended December 31, | |
| | | 2019 | | | 2018 | | | 2017 | | | 2016 | | | 2015 | |
| | | | | |
Class 4 | | | | | | | | | | | | | | | | | | | | |
| | | | | |
Per share operating performance | | | | | | | | | | | | | | | | | | | | |
(for a share outstanding throughout the year) | | | | | | | | | | | | | | | | | | | | |
| | | | | |
Net asset value, beginning of year | | | $12.96 | | | | $15.71 | | | | $13.71 | | | | $13.29 | | | | $15.16 | |
| | | | | |
Income from investment operationsa: | | | | | | | | | | | | | | | | | | | | |
| | | | | |
Net investment incomeb | | | 0.39 | | | | 0.24 | | | | 0.23 | | | | 0.26 | | | | 0.25 | |
| | | | | |
Net realized and unrealized gains (losses) | | | 1.20 | | | | (2.63 | ) | | | 2.03 | | | | 0.63 | | | | (1.14 | ) |
| | | | | |
Total from investment operations | | | 1.59 | | | | (2.39 | ) | | | 2.26 | | | | 0.89 | | | | (0.89 | ) |
| | | | | |
Less distributions from: | | | | | | | | | | | | | | | | | | | | |
| | | | | |
Net investment income | | | (0.21 | ) | | | (0.36 | ) | | | (0.26 | ) | | | (0.24 | ) | | | (0.48 | ) |
| | | | | |
Net realized gains | | | (0.14 | ) | | | — | | | | — | | | | (0.23 | ) | | | (0.50 | ) |
| | | | | |
Total distributions | | | (0.35 | ) | | | (0.36 | ) | | | (0.26 | ) | | | (0.47 | ) | | | (0.98 | ) |
| | | | | |
Net asset value, end of year | | | $14.20 | | | | $12.96 | | | | $15.71 | | | | $13.71 | | | | $13.29 | |
| | | | | |
Total returnc | | | 12.49% | | | | (15.54 | )% | | | 16.62% | | | | 7.09% | | | | (6.65)% | |
| | | | | |
Ratios to average net assets | | | | | | | | | | | | | | | | | | | | |
| | | | | |
Expenses before waiver and payments by affiliates | | | 1.20% | | | | 1.18% | | | | 1.17% | | | | 1.15% | | | | 1.13% | |
| | | | | |
Expenses net of waiver and payments by affiliates | | | 1.18% | | | | 1.16% | | | | 1.16% | d | | | 1.13% | | | | 1.13% | e |
| | | | | |
Net investment income | | | 2.90% | | | | 1.61% | | | | 1.64% | | | | 2.03% | | | | 1.70% | |
| | | | | |
Supplemental data | | | | | | | | | | | | | | | | | | | | |
| | | | | |
Net assets, end of year (000’s) | | | $113,681 | | | | $125,265 | | | | $159,944 | | | | $484,763 | | | | $472,189 | |
| | | | | |
Portfolio turnover rate | | | 28.52% | | | | 21.38% | | | | 26.81% | | | | 20.93% | | | | 15.15% | |
aThe amount shown for a share outstanding throughout the period may not correlate with the Statement of Operations for the period due to the timing of sales and repurchases of the Fund’s shares in relation to income earned and/or fluctuating fair value of the investments of the Fund.
bBased on average daily shares outstanding.
cTotal return does not include fees, charges or expenses imposed by the variable annuity and life insurance contracts for which Franklin Templeton Variable Insurance Products Trust serves as an underlying investment vehicle.
dBenefit of expense reduction rounds to less than 0.01%.
eBenefit of waiver and payments by affiliates rounds to less than 0.01%.
| | | | |
| | | |
| | The accompanying notes are an integral part of these financial statements. | Annual Report | | TF-9 |
FRANKLIN TEMPLETON VARIABLE INSURANCE PRODUCTS TRUST
Statement of Investments, December 31, 2019
Templeton Foreign VIP Fund
| | | | | | | | | | | | | | | | |
| | | Country | | | Shares | | | | | | Value | |
| | | | |
Common Stocks 94.4% | | | | | | | | | | | | | | | | |
Aerospace & Defense 1.3% | | | | | | | | | | | | | | | | |
BAE Systems PLC | | | United Kingdom | | | | 2,299,513 | | | | | | | $ | 17,201,492 | |
| | | | |
Auto Components 1.4% | | | | | | | | | | | | | | | | |
Cie Generale des Etablissements Michelin SCA | | | France | | | | 158,794 | | | | | | | | 19,428,477 | |
| | | | |
Automobiles 1.3% | | | | | | | | | | | | | | | | |
Hero Motocorp Ltd. | | | India | | | | 154,059 | | | | | | | | 5,274,667 | |
Isuzu Motors Ltd. | | | Japan | | | | 1,085,800 | | | | | | | | 12,978,644 | |
| | | | |
| | | | | | | | | | | | | | | 18,253,311 | |
Banks 17.8% | | | | | | | | | | | | | | | | |
Bank of Ireland Group PLC | | | Ireland | | | | 2,346,131 | | | | | | | | 12,844,877 | |
BNP Paribas SA | | | France | | | | 717,204 | | | | | | | | 42,491,615 | |
Hana Financial Group Inc. | | | South Korea | | | | 540,193 | | | | | | | | 17,243,334 | |
ING Groep NV | | | Netherlands | | | | 3,440,596 | | | | | | | | 41,239,182 | |
Kasikornbank PCL, fgn | | | Thailand | | | | 1,860,000 | | | | | | | | 9,403,090 | |
KB Financial Group Inc., ADR | | | South Korea | | | | 871,106 | | | | | | | | 36,037,655 | |
Shinhan Financial Group Co. Ltd. | | | South Korea | | | | 366,922 | | | | | | | | 13,759,694 | |
Standard Chartered PLC | | | United Kingdom | | | | 4,362,317 | | | | | | | | 41,160,126 | |
Sumitomo Mitsui Financial Group Inc. | | | Japan | | | | 732,300 | | | | | | | | 27,209,822 | |
| | | | |
| | | | | | | | | | | | | | | 241,389,395 | |
Beverages 2.0% | | | | | | | | | | | | | | | | |
Kirin Holdings Co. Ltd. | | | Japan | | | | 841,800 | | | | | | | | 18,513,016 | |
Suntory Beverage & Food Ltd. | | | Japan | | | | 217,100 | | | | | | | | 9,079,544 | |
| | | | |
| | | | | | | | | | | | | | | 27,592,560 | |
Building Products 1.1% | | | | | | | | | | | | | | | | |
Compagnie de Saint-Gobain | | | France | | | | 373,982 | | | | | | | | 15,308,177 | |
| | | | |
Capital Markets 0.5% | | | | | | | | | | | | | | | | |
UBS Group AG | | | Switzerland | | | | 540,632 | | | | | | | | 6,830,183 | |
| | | | |
Chemicals 2.7% | | | | | | | | | | | | | | | | |
Johnson Matthey PLC | | | United Kingdom | | | | 580,290 | | | | | | | | 23,026,210 | |
Lotte Chemical Corp. | | | South Korea | | | | 67,855 | | | | | | | | 13,148,487 | |
| | | | |
| | | | | | | | | | | | | | | 36,174,697 | |
Construction & Engineering 0.5% | | | | | | | | | | | | | | | | |
Sinopec Engineering Group Co. Ltd. | | | China | | | | 11,734,000 | | | | | | | | 7,017,240 | |
| | | | |
Diversified Telecommunication Services 3.1% | | | | | | | | | | | | | | | | |
China Telecom Corp. Ltd., H | | | China | | | | 40,444,357 | | | | | | | | 16,660,856 | |
Singapore Telecommunications Ltd. | | | Singapore | | | | 6,240,400 | | | | | | | | 15,633,473 | |
Telefonica Deutschland Holding AG | | | Germany | | | | 3,133,398 | | | | | | | | 9,080,045 | |
| | | | |
| | | | | | | | | | | | | | | 41,374,374 | |
Electric Utilities 0.5% | | | | | | | | | | | | | | | | |
aKorea Electric Power Corp. | | | South Korea | | | | 267,802 | | | | | | | | 6,440,277 | |
| | | | |
Electronic Equipment, Instruments & Components 0.9% | | | | | | | | | | | | | | | | |
Landis+Gyr Group AG | | | Switzerland | | | | 120,834 | | | | | | | | 12,574,778 | |
FRANKLIN TEMPLETON VARIABLE INSURANCE PRODUCTS TRUST
STATEMENT OF INVESTMENTS
Templeton Foreign VIP Fund(continued)
| | | | | | | | | | | | | | | | |
| | | Country | | | Shares | | | | | | Value | |
| | | | |
Common Stocks(continued) | | | | | | | | | | | | | | | | |
Energy Equipment & Services 1.8% | | | | | | | | | | | | | | | | |
SBM Offshore NV | | | Netherlands | | | | 960,511 | | | | | | | $ | 17,870,169 | |
Tenaris SA | | | Italy | | | | 570,849 | | | | | | | | 6,433,795 | |
| | | | |
| | | | | | | | | | | | | | | 24,303,964 | |
| | | | |
Food & Staples Retailing 3.1% | | | | | | | | | | | | | | | | |
Matsumotokiyoshi Holdings Co. Ltd. | | | Japan | | | | 347,500 | | | | | | | | 13,541,868 | |
Seven & i Holdings Co. Ltd. | | | Japan | | | | 360,100 | | | | | | | | 13,264,139 | |
Sundrug Co. Ltd. | | | Japan | | | | 410,400 | | | | | | | | 14,935,652 | |
| | | | |
| | | | | | | | | | | | | | | 41,741,659 | |
| | | | |
Health Care Providers & Services 0.8% | | | | | | | | | | | | | | | | |
Sinopharm Group Co. Ltd., H | | | China | | | | 2,794,800 | | | | | | | | 10,203,927 | |
| | | | |
Household Durables 1.6% | | | | | | | | | | | | | | | | |
Panasonic Corp. | | | Japan | | | | 2,272,100 | | | | | | | | 21,524,058 | |
| | | | |
Industrial Conglomerates 2.7% | | | | | | | | | | | | | | | | |
CK Hutchison Holdings Ltd. | | | Hong Kong | | | | 3,873,500 | | | | | | | | 36,934,031 | |
| | | | |
Interactive Media & Services 1.3% | | | | | | | | | | | | | | | | |
aBaidu Inc., ADR | | | China | | | | 138,230 | | | | | | | | 17,472,272 | |
| | | | |
Marine 0.6% | | | | | | | | | | | | | | | | |
A.P. Moeller-Maersk AS, B | | | Denmark | | | | 5,208 | | | | | | | | 7,509,675 | |
| | | | |
Media 0.8% | | | | | | | | | | | | | | | | |
SES SA, IDR | | | Luxembourg | | | | 809,562 | | | | | | | | 11,348,541 | |
| | | | |
Metals & Mining 5.1% | | | | | | | | | | | | | | | | |
Alamos Gold Inc., A | | | Canada | | | | 3,063,752 | | | | | | | | 18,443,787 | |
Sumitomo Metal Mining Co. Ltd. | | | Japan | | | | 603,700 | | | | | | | | 19,687,259 | |
Wheaton Precious Metals Corp. | | | Canada | | | | 1,040,700 | | | | | | | | 30,966,154 | |
| | | | |
| | | | | | | | | | | | | | | 69,097,200 | |
| | | | |
Multi-Utilities 2.7% | | | | | | | | | | | | | | | | |
E.ON SE | | | Germany | | | | 1,722,486 | | | | | | | | 18,397,339 | |
Veolia Environnement SA | | | France | | | | 671,188 | | | | | | | | 17,846,607 | |
| | | | |
| | | | | | | | | | | | | | | 36,243,946 | |
| | | | |
Oil, Gas & Consumable Fuels 11.8% | | | | | | | | | | | | | | | | |
BP PLC | | | United Kingdom | | | | 5,505,186 | | | | | | | | 34,385,976 | |
Eni SpA | | | Italy | | | | 1,751,379 | | | | | | | | 27,194,707 | |
Equinor ASA | | | Norway | | | | 1,032,386 | | | | | | | | 20,641,839 | |
Galp Energia SGPS SA, B | | | Portugal | | | | 844,528 | | | | | | | | 14,111,729 | |
Husky Energy Inc. | | | Canada | | | | 1,163,600 | | | | | | | | 9,336,757 | |
Royal Dutch Shell PLC, B | | | United Kingdom | | | | 1,043,010 | | | | | | | | 30,936,779 | |
Total SA | | | France | | | | 418,732 | | | | | | | | 23,103,681 | |
| | | | |
| | | | | | | | | | | | | | | 159,711,468 | |
| | | | |
Pharmaceuticals 11.6% | | | | | | | | | | | | | | | | |
Astellas Pharma Inc. | | | Japan | | | | 596,100 | | | | | | | | 10,257,253 | |
Bayer AG | | | Germany | | | | 412,732 | | | | | | | | 33,700,713 | |
Merck KGaA | | | Germany | | | | 175,053 | | | | | | | | 20,681,594 | |
Novartis AG | | | Switzerland | | | | 128,920 | | | | | | | | 12,243,836 | |
Roche Holding AG | | | Switzerland | | | | 79,825 | | | | | | | | 25,903,013 | |
FRANKLIN TEMPLETON VARIABLE INSURANCE PRODUCTS TRUST
STATEMENT OF INVESTMENTS
Templeton Foreign VIP Fund(continued)
| | | | | | | | | | | | | | | | |
| | | Country | | | Shares | | | | | | Value | |
| | | | |
Common Stocks(continued) | | | | | | | | | | | | | | | | |
Pharmaceuticals(continued) | | | | | | | | | | | | | | | | |
Sanofi | | | France | | | | 209,983 | | | | | | | $ | 21,104,205 | |
Takeda Pharmaceutical Co. Ltd. | | | Japan | | | | 816,694 | | | | | | | | 32,555,035 | |
| | | | |
| | | | | | | | | | | | | | | 156,445,649 | |
| | | | |
Real Estate Management & Development 3.1% | | | | | | | | | | | | | | | | |
CK Asset Holdings Ltd. | | | Hong Kong | | | | 3,078,200 | | | | | | | | 22,220,493 | |
Mitsui Fudosan Co. Ltd. | | | Japan | | | | 767,500 | | | | | | | | 18,870,578 | |
Swire Pacific Ltd., A | | | Hong Kong | | | | 90,800 | | | | | | | | 843,643 | |
| | | | |
| | | | | | | | | | | | | | | 41,934,714 | |
| | | | |
Semiconductors & Semiconductor Equipment 5.2% | | | | | | | | | | | | | | | | |
Infineon Technologies AG | | | Germany | | | | 590,665 | | | | | | | | 13,453,370 | |
NXP Semiconductors NV | | | Netherlands | | | | 221,300 | | | | | | | | 28,162,637 | |
Taiwan Semiconductor Manufacturing Co. Ltd. | | | Taiwan | | | | 2,587,000 | | | | | | | | 28,628,163 | |
| | | | |
| | | | | | | | | | | | | | | 70,244,170 | |
| | | | |
Specialty Retail 1.0% | | | | | | | | | | | | | | | | |
Kingfisher PLC | | | United Kingdom | | | | 4,640,268 | | | | | | | | 13,336,392 | |
Technology Hardware, Storage & Peripherals 4.8% | | | | | | | | | | | | | | | | |
Samsung Electronics Co. Ltd. | | | South Korea | | | | 1,337,964 | | | | | | | | 64,583,942 | |
Wireless Telecommunication Services 3.3% | | | | | | | | | | | | | | | | |
China Mobile Ltd. | | | China | | | | 1,821,000 | | | | | | | | 15,306,841 | |
Vodafone Group PLC, ADR | | | United Kingdom | | | | 1,512,103 | | | | | | | | 29,228,951 | |
| | | | |
| | | | | | | | | | | | | | | 44,535,792 | |
| | | | |
Total Common Stocks (Cost $1,116,248,012) | | | | | | | | | | | | | | | 1,276,756,361 | |
| | | | |
Short Term Investments (Cost $70,825,763) 5.2% | | | | | | | | | | | | | | | | |
| | | | |
Money Market Funds 5.2% | | | | | | | | | | | | | | | | |
b,cInstitutional Fiduciary Trust Money Market Portfolio, 1.26% | | | United States | | | | 70,825,763 | | | | | | | | 70,825,763 | |
| | | | |
Total Investments (Cost $1,187,073,775) 99.6% | | | | | | | | | | | | | | | 1,347,582,124 | |
Other Assets, less Liabilities 0.4% | | | | | | | | | | | | | | | 5,859,442 | |
| | | | |
Net Assets 100.0% | | | | | | | | | | | | | | $ | 1,353,441,566 | |
See Abbreviations on pageTF-23.
aNon-income producing.
bSee Note 3(e) regarding investments in affiliated management investment companies.
cThe rate shown is the annualizedseven-day effective yield at period end.
| | | | |
| | | |
TF-12 | | Annual Report | The accompanying notes are an integral part of these financial statements. | | |
FRANKLIN TEMPLETON VARIABLE INSURANCE PRODUCTS TRUST
FINANCIAL STATEMENTS
Statement of Assets and Liabilities
December 31, 2019
| | | | |
| | | Templeton
Foreign VIP Fund | |
| |
Assets: | | | | |
Investments in securities: | | | | |
Cost - Unaffiliated issuers | | $ | 1,116,248,012 | |
| |
Cost -Non-controlled affiliates (Note 3e) | | | 70,825,763 | |
| |
Value - Unaffiliated issuers | | $ | 1,276,756,361 | |
Value -Non-controlled affiliates (Note 3e) | | | 70,825,763 | |
Receivables: | | | | |
Investment securities sold | | | 494,328 | |
Capital shares sold | | | 70,547 | |
Dividends | | | 8,442,994 | |
European Union tax reclaims | | | 851,866 | |
Other assets | | | 165 | |
| |
Total assets | | | 1,357,442,024 | |
| |
Liabilities: | | | | |
Payables: | | | | |
Investment securities purchased | | | 1,689,770 | |
Capital shares redeemed | | | 737,263 | |
Management fees | | | 886,909 | |
Distribution fees | | | 267,257 | |
Reports to shareholders | | | 202,736 | |
Accrued expenses and other liabilities | | | 216,523 | |
| |
Total liabilities | | | 4,000,458 | |
| |
Net assets, at value | | $ | 1,353,441,566 | |
| |
Net assets consist of: | | | | |
Paid-in capital | | $ | 1,199,267,363 | |
Total distributable earnings (losses) | | | 154,174,203 | |
| |
Net assets, at value | | $ | 1,353,441,566 | |
| |
Class 1: | | | | |
Net assets, at value | | $ | 121,947,913 | |
Shares outstanding | | | 8,568,140 | |
Net asset value and maximum offering price per share | | | $14.23 | |
Class 2: | | | | |
Net assets, at value | | $ | 1,117,813,122 | |
Shares outstanding | | | 80,216,519 | |
Net asset value and maximum offering price per share | | | $13.93 | |
Class 4: | | | | |
Net assets, at value | | $ | 113,680,531 | |
Shares outstanding | | | 8,008,045 | |
Net asset value and maximum offering price per share | | | $14.20 | |
| | | | |
| | | |
| | The accompanying notes are an integral part of these financial statements. | Annual Report | | TF-13 |
FRANKLIN TEMPLETON VARIABLE INSURANCE PRODUCTS TRUST
FINANCIAL STATEMENTS
Statement of Operations
for the year ended December 31, 2019
| | | | |
| | | Templeton Foreign VIP Fund | |
| |
| |
Investment income: | | | | |
Dividends: (net of foreign taxes)* | | | | |
Unaffiliated issuers | | $ | 52,458,556 | |
Non-controlled affiliates (Note 3e) | | | 1,028,147 | |
Interest: | | | | |
Unaffiliated issuers | | | 4,197 | |
Income from securities loaned: | | | | |
Non-controlled affiliates (Note 3e) | | | 254,421 | |
| | | | |
| |
Total investment income | | | 53,745,321 | |
| | | | |
| |
Expenses: | | | | |
Management fees (Note 3a) | | | 10,579,830 | |
Distribution fees: (Note 3c) | | | | |
Class 2 | | | 2,711,228 | |
Class 4 | | | 397,414 | |
Custodian fees (Note 4) | | | 136,162 | |
Reports to shareholders | | | 253,150 | |
Professional fees | | | 105,663 | |
Trustees’ fees and expenses | | | 7,868 | |
Other | | | 48,047 | |
| | | | |
| |
Total expenses | | | 14,239,362 | |
Expenses waived/paid by affiliates (Note 3e) | | | (244,795 | ) |
| | | | |
| |
Net expenses | | | 13,994,567 | |
| | | | |
| |
Net investment income | | | 39,750,754 | |
| | | | |
| |
Realized and unrealized gains (losses): | | | | |
Net realized gain (loss) from: | | | | |
Investments: | | | | |
Unaffiliated issuers | | | (42,774,216 | ) |
Foreign currency transactions | | | (165,905 | ) |
| | | | |
| |
Net realized gain (loss) | | | (42,940,121 | ) |
| | | | |
| |
Net change in unrealized appreciation (depreciation) on: | | | | |
Investments: | | | | |
Unaffiliated issuers | | | 161,088,553 | |
Translation of other assets and liabilities
denominated in foreign currencies | | | (44,012 | ) |
| | | | |
| |
Net change in unrealized appreciation (depreciation) | | | 161,044,541 | |
| | | | |
| |
Net realized and unrealized gain (loss) | | | 118,104,420 | |
| | | | |
| |
Net increase (decrease) in net assets resulting from operations | | $ | 157,855,174 | |
| | | | |
| |
| | | | |
| *Foreign taxes withheld on dividends | | $ | 4,376,801 | |
| | | | |
| | | |
TF-14 | | Annual Report | The accompanying notes are an integral part of these financial statements. | | |
FRANKLIN TEMPLETON VARIABLE INSURANCE PRODUCTS TRUST
FINANCIAL STATEMENTS
Statements of Changes in Net Assets
| | | | | | | | |
| | | Templeton Foreign VIP Fund | |
| | | | |
| |
| | | Year Ended December 31, | |
| | | | |
| | |
| | | 2019 | | | 2018 | |
| |
Increase (decrease) in net assets: | | | | | | | | |
Operations: | | | | | | | | |
Net investment income | | $ | 39,750,754 | | | $ | 26,739,957 | |
Net realized gain (loss) | | | (42,940,121 | ) | | | 97,768,736 | |
Net change in unrealized appreciation (depreciation) | | | 161,044,541 | | | | (367,924,342 | ) |
| | | | |
| | |
Net increase (decrease) in net assets resulting from operations | | | 157,855,174 | | | | (243,415,649 | ) |
| | | | |
| | |
Distributions to shareholders: | | | | | | | | |
Class 1 | | | (3,542,825 | ) | | | (3,961,619 | ) |
Class 2 | | | (29,727,357 | ) | | | (33,465,356 | ) |
Class 4 | | | (2,819,837 | ) | | | (3,521,973 | ) |
| | | | |
| | |
Total distributions to shareholders | | | (36,090,019 | ) | | | (40,948,948 | ) |
| | | | |
| | |
Capital share transactions: (Note 2) | | | | | | | | |
Class 1 | | | (3,622,678 | ) | | | (12,722,479 | ) |
Class 2 | | | (41,982,881 | ) | | | (102,793,664 | ) |
Class 4 | | | (22,867,835 | ) | | | (7,072,417 | ) |
| | | | |
| | |
Total capital share transactions | | | (68,473,394 | ) | | | (122,588,560 | ) |
| | | | |
| | |
Net increase (decrease) in net assets | | | 53,291,761 | | | | (406,953,157 | ) |
| | |
Net assets: | | | | | | | | |
Beginning of year | | | 1,300,149,805 | | | | 1,707,102,962 | |
| | | | |
| | |
End of year | | $ | 1,353,441,566 | | | $ | 1,300,149,805 | |
| | | | |
| | | | |
| | | |
| | The accompanying notes are an integral part of these financial statements. | Annual Report | | TF-15 |
FRANKLIN TEMPLETON VARIABLE INSURANCE PRODUCTS TRUST
Notes to Financial Statements
Templeton Foreign VIP Fund
1. Organization and Significant Accounting Policies
Franklin Templeton Variable Insurance Products Trust (Trust) is registered under the Investment Company Act of 1940 (1940 Act) as anopen-end management investment company, consisting of eighteen separate funds and applies the specialized accounting and reporting guidance in U.S. Generally Accepted Accounting Principles (U.S. GAAP). Templeton Foreign VIP Fund (Fund) is included in this report. Shares of the Fund are generally sold only to insurance company separate accounts to fund the benefits of variable life insurance policies or variable annuity contracts. The Fund offers three classes of shares: Class 1, Class 2, and Class 4. Each class of shares may differ by its distribution fees, voting rights on matters affecting a single class and its exchange privilege.
The following summarizes the Fund’s significant accounting policies.
a. Financial Instrument Valuation
The Fund’s investments in financial instruments are carried at fair value daily. Fair value is the price that would be received to sell an asset or paid to transfer a liability in an orderly transaction between market participants on the measurement date. The Fund calculates the net asset value (NAV) per share each business day as of 4 p.m. Eastern time or the regularly scheduled close of the New York Stock Exchange (NYSE), whichever is earlier. Under compliance policies and procedures approved by the Trust’s Board of Trustees (the Board), the Fund’s administrator has responsibility for oversight of valuation, including leading the cross-functional Valuation Committee (VC). The Fund may utilize independent pricing services, quotations from securities and financial instrument dealers, and other market sources to determine fair value.
Equity securities listed on an exchange or on the NASDAQ National Market System are valued at the last quoted sale price or the official closing price of the day, respectively. Foreign equity securities are valued as of the close of trading on the foreign stock exchange on which the security is primarily traded, or as of 4 p.m. Eastern time. The value is then converted into its U.S. dollar equivalent at the foreign exchange rate in effect at 4 p.m. Eastern time on the day that the value of the security is determined.Over-the-counter (OTC) securities are valued within the range of the most recent quoted bid and ask prices. Securities that trade in multiple markets or on multiple exchanges are valued
according to the broadest and most representative market. Certain equity securities are valued based upon fundamental characteristics or relationships to similar securities.
Investments inopen-end mutual funds are valued at the closing NAV.
The Fund has procedures to determine the fair value of financial instruments for which market prices are not reliable or readily available. Under these procedures, the Fund primarily employs a market-based approach which may use related or comparable assets or liabilities, recent transactions, market multiples, book values, and other relevant information for the investment to determine the fair value of the investment. An income-based valuation approach may also be used in which the anticipated future cash flows of the investment are discounted to calculate fair value. Discounts may also be applied due to the nature or duration of any restrictions on the disposition of the investments. Due to the inherent uncertainty of valuations of such investments, the fair values may differ significantly from the values that would have been used had an active market existed.
Trading in securities on foreign securities stock exchanges and OTC markets may be completed before 4 p.m. Eastern time. In addition, trading in certain foreign markets may not take place on every Fund’s business day. Occasionally, events occur between the time at which trading in a foreign security is completed and 4 p.m. Eastern time that might call into question the reliability of the value of a portfolio security held by the Fund. As a result, differences may arise between the value of the Fund’s portfolio securities as determined at the foreign market close and the latest indications of value at 4 p.m. Eastern time. In order to minimize the potential for these differences, the VC monitors price movements following the close of trading in foreign stock markets through a series of country specific market proxies (such as baskets of American Depositary Receipts, futures contracts and exchange traded funds). These price movements are measured against established trigger thresholds for each specific market proxy to assist in determining if an event has occurred that may call into question the reliability of the values of the foreign securities held by the Fund. If such an event occurs, the securities may be valued using fair value procedures, which may include the use of independent pricing services.
FRANKLIN TEMPLETON VARIABLE INSURANCE PRODUCTS TRUST
NOTES TO FINANCIAL STATEMENTS
Templeton Foreign VIP Fund(continued)
When the last day of the reporting period is anon-business day, certain foreign markets may be open on those days that the Fund’s NAV is not calculated, which could result in differences between the value of the Fund’s portfolio securities on the last business day and the last calendar day of the reporting period. Any significant security valuation changes due to an open foreign market are adjusted and reflected by the Fund for financial reporting purposes.
b. Foreign Currency Translation
Portfolio securities and other assets and liabilities denominated in foreign currencies are translated into U.S. dollars based on the exchange rate of such currencies against U.S. dollars on the date of valuation. The Fund may enter into foreign currency exchange contracts to facilitate transactions denominated in a foreign currency. Purchases and sales of securities, income and expense items denominated in foreign currencies are translated into U.S. dollars at the exchange rate in effect on the transaction date. Portfolio securities and assets and liabilities denominated in foreign currencies contain risks that those currencies will decline in value relative to the U.S. dollar. Occasionally, events may impact the availability or reliability of foreign exchange rates used to convert the U.S. dollar equivalent value. If such an event occurs, the foreign exchange rate will be valued at fair value using procedures established and approved by the Board.
The Fund does not separately report the effect of changes in foreign exchange rates from changes in market prices on securities held. Such changes are included in net realized and unrealized gain or loss from investments in the Statement of Operations.
Realized foreign exchange gains or losses arise from sales of foreign currencies, currency gains or losses realized between the trade and settlement dates on securities transactions and the difference between the recorded amounts of dividends, interest, and foreign withholding taxes and the U.S. dollar equivalent of the amounts actually received or paid. Net unrealized foreign exchange gains and losses arise from changes in foreign exchange rates on foreign denominated assets and liabilities other than investments in securities held at the end of the reporting period.
c. Securities Lending
The Fund participates in an agency based securities lending program to earn additional income. The Fund receives cash collateral against the loaned securities in an amount equal to at least 102% of the fair value of the loaned securities. Collateral is maintained over the life of the loan in an amount not less than 100% of the fair value of loaned securities, as determined at the close of Fund business each day; any additional collateral required due to changes in security values is delivered to the Fund on the next business day. The collateral is deposited into a joint cash account with other funds and is used to invest in a money market fund managed by Franklin Advisers, Inc., an affiliate of the Fund. The Fund may receive income from the investment of cash collateral, in addition to lending fees and rebates paid by the borrower. Income from securities loaned, net of fees paid to the securities lending agent and/or third-party vendor, is reported separately in the Statement of Operations. The Fund bears the market risk with respect to the collateral investment, securities loaned, and the risk that the agent may default on its obligations to the Fund. If the borrower defaults on its obligation to return the securities loaned, the Fund has the right to repurchase the securities in the open market using the collateral received. The securities lending agent has agreed to indemnify the Fund in the event of default by a third party borrower. At December 31, 2019, the Fund had no securities on loan.
d. Income and Deferred Taxes
It is the Fund’s policy to qualify as a regulated investment company under the Internal Revenue Code. The Fund intends to distribute to shareholders substantially all of its taxable income and net realized gains to relieve it from federal income and if applicable, excise taxes. As a result, no provision for U.S. federal income taxes is required.
The Fund may be subject to foreign taxation related to income received, capital gains on the sale of securities and certain foreign currency transactions in the foreign jurisdictions in which it invests. Foreign taxes, if any, are recorded based on the tax regulations and rates that exist in the foreign markets in which the Fund invests. When a capital gain tax is determined to apply, the Fund records an estimated deferred tax liability in an amount that would be payable if the securities were disposed of on the valuation date.
FRANKLIN TEMPLETON VARIABLE INSURANCE PRODUCTS TRUST
NOTES TO FINANCIAL STATEMENTS
Templeton Foreign VIP Fund(continued)
1. Organization and Significant Accounting Policies (continued)
d. Income and Deferred Taxes(continued)
As a result of several court cases, in certain countries across the European Union, the Fund filed additional tax reclaims for previously withheld taxes on dividends earned in those countries (EU reclaims). These additional filings are subject to various administrative proceedings by the local jurisdictions’ tax authorities within the European Union, as well as a number of related judicial proceedings. Income recognized, if any, for EU reclaims is reflected as other income in the Statement of Operations and any related receivable, if any, is reflected as European Union tax reclaims in the Statement of Assets and Liabilities. When uncertainty exists as to the ultimate resolution of these proceedings, the likelihood of receipt of these EU reclaims, and the potential timing of payment, no amounts are reflected in the financial statements. For U.S. income tax purposes, when EU reclaims are received by the Fund and the Fund previously passed foreign tax credit on to its shareholders, the Fund must either amend historic tax reporting to shareholders or enter into a closing agreement with the Internal Revenue Service (IRS) in order to pay the associated tax liability on behalf of the Fund’s shareholders.
The Fund may recognize an income tax liability related to its uncertain tax positions under U.S. GAAP when the uncertain tax position has a less than 50% probability that it will be sustained upon examination by the tax authorities based on its technical merits. As of December 31, 2019, the Fund has determined that no tax liability is required in its financial statements related to uncertain tax positions for any open tax years (or expected to be taken in future tax years). Open tax years are those that remain subject to examination and are based on the statute of limitations in each jurisdiction in which the Fund invests.
e. Security Transactions, Investment Income, Expenses and Distributions
Security transactions are accounted for on trade date. Realized gains and losses on security transactions are determined on a specific identification basis. Interest income and estimated expenses are accrued daily. Dividend income is recorded on theex-dividend date except for certain dividends from securities where the dividend rate is not
available. In such cases, the dividend is recorded as soon as the information is received by the Fund. Distributions to shareholders are recorded on theex-dividend date. Distributable earnings are determined according to income tax regulations (tax basis) and may differ from earnings recorded in accordance with U.S. GAAP. These differences may be permanent or temporary. Permanent differences are reclassified among capital accounts to reflect their tax character. These reclassifications have no impact on net assets or the results of operations. Temporary differences are not reclassified, as they may reverse in subsequent periods.
Common expenses incurred by the Trust are allocated among the Funds based on the ratio of net assets of each Fund to the combined net assets of the Trust or based on the ratio of number of shareholders of each Fund to the combined number of shareholders of the Trust. Fund specific expenses are charged directly to the Fund that incurred the expense.
Realized and unrealized gains and losses and net investment income, excluding class specific expenses, are allocated daily to each class of shares based upon the relative proportion of net assets of each class. Differences in per share distributions by class are generally due to differences in class specific expenses.
f. Accounting Estimates
The preparation of financial statements in accordance with U.S. GAAP requires management to make estimates and assumptions that affect the reported amounts of assets and liabilities at the date of the financial statements and the amounts of income and expenses during the reporting period. Actual results could differ from those estimates.
g. Guarantees and Indemnifications
Under the Trust’s organizational documents, its officers and trustees are indemnified by the Trust against certain liabilities arising out of the performance of their duties to the Trust. Additionally, in the normal course of business, the Trust, on behalf of the Fund, enters into contracts with service providers that contain general indemnification clauses. The Trust’s maximum exposure under these arrangements is unknown as this would involve future claims that may be made against the Trust that have not yet occurred. Currently, the Trust expects the risk of loss to be remote.
FRANKLIN TEMPLETON VARIABLE INSURANCE PRODUCTS TRUST
NOTES TO FINANCIAL STATEMENTS
Templeton Foreign VIP Fund(continued)
2. Shares of Beneficial Interest
At December 31, 2019, there were an unlimited number of shares authorized (without par value). Transactions in the Fund’s shares were as follows:
| | | | | | | | | | | | | | | | | | | | | | | | | | | | |
| | | Year Ended December 31, | |
| | | | |
| | |
| | | 2019 | | | 2018 | |
| | | | |
| | | | | | | |
| | | Shares | | | | | | Amount | | | | | | Shares | | | | | | Amount | |
| |
| | | | | | | |
Class 1 Shares: | | | | | | | | | | | | | | | | | | | | | | | | | | | | |
| | | | | | | |
Shares sold | | | 315,303 | | | | | | | $ | 4,277,207 | | | | | | | | 438,905 | | | | | | | $ | 6,719,723 | |
Shares issued in reinvestment of distributions | | | 273,789 | | | | | | | | 3,542,825 | | | | | | | | 263,056 | | | | | | | | 3,961,619 | |
Shares redeemed | | | (844,252) | | | | | | | | (11,442,710) | | | | | | | | (1,543,257) | | | | | | | | (23,403,821) | |
| | | | |
| | | | | | | |
Net increase (decrease) | | | (255,160) | | | | | | | $ | (3,622,678) | | | | | | | | (841,296) | | | | | | | $ | (12,722,479) | |
| | | | |
| | | | | | | |
Class 2 Shares: | | | | | | | | | | | | | | | | | | | | | | | | | | | | |
Shares sold | | | 7,564,257 | | | | | | | $ | 99,786,234 | | | | | | | | 7,214,702 | | | | | | | $ | 104,866,589 | |
Shares issued in reinvestment of distributions | | | 2,342,581 | | | | | | | | 29,727,357 | | | | | | | | 2,265,765 | | | | | | | | 33,465,356 | |
Shares redeemed | | | (12,910,655) | | | | | | | | (171,496,472) | | | | | | | | (16,372,436) | | | | | | | | (241,125,609) | |
| | | | |
| | | | | | | |
Net increase (decrease) | | | (3,003,817) | | | | | | | $ | (41,982,881) | | | | | | | | (6,891,969) | | | | | | | $ | (102,793,664) | |
| | | | |
| | | | | | | |
Class 4 Shares: | | | | | | | | | | | | | | | | | | | | | | | | | | | | |
Shares sold | | | 784,963 | | | | | | | $ | 10,500,046 | | | | | | | | 1,564,942 | | | | | | | $ | 23,205,250 | |
Shares issued in reinvestment of distributions | | | 218,085 | | | | | | | | 2,819,837 | | | | | | | | 234,330 | | | | | | | | 3,521,973 | |
Shares redeemed | | | (2,661,084) | | | | | | | | (36,187,718) | | | | | | | | (2,311,503) | | | | | | | | (33,799,640) | |
| | | | |
| | | | | | | |
Net increase (decrease) | | | (1,658,036) | | | | | | | $ | (22,867,835) | | | | | | | | (512,231) | | | | | | | $ | (7,072,417) | |
| | | | |
3. Transactions with Affiliates
Franklin Resources, Inc. is the holding company for various subsidiaries that together are referred to as Franklin Templeton. Certain officers and trustees of the Fund are also officers and/or directors of the following subsidiaries:
| | |
| Subsidiary | | Affiliation |
Templeton Investment Counsel, LLC (TIC) | | Investment manager |
Franklin Templeton Services, LLC (FT Services) | | Administrative manager |
Franklin Templeton Distributors, Inc. (Distributors) | | Principal underwriter |
Franklin Templeton Investor Services, LLC (Investor Services) | | Transfer agent |
FRANKLIN TEMPLETON VARIABLE INSURANCE PRODUCTS TRUST
NOTES TO FINANCIAL STATEMENTS
Templeton Foreign VIP Fund(continued)
3. Transactions with Affiliates(continued)
a. Management Fees
The Fund pays an investment management fee to TIC based on the average daily net assets of the Fund as follows:
| | |
| Annualized Fee Rate | | Net Assets |
| 0.900% | | Up to and including $200 million |
| 0.810% | | Over $200 million, up to and including $700 million |
| 0.775% | | Over $700 million, up to and including $1.2 billion |
| 0.750% | | Over $1.2 billion, up to and including $1.3 billion |
| 0.675% | | Over $1.3 billion, up to and including $10 billion |
| 0.655% | | Over $10 billion, up to and including $15 billion |
| 0.635% | | Over $15 billion, up to and including $20 billion |
| 0.615% | | In excess of $20 billion |
For the year ended December 31, 2019, the gross effective investment management fee rate was 0.803% of the Fund’s average daily net assets.
b. Administrative Fees
Under an agreement with TIC, FT Services provides administrative services to the Fund. The fee is paid by TIC based on the Fund’s average daily net assets, and is not an additional expense of the Fund.
c. Distribution Fees
The Board has adopted distribution plans for Class 2 and Class 4 shares pursuant to Rule12b-1 under the 1940 Act. Under the Fund’s compensation distribution plans, the Fund pays Distributors for costs incurred in connection with the servicing, sale and distribution of the Fund’s shares up to 0.25% and 0.35% per year of its average daily net assets of Class 2 and Class 4, respectively. The plan year, for purposes of monitoring compliance with the maximum annual plan rates, is February 1 through January 31.
d. Transfer Agent Fees
Investor Services, under terms of an agreement, performs shareholder servicing for the Fund and is not paid by the Fund for the services.
FRANKLIN TEMPLETON VARIABLE INSURANCE PRODUCTS TRUST
NOTES TO FINANCIAL STATEMENTS
Templeton Foreign VIP Fund(continued)
e. Investments in Affiliated Management Investment Companies
The Fund invests in one or more affiliated management investment companies for purposes other than exercising a controlling influence over the management or policies. Management fees paid by the Fund are waived on assets invested in the affiliated management investment companies, as noted in the Statement of Operations, in an amount not to exceed the management and administrative fees paid directly or indirectly by each affiliate. During the year ended December 31, 2019, the Fund held investments in affiliated management investment companies as follows:
| | | | | | | | | | | | | | | | | | | | | | | | | | | | | | | | |
| | | Value at Beginning of Year | | | Purchases | | | Sales | | | Realized Gain (Loss) | | | Net Change in Unrealized Appreciation (Depreciation) | | | Value at End of Year | | | Number of Shares Held at End of Year | | | Investment Income | |
| |
Non-Controlled Affiliates | | | | | | | | | | | | | | | | | | | | | |
| | | | | | | | |
| | | | | | | | | | | | | | | | | | | | | | | | | | | | | | | Dividends | |
| | | | | | | | | | | | | | | | | | | | | | | | | | | | | | | | |
Institutional Fiduciary Trust Money Market Portfolio, 1.26% | | $ | 49,866,794 | | | $ | 282,622,675 | | | $ | (261,663,706 | ) | | | $ — | | | | $ — | | | $ | 70,825,763 | | | | 70,825,763 | | | | $1,028,147 | |
| | | | | | | | |
| | | | | | | | | | | | | | | | | | | | | | | | | | | | | |
| Income from
securities loaned |
|
| | | | | | | | | | | | | | | | | | | | | | | | | | | | | | | | |
Institutional Fiduciary Trust Money Market Portfolio, 1.26% | | | 13,003,937 | | | | 336,062,006 | | | | (349,065,943 | ) | | | — | | | | — | | | | — | | | | — | | | | 254,421 | |
| | | | | | | | | | | | |
| | | | | | | | |
Total Affiliated Securities | | $ | 62,870,731 | | | $ | 618,684,681 | | | $ | (610,729,649 | ) | | | $ — | | | | $ — | | | $ | 70,825,763 | | | | | | | | $1,282,568 | |
| | | | | | | | | | | | |
4. Expense Offset Arrangement
The Fund has entered into an arrangement with its custodian whereby credits realized as a result of uninvested cash balances are used to reduce a portion of the Fund’s custodian expenses. During the year ended December 31, 2019, there were no credits earned.
5. Income Taxes
For tax purposes, capital losses may be carried over to offset future capital gains.
At December 31, 2019, the capital loss carryforwards were as follows:
Capital loss carryforwards not subject to expiration:
The tax character of distributions paid during the years ended December 31, 2019 and 2018, was as follows:
| | | | | | | | |
| | | 2019 | | | 2018 | |
| | | | |
Distributions paid from: | | | | | | | | |
Ordinary income | | $ | 24,584,858 | | | $ | 40,948,948 | |
Long term capital gain | | | 11,505,161 | | | | — | |
| | | | |
| | |
| | $ | 36,090,019 | | | $ | 40,948,948 | |
| | | | |
FRANKLIN TEMPLETON VARIABLE INSURANCE PRODUCTS TRUST
NOTES TO FINANCIAL STATEMENTS
Templeton Foreign VIP Fund(continued)
5. Income Taxes(continued)
At December 31, 2019, the cost of investments and net unrealized appreciation (depreciation) for income tax purposes were as follows:
| | | | |
Cost of investments | | $ | 1,190,574,785 | |
| | | | |
| |
Unrealized appreciation | | $ | 241,602,360 | |
Unrealized depreciation | | | (84,595,021) | |
| | | | |
| |
Net unrealized appreciation (depreciation) | | $ | 157,007,339 | |
| | | | |
| |
Distributable earnings: | | | | |
Undistributed ordinary income | | $ | 39,574,338 | |
| | | | |
Differences between income and/or capital gains as determined on a book basis and a tax basis are primarily due to differing treatment of foreign currency transactions.
6. Investment Transactions
Purchases and sales of investments (excluding short term securities) for the year ended December 31, 2019, aggregated $356,343,297 and $450,547,584, respectively.
7. Concentration of Risk
Investing in foreign securities may include certain risks and considerations not typically associated with investing in U.S. securities, such as fluctuating currency values and changing local, regional and global economic, political and social conditions, which may result in greater market volatility. Current political and financial uncertainty surrounding the European Union may increase market volatility and the economic risk of investing in securities in Europe. In addition, certain foreign securities may not be as liquid as U.S. securities.
8. Credit Facility
The Fund, together with other U.S. registered and foreign investment funds (collectively, Borrowers), managed by Franklin Templeton, are borrowers in a joint syndicated senior unsecured credit facility totaling $2 billion (Global Credit Facility) which matured on February 7, 2020. This Global Credit Facility provides a source of funds to the Borrowers for temporary and emergency purposes, including the ability to meet future unanticipated or unusually large redemption requests. Effective February 7, 2020, the Borrowers renewed the Global Credit Facility for a one year term, maturing February 5, 2021, for a total of $2 billion.
Under the terms of the Global Credit Facility, the Fund shall, in addition to interest charged on any borrowings made by the Fund and other costs incurred by the Fund, pay its share of fees and expenses incurred in connection with the implementation and maintenance of the Global Credit Facility, based upon its relative share of the aggregate net assets of all of the Borrowers, including an annual commitment fee of 0.15% based upon the unused portion of the Global Credit Facility. These fees are reflected in other expenses in the Statement of Operations. During the year ended December 31, 2019, the Fund did not use the Global Credit Facility.
FRANKLIN TEMPLETON VARIABLE INSURANCE PRODUCTS TRUST
NOTES TO FINANCIAL STATEMENTS
Templeton Foreign VIP Fund(continued)
9. Fair Value Measurements
The Fund follows a fair value hierarchy that distinguishes between market data obtained from independent sources (observable inputs) and the Fund’s own market assumptions (unobservable inputs). These inputs are used in determining the value of the Fund’s financial instruments and are summarized in the following fair value hierarchy:
| | • | | Level 1 – quoted prices in active markets for identical financial instruments |
| | • | | Level 2 – other significant observable inputs (including quoted prices for similar financial instruments, interest rates, prepayment speed, credit risk, etc.) |
| | • | | Level 3 – significant unobservable inputs (including the Fund’s own assumptions in determining the fair value of financial instruments) |
The input levels are not necessarily an indication of the risk or liquidity associated with financial instruments at that level.
At December 31, 2019, all of the Fund’s investments in financial instruments carried at fair value were valued using Level 1 inputs. For detailed categories, see the accompanying Statement of Investments.
10. Subsequent Events
The Fund has evaluated subsequent events through the issuance of the financial statements and determined that no events have occurred that require disclosure other than those already disclosed in the financial statements.
Abbreviations
| | |
| Selected Portfolio |
| |
ADR | | American Depositary Receipt |
| |
IDR | | International Depositary Receipt |
FRANKLIN TEMPLETON VARIABLE INSURANCE PRODUCTS TRUST
Report of Independent Registered Public Accounting Firm
To the Board of Trustees of Franklin Templeton Variable Insurance Products Trust and Shareholders of Templeton Foreign VIP Fund
Opinion on the Financial Statements
We have audited the accompanying statement of assets and liabilities, including the statement of investments, of Templeton Foreign VIP Fund (the “Fund” ) as of December 31, 2019, the related statement of operations for the year ended December 31, 2019, the statement of changes in net assets for each of the two years in the period ended December 31, 2019, including the related notes, and the financial highlights for each of the five years in the period ended December 31, 2019 (collectively referred to as the “financial statements”). In our opinion, the financial statements present fairly, in all material respects, the financial position of the Fund as of December 31, 2019, the results of its operations for the year then ended, the changes in its net assets for each of the two years in the period ended December 31, 2019 and the financial highlights for each of the five years in the period ended December 31, 2019 in conformity with accounting principles generally accepted in the United States of America.
Basis for Opinion
These financial statements are the responsibility of the Fund’s management. Our responsibility is to express an opinion on the Fund’s financial statements based on our audits. We are a public accounting firm registered with the Public Company Accounting Oversight Board (United States) (PCAOB) and are required to be independent with respect to the Fund in accordance with the U.S. federal securities laws and the applicable rules and regulations of the Securities and Exchange Commission and the PCAOB.
We conducted our audits of these financial statements in accordance with the standards of the PCAOB. Those standards require that we plan and perform the audit to obtain reasonable assurance about whether the financial statements are free of material misstatement, whether due to error or fraud.
Our audits included performing procedures to assess the risks of material misstatement of the financial statements, whether due to error or fraud, and performing procedures that respond to those risks. Such procedures included examining, on a test basis, evidence regarding the amounts and disclosures in the financial statements. Our audits also included evaluating the accounting principles used and significant estimates made by management, as well as evaluating the overall presentation of the financial statements. Our procedures included confirmation of securities owned as of December 31, 2019 by correspondence with the custodian, transfer agent and brokers; when replies were not received from brokers, we performed other auditing procedures. We believe that our audits provide a reasonable basis for our opinion.
PricewaterhouseCoopers LLP
San Francisco, California
February 20, 2020
We have served as the auditor of one or more investment companies in the Franklin Templeton Group of Funds since 1948.
FRANKLIN TEMPLETON VARIABLE INSURANCE PRODUCTS TRUST
Tax Information (unaudited)
Templeton Foreign VIP Fund
Under Section 852(b)(3)(C) of the Internal Revenue Code, the Fund hereby reports the maximum amount allowable but no less than $11,505,161 as a long term capital gain dividend for the fiscal year ended December 31, 2019.
At December 31, 2019, more than 50% of the Fund’s total assets were invested in securities of foreign issuers. In most instances, foreign taxes were withheld from income paid to the Fund on these investments. The Fund elects to treat foreign taxes paid as allowed under Section 853 of the Internal Revenue Code. This election will allow shareholders of record as of the 2020 distribution date, to treat their proportionate share of foreign taxes paid by the Fund as having been paid directly by them. The shareholder shall consider these amounts as foreign taxes paid in the tax year in which they receive the Fund distribution.
This page intentionally left blank.
Templeton Global Bond VIP Fund
This annual report for Templeton Global Bond VIP Fund covers the fiscal year ended December 31, 2019.
Class 4 Performance Summary as of December 31, 2019
Average annual total return of Class 4 shares* represents the average annual change in value, assuming reinvestment of dividends and capital gains. Average returns smooth out variations in returns, which can be significant; they are not the same asyear-by-year results.
| | | | | | | | | | | | |
| Periods ended 12/31/19 | | 1-Year | | | 5-Year | | | 10-Year | |
| | | |
Average Annual Total Return | | | +1.86%** | | | | +0.76% | | | | +3.39% | |
*The Fund has a fee waiver associated with any investment it makes in a Franklin Templeton money fund and/or other Franklin Templeton fund, contractually guaranteed through 4/30/20. Fund investment results reflect the fee waiver; without this waiver, the results would have been lower.
**Total return information is based on net asset values calculated for shareholder transactions. Certain adjustments were made to the net assets of the Fund at 12/31/19 for financial reporting purposes. Accordingly, adjusted total returns have been disclosed in the Financial Highlights and differ from those reported here.
Performance reflects the Fund’s Class 4 operating expenses, but doesnot include any contract fees, expenses or sales charges. If they had been included, performance would be lower. These charges and deductions, particularly for variable life policies, can have a significant effect on contract values and insurance benefits. See the contract prospectus for a complete description of these expenses, including sales charges.
Performance data represent past performance, which does not guarantee future results. Investment return and principal value will fluctuate, and you may have a gain or loss when you sell your shares. Current performance may differ from figures shown.
Total Return Index Comparison for a Hypothetical $10,000 Investment (1/1/10–12/31/19)
The graph below shows the change in value of a hypothetical $10,000 investment in the Fund over the indicated period and includes reinvestment of any income or distributions. The Fund’s performance* is compared to the performance of the J.P. Morgan (JPM) Global Government Bond Index (GGBI), the FTSE World Government Bond Index (WGBI) and the Consumer Price Index. One cannot invest directly in an index, and an index is not representative of the Fund’s portfolio.Please see Important Notes toPerformance Informationpreceding the Fund Summaries.
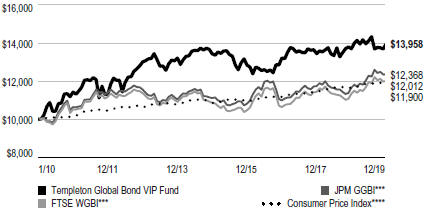
***Source: Morningstar. Please see Index Descriptions following the Fund Summaries.
****Source: Bureau of Labor Statistics, bls.gov/cpi. Please see Index Descriptions following the Fund Summaries.
TEMPLETON GLOBAL BOND VIP FUND
Fund Goal and Main Investments
The Fund seeks high current income, consistent with preservation of capital, with capital appreciation as a secondary consideration. Under normal market conditions, the Fund invests at least 80% of its net assets in bonds, which include debt securities of any maturity, such as bonds, notes, bills and debentures.
Fund Risks
All investments involve risks, including possible loss of principal. Foreign securities involve special risks, including currency fluctuations and economic and political uncertainties. Currency rates may fluctuate significantly over short periods of time, and can reduce returns. Sovereign debt securities are subject to various risks in addition to those relating to debt securities and foreign securities generally, including, but not limited to, the risk that a governmental entity may be unwilling or unable to pay interest and repay principal on its sovereign debt, or otherwise meet its obligations when due. Adverse conditions in a certain region or country can adversely affect securities of issuers in other countries whose economies appear to be unrelated. Investments in developing markets involve heightened risks related to the same factors, in addition to those associated with these markets’ smaller size, lesser liquidity and lack of established legal, political, business and social frameworks to support securities market. The Fund is actively managed but there is no guarantee that the manager’s investment decisions will produce the desired results. The Fund’s prospectus also includes a description of the main investment risks.
Performance Overview
You can find the Fund’sone-year total return in the Performance Summary. For comparison, the J.P. Morgan GGBI posted a +6.02% total return and the FTSE WGBI posted a +5.90% total return for the same period.1
Economic and Market Overview
Global financial markets started 2019 on a positive note, with rallies in risk assets through much of the first quarter after a volatile end to 2018. However, escalating trade tensions between the U.S. and China sporadically resurfaced throughout the year, leading to broad resurgences in global
Geographic Composition*
Based on Total Net Assets as of 12/31/19
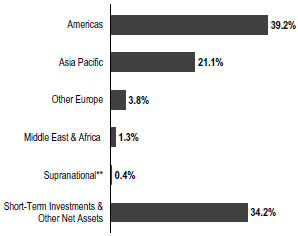
*Figures represent the net Fund exposure and include certain derivatives held in the portfolio (or their underlying reference assets) and may not total 100% or may be negative due to rounding, use of any derivatives or other factors.
**The Fund’s supranational investment was denominated in the Mexican peso.
risk aversion that intermittently affected market valuations. Both the U.S. Federal Reserve (Fed) and the European Central Bank (ECB) increasingly cited trade uncertainties and global risks as policy concerns during the year, with the Fed building a case for rate cuts and the ECB signaling that additional monetary accommodation could arrive in the Fall.
The Fed took a dovish turn at its January 2019 meeting, halting its series of rate hikes from 2018 and removing its prior statement that “some further gradual increases in the target range for the federal funds rate” would be consistent with economic activity and inflation objectives. Policy guidance turned even further dovish at the March meeting as the Fed kept rates unchanged and moderately downgraded U.S. growth forecasts for 2019 and 2020. The Fed ultimately kept the federal funds target rate unchanged at its May and June meetings before cutting rates for the first time in more than a decade at its July meeting. The rate cut was 25 basis points (bps). In August, the Fed discontinued its monthly pace of balance sheet unwinding, two months earlier than originally forecast. It then consecutively cut rates 25 bps at its September and October meetings to a range of 1.50% to 1.75%, before signaling that it would likely keep rates unchanged going forward, barring a material change in the economic outlook.
1. Source: Morningstar. One cannot invest directly in an index, and an index is not representative of the Fund’s portfolio. Please see Index Descriptions following the Fund Summaries.
The dollar value, number of shares or principal amount, and names of all portfolio holdings are listed in the Fund’s Statement of Investments (SOI).
TEMPLETON GLOBAL BOND VIP FUND
The shifts in monetary policy affected the shape of the U.S. Treasury (UST) yield curve throughout the year. A yield curve inversion from the three-month UST bill to the10-year UST note took hold in May, reaching a low of 50 bps of spread inversion in late August. However, the Fed provided updated forward guidance in September and October that enabled the curve to steepen, erasing the inversion as the front end rallied lower while longer-term UST yields rose. The curve continued to steepen through the end of the year, as the Fed kept rates unchanged at its December meeting with the first10-0 consensus policy vote since May. The updated dot plot in December indicated that a strong majority of Fed officials expected rates to remain unchanged through the end of 2020.
In our view, longer-term USTs appeared vulnerable to a potential rate shock given rising deficit spending, rising debt issuance and over-levered financial markets. Additionally, inflation risks remained significantly underpriced, in our view, given supply chain disruptions, immigration restrictions and exceptional tightness in the labor market. Given each of these factors, we believed longer-term USTs remained highly overvalued. The Fed can control short-term rates, but it cannot always control the economic and technical pressures on the longer end of the curve. We believed the yield curve inversion was overdone and that longer-term UST yields would rise.
Despite escalating trade disputes between the U.S. and China during much of the year, including a peak in retaliatory measures by each country in August, the U.S. and China appeared to reach agreement on a “phase one” trade deal in December, expected to be ratified on January 15. The potential resolution bolstered market sentiment, driving risk asset valuations higher in several markets across the globe. However, we continued to monitor the broader implications of trade tensions on multiple fronts and the potential ramifications to risk assets in various regions. Despite the positive developments on trade policy, risks for additional disputes remained elevated, in our view.
In Europe, the ECB kept its policy rate unchanged (0.0% main refinancing operations,-0.40% deposit facility) for most of the reporting period, but delivered on an anticipated stimulus package at its September meeting, dropping the deposit rate to-0.5% and scheduling there-start of its quantitative easing (QE) program in November, at a pace of€20 billion in bond purchases per month. Mario Draghi kept rates unchanged at his final meeting as ECB president in October, before Christine Lagarde took over the post in November. Lagarde held her first policy meeting in December, keeping rates and the QE program unchanged,
as largely expected. During the reporting period, it appeared Lagarde would maintain continuity with the policy framework she inherited from her predecessor, indicating her support for negative rates by commenting that the ECB has “done the right thing to act in favor of jobs and growth rather than the protection of savers.” We expected the euro to weaken against the U.S. dollar during the period on continued monetary accommodation from the ECB, as well as unresolved structural vulnerabilities in the eurozone.
The Bank of Japan (BOJ) kept monetary policy unchanged during the reporting period, retaining its 0.0% yield target on the10-year Japanese government bond and its-0.1% target on the overnight rate. However, BOJ Governor Haruhiko Kuroda increasingly indicated a willingness to cut rates at future meetings if there were risks to achieving the 2.0% inflation target. We expected monetary policy to remain highly accommodative during the reporting period, but our expectations for weakness in the Japanese yen against the U.S. dollar shifted to expectations for strength on softer policy divergence between the Fed and BOJ, and the yen’s potential to rally as a perceived safe haven during periods of risk aversion, given Japan’s strong external balances.
A number of central banks around the world followed the dovish directions of the Fed and the ECB in 2019, taking the opportunity to cut their own domestic rates. Notably, Mexico and Indonesia cut their policy rates by 100 bps, India cut by 135 bps and Brazil cut by 200 bps. Overall, sovereign bond yields declined across much of the world during the reporting period. The yield on the10-year UST note finished the period 77 bps lower at 1.92%, and the yield on the10-year German Bund fell 43 bps to finish at-0.19%, after reaching its lowest level on record in August(-0.71%). On the whole, long-duration exposures tended to perform well in most markets, while currency valuations were more idiosyncratic to individual country dynamics.
Investment Strategy
We invest selectively in bonds around the world based upon our assessment of changing market, political and economic conditions. While seeking opportunities, we monitor various factors including changes in interest rates, currency exchange rates and credit risks. We seek to manage the Fund’s exposure to various currencies and regularly utilize currency and cross currency forward contracts and may also use currency and currency index futures contracts and other derivative instruments.
TEMPLETON GLOBAL BOND VIP FUND
Currency Composition*
12/31/19
| | | | |
| | | % of Total
Net Assets | |
| |
| |
Americas | | | 87.0% | |
| |
| |
U.S. Dollar | | | 63.1% | |
| |
| |
Brazilian Real | | | 10.4% | |
| |
| |
Mexican Peso | | | 10.2% | |
| |
| |
Argentine Peso | | | 1.8% | |
| |
| |
Colombian Peso | | | 1.5% | |
| |
| |
Canadian Dollar | | | 0.0% | ** |
| |
| |
Asia Pacific | | | 26.7% | |
| |
| |
Japanese Yen | | | 34.1% | |
| |
| |
Indonesian Rupiah | | | 4.3% | |
| |
| |
Indian Rupee | | | 0.1% | |
| |
| |
New Zealand Dollar | | | 0.0% | ** |
| |
| |
South Korean Won | | | 0.0% | ** |
| |
| |
Australian Dollar | | | -11.8% | |
| |
| |
Middle East & Africa | | | 1.3% | |
| |
| |
Ghanaian Cedi | | | 1.3% | |
| |
| |
Europe | | | -14.9% | |
| |
| |
Norwegian Krone | | | 7.8% | |
| |
| |
Swiss Franc | | | 5.2% | |
| |
| |
Swedish Krona | | | 4.8% | |
| |
| |
Euro | | | -32.7% | |
| |
*Figures represent the net Fund exposure and include certain derivatives held in the portfolio (or their underlying reference assets) and may not total 100% or may be negative due to rounding, use of any derivatives or other factors.
**Rounds to less than 0.1%.
|
What is a currency forward contract? |
|
A currency forward contract is an agreement between the Fund and a counterparty to buy or sell a foreign currency in exchange for another currency at a specific exchange rate on a future date. Currency forward contracts are privately traded in the interbank market, not on a centralized exchange. |
|
What is a futures contract? |
|
A futures contract is an agreement between the Fund and a counterparty made through a U.S. or foreign futures exchange to buy or sell an underlying instrument or asset at a specific price on a future date. |
Manager’s Discussion
During the reporting period the strategy continued to seek select duration exposures in countries that have attractive risk-adjusted yields, strong or improving economic fundamentals and prudent fiscal and monetary policies.
Several emerging markets continued to offer significantly higher yields than those available in the developed markets. The strategy also maintained negative duration exposure to longer-term U.S. Treasuries as the team believed that inflation pressures, rising deficit spending and surging levels of debt issuance were significantly underpriced risks in the longer-term U.S. Treasury markets. The strategy also increased its allocations to undervalued safe-haven assets to hedge against global financial market risks associated with geopolitical tensions and price distortions from ongoing loose monetary policy across the developed world, notably including the Japanese yen, Swiss franc, Swedish krona and Norwegian krone. The strategy held anet-negative position in the euro to hedge against broad-based U.S. dollar strength and unresolved structural risks across Europe, and anet-negative position in the Australian dollar to hedge against broad emerging market risks. During the period, we used forward currency exchange contracts to actively manage currencies. We also used interest-rate swaps to tactically manage duration exposures.
|
What is duration? |
|
Duration is a measure of a bond’s price sensitivity to interest-rate changes. In general, a portfolio of securities with a lower duration can be expected to be less sensitive to interest-rate changes than a portfolio with a higher duration. |
|
What is an interest-rate swap? |
|
An interest-rate swap is an agreement between two parties to exchange interest-rate payment obligations, generally one based on an interest rate fixed to maturity and the other based on an interest rate that changes in accordance with changes in a designated benchmark (for example, LIBOR, prime, commercial paper or other benchmarks). |
During the period, the Fund’s positive absolute performance was primarily attributable to currency positions. Interest-rate strategies detracted from absolute results, while sovereign credit exposures had a largely neutral effect. Among currencies, the Fund’snet-negative position in the euro contributed to absolute performance, as did its position in the Indonesian rupiah. However, currency positions in Latin America detracted from absolute results (the Argentine peso detracted, while the Mexican peso contributed). The Fund maintained a defensive approach regarding interest rates in developed markets, while holding duration exposures in select emerging markets. Negative duration exposure to U.S. Treasuries detracted from absolute results, while select duration exposures in Asiaex-Japan (Indonesia and India) and Latin America (Brazil) contributed.
TEMPLETON GLOBAL BOND VIP FUND
On a relative basis, the Fund underperformed its benchmark due to interest-rate strategies. Currency positions contributed to relative results, while sovereign credit exposures had a largely neutral effect. Underweighted duration exposures in the U.S. and Japan detracted from relative performance, as did select underweighted duration exposures in Europe and a lack of duration exposure in the U.K. However, select overweighted duration exposures in Asiaex-Japan (Indonesia and India) and Latin America (Brazil) contributed to relative results. Among currencies, the Fund’s underweighted position in the euro contributed to relative performance, as did its overweighted position in the Indonesian rupiah. However, overweighted currency positions in Latin America detracted from relative results (the Argentine peso detracted, while the Mexican peso contributed).
Thank you for your participation in Templeton Global Bond VIP Fund. We look forward to serving your future investment needs.
The foregoing information reflects our analysis, opinions and portfolio holdings as of December 31, 2019, the end of the reporting period. The way we implement our main investment strategies and the resulting portfolio holdings may change depending on factors such as market and economic conditions. These opinions may not be relied upon as investment advice or an offer for a particular security. The information is not a complete analysis of every aspect of any market, country, industry, security or the Fund. Statements of fact are from sources considered reliable, but the investment manager makes no representation or warranty as to their completeness or accuracy. Although historical performance is no guarantee of future results, these insights may help you understand our investment management philosophy.
TEMPLETON GLOBAL BOND VIP FUND
Class 4 Fund Expenses
As an investor in a variable insurance contract (Contract) that indirectly provides for investment in an underlying mutual fund, you can incur transaction and/or ongoing expenses at both the Fund level and the Contract Level: (1) transaction expenses can include sales charges (loads) on purchases, surrender fees, transfer fees and premium taxes; and (2) ongoing expenses can include management fees, distribution and service(12b-1) fees, contract fees, annual maintenance fees, mortality and expense risk fees and other fees and expenses. All mutual funds and Contracts have some types of ongoing expenses. The table below shows Fund-level ongoing expenses and can help you understand these costs and compare them with those of other mutual funds offered through the Contract. The table assumes a $1,000 investment held for the six months indicated. Please refer to the Fund prospectus for additional information on operating expenses.
Actual Fund Expenses
The table below provides information about the actual account values and actual expenses in the columns under the heading “Actual.” In these columns the Fund’s actual return, which includes the effect of ongoing Fund expenses but does not include the effect of ongoing Contract expenses, is used to calculate the “Ending Account Value.” You can estimate the Fund-level expenses you paid during the period by following these steps (of course, your account value and expenses will differ fromthose in this illustration): Divide your account value by $1,000 (if your account had an $8,600 value, then $8,600÷ $1,000 = 8.6). Then multiply the result by the number under the headings “Actual” and “Fund-Level Expenses Paid During Period” (if Fund-Level Expenses Paid During Period were $ 7.50, then 8.6 x $ 7.50 = $64.50). In this illustration, the estimated expensespaid this period at the Fund level are $64.50.
Hypothetical Example for Comparison with Other Mutual Funds
Under the heading “Hypothetical” in the table, information is provided about hypothetical account values and hypothetical expenses based on the Fund’s actual expense ratio and an assumed rate of return of 5% per year before expenses, which is not the Fund’s actual return. This information may not be used to estimate the actual ending account balance or expenses you paid for the period, but it can help you compare ongoing costs of investing in the Fund with those of other mutual funds offered through the Contract. To do so, compare this 5% hypothetical example with the 5% hypothetical examples that appear in the shareholder reports of other funds offered through the Contract.
Please note that expenses shown in the table are meant to highlight ongoing costs at the Fund level only and do not reflect any ongoing expenses at the Contract level, or transaction expenses at either the Fund or Contract levels. In addition, while the Fund does not have transaction expenses, if the transaction and ongoing expenses at the Contract level were included, the expenses shown below would be higher. You should consult your Contract prospectus or disclosure document for more information.
| | | | | | | | | | | | |
| | | | | Actual (actual return after expenses) | | Hypothetical (5% annual return before expenses) | | |
Share Class | | Beginning Account Value 7/1/19 | | Ending Account Value 12/31/19 | | Fund-Level Expenses Paid During Period 7/1/19–12/31/191, 2 | | Ending Account Value 12/31/19 | | Fund-Level Expenses Paid During Period 7/1/19–12/31/191, 2 | | Net Annualized Expense Ratio2 |
| | | | | | |
| Class 4 | | $1,000 | | $988.50 | | $3.66 | | $1,021.53 | | $3.72 | | 0.73% |
1. Expenses are equal to the annualized expense ratio for thesix-month period as indicated above—in the far right column—multiplied by the simple average account value over the period indicated, and then multiplied by 184/365 to reflect theone-half year period.
2. Reflects expenses after fee waivers and expense reimbursements. Does not include any ongoing expenses of the Contract for which the Fund is an investment option or acquired fund fees and expenses.
FRANKLIN TEMPLETON VARIABLE INSURANCE PRODUCTS TRUST
Financial Highlights
Templeton Global Bond VIP Fund
| | | | | | | | | | | | | | | | | | | | |
| | | Year Ended December 31, | |
| | | | |
| | | | | |
| | | 2019 | | | 2018 | | | 2017 | | | 2016 | | | 2015 | |
| |
| | | | | |
Class 1 | | | | | | | | | | | | | | | | | | | | |
| | | | | |
Per share operating performance | | | | | | | | | | | | | | | | | | | | |
(for a share outstanding throughout the year) | | | | | | | | | | | | | | | | | | | | |
| | | | | |
Net asset value, beginning of year | | | $17.54 | | | | $17.17 | | | | $16.85 | | | | $16.34 | | | | $18.56 | |
| | | | |
| | | | | |
Income from investment operationsa: | | | | | | | | | | | | | | | | | | | | |
| | | | | |
Net investment incomeb | | | 0.89 | | | | 0.88 | | | | 0.83 | | | | 0.62 | | | | 0.52 | |
| | | | | |
Net realized and unrealized gains (losses) | | | (0.54 | ) | | | (0.51 | ) | | | (0.46 | ) | | | (0.10 | ) | | | (1.22) | |
| | | | |
| | | | | |
Total from investment operations | | | 0.35 | | | | 0.37 | | | | 0.37 | | | | 0.52 | | | | (0.70) | |
| | | | |
| | | | | |
Less distributions from: | | | | | | | | | | | | | | | | | | | | |
| | | | | |
Net investment income and net foreign currency gains | | | (1.26 | ) | | | — | | | | — | | | | — | | | | (1.43) | |
| | | | | |
Net realized gains | | | — | | | | — | | | | (0.05 | ) | | | (0.01 | ) | | | (0.09) | |
| | | | |
| | | | | |
Total distributions | | | (1.26 | ) | | | — | | | | (0.05 | ) | | | (0.01 | ) | | | (1.52) | |
| | | | |
| | | | | |
Net asset value, end of year | | | $16.63 | | | | $17.54 | | | | $17.17 | | | | $16.85 | | | | $16.34 | |
| | | | |
| | | | | |
Total returnc | | | 1.89% | | | | 2.15% | | | | 2.15% | | | | 3.21% | | | | (4.10)% | |
| | | | | |
Ratios to average net assets | | | | | | | | | | | | | | | | | | | | |
| | | | | |
Expenses before waiver and payments by affiliates and expense reduction | | | 0.53% | | | | 0.56% | | | | 0.53% | | | | 0.53% | | | | 0.52% | |
| | | | | |
Expenses net of waiver and payments by affiliates | | | 0.44% | | | | 0.47% | | | | 0.46% | | | | 0.48% | | | | 0.52% | d |
| | | | | |
Expenses net of waiver and payments by affiliates and expense reduction | | | 0.42% | | | | 0.45% | | | | 0.46% | e | | | 0.48% | e | | | 0.52% | d,e |
| | | | | |
Net investment income | | | 5.22% | | | | 5.09% | | | | 4.81% | | | | 3.88% | | | | 2.99% | |
| | | | | |
Supplemental data | | | | | | | | | | | | | | | | | | | | |
| | | | | |
Net assets, end of year (000’s) | | | $322,794 | | | | $285,046 | | | | $286,502 | | | | $241,792 | | | | $292,802 | |
| | | | | |
Portfolio turnover rate | | | 22.58% | | | | 18.22% | | | | 37.97% | | | | 59.00% | | | | 51.58% | |
aThe amount shown for a share outstanding throughout the period may not correlate with the Statement of Operations for the period due to the timing of sales and repurchases of the Fund’s shares in relation to income earned, adjustments to interest income for the inflation-indexed bonds, and/or fluctuating fair value of the investments of the Fund.
bBased on average daily shares outstanding.
cTotal return does not include fees, charges or expenses imposed by the variable annuity and life insurance contracts for which Franklin Templeton Variable Insurance Products Trust serves as an underlying investment vehicle.
dBenefit of waiver and payments by affiliates rounds to less than 0.01%.
eBenefit of expense reduction rounds to less than 0.01%.
| | | | |
| | | |
| | The accompanying notes are an integral part of these financial statements. | Annual Report | | TGB-7 |
FRANKLIN TEMPLETON VARIABLE INSURANCE PRODUCTS TRUST
FINANCIAL HIGHLIGHTS
Templeton Global Bond VIP Fund(continued)
| | | | | | | | | | | | | | | | | | | | |
| | | Year Ended December 31, | |
| | | | |
| | | 2019 | | | 2018 | | | 2017 | | | 2016 | | | 2015 | |
| |
| | | | | |
Class 2 | | | | | | | | | | | | | | | | | | | | |
| | | | | |
Per share operating performance | | | | | | | | | | | | | | | | | | | | |
(for a share outstanding throughout the year) | | | | | | | | | | | | | | | | | | | | |
| | | | | |
Net asset value, beginning of year | | | $16.83 | | | | $16.51 | | | | $16.25 | | | | $15.80 | | | | $17.99 | |
| | | | |
| | | | | |
Income from investment operationsa: | | | | | | | | | | | | | | | | | | | | |
| | | | | |
Net investment incomeb | | | 0.82 | | | | 0.81 | | | | 0.76 | | | | 0.56 | | | | 0.46 | |
| | | | | |
Net realized and unrealized gains (losses) | | | (0.53 | ) | | | (0.49 | ) | | | (0.45 | ) | | | (0.10 | ) | | | (1.17) | |
| | | | |
| | | | | |
Total from investment operations | | | 0.29 | | | | 0.32 | | | | 0.31 | | | | 0.46 | | | | (0.71) | |
| | | | |
| | | | | |
Less distributions from: | | | | | | | | | | | | | | | | | | | | |
| | | | | |
Net investment income and net foreign currency gains | | | (1.21 | ) | | | — | | | | — | | | | — | | | | (1.39) | |
| | | | | |
Net realized gains | | | — | | | | — | | | | (0.05 | ) | | | (0.01 | ) | | | (0.09) | |
| | | | |
| | | | | |
Total distributions | | | (1.21 | ) | | | — | | | | (0.05 | ) | | | (0.01 | ) | | | (1.48) | |
| | | | |
| | | | | |
Net asset value, end of year | | | $15.91 | | | | $16.83 | | | | $16.51 | | | | $16.25 | | | | $15.80 | |
| | | | |
| | | | | |
Total returnc | | | 1.63% | | | | 1.94% | | | | 1.93% | | | | 2.94% | | | | (4.30)% | |
| | | | | |
Ratios to average net assets | | | | | | | | | | | | | | | | | | | | |
| | | | | |
Expenses before waiver and payments by affiliates and expense reduction | | | 0.78% | | | | 0.81% | | | | 0.78% | | | | 0.78% | | | | 0.77% | |
| | | | | |
Expenses net of waiver and payments by affiliates | | | 0.69% | | | | 0.72% | | | | 0.71% | | | | 0.73% | | | | 0.77% | d |
| | | | | |
Expenses net of waiver and payments by affiliates and expense reduction | | | 0.67% | | | | 0.70% | | | | 0.71% | e | | | 0.73% | e | | | 0.77% | d,e |
| | | | | |
Net investment income | | | 4.97% | | | | 4.84% | | | | 4.56% | | | | 3.63% | | | | 2.74% | |
| | | | | |
Supplemental data | | | | | | | | | | | | | | | | | | | | |
| | | | | |
Net assets, end of year (000’s) | | | $2,389,610 | | | | $2,544,900 | | | | $2,730,081 | | | | $2,812,535 | | | | $2,971,667 | |
| | | | | |
Portfolio turnover rate | | | 22.58% | | | | 18.22% | | | | 37.97% | | | | 59.00% | | | | 51.58% | |
aThe amount shown for a share outstanding throughout the period may not correlate with the Statement of Operations for the period due to the timing of sales and repurchases of the Fund’s shares in relation to income earned, adjustments to interest income for the inflation-indexed bonds, and/or fluctuating fair value of the investments of the Fund.
bBased on average daily shares outstanding.
cTotal return does not include fees, charges or expenses imposed by the variable annuity and life insurance contracts for which Franklin Templeton Variable Insurance Products Trust serves as an underlying investment vehicle.
dBenefit of waiver and payments by affiliates rounds to less than 0.01%.
eBenefit of expense reduction rounds to less than 0.01%.
| | | | |
| | | |
TGB-8 | | Annual Report | The accompanying notes are an integral part of these financial statements. | | |
FRANKLIN TEMPLETON VARIABLE INSURANCE PRODUCTS TRUST
FINANCIAL HIGHLIGHTS
Templeton Global Bond VIP Fund(continued)
| | | | | | | | | | | | | | | | | | | | |
| | | Year Ended December 31, | |
| | | | |
| | | | | |
| | | 2019 | | | 2018 | | | 2017 | | | 2016 | | | 2015 | |
| |
| | | | | |
Class 4 | | | | | | | | | | | | | | | | | | | | |
| | | | | |
Per share operating performance | | | | | | | | | | | | | | | | | | | | |
(for a share outstanding throughout the year) | | | | | | | | | | | | | | | | | | | | |
| | | | | |
Net asset value, beginning of year | | | $17.19 | | | | $16.88 | | | | $16.62 | | | | $16.18 | | | | $18.38 | |
| | | | |
| | | | | |
Income from investment operationsa: | | | | | | | | | | | | | | | | | | | | |
| | | | | |
Net investment incomeb | | | 0.82 | | | | 0.81 | | | | 0.76 | | | | 0.56 | | | | 0.46 | |
| | | | | |
Net realized and unrealized gains (losses) | | | (0.55 | ) | | | (0.50 | ) | | | (0.45 | ) | | | (0.11 | ) | | | (1.21 | ) |
| | | | |
| | | | | |
Total from investment operations | | | 0.27 | | | | 0.31 | | | | 0.31 | | | | 0.45 | | | | (0.75) | |
| | | | |
| | | | | |
Less distributions from: | | | | | | | | | | | | | | | | | | | | |
| | | | | |
Net investment income and net foreign currency gains | | | (1.19 | ) | | | — | | | | — | | | | — | | | | (1.36 | ) |
| | | | | |
Net realized gains | | | — | | | | — | | | | (0.05 | ) | | | (0.01 | ) | | | (0.09 | ) |
| | | | |
| | | | | |
Total distributions | | | (1.19 | ) | | | — | | | | (0.05 | ) | | | (0.01 | ) | | | (1.45) | |
| | | | |
| | | | | |
Net asset value, end of year | | | $16.27 | | | | $17.19 | | | | $16.88 | | | | $16.62 | | | | $16.18 | |
| | | | |
| | | | | |
Total returnc | | | 1.48% | | | | 1.84% | | | | 1.76% | | | | 2.87% | | | | (4.39)% | |
| | | | | |
Ratios to average net assets | | | | | | | | | | | | | | | | | | | | |
| | | | | |
Expenses before waiver and payments by affiliates and expense reduction | | | 0.88% | | | | 0.91% | | | | 0.88% | | | | 0.88% | | | | 0.87% | |
| | | | | |
Expenses net of waiver and payments by affiliates | | | 0.79% | | | | 0.82% | | | | 0.81% | | | | 0.83% | | | | 0.87% | d |
| | | | | |
Expenses net of waiver and payments by affiliates and expense reduction | | | 0.77% | | | | 0.80% | | | | 0.81% | e | | | 0.83% | e | | | 0.87% | d,e |
| | | | | |
Net investment income | | | 4.87% | | | | 4.74% | | | | 4.46% | | | | 3.53% | | | | 2.64% | |
| | | | | |
Supplemental data | | | | | | | | | | | | | | | | | | | | |
| | | | | |
Net assets, end of year (000’s) | | | $90,272 | | | | $94,312 | | | | $98,934 | | | | $96,798 | | | | $103,045 | |
| | | | | |
Portfolio turnover rate | | | 22.58% | | | | 18.22% | | | | 37.97% | | | | 59.00% | | | | 51.58% | |
aThe amount shown for a share outstanding throughout the period may not correlate with the Statement of Operations for the period due to the timing of sales and repurchases of the Fund’s shares in relation to income earned, adjustments to interest income for the inflation-indexed bonds, and/or fluctuating fair value of the investments of the Fund.
bBased on average daily shares outstanding.
cTotal return does not include fees, charges or expenses imposed by the variable annuity and life insurance contracts for which Franklin Templeton Variable Insurance Products Trust serves as an underlying investment vehicle.
dBenefit of waiver and payments by affiliates rounds to less than 0.01%.
eBenefit of expense reduction rounds to less than 0.01%.
| | | | |
| | | |
| | The accompanying notes are an integral part of these financial statements. | Annual Report | | TGB-9 |
FRANKLIN TEMPLETON VARIABLE INSURANCE PRODUCTS TRUST
Statement of Investments, December 31, 2019
Templeton Global Bond VIP Fund
| | | | | | | | | | | | |
| | | Principal Amount* | | | | | | Value | |
| | | |
Foreign Government and Agency Securities 53.6% | | | | | | | | | | | | |
Argentina 1.4% | | | | | | | | | | | | |
aArgentina Treasury Bill, | | | | | | | | | | | | |
Strip, 3/30/20 | | | 727,627,800 | | | | ARS | | | $ | 8,716,924 | |
Strip, 4/28/20 | | | 372,737,900 | | | | ARS | | | | 5,705,752 | |
Strip, 5/28/20 | | | 18,428,800 | | | | ARS | | | | 247,759 | |
Strip, 7/29/20 | | | 250,727,500 | | | | ARS | | | | 3,571,061 | |
Strip, 10/29/20 | | | 111,260,670 | | | | ARS | | | | 1,192,200 | |
aArgentine Bonos del Tesoro, | | | | | | | | | | | | |
18.20%, 10/03/21 | | | 820,823,000 | | | | ARS | | | | 4,380,067 | |
16.00%, 10/17/23 | | | 844,288,000 | | | | ARS | | | | 4,054,197 | |
senior note, 15.50%, 10/17/26 | | | 1,668,306,000 | | | | ARS | | | | 7,520,531 | |
Government of Argentina, | | | | | | | | | | | | |
a,b FRN, 52.564%, (ARS Badlar + 2.00%), 4/03/22 | | | 24,036,000 | | | | ARS | | | | 207,140 | |
a,cIndex Linked, 4.00%, 3/06/20 | | | 4,138,000 | | | | ARS | | | | 79,566 | |
senior note, 4.50%, 2/13/20 | | | 9,351,000 | | | | | | | | 4,737,123 | |
| | | | | | | | | | | | |
| | | | | | | | | | | 40,412,320 | |
| | | | | | | | | | | | |
| | | |
Brazil 10.2% | | | | | | | | | | | | |
Letra Tesouro Nacional, | | | | | | | | | | | | |
Strip, 7/01/20 | | | 164,331 | d | | | BRL | | | | 40,047,602 | |
Strip, 4/01/21 | | | 25,610 | d | | | BRL | | | | 6,016,225 | |
Strip, 7/01/21 | | | 34,210 | d | | | BRL | | | | 7,925,081 | |
Nota do Tesouro Nacional, | | | | | | | | | | | | |
10.00%, 1/01/21 | | | 38,520 | d | | | BRL | | | | 10,075,369 | |
10.00%, 1/01/23 | | | 522,145 | d | | | BRL | | | | 144,434,647 | |
10.00%, 1/01/25 | | | 69,029 | d | | | BRL | | | | 19,732,747 | |
10.00%, 1/01/27 | | | 194,573 | d | | | BRL | | | | 57,027,393 | |
| | | | | | | | | | | | |
| | | | | | | | | | | 285,259,064 | |
| | | | | | | | | | | | |
| | | |
Colombia 1.5% | | | | | | | | | | | | |
Government of Colombia, | | | | | | | | | | | | |
senior bond, 7.75%, 4/14/21 | | | 2,386,000,000 | | | | COP | | | | 749,123 | |
senior bond, 4.375%, 3/21/23 | | | 362,000,000 | | | | COP | | | | 107,900 | |
senior bond, 9.85%, 6/28/27 | | | 576,000,000 | | | | COP | | | | 220,313 | |
Titulos de Tesoreria, | | | | | | | | | | | | |
senior bond, B, 11.00%, 7/24/20 | | | 9,167,000,000 | | | | COP | | | | 2,901,358 | |
senior bond, B, 7.00%, 5/04/22 | | | 10,237,000,000 | | | | COP | | | | 3,258,171 | |
senior bond, B, 10.00%, 7/24/24 | | | 40,977,000,000 | | | | COP | | | | 14,787,427 | |
senior bond, B, 7.50%, 8/26/26 | | | 35,134,200,000 | | | | COP | | | | 11,681,517 | |
senior bond, B, 6.00%, 4/28/28 | | | 29,113,600,000 | | | | COP | | | | 8,825,768 | |
| | | | | | | | | | | | |
| | | | | | | | | | | 42,531,577 | |
| | | | | | | | | | | | |
| | | |
Ghana 1.3% | | | | | | | | | | | | |
Government of Ghana, | | | | | | | | | | | | |
24.75%, 3/01/21 | | | 690,000 | | | | GHS | | | | 129,752 | |
16.25%, 5/17/21 | | | 7,250,000 | | | | GHS | | | | 1,242,075 | |
24.50%, 6/21/21 | | | 80,000 | | | | GHS | | | | 14,931 | |
24.75%, 7/19/21 | | | 1,190,000 | | | | GHS | | | | 217,887 | |
18.75%, 1/24/22 | | | 26,840,000 | | | | GHS | | | | 4,578,628 | |
FRANKLIN TEMPLETON VARIABLE INSURANCE PRODUCTS TRUST
STATEMENT OF INVESTMENTS
Templeton Global Bond VIP Fund(continued)
| | | | | | | | | | | | |
| | | Principal Amount* | | | | | | Value | |
| | | |
Foreign Government and Agency Securities(continued) | | | | | | | | | | | | |
Ghana(continued) | | | | | | | | | | | | |
Government of Ghana, (continued) | | | | | | | | | | | | |
17.60%, 11/28/22 | | | 370,000 | | | | GHS | | | $ | 60,655 | |
19.75%, 3/25/24 | | | 26,840,000 | | | | GHS | | | | 4,544,524 | |
19.00%, 11/02/26 | | | 80,510,000 | | | | GHS | | | | 12,829,028 | |
senior bond, 19.75%, 3/15/32 | | | 80,510,000 | | | | GHS | | | | 12,941,206 | |
senior note, 21.50%, 3/09/20 | | | 1,270,000 | | | | GHS | | | | 223,563 | |
senior note, 18.50%, 6/01/20 | | | 500,000 | | | | GHS | | | | 86,886 | |
senior note, 18.25%, 9/21/20 | | | 480,000 | | | | GHS | | | | 85,630 | |
senior note, 16.50%, 3/22/21 | | | 1,730,000 | | | | GHS | | | | 299,596 | |
| | | | | | | | | | | | |
| | | | | | | | | | | 37,254,361 | |
| | | | | | | | | | | | |
India 8.5% | | | | | | | | | | | | |
Government of India, | | | | | | | | | | | | |
senior bond, 8.20%, 2/15/22 | | | 500,000,000 | | | | INR | | | | 7,308,586 | |
senior bond, 8.35%, 5/14/22 | | | 212,700,000 | | | | INR | | | | 3,124,054 | |
senior bond, 8.08%, 8/02/22 | | | 1,783,000,000 | | | | INR | | | | 26,123,511 | |
senior bond, 8.13%, 9/21/22 | | | 28,000,000 | | | | INR | | | | 411,489 | |
senior bond, 9.15%, 11/14/24 | | | 2,409,000,000 | | | | INR | | | | 37,204,341 | |
senior note, 8.27%, 6/09/20 | | | 1,222,000,000 | | | | INR | | | | 17,382,832 | |
senior note, 7.80%, 4/11/21 | | | 1,980,300,000 | | | | INR | | | | 28,436,043 | |
senior note, 8.79%, 11/08/21 | | | 653,000,000 | | | | INR | | | | 9,586,112 | |
senior note, 8.15%, 6/11/22 | | | 1,621,000,000 | | | | INR | | | | 23,714,667 | |
senior note, 6.84%, 12/19/22 | | | 98,000,000 | | | | INR | | | | 1,395,664 | |
senior note, 7.16%, 5/20/23 | | | 133,700,000 | | | | INR | | | | 1,917,161 | |
senior note, 8.83%, 11/25/23 | | | 2,983,900,000 | | | | INR | | | | 45,219,121 | |
senior note, 7.68%, 12/15/23 | | | 1,376,000,000 | | | | INR | | | | 20,082,065 | |
senior note, 6.79%, 5/15/27 | | | 1,142,800,000 | | | | INR | | | | 15,975,657 | |
| | | | | | | | | | | | |
| | | | | | | | | | | 237,881,303 | |
| | | | | | | | | | | | |
Indonesia 4.3% | | | | | | | | | | | | |
Government of Indonesia, | | | | | | | | | | | | |
senior bond, FR34, 12.80%, 6/15/21 | | | 324,406,000,000 | | | | IDR | | | | 25,693,085 | |
senior bond, FR35, 12.90%, 6/15/22 | | | 71,229,000,000 | | | | IDR | | | | 5,922,022 | |
senior bond, FR39, 11.75%, 8/15/23 | | | 5,491,000,000 | | | | IDR | | | | 464,337 | |
senior bond, FR40, 11.00%, 9/15/25 | | | 46,856,000,000 | | | | IDR | | | | 4,054,946 | |
senior bond, FR43, 10.25%, 7/15/22 | | | 147,832,000,000 | | | | IDR | | | | 11,690,791 | |
senior bond, FR44, 10.00%, 9/15/24 | | | 4,454,000,000 | | | | IDR | | | | 365,207 | |
senior bond, FR46, 9.50%, 7/15/23 | | | 226,780,000,000 | | | | IDR | | | | 17,967,598 | |
senior bond, FR47, 10.00%, 2/15/28 | | | 12,000,000 | | | | IDR | | | | 1,011 | |
senior bond, FR52, 10.50%, 8/15/30 | | | 6,960,000,000 | | | | IDR | | | | 619,168 | |
senior bond, FR59, 7.00%, 5/15/27 | | | 47,752,000,000 | | | | IDR | | | | 3,444,199 | |
senior bond, FR61, 7.00%, 5/15/22 | | | 244,849,000,000 | | | | IDR | | | | 18,040,254 | |
senior bond, FR63, 5.625%, 5/15/23 | | | 258,951,000,000 | | | | IDR | | | | 18,300,507 | |
senior bond, FR64, 6.125%, 5/15/28 | | | 37,000,000 | | | | IDR | | | | 2,518 | |
senior bond, FR70, 8.375%, 3/15/24 | | | 78,915,000,000 | | | | IDR | | | | 6,081,269 | |
senior bond, FR71, 9.00%, 3/15/29 | | | 51,222,000,000 | | | | IDR | | | | 4,140,930 | |
FRANKLIN TEMPLETON VARIABLE INSURANCE PRODUCTS TRUST
STATEMENT OF INVESTMENTS
Templeton Global Bond VIP Fund(continued)
| | | | | | | | | | | | |
| | | Principal Amount* | | | | | | Value | |
| | | |
Foreign Government and Agency Securities(continued) | | | | | | | | | | | | |
Indonesia(continued) | | | | | | | | | | | | |
Government of Indonesia, (continued) | | | | | | | | | | | | |
senior bond, FR73, 8.75%, 5/15/31 | | | 60,845,000,000 | | | | IDR | | | $ | 4,874,171 | |
| | | | | | | | | | | | |
| | | | | | | | | | | 121,662,013 | |
| | | | | | | | | | | | |
| | | |
Mexico 13.8% | | | | | | | | | | | | |
Government of Mexico, | | | | | | | | | | | | |
senior bond, M, 8.00%, 6/11/20 | | | 3,814,000 | e | | | MXN | | | | 20,295,348 | |
senior bond, M, 6.50%, 6/10/21 | | | 18,568,200 | e | | | MXN | | | | 97,825,192 | |
senior bond, M, 6.50%, 6/09/22 | | | 20,792,500 | e | | | MXN | | | | 109,369,579 | |
senior bond, M, 8.00%, 12/07/23 | | | 7,653,700 | e | | | MXN | | | | 42,143,000 | |
senior note, M, 7.25%, 12/09/21 | | | 21,545,600 | e | | | MXN | | | | 114,862,459 | |
fMexican Udibonos, Index Linked, 2.50%, 12/10/20 | | | 390,212 | g | | | MXN | | | | 2,042,832 | |
| | | | | | | | | | | | |
| | | | | | | | | | | 386,538,410 | |
| | | | | | | | | | | | |
| | | |
Norway 3.8% | | | | | | | | | | | | |
h,iGovernment of Norway, | | | | | | | | | | | | |
144A, Reg S, 3.75%, 5/25/21 | | | 292,429,000 | | | | NOK | | | | 34,429,996 | |
144A, Reg S, 2.00%, 5/24/23 | | | 280,579,000 | | | | NOK | | | | 32,601,666 | |
144A, Reg S, 3.00%, 3/14/24 | | | 235,699,000 | | | | NOK | | | | 28,610,139 | |
144A, Reg S, 1.75%, 3/13/25 | | | 89,312,000 | | | | NOK | | | | 10,366,297 | |
| | | | | | | | | | | | |
| | | | | | | | | | | 106,008,098 | |
| | | | | | | | | | | | |
| | | |
South Korea 8.4% | | | | | | | | | | | | |
Korea Monetary Stabilization Bond, | | | | | | | | | | | | |
senior note, 2.14%, 6/02/20 | | | 14,858,000,000 | | | | KRW | | | | 12,895,172 | |
senior note, 2.05%, 10/05/20 | | | 31,280,000,000 | | | | KRW | | | | 27,201,172 | |
Korea Treasury Bond, | | | | | | | | | | | | |
senior note, 1.75%, 6/10/20 | | | 7,615,000,000 | | | | KRW | | | | 6,598,876 | |
senior note, 3.00%, 3/10/23 | | | 3,919,000,000 | | | | KRW | | | | 3,555,113 | |
senior note, 2.25%, 9/10/23 | | | 88,312,000,000 | | | | KRW | | | | 78,535,720 | |
senior note, 1.875%, 3/10/24 | | | 33,811,000,000 | | | | KRW | | | | 29,697,429 | |
senior note, 1.375%, 9/10/24 | | | 68,301,810,000 | | | | KRW | | | | 58,811,499 | |
senior note, 3.00%, 9/10/24 | | | 18,500,000,000 | | | | KRW | | | | 17,070,783 | |
| | | | | | | | | | | | |
| | | | | | | | | | | 234,365,764 | |
| | | | | | | | | | | | |
| | | |
jSupranational 0.4% | | | | | | | | | | | | |
Inter-American Development Bank, senior bond, 7.50%, 12/05/24 | | | 200,000,000 | | | | MXN | | | | 10,835,562 | |
| | | | | | | | | | | | |
| | | |
Total Foreign Government and Agency Securities (Cost $1,705,706,010) | | | | | | | | | | | 1,502,748,472 | |
| | | | | | | | | | | | |
| | | |
U.S. Government and Agency Securities 12.5% | | | | | | | | | | | | |
United States 12.5% | | | | | | | | | | | | |
U.S. Treasury Note, | | | | | | | | | | | | |
1.125%, 7/31/21 | | | 15,143,000 | | | | | | | | 15,029,970 | |
1.125%, 8/31/21 | | | 162,828,000 | | | | | | | | 161,571,131 | |
1.50%, 8/31/21 | | | 146,172,000 | | | | | | | | 145,932,893 | |
1.125%, 9/30/21 | | | 3,497,000 | | | | | | | | 3,468,088 | |
1.50%, 9/30/21 | | | 15,768,000 | | | | | | | | 15,742,483 | |
2.125%, 12/31/21 | | | 3,953,000 | | | | | | | | 3,994,169 | |
FRANKLIN TEMPLETON VARIABLE INSURANCE PRODUCTS TRUST
STATEMENT OF INVESTMENTS
Templeton Global Bond VIP Fund(continued)
| | | | | | | | | | | | | | |
| | | | | | Principal Amount* | | | | | Value | |
| | | | |
U.S. Government and Agency Securities(continued) | | | | | | | | | | | | | | |
United States(continued) | | | | | | | | | | | | | | |
U.S. Treasury Note, (continued) | | | | | | | | | | | | | | |
2.625%, 7/15/21 | | | | | | | 3,801,000 | | | | | $ | 3,860,335 | |
| | | | | | | | | | | | | | |
| | | | |
Total U.S. Government and Agency Securities
(Cost $350,270,002) | | | | | | | | | | | | | 349,599,069 | |
| | | | | | | | | | | | | | |
| | | | |
| | | Number of
Contracts | | | Notional
Amount* | | | | | | |
| | | | |
Options Purchased 0.2% | | | | | | | | | | | | | | |
| | | | |
Calls -Over-the-Counter | | | | | | | | | | | | | | |
| | | | |
Currency Options 0.1% | | | | | | | | | | | | | | |
AUD/JPY, Counterparty CITI, January Strike Price 79.00 JPY, Expires 1/23/20 | | | 1 | | | | 31,568,000 | | | AUD | | | 4,674 | |
AUD/JPY, Counterparty CITI, February Strike Price 79.45 JPY, Expires 2/12/20 | | | 1 | | | | 16,870,000 | | | AUD | | | 6,534 | |
AUD/JPY, Counterparty CITI, February Strike Price 82.35 JPY, Expires 2/12/20 | | | 1 | | | | 2,664,000 | | | AUD | | | 73 | |
AUD/JPY, Counterparty CITI, April Strike Price 79.30 JPY, Expires 4/22/20 | | | 1 | | | | 14,227,000 | | | AUD | | | 32,772 | |
AUD/JPY, Counterparty CITI, May Strike Price 84.00 JPY, Expires 5/06/20 | | | 1 | | | | 11,838,000 | | | AUD | | | 2,525 | |
AUD/JPY, Counterparty CITI, May Strike Price 86.63 JPY, Expires 5/06/20 | | | 1 | | | | 13,022,000 | | | AUD | | | 1,005 | |
AUD/JPY, Counterparty CITI, May Strike Price 78.75 JPY, Expires 5/07/20 | | | 1 | | | | 11,838,000 | | | AUD | | | 43,782 | |
AUD/JPY, Counterparty CITI, May Strike Price 85.50 JPY, Expires 5/07/20 | | | 1 | | | | 47,352,000 | | | AUD | | | 5,249 | |
AUD/JPY, Counterparty CITI, November Strike Price 84.33 JPY, Expires 11/12/20 | | | 1 | | | | 8,878,000 | | | AUD | | | 13,505 | |
AUD/JPY, Counterparty CITI, December Strike Price 82.15 JPY, Expires 12/21/20 | | | 1 | | | | 35,514,000 | | | AUD | | | 131,220 | |
AUD/USD, Counterparty HSBK, April Strike Price $0.77, Expires 4/30/20 | | | 1 | | | | 14,798,000 | | | AUD | | | 3,364 | |
AUD/USD, Counterparty HSBK, May Strike Price $0.77, Expires 5/04/20 | | | 1 | | | | 18,644,000 | | | AUD | | | 5,324 | |
AUD/USD, Counterparty HSBK, May Strike Price $0.77, Expires 5/07/20 | | | 1 | | | | 11,838,000 | | | AUD | | | 2,542 | |
AUD/USD, Counterparty MSCO, May Strike Price $0.77, Expires 5/12/21 | | | 1 | | | | 21,309,000 | | | AUD | | | 116,457 | |
USD/JPY, Counterparty CITI, March Strike Price 111.15 JPY, Expires 3/20/20 | | | 1 | | | | 29,582,000 | | | | | | 39,226 | |
USD/JPY, Counterparty CITI, March Strike Price 111.40 JPY, Expires 3/30/20 | | | 1 | | | | 34,512,000 | | | | | | 45,763 | |
USD/JPY, Counterparty CITI, September Strike Price 112.24 JPY, Expires 9/22/20 | | | 1 | | | | 38,210,000 | | | | | | 134,881 | |
USD/MXN, Counterparty CITI, March Strike Price 20.78 MXN, Expires 3/09/20 | | | 1 | | | | 19,068,000 | | | | | | 15,026 | |
USD/MXN, Counterparty CITI, March Strike Price 18.40 MXN, Expires 3/30/20 | | | 1 | | | | 11,441,000 | | | | | | 473,051 | |
USD/MXN, Counterparty CITI, March Strike Price 21.92 MXN, Expires 3/30/20 | | | 1 | | | | 17,162,000 | | | | | | 7,500 | |
USD/MXN, Counterparty CITI, May Strike Price 20.50 MXN, Expires 5/11/20 | | | 1 | | | | 21,843,000 | | | | | | 96,917 | |
USD/MXN, Counterparty CITI, May Strike Price 20.09 MXN, Expires 5/12/20 | | | 1 | | | | 19,994,000 | | | | | | 137,979 | |
USD/MXN, Counterparty CITI, May Strike Price 20.92 MXN, Expires 5/12/20 | | | 1 | | | | 7,801,000 | | | | | | 23,520 | |
USD/MXN, Counterparty CITI, May Strike Price 20.87 MXN, Expires 5/14/20 | | | 1 | | | | 43,998,000 | | | | | | 143,566 | |
USD/MXN, Counterparty CITI, May Strike Price 20.58 MXN, Expires 5/15/20 | | | 1 | | | | 13,730,000 | | | | | | 59,684 | |
USD/MXN, Counterparty CITI, July Strike Price 21.03 MXN, Expires 7/30/20 | | | 1 | | | | 12,204,000 | | | | | | 81,864 | |
USD/MXN, Counterparty CITI, September Strike Price 21.94 MXN, Expires 9/03/20 | | | 1 | | | | 47,671,000 | | | | | | 230,632 | |
USD/MXN, Counterparty CITI, September Strike Price 21.70 MXN, Expires 9/08/20 | | | 1 | | | | 47,623,000 | | | | | | 276,261 | |
FRANKLIN TEMPLETON VARIABLE INSURANCE PRODUCTS TRUST
STATEMENT OF INVESTMENTS
Templeton Global Bond VIP Fund(continued)
| | | | | | | | | | | | | | | | |
| | | Number of Contracts | | | Notional Amount* | | | | | | Value | |
| | | | |
Options Purchased(continued) | | | | | | | | | | | | | | | | |
| | | | |
Calls -Over-the-Counter(continued) | | | | | | | | | | | | | | | | |
| | | | |
Currency Options(continued) | | | | | | | | | | | | | | | | |
USD/MXN, Counterparty CITI, September Strike Price 20.85 MXN, Expires 9/17/20 | | | 1 | | | | 43,738,000 | | | | | | | $ | 475,038 | |
USD/MXN, Counterparty GSCO, March Strike Price 21.20 MXN, Expires 3/12/20 | | | 1 | | | | 45,800,000 | | | | | | | | 24,045 | |
USD/MXN, Counterparty JPHQ, April Strike Price 20.11 MXN, Expires 4/24/20 | | | 1 | | | | 21,999,000 | | | | | | | | 118,377 | |
USD/MXN, Counterparty JPHQ, May Strike Price 20.47 MXN, Expires 5/13/20 | | | 1 | | | | 25,142,000 | | | | | | | | 117,841 | |
USD/MXN, Counterparty JPHQ, July Strike Price 20.90 MXN, Expires 7/27/20 | | | 1 | | | | 12,571,000 | | | | | | | | 90,059 | |
USD/MXN, Counterparty MSCO, February Strike Price 19.65 MXN, Expires 2/20/20 | | | 1 | | | | 76,275,000 | | | | | | | | 200,985 | |
USD/MXN, Counterparty MSCO, February Strike Price 20.98 MXN, Expires 2/20/20 | | | 1 | | | | 38,137,000 | | | | | | | | 9,611 | |
USD/MXN, Counterparty MSCO, March Strike Price 21.58 MXN, Expires 3/05/20 | | | 1 | | | | 38,137,000 | | | | | | | | 10,144 | |
USD/MXN, Counterparty MSCO, March Strike Price 24.81 MXN, Expires 3/05/20 | | | 1 | | | | 19,068,000 | | | | | | | | 381 | |
USD/MXN, Counterparty MSCO, March Strike Price 21.36 MXN, Expires 3/10/20 | | | 1 | | | | 71,507,000 | | | | | | | | 29,103 | |
USD/MXN, Counterparty MSCO, March Strike Price 20.90 MXN, Expires 3/12/20 | | | 1 | | | | 12,400,000 | | | | | | | | 9,337 | |
USD/MXN, Counterparty MSCO, June Strike Price 21.45 MXN, Expires 6/15/20 | | | 1 | | | | 12,400,000 | | | | | | | | 35,786 | |
USD/MXN, Counterparty MSCO, September Strike Price 22.33 MXN, Expires 9/04/20 | | | 1 | | | | 38,137,000 | | | | | | | | 148,963 | |
USD/MXN, Counterparty MSCO, September Strike Price 25.97 MXN, Expires 9/04/20 | | | 1 | | | | 38,137,000 | | | | | | | | 30,052 | |
| | | | | | | | | | | | | | | | |
| | | | |
| | | | | | | | | | | | | | | 3,434,618 | |
| | | | | | | | | | | | | | | | |
| | | | |
Puts -Over-the-Counter | | | | | | | | | | | | | | | | |
| | | | |
Currency Options 0.1% | | | | | | | | | | | | | | | | |
AUD/JPY, Counterparty CITI, May Strike Price 69.54 JPY, Expires 5/06/20 | | | 1 | | | | 9,470,000 | | | | AUD | | | | 21,030 | |
AUD/JPY, Counterparty CITI, May Strike Price 70.65 JPY, Expires 5/06/20 | | | 1 | | | | 5,919,000 | | | | AUD | | | | 17,705 | |
AUD/JPY, Counterparty CITI, May Strike Price 74.48 JPY, Expires 5/06/20 | | | 1 | | | | 9,470,000 | | | | AUD | | | | 84,300 | |
AUD/JPY, Counterparty CITI, May Strike Price 75.05 JPY, Expires 5/06/20 | | | 1 | | | | 5,919,000 | | | | AUD | | | | 62,441 | |
AUD/JPY, Counterparty CITI, May Strike Price 65.55 JPY, Expires 5/07/20 | | | 1 | | | | 5,919,000 | | | | AUD | | | | 4,876 | |
AUD/JPY, Counterparty CITI, May Strike Price 73.25 JPY, Expires 5/07/20 | | | 1 | | | | 19,730,000 | | | | AUD | | | | 123,512 | |
AUD/JPY, Counterparty CITI, July Strike Price 72.00 JPY, Expires 7/21/20 | | | 1 | | | | 71,027,000 | | | | AUD | | | | 537,731 | |
AUD/JPY, Counterparty CITI, November Strike Price 66.78 JPY, Expires 11/12/20 | | | 1 | | | | 4,439,000 | | | | AUD | | | | 22,821 | |
AUD/JPY, Counterparty CITI, November Strike Price 69.18 JPY, Expires 11/12/20 | | | 1 | | | | 2,664,000 | | | | AUD | | | | 20,316 | |
AUD/JPY, Counterparty CITI, November Strike Price 72.78 JPY, Expires 11/12/20 | | | 1 | | | | 11,098,000 | | | | AUD | | | | 157,054 | |
AUD/JPY, Counterparty CITI, November Strike Price 74.00 JPY, Expires 11/12/20 | | | 1 | | | | 7,990,000 | | | | AUD | | | | 140,216 | |
AUD/JPY, Counterparty CITI, December Strike Price 65.85 JPY, Expires 12/21/20 | | | 1 | | | | 17,757,000 | | | | AUD | | | | 94,653 | |
AUD/USD, Counterparty HSBK, April Strike Price $0.68, Expires 4/30/20 | | | 1 | | | | 19,730,000 | | | | AUD | | | | 64,525 | |
AUD/USD, Counterparty HSBK, May Strike Price $0.68, Expires 5/04/20 | | | 1 | | | | 24,662,000 | | | | AUD | | | | 68,663 | |
AUD/USD, Counterparty HSBK, May Strike Price $0.66, Expires 5/05/20 | | | 1 | | | | 19,730,000 | | | | AUD | | | | 32,325 | |
FRANKLIN TEMPLETON VARIABLE INSURANCE PRODUCTS TRUST
STATEMENT OF INVESTMENTS
Templeton Global Bond VIP Fund(continued)
| | | | | | | | | | | | | | |
| | | Number of Contracts | | | Notional Amount* | | | | | Value | |
| | | | |
Options Purchased(continued) | | | | | | | | | | | | | | |
| | | | |
Puts -Over-the-Counter(continued) | | | | | | | | | | | | | | |
| | | | |
Currency Options(continued) | | | | | | | | | | | | | | |
AUD/USD, Counterparty HSBK, May Strike Price $0.65, Expires 5/07/20 | | | 1 | | | | 23,676,000 | | | AUD | | $ | 22,759 | |
AUD/USD, Counterparty HSBK, May Strike Price $0.68, Expires 5/07/20 | | | 1 | | | | 11,838,000 | | | AUD | | | 35,717 | |
AUD/USD, Counterparty MSCO, August Strike Price $0.67, Expires 8/12/20 | | | 1 | | | | 67,082,000 | | | AUD | | | 324,205 | |
USD/JPY, Counterparty CITI, March Strike Price 100.11 JPY, Expires 3/20/20 | | | 1 | | | | 29,582,000 | | | | | | 16,389 | |
USD/JPY, Counterparty CITI, March Strike Price 105.29 JPY, Expires 3/20/20 | | | 1 | | | | 59,164,000 | | | | | | 185,302 | |
USD/JPY, Counterparty CITI, March Strike Price 104.61 JPY, Expires 3/30/20 | | | 1 | | | | 69,025,000 | | | | | | 201,760 | |
USD/JPY, Counterparty CITI, September Strike Price 104.48 JPY, Expires 9/22/20 | | | 1 | | | | 76,420,000 | | | | | | 909,245 | |
USD/MXN, Counterparty CITI, March Strike Price 18.35 MXN, Expires 3/06/20 | | | 1 | | | | 20,319,000 | | | | | | 22,879 | |
USD/MXN, Counterparty CITI, March Strike Price 18.68 MXN, Expires 3/09/20 | | | 1 | | | | 14,301,000 | | | | | | 52,041 | |
USD/MXN, Counterparty CITI, May Strike Price 18.31 MXN, Expires 5/14/20 | | | 1 | | | | 11,000,000 | | | | | | 26,774 | |
USD/MXN, Counterparty CITI, September Strike Price 19.11 MXN, Expires 9/03/20 | | | 1 | | | | 23,836,000 | | | | | | 341,689 | |
USD/MXN, Counterparty GSCO, March Strike Price 18.57 MXN, Expires 3/12/20 | | | 1 | | | | 7,630,000 | | | | | | 19,403 | |
USD/MXN, Counterparty JPHQ, January Strike Price 18.50 MXN, Expires 1/27/20 | | | 1 | | | | 9,428,000 | | | | | | 5,449 | |
USD/MXN, Counterparty MSCO, March Strike Price 18.92 MXN, Expires 3/10/20 | | | 1 | | | | 9,534,000 | | | | | | 73,564 | |
| | | | | | | | | | | | | | |
| | | | |
| | | | | | | | | | | | | 3,689,344 | |
| | | | | | | | | | | | | | |
| | | | |
Total Options Purchased
(Cost $25,728,033) | | | | | | | | | | | | | 7,123,962 | |
| | | | | | | | | | | | | | |
| | | | |
Total Investments before Short Term Investments
(Cost $2,081,704,045) | | | | | | | | | | | | | 1,859,471,503 | |
| | | | | | | | | | | | | | |
| | | | |
| | | | | | Principal
Amount* | | | | | | |
| | | | |
Short Term Investments 31.2% | | | | | | | | | | | | | | |
| | | | |
Foreign Government and Agency Securities 6.4% | | | | | | | | | | | | | | |
| | | | |
Argentina 0.1% | | | | | | | | | | | | | | |
aArgentina Treasury Bill, | | | | | | | | | | | | | | |
k2/26/20 - 5/13/20 | | | | | | | 213,440,180 | | | ARS | | | 2,472,579 | |
Strip, 8/27/20 | | | | | | | 55,163,710 | | | ARS | | | 631,486 | |
a,bGovernment of Argentina, FRN, 70.253%, (ARPP7DRR), 6/21/20 | | | | | | | 33,173,610 | | | ARS | | | 290,168 | |
| | | | | | | | | | | | | | |
| | | | |
| | | | | | | | | | | | | 3,394,233 | |
| | | | | | | | | | | | | | |
| | | | |
Brazil 0.1% | | | | | | | | | | | | | | |
Letra Tesouro Nacional, Strip, 1/01/20 | | | | | | | 14,770 | d | | BRL | | | 3,673,940 | |
| | | | | | | | | | | | | | |
FRANKLIN TEMPLETON VARIABLE INSURANCE PRODUCTS TRUST
STATEMENT OF INVESTMENTS
Templeton Global Bond VIP Fund(continued)
| | | | | | | | | | | | | | |
| | | | | | Principal Amount* | | | | | Value | |
| | | | |
Short Term Investments(continued) | | | | | | | | | | | | | | |
| | | | |
Foreign Government and Agency Securities(continued) | | | | | | | | | | | | | | |
| | | | |
Japan 4.4% | | | | | | | | | | | | | | |
kJapan Treasury Discount Bill, | | | | | | | | | | | | | | |
1/14/20 - 9/23/20 | | | | | | | 10,261,900,000 | | | JPY | | $ | 94,460,695 | |
1/27/20 | | | | | | | 3,147,000,000 | | | JPY | | | 28,961,145 | |
| | | | | | | | | | | | | | |
| | | | |
| | | | | | | | | | | | | 123,421,840 | |
| | | | | | | | | | | | | | |
| | | | |
Mexico 0.7% | | | | | | | | | | | | | | |
kMexico Treasury Bill, 1/02/20 - 2/27/20 | | | | | | | 34,885,960 | l | | MXN | | | 18,264,160 | |
| | | | | | | | | | | | | | |
| | | | |
Norway 0.8% | | | | | | | | | | | | | | |
h,i,k Norway Treasury Bill, 144A, Reg S, 3/18/20 - 9/16/20 | | | | | | | 199,761,000 | | | NOK | | | 22,659,429 | |
| | | | | | | | | | | | | | |
| | | | |
South Korea 0.3% | | | | | | | | | | | | | | |
Korea Monetary Stabilization Bond, senior note, 2.16%, 2/02/20 | | | | | | | 7,615,000,000 | | | KRW | | | 6,592,038 | |
| | | | | | | | | | | | | | |
| | | | |
Total Foreign Government and Agency Securities
(Cost $177,374,759) | | | | | | | | | | | | | 178,005,640 | |
| | | | | | | | | | | | | | |
| | | | |
U.S. Government and Agency Securities (Cost $3,897,414) 0.1% | | | | | | | | | | | | | | |
United States 0.1% | | | | | | | | | | | | | | |
U.S. Treasury Note, 1.25%, 1/31/20 | | | | | | | 3,900,000 | | | | | | 3,898,777 | |
| | | | | | | | | | | | | | |
| | | | |
Total Investments before Money Market Funds
(Cost $2,262,976,218) | | | | | | | | | | | | | 2,041,375,920 | |
| | | | | | | | | | | | | | |
| | | | |
| | | | | | Shares | | | | | | |
Money Market Funds (Cost $691,092,548) 24.7% | | | | | | | | | | | | | | |
United States 24.7% | | | | | | | | | | | | | | |
m,nInstitutional Fiduciary Trust Money Market Portfolio, 1.26% | | | | | | | 691,092,548 | | | | | | 691,092,548 | |
| | | | | | | | | | | | | | |
| | | | |
Total Investments (Cost $2,954,068,766) 97.5% | | | | | | | | | | | | | 2,732,468,468 | |
| | | | |
Options Written (0.5)% | | | | | | | | | | | | | (13,186,703 | ) |
| | | | |
Other Assets, less Liabilities 3.0% | | | | | | | | | | | | | 83,394,741 | |
| | | | | | | | | | | | | | |
| | | | |
Net Assets 100.0% | | | | | | | | | | | | $ | 2,802,676,506 | |
| | | | | | | | | | | | | | |
| | | | |
| | | Number of
Contracts | | | Notional
Amount* | | | | | | |
| | | | |
oOptions Written (0.5)% | | | | | | | | | | | | | | |
| | | | |
Calls -Over-the-Counter | | | | | | | | | | | | | | |
| | | | |
Currency Options (0.2)% | | | | | | | | | | | | | | |
AUD/JPY, Counterparty CITI, January Strike Price 76.70 JPY, Expires 1/23/20 | | | 1 | | | | 27,603,000 | | | AUD | | | (89,053 | ) |
AUD/JPY, Counterparty CITI, February Strike Price 75.90 JPY, Expires 2/12/20 | | | 1 | | | | 16,870,000 | | | AUD | | | (152,352 | ) |
AUD/JPY, Counterparty CITI, February Strike Price 77.28 JPY, Expires 2/12/20 | | | 1 | | | | 8,878,000 | | | AUD | | | (28,723 | ) |
AUD/JPY, Counterparty CITI, February Strike Price 78.18 JPY, Expires 2/12/20 | | | 1 | | | | 5,327,000 | | | AUD | | | (7,431 | ) |
AUD/JPY, Counterparty CITI, April Strike Price 75.95 JPY, Expires 4/22/20 | | | 1 | | | | 14,227,000 | | | AUD | | | (185,173 | ) |
AUD/JPY, Counterparty CITI, May Strike Price 76.00 JPY, Expires 5/06/20 | | | 1 | | | | 24,860,000 | | | AUD | | | (332,621 | ) |
FRANKLIN TEMPLETON VARIABLE INSURANCE PRODUCTS TRUST
STATEMENT OF INVESTMENTS
Templeton Global Bond VIP Fund(continued)
| | | | | | | | | | | | | | |
| | | Number of Contracts | | | Notional Amount* | | | | | Value | |
| | | | |
oOptions Written(continued) | | | | | | | | | | | | | | |
| | | | |
Calls -Over-the-Counter(continued) | | | | | | | | | | | | | | |
| | | | |
Currency Options(continued) | | | | | | | | | | | | | | |
AUD/JPY, Counterparty CITI, May Strike Price 76.50 JPY, Expires 5/07/20 | | | 1 | | | | 23,676,000 | | | AUD | | $ | (260,547 | ) |
AUD/JPY, Counterparty CITI, May Strike Price 77.35 JPY, Expires 5/07/20 | | | 1 | | | | 11,838,000 | | | AUD | | | (89,391 | ) |
AUD/JPY, Counterparty CITI, December Strike Price 75.70 JPY, Expires 12/21/20 | | | 1 | | | | 35,514,000 | | | AUD | | | (791,309 | ) |
AUD/USD, Counterparty HSBK, April Strike Price $0.71, Expires 4/30/20 | | | 1 | | | | 14,798,000 | | | AUD | | | (114,006 | ) |
AUD/USD, Counterparty HSBK, May Strike Price $0.71, Expires 5/04/20 | | | 1 | | | | 18,644,000 | | | AUD | | | (176,143 | ) |
AUD/USD, Counterparty HSBK, November Strike Price $0.71, Expires 11/05/20 | | | 1 | | | | 11,838,000 | | | AUD | | | (171,870 | ) |
AUD/USD, Counterparty HSBK, November Strike Price $0.80, Expires 11/05/20 | | | 1 | | | | 23,676,000 | | | AUD | | | (20,184 | ) |
AUD/USD, Counterparty HSBK, May Strike Price $0.78, Expires 5/05/21 | | | 1 | | | | 19,730,000 | | | AUD | | | (84,986 | ) |
AUD/USD, Counterparty MSCO, August Strike Price $0.74, Expires 8/12/20 | | | 1 | | | | 25,156,000 | | | AUD | | | (108,605 | ) |
AUD/USD, Counterparty MSCO, May Strike Price $0.74, Expires 5/12/21 | | | 1 | | | | 42,617,000 | | | AUD | | | (481,276 | ) |
USD/JPY, Counterparty CITI, March Strike Price 108.91 JPY, Expires 3/20/20 | | | 1 | | | | 59,164,000 | | | | | | (387,643 | ) |
USD/JPY, Counterparty CITI, March Strike Price 109.16 JPY, Expires 3/30/20 | | | 1 | | | | 69,025,000 | | | | | | (419,396 | ) |
USD/JPY, Counterparty CITI, September Strike Price 108.77 JPY, Expires 9/22/20 | | | 1 | | | | 76,420,000 | | | | | | (937,138 | ) |
USD/MXN, Counterparty CITI, January Strike Price 19.96 MXN, Expires 1/30/20 | | | 1 | | | | 6,102,000 | | | | | | (2,807 | ) |
USD/MXN, Counterparty CITI, March Strike Price 21.82 MXN, Expires 3/06/20 | | | 1 | | | | 11,853,000 | | | | | | (2,572 | ) |
USD/MXN, Counterparty CITI, March Strike Price 19.95 MXN, Expires 3/30/20 | | | 1 | | | | 22,882,000 | | | | | | (95,738 | ) |
USD/MXN, Counterparty CITI, May Strike Price 19.34 MXN, Expires 5/12/20 | | | 1 | | | | 9,997,000 | | | | | | (167,270 | ) |
USD/MXN, Counterparty CITI, May Strike Price 22.85 MXN, Expires 5/14/20 | | | 1 | | | | 21,999,000 | | | | | | (16,235 | ) |
USD/MXN, Counterparty CITI, May Strike Price 22.91 MXN, Expires 5/21/20 | | | 1 | | | | 4,212,000 | | | | | | (3,290 | ) |
USD/MXN, Counterparty CITI, September Strike Price 23.00 MXN, Expires 9/03/20 | | | 1 | | | | 23,836,000 | | | | | | (64,643 | ) |
USD/MXN, Counterparty CITI, September Strike Price 24.30 MXN, Expires 9/08/20 | | | 1 | | | | 15,874,000 | | | | | | (24,557 | ) |
USD/MXN, Counterparty CITI, September Strike Price 20.06 MXN, Expires 9/17/20 | | | 1 | | | | 21,869,000 | | | | | | (425,133 | ) |
USD/MXN, Counterparty CITI, September Strike Price 22.40 MXN, Expires 9/17/20 | | | 1 | | | | 21,869,000 | | | | | | (91,653 | ) |
USD/MXN, Counterparty GSCO, March Strike Price 19.49 MXN, Expires 3/12/20 | | | 1 | | | | 15,250,000 | | | | | | (94,550 | ) |
USD/MXN, Counterparty GSCO, March Strike Price 22.11 MXN, Expires 3/12/20 | | | 1 | | | | 15,250,000 | | | | | | (3,141 | ) |
USD/MXN, Counterparty JPHQ, May Strike Price 21.54 MXN, Expires 5/13/20 | | | 1 | | | | 15,714,000 | | | | | | (28,442 | ) |
USD/MXN, Counterparty JPHQ, July Strike Price 22.30 MXN, Expires 7/27/20 | | | 1 | | | | 12,571,000 | | | | | | (35,676 | ) |
USD/MXN, Counterparty MSCO, February Strike Price 20.15 MXN, Expires 2/20/20 | | | 1 | | | | 114,412,000 | | | | | | (110,636 | ) |
USD/MXN, Counterparty MSCO, March Strike Price 22.56 MXN, Expires 3/05/20 | | | 1 | | | | 28,603,000 | | | | | | (2,946 | ) |
USD/MXN, Counterparty MSCO, March Strike Price 20.49 MXN, Expires 3/10/20 | | | 1 | | | | 23,835,000 | | | | | | (28,459 | ) |
USD/MXN, Counterparty MSCO, March Strike Price 22.87 MXN, Expires 3/12/20 | | | 1 | | | | 9,300,000 | | | | | | (986 | ) |
FRANKLIN TEMPLETON VARIABLE INSURANCE PRODUCTS TRUST
STATEMENT OF INVESTMENTS
Templeton Global Bond VIP Fund(continued)
| | | | | | | | | | | | | | |
| | | Number of Contracts | | | Notional Amount* | | | | | Value | |
| | | | |
oOptions Written(continued) | | | | | | | | | | | | | | |
| | | | |
Calls -Over-the-Counter(continued) | | | | | | | | | | | | | | |
| | | | |
Currency Options(continued) | | | | | | | | | | | | | | |
USD/MXN, Counterparty MSCO, June Strike Price 24.20 MXN, Expires 6/15/20 | | | 1 | | | | 6,200,000 | | | | | $ | (3,205 | ) |
USD/MXN, Counterparty MSCO, September Strike Price 24.56 MXN, Expires 9/04/20 | | | 1 | | | | 57,205,000 | | | | | | (76,712 | ) |
USD/MXN, Counterparty MSCO, September Strike Price 22.46 MXN, Expires 9/10/20 | | | 1 | | | | 4,767,000 | | | | | | (18,148 | ) |
| | | | | | | | | | | | | | |
| | | | |
| | | | | | | | | | | | | (6,134,646 | ) |
| | | | | | | | | | | | | | |
| | | | |
Puts -Over-the-Counter | | | | | | | | | | | | | | |
| | | | |
Currency Options (0.3)% | | | | | | | | | | | | | | |
AUD/JPY, Counterparty CITI, July Strike Price 68.00 JPY, Expires 7/21/20 | | | 1 | | | | 31,568,000 | | | AUD | | | (101,246 | ) |
AUD/USD, Counterparty MSCO, August Strike Price $0.64, Expires 8/12/20 | | | 1 | | | | 16,771,000 | | | AUD | | | (26,077 | ) |
USD/JPY, Counterparty CITI, March Strike Price 102.84 JPY, Expires 3/20/20 | | | 1 | | | | 59,164,000 | | | | | | (77,505 | ) |
USD/JPY, Counterparty CITI, March Strike Price 100.13 JPY, Expires 3/30/20 | | | 1 | | | | 34,512,000 | | | | | | (25,125 | ) |
USD/JPY, Counterparty CITI, September Strike Price 100.03 JPY, Expires 9/22/20 | | | 1 | | | | 38,210,000 | | | | | | (195,521 | ) |
USD/MXN, Counterparty CITI, March Strike Price 18.96 MXN, Expires 3/06/20 | | | 1 | | | | 19,049,000 | | | | | | (156,735 | ) |
USD/MXN, Counterparty CITI, March Strike Price 19.38 MXN, Expires 3/06/20 | | | 1 | | | | 11,430,000 | | | | | | (248,660 | ) |
USD/MXN, Counterparty CITI, March Strike Price 19.37 MXN, Expires 3/09/20 | | | 1 | | | | 28,603,000 | | | | | | (610,245 | ) |
USD/MXN, Counterparty CITI, May Strike Price 19.55 MXN, Expires 5/11/20 | | | 1 | | | | 21,843,000 | | | | | | (589,695 | ) |
USD/MXN, Counterparty CITI, May Strike Price 19.69 MXN, Expires 5/12/20 | | | 1 | | | | 7,801,000 | | | | | | (251,153 | ) |
USD/MXN, Counterparty CITI, May Strike Price 19.24 MXN, Expires 5/14/20 | | | 1 | | | | 32,999,000 | | | | | | (558,211 | ) |
USD/MXN, Counterparty CITI, May Strike Price 20.58 MXN, Expires 5/15/20 | | | 1 | | | | 13,730,000 | | | | | | (969,159 | ) |
USD/MXN, Counterparty CITI, May Strike Price 19.09 MXN, Expires 5/21/20 | | | 1 | | | | 4,212,000 | | | | | | (54,457 | ) |
USD/MXN, Counterparty CITI, September Strike Price 19.76 MXN, Expires 9/03/20 | | | 1 | | | | 47,671,000 | | | | | | (1,459,019 | ) |
USD/MXN, Counterparty GSCO, March Strike Price 19.40 MXN, Expires 3/12/20 | | | 1 | | | | 19,100,000 | | | | | | (425,090 | ) |
USD/MXN, Counterparty JPHQ, January Strike Price 19.00 MXN, Expires 1/27/20 | | | 1 | | | | 25,142,000 | | | | | | (194,197 | ) |
USD/MXN, Counterparty JPHQ, April Strike Price 19.36 MXN, Expires 4/24/20 | | | 1 | | | | 21,999,000 | | | | | | (447,636 | ) |
USD/MXN, Counterparty MSCO, March Strike Price 19.05 MXN, Expires 3/12/20 | | | 1 | | | | 9,300,000 | | | | | | (98,161 | ) |
USD/MXN, Counterparty MSCO, June Strike Price 19.05 MXN, Expires 6/15/20 | | | 1 | | | | 9,300,000 | | | | | | (116,501 | ) |
USD/MXN, Counterparty MSCO, September Strike Price 19.76 MXN, Expires 9/10/20 | | | 1 | | | | 14,301,000 | | | | | | (447,664 | ) |
| | | | | | | | | | | | | | |
| | | | |
| | | | | | | | | | | | | (7,052,057 | ) |
| | | | | | | | | | | | | | |
| | | | |
Total Options Written (Premiums received $18,573,066) | | | | | | | | | | | | | (13,186,703 | ) |
| | | | | | | | | | | | | | |
FRANKLIN TEMPLETON VARIABLE INSURANCE PRODUCTS TRUST
STATEMENT OF INVESTMENTS
Templeton Global Bond VIP Fund(continued)
*The principal/notional amount is stated in U.S. dollars unless otherwise indicated.
aSecurities denominated in Argentine Peso have been designated as Level 3 investments. See Note 11 regarding fair value measurements.
bThe coupon rate shown represents the rate at period end.
cRedemption price at maturity and coupon payment are adjusted for inflation. See Note 1(g).
dPrincipal amount is stated in 1,000 Brazilian Real Units.
ePrincipal amount is stated in 100 Mexican Peso Units.
fPrincipal amount of security is adjusted for inflation. See Note 1(g).
gPrincipal amount is stated in 100 Unidad de Inversion Units.
hSecurity was purchased pursuant to Rule 144A under the Securities Act of 1933 and may be sold in transactions exempt from registration only to qualified institutional buyers or in a public offering registered under the Securities Act of 1933. At December 31, 2019, the aggregate value of these securities $128,667,527, representing 4.6% of net assets.
iSecurity was purchased pursuant to Regulation S under the Securities Act of 1933, which exempts from registration securities offered and sold outside of the United States. Such a security cannot be sold in the United States without either an effective registration statement filed pursuant to the Securities Act of 1933, or pursuant to an exemption from registration. At December 31, 2019, the aggregate value of these securities was $128,667,527, representing 4.6% of net assets.
jA supranational organization is an entity formed by two or more central governments through international treaties.
kThe security was issued on a discount basis with no stated coupon rate.
lPrincipal amount is stated in 10 Mexican Peso Units.
mSee Note 3(e) regarding investments in affiliated management investment companies.
nThe rate shown is the annualizedseven-day effective yield at period end.
oSee Note 1(c) regarding written options.
At December 31, 2019, the Fund had the following forward exchange contracts outstanding. See Note 1(c).
Forward Exchange Contracts
| | | | | | | | | | | | | | | | | | | | | | | | | | | | | | |
| Currency | | Counterpartya | | | Type | | | Quantity | | | Contract Amount* | | | | | Settlement
Date | | | Unrealized
Appreciation | | | Unrealized
Depreciation | |
| | | | | | | |
OTC Forward Exchange Contracts | | | | | | | | | | | | | | | | | | | | | | | | | | | |
Norwegian Krone | | | DBAB | | | | Buy | | | | 55,158,000 | | | | 6,042,130 | | | | | | 1/03/20 | | | $ | 241,980 | | | $ | — | |
Norwegian Krone | | | DBAB | | | | Sell | | | | 55,158,000 | | | | 6,002,481 | | | | | | 1/03/20 | | | | — | | | | (281,628 | ) |
Indian Rupee | | | BNDP | | | | Sell | | | | 845,797,600 | | | | 11,795,518 | | | | | | 1/07/20 | | | | — | | | | (54,254 | ) |
South Korean Won | | | HSBK | | | | Sell | | | | 42,561,000,000 | | | | 35,642,744 | | | | | | 1/08/20 | | | | — | | | | (1,180,910 | ) |
Indian Rupee | | | BNDP | | | | Sell | | | | 237,955,000 | | | | 3,262,004 | | | | | | 1/13/20 | | | | — | | | | (70,919 | ) |
Australian Dollar | | | JPHQ | | | | Sell | | | | 25,330,000 | | | | 1,857,929,916 | | | JPY | | | 1/14/20 | | | | — | | | | (669,494 | ) |
Australian Dollar | | | JPHQ | | | | Buy | | | | 30,315,000 | | | | 20,592,191 | | | | | | 1/15/20 | | | | 686,601 | | | | — | |
Australian Dollar | | | JPHQ | | | | Sell | | | | 30,315,000 | | | | 21,239,144 | | | | | | 1/15/20 | | | | — | | | | (39,649 | ) |
Indian Rupee | | | CITI | | | | Sell | | | | 1,193,580,000 | | | | 16,299,058 | | | | | | 1/16/20 | | | | — | | | | (416,672 | ) |
Euro | | | SCNY | | | | Buy | | | | 657,000 | | | | 728,351 | | | | | | 1/17/20 | | | | 9,245 | | | | — | |
Euro | | | SCNY | | | | Sell | | | | 657,000 | | | | 729,999 | | | | | | 1/17/20 | | | | — | | | | (7,597 | ) |
South Korean Won | | | HSBK | | | | Sell | | | | 13,984,825,441 | | | | 11,645,772 | | | | | | 1/17/20 | | | | — | | | | (456,026 | ) |
Euro | | | DBAB | | | | Buy | | | | 8,405,717 | | | | 9,318,073 | | | | | | 1/23/20 | | | | 122,438 | | | | — | |
Euro | | | DBAB | | | | Sell | | | | 8,405,717 | | | | 9,572,598 | | | | | | 1/23/20 | | | | 132,087 | | | | — | |
Japanese Yen | | | BNDP | | | | Buy | | | | 8,410,370,000 | | | | 78,389,498 | | | | | | 1/24/20 | | | | — | | | | (894,194 | ) |
South Korean Won | | | HSBK | | | | Sell | | | | 39,774,174,559 | | | | 34,043,429 | | | | | | 1/28/20 | | | | — | | | | (382,773 | ) |
South Korean Won | | | HSBK | | | | Sell | | | | 24,029,880,977 | | | | 20,533,095 | | | | | | 1/30/20 | | | | — | | | | (266,594 | ) |
Euro | | | JPHQ | | | | Buy | | | | 32,859,900 | | | | 36,702,197 | | | | | | 2/03/20 | | | | 228,471 | | | | — | |
Euro | | | JPHQ | | | | Sell | | | | 32,859,900 | | | | 37,139,573 | | | | | | 2/03/20 | | | | 208,906 | | | | — | |
Indian Rupee | | | HSBK | | | | Sell | | | | 1,629,025,341 | | | | 22,680,715 | | | | | | 2/03/20 | | | | — | | | | (109,444 | ) |
Brazilian Real | | | JPHQ | | | | Sell | | | | 57,125,400 | | | | 13,876,503 | | | | | | 2/04/20 | | | | — | | | | (325,376 | ) |
Indian Rupee | | | HSBK | | | | Sell | | | | 1,466,662,182 | | | | 20,355,351 | | | | | | 2/05/20 | | | | — | | | | (158,841 | ) |
Indian Rupee | | | BNDP | | | | Sell | | | | 852,858,400 | | | | 11,897,887 | | | | | | 2/06/20 | | | | — | | | | (29,730 | ) |
Indian Rupee | | | HSBK | | | | Sell | | | | 640,177,000 | | | | 8,967,948 | | | | | | 2/06/20 | | | | 14,779 | | | | — | |
South Korean Won | | | DBAB | | | | Sell | | | | 13,920,000,000 | | | | 11,536,549 | | | | | | 2/10/20 | | | | — | | | | (515,157 | ) |
FRANKLIN TEMPLETON VARIABLE INSURANCE PRODUCTS TRUST
STATEMENT OF INVESTMENTS
Templeton Global Bond VIP Fund(continued)
Forward Exchange Contracts(continued)
| | | | | | | | | | | | | | | | | | | | | | | | | | | | | | |
| Currency | | Counterpartya | | | Type | | | Quantity | | | Contract Amount* | | | | | Settlement
Date | | | Unrealized
Appreciation | | | Unrealized
Depreciation | |
| | | | | | | |
OTC Forward Exchange Contracts (continued) | | | | | | | | | | | | | | | | | | | | | | | | | | | |
Swiss Franc | | | UBSW | | | | Buy | | | | 17,378,212 | | | | 15,815,628 | | | EUR | | | 2/10/20 | | | $ | 229,475 | | | $ | — | |
South Korean Won | | | HSBK | | | | Sell | | | | 75,818,000,000 | | | | 65,152,531 | | | | | | 2/12/20 | | | | — | | | | (492,303 | ) |
Swiss Franc | | | GSCO | | | | Buy | | | | 17,055,038 | | | | 15,526,600 | | | EUR | | | 2/12/20 | | | | 219,776 | | | | — | |
Swedish Krona | | | DBAB | | | | Buy | | | | 208,032,300 | | | | 19,486,343 | | | EUR | | | 2/13/20 | | | | 345,053 | | | | — | |
Indian Rupee | | | HSBK | | | | Sell | | | | 320,909,148 | | | | 4,432,937 | | | | | | 2/14/20 | | | | — | | | | (51,195 | ) |
Indian Rupee | | | HSBK | | | | Sell | | | | 833,252,000 | | | | 11,493,924 | | | | | | 2/18/20 | | | | — | | | | (144,189 | ) |
Indian Rupee | | | JPHQ | | | | Sell | | | | 1,513,957,170 | | | | 20,894,416 | | | | | | 2/20/20 | | | | — | | | | (246,546 | ) |
Australian Dollar | | | JPHQ | | | | Sell | | | | 30,315,000 | | | | 2,169,386,883 | | | JPY | | | 2/21/20 | | | | — | | | | (1,276,844 | ) |
Euro | | | SCNY | | | | Buy | | | | 4,975,000 | | | | 5,554,463 | | | | | | 2/24/20 | | | | 43,955 | | | | — | |
Euro | | | SCNY | | | | Sell | | | | 4,975,000 | | | | 5,583,691 | | | | | | 2/24/20 | | | | — | | | | (14,726 | ) |
Australian Dollar | | | CITI | | | | Sell | | | | 35,702,533 | | | | 2,552,418,685 | | | JPY | | | 2/25/20 | | | | — | | | | (1,523,879 | ) |
Australian Dollar | | | JPHQ | | | | Sell | | | | 52,305,500 | | | | 3,751,062,779 | | | JPY | | | 2/25/20 | | | | — | | | | (2,124,746 | ) |
Euro | | | HSBK | | | | Sell | | | | 25,253,559 | | | | 2,980,010,839 | | | JPY | | | 2/25/20 | | | | — | | | | (911,320 | ) |
Japanese Yen | | | CITI | | | | Buy | | | | 3,408,578,000 | | | | 32,453,406 | | | | | | 2/26/20 | | | | — | | | | (987,032 | ) |
Japanese Yen | | | CITI | | | | Sell | | | | 3,408,578,000 | | | | 31,992,750 | | | | | | 2/26/20 | | | | 526,376 | | | | — | |
Norwegian Krone | | | DBAB | | | | Buy | | | | 135,189,000 | | | | 15,096,988 | | | | | | 2/26/20 | | | | 307,939 | | | | — | |
Norwegian Krone | | | DBAB | | | | Sell | | | | 135,189,000 | | | | 14,712,047 | | | | | | 2/26/20 | | | | — | | | | (692,880 | ) |
Indian Rupee | | | SCNY | | | | Sell | | | | 945,558,000 | | | | 12,802,898 | | | | | | 2/27/20 | | | | — | | | | (390,812 | ) |
Japanese Yen | | | CITI | | | | Buy | | | | 2,324,212,100 | | | | 22,107,225 | | | | | | 2/27/20 | | | | — | | | | (649,983 | ) |
Japanese Yen | | | CITI | | | | Sell | | | | 2,324,212,100 | | | | 21,816,254 | | | | | | 2/27/20 | | | | 359,012 | | | | — | |
Japanese Yen | | | JPHQ | | | | Buy | | | | 2,297,161,600 | | | | 21,849,209 | | | | | | 2/27/20 | | | | — | | | | (641,699 | ) |
Euro | | | BZWS | | | | Buy | | | | 22,495,165 | | | | 25,171,078 | | | | | | 2/28/20 | | | | 149,085 | | | | — | |
Euro | | | BZWS | | | | Sell | | | | 22,495,166 | | | | 25,278,830 | | | | | | 2/28/20 | | | | — | | | | (41,333 | ) |
Indian Rupee | | | SCNY | | | | Sell | | | | 1,135,539,000 | | | | 15,415,847 | | | | | | 2/28/20 | | | | — | | | | (427,004 | ) |
Japanese Yen | | | CITI | | | | Buy | | | | 4,463,423,000 | | | | 42,753,688 | | | | | | 2/28/20 | | | | — | | | | (1,544,803 | ) |
Japanese Yen | | | CITI | | | | Sell | | | | 4,463,423,000 | | | | 41,898,391 | | | | | | 2/28/20 | | | | 689,506 | | | | — | |
Brazilian Real | | | JPHQ | | | | Sell | | | | 71,627,700 | | | | 17,345,621 | | | | | | 3/03/20 | | | | — | | | | (431,994 | ) |
Indian Rupee | | | SCNY | | | | Sell | | | | 2,362,358,000 | | | | 32,036,751 | | | | | | 3/03/20 | | | | — | | | | (905,775 | ) |
Australian Dollar | | | CITI | | | | Sell | | | | 23,089,500 | | | | 1,653,613,051 | | | JPY | | | 3/06/20 | | | | — | | | | (953,750 | ) |
Japanese Yen | | | HSBK | | | | Buy | | | | 1,385,935,670 | | | | 13,063,576 | | | | | | 3/06/20 | | | | — | | | | (262,580 | ) |
Japanese Yen | | | HSBK | | | | Sell | | | | 1,385,935,670 | | | | 13,219,153 | | | | | | 3/06/20 | | | | 418,157 | | | | — | |
Japanese Yen | | | JPHQ | | | | Buy | | | | 1,316,291,430 | | | | 12,420,546 | | | | | | 3/06/20 | | | | — | | | | (262,809 | ) |
Japanese Yen | | | JPHQ | | | | Sell | | | | 1,316,291,430 | | | | 12,511,845 | | | | | | 3/06/20 | | | | 354,108 | | | | — | |
South Korean Won | | | DBAB | | | | Sell | | | | 13,919,000,000 | | | | 11,576,978 | | | | | | 3/06/20 | | | | — | | | | (483,022 | ) |
South Korean Won | | | GSCO | | | | Sell | | | | 44,346,000,000 | | | | 38,184,871 | | | | | | 3/09/20 | | | | — | | | | (244,987 | ) |
Euro | | | BOFA | | | | Buy | | | | 17,090,572 | | | | 19,106,336 | | | | | | 3/10/20 | | | | 144,160 | | | | — | |
Euro | | | BOFA | | | | Sell | | | | 17,090,572 | | | | 19,044,024 | | | | | | 3/10/20 | | | | — | | | | (206,472 | ) |
Australian Dollar | | | HSBK | | | | Sell | | | | 19,340,000 | | | | 1,424,410,340 | | | JPY | | | 3/12/20 | | | | — | | | | (433,081 | ) |
Australian Dollar | | | JPHQ | | | | Sell | | | | 22,880,000 | | | | 1,707,432,812 | | | JPY | | | 3/12/20 | | | | — | | | | (306,328 | ) |
Australian Dollar | | | HSBK | | | | Sell | | | | 9,830,000 | | | | 730,865,415 | | | JPY | | | 3/13/20 | | | | — | | | | (156,371 | ) |
Swedish Krona | | | DBAB | | | | Buy | | | | 208,032,400 | | | | 19,479,054 | | | EUR | | | 3/13/20 | | | | 344,041 | | | | — | |
Indian Rupee | | | JPHQ | | | | Sell | | | | 415,137,830 | | | | 5,684,873 | | | | | | 3/16/20 | | | | — | | | | (94,174 | ) |
South Korean Won | | | HSBK | | | | Sell | | | | 7,007,000,000 | | | | 5,956,307 | | | | | | 3/18/20 | | | | — | | | | (119,049 | ) |
South Korean Won | | | CITI | | | | Sell | | | | 4,215,000,000 | | | | 3,580,682 | | | | | | 3/20/20 | | | | — | | | | (74,317 | ) |
Euro | | | GSCO | | | | Buy | | | | 1,230,811 | | | | 1,374,970 | | | | | | 3/23/20 | | | | 12,563 | | | | — | |
Euro | | | GSCO | | | | Sell | | | | 1,230,811 | | | | 1,379,468 | | | | | | 3/23/20 | | | | — | | | | (8,064 | ) |
FRANKLIN TEMPLETON VARIABLE INSURANCE PRODUCTS TRUST
STATEMENT OF INVESTMENTS
Templeton Global Bond VIP Fund(continued)
Forward Exchange Contracts(continued)
| | | | | | | | | | | | | | | | | | | | | | | | | | | | | | |
| Currency | | Counterpartya | | | Type | | | Quantity | | | Contract Amount* | | | | | Settlement
Date | | | Unrealized
Appreciation | | | Unrealized
Depreciation | |
| | | | | | | |
OTC Forward Exchange Contracts(continued) | | | | | | | | | | | | | | | | | | | | | | | | | | | |
Japanese Yen | | | HSBK | | | | Buy | | | | 5,242,851,400 | | | | 49,342,826 | | | | | | 3/23/20 | | | $ | — | | | $ | (869,524 | ) |
Japanese Yen | | | HSBK | | | | Sell | | | | 5,242,851,400 | | | | 50,052,760 | | | | | | 3/23/20 | | | | 1,579,457 | | | | — | |
Japanese Yen | | | JPHQ | | | | Buy | | | | 3,549,117,130 | | | | 33,375,614 | | | | | | 3/23/20 | | | | — | | | | (561,900 | ) |
Japanese Yen | | | JPHQ | | | | Sell | | | | 3,549,117,130 | | | | 33,804,818 | | | | | | 3/23/20 | | | | 991,104 | | | | — | |
Norwegian Krone | | | DBAB | | | | Buy | | | | 110,414,000 | | | | 12,349,592 | | | | | | 3/23/20 | | | | 232,549 | | | | — | |
Norwegian Krone | | | DBAB | | | | Sell | | | | 110,414,000 | | | | 12,107,329 | | | | | | 3/23/20 | | | | — | | | | (474,812 | ) |
Japanese Yen | | | CITI | | | | Buy | | | | 4,452,680,000 | | | | 41,757,642 | | | | | | 3/24/20 | | | | — | | | | (587,524 | ) |
Japanese Yen | | | CITI | | | | Sell | | | | 240,000,000 | | | | 2,256,205 | | | | | | 3/24/20 | | | | 37,131 | | | | — | |
Japanese Yen | | | JPHQ | | | | Buy | | | | 921,145,640 | | | | 8,744,741 | | | | | | 3/24/20 | | | | — | | | | (227,696 | ) |
Japanese Yen | | | JPHQ | | | | Sell | | | | 921,145,640 | | | | 8,774,153 | | | | | | 3/24/20 | | | | 257,108 | | | | — | |
Norwegian Krone | | | DBAB | | | | Buy | | | | 83,053,000 | | | | 9,236,218 | | | | | | 3/24/20 | | | | 228,030 | | | | — | |
Norwegian Krone | | | DBAB | | | | Sell | | | | 83,053,000 | | | | 9,038,208 | | | | | | 3/24/20 | | | | — | | | | (426,040 | ) |
Euro | | | HSBK | | | | Sell | | | | 25,254,215 | | | | 2,985,553,322 | | | JPY | | | 3/25/20 | | | | — | | | | (867,108 | ) |
Euro | | | BZWS | | | | Buy | | | | 11,247,583 | | | | 12,570,367 | | | | | | 3/31/20 | | | | 115,950 | | | | — | |
Euro | | | BZWS | | | | Sell | | | | 11,247,583 | | | | 12,462,265 | | | | | | 3/31/20 | | | | — | | | | (224,052 | ) |
Euro | | | CITI | | | | Sell | | | | 22,979,200 | | | | 2,707,863,964 | | | JPY | | | 3/31/20 | | | | — | | | | (871,035 | ) |
Euro | | | SCNY | | | | Buy | | | | 12,544,218 | | | | 14,017,424 | | | | | | 3/31/20 | | | | 131,388 | | | | — | |
Euro | | | SCNY | | | | Sell | | | | 12,544,218 | | | | 13,905,768 | | | | | | 3/31/20 | | | | — | | | | (243,045 | ) |
Brazilian Real | | | CITI | | | | Buy | | | | 206,375,000 | | | | 44,333,097 | | | EUR | | | 4/01/20 | | | | 1,146,824 | | | | — | |
Euro | | | BOFA | | | | Buy | | | | 17,079,724 | | | | 19,098,667 | | | | | | 4/08/20 | | | | 175,391 | | | | — | |
Euro | | | BOFA | | | | Sell | | | | 17,079,724 | | | | 18,978,477 | | | | | | 4/08/20 | | | | — | | | | (295,581 | ) |
Euro | | | GSCO | | | | Buy | | | | 2,045,000 | | | | 2,286,562 | | | | | | 4/08/20 | | | | 21,172 | | | | — | |
Euro | | | GSCO | | | | Sell | | | | 2,045,000 | | | | 2,272,915 | | | | | | 4/08/20 | | | | — | | | | (34,818 | ) |
Mexican Peso | | | CITI | | | | Sell | | | | 157,383,000 | | | | 7,836,511 | | | | | | 4/08/20 | | | | — | | | | (359,325 | ) |
Euro | | | UBSW | | | | Buy | | | | 8,311,299 | | | | 9,309,154 | | | | | | 4/09/20 | | | | 70,531 | | | | — | |
Euro | | | UBSW | | | | Sell | | | | 8,311,299 | | | | 9,247,151 | | | | | | 4/09/20 | | | | — | | | | (132,533 | ) |
Euro | | | BZWS | | | | Buy | | | | 7,003,000 | | | | 7,832,985 | | | | | | 4/14/20 | | | | 72,681 | | | | — | |
Euro | | | BZWS | | | | Sell | | | | 7,003,000 | | | | 7,785,515 | | | | | | 4/14/20 | | | | — | | | | (120,151 | ) |
Euro | | | BOFA | | | | Buy | | | | 17,769,000 | | | | 19,910,449 | | | | | | 4/15/20 | | | | 150,170 | | | | — | |
Euro | | | BOFA | | | | Sell | | | | 17,769,000 | | | | 19,824,340 | | | | | | 4/15/20 | | | | — | | | | (236,279 | ) |
Euro | | | GSCO | | | | Buy | | | | 1,789,884 | | | | 2,001,811 | | | | | | 4/15/20 | | | | 18,909 | | | | — | |
Euro | | | GSCO | | | | Sell | | | | 1,789,884 | | | | 1,996,758 | | | | | | 4/15/20 | | | | — | | | | (23,962 | ) |
Swedish Krona | | | DBAB | | | | Buy | | | | 208,032,300 | | | | 19,139,791 | | | EUR | | | 4/15/20 | | | | 715,903 | | | | — | |
Euro | | | GSCO | | | | Buy | | | | 1,231,111 | | | | 1,381,337 | | | | | | 4/23/20 | | | | 9,239 | | | | — | |
Euro | | | GSCO | | | | Sell | | | | 1,231,111 | | | | 1,390,047 | | | | | | 4/23/20 | | | | — | | | | (528 | ) |
Euro | | | UBSW | | | | Buy | | | | 11,641,500 | | | | 13,050,936 | | | | | | 4/24/20 | | | | 99,296 | | | | — | |
Euro | | | UBSW | | | | Sell | | | | 11,641,500 | | | | 13,116,769 | | | | | | 4/24/20 | | | | — | | | | (33,464 | ) |
Euro | | | HSBK | | | | Buy | | | | 19,488,000 | | | | 21,817,496 | | | | | | 4/27/20 | | | | 200,249 | | | | — | |
Euro | | | HSBK | | | | Sell | | | | 19,488,000 | | | | 21,942,319 | | | | | | 4/27/20 | | | | — | | | | (75,427 | ) |
Euro | | | BOFA | | | | Buy | | | | 32,470,000 | | | | 36,410,137 | | | | | | 4/29/20 | | | | 279,374 | | | | — | |
Euro | | | BOFA | | | | Sell | | | | 33,910,662 | | | | 38,077,605 | | | | | | 4/29/20 | | | | — | | | | (239,785 | ) |
Euro | | | GSCO | | | | Buy | | | | 2,855,793 | | | | 3,205,499 | | | | | | 4/29/20 | | | | 21,407 | | | | — | |
Euro | | | GSCO | | | | Sell | | | | 2,855,793 | | | | 3,209,112 | | | | | | 4/29/20 | | | | — | | | | (17,795 | ) |
Euro | | | SCNY | | | | Buy | | | | 12,300,264 | | | | 13,789,519 | | | | | | 4/29/20 | | | | 109,178 | | | | — | |
Euro | | | SCNY | | | | Sell | | | | 12,300,264 | | | | 13,820,762 | | | | | | 4/29/20 | | | | — | | | | (77,935 | ) |
Indian Rupee | | | JPHQ | | | | Sell | | | | 1,986,473,600 | | | | 27,399,636 | | | | | | 4/29/20 | | | | — | | | | (102,548 | ) |
FRANKLIN TEMPLETON VARIABLE INSURANCE PRODUCTS TRUST
STATEMENT OF INVESTMENTS
Templeton Global Bond VIP Fund(continued)
Forward Exchange Contracts(continued)
| | | | | | | | | | | | | | | | | | | | | | | | | | | | | | |
| Currency | | Counterpartya | | | Type | | | Quantity | | | Contract Amount* | | | | | Settlement
Date | | | Unrealized
Appreciation | | | Unrealized
Depreciation | |
| | | | | | | |
OTC Forward Exchange Contracts(continued) | | | | | | | | | | | | | | | | | | | | | | | | | | | |
Euro | | | BOFA | | | | Sell | | | | 33,910,662 | | | | 38,086,761 | | | | | | 4/30/20 | | | $ | — | | | $ | (233,014 | ) |
Euro | | | CITI | | | | Sell | | | | 22,979,200 | | | | 2,779,793,824 | | | JPY | | | 4/30/20 | | | | — | | | | (210,731 | ) |
Euro | | | GSCO | | | | Buy | | | | 13,037,050 | | | | 14,602,148 | | | | | | 4/30/20 | | | | 129,998 | | | | — | |
Euro | | | GSCO | | | | Sell | | | | 13,037,050 | | | | 14,638,912 | | | | | | 4/30/20 | | | | — | | | | (93,233 | ) |
Euro | | | HSBK | | | | Sell | | | | 25,974,891 | | | | 29,216,947 | | | | | | 4/30/20 | | | | — | | | | (135,236 | ) |
Brazilian Real | | | JPHQ | | | | Sell | | | | 64,790,800 | | | | 15,630,734 | | | | | | 5/05/20 | | | | — | | | | (402,227 | ) |
Swiss Franc | | | UBSW | | | | Buy | | | | 17,378,212 | | | | 15,829,025 | | | EUR | | | 5/08/20 | | | | 229,342 | | | | — | |
Swiss Franc | | | GSCO | | | | Buy | | | | 17,055,038 | | | | 15,539,898 | | | EUR | | | 5/12/20 | | | | 219,772 | | | | — | |
Swedish Krona | | | DBAB | | | | Buy | | | | 208,032,300 | | | | 19,542,908 | | | EUR | | | 5/13/20 | | | | 251,128 | | | | — | |
Euro | | | HSBK | | | | Sell | | | | 1,800,000 | | | | 2,005,992 | | | | | | 5/14/20 | | | | — | | | | (29,821 | ) |
Indian Rupee | | | JPHQ | | | | Sell | | | | 451,390,000 | | | | 6,129,685 | | | | | | 5/18/20 | | | | — | | | | (105,381 | ) |
Euro | | | BOFA | | | | Sell | | | | 10,878,191 | | | | 12,169,758 | | | | | | 5/20/20 | | | | — | | | | (138,154 | ) |
Euro | | | GSCO | | | | Sell | | | | 1,898,500 | | | | 2,124,232 | | | | | | 5/20/20 | | | | — | | | | (23,788 | ) |
Australian Dollar | | | JPHQ | | | | Sell | | | | 60,630,000 | | | | 4,397,043,441 | | | JPY | | | 5/21/20 | | | | — | | | | (1,894,254 | ) |
Euro | | | BOFA | | | | Sell | | | | 7,066,000 | | | | 7,919,573 | | | | | | 5/21/20 | | | | — | | | | (75,610 | ) |
Euro | | | GSCO | | | | Sell | | | | 1,230,811 | | | | 1,379,124 | | | | | | 5/21/20 | | | | — | | | | (13,540 | ) |
Euro | | | JPHQ | | | | Sell | | | | 21,878,395 | | | | 24,516,274 | | | | | | 5/21/20 | | | | — | | | | (239,144 | ) |
Euro | | | HSBK | | | | Sell | | | | 50,507,118 | | | | 6,015,152,722 | | | JPY | | | 5/22/20 | | | | — | | | | (1,349,823 | ) |
Euro | | | JPHQ | | | | Sell | | | | 26,361,295 | | | | 29,500,003 | | | | | | 5/22/20 | | | | — | | | | (329,677 | ) |
Japanese Yen | | | JPHQ | | | | Buy | | | | 2,297,117,500 | | | | 21,392,415 | | | | | | 5/26/20 | | | | — | | | | (77,257 | ) |
Euro | | | MSCO | | | | Sell | | | | 30,744,500 | | | | 34,286,266 | | | | | | 5/27/20 | | | | — | | | | (514,168 | ) |
Euro | | | BOFA | | | | Sell | | | | 27,627,938 | | | | 30,796,586 | | | | | | 5/29/20 | | | | — | | | | (480,038 | ) |
Euro | | | BZWS | | | | Sell | | | | 11,247,583 | | | | 12,585,820 | | | | | | 5/29/20 | | | | — | | | | (147,176 | ) |
Euro | | | JPHQ | | | | Sell | | | | 6,775,311 | | | | 7,592,787 | | | | | | 6/04/20 | | | | — | | | | (80,178 | ) |
Euro | | | SCNY | | | | Sell | | | | 17,972,751 | | | | 20,144,776 | | | | | | 6/05/20 | | | | — | | | | (210,434 | ) |
Japanese Yen | | | HSBK | | | | Buy | | | | 1,385,935,690 | | | | 13,139,372 | | | | | | 6/08/20 | | | | — | | | | (269,733 | ) |
Japanese Yen | | | HSBK | | | | Sell | | | | 1,385,935,690 | | | | 13,288,611 | | | | | | 6/08/20 | | | | 418,972 | | | | — | |
Japanese Yen | | | JPHQ | | | | Buy | | | | 1,316,291,430 | | | | 12,493,638 | | | | | | 6/08/20 | | | | — | | | | (270,708 | ) |
Japanese Yen | | | JPHQ | | | | Sell | | | | 1,316,291,430 | | | | 12,591,391 | | | | | | 6/08/20 | | | | 368,461 | | | | — | |
Australian Dollar | | | HSBK | | | | Sell | | | | 29,370,000 | | | | 2,163,795,505 | | | JPY | | | 6/12/20 | | | | — | | | | (588,710 | ) |
Australian Dollar | | | JPHQ | | | | Sell | | | | 44,900,000 | | | | 3,317,676,979 | | | JPY | | | 6/12/20 | | | | — | | | | (809,636 | ) |
Euro | | | JPHQ | | | | Sell | | | | 6,775,311 | | | | 7,873,725 | | | | | | 6/15/20 | | | | 195,491 | | | | — | |
Norwegian Krone | | | JPHQ | | | | Buy | | | | 199,051,400 | | | | 21,751,993 | | | | | | 6/15/20 | | | | 931,145 | | | | — | |
Swedish Krona | | | DBAB | | | | Buy | | | | 208,032,300 | | | | 19,454,271 | | | EUR | | | 6/15/20 | | | | 340,105 | | | | — | |
Swedish Krona | | | DBAB | | | | Buy | | | | 208,032,400 | | | | 19,823,937 | | | EUR | | | 6/15/20 | | | | — | | | | (78,816 | ) |
Norwegian Krone | | | JPHQ | | | | Buy | | | | 197,840,000 | | | | 21,751,989 | | | | | | 6/16/20 | | | | 793,105 | | | | — | |
Mexican Peso | | | CITI | | | | Sell | | | | 539,656,000 | | | | 26,544,132 | | | | | | 6/17/20 | | | | — | | | | (1,272,678 | ) |
Norwegian Krone | | | JPHQ | | | | Buy | | | | 202,667,400 | | | | 22,486,869 | | | | | | 6/19/20 | | | | 608,348 | | | | — | |
Japanese Yen | | | JPHQ | | | | Buy | | | | 1,776,469,130 | | | | 16,798,461 | | | | | | 6/22/20 | | | | — | | | | (289,353 | ) |
Japanese Yen | | | JPHQ | | | | Buy | | | | 2,360,520,000 | | | | 21,781,741 | | | | | | 6/22/20 | | | | 155,076 | | | | — | |
Japanese Yen | | | JPHQ | | | | Sell | | | | 1,776,469,130 | | | | 17,004,749 | | | | | | 6/22/20 | | | | 495,641 | | | | — | |
Japanese Yen | | | BNDP | | | | Buy | | | | 4,489,315,360 | | | | 42,878,248 | | | | | | 6/24/20 | | | | — | | | | (1,153,375 | ) |
Euro | | | CITI | | | | Sell | | | | 22,979,200 | | | | 2,707,404,380 | | | JPY | | | 6/30/20 | | | | — | | | | (894,117 | ) |
Euro | | | UBSW | | | | Buy | | | | 1,922,305 | | | | 2,166,765 | | | | | | 7/23/20 | | | | 16,889 | | | | — | |
Euro | | | UBSW | | | | Sell | | | | 1,922,305 | | | | 2,182,681 | | | | | | 7/23/20 | | | | — | | | | (972 | ) |
Swiss Franc | | | UBSW | | | | Buy | | | | 17,378,212 | | | | 15,841,579 | | | EUR | | | 8/10/20 | | | | 229,551 | | | | — | |
FRANKLIN TEMPLETON VARIABLE INSURANCE PRODUCTS TRUST
STATEMENT OF INVESTMENTS
Templeton Global Bond VIP Fund(continued)
Forward Exchange Contracts(continued)
| | | | | | | | | | | | | | | | | | | | | | | | | | | | | | |
| Currency | | Counterpartya | | | Type | | | Quantity | | | Contract Amount* | | | | | Settlement
Date | | | Unrealized
Appreciation | | | Unrealized
Depreciation | |
| | | | | | | |
OTC Forward Exchange Contracts(continued) | | | | | | | | | | | | | | | | | | | | | | | | | | | |
Swiss Franc | | | GSCO | | | | Buy | | | | 17,055,038 | | | | 15,552,652 | | | EUR | | | 8/12/20 | | | $ | 219,125 | | | $ | — | |
Australian Dollar | | | JPHQ | | | | Sell | | | | 30,315,000 | | | | 2,154,483,985 | | | JPY | | | 8/21/20 | | | | — | | | | (1,293,352 | ) |
Australian Dollar | | | CITI | | | | Sell | | | | 35,607,467 | | | | 2,527,369,963 | | | JPY | | | 8/24/20 | | | | — | | | | (1,547,053 | ) |
Australian Dollar | | | JPHQ | | | | Sell | | | | 52,305,500 | | | | 3,724,936,182 | | | JPY | | | 8/24/20 | | | | — | | | | (2,157,243 | ) |
Euro | | | HSBK | | | | Sell | | | | 25,253,559 | | | | 2,984,142,320 | | | JPY | | | 8/24/20 | | | | — | | | | (913,204 | ) |
Japanese Yen | | | CITI | | | | Buy | | | | 2,796,566,000 | | | | 27,059,295 | | | | | | 8/31/20 | | | | — | | | | (967,271 | ) |
Norwegian Krone | | | JPHQ | | | | Buy | | | | 177,591,200 | | | | 19,683,519 | | | | | | 9/21/20 | | | | 549,242 | | | | — | |
Euro | | | CITI | | | | Sell | | | | 45,958,400 | | | | 5,496,240,519 | | | JPY | | | 9/30/20 | | | | — | | | | (1,064,370 | ) |
Euro | | | GSCO | | | | Buy | | | | 17,044,025 | | | | 19,273,383 | | | | | | 10/05/20 | | | | 177,689 | | | | — | |
Euro | | | GSCO | | | | Sell | | | | 17,044,025 | | | | 19,070,900 | | | | | | 10/05/20 | | | | — | | | | (380,172 | ) |
Mexican Peso | | | CITI | | | | Sell | | | | 161,485,000 | | | | 7,836,491 | | | | | | 10/08/20 | | | | — | | | | (353,608 | ) |
Mexican Peso | | | CITI | | | | Sell | | | | 121,288,000 | | | | 5,877,353 | | | | | | 10/09/20 | | | | — | | | | (273,221 | ) |
Euro | | | HSBK | | | | Sell | | | | 33,800,018 | | | | 37,982,433 | | | | | | 10/13/20 | | | | — | | | | (610,413 | ) |
Mexican Peso | | | CITI | | | | Sell | | | | 404,375,000 | | | | 19,555,619 | | | | | | 10/13/20 | | | | — | | | | (939,283 | ) |
Mexican Peso | | | CITI | | | | Sell | | | | 595,223,000 | | | | 28,888,991 | | | | | | 10/15/20 | | | | — | | | | (1,270,439 | ) |
Euro | | | BOFA | | | | Sell | | | | 5,251,819 | | | | 5,944,009 | | | | | | 10/16/20 | | | | — | | | | (53,647 | ) |
Euro | | | HSBK | | | | Sell | | | | 8,692,000 | | | | 9,833,042 | | | | | | 10/16/20 | | | | — | | | | (93,352 | ) |
Mexican Peso | | | CITI | | | | Sell | | | | 545,017,000 | | | | 26,695,974 | | | | | | 10/16/20 | | | | — | | | | (915,808 | ) |
Swiss Franc | | | UBSW | | | | Buy | | | | 17,378,212 | | | | 15,853,718 | | | EUR | | | 11/09/20 | | | | 229,864 | | | | — | |
Swiss Franc | | | GSCO | | | | Buy | | | | 17,055,038 | | | | 15,564,006 | | | EUR | | | 11/12/20 | | | | 220,221 | | | | — | |
| | | | | | | | | | | | | | | | | | | | | | | | | | |
| | | | | | | |
Total Forward Exchange Contracts | | | | | | | | | | | | | | | | | | | | | $ | 19,229,919 | | | $ | (55,309,610 | ) |
| | | | | | | | | | | | | | | | | | | | | | | | | | |
| | | | | | | |
Net unrealized appreciation (depreciation) | | | | | | | | | | | | | | | | | | | | | | | | | $ | (36,079,691 | ) |
| | | | | | | | | | | | | | | | | | | | | | | | | | | | | | |
*In U.S. dollars unless otherwise indicated.
aMay be comprised of multiple contracts with the same counterparty, currency and settlement date.
At December 31, 2019, the Fund had the following interest rate swap contracts outstanding. See Note 1(c).
Interest Rate Swap Contracts
| | | | | | | | | | | | | | | | |
| Description | | Payment
Frequency | | | Maturity
Date | | | Notional
Amount | | | Value/
Unrealized
Appreciation
(Depreciation) | |
| | | | |
Centrally Cleared Swap Contracts | | | | | | | | | | | | | | | | |
| | | | |
Receive Floating3-month USD LIBOR | | | Quarterly | | | | | | | | | | | | | |
| | | | |
Pay Fixed 2.378% | | | Semi-Annual | | | | 11/18/46 | | | $ | 122,400,000 | | | $ | (7,546,995 | ) |
| | | | |
Receive Floating3-month USD LIBOR | | | Quarterly | | | | | | | | | | | | | |
| | | | |
Pay Fixed 2.537% | | | Semi-Annual | | | | 4/13/47 | | | | 72,700,000 | | | | (7,043,492 | ) |
| | | | |
Receive Floating3-month USD LIBOR | | | Quarterly | | | | | | | | | | | | | |
| | | | |
Pay Fixed 2.587% | | | Semi-Annual | | | | 7/27/47 | | | | 36,700,000 | | | | (4,218,306 | ) |
| | | | |
Receive Floating3-month USD LIBOR | | | Quarterly | | | | | | | | | | | | | |
| | | | |
Pay Fixed 2.980% | | | Semi-Annual | | | | 2/20/48 | | | | 15,638,000 | | | | (3,188,070 | ) |
| | | | |
Receive Floating3-month USD LIBOR | | | Quarterly | | | | | | | | | | | | | |
| | | | |
Pay Fixed 3.002% | | | Semi-Annual | | | | 2/22/48 | | | | 15,638,000 | | | | (3,265,695 | ) |
| | | | |
Receive Floating3-month USD LIBOR | | | Quarterly | | | | | | | | | | | | | |
FRANKLIN TEMPLETON VARIABLE INSURANCE PRODUCTS TRUST
STATEMENT OF INVESTMENTS
Templeton Global Bond VIP Fund(continued)
Interest Rate Swap Contracts(continued)
| | | | | | | | | | | | | | | | |
| Description | | Payment
Frequency | | | Maturity
Date | | | Notional
Amount | | | Value/
Unrealized
Appreciation
(Depreciation) | |
| | | | |
Centrally Cleared Swap Contracts(continued) | | | | | | | | | | | | | | | | |
Pay Fixed 3.019% | | | Semi-Annual | | | | 2/23/48 | | | $ | 15,638,000 | | | | $ (3,325,652 | ) |
| | | | |
Total Interest Rate Swap Contracts | | | | | | | | | | | | | | | $(28,588,210 | ) |
See Note 9 regarding other derivative information.
See Abbreviations on pageTGB-41.
| | | | | | |
| | | |
TGB-24 | | Annual Report | The accompanying notes are an integral part of these financial statements. | | |
FRANKLIN TEMPLETON VARIABLE INSURANCE PRODUCTS TRUST
FINANCIAL STATEMENTS
Statement of Assets and Liabilities
December 31, 2019
| | | | |
| | | Templeton Global Bond VIP Fund | |
| |
Assets: | | | | |
Investments in securities: | | | | |
Cost - Unaffiliated issuers | | | $2,262,976,218 | |
Cost -Non-controlled affiliates (Note 3e) | | | 691,092,548 | |
| | | | |
| |
Value - Unaffiliated issuers | | | $2,041,375,920 | |
Value -Non-controlled affiliates (Note 3e) | | | 691,092,548 | |
Cash | | | 4,228,331 | |
Restricted cash for OTC derivative contracts (Note 1d) | | | 338,000 | |
Restricted currency, at value (cost $8,561,188) (Note 1e) | | | 8,460,563 | |
Foreign currency, at value (cost $584,333) | | | 584,945 | |
Receivables: | | | | |
Capital shares sold | | | 2,187,485 | |
Interest | | | 26,637,260 | |
Affiliates | | | 3,311 | |
Deposits with brokers for: | | | | |
OTC derivative contracts | | | 44,250,000 | |
Centrally cleared swap contracts | | | 35,603,884 | |
Variation margin on centrally cleared swap contracts | | | 3,043,102 | |
Unrealized appreciation on OTC forward exchange contracts | | | 19,229,919 | |
Other assets | | | 357 | |
| | | | |
Total assets | | | 2,877,035,625 | |
| | | | |
| |
Liabilities: | | | | |
Payables: | | | | |
Capital shares redeemed | | | 1,355,574 | |
Management fees | | | 872,939 | |
Distribution fees | | | 530,725 | |
Deposits from brokers for: | | | | |
OTC derivative contracts | | | 338,000 | |
Options written, at value (premiums received $18,573,066) | | | 13,186,703 | |
Unrealized depreciation on OTC forward exchange contracts | | | 55,309,610 | |
Deferred tax | | | 1,080,755 | |
Accrued expenses and other liabilities | | | 1,684,813 | |
| | | | |
| |
Total liabilities | | | 74,359,119 | |
| | | | |
| |
Net assets, at value | | | $2,802,676,506 | |
| | | | |
| |
Net assets consist of: | | | | |
Paid-in capital | | | $2,936,200,505 | |
Total distributable earnings (losses) | | | (133,523,999 | ) |
| | | | |
| |
Net assets, at value | | | $2,802,676,506 | |
| | | | |
| | | | |
| | | |
| | The accompanying notes are an integral part of these financial statements. | Annual Report | | TGB-25 |
FRANKLIN TEMPLETON VARIABLE INSURANCE PRODUCTS TRUST
FINANCIAL STATEMENTS
Statement of Assets and Liabilities(continued)
December 31, 2019
| | | | |
| | | Templeton Global Bond VIP Fund | |
| |
Class 1: | | | | |
| |
Net assets, at value | | | $ 322,794,357 | |
| | | | |
Shares outstanding | | | 19,408,120 | |
| | | | |
Net asset value and maximum offering price per share | | | $16.63 | |
| | | | |
| |
Class 2: | | | | |
| |
Net assets, at value | | | $2,389,609,852 | |
| | | | |
Shares outstanding | | | 150,200,845 | |
| | | | |
Net asset value and maximum offering price per share | | | $15.91 | |
| | | | |
| |
Class 4: | | | | |
| |
Net assets, at value | | | $ 90,272,297 | |
| | | | |
Shares outstanding | | | 5,547,129 | |
| | | | |
Net asset value and maximum offering price per share | | | $16.27 | |
| | | | |
| | | | |
| | | |
TGB-26 | | Annual Report | The accompanying notes are an integral part of these financial statements. | | |
FRANKLIN TEMPLETON VARIABLE INSURANCE PRODUCTS TRUST
FINANCIAL STATEMENTS
Statement of Operations
for the year ended December 31, 2019
| | | | |
| | | Templeton
Global Bond VIP Fund | |
| |
Investment income: | | | | |
Dividends: | | | | |
Non-controlled affiliates (Note 3e) | | $ | 13,662,877 | |
Interest: (net of foreign taxes)~ | | | | |
Unaffiliated issuers | | | 148,767,579 | |
| | | | |
| |
Total investment income | | | 162,430,456 | |
| | | | |
| |
Expenses: | | | | |
Management fees (Note 3a) | | | 13,216,398 | |
Distribution fees: (Note 3c) | | | | |
Class 2 | | | 6,202,773 | |
Class 4 | | | 321,517 | |
Custodian fees (Note 4) | | | 975,950 | |
Reports to shareholders | | | 321,729 | |
Professional fees | | | 91,604 | |
Trustees’ fees and expenses | | | 17,334 | |
Other | | | 390,060 | |
| | | | |
| |
Total expenses | | | 21,537,365 | |
Expense reductions (Note 4) | | | (473,116 | ) |
Expenses waived/paid by affiliates (Note 3e) | | | (2,582,188 | ) |
| | | | |
| |
Net expenses | | | 18,482,061 | |
| | | | |
Net investment income | | | 143,948,395 | |
| | | | |
| |
Realized and unrealized gains (losses): | | | | |
Net realized gain (loss) from: | | | | |
Investments:# | | | | |
Unaffiliated issuers | | | (27,018,737 | ) |
Written options | | | 6,474,760 | |
Foreign currency transactions | | | (3,592,489 | ) |
Forward exchange contracts | | | 103,625,245 | |
Swap contracts | | | (38,566,387 | ) |
| | | | |
| |
Net realized gain (loss) | | | 40,922,392 | |
| | | | |
| |
Net change in unrealized appreciation (depreciation) on: | | | | |
Investments: | | | | |
Unaffiliated issuers | | | (54,652,582 | ) |
Translation of other assets and liabilities denominated in foreign currencies | | | 188,524 | |
Forward exchange contracts | | | (40,855,477 | ) |
Written options | | | 5,386,363 | |
Swap contracts | | | (47,284,879 | ) |
Change in deferred taxes on unrealized appreciation | | | 797,356 | |
| | | | |
| |
Net change in unrealized appreciation (depreciation) | | | (136,420,695 | ) |
| | | | |
Net realized and unrealized gain (loss) | | | (95,498,303 | ) |
| | | | |
Net increase (decrease) in net assets resulting from operations | | $ | 48,450,092 | |
| | | | |
| | | | |
~Foreign taxes withheld on interest | | $ | 3,599,403 | |
#Net of foreign taxes | | $ | 356,110 | |
| | | | |
| | | |
| | The accompanying notes are an integral part of these financial statements. | Annual Report | | TGB-27 |
FRANKLIN TEMPLETON VARIABLE INSURANCE PRODUCTS TRUST
FINANCIAL STATEMENTS
Statements of Changes in Net Assets
| | | | | | | | |
| | | Templeton Global Bond VIP Fund | |
| | | | |
| | | Year Ended December 31, | |
| | | | |
| | | 2019 | | | 2018 | |
| |
| | |
Increase (decrease) in net assets: | | | | | | | | |
Operations: | | | | | | | | |
Net investment income | | $ | 143,948,395 | | | $ | 148,925,933 | |
Net realized gain (loss) | | | 40,922,392 | | | | 29,395,004 | |
Net change in unrealized appreciation (depreciation) | | | (136,420,695 | ) | | | (118,382,692 | ) |
| | | | |
| | |
Net increase (decrease) in net assets resulting from operations | | | 48,450,092 | | | | 59,938,245 | |
| | | | |
Distributions to shareholders: | | | | | | | | |
Class 1 | | | (22,427,340 | ) | | | — | |
Class 2 | | | (175,601,316 | ) | | | — | |
Class 4 | | | (6,224,019 | ) | | | — | |
| | | | |
| | |
Total distributions to shareholders | | | (204,252,675 | ) | | | — | |
| | | | |
Capital share transactions: (Note 2) | | | | | | | | |
Class 1 | | | 55,417,128 | | | | (7,760,972 | ) |
Class 2 | | | (21,954,185 | ) | | | (237,044,140 | ) |
Class 4 | | | 758,324 | | | | (6,392,585 | ) |
| | | | |
| | |
Total capital share transactions | | | 34,221,267 | | | | (251,197,697 | ) |
| | | | |
Net increase (decrease) in net assets | | | (121,581,316 | ) | | | (191,259,452 | ) |
| | |
Net assets: | | | | | | | | |
Beginning of year | | | 2,924,257,822 | | | | 3,115,517,274 | |
| | | | |
| | |
End of year | | $ | 2,802,676,506 | | | $ | 2,924,257,822 | |
| | | | |
| | | | |
| | | |
TGB-28 | | Annual Report | The accompanying notes are an integral part of these financial statements. | | |
FRANKLIN TEMPLETON VARIABLE INSURANCE PRODUCTS TRUST
Notes to Financial Statements
Templeton Global Bond VIP Fund
1. Organization and Significant Accounting Policies
Franklin Templeton Variable Insurance Products Trust (Trust) is registered under the Investment Company Act of 1940 (1940 Act) as anopen-end management investment company, consisting of eighteen separate funds and applies the specialized accounting and reporting guidance in U.S. Generally Accepted Accounting Principles (U.S. GAAP). Templeton Global Bond VIP Fund (Fund) is included in this report. Shares of the Fund are generally sold only to insurance company separate accounts to fund the benefits of variable life insurance policies or variable annuity contracts. The Fund offers three classes of shares: Class 1, Class 2 and Class 4. Each class of shares may differ by its distribution fees, voting rights on matters affecting a single class and its exchange privilege.
The following summarizes the Fund’s significant accounting policies.
a. Financial Instrument Valuation
The Fund’s investments in financial instruments are carried at fair value daily. Fair value is the price that would be received to sell an asset or paid to transfer a liability in an orderly transaction between market participants on the measurement date. The Fund calculates the net asset value (NAV) per share each business day as of 4 p.m. Eastern time or the regularly scheduled close of the New York Stock Exchange (NYSE), whichever is earlier. Under compliance policies and procedures approved by the Trust’s Board of Trustees (the Board), the Fund’s administrator has responsibility for oversight of valuation, including leading the cross-functional Valuation Committee (VC). The Fund may utilize independent pricing services, quotations from securities and financial instrument dealers, and other market sources to determine fair value.
Debt securities generally trade in theover-the-counter (OTC) market rather than on a securities exchange. The Fund’s pricing services use multiple valuation techniques to determine fair value. In instances where sufficient market activity exists, the pricing services may utilize a market-based approach through which quotes from market makers are used to determine fair value. In instances where sufficient market activity may not exist or is limited, the pricing services also utilize proprietary valuation models which may consider market characteristics such as benchmark yield curves, credit spreads, estimated default rates, anticipated market interest rate volatility, coupon rates, anticipated timing of principal
repayments, underlying collateral, and other unique security features in order to estimate the relevant cash flows, which are then discounted to calculate the fair value. Securities denominated in a foreign currency are converted into their U.S. dollar equivalent at the foreign exchange rate in effect at 4 p.m. Eastern time on the date that the values of the foreign debt securities are determined.
Investments inopen-end mutual funds are valued at the closing NAV.
Certain derivative financial instruments are centrally cleared or trade in the OTC market. The Fund’s pricing services use various techniques including industry standard option pricing models and proprietary discounted cash flow models to determine the fair value of those instruments. The Fund’s net benefit or obligation under the derivative contract, as measured by the fair value of the contract, is included in net assets.
The Fund has procedures to determine the fair value of financial instruments for which market prices are not reliable or readily available. Under these procedures, the Fund primarily employs a market-based approach which may use related or comparable assets or liabilities, recent transactions, market multiples, book values, and other relevant information for the investment to determine the fair value of the investment. An income-based valuation approach may also be used in which the anticipated future cash flows of the investment are discounted to calculate fair value. Discounts may also be applied due to the nature or duration of any restrictions on the disposition of the investments. Due to the inherent uncertainty of valuations of such investments, the fair values may differ significantly from the values that would have been used had an active market existed.
b. Foreign Currency Translation
Portfolio securities and other assets and liabilities denominated in foreign currencies are translated into U.S. dollars based on the exchange rate of such currencies against U.S. dollars on the date of valuation. The Fund may enter into foreign currency exchange contracts to facilitate transactions denominated in a foreign currency. Purchases and sales of securities, income and expense items denominated in foreign currencies are translated into U.S. dollars at the exchange rate in effect on the transaction date. Portfolio securities and assets and liabilities denominated in foreign currencies contain risks that those currencies will decline in value relative to the U.S. dollar. Occasionally,
FRANKLIN TEMPLETON VARIABLE INSURANCE PRODUCTS TRUST
FINANCIAL STATEMENTS
Templeton Global Bond VIP Fund(continued)
1. Organization and Significant Accounting Policies(continued)
b. Foreign Currency Translation(continued)
events may impact the availability or reliability of foreign exchange rates used to convert the U.S. dollar equivalent value. If such an event occurs, the foreign exchange rate will be valued at fair value using procedures established and approved by the Board.
The Fund does not separately report the effect of changes in foreign exchange rates from changes in market prices on securities held. Such changes are included in net realized and unrealized gain or loss from investments in the Statement of Operations.
Realized foreign exchange gains or losses arise from sales of foreign currencies, currency gains or losses realized between the trade and settlement dates on securities transactions and the difference between the recorded amounts of dividends, interest, and foreign withholding taxes and the U.S. dollar equivalent of the amounts actually received or paid. Net unrealized foreign exchange gains and losses arise from changes in foreign exchange rates on foreign denominated assets and liabilities other than investments in securities held at the end of the reporting period.
c. Derivative Financial Instruments
The Fund invested in derivative financial instruments in order to manage risk or gain exposure to various other investments or markets. Derivatives are financial contracts based on an underlying or notional amount, require no initial investment or an initial net investment that is smaller than would normally be required to have a similar response to changes in market factors, and require or permit net settlement. Derivatives contain various risks including the potential inability of the counterparty to fulfill their obligations under the terms of the contract, the potential for an illiquid secondary market, and/or the potential for market movements which expose the Fund to gains or losses in excess of the amounts shown in the Statement of Assets and Liabilities. Realized gain and loss and unrealized appreciation and depreciation on these contracts for the period are included in the Statement of Operations.
Derivative counterparty credit risk is managed through a formal evaluation of the creditworthiness of all potential counterparties. The Fund attempts to reduce its exposure to counterparty credit risk on OTC derivatives, whenever
possible, by entering into International Swaps and Derivatives Association (ISDA) master agreements with certain counterparties. These agreements contain various provisions, including but not limited to collateral requirements, events of default, or early termination. Termination events applicable to the counterparty include certain deteriorations in the credit quality of the counterparty. Termination events applicable to the Fund include failure of the Fund to maintain certain net asset levels and/or limit the decline in net assets over various periods of time. In the event of default or early termination, the ISDA master agreement gives thenon-defaulting party the right to net andclose-out all transactions traded, whether or not arising under the ISDA agreement, to one net amount payable by one counterparty to the other. However, absent an event of default or early termination, OTC derivative assets and liabilities are presented gross and not offset in the Statement of Assets and Liabilities. Early termination by the counterparty may result in an immediate payment by the Fund of any net liability owed to that counterparty under the ISDA agreement.
Collateral requirements differ by type of derivative. Collateral or initial margin requirements are set by the broker or exchange clearing house for exchange traded and centrally cleared derivatives. Initial margin deposited is held at the exchange and can be in the form of cash and/or securities. For OTC derivatives traded under an ISDA master agreement, posting of collateral is required by either the Fund or the applicable counterparty if the total net exposure of all OTC derivatives with the applicable counterparty exceeds the minimum transfer amount, which typically ranges from $100,000 to $250,000, and can vary depending on the counterparty and the type of the agreement. Generally, collateral is determined at the close of Fund business each day and any additional collateral required due to changes in derivative values may be delivered by the Fund or the counterparty the next business day, or within a few business days. Collateral pledged and/or received by the Fund for OTC derivatives, if any, is held in segregated accounts with the Fund’s custodian/counterparty broker and can be in the form of cash and/or securities. Unrestricted cash may be invested according to the Fund’s investment objectives. To the extent that the amounts due to the Fund from its counterparties are not subject to collateralization or are not fully collateralized, the Fund bears the risk of loss from counterpartynon-performance.
FRANKLIN TEMPLETON VARIABLE INSURANCE PRODUCTS TRUST
FINANCIAL STATEMENTS
Templeton Global Bond VIP Fund(continued)
The Fund entered into OTC forward exchange contracts primarily to manage and/or gain exposure to certain foreign currencies. A forward exchange contract is an agreement between the Fund and a counterparty to buy or sell a foreign currency at a specific exchange rate on a future date.
The Fund entered into interest rate swap contracts primarily to manage interest rate risk. An interest rate swap is an agreement between the Fund and a counterparty to exchange cash flows based on the difference between two interest rates, applied to a notional amount. These agreements may be privately negotiated in theover-the-counter market (OTC interest rate swaps) or may be executed on a registered exchange (centrally cleared interest rate swaps). For centrally cleared interest rate swaps, required initial margins are pledged by the Fund, and the daily change in fair value is accounted for as a variation margin payable or receivable in the Statement of Assets and Liabilities. Over the term of the contract, contractually required payments to be paid and to be received are accrued daily and recorded as unrealized depreciation and appreciation until the payments are made, at which time they are realized.
The Fund purchased or wrote OTC option contracts primarily to manage and/or gain exposure to foreign exchange rate risk. An option is a contract entitling the holder to purchase or sell a specific amount of shares or units of an asset or notional amount of a swap (swaption), at a specified price. When an option is purchased or written, an amount equal to the premium paid or received is recorded as an asset or liability, respectively. Upon exercise of an option, the acquisition cost or sales proceeds of the underlying investment is adjusted by any premium received or paid. Upon expiration of an option, any premium received or paid is recorded as a realized gain or loss. Upon closing an option other than through expiration or exercise, the difference between the premium received or paid and the cost to close the position is recorded as a realized gain or loss.
The Fund invested in value recovery instruments (VRI) primarily to gain exposure to economic growth. Periodic payments from VRI are dependent on established benchmarks for underlying variables. VRI has a notional amount, which is used to calculate amounts of payments to holders. Payments are recorded upon receipt as realized
gains in the Statement of Operations. The risks of investing in VRI include growth risk, liquidity, and the potential loss of investment.
See Note 9 regarding other derivative information.
d. Restricted Cash
At December 31, 2019, the Fund held restricted cash in connection with investments in certain derivative securities. Restricted cash is held in a segregated account with the Fund’s custodian and is reflected in the Statement of Assets and Liabilities.
e. Restricted Currency
At December 31, 2019, the Fund held currencies in certain markets in which the ability to repatriate such currency is limited. As a result of such limitations on repatriation, the Fund may incur substantial delays in gaining access to these assets and may be exposed to potential adverse movements in currency value.
f. Income and Deferred Taxes
It is the Fund’s policy to qualify as a regulated investment company under the Internal Revenue Code. The Fund intends to distribute to shareholders substantially all of its taxable income and net realized gains to relieve it from federal income and if applicable, excise taxes. As a result, no provision for U.S. federal income taxes is required.
The Fund may be subject to foreign taxation related to income received, capital gains on the sale of securities and certain foreign currency transactions in the foreign jurisdictions in which it invests. Foreign taxes, if any, are recorded based on the tax regulations and rates that exist in the foreign markets in which the Fund invests. When a capital gain tax is determined to apply, the Fund records an estimated deferred tax liability in an amount that would be payable if the securities were disposed of on the valuation date.
The Fund may recognize an income tax liability related to its uncertain tax positions under U.S. GAAP when the uncertain tax position has a less than 50% probability that it will be sustained upon examination by the tax authorities based on its technical merits. As of December 31, 2019, the Fund has determined that no tax liability is required in its financial statements related to uncertain tax positions for any open tax years (or expected to be taken in future tax years). Open tax
FRANKLIN TEMPLETON VARIABLE INSURANCE PRODUCTS TRUST
FINANCIAL STATEMENTS
Templeton Global Bond VIP Fund(continued)
1. Organization and Significant Accounting Policies(continued)
f. Income and Deferred Taxes(continued)
years are those that remain subject to examination and are based on the statute of limitations in each jurisdiction in which the Fund invests.
g. Security Transactions, Investment Income, Expenses and Distributions
Security transactions are accounted for on trade date. Realized gains and losses on security transactions are determined on a specific identification basis. Interest income and estimated expenses are accrued daily. Amortization of premium and accretion of discount on debt securities are included in interest income. Dividend income is recorded on theex-dividend date. Distributions to shareholders are recorded on theex-dividend date. Distributable earnings are determined according to income tax regulations (tax basis) and may differ from earnings recorded in accordance with U.S. GAAP. These differences may be permanent or temporary. Permanent differences are reclassified among capital accounts to reflect their tax character. These reclassifications have no impact on net assets or the results of operations. Temporary differences are not reclassified, as they may reverse in subsequent periods.
Common expenses incurred by the Trust are allocated among the Funds based on the ratio of net assets of each Fund to the combined net assets of the Trust or based on the ratio of number of shareholders of each Fund to the combined number of shareholders of the Trust. Fund specific expenses are charged directly to the Fund that incurred the expense.
Realized and unrealized gains and losses and net investment income, excluding class specific expenses, are allocated daily to each class of shares based upon the relative proportion of
net assets of each class. Differences in per share distributions by class are generally due to differences in class specific expenses.
Inflation-indexed bonds are adjusted for inflation through periodic increases or decreases in the security’s interest accruals, face amount, or principal redemption value, by amounts corresponding to the rate of inflation as measured by an index. Any increase or decrease in the face amount or principal redemption value will be included as interest income in the Statement of Operations.
h. Accounting Estimates
The preparation of financial statements in accordance with U.S. GAAP requires management to make estimates and assumptions that affect the reported amounts of assets and liabilities at the date of the financial statements and the amounts of income and expenses during the reporting period. Actual results could differ from those estimates.
i. Guarantees and Indemnifications
Under the Trust’s organizational documents, its officers and trustees are indemnified by the Trust against certain liabilities arising out of the performance of their duties to the Trust. Additionally, in the normal course of business, the Trust, on behalf of the Fund, enters into contracts with service providers that contain general indemnification clauses. The Trust’s maximum exposure under these arrangements is unknown as this would involve future claims that may be made against the Trust that have not yet occurred. Currently, the Trust expects the risk of loss to be remote.
FRANKLIN TEMPLETON VARIABLE INSURANCE PRODUCTS TRUST
FINANCIAL STATEMENTS
Templeton Global Bond VIP Fund(continued)
2. Shares of Beneficial Interest
At December 31, 2019, there were an unlimited number of shares authorized (without par value). Transactions in the Fund’s shares were as follows:
| | | | | | | | | | | | | | | | | | |
| | | Year Ended December 31, | |
| | |
| | | 2019 | | | 2018 | |
| | | | | |
| | | Shares | | | | | Amount | | | Shares | | | Amount | |
| | | | | |
Class 1 Shares: | | | | | | | | | | | | | | | | | | |
Shares sold | | | 5,087,795 | | | | | $ | 89,164,653 | | | | 3,298,930 | | | $ | 57,215,991 | |
Shares issued in reinvestment of distributions | | | 1,330,210 | | | | | | 22,427,340 | | | | — | | | | — | |
Shares redeemed | | | (3,257,868 | ) | | | | | (56,174,865 | ) | | | (3,741,198 | ) | | | (64,976,963) | |
| | | | |
| | | | | |
Net increase (decrease) | | | 3,160,137 | | | | | $ | 55,417,128 | | | | (442,268 | ) | | $ | (7,760,972) | |
| | | | |
| | | | | |
Class 2 Shares: | | | | | | | | | | | | | | | | | | |
Shares sold | | | 7,233,859 | | | | | $ | 119,112,193 | | | | 10,132,393 | | | $ | 169,096,447 | |
Shares issued in reinvestment of distributions | | | 10,873,146 | | | | | | 175,601,316 | | | | — | | | | — | |
Shares redeemed | | | (19,122,225 | ) | | | | | (316,667,694 | ) | | | (24,289,543 | ) | | | (406,140,587) | |
| | | | |
| | | | | |
Net increase (decrease) | | | (1,015,220 | ) | | | | $ | (21,954,185 | ) | | | (14,157,150 | ) | | $ | (237,044,140) | |
| | | | |
| | | | | |
Class 4 Shares: | | | | | | | | | | | | | | | | | | |
Shares sold | | | 692,994 | | | | | $ | 11,712,750 | | | | 816,409 | | | $ | 13,930,984 | |
Shares issued in reinvestment of distributions | | | 376,529 | | | | | | 6,224,019 | | | | — | | | | — | |
Shares redeemed | | | (1,010,027 | ) | | | | | (17,178,445 | ) | | | (1,191,456 | ) | | | (20,323,569) | |
| | | | |
| | | | | |
Net increase (decrease) | | | 59,496 | | | | | $ | 758,324 | | | | (375,047 | ) | | $ | (6,392,585) | |
| | | | |
3. Transactions with Affiliates
Franklin Resources, Inc. is the holding company for various subsidiaries that together are referred to as Franklin Templeton. Certain officers and trustees of the Fund are also officers and/or directors of the following subsidiaries:
| | |
| Subsidiary | | Affiliation |
| |
| Franklin Advisers, Inc. (Advisers) | | Investment manager |
| |
| Franklin Templeton Services, LLC (FT Services) | | Administrative manager |
| |
| Franklin Templeton Distributors, Inc. (Distributors) | | Principal underwriter |
| |
| Franklin Templeton Investor Services, LLC (Investor Services) | | Transfer agent |
FRANKLIN TEMPLETON VARIABLE INSURANCE PRODUCTS TRUST
FINANCIAL STATEMENTS
Templeton Global Bond VIP Fund(continued)
3. Transactions with Affiliates(continued)
a. Management Fees
The Fund pays an investment management fee to Advisers based on the average daily net assets of the Fund as follows:
| | |
| Annualized Fee Rate | | Net Assets |
0.625% | | Up to and including $100 million |
0.500% | | Over $100 million, up to and including $250 million |
0.450% | | Over $250 million, up to and including $7.5 billion |
0.440% | | Over $7.5 billion, up to and including $10 billion |
0.430% | | Over $10 billion, up to and including $12.5 billion |
0.420% | | Over $12.5 billion, up to and including $15 billion |
0.400% | | In excess of $15 billion |
For the year ended December 31, 2019, the gross effective investment management fee rate was 0.459% of the Fund’s average daily net assets.
b. Administrative Fees
Under an agreement with Advisers, FT Services provides administrative services to the Fund. The fee is paid by Advisers based on the Fund’s average daily net assets, and is not an additional expense of the Fund.
c. Distribution Fees
The Board has adopted distribution plans for Class 2 and Class 4 shares pursuant to Rule12b-1 under the 1940 Act. Under the Fund’s compensation distribution plans, the Fund pays Distributors for costs incurred in connection with the servicing, sale and distribution of the Fund’s shares up to 0.25% and 0.35% per year of its average daily net assets of Class 2 and Class 4, respectively. The plan year, for purposes of monitoring compliance with the maximum annual plan rates, is February 1 through January 31.
d. Transfer Agent Fees
Investor Services, under terms of an agreement, performs shareholder servicing for the Fund and is not paid by the Fund for the services.
e. Investments in Affiliated Management Investment Companies
The Fund invests in one or more affiliated management investment companies for purposes other than exercising a controlling influence over the management or policies. Management fees paid by the Fund are waived on assets invested in the affiliated management investment companies, as noted in the Statement of Operations, in an amount not to exceed the management and administrative fees paid directly or indirectly by each affiliate. During the year ended December 31, 2019, the Fund held investments in affiliated management investment companies as follows:
| | | | | | | | | | | | | | | | | | | | | | | | | | | | | | | | |
| | | Value at Beginning of Year | | | Purchases | | | Sales | | | Realized Gain (Loss) | | | Net Change in Unrealized Appreciation (Depreciation) | | | Value at End of Year | | | Number of Shares Held at End of Year | | | Dividend Income | |
Non-Controlled Affiliates | | | | | | | | | | | | | | | | | | | | | | | | | | | | | | | | |
Institutional Fiduciary Trust Money Market Portfolio, 1.26% | | $ | 663,563,266 | | | $ | 798,168,118 | | | $ | (770,638,836 | ) | | | $ — | | | | $ — | | | $ | 691,092,548 | | | | 691,092,548 | | | $ | 13,662,877 | |
| | | | | | | | | | | | |
FRANKLIN TEMPLETON VARIABLE INSURANCE PRODUCTS TRUST
FINANCIAL STATEMENTS
Templeton Global Bond VIP Fund(continued)
4. Expense Offset Arrangement
The Fund has entered into an arrangement with its custodian whereby credits realized as a result of uninvested cash balances are used to reduce a portion of the Fund’s custodian expenses. During the year ended December 31, 2019, the custodian fees were reduced as noted in the Statement of Operations.
5. Income Taxes
For tax purposes, capital losses may be carried over to offset future capital gains.
At December 31, 2019, the capital loss carryforwards were as follows:
| | | | |
Capital loss carryforwards not subject to expiration: | | | | |
Short term | | $ | 1,874,982 | |
Long term | | | 56,256,007 | |
| | | | |
| |
Total capital loss carryforwards | | $ | 58,130,989 | |
| | | | |
The tax character of distributions paid during the years ended December 31, 2019 and 2018, was as follows:
| | | | | | | | |
| | | 2019 | | | 2018 | |
| | |
Distributions paid from ordinary income | | $ | 204,252,675 | | | $ | — | |
| | | | |
At December 31, 2019, the cost of investments, net unrealized appreciation (depreciation) and undistributed ordinary income for income tax purposes were as follows:
| | | | |
Cost of investments | | $ | 2,934,655,844 | |
| | | | |
| |
Unrealized appreciation | | $ | 122,990,545 | |
Unrealized depreciation | | | (402,219,586 | ) |
| | | | |
| |
Net unrealized appreciation (depreciation) | | $ | (279,229,041 | ) |
| | | | |
| |
Distributable earnings-undistributed ordinary income | | $ | 205,698,317 | |
| | | | |
Differences between income and/or capital gains as determined on a book basis and a tax basis are primarily due to differing treatments of foreign currency transactions and tax straddles.
6. Investment Transactions
Purchases and sales of investments (excluding short term securities) for the year ended December 31, 2019, aggregated $960,302,670 and $367,338,225, respectively.
7. Credit Risk
At December 31, 2019, the Fund had 13.5% of its portfolio invested in high yield or other securities rated below investment grade and unrated securities, if any. These securities may be more sensitive to economic conditions causing greater price volatility and are potentially subject to a greater risk of loss due to default than higher rated securities.
FRANKLIN TEMPLETON VARIABLE INSURANCE PRODUCTS TRUST
FINANCIAL STATEMENTS
Templeton Global Bond VIP Fund(continued)
8. Concentration of Risk
Investments in issuers domiciled or with significant operations in developing or emerging market countries may be subject to higher risks than investments in developed countries. These risks include fluctuating currency values, underdeveloped legal or business systems, and changing local and regional economic, political and social conditions, which may result in greater market volatility. In addition, certain foreign securities may not be as liquid as U.S. securities. Currencies of developing or emerging market countries may be subject to significantly greater risks than currencies of developed countries, including the potential inability to repatriate those currencies into U.S. dollars.
At December 31, 2019, the Fund had 1.8% of its net assets denominated in Argentine Pesos, which has restricted currency repatriation since September 2019, and had restructured certain issues of its debt. Political and economic conditions in Argentina could continue to affect the value of the Fund’s holdings.
9. Other Derivative Information
At December 31, 2019, investments in derivative contracts are reflected in the Statement of Assets and Liabilities as follows:
| | | | | | | | | | | | | | | | |
| | | Asset Derivatives | | | | | | Liability Derivatives | |
| | | | | |
Derivative Contracts Not Accounted for as Hedging Instruments | | Statement of Assets and Liabilities Location | | Fair Value | | | | | | Statement of Assets and Liabilities Location | | Fair Value | |
| | | | | |
Interest rate contracts | | Variation margin on centrally cleared swap contracts | | $ | — | | | | | | | Variation margin on centrally cleared swap contracts | | $ | 28,588,210 | a |
| | | | | |
Foreign exchange contracts | | Investments in securities, at value | | | 7,123,962 | b | | | | | | Options written, at value | | | 13,186,703 | |
| | | | | |
| | Unrealized appreciation on OTC forward exchange contracts | | | 19,229,919 | | | | | | | Unrealized depreciation on OTC forward exchange contracts | | | 55,309,610 | |
| | | | | | | | | | | | | | | | |
Totals | | | | $ | 26,353,881 | | | | | | | | | $ | 97,084,523 | |
| | | | | | | | | | | | | | | | |
aThis amount reflects the cumulative appreciation (depreciation) of centrally cleared swap contracts as reported in the Statement of Investments. Only the variation margin receivable/payable at year end is separately reported within the Statement of Assets and Liabilities. Prior variation margin movements were recorded to cash upon receipt or payment.
bPurchased option contracts are included in investments in securities, at value in the Statement of Assets and Liabilities.
For the year ended December 31, 2019, the effect of derivative contracts in the Statement of Operations was as follows:
| | | | | | | | | | | | |
Derivative Contracts Not Accounted for as Hedging Instruments | | Statement of Operations Location | | Net Realized Gain (Loss) for the Year | | | Statement of Operations Location | | Net Change in Unrealized Appreciation (Depreciation) for the Year | |
| | | | |
| | Net realized gain (loss) from: | | | | | | Net change in unrealized appreciation (depreciation) on: | | | | |
| | | | |
Interest rate contracts | | Swap contracts | | $ | (38,566,387 | ) | | Swap contracts | | $ | (47,284,879 | ) |
| | | | |
Foreign exchange contracts | | Investments | | | (6,438,453 | )a | | Investments | | | (18,604,071 | )a |
| | | | |
| | Written options | | | 6,474,760 | | | Written options | | | 5,386,363 | |
| | | | |
| | Forward exchange contracts | | | 103,625,245 | | | Forward exchange contracts | | | (40,855,477 | ) |
| | | | |
Value recovery instruments | | Investments | | | 4,142,988 | a | | Investments | | | (3,416,727 | )a |
| | | | | | | | | | | | |
| | | | |
Totals | | | | $ | 69,238,153 | | | | | $ | (104,774,791 | ) |
| | | | | | | | | | | | |
aPurchased option contracts and VRI are included in net realized gain (loss) from investments and net change in unrealized appreciation (depreciation) on investments in the Statement of Operations.
FRANKLIN TEMPLETON VARIABLE INSURANCE PRODUCTS TRUST
FINANCIAL STATEMENTS
Templeton Global Bond VIP Fund(continued)
For the year ended December 31, 2019, the average month end notional amount of options and swap contracts, the average month end contract value for forward exchange contracts and average month end fair value of VRI, were as follows:
| | | | |
Options | | $ | 1,251,647,862 | |
Swap contracts | | $ | 624,427,846 | |
Forward exchange contracts | | $ | 3,393,437,312 | |
VRI | | $ | 3,866,835 | |
See Note 1(c) regarding derivative financial instruments.
At December 31, 2019, OTC derivative assets and liabilities are as follows:
| | | | | | | | |
| | | Gross Amounts of Assets and Liabilities Presented in the Statement of Assets and Liabilities | |
| | |
| | | Assetsa | | | Liabilitiesa | |
| | |
Derivatives | | | | | | | | |
| | |
Forward exchange contracts | | | $19,229,919 | | | | $55,309,610 | |
| | |
Options purchased | | | 7,123,962 | | | | — | |
| | |
Options written | | | — | | | | 13,186,703 | |
| | | | |
| | |
Total | | | $26,353,881 | | | | $68,496,313 | |
| | | | |
aAbsent an event of default or early termination, OTC derivative assets and liabilities are presented gross and not offset in the Statement of Assets and Liabilities.
At December 31, 2019, OTC derivative assets, which may be offset against OTC derivative liabilities and collateral received from the counterparty, are as follows:
| | | | | | | | | | | | | | | | | | | | | | |
| | | | | | | | Amounts Not Offset in the Statement of Assets and Liabilities | | | | |
| | | | | | |
| | | Gross Amounts of Assets Presented in the Statement of Assets and Liabilities | | | | | Financial
Instruments
Available for
Offset | | | Financial
Instruments
Collateral
Receiveda,b | | | Cash
Collateral
Receivedb | | | Net Amount
(Not less
than zero) | |
| | | | | | |
Counterparty | | | | | | | | | | | | | | | | | | | | | | |
BNDP | | $ | — | | | | | $ | — | | | $ | — | | | $ | — | | | $ | — | |
BOFA | | | 749,095 | | | | | | (749,095 | ) | | | — | | | | — | | | | — | |
BZWS | | | 337,716 | | | | | | (337,716 | ) | | | — | | | | — | | | | — | |
CITI | | | 8,283,830 | | | | | | (8,283,830 | ) | | | — | | | | — | | | | — | |
DBAB | | | 3,261,253 | | | | | | (2,952,355 | ) | | | — | | | | (308,898 | ) | | | — | |
GSCO | | | 1,313,319 | | | | | | (1,313,319 | ) | | | — | | | | — | | | | — | |
HSBK | | | 2,866,833 | | | | | | (2,866,833 | ) | | | — | | | | — | | | | — | |
JPHQ | | | 7,154,533 | | | | | | (7,154,533 | ) | | | — | | | | — | | | | — | |
MSCO | | | 988,588 | | | | | | (988,588 | ) | | | — | | | | — | | | | — | |
SCNY | | | 293,766 | | | | | | (293,766 | ) | | | — | | | | — | | | | — | |
UBSW | | | 1,104,948 | | | | | | (166,969 | ) | | | (912,419 | ) | | | — | | | | 25,560 | |
| | | | |
| | | | | | |
Total | | $ | 26,353,881 | | | | | $ | (25,107,004 | ) | | $ | (912,419 | ) | | $ | (308,898 | ) | | $ | 25,560 | |
| | | | |
FRANKLIN TEMPLETON VARIABLE INSURANCE PRODUCTS TRUST
FINANCIAL STATEMENTS
Templeton Global Bond VIP Fund(continued)
9. Other Derivative Information(continued)
At December 31, 2019, OTC derivative liabilities, which may be offset against OTC derivative assets and collateral pledged to the counterparty, are as follows:
| | | | | | | | | | | | | | | | | | | | |
| | | | | | Amounts Not Offset in the Statement of Assets and Liabilities | | | |
| | | Gross Amounts of Liabilities Presented in the Statement of Assets and Liabilities | | | Financial
Instruments
Available for
Offset | | | Financial
Instruments
Collateral
Pledged | | | Cash Collateral
Pledgedb | | | Net Amount (Not less than zero) |
| | | | | |
Counterparty | | | | | | | | | | | | | | | | | | | | |
BNDP | | $ | 2,202,472 | | | $ | — | | | $ | — | | | $ | (2,202,472 | ) | | $ | — | |
BOFA | | | 1,958,580 | | | | (749,095 | ) | | | — | | | | (1,110,000 | ) | | | 99,485 | |
BZWS | | | 532,712 | | | | (337,716 | ) | | | — | | | | — | | | | 194,996 | |
CITI | | | 27,548,305 | | | | (8,283,830 | ) | | | — | | | | (19,264,475 | ) | | | — | |
DBAB | | | 2,952,355 | | | | (2,952,355 | ) | | | — | | | | — | | | | — | |
GSCO | | | 1,363,668 | | | | (1,313,319 | ) | | | — | | | | — | | | | 50,349 | |
HSBK | | | 11,494,216 | | | | (2,866,833 | ) | | | — | | | | (7,890,000 | ) | | | 737,383 | |
JPHQ | | | 15,966,164 | | | | (7,154,533 | ) | | | — | | | | (8,811,631 | ) | | | — | |
MSCO | | | 2,033,544 | | | | (988,588 | ) | | | — | | | | (860,000 | ) | | | 184,956 | |
SCNY | | | 2,277,328 | | | | (293,766 | ) | | | — | | | | (1,950,000 | ) | | | 33,562 | |
UBSW | | | 166,969 | | | | (166,969 | ) | | | — | | | | — | | | | — | |
| | | | |
| | | | | |
Total | | $ | 68,496,313 | | | $ | (25,107,004 | ) | | $ | — | | | $ | (42,088,578 | ) | | $ | 1,300,731 | |
| | | | |
aAt December 31, 2019, the Fund received U.K. Treasury Bonds as collateral for derivatives.
bIn some instances, the collateral amounts disclosed in the table above were adjusted due to the requirement to limit collateral amounts to avoid the effect of overcollateralization. Actual collateral received and/or pledged may be more than the amounts disclosed herein.
See Abbreviations on pageTGB-41.
10. Credit Facility
The Fund, together with other U.S. registered and foreign investment funds (collectively, Borrowers), managed by Franklin Templeton, are borrowers in a joint syndicated senior unsecured credit facility totaling $2 billion (Global Credit Facility) which matured on February 7, 2020. This Global Credit Facility provides a source of funds to the Borrowers for temporary and emergency purposes, including the ability to meet future unanticipated or unusually large redemption requests. Effective February 7, 2020, the Borrowers renewed the Global Credit Facility for a one year term, maturing February 5, 2021, for a total of $2 billion.
Under the terms of the Global Credit Facility, the Fund shall, in addition to interest charged on any borrowings made by the Fund and other costs incurred by the Fund, pay its share of fees and expenses incurred in connection with the implementation and maintenance of the Global Credit Facility, based upon its relative share of the aggregate net assets of all of the Borrowers, including an annual commitment fee of 0.15% based upon the unused portion of the Global Credit Facility. These fees are reflected in other expenses in the Statement of Operations. During the year ended December 31, 2019, the Fund did not use the Global Credit Facility.
FRANKLIN TEMPLETON VARIABLE INSURANCE PRODUCTS TRUST
FINANCIAL STATEMENTS
Templeton Global Bond VIP Fund(continued)
11. Fair Value Measurements
The Fund follows a fair value hierarchy that distinguishes between market data obtained from independent sources (observable inputs) and the Fund’s own market assumptions (unobservable inputs). These inputs are used in determining the value of the Fund’s financial instruments and are summarized in the following fair value hierarchy:
| | • | | Level 1 – quoted prices in active markets for identical financial instruments |
| | • | | Level 2 – other significant observable inputs (including quoted prices for similar financial instruments, interest rates, prepayment speed, credit risk, etc.) |
| | • | | Level 3 – significant unobservable inputs (including the Fund’s own assumptions in determining the fair value of financial instruments) |
The input levels are not necessarily an indication of the risk or liquidity associated with financial instruments at that level.
A summary of inputs used as of December 31, 2019, in valuing the Fund’s assets and liabilities carried at fair value, is as follows:
| | | | | | | | | | | | | | | | |
| | | Level 1 | | | Level 2 | | | Level 3 | | | Total | |
| | | | |
Assets: | | | | | | | | | | | | | | | | |
Investments in Securities:a | | | | | | | | | | | | | | | | |
Foreign Government and Agency Securities: | | | | | | | | | | | | | | | | |
Argentina | | $ | — | | | $ | 4,737,123 | | | $ | 35,675,197 | | | $ | 40,412,320 | |
All Other Foreign Government and Agency Securities | | | — | | | | 1,462,336,152 | | | | — | | | | 1,462,336,152 | |
U.S. Government and Agency Securities | | | — | | | | 349,599,069 | | | | — | | | | 349,599,069 | |
Options Purchased | | | — | | | | 7,123,962 | | | | — | | | | 7,123,962 | |
Short Term Investments: | | | | | | | | | | | | | | | | |
Argentina | | | — | | | | — | | | | 3,394,233 | | | | 3,394,233 | |
All Other Short Term Investments | | | 691,092,548 | | | | 178,510,184 | | | | — | | | | 869,602,732 | |
| | | | |
Total Investments in Securities | | $ | 691,092,548 | | | $ | 2,002,306,490 | | | $ | 39,069,430 | | | $ | 2,732,468,468 | |
| | | | |
Other Financial Instruments: | | | | | | | | | | | | | | | | |
Forward Exchange Contracts | | $ | — | | | $ | 19,229,919 | | | $ | — | | | $ | 19,229,919 | |
Restricted Currency (ARS) | | | — | | | | — | | | | 8,460,563 | | | | 8,460,563 | |
| | | | |
Total Other Financial Instruments | | | — | | | | 19,229,919 | | | | 8,460,563 | | | | 27,690,482 | |
| | | | |
Receivables: | | | | | | | | | | | | | | | | |
Interest (ARS) | | $ | — | | | $ | — | | | $ | 1,601,869 | | | $ | 1,601,869 | |
Liabilities: | | | | | | | | | | | | | | | | |
Other Financial Instruments: | | | | | | | | | | | | | | | | |
Options Written | | $ | — | | | $ | 13,186,703 | | | $ | — | | | $ | 13,186,703 | |
Forward Exchange Contracts | | | — | | | | 55,309,610 | | | | — | | | | 55,309,610 | |
Swap Contracts | | | — | | | | 28,588,210 | | | | — | | | | 28,588,210 | |
| | | | |
Total Other Financial Instruments | | $ | — | | | $ | 97,084,523 | | | $ | — | | | $ | 97,084,523 | |
| | | | |
Payables: | | | | | | | | | | | | | | | | |
Deferred Tax (ARS) | | $ | — | | | $ | — | | | $ | 4,066 | | | $ | 4,066 | |
aFor detailed categories, see the accompanying Statement of Investments.
FRANKLIN TEMPLETON VARIABLE INSURANCE PRODUCTS TRUST
FINANCIAL STATEMENTS
Templeton Global Bond VIP Fund(continued)
11. Fair Value Measurements(continued)
A reconciliation of assets and/or liabilities in which Level 3 inputs are used in determining fair value is presented when there are significant Level 3 assets and/or liabilities at the beginning and/or end of the year. At December 31, 2019, the reconciliation of assets and/or liabilities, is as follows:
| | | | | | | | | | | | | | | | | | | | | | | | | | | | | | | | | | | | | | | | | | |
| | | Balance at Beginning of Year | | | Purchases | | | Sales | | | Transfer Into Level 3a | | | Transfer Out of Level 3 | | | Cost Basis Adjustmentsb | | | Net Realized Gain (Loss) | | | Net Unrealized Appreciation (Depreciation) | | | Balance at End of Year | | | Net Change in Unrealized Appreciation (Depreciation) on Assets Held at Year End | |
| |
| | | | | | | | | | | |
Asset: | | | | | | | | | | | | | | | | | | | | | | | | | | | | | | | | | | | | | | | | | | |
Investments in Securities: | | | | | | | | | | | | | | | | | | | | | | | | | | | | | | | | | | | | | | | | | | |
Foreign Government and Agency Securities Argentina | | | $— | | | $ | 1,661,146 | | | $ | — | | | $ | 32,311,758 | | | | $— | | | | $6,120,948 | | | $ | — | | | | $(4,418,655 | ) | | $ | 35,675,197 | | | | | $ | 1,811,665 | |
Short Term Investments: | | | | | | | | | | | | | | | | | | | | | | | | | | | | | | | | | | | | | | | | | | |
| | | | | | | | | | | |
Argentina | | | — | | | | 2,708,215 | | | | (272,318 | ) | | | 61,987 | | | | — | | | | 589,992 | | | | (368,640 | ) | | | 674,997 | | | | 3,394,233 | | | | | | 389,219 | |
| | | | |
| | | | | | | | | | | |
| Total Investment in Securities | | | $— | | | $ | 4,369,361 | | | $ | (272,318 | ) | | $ | 32,373,745 | | | | $— | | | | $6,710,940 | | | $ | (368,640 | ) | | | $(3,743,658 | ) | | $ | 39,069,430 | | | | | $ | 2,200,884 | |
| | | | |
| | | | | | | | | | | |
Other Financial Instruments: | | | | | | | | | | | | | | | | | | | | | | | | | | | | | | | | | | | | | | | | | | |
Restricted Currency (ARS) | | | $— | | | $ | 11,877,831 | | | $ | (4,435,314 | ) | | $ | 1,914,857 | | | | $— | | | | $ — | | | $ | (1,233,844 | ) | | | $ 337,033 | | | $ | 8,460,563 | | | | | $ | (100,625 | ) |
| | | | |
| | | | | | | | | | | |
Receivables: | | | | | | | | | | | | | | | | | | | | | | | | | | | | | | | | | | | | | | | | | | |
Interest (ARS) | | | $— | | | $ | 2,433,160 | | | $ | (4,025,141 | ) | | $ | 3,346,481 | | | | $— | | | | $ — | | | $ | (1,837,839 | ) | | | $ 1,685,208 | | | $ | 1,601,869 | | | | | $ | 4,208 | |
| | | | |
| | | | | | | | | | | |
Liabilities: | | | | | | | | | | | | | | | | | | | | | | | | | | | | | | | | | | | | | | | | | | |
Payables: | | | | | | | | | | | | | | | | | | | | | | | | | | | | | | | | | | | | | | | | | | |
Deferred Tax (ARS) | | | $— | | | $ | — | | | $ | — | | | $ | 5,437 | | | | $— | | | | $ — | | | $ | — | | | | $ (1,371 | ) | | $ | 4,066 | | | | | $ | (1,371 | ) |
| | | | |
aTransferred into Level 3 as a result of the unavailability of a quoted market price in an active market for identical securities or as a result of the unreliability of the foreign exchange rate and other significant observable valuation inputs.
bMay include accretion, amortization, partnership adjustments, and/or other cost basis adjustments.
FRANKLIN TEMPLETON VARIABLE INSURANCE PRODUCTS TRUST
FINANCIAL STATEMENTS
Templeton Global Bond VIP Fund(continued)
Significant unobservable valuation inputs for material Level 3 assets and/or liabilities and impact to fair value as a result of changes in unobservable valuation inputs as of December 31, 2019, are as follows:
| | | | | | | | | | | | | | | | | | | | |
| Description | | Fair Value at End of Year | | | Valuation Technique | | | Unobservable Inputs | | | Amount | | | Impact to Fair Value if Input Increasesa | |
Assets: | | | | | | | | | | | | | | | | | | | | |
Investments in Securities: | | | | | | | | | | | | | | | | | | | | |
Foreign Government and Agency Securities | | | | | | | | | | | | | | | | | | | | |
Argentina | | $ | 35,675,197 | | | | Market comparables | | |
| Implied Foreign
exchange rate |
| | | 75.1 ARS/USD | | | | Decrease | b |
Short Term Investments | | | | | | | | | | | | | | | | | | | | |
Argentina | | | 3,394,233 | | | | Market comparables | | |
| Implied Foreign
exchange rate |
| | | 75.1 ARS/USD | | | | Decrease | b |
Other Financial Instruments: | | | | | | | | | | | | | | | | | | | | |
Restricted Currency (ARS) | | | 8,460,563 | | | | Market comparables | | |
| Implied Foreign
exchange rate |
| | | 75.1 ARS/USD | | | | Decrease | b |
All otherc | | | 1,601,869 | | | | | | | | | | | | | | | | | |
Liabilities: | | | | | | | | | | | | | | | | | | | | |
All otherc | | | 4,066 | | | | | | | | | | | | | | | | | |
aRepresents the directional change in the fair value that would result from a significant and reasonable increase in the corresponding input. A significant and reasonable decrease in the input would have the opposite effect. Significant impacts, if any, to fair value and/or net assets have been indicated.
bRepresents a significant impact to fair value but not net assets.
cIncludes fair value of immaterial assets and/or liabilities developed using various valuation techniques and unobservable inputs. May also include values derived using private transaction prices ornon-public third party pricing information which is unobservable.
12. Subsequent Events
The Fund has evaluated subsequent events through the issuance of the financial statements and determined that no events have occurred that require disclosure other than those already disclosed in the financial statements.
| | | | | | | | | | |
Abbreviations | | | | | | | | |
| Counterparty | | Currency | | Selected Portfolio |
| | | | | |
| BNDP | | BNP Paribas SA | | ARS | | Argentine Peso | | ARPP7DRR | | Argentina Central Bank 7 Day Repo Rate |
| | | | | |
| BOFA | | Bank of America Corp. | | AUD | | Australian Dollar | | BADLAR | | Argentina Deposit Rates Badlar Private Banks ARS |
| | | | | |
| BZWS | | Barclays Bank PLC | | BRL | | Brazilian Real | | FRN | | Floating Rate Note |
| | | | | |
| CITI | | Citigroup, Inc. | | COP | | Colombian Peso | | LIBOR | | London InterBank Offered Rate |
| | | | | |
| DBAB | | Deutsche Bank AG | | EUR | | Euro | | | | |
| | | | | |
| GSCO | | The Goldman Sachs Group, Inc. | | GHS | | Ghanaian Cedi | | | | |
| | | | | |
| HSBK | | HSBC Bank PLC | | IDR | | Indonesian Rupiah | | | | |
| | | | | |
| JPHQ | | JP Morgan Chase & Co. | | INR | | Indian Rupee | | | | |
| | | | | |
| MSCO | | Morgan Stanley | | JPY | | Japanese Yen | | | | |
| | | | | |
| SCNY | | Standard Chartered Bank | | KRW | | South Korean Won | | | | |
| | | | | |
| UBSW | | UBS AG | | MXN | | Mexican Peso | | | | |
| | | | | |
| | | | NOK | | Norwegian Krone | | | | |
| | | | | |
| | | | USD | | United States Dollar | | | | |
FRANKLIN TEMPLETON VARIABLE INSURANCE PRODUCTS TRUST
Report of Independent Registered Public Accounting Firm
To the Board of Trustees of Franklin Templeton Variable Insurance Products Trust and Shareholders of Templeton Global Bond VIP Fund
Opinion on the Financial Statements
We have audited the accompanying statement of assets and liabilities, including the statement of investments, of Templeton Global Bond VIP Fund (the “Fund”) as of December 31, 2019, the related statement of operations for the year ended December 31, 2019, the statement of changes in net assets for each of the two years in the period ended December 31, 2019, including the related notes, and the financial highlights for each of the five years in the period ended December 31, 2019 (collectively referred to as the “financial statements”). In our opinion, the financial statements present fairly, in all material respects, the financial position of the Fund as of December 31, 2019, the results of its operations for the year then ended, the changes in its net assets for each of the two years in the period ended December 31, 2019 and the financial highlights for each of the five years in the period ended December 31, 2019 in conformity with accounting principles generally accepted in the United States of America.
Basis for Opinion
These financial statements are the responsibility of the Fund’s management. Our responsibility is to express an opinion on the Fund’s financial statements based on our audits. We are a public accounting firm registered with the Public Company Accounting Oversight Board (United States) (PCAOB) and are required to be independent with respect to the Fund in accordance with the U.S. federal securities laws and the applicable rules and regulations of the Securities and Exchange Commission and the PCAOB.
We conducted our audits of these financial statements in accordance with the standards of the PCAOB. Those standards require that we plan and perform the audit to obtain reasonable assurance about whether the financial statements are free of material misstatement, whether due to error or fraud.
Our audits included performing procedures to assess the risks of material misstatement of the financial statements, whether due to error or fraud, and performing procedures that respond to those risks. Such procedures included examining, on a test basis, evidence regarding the amounts and disclosures in the financial statements. Our audits also included evaluating the accounting principles used and significant estimates made by management, as well as evaluating the overall presentation of the financial statements. Our procedures included confirmation of securities owned as of December 31, 2019 by correspondence with the custodian, transfer agent and brokers; when replies were not received from brokers, we performed other auditing procedures. We believe that our audits provide a reasonable basis for our opinion.
PricewaterhouseCoopers LLP
San Francisco, California
February 20, 2020
We have served as the auditor of one or more investment companies in the Franklin Templeton Group of Funds since 1948.
FRANKLIN TEMPLETON VARIABLE INSURANCE PRODUCTS TRUST
Tax Information (unaudited)
Templeton Global Bond VIP Fund
At December 31, 2019, more than 50% of the Fund’s total assets were invested in securities of foreign issuers. In most instances, foreign taxes were withheld from income paid to the Fund on these investments. The Fund elects to treat foreign taxes paid as allowed under Section 853 of the Internal Revenue Code. This election will allow shareholders of record as of the 2020 distribution date, to treat their proportionate share of foreign taxes paid by the Fund as having been paid directly by them. The shareholder shall consider these amounts as foreign taxes paid in the tax year in which they receive the Fund distribution.
This page intentionally left blank.
Templeton Growth VIP Fund
This annual report for Templeton Growth VIP Fund covers the fiscal year ended December 31, 2019.
Class 4 Performance Summary as of December 31, 2019
Average annual total return of Class 4 shares* represents the average annual change in value, assuming reinvestment of dividends and capital gains. Average returns smooth out variations in returns, which can be significant; they are not the same asyear-by-year results.
| | | | | | |
| Periods ended 12/31/19 | | 1-Year | | 5-Year | | 10-Year |
Average Annual Total Return | | +14.97% | | +3.45% | | +6.13% |
*The Fund has a fee waiver associated with any investment it makes in a Franklin Templeton money fund and/or other Franklin Templeton fund, contractually guaranteed through 4/30/20. Fund investment results reflect the fee waiver; without this waiver, the results would have been lower.
Performance reflects the Fund’s Class 4 operating expenses, but doesnotinclude any contract fees, expenses or sales charges. If they had been included, performance would be lower. These charges and deductions, particularly for variable life policies, can have a significant effect on contract values and insurance benefits. See the contract prospectus for a complete description of these expenses, including sales charges.
Performance data represent past performance, which does not guarantee future results. Investment return and principal value will fluctuate, and you may have a gain or loss when you sell your shares. Current performance may differ from figures shown.
Total Return Index Comparison for a Hypothetical $10,000 Investment (1/1/10–12/31/19)
The graph below shows the change in value of a hypothetical $10,000 investment in the Fund over the indicated period and includes reinvestment of any income or distributions. The Fund’s performance* is compared to the performance of the MSCI All Country World Index (ACWI). One cannot invest directly in an index, and an index is not representative of the Fund’s portfolio.Please see Important Notes to Performance Information preceding the Fund Summaries.
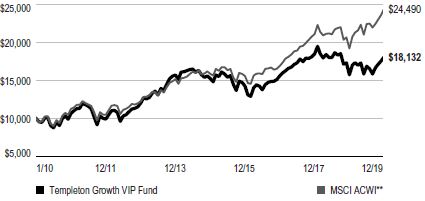
**Source: Morningstar. Please see Index Descriptions following the Fund Summaries.
TEMPLETON GROWTH VIP FUND
Fund Goal and Main Investments
The Fund seeks long-term capital growth. Under normal market conditions, the Fund invests predominantly in equity securities (primarily common stocks) of companies located anywhere in the world, including developing markets.
Fund Risks
All investments involve risks, including possible loss of principal. Special risks are associated with foreign investing, including currency fluctuations, economic instability and political developments; investments in developing markets involve heightened risks related to the same factors. Because the Fund may invest its assets in companies in a specific region, including Europe, it is subject to greater risks of adverse developments in that region and/or the surrounding regions than a fund that is more broadly diversified geographically. Political, social or economic disruptions in the region, even in countries in which the Fund is not invested, may adversely affect the value of securities held by the Fund. Current political and financial uncertainty surrounding the European Union (EU) and the financial instability of some countries in the EU may increase market volatility and the economic risk of investing in companies in Europe. Derivatives involve costs and can create economic leverage which may result in significant volatility and cause the Fund to participate in losses (and enable gains) on an amount that exceeds the Fund’s initial investment. In addition, smaller company stocks have historically experienced more price volatility than larger company stocks, especially over the short term. The Fund is actively managed but there is no guarantee that the manager’s investment decisions will produce the desired results. The Fund’s prospectus also includes a description of the main investment risks.
Performance Overview
You can find the Fund’sone-year total return in the Performance Summary. For comparison, the Fund’s benchmark, the MSCI ACWI, posted a +27.30% total return for the period under review.1
Geographic Composition
Based on Total Net Assets as of 12/31/19
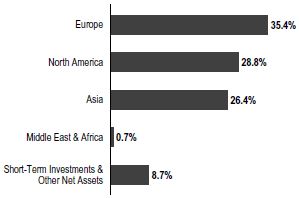
Economic and Market Overview
Global developed and emerging market stocks, as measured by the MSCI ACWI, posted strong returns during the reporting period. Although global economic growth slowed from 2018, interest-rate cuts from many central banks and the easing of trade tensions nearperiod-end contributed to the generally positive environment for equities worldwide. Reflecting investor optimism and slowing but resilient economic growth, stocks advanced in every major region of the globe.
In the U.S., solid economic growth also supported equities, as healthy consumer spending and a strong labor market kept the economy afloat. The unemployment rate fell during the year, reaching 3.5% in September, November and December 2019, the lowest recorded unemployment rate in 50 years.2 Wages also grew, albeit at a moderate pace, and inflation remained persistently low. In addition, deficit spending by the U.S. government boosted current growth at the expense of long-term debt. Despite the strength in the consumer sector, some parts of the economy struggled, particularly heavy industry. Annual industrial production contracted late in the reporting period, manufacturing output stalled and capital spending declined.
The U.S. Federal Reserve (Fed) provided a substantial boost to equity markets early in the reporting period as it shifted to a more accommodative monetary policy. In January 2019, the Fed signaled the end of its tightening cycle and cut the federal funds rate three times thereafter, lowering it to a
1. Source: Morningstar. One cannot invest directly in an index, and an index is not representative of the Fund’s portfolio. Please see Index Descriptions following the Fund Summaries.
2. Source: U.S. Bureau of Labor Statistics.
The dollar value, number of shares or principal amount, and names of all portfolio holdings are listed in the Fund’s Statement of Investments (SOI).
TEMPLETON GROWTH VIP FUND
range of 1.50%–1.75%. Stocks responded positively to the interest-rate cuts and gained further in December 2019 after the Fed indicated it would likely leave interest rates unchanged in 2020.
Growth slowed overall in the eurozone, particularly in Germany and Italy. Germany, which is heavily reliant on exports, was adversely affected by the trade conflict between the U.S. and China and the resulting slowdown in global trade. In Italy, political uncertainty and budget concerns caused the country’s annual gross domestic product (GDP) growth to stall in 2019’s first quarter before accelerating in the second quarter. Despite sluggish economic conditions, European developed market equities, as measured by the MSCI Europe Index, posted strong returns overall, as easing trade tensions buoyed investor optimism and an electoral victory by the Conservative Party in the U.K. alleviated uncertainty surrounding Brexit. Although the European Central Bank left its headline refinancing rate unchanged, it lowered the deposit rate and restarted its bond-buying stimulus program, further supporting stocks.
Economic growth in Asia was relatively solid overall, despite slowdowns in several large emerging market countries, such as China and India. Japan’s economy grew amid the Bank of Japan’s sizable stimulus program. The trade war between the U.S. and China provided the backdrop for Asian stocks, which rose and fell in sync with investor sentiment regarding a trade deal. A phase one trade agreement between the two countries reached in December 2019 propelled Asian developed and emerging market stocks, which ultimately ended with strong returns over the12-month period, as measured by the MSCI All Country Asia Index.
Emerging market stocks overall experienced several sharp selloffs and subsequent rebounds throughout the reporting period before ending with gains. In aggregate, economic growth slowed somewhat from 2018 but remained solid, although there was some variation among individual countries. Many central banks in emerging markets cut interest rates throughout the reporting period which, along with resilient GDP growth, provided a supportive environment for equities. Russian stocks posted the highest returns among emerging markets as the threat of further sanctions receded and a solid fiscal environment reassured investors. Overall, global emerging markets, as measured by the MSCI Emerging Markets Index, posted robust returns for the period.
Investment Strategy
Our investment philosophy is bottom up, value oriented and long term. When choosing equity investments for the Fund, we focus on the market price of a company’s securities relative to our evaluation of the company’s potential long-term earnings, asset value and cash flow. Our analysis includes an assessment of the potential impacts of material environmental, social and governance (ESG) factors on the long-term risk and return profile of a company. We also consider a company’s price/earnings ratio, price/cash flow ratio, profit margins and liquidation value.
The Fund may, from time to time, seek to hedge (protect) against currency risks, using certain currency-related derivative instruments. The Fund may also use a variety of equity-related derivatives for various purposes including enhancing Fund returns, increasing liquidity and gaining exposure to particular markets in more efficient or less expensive ways.
Manager’s Discussion
During the 12 months under review, key detractors from the Fund’s performance relative to the MSCI ACWI included stock selection and an underweighting in the information technology (IT) sector, stock selection in the communication services sector, and stock selection and an overweighting in the energy sector.3
There were no IT holdings among the Fund’s 10 biggest relative detractors; however, the sector included one of the top 10 relative contributors during the year, South Korean electronics firm Samsung Electronics. We believe broad IT sector performance during the year was driven mostly by multiples expansion, not by fundamentals, which actually deteriorated in 2019. Within the IT sector, we have avoided what we considered to be expensive, momentum-driven stocks, finding opportunities instead among hardware companies with restructuring potential and, occasionally, mature software firms with healthy cash flows and new growth opportunities.
In the communication services sector, Luxembourg-based satellite operator SES, Chinese language internet search company Baidu and Chinese telecommunication firm China Mobile hurt relative results. Shares of SES declined as investors, in our view, reacted too negatively to a regulatory ruling that we believe will likely prove less value-destructive
3. The IT sector comprises communications equipment; electronic equipment, instruments and components; software; and technology hardware, storage and peripherals in the SOI. The communication services sector comprises diversified telecommunication services, interactive media and services, media and wireless telecommunication services in the SOI. The energy sector comprises oil, gas and consumable fuels in the SOI.
TEMPLETON GROWTH VIP FUND
than initially feared. We remain positive on the stock given its strong balance sheet and healthy dividend yield, as well as our expectation of renewed growth from the firm’s core business over a long-term investment horizon. China Mobile’s shares declined amid concerns about elevated 5G capital expenditures and continued security scrutiny of Chinese telecommunication services companies. We continue to believe the stock offers undemanding valuations, attractive dividend yields and a solid competitive position in a secular growth market.
In the energy sector, Hong Kong-listed oil and gas firm Kunlun Energy and U.K.-based integrated energy firm BP dampened relative performance. Kunlun Energy’s shares declined due to investor concerns aboutgovernment-led energy reforms. BP reported higher oil and gas production but disappointed investors hoping for a dividend increase. The company has made solid progress selling assets to shore up its balance sheet and, in our view, could potentially benefit from firmer oil prices and rising production following years of investment.
Other key detractors from relative performance included Israel-based generic drugmaker Teva Pharmaceutical Industries and U.S. drug retailer Walgreens Boots Alliance.
Conversely, stock selection and an underweighting in the materials sector contributed to the Fund’s relative performance.4 Within the sector, shares of Canadian mining company Wheaton Precious Metals rallied as the price of gold broke out of asix-year trading range. Anticipating an eventual move higher in gold prices given record-high debt levels, historically low interest rates, escalating geopolitical turmoil and renewed central bank buying, we maintained a modest precious metals allocation as a portfolio hedge and diversifier.
Other notable contributors included U.S. beauty products firm Coty (not held atperiod-end), U.S.-listed pharmaceutical products company Allergan, U.S. bank Citigroup and French lender BNP Paribas. Citigroup’s share price reached a post-financial crisis high atyear-end as the steeper yield curve—with yields on long-term U.S. Treasuries higher than short-term U.S. Treasuries—aided profitability and improving conditions abroad buoyed sentiment at the global bank. We believe Citigroup remains one of the cheapest major U.S. banks and one of the few with material scope to benefit from ongoing self-help measures. BNP Paribas benefited from solid results at its fixed income unit and from more benign European economic conditions. In our view, BNP Paribas is a
Top 10 Holdings
12/31/19
| | | | |
Company Sector/Industry, Country | | % of Total
Net Assets | |
Allergan PLC | | | 3.0% | |
Pharmaceuticals, U.S. | | | | |
BNP Paribas SA | | | 2.6% | |
Banks, France | | | | |
Singapore Telecommunications Ltd. | | | 2.5% | |
Diversified Telecommunication Services, Singapore | | | | |
Walgreens Boots Alliance Inc. | | | 2.4% | |
Food & Staples Retailing, U.S. | | | | |
Samsung Electronics Co. Ltd. | | | 2.3% | |
Technology Hardware, Storage & Peripherals,South Korea | | | | |
Gilead Sciences Inc. | | | 2.3% | |
Biotechnology, U.S. | | | | |
Sanofi | | | 2.3% | |
Pharmaceuticals, France | | | | |
Takeda Pharmaceutical Co. Ltd. | | | 2.2% | |
Pharmaceuticals, Japan | | | | |
ING Groep NV | | | 2.2% | |
Banks, Netherlands | | | | |
The Kroger Co. | | | 2.2% | |
Food & Staples Retailing, U.S. | | | | |
diverse, high-quality European bank with an excellent track record of managing credit risk and maintaining profitability in various economic conditions.
From a geographic perspective, all major regions where the Fund invested during the period detracted from relative performance. Significant detractors included stock selection and overweightings in Europe and Asia, as well as stock selection and an underweighting in North America.
Thank you for your participation in Templeton Growth VIP Fund. We look forward to serving your future investment needs.
4. The materials sector comprises metals and mining in the SOI.
TEMPLETON GROWTH VIP FUND
The foregoing information reflects our analysis, opinions and portfolio holdings as of December 31, 2019, the end of the reporting period. The way we implement our main investment strategies and the resulting portfolio holdings may change depending on factors such as market and economic conditions. These opinions may not be relied upon as investment advice or an offer for a particular security. The information is not a complete analysis of every aspect of any market, country, industry, security or the Fund. Statements of fact are from sources considered reliable, but the investment manager makes no representation or warranty as to their completeness or accuracy. Although historical performance is no guarantee of future results, these insights may help you understand our investment management philosophy.
TEMPLETON GROWTH VIP FUND
Class 4 Fund Expenses
As an investor in a variable insurance contract (Contract) that indirectly provides for investment in an underlying mutual fund, you can incur transaction and/or ongoing expenses at both the Fund level and the Contract Level: (1) transaction expenses can include sales charges (loads) on purchases, surrender fees, transfer fees and premium taxes; and (2) ongoing expenses can include management fees, distribution and service(12b-1) fees, contract fees, annual maintenance fees, mortality and expense risk fees and other fees and expenses. All mutual funds and Contracts have some types of ongoing expenses. The table below shows Fund-level ongoing expenses and can help you understand these costs and compare them with those of other mutual funds offered through the Contract. The table assumes a $1,000 investment held for the six months indicated. Please refer to the Fund prospectus for additional information on operating expenses.
Actual Fund Expenses
The table below provides information about the actual account values and actual expenses in the columns under the heading “Actual.” In these columns the Fund’s actual return, which includes the effect of ongoing Fund expenses but does not include the effect of ongoing Contract expenses, is used to calculate the “Ending Account Value.” You can estimate the Fund-level expenses you paid during the period by following these steps (of course, your account value and expenses will differ from those in this illustration): Divide your account value by $1,000 (if your account had an $8,600 value, then $8,600÷ $1,000 =8.6). Then multiply the result by the number under the headings “Actual” and “Fund-Level Expenses Paid During Period” (if Fund-Level Expenses Paid During Period were $ 7.50, then 8.6 x $ 7.50 = $64.50). In this illustration, the estimated expenses paid this period at the Fund level are $64.50.
Hypothetical Example for Comparison with Other Mutual Funds
Under the heading “Hypothetical” in the table, information is provided about hypothetical account values and hypothetical expenses based on the Fund’s actual expense ratio and an assumed rate of return of 5% per year before expenses, which is not the Fund’s actual return. This information may not be used to estimate the actual ending account balance or expenses you paid for the period, but it can help you compare ongoing costs of investing in the Fund with those of other mutual funds offered through the Contract. To do so, compare this 5% hypothetical example with the 5% hypothetical examples that appear in the shareholder reports of other funds offered through the Contract.
Please note that expenses shown in the table are meant to highlight ongoing costs at the Fund level only and do not reflect any ongoing expenses at the Contract level, or transaction expenses at either the Fund or Contract levels. In addition, while the Fund does not have transaction expenses, if the transaction and ongoing expenses at the Contract level were included, the expenses shown below would be higher. You should consult your Contract prospectus or disclosure document for more information.
| | | | | | | | | | | | |
| | | | | Actual (actual return after expenses) | | Hypothetical (5% annual return before expenses) | | |
| | | | | | | | |
Share
Class | | Beginning
Account Value 7/1/19 | | Ending Account Value 12/31/19 | | Fund-Level Expenses Paid During Period 7/1/19–12/31/191, 2 | | Ending Account Value 12/31/19 | | Fund-Level Expenses Paid During Period 7/1/19–12/31/191, 2 | | Net
Annualized
Expense
Ratio2 |
| | | | | | |
| | | | | | |
| Class 4 | | $1,000 | | $1,072.70 | | $6.43 | | $1,019.00 | | $6.26 | | 1.23% |
1. Expenses are equal to the annualized expense ratio for thesix-month period as indicated above—in the far right column—multiplied by the simple average account value over the period indicated, and then multiplied by 184/365 to reflect theone-half year period.
2. Reflects expenses after fee waivers and expense reimbursements. Does not include any ongoing expenses of the Contract for which the Fund is an investment option or acquired fund fees and expenses.
FRANKLIN TEMPLETON VARIABLE INSURANCE PRODUCTS TRUST
Financial Highlights
Templeton Growth VIP Fund
| | | | | | | | | | | | | | | | | | | | |
| | | Year Ended December 31, | |
| | | | |
| | | 2019 | | | 2018 | | | 2017 | | | 2016 | | | 2015 | |
| |
| | | | | |
Class 1 | | | | | | | | | | | | | | | | | | | | |
| | | | | |
Per share operating performance (for a share outstanding throughout the year) | | | | | | | | | | | | | | | | | | | | |
| | | | | |
Net asset value, beginning of year | | | $12.44 | | | | $16.24 | | | | $13.93 | | | | $13.54 | | | | $14.85 | |
| | | | |
| | | | | |
Income from investment operationsa: | | | | | | | | | | | | | | | | | | | | |
| | | | | |
Net investment incomeb | | | 0.30 | | | | 0.28 | | | | 0.29 | | | | 0.26 | | | | 0.28 | |
| | | | | |
Net realized and unrealized gains (losses) | | | 1.30 | | | | (2.42) | | | | 2.30 | | | | 0.96 | | | | (1.17) | |
| | | | |
| | | | | |
Total from investment operations | | | 1.60 | | | | (2.14) | | | | 2.59 | | | | 1.22 | | | | (0.89) | |
| | | | |
| | | | | |
Less distributions from: | | | | | | | | | | | | | | | | | | | | |
| | | | | |
Net investment income | | | (0.40) | | | | (0.35) | | | | (0.28) | | | | (0.31) | | | | (0.42) | |
| | | | | |
Net realized gains | | | (2.49) | | | | (1.31) | | | | — | | | | (0.52) | | | | — | |
| | | | |
| | | | | |
Total distributions | | | (2.89) | | | | (1.66) | | | | (0.28) | | | | (0.83) | | | | (0.42) | |
| | | | |
| | | | | |
Net asset value, end of year | | | $11.15 | | | | $12.44 | | | | $16.24 | | | | $13.93 | | | | $13.54 | |
| | | | |
| | | | | |
Total returnc | | | 15.43% | | | | (14.61)% | | | | 18.77% | | | | 9.90% | | | | (6.24)% | |
| | | | | |
Ratios to average net assets | | | | | | | | | | | | | | | | | | | | |
| | | | | |
Expensesd | | | 0.86% | | | | 0.83% | | | | 0.82% | e | | | 0.82% | | | | 0.80% | |
| | | | | |
Net investment income | | | 2.52% | | | | 1.90% | | | | 1.94% | | | | 2.01% | | | | 1.96% | |
| | | | | |
Supplemental data | | | | | | | | | | | | | | | | | | | | |
| | | | | |
Net assets, end of year (000’s) | | | $97,988 | | | | $354,164 | | | | $466,207 | | | | $453,997 | | | | $468,548 | |
| | | | | |
Portfolio turnover rate | | | 19.69% | | | | 29.25% | | | | 26.46% | | | | 22.88% | | | | 20.92% | |
aThe amount shown for a share outstanding throughout the period may not correlate with the Statement of Operations for the period due to the timing of sales and repurchases of the Fund’s shares in relation to income earned and/or fluctuating fair value of the investments of the Fund.
bBased on average daily shares outstanding.
cTotal return does not include fees, charges or expenses imposed by the variable annuity and life insurance contracts for which Franklin Templeton Variable Insurance Products Trust serves as an underlying investment vehicle.
dBenefit of waiver and payments by affiliates rounds to less than 0.01%.
eBenefit of expense reduction rounds to less than 0.01%.
| | | | |
| | | |
| | The accompanying notes are an integral part of these financial statements. | Annual Report | | TG-7 |
FRANKLIN TEMPLETON VARIABLE INSURANCE PRODUCTS TRUST
FINANCIAL HIGHLIGHTS
Templeton Growth VIP Fund(continued)
| | | | | | | | | | | | | | | | | | | | |
| | | Year Ended December 31, | |
| | | | |
| | | 2019 | | | 2018 | | | 2017 | | | 2016 | | | 2015 | |
| |
| | | | | |
Class 2 | | | | | | | | | | | | | | | | | | | | |
| | | | | |
Per share operating performance (for a share outstanding throughout the year) | | | | | | | | | | | | | | | | | | | | |
| | | | | |
Net asset value, beginning of year | | | $12.21 | | | | $15.97 | | | | $13.70 | | | | $13.32 | | | | $14.61 | |
| | | | |
| | | | | |
Income from investment operationsa: | | | | | | | | | | | | | | | | | | | | |
| | | | | |
Net investment incomeb | | | 0.26 | | | | 0.24 | | | | 0.25 | | | | 0.23 | | | | 0.25 | |
| | | | | |
Net realized and unrealized gains (losses) | | | 1.28 | | | | (2.38) | | | | 2.26 | | | | 0.94 | | | | (1.16) | |
| | | | |
| | | | | |
Total from investment operations | | | 1.54 | | | | (2.14) | | | | 2.51 | | | | 1.17 | | | | (0.91) | |
| | | | |
| | | | | |
Less distributions from: | | | | | | | | | | | | | | | | | | | | |
| | | | | |
Net investment income | | | (0.36) | | | | (0.31) | | | | (0.24) | | | | (0.27) | | | | (0.38) | |
| | | | | |
Net realized gains | | | (2.49) | | | | (1.31) | | | | — | | | | (0.52) | | | | — | |
| | | | |
| | | | | |
Total distributions | | | (2.85) | | | | (1.62) | | | | (0.24) | | | | (0.79) | | | | (0.38) | |
| | | | |
| | | | | |
Net asset value, end of year | | | $10.90 | | | | $12.21 | | | | $15.97 | | | | $13.70 | | | | $13.32 | |
| | | | |
| | | | | |
Total returnc | | | 15.15% | | | | (14.85)% | | | | 18.50% | | | | 9.62% | | | | (6.49)% | |
| | | | | |
Ratios to average net assets | | | | | | | | | | | | | | | | | | | | |
| | | | | |
Expensesd | | | 1.11% | | | | 1.08% | | | | 1.07% | e | | | 1.07% | | | | 1.05% | |
| | | | | |
Net investment income | | | 2.27% | | | | 1.65% | | | | 1.69% | | | | 1.76% | | | | 1.71% | |
| | | | | |
Supplemental data | | | | | | | | | | | | | | | | | | | | |
| | | | | |
Net assets, end of year (000’s) | | | $659,412 | | | | $625,311 | | | | $879,521 | | | | $876,128 | | | | $921,895 | |
| | | | | |
Portfolio turnover rate | | | 19.69% | | | | 29.25% | | | | 26.46% | | | | 22.88% | | | | 20.92% | |
aThe amount shown for a share outstanding throughout the period may not correlate with the Statement of Operations for the period due to the timing of sales and repurchases of the Fund’s shares in relation to income earned and/or fluctuating fair value of the investments of the Fund.
bBased on average daily shares outstanding.
cTotal return does not include fees, charges or expenses imposed by the variable annuity and life insurance contracts for which Franklin Templeton Variable Insurance Products Trust serves as an underlying investment vehicle.
dBenefit of waiver and payments by affiliates rounds to less than 0.01%.
eBenefit of expense reduction rounds to less than 0.01%.
| | | | |
| | |
TG-8 | | Annual Report | The accompanying notes are an integral part of these financial statements. |
FRANKLIN TEMPLETON VARIABLE INSURANCE PRODUCTS TRUST
FINANCIAL HIGHLIGHTS
Templeton Growth VIP Fund(continued)
| | | | | | | | | | | | | | | | | | | | |
| | | Year Ended December 31, | |
| | | | |
| | | 2019 | | | 2018 | | | 2017 | | | 2016 | | | 2015 | |
| |
| | | | | |
Class 4 | | | | | | | | | | | | | | | | | | | | |
| | | | | |
Per share operating performance (for a share outstanding throughout the year) | | | | | | | | | | | | | | | | | | | | |
| | | | | |
Net asset value, beginning of year | | | $12.36 | | | | $16.13 | | | | $13.83 | | | | $13.44 | | | | $14.73 | |
| | | | |
| | | | | |
Income from investment operationsa: | | | | | | | | | | | | | | | | | | | | |
| | | | | |
Net investment incomeb | | | 0.26 | | | | 0.23 | | | | 0.24 | | | | 0.22 | | | | 0.23 | |
| | | | | |
Net realized and unrealized gains (losses) | | | 1.29 | | | | (2.40) | | | | 2.28 | | | | 0.94 | | | | (1.16) | |
| | | | |
| | | | | |
Total from investment operations | | | 1.55 | | | | (2.17) | | | | 2.52 | | | | 1.16 | | | | (0.93) | |
| | | | |
| | | | | |
Less distributions from: | | | | | | | | | | | | | | | | | | | | |
| | | | | |
Net investment income | | | (0.35) | | | | (0.29) | | | | (0.22) | | | | (0.25) | | | | (0.36) | |
| | | | | |
Net realized gains | | | (2.49) | | | | (1.31) | | | | — | | | | (0.52) | | | | — | |
| | | | |
| | | | | |
Total distributions | | | (2.84) | | | | (1.60) | | | | (0.22) | | | | (0.77) | | | | (0.36) | |
| | | | |
| | | | | |
Net asset value, end of year | | | $11.07 | | | | $12.36 | | | | $16.13 | | | | $13.83 | | | | $13.44 | |
| | | | |
| | | | | |
Total returnc | | | 14.97% | | | | (14.88)% | | | | 18.38% | | | | 9.47% | | | | (6.54)% | |
| | | | | |
Ratios to average net assets | | | | | | | | | | | | | | | | | | | | |
| | | | | |
Expensesd | | | 1.21% | | | | 1.18% | | | | 1.17% | e | | | 1.17% | | | | 1.15% | |
| | | | | |
Net investment income | | | 2.17% | | | | 1.55% | | | | 1.59% | | | | 1.66% | | | | 1.61% | |
| | | | | |
Supplemental data | | | | | | | | | | | | | | | | | | | | |
| | | | | |
Net assets, end of year (000’s) | | | $27,330 | | | | $28,238 | | | | $38,798 | | | | $43,286 | | | | $47,777 | |
| | | | | |
Portfolio turnover rate | | | 19.69% | | | | 29.25% | | | | 26.46% | | | | 22.88% | | | | 20.92% | |
aThe amount shown for a share outstanding throughout the period may not correlate with the Statement of Operations for the period due to the timing of sales and repurchases of the Fund’s shares in relation to income earned and/or fluctuating fair value of the investments of the Fund.
bBased on average daily shares outstanding.
cTotal return does not include fees, charges or expenses imposed by the variable annuity and life insurance contracts for which Franklin Templeton Variable Insurance Products Trust serves as an underlying investment vehicle.
dBenefit of waiver and payments by affiliates rounds to less than 0.01%.
eBenefit of expense reduction rounds to less than 0.01%.
| | | | |
| | | |
| | The accompanying notes are an integral part of these financial statements. | Annual Report | | TG-9 |
FRANKLIN TEMPLETON VARIABLE INSURANCE PRODUCTS TRUST
Statement of Investments, December 31, 2019
Templeton Growth VIP Fund
| | | | | | | | | | | | |
| | | Country | | | Shares | | | Value | |
| | | |
Common Stocks 91.3% | | | | | | | | | | | | |
Air Freight & Logistics 1.1% | | | | | | | | | | | | |
United Parcel Service Inc., B | | | United States | | | | 70,479 | | | $ | 8,250,272 | |
| | | | | | | | | | | | |
| | | |
Automobiles 0.6% | | | | | | | | | | | | |
Hero Motocorp Ltd. | | | India | | | | 141,930 | | | | 4,859,394 | |
| | | | | | | | | | | | |
| | | |
Banks 16.7% | | | | | | | | | | | | |
Bangkok Bank PCL, fgn | | | Thailand | | | | 1,397,560 | | | | 7,487,767 | |
Bank of Ireland Group PLC | | | Ireland | | | | 581,690 | | | | 3,184,706 | |
Barclays PLC | | | United Kingdom | | | | 3,966,533 | | | | 9,437,342 | |
BNP Paribas SA. | | | France | | | | 349,237 | | | | 20,690,966 | |
Citigroup Inc. | | | United States | | | | 161,090 | | | | 12,869,480 | |
Credit Agricole SA | | | France | | | | 745,066 | | | | 10,799,539 | |
HSBC Holdings PLC | | | United Kingdom | | | | 522,657 | | | | 4,081,424 | |
ING Groep NV | | | Netherlands | | | | 1,451,656 | | | | 17,399,632 | |
KB Financial Group Inc. | | | South Korea | | | | 280,494 | | | | 11,561,985 | |
Standard Chartered PLC | | | United Kingdom | | | | 1,321,833 | | | | 12,471,999 | |
Sumitomo Mitsui Financial Group Inc. | | | Japan | | | | 271,960 | | | | 10,105,125 | |
Wells Fargo & Co. | | | United States | | | | 203,257 | | | | 10,935,227 | |
| | | | | | | | | | | | |
| | | |
| | | | | | | | | | | 131,025,192 | |
| | | | | | | | | | | | |
Beverages 1.8% | | | | | | | | | | | | |
Kirin Holdings Co. Ltd. | | | Japan | | | | 322,500 | | | | 7,092,478 | |
Suntory Beverage & Food Ltd. | | | Japan | | | | 165,960 | | | | 6,940,770 | |
| | | | | | | | | | | | |
| | | |
| | | | | | | | | | | 14,033,248 | |
| | | | | | | | | | | | |
Biotechnology 2.3% | | | | | | | | | | | | |
| | | |
Gilead Sciences Inc. | | | United States | | | | 276,080 | | | | 17,939,678 | |
| | | | | | | | | | | | |
| | | |
Building Products 0.7% | | | | | | | | | | | | |
| | | |
Compagnie de Saint-Gobain | | | France | | | | 137,620 | | | | 5,633,189 | |
| | | | | | | | | | | | |
| | | |
Capital Markets 0.6% | | | | | | | | | | | | |
UBS Group AG | | | Switzerland | | | | 319,324 | | | | 4,034,244 | |
Value Partners Group Ltd. | | | Hong Kong | | | | 990,540 | | | | 610,165 | |
| | | | | | | | | | | | |
| | | |
| | | | | | | | | | | 4,644,409 | |
| | | | | | | | | | | | |
Communications Equipment 0.1% | | | | | | | | | | | | |
| | | |
aCommScope Holding Co. Inc. | | | United States | | | | 44,070 | | | | 625,353 | |
| | | | | | | | | | | | |
| | | |
Consumer Finance 0.2% | | | | | | | | | | | | |
Capital One Financial Corp. | | | United States | | | | 15,088 | | | | 1,552,706 | |
| | | | | | | | | | | | |
| | | |
Diversified Telecommunication Services 5.1% | | | | | | | | | | | | |
China Telecom Corp. Ltd., ADR | | | China | | | | 98,965 | | | | 4,076,368 | |
Deutsche Telekom AG | | | Germany | | | | 233,410 | | | | 3,813,809 | |
Singapore Telecommunications Ltd. | | | Singapore | | | | 7,759,230 | | | | 19,438,452 | |
Telefonica SA. | | | Spain | | | | 901,225 | | | | 6,293,497 | |
Verizon Communications Inc. | | | United States | | | | 99,251 | | | | 6,094,011 | |
| | | | | | | | | | | | |
| | | |
| | | | | | | | | | | 39,716,137 | |
| | | | | | | | | | | | |
Electronic Equipment, Instruments & Components 0.5% | | | | | | | | | | | | |
| | | |
Kyocera Corp. | | | Japan | | | | 53,000 | | | | 3,647,941 | |
| | | | | | | | | | | | |
FRANKLIN TEMPLETON VARIABLE INSURANCE PRODUCTS TRUST
STATEMENT OF INVESTMENTS
Templeton Growth VIP Fund(continued)
| | | | | | | | | | | | |
| | | |
| | | Country | | | Shares | | | Value | |
| | | |
Common Stocks(continued) | | | | | | | | | | | | |
Food & Staples Retailing 5.6% | | | | | | | | | | | | |
The Kroger Co. | | | United States | | | | 587,760 | | | $ | 17,039,162 | |
Seven & i Holdings Co. Ltd. | | | Japan | | | | 215,860 | | | | 7,951,117 | |
Walgreens Boots Alliance Inc. | | | United States | | | | 316,929 | | | | 18,686,134 | |
| | | | | | | | | | | | |
| | | |
| | | | | | | | | | | 43,676,413 | |
| | | | | | | | | | | | |
Food Products 2.1% | | | | | | | | | | | | |
Kellogg Co. | | | United States | | | | 242,010 | | | | 16,737,412 | |
| | | | | | | | | | | | |
| | | |
Gas Utilities 0.7% | | | | | | | | | | | | |
Kunlun Energy Co. Ltd. | | | China | | | | 6,156,650 | | | | 5,435,847 | |
| | | | | | | | | | | | |
| | | |
Health Care Providers & Services 1.3% | | | | | | | | | | | | |
AmerisourceBergen Corp. | | | United States | | | | 60,567 | | | | 5,149,406 | |
Cardinal Health Inc. | | | United States | | | | 98,308 | | | | 4,972,419 | |
| | | | | | | | | | | | |
| | | |
| | | | | | | | | | | 10,121,825 | |
| | | | | | | | | | | | |
Household Durables 1.6% | | | | | | | | | | | | |
Panasonic Corp. | | | Japan | | | | 1,366,580 | | | | 12,945,886 | |
| | | | | | | | | | | | |
| | | |
Industrial Conglomerates 3.8% | | | | | | | | | | | | |
CK Hutchison Holdings Ltd. | | | Hong Kong | | | | 1,636,400 | | | | 15,603,162 | |
Siemens AG | | | Germany | | | | 110,732 | | | | 14,471,984 | |
| | | | | | | | | | | | |
| | | |
| | | | | | | | | | | 30,075,146 | |
| | | | | | | | | | | | |
Insurance 2.1% | | | | | | | | | | | | |
Aegon NV | | | Netherlands | | | | 684,036 | | | | 3,119,845 | |
China Life Insurance Co. Ltd., H. | | | China | | | | 4,891,020 | | | | 13,589,131 | |
| | | | | | | | | | | | |
| | | |
| | | | | | | | | | | 16,708,976 | |
| | | | | | | | | | | | |
Interactive Media & Services 0.9% | | | | | | | | | | | | |
aBaidu Inc., ADR | | | China | | | | 55,840 | | | | 7,058,176 | |
| | | | | | | | | | | | |
| | | |
Leisure Products 1.4% | | | | | | | | | | | | |
aMattel Inc. | | | United States | | | | 831,780 | | | | 11,270,619 | |
| | | | | | | | | | | | |
| | | |
Machinery 0.8% | | | | | | | | | | | | |
aNavistar International Corp. | | | United States | | | | 210,030 | | | | 6,078,268 | |
| | | | | | | | | | | | |
| | | |
Marine 1.0% | | | | | | | | | | | | |
A.P. Moeller-Maersk AS, B | | | Denmark | | | | 5,400 | | | | 7,786,529 | |
| | | | | | | | | | | | |
| | | |
Media 2.6% | | | | | | | | | | | | |
Comcast Corp., A | | | United States | | | | 174,363 | | | | 7,841,104 | |
SES SA, IDR | | | Luxembourg | | | | 901,520 | | | | 12,637,620 | |
| | | | | | | | | | | | |
| | | |
| | | | | | | | | | | 20,478,724 | |
| | | | | | | | | | | | |
Metals & Mining 1.9% | | | | | | | | | | | | |
Wheaton Precious Metals Corp. | | | Canada | | | | 496,476 | | | | 14,772,703 | |
| | | | | | | | | | | | |
| | | |
Multi-Utilities 2.9% | | | | | | | | | | | | |
E.ON SE | | | Germany | | | | 1,029,259 | | | | 10,993,196 | |
Veolia Environnement SA | | | France | | | | 429,630 | | | | 11,423,681 | |
| | | | | | | | | | | | |
| | | |
| | | | | | | | | | | 22,416,877 | |
| | | | | | | | | | | | |
FRANKLIN TEMPLETON VARIABLE INSURANCE PRODUCTS TRUST
STATEMENT OF INVESTMENTS
Templeton Growth VIP Fund(continued)
| | | | | | | | | | | | |
| | | Country | | | Shares | | | Value | |
| | | |
Common Stocks(continued) | | | | | | | | | | | | |
Oil, Gas & Consumable Fuels 8.5% | | | | | | | | | | | | |
Apache Corp. | | | United States | | | | 522,540 | | | $ | 13,371,799 | |
BP PLC | | | United Kingdom | | | | 2,232,011 | | | | 13,941,378 | |
Eni SpA | | | Italy | | | | 674,349 | | | | 10,471,019 | |
Exxon Mobil Corp. | | | United States | | | | 157,870 | | | | 11,016,169 | |
Husky Energy Inc. | | | Canada | | | | 527,660 | | | | 4,233,957 | |
Royal Dutch Shell PLC, B | | | United Kingdom | | | | 467,119 | | | | 13,855,243 | |
| | | | | | | | | | | | |
| | | |
| | | | | | | | | | | 66,889,565 | |
| | | | | | | | | | | | |
Pharmaceuticals 13.3% | | | | | | | | | | | | |
Allergan PLC | | | United States | | | | 122,834 | | | | 23,482,176 | |
Bayer AG | | | Germany | | | | 207,926 | | | | 16,977,735 | |
Merck KGaA | | | Germany | | | | 72,694 | | | | 8,588,415 | |
Roche Holding AG | | | Switzerland | | | | 42,833 | | | | 13,899,201 | |
Sanofi | | | France | | | | 177,087 | | | | 17,798,014 | |
Takeda Pharmaceutical Co. Ltd. | | | Japan | | | | 440,170 | | | | 17,546,045 | |
aTeva Pharmaceutical Industries Ltd., ADR | | | Israel | | | | 608,540 | | | | 5,963,692 | |
| | | | | | | | | | | | |
| | | |
| | | | | | | | | | | 104,255,278 | |
| | | | | | | | | | | | |
Real Estate Management & Development 2.4% | | | | | | | | | | | | |
CK Asset Holdings Ltd. | | | Hong Kong | | | | 796,840 | | | | 5,752,121 | |
Mitsui Fudosan Co. Ltd. | | | Japan | | | | 365,950 | | | | 8,997,639 | |
Sun Hung Kai Properties Ltd. | | | Hong Kong | | | | 281,500 | | | | 4,309,761 | |
| | | | | | | | | | | | |
| | | |
| | | | | | | | | | | 19,059,521 | |
| | | | | | | | | | | | |
Software 1.6% | | | | | | | | | | | | |
Oracle Corp. | | | United States | | | | 231,028 | | | | 12,239,864 | |
| | | | | | | | | | | | |
| | | |
Specialty Retail 1.4% | | | | | | | | | | | | |
Kingfisher PLC | | | United Kingdom | | | | 3,939,045 | | | | 11,321,038 | |
| | | | | | | | | | | | |
| | | |
Technology Hardware, Storage & Peripherals 2.3% | | | | | | | | | | | | |
Samsung Electronics Co. Ltd. | | | South Korea | | | | 373,630 | | | | 18,035,237 | |
| | | | | | | | | | | | |
| | | |
Wireless Telecommunication Services 3.4% | | | | | | | | | | | | |
aBharti Airtel Ltd. | | | India | | | | 856,685 | | | | 5,472,315 | |
China Mobile Ltd. | | | China | | | | 1,020,100 | | | | 8,574,689 | |
Vodafone Group PLC | | | United Kingdom | | | | 6,673,513 | | | | 12,971,726 | |
| | | | | | | | | | | | |
| | | |
| | | | | | | | | | | 27,018,730 | |
| | | | | | | | | | | | |
| | | |
Total Common Stocks (Cost $640,457,062) | | | | | | | | | | | 716,310,153 | |
| | | | | | | | | | | | |
| | | |
| | | | | | Principal
Amount* | | | | |
| | | |
Short Term Investments 5.0% | | | | | | | | | | | | |
| | | |
U.S. Government and Agency Securities (Cost $199,987) 0.0%† | | | | | | | | | | | | |
bFFCB, 1/02/20 | | | United States | | | $ | 200,000 | | | | 200,000 | |
| | | | | | | | | | | | |
FRANKLIN TEMPLETON VARIABLE INSURANCE PRODUCTS TRUST
STATEMENT OF INVESTMENTS
Templeton Growth VIP Fund(continued)
| | | | | | | | | | | | |
| | | Country | | | Principal
Amount* | | | Value | |
| | | |
Short Term Investments(continued) | | | | | | | | | | | | |
| | | |
Time Deposits 5.0% | | | | | | | | | | | | |
National Australia Bank Ltd, 1.45%, 1/02/20 | | | Australia | | | $ | 20,000,000 | | | $ | 20,000,000 | |
Royal Bank of Canada, 1.56%, 1/02/20 | | | Canada | | | | 19,000,000 | | | | 19,000,000 | |
| | | |
Total Time Deposits (Cost $39,000,000) | | | | | | | | | | | 39,000,000 | |
Total Investments (Cost $679,657,049) 96.3% | | | | | | | | | | | 755,510,153 | |
Other Assets, less Liabilities 3.7% | | | | | | | | | | | 29,219,519 | |
| | | |
Net Assets 100.0% | | | | | | | | | | $ | 784,729,672 | |
See Abbreviations on pageTG-24.
†Rounds to less than 0.1% of net assets.
*The principal amount is stated in U.S. dollars unless otherwise indicated.
aNon-income producing.
bThe security was issued on a discount basis with no stated coupon rate.
| | | | |
| | | |
| | The accompanying notes are an integral part of these financial statements. | Annual Report | | TG-13 |
FRANKLIN TEMPLETON VARIABLE INSURANCE PRODUCTS TRUST
FINANCIAL STATEMENTS
Statement of Assets and Liabilities
December 31, 2019
| | |
| | | Templeton Growth VIP Fund |
| |
Assets: | | |
Investments in securities: | | |
Cost - Unaffiliated issuers | | $679,657,049 |
| | |
| |
Value - Unaffiliated issuers | | $755,510,153 |
Cash | | 197,146 |
Foreign currency, at value (cost $27,041,023) | | 27,083,323 |
Receivables: | | |
Investment securities sold | | 232,331 |
Capital shares sold | | 13,306 |
Dividends and interest | | 2,629,540 |
European Union tax reclaims | | 783,907 |
| |
Other assets | | 130 |
| | |
| |
Total assets | | 786,449,836 |
| | |
| |
Liabilities: | | |
| |
Payables: | | |
| |
Investment securities purchased | | 26,201 |
| |
Capital shares redeemed | | 300,820 |
| |
Management fees | | 546,685 |
| |
Distribution fees | | 146,903 |
| |
Reports to shareholders | | 137,329 |
| |
Deferred tax | | 388,289 |
| |
Accrued expenses and other liabilities | | 173,937 |
| | |
| |
Total liabilities | | 1,720,164 |
| | |
| |
Net assets, at value | | $784,729,672 |
| | |
| |
Net assets consist of: | | |
| |
Paid-in capital | | $707,926,170 |
| |
Total distributable earnings (losses) | | 76,803,502 |
| | |
| |
Net assets, at value | | $784,729,672 |
| | |
| |
Class 1: | | |
| |
Net assets, at value | | $ 97,987,671 |
| | |
| |
Shares outstanding | | 8,784,532 |
| | |
| |
Net asset value and maximum offering price per share | | $11.15 |
| | |
| |
Class 2: | | |
| |
Net assets, at value | | $659,411,963 |
| | |
| |
Shares outstanding | | 60,473,438 |
| | |
| |
Net asset value and maximum offering price per share | | $10.90 |
| | |
| |
Class 4: | | |
| |
Net assets, at value | | $ 27,330,038 |
| | |
| |
Shares outstanding | | 2,468,207 |
| | |
| |
Net asset value and maximum offering price per share | | $11.07 |
| | |
| | | | |
| | |
TG-14 | | Annual Report | The accompanying notes are an integral part of these financial statements. |
FRANKLIN TEMPLETON VARIABLE INSURANCE PRODUCTS TRUST
FINANCIAL STATEMENTS
Statement of Operations
for the year ended December 31, 2019
| | |
| | | Templeton Growth
VIP Fund |
| |
Investment income: | | |
Dividends: (net of foreign taxes)* | | |
Unaffiliated issuers | | $ 28,318,210 |
Interest: | | |
Unaffiliated issuers | | 573,162 |
Income from securities loaned: | | |
Unaffiliated issuers (net of fees and rebates) | | 50,429 |
Non-controlled affiliates (Note 3e) | | 87,077 |
| | |
| |
Total investment income | | 29,028,878 |
| | |
Expenses: | | |
Management fees (Note 3a) | | 7,019,870 |
Distribution fees: (Note 3c) | | |
Class 2 | | 1,604,456 |
Class 4 | | 97,819 |
Custodian fees (Note 4) | | 51,910 |
Reports to shareholders | | 180,621 |
Professional fees | | 107,455 |
Trustees’ fees and expenses | | 5,596 |
Other | | 38,324 |
| | |
| |
Total expenses | | 9,106,051 |
| |
Expenses waived/paid by affiliates (Note 3e) | | (15,725) |
| | |
| |
Net expenses | | 9,090,326 |
| | |
| |
Net investment income | | 19,938,552 |
| | |
| |
Realized and unrealized gains (losses): | | |
| |
Net realized gain (loss) from: | | |
| |
Investments: | | |
| |
Unaffiliated issuers | | (13,454,965) |
| |
Foreign currency transactions | | (129,722) |
| | |
| |
Net realized gain (loss) | | (13,584,687) |
| | |
Net change in unrealized appreciation (depreciation) on: | | |
| |
Investments: | | |
| |
Unaffiliated issuers | | 128,566,054 |
| |
Translation of other assets and liabilities denominated in foreign currencies | | (3,746) |
| |
Change in deferred taxes on unrealized appreciation | | (388,289) |
| | |
| |
Net change in unrealized appreciation (depreciation) | | 128,174,019 |
| | |
| |
Net realized and unrealized gain (loss) | | 114,589,332 |
| | |
| |
Net increase (decrease) in net assets resulting from operations | | $134,527,884 |
| | |
| |
*Foreign taxes withheld on dividends. | | $ 2,130,837 |
| | | | |
| | | |
| | The accompanying notes are an integral part of these financial statements. | Annual Report | | TG-15 |
FRANKLIN TEMPLETON VARIABLE INSURANCE PRODUCTS TRUST
FINANCIAL STATEMENTS
Statements of Changes in Net Assets
| | | | | | | | |
| | | Templeton Growth VIP Fund | |
| |
| | | Year Ended December 31, | |
| | |
| | | 2019 | | | 2018 | |
Increase (decrease) in net assets: | | | | | | | | |
| | |
Operations: | | | | | | | | |
| | |
Net investment income | | $ | 19,938,552 | | | $ | 21,598,649 | |
| | |
Net realized gain (loss) | | | (13,584,687 | ) | | | 145,036,204 | |
| | |
Net change in unrealized appreciation (depreciation) | | | 128,174,019 | | | | (344,182,476 | ) |
| | | | |
| | |
Net increase (decrease) in net assets resulting from operations | | | 134,527,884 | | | | (177,547,623 | ) |
| | | | |
| | |
Distributions to shareholders: | | | | | | | | |
| | |
Class 1 | | | (20,901,613 | ) | | | (44,508,681 | ) |
| | |
Class 2 | | | (139,418,589 | ) | | | (82,384,314 | ) |
| | |
Class 4 | | | (6,044,047 | ) | | | (3,542,055 | ) |
| | | | |
| | |
Total distributions to shareholders | | | (166,364,249 | ) | | | (130,435,050 | ) |
| | | | |
| | |
Capital share transactions: (Note 2) | | | | | | | | |
| | |
Class 1 | | | (275,115,440 | ) | | | (7,474,527 | ) |
| | |
Class 2 | | | 82,734,600 | | | | (59,234,414 | ) |
| | |
Class 4 | | | 1,233,451 | | | | (2,120,747 | ) |
| | | | |
| | |
Total capital share transactions | | | (191,147,389 | ) | | | (68,829,688 | ) |
| | | | |
| | |
Net increase (decrease) in net assets | | | (222,983,754 | ) | | | (376,812,361 | ) |
| | |
Net assets: | | | | | | | | |
| | |
Beginning of year | | | 1,007,713,426 | | | | 1,384,525,787 | |
| | | | |
| | |
End of year | | $ | 784,729,672 | | | $ | 1,007,713,426 | |
| | | | |
| | | | |
| | |
TG-16 | | Annual Report | The accompanying notes are an integral part of these financial statements. |
FRANKLIN TEMPLETON VARIABLE INSURANCE PRODUCTS TRUST
Notes to Financial Statements
Templeton Growth VIP Fund
1. Organization and Significant Accounting Policies
Franklin Templeton Variable Insurance Products Trust (Trust) is registered under the Investment Company Act of 1940 (1940 Act) as anopen-end management investment company, consisting of eighteen separate funds and applies the specialized accounting and reporting guidance in U.S. Generally Accepted Accounting Principles (U.S. GAAP). Templeton Growth VIP Fund (Fund) is included in this report. Shares of the Fund are generally sold only to insurance company separate accounts to fund the benefits of variable life insurance policies or variable annuity contracts. The Fund offers three classes of shares: Class 1, Class 2 and Class 4. Each class of shares may differ by its distribution fees, voting rights on matters affecting a single class and its exchange privilege.
The following summarizes the Fund’s significant accounting policies.
a. Financial Instrument Valuation
The Fund’s investments in financial instruments are carried at fair value daily. Fair value is the price that would be received to sell an asset or paid to transfer a liability in an orderly transaction between market participants on the measurement date. The Fund calculates the net asset value (NAV) per share each business day as of 4 p.m. Eastern time or the regularly scheduled close of the New York Stock Exchange (NYSE), whichever is earlier. Under compliance policies and procedures approved by the Trust’s Board of Trustees (the Board), the Fund’s administrator has responsibility for oversight of valuation, including leading the cross-functional Valuation Committee (VC). The Fund may utilize independent pricing services, quotations from securities and financial instrument dealers, and other market sources to determine fair value.
Equity securities listed on an exchange or on the NASDAQ National Market System are valued at the last quoted sale price or the official closing price of the day, respectively. Foreign equity securities are valued as of the close of trading on the foreign stock exchange on which the security is primarily traded, or as of 4 p.m. Eastern time. The value is then converted into its U.S. dollar equivalent at the foreign exchange rate in effect at 4 p.m. Eastern time on the day that the value of the security is determined.Over-the-counter (OTC) securities are valued within the range of the most recent quoted bid and ask prices. Securities that trade in multiple markets or on multiple exchanges are valued
according to the broadest and most representative market. Certain equity securities are valued based upon fundamental characteristics or relationships to similar securities.
Debt securities generally trade in the OTC market rather than on a securities exchange. The Fund’s pricing services use multiple valuation techniques to determine fair value. In instances where sufficient market activity exists, the pricing services may utilize a market-based approach through which quotes from market makers are used to determine fair value. In instances where sufficient market activity may not exist or is limited, the pricing services also utilize proprietary valuation models which may consider market characteristics such as benchmark yield curves, credit spreads, estimated default rates, anticipated market interest rate volatility, coupon rates, anticipated timing of principal repayments, underlying collateral, and other unique security features in order to estimate the relevant cash flows, which are then discounted to calculate the fair value.
Investments inopen-end mutual funds are valued at the closing NAV. Investments in time deposits are valued at cost, which approximates fair value.
The Fund has procedures to determine the fair value of financial instruments for which market prices are not reliable or readily available. Under these procedures, the Fund primarily employs a market-based approach which may use related or comparable assets or liabilities, recent transactions, market multiples, book values, and other relevant information for the investment to determine the fair value of the investment. An income-based valuation approach may also be used in which the anticipated future cash flows of the investment are discounted to calculate fair value. Discounts may also be applied due to the nature or duration of any restrictions on the disposition of the investments. Due to the inherent uncertainty of valuations of such investments, the fair values may differ significantly from the values that would have been used had an active market existed.
Trading in securities on foreign securities stock exchanges and OTC markets may be completed before 4 p.m. Eastern time. In addition, trading in certain foreign markets may not take place on every Fund’s business day. Occasionally, events occur between the time at which trading in a foreign security is completed and 4 p.m. Eastern time that might call into question the reliability of the value of a portfolio security held by the Fund. As a result, differences may arise between the value of the Fund’s portfolio securities as determined at
FRANKLIN TEMPLETON VARIABLE INSURANCE PRODUCTS TRUST
NOTES TO FINANCIAL STATEMENTS
Templeton Growth VIP Fund(continued)
1. Organization and Significant Accounting Policies(continued)
a. Financial Instrument Valuation(continued)
the foreign market close and the latest indications of value at 4 p.m. Eastern time. In order to minimize the potential for these differences, the VC monitors price movements following the close of trading in foreign stock markets through a series of country specific market proxies (such as baskets of American Depositary Receipts, futures contracts and exchange traded funds). These price movements are measured against established trigger thresholds for each specific market proxy to assist in determining if an event has occurred that may call into question the reliability of the values of the foreign securities held by the Fund. If such an event occurs, the securities may be valued using fair value procedures, which may include the use of independent pricing services.
When the last day of the reporting period is anon-business day, certain foreign markets may be open on those days that the Fund’s NAV is not calculated, which could result in differences between the value of the Fund’s portfolio securities on the last business day and the last calendar day of the reporting period. Any significant security valuation changes due to an open foreign market are adjusted and reflected by the Fund for financial reporting purposes.
b. Foreign Currency Translation
Portfolio securities and other assets and liabilities denominated in foreign currencies are translated into U.S. dollars based on the exchange rate of such currencies against U.S. dollars on the date of valuation. The Fund may enter into foreign currency exchange contracts to facilitate transactions denominated in a foreign currency. Purchases and sales of securities, income and expense items denominated in foreign currencies are translated into U.S. dollars at the exchange rate in effect on the transaction date. Portfolio securities and assets and liabilities denominated in foreign currencies contain risks that those currencies will decline in value relative to the U.S. dollar. Occasionally, events may impact the availability or reliability of foreign exchange rates used to convert the U.S. dollar equivalent value. If such an event occurs, the foreign exchange rate will be valued at fair value using procedures established and approved by the Board.
The Fund does not separately report the effect of changes in foreign exchange rates from changes in market prices on securities held. Such changes are included in net realized and unrealized gain or loss from investments in the Statement of Operations.
Realized foreign exchange gains or losses arise from sales of foreign currencies, currency gains or losses realized between the trade and settlement dates on securities transactions and the difference between the recorded amounts of dividends, interest, and foreign withholding taxes and the U.S. dollar equivalent of the amounts actually received or paid. Net unrealized foreign exchange gains and losses arise from changes in foreign exchange rates on foreign denominated assets and liabilities other than investments in securities held at the end of the reporting period.
c. Securities Lending
The Fund participates in an agency based securities lending program to earn additional income. The Fund receives cash collateral against the loaned securities in an amount equal to at least 102% of the fair value of the loaned securities. Collateral is maintained over the life of the loan in an amount not less than 100% of the fair value of loaned securities, as determined at the close of Fund business each day; any additional collateral required due to changes in security values is delivered to the Fund on the next business day. The collateral is deposited into a joint cash account with other funds and is used to invest in a money market fund managed by Franklin Advisers, Inc., an affiliate of the Fund. The Fund may receive income from the investment of cash collateral, in addition to lending fees and rebates paid by the borrower. Income from securities loaned, net of fees paid to the securities lending agent and/or third-party vendor, is reported separately in the Statement of Operations. The Fund bears the market risk with respect to the collateral investment, securities loaned, and the risk that the agent may default on its obligations to the Fund. If the borrower defaults on its obligation to return the securities loaned, the Fund has the right to repurchase the securities in the open market using the collateral received. The securities lending agent has agreed to indemnify the Fund in the event of default by a third party borrower. At December 31, 2019, the fund had no securities on loan.
FRANKLIN TEMPLETON VARIABLE INSURANCE PRODUCTS TRUST
NOTES TO FINANCIAL STATEMENTS
Templeton Growth VIP Fund(continued)
d. Income and Deferred Taxes
It is the Fund’s policy to qualify as a regulated investment company under the Internal Revenue Code. The Fund intends to distribute to shareholders substantially all of its taxable income and net realized gains to relieve it from federal income and if applicable, excise taxes. As a result, no provision for U.S. federal income taxes is required.
The Fund may be subject to foreign taxation related to income received, capital gains on the sale of securities and certain foreign currency transactions in the foreign jurisdictions in which it invests. Foreign taxes, if any, are recorded based on the tax regulations and rates that exist in the foreign markets in which the Fund invests. When a capital gain tax is determined to apply, the Fund records an estimated deferred tax liability in an amount that would be payable if the securities were disposed of on the valuation date.
As a result of several court cases, in certain countries across the European Union, the Fund filed additional tax reclaims for previously withheld taxes on dividends earned in those countries (EU reclaims). These additional filings are subject to various administrative proceedings by the local jurisdictions’ tax authorities within the European Union, as well as a number of related judicial proceedings. Income recognized, if any, for EU reclaims is reflected as other income in the Statement of Operations and any related receivable, if any, is reflected as European Union tax reclaims in the Statement of Assets and Liabilities. When uncertainty exists as to the ultimate resolution of these proceedings, the likelihood of receipt of these EU reclaims, and the potential timing of payment, no amounts are reflected in the financial statements. For U.S. income tax purposes, when EU reclaims are received by the Fund and the Fund previously passed foreign tax credit on to its shareholders, the Fund must either amend historic tax reporting to shareholders or enter into a closing agreement with the Internal Revenue Service (IRS) in order to pay the associated tax liability on behalf of the Fund’s shareholders.
The Fund may recognize an income tax liability related to its uncertain tax positions under U.S. GAAP when the uncertain tax position has a less than 50% probability that it will be sustained upon examination by the tax authorities based on its technical merits. As of December 31, 2019, the Fund has determined that no tax liability is required in its financial statements related to uncertain tax positions for any open tax years (or expected to be taken in future tax years). Open tax
years are those that remain subject to examination and are based on the statute of limitations in each jurisdiction in which the Fund invests.
e. Security Transactions, Investment Income, Expenses and Distributions
Security transactions are accounted for on trade date. Realized gains and losses on security transactions are determined on a specific identification basis. Interest income and estimated expenses are accrued daily. Dividend income and capital gain distributions are recorded on theex-dividend date except for certain dividends from securities where the dividend rate is not available. In such cases, the dividend is recorded as soon as the information is received by the Fund. Distributions to shareholders are recorded on theex-dividend date. Distributable earnings are determined according to income tax regulations (tax basis) and may differ from earnings recorded in accordance with U.S. GAAP. These differences may be permanent or temporary. Permanent differences are reclassified among capital accounts to reflect their tax character. These reclassifications have no impact on net assets or the results of operations. Temporary differences are not reclassified, as they may reverse in subsequent periods.
Common expenses incurred by the Trust are allocated among the Funds based on the ratio of net assets of each Fund to the combined net assets of the Trust or based on the ratio of number of shareholders of each Fund to the combined number of shareholders of the Trust. Fund specific expenses are charged directly to the Fund that incurred the expense.
Realized and unrealized gains and losses and net investment income, excluding class specific expenses, are allocated daily to each class of shares based upon the relative proportion of net assets of each class. Differences in per share distributions by class are generally due to differences in class specific expenses.
f. Accounting Estimates
The preparation of financial statements in accordance with U.S. GAAP requires management to make estimates and assumptions that affect the reported amounts of assets and liabilities at the date of the financial statements and the amounts of income and expenses during the reporting period. Actual results could differ from those estimates.
FRANKLIN TEMPLETON VARIABLE INSURANCE PRODUCTS TRUST
NOTES TO FINANCIAL STATEMENTS
Templeton Growth VIP Fund(continued)
1. Organization and Significant Accounting Policies(continued)
g. Guarantees and Indemnifications
Under the Trust’s organizational documents, its officers and trustees are indemnified by the Trust against certain liabilities arising out of the performance of their duties to the Trust.
Additionally, in the normal course of business, the Trust, on behalf of the Fund, enters into contracts with service providers that contain general indemnification clauses. The Trust’s maximum exposure under these arrangements is unknown as this would involve future claims that may be made against the Trust that have not yet occurred. Currently, the Trust expects the risk of loss to be remote.
2. Shares of Beneficial Interest
At December 31, 2019, there were an unlimited number of shares authorized (without par value). Transactions in the Fund’s shares were as follows:
| | | | | | | | | | | | | | | | |
| | | Year Ended December 31, | |
| | | | |
| | |
| | | 2019 | | | 2018 | |
| | | | |
| | | | |
| | | Shares | | | Amount | | | Shares | | | Amount | |
| |
Class 1 Shares: | | | | | | | | | | | | | | | | |
Shares sold | | | 68,873 | | | $ | 790,173 | | | | 751,581 | | | $ | 10,285,009 | |
Shares issued in reinvestment of distributions | | | 2,083,910 | | | | 20,901,613 | | | | 3,065,336 | | | | 44,508,681 | |
Shares redeemed | | | (21,838,635 | ) | | | (296,807,226 | ) | | | (4,049,692 | ) | | | (62,268,217) | |
| | | | |
| | | | |
Net increase (decrease) | | | (19,685,852 | ) | | $ | (275,115,440 | ) | | | (232,775 | ) | | $ | (7,474,527) | |
| | | | |
Class 2 Shares: | | | | | | | | | | | | | | | | |
Shares sold | | | 3,619,417 | | | $ | 39,550,989 | | | | 2,342,753 | | | $ | 33,884,634 | |
Shares issued in reinvestment of distributions | | | 14,197,412 | | | | 139,418,589 | | | | 5,773,252 | | | | 82,384,314 | |
Shares redeemed | | | (8,538,686 | ) | | | (96,234,978 | ) | | | (11,984,334 | ) | | | (175,503,362) | |
| | | | |
| | | | |
Net increase (decrease) | | | 9,278,143 | | | $ | 82,734,600 | | | | (3,868,329 | ) | | $ | (59,234,414) | |
| | | | |
| | | | |
Class 4 Shares: | | | | | | | | | | | | | | | | |
Shares sold | | | 148,576 | | | $ | 1,690,506 | | | | 154,144 | | | $ | 2,180,515 | |
Shares issued in reinvestment of distributions | | | 605,616 | | | | 6,044,047 | | | | 245,125 | | | | 3,542,055 | |
Shares redeemed | | | (571,458 | ) | | | (6,501,102 | ) | | | (518,871 | ) | | | (7,843,317) | |
| | | | |
| | | | |
Net increase (decrease) | | | 182,734 | | | $ | 1,233,451 | | | | (119,602 | ) | | $ | (2,120,747) | |
| | | | |
3. Transactions with Affiliates
Franklin Resources, Inc. is the holding company for various subsidiaries that together are referred to as Franklin Templeton. Certain officers and trustees of the Fund are also officers and/or directors of the following subsidiaries:
| | |
| Subsidiary | | Affiliation |
| |
Templeton Global Advisors Limited (Global Advisors) | | Investment manager |
| |
Franklin Templeton Services, LLC (FT Services) | | Administrative manager |
| |
Franklin Templeton Distributors, Inc. (Distributors) | | Principal underwriter |
| |
Franklin Templeton Investor Services, LLC (Investor Services) | | Transfer agent |
FRANKLIN TEMPLETON VARIABLE INSURANCE PRODUCTS TRUST
NOTES TO FINANCIAL STATEMENTS
Templeton Growth VIP Fund(continued)
a. Management Fees
The Fund pays an investment management fee to Global Advisors based on the average daily net assets of the Fund as follows:
| | |
| Annualized Fee Rate | | Net Assets |
1.000% | | Up to and including $100 million |
0.900% | | Over $100 million, up to and including $250 million |
0.800% | | Over $250 million, up to and including $500 million |
0.750% | | Over $500 million, up to and including $1 billion |
0.700% | | Over $1 billion, up to and including $5 billion |
0.675% | | Over $5 billion, up to and including $10 billion |
0.655% | | Over $10 billion, up to and including $15 billion |
0.635% | | Over $15 billion, up to and including $20 billion |
0.615% | | In excess of $20 billion |
For the year ended December 31, 2019, the gross effective investment management fee rate was 0.819% of the Fund’s average daily net assets.
b. Administrative Fees
Under an agreement with Global Advisors, FT Services provides administrative services to the Fund. The fee is paid by Global Advisors based on the Fund’s average daily net assets, and is not an additional expense of the Fund.
c. Distribution Fees
The Board has adopted distribution plans for Class 2 and Class 4 shares pursuant to Rule12b-1 under the 1940 Act. Under the Fund’s compensation distribution plans, the Fund pays Distributors for costs incurred in connection with the servicing, sale and distribution of the Fund’s shares up to 0.35% per year of its average daily net assets of each class. The Board has agreed to limit the current rate to 0.25% per year for Class 2. The plan year, for purposes of monitoring compliance with the maximum annual plan rates, is February 1 through January 31.
d. Transfer Agent Fees
Investor Services, under terms of an agreement, performs shareholder servicing for the Fund and is not paid by the Fund for the services.
FRANKLIN TEMPLETON VARIABLE INSURANCE PRODUCTS TRUST
NOTES TO FINANCIAL STATEMENTS
Templeton Growth VIP Fund(continued)
3. Transactions with Affiliates(continued)
e. Investments in Affiliated Management Investment Companies
The Fund invests in one or more affiliated management investment companies for purposes other than exercising a controlling influence over the management or policies. Management fees paid by the Fund are waived on assets invested in the affiliated management investment companies, as noted in the Statement of Operations, in an amount not to exceed the management and administrative fees paid directly or indirectly by each affiliate. During the year ended December 31, 2019, the Fund held investments in affiliated management investment companies as follows:
| | | | | | | | | | | | | | | | | | | | | | | | | | | | | | | | |
| | | Value at
Beginning
of Year | | | Purchases | | | Sales | | | Realized
Gain (Loss) | | | Net Change in Unrealized
Appreciation
(Depreciation) | | | Value at
End of
Year | | | Number of
Shares
Held at End
of Year | | | Income from
securities
loaned | |
| |
Non-Controlled Affiliates | | | | | | | | | | | | | | | | | | | | | | | | | | | | | | | | |
Institutional Fiduciary Trust Money Market Portfolio, 1.26% | | | $12,394,593 | | | | $156,184,244 | | | | $(168,578,837 | ) | | | $— | | | | $— | | | | $— | | | | — | | | | $87,077 | |
| | | | | | | | | | | | |
f. Interfund Transactions
The Fund engaged in purchases and sales of investments with funds or other accounts that have common investment managers (or affiliated investment managers), directors, trustees or officers. During the year ended December 31, 2019, these purchase and sale transactions aggregated $0 and $7,221,547, respectively.
4. Expense Offset Arrangement
The Fund has entered into an arrangement with its custodian whereby credits realized as a result of uninvested cash balances are used to reduce a portion of the Fund’s custodian expenses. During the year ended December 31, 2019, there were no credits earned.
5. Income Taxes
For tax purposes, capital losses may be carried over to offset future capital gains.
On December 31, 2019, the capital loss carryforwards were as follows:
| | | | |
Capital loss carryforwards not subject to expiration: | | | | |
| |
Short term | | | $1,856,399 | |
| |
Long term | | | 3,209,150 | |
| | | | |
| |
Total capital loss carryforwards | | | $5,065,549 | |
| | | | |
The tax character of distributions paid during the years ended December 31, 2019 and 2018, was as follows:
| | | | | | | | |
| | | 2019 | | | 2018 | |
| | | | |
Distributions paid from: | | | | | | | | |
| | |
Ordinary income | | $ | 35,138,144 | | | $ | 33,715,376 | |
| | |
Long term capital gain | | | 131,226,105 | | | | 96,719,674 | |
| | | | |
| | $ | 166,364,249 | | | $ | 130,435,050 | |
| | | | |
FRANKLIN TEMPLETON VARIABLE INSURANCE PRODUCTS TRUST
NOTES TO FINANCIAL STATEMENTS
Templeton Growth VIP Fund(continued)
At December 31, 2019, the cost of investments, net unrealized appreciation (depreciation) and undistributed ordinary income for income tax purposes were as follows:
| | | | |
Cost of investments | | $ | 693,867,257 | |
| | | | |
| |
Unrealized appreciation | | $ | 128,868,370 | |
Unrealized depreciation | | | (67,225,474) | |
| | | | |
| |
Net unrealized appreciation (depreciation) | | $ | 61,642,896 | |
| | | | |
| |
Distributable earnings: | | | | |
Undistributed ordinary income | | $ | 19,829,425 | |
| | | | |
Differences between income and/or capital gains as determined on a book basis and a tax basis are primarily due to differing treatment of wash sales.
6. Investment Transactions
Purchases and sales of investments (excluding short term securities) for the year ended December 31, 2019, aggregated $160,700,800 and $558,032,335, respectively.
7. Concentration of Risk
Investing in foreign securities may include certain risks and considerations not typically associated with investing in U.S. securities, such as fluctuating currency values and changing local, regional and global economic, political and social conditions, which may result in greater market volatility. Current political and financial uncertainty surrounding the European Union may increase market volatility and the economic risk of investing in securities in Europe. In addition, certain foreign securities may not be as liquid as U.S. securities.
8. Credit Facility
The Fund, together with other U.S. registered and foreign investment funds (collectively, Borrowers), managed by Franklin Templeton, are borrowers in a joint syndicated senior unsecured credit facility totaling $2 billion (Global Credit Facility) which matured on February 7, 2020. This Global Credit Facility provides a source of funds to the Borrowers for temporary and emergency purposes, including the ability to meet future unanticipated or unusually large redemption requests. Effective February 7, 2020, the Borrowers renewed the Global Credit Facility for a one year term, maturing February 5, 2021, for a total of $2 billion.
Under the terms of the Global Credit Facility, the Fund shall, in addition to interest charged on any borrowings made by the Fund and other costs incurred by the Fund, pay its share of fees and expenses incurred in connection with the implementation and maintenance of the Global Credit Facility, based upon its relative share of the aggregate net assets of all of the Borrowers, including an annual commitment fee of 0.15% based upon the unused portion of the Global Credit Facility. These fees are reflected in other expenses in the Statement of Operations. During the year ended December 31, 2019, the Fund did not use the Global Credit Facility.
FRANKLIN TEMPLETON VARIABLE INSURANCE PRODUCTS TRUST
NOTES TO FINANCIAL STATEMENTS
Templeton Growth VIP Fund(continued)
9. Fair Value Measurements
The Fund follows a fair value hierarchy that distinguishes between market data obtained from independent sources (observable inputs) and the Fund’s own market assumptions (unobservable inputs). These inputs are used in determining the value of the Fund’s financial instruments and are summarized in the following fair value hierarchy:
| | • | | Level 1 – quoted prices in active markets for identical financial instruments |
| | • | | Level 2 – other significant observable inputs (including quoted prices for similar financial instruments, interest rates, prepayment speed, credit risk, etc.) |
| | • | | Level 3 – significant unobservable inputs (including the Fund’s own assumptions in determining the fair value of financial instruments) |
The input levels are not necessarily an indication of the risk or liquidity associated with financial instruments at that level.
A summary of inputs used as of December 31, 2019, in valuing the Fund’s assets carried at fair value, is as follows:
| | | | | | | | | | | | | | | | |
| | | Level 1 | | | Level 2 | | | Level 3 | | | Total | |
| |
| | | | |
Assets: | | | | | | | | | | | | | | | | |
| | | | |
Investments in Securities:a | | | | | | | | | | | | | | | | |
| | | | |
Equity Investments | | $ | 716,310,153 | | | $ | — | | | $ | — | | | $ | 716,310,153 | |
| | | | |
Short Term Investments | | | — | | | | 39,200,000 | | | | — | | | | 39,200,000 | |
| | | | |
| | | | |
Total Investments in Securities | | $ | 716,310,153 | | | $ | 39,200,000 | | | $ | — | | | $ | 755,510,153 | |
| | | | |
aFor detailed categories, see the accompanying Statement of Investments.
10. Subsequent Events
The Fund has evaluated subsequent events through the issuance of the financial statements and determined that no events have occurred that require disclosure other than those already disclosed in the financial statements.
Abbreviations
| | |
| Selected Portfolio |
| |
ADR | | American Depositary Receipt |
FFCB | | Federal Farm Credit Bank |
IDR | | International Depositary Receipt |
FRANKLIN TEMPLETON VARIABLE INSURANCE PRODUCTS TRUST
Report of Independent Registered Public Accounting Firm
To the Board of Trustees of Franklin Templeton Variable Insurance Products Trust and Shareholders of Templeton Growth VIP Fund
Opinion on the Financial Statements
We have audited the accompanying statement of assets and liabilities, including the statement of investments, of Templeton Growth VIP Fund (the “Fund") as of December 31, 2019, the related statement of operations for the year ended December 31, 2019, the statement of changes in net assets for each of the two years in the period ended December 31, 2019, including the related notes, and the financial highlights for each of the five years in the period ended December 31, 2019 (collectively referred to as the “financial statements”). In our opinion, the financial statements present fairly, in all material respects, the financial position of the Fund as of December 31, 2019, the results of its operations for the year then ended, the changes in its net assets for each of the two years in the period ended December 31, 2019 and the financial highlights for each of the five years in the period ended December 31, 2019 in conformity with accounting principles generally accepted in the United States of America.
Basis for Opinion
These financial statements are the responsibility of the Fund’s management. Our responsibility is to express an opinion on the Fund’s financial statements based on our audits. We are a public accounting firm registered with the Public Company Accounting Oversight Board (United States) (PCAOB) and are required to be independent with respect to the Fund in accordance with the U.S. federal securities laws and the applicable rules and regulations of the Securities and Exchange Commission and the PCAOB.
We conducted our audits of these financial statements in accordance with the standards of the PCAOB. Those standards require that we plan and perform the audit to obtain reasonable assurance about whether the financial statements are free of material misstatement, whether due to error or fraud.
Our audits included performing procedures to assess the risks of material misstatement of the financial statements, whether due to error or fraud, and performing procedures that respond to those risks. Such procedures included examining, on a test basis, evidence regarding the amounts and disclosures in the financial statements. Our audits also included evaluating the accounting principles used and significant estimates made by management, as well as evaluating the overall presentation of the financial statements. Our procedures included confirmation of securities owned as of December 31, 2019 by correspondence with the custodian and brokers; when replies were not received from brokers, we performed other auditing procedures. We believe that our audits provide a reasonable basis for our opinion.
PricewaterhouseCoopers LLP
San Francisco, California
February 20, 2020
We have served as the auditor of one or more investment companies in the Franklin Templeton Group of Funds since 1948.
FRANKLIN TEMPLETON VARIABLE INSURANCE PRODUCTS TRUST
Tax Information (unaudited)
Templeton Growth VIP Fund
Under Section 852(b)(3)(C) of the Internal Revenue Code, the Fund hereby reports the maximum amount allowable but no less than $131,226,105 as a long term capital gain dividend for the fiscal year ended December 31, 2019.
Under Section 854(b)(1)(A) of the Internal Revenue Code, the Fund hereby reports 19.63% of the ordinary income dividends as income qualifying for the dividends received deduction for the fiscal year ended December 31, 2019.
At December 31, 2019, more than 50% of the Fund’s total assets were invested in securities of foreign issuers. In most instances, foreign taxes were withheld from income paid to the Fund on these investments. The Fund elects to treat foreign taxes paid as allowed under Section 853 of the Internal Revenue Code. This election will allow shareholders of record as of the 2020 distribution date, to treat their proportionate share of foreign taxes paid by the Fund as having been paid directly by them. The shareholder shall consider these amounts as foreign taxes paid in the tax year in which they receive the Fund distribution.
FRANKLIN TEMPLETON VARIABLE INSURANCE PRODUCTS TRUST
Index Descriptions
The indexes are unmanaged and include reinvestment of any income or distributions (after the deduction of certain withholding taxes for the NR or Net Return Index). They do not reflect any fees, expenses or sales charges.
For Russell Indexes: Frank Russell Company is the source and owner of the trademarks, service marks and copyrights related to the Russell Indexes. Russell® is a trademark of Frank Russell Company.
See www.franklintempletondatasources.com for additional data provider information.
Bloomberg Barclays1-3 Month U.S. Treasury Bill Indexmeasures the performance of U.S. Treasury bills that have a remaining maturity of greater than or equal to one month and less than three months.
Bloomberg Barclays U.S. Aggregate Bond Indexis a market capitalization-weighted index representing the U.S. investment-grade, fixed-rate, taxable bond market with index components for government and corporate, mortgage pass-through and asset-backed securities. All issues included are SEC registered, taxable, dollar denominated and nonconvertible, must have at least one year to final maturity and must be rated investment grade(Baa3/BBB-/BBB- or higher) using the middle rating of Moody’s, Standard & Poor’s and Fitch, respectively.
Bloomberg Barclays U.S. Corporate Bond Indexmeasures the investment grade, fixed-rate, taxable corporate bond market. It includes U.S. dollar-denominated securities publicly issued by U.S. andnon-U.S. industrial, utility and financial issuers.
Bloomberg Barclays U.S. Corporate High Yield Bond Indexmeasures the U.S. dollar-denominated, high yield, fixed-rate corporate bond market. Securities are classified as high yield if the middle rating of Moody’s, Fitch and Standard & Poor’s is Ba1/BB+/BB+ or below.
Bloomberg Barclays U.S. Government Index: Intermediate Componentis the intermediate component of the Barclays U.S. Government Index, which includes public obligations of the U.S. Treasury with at least one year to final maturity and publicly issued debt of U.S. government agencies, quasi-federal corporations, and corporate or foreign debt guaranteed by the U.S. government.
Bloomberg Barclays U.S. High Yield Very Liquid Indexis a component of the U.S. Corporate High Yield Index designed to track a more liquid component of the U.S. dollar-denominated, high-yield fixed-rate corporate bond market.
Bloomberg Barclays U.S. Treasury Indexmeasures U.S. dollar-denominated, fixed-rate, nominal debt issued by the U.S. Treasury with at least one year until final maturity.
Consumer Price Index (CPI)is a commonly used measure of the inflation rate.
FTSE® EPRA®/NAREIT® Developed Indexis a free float-adjusted index designed to measure the performance of publicly traded real estate securities in the North American, European and Asian real estate markets.
FTSE World Government Bond Indexis a market capitalization-weighted index consisting of investment-grade world government bond markets.
J.P. Morgan (JPM) Global Government Bond Index (GGBI)tracks total returns for liquid, fixed-rate, domestic government bonds with maturities greater than one year issued by developed countries globally.
Lipper Multi-Sector Income Funds Classification Averageis calculated by averaging the total returns of all funds within the Lipper Multi-Sector Income Funds Classification in the LipperOpen-End underlying funds universe. Lipper Multi-Sector Income Funds are defined as funds that seek current income by allocation of assets among different fixed income securities sectors (not primarily in one sector except for defensive purposes), including U.S. and foreign governments, with a significant portion rated below investment grade. For the12-month period ended 12/31/19, there were 324 funds in this category. Lipper calculations do not include contract fees, expenses or sales charges, and may have been different if such charges had been considered.
Lipper VIP General U.S. Government Funds Classification Averageis an equally weighted average calculation of performance figures for all funds within the Lipper General U.S. Government Funds classification in the Lipper VIP underlying funds universe. Lipper General U.S. Government
FRANKLIN TEMPLETON VARIABLE INSURANCE PRODUCTS TRUST
INDEX DESCRIPTIONS
Funds invest primarily in U.S. government and agency issues. For the12-month period ended 12/31/19, there were 26 funds in this category. Lipper calculations do not include contract fees, expenses or sales charges, and may have been different if such charges had been considered.
MSCI All Country Asia Indexis a free float-adjusted, market capitalization-weighted index designed to measure equity market performance in developed and emerging markets in Asia.
MSCI All Country World Index (ACWI)is a free float-adjusted, market capitalization-weighted index designed to measure equity market performance in global developed and emerging markets.
MSCI All Country World Index (ACWI) ex USA Indexis a free float-adjusted, market capitalization-weighted index designed to measure equity market performance in global developed and emerging markets, excluding the U.S.
MSCI Europe, Australasia, Far East (EAFE) Indexis a free float-adjusted market capitalization-weighted index designed to measure the equity market performance of developed markets, excluding the U.S. and Canada.
MSCI Emerging Markets (EM) Indexis a free float-adjusted, market capitalization-weighted index designed to measure equity market performance in global emerging markets.
MSCI USA High Dividend Yield Indexis based on the MSCI USA Index, its parent index, and includes large- andmid-capitalization stocks. The index is designed to reflect the performance of equities in the parent index (excluding real estate investment trusts) with higher dividend income and quality characteristics than average dividend yields that are both sustainable and persistent.
MSCI World Indexis a free float-adjusted, market capitalization-weighted index designed to measure equity market performance in global developed markets.
Russell 1000® Growth Indexis market capitalization weighted and measures performance of those Russell 1000® Index companies with relatively higherprice-to-book ratios and higher forecasted growth rates.
Russell 1000® Indexis market capitalization weighted and measures performance of the approximately 1,000 largest companies in the Russell 3000® Index, which represents the majority of the U.S. market’s total capitalization.
Russell 2000® Indexis market capitalization weighted and measures performance of the approximately 2,000 smallest companies in the Russell 3000® Index, which represent a small amount of the total market capitalization of the Russell 3000® Index.
Russell 2000® Value Indexis market capitalization weighted and measures performance of those Russell 2000® Index companies with relatively lowerprice-to-book ratios and lower forecasted growth rates.
Russell 3000® Growth Indexis market capitalization weighted and measures performance of those Russell 3000® Index companies with relatively higherprice-to-book ratios and higher forecasted growth rates.
Russell Midcap® Growth Indexis market capitalization weighted and measures performance of those Russell Midcap® Index companies with relatively higherprice-to-book ratios and higher forecasted growth rates.
Russell Midcap® Indexis market capitalization weighted and measures performance of the smallest companies in the Russell 1000® Index, which represents a modest amount of the Russell 1000® Index’s total market capitalization.
Standard & Poor’s® 500 Index (S&P 500®)is a market capitalization-weighted index of 500 stocks designed to measure total U.S. equity market performance.
Standard & Poor’s®/International Finance Corporation Investable (S&P/IFCI) Composite Indexis a free float-adjusted, market capitalization-weighted index designed to measure equity performance in global emerging markets.
FRANKLIN TEMPLETON VARIABLE INSURANCE PRODUCTS TRUST
Board Members and Officers
The name, year of birth and address of the officers and board members, as well as their affiliations, positions held with the Trust, principal occupations during at least the past five years and number of U.S. registered portfolios overseen in the Franklin Templeton fund complex, are shown below. Generally, each board member serves until that person’s successor is elected and qualified.
Independent Board Members
| | | | | | | | |
Name, Year of Birth and Address | | Position | | Length of Time Served | | Number of Portfolios in Fund Complex Overseen by Board Member* | | Other Directorships Held During at Least the Past 5 Years |
| | | | |
| Harris J. Ashton (1932) | | Trustee | | Since 1988 | | 134 | | Bar-S Foods (meat packing company) |
| One Franklin Parkway | | | | | | | | (1981-2010). |
| San Mateo, CA 94403-1906 | | | | | | | | |
|
| Principal Occupation During at Least the Past 5 Years: |
| Director of various companies; andformerly, Director, RBC Holdings, Inc. (bank holding company) (until 2002); and President, Chief Executive Officer and Chairman of the Board, General Host Corporation (nursery and craft centers) (until 1998). |
| | | | | |
Terrence J. Checki (1945) One Franklin Parkway San Mateo, CA 94403-1906 | | Trustee | | Since 2017 | | 113 | | Hess Corporation (exploration of oil and gas) (2014-present). |
|
| Principal Occupation During at Least the Past 5 Years: |
| Member of the Council on Foreign Relations (1996-present); Member of the National Committee on U.S.-China Relations (1999-present); member of the Board of Trustees of the Economic Club of New York (2013-present); member of the Board of Trustees of the Foreign Policy Association (2005-present) and member of various other boards of trustees and advisory boards; andformerly, Executive Vice President of the Federal Reserve Bank of New York and Head of its Emerging Markets and Internal Affairs Group and Member of Management Committee (1995-2014); and Visiting Fellow at the Council on Foreign Relations (2014). |
| | | | | |
Mary C. Choksi (1950) One Franklin Parkway San Mateo, CA 94403-1906 | | Trustee | | Since 2014 | | 134 | | Avis Budget Group Inc. (car rental) (2007-present), Omnicom Group Inc. (advertising and marketing communications services) (2011-present) and White Mountains Insurance Group, Ltd. (holding company) (2017-present) |
|
| Principal Occupation During at Least the Past 5 Years: |
| Director of various companies; andformerly, Founder and Senior Advisor, Strategic Investment Group (investment management group) (2015-2017); Founding Partner and Senior Managing Director, Strategic Investment Group (1987-2015); Founding Partner and Managing Director, Emerging Markets Management LLC (investment management firm) (1987-2011); and Loan Officer/Senior Loan Officer/Senior Pension Investment Officer, World Bank Group (international financial institution) (1977-1987). |
| | | | | |
Edith E. Holiday (1952) One Franklin Parkway San Mateo, CA 94403-1906 | | Lead Independent Trustee | | Trustee since 2005 and Lead Independent Trustee since March 2019 | | 134 | | Hess Corporation (exploration of oil and gas) (1993-present), Canadian National Railway (railroad) (2001-present), White Mountains Insurance Group, Ltd. (holding company) (2004-present), Santander Consumer USA Holdings, Inc. (consumer finance) (2016-present), RTI International Metals, Inc. (manufacture and distribution of titanium) (1999-2015) and H.J. Heinz Company (processed foods and allied products) (1994-2013). |
|
| Principal Occupation During at Least the Past 5 Years: |
| Director or Trustee of various companies and trusts; andformerly, Assistant to the President of the United States and Secretary of the Cabinet (1990-1993); General Counsel to the United States Treasury Department (1989-1990); and Counselor to the Secretary and Assistant Secretary for Public Affairs and Public Liaison–United States Treasury Department (1988-1989). |
FRANKLIN TEMPLETON VARIABLE INSURANCE PRODUCTS TRUST
Independent Board Members(continued)
| | | | | | | | |
Name, Year of Birth and Address | | Position | | Length of Time Served | | Number of Portfolios in Fund Complex Overseen by Board Member* | | Other Directorships Held During at Least the Past 5 Years |
| | | | |
J. Michael Luttig (1954) One Franklin Parkway San Mateo, CA 94403-1906 | | Trustee | | Since 2009 | | 134 | | Boeing Capital Corporation (aircraft financing) (2006-2013). |
|
| Principal Occupation During at Least the Past 5 Years: |
| Executive Vice President, Counselor and Senior Advisor to Boeing Chairman and Board of Directors, The Boeing Company (aerospace company) (2019-present); member of the Executive Council, The Boeing Company (2006-present) andformerly, General Counsel, The Boeing Company (2006-2019) and Federal Appeals Court Judge, U.S. Court of Appeals for the Fourth Circuit (1991-2006). |
| | | | |
Larry D. Thompson (1945) One Franklin Parkway San Mateo, CA 94403-1906 | | Trustee | | Since 2007 | | 134 | | The Southern Company (energy company) (2014-present; previously 2010-2012), Graham Holdings Company (education and media organization) (2011-present) and Cbeyond, Inc. (business communications provider) (2010-2012). |
|
| Principal Occupation During at Least the Past 5 Years: |
| Director of various companies; Counsel, Finch McCranie, LLP (law firm) (2015-present); Independent Compliance Monitor and Auditor, Volkswagen AG (manufacturer of automobiles and commercial vehicles) (2017-present); John A. Sibley Professor of Corporate and Business Law, University of Georgia School of Law (2015-present; previously 2011-2012); andformerly, Executive Vice President – Government Affairs, General Counsel and Corporate Secretary, PepsiCo, Inc. (consumer products) (2012-2014); Senior Vice President – Government Affairs, General Counsel and Secretary, PepsiCo, Inc. (2004-2011); Senior Fellow of The Brookings Institution (2003-2004); Visiting Professor, University of Georgia School of Law (2004); and Deputy Attorney General, U.S. Department of Justice (2001-2003). |
| | |
| Interested Board Members and Officers | | | | |
| | | | |
Name, Year of Birth and Address | | Position | | Length of Time Served | | Number of Portfolios in Fund Complex Overseen by Board Member* | | Other Directorships Held During at Least the Past 5 Years |
| | | | |
| **Gregory E. Johnson (1961) | | Trustee | | Since 2013 | | 146 | | None |
| One Franklin Parkway | | | | | | | | |
| San Mateo, CA 94403-1906 | | | | | | | | |
|
| Principal Occupation During at Least the Past 5 Years: |
| Chairman of the Board, Member – Office of the Chairman, Director and Chief Executive Officer, Franklin Resources, Inc.; officer and/or director or trustee, as the case may be, of some of the other subsidiaries of Franklin Resources, Inc. and of 39 of the investment companies in Franklin Templeton; Vice Chairman, Investment Company Institute; andformerly, President, Franklin Resources, Inc. (1994-2015). |
| | | | |
**Rupert H. Johnson, Jr. (1940) One Franklin Parkway San Mateo, CA 94403-1906 | | Chairman of the Board, and Trustee | | Chairman of the Board since 2013, and Trustee since 1988 | | 134 | | None |
|
| Principal Occupation During at Least the Past 5 Years: |
| Vice Chairman, Member – Office of the Chairman and Director, Franklin Resources, Inc.; Director, Franklin Advisers, Inc.; Senior Vice President, Franklin Advisory Services, LLC; and officer and/or director or trustee, as the case may be, of some of the other subsidiaries of Franklin Resources, Inc. and of 37 of the investment companies in Franklin Templeton. |
| | | | |
| Alison E. Baur (1964) | | Vice President | | Since 2012 | | Not Applicable | | Not Applicable |
| One Franklin Parkway | | | | | | | | |
| San Mateo, CA 94403-1906 | | | | | | | | |
|
| Principal Occupation During at Least the Past 5 Years: |
| Deputy General Counsel, Franklin Templeton; and officer of some of the other subsidiaries of Franklin Resources, Inc. and of 41 of the investment companies in Franklin Templeton. |
FRANKLIN TEMPLETON VARIABLE INSURANCE PRODUCTS TRUST
Interested Board Members and Officers(continued)
| | | | | | | | |
Name, Year of Birth and Address | | Position | | Length of Time Served | | Number of Portfolios in Fund Complex Overseen by Board Member* | | Other Directorships Held During at Least the Past 5 Years |
Gaston Gardey (1967) One Franklin Parkway San Mateo, CA 94403-1906 | | Treasurer, Chief Financial Officer and Chief Accounting Officer | | Since 2009 | | Not Applicable | | Not Applicable |
|
Principal Occupation During at Least the Past 5 Years: Treasurer, U.S. Fund Administration & Reporting, Franklin Templeton; and officer of 24 of the investment companies in Franklin Templeton. |
| | | | |
Steven J. Gray (1955) One Franklin Parkway San Mateo, CA 94403-1906 | | Vice President andCo-Secretary | | Vice President since 2009 andCo-Secretary since 2019 | | Not Applicable | | Not Applicable |
|
Principal Occupation During at Least the Past 5 Years: Senior Associate General Counsel, Franklin Templeton; Vice President, Franklin Templeton Distributors, Inc. and FASA, LLC; and officer of 41 of the investment companies in Franklin Templeton. |
| | | | |
Matthew T. Hinkle (1971) One Franklin Parkway San Mateo, CA 94403-1906 | | Chief Executive Officer – Finance and Administration | | Since 2017 | | Not Applicable | | Not Applicable |
|
Principal Occupation During at Least the Past 5 Years: Senior Vice President, Franklin Templeton Services, LLC; officer of 41 of the investment companies in Franklin Templeton; andformerly, Vice President, Global Tax (2012-April 2017) and Treasurer/Assistant Treasurer, Franklin Templeton (2009-2017). |
| | | | |
Robert Lim (1948) One Franklin Parkway San Mateo, CA 94403-1906 | | Vice President – AML Compliance | | Since 2016 | | Not Applicable | | Not Applicable |
|
Principal Occupation During at Least the Past 5 Years: Vice President, Franklin Templeton Companies, LLC; Chief Compliance Officer, Franklin Templeton Distributors, Inc. and Franklin Templeton Investor Services, LLC; and officer of 41 of the investment companies in Franklin Templeton. |
| | | | |
Edward D. Perks (1970) One Franklin Parkway San Mateo, CA 94403-1906 | | President and Chief Executive Officer – Investment Management | | Since 2018 | | Not Applicable | | Not Applicable |
|
Principal Occupation During at Least the Past 5 Years: President and Director, Franklin Advisers, Inc.; and officer of eight of the investment companies in Franklin Templeton (since December 2018). |
| | | | |
| Robert C. Rosselot (1960) | | Chief | | Since 2013 | | Not Applicable | | Not Applicable |
| 300 S.E. 2nd Street | | Compliance | | | | | | |
| Fort Lauderdale, FL 33301-1923 | | Officer | | | | | | |
|
Principal Occupation During at Least the Past 5 Years: Director, Global Compliance, Franklin Templeton; Vice President, Franklin Templeton Companies, LLC; officer of 41 of the investment companies in Franklin Templeton; andformerly, Senior Associate General Counsel, Franklin Templeton (2007-2013); and Secretary and Vice President, Templeton Group of Funds (2004-2013). |
| | | | |
| Navid J. Tofigh (1972) | | Vice President | | Since 2015 | | Not Applicable | | Not Applicable |
| One Franklin Parkway | | | | | | | | |
| San Mateo, CA 94403-1906 | | | | | | | | |
|
Principal Occupation During at Least the Past 5 Years: Associate General Counsel, Franklin Templeton; and officer of 41 of the investment companies in Franklin Templeton. |
FRANKLIN TEMPLETON VARIABLE INSURANCE PRODUCTS TRUST
Interested Board Members and Officers(continued)
| | | | | | | | |
Name, Year of Birth and Address | | Position | | Length of Time Served | | Number of Portfolios in Fund Complex Overseen by Board Member* | | Other Directorships Held During at Least the Past 5 Years |
| Craig S. Tyle (1960) | | Vice President | | Since 2005 | | Not Applicable | | Not Applicable |
One Franklin Parkway | | | | | | | | |
San Mateo, CA 94403-1906 | | | | | | | | |
|
Principal Occupation During at Least the Past 5 Years: General Counsel, Executive Vice President, Franklin Resources, Inc.; and officer of some of the other subsidiaries of Franklin Resources, Inc. and of 41 of the investment companies in Franklin Templeton. |
| | | | |
Lori A. Weber (1964) 300 S.E. 2nd Street Fort Lauderdale, FL 33301-1923 | | Vice President andCo-Secretary | | Vice President since 2011 andCo-Secretary since January 2019 | | Not Applicable | | Not Applicable |
|
Principal Occupation During at Least the Past 5 Years: Senior Associate General Counsel, Franklin Templeton; Assistant Secretary, Franklin Resources, Inc.; Vice President and Secretary, Templeton Investment Counsel, LLC; and officer of 41 of the investment companies in Franklin Templeton. |
*We base the number of portfolios on each separate series of the U.S. registered investment companies within the Franklin Templeton fund complex. These portfolios have a common investment manager or affiliated investment managers.
**Gregory E. Johnson is considered to be an interested person of the Fund under the federal securities laws due to his position as an officer and director of Franklin Resources, Inc. (Resources), which is the parent company of the Fund’s investment manager and distributor. Rupert H. Johnson, Jr. is considered to be an interested person of the Fund under the federal securities laws due to his position as an officer and director and major shareholder of Resources.
Note 1: Rupert H. Johnson, Jr. is the uncle of Gregory E. Johnson.
Note 2: Effective March 12, 2019, John B. Wilson ceased to be a trustee of the Trust.
Note 3: Officer information is current as of the date of this report. It is possible that after this date, information about officers may change.
The Sarbanes-Oxley Act of 2002 and Rules adopted by the Securities and Exchange Commission require the Fund to disclose whether the Fund’s Audit Committee includes at least one member who is an audit committee financial expert within the meaning of such Act and Rules. The Fund’s Board has determined that there is at least one such financial expert on the Audit Committee and has designated Mary C. Choksi as its audit committee financial expert. The Board believes that Ms. Choksi qualifies as such an expert in view of her extensive business background and experience. She currently serves as a director of Avis Budget Group, Inc. (2007-present) and formerly, Founder and Senior Advisor, Strategic Investment Group (1987 to 2017). Ms. Choksi has been a Member of the Fund’s Audit Committee since 2014. As a result of such background and experience, the Board believes that Ms. Choksi has acquired an understanding of generally accepted accounting principles and financial statements, the general application of such principles in connection with the accounting estimates, accruals and reserves, and analyzing and evaluating financial statements that present a breadth and level of complexity of accounting issues generally comparable to those of the Fund, as well as an understanding of internal controls and procedures for financial reporting and an understanding of audit committee functions. Ms. Choksi is an independent Board member as that term is defined under the relevant Securities and Exchange Commission Rules and Releases.
The Statement of Additional Information (SAI) includes additional information about the board members and is available, without charge, upon request. Shareholders may call (800) DIALBEN/342-5236 to request the SAI.
FRANKLIN TEMPLETON VARIABLE INSURANCE PRODUCTS TRUST
SHAREHOLDER INFORMATION
Shareholder Information
Proxy Voting Policies and Procedures
The Trust’s investment manager has established Proxy Voting Policies and Procedures (Policies) that the Trust uses to determine how to vote proxies relating to portfolio securities. Shareholders may view the Trust’s complete Policies online at franklintempleton.com. Alternatively, shareholders may request copies of the Policies free of charge by calling the Proxy Group collect at (954)527-7678 or by sending a written request to: Franklin Templeton Companies, LLC, 300 S.E. 2nd Street, Fort Lauderdale, FL 33301, Attention: Proxy Group. Copies of the Trust’s proxy voting records are also made available online at franklintempleton.com and posted on the U.S. Securities and Exchange Commission’s website at sec.gov and reflect the most recent12-month period ended June 30.
Quarterly Statement of Investments
The Trust files a complete statement of investments with the U.S. Securities and Exchange Commission for the first and third quarters for each fiscal year as an exhibit to its report on FormN-PORT. Shareholders may view the filed FormN-PORT by visiting the Commission’s website at sec.gov. The filed form may also be viewed and copied at the Commission’s Public Reference Room in Washington, DC. Information regarding the operations of the Public Reference Room may be obtained by calling(800) SEC-0330.
This page intentionally left blank.
This page intentionally left blank.
This page intentionally left blank.
Franklin Templeton Variable Insurance Products Trust (FTVIP) shares are not offered to the public; they are offered and sold only to: (1) insurance company separate accounts (Separate Account) to serve as the underlying investment vehicle for variable contracts; (2) certain qualified plans; and (3) other mutual funds (funds of funds).
Authorized for distribution to investors in Separate Accounts only when accompanied or preceded by the current prospectus for the applicable contract, which includes the Separate Account and the FTVIP prospectuses. Investors should carefully consider a fund’s investment goals, risks, charges and expenses before investing. The prospectus contains this and other information; please read it carefully before investing.
To help ensure we provide you with quality service, all calls to and from our service areas are monitored and/or recorded.
| | | | | | |
| |

| | Annual Report |
| | Franklin Templeton Variable Insurance Products Trust |
| | |
| | Investment Managers | | Fund Administrator | | Distributor |
| | Franklin Advisers, Inc. | | Franklin Templeton Services, LLC | | Franklin Templeton Distributors, Inc. |
| | Franklin Mutual Advisers, LLC | | | | |
| | Franklin Templeton | | | | |
| | Institutional, LLC | | | | |
| | Templeton Asset | | | | |
| | Management Ltd. | | | | |
| | Templeton Global Advisors Limited | | | | |
| | Templeton Investment | | | | |
| | Counsel, LLC | | | | |
| | | | | | |
| © 2020 Franklin Templeton Investments. All rights reserved. | | | | VIP4 A 02/20 |
| (a) | The Registrant has adopted a code of ethics that applies to its principal executive officers and principal financial and accounting officer. |
| (f) | Pursuant to Item 13(a)(1), the Registrant is attaching as an exhibit a copy of its code of ethics that applies to its principal executive officers and principal financial and accounting officer. |
| Item 3. | Audit Committee Financial Expert. |
| (a)(1) | The Registrant has an audit committee financial expert serving on its audit committee. |
| (2) | The audit committee financial expert is Mary C. Choksi and she is “independent” as defined under the relevant Securities and Exchange Commission Rules and Releases. |
| Item 4. | Principal Accountant Fees and Services. |
The aggregate fees paid to the principal accountant for professional services rendered by the principal accountant for the audit of the registrant’s annual financial statements or for services that are normally provided by the principal accountant in connection with statutory and regulatory filings or engagements were $874,816 for the fiscal year ended December 31, 2019 and $831,712 for the fiscal year ended December 31, 2018.
There were no fees paid to the principal accountant for assurance and related services rendered by the principal accountant to the registrant that are reasonably related to the performance of the audit of the registrant’s financial statements and are not reported under paragraph (a) of Item 4.
There were no fees paid to the principal accountant for assurance and related services rendered by the principal accountant to the registrant’s investment adviser and any entity controlling, controlled by or under common control with the investment adviser that provides ongoing services to the registrant that are reasonably related to the performance of the audit of their financial statements.
There were no fees paid to the principal accountant for professional services rendered by the principal accountant to the registrant for tax compliance, tax advice and tax planning.
The aggregate fees paid to the principal accountant for professional services rendered by the principal accountant to the registrant’s investment adviser and any entity controlling, controlled by or under common control with the investment adviser that provides ongoing services to the registrant for tax compliance, tax advice and tax planning were $210,000 for the fiscal year ended December 31, 2019 and $194,500 for the fiscal year ended December 31, 2018. The services for which these fees were paid included tax compliance services related toyear-end, tax consulting services related to the operating agreement and term sheet for the launch of a new fund, and professional fees in connection with tax treatment of equipment lease transactions and with an Indonesia withholding tax refund claim.
The aggregate fees paid to the principal accountant for products and services rendered by the principal accountant to the registrant not reported in paragraphs (a)-(c) of Item 4 were $0 for the fiscal year ended December 31, 2019 and $8,838 for the fiscal year ended December 31, 2018. The services for which these fees were paid included review of materials provided to the fund Board in connection with the investment management contract renewal process.
The aggregate fees paid to the principal accountant for products and services rendered by the principal accountant to the registrant’s investment adviser and any entity controlling, controlled by or under common control with the investment adviser that provides ongoing services to the registrant not reported in paragraphs (a)-(c) of Item 4 were $183,244 for the fiscal year ended December 31, 2019 and $95,000 for the fiscal year ended December 31, 2018. The services for which
these fees were paid included valuation services related to fair value engagement, benchmarking services in connection with the ICI TA survey, account maintenance project, assets under management certification, and the issuance of an Auditors’ Certificate for South Korean regulatory shareholder disclosures.
(e) (1) The registrant’s audit committee is directly responsible for approving the services to be provided by the auditors, including:
(i)pre-approval of all audit and audit related services;
(ii)pre-approval of allnon-audit related services to be provided to the Fund by the auditors;
(iii)pre-approval of allnon-audit related services to be provided to the registrant by the auditors to the registrant’s investment adviser or to any entity that controls, is controlled by or is under common control with the registrant’s investment adviser and that provides ongoing services to the registrant where thenon-audit services relate directly to the operations or financial reporting of the registrant; and
(iv) establishment by the audit committee, if deemed necessary or appropriate, as an alternative to committeepre-approval of services to be provided by the auditors, as required by paragraphs (ii) and (iii) above, of policies and procedures to permit such services to bepre-approved by other means, such as through establishment of guidelines or by action of a designated member or members of the committee; provided the policies and procedures are detailed as to the particular service and the committee is informed of each service and such policies and procedures do not include delegation of audit committee responsibilities, as contemplated under the Securities Exchange Act of 1934, to management; subject, in the case of (ii) through (iv), to any waivers, exceptions or exemptions that may be available under applicable law or rules.
(e) (2) None of the services provided to the registrant described in paragraphs (b)-(d) of Item 4 were approved by the audit committee pursuant to paragraph (c)(7)(i)(C) of Rule2-01 of regulationS-X.
(f) No disclosures are required by this Item 4(f).
(g) The aggregatenon-audit fees paid to the principal accountant for services rendered by the principal accountant to the registrant and the registrant’s investment adviser and any entity controlling, controlled by or under common control with the investment adviser that provides ongoing services to the registrant were $393,244 for the fiscal year ended December 31, 2019 and $298,338 for the fiscal year ended December 31, 2018.
(h) The registrant’s audit committee of the board has considered whether the provision ofnon-audit services that were rendered to the registrant’s investment adviser (not including anysub-adviser whose role is primarily portfolio management and is subcontracted with or overseen by another investment adviser), and any entity controlling, controlled by, or under common control with the investment adviser that provides ongoing services to the registrant that were notpre-approved
pursuant to paragraph (c)(7)(ii) of Rule2-01 of RegulationS-X is compatible with maintaining the principal accountant’s independence.
| | | | |
Item 5. Audit Committee of Listed Registrants. | | N/A | | |
| | |
Item 6. Schedule of Investments. | | N/A | | |
| | |
Item 7. Disclosure of Proxy Voting Policies and Procedures forClosed-End Management Investment Companies. | | N/A | | |
| | |
Item 8. Portfolio Managers ofClosed-End Management Investment Companies. | | N/A | | |
| | |
Item 9. Purchases of Equity Securities byClosed-End Management Investment Company and Affiliated Purchasers. | | N/A | | |
| Item 10. | Submission of Matters to a Vote of Security Holders. |
There have been no changes to the procedures by which shareholders may recommend nominees to the Registrant’s Board of Trustees that would require disclosure herein.
| Item 11. | Controls and Procedures. |
(a)Evaluation of Disclosure Controls and Procedures. The Registrant maintains disclosure controls and procedures that are designed to provide reasonable assurance that information required to be disclosed in the Registrant’s filings under the Securities Exchange Act of 1934, as amended, and the Investment Company Act of 1940 is recorded, processed, summarized and reported within the periods specified in the rules and forms of the Securities and Exchange Commission. Such information is accumulated and communicated to the Registrant’s management, including its principal executive officer and principal financial officer, as appropriate, to allow timely decisions regarding required disclosure. The Registrant’s management, including the principal executive officer and the principal financial officer, recognizes that any set of controls and procedures, no matter how well designed and operated, can provide only reasonable assurance of achieving the desired control objectives.
Within 90 days prior to the filing date of this Shareholder Report onForm N-CSR, the Registrant had carried out an evaluation, under the supervision and with the participation of the Registrant’s management, including the Registrant’s principal executive officer and the Registrant’s principal financial officer, of the effectiveness of the design and operation of the Registrant’s disclosure controls and procedures. Based on such evaluation, the Registrant’s principal executive officer and principal financial officer concluded that the Registrant’s disclosure controls and procedures are effective.
(b)Changes in Internal Controls. There have been no changes in the Registrant’s internal control over financial reporting that occurred during the period covered by this report that has materially affected, or is reasonably likely to materially affect the internal control over financial reporting.
| Item 12. | Disclosure of Securities Lending Activities forClosed-End Management Investment Company. N/A |
(a)(1) Code of Ethics
(a)(2) Certifications pursuant to Section 302 of the Sarbanes-Oxley Act of 2002 of Matthew T. Hinkle, Chief Executive Officer—Finance and Administration, and Gaston Gardey, Chief Financial Officer and Chief Accounting Officer
(b)Certifications pursuant to Section 906 of the Sarbanes-Oxley Act of 2002 of Matthew T. Hinkle, Chief Executive Officer—Finance and Administration, and Gaston Gardey, Chief Financial Officer and Chief Accounting Officer
SIGNATURES
Pursuant to the requirements of the Securities Exchange Act of 1934 and the Investment Company Act of 1940, the registrant has duly caused this report to be signed on its behalf by the undersigned, thereunto duly authorized.
Franklin Templeton Variable Insurance Products Trust
| | |
| By | | S\ MATTHEW T. HINKLE |
| | Matthew T. Hinkle |
| | Chief Executive Officer – Finance and Administration |
Date February 28, 2020
Pursuant to the requirements of the Securities Exchange Act of 1934 and the Investment Company Act of 1940, this report has been signed below by the following persons on behalf of the registrant and in the capacities and on the dates indicated.
| | |
| By | | S\ MATTHEW T. HINKLE |
| | Matthew T. Hinkle |
| | Chief Executive Officer – Finance and Administration |
Date February 28, 2020
| | |
| By | | S\ GASTON GARDEY |
| | Gaston Gardey |
| | Chief Financial Officer and Chief Accounting Officer |
Date February 28, 2020