Filed by Voya Variable Products Trust (SEC File No.: 033-73140; 811-8220) pursuant to Rule 425 under the Securities Act of 1933, as amended, and deemed filed pursuant to Rule 14a-12 under the Securities Exchange Act of 1934, as amended.
Subject Company:
Voya Investors Trust, on behalf of its series VY®FMR® Diversified Mid Cap Portfolio (SEC File No.: 333-216939; 033-23512)
May 1, 2017
Voya Investment Management
ClientTalking Points
VY® FMR® Diversified Mid Cap Portfolio
Voya Investment Management has announced the following changes:
| Planned Change(s) | Effective Date (on or about) | Merging Portfolio Name | Surviving Portfolio Name |
| Reorganization | July 14, 2017 | VY® FMR® Diversified Mid Cap Portfolio | Voya MidCap Opportunities Portfolio |
The Board of Trustees (the “Board”) of VY® FMR®Diversified Mid Cap Portfolio (“FMR Portfolio”) and Voya MidCap Opportunities Portfolio (“Voya Portfolio”) (together with FMR Portfolio, the “Portfolios”) approved an Agreement and Plan of Reorganization (“Merger” or “Reorganization”). The approval of shareholders of the FMR Portfolio is required before the Merger may take place.
| § | What is happening? |
| o | On November 17, 2016, the Board approved a proposal to merge FMR Portfolio into Voya Portfolio. |
| o | A prospectus supplement was filed on December 2, 2016 to notify shareholders of the Merger. |
| o | Shareholders of FMR Portfolio will be sent a combined proxy statement and prospectus on or about May 5, 2017. |
| o | A shareholder meeting will be held on or about June 22, 2017. |
| o | Pending shareholder approval, the Merger will occur as of the close of business on or about July 14, 2017 (“Closing Date”). |
| § | Why is the Merger proposed? |
| o | Voya Investments, LLC (“Voya Investments” or the “Adviser”) believes that the Reorganization would address FMR Portfolio’s limited prospects for future sales and long-term viability and provide its shareholders with potential for improved performance over time. |
| o | The Reorganization would offer FMR Portfolio investors the opportunity to invest in a larger, actively managed portfolio with a substantially similar investment objective. |
| 1 |
| o | The Adviser believes that the combined asset size of the two Portfolios can be expected to result, over time, in |
| 1) | a reduction in expenses |
| 2) | provide greater scale and superior potential to maintain long-term scale benefits for the shareholders of both Portfolios. (As shown below, total expenses of Class ADV shares are expected to be lower immediately following the Reorganization; net expenses of each of the other share classes are expected to increase by one basis point (0.01%) immediately following the Reorganization.) |
| § | How do the Investment Objectives compare? |
| FMR Portfolio | Voya Portfolio | |
| Investment Objective | The Portfolio seeks long-term growth of capital. | The Portfolio seeks long-term capital appreciation. |
| § | What is the experience of the Voya Investment Management Team? |
The Voya Portfolio is managed by the Voya Investment Management Co. LLC (“Voya Investment Management” or “Voya IM”) team of Jeffrey Bianchi and Michael Pytosh.
Jeffrey Bianchi, CFA
Portfolio Manager
Jeffrey Bianchi, CFA, Portfolio Manager of Voya IM’s large cap growth and mid cap growth strategies, joined Voya IM in 1994 as a quantitative analyst and later became a fundamental research analyst in 1995. Mr. Bianchi has had primary responsibility for the health care sector as well as other growth sectors, including technology and consumer. He assumed assistant portfolio management duties on the large cap growth strategy in 2000, and was named a portfolio manager on the strategy in 2008. He also assumed portfolio manager responsibilities of the mid cap growth strategy in 2005.
Michael Pytosh
Portfolio Manager
Michael Pytosh, Portfolio Manager for large-cap growth and mid-cap growth strategies and Voya IM’s Chief Investment Officer, equities, joined Voya IM in 2004. Previously at Voya IM, Mr. Pytosh covered the technology sector as an analyst. Prior to joining Voya IM, he was president of Lincoln Equity Management, LLC and a technology analyst. Mr. Pytosh also served as a technology analyst at JPMorgan Investment Management and an analyst at Lehman Brothers.
| § | How do the Annual Portfolio Operating Expenses compare? |
The table below describes the fees and expenses that you may pay if you buy and hold shares of the Portfolios.Pro forma fees and expenses, which are the estimated fees and expenses of Voya Portfolio after giving effect to the Reorganization, assume the Reorganization occurred on December 31, 2016. As shown below, 12b-1 fees for Class ADV shares of Voya Portfolio immediately following the Reorganization will be lower than were the 12b-1 fees for Class ADV shares of FMR Portfolio, and management fees of Voya Portfolio (for all share classes) immediately following the Reorganization will be higher than were the management fees of FMR Portfolio. The table does not reflect fees or expenses
| 2 |
that are, or may be, imposed under your Variable Contract or Qualified Plan. If these fees or expenses were included in the table, the Portfolios’ expenses would be higher. For more information on these charges, please refer to the documents governing your Variable Contract or consult your plan administrator.
The management agreement between Voya Investments and FMR Portfolio provides for a “bundled fee” arrangement under which Voya Investments provides (in addition to the advisory services) custodial, administrative, transfer agency, portfolio accounting, auditing, and ordinary legal services in return for a single management fee. The management agreement between Voya Investments and Voya Portfolio provides for an advisory fee for which Voya Investments provides advisory and administrative services. Other services are provided to Voya Portfolio under separate agreements at additional expense.
Annual Portfolio Operating Expenses1 Expenses you pay each year as a % of the value of your investment | ||||
| FMR Portfolio | Voya Portfolio | Voya Portfolio Pro Forma | ||
| Class ADV | ||||
| Management Fees | % | 0.65 | 0.78 | 0.75 |
| Distribution and/or Shareholder Services (12b-1) Fees | % | 0.60 | 0.50 | 0.50 |
| Other Expenses | % | None | 0.03 | 0.03 |
| Total Annual Portfolio Operating Expenses | % | 1.25 | 1.31 | 1.28 |
| Waivers and Reimbursements | % | None | None2 | -0.123 |
| Total Annual Portfolio Operating Expenses after Waivers and Reimbursements | % | 1.25 | 1.31 | 1.16 |
| Class I | ||||
| Management Fees | % | 0.65 | 0.78 | 0.75 |
| Distribution and/or Shareholder Services (12b-1) Fees | % | None | None | None |
| Other Expenses | % | None | 0.03 | 0.03 |
| Total Annual Portfolio Operating Expenses | % | 0.65 | 0.81 | 0.78 |
| Waivers and Reimbursements | % | None | None2 | -0.123 |
| Total Annual Portfolio Operating Expenses after Waivers and Reimbursements | % | 0.65 | 0.81 | 0.66 |
| Class S | ||||
| Management Fees | % | 0.65 | 0.78 | 0.75 |
| Distribution and/or Shareholder Services (12b-1) Fees | % | 0.25 | 0.25 | 0.25 |
| Other Expenses | % | None | 0.03 | 0.03 |
| Total Annual Portfolio Operating Expenses | % | 0.90 | 1.06 | 1.03 |
| Waivers and Reimbursements | % | None | None2 | -0.123 |
| Total Annual Portfolio Operating Expenses after Waivers and Reimbursements | % | 0.90 | 1.06 | 0.91 |
| Class S2 | ||||
| Management Fees | % | 0.65 | 0.78 | 0.75 |
| Distribution and/or Shareholder Services (12b-1) Fees | % | 0.40 | 0.40 | 0.40 |
| Other Expenses | % | None | 0.03 | 0.03 |
| Total Annual Portfolio Operating Expenses | % | 1.05 | 1.21 | 1.18 |
| Waivers and Reimbursements | % | None | None2 | -0.123 |
| Total Annual Portfolio Operating Expenses after Waivers and Reimbursements | % | 1.05 | 1.21 | 1.06 |
| 1. | Expense ratios have been adjusted to reflect current contractual rates. |
| 2. | The Adviser is contractually obligated to limit expenses to 1.40%, 0.90%, 1.10%, and 1.30% for Class ADV, Class I, Class S, and Class S2 shares, respectively, through May 1, 2019. In addition, the Adviser is contractually obligated to further limit expenses to 1.35%, 0.85%, 1.10%, and 1.25% for Class ADV, Class I, Class S, and Class S2 shares, respectively, through May 1, 2019. The limitations do not extend to interest, taxes, investment-related costs, leverage |
| 3 |
expenses, extraordinary expenses, and Acquired Fund Fees and Expenses. These limitations are subject to possible recoupment by the adviser within 36 months of the waiver or reimbursement. Termination or modification of these obligations requires approval by the Portfolio’s Board.
| 3. | The Adviser will be contractually obligated to limit expenses to 1.40%, 0.90%, 1.10%, and 1.30% for Class ADV, Class I, Class S, and Class S2 shares, respectively, through May 1, 2019. This limitation is subject to possible recoupment by the Adviser within 36 months of the waiver or reimbursement. In addition, the Adviser is contractually obligated to further limit expenses to 1.16%, 0.66%, 0.91%, and 1.06% for Class ADV, Class I, Class S, and Class S2 shares, respectively, through May 1, 2019. The limitations do not extend to interest, taxes, investment-related costs, leverage expenses, extraordinary expenses, and Acquired Fund Fees and Expenses. Termination or modification of these obligations requires approval by the Portfolio’s Board. |
| § | How does FMR Portfolio’s performance compare to Voya Portfolio? |
The following information is intended to help you understand the risks of investing in the Portfolios. The following bar charts show the changes in each Portfolio’s performance from year to year, and the table compares the Portfolios’ performance to the performance of a broad-based securities market index/indices for the same period. The Portfolios’ performance information reflects applicable fee waivers and/or expense limitations in effect during the period presented. Absent such fee waivers/expense limitations, if any, performance would have been lower. The bar chart shows the performance of the Portfolios’ Class S shares. Other class shares’ performance would be higher or lower than Class S shares’ performance because of the higher or lower expenses paid by Class S shares.
Performance shown in the bar chart and in the Average Annual Total Returns table does not include insurance-related charges imposed under a Variable Contract or expenses related to a Qualified Plan. If these charges or expenses were included, performance would have been lower. Thus, you should not compare the Portfolios’ performance directly with the performance information of other investment products without taking into account all insurance-related charges and expenses payable under your Variable Contract or Qualified Plan. Each Portfolio’s past performance is no guarantee of future results.
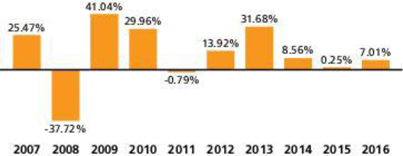
FMR Portfolio - Calendar Year Total Returns – Class S
(as of December 31 of each year)

Best quarter: 2nd 2009, 19.44% and Worst quarter: 4th 2008, -23.41%
| 4 |
Voya Portfolio - Calendar Year Total Returns – Class S
(as of December 31 of each year)
Best quarter: 3rd 2009, 17.65% and Worst quarter: 4th 2008, -23.39%
| Average Annual Total Returns % (for the periods ended December 31, 2016) | ||||||
| 1 Year | 5 Years | 10 Years | Since Inception | Inception Date | ||
| FMR Portfolio | ||||||
| Class ADV | % | 11.40 | 12.31 | 6.88 | N/A | 01/17/06 |
| S&P MidCap 400 Index1 | % | 20.74 | 15.33 | 9.16 | N/A | |
| Class I | % | 12.05 | 12.97 | 7.52 | N/A | 08/15/05 |
| S&P MidCap 400 Index1 | % | 20.74 | 15.33 | 9.16 | N/A | |
| Class S | % | 11.77 | 12.69 | 7.25 | N/A | 10/02/00 |
| S&P MidCap 400 Index1 | % | 20.74 | 15.33 | 9.16 | N/A | |
| Class S2 | % | 11.60 | 12.51 | 7.09 | N/A | 09/09/02 |
| S&P MidCap 400 Index1 | % | 20.74 | 15.33 | 9.16 | N/A | |
| Voya Portfolio | ||||||
| Class ADV | % | 6.78 | 11.52 | 9.19 | N/A | 12/29/06 |
| Russell Midcap® Growth Index1 | % | 7.33 | 13.51 | 7.83 | N/A | |
| Russell Midcap® Index1 | % | 13.80 | 14.72 | 7.86 | N/A | |
| Class I | % | 7.27 | 12.08 | 9.79 | N/A | 05/05/00 |
| Russell Midcap® Growth Index1 | % | 7.33 | 13.51 | 7.83 | N/A | |
| Russell Midcap® Index1 | % | 13.80 | 14.72 | 7.86 | N/A | |
| Class S | % | 7.01 | 11.80 | 9.52 | N/A | 05/07/01 |
| Russell Midcap® Growth Index1 | % | 7.33 | 13.51 | 7.83 | N/A | |
| Russell Midcap® Index1 | % | 13.80 | 14.72 | 7.86 | N/A | |
| Class S2 | % | 6.87 | 11.65 | N/A | 17.65 | 02/27/09 |
| Russell Midcap® Growth Index1 | % | 7.33 | 13.51 | N/A | 18.91 | |
| Russell Midcap® Index1 | % | 13.80 | 14.72 | N/A | 19.86 | |
1. The index returns do not reflect the deductions for fees, expenses, or taxes.
| 5 |
TheS&P MidCap 400®Index measures the performance of the mid-size company segment of the U.S. market.
TheRussell Midcap®Growth Index measures the performance of the mid-cap growth segment of the U.S. equity universe. It includes those Russell Midcap® Index companies with higher price-to-book ratios and higher forecasted growth values.
TheRussell Midcap®Index measures the performance of the mid-cap segment of the U.S. equity universe. The index is a subset of the Russell 1000® Index. It includes approximately 800 of the smallest securities based on a combination of their market cap and current index membership. The index represents approximately 31% of the total market capitalization of the Russell 1000®Index companies.
| § | Tax Considerations |
The Reorganization is intended to qualify for federal income tax purposes as a tax-free reorganization under Section 368 of the United States Internal Revenue Code of 1986, as amended (the “Code”). Accordingly, pursuant to this treatment, neither FMR Portfolio nor the Separate Accounts and Qualified Plans as its shareholders, nor Voya Portfolio nor the Separate Accounts and Qualified Plans as its shareholders, are expected to recognize any gain or loss for federal income tax purposes from the transactions contemplated by the Reorganization Agreement. As a condition to the closing of the Reorganization, each Portfolio will receive an opinion from tax counsel to the effect that, on the basis of existing provisions of the Code, U.S. Treasury Regulations promulgated thereunder, current administrative rules, pronouncements and court decisions, and subject to certain qualifications, the Reorganization will qualify as a tax-free reorganization for federal income tax purposes.
Prior to the Closing Date, FMR Portfolio will pay to the Separate Accounts of Participating Insurance Companies and Qualified Plans that own its shares, a distribution consisting of any undistributed investment company taxable income, any net tax-exempt income, and/or any undistributed realized net capital gains, including any net gains realized from any sales of assets prior to the Closing Date, including portfolio transitions in connection with the Reorganization. Variable Contract owners and Plan Participants are not expected to recognize any income or gains for federal income tax purposes from this cash distribution.
For financial professional use only. Not for inspection by or distribution to the general public.
The foregoing is not an offer to sell, nor a solicitation of an offer to buy, shares of any portfolio, nor is it a solicitation of any proxy. For information regarding the Voya MidCap Opportunities Portfolio, please call Voya Investment Management toll free at 1-800-992-0180.
For information regarding any of the Portfolios discussed in this Client Talking Points, please call Voya Investment Management toll free at 1-800-992-0180. To receive a free copy of a Proxy Statement/Prospectus relating to the proposed merger of VY® FMR®Diversified Mid Cap Portfolio with and into Voya MidCap Opportunities Portfolio, please call Voya Investment Management toll free at 1-800-992-0180. This “Client Talking Points” is qualified in its entirety by reference to the Proxy Statement/Prospectus, and supersedes any prior Client Talking Points. The Proxy Statement/Prospectus contains important information about fund objectives, strategies, fees, expenses and risk considerations, and therefore you are advised to read it. The Proxy Statement/Prospectus and shareholder reports and other information are or will also be available
| 6 |
for free on the SEC’s website (www.sec.gov). Please read any Proxy Statement/Prospectus carefully before making any decision to invest or to approve the merger.
This information is proprietary and cannot be reproduced or distributed. Certain information may be received from sources Voya Investment Management considers reliable; Voya Investment Management does not represent that such information is accurate or complete. Certain statements contained herein may constitute "projections," "forecasts" and other "forward-looking statements" which do not reflect actual results and are based primarily upon applying retroactively a hypothetical set of assumptions to certain historical financial data. Actual results, performance or events may differ materially from those in such statements. Any opinions, projections, forecasts and forward looking statements presented herein are valid only as of the date of this document and are subject to change. Nothing contained herein should be construed as: (i) an offer to buy any security; or (ii) a recommendation as to the advisability of investing in, purchasing or selling any security. Voya Investment Management assumes no obligation to update any forward-looking information. Past performance is no guarantee of future results.
Your clients should consider the investment objectives, risks, charges and expenses of Voya MidCap Opportunities Portfolio carefully before investing. For a free copy of Voya MidCap Opportunities Portfolio’s prospectus, which contains this and other information, visit us atwww.voyainvestments.comor call Voya Investment Management at 1-800-992-0180. Please instruct your clients to read the prospectus carefully before investing.
Compliance ID: IM0501-34033-0518
| 7 |