UNITED STATES
SECURITIES AND EXCHANGE COMMISSION
Washington, D.C. 20549
FORM N-CSR
CERTIFIED SHAREHOLDER REPORT OF REGISTERED MANAGEMENT INVESTMENT COMPANIES
Investment Company Act file number: 811-05631
Lee Financial Mutual Fund, Inc.
(Exact name of registrant as specified in charter)
3113 Olu Street
Honolulu, HI 96816
(Address of principal executive offices) (Zip code)
Nancy P. O’Hara
Faegre Drinker Biddle & Reath LLP
One Logan Square
Suite #2000
Philadelphia, PA 19103-6996
(Name and address of agent for service)
Registrant's telephone number, including area code: (808) 988-8088
Date of fiscal year end: September 30
Date of reporting period: September 30, 2020
Item 1. Report to Stockholders.

ANNUAL REPORT
September 30, 2020
Beginning on January 1, 2021, as permitted by regulations adopted by the Commission, paper copies of the Fund’s shareholder reports will no longer be sent by mail, unless you specifically request paper copies of the reports from the Fund or from your financial intermediary, such as a broker-dealer or bank. Instead, the reports will be made available on a website and you will be notified by mail each time a report is posted and provided with a website link to access the report.
If you have already elected to receive shareholder reports electronically, you will not be affected by this change and you need not take any action. You may elect to receive shareholder reports and other communications from the Fund or your financial intermediary electronically by calling the Fund at 808-988-8088 or by contacting your financial intermediary.
You may elect to receive all future reports in paper free of charge. You can inform the Fund that you wish to continue receiving paper copies of your shareholder reports by calling 808-988-8088. If you own these shares through a financial intermediary, you may contact your financial intermediary to elect to continue to receive paper copies of your shareholder reports. Your election to receive reports in paper will apply to all funds held with your financial intermediary.
Hawaii Municipal Fund
October 30, 2020
Dear fellow shareholder,
Since 1988, the Hawaii Municipal Fund (the “Fund”) has provided shareholders with the opportunity to earn double tax-free income* while supporting local projects designed to enrich the community. These projects may include improvements to schools, roads, utility systems, hospitals, housing and other projects that help to improve the quality of life here in Hawaii.
The world continues to adapt to the effects of the Coronavirus pandemic. Hawaii specifically has been hard hit as its economy is highly dependent on tourism. Hawaii’s unemployment rate has improved to 15.3% for September 2020 from a high of 23.6% in April 2020, but remains high as compared to 2.8% in September 2019.
The Federal Open Market Committee (“FOMC”) maintained a target federal funds rate of 0% - 0.25% after two decreases in March 2020. Per FOMC’s September 16, 2020 press release, the FOMC will “…maintain this target range until labor market conditions have reached levels consistent with the Committee’s assessments of maximum employment and inflation has risen to two percent and is on track to moderately exceed two percent for some time.”
The Fund had a beginning net asset value (“NAV”) of $11.23 per share on October 1, 2019 and a closing NAV of $11.31 per share on September 30, 2020. The Fund’s $0.08 per share increase in NAV combined with the net income distribution of $0.22 per share, resulted in a total return of 2.67% for the twelve-month reporting period ended September 30, 2020. The Fund’s performance for this period was generally attributed to the declining interest rate environment described above.
On the following pages are line graphs comparing the Fund’s performance to the Bloomberg Barclays Municipal Bond Index for the 10 years ended September 30, 2020. The graph assumes a hypothetical $10,000 investment in the Fund. The objective of the graph is to permit a comparison of the Fund with a municipal bond benchmark index and to provide perspective on market conditions and investment strategies and techniques that materially affected the performance of the Fund. While the Fund lagged the Index, we believe that the Fund is generally competitive against the Index, as the Index does not include any mutual fund operating expenses and does not reflect municipal bond performance specific to the State of Hawaii, as it is a nationally oriented municipal bond index.
The Fund’s portfolio manager will continue to evaluate potential and current portfolio holdings believed to provide an advantageous combination of yield, quality and maturity. We continue to believe that municipal bonds are attractive investments for long term investors.
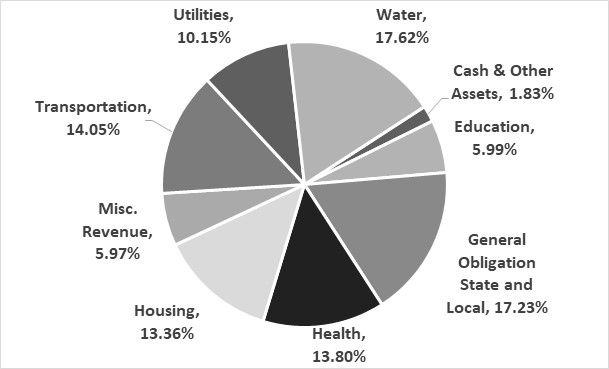
CATEGORY ALLOCATION (% of Net Assets)
September 30, 2020
There was no capital gain distribution to shareholders for the 2019 calendar year. There will be a capital gain distribution for the Hawaii Municipal Fund for the 2020 calendar year.
If you have any questions about this Annual Report or would like us to provide information about the Fund to your family or friends, please call us at (808) 988-8088. Thank you for the trust you have placed in us to manage your investments. On behalf of the staff and management of Lee Financial Group Hawaii, Inc., I would like to extend best wishes for a safe and happy holiday season.
Warmest Aloha,
/s/ Terrence K.H. Lee
Terrence K.H. Lee
President and CEO
Before investing, read the prospectus carefully. Please carefully consider the Fund’s investment objective, risks, and charges and expenses before investing. The prospectus contains this and other information about the Fund. This Annual Report must be accompanied or preceded by a prospectus.
A word about risk: Mutual fund investing includes risks. Principal loss is possible. The Fund’s investments in municipal bonds subjects the Fund to interest rate, credit, call and geographic concentration risk. This is not a complete list of risks that may affect the Fund. For additional information concerning the risks applicable to the Fund, please see the Fund’s prospectus.
| * | Some income may be subject to the federal alternative minimum tax for certain investors. Income may also be subject to capital gains taxes. |
The Fund’s yield, share price and investment return fluctuate so that you may receive more or less than your original investment upon redemption. Past performance is no guarantee of future results. The Fund is a series of Lee Financial Mutual Fund, Inc.
Lee Financial Securities, Inc., member FINRA is the Distributor for Lee Financial Mutual Fund, Inc. Lee Financial Securities, Inc. is a wholly owned subsidiary of Lee Financial Group Hawaii, Inc., a registered investment adviser with the SEC.
This Annual Report may contain certain forward-looking statements about factors that may affect the performance of the Fund in the future. These statements are based on the predictions and expectations of Lee Financial Group Hawaii, Inc., the Fund’s investment manager (the “Investment Manager”), concerning certain future events, such as performance of the economy, changes in interest rates and other factors that may impact the performance of the Fund. The Investment Manager believes that these forward looking statements are reasonable, although they are inherently uncertain and difficult to predict. Actual events may cause adjustments in portfolio management strategies from those currently expected to be employed.
Hawaii Municipal Fund Investor Class
$10,000 Investment in Fund Compared to the Bloomberg Barclays Municipal Bond Index

The Bloomberg Barclays Municipal Bond Index consists of a broad selection of investment grade general obligation and revenue bonds of maturities ranging from one year to 30 years. It is an unmanaged index representative of the tax-exempt bond market. This index is made up of all investment grade municipal bonds issued after December 31, 1990 having a remaining maturity of at least one year. It is not possible to invest directly in an unmanaged index.
The graph above compares the increase in value of a $10,000 investment in the Fund with the performance of the Bloomberg Barclays Municipal Bond Index. The objective of the graph is to permit you to compare the performance of the Fund with the current market and to give perspective to market conditions and investment strategies and techniques pursued by the investment manager that materially affected the performance of the Fund. The Bloomberg Barclays Municipal Bond Index reflects reinvestment of dividends but not the expenses of the Fund. It is not possible to invest directly in an index. The return and principal value of an investment in the Fund will fluctuate so that an investor’s shares, when redeemed, may be worth more or less than their original cost. Past performance is not indicative of future results. Current performance may be higher or lower than the total return shown. Please call the Fund at (808) 988-8088 or (800) 354-9654 to obtain the most recent month-end returns. The total returns are before taxes on distributions or redemptions of Fund shares. The Fund’s annual operating expense ratio, as stated in the current prospectus dated February 1, 2020, is 0.98%. This rate can fluctuate and may differ from the expense ratio for the most recently completed fiscal year disclosed in the “Financial Highlights” portion of this Annual Report.
YOUR FUND’S EXPENSES
As a Fund shareholder, you can incur the following costs:
| ● | Ongoing Fund costs, including management fees, distribution and service (12b-1) fees, and other Fund expenses. All mutual funds have ongoing costs, sometimes referred to as operating expenses. |
The following table shows ongoing costs of investing in the Fund and can help you understand these costs and compare them with those of other mutual funds. The table assumes a $1,000 investment held for the six months indicated.
Actual Fund Expenses
The first line (Actual) for the share class listed in the table below provides actual account values and expenses. The “Ending Account Value” is derived from the Fund’s actual return, which includes the effect of Fund expenses.
You can estimate the expenses you paid during the period, by following these steps. Of course, your account value and expenses will differ from those in this illustration:
| 1. | Divide your account value by $1,000.
If an account had an $8,600 value, the $8,600 ÷ $1,000 = 8.6. |
| 2. | Multiply the result by the number under the heading “Expenses Paid During Period.”
If expenses Paid During Period were $7.50, then 8.6 x $7.50 = $64.50. |
In this illustration, the estimated expenses paid this period are $64.50.
Hypothetical Example for Comparison with Other Funds
Information in the second line (Hypothetical) in the table can help you compare ongoing costs of investing in the Fund with those of other mutual funds. This information may not be used to estimate the actual ending account balance or expenses you paid during the period. The hypothetical “Ending Account Value” is based on the actual expense ratio for the Fund and an assumed 5% annual rate of return before expenses, which does not represent the Fund’s actual return. The figure under the heading “Expenses Paid During Period” shows the hypothetical expenses your account would have incurred under this scenario. You can compare this figure with the 5% hypothetical examples that appear in shareholder reports of other funds.
Please note that expenses shown in the table are meant to highlight ongoing costs. Therefore, the second line is useful in comparing ongoing costs only, and will not help you compare total costs of owning different funds. Please refer to the Fund prospectus for additional information on operating expenses.
| Beginning Account Value 04/01/20 | Ending Account
Value 09/30/20 | Expenses Paid During Period* 04/01/20 - 09/30/20 |
| Hawaii Municipal Fund Investor Class | | | |
| Actual | $1,000.00 | $1,028.40 | $4.81 |
| Hypothetical | $1,000.00 | $1,020.26 | $4.79 |
| * | Expenses are equal to the annualized expense ratio (0.95%), which is net of fee reductions, multiplied by the average account value over the period, multiplied by 183/366 to reflect the one-half year period. |
REPORT OF INDEPENDENT REGISTERED PUBLIC ACCOUNTING FIRM
To the Shareholders and Board of Directors
of Lee Financial Mutual Fund, Inc.
Opinion on the Financial Statements
We have audited the accompanying statement of assets and liabilities of Hawaii Municipal Fund (the “Fund”), a series of Lee Financial Mutual Fund, Inc., including the schedule of investments, as of September 30, 2020, the related statement of operations for the year then ended, the statements of changes in net assets for each of the two years in the period then ended, financial highlights for each of the five years in the period then ended, and the related notes (collectively referred to as the “financial statements”). In our opinion, the financial statements present fairly, in all material respects, the financial position of the Fund as of September 30, 2020, the results of its operations for the year then ended, the changes in its net assets for each of the two years in the period then ended, and the financial highlights for each of the five years in the period then ended, in conformity with accounting principles generally accepted in the United States of America.
Basis for Opinion
These financial statements are the responsibility of the Fund’s management. Our responsibility is to express an opinion on the Fund’s financial statements based on our audits. We are a public accounting firm registered with the Public Company Accounting Oversight Board (United States) (“PCAOB”) and are required to be independent with respect to the Fund in accordance with the U.S. federal securities laws and the applicable rules and regulations of the Securities and Exchange Commission and the PCAOB. We have served as the Fund’s auditor since 1988.
We conducted our audit in accordance with the standards of the PCAOB. Those standards require that we plan and perform the audit to obtain reasonable assurance about whether the financial statements are free of material misstatement, whether due to error or fraud. The Fund is not required to have, nor were we engaged to perform, an audit of its internal control over financial reporting. As part of our audits we are required to obtain an understanding of internal control over financial reporting, but not for the purpose of expressing an opinion on the effectiveness of the Fund’s internal control over financial reporting. Accordingly, we express no such opinion.
Our audit included performing procedures to assess the risks of material misstatement of the financial statements, whether due to error or fraud, and performing procedures that respond to those risks. Such procedures included examining, on a test basis, evidence regarding the amounts and disclosures in the financial statements. Our audits also included evaluating the accounting principles used and significant estimates made by management, as well as evaluating the overall presentation of the financial statements. Our procedures included confirmation of securities owned as of September 30, 2020 by correspondence with the custodian. We believe that our audit provides a reasonable basis for our opinion.

Philadelphia, Pennsylvania
November 27, 2020
HAWAII MUNICIPAL FUND
SCHEDULE OF INVESTMENTS
September 30, 2020
| Par Value | | | | | | | Value
(Note 1 (A)) | |
| | | | | | HAWAII MUNICIPAL BONDS – 96.85% | | | |
| | | | Hawaii County | | | |
| | | | | General Obligation Bonds – 2.09% | | | | |
| $ | 1,025,000 | | | 5.000%, | | 09/01/27 | | $ | 1,269,647 | |
| | 800,000 | | | 4.000%, | | 09/01/31 | | | 943,240 | |
| | 460,000 | | | 5.000%, | | 09/01/32 | | | 558,003 | |
| | 500,000 | | | 5.000%, | | 09/01/33 | | | 616,360 | |
| | | | | | | | | | 3,387,250 | |
| | | | | | | | | | | |
| | | | | Hawaii State | | | | | | |
| | | | | General Obligation Bonds – 4.56% | | | | |
| | 2,000,000 | | | 5.000%, | | 08/01/30 | | | 2,333,140 | |
| | 2,000,000 | | | 4.000%, | | 10/01/35 | | | 2,248,320 | |
| | 1,500,000 | | | 3.375%, | | 01/01/36 | | | 1,661,760 | |
| | 1,000,000 | | | 4.000%, | | 05/01/36 | | | 1,156,010 | |
| | | | | | | | | | 7,399,230 | |
| | | | | | | | | | | |
| | | | | Airport Systems Revenue Bonds – 8.08% | | | | |
| | 1,000,000 | | | 5.000%, | | 07/01/35 | | | 1,201,340 | |
| | 750,000 | | | 5.000%, | | 07/01/41 | | | 856,897 | |
| | 735,000 | | | 5.000%, | | 07/01/43 | | | 863,427 | |
| | 7,335,000 | | | 5.000%, | | 07/01/45 | | | 8,337,548 | |
| | 1,600,000 | | | 5.000%, | | 07/01/48 | | | 1,866,016 | |
| | | | | | | | | | 13,125,228 | |
| | | | | | | | | | | |
| | | | | Harbors Revenue Bonds – 0.93% | | | | |
| | 1,500,000 | | | 5.500%, | | 07/01/35 | | | 1,505,325 | |
| | | | | | | | | | | |
| | | | | | | | | | | |
| | | | | Department of Budget & Finance Special Purpose Revenue Bonds | | | | |
| | | | | Hawaiian Electric Company, Inc. – 10.15% | | | | |
| | 1,000,000 | | | 3.250%, | | 01/01/25 | | | 1,060,570 | |
| | 3,000,000 | | | 3.100%, | | 05/01/26 | | | 3,190,590 | |
| | 1,890,000 | | | 4.000%, | | 03/01/37 | | | 2,019,522 | |
| | 10,000,000 | | | 3.200%, | | 07/01/39 | | | 10,211,800 | |
| | | | | | | | | | 16,482,482 | |
See accompanying notes to financial statements.
HAWAII MUNICIPAL FUND
SCHEDULE OF INVESTMENTS – (Continued)
September 30, 2020
| Par Value | | | | | | | Value
(Note 1 (A)) | |
| | | | | Hawaii Pacific Health – 2.11% | | | | |
| $ | 175,000 | | | 5.125%, | | 07/01/31 | | $ | 192,815 | |
| | 340,000 | | | 5.500%, | | 07/01/38 | | | 374,500 | |
| | 2,600,000 | | | 5.500%, | | 07/01/43 | | | 2,853,396 | |
| | | | | | | | | | 3,420,711 | |
| | | | | | | | | | | |
| | | | | Hawaii Mid-Pacific Institute – 1.16% | | | | |
| | 270,000 | | | 4.000%, | | 01/01/32 | | | 292,988 | |
| | 435,000 | | | 3.000%, | | 01/01/34 | | | 428,814 | |
| | 600,000 | | | 3.000%, | | 01/01/35 | | | 588,798 | |
| | 585,000 | | | 3.000%, | | 01/01/36 | | | 569,439 | |
| | | | | | | | | | 1,880,039 | |
| | | | | | | | | | | |
| | | | | Kahala Nui – 7.04% | | | | |
| | 500,000 | | | 5.000%, | | 11/15/21 | | | 524,615 | |
| | 2,900,000 | | | 5.000%, | | 11/15/27 | | | 3,139,482 | |
| | 3,200,000 | | | 5.125%, | | 11/15/32 | | | 3,436,064 | |
| | 4,055,000 | | | 5.250%, | | 11/15/37 | | | 4,339,661 | |
| | | | | | | | | | 11,439,822 | |
| | | | | | | | | | | |
| | | | | Queen’s Health Systems – 4.65% | | | | |
| | 6,185,000 | | | 5.000%, | | 07/01/35 | | | 7,080,650 | |
| | 435,000 | | | 4.000%, | | 07/01/40 | | | 469,439 | |
| | | | | | | | | | 7,550,089 | |
| | | | | | | | | | | |
| | | | | Department of Hawaiian Home Lands – 1.30% | | | | |
| | 600,000 | | | 5.000%, | | 04/01/30 | | | 746,916 | |
| | 800,000 | | | 5.000%, | | 04/01/31 | | | 991,248 | |
| | 300,000 | | | 5.000%, | | 04/01/32 | | | 369,888 | |
| | | | | | | | | | 2,108,052 | |
| | | | | | | | | | | |
| | | | | Department of Hawaiian Home Lands COP – 1.19% | | | | |
| | 680,000 | | | 5.000%, | | 11/01/29 | | | 865,443 | |
| | 500,000 | | | 5.000%, | | 11/01/30 | | | 633,020 | |
| | 350,000 | | | 5.000%, | | 11/01/31 | | | 439,607 | |
| | | | | | | | | | 1,938,070 | |
See accompanying notes to financial statements.
HAWAII MUNICIPAL FUND
SCHEDULE OF INVESTMENTS – (Continued)
September 30, 2020
| Par Value | | | | | | | Value
(Note 1 (A)) | |
| | | | Department of Transportation Airports COP – 4.78% | | |
| $ | 1,000,000 | | | 5.000%, | | 08/01/23 | | $ | 1,106,850 | |
| | 1,420,000 | | | 5.250%, | | 08/01/24 | | | 1,580,744 | |
| | 2,570,000 | | | 5.250%, | | 08/01/26 | | | 2,848,768 | |
| | 1,000,000 | | | 5.000%, | | 08/01/27 | | | 1,099,200 | |
| | 1,025,000 | | | 5.000%, | | 08/01/28 | | | 1,124,281 | |
| | | | | | | | | | 7,759,843 | |
| | | | | | | | | | | |
| | | | | Highway Revenue – 4.71% | | | | |
| | 1,500,000 | | | 5.000%, | | 01/01/27 | | | 1,752,690 | |
| | 2,065,000 | | | 5.000%, | | 01/01/33 | | | 2,380,367 | |
| | 1,250,000 | | | 4.000%, | | 01/01/34 | | | 1,426,488 | |
| | 1,360,000 | | | 4.000%, | | 01/01/35 | | | 1,548,659 | |
| | 425,000 | | | 5.000%, | | 01/01/36 | | | 541,798 | |
| | | | | | | | | | 7,650,002 | |
| | | | | | | | | | | |
| | | | | Housing Authority | | | | |
| | | | | HFDC Multi-Family-Kuhio Park– 3.42% | | | | |
| | 2,430,000 | | | 4.750%, | | 10/01/27 | | | 2,478,721 | |
| | 3,000,000 | | | 4.950%, | | 04/01/29 | | | 3,072,330 | |
| | | | | | | | | | 5,551,051 | |
| | | | | | | | | | | |
| | | | | HFDC Multi-Family-Iwilei Apartments– 2.68% | | | | |
| | 150,000 | | | 3.300%, | | 01/01/26 | | | 156,250 | |
| | 4,035,000 | | | 3.750%, | | 01/01/31 | | | 4,194,544 | |
| | | | | | | | | | 4,350,794 | |
| | | | | | | | | | | |
| | | | | HFDC Multi-Family-Kooloaula Apartments– 2.23% | | | | |
| | 75,000 | | | 3.125%, | | 09/01/22 | | | 77,464 | |
| | 3,435,000 | | | 4.000%, | | 09/01/33 | | | 3,551,859 | |
| | | | | | | | | | 3,629,323 | |
| | | | | | | | | | | |
| | | | | HFDC Multi-Family-Hale Kewalo Apartments– 0.92% | | | | |
| | 1,500,000 | | | 1.900%, | | 01/01/21 | | | 1,502,100 | |
See accompanying notes to financial statements.
HAWAII MUNICIPAL FUND
SCHEDULE OF INVESTMENTS – (Continued)
September 30, 2020
| Par Value | | | | | | | Value
(Note 1 (A)) | |
| | | | University of Hawaii - Revenue Bonds – 4.83% | | |
| $ | 500,000 | | | 3.000%, | | 10/01/28 | | $ | 568,005 | |
| | 2,000,000 | | | 5.000%, | | 10/01/29 | | | 2,458,860 | |
| | 1,200,000 | | | 5.000%, | | 10/01/30 | | | 1,468,584 | |
| | 1,600,000 | | | 5.000%, | | 10/01/31 | | | 1,950,048 | |
| | 500,000 | | | 5.000%, | | 10/01/34 | | | 586,350 | |
| | 655,000 | | | 5.000%, | | 10/01/34 | | | 811,211 | |
| | | | | | | | | | 7,843,058 | |
| | | | | | | | | | | |
| | | | | Honolulu City & County | | | | |
| | | | | General Obligation Bonds – 4.76% | | | | |
| | 500,000 | | | 4.000%, | | 09/01/36 | | | 590,070 | |
| | 1,200,000 | | | 4.000%, | | 09/01/37 | | | 1,386,360 | |
| | 1,400,000 | | | 5.000%, | | 10/01/37 | | | 1,664,208 | |
| | 735,000 | | | 4.000%, | | 09/01/39 | | | 859,656 | |
| | 1,100,000 | | | 5.000%, | | 09/01/42 | | | 1,373,966 | |
| | 500,000 | | | 4.000%, | | 09/01/43 | | | 589,720 | |
| | 1,000,000 | | | 5.000%, | | 08/01/44 | | | 1,266,740 | |
| | | | | | | | | | 7,730,720 | |
| | | | | | | | | | | |
| | | | | Water System Revenue Bonds | | | | |
| | | | | Board of Water Supply – 4.75% | | | | |
| | 1,000,000 | | | 5.000%, | | 07/01/28 | | | 1,308,650 | |
| | 2,000,000 | | | 5.000%, | | 07/01/29 | | | 2,325,560 | |
| | 1,470,000 | | | 5.000%, | | 07/01/29 | | | 1,965,493 | |
| | 1,545,000 | | | 5.000%, | | 07/01/30 | | | 2,107,612 | |
| | | | | | | | | | 7,707,315 | |
| | | | | | | | | | | |
| | | | | Wastewater System Revenue Bonds – 11.88% | | | | |
| | 1,750,000 | | | 5.000%, | | 07/01/26 | | | 2,115,365 | |
| | 2,000,000 | | | 5.000%, | | 07/01/32 | | | 2,382,340 | |
| | 1,000,000 | | | 5.000%, | | 07/01/34 | | | 1,220,540 | |
| | 1,520,000 | | | 5.000%, | | 07/01/36 | | | 1,843,866 | |
| | 500,000 | | | 4.000%, | | 07/01/37 | | | 600,785 | |
| | 2,000,000 | | | 4.000%, | | 07/01/38 | | | 2,349,240 | |
| | 500,000 | | | 4.000%, | | 07/01/42 | | | 581,190 | |
| | 3,250,000 | | | 4.000%, | | 07/01/44 | | | 3,818,555 | |
| | 2,690,000 | | | 4.000%, | | 07/01/49 | | | 3,125,780 | |
| | 1,000,000 | | | 5.000%, | | 07/01/49 | | | 1,258,440 | |
| | | | | | | | | | 19,296,101 | |
See accompanying notes to financial statements.
HAWAII MUNICIPAL FUND
SCHEDULE OF INVESTMENTS – (Continued)
September 30, 2020
| Par Value | | | | | | | Value
(Note 1 (A)) | |
| | | | Kauai County | | | | | |
| | | | | General Obligation Bonds – 1.31% | | | | |
| $ | 400,000 | | | 3.125%, | | 08/01/23 | | $ | 418,720 | |
| | 770,000 | | | 5.000%, | | 08/01/24 | | | 800,454 | |
| | 880,000 | | | 3.625%, | | 08/01/25 | | | 904,059 | |
| | | | | | | | | | 2,123,233 | |
| | | | | | | | | | | |
| | | | | Kukuiula Development – 2.80% | | | | |
| | 1,090,000 | | | 5.625%, | | 05/15/33 | | | 1,130,810 | |
| | 2,250,000 | | | 5.750%, | | 05/15/42 | | | 2,329,987 | |
| | 1,000,000 | | | 5.000%, | | 05/15/49 | | | 1,085,930 | |
| | | | | | | | | | 4,546,727 | |
| | | | | | | | | | | |
| | | | | Maui County | | | | | | |
| | | | | General Obligation Bonds – 4.52% | | | | |
| | 1,000,000 | | | 5.000%, | | 09/01/23 | | | 1,140,210 | |
| | 3,000,000 | | | 2.125%, | | 06/01/24 | | | 3,152,100 | |
| | 1,000,000 | | | 4.000%, | | 09/01/28 | | | 1,154,250 | |
| | 300,000 | | | 3.500%, | | 09/01/37 | | | 335,892 | |
| | 1,200,000 | | | 5.000%, | | 03/01/40 | | | 1,552,836 | |
| | | | | | | | | | 7,335,288 | |
| | | | | | | | | | | |
| | | | | Total Hawaii Municipal Bonds (Cost $150,594,829) | | $ | 157,261,853 | |
| | | | | | | | | | | |
| | | | | | | PRE-REFUNDED1 | | | | |
| | | | | | | HAWAII MUNICIPAL BONDS – 1.32% | | | | |
| | | | | Hawaii State | | | | |
| | | | | Highway Revenue – 0.33% | | | | |
| $ | 500,000 | | | 5.000%, | | 01/01/22 | | $ | 530,205 | |
| | | | | | | | | | | |
| | | | | Honolulu City & County | | | | |
| | | | | Water System Revenue Bonds | | | | |
| | | | | Board of Water Supply – 0.99% | | | | |
| | 1,500,000 | | | 4.500%, | | 07/01/22 | | | 1,613,535 | |
| | | | | | | | | | | |
| | | | | Total Pre-Refunded Hawaii Municipal Bonds (Cost $2,074,983) | | $ | 2,143,740 | |
See accompanying notes to financial statements.
HAWAII MUNICIPAL FUND
SCHEDULE OF INVESTMENTS – (Concluded)
September 30, 2020
| | | | Total Investments (Cost $152,669,812) (a) | | | 98.17 | % | | | 159,405,593 | |
| | | | Other Assets Less Liabilities | | | 1.83 | % | | | 2,967,168 | |
| | | | Net Assets | | | 100.00 | % | | $ | 162,372,761 | |
| | | | (a) Aggregate cost for federal income tax purposes is $152,667,865. | | | | |
| | | | | | | | |
| | | | At September 30, 2020, unrealized appreciation (depreciation) of securities for federal income tax purposes is as follows: |
| | | | | | | | |
| | | | Gross unrealized appreciation | | $ | 7,063,420 | |
| | | | Gross unrealized (depreciation) | | | (325,692 | ) |
| | | | Net unrealized appreciation | | $ | 6,737,728 | |
| 1 | Pre-Refunded bonds are bonds for which U.S. Government Obligations usually have been placed in escrow to retire the bonds at their earliest call date. |
See accompanying notes to financial statements.
HAWAII MUNICIPAL FUND
STATEMENT OF ASSETS AND LIABILITIES
September 30, 2020
| | | Municipal | |
| | | Fund | |
| ASSETS | | | |
| Investments at market value | | | | |
| (Identified cost $152,669,812) (Note 1 (A)) | | $ | 159,405,593 | |
| Cash | | | 1,412,860 | |
| Interest receivable | | | 1,767,892 | |
| Other assets | | | 10,955 | |
| | | | | |
| Total assets | | | 162,597,300 | |
| | | | | |
| LIABILITIES | | | | |
| Distributions payable | | | 65,096 | |
| Redemptions payable | | | 3,433 | |
| Management fee payable | | | 66,513 | |
| Administration fee payable | | | 2,661 | |
| Distribution plan payable | | | 20,463 | |
| Shareholder servicing fee payable | | | 6,651 | |
| Transfer Agent fee payable | | | 7,982 | |
| Chief Compliance Officer fee payable | | | 5,753 | |
| Audit fee payable | | | 32,500 | |
| Accrued expenses | | | 13,487 | |
| Total liabilities | | | 224,539 | |
| | | | | |
| NET ASSETS | | $ | 162,372,761 | |
| (Applicable to 14,353,267 shares outstanding, $0.01 par value, 40,000,000 shares authorized) | | | | |
| | | | | |
| NET ASSET VALUE, OFFERING AND REPURCHASE PRICE PER SHARE, INVESTOR CLASS SHARES | | $ | 11.31 | |
| | | | | |
| NET ASSETS | | | | |
| At September 30, 2020, net assets consisted of: | | | | |
| Paid-in capital | | $ | 154,436,567 | |
| Distributable earnings | | | 7,936,194 | |
| | | $ | 162,372,761 | |
See accompanying notes to financial statements.
HAWAII MUNICIPAL FUND
STATEMENT OF OPERATIONS
For the year ended September 30, 2020
| | | Municipal | |
| | | Fund | |
| INVESTMENT INCOME | | | | |
| Interest income | | $ | 4,766,988 | |
| | | | | |
| Expenses | | | | |
| Management fee (Note 2) | | | 813,893 | |
| Distribution costs (Notes 2 and 3) | | | 244,168 | |
| Transfer Agent fee (Note 2) | | | 97,667 | |
| Shareholder Services fee (Note 2) | | | 81,390 | |
| Chief Compliance Officer fee (Note 2) | | | 70,192 | |
| Accounting fee | | | 57,700 | |
| Legal fees | | | 44,462 | |
| Administration fee (Note 2) | | | 32,556 | |
| Audit fees | | | 33,300 | |
| Transfer Agent out of pocket expenses | | | 30,205 | |
| Insurance | | | 14,777 | |
| Custodian fee | | | 12,771 | |
| Registration fee | | | 11,860 | |
| Printing | | | 6,033 | |
| Director’s fee | | | 5,427 | |
| Director’s expense | | | 3,789 | |
| Mailing expense | | | 3,119 | |
| Shareholder Communications | | | 1,399 | |
| Total expenses | | | 1,564,708 | |
| Expense reductions (Note 5) | | | (5,818 | ) |
| | | | | |
| Net Expenses | | | 1,558,890 | |
| Net investment income | | | 3,208,098 | |
| | | | | |
| NET REALIZED AND UNREALIZED GAIN (LOSS) ON INVESTMENTS | | | | |
| Net realized gain from investments | | | 1,114,477 | |
| Change in unrealized appreciation (depreciation) of investments | | | (90,604 | ) |
| | | | | |
| Net gain on investments | | | 1,023,873 | |
| | | | | |
| NET INCREASE IN NET ASSETS RESULTING FROM OPERATIONS | | $ | 4,231,971 | |
See accompanying notes to financial statements.
HAWAII MUNICIPAL FUND
STATEMENTS OF CHANGES IN NET ASSETS
| | | For The Year Ended September 30, 2020 | | | For The Year Ended September 30, 2019 | |
| INCREASE (DECREASE) IN NET ASSETS FROM | | | | | | | | |
| Operations | | | | | | | | |
| Net investment income | | $ | 3,208,098 | | | $ | 3,800,054 | |
| Net realized gain from investments | | | 1,114,477 | | | | 328,129 | |
| (Decrease) Increase in unrealized appreciation of investments | | | (90,604 | ) | | | 5,359,671 | |
| Net increase in net assets resulting from operations | | | 4,231,971 | | | | 9,487,854 | |
| Distributions to shareholders | | | | | | | | |
| Investor Class ($0.22 and $0.25 per share, respectively) | | | (3,150,138 | ) | | | (3,700,255 | ) |
| Total distributions to shareholders | | | (3,150,138 | ) | | | (3,700,255 | ) |
| | | | | | | | | |
| Capital share transactions (a) | | | | | | | | |
| (Decrease) in net assets resulting from capital share transactions | | | (3,264,538 | ) | | | (2,957,244 | ) |
| Total (decrease) increase in net assets | | | (2,182,705 | ) | | | 2,830,355 | |
| NET ASSETS | | | | | | | | |
| Beginning of year | | | 164,555,466 | | | | 161,725,111 | |
| End of year | | $ | 162,372,761 | | | $ | 164,555,466 | |
| (a) Summary of capital share activity follows: | | Investor Class | | | Investor Class | |
| | | For The Year Ended | | | For The Year Ended | |
| | | September 30, 2020 | | | September 30, 2019 | |
| | | Shares | | | Value | | | Shares | | | Value | |
| Shares sold | | | 751,276 | | | $ | 8,463,349 | | | | 1,040,969 | | | $ | 11,485,153 | |
| Shares issued on reinvestment of distributions | | | 208,846 | | | | 2,351,069 | | | | 243,873 | | | | 2,691,276 | |
| | | | 960,122 | | | | 10,814,418 | | | | 1,284,842 | | | | 14,176,429 | |
| Shares redeemed | | | (1,264,291 | ) | | | (14,078,956 | ) | | | (1,554,219 | ) | | | (17,133,673 | ) |
| Net (decrease) | | | (304,169 | ) | | $ | (3,264,538 | ) | | | (269,377 | ) | | $ | (2,957,244 | ) |
See accompanying notes to financial statements.
HAWAII MUNICIPAL FUND
FINANCIAL HIGHLIGHTS
(For a share outstanding throughout each year)
| | | 2020 | | | 2019 | | | 2018 | | | 2017 | | | 2016 | |
| Net asset value | | | | | | | | | | | | | | | |
| Beginning of year | | $ | 11.23 | | | $ | 10.83 | | | $ | 11.13 | | | $ | 11.36 | | | $ | 11.21 | |
| Income from investment operations | | | | | | | | | | | | | | | | | | | | |
| Net investment income | | | 0.22 | | | | 0.26 | | | | 0.25 | | | | 0.26 | | | | 0.29 | |
| Net gain (loss) on securities (both realized and unrealized) | | | 0.08 | | | | 0.39 | | | | (0.30 | ) | | | (0.23 | ) | | | 0.15 | |
| Total from investment operations | | | 0.30 | | | | 0.65 | | | | (0.05 | ) | | | 0.03 | | | | 0.44 | |
| Less distributions | | | | | | | | | | | | | | | | | | | | |
| Dividends from net investment income | | | (0.22 | ) | | | (0.25 | ) | | | (0.25 | ) | | | (0.26 | ) | | | (0.29 | ) |
| Distributions from capital gains | | | – | | | | – | | | | – | | | | – | | | | – | |
| Total distributions | | | (0.22 | ) | | | (0.25 | ) | | | (0.25 | ) | | | (0.26 | ) | | | (0.29 | ) |
| End of year | | $ | 11.31 | | | $ | 11.23 | | | $ | 10.83 | | | $ | 11.13 | | | $ | 11.36 | |
| Total return | | | 2.67 | % | | | 6.07 | % | | | -0.44 | % | | | 0.31 | % | | | 3.94 | % |
| Ratios/Supplemental Data | | | | | | | | | | | | | | | | | | | | |
| Net assets, end of year (in 000's) | | $ | 162,373 | | | $ | 164,555 | | | $ | 161,725 | | | $ | 165,635 | | | $ | 175,173 | |
| Ratio of expenses to average net assets | | | 0.96 | %(a) | | | 0.98 | %(a) | | | 1.05 | % | | | 1.08 | % | | | 1.03 | % |
| Ratio of net investment income to | | | | | | | | | | | | | | | | | | | | |
| average net assets | | | 1.97 | % | | | 2.33 | % | | | 2.30 | % | | | 2.47 | % | | | 2.53 | % |
| Portfolio Turnover | | | 17.75 | % | | | 23.83 | % | | | 10.03 | % | | | 18.41 | % | | | 18.46 | % |
| (a) | Ratio of expenses to average net assets after the reduction of custodian fees under a custodian arrangement were 0.96% and 0.98% for the years ended September 30, 2020 and 2019, respectively. See Note 5. |
See accompanying notes to financial statements.
HAWAII MUNICIPAL FUND
NOTES TO FINANCIAL STATEMENTS
September 30, 2020
| (1) | ORGANIZATION AND SUMMARY OF SIGNIFICANT ACCOUNTING POLICIES |
Hawaii Municipal Fund (“Fund”) is a series of Lee Financial Mutual Fund, Inc. which is registered under the Investment Company Act of 1940, as a non-diversified open-end management investment company. Lee Financial Mutual Fund, Inc. currently has one investment portfolio, the Fund, which is currently offering one Class of Shares: Investor Shares.
The investment objective of the Fund is to provide a high level of current income exempt from federal and Hawaii state income taxes, consistent with preservation of capital and prudent investment management. The Fund seeks to achieve its objective by investing primarily in a portfolio of investment grade municipal securities issued by or on behalf of the State of Hawaii, or any of its political subdivisions, which pay interest that is exempt from regular federal and Hawaii income taxes.
The Fund is subject to the risk of price fluctuation of the municipal securities held in its portfolio which is generally a function of the underlying credit rating of an issuer, the maturity length of the securities, the securities’ yield, and general economic and interest rate conditions.
Since the Fund invests primarily in obligations of issuers located in Hawaii, the Fund is subject to additional concentration of risk. Due to the level of investment in Hawaii municipal obligations, the marketability and market value of these obligations may be affected by certain Hawaiian constitutional provisions, legislative measures, executive orders, administrative regulations, voter initiatives, and other political and economic developments. If any such problems arise, they could adversely affect the ability of various Hawaiian issuers to meet their financial obligation. Therefore, an investment in the Fund may be riskier than investment in other types of municipal bond funds.
The Fund is an investment company and accordingly follows the investment company accounting and reporting guidance of the Financial Accounting Standards Board (FASB) Accounting Standard Codification Topic 946 “Financial Services – Investment Companies” including FASB Accounting Standard Update ASU 2013-08.
Portfolio securities, that are fixed income securities, are valued by an independent pricing service using methodologies that it believes are appropriate, including actual market transactions, mean between bid and ask prices, broker-dealer supplied valuations, matrix pricing, or other electronic data processing techniques designed to identify market values for such securities, in accordance with procedures established in good faith by the Board of Directors. Securities with remaining maturities of 60 days or less are valued on the amortized cost basis as reflecting fair value. Securities for which market quotations are not readily available or for which available prices are suspect will be valued at “fair value” using methods determined in good faith by or at the direction of the Board of Directors. For these purposes, “fair value” means the price that the Investment Manager reasonably expects the Fund could receive from an arm’s-length buyer upon the current sale of the securities within seven (7) days, after considering all appropriate factors and indications of value available to them. Such value will be cost if the Investment Manager determines such valuation is appropriate after considering a multitude of factors in accordance with established procedures.
The Fund utilizes various methods to measure the fair value of most of its investments on a recurring basis. U.S. generally accepted accounting principles (“GAAP”) establishes a hierarchy that prioritizes inputs to valuation methods. The three levels of inputs are:
HAWAII MUNICIPAL FUND
NOTES TO FINANCIAL STATEMENTS – (Continued)
September 30, 2020
Level 1 – Unadjusted quoted prices in active markets for identical assets or liabilities that the Fund has the ability to access.
Level 2 – Observable inputs other than quoted prices included in Level 1 that are observable for the asset or liability, either directly or indirectly. These inputs may include quoted prices for the identical instrument on an inactive market, prices for similar instruments, interest rates, prepayment speeds, credit risk, yield curves, default rates and similar data.
Level 3 – Unobservable inputs for the asset or liability, to the extent relevant observable inputs are not available, representing the Fund’s own assumptions about the assumptions a market participant would use in valuing the asset or liability, and would be based on the best information available.
The availability of observable inputs can vary from security to security and is affected by a wide variety of factors, including for example, the type of security, whether the security is new and not yet established in the marketplace, the liquidity of markets, and other characteristics particular to the security. To the extent that valuation is based on models or inputs that are less observable or unobservable in the market, the determination of fair value requires more judgment. Accordingly, the degree of judgment exercised in determining fair value is greatest for instruments categorized in Level 3.
The inputs used to measure fair value may fall into different levels of the fair value hierarchy. In such cases, for disclosure purposes, the level in the fair value hierarchy within which the fair value measurement falls in its entirety, is determined based on the lowest level input that is significant to the fair value measurement in its entirety.
Changes in valuation techniques may result in transfers in/out changing an investment’s assigned level within the hierarchy.
The following is a description of the valuation techniques applied to the Fund’s major categories of financial instruments measured at fair value on a recurring basis:
Municipal bonds are categorized in Level 2 of the fair value hierarchy.
The following is a summary of the inputs used in valuing the Fund’s investments, as of September 30, 2020. The inputs or methodology used for valuing securities are not necessarily an indication of the risks associated with investing in those securities.
Valuation Inputs at Reporting Date:
| Description | | Level 1 | | | Level 2 | | | Level 3 | | | Total | |
| Municipal Bonds | | $ | - | | | $ | 159,405,593 | | | $ | - | | | $ | 159,405,593 | |
There were no transfers in to and out of Levels 1 and 2 during the current period presented.
HAWAII MUNICIPAL FUND
NOTES TO FINANCIAL STATEMENTS – (Continued)
September 30, 2020
It is the Fund’s policy to comply with the requirements of the Internal Revenue Code applicable to regulated investment companies and to distribute its taxable income, if any, to its shareholders. Therefore, no federal income tax provision is required.
The Fund has reviewed all open tax years for all major jurisdictions, which is the Federal jurisdiction, and concluded that there are no significant uncertain tax positions that would require recognition in the financial statements. As of September 30, 2020, open Federal tax years include the tax years ended September 30, 2017 – September 30, 2020. The Fund has no examination in progress and is also not aware of any tax positions for which it is reasonably possible that the total amounts of unrecognized tax benefits will significantly change in the next twelve months.
In order to avoid imposition of the excise tax applicable to regulated investment companies, the Fund intends to declare each year as dividends in each calendar year at least 98% of its net investment income (earned during the calendar year) and 98.2% of its net realized capital gains (earned during the twelve months ended October 31) plus undistributed amounts, if any, from prior years.
On December 22, 2010, the Regulated Investment Company Modernization Act of 2010 (the “Act”) was enacted. The Act modernized several of the federal income and excise tax provisions related to regulated investment companies such as the Fund, and, with certain exceptions, was effective for taxable years beginning after December 22, 2010. Among the changes made are changes to the capital loss carryforward rules allowing for capital losses to be carried forward indefinitely. As of September 30, 2020, the Fund did not have any non-expiring capital loss carryforwards.
Capital losses incurred after October 31 within the fiscal year are deemed to arise on the first business day of the Fund’s following fiscal year for tax purposes. The Fund did not have any post October capital losses to defer.
| (C) | SECURITY TRANSACTIONS, INVESTMENT INCOME AND DISTRIBUTIONS TO SHAREHOLDERS |
Security transactions are recorded on the trade date. Interest income is recorded on the accrual basis. Bond discounts and premiums are amortized using the interest method. Distributions to shareholders are declared daily and reinvested or paid in cash monthly.
The preparation of financial statements in conformity with accounting principles generally accepted in the United States of America requires management to make estimates and assumptions that affect the reported amounts of assets and liabilities at the date of the financial statements and the reported amounts of revenues and expenses during the reporting period. Actual results could differ from those estimates.
The net asset value per share for the Fund is determined by calculating the total value of the Fund’s assets, deducting its total liabilities and dividing the result by the number of shares outstanding.
HAWAII MUNICIPAL FUND
NOTES TO FINANCIAL STATEMENTS – (Continued)
September 30, 2020
| (2) | INVESTMENT MANAGEMENT FEE AND OTHER TRANSACTIONS WITH AFFILIATES |
Lee Financial Group Hawaii, Inc. (“LFG”) provides the Fund with management and administrative services pursuant to a management agreement and administrative services agreement, respectively. In accordance with the terms of the management agreement and of the administrative services agreement, LFG receives compensation at the annual rate of 0.50% and up to 0.10% of the Fund’s average daily net assets, respectively. The fees are listed on the statement of operations. For the period ended September 30, 2020, the Fund was allocated, and paid LFG, $70,192 of the Fund’s Chief Compliance Officer fee.
The Fund’s distributor, Lee Financial Securities, Inc. (“LFS”), a wholly-owned subsidiary of LFG, received $239,155 for costs incurred in connection with the sale of the Fund’s shares (See Note 3).
Lee Financial Recordkeeping, Inc. (“LFR”), a wholly-owned subsidiary of LFG, serves as the transfer agent for the Fund. In accordance with the terms of the transfer agent agreement, LFR receives compensation at the annual rate of 0.06% of the Fund’s average daily net assets. LFR has delegated certain of its duties and responsibilities to UMB Fund Services, Inc. as sub-transfer agent. LFR also provides the Fund with certain clerical, bookkeeping and shareholder services pursuant to a service agreement approved by the Fund’s directors. As compensation for these services LFR receives a fee, computed daily and payable monthly, at an annualized rate of 0.05% of the Fund’s average daily net assets. The fees are listed on the statement of operations.
Certain officers and directors of the Fund are also officers of LFG, LFS and LFR.
The Fund’s Board of Directors, including a majority of the Directors who are not “interested persons” of the Fund, as defined in the Investment Company Act of 1940, adopted a distribution plan pursuant to Rule 12b-1 of the Act. Rule 12b-1 regulates the manner in which a regulated investment company may assume costs of distributing and promoting the sales of its shares.
The Plan provides that the Hawaii Municipal Fund Investor Class may incur certain costs, which may not exceed 0.25% per annum of the Fund’s average daily net assets, for payment to the distributor for items such as advertising expenses, selling expenses, commissions or travel, reasonably intended to result in sales of shares of the Fund. The fees are listed on the statement of operations.
| (4) | PURCHASES AND SALES OF SECURITIES |
Purchases and sales of securities aggregated $28,512,131 and $30,748,066, respectively, for the Fund during the period October 1, 2019 through September 30, 2020.
Under an agreement with the Fund’s custodian bank, $5,818 and $1,090 of the custodian fees were paid by credits for cash balances during the fiscal years ended September 30, 2020 and September 30, 2019, respectively. If not for the offset agreement, the assets could have been employed to produce income.
HAWAII MUNICIPAL FUND
NOTES TO FINANCIAL STATEMENTS – Concluded
September 30, 2020
| (6) | TAX COMPONENTS OF CAPITAL AND DISTRIBUTIONS TO SHAREHOLDERS |
The tax character of distributions paid for the Hawaii Municipal Fund during the years ended September 30, 2020 and 2019 were as follows:
| | | Exempt-Interest Dividends | | | Ordinary Income | | Long Term Capital Gains | | Total Distributions | |
| 2020 | | $ | 3,150,138 | | | $ | - | | $ | - | | $ | 3,150,138 | |
| 2019 | | $ | 3,700,255 | | | $ | - | | $ | - | | $ | 3,700,255 | |
The tax character of distributable earnings for the Hawaii Municipal Fund at September 30, 2020 were as follows:
| Undistributed Ordinary Exempt-Interest Income | | | Ordinary Income | | | Undistributed Capital Gains | | | Capital Loss Carryforwards | | | Post October Losses | | | Unrealized Gain/(Loss)* | | | Total Distributable Earnings | |
| $ | 31,460 | | | $ | 63,570 | | | $ | 1,103,436 | | | $ | - | | | $ | - | | | $ | 6,737,728 | | | $ | 7,936,194 | |
| * | The difference between book basis and tax basis unrealized appreciation is attributable to market discount on debt securities and wash sales. |
Accounting principles generally accepted in the United States of America require that certain components of net assets be reclassified between financial and tax reporting. These reclassifications have no effect on net assets or net asset value per share. For the year ended September 30, 2020, the Fund utilized $11,041 of capital loss carryforward.
| (7) | NEW ACCOUNTING PRONOUNCEMENTS OR REGULATIONS |
In March 2017, the Financial Accounting Standards Board (FASB) issued Accounting Standards Update (ASU) No. 2017-08, Receivables-Nonrefundable Fees and Other Costs (Subtopic 310-20): Premium Amortization on Purchased Callable Debt Securities. The amendments in the ASU shorten the amortization period for certain callable debt securities, held at a premium, to be amortized to the earliest call date. The ASU does not require an accounting change for securities held at a discount; which continues to be amortized to maturity. The ASU is effective for fiscal years and interim periods within those fiscal years beginning after December 15, 2018. The Hawaii Municipal Fund complied with ASU No. 2017-08 on July 22, 2019 by changing its accounting policy to amortizing premium to the earliest call date. There was minimal effect on the amortization of the Fund.
| (8) | SUBSEQUENT EVENTS DISCLOSURE |
In preparing the Fund’s financial statements as of September 30, 2020, the Fund’s management considered the impact of subsequent events for potential recognition or disclosure in these financial statements.
LEE FINANCIAL MUTUAL FUND, INC.
BOARD OF DIRECTORS AND OFFICERS (Unaudited)
The Officers and Directors of the Corporation, their principal occupations for the last five years and their affiliation, if any, with the Investment Manager, or the Corporation's Distributor, are shown below. Interested persons of the Corporation as defined in the 1940 Act are indicated by an asterisk (*) in the table below. The Officers of the Corporation manage its day-to-day operations. The Corporation’s Investment Manager and its Officers are subject to the supervision and control of the Directors under the laws of the state of Maryland. Unless otherwise indicated below, the address of each Director and Officer is c/o Lee Financial Group Hawaii, Inc., 3113 Olu Street, Honolulu, HI 96816-1425.
| Name, Age and Address | Position & Office With the Corporation | Term of Office and Length of Time Served | Principal Occupation During the Past Five Years | Number of Portfolios in Corporation Complex Overseen by Director** | Other Directorships Held by Director During the Past Five Years |
| DISINTERESTED DIRECTORS | | | | |
| Clayton W.H. Chow (68) | Director | Unlimited Term 32 years | Retired; March 2012-August 2014, Sales Manager, Estes Express | 1 | None |
| Lynden M. Keala (66) | Director | Unlimited Term 31 years | February 2014–Present, Account Executive, American Solutions for Business; September 2005-January 2014, Account Executive, Workflow One (formerly The Relizon Company) | 1 | None |
| Kim F. Scoggins (73) | Director | Unlimited Term 23 years | Vice President & Division Manager, Colliers International HI, LLC | 1 | None |
| INTERESTED DIRECTORS | | | | |
| Terrence K.H. Lee (63)* | Director, Chairman, and CEO | Unlimited Term 32 years | Director, President and CEO, Lee Financial Group Hawaii, Inc., Lee Financial Securities, Inc., and Lee Financial Recordkeeping, Inc. | 1 | None |
| OFFICERS | | |
| Nora B. Foley (60) | President (Since January 2018), and Chief Compliance Officer (Since October 2004) | Vice President, CCO, CFO, and Treasurer Lee Financial Group Hawaii, Inc., Lee Financial Securities, Inc., and Lee Financial Recordkeeping, Inc. |
| Charlotte A. Meyer (67) | Secretary (Since January 2018) | Director, Secretary (Since March 2018) Corporate Vice President, and Assistant Treasurer (January 2006 – March 2018), Lee Financial Group Hawaii, Inc., Lee Financial Securities, Inc., and Lee Financial Recordkeeping, Inc. |
| Lee Ann Y. Matsuda (56) | Treasurer (Since January 2018) | Employee, Vice President, March 2016 – Present; VP Operations, March 2013 – March 2016, Lee Financial Group Hawaii, Inc. March 2013 – Present; Employee, Lee Financial Securities, Inc. and Lee Financial Recordkeeping, Inc. |
Terrence K.H. Lee is an interested person of the Corporation by virtue of his relationship as a director, officer and shareholder of the Fund’s investment manager, as a director and officer of the Fund’s principal underwriter and transfer agent and because he has had a material and professional relationship with the Corporation for the last two completed calendar years.
| ** | Each Corporation director oversees one portfolio of the Corporation that is currently offered for sale. |
Additional information about members of the Board of Directors and executive Officers is available in the Fund’s Statement of Additional Information (“SAI”). To obtain a free copy of the SAI, please call (808) 988-8088.
STATEMENT REGARDING THE FUND’S LIQUIDITY RISK MANAGEMENT PROGRAM (UNAUDITED)
The Fund has adopted and implemented a Liquidity Risk Management Program (the “Program”) as required by Rule 22e-4 under the Investment Company Act of 1940, as amended (the “Liquidity Rule”). The Program seeks to assess, manage and review the Fund’s Liquidity Risk. “Liquidity Risk” is defined as the risk that the Fund could not meet requests to redeem shares issued by the Fund without significant dilution of remaining investors’ interest in the Fund. The Fund’s Board of Directors has appointed the Fund’s Investment Manager to serve as the program administrator for the Program (the “Program Administrator”). Among other things, the Liquidity Rule requires that the Program Administrator provide a written report to the Board on an annual basis that addresses the operation of the Program, and assesses the adequacy and effectiveness of its implementation, including the operation of the Highly Liquidity Investment Minimum (“HLIM”) established for the Fund, if any, and any material changes to the Program (the “Report”). The Program Administrator has established a Liquidity Risk Management Committee (the “Committee”) to assist it in the implementation and administration of the Program.
At a meeting held on October 28, 2020, the Board received and reviewed the first annual Report concerning the operation of the Program for the period from June 1, 2019 to June 30, 2020 (the “Period”) from the Committee. The Report summarized the operation of the Program and the information and factors considered by the Committee in reviewing the adequacy and effectiveness of the implementation of the Program. The Report concluded that the Program has been appropriately designed, implemented, and is effectively operating to assess and manage the Fund’s Liquidity Risk within the compliance parameters of the Liquidity Rule. The Report also indicated that no material changes to the Program were being recommended by the Committee and that the Fund was not required to set a HLIM.
There can be no assurance that the Program will achieve its objectives under all circumstances in the future. Please refer to the Fund’s prospectus for more information regarding the Fund’s exposure to liquidity risk and other risks to which it may be subject.
Hawaii Municipal Fund Investor Class (Unaudited)
Shareholder Information
Household Delivery of Shareholder Documents: Only one Prospectus, Annual and Semi-Annual Report will be sent to shareholders with the same last name and address on their Fund account, unless you request multiple copies. If you would like to receive separate copies, please call us at (808) 988-8088. We will begin sending you additional copies within 30 days. If your shares are held through a service provider, please contact them directly.
Business Continuity Plan Summary Disclosure Statement: Lee Financial Mutual Fund, Inc., Lee Financial Group Hawaii, Inc., Lee Financial Securities, Inc. and Lee Financial Recordkeeping, Inc. have developed Business Continuity Plans on how we will respond to events that significantly disrupt our business. Since the timing and impact of disasters and disruptions is unpredictable, we will have to be flexible in responding to actual events as they occur. In response to the Coronavirus outbreak, Lee Financial has had minimal staff on-site to facilitate the daily fund operations and maintain normal business operations. Additional Lee Financial staff have worked remotely to assist with Fund operations and shareholder requests. The Fund’s office has maintained limited visitor access. The Fund’s other service providers have been able to maintain normal business operations.
Contacting Us - If after a significant business disruption you cannot contact us as you usually do at (808) 988-8088, you should go to our website at www.LeeHawaii.com. Please visit our website at www.LeeHawaii.com for the Business Continuity Plan Disclosure Statement.
Proxy Voting Policies and Procedures
The Fund has established Proxy Voting Policies and Procedures (“Policies”) that the Fund uses to determine how to vote proxies relating to portfolio securities. Shareholders may request copies of the Policies free of charge by calling (808) 988-8088 or by sending a written request to Lee Financial Group Hawaii, Inc., 3113 Olu Street, Honolulu, HI 96816. Copies of the Fund’s proxy voting records are posted on the Securities and Exchange Commission’s website at www.sec.gov and the Fund’s website at www.LeeHawaii.com and reflect the 12-month period beginning July 1, 2019 and ending June 30, 2020.
Schedules of Investments
The Fund files a complete schedule of investments with the Securities and Exchange Commission for the third month of the first and third quarters for each fiscal year on Form N-PORT. Shareholders will be able to view the filed Form N-PORT by visiting the Commission’s website at www.sec.gov or the Fund’s website at www.LeeHawaii.com.
Disclosure Regarding Approval of the Investment Management Agreement
Hawaii Municipal Fund (Unaudited)
At a meeting held on July 29, 2020, the Board of Directors (the “Board”) of Lee Financial Mutual Fund, Inc. (the “Fund”) considered and approved the continuance of the Investment Management Agreement between the Fund and Lee Financial Group Hawaii, Inc. (the “LFG”) with respect to the Hawaii Municipal Fund (the “Portfolio”), a series of Lee Financial Mutual Fund, Inc., for an additional one-year period ending September 30, 2021.
Prior to the meeting, the Board had received detailed information from LFG. This information together with other information provided by LFG and the information provided to the Board throughout the course of year formed the primary (but not exclusive) basis for the Board's determinations as summarized below. The information, material factors and conclusions that formed the basis for the Board's subsequent approval of the Investment Management Agreement are described below.
1. Information Received
Materials reviewed. During the course of the year, the Board received a wide variety of materials relating to the services provided by LFG, including reports on the Portfolio's investment results; portfolio composition; portfolio trading practices; and other information relating to the nature, extent and quality of services provided by LFG to the Fund and Portfolio. In addition, the Board reviewed and considered supplementary information and presentations by LFG that included materials regarding the Portfolio's investment results; management fee; performance; financial and profitability information regarding LFG, descriptions of various functions such as compliance monitoring and portfolio trading, and information about the experience and qualifications of the personnel providing investment management and administrative services to the Portfolio. Further, an independent third party prepared an analytical report which provided comparative management fee, expense and performance information for the Portfolio and its peer group.
Review Process. The Board received assistance regarding legal and industry standards from independent counsel to the independent Directors of the Board. The Board discussed the renewal of the Investment Management Agreement with LFG representatives. In deciding to recommend the renewal of the Investment Management Agreement, the Board did not identify any single issue or particular information that, in isolation, was the controlling factor. This summary describes the most important, but not all, of the factors considered by the Board.
2. Nature, Extent and Quality of Services
In the Board’s review of LFG, its personnel and its resources, it considered the depth and quality of LFG's investment management process; the experience, capability and integrity of its senior management, portfolio manager and other personnel; the turnover rates of its personnel; and the overall financial strength and stability of its organization. Based on this review, the Board determined that LFG has the capabilities, resources and personnel necessary to manage the Fund and Portfolio and the Board is satisfied with the quality of services provided by LFG in advising the Portfolio.
Other Services. The Board considered, in connection with the performance of LFG’s investment management services to the Fund and the Portfolio, the following: LFG’s policies, procedures and systems for compliance with applicable laws and regulations and its commitment to these programs; its efforts to keep the Board informed; and its attention to matters that may involve conflicts of interest with the Fund. As a point of comparison, the Board also considered the nature, extent, quality and cost of certain non-investment related administrative services provided by LFG to the Fund and Portfolio under the Administrative Agreement.
3. Investment Performance
The Board considered the Portfolio's unique pursuit of its investment objective and the investment results of the Portfolio in light of its objective. The Board reviewed the short-term and long-term performance of the Portfolio on an absolute basis and in comparison to its benchmark index and other comparable Hawaii and other single-state mutual funds. The Board also reviewed the rankings for the Portfolio by an independent rating and ranking organization. The Board took into consideration LFG’s explanation of the under-performance of the Portfolio over various periods as compared to its benchmark and peer group and noted the out-performance as compared to the Fund’s Hawaii mutual fund peers. The Board concluded that the performance of the Portfolio is reasonable as compared to its benchmark and other comparable funds in the peer group median as selected by the independent third party and the other Hawaii mutual funds.
4. Management Fees and Total Operating Expenses
The Board reviewed and considered the management fee payable by the Portfolio to LFG in light of the nature, extent and quality of the investment management and administrative services provided by LFG. Additionally, the Board received and considered information comparing the Portfolio’s management fee and overall expenses with those of other comparable funds as selected by the independent third party. The comparative information showed that the Portfolio’s management fee and operating expenses are competitive with the management fees and expenses of such other funds, however, the current Portfolio management fee is higher than the peer group and category median, but below the highest management fee of the peer group and the current net expenses are higher than the peer group and category median for other funds of similar size, but on a gross basis, lower than the highest expense ratio of the peer group. The Board also considered the advisory fee information for other LFG clients that are similarly managed to the Portfolio. Based on this information the Board concluded that the management fees and total operating expenses for the Portfolio are reasonable in light of the nature, extent and quality of the investment management and administrative services provided by LFG.
5. Adviser Costs, Level of Profits, Economies of Scale and Ancillary Benefits
The Board reviewed information regarding LFG's costs of providing services to the Fund and the Portfolio, as well as the resulting level of profits to LFG. The Board further concluded that the profit to LFG for investment management services seems reasonable based on the services provided. The Board noted that since the management fee does not contain breakpoints, there would be no economies of scale from reduction of the management fee as the Portfolio’s assets grow. In assessing the benefits to LFG from its relationships with the Portfolio, the Board noted that there are no soft dollar arrangements. The Board also took into account potential benefits to LFG as the Fund’s administrator and the engagement of affiliates for distribution, shareholder servicing and transfer agency services and concluded that the management fee for the Portfolio was reasonable in relation to the benefits derived by LFG and its affiliates from these relationships.
6. Conclusions
No single factor was determinative of the Board's decision to re-approve the Fund Portfolio Investment Management Agreement, but rather the Board based their determination on the total mix of information available to them. Based on their review, including their consideration of each of the factors referred to above, the Board, including all of the Fund’s Independent Directors of the Board present, concluded that the Portfolio’s Investment Management Agreement, and the compensation is determined to be fair and reasonable in light of such services provided and expenses incurred under the Investment Management Agreement.
INVESTMENT MANAGER
Lee Financial Group Hawaii, Inc.
3113 Olu Street
Honolulu, Hawaii 96816
DISTRIBUTOR
Lee Financial Securities, Inc.
3113 Olu Street
Honolulu, Hawaii 96816
FUND ACCOUNTANT
UMB Fund Services
235 W. Galena Street
Milwaukee, Wisconsin 53212-3948
CUSTODIAN
UMB Bank, N.A.
982 Grand Blvd, 5th Floor
Kansas City, Missouri 64106
LEGAL COUNSEL
Faegre Drinker Biddle & Reath LLP
One Logan Square
Suite #2000
Philadelphia, Pennsylvania 19103-6996
INDEPENDENT REGISTERED PUBLIC ACCOUNTING FIRM
Tait, Weller & Baker LLP
Two Liberty Place
50 S 16th Street, Suite #2900
Philadelphia, Pennsylvania 19102-2529
TRANSFER AGENT
Lee Financial Recordkeeping, Inc.
3113 Olu Street
Honolulu, Hawaii 96816
Item 2. Code of Ethics.
(a) The registrant has adopted a code of ethics that applies to its principal executive and senior financial executives.
(c) Not applicable.
(d) Not applicable.
(e) Not applicable.
(f)(1) Pursuant to Item 13(a)(1), the Registrant is attaching as an exhibit a copy of its code of ethics that applies to its principal executive and senior financial executives.
(f)(2) Copies of the Code of Ethics may be obtained free of charge by accessing the website www.LeeHawaii.com, by calling (808) 988-8088 or by sending a written request to Lee Financial Group Hawaii, Inc., 3113 Olu Street, Honolulu, HI 96816.
Item 3. Audit Committee Financial Expert
(a)(1) The registrant’s board of directors has determined that the registrant does not have an audit committee financial expert serving on its audit committee.
(a)(2) Not applicable.
(a)(3) The board of directors concluded that based on the required attributes, no independent member of the Board qualified as a financial expert. Based on the size of the registrant, the Board further concluded that a financial expert was not required.
Item 4. Principal Accountant Fee and Services.
(a) Audit Fees.
The aggregate fees billed for each of the last two fiscal years for professional services rendered by the principal accountant for the audit of the registrant’s annual financial statements or services that are normally provided by the accountant in connection with statutory and regulatory filings or engagements were $28,400 for the fiscal year ended September 30, 2020 and $28,400 for the fiscal year ended September 30, 2019.
(b) Audit-Related Fees.
The aggregate fees billed in each of the last two fiscal years for assurance and related services by the principal accountant that are reasonably related to the performance of the audit of the registrant’s financial statements and are not reported under paragraph (a) of this Item were none for the fiscal year ended September 30, 2020 and none for the fiscal year ended September 30, 2019.
(c) Tax Fees.
The aggregate fees billed in each of the last two fiscal years for professional services rendered by the principal accountant for tax compliance, tax advice, and tax planning were $3,300 for the fiscal year ended September 30, 2020 and $3,300 for the fiscal year ended September 30, 2019. The tax services relate to the preparation of the registrant’s excise tax and income tax returns.
(d) All Other Fees.
The aggregate fees billed in each of the last two fiscal years for products and services provided by the principal accountant, other than the services reported in paragraphs (a) through (c) of this Item were $10,500 for the fiscal year ended September 30, 2020 and $10,500 for the fiscal year ended September 30, 2019. These fees are for services related to the internal control audit of the transfer agent.
(e)(1) Audit Committee’s Pre-Approval Policies and Procedures
1. (a) The Committee shall review and approve proposals for the independent accountants to render permissible non-audit services. The Committee may adopt pre-approval policies and procedures, including both general pre-approvals and terms for specific case-by-case approvals, and may delegate the authority to grant such pre-approvals to one or more members of the Committee.
(b) The pre-approval requirement may be waived with respect to the provision of non-audit services for the registrant if: (i) the aggregate amount of all such non-audit services provided to the registrant constitutes no more than 5% of the total amount of revenues paid by the registrant to its independent accountants during the fiscal year in which the non-audit services are provided; (ii) such services were not recognized at the time of the engagement to be non-audit services; and (iii) such services are promptly brought to the attention of the Committee and approved prior to the completion of the audit.
2. Review and approve in advance with the independent accountants each non-audit engagement involving the registrant’s independent accountants and the registrant’s investment adviser and any entity controlling, controlled by or under common control with the adviser (“control affiliates”) where: (i) the investment adviser or its control affiliate provides ongoing services to the registrant; and (ii) the engagement relates directly to the operations and financial reporting of the registrant.
(a) The pre-approval requirement may be waived if: (i) the aggregate amount of all services provided constitutes not more than 5% of the total amount of revenues paid to the registrant’s independent accountants by the registrant’s investment adviser and its control affiliates that provide ongoing services to the registrant during the fiscal year in which the services are provided that would have to be pre-approved by the registrant’s Committee; (ii) such services were not recognized by the registrant’s adviser or its control affiliates (that provide ongoing services to the Fund) at the time of the engagement to be non-audit services; and (iii) such services are promptly brought to the attention of the Committee and approved prior to the completion of the audit.
(e)(2) None of the services provided to the registrant described in paragraphs (b) – (d) of Item 4 were pre-approved by the audit committee pursuant to paragraph (c)(7)(i)(C) of Rule 2-01 of Regulation S-X.
(f) Not applicable.
(g) The aggregate non-audit fees billed to the principal accountant for services rendered by the principal accountant to the registrant, registrant’s investment adviser, and any entity controlling, controlled by or under common control with the investment adviser that provides ongoing services to the registrant were $15,400 for the fiscal year ended September 30, 2020 and $15,800 for the fiscal year ended September 30, 2019. These fees are for the tax services disclosed under Item 4(c) above; services related to the internal control audit of the transfer agent disclosed under Item 4(d) above; and the Anti-Money Laundering Program for the distributor and transfer agent.
(h) Not applicable.
Item 5. Audit Committee of Listed Registrants.
Not applicable.
Item 6. Schedule of Investments.
(a) Schedule I - Investment in securities of unaffiliated issuers is included as part of the reports to shareholders filed under Item 1 of this Form.
(b) Not applicable.
Item 7. Disclosure of Proxy Voting Policies and Procedures for Closed-End Management Investment Companies.
Not applicable.
Item 8. Portfolio Managers of Closed-End Management Investment Companies.
Not applicable
Item 9. Purchases of Equity Securities by Closed-End Management Investment Company and Affiliated Purchasers.
Not applicable.
Item 10. Submission of Matters to a Vote of Security Holders.
No material changes were made to the procedures by which shareholders recommend nominees to the board.
Item 11. Controls and Procedures.
| (a) | The registrant’s principal executive and principal financial officers, or person performing similar functions, has concluded that the registrant’s disclosure controls and procedures (as defined in Rule 30a-3(c) under the Investment Company Act of 1940, as amended (the “1940 Act”) (17CFR 270.30a-3(c))) are effective, as of a date within 90 days of the filing date of the report that includes the disclosure required by this paragraph, based on their evaluation of these controls and procedures required by Rule 30a-3(b) under the 1940 Act (17 CFR 270.30a-3(b)) and Rules 13a-15(b) or 15d-15(b) under the Securities Exchange Act of 1934, as amended (17CFR 240.13a-15(b) or 240.15d-15(b)). |
| (b) | There were no changes in the registrant’s internal control over financial reporting (as defined in Rule 30a-3(d) under the 1940 Act (17 CFR 270.30a-3(d)) that occurred during the period covered by this report that has materially affected, or is reasonably likely to materially affect, the registrant’s internal control over financial reporting. |
Item 12. Disclosure of Securities Lending Activities for Closed-End Management Investment Companies.
Not applicable.
Item 13. Exhibits.
SIGNATURES
Pursuant to the requirements of the Securities Exchange Act of 1934 and the Investment Company Act of 1940, the registrant has duly caused this report to be signed on its behalf by the undersigned, thereunto duly authorized.
| (Registrant) | Lee Financial Mutual Fund, Inc. | |
| By (Signature and Title)* | /s/ Terrence K.H. Lee | |
| | Terrence K.H. Lee, CEO | |
| | (principal executive officer) | |
| | | |
| Date | November 27, 2020 | |
Pursuant to the requirements of the Securities Exchange Act of 1934 and the Investment Company Act of 1940, this report has been signed below by the following persons on behalf of the registrant and in the capacities and on the dates indicated.
| By (Signature and Title)* | /s/ Terrence K.H. Lee | |
| | Terrence K.H. Lee, CEO | |
| | (principal executive officer) | |
| | | |
| By (Signature and Title)* | /s/ Lee Ann Y. Matsuda | |
| | Lee Ann Y. Matsuda, Treasurer | |
| | (principal financial officer) | |
| | | |
| Date | November 27, 2020 | |
| * | Print the name and title of each signing officer under his or her signature. |