UNITED STATES
SECURITIES AND EXCHANGE COMMISSION
WASHINGTON, D.C. 20549
FORM N-CSR
CERTIFIED SHAREHOLDER REPORT OF REGISTERED
MANAGEMENT INVESTMENT COMPANIES
Investment Company Act file number 811-5586
Oppenheimer Rochester California Municipal Fund
(Exact name of registrant as specified in charter)
6803 South Tucson Way, Centennial, Colorado 80112-3924
(Address of principal executive offices) (Zip code)
Cynthia Lo Bessette
OFI Global Asset Management, Inc.
225 Liberty Street, New York, New York 10281-1008
(Name and address of agent for service)
Registrant’s telephone number, including area code: (303) 768-3200
Date of fiscal year end: July 31
Date of reporting period: 7/31/2016
| Item 1. | Reports to Stockholders. |
| | | | | | |
| | Annual Report | | 7/31/2016 | | |
| | | | |
| | 
| | |
| | Oppenheimer Rochester ® California Municipal Fund | | |
Table of Contents
Class A Shares
AVERAGE ANNUAL TOTAL RETURNS AT 7/31/16
| | | | | | | | | | | | |
| | | Class A Shares of the Fund | | | | |
| | | Without Sales Charge | | | With Sales Charge | | | Barclays Municipal Bond Index | |
| | | |
1-Year | | | 10.67% | | | | 5.41% | | | | 6.94% | |
| |
| | | |
5-Year | | | 8.14 | | | | 7.10 | | | | 5.13 | |
| |
| | | |
10-Year | | | 3.35 | | | | 2.85 | | | | 5.01 | |
| |
Performance data quoted represents past performance, which does not guarantee future results. The investment return and principal value of an investment in the Fund will fluctuate so that an investor’s shares, when redeemed, may be worth more or less than their original cost. Fund returns include changes in share price, reinvested distributions, and a 4.75% maximum applicable sales charge except where “without sales charge” is indicated. Current performance may be lower or higher than the performance quoted. Returns do not consider capital gains or income taxes on an individual’s investment. For performance data current to the most recent month-end, visit oppenheimerfunds.com or call 1.800.CALL OPP (225.5677).
Our Twitter handle is @RochesterFunds.
2 OPPENHEIMER ROCHESTER CALIFORNIA MUNICIPAL FUND
An Important Update
to the Fund Performance Discussion
Update (as of September 14, 2016): In the weeks that followed the end of this reporting period, several developments occurred that we believe warrant attention from this Fund’s shareholders.
Payments were due August 1, 2016 on several Puerto Rico securities. The Rochester complex received 100% of the payments owed on its COFINA holdings and 100% of the payments owed on its MFA holdings. This Fund does not hold the PRASA securities that had and made August 1, 2016 payments. The Government Development Bank of Puerto Rico (GDB), the Public Finance Corporation (PFC) and the Puerto Rico Infrastructure and Finance Authority (PRIFA) did not make their August 1, 2016 payments, and the Commonwealth also failed to make an interest payment of $1.3 million on its general obligation (G.O.) debt, according to The Bond Buyer. The PFC had defaulted on payments in 2015 and earlier this year, and this Fund does not hold the GDB, PRIFA or G.O. securities that missed their August 1, 2016 debt payments.
In early September 2016, Francisco Besosa, a U.S. District Court judge, said he would not halt a lawsuit in which plaintiffs allege that Gov. Alejandro García Padilla violated PROMESA (the Puerto Rico Oversight, Management and Economic Stability Act) by declaring a moratorium on payments stipulated in the covenants for constitutionally backed debt. While PROMESA was to automatically stay any litigation against Puerto Rico and its instrumentalities, this ruling has the potential to benefit bondholders. Among other allegations, the lawsuit claims that Puerto Rico’s budget for fiscal year 2017, which calls for the transfer of certain funds, and the debt moratorium violate PROMESA.
Earlier, Judge Besosa stayed litigation brought by Ambac Assurance Corporation against Puerto Rico’s highway and transportation authority. According to an August 25, 2016 article on the Caribbean Business website, there are “at least eight lawsuits whose plaintiffs are fighting PROMESA’s stay.” Separately, several Puerto Rico industry and business associations have joined forces to challenge the rate increases that PREPA, the Commonwealth’s electric utility authority, began charging in August.
The president of the Puerto Rico House of Representatives resigned on August 29, 2016, amid rumors that one of his businesses benefited from an affiliation with a man who pled guilty to corruption charges.
On August 31, 2016, two weeks before the date set forth in PROMESA, the Obama administration announced the following members of the federal oversight board:
| ● | | Andrew G. Biggs, a resident scholar at the American Enterprise Institute |
| ● | | Jose B. Carrión III, the president and principal partner of Hub International CLC |
3 OPPENHEIMER ROCHESTER CALIFORNIA MUNICIPAL FUND
| ● | | Carlos M. Garcia, the managing partner of BayBoston Capital and a former president, CEO and chairman of the Government Development Bank of Puerto Rico (the GDB) |
| ● | | Arthur J. Gonzalez, a senior fellow at New York University Law School and a retired Chief Judge of the U.S. Bankruptcy Court for the Southern District of New York |
| ● | | José Ramon González, the CEO and president of the Federal Home Loan Bank of New York and a former president of the GDB |
| ● | | Ana J. Matosantos, a financial and budget consultant for the Public Policy Institute of California and a former director of the California Department of Finance for Governors Arnold Schwarzenegger and Jerry Brown |
| ● | | David A. Skeel Jr., a professor at the University of Pennsylvania Law School. |
Each will serve a 3-year term and can be reappointed. Of the seven members of the board, four were on lists developed by the Republican leadership in Congress, two were on lists developed by the Democratic leadership in Congress and one was chosen by the President himself. The President selected six members from the legislative lists.
Investors should note that PROMESA put forth an explicit process and guidelines for selecting board members. The law specified that board members must have “knowledge and expertise in finance, municipal bond markets, management, law, or the organization or operation of business or government,” according to a summary prepared by the House Committee on Natural Resources. Board members, the law explained, are to be reimbursed for expenses but will not be paid for their service. PROMESA has a plan to fill any board vacancies that may arise, and the board may hire an executive director as well as U.S. or Puerto Rico government employees.
Later on August 31, Gov. Padilla announced that Dick Ravitch – a lawyer, real estate developer and, for a short time, the lieutenant governor of New York – would be his appointed ex officio representative to the control board. Ravitch’s term may be short lived given that Gov. Padilla is not running for re-election this November. The new governor may choose to take the non-voting role for himself, may retain Ravitch or may appoint a different representative.
On September 14, 2016, Puerto Rico’s Office of Management and Budget and its Treasury Department announced that the government had located about $2 billion in segregated accounts that are separate from the Commonwealth’s general fund. The restrictions on the use of this money could be lifted via new legislation.
Our team continues to be an active participant in negotiations with Puerto Rico officials. Shareholders should be confident that we will continue to work to protect our shareholders’ best interests.
4 OPPENHEIMER ROCHESTER CALIFORNIA MUNICIPAL FUND
Fund Performance Discussion
Oppenheimer Rochester California Municipal Fund once again generated high levels of tax-free income during the 12 months ended July 31, 2016. The Class A shares provided a yield-driven annual total return of 10.67% at net asset value (NAV) and a distribution yield of 5.16% at NAV. The Fund’s Class A shares were in the fourth percentile in Lipper’s California Municipal Debt Funds category, and the distribution yield was 214 basis points higher than the category average. Additionally, the Fund outperformed the Barclays Municipal Bond Index, its benchmark, by 373 basis points. Tax-free income comprised more than half of the Fund’s total return this reporting period, further evidence supporting our focus on yield as the long-term driver of Fund performance.
MARKET OVERVIEW
The Federal Reserve Open Market Committee (FOMC) once again decided at its July 2016 meeting to leave the Fed Funds target interest rate between 0.25% and 0.50%. However, in a statement following the meeting, the committee noted that “near-term risks to the economic outlook diminished.” The FOMC reiterated its plans to monitor “global economic and financial developments” and painted a more positive picture, saying that “the labor market strengthened with economic activity expanding at a moderate
|
|
The average distribution yield in Lipper’s California Municipal Debt Funds category was 3.02% at the end of this reporting period. At 5.16%, the distribution yield at NAV for this Fund’s Class A shares was 214 basis points higher than the category average. |
rate and household spending growing strongly.” The FOMC also noted that business investment has been soft and that inflation remains below the Fed’s 2% annual target
| | | | |
YIELDS & DISTRIBUTIONS FOR CLASS A SHARES | | | | |
Dividend Yield w/o sales charge | | | 5.16% | |
Dividend Yield with sales charge | | | 4.91 | |
Standardized Yield | | | 2.77 | |
Taxable Equivalent Yield | | | 5.70 | |
Last distribution (7/26/16) | | $ | 0.037 | |
Total distributions (8/1/15 to 7/31/16) | | $ | 0.452 | |
Endnotes for this discussion begin on page 23 of this report.
5 OPPENHEIMER ROCHESTER CALIFORNIA MUNICIPAL FUND
rate, partly reflecting earlier declines in energy prices and non-energy import prices. Thus, the reporting period ended as it began, with market watchers speculating about the timing and nature of FOMC decisions.
Many market analysts had predicted that the FOMC would raise the Fed Funds target rate at the September 2015 meeting. The Fed decided otherwise, citing “underutilization of labor resources and inflation continuing to run below the committee’s longer-run objective.”
In a speech after that meeting, Ms. Yellen tried to quell the resulting market volatility saying, “It will likely be appropriate to raise the target range of the Federal Funds rate sometime later this year, and to continue boosting short-term rates at a gradual pace thereafter as the labor market improves further and inflation moves back to our 2% objective.”
In December 2015, the Fed Funds target rate was increased to the current 0.25% to 0.50% range. The rate had been held to a range of zero to 0.25% for nearly 7 years, and the December 2015 increase was the first in nearly 10 years. Also in December, the Fed said it expected to raise the short-term Fed Funds rate four times in 2016.
After the March 2016 meeting, the number of likely 2016 increases was halved. By way of explanation, Ms. Yellen said “risks of raising rates too soon and derailing growth outweigh
the hazards of the Fed needing to catch up to a sizzling economy.”
In the minutes of the July 2016 meeting, the FOMC asserted that another Fed Funds rate increase “was or would soon be warranted.” We remind investors that a change in the Fed Funds rate does not automatically translate into a change in longer-term interest rates, which are determined by the marketplace. No matter what the Fed does, this Fund’s investment team will seek to meet investors’ desires for competitive levels of tax-free income by searching for value in the muni market.
On July 29, 2016, the last business day of this reporting period, yields on high-grade municipal bonds at the short end of the yield curve were higher than they had been on July 31, 2015. Prices on high-grade munis with maturities of 3 years and longer rallied during the same period.
The average yield on 30-year, AAA-rated muni bonds was 2.27% on July 29, 2016, down 93 basis points from July 31, 2015. The average yield on 10-year, AAA-rated muni bonds was 1.45% on July 29, 2016, down 79 basis points from the July 2015 date, and the average yield on 1-year, AAA-rated muni bonds was 0.45%, up 17 basis points from the July 2015 date.
In June 2016, California legislators approved a $122.5 billion spending plan for fiscal year 2017 that increases spending for social
6 OPPENHEIMER ROCHESTER CALIFORNIA MUNICIPAL FUND
services but also sets aside $2 billion more than required for the state’s rainy day fund. Calling the agreement “fiscally sound” and “focused on today and tomorrow,” Senate President Pro Tem Kevin de Leon noted that the budget “makes key investments to fight poverty and homelessness, bolsters education from pre-school to college, and targets critical funding for healthcare and public safety while setting aside significant savings to hedge against harder times.”
The Trustees of California State University issued $1.1 billion in systemwide revenue bonds in August 2015 to fund a variety of campus projects. Moody’s assigned an Aa2 rating for the bonds, citing “the scale of the system which is the nation’s single largest 4-year higher education system, very strong student demand, ample unrestricted liquidity, improved state funding reflecting strengthening of California’s economy and management’s demonstrated ability to manage operations through periods of revenue constraint.”
In January 2016, Gov. Jerry Brown announced the 2016 California Infrastructure Plan with $55 billion to be spent mostly on the state’s transportation system over the next 5 years. Sources of funding will be from a variety of state and federal funds, and projects will include deferred maintenance at levees, state facilities, courts, universities, and community colleges, and renovations of the state’s Sacramento downtown office space, including the State Capitol Annex. The Plan also includes $36 billion over the next decade
to improve the maintenance of highways and roads, expand public transit and improve critical trade routes.
During this reporting period, the California High-Speed Rail Authority continued to work on what is expected to be the nation’s first high-speed rail system. If all goes as planned, commuters will be able to travel from San Francisco to the Los Angeles basin in less than 3 hours by 2029. The system will eventually extend from Sacramento to San Diego. In February 2016, rail officials announced plans to start the $64.2 billion project in the north, constructing the Bakersfield-to-San Jose segment before the Bakersfield-to-Los Angeles stretch. The authority projected reduced costs of $5.5 billion resulting from value engineering, design changes and a favorable bidding environment. To fund the high-speed rail system, California has $9.9 billion in voter-approved bonds, $2.5 billion in federal stimulus funds that must be spent by September 2017, and 25% of fluctuating revenue from the state’s cap-and-trade program, which could be as much as $500 million a year.
In April 2016, Orange County issued its first bonds in nearly a decade to finance the upgrade of the county’s central utility power facility in Santa Ana. Investors may remember Orange County’s troubled history: In 1994, after officials revealed that the county faced $1.5 billion in losses related to high-risk investments, the state’s third-most populous county defaulted on its bonds and commenced Chapter 9 bankruptcy
7 OPPENHEIMER ROCHESTER CALIFORNIA MUNICIPAL FUND
proceedings. While the news justifiably kept Orange County in the headlines as the NAVs of many mutual funds were adversely affected, much less was reported on the eventual resolution: Orange County municipal bondholders ultimately received 100% of the principal and interest payments they were owed and also received added interest to compensate for the payment delays.
In the second quarter of 2016, Gov. Brown imposed permanent water conservation measures, including many emergency drought regulations that will remain in effect indefinitely under the governor’s executive order. With California entering its fifth year of a statewide drought, the new restrictions were tailored to each individual water agency’s specific water supply circumstances and developed with their input. Despite rains that replenished some reservoirs, Gov. Brown stated the drought may never entirely end and that the state needs to adapt to life with less water.
As of July 31, 2016, California’s general obligation (G.O.) bonds were rated Aa3 by Moody’s Investors Service, AA-minus by S&P Global Ratings (S&P) and A-plus by Fitch Ratings. G.O.s are backed by the full faith and taxing authority of the state or local government that issues them.
Successful investors, we have found, maintain a long-term perspective regardless of the specific developments associated with any given reporting period. To maximize the
benefits that municipal bond funds seek to provide, many investors reinvest their dividends and allow the income generated from their investments to compound over time.
FUND PERFORMANCE
Oppenheimer Rochester California Municipal Fund held more than 575 securities as of July 31, 2016. The Fund was invested in a broad range of sectors, providing shareholders with a diversity of holdings that we believe would be difficult and costly to replicate in an individual portfolio.
The Fund’s Class A distribution yield at NAV was in the fourth percentile in Lipper’s California Municipal Debt Funds category as of July 31, 2016. At 5.16% on that date, it was 214 basis points higher than the category average, which was 3.02%. During this reporting period, market conditions created pressure on the dividends of many fixed income funds. This Fund’s Class A dividend, which was 3.8 cents per share at the outset of this reporting period, was reduced to 3.7 cents per share beginning with the April 2016 payout. In all, the Fund distributed 45.2 cents per Class A share this reporting period.
The tax-exempt status of the Fund’s distributions of net income remained a boon to investors seeking tax-free income. For a taxable investment to have provided a greater benefit than an investment in this Fund, it would have had to yield more than 5.70%, based on the Fund’s standardized yield as
8 OPPENHEIMER ROCHESTER CALIFORNIA MUNICIPAL FUND
| | | | | | |
The Rochester Portfolio Management Team |
 | |  | |  | |  |
| | | |
| Scott Cottier, CFA | | Troy Willis, JD, CFA | | Mark DeMitry, CFA | | Michael Camarella, |
Team Leader and Senior Portfolio Manager | | Team Leader and Senior Portfolio Manager | | Senior Portfolio Manager | | CFA Senior Portfolio Manager |
| | | |
 | |  | | | | |
| | | |
Charlie Pulire, CFA Senior Portfolio Manager | | Elizabeth Mossow, CFA Portfolio Manager | | | | |
of July 31, 2016, and the top federal and California income tax rates for 2016. As long-time investors know, yields and share prices move in opposite directions. When yields on fixed income funds rise, share prices fall and vice versa. Yields have historically contributed the lion’s share of the long-term total returns generated by bonds, and the Fund’s total return this reporting period reflects both competitive yields and NAV increases.
During this reporting period, all industry sectors contributed positively to the Fund’s total return. In aggregate, the Fund’s investments in securities issued in Puerto Rico also contributed positively to Fund performance.
G.O. securities comprised 15.3% of total assets (15.5% of net assets) as of July 31, 2016. At the end of this reporting period, the
9 OPPENHEIMER ROCHESTER CALIFORNIA MUNICIPAL FUND
10 OPPENHEIMER ROCHESTER CALIFORNIA MUNICIPAL FUND
G.O. holdings consisted of bonds issued in various California municipalities and in the Commonwealth of Puerto Rico, and the sector contributed positively to Fund performance. While they have not been tested before a court, the legal protections for Puerto Rico’s G.O. debt are strong, we believe, and many of our funds have overweight positions in these bonds relative to muni funds offered by other asset managers.
Municipal bonds backed by proceeds from the tobacco Master Settlement Agreement (MSA), the national litigation settlement with U.S. tobacco manufacturers, represented 12.8% of the Fund’s total assets (13.0% of net assets) at the end of this reporting period. The sector was a positive contributor to the Fund’s total return this reporting period.
We believe the securities we hold in this sector are fundamentally sound credits, and we like that “tobacco bonds” can provide tax-exempt income for investors as well as benefits to the issuing states and territories. During this reporting period, our long-term view of the sector continued to be bullish and, given attractive valuations, we believe that it is likely we will continue to hold a greater percentage of tobacco bonds in our portfolios than our peers. As in prior reporting periods, the tobacco bonds this Fund held during this reporting period made all scheduled payments of interest and principal on time and in full.
The Fund’s holdings in municipal bonds issued by utilities represented 11.6% of total assets (11.7% of net assets) at the end of
this reporting period. This set of holdings included water utilities with 5.2% of total assets (5.3% of net assets), electric utilities with 4.9% of total assets (4.9% of net assets), sewer utilities with 1.3% of total assets (1.3% of net assets) and gas utilities with 0.2% of total assets (0.2% of net assets) as of July 31, 2016. Our holdings in these sectors include securities issued by PREPA (Puerto Rico’s electric utility authority) and PRASA (the aqueduct and sewer authority) as well as securities issued in Guam. All of the utility sectors contributed positively to Fund performance this reporting period.
As of July 31, 2016, the Fund remained invested in land development (or “dirt”) bonds, which are Special Assessment and, in some cases, Special Tax bonds that help finance the infrastructure needs of new real estate development. At the end of this reporting period, the Special Tax and Special Assessment sectors represented 10.9% and 0.8% of the Fund’s total assets (11.1% and 0.8% of net assets), respectively.
Overall, we believe that land development bonds have several appealing characteristics: the debt service payments securing these bonds are on parity with real estate taxes and senior to mortgage payments, and assessments or taxes must be paid by whoever owns the land when the tax bill comes due. Additionally, we continue to believe that improvements in the housing market and the general economy could further strengthen the credit profiles of the Fund’s land development securities. The Special Tax
11 OPPENHEIMER ROCHESTER CALIFORNIA MUNICIPAL FUND
sector included three territory bonds, one issued in Puerto Rico, one in Guam and one in the U.S. Virgin Islands. Both the Special Tax and the Special Assessment sectors contributed positively to Fund performance this reporting period.
Securities issued in the Commonwealth of Puerto Rico, which are exempt from federal, state and local income taxes, represented 10.2% of the Fund’s total assets (10.3% of net assets) at the end of this reporting period. Puerto Rico’s “tobacco bonds” are excluded from this figure, as they are backed by proceeds from the tobacco MSA and included in this Fund’s tobacco holdings. The Puerto Rico investments of this Fund contributed positively to the Fund’s total return as of July 31, 2016.
The Fund’s Puerto Rico holdings include G.O. securities, which are backed by the full faith and taxing authority of state and local governments, and securities from many different sectors. Some of the Fund’s Puerto Rico G.O.s are insured and others have been pre-refunded, which means they are U.S. Government Obligations sector holdings. In a pre-refunding, a municipality issues a new bond, the proceeds of which are escrowed in U.S. Treasury bonds and earmarked for pay off a previously issued bond.
Most of the Fund’s investments in securities issued in Puerto Rico are supported by taxes and other revenues and are designed to help finance electric utilities, highways and education, among other things.
While Puerto Rico remained in the headlines throughout this reporting period, several significant developments occurred in June and July 2016: In June, the U.S. Supreme Court ruled on a Puerto Rico law our team had challenged and President Barack Obama signed the Puerto Rico Oversight, Management and Economic Stability Act, aka PROMESA, and, at the beginning of July, the Commonwealth defaulted on its G.O. payments and some other debt-service obligations that were due on the first of the month. As detailed later in this report, Puerto Rico issuers had a mixed record throughout this reporting period, making some payments on time and in full while defaulting on others.
On June 13, 2016, the U.S. Supreme Court held that Federal law preempts Puerto Rico from enacting its own bankruptcy laws and invalidated the Puerto Rico Public Corporation Debt Enforcement and Recovery Act (the Recovery Act), which the Commonwealth had enacted in 2014. The Justices upheld the rulings of two lower courts, saying that the Recovery Act, which would have enabled Puerto Rico to restructure the debt of its public utilities under the supervision of a Commonwealth court, was invalid.
As you may recall, the Recovery Act was passed in late June 2014 and Oppenheimer Rochester and Franklin Templeton filed suit immediately, challenging the legislation that was designed to allow PREPA (the Commonwealth’s electric utility authority), PRASA (the aqueduct and sewer authority) and PRHTA (the highway authority) to
12 OPPENHEIMER ROCHESTER CALIFORNIA MUNICIPAL FUND
restructure their debt. On February 6, 2015, a federal judge ruled that the “Recovery Act” violated the U.S. Constitution and was invalid. Five months later, a federal appeals court unanimously affirmed the judge’s decision. On August 21, 2015, the Commonwealth petitioned the U.S. Supreme Court to overturn the February 2015 federal district court ruling, and on December 4, 2015, the U.S. Supreme Court agreed to hear the Commonwealth’s appeal.
At the March 22, 2016 hearing, much of the discussion centered on a 1984 amendment to Chapter 9 bankruptcy code, which does not allow Puerto Rico municipalities or public corporations to file for Chapter 9 bankruptcy protection.
We are pleased that the U.S. Supreme Court upheld the lower courts’ decisions. We are long-term investors in Puerto Rico, and we are working constructively with a range of stakeholders to help return Puerto Rico to a sustainable financial footing.
On June 30, 2016, PROMESA was enacted, a new law that requires the government of Puerto Rico to develop a new fiscal plan, to develop and enact balanced budgets (and legislation) that conform to the fiscal plan, and to deliver audited financial results in a timely fashion. The law began to take shape after earlier proposals – a Puerto Rico Stability Act, a Puerto Rico Recovery Act of 2016 (not to be confused with the Recovery Act), and a Territories Relief Act – failed to gain traction in the U.S. Senate.
We note that PROMESA – which was passed with rare bipartisan support – seems to have successfully balanced the interests of many stakeholders. To quote from the law itself, PROMESA recognizes both the importance of providing Puerto Rico and its instrumentalities with “a method to achieve fiscal responsibility and access to the capital markets” and the need for debt restructuring proposals to be “feasible and in the best interest of creditors.”
The establishment of a federal control board, which is charged with mapping Puerto Rico’s path forward, has the potential to be PROMESA’s greatest strength, we believe, though a lot depends on the board’s composition and approach.
Several provisions, it appears, were designed to protect bondholders. To quote PROMESA, for example, any adjustment of debts must “respect the relative lawful priorities or lawful liens, as may be applicable, in the constitution, other laws, or agreements of a covered territory or covered territorial instrumentality, in effect prior to the date of enactment of this Act.” Importantly, before any instrumentality of Puerto Rico can seek to restructure its debt, the federal control board must certify that the debtor (i.e., Puerto Rico or one of its instrumentalities) has made good faith efforts to reach a consensual restructuring with creditors; has delivered draft financial statements and has procedures in place to deliver timely audited financial statements, and has a fiscal plan, among other provisions.
13 OPPENHEIMER ROCHESTER CALIFORNIA MUNICIPAL FUND
The law also seeks to prevent the government of Puerto Rico from exercising “any control, supervision, oversight, or review” over the federal control board and makes it clear that neither Puerto Rico’s governor nor its legislature can “enact, implement, or enforce any statute, resolution, policy, or rule that would impair or defeat the purposes” of PROMESA.
Late in this reporting period, the roster for the PROMESA-mandated Congressional Task Force on Economic Growth for Puerto Rico was set. Sen. Orrin Hatch (R-Utah) will chair the group, which also includes Senators Marco Rubio (R-Florida), Bob Nelson (D-Florida) and Robert Menendez (D-New Jersey); Representatives Nydia Velazquez (D-New York), Tom MacArthur (R-New Jersey) and Sean Duffy (R-Wisconsin), and Resident Commissioner Pedro Pierluisi. Members of the federal control board for Puerto Rico have yet to be selected.
Shortly after President Barack Obama signed PROMESA, Puerto Rico announced its plans regarding its July 1, 2016 debt-service obligations, which totaled approximately $2 billion. As had been hinted, the Government Development Bank of Puerto Rico announced on July 1, 2016 that it would fail to make a $779 million payment on its G.O. debt. The Puerto Rico Infrastructure and Finance Authority (PRIFA), which had defaulted on payments earlier in the year, did not make its July 1 payments either.
PREPA made a full payment of principal and interest, as did the Municipal Finance Authority (MFA).
PRASA paid all of the principal and interest it owed on the securities held by Oppenheimer Rochester funds; while it failed to pay on rural development bonds, the Rochester funds do not hold these securities. PRASA and its creditors reached an agreement by which PRASA could delay payment on certain securities that had been guaranteed by the Commonwealth.
All of the interest and more than 70% of the principal owed on Public Building Authority (PBA) securities was paid on July 1, 2016. The Puerto Rico Highway and Transportation Authority (PRHTA) paid most of its debt, in part by tapping its debt-service reserve fund.
Interest on bonds backed by Puerto Rico’s sales tax revenues (so called COFINAs) was paid in full on July 1, 2016. The COFINAs are backed by the sales and use tax, which was raised to 11.5%, from 7.5%, on July 1, 2015.
In all, the Commonwealth and its instrumentalities paid slightly more than $900 million of the approximately $2 billion in principal and interest payments that were due July 1, 2016.
It is not yet clear how the Commonwealth’s decisions about its debt-service obligations will affect the long-term outlook for the island’s residents or its bondholders (many of whom reside in Puerto Rico). Investors should
14 OPPENHEIMER ROCHESTER CALIFORNIA MUNICIPAL FUND
note that a decline in a fund’s net investment income can create dividend pressure.
It is also worth noting several other Puerto Rico-related developments that occurred during this reporting period. At the beginning of 2016, the Commonwealth made virtually all of the nearly $1 billion in payments due then. A full payment of $368 million was received to cover the debt-service obligations on Puerto Rico’s G.O. securities. PREPA also made a full payment of $215 million. Two authorities, PRIFA and the Puerto Rico Finance Corporation (PFC), defaulted on $37 million.
According to Gov. Alejandro García Padilla, these defaults were the result of the emergency measure he authorized to divert revenue and use it to ensure that other debt was paid in full. The Puerto Rican government decided not to make the PFC appropriation, and PRIFA revenues were subject to a “claw back.” Three bond insurers – Ambac, Assured Guaranty and FGIC – sued the Commonwealth, arguing that the revenues should not have been diverted. On January 31, 2016, the Commonwealth filed a motion to dismiss the suits filed by Ambac and Assured Guaranty, which were joined. The insurers’ cases were still pending at the end of this reporting period.
As expected, Puerto Rico made its February 1, 2016 COFINA payments. This bond payment had been 99% funded at the end of 2015 and totaled approximately $322 million. The MFA also made its payments on February 1.
The PFC, however, did not honor its debt-service obligation on February 1.
On March 8, 2016, the governor agreed to postpone until June 1 a 6.5 percentage point increase in the Commonwealth’s business-to-business service tax. This decision also delayed Puerto Rico’s transition to a value-added tax (VAT), originally slated to begin April 1. Meanwhile, there were calls for the Commonwealth’s tax system to be overhauled, and the Puerto Rico Legislature passed a bill to stop the tax increases. The governor vetoed the bill, but both chambers of the Legislature overrode the governor, thus eliminating the proposed tax increases.
Issuers of Puerto Rico debt made $59 million of the $60 million in bond and note payments that were due April 1, 2016. The PFC again failed to honor its April 1 debt-service obligation.
On April 4, 2016, reports that the Government Development Bank (the GDB) had established new bank accounts prompted some investors to file a lawsuit in the U.S. District Court for Puerto Rico. The suit seeks a court order to prevent the GDB from diverting money into the new accounts.
The next day, Gov. Padilla proposed that he should be given the authority to declare a debt moratorium on all bonds issued by the Commonwealth’s public sector entities, including G.O. securities and COFINAs. The Puerto Rico Senate passed the measure in the early hours of April 5, the Puerto Rico
15 OPPENHEIMER ROCHESTER CALIFORNIA MUNICIPAL FUND
House approved it the following day and the governor then signed it into law.
Soon after, Puerto Rico legislators began debating amendments that could make many Commonwealth securities ineligible for the debt moratorium. While the Puerto Rico House approved some exemptions, the Senate decided not to vote to exempt guaranteed debt and COFINAs from the debt moratorium.
Meanwhile, the governor declared a state of emergency for the GDB, halting payments to all but “essential services.” Also during April, a group of G.O. bondholders offered a debt-relief plan that included $750 million of new G.O.s; the Commonwealth came forth with revisions to its “voluntary” exchange offer; the Natural Resources Committee of the U.S. House postponed its vote on Puerto Rico-related legislation, and the GDB was said to be in negotiations to reduce the par value of about $120 million of its debt by 47%.
Things heated up when the governor announced that he had signed an executive order on April 30 to declare a moratorium on part of the GDB’s debt. The GDB defaulted on a $367 million principal payment on May 2 after reaching tentative forbearance agreements with two creditor groups. Oppenheimer Rochester Limited Term California Municipal Fund is the only fund in our complex with a GDB position, and its market value is less than one-hundredth of 1% of that fund’s assets.
Also during May, the Puerto Rico House unanimously voted to cancel a planned 4 percentage point increase in a business-to-business tax and to delay its shift to a VAT; a new corporation was established to help PRASA borrow for capital needs, and an agreement for PREPA to sell $111 million in 3-year notes to bondholders and insurance companies appeared to be on the rocks amid concerns about how the debt moratorium law could affect future debt payments. However, PREPA officials said that the restructuring agreements it had reached with bondholders were still on track.
Investors may recall that PREPA and many of its creditors, including this Fund, reached a forbearance agreement in August 2014: In the agreement, which was extended several times beyond March 31, 2015, its initial expiration date, the bondholders agreed to forbear from exercising rights in connection with events that would constitute a default on PREPA bonds, and PREPA agreed to a variety of financial terms; to make its July 1, 2015 payment, and to reach a comprehensive restructuring plan with its creditors by September 1, 2015.
On September 1, 2015, PREPA and the forbearing bondholders reached an agreement in principle on the major financial terms of a securitization transaction to lower PREPA’s debt-service costs. Although the proposed agreement would result in a reduction in the par value of PREPA’s existing bonds, we nevertheless believe the
16 OPPENHEIMER ROCHESTER CALIFORNIA MUNICIPAL FUND
agreement – if implemented – will be a win for bondholders, PREPA and Puerto Ricans.
Investors are reminded that the new bond structure would be bankruptcy remote, which serves to protect bondholders from event risks; that the term sheet required that the new securitization bonds earn an investment-grade rating; that the deal requires approval by the Puerto Rico Legislature and high participation by all bondholders, and that insurers reach agreement with PREPA on the treatment of the insured bonds. If all goes as planned, bondholders will be further insulated from the risks and uncertainties related to any inefficiency in PREPA’s operations and will not incur the costs that would result from a lengthy and uncertain litigation process. While we expect that all parties will continue to work collaboratively, we remind investors that there is no guarantee of either a timeline or implementation.
In subsequent months, after gaining several extensions related to the debt-restructuring agreement, PREPA announced in December 2015 that it had reached agreement with at least 70% of its creditors and its bond insurers.
PREPA and its forbearing bondholders, a group that includes the Oppenheimer Rochester funds, set a January 21, 2016 deadline for the Puerto Rico Legislature to approve legislation related to the debt-restructuring agreement. No vote was taken by that date and, at the time, PREPA asked for an extension. The forbearing bondholders
responded that the extension and a loan of $115 million were contingent on the approval of a surcharge for PREPA customers. After some back and forth, creditors agreed to provide $111 million of financing through the purchase of new bonds – half to be provided after the passage of the debt-restructuring legislation and the remainder after the securitization structure had been submitted to the Energy Commission for approval. PREPA accepted these terms and the deadline for the legislative vote was extended to February 16. The governor signed the debt-restructuring legislation and PREPA was given until March 1 to submit a rate proposal to the Commonwealth’s Energy Commission. All parties agreed to further extensions of the deadline, and the rate proposal was ultimately submitted in late May. Thereafter, the second half of the $111 million was invested in bonds with a 10% coupon and a July 2019 maturity.
On June 21, 2016, the commission agreed to an initial surcharge of 3.1-cent per kilowatt-hour. The following week, the commission added a provisional increase of 1.3 cents per kilowatt-hour, which is designed to help PREPA cover a gap of approximately $222 million in its operating income.
On June 30, 2016, the “Ad Hoc Group” of investors and several insurers agreed to buy an additional $264 million in PREPA securities, which enabled the electric utility to make its July 1 payment of $415 million. Also on that date, the restructuring agreement
17 OPPENHEIMER ROCHESTER CALIFORNIA MUNICIPAL FUND
between the forbearing bondholders and PREPA was extended to December 15, 2016.
PRASA, meanwhile, announced that it will seek to sell $900 million in bonds through a new agency and to restructure another $1.1 billion in existing debt. In a July 12, 2016 television interview, the governor indicated that the bill authorizing these transactions was “more likely to be signed” than other bills on his desk.
A number of nationally recognized statistical ratings organizations (NRSROs) issued downgrades on some Puerto Rico bonds. According to reports in The Bond Buyer, both S&P and Fitch downgraded Puerto Rico’s G.O. debt to D late in the reporting period. Additionally, S&P lowered the credit ratings of PRASA’s senior-lien revenue bonds; some securities issued by PRHTA, PBA and the PR Industrial, Tourist, Educational Medical and Environmental Control Facilities Financing Authority, and debt that had been guaranteed by the Commonwealth.
In other news, the government and various government officials were named in an assortment of lawsuits filed in June and July 2016. One case seeks to have the Commonwealth’s Moratorium Act declared illegal and unconstitutional. Another focuses on the PRHTA funds that were diverted to help pay G.O. debt obligations and support the Commonwealth’s general fund. A third invokes a provision of PROMESA in its argument that government funds should be used to pay G.O. debt-service obligations,
and a fourth – by Assured Guaranty – argues that toll revenues on the bonds it has insured should not have been diverted.
At the end of this reporting period, Puerto Rico’s governor signed a budget for fiscal 2017, which began July 1, 2016. While smaller than the $9.8 billion budget for fiscal 2016, the size of the new budget is a point of contention, with the government saying it’s a $9 billion budget while the minority leader of the Puerto Rico House says spending will total $9.6 billion once various ancillary budget bills are signed. Revenues for fiscal 2016, meanwhile, totaled $9.2 billion, less than had been anticipated but more than had been collected in fiscal 2015.
The Oppenheimer Rochester team has been an active participant in negotiations with Puerto Rico officials, and shareholders should be confident that we will continue to work to protect their best interests.
Our investment team will continue to monitor credit rating changes and other developments related to our Puerto Rico holdings closely. Investors should note that deterioration of the Puerto Rican economy could have an adverse impact on Puerto Rico bonds and the performance of the Oppenheimer Rochester municipal funds that hold them, including this Fund. Our team’s commitment to protecting the interests of our shareholders is unwavering.
Given the degree to which Oppenheimer Rochester funds have been cited in news
18 OPPENHEIMER ROCHESTER CALIFORNIA MUNICIPAL FUND
coverage about the economic and fiscal challenges facing Puerto Rico, we feel compelled to remind investors that all fund investments are actively managed. Our team is responsive to the dynamics of the market and may choose to adjust trading strategies in the interest of maximizing the potential benefits to our shareholders. Further, while we remain committed to keeping investors informed about our basic investing strategies, we do not provide comment about near-term trading strategies as we believe doing so might allow other market participants to impair our team’s ability to deliver shareholder value.
Please note: An important update on post-reporting-period developments that could have implications for the Fund’s Puerto Rico holdings can be found on page 3 of this report.
Tax increment financing (TIF) bonds constituted 8.8% of the Fund’s total assets (8.9% of net assets) on July 31, 2016. Traditionally, this type of financing has been used for urban and suburban renewal projects. When tax collections increase, driven either by an improving economy or inflation, the credit quality of these types of securities generally improves, which can lead to enhanced performance. TIFs also contributed positively to the Fund’s performance this reporting period.
U.S. Government obligation bonds constituted 7.1% of the Fund’s total assets (7.2% of net assets) on July 31, 2016. This sector includes
any securities held by the Fund that have been pre-refunded. In a pre-refunding or a refunding, new securities with lower coupon rates are sold by a municipality to pay off debt that has higher interest rates. When a municipality issues a pre-refunding bond, a development that can only be done when the nearest call date is at least 90 days later, the proceeds are escrowed in U.S. Treasury bonds and earmarked to pay off the previously issued bond. While pre-refundings and refundings tend to reduce the total income that can be distributed, the Treasury bonds that are purchased with the proceeds of pre-refundings and refundings are backed by the full faith and credit of the U.S. government. The sector contributed positively to the Fund’s performance this reporting period.
The Fund was also invested in the municipal leases sector this reporting period, which accounted for 5.4% of the Fund’s total assets (5.5% of net assets) as of July 31, 2016. As state and local governments seek new ways to reduce costs and improve near-term cash flow, many lease all types of assets, including office space for public sector employees. The bonds held by this Fund, three of which were issued in Puerto Rico, are backed by the proceeds of these lease arrangements. This sector contributed positively to the Fund’s performance.
The Fund was also invested in securities used to finance marine and aviation facilities this reporting period. Many of these securities are high-grade investments that are backed by valuable collateral. As of July 31, 2016, 4.7%
19 OPPENHEIMER ROCHESTER CALIFORNIA MUNICIPAL FUND
of the Fund’s total assets (4.7% of net assets) were invested in the marine/aviation facilities sector. Our holdings in this sector, which include two bonds issued in Guam and two bonds issued in the Northern Mariana Islands, contributed positively to Fund performance.
The sales tax sector represented 4.5% of the Fund’s total assets (4.6% of net assets) as of July 31, 2016. Debt-service payments on securities in this sector are paid using the issuing municipality’s sales tax revenue. The sector includes one bond issued in the U.S. Virgin Islands, and securities issued in Puerto Rico represents about 70% of the Fund’s investments in this sector. The sales-tax sector contributed positively to Fund performance this reporting period.
Many sectors in which the Fund maintained relatively smaller investments as of July 31, 2016 also contributed positively to performance. Investors benefited this reporting period from the Fund’s holdings in sectors focused on higher education, hospital/ healthcare, and single- and multifamily housing, among others.
During this reporting period, the Fund maintained an investment in municipal inverse-floating rate securities, which are tax-exempt securities with interest payments that move inversely to changes in short-term interest rates. “Inverse floaters” continued to provide high levels of income to funds across the industry during this reporting period and, in aggregate, contributed positively to this Fund’s total return. We continue to believe
that “inverse floaters” are an essential element of this Fund’s portfolio because they can produce attractive yields under certain market conditions.
Our approach to municipal bond investing is flexible and responsive to market conditions. Shareholders should note that market conditions during this reporting period did not affect the Fund’s overall investment goals or cause it to pay any capital gain distributions. In closing, we believe that the Fund’s structure and sector composition as well as our time-tested strategies will continue to benefit fixed income investors through interest rate and economic cycles.
INVESTMENT STRATEGY
The Rochester investment team focuses exclusively on municipal bonds and has consistently used a time-tested, value-oriented and security-specific approach to fund management. We know that market conditions can and do fluctuate, but we do not waver in our belief in the power of tax-free yield to help investors achieve their long-term objectives.
This Fund invests primarily in investment-grade municipal securities. It may invest up to 25% of its total assets in below-investment grade securities, or “junk” bonds; the percentage of assets is measured at the time of purchase as is the credit quality of the securities. Additionally, the credit quality is based on Nationally Recognized Statistical Rating Organization (“NRSRO”) ratings or, if
20 OPPENHEIMER ROCHESTER CALIFORNIA MUNICIPAL FUND
no NRSRO rating, on internal ratings. As of July 31, 2016, market movements or rating changes of municipal bonds, notably the Fund’s investments in Puerto Rico paper, caused the Fund’s below-investment-grade holdings to exceed this threshold. As a result, no further purchases of below-investment-grade bonds will be made until the Fund’s holdings of these types of bonds is once again below 25% of total assets.
Our team continually searches for bonds that we believe are undervalued and can provide a meaningful level of tax-free income until maturity. Rather than making allocation shifts based on expected market conditions, we search the marketplace for what we believe to be the best values for generating income. It remains important to note that we do not manage our funds based on predictions of interest rate changes.
Instead, our investment approach involves scouring the market for municipal securities that meet our stringent credit criteria and buying bonds that we believe will deliver above-average yields relative to peer funds.
Our team also favors premium-coupon, callable bonds, which historically have been a positive for shareholders, delivering higher levels of tax-free income than shorter-maturity bonds while exhibiting less price volatility than their final maturities would suggest.
We regularly focus on identifying inefficiencies in market pricing that can lead to investment advantages. We seek to maintain a thoughtful mix of industry sectors, maturities and credit ratings in this Fund’s portfolio.
The Rochester team also prospects for yield-enhancing opportunities in the secondary market, often picking up odd lots that we believe can add significant incremental yield to our portfolios. We will also look for non-rated issues with solid credit qualities, which we believe can often help enhance a fund’s tax-free yield. Investors should note that non-rated or unrated securities may or may not be the equivalent of investment grade securities.
The Rochester Way, we believe, distinguishes our approach to municipal investing from those of our competitors.
| | | | | | | | |
 | |  | | | |  | |  |
| | Scott S. Cottier, CFA | | | | | Troy E. Willis, CFA, J.D. |
| | Vice President, Senior Portfolio | | | | | Vice President, Senior Portfolio |
| | Manager and Team Leader | | | | | Manager and Team Leader |
On behalf of the rest of the Rochester portfolio management team: Mark R. DeMitry, Michael L. Camarella, Charles S. Pulire and Elizabeth S. Mossow.
21 OPPENHEIMER ROCHESTER CALIFORNIA MUNICIPAL FUND
Top Holdings and Allocations
TOP TEN CATEGORIES
| | |
General Obligation | | 15.3% |
Tobacco Master Settlement Agreement | | 12.8 |
Special Tax | | 10.9 |
Tax Increment Financing (TIF) | | 8.8 |
U.S. Government Obligations | | 7.1 |
Municipal Leases | | 5.4 |
Water Utilities | | 5.2 |
Electric Utilities | | 4.9 |
Marine/Aviation Facilities | | 4.7 |
Sales Tax Revenue | | 4.5 |
Portfolio holdings and allocations are subject to change. Percentages are as of July 31, 2016 and are based on total assets.
CREDIT ALLOCATION
| | | | | | | | | | | | |
| | | NRSRO- Rated | | | Sub-
Adviser-
Rated | | | Total | |
AAA | | | 4.8% | | | | 3.5% | | | | 8.3% | |
AA | | | 35.2 | | | | 0.0 | | | | 35.2 | |
A | | | 10.2 | | | | 0.9 | | | | 11.1 | |
BBB | | | 6.5 | | | | 12.0 | | | | 18.5 | |
BB or lower | | | 16.7 | | | | 10.2 | | | | 26.9 | |
Total | | | 73.4% | | | | 26.6% | | | | 100.0% | |
The percentages above are based on the market value of the securities as of July 31, 2016 and are subject to change. OppenheimerFunds, Inc. determines the credit allocation of the Fund’s assets using ratings by nationally recognized statistical rating organizations (NRSROs), such as S&P Global Ratings (S&P). For any security rated by an NRSRO other than S&P, the sub-adviser, OppenheimerFunds, Inc., converts that security’s rating to the equivalent S&P rating. If two or more NRSROs have assigned a rating to a security, the highest rating is used. For securities not rated by an NRSRO, the sub-adviser uses its own credit analysis to assign ratings in categories similar to those of S&P. The use of similar categories is not an indication that the sub-adviser’s credit analysis process is consistent or comparable with any NRSRO’s process were that NRSRO to rate the same security.
For the purposes of this Credit Allocation table, securities rated within the NRSROs’ four highest categories—AAA, AA, A and BBB—are investment-grade securities. For further details, please consult the Fund’s prospectus or Statement of Additional Information.
22 OPPENHEIMER ROCHESTER CALIFORNIA MUNICIPAL FUND
Performance
DISTRIBUTION YIELDS
| | | | | | |
| As of 7/31/16 | | | | | | |
| | | Without Sales
Charge | | With Sales
Charge | | |
Class A | | 5.16% | | 4.91% | | |
Class B | | 4.27 | | N/A | | |
Class C | | 4.31 | | N/A | | |
Class Y | | 5.43 | | N/A | | |
STANDARDIZED YIELDS
| | |
| For the 30 Days Ended 7/31/16 |
Class A | | 2.77% |
Class B | | 2.15 |
Class C | | 2.16 |
Class Y | | 3.15 |
TAXABLE EQUIVALENT YIELDS
| | |
| As of 7/31/16 |
Class A | | 5.70% |
Class B | | 4.42 |
Class C | | 4.44 |
Class Y | | 6.48 |
AVERAGE ANNUAL TOTAL RETURNS WITHOUT SALES CHARGE AS OF 7/31/16
| | | | | | | | | | | | | | | | | | | | |
| | | Inception Date | | | 1-Year | | | 5-Year | | | 10-Year | | | Since
Inception | |
Class A (OPCAX) | | | 11/3/88 | | | | 10.67 | % | | | 8.14 | % | | | 3.35 | % | | | 5.74 | % |
Class B (OCABX) | | | 5/3/93 | | | | 9.82 | | | | 7.26 | | | | 2.85 | | | | 4.75 | |
Class C (OCACX) | | | 11/1/95 | | | | 9.89 | | | | 7.32 | | | | 2.57 | | | | 4.11 | |
Class Y (OCAYX) | | | 11/29/10 | | | | 10.93 | | | | 8.37 | | | | N/A | | | | 8.34 | |
|
AVERAGE ANNUAL TOTAL RETURNS WITH SALES CHARGE AS OF 7/31/16 | |
| | | Inception
Date | | | 1-Year | | | 5-Year | | | 10-Year | | | Since
Inception | |
Class A (OPCAX) | | | 11/3/88 | | | | 5.41 | % | | | 7.10 | % | | | 2.85 | % | | | 5.56 | % |
Class B (OCABX) | | | 5/3/93 | | | | 4.82 | | | | 6.95 | | | | 2.85 | | | | 4.75 | |
Class C (OCACX) | | | 11/1/95 | | | | 8.89 | | | | 7.32 | | | | 2.57 | | | | 4.11 | |
Class Y (OCAYX) | | | 11/29/10 | | | | 10.93 | | | | 8.37 | | | | N/A | | | | 8.34 | |
23 OPPENHEIMER ROCHESTER CALIFORNIA MUNICIPAL FUND
COMPARISON OF CHANGE IN VALUE OF $10,000 HYPOTHETICAL INVESTMENTS IN:
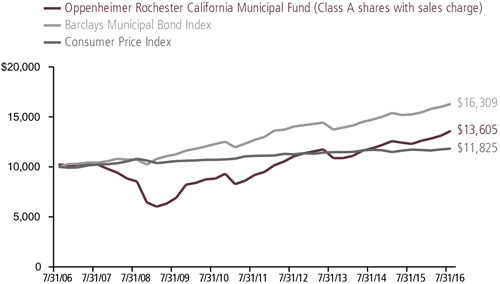
Performance data quoted represents past performance, which does not guarantee future results. The investment return and principal value of an investment in the Fund will fluctuate so that an investor’s shares, when redeemed, may be worth more or less than their original cost. Current performance may be lower or higher than the performance quoted. Returns do not consider capital gains or income taxes on an individual’s investments. For performance data current to the most recent month-end, visit oppenheimerfunds.com or call 1.800.CALL OPP (225.5677). Fund returns include changes in share price, reinvested distributions and the applicable sales charge: for Class A shares, the current maximum initial sales charge of 4.75%; for Class B shares, the contingent deferred sales charge of 5% (1-year) and 2% (5-year); and for Class C, the contingent deferred sales charge of 1% for the 1-year period. There is no sales charge for Class Y shares. Because Class B shares convert to Class A shares 72 months after purchase, the 10-year return for Class B shares uses Class A performance for the period after conversion.
The Fund’s performance is compared to the performance of the Barclays Municipal Bond Index, an index of a broad range of investment-grade municipal bonds that is a measure of the general municipal bond market. The Fund’s performance is also compared to the Consumer Price Index, a non-securities index that measures changes in the inflation rate. Indices are unmanaged and cannot be purchased by investors. While index comparisons may be useful to provide a benchmark for the Fund’s performance, it must be noted that the Fund’s investments are not limited to the investments comprising the indices. Index performance includes reinvestment of income, but does not reflect transaction costs, fees, expenses or taxes. Index performance is shown for illustrative purposes only as a benchmark for the Fund’s performance, and does not predict or depict performance of the Fund. The Fund’s performance reflects the effects of the Fund’s business and operating expenses.
Distribution yields for Class A shares are based on dividends of $0.037 for the 35-day accrual period ended July 26, 2016. The yield without sales charge for Class A shares is calculated by dividing annualized dividends by the Class A net asset value (NAV) on July 26, 2016; for the yield with sales charge, the denominator is the Class A maximum offering price on that date. Distribution yields for Class B, C and Y are annualized based on dividends of $0.0307, $0.0308 and $0.0390 respectively, for the 35-day accrual period ended July 26, 2016 and on the corresponding net asset values on that date.
24 OPPENHEIMER ROCHESTER CALIFORNIA MUNICIPAL FUND
Standardized yield is based on the Fund’s net investment income for the 30-day period ended July 31, 2016 and either that date’s maximum offering price (for Class A shares) or NAV (for the other classes). Each result is compounded semiannually and annualized. Falling share prices artificially increase yields.
The average distribution yield in this Fund’s Lipper category was calculated based on the distributions and the final NAVs of the reporting period for the funds in each category. The average yield at NAV in Lipper’s California Municipal Debt Funds category is based on 128 NAVs, one for each class of each fund in the category; a fund can have up to 4 classes. Lipper yields do not include sales charges – which, if included, would reduce results.
Taxable equivalent yield is based on the standardized yield and the 2016 top federal and California tax rate of 51.4%. Calculations factor in the 3.8% tax on unearned income under the Patient Protection and Affordable Care Act, as applicable. A portion of the Fund’s distributions may be subject to tax; distributions may also increase an investor’s exposure to the alternative minimum tax. Capital gains distributions are taxable as capital gains. Tax treatments of the Fund’s distributions and capital gains may vary by state; investors should consult a tax advisor to determine if the Fund is appropriate for them. Each result is compounded semiannually and annualized. Falling share prices artificially increase yields. This Report must be preceded or accompanied by a Fund prospectus.
The average yields for AAA-rated municipal securities are provided by Municipal Market Advisors (MMA) and are based on its benchmark of general obligation bonds structured with a 5% coupon. The MMA 5% benchmark is constructed using yields from the leading underwriters, who represent a significant percentage of the primary activity of the top 10 underwriters and therefore the total issuance.
Investments in “tobacco bonds,” which are backed by the proceeds a state or territory receives from the 1998 national litigation settlement with tobacco manufacturers, may be vulnerable to economic and/or legislative events that affect issuers in a particular municipal market sector. Annual payments by MSA-participating manufacturers, for example, hinge on many factors, including annual domestic cigarette shipments, inflation and the relative market share of non-participating manufacturers. To date, we believe consumption figures remain within an acceptable range of the assumptions used to structure MSA bonds. Future MSA payments could be reduced if consumption were to fall more rapidly than originally forecast.
The Fund’s investment strategy and focus can change over time. The mention of specific fund holdings does not constitute a recommendation by OppenheimerFunds, Inc. or its affiliates.
Before investing in any of the Oppenheimer funds, investors should carefully consider a fund’s investment objectives, risks, charges and expenses. Fund prospectuses and summary prospectuses contain this and other information about the funds, and may be obtained by asking your financial advisor, visiting oppenheimerfunds.com, or calling 1.800.CALL OPP (225.5677). Read prospectuses and summary prospectuses carefully before investing.
Shares of Oppenheimer funds are not deposits or obligations of any bank, are not guaranteed by any bank, are not insured by the FDIC or any other agency and involve investment risks, including the possible loss of the principal amount invested.
25 OPPENHEIMER ROCHESTER CALIFORNIA MUNICIPAL FUND
Fund Expenses
Fund Expenses. As a shareholder of the Fund, you incur two types of costs: (1) transaction costs, which may include sales charges (loads) on purchase payments and/or contingent deferred sales charges on redemptions; and (2) ongoing costs, including management fees; distribution and service fees; and other Fund expenses. These examples are intended to help you understand your ongoing costs (in dollars) of investing in the Fund and to compare these costs with the ongoing costs of investing in other mutual funds.
The examples are based on an investment of $1,000.00 invested at the beginning of the period and held for the entire 6-month period ended July 31, 2016.
Actual Expenses. The first section of the table provides information about actual account values and actual expenses. You may use the information in this section for the class of shares you hold, together with the amount you invested, to estimate the expense that you paid over the period. Simply divide your account value by $1,000.00 (for example, an $8,600.00 account value divided by $1,000.00 = 8.60), then multiply the result by the number in the first section under the heading entitled “Expenses Paid During 6 Months Ended July 31, 2016” to estimate the expenses you paid on your account during this period.
Hypothetical Example for Comparison Purposes. The second section of the table provides information about hypothetical account values and hypothetical expenses based on the Fund’s actual expense ratio for each class of shares, and an assumed rate of return of 5% per year for each class before expenses, which is not the Fund’s actual return. The hypothetical account values and expenses may not be used to estimate the actual ending account balance or expenses you paid for the period. You may use this information to compare the ongoing costs of investing in the Fund and other funds. To do so, compare this 5% hypothetical example for the class of shares you hold with the 5% hypothetical examples that appear in the shareholder reports of the other funds.
Please note that the expenses shown in the table are meant to highlight your ongoing costs only and do not reflect any transactional costs, such as front-end or contingent deferred sales charges (loads). Therefore, the “hypothetical” section of the table is useful in comparing ongoing costs only, and will not help you determine the relative total costs of owning different funds. In addition, if these transactional costs were included, your costs would have been higher.
26 OPPENHEIMER ROCHESTER CALIFORNIA MUNICIPAL FUND
| | | | | | | | | | | | |
| Actual | | Beginning Account Value February 1, 2016 | | | Ending Account Value July 31, 2016 | | | Expenses Paid During 6 Months Ended July 31, 2016 | |
Class A | | $ | 1,000.00 | | | $ | 1,060.00 | | | $ | 5.70 | |
Class B | | | 1,000.00 | | | | 1,055.90 | | | | 9.60 | |
Class C | | | 1,000.00 | | | | 1,056.30 | | | | 9.60 | |
Class Y | | | 1,000.00 | | | | 1,061.20 | | | | 4.47 | |
| | | |
| Hypothetical | | | | | | | | | |
(5% return before expenses) | | | | | | | | | | | | |
Class A | | | 1,000.00 | | | | 1,019.34 | | | | 5.59 | |
Class B | | | 1,000.00 | | | | 1,015.56 | | | | 9.41 | |
Class C | | | 1,000.00 | | | | 1,015.56 | | | | 9.41 | |
Class Y | | | 1,000.00 | | | | 1,020.54 | | | | 4.38 | |
Expenses are equal to the Fund’s annualized expense ratio for that class, multiplied by the average account value over the period, multiplied by 182/366 (to reflect the one-half year period). Those annualized expense ratios, excluding indirect expenses from affiliated funds, based on the 6-month period ended July 31, 2016 are as follows:
| | | | |
| Class | | Expense Ratios | | |
Class A | | 1.11% | | |
Class B | | 1.87 | | |
Class C | | 1.87 | | |
Class Y | | 0.87 | | |
27 OPPENHEIMER ROCHESTER CALIFORNIA MUNICIPAL FUND
STATEMENT OF INVESTMENTS July 31, 2016
| | | | | | | | | | | | | | | | |
| Principal Amount | | | | | Coupon | | | Maturity | | | Value | |
| | |
| | Municipal Bonds and Notes—106.9% | | | | | | | | | | | | |
| | |
| | California—94.3% | | | | | | | | | | | | |
| | $1,000,000 | | | Adelanto, CA Community Facilities District Special Tax No. 2006-21 | | | 5.000 | % | | | 09/01/2045 | | | $ | 1,100,570 | |
| | |
| | 2,675,000 | | | Adelanto, CA Elementary School District Community Facilities District No. 11 | | | 5.250 | | | | 09/01/2026 | | | | 2,677,381 | |
| | |
| | 1,745,000 | | | Adelanto, CA Elementary School District Community Facilities District No. 11,2 | | | 5.400 | | | | 09/01/2036 | | | | 1,745,768 | |
| | |
| | 40,000 | | | Adelanto, CA Improvement Agency, Series B1 | | | 5.500 | | | | 12/01/2023 | | | | 40,345 | |
| | |
| | 5,710,000 | | | Adelanto, CA Public Utility Authority1 | | | 5.000 | | | | 07/01/2039 | | | | 5,954,845 | |
| | |
| | 1,570,000 | | | Adelanto, CA Public Utility Authority1 | | | 5.000 | | | | 07/01/2024 | | | | 1,641,576 | |
| | |
| | 6,620,000 | | | Adelanto, CA Public Utility Authority1 | | | 6.750 | | | | 07/01/2039 | | | | 7,514,494 | |
| | |
| | 1,000,000 | | | Alhambra, CA (Atherton Baptist Homes)1 | | | 7.625 | | | | 01/01/2040 | | | | 1,135,610 | |
| | |
| | 1,475,000 | | | Alhambra, CA (Atherton Baptist Homes)1 | | | 7.500 | | | | 01/01/2030 | | | | 1,682,178 | |
| | |
| | 100,000 | | | Alvord, CA Unified School District Community Facilities District Special Tax1 | | | 4.500 | | | | 09/01/2017 | | | | 101,236 | |
| | |
| | 885,000 | | | Anaheim, CA Community Facilities District Special Tax (Platinum Triangle)1 | | | 6.125 | | | | 09/01/2031 | | | | 914,125 | |
| | |
| | 3,735,000 | | | Anaheim, CA Community Facilities District Special Tax (Platinum Triangle)1 | | | 6.250 | | | | 09/01/2040 | | | | 3,857,097 | |
| | |
| | 895,000 | | | Anaheim, CA Community Facilities District Special Tax (Platinum Triangle)1 | | | 6.125 | | | | 09/01/2032 | | | | 924,392 | |
| | |
| | 1,350,000 | | | Anaheim, CA Public Financing Authority1 | | | 5.000 | | | | 05/01/2034 | | | | 1,650,429 | |
| | |
| | 10,250,000 | | | Anaheim, CA Public Financing Authority1 | | | 5.000 | | | | 05/01/2039 | | | | 12,432,225 | |
| | |
| | 3,000,000 | | | Anaheim, CA Public Financing Authority (Anaheim Electric System Distribution)3 | | | 5.250 | | | | 10/01/2034 | | | | 3,338,325 | |
| | |
| | 7,000,000 | | | Anaheim, CA Public Financing Authority (Anaheim Electric System Distribution)3 | | | 5.250 | | | | 10/01/2039 | | | | 7,789,425 | |
| | |
| | 25,000 | | | Apple Valley, CA Redevel. Agency Tax Allocation1 | | | 5.000 | | | | 06/01/2032 | | | | 25,462 | |
| | |
| | 600,000 | | | Arvin, CA Community Redevel. Agency Tax Allocation1 | | | 6.500 | | | | 09/01/2038 | | | | 634,194 | |
| | |
| | 790,000 | | | Azusa, CA Special Tax Community Facilities District No. 05-11 | | | 5.000 | | | | 09/01/2021 | | | | 800,341 | |
| | |
| | 1,325,000 | | | Bakersfield, CA Improvement Bond Act 19151,2 | | | 7.375 | | | | 09/02/2028 | | | | 1,338,316 | |
| | |
| | 415,000 | | | Bakersfield, CA Improvement Bond Act 1915 | | | 5.350 | | | | 09/02/2022 | | | | 415,232 | |
| | |
| | 1,130,000 | | | Bakersfield, CA Improvement Bond Act 1915 | | | 5.400 | | | | 09/02/2025 | | | | 1,130,463 | |
| | |
| | 15,000,000 | | | Bay Area, CA Toll Authority (San Francisco Bay Area) | | | 0.430 | 4 | | | 04/01/2047 | | | | 15,000,000 | |
| | |
| | 250,000 | | | Beaumont, CA Financing Authority, Series A1 | | | 5.625 | | | | 09/01/2032 | | | | 284,325 | |
| | |
| | 5,500,000 | | | Beaumont, CA Financing Authority, Series A1 | | | 5.350 | | | | 09/01/2036 | | | | 5,521,065 | |
| | |
| | 120,000 | | | Beaumont, CA Financing Authority, Series A1 | | | 5.250 | | | | 09/01/2029 | | | | 136,135 | |
| | |
| | 115,000 | | | Beaumont, CA Financing Authority, Series A1 | | | 5.125 | | | | 09/01/2028 | | | | 130,627 | |
| | |
| | 1,050,000 | | | Beaumont, CA Financing Authority, Series A1 | | | 6.875 | | | | 09/01/2036 | | | | 1,054,105 | |
| | |
| | 750,000 | | | Beaumont, CA Financing Authority, Series A1 | | | 5.000 | | | | 09/01/2036 | | | | 835,327 | |
| | |
| | 4,410,000 | | | Beaumont, CA Financing Authority, Series A1 | | | 5.875 | | | | 09/01/2042 | | | | 4,993,487 | |
| | |
| | 5,000 | | | Beaumont, CA Financing Authority, Series A1 | | | 7.000 | | | | 09/01/2023 | | | | 5,021 | |
| | |
| | 1,500,000 | | | Beaumont, CA Financing Authority, Series A1 | | | 6.375 | | | | 09/01/2042 | | | | 1,781,475 | |
| | |
| | 2,105,000 | | | Beaumont, CA Financing Authority, Series A1 | | | 5.700 | | | | 09/01/2035 | | | | 2,132,575 | |
| | |
| | 1,560,000 | | | Beaumont, CA Financing Authority, Series B1 | | | 5.000 | | | | 09/01/2025 | | | | 1,872,936 | |
| | |
| | 130,000 | | | Beaumont, CA Financing Authority, Series B1 | | | 8.625 | | | | 09/01/2039 | | | | 130,542 | |
| | |
| | 685,000 | | | Beaumont, CA Financing Authority, Series B1 | | | 5.000 | | | | 09/01/2027 | | | | 686,466 | |
| | |
| | 180,000 | | | Beaumont, CA Financing Authority, Series B1 | | | 5.050 | | | | 09/01/2037 | | | | 180,320 | |
28 OPPENHEIMER ROCHESTER CALIFORNIA MUNICIPAL FUND
| | | | | | | | | | | | | | | | |
| Principal Amount | | | | | Coupon | | | Maturity | | | Value | |
| | |
| | California (Continued) | | | | | | | | | | | | |
| | |
| | $60,000 | | | Beaumont, CA Financing Authority, Series B1 | | | 8.875 | % | | | 09/01/2034 | | | $ | 60,268 | |
| | |
| | 4,000,000 | | | Beaumont, CA Financing Authority, Series C1 | | | 5.500 | | | | 09/01/2035 | | | | 4,018,200 | |
| | |
| | 3,245,000 | | | Beaumont, CA Financing Authority, Series E1 | | | 6.250 | | | | 09/01/2038 | | | | 3,252,171 | |
| | |
| | 500,000 | | | Blythe, CA Community Facilities District Special Tax (Hidden Beaches)1 | | | 5.300 | | | | 09/01/2035 | | | | 505,800 | |
| | |
| | 2,205,000 | | | Blythe, CA Redevel. Agency (Redevel. Project No. 1 Tax Allocation)1 | | | 9.750 | | | | 05/01/2038 | | | | 2,828,772 | |
| | |
| | 1,000,000 | | | Blythe, CA Redevel. Agency (Redevel. Project No. 1 Tax Allocation)1 | | | 5.000 | | | | 05/01/2038 | | | | 1,119,350 | |
| | |
| | 1,010,000 | | | Brea, CA Redevel. Agency | | | 6.591 | 5 | | | 08/01/2031 | | | | 431,250 | |
| | |
| | 2,930,000 | | | Brea, CA Redevel. Agency | | | 6.675 | 5 | | | 08/01/2032 | | | | 1,155,152 | |
| | |
| | 2,300,000 | | | Brea, CA Redevel. Agency | | | 6.830 | 5 | | | 08/01/2033 | | | | 831,565 | |
| | |
| | 5,000,000 | | | Brea, CA Redevel. Agency | | | 6.869 | 5 | | | 08/01/2034 | | | | 1,660,750 | |
| | |
| | 60,000 | | | Butte County, CA Hsg. Authority (Affordable Hsg. Pool)1 | | | 7.000 | | | | 10/01/2020 | | | | 60,313 | |
| | |
| | 3,000,000 | | | CA ABAG Finance Authority for NonProfit Corporations (Casa De Las Campanas)1 | | | 6.000 | | | | 09/01/2037 | | | | 3,545,220 | |
| | |
| | 25,000 | | | CA ABAG Finance Authority for NonProfit Corporations COP (Palo Alto Gardens Apartments)1 | | | 5.350 | | | | 10/01/2029 | | | | 25,042 | |
| | |
| | 60,000 | | | CA Affordable Hsg. Agency (Merced County Hsg. Authority)1 | | | 6.000 | | | | 01/01/2023 | | | | 60,002 | |
| | |
| | 15,000 | | | CA Bay Area Governments Association1,2 | | | 4.125 | | | | 09/01/2019 | | | | 15,035 | |
| | |
| | 2,845,000 | | | CA Communities Transportation Revenue COP1 | | | 6.000 | | | | 06/01/2042 | | | | 3,442,934 | |
| | |
| | 409,500,000 | | | CA County Tobacco Securitization Agency | | | 8.248 | 5 | | | 06/01/2055 | | | | 3,042,585 | |
| | |
| | 3,900,000 | | | CA County Tobacco Securitization Agency | | | 4.461 | 5 | | | 06/01/2033 | | | | 1,484,886 | |
| | |
| | 82,110,000 | | | CA County Tobacco Securitization Agency | | | 5.305 | 5 | | | 06/01/2046 | | | | 11,835,335 | |
| | |
| | 71,700,000 | | | CA County Tobacco Securitization Agency | | | 6.998 | 5 | | | 06/01/2055 | | | | 832,437 | |
| | |
| | 3,000,000 | | | CA County Tobacco Securitization Agency1 | | | 5.000 | | | | 06/01/2047 | | | | 3,000,780 | |
| | |
| | 51,500,000 | | | CA County Tobacco Securitization Agency | | | 6.695 | 5 | | | 06/01/2057 | | | | 391,915 | |
| | |
| | 55,250,000 | | | CA County Tobacco Securitization Agency | | | 6.045 | 5 | | | 06/01/2057 | | | | 319,345 | |
| | |
| | 39,700,000 | | | CA County Tobacco Securitization Agency | | | 5.746 | 5 | | | 06/01/2057 | | | | 418,438 | |
| | |
| | 45,600,000 | | | CA County Tobacco Securitization Agency | | | 5.368 | 5 | | | 06/01/2057 | | | | 525,312 | |
| | |
| | 347,900,000 | | | CA County Tobacco Securitization Agency | | | 7.548 | 5 | | | 06/01/2055 | | | | 2,584,897 | |
| | |
| | 850,000 | | | CA County Tobacco Securitization Agency (TASC)1 | | | 5.100 | 6 | | | 06/01/2028 | | | | 852,949 | |
| | |
| | 2,505,000 | | | CA County Tobacco Securitization Agency (TASC)1 | | | 5.750 | | | | 06/01/2029 | | | | 2,529,399 | |
| | |
| | 1,000,000 | | | CA County Tobacco Securitization Agency (TASC) | | | 5.250 | | | | 06/01/2046 | | | | 1,000,030 | |
| | |
| | 1,780,000 | | | CA County Tobacco Securitization Agency (TASC)1 | | | 5.875 | | | | 06/01/2043 | | | | 1,797,391 | |
| | |
| | 10,760,000 | | | CA County Tobacco Securitization Agency (TASC)1 | | | 6.000 | | | | 06/01/2035 | | | | 10,766,564 | |
| | |
| | 9,670,000 | | | CA County Tobacco Securitization Agency (TASC)1 | | | 6.125 | | | | 06/01/2038 | | | | 9,675,802 | |
| | |
| | 5,315,000 | | | CA County Tobacco Securitization Agency (TASC)1 | | | 5.250 | | | | 06/01/2045 | | | | 5,311,492 | |
| | |
| | 65,800,000 | | | CA County Tobacco Securitization Agency (TASC) | | | 5.388 | 5 | | | 06/01/2046 | | | | 3,030,748 | |
| | |
| | 86,970,000 | | | CA County Tobacco Securitization Agency (TASC) | | | 6.372 | 5 | | | 06/01/2046 | | | | 4,506,785 | |
| | |
| | 11,970,000 | | | CA County Tobacco Securitization Agency (TASC)1 | | | 5.875 | | | | 06/01/2035 | | | | 12,058,458 | |
| | |
| | 18,090,000 | | | CA County Tobacco Securitization Agency (TASC)1 | | | 6.000 | | | | 06/01/2042 | | | | 18,165,435 | |
| | |
| | 3,725,000 | | | CA County Tobacco Securitization Agency (TASC)1 | | | 5.125 | | | | 06/01/2038 | | | | 3,725,298 | |
| | |
| | 8,000,000 | | | CA Educational Facilities Authority (Pepperdine University)1 | | | 5.000 | | | | 10/01/2046 | | | | 9,910,320 | |
| | |
| | 1,250,000 | | | CA Educational Facilities Authority (San Francisco University)1 | | | 6.125 | | | | 10/01/2036 | | | | 1,546,487 | |
29 OPPENHEIMER ROCHESTER CALIFORNIA MUNICIPAL FUND
STATEMENT OF INVESTMENTS Continued
| | | | | | | | | | | | | | | | |
| Principal Amount | | | | | Coupon | | | Maturity | | | Value | |
| | |
| | California (Continued) | | | | | | | | | | | | |
| | |
| | $2,500,000 | | | CA Enterprise Devel. Authority (Sunpower Corp.)1 | | | 8.500 | % | | | 04/01/2031 | | | $ | 2,872,525 | |
| | |
| | 1,500,000 | | | CA GO1 | | | 6.000 | | | | 03/01/2033 | | | | 1,771,305 | |
| | |
| | 7,800,000 | | | CA GO1 | | | 5.000 | | | | 02/01/2038 | | | | 9,210,318 | |
| | |
| | 5,000 | | | CA GO1 | | | 5.500 | | | | 10/01/2022 | | | | 5,044 | |
| | |
| | 5,000 | | | CA GO1 | | | 5.750 | | | | 05/01/2030 | | | | 5,022 | |
| | |
| | 5,000,000 | | | CA GO1 | | | 6.500 | | | | 04/01/2033 | | | | 5,774,700 | |
| | |
| | 35,000 | | | CA GO1 | | | 5.250 | | | | 06/01/2021 | | | | 35,571 | |
| | |
| | 60,000 | | | CA GO1 | | | 6.250 | | | | 10/01/2019 | | | | 60,602 | |
| | |
| | 200,000 | | | CA GO1 | | | 6.250 | | | | 10/01/2019 | | | | 202,006 | |
| | |
| | 5,000,000 | | | CA GO1 | | | 5.000 | | | | 09/01/2036 | | | | 6,270,700 | |
| | |
| | 4,000,000 | | | CA GO1 | | | 0.440 | 4 | | | 05/01/2040 | | | | 4,000,000 | |
| | |
| | 5,190,000 | | | CA GO1 | | | 5.000 | | | | 12/01/2031 | | | | 6,443,696 | |
| | |
| | 25,150,000 | �� | | CA GO1 | | | 5.000 | | | | 09/01/2034 | | | | 31,296,911 | |
| | |
| | 5,000,000 | | | CA Golden State Tobacco Securitization Corp. (TASC)1 | | | 5.750 | | | | 06/01/2047 | | | | 5,101,650 | |
| | |
| | 5,000,000 | | | CA Golden State Tobacco Securitization Corp. (TASC)1 | | | 5.125 | | | | 06/01/2047 | | | | 5,001,250 | |
| | |
| | 2,500,000 | | | CA Golden State Tobacco Securitization Corp. (TASC)1 | | | 5.000 | | | | 06/01/2040 | | | | 3,030,350 | |
| | |
| | 3,750,000 | | | CA Golden State Tobacco Securitization Corp. (TASC)1 | | | 5.000 | | | | 06/01/2045 | | | | 4,528,875 | |
| | |
| | 2,030,000 | | | CA Health Facilities Financing Authority (Community Programs for Persons with Developmental Disabilities)1 | | | 6.250 | | | | 02/01/2026 | | | | 2,490,566 | |
| | |
| | 14,215,000 | | | CA Health Facilities Financing Authority (Providence Health & Service/Provident Health System-Oregon Obligated Group)3 | | | 5.500 | | | | 10/01/2039 | | | | 16,245,545 | |
| | |
| | 160,000 | | | CA Health Facilities Financing Authority (Providence Health System-Southern California)1 | | | 6.250 | | | | 10/01/2028 | | | | 179,776 | |
| | |
| | 5,000,000 | | | CA Health Facilities Financing Authority (SJHS/SJHCN/SJHE/SJHO Obligated Group)1 | | | 5.750 | | | | 07/01/2039 | | | | 5,688,450 | |
| | |
| | 13,500,000 | | | CA Health Facilities Financing Authority (Sutter Health)3 | | | 5.250 | | | | 08/15/2031 | | | | 16,175,700 | |
| | |
| | 260,000 | | | CA HFA (Home Mtg.)1,2 | | | 5.550 | | | | 08/01/2033 | | | | 263,757 | |
| | |
| | 5,000,000 | | | CA HFA (Home Mtg.)1 | | | 5.450 | | | | 08/01/2028 | | | | 5,089,350 | |
| | |
| | 100,000 | | | CA HFA (Home Mtg.)1 | | | 5.050 | | | | 02/01/2029 | | | | 101,072 | |
| | |
| | 745,000 | | | CA HFA (Home Mtg.)1 | | | 5.450 | | | | 08/01/2033 | | | | 783,896 | |
| | |
| | 885,000 | | | CA Independent Cities Finance Authority Mobile Home Park (Hacienda Valley Estates)1 | | | 5.000 | | | | 11/15/2034 | | | | 1,028,901 | |
| | |
| | 1,000,000 | | | CA Independent Cities Finance Authority Mobile Home Park (Lamplighter Salinas)1 | | | 6.250 | | | | 07/15/2045 | | | | 1,120,710 | |
| | |
| | 1,000,000 | | | CA Independent Cities Finance Authority Mobile Home Park (Rancho Del Sol & Grandview)1 | | | 5.500 | | | | 05/15/2047 | | | | 1,118,060 | |
| | |
| | 2,000,000 | | | CA Infrastructure and Economic Devel. (AOMPAAS/TVSRF/AcadF/AFound/AMF Obligated Group)1 | | | 5.000 | | | | 11/01/2041 | | | | 2,404,780 | |
| | |
| | 65,000 | | | CA M-S-R Public Power Agency (San Juan)1 | | | 6.000 | | | | 07/01/2022 | | | | 78,216 | |
| | |
| | 200,000 | | | CA Municipal Finance Authority (Biola University)1 | | | 5.625 | | | | 10/01/2023 | | | | 215,794 | |
| | |
| | 525,000 | | | CA Municipal Finance Authority (Caritas Acquisitions/Caritas Corp. Obligated Group)1,2 | | | 6.400 | | | | 08/15/2045 | | | | 601,440 | |
| | |
| | 250,000 | | | CA Municipal Finance Authority (Casa Griffin Apts.)1 | | | 5.750 | | | | 10/01/2034 | | | | 270,365 | |
30 OPPENHEIMER ROCHESTER CALIFORNIA MUNICIPAL FUND
| | | | | | | | | | | | | | | | |
| Principal Amount | | | | | Coupon | | | Maturity | | | Value | |
| | |
| | California (Continued) | | | | | | | | | | | | |
| | |
| | $1,000,000 | | | CA Municipal Finance Authority (Emerson College)1 | | | 5.750 | % | �� | | 01/01/2033 | | | $ | 1,189,510 | |
| | |
| | 1,000,000 | | | CA Municipal Finance Authority (Emerson College)1 | | | 6.000 | | | | 01/01/2042 | | | | 1,207,990 | |
| | |
| | 1,070,000 | | | CA Municipal Finance Authority (Goodwill Sacramento Valley & Northern Nevada)1 | | | 6.625 | | | | 01/01/2032 | | | | 1,195,158 | |
| | |
| | 835,000 | | | CA Municipal Finance Authority (Goodwill Sacramento Valley & Northern Nevada)1 | | | 5.750 | | | | 01/01/2022 | | | | 911,728 | |
| | |
| | 2,135,000 | | | CA Municipal Finance Authority (Goodwill Sacramento Valley & Northern Nevada)1 | | | 6.875 | | | | 01/01/2042 | | | | 2,413,703 | |
| | |
| | 1,500,000 | | | CA Municipal Finance Authority (OCEAA)1 | | | 7.000 | | | | 10/01/2039 | | | | 1,577,610 | |
| | |
| | 1,750,000 | | | CA Municipal Finance Authority (Pilgrim Place Claremont)1 | | | 5.875 | | | | 05/15/2029 | | | | 1,992,060 | |
| | |
| | 1,000,000 | | | CA Municipal Finance Authority (Pilgrim Place Claremont)1 | | | 6.125 | | | | 05/15/2039 | | | | 1,142,360 | |
| | |
| | 1,250,000 | | | CA Municipal Finance Authority (Southwestern Law School)1 | | | 6.500 | | | | 11/01/2041 | | | | 1,510,250 | |
| | |
| | 600,000 | | | CA Municipal Finance Authority (Southwestern Law School)1 | | | 6.500 | | | | 11/01/2031 | | | | 730,236 | |
| | |
| | 1,000,000 | | | CA Municipal Finance Authority Charter School (John Adams Academics)1 | | | 5.250 | | | | 10/01/2045 | | | | 1,066,950 | |
| | |
| | 5,000,000 | | | CA Municipal Finance Authority Mobile Home Park (Caritas Acquisitions)1 | | | 5.500 | | | | 08/15/2047 | | | | 5,772,150 | |
| | |
| | 1,200,000 | | | CA Municipal Finance Authority Mobile Home Park (Caritas Affordable Housing)1 | | | 5.250 | | | | 08/15/2039 | | | | 1,419,924 | |
| | |
| | 4,000,000 | | | CA Pollution Control Financing Authority (Aemerge Redpak Services Southern California)1 | | | 7.000 | | | | 12/01/2027 | | | | 4,100,200 | |
| | |
| | 365,000 | | | CA Public Works1 | | | 6.125 | | | | 11/01/2029 | | | | 428,251 | |
| | |
| | 2,795,000 | | | CA Public Works1 | | | 5.750 | | | | 03/01/2030 | | | | 3,279,150 | |
| | |
| | 2,500,000 | | | CA Public Works1 | | | 6.000 | | | | 03/01/2035 | | | | 2,949,450 | |
| | |
| | 615,000 | | | CA Public Works1 | | | 6.625 | | | | 11/01/2034 | | | | 617,386 | |
| | |
| | 8,370,000 | | | CA Public Works1 | | | 6.375 | | | | 11/01/2034 | | | | 9,867,895 | |
| | |
| | 2,000,000 | | | CA Public Works (California State Prisons)1 | | | 5.750 | | | | 10/01/2031 | | | | 2,462,920 | |
| | |
| | 900,000 | | | CA Public Works (Dept. of Mental Health)1 | | | 5.000 | | | | 11/01/2031 | | | | 911,079 | |
| | |
| | 1,250,000 | | | CA Public Works (Judicial Council)1 | | | 5.000 | | | | 12/01/2031 | | | | 1,489,200 | |
| | |
| | 125,000 | | | CA Public Works (Trustees California State University)1 | | | 6.000 | | | | 04/01/2027 | | | | 142,830 | |
| | |
| | 305,000 | | | CA Rural Home Mtg. Finance Authority (Single Family Mtg.)7 | | | 5.500 | | | | 08/01/2047 | | | | 97,579 | |
| | |
| | 2,450,000 | | | CA Rural Home Mtg. Finance Authority (Single Family Mtg.)7 | | | 5.500 | | | | 08/01/2047 | | | | 1,224,828 | |
| | |
| | 12,650,000 | | | CA Silicon Valley Tobacco Securitization Authority | | | 5.845 | 5 | | | 06/01/2047 | | | | 1,707,750 | |
| | |
| | 21,465,000 | | | CA Silicon Valley Tobacco Securitization Authority | | | 9.044 | 5 | | | 06/01/2041 | | | | 4,997,052 | |
| | |
| | 165,000,000 | | | CA Silicon Valley Tobacco Securitization Authority | | | 6.296 | 5 | | | 06/01/2056 | | | | 3,262,050 | |
| | |
| | 53,920,000 | | | CA Silicon Valley Tobacco Securitization Authority | | | 8.586 | 5 | | | 06/01/2036 | | | | 17,944,576 | |
| | |
| | 7,405,000 | | | CA State University1 | | | 5.000 | | | | 11/01/2041 | | | | 9,223,594 | |
| | |
| | 100,000 | | | CA Statewide CDA | | | 4.446 | 5 | | | 09/01/2028 | | | | 44,134 | |
| | |
| | 95,000 | | | CA Statewide CDA1 | | | 5.000 | | | | 09/02/2018 | | | | 98,105 | |
| | |
| | 100,000 | | | CA Statewide CDA | | | 5.078 | 5 | | | 09/01/2034 | | | | 28,069 | |
| | |
| | 135,000 | | | CA Statewide CDA1 | | | 5.000 | | | | 09/02/2019 | | | | 139,389 | |
| | |
| | 230,000 | | | CA Statewide CDA1 | | | 5.125 | | | | 09/02/2020 | | | | 237,480 | |
| | |
| | 50,000 | | | CA Statewide CDA1 | | | 6.750 | | | | 09/01/2037 | | | | 50,128 | |
31 OPPENHEIMER ROCHESTER CALIFORNIA MUNICIPAL FUND
STATEMENT OF INVESTMENTS Continued
| | | | | | | | | | | | | | | | |
| Principal Amount | | | | | Coupon | | | Maturity | | | Value | |
| | |
| | California (Continued) | | | | | | | | | | | | |
| | |
| | $2,960,000 | | | CA Statewide CDA (Cathedral City Heritage Park / Glendale Heritage Park Obligated Group)1 | | | 5.200 | % | | | 06/01/2036 | | | $ | 2,973,320 | |
| | |
| | 1,200,000 | | | CA Statewide CDA (CHF-Irvine)1 | | | 5.000 | | | | 05/15/2040 | | | | 1,454,508 | |
| | |
| | 3,675,000 | | | CA Statewide CDA (Cottage Health System) Floaters1 | | | 0.590 | 4 | | | 11/01/2043 | | | | 3,675,000 | |
| | |
| | 1,250,000 | | | CA Statewide CDA (Enloe Medical Center)1 | | | 6.250 | | | | 08/15/2033 | | | | 1,394,712 | |
| | |
| | 1,000,000 | | | CA Statewide CDA (Enloe Medical Center)1 | | | 5.750 | | | | 08/15/2038 | | | | 1,105,620 | |
| | |
| | 3,000,000 | | | CA Statewide CDA (EVLAJHA / GVLAJHA / JHAGS / LAJHFTA / FEV / JHAW / BCSC / ASN Obligated Group)1 | | | 4.750 | | | | 08/01/2020 | | | | 3,010,740 | |
| | |
| | 2,019,578 | | | CA Statewide CDA (Microgy Holdings)8 | | | 9.000 | | | | 12/01/2038 | | | | 20 | |
| | |
| | 4,515,000 | | | CA Statewide CDA (Orinda Wilder)1 | | | 5.000 | | | | 09/01/2037 | | | | 5,155,227 | |
| | |
| | 345,000 | | | CA Statewide CDA (Rio Bravo)1 | | | 6.500 | | | | 12/01/2018 | | | | 345,141 | |
| | |
| | 3,000,000 | | | CA Statewide CDA (Yucaipa Valley Water Reservoir)1 | | | 6.000 | | | | 09/02/2044 | | | | 3,092,790 | |
| | |
| | 145,000 | | | CA Statewide CDA COP (Internext Group)1 | | | 5.375 | | | | 04/01/2030 | | | | 145,539 | |
| | |
| | 2,000,000 | | | CA Statewide CDA School Facilities (47th & Main)1 | | | 6.375 | | | | 07/01/2047 | | | | 2,316,100 | |
| | |
| | 120,000 | | | CA Statewide CDA Special Tax Community Facilities District No. 97 | | | 3.872 | 5 | | | 09/01/2022 | | | | 89,960 | |
| | |
| | 15,000 | | | CA Statewide CDA Water1 | | | 7.000 | | | | 07/01/2022 | | | | 15,054 | |
| | |
| | 25,175,000 | | | CA Statewide Financing Authority Tobacco Settlement | | | 5.211 | 5 | | | 06/01/2046 | | | | 3,189,421 | |
| | |
| | 8,295,000 | | | CA Statewide Financing Authority Tobacco Settlement (TASC)1 | | | 6.000 | | | | 05/01/2037 | | | | 8,402,337 | |
| | |
| | 1,025,000 | | | CA Statewide Financing Authority Tobacco Settlement (TASC)1 | | | 6.000 | | | | 05/01/2037 | | | | 1,037,782 | |
| | |
| | 1,345,000 | | | CA Valley Sanitation District1 | | | 5.200 | | | | 09/02/2030 | | | | 1,361,705 | |
| | |
| | 290,000 | | | CA Water (Center Valley)3 | | | 5.250 | | | | 12/01/2035 | | | | 356,097 | |
| | |
| | 9,710,000 | | | CA Water (Center Valley)3 | | | 5.250 | | | | 12/01/2035 | | | | 11,513,803 | |
| | |
| | 2,500,000 | | | Calexico, CA Community Facilities District No. 2005-1 Special Tax (Hearthstone) | | | 5.500 | | | | 09/01/2036 | | | | 1,284,100 | |
| | |
| | 2,325,000 | | | Calexico, CA Community Facilities District No. 2005-1 Special Tax (Hearthstone) | | | 5.550 | | | | 09/01/2036 | | | | 1,193,934 | |
| | |
| | 35,000 | | | Calexico, CA Community Redevel. Agency Tax Allocation (Central Business District & Residential Redevel.)1 | | | 7.250 | | | | 08/01/2033 | | | | 43,914 | |
| | |
| | 2,910,000 | | | Camarillo, CA Community Devel. Commission (Camarillo Corridor)1 | | | 5.000 | | | | 09/01/2032 | | | | 3,532,333 | |
| | |
| | 25,000 | | | Carlsbad, CA Improvement Bond Act 19151 | | | 5.500 | | | | 09/02/2028 | | | | 25,078 | |
| | |
| | 100,000 | | | Carson, CA Public Financing Authority (Remediation)1 | | | 6.500 | | | | 10/01/2036 | | | | 117,172 | |
| | |
| | 2,500,000 | | | Carson, CA Redevel. Agency Tax Allocation1 | | | 7.000 | | | | 10/01/2036 | | | | 2,958,750 | |
| | |
| | 3,260,000 | | | Castaic, CA Union School District Community Facilities District No. 92-11 | | | 9.000 | | | | 10/01/2019 | | | | 3,297,523 | |
| | |
| | 2,000,000 | | | Centinela Valley, CA Union High School District1 | | | 6.000 | | | | 08/01/2036 | | | | 2,584,840 | |
| | |
| | 1,100,000 | | | Chino, CA Public Financing Authority1 | | | 5.000 | | | | 09/01/2034 | | | | 1,301,707 | |
| | |
| | 865,000 | | | Chino, CA Public Financing Authority1 | | | 5.000 | | | | 09/01/2035 | | | | 1,018,269 | |
| | |
| | 20,000 | | | Chowchilla, CA Redevel. Agency1 | | | 5.000 | | | | 08/01/2037 | | | | 20,032 | |
| | |
| | 2,000,000 | | | Chula Vista, CA Industrial Devel. (San Diego Gas & Electric Company)1 | | | 5.875 | | | | 01/01/2034 | | | | 2,268,740 | |
| | |
| | 500,000 | | | Clovis, CA Wastewater1 | | | 5.250 | | | | 08/01/2031 | | | | 628,620 | |
32 OPPENHEIMER ROCHESTER CALIFORNIA MUNICIPAL FUND
| | | | | | | | | | | | | | | | |
| Principal Amount | | | | | Coupon | | | Maturity | | | Value | |
| | |
| | California (Continued) | | | | | | | | | | | | |
| | |
| | $1,060,000 | | | Clovis, CA Wastewater1 | | | 5.250 | % | | | 08/01/2030 | | | $ | 1,335,642 | |
| | |
| | 870,000 | | | Colton, CA Community Facilities District Special Tax1,2 | | | 7.500 | | | | 09/01/2020 | | | | 873,724 | |
| | |
| | 3,715,000 | | | Compton, CA Community College District1 | | | 6.750 | | | | 08/01/2034 | | | | 4,396,554 | |
| | |
| | 4,000,000 | | | Compton, CA Public Finance Authority1 | | | 5.250 | | | | 09/01/2027 | | | | 4,324,160 | |
| | |
| | 5,000 | | | Contra Costa County, CA Public Financing Authority Tax Allocation1 | | | 5.850 | | | | 08/01/2033 | | | | 5,010 | |
| | |
| | 4,870,000 | | | Corcoran, CA Hospital District1 | | | 8.000 | | | | 08/01/2034 | | | | 5,492,289 | |
| | |
| | 955,000 | | | Corona, CA Community Facilities District (Buchanan Street)1 | | | 5.150 | | | | 09/01/2036 | | | | 956,767 | |
| | |
| | 110,000 | | | Corona, CA Community Facilities District (Eagle Glen II)1 | | | 6.000 | | | | 09/01/2031 | | | | 110,208 | |
| | |
| | 250,000 | | | Corona-Norco, CA Unified School District1 | | | 6.000 | | | | 09/01/2037 | | | | 253,142 | |
| | |
| | 1,000,000 | | | Corona-Norco, CA Unified School District Community Facilities District No. 05-11 | | | 5.000 | | | | 09/01/2036 | | | | 1,183,160 | |
| | |
| | 50,000 | | | Daly City, CA Hsg. Devel. Finance Agency (Franciscan Mobile Home Park)1 | | | 5.000 | | | | 12/15/2037 | | | | 51,791 | |
| | |
| | 945,000 | | | Daly City, CA Hsg. Devel. Finance Agency (Third Tier Franciscan)1 | | | 6.500 | | | | 12/15/2047 | | | | 974,267 | |
| | |
| | 1,220,000 | | | Dehesa, CA School District1 | | | 5.500 | | | | 06/01/2044 | | | | 1,453,874 | |
| | |
| | 1,855,000 | | | Desert Hot Springs, CA Community Facilities District Special Tax1 | | | 6.375 | | | | 09/01/2038 | | | | 2,029,073 | |
| | |
| | 3,725,000 | | | Desert Hot Springs, CA Redevel. Agency Tax Allocation1 | | | 7.375 | | | | 09/01/2039 | | | | 4,345,250 | |
| | |
| | 6,035,000 | | | Desert, CA Community College District Floaters1 | | | 0.580 | 4 | | | 08/01/2032 | | | | 6,035,000 | |
| | |
| | 15,000,000 | | | East Bay, CA Municipal Utility District (Water System)3 | | | 5.000 | | | | 06/01/2036 | | | | 17,281,050 | |
| | |
| | 10,000,000 | | | Eastern CA Municipal Water District1 | | | 0.430 | 4 | | | 07/01/2046 | | | | 10,000,000 | |
| | |
| | 25,000 | | | Elsinore Valley, CA Municipal Water District Community Facilities District No. 2004-11 | | | 6.500 | | | | 09/01/2032 | | | | 25,884 | |
| | |
| | 10,075,000 | | | Etiwanda, CA School District Special Tax Community Facilities District No. 2004-21 | | | 6.000 | | | | 09/01/2037 | | | | 10,628,117 | |
| | |
| | 865,000 | | | Fairfield, CA Community Facilities District Special Tax (Fairfield Commons)1 | | | 6.875 | | | | 09/01/2038 | | | | 929,252 | |
| | |
| | 2,500,000 | | | Fontana, CA Public Financing Authority (North Fontana Redevel.)1 | | | 5.500 | | | | 09/01/2032 | | | | 2,526,975 | |
| | |
| | 10,000 | | | Fontana, CA Redevel. Agency (Jurupa Hills)1 | | | 5.500 | | | | 10/01/2027 | | | | 10,083 | |
| | |
| | 10,000 | | | Fontana, CA Redevel. Agency (Sierra Corridor Commercial Redevel.) | | | 5.500 | | | | 09/01/2034 | | | | 10,036 | |
| | |
| | 10,000 | | | Garden Grove, CA Sanitation District | | | 5.000 | | | | 06/15/2036 | | | | 10,037 | |
| | |
| | 1,010,000 | | | Greenfield, CA Union School District1 | | | 7.000 | | | | 09/01/2040 | | | | 1,043,481 | |
| | |
| | 5,145,000 | | | Grossmont, CA Union High School District3 | | | 5.500 | | | | 08/01/2030 | | | | 5,895,909 | |
| | |
| | 4,895,000 | | | Grossmont, CA Union High School District3 | | | 5.500 | | | | 08/01/2031 | | | | 5,609,420 | |
| | |
| | 120,000 | | | Guadalupe, CA Redevel. Agency Tax Allocation1 | | | 5.125 | | | | 08/01/2035 | | | | 120,408 | |
| | |
| | 1,065,000 | | | Hesperia, CA Unified School District1 | | | 5.000 | | | | 09/01/2030 | | | | 1,079,953 | |
| | |
| | 500,000 | | | Hollister, CA Redevel. Agency Tax Allocation1 | | | 7.000 | | | | 10/01/2032 | | | | 593,650 | |
| | |
| | 1,600,000 | | | Hollister, CA Redevel. Agency Tax Allocation (Hollister Community Devel.)1 | | | 5.000 | | | | 10/01/2030 | | | | 1,960,192 | |
| | |
| | 1,305,000 | | | Hollister, CA Redevel. Agency Tax Allocation (Hollister Community Devel.)1 | | | 5.000 | | | | 10/01/2032 | | | | 1,586,710 | |
33 OPPENHEIMER ROCHESTER CALIFORNIA MUNICIPAL FUND
STATEMENT OF INVESTMENTS Continued
| | | | | | | | | | | | | | | | |
| Principal Amount | | | | | Coupon | | | Maturity | | | Value | |
| | |
| | California (Continued) | | | | | | | | | | | | |
| | |
| | $1,430,000 | | | Imperial County, CA Community Facilities District No. 2004-2 Special Tax1 | | | 5.900 | % | | | 09/01/2037 | | | $ | 1,431,401 | |
| | |
| | 2,030,000 | | | Imperial County, CA Special Tax (Victoria Ranch)1 | | | 5.000 | | | | 09/01/2036 | | | | 2,334,561 | |
| | |
| | 7,000,000 | | | Imperial, CA Irrigation District1 | | | 6.250 | | | | 11/01/2031 | | | | 8,614,270 | |
| | |
| | 309,105,000 | | | Inland, CA Empire Tobacco Securitization Authority (TASC) | | | 7.985 | 5 | | | 06/01/2057 | | | | 3,050,866 | |
| | |
| | 2,955,000 | | | Ione, CA Special Tax Community Facilities District 2005-2-A1,2 | | | 6.000 | | | | 09/01/2036 | | | | 3,021,340 | |
| | |
| | 5,000 | | | La Mesa, CA Fire, Police & Emergency Services | | | 5.250 | | | | 08/01/2034 | | | | 5,020 | |
| | |
| | 65,000 | | | Lake Berryessa, CA Resort Improvement District2 | | | 5.250 | | | | 09/02/2017 | | | | 65,740 | |
| | |
| | 2,000,000 | | | Lake Elsinore, CA Public Financing Authority1 | | | 5.000 | | | | 09/01/2035 | | | | 2,322,420 | |
| | |
| | 335,000 | | | Lake Elsinore, CA Public Financing Authority (Canyon Hills)1 | | | 5.000 | | | | 09/01/2037 | | | | 375,190 | |
| | |
| | 630,000 | | | Lake Elsinore, CA Public Financing Authority (Canyon Hills)1 | | | 5.000 | | | | 09/01/2032 | | | | 714,237 | |
| | |
| | 1,000,000 | | | Lake Elsinore, CA Public Financing Authority (Canyon Hills)1 | | | 5.000 | | | | 09/01/2040 | | | | 1,124,580 | |
| | |
| | 1,175,000 | | | Lake Elsinore, CA Public Financing Authority (Villages Wasson Canyon)1 | | | 5.250 | | | | 09/01/2038 | | | | 1,294,744 | |
| | |
| | 1,275,000 | | | Lake Elsinore, CA Unified School District Community Facilities District Special Tax No. 2005-71 | | | 6.250 | | | | 09/01/2040 | | | | 1,316,922 | |
| | |
| | 1,100,000 | | | Lake Elsinore, CA Unified School District Community Facilities District Special Tax No. 2006-61 | | | 5.900 | | | | 09/01/2037 | | | | 1,113,442 | |
| | |
| | 500,000 | | | Lammersville, CA School District Community Facilities District (Mountain House)1 | | | 5.250 | 6 | | | 09/01/2029 | | | | 550,465 | |
| | |
| | 1,000,000 | | | Lammersville, CA School District Community Facilities District (Mountain House)1 | | | 5.200 | 6 | | | 09/01/2028 | | | | 1,104,390 | |
| | |
| | 1,000,000 | | | Lammersville, CA School District Community Facilities District (Mountain House)1 | | | 5.375 | 6 | | | 09/01/2032 | | | | 1,095,080 | |
| | |
| | 500,000 | | | Lammersville, CA School District Community Facilities District (Mountain House)1 | | | 5.300 | 6 | | | 09/01/2030 | | | | 549,520 | |
| | |
| | 420,000 | | | Lammersville, CA School District Community Facilities District (Mountain House)1 | | | 5.000 | 6 | | | 09/01/2025 | | | | 467,897 | |
| | |
| | 375,000 | | | Lammersville, CA School District Community Facilities District (Mountain House)1 | | | 5.100 | 6 | | | 09/01/2026 | | | | 416,617 | |
| | |
| | 885,000 | | | Lammersville, CA School District Community Facilities District (Mountain House)1 | | | 5.150 | 6 | | | 09/01/2027 | | | | 980,270 | |
| | |
| | 580,000 | | | Lancaster, CA Redevel. Agency Tax Allocation (Comb Redevel.)1 | | | 6.875 | | | | 08/01/2039 | | | | 688,182 | |
| | |
| | 1,670,000 | | | Lancaster, CA Redevel. Agency Tax Allocation (Comb Redevel.)1 | | | 6.875 | | | | 08/01/2034 | | | | 1,932,173 | |
| | |
| | 430,000 | | | Lancaster, CA Redevel. Agency Tax Allocation (Comb Redevel.)1 | | | 6.875 | | | | 08/01/2039 | | | | 497,506 | |
| | |
| | 5,000 | | | Lathrop, CA Financing Authority (Water Supply)1 | | | 5.700 | | | | 06/01/2019 | | | | 5,092 | |
| | |
| | 10,000 | | | Lathrop, CA Financing Authority (Water Supply)1 | | | 5.600 | | | | 06/01/2018 | | | | 10,182 | |
| | |
| | 4,000,000 | | | Lathrop, CA Special Tax Community Facilities District No. 03-21,2 | | | 7.000 | | | | 09/01/2033 | | | | 4,010,080 | |
| | |
| | 4,000,000 | | | LeMoore, CA Redevel. Agency Tax Allocation1 | | | 7.375 | | | | 08/01/2040 | | | | 4,022,400 | |
| | |
| | 1,000,000 | | | Lennox, CA School District COP1 | | | 5.000 | | | | 10/01/2034 | | | | 1,166,400 | |
| | |
| | 100,000 | | | Lincoln, CA Public Financing Authority1 | | | 5.000 | | | | 09/01/2034 | | | | 101,194 | |
34 OPPENHEIMER ROCHESTER CALIFORNIA MUNICIPAL FUND
| | | | | | | | | | | | | | | | |
| Principal Amount | | | | | Coupon | | | Maturity | | | Value | |
| | |
| | California (Continued) | | | | | | | | | | | | |
| | |
| | $635,000 | | | Lincoln, CA Special Tax1 | | | 5.000 | % | | | 09/01/2026 | | | $ | 636,397 | |
| | |
| | 240,000 | | | Livermore, CA Redevel. Agency Tax Allocation1 | | | 5.000 | | | | 08/01/2032 | | | | 241,018 | |
| | |
| | 2,625,000 | | | Livermore, CA Redevel. Agency Tax Allocation1 | | | 5.000 | | | | 08/01/2026 | | | | 2,638,886 | |
| | |
| | 1,000,000 | | | Long Beach, CA Bond Finance Authority Natural Gas1 | | | 5.500 | | | | 11/15/2037 | | | | 1,372,020 | |
| | |
| | 50,000 | | | Long Beach, CA Bond Finance Authority Natural Gas1 | | | 5.500 | | | | 11/15/2028 | | | | 65,853 | |
| | |
| | 1,200,000 | | | Los Alamitos, CA Unified School District COP1 | | | 0.000 | 6 | | | 08/01/2034 | | | | 1,107,996 | |
| | |
| | 10,000,000 | | | Los Angeles, CA Community College District1 | | | 5.000 | | | | 08/01/2031 | | | | 12,468,700 | |
| | |
| | 2,075,000 | | | Los Angeles, CA Community Devel. Agency (Adelante Eastside Redevel.)1 | | | 6.500 | | | | 09/01/2039 | | | | 2,415,030 | |
| | |
| | 1,575,000 | | | Los Angeles, CA Community Redevel. Agency (Grand Central Square)1 | | | 5.000 | | | | 12/01/2026 | | | | 1,643,276 | |
| | |
| | 4,365,000 | | | Los Angeles, CA Dept. of Airports1 | | | 5.000 | | | | 05/15/2033 | | | | 5,267,507 | |
| | |
| | 1,500,000 | | | Los Angeles, CA Dept. of Airports1 | | | 5.000 | | | | 05/15/2042 | | | | 1,812,345 | |
| | |
| | 5,795,000 | | | Los Angeles, CA Dept. of Airports1 | | | 5.000 | | | | 05/15/2034 | | | | 6,977,875 | |
| | |
| | 11,000,000 | | | Los Angeles, CA Dept. of Airports (Los Angeles International Airport)3 | | | 5.375 | | | | 05/15/2027 | | | | 11,873,919 | |
| | |
| | 10,000,000 | | | Los Angeles, CA Dept. of Airports (Los Angeles International Airport)3 | | | 5.375 | | | | 05/15/2026 | | | | 10,801,867 | |
| | |
| | 10,215,000 | | | Los Angeles, CA Dept. of Airports (Los Angeles International Airport)3 | | | 5.375 | | | | 05/15/2025 | | | | 11,034,992 | |
| | |
| | 14,210,000 | | | Los Angeles, CA Dept. of Airports (Los Angeles International Airport)3 | | | 5.250 | | | | 05/15/2024 | | | | 15,347,205 | |
| | |
| | 10,095,000 | | | Los Angeles, CA Dept. of Airports (Los Angeles International Airport)3 | | | 5.375 | | | | 05/15/2028 | | | | 10,887,558 | |
| | |
| | 2,000,000 | | | Los Angeles, CA Dept. of Water & Power1 | | | 5.000 | | | | 07/01/2040 | | | | 2,479,940 | |
| | |
| | 3,000,000 | | | Los Angeles, CA Dept. of Water & Power3 | | | 5.375 | | | | 07/01/2034 | | | | 3,330,120 | |
| | |
| | 12,000,000 | | | Los Angeles, CA Dept. of Water & Power3 | | | 5.375 | | | | 07/01/2038 | | | | 13,326,600 | |
| | |
| | 16,300,000 | | | Los Angeles, CA Harbor Dept.3 | | | 5.250 | | | | 08/01/2034 | | | | 18,443,287 | |
| | |
| | 500,000 | | | Los Angeles, CA Hsg. Auth. (Property Acquisition)1 | | | 6.375 | | | | 06/01/2039 | | | | 552,615 | |
| | |
| | 2,000,000 | | | Los Angeles, CA Hsg. Auth. (Property Acquisition)1 | | | 6.250 | | | | 06/01/2034 | | | | 2,204,220 | |
| | |
| | 2,000,000 | | | Los Angeles, CA Hsg. Auth. (Property Acquisition)1 | | | 6.000 | | | | 06/01/2029 | | | | 2,191,760 | |
| | |
| | 1,500,000 | | | Los Angeles, CA IDA (Santee Court Parking Facility) | | | 5.000 | | | | 12/01/2020 | | | | 1,367,940 | |
| | |
| | 1,100,000 | | | Los Angeles, CA IDA (Santee Court Parking Facility) | | | 5.000 | | | | 12/01/2027 | | | | 922,570 | |
| | |
| | 4,000,000 | | | Los Angeles, CA Municipal Improvement Corp. (Real Property)1 | | | 6.000 | | | | 09/01/2039 | | | | 4,661,120 | |
| | |
| | 7,000,000 | | | Los Angeles, CA Unified School District1 | | | 5.000 | | | | 07/01/2040 | | | | 8,579,830 | |
| | |
| | 85,000 | | | Madera County, CA COP (Valley Children’s Hospital)1 | | | 5.750 | | | | 03/15/2028 | | | | 85,339 | |
| | |
| | 950,000 | | | Martinez, CA Unified School District1 | | | 6.125 | 6 | | | 08/01/2035 | | | | 1,276,030 | |
| | |
| | 4,530,000 | | | Mayers, CA Memorial Hospital District1 | | | 7.875 | | | | 06/01/2041 | | | | 4,545,674 | |
| | |
| | 1,750,000 | | | McFarland, CA Unified School District1 | | | 5.500 | | | | 11/01/2038 | | | | 2,194,237 | |
| | |
| | 1,375,000 | | | Mendota, CA Joint Powers Financing Authority Wastewater1 | | | 5.150 | | | | 07/01/2035 | | | | 1,376,182 | |
| | |
| | 5,000,000 | | | Metropolitan Water District of Southern California1 | | | 5.000 | | | | 07/01/2028 | | | | 6,466,200 | |
| | |
| | 7,800,000 | | | Metropolitan Water District of Southern California1 | | | 5.000 | | | | 07/01/2031 | | | | 9,946,404 | |
| | |
| | 3,460,000 | | | Metropolitan Water District of Southern California1 | | | 5.000 | | | | 07/01/2029 | | | | 4,450,217 | |
| | |
| | 3,000,000 | | | Montebello, CA Community Redevel. Agency (Montebello Hills Redevel.)1 | | | 8.100 | | | | 03/01/2027 | | | | 3,356,880 | |
35 OPPENHEIMER ROCHESTER CALIFORNIA MUNICIPAL FUND
STATEMENT OF INVESTMENTS Continued
| | | | | | | | | | | | | | | | |
| Principal Amount | | | | | Coupon | | | Maturity | | | Value | |
| | |
| | California (Continued) | | | | | | | | | | | | |
| | |
| | $1,500,000 | | | Montebello, CA Public Financing Authority (Montebello Hotel)1 | | | 5.000 | % | | | 12/01/2033 | | | $ | 1,586,640 | |
| | |
| | 2,050,000 | | | Moreno Valley, CA Unified School District Community Facilities District No. 2004-41 | | | 5.000 | | | | 09/01/2045 | | | | 2,316,520 | |
| | |
| | 230,000 | | | Murrieta, CA Community Facilities District Special Tax (Meadowlane/Amberwalk)1 | | | 5.125 | | | | 09/01/2035 | | | | 230,954 | |
| | |
| | 1,500,000 | | | Norco, CA Community Redevel. Agency1 | | | 5.000 | | | | 03/01/2030 | | | | 1,815,360 | |
| | |
| | 2,000,000 | | | Norco, CA Community Redevel. Agency1 | | | 5.000 | | | | 03/01/2032 | | | | 2,403,320 | |
| | |
| | 2,000,000 | | | Norco, CA Redevel. Agency Tax Allocation1 | | | 6.000 | | | | 03/01/2036 | | | | 2,337,900 | |
| | |
| | 157,335,000 | | | Northern CA Tobacco Securitization Authority (TASC) | | | 5.396 | 5 | | | 06/01/2045 | | | | 3,642,305 | |
| | |
| | 1,250,000 | | | Northern Humboldt, CA Union High School District1 | | | 6.500 | | | | 08/01/2034 | | | | 1,561,263 | |
| | |
| | 4,115,000 | | | Northern Humboldt, CA Union High School District1 | | | 5.000 | | | | 08/01/2043 | | | | 4,951,003 | |
| | |
| | 2,000,000 | | | Northern, CA Inyo County Local Hospital District1 | | | 6.375 | | | | 12/01/2025 | | | | 2,244,900 | |
| | |
| | 1,000,000 | | | Oak Valley, CA Hospital District1 | | | 7.000 | | | | 11/01/2035 | | | | 1,082,590 | |
| | |
| | 10,000 | | | Oakdale, CA Public Financing Authority Tax Allocation (Central City Redevel.)1 | | | 6.100 | | | | 06/01/2027 | | | | 10,089 | |
| | |
| | 250,000 | | | Oakland, CA GO1 | | | 6.250 | | | | 01/15/2039 | | | | 284,683 | |
| | |
| | 1,000,000 | | | Oakland, CA GO1 | | | 6.000 | | | | 01/15/2034 | | | | 1,132,630 | |
| | |
| | 4,595,000 | | | Oakland, CA Unified School District1 | | | 6.125 | | | | 08/01/2029 | | | | 5,230,489 | |
| | |
| | 250,000 | | | Oakland, CA Unified School District1 | | | 6.500 | | | | 08/01/2022 | | | | 287,313 | |
| | |
| | 250,000 | | | Oakland, CA Unified School District1 | | | 6.500 | | | | 08/01/2023 | | | | 286,515 | |
| | |
| | 250,000 | | | Oakland, CA Unified School District1 | | | 6.500 | | | | 08/01/2024 | | | | 286,515 | |
| | |
| | 3,145,000 | | | Olivehurst, CA Public Utilities District (Plumas Lake Community Facilities District)1 | | | 7.625 | | | | 09/01/2038 | | | | 3,210,510 | |
| | |
| | 2,540,000 | | | Ontario, CA Improvement Bond Act 1915 Assessment District No. 1081 | | | 7.500 | | | | 09/02/2020 | | | | 2,555,570 | |
| | |
| | 2,100,000 | | | Orange County, CA Airport1 | | | 5.750 | | | | 07/01/2034 | | | | 2,201,598 | |
| | |
| | 1,250,000 | | | Oxnard, CA Financing Authority Wastewater1 | | | 5.000 | | | | 06/01/2032 | | | | 1,509,713 | |
| | |
| | 1,500,000 | | | Oxnard, CA Financing Authority Wastewater1 | | | 5.000 | | | | 06/01/2033 | | | | 1,806,840 | |
| | |
| | 850,000 | | | Oxnard, CA Financing Authority Wastewater1 | | | 5.000 | | | | 06/01/2034 | | | | 1,020,485 | |
| | |
| | 150,000 | | | Palm Desert, CA Financing Authority1 | | | 5.000 | | | | 04/01/2030 | | | | 151,019 | |
| | |
| | 390,000 | | | Palm Desert, CA Financing Authority | | | 1.549 | 5 | | | 08/01/2016 | | | | 389,910 | |
| | |
| | 1,605,000 | | | Palm Desert, CA Financing Authority | | | 3.357 | 5 | | | 08/01/2022 | | | | 1,130,530 | |
| | |
| | 25,000 | | | Palm Desert, CA Financing Authority1 | | | 5.000 | | | | 08/01/2033 | | | | 25,548 | |
| | |
| | 395,000 | | | Palm Desert, CA Financing Authority | | | 5.983 | 5 | | | 04/01/2023 | | | | 266,404 | |
| | |
| | 380,000 | | | Palm Desert, CA Financing Authority | | | 5.971 | 5 | | | 04/01/2022 | | | | 272,171 | |
| | |
| | 500,000 | | | Palm Desert, CA Financing Authority1 | | | 5.200 | | | | 10/01/2028 | | | | 503,860 | |
| | |
| | 1,755,000 | | | Palm Desert, CA Financing Authority | | | 3.517 | 5 | | | 08/01/2023 | | | | 1,163,425 | |
| | |
| | 230,000 | | | Palm Desert, CA Financing Authority | | | 5.614 | 5 | | | 04/01/2018 | | | | 209,891 | |
| | |
| | 1,430,000 | | | Palm Desert, CA Financing Authority | | | 4.287 | 5 | | | 08/01/2030 | | | | 619,462 | |
| | |
| | 265,000 | | | Palm Desert, CA Financing Authority | | | 5.716 | 5 | | | 04/01/2019 | | | | 228,128 | |
| | |
| | 340,000 | | | Palm Desert, CA Financing Authority | | | 5.919 | 5 | | | 04/01/2021 | | | | 258,992 | |
| | |
| | 305,000 | | | Palm Desert, CA Financing Authority | | | 5.818 | 5 | | | 04/01/2020 | | | | 247,230 | |
| | |
| | 1,370,000 | | | Palm Desert, CA Financing Authority | | | 4.203 | 5 | | | 08/01/2029 | | | | 631,063 | |
| | |
| | 2,070,000 | | | Palm Desert, CA Financing Authority | | | 3.789 | 5 | | | 08/01/2025 | | | | 1,216,436 | |
| | |
| | 1,910,000 | | | Palm Desert, CA Financing Authority | | | 3.660 | 5 | | | 08/01/2024 | | | | 1,192,279 | |
| | |
| | 2,235,000 | | | Palm Desert, CA Financing Authority | | | 3.906 | 5 | | | 08/01/2026 | | | | 1,236,246 | |
| | |
| | 1,415,000 | | | Palm Desert, CA Financing Authority | | | 4.112 | 5 | | | 08/01/2028 | | | | 692,940 | |
36 OPPENHEIMER ROCHESTER CALIFORNIA MUNICIPAL FUND
| | | | | | | | | | | | | | | | |
| Principal Amount | | | | | Coupon | | | Maturity | | | Value | |
| | |
| | California (Continued) | | | | | | | | | | | | |
| | |
| | $1,400,000 | | | Palm Desert, CA Financing Authority | | | 4.014 | %5 | | | 08/01/2027 | | | $ | 728,672 | |
| | |
| | 520,000 | | | Palm Desert, CA Financing Authority | | | 6.061 | 5 | | | 04/01/2030 | | | | 229,445 | |
| | |
| | 500,000 | | | Palm Desert, CA Financing Authority | | | 6.050 | 5 | | | 04/01/2029 | | | | 234,535 | |
| | |
| | 480,000 | | | Palm Desert, CA Financing Authority | | | 6.039 | 5 | | | 04/01/2028 | | | | 239,328 | |
| | |
| | 590,000 | | | Palm Desert, CA Financing Authority | | | 6.083 | 5 | | | 04/01/2034 | | | | 204,134 | |
| | |
| | 580,000 | | | Palm Desert, CA Financing Authority | | | 6.083 | 5 | | | 04/01/2033 | | | | 213,104 | |
| | |
| | 540,000 | | | Palm Desert, CA Financing Authority | | | 6.071 | 5 | | | 04/01/2031 | | | | 224,073 | |
| | |
| | 465,000 | | | Palm Desert, CA Financing Authority | | | 6.028 | 5 | | | 04/01/2027 | | | | 246,380 | |
| | |
| | 410,000 | | | Palm Desert, CA Financing Authority | | | 5.994 | 5 | | | 04/01/2024 | | | | 260,407 | |
| | |
| | 560,000 | | | Palm Desert, CA Financing Authority | | | 6.082 | 5 | | | 04/01/2032 | | | | 218,506 | |
| | |
| | 445,000 | | | Palm Desert, CA Financing Authority | | | 6.017 | 5 | | | 04/01/2026 | | | | 250,522 | |
| | |
| | 430,000 | | | Palm Desert, CA Financing Authority | | | 6.006 | 5 | | | 04/01/2025 | | | | 257,149 | |
| | |
| | 250,000 | | | Palm Springs, CA Airport Passenger Facilities (Palm Springs International Airport)1 | | | 6.400 | | | | 07/01/2023 | | | | 250,520 | |
| | |
| | 120,000 | | | Palm Springs, CA Airport Passenger Facilities (Palm Springs International Airport)1 | | | 5.450 | | | | 07/01/2020 | | | | 120,158 | |
| | |
| | 400,000 | | | Palm Springs, CA Airport Passenger Facilities (Palm Springs International Airport)1 | | | 5.550 | | | | 07/01/2028 | | | | 400,552 | |
| | |
| | 350,000 | | | Palm Springs, CA Airport Passenger Facilities (Palm Springs International Airport)1 | | | 6.500 | | | | 07/01/2027 | | | | 350,756 | |
| | |
| | 85,000 | | | Palm Springs, CA Airport Passenger Facilities (Palm Springs Regional Airport) | | | 5.250 | | | | 01/01/2022 | | | | 85,339 | |
| | |
| | 445,000 | | | Palm Springs, CA Community Redevel. Agency Tax Allocation1 | | | 5.000 | | | | 09/01/2032 | | | | 539,429 | |
| | |
| | 4,895,000 | | | Palmdale, CA Community Facilities District Special Tax1 | | | 6.250 | | | | 09/01/2035 | | | | 4,993,830 | |
| | |
| | 5,900,000 | | | Palmdale, CA Community Facilities District Special Tax1 | | | 6.125 | | | | 09/01/2037 | | | | 6,004,430 | |
| | |
| | 1,355,000 | | | Palmdale, CA Community Facilities District Special Tax1 | | | 5.400 | | | | 09/01/2035 | | | | 1,357,954 | |
| | |
| | 170,000 | | | Palmdale, CA Elementary School District Special Tax Community Facilities District No. 90-11,2 | | | 5.700 | | | | 08/01/2018 | | | | 170,707 | |
| | |
| | 1,610,000 | | | Palomar Pomerado, CA Health System | | | 5.000 | | | | 08/01/2034 | | | | 1,615,603 | |
| | |
| | 540,000 | | | Palomar Pomerado, CA Health System1 | | | 5.125 | | | | 08/01/2037 | | | | 561,200 | |
| | |
| | 120,000 | | | Perris, CA Community Facilities District Special Tax (May Farms)1 | | | 5.150 | | | | 09/01/2035 | | | | 122,594 | |
| | |
| | 10,000 | | | Perris, CA Community Facilities District Special Tax (May Farms)1 | | | 5.100 | | | | 09/01/2030 | | | | 10,218 | |
| | |
| | 1,145,000 | | | Perris, CA Community Facilities District Special Tax, Series A1 | | | 5.750 | | | | 09/01/2035 | | | | 1,147,588 | |
| | |
| | 290,000 | | | Perris, CA Elementary School District1 | | | 6.000 | | | | 08/01/2030 | | | | 378,166 | |
| | |
| | 235,000 | | | Perris, CA Elementary School District1 | | | 6.000 | | | | 08/01/2029 | | | | 306,581 | |
| | |
| | 1,000,000 | | | Pixley, CA Union School District (Pixley Union Elementary School District)1 | | | 5.250 | | | | 08/01/2044 | | | | 1,207,260 | |
| | |
| | 55,000 | | | Pomona, CA Public Financing Authority | | | 5.000 | | | | 02/01/2030 | | | | 55,184 | |
| | |
| | 5,000 | | | Pomona, CA Public Financing Authority | | | 5.000 | | | | 10/01/2035 | | | | 5,016 | |
| | |
| | 1,305,000 | | | Pomona, CA Public Financing Authority (Merfed Redevel.) | | | 5.250 | | | | 02/01/2020 | | | | 1,310,142 | |
| | |
| | 50,000 | | | Pomona, CA Unified School District1 | | | 6.150 | | | | 08/01/2030 | | | | 62,444 | |
37 OPPENHEIMER ROCHESTER CALIFORNIA MUNICIPAL FUND
STATEMENT OF INVESTMENTS Continued
| | | | | | | | | | | | | | | | |
| Principal Amount | | | | | Coupon | | | Maturity | | | Value | |
| | |
| | California (Continued) | | | | | | | | | | | | |
| | |
| | $1,990,000 | | | Poway, CA Unified School District Public Financing Authority Special Tax1,2 | | | 5.000 | % | | | 09/01/2035 | | | $ | 2,388,617 | |
| | |
| | 500,000 | | | Poway, CA Unified School District Special Tax Community Facilities District No. 14 (Torrey Highland Subarea)1 | | | 6.125 | | | | 09/01/2041 | | | | 516,190 | |
| | |
| | 5,000,000 | | | Rancho, CA Water District Financing Authority1 | | | 5.000 | | | | 08/01/2028 | | | | 5,437,150 | |
| | |
| | 2,595,000 | | | Rialto, CA Redevel. Agency (Merged Project Area)1 | | | 5.875 | | | | 09/01/2033 | | | | 2,850,737 | |
| | |
| | 490,000 | | | Rialto, CA Special Tax Community Facilities District No. 2006-11 | | | 5.250 | | | | 09/01/2026 | | | | 491,166 | |
| | |
| | 5,000 | | | Richgrove, CA School District1 | | | 6.375 | | | | 07/01/2018 | | | | 5,086 | |
| | |
| | 2,000,000 | | | Richmond, CA Joint Powers Financing Authority (Civic Center)1 | | | 5.750 | | | | 08/01/2029 | | | | 2,257,660 | |
| | |
| | 2,500,000 | | | Ridgecrest, CA Redevel. Agency (Ridgecrest Redevel.)1 | | | 6.250 | | | | 06/30/2037 | | | | 2,963,500 | |
| | |
| | 10,530,000 | | | Rio Hondo, CA Community College District1 | | | 0.000 | 6 | | | 08/01/2042 | | | | 11,309,852 | |
| | |
| | 3,000,000 | | | Rio Vista, CA Community Facilities District Special Tax No. 2004-11 | | | 5.850 | | | | 09/01/2035 | | | | 3,005,460 | |
| | |
| | 700,000 | | | Riverbank, CA Redevel. Agency (Riverbank Reinvestment)7 | | | 5.000 | | | | 08/01/2032 | | | | 503,937 | |
| | |
| | 1,000,000 | | | Riverside County, CA Community Facilities District Special Tax No. 07-2 (Clinton Keith)1 | | | 5.000 | | | | 09/01/2040 | | | | 1,105,450 | |
| | |
| | 2,500,000 | | | Riverside County, CA Community Facilities District Special Tax No. 07-2 (Clinton Keith)1 | | | 5.000 | | | | 09/01/2044 | | | | 2,753,450 | |
| | |
| | 1,000,000 | | | Riverside County, CA Redevel. Agency1 | | | 7.125 | | | | 10/01/2042 | | | | 1,276,040 | |
| | |
| | 3,000,000 | | | Riverside County, CA Redevel. Agency (Desert Communities)1 | | | 6.000 | | | | 10/01/2037 | | | | 3,569,040 | |
| | |
| | 1,000,000 | | | Riverside County, CA Redevel. Agency (Jurupa Valley Redevel.)1 | | | 0.000 | 6 | | | 10/01/2027 | | | | 1,075,250 | |
| | |
| | 1,325,000 | | | Riverside County, CA Redevel. Agency (Jurupa Valley Redevel.)1 | | | 6.500 | | | | 10/01/2025 | | | | 1,645,465 | |
| | |
| | 1,200,000 | | | Riverside County, CA Redevel. Agency (Jurupa Valley Redevel.)1 | | | 6.750 | | | | 10/01/2030 | | | | 1,508,964 | |
| | |
| | 1,000,000 | | | Riverside County, CA Redevel. Agency (Jurupa Valley Redevel.)1 | | | 0.000 | 6 | | | 10/01/2031 | | | | 1,083,880 | |
| | |
| | 7,500,000 | | | Riverside County, CA Transportation Commission1 | | | 5.250 | | | | 06/01/2039 | | | | 9,288,450 | |
| | |
| | 1,050,000 | | | Riverside, CA Special Tax Community Facilities District No. 92-1, Series A1 | | | 5.300 | | | | 09/01/2034 | | | | 1,052,058 | |
| | |
| | 1,250,000 | | | Romoland, CA School District Special Tax Community Facilities District No. 2006-11 | | | 6.000 | | | | 09/01/2041 | | | | 1,290,463 | |
| | |
| | 25,000 | | | Romoland, CA School District Special Tax Community Facilities District No. 91-11 | | | 5.500 | | | | 09/01/2034 | | | | 25,056 | |
| | |
| | 2,250,000 | | | Romoland, CA School District Special Tax Community Facilities District No. 91-181 | | | 6.000 | | | | 09/01/2037 | | | | 2,322,833 | |
| | |
| | 1,000,000 | | | Ross Valley, CA School District1 | | | 5.500 | | | | 08/01/2041 | | | | 1,207,040 | |
| | |
| | 40,000 | | | Sacramento County, CA COP (Public Facilities) | | | 5.000 | | | | 06/01/2029 | | | | 40,151 | |
| | |
| | 1,200,000 | | | Sacramento County, CA Hsg. Authority (Vintage Willow Creek Senior Apartments)1 | | | 5.250 | | | | 06/01/2027 | | | | 1,203,600 | |
| | |
| | 1,000,000 | | | Sacramento County, CA Special Tax Community Facilities District No. 2005-21 | | | 5.000 | | | | 09/01/2040 | | | | 1,183,800 | |
38 OPPENHEIMER ROCHESTER CALIFORNIA MUNICIPAL FUND
| | | | | | | | | | | | | | | | |
| Principal Amount | | | | | Coupon | | | Maturity | | | Value | |
| | |
| | California (Continued) | | | | | | | | | | | | |
| | |
| | $2,320,000 | | | Sacramento, CA City Financing Authority (North Natomas CFD No. 2)1 | | | 6.250 | % | | | 09/01/2023 | | | $ | 2,332,296 | |
| | |
| | 2,580,000 | | | Sacramento, CA Municipal Utility District1 | | | 5.000 | | | | 07/01/2028 | | | | 3,290,635 | |
| | |
| | 1,200,000 | | | Sacramento, CA Special Tax (North Natomas Community Facilities District No. 4)1 | | | 5.000 | | | | 09/01/2033 | | | | 1,432,836 | |
| | |
| | 1,290,000 | | | Sacramento, CA Special Tax (North Natomas Community Facilities District No. 4)1 | | | 5.000 | | | | 09/01/2032 | | | | 1,546,078 | |
| | |
| | 1,600,000 | | | San Bernardino County, CA Special Tax (Lytle Creek North)1 | | | 5.000 | | | | 09/01/2045 | | | | 1,808,016 | |
| | |
| | 1,000,000 | | | San Bernardino County, CA Special Tax (Lytle Creek North)1 | | | 5.375 | | | | 09/01/2038 | | | | 1,032,180 | |
| | |
| | 85,000 | | | San Bernardino, CA Joint Powers Financing Authority (California Dept. of Transportation Lease)1 | | | 5.500 | | | | 12/01/2020 | | | | 85,352 | |
| | |
| | 1,375,000 | | | San Bernardino, CA Joint Powers Financing Authority (Central City)1 | | | 5.750 | | | | 07/01/2020 | | | | 1,468,610 | |
| | |
| | 805,000 | | | San Bernardino, CA Joint Powers Financing Authority (Police Station)1 | | | 5.500 | | | | 09/01/2020 | | | | 805,475 | |
| | |
| | 20,000 | | | San Bernardino, CA Joint Powers Financing Authority (Police Station)1 | | | 5.500 | | | | 09/01/2024 | | | | 20,009 | |
| | |
| | 3,235,000 | | | San Bernardino, CA Mountains Community Hospital District COP1 | | | 5.000 | | | | 02/01/2037 | | | | 3,243,476 | |
| | |
| | 1,410,000 | | | San Bernardino, CA Mountains Community Hospital District COP1 | | | 5.000 | | | | 02/01/2027 | | | | 1,416,289 | |
| | |
| | 3,000,000 | | | San Buenaventura, CA Community Memorial Health Systems1 | | | 8.000 | | | | 12/01/2031 | | | | 3,851,760 | |
| | |
| | 875,000 | | | San Diego County, CA COP1 | | | 5.600 | | | | 07/01/2038 | | | | 959,814 | |
| | |
| | 6,645,000 | | | San Diego County, CA Redevel. Agency (Gillespie Field)1 | | | 5.750 | | | | 12/01/2032 | | | | 6,655,300 | |
| | |
| | 3,000,000 | | | San Diego, CA Hsg. Authority (Sorrento Tower Apartments)1 | | | 5.000 | | | | 05/01/2029 | | | | 3,318,150 | |
| | |
| | 5,880,000 | | | San Diego, CA Public Facilities Financing Authority1 | | | 5.250 | | | | 08/01/2027 | | | | 6,933,637 | |
| | |
| | 15,510,000 | | | San Diego, CA Unified School District1 | | | 5.000 | | | | 07/01/2040 | | | | 19,010,452 | |
| | |
| | 1,000,000 | | | San Francisco, CA Bay Area Rapid Transit District1 | | | 5.000 | | | | 07/01/2031 | | | | 1,267,370 | |
| | |
| | 1,725,000 | | | San Francisco, CA Bay Area Rapid Transit District1 | | | 5.000 | | | | 07/01/2033 | | | | 2,168,377 | |
| | |
| | 1,000,000 | | | San Francisco, CA City & County Airports Commission1 | | | 5.000 | | | | 05/01/2031 | | | | 1,162,890 | |
| | |
| | 15,000 | | | San Francisco, CA City & County Airports Commission (SFO Fuel Company) | | | 5.250 | | | | 01/01/2024 | | | | 15,059 | |
| | |
| | 500,000 | | | San Francisco, CA City & County Redevel. Agency (Mission Bay South Public Improvements)1 | | | 5.000 | | | | 08/01/2031 | | | | 571,175 | |
| | |
| | 2,000,000 | | | San Francisco, CA City & County Redevel. Financing Authority (Mission Bay North Redevel.)1 | | | 6.500 | | | | 08/01/2039 | | | | 2,349,420 | |
| | |
| | 500,000 | | | San Francisco, CA City & County Redevel. Financing Authority (Mission Bay North Redevel.)1 | | | 7.000 | | | | 08/01/2033 | | | | 637,290 | |
| | |
| | 400,000 | | | San Francisco, CA City & County Redevel. Financing Authority (Mission Bay North Redevel.)1 | | | 6.750 | | | | 08/01/2033 | | | | 505,416 | |
| | |
| | 1,500,000 | | | San Francisco, CA City & County Redevel. Financing Authority (Mission Bay South Redevel.)1 | | | 6.625 | | | | 08/01/2039 | | | | 1,767,630 | |
| | |
| | 500,000 | | | San Francisco, CA City & County Redevel. Financing Authority (San Francisco Redevel.)1 | | | 6.500 | | | | 08/01/2032 | | | | 581,670 | |
39 OPPENHEIMER ROCHESTER CALIFORNIA MUNICIPAL FUND
STATEMENT OF INVESTMENTS Continued
| | | | | | | | | | | | | | | | |
| Principal Amount | | | | | Coupon | | | Maturity | | | Value | |
| | |
| | California (Continued) | | | | | | | | | | | | |
| | |
| | $545,000 | | | San Francisco, CA City & County Redevel. Financing Authority (San Francisco Redevel.)1 | | | 6.625 | % | | | 08/01/2039 | | | $ | 636,031 | |
| | |
| | 1,000,000 | | | San Gorgonio, CA Memorial Health Care District1 | | | 5.000 | | | | 08/01/2032 | | | | 1,193,570 | |
| | |
| | 1,350,000 | | | San Jacinta, CA Community Facilities District1 | | | 5.000 | | | | 09/01/2031 | | | | 1,597,698 | |
| | |
| | 1,000,000 | | | San Jacinta, CA Community Facilities District1 | | | 5.000 | | | | 09/01/2033 | | | | 1,171,060 | |
| | |
| | 6,310,000 | | | San Jacinto, CA Financing Authority, Tranche A1 | | | 6.600 | 6 | | | 09/01/2033 | | | | 6,345,021 | |
| | |
| | 6,180,000 | | | San Jacinto, CA Financing Authority, Tranche B1 | | | 6.600 | 6 | | | 09/01/2033 | | | | 6,213,743 | |
| | |
| | 6,345,000 | | | San Jacinto, CA Financing Authority, Tranche C1 | | | 6.600 | 6 | | | 09/01/2033 | | | | 6,380,215 | |
| | |
| | 250,000 | | | San Jacinto, CA Unified School District Special Tax1 | | | 5.750 | | | | 09/01/2040 | | | | 258,030 | |
| | |
| | 500,000 | | | San Jacinto, CA Unified School District Special Tax1 | | | 5.100 | | | | 09/01/2036 | | | | 493,175 | |
| | |
| | 25,000 | | | San Jose, CA (Libraries, Parks & Public Safety) | | | 5.000 | | | | 09/01/2032 | | | | 25,094 | |
| | |
| | 5,050,000 | | | San Jose, CA Airport1 | | | 5.000 | | | | 03/01/2037 | | | | 5,171,857 | |
| | |
| | 1,000,000 | | | San Jose, CA Airport1 | | | 5.000 | | | | 03/01/2025 | | | | 1,143,980 | |
| | |
| | 35,000 | | | San Jose, CA Improvement Bond Act 19151 | | | 5.875 | | | | 09/02/2023 | | | | 36,150 | |
| | |
| | 3,150,000 | | | San Jose, CA Multifamily Hsg. (El Parador Apartments)1 | | | 6.200 | | | | 01/01/2041 | | | | 3,154,347 | |
| | |
| | 4,025,000 | | | San Jose, CA Multifamily Hsg. (Fallen Leaves Apartments)1 | | | 5.100 | | | | 12/01/2032 | | | | 4,029,347 | |
| | |
| | 230,000 | | | San Jose, CA Redevel. Agency | | | 5.000 | | | | 08/01/2027 | | | | 230,858 | |
| | |
| | 185,000 | | | San Jose, CA Redevel. Agency | | | 5.000 | | | | 08/01/2026 | | | | 185,690 | |
| | |
| | 995,000 | | | San Jose, CA Redevel. Agency1 | | | 5.000 | | | | 08/01/2026 | | | | 1,038,452 | |
| | |
| | 55,000 | | | San Jose, CA Redevel. Agency1 | | | 5.000 | | | | 08/01/2028 | | | | 55,202 | |
| | |
| | 305,000 | | | San Jose, CA Redevel. Agency1 | | | 5.000 | | | | 08/01/2018 | | | | 306,144 | |
| | |
| | 2,000,000 | | | San Jose, CA Redevel. Agency | | | 5.850 | | | | 08/01/2027 | | | | 2,008,440 | |
| | |
| | 160,000 | | | San Jose, CA Redevel. Agency | | | 5.000 | | | | 08/01/2025 | | | | 160,597 | |
| | |
| | 125,000 | | | San Jose, CA Redevel. Agency | | | 5.000 | | | | 08/01/2020 | | | | 125,466 | |
| | |
| | 1,235,000 | | | San Jose, CA Redevel. Agency (Merged Area Redevel.)1 | | | 5.000 | | | | 08/01/2021 | | | | 1,286,648 | |
| | |
| | 170,000 | | | San Jose, CA Redevel. Agency (Merged Area Redevel.)1 | | | 5.000 | | | | 08/01/2019 | | | | 177,285 | |
| | |
| | 535,000 | | | San Jose, CA Redevel. Agency (Merged Area Redevel.)1 | | | 5.000 | | | | 08/01/2016 | | | | 535,123 | |
| | |
| | 220,000 | | | San Jose, CA Redevel. Agency (Merged Area Redevel.)1 | | | 5.000 | | | | 08/01/2024 | | | | 229,722 | |
| | |
| | 2,415,000 | | | San Jose, CA Redevel. Agency (Merged Area Redevel.)1 | | | 5.000 | | | | 08/01/2025 | | | | 2,521,212 | |
| | |
| | 200,000 | | | San Jose, CA Redevel. Agency (Merged Area Redevel.)1 | | | 5.000 | | | | 08/01/2032 | | | | 207,152 | |
| | |
| | 550,000 | | | San Jose, CA Redevel. Agency (Merged Area Redevel.)1 | | | 5.000 | | | | 08/01/2027 | | | | 558,085 | |
| | |
| | 795,000 | | | San Jose, CA Redevel. Agency (Merged Area Redevel.)1 | | | 5.000 | | | | 08/01/2022 | | | | 827,834 | |
| | |
| | 100,000 | | | San Jose, CA Redevel. Agency (Merged Area Redevel.)1 | | | 5.000 | | | | 08/01/2023 | | | | 104,079 | |
| | |
| | 25,000 | | | San Jose, CA Special Tax Community Facilities District No. 9 (Bailey Highway 101)1 | | | 6.600 | | | | 09/01/2027 | | | | 25,070 | |
| | |
| | 10,000,000 | | | San Marcos, CA Unified School District3 | | | 5.250 | | | | 08/01/2031 | | | | 11,938,600 | |
| | |
| | 1,000,000 | | | Santa Clara County, CA Hsg. Authority (Rivertown Apartments)1 | | | 5.850 | | | | 08/01/2031 | | | | 1,001,460 | |
40 OPPENHEIMER ROCHESTER CALIFORNIA MUNICIPAL FUND
| | | | | | | | | | | | | | | | |
| Principal Amount | | | | | Coupon | | | Maturity | | | Value | |
| | |
| | California (Continued) | | | | | | | | | | | | |
| | |
| | $2,070,000 | | | Santa Clara County, CA Hsg. Authority (Rivertown Apartments)1 | | | 6.000 | % | | | 08/01/2041 | | | $ | 2,072,588 | |
| | |
| | 3,000,000 | | | Santa Clara, CA Redevel. Agency Tax Allocation (Bayshore North)1 | | | 5.750 | | | | 06/01/2026 | | | | 3,556,920 | |
| | |
| | 8,395,000 | | | Santa Cruz County, CA Redevel. Agency (Live Oak/Soquel Community)1 | | | 7.000 | | | | 09/01/2036 | | | | 10,027,660 | |
| | |
| | 1,750,000 | | | Santa Monica, CA Redevel. Agency Tax Allocation (Earthquake Recovery Redevel.)1 | | | 5.875 | | | | 07/01/2036 | | | | 2,108,260 | |
| | |
| | 2,600,000 | | | Santa Monica, CA Redevel. Agency Tax Allocation (Earthquake Recovery Redevel.)1 | | | 5.875 | | | | 07/01/2042 | | | | 3,132,272 | |
| | |
| | 10,000 | | | Santa Rita, CA Union School District1 | | | 5.200 | | | | 08/01/2037 | | | | 10,020 | |
| | |
| | 2,935,000 | | | Saugus, CA Union School District Community Facilities District No. 20061,2 | | | 11.625 | | | | 09/01/2038 | | | | 3,894,540 | |
| | |
| | 1,565,000 | | | Saugus, CA Union School District Community Facilities District No. 20061,2 | | | 11.625 | | | | 09/01/2038 | | | | 2,076,645 | |
| | |
| | 1,575,000 | | | Saugus, CA Union School District Community Facilities District No. 2006-21 | | | 5.000 | | | | 09/01/2037 | | | | 1,624,754 | |
| | |
| | 1,250,000 | | | Saugus/Hart, CA School Facilities Financing Authority1 | | | 5.000 | | | | 09/01/2046 | | | | 1,476,175 | |
| | |
| | 1,230,000 | | | Saugus/Hart, CA School Facilities Financing Authority1 | | | 5.000 | | | | 09/01/2041 | | | | 1,456,529 | |
| | |
| | 5,000,000 | | | Sequoia, CA Unified High School District1 | | | 6.000 | | | | 07/01/2043 | | | | 6,063,700 | |
| | |
| | 2,500,000 | | | Sequoia, CA Unified High School District1 | | | 5.875 | | | | 07/01/2036 | | | | 3,040,950 | |
| | |
| | 1,090,000 | | | Shafter, CA Community Devel. Agency Tax Allocation1 | | | 5.400 | | | | 11/01/2026 | | | | 1,096,943 | |
| | |
| | 1,720,000 | | | Signal Hill, CA Redevel. Agency Tax Allocation1 | | | 7.000 | | | | 10/01/2026 | | | | 2,066,374 | |
| | |
| | 520,000 | | | Soledad, CA Redevel. Agency (Soledad Redevel.)1 | | | 5.350 | | | | 12/01/2028 | | | | 521,253 | |
| | |
| | 2,000,000 | | | South Bayside, CA Waste Management Authority (Shoreway Environmental)1 | | | 6.000 | | | | 09/01/2036 | | | | 2,304,060 | |
| | |
| | 4,150,000 | | | South El Monte, CA Improvement District1 | | | 5.000 | | | | 08/01/2035 | | | | 4,926,797 | |
| | |
| | 790,000 | | | Southern CA Mono Health Care District1 | | | 5.000 | | | | 08/01/2021 | | | | 906,509 | |
| | |
| | 50,000 | | | Southern CA Public Power Authority1 | | | 5.250 | | | | 11/01/2023 | | | | 61,606 | |
| | |
| | 470,000 | | | Southern CA Public Power Authority1 | | | 5.250 | | | | 11/01/2022 | | | | 569,226 | |
| | |
| | 250,000 | | | Southern CA Public Power Authority1 | | | 5.250 | | | | 11/01/2026 | | | | 317,550 | |
| | |
| | 13,000,000 | | | Southern CA Public Power Authority1 | | | 5.000 | | | | 07/01/2035 | | | | 15,950,870 | |
| | |
| | 2,085,000 | | | Southern CA Public Power Authority1 | | | 5.000 | | | | 11/01/2033 | | | | 2,702,556 | |
| | |
| | 205,000 | | | Southern CA Public Power Authority Natural Gas1 | | | 5.000 | | | | 11/01/2028 | | | | 259,052 | |
| | |
| | 165,000 | | | Southern CA Public Power Authority Natural Gas1 | | | 5.000 | | | | 11/01/2029 | | | | 208,943 | |
| | |
| | 2,255,000 | | | Southern CA Public Power Authority Natural Gas1 | | | 5.250 | | | | 11/01/2027 | | | | 2,890,662 | |
| | |
| | 97,775,000 | | | Southern CA Tobacco Securitization Authority | | | 7.098 | 5 | | | 06/01/2046 | | | | 2,100,207 | |
| | |
| | 4,000,000 | | | Southern CA Tobacco Securitization Authority (TASC)1 | | | 5.000 | | | | 06/01/2037 | | | | 4,000,320 | |
| | |
| | 2,000,000 | | | Stockton, CA Community Facilities District (Arch Road East No. 99-02)1 | | | 5.875 | | | | 09/01/2037 | | | | 2,063,800 | |
| | |
| | 225,000 | | | Stockton, CA Public Financing Authority (Parking)1 | | | 5.125 | | | | 09/01/2030 | | | | 225,020 | |
| | |
| | 1,000,000 | | | Stockton, CA Public Financing Authority, Series A1 | | | 5.250 | | | | 09/01/2037 | | | | 1,002,030 | |
| | |
| | 3,150,000 | | | Stockton, CA Redevel. Agency (Stockton Events Center Arena)1 | | | 5.000 | | | | 09/01/2036 | | | | 3,150,158 | |
| | |
| | 15,000 | | | Susanville, CA Public Financing Authority2 | | | 7.750 | | | | 09/01/2017 | | | | 15,082 | |
41 OPPENHEIMER ROCHESTER CALIFORNIA MUNICIPAL FUND
STATEMENT OF INVESTMENTS Continued
| | | | | | | | | | | | | | | | |
| Principal Amount | | | | | Coupon | | | Maturity | | | Value | |
| | |
| | California (Continued) | | | | | | | | | | | | |
| | |
| | $1,000,000 | | | Susanville, CA Public Financing Authority (Utility Enterprises)1 | | | 5.500 | % | | | 06/01/2030 | | | $ | 1,099,480 | |
| | |
| | 30,000 | | | Temecula, CA Public Financing Authority Community Facilities District (Harveston)1 | | | 5.100 | | | | 09/01/2036 | | | | 30,043 | |
| | |
| | 1,575,000 | | | Temecula, CA Redevel. Agency1 | | | 5.125 | | | | 08/01/2027 | | | | 1,584,860 | |
| | |
| | 50,000 | | | Temecula, CA Redevel. Agency | | | 5.250 | | | | 08/01/2036 | | | | 50,169 | |
| | |
| | 3,705,000 | | | Trinity County, CA COP | | | 8.500 | | | | 01/15/2026 | | | | 3,764,873 | |
| | |
| | 500,000 | | | Tulare, CA Health Care District1 | | | 6.500 | | | | 08/01/2026 | | | | 572,065 | |
| | |
| | 305,000 | | | Turlock, CA Health Facility (Emanuel Medical Center) COP1 | | | 5.125 | | | | 10/15/2027 | | | | 321,510 | |
| | |
| | 2,500,000 | | | Turlock, CA Health Facility (Emanuel Medical Center) COP1 | | | 5.125 | | | | 10/15/2037 | | | | 2,635,325 | |
| | |
| | 430,000 | | | Turlock, CA Health Facility (Emanuel Medical Center) COP1 | | | 5.000 | | | | 10/15/2017 | | | | 442,410 | |
| | |
| | 2,590,000 | | | Turlock, CA Health Facility (Emanuel Medical Center) COP1 | | | 5.000 | | | | 10/15/2022 | | | | 2,726,286 | |
| | |
| | 425,000 | | | Turlock, CA Public Financing Authority1 | | | 5.450 | | | | 09/01/2024 | | | | 426,105 | |
| | |
| | 1,500,000 | | | Tustin, CA Unified School District1 | | | 6.000 | | | | 08/01/2036 | | | | 1,881,270 | |
| | |
| | 415,000 | | | Twentynine Palms, CA Redevel. Agency Tax Allocation (Four Corners)1 | | | 7.400 | | | | 09/01/2032 | | | | 519,099 | |
| | |
| | 425,000 | | | Twentynine Palms, CA Redevel. Agency Tax Allocation (Four Corners)1 | | | 7.650 | | | | 09/01/2042 | | | | 536,699 | |
| | |
| | 500,000 | | | Twentynine Palms, CA Redevel. Agency Tax Allocation (Four Corners)1 | | | 7.400 | | | | 09/01/2032 | | | | 625,420 | |
| | |
| | 375,000 | | | Twentynine Palms, CA Redevel. Agency Tax Allocation (Four Corners)1 | | | 7.125 | | | | 09/01/2026 | | | | 475,931 | |
| | |
| | 15,000,000 | | | University of California1 | | | 5.000 | | | | 05/15/2038 | | | | 18,088,350 | |
| | |
| | 12,840,000 | | | University of California1 | | | 5.000 | | | | 05/15/2037 | | | | 16,068,875 | |
| | |
| | 1,080,000 | | | Upland, CA Community Facilities District Special Tax (Improvement Area No. 2 Colonies San Antonio)1 | | | 5.000 | | | | 09/01/2030 | | | | 1,270,534 | |
| | |
| | 1,030,000 | | | Upland, CA Community Facilities District Special Tax (Improvement Area No. 2 Colonies San Antonio)1 | | | 5.000 | | | | 09/01/2029 | | | | 1,215,019 | |
| | |
| | 750,000 | | | Ventura County, CA Area Hsg. Authority (Mira Vista Senior Apartments)1 | | | 5.050 | | | | 12/01/2026 | | | | 754,710 | |
| | |
| | 1,595,000 | | | Ventura County, CA Area Hsg. Authority (Mira Vista Senior Apartments)1 | | | 5.150 | | | | 12/01/2031 | | | | 1,605,336 | |
| | |
| | 4,000,000 | | | Vernon, CA Electric System1 | | | 5.500 | | | | 08/01/2041 | | | | 4,689,680 | |
| | |
| | 1,000,000 | | | Vernon, CA Electric System1 | | | 5.125 | | | | 08/01/2033 | | | | 1,163,400 | |
| | |
| | 65,000 | | | Vernon, CA Redevel. Agency Tax Allocation1 | | | 5.000 | | | | 09/01/2035 | | | | 65,086 | |
| | |
| | 500,000 | | | Victorville, CA Special Tax Community Facilities District 07-011 | | | 5.350 | | | | 09/01/2042 | | | | 516,015 | |
| | |
| | 1,500,000 | | | West Hollywood, CA Community Devel. Commission Tax Allocation (East Side Redevel.)1 | | | 7.500 | | | | 09/01/2042 | | | | 1,932,810 | |
| | |
| | 1,550,000 | | | West Patterson, CA Financing Authority Special Tax Community Facilities District No. 2015-11 | | | 5.250 | | | | 09/01/2045 | | | | 1,651,680 | |
| | |
| | 610,000 | | | West Patterson, CA Financing Authority Special Tax Community Facilities District No. 2015-11 | | | 5.250 | | | | 09/01/2035 | | | | 656,177 | |
| | |
| | 1,500,000 | | | Woodland, CA Finance Authority1 | | | 6.000 | | | | 03/01/2041 | | | | 1,820,025 | |
42 OPPENHEIMER ROCHESTER CALIFORNIA MUNICIPAL FUND
| | | | | | | | | | | | | | | | |
| Principal Amount | | | | | Coupon | | | Maturity | | | Value | |
| | |
| | California (Continued) | | | | | | | | | | | | |
| | |
| | $2,300,000 | | | Woodland, CA Finance Authority1 | | | 6.000 | % | | | 03/01/2036 | | | $ | 2,796,455 | |
| | | | | | | | | | | | | | | | |
| | | | | | | | | | | | | | | 1,283,214,057 | |
|
| | |
| | U.S. Possessions—12.6% | | | | | | | | | | | | |
| | 1,000,000 | | | Guam Government Limited Obligation1 | | | 5.375 | | | | 12/01/2024 | | | | 1,109,480 | |
| | |
| | 2,500,000 | | | Guam International Airport Authority1 | | | 6.125 | | | | 10/01/2043 | | | | 3,038,450 | |
| | |
| | 1,000,000 | | | Guam International Airport Authority1 | | | 6.000 | | | | 10/01/2034 | | | | 1,216,740 | |
| | |
| | 320,000 | | | Guam Power Authority, Series A1 | | | 5.000 | | | | 10/01/2024 | | | | 383,331 | |
| | |
| | 570,000 | | | Guam Power Authority, Series A1 | | | 5.000 | | | | 10/01/2030 | | | | 679,394 | |
| | |
| | 250,000 | | | Guam Power Authority, Series A1 | | | 5.000 | | | | 10/01/2023 | | | | 295,767 | |
| | |
| | 1,320,000 | | | Northern Mariana Islands Ports Authority, Series A1 | | | 6.250 | | | | 03/15/2028 | | | | 1,239,982 | |
| | |
| | 2,490,000 | | | Northern Mariana Islands Ports Authority, Series A1 | | | 5.500 | | | | 03/15/2031 | | | | 2,428,323 | |
| | |
| | 5,000,000 | | | Puerto Rico Aqueduct & Sewer Authority | | | 5.125 | | | | 07/01/2037 | | | | 3,522,050 | |
| | |
| | 3,700,000 | | | Puerto Rico Aqueduct & Sewer Authority | | | 6.125 | 6 | | | 07/01/2024 | | | | 2,723,681 | |
| | |
| | 6,000,000 | | | Puerto Rico Aqueduct & Sewer Authority | | | 6.000 | | | | 07/01/2044 | | | | 4,339,920 | |
| | |
| | 8,405,000 | | | Puerto Rico Children’s Trust Fund (TASC)1 | | | 5.500 | | | | 05/15/2039 | | | | 8,342,719 | |
| | |
| | 2,130,000 | | | Puerto Rico Children’s Trust Fund (TASC)1 | | | 5.625 | | | | 05/15/2043 | | | | 2,115,218 | |
| | |
| | 5,095,000 | | | Puerto Rico Children’s Trust Fund (TASC)1 | | | 5.375 | | | | 05/15/2033 | | | | 5,082,110 | |
| | |
| | 7,590,000 | | | Puerto Rico Commonwealth GO8 | | | 6.000 | | | | 07/01/2039 | | | | 4,853,881 | |
| | |
| | 1,020,000 | | | Puerto Rico Commonwealth GO8 | | | 5.750 | | | | 07/01/2038 | | | | 650,250 | |
| | |
| | 3,000,000 | | | Puerto Rico Commonwealth GO8 | | | 6.500 | | | | 07/01/2037 | | | | 1,933,530 | |
| | |
| | 1,000,000 | | | Puerto Rico Commonwealth GO8 | | | 6.500 | | | | 07/01/2040 | | | | 644,510 | |
| | |
| | 1,450,000 | | | Puerto Rico Commonwealth GO8 | | | 5.375 | | | | 07/01/2030 | | | | 922,562 | |
| | |
| | 8,660,000 | | | Puerto Rico Commonwealth GO8 | | | 5.750 | | | | 07/01/2041 | | | | 5,520,750 | |
| | |
| | 80,000 | | | Puerto Rico Commonwealth GO | | | 6.000 | | | | 07/01/2036 | | | | 80,178 | |
| | |
| | 1,615,000 | | | Puerto Rico Commonwealth GO8 | | | 5.500 | | | | 07/01/2027 | | | | 1,027,544 | |
| | |
| | 5,025,000 | | | Puerto Rico Commonwealth GO8 | | | 5.750 | | | | 07/01/2028 | | | | 3,203,437 | |
| | |
| | 5,000,000 | | | Puerto Rico Commonwealth GO8 | | | 5.500 | | | | 07/01/2026 | | | | 3,181,250 | |
| | |
| | 1,480,000 | | | Puerto Rico Commonwealth GO | | | 5.500 | | | | 07/01/2020 | | | | 1,572,219 | |
| | |
| | 3,500,000 | | | Puerto Rico Commonwealth GO8 | | | 5.250 | | | | 07/01/2023 | | | | 2,222,500 | |
| | |
| | 4,000,000 | | | Puerto Rico Commonwealth GO8 | | | 6.000 | | | | 07/01/2038 | | | | 2,558,040 | |
| | |
| | 2,500,000 | | | Puerto Rico Commonwealth GO8 | | | 6.000 | | | | 07/01/2039 | | | | 1,618,750 | |
| | |
| | 500,000 | | | Puerto Rico Commonwealth GO8 | | | 5.250 | | | | 07/01/2030 | | | | 317,500 | |
| | |
| | 5,000,000 | | | Puerto Rico Commonwealth GO8 | | | 5.500 | | | | 07/01/2039 | | | | 3,225,000 | |
| | |
| | 1,000,000 | | | Puerto Rico Commonwealth GO7 | | | 5.500 | | | | 07/01/2021 | | | | 735,000 | |
| | |
| | 453,432 | | | Puerto Rico Electric Power Authority | | | 10.000 | | | | 07/01/2021 | | | | 359,502 | |
| | |
| | 453,432 | | | Puerto Rico Electric Power Authority | | | 10.000 | | | | 01/01/2021 | | | | 359,502 | |
| | |
| | 476,247 | | | Puerto Rico Electric Power Authority | | | 10.000 | | | | 07/01/2019 | | | | 379,580 | |
| | |
| | 151,144 | | | Puerto Rico Electric Power Authority | | | 10.000 | | | | 01/01/2022 | | | | 119,683 | |
| | |
| | 476,247 | | | Puerto Rico Electric Power Authority | | | 10.000 | | | | 07/01/2019 | | | | 379,580 | |
| | |
| | 151,143 | | | Puerto Rico Electric Power Authority | | | 10.000 | | | | 07/01/2022 | | | | 119,682 | |
| | |
| | 1,000,000 | | | Puerto Rico Electric Power Authority, Series A9 | | | 5.050 | | | | 07/01/2042 | | | | 671,620 | |
| | |
| | 10,000,000 | | | Puerto Rico Electric Power Authority, Series A9 | | | 5.000 | | | | 07/01/2029 | | | | 6,714,900 | |
| | |
| | 8,995,000 | | | Puerto Rico Electric Power Authority, Series A9 | | | 5.000 | | | | 07/01/2042 | | | | 6,041,942 | |
| | |
| | 7,350,000 | | | Puerto Rico Electric Power Authority, Series A9 | | | 6.750 | | | | 07/01/2036 | | | | 4,956,546 | |
| | |
| | 1,000,000 | | | Puerto Rico Electric Power Authority, Series A9 | | | 7.000 | | | | 07/01/2033 | | | | 674,410 | |
| | |
| | 5,000,000 | | | Puerto Rico Electric Power Authority, Series WW9 | | | 5.000 | | | | 07/01/2028 | | | | 3,357,700 | |
| | |
| | 5,000,000 | | | Puerto Rico Electric Power Authority, Series XX9 | | | 5.750 | | | | 07/01/2036 | | | | 3,356,900 | |
| | |
| | 6,495,000 | | | Puerto Rico Electric Power Authority, Series XX9 | | | 5.250 | | | | 07/01/2040 | | | | 4,361,328 | |
| | |
| | 500,000 | | | Puerto Rico Electric Power Authority, Series ZZ9 | | | 5.250 | | | | 07/01/2026 | | | | 335,745 | |
43 OPPENHEIMER ROCHESTER CALIFORNIA MUNICIPAL FUND
STATEMENT OF INVESTMENTS Continued
| | | | | | | | | | | | | | | | |
| Principal Amount | | | | | Coupon | | | Maturity | | | Value | |
| | |
| | U.S. Possessions (Continued) | | | | | | | | | | | | |
| | |
| | $2,500,000 | | | Puerto Rico Highway & Transportation Authority | | | 5.500 | % | | | 07/01/2030 | | | $ | 1,556,575 | |
| | |
| | 100,000 | | | Puerto Rico Infrastructure7 | | | 5.500 | | | | 07/01/2020 | | | | 48,625 | |
| | |
| | 1,220,000 | | | Puerto Rico Infrastructure (Mepsi Campus)1 | | | 6.500 | | | | 10/01/2037 | | | | 621,980 | |
| | |
| | 250,000 | | | Puerto Rico ITEMECF (Ana G. Mendez University)1 | | | 5.000 | | | | 04/01/2027 | | | | 234,420 | |
| | |
| | 225,000 | | | Puerto Rico ITEMECF (Ana G. Mendez University)1 | | | 5.375 | | | | 04/01/2042 | | | | 205,857 | |
| | |
| | 170,000 | | | Puerto Rico ITEMECF (Ana G. Mendez University)1 | | | 5.125 | | | | 04/01/2032 | | | | 156,796 | |
| | |
| | 6,055,000 | | | Puerto Rico ITEMECF (Cogeneration Facilities)1 | | | 6.625 | | | | 06/01/2026 | | | | 5,884,673 | |
| | |
| | 1,725,000 | | | Puerto Rico ITEMECF (Guaynabo Municipal Government Center)1 | | | 5.625 | | | | 07/01/2022 | | | | 1,374,808 | |
| | |
| | 8,055,000 | | | Puerto Rico Public Buildings Authority7 | | | 6.750 | | | | 07/01/2036 | | | | 4,893,413 | |
| | |
| | 7,255,000 | | | Puerto Rico Public Buildings Authority7 | | | 6.000 | | | | 07/01/2041 | | | | 4,380,206 | |
| | |
| | 7,710,000 | | | Puerto Rico Sales Tax Financing Corp., Series A | | | 5.375 | | | | 08/01/2039 | | | | 3,773,968 | |
| | |
| | 7,670,000 | | | Puerto Rico Sales Tax Financing Corp., Series A | | | 5.500 | | | | 08/01/2042 | | | | 3,749,019 | |
| | |
| | 610,000 | | | Puerto Rico Sales Tax Financing Corp., Series A | | | 5.500 | | | | 08/01/2028 | | | | 312,180 | |
| | |
| | 17,000,000 | | | Puerto Rico Sales Tax Financing Corp., Series A | | | 6.500 | | | | 08/01/2044 | | | | 8,687,680 | |
| | |
| | 15,500,000 | | | Puerto Rico Sales Tax Financing Corp., Series A | | | 6.375 | | | | 08/01/2039 | | | | 7,921,585 | |
| | |
| | 12,380,000 | | | Puerto Rico Sales Tax Financing Corp., Series A | | | 5.750 | | | | 08/01/2037 | | | | 6,160,164 | |
| | |
| | 1,000,000 | | | Puerto Rico Sales Tax Financing Corp., Series A-1 | | | 5.250 | | | | 08/01/2043 | | | | 486,320 | |
| | |
| | 8,575,000 | | | Puerto Rico Sales Tax Financing Corp., Series C | | | 6.000 | | | | 08/01/2042 | | | | 4,382,854 | |
| | |
| | 17,465,000 | | | Puerto Rico Sales Tax Financing Corp., Series C | | | 6.000 | | | | 08/01/2039 | | | | 8,926,885 | |
| | |
| | 3,055,000 | | | V.I. Public Finance Authority (Matching Fund Loan Note)1 | | | 5.000 | | | | 10/01/2019 | | | | 3,062,332 | |
| | |
| | 425,000 | | | V.I. Public Finance Authority (Matching Fund Loan Note)1 | | | 5.000 | | | | 10/01/2017 | | | | 436,326 | |
| | |
| | 840,000 | | | V.I. Public Finance Authority (Matching Fund Loan Notes)1 | | | 5.000 | | | | 10/01/2032 | | | | 849,366 | |
| | |
| | 1,350,000 | | | V.I. Public Finance Authority, Series A1 | | | 5.000 | | | | 10/01/2018 | | | | 1,375,772 | |
| | | | | | | | | | | | | | | | |
| | | | | | | | | | | | | | | 172,454,490 | |
|
| | |
| | Total Investments, at Value (Cost $1,508,470,581)—106.9% | | | | | | | | | | | 1,455,668,547 | |
| | |
| | Net Other Assets (Liabilities)—(6.9) | | | | | | | | | | | (94,533,690) | |
| | | | | | | | | | | | | | | | |
| | Net Assets—100.0% | | | | | | | | | | $ | 1,361,134,857 | |
| | | | | | | | | | | | | | | | |
Footnotes to Statement of Investments
1. All or a portion of the security position has been segregated for collateral to cover borrowings. See Note 9 of the accompanying Notes.
2. All or a portion of the security position is when-issued or delayed delivery to be delivered and settled after period end. See Note 4 of the accompanying Notes.
3. Security represents the underlying municipal bond with respect to an inverse floating rate security held by the Fund. The bond was purchased by the Fund and subsequently transferred to a trust, which issued the related inverse floating rate security. See Note 4 of the accompanying Notes.
4. Represents the current interest rate for a variable or increasing rate security.
5. Zero coupon bond reflects effective yield on the original acquisition date.
6. Denotes a step bond: a zero coupon bond that converts to a fixed or variable interest rate at a designated future date.
7. This security is accruing partial income at an anticipated effective rate based on expected interest and/or principal payments. The rate shown is the contractual interest rate.
8. This security is not accruing income because the issuer has missed an interest payment on it and/or is not anticipated to make future interest and/or principal payments. The rate shown is the contractual interest rate. See Note 4 of the accompanying Notes.
44 OPPENHEIMER ROCHESTER CALIFORNIA MUNICIPAL FUND
Footnotes to Statement of Investments (Continued)
9. Subject to a forbearance agreement. Rate shown is the contractual interest rate. See Note 4 of the accompanying Notes.
To simplify the listings of securities, abbreviations are used per the table below:
| | |
| ABAG | | Association of Bay Area Governments |
| AcadF | | Academy Foundation |
| AFound | | Archival Foundation |
| AMF | | Academy Museum Foundation |
| AOMPAAS | | Academy of Motion Pictures Arts and Sciences |
| ASN | | Annenberg School of Nursing |
| BCSC | | Brandman Center for Senior Care |
| CDA | | Communities Devel. Authority |
| CFD | | Community Facilities District |
| CHF | | City Hospital Foundation |
| COP | | Certificates of Participation |
| EBPC | | East Bay Prenatal Center |
| EMC | | Eden Medical Center |
| EVLAJHA | | Eisenberg Village of the Los Angeles Jewish Home for the Aging |
| FEV | | Fountainview at Eisenberg Village |
| GO | | General Obligation |
| GVLAJHA | | Grancell Village of the Los Angeles Jewish Home for the Aging |
| HFA | | Housing Finance Agency |
| IDA | | Industrial Devel. Agency |
| ITEMECF | | Industrial, Tourist, Educational, Medical and Environmental Community Facilities |
| JHAGS | | JHA Geriatric Services |
| JHAW | | JHA West 16 |
| LAJHFTA | | Los Angeles Jewish Home for the Aging |
| MCHlth | | Marin Community Health |
| MPHS | | Mills-Peninsula Health Services |
| M-S-R | | Modesto Irrigation District of the City of Santa Clara and the City of Redding |
| OCEAA | | Orange County Educational Arts Academy |
| PAMFHCR&E | | Palo Alto Medical Foundation for Health Care Research & Education |
| SCHosp | | Sutter Coast Hospital |
| SCVH | | Sutter Central Valley Hospitals |
| SEBH | | Sutter East Bay Hospitals |
| SGMF | | Sutter Gould Medical Foundation |
| SHlth | | Sutter Health |
| SJHCN | | St. Joseph Home Care Network |
| SJHE | | St. Joseph Hospital of Eureka |
| SJHO | | St. Joseph Hospital of Orange |
| SJHS | | St. Joseph Health System |
| TASC | | Tobacco Settlement Asset-Backed Bonds |
| TVSRF | | The Vince Street Archive Foundation |
| V.I. | | United States Virgin Islands |
See accompanying Notes to Financial Statements.
45 OPPENHEIMER ROCHESTER CALIFORNIA MUNICIPAL FUND
STATEMENT OF ASSETS AND LIABILITIES July 31, 2016
| | | | |
| |
| Assets | | | | |
| Investments, at value (cost $1,508,470,581)—see accompanying statement of investments | | $ | 1,455,668,547 | |
| |
| Cash | | | 645,567 | |
| |
| Receivables and other assets: | | | | |
| Interest | | | 21,092,163 | |
| Investments sold on a when-issued or delayed delivery basis | | | 1,725,424 | |
| Shares of beneficial interest sold | | | 1,716,101 | |
| Other | | | 457,427 | |
| | | | |
| Total assets | | | 1,481,305,229 | |
|
| |
| Liabilities | | | | |
| Payables and other liabilities: | | | | |
| Payable for short-term floating rate notes issued (See Note 4) | | | 102,420,000 | |
| Payable for borrowings (See Note 9) | | | 11,400,000 | |
| Investments purchased | | | 2,961,770 | |
| Shares of beneficial interest redeemed | | | 1,794,610 | |
| Dividends | | | 1,024,387 | |
| Distribution and service plan fees | | | 250,964 | |
| Trustees’ compensation | | | 201,604 | |
| Shareholder communications | | | 13,667 | |
| Interest expense on borrowings | | | 1,264 | |
| Other | | | 102,106 | |
| | | | |
| Total liabilities | | | 120,170,372 | |
|
| |
| Net Assets | | $ | 1,361,134,857 | |
| | | | |
|
| |
| Composition of Net Assets | | | | |
| Par value of shares of beneficial interest | | $ | 158,291 | |
| |
| Additional paid-in capital | | | 1,920,116,003 | |
| |
| Accumulated net investment income | | | 7,444,852 | |
| |
| Accumulated net realized loss on investments | | | (513,782,255) | |
| |
| Net unrealized depreciation on investments | | | (52,802,034) | |
| | | | |
| Net Assets | | $ | 1,361,134,857 | |
| | | | |
46 OPPENHEIMER ROCHESTER CALIFORNIA MUNICIPAL FUND
| | | | |
| |
| Net Asset Value Per Share | | | | |
| Class A Shares: | | | | |
| |
| Net asset value and redemption price per share (based on net assets of $925,806,789 and 107,585,022 shares of beneficial interest outstanding) | | $ | 8.61 | |
| |
| Maximum offering price per share (net asset value plus sales charge of 4.75% of offering price) | | $ | 9.04 | |
| |
| |
| Class B Shares: | | | | |
| |
| Net asset value, redemption price (excludes applicable contingent deferred sales charge) and offering price per share (based on net assets of $1,630,270 and 189,255 shares of beneficial interest outstanding) | | $ | 8.61 | |
| |
| |
| Class C Shares: | | | | |
| |
| Net asset value, redemption price (excludes applicable contingent deferred sales charge) and offering price per share (based on net assets of $259,836,397 and 30,318,437 shares of beneficial interest outstanding) | | $ | 8.57 | |
| |
| |
| Class Y Shares: | | | | |
| |
| Net asset value, redemption price and offering price per share (based on net assets of $173,861,401 and 20,198,323 shares of beneficial interest outstanding) | | $ | 8.61 | |
See accompanying Notes to Financial Statements.
47 OPPENHEIMER ROCHESTER CALIFORNIA MUNICIPAL FUND
STATEMENT OF OPERATIONS For the Year Ended July 31, 2016
| | | | |
| |
| Investment Income | | | | |
| Interest | | $ | 81,365,256 | |
| |
| Expenses | | | | |
| Management fees | | | 5,864,896 | |
| |
| Distribution and service plan fees: | | | | |
| Class A | | | 2,140,963 | |
| Class B | | | 19,495 | |
| Class C | | | 2,554,205 | |
| |
| Transfer and shareholder servicing agent fees: | | | | |
| Class A | | | 881,775 | |
| Class B | | | 1,952 | |
| Class C | | | 255,582 | |
| Class Y | | | 145,665 | |
| |
| Shareholder communications: | | | | |
| Class A | | | 16,024 | |
| Class B | | | 117 | |
| Class C | | | 8,067 | |
| Class Y | | | 2,941 | |
| |
| Legal, auditing and other professional fees | | | 3,205,397 | |
| |
| Interest expense and fees on short-term floating rate notes issued (See Note 4) | | | 1,119,863 | |
| |
| Borrowing fees | | | 644,459 | |
| |
| Trustees’ compensation | | | 21,495 | |
| |
| Interest expense on borrowings | | | 7,782 | |
| |
| Custodian fees and expenses | | | 7,096 | |
| |
| Other | | | 168,005 | |
| | | | |
| Total expenses | | | 17,065,779 | |
| |
| Net Investment Income | | | 64,299,477 | |
| |
| Realized and Unrealized Gain | | | | |
| Net realized gain on investments | | | 13,653,851 | |
| |
| Net change in unrealized appreciation/depreciation on investments | | | 50,859,045 | |
| |
| Net Increase in Net Assets Resulting from Operations | | $ | 128,812,373 | |
| | | | |
See accompanying Notes to Financial Statements.
48 OPPENHEIMER ROCHESTER CALIFORNIA MUNICIPAL FUND
STATEMENTS OF CHANGES IN NET ASSETS
| | | | | | | | |
| | | Year Ended July 31, 2016 | | | Year Ended July 31, 2015 | |
| |
| Operations | | | | | | | | |
| Net investment income | | $ | 64,299,477 | | | $ | 71,186,071 | |
| |
| Net realized gain | | | 13,653,851 | | | | 666,786 | |
| |
| Net change in unrealized appreciation/depreciation | | | 50,859,045 | | | | (26,982,523) | |
| | | | |
| Net increase in net assets resulting from operations | | | 128,812,373 | | | | 44,870,334 | |
|
| |
| Dividends and/or Distributions to Shareholders | | | | | | | | |
| Dividends from net investment income: | | | | | | | | |
| Class A | | | (47,822,210) | | | | (50,852,944) | |
| Class B | | | (91,205) | | | | (163,813) | |
| Class C | | | (11,989,671) | | | | (12,801,382) | |
| Class Y | | | (8,231,490) | | | | (7,281,003) | |
| | | | |
| | | (68,134,576) | | | | (71,099,142) | |
|
| |
| Beneficial Interest Transactions | | | | | | | | |
| Net increase (decrease) in net assets resulting from beneficial interest transactions: | | | | | | | | |
| Class A | | | 4,874,638 | | | | 3,078,547 | |
| Class B | | | (1,290,639) | | | | (1,125,283) | |
| Class C | | | (5,874,124) | | | | (7,210,005) | |
| Class Y | | | 43,054,737 | | | | 25,570,237 | |
| | | | |
| | | 40,764,612 | | | | 20,313,496 | |
|
| |
| Net Assets | | | | | | | | |
| Total increase (decrease) | | | 101,442,409 | | | | (5,915,312) | |
| |
| Beginning of period | | | 1,259,692,448 | | | | 1,265,607,760 | |
| | | | |
| End of period (including accumulated net investment income of $7,444,852 and $11,701,069, respectively) | | $ | 1,361,134,857 | | | $ | 1,259,692,448 | |
| | | | |
See accompanying Notes to Financial Statements.
49 OPPENHEIMER ROCHESTER CALIFORNIA MUNICIPAL FUND
STATEMENT OF CASH FLOWS For the Year Ended July 31, 2016
| | | | |
| |
| Cash Flows from Operating Activities | | | | |
| Net increase in net assets from operations | | $ | 128,812,373 | |
| |
| Adjustments to reconcile net increase in net assets from operations to net cash provided by operating activities: | | | | |
Purchase of investment securities | | | (228,012,907) | |
Proceeds from disposition of investment securities | | | 209,191,313 | |
Short-term investment securities, net | | | 1,894,307 | |
Premium amortization | | | 5,282,764 | |
Discount accretion | | | (16,657,386) | |
Net realized gain on investments | | | (13,653,851) | |
Net change in unrealized appreciation/depreciation on investments | | | (50,859,045) | |
| Change in assets: | | | | |
Increase in other assets | | | (182,115) | |
Decrease in interest receivable | | | 530,296 | |
Decrease in receivable for securities sold | | | 15,413,854 | |
| Change in liabilities: | | | | |
Decrease in other liabilities | | | (2,436) | |
Decrease in payable for securities purchased | | | (644,240) | |
| | | | |
| Net cash provided by operating activities | | | 51,112,927 | |
|
| |
| Cash Flows from Financing Activities | | | | |
| Proceeds from borrowings | | | 61,600,000 | |
| Payments on borrowings | | | (50,200,000) | |
| Payments on short-term floating rate notes issued | | | (41,020,000) | |
| Proceeds from shares sold | | | 287,768,218 | |
| Payments on shares redeemed | | | (299,884,004) | |
| Cash distributions paid | | | (17,148,819) | |
| | | | |
| Net cash used in financing activities | | | (58,884,605) | |
| |
| Net decrease in cash | | | (7,771,678) | |
| |
| Cash, beginning balance | | | 8,417,245 | |
| | | | |
| Cash, ending balance | | $ | 645,567 | |
| | | | |
Supplemental disclosure of cash flow information:
Noncash financing activities not included herein consist of reinvestment of dividends and distributions of $50,982,919.
Cash paid for interest on borrowings—$6,569.
Cash paid for interest on short-term floating rate notes issued—$1,119,863.
See accompanying Notes to Financial Statements.
50 OPPENHEIMER ROCHESTER CALIFORNIA MUNICIPAL FUND
FINANCIAL HIGHLIGHTS
| | | | | | | | | | | | | | | | | | | | |
| Class A | | Year Ended
July 31, 2016 | | | Year Ended
July 31, 2015 | | | Year Ended
July 31, 2014 | | | Year Ended
July 31, 2013 | | | Year Ended
July 31, 2012 | |
| |
| Per Share Operating Data | | | | | | | | | | | | | | | | | | | | |
| Net asset value, beginning of period | | | $8.21 | | | | $8.37 | | | | $8.14 | | | | $8.75 | | | | $7.75 | |
| |
| Income (loss) from investment operations: | | | | | | | | | | | | | | | | | | | | |
| Net investment income1 | | | 0.43 | | | | 0.47 | | | | 0.51 | | | | 0.49 | | | | 0.51 | |
| Net realized and unrealized gain (loss) | | | 0.42 | | | | (0.16) | | | | 0.20 | | | | (0.62) | | | | 1.01 | |
| | | | |
| Total from investment operations | | | 0.85 | | | | 0.31 | | | | 0.71 | | | | (0.13) | | | | 1.52 | |
| |
| Dividends and/or distributions to shareholders: | | | | | | | | | | | | | | | | | | | | |
| Dividends from net investment income | | | (0.45) | | | | (0.47) | | | | (0.48) | | | | (0.48) | | | | (0.52) | |
| |
| Net asset value, end of period | | | $8.61 | | | | $8.21 | | | | $8.37 | | | | $8.14 | | | | $8.75 | |
| | | | |
| | | | | |
| |
| Total Return, at Net Asset Value2 | | | 10.67% | | | | 3.61% | | | | 9.03% | | | | (1.66)% | | | | 20.31% | |
| | | | | |
| |
| Ratios/Supplemental Data | | | | | | | | | | | | | | | | | | | | |
| Net assets, end of period (in thousands) | | | $925,807 | | | | $879,253 | | | | $894,308 | | | | $967,217 | | | | $1,194,157 | |
| |
| Average net assets (in thousands) | | | $886,704 | | | | $926,912 | | | | $922,522 | | | | $1,214,170 | | | | $1,037,577 | |
| |
| Ratios to average net assets:3 | | | | | | | | | | | | | | | | | | | | |
| Net investment income | | | 5.10% | | | | 5.50% | | | | 6.32% | | | | 5.56% | | | | 6.18% | |
| Expenses excluding specific expenses listed below | | | 1.06% | | | | 0.95% | | | | 0.80% | | | | 0.73% | | | | 0.75% | |
| Interest and fees from borrowings | | | 0.05% | | | | 0.04% | | | | 0.05% | | | | 0.04% | | | | 0.04% | |
| Interest and fees on short-term floating rate notes issued4 | | | 0.09% | | | | 0.08% | | | | 0.09% | | | | 0.09% | | | | 0.12% | |
| | | | |
| Total expenses | | | 1.20% | | | | 1.07% | | | | 0.94% | | | | 0.86% | | | | 0.91% | |
| Expenses after payments, waivers and/or reimbursements and reduction to custodian expenses | | | 1.20% | | | | 1.07% | | | | 0.94% | | | | 0.85% | | | | 0.90% | |
| |
| Portfolio turnover rate | | | 15% | | | | 21% | | | | 17% | | | | 24% | | | | 10% | |
1. Per share amounts calculated based on the average shares outstanding during the period.
2. Assumes an initial investment on the business day before the first day of the fiscal period, with all dividends and distributions reinvested in additional shares on the reinvestment date, and redemption at the net asset value calculated on the last business day of the fiscal period. Sales charges are not reflected in the total returns. Total returns are not annualized for periods less than one full year. Returns do not reflect the deduction of taxes that a shareholder would pay on fund distributions or the redemption of fund shares.
3. Annualized for periods less than one full year.
4. Interest and fee expense relates to the Fund’s liability for short-term floating rate notes issued in conjunction with inverse floating rate security transactions.
See accompanying Notes to Financial Statements.
51 OPPENHEIMER ROCHESTER CALIFORNIA MUNICIPAL FUND
FINANCIAL HIGHLIGHTS Continued
| | | | | | | | | | | | | | | | | | | | |
| Class B | | Year Ended
July 31, 2016 | | | Year Ended
July 31, 2015 | | | Year Ended
July 31, 2014 | | | Year Ended July 31, 2013 | | | Year Ended
July 31, 2012 | |
| |
| Per Share Operating Data | | | | | | | | | | | | | | | | | | | | |
| Net asset value, beginning of period | | | $8.22 | | | | $8.38 | | | | $8.15 | | | | $8.76 | | | | $7.76 | |
| |
| Income (loss) from investment operations: | | | | | | | | | | | | | | | | | | | | |
| Net investment income1 | | | 0.37 | | | | 0.40 | | | | 0.45 | | | | 0.41 | | | | 0.44 | |
| Net realized and unrealized gain (loss) | | | 0.41 | | | | (0.16) | | | | 0.19 | | | | (0.61) | | | | 1.01 | |
| | | | |
| Total from investment operations | | | 0.78 | | | | 0.24 | | | | 0.64 | | | | (0.20) | | | | 1.45 | |
| |
| Dividends and/or distributions to shareholders: | | | | | | | | | | | | | | | | | | | | |
| Dividends from net investment income | | | (0.39) | | | | (0.40) | | | | (0.41) | | | | (0.41) | | | | (0.45) | |
| |
| Net asset value, end of period | | | $8.61 | | | | $8.22 | | | | $8.38 | | | | $8.15 | | | | $8.76 | |
| | | | |
| | | | | |
| |
| Total Return, at Net Asset Value2 | | | 9.82% | | | | 2.82% | | | | 8.16% | | | | (2.54)% | | | | 19.26% | |
| | | | | |
| |
| Ratios/Supplemental Data | | | | | | | | | | | | | | | | | | | | |
| Net assets, end of period (in thousands) | | | $1,630 | | | | $2,835 | | | | $4,001 | | | | $6,910 | | | | $13,960 | |
| |
| Average net assets (in thousands) | | | $1,963 | | | | $3,474 | | | | $5,149 | | | | $10,336 | | | | $15,887 | |
| |
| Ratios to average net assets:3 | | | | | | | | | | | | | | | | | | | | |
| Net investment income | | | 4.36% | | | | 4.73% | | | | 5.52% | | | | 4.69% | | | | 5.39% | |
| Expenses excluding specific expenses listed below | | | 1.82% | | | | 1.72% | | | | 1.62% | | | | 1.62% | | | | 1.61% | |
| Interest and fees from borrowings | | | 0.05% | | | | 0.04% | | | | 0.05% | | | | 0.04% | | | | 0.04% | |
| Interest and fees on short-term floating rate notes issued4 | | | 0.09% | | | | 0.08% | | | | 0.09% | | | | 0.09% | | | | 0.12% | |
| | | | |
| Total expenses | | | 1.96% | | | | 1.84% | | | | 1.76% | | | | 1.75% | | | | 1.77% | |
| Expenses after payments, waivers and/or reimbursements and reduction to custodian expenses | | | 1.96% | | | | 1.84% | | | | 1.76% | | | | 1.74% | | | | 1.76% | |
| |
| Portfolio turnover rate | | | 15% | | | | 21% | | | | 17% | | | | 24% | | | | 10% | |
1. Per share amounts calculated based on the average shares outstanding during the period.
2. Assumes an initial investment on the business day before the first day of the fiscal period, with all dividends and distributions reinvested in additional shares on the reinvestment date, and redemption at the net asset value calculated on the last business day of the fiscal period. Sales charges are not reflected in the total returns. Total returns are not annualized for periods less than one full year. Returns do not reflect the deduction of taxes that a shareholder would pay on fund distributions or the redemption of fund shares. The returns do not include adjustments in accordance with generally accepted accounting principles required at the period end for financial reporting purposes.
3. Annualized for periods less than one full year.
4. Interest and fee expense relates to the Fund’s liability for short-term floating rate notes issued in conjunction with inverse floating rate security transactions.
See accompanying Notes to Financial Statements.
52 OPPENHEIMER ROCHESTER CALIFORNIA MUNICIPAL FUND
| | | | | | | | | | | | | | | | | | | | |
| Class C | | Year Ended
July 31, 2016 | | | Year Ended
July 31, 2015 | | | Year Ended
July 31, 2014 | | | Year Ended
July 31, 2013 | | | Year Ended
July 31, 2012 | |
| |
| Per Share Operating Data | | | | | | | | | | | | | | | | | | | | |
| Net asset value, beginning of period | | | $8.18 | | | | $8.34 | | | | $8.11 | | | | $8.72 | | | | $7.73 | |
| |
| Income (loss) from investment operations: | | | | | | | | | | | | | | | | | | | | |
| Net investment income1 | | | 0.36 | | | | 0.40 | | | | 0.45 | | | | 0.42 | | | | 0.44 | |
| Net realized and unrealized gain (loss) | | | 0.42 | | | | (0.16) | | | | 0.20 | | | | (0.61) | | | | 1.01 | |
| | | | |
| Total from investment operations | | | 0.78 | | | | 0.24 | | | | 0.65 | | | | (0.19) | | | | 1.45 | |
| |
| Dividends and/or distributions to shareholders: | | | | | | | | | | | | | | | | | | | | |
| Dividends from net investment income | | | (0.39) | | | | (0.40) | | | | (0.42) | | | | (0.42) | | | | (0.46) | |
| |
| Net asset value, end of period | | | $8.57 | | | | $8.18 | | | | $8.34 | | | | $8.11 | | | | $8.72 | |
| | | | |
| | | | | |
| |
| Total Return, at Net Asset Value2 | | | 9.89% | | | | 2.84% | | | | 8.24% | | | | (2.43)% | | | | 19.31% | |
| | | | | |
| |
| Ratios/Supplemental Data | | | | | | | | | | | | | | | | | | | | |
| Net assets, end of period (in thousands) | | | $259,836 | | | | $253,773 | | | | $266,060 | | | | $293,424 | | | | $320,829 | |
| |
| Average net assets (in thousands) | | | $257,015 | | | | $269,613 | | | | $265,211 | | | | $333,013 | | | | $288,500 | |
| |
| Ratios to average net assets:3 | | | | | | | | | | | | | | | | | | | | |
| Net investment income | | | 4.35% | | | | 4.74% | | | | 5.55% | | | | 4.79% | | | | 5.42% | |
| Expenses excluding specific expenses listed below | | | 1.81% | | | | 1.71% | | | | 1.57% | | | | 1.51% | | | | 1.52% | |
| Interest and fees from borrowings | | | 0.05% | | | | 0.04% | | | | 0.05% | | | | 0.04% | | | | 0.04% | |
| Interest and fees on short-term floating rate notes issued4 | | | 0.09% | | | | 0.08% | | | | 0.09% | | | | 0.09% | | | | 0.12% | |
| | | | |
| Total expenses | | | 1.95% | | | | 1.83% | | | | 1.71% | | | | 1.64% | | | | 1.68% | |
| Expenses after payments, waivers and/or reimbursements and reduction to custodian expenses | | | 1.95% | | | | 1.83% | | | | 1.71% | | | | 1.63% | | | | 1.67% | |
| |
| Portfolio turnover rate | | | 15% | | | | 21% | | | | 17% | | | | 24% | | | | 10% | |
1. Per share amounts calculated based on the average shares outstanding during the period.
2. Assumes an initial investment on the business day before the first day of the fiscal period, with all dividends and distributions reinvested in additional shares on the reinvestment date, and redemption at the net asset value calculated on the last business day of the fiscal period. Sales charges are not reflected in the total returns. Total returns are not annualized for periods less than one full year. Returns do not reflect the deduction of taxes that a shareholder would pay on fund distributions or the redemption of fund shares. The returns do not include adjustments in accordance with generally accepted accounting principles required at the period end for financial reporting purposes.
3. Annualized for periods less than one full year.
4. Interest and fee expense relates to the Fund’s liability for short-term floating rate notes issued in conjunction with inverse floating rate security transactions.
See accompanying Notes to Financial Statements.
53 OPPENHEIMER ROCHESTER CALIFORNIA MUNICIPAL FUND
FINANCIAL HIGHLIGHTS Continued
| | | | | | | | | | | | | | | | | | | | |
Class Y | | Year Ended
July 31, 2016 | | | Year Ended
July 31, 2015 | | | Year Ended
July 31, 2014 | | | Year Ended
July 31, 2013 | | | Year Ended
July 31, 2012 | |
| |
| Per Share Operating Data | | | | | | | | | | | | | | | | | | | | |
| Net asset value, beginning of period | | | $8.21 | | | | $8.37 | | | | $8.14 | | | | $8.75 | | | | $7.76 | |
| |
| Income (loss) from investment operations: | | | | | | | | | | | | | | | | | | | | |
| Net investment income1 | | | 0.45 | | | | 0.49 | | | | 0.53 | | | | 0.51 | | | | 0.52 | |
| Net realized and unrealized gain (loss) | | | 0.42 | | | | (0.16) | | | | 0.20 | | | | (0.62) | | | | 1.01 | |
| | | | |
| Total from investment operations | | | 0.87 | | | | 0.33 | | | | 0.73 | | | | (0.11) | | | | 1.53 | |
| |
| Dividends and/or distributions to shareholders: | | | | | | | | | | | | | | | | | | | | |
| Dividends from net investment income | | | (0.47) | | | | (0.49) | | | | (0.50) | | | | (0.50) | | | | (0.54) | |
| |
| Net asset value, end of period | | | $8.61 | | | | $8.21 | | | | $8.37 | | | | $8.14 | | | | $8.75 | |
| | | | |
| |
| |
| Total Return, at Net Asset Value2 | | | 10.93% | | | | 3.86% | | | | 9.29% | | | | (1.44)% | | | | 20.43% | |
| |
| |
| Ratios/Supplemental Data | | | | | | | | | | | | | | | | | | | | |
| Net assets, end of period (in thousands) | | | $173,862 | | | | $123,831 | | | | $101,239 | | | | $104,708 | | | | $97,255 | |
| |
| Average net assets (in thousands) | | | $146,478 | | | | $127,028 | | | | $93,710 | | | | $116,275 | | | | $54,713 | |
| |
| Ratios to average net assets:3 | | | | | | | | | | | | | | | | | | | | |
| Net investment income | | | 5.33% | | | | 5.74% | | | | 6.54% | | | | 5.79% | | | | 6.28% | |
| Expenses excluding specific expenses listed below | | | 0.81% | | | | 0.71% | | | | 0.56% | | | | 0.51% | | | | 0.50% | |
| Interest and fees from borrowings | | | 0.05% | | | | 0.04% | | | | 0.05% | | | | 0.04% | | | | 0.04% | |
| Interest and fees on short-term floating rate notes issued4 | | | 0.09% | | | | 0.08% | | | | 0.09% | | | | 0.09% | | | | 0.12% | |
| | | | |
| Total expenses | | | 0.95% | | | | 0.83% | | | | 0.70% | | | | 0.64% | | | | 0.66% | |
| Expenses after payments, waivers and/or reimbursements and reduction to custodian expenses | | | 0.95% | | | | 0.83% | | | | 0.70% | | | | 0.63% | | | | 0.65% | |
| |
| Portfolio turnover rate | | | 15% | | | | 21% | | | | 17% | | | | 24% | | | | 10% | |
1. Per share amounts calculated based on the average shares outstanding during the period.
2. Assumes an initial investment on the business day before the first day of the fiscal period, with all dividends and distributions reinvested in additional shares on the reinvestment date, and redemption at the net asset value calculated on the last business day of the fiscal period. Sales charges are not reflected in the total returns. Total returns are not annualized for periods less than one full year. Returns do not reflect the deduction of taxes that a shareholder would pay on fund distributions or the redemption of fund shares.
3. Annualized for periods less than one full year.
4. Interest and fee expense relates to the Fund’s liability for short-term floating rate notes issued in conjunction with inverse floating rate security transactions.
See accompanying Notes to Financial Statements.
54 OPPENHEIMER ROCHESTER CALIFORNIA MUNICIPAL FUND
NOTES TO FINANCIAL STATEMENTS July 31, 2016
1. Organization
Oppenheimer Rochester California Municipal Fund (the “Fund”) is a diversified open-end management investment company registered under the Investment Company Act of 1940 (“1940 Act”), as amended. The Fund’s investment objective is to seek tax-free income. The Fund’s investment adviser is OFI Global Asset Management, Inc. (“OFI Global” or the “Manager”), a wholly-owned subsidiary of OppenheimerFunds, Inc. (“OFI” or the “Sub-Adviser”). The Manager has entered into a sub-advisory agreement with OFI.
The Fund offers Class A, Class C and Class Y shares, and previously offered Class B shares for new purchase through June 29, 2012. Subsequent to that date, no new purchases of Class B shares are permitted, however reinvestment of dividend and/or capital gain distributions and exchanges of Class B shares into and from other Oppenheimer funds are allowed. Class A shares are sold at their offering price, which is normally net asset value plus a front-end sales charge. Class C shares are sold, and Class B shares were sold, without a front-end sales charge but may be subject to a contingent deferred sales charge (“CDSC”). Class Y shares are sold to certain institutional investors or intermediaries without either a front-end sales charge or a CDSC, however, the intermediaries may impose charges on their accountholders who beneficially own Class Y shares. All classes of shares have identical rights and voting privileges with respect to the Fund in general and exclusive voting rights on matters that affect that class alone. Earnings, net assets and net asset value per share may differ due to each class having its own expenses, such as transfer and shareholder servicing agent fees and shareholder communications, directly attributable to that class. Class A, B and C shares have separate distribution and/or service plans under which they pay fees. Class Y shares do not pay such fees. Class B shares will automatically convert to Class A shares 72 months after the date of purchase.
The following is a summary of significant accounting policies followed in the Fund’s preparation of financial statements in accordance with accounting principles generally accepted in the United States (“U.S. GAAP”).
2. Significant Accounting Policies
Security Valuation. All investments in securities are recorded at their estimated fair value, as described in Note 3.
Allocation of Income, Expenses, Gains and Losses. Income, expenses (other than those attributable to a specific class), gains and losses are allocated on a daily basis to each class of shares based upon the relative proportion of net assets represented by such class. Operating expenses directly attributable to a specific class are charged against the operations of that class.
Dividends and Distributions to Shareholders. Dividends and distributions to shareholders, which are determined in accordance with income tax regulations and may differ from U.S. GAAP, are recorded on the ex-dividend date. Income distributions, if any, are declared daily and paid monthly. Capital gain distributions, if any, are declared and paid
55 OPPENHEIMER ROCHESTER CALIFORNIA MUNICIPAL FUND
NOTES TO FINANCIAL STATEMENTS Continued
2. Significant Accounting Policies (Continued)
annually or at other times as deemed necessary by the Manager.
Investment Income. Interest income is recognized on an accrual basis. Discount and premium, which are included in interest income on the Statement of Operations, are amortized or accreted daily.
Custodian Fees. “Custodian fees and expenses” in the Statement of Operations may include interest expense incurred by the Fund on any cash overdrafts of its custodian account during the period. Such cash overdrafts may result from the effects of failed trades in portfolio securities and from cash outflows resulting from unanticipated shareholder redemption activity. The Fund pays interest to its custodian on such cash overdraft at a rate equal to the Prime Rate plus 0.35%. The “Reduction to custodian expenses” line item, if applicable, represents earnings on cash balances maintained by the Fund during the period. Such interest expense and other custodian fees may be paid with these earnings.
Security Transactions. Security transactions are recorded on the trade date. Realized gains and losses on securities sold are determined on the basis of identified cost.
Indemnifications. The Fund’s organizational documents provide current and former Trustees and officers with a limited indemnification against liabilities arising in connection with the performance of their duties to the Fund. In the normal course of business, the Fund may also enter into contracts that provide general indemnifications. The Fund’s maximum exposure under these arrangements is unknown as this would be dependent on future claims that may be made against the Fund. The risk of material loss from such claims is considered remote.
Federal Taxes. The Fund intends to comply with provisions of the Internal Revenue Code applicable to regulated investment companies and to distribute substantially all of its investment company taxable income, including any net realized gain on investments not offset by capital loss carryforwards, if any, to shareholders. Therefore, no federal income or excise tax provision is required. The Fund files income tax returns in U.S. federal and applicable state jurisdictions. The statute of limitations on the Fund’s tax return filings generally remains open for the three preceding fiscal reporting period ends. The Fund has analyzed its tax positions for the fiscal year ended July 31, 2016, including open tax years, and does not believe there are any uncertain tax positions requiring recognition in the Fund’s financial statements.
The tax components of capital shown in the following table represent distribution requirements the Fund must satisfy under the income tax regulations, losses the Fund may be able to offset against income and gains realized in future years and unrealized appreciation or depreciation of securities and other investments for federal income tax purposes.
56 OPPENHEIMER ROCHESTER CALIFORNIA MUNICIPAL FUND
2. Significant Accounting Policies (Continued)
| | | | | | | | | | | | |
Undistributed Net Investment Income | | Undistributed
Long-Term
Gain | | | Accumulated Loss
Carryforward1,2,3,4 | | | Net Unrealized
Depreciation
Based on cost of
Securities and
Other Investments
for Federal Income
Tax Purposes | |
| |
| $9,739,984 | | | $— | | | | $509,435,202 | | | | $55,976,376 | |
1. At period end, the Fund had $509,435,202 of net capital loss carryforward available to offset future realized capital gains, if any, and thereby reduce future taxable gain distributions. Details of the capital loss carryforwards are included in the table below. Capital loss carryovers with no expiration, if any, must be utilized prior to those with expiration dates.
| | | | |
| Expiring | | | |
| |
2017 | | | $ 100,477,817 | |
2018 | | | 223,689,715 | |
2019 | | | 31,408,386 | |
No expiration | | | 153,859,284 | |
| | | | |
Total | | | $ 509,435,202 | |
| | | | |
2. During the reporting period, the Fund utilized $14,063,145 of capital loss carryforward to offset capital gains realized in that fiscal year.
3. During the previous reporting period, the Fund utilized $1,370,587 of capital loss carryforward to offset capital gains realized in that fiscal year.
4. During the reporting period, $33,667,971 of unused capital loss carryforward expired.
Net investment income (loss) and net realized gain (loss) may differ for financial statement and tax purposes. The character of dividends and distributions made during the fiscal year from net investment income or net realized gains are determined in accordance with federal income tax requirements, which may differ from the character of net investment income or net realized gains presented in those financial statements in accordance with U.S. GAAP. Also, due to timing of dividends and distributions, the fiscal year in which amounts are distributed may differ from the fiscal year in which the income or net realized gain was recorded by the Fund.
Accordingly, the following amounts have been reclassified for the reporting period. Net assets of the Fund were unaffected by the reclassifications.
| | | | | | | | |
Reduction to Paid-in Capital | | Reduction
to Accumulated
Net Investment
Income | | | Reduction
to Accumulated Net
Realized Loss on Investments | |
| |
$33,667,971 | | | $421,118 | | | | $34,089,089 | |
The tax character of distributions paid during the reporting periods:
57 OPPENHEIMER ROCHESTER CALIFORNIA MUNICIPAL FUND
NOTES TO FINANCIAL STATEMENTS Continued
2. Significant Accounting Policies (Continued)
| | | | | | | | |
| | | Year Ended
July��31, 2016 | | | Year Ended
July 31, 2015 | |
| |
Distributions paid from: | | | | | | | | |
Exempt-interest dividends | | $ | 67,839,251 | | | $ | 70,117,766 | |
Ordinary income | | | 295,325 | | | | 981,376 | |
| | | | |
Total | | $ | 68,134,576 | | | $ | 71,099,142 | |
| | | | |
The aggregate cost of securities and other investments and the composition of unrealized appreciation and depreciation of securities and other investments for federal income tax purposes at period end are noted in the following table. The primary difference between book and tax appreciation or depreciation of securities and other investments, if applicable, is attributable to the tax deferral of losses or tax realization of financial statement unrealized gain or loss.
| | | | |
Federal tax cost of other investments | | $ | 1,411,533,3561 | |
| | | | |
Gross unrealized appreciation | | $ | 134,934,730 | |
Gross unrealized depreciation | | | (190,911,106) | |
| | | | |
Net unrealized depreciation | | $ | (55,976,376) | |
| | | | |
1. The Federal tax cost of securities does not include cost of $100,111,567 which has otherwise been recognized for financial reporting purposes, related to bonds placed into trusts in conjunction with certain investment transactions. See the Inverse Floating Rate Securities note in Note 4.
Use of Estimates. The preparation of financial statements in conformity with U.S. GAAP requires management to make estimates and assumptions that affect the reported amounts of assets and liabilities and disclosure of contingent assets and liabilities at the date of the financial statements and the reported amounts of increases and decreases in net assets from operations during the reporting period. Actual results could differ from those estimates.
3. Securities Valuation
The Fund calculates the net asset value of its shares as of 4:00 P.M. Eastern time, on each day the New York Stock Exchange (the “Exchange”) is open for trading, except in the case of a scheduled early closing of the Exchange, in which case the Fund will calculate net asset value of the shares as of the scheduled early closing time of the Exchange.
The Fund’s Board has adopted procedures for the valuation of the Fund’s securities and has delegated the day-to-day responsibility for valuation determinations under those procedures to the Manager. The Manager has established a Valuation Committee which is responsible for determining a “fair valuation” for any security for which market quotations are not “readily available.” The Valuation Committee’s fair valuation determinations are subject to review, approval and ratification by the Fund’s Board at its next regularly scheduled meeting covering the calendar quarter in which the fair valuation was determined.
58 OPPENHEIMER ROCHESTER CALIFORNIA MUNICIPAL FUND
3. Securities Valuation (Continued)
Valuation Methods and Inputs
Securities are valued using unadjusted quoted market prices, when available, as supplied primarily by third party pricing services or dealers.
The following methodologies are used to determine the market value or the fair value of the types of securities described below:
Securities traded on a registered U.S. securities exchange (including exchange-traded derivatives other than futures and futures options) are valued based on the last sale price of the security reported on the principal exchange on which it is traded, prior to the time when the Fund’s assets are valued. In the absence of a sale, the security is valued at the mean between the bid and asked price on the principal exchange or, if not available from the principal exchange, obtained from two dealers. If bid and asked prices are not available from either the exchange or two dealers, the security is valued by using one of the following methodologies (listed in order of priority): (1) a bid from the principal exchange, (2) the mean between the bid and asked price as provided by a single dealer, or (3) a bid from a single dealer. A security of a foreign issuer traded on a foreign exchange, but not listed on a registered U.S. securities exchange, is valued based on the last sale price on the principal exchange on which the security is traded, as identified by the third party pricing service used by the Manager, prior to the time when the Fund’s assets are valued. If the last sale price is unavailable, the security is valued at the most recent official closing price on the principal exchange on which it is traded. If the last sales price or official closing price for a foreign security is not available, the security is valued at the mean between the bid and asked price per the exchange or, if not available from the exchange, obtained from two dealers. If bid and asked prices are not available from either the exchange or two dealers, the security is valued by using one of the following methodologies (listed in order of priority): (1) a bid from the exchange, (2) the mean between the bid and asked price as provided by a single dealer, or (3) a bid from a single dealer.
Shares of a registered investment company that are not traded on an exchange are valued at that investment company’s net asset value per share.
Corporate and government debt securities (of U.S. or foreign issuers) and municipal debt securities, event-linked bonds, loans, mortgage-backed securities, collateralized mortgage obligations, and asset-backed securities are valued at the mean between the “bid” and “asked” prices utilizing evaluated prices obtained from third party pricing services or broker-dealers who may use matrix pricing methods to determine the evaluated prices.
Short-term money market type debt securities with a remaining maturity of sixty days or less are valued at cost adjusted by the amortization of discount or premium to maturity (amortized cost), which approximates market value. Short-term debt securities with a remaining maturity in excess of sixty days are valued at the mean between the “bid” and “asked” prices utilizing evaluated prices obtained from third party pricing services or broker-dealers.
A description of the standard inputs that may generally be considered by the third party pricing vendors in determining their evaluated prices is provided below.
59 OPPENHEIMER ROCHESTER CALIFORNIA MUNICIPAL FUND
NOTES TO FINANCIAL STATEMENTS Continued
3. Securities Valuation (Continued)
| | |
| Security Type | | Standard inputs generally considered by third-party pricing vendors |
|
| Corporate debt, government debt, municipal, mortgage-backed and asset-backed securities | | Reported trade data, broker-dealer price quotations, benchmark yields, issuer spreads on comparable securities, the credit quality, yield, maturity, and other appropriate factors. |
|
| Loans | | Information obtained from market participants regarding reported trade data and broker-dealer price quotations. |
|
| Event-linked bonds | | Information obtained from market participants regarding reported trade data and broker-dealer price quotations. |
If a market value or price cannot be determined for a security using the methodologies described above, or if, in the “good faith” opinion of the Manager, the market value or price obtained does not constitute a “readily available market quotation,” or a significant event has occurred that would materially affect the value of the security, the security is fair valued either (i) by a standardized fair valuation methodology applicable to the security type or the significant event as previously approved by the Valuation Committee and the Fund’s Board or (ii) as determined in good faith by the Manager’s Valuation Committee. The Valuation Committee considers all relevant facts that are reasonably available, through either public information or information available to the Manager, when determining the fair value of a security. Fair value determinations by the Manager are subject to review, approval and ratification by the Fund’s Board at its next regularly scheduled meeting covering the calendar quarter in which the fair valuation was determined. Those fair valuation standardized methodologies include, but are not limited to, valuing securities at the last sale price or initially at cost and subsequently adjusting the value based on: changes in company specific fundamentals, changes in an appropriate securities index, or changes in the value of similar securities which may be further adjusted for any discounts related to security-specific resale restrictions. When possible, such methodologies use observable market inputs such as unadjusted quoted prices of similar securities, observable interest rates, currency rates and yield curves. The methodologies used for valuing securities are not necessarily an indication of the risks associated with investing in those securities nor can it be assured that the Fund can obtain the fair value assigned to a security if it were to sell the security.
To assess the continuing appropriateness of security valuations, the Manager, or its third party service provider who is subject to oversight by the Manager, regularly compares prior day prices, prices on comparable securities, and sale prices to the current day prices and challenges those prices exceeding certain tolerance levels with the third party pricing service or broker source. For those securities valued by fair valuations, whether through a standardized fair valuation methodology or a fair valuation determination, the Valuation Committee reviews and affirms the reasonableness of the valuations based on such methodologies and fair valuation determinations on a regular basis after considering all relevant information that is reasonably available.
Classifications
Each investment asset or liability of the Fund is assigned a level at measurement date based
60 OPPENHEIMER ROCHESTER CALIFORNIA MUNICIPAL FUND
3. Securities Valuation (Continued)
on the significance and source of the inputs to its valuation. Various data inputs are used in determining the value of each of the Fund’s investments as of the reporting period end. These data inputs are categorized in the following hierarchy under applicable financial accounting standards:
1) Level 1-unadjusted quoted prices in active markets for identical assets or liabilities (including securities actively traded on a securities exchange)
2) Level 2-inputs other than unadjusted quoted prices that are observable for the asset or liability (such as unadjusted quoted prices for similar assets and market corroborated inputs such as interest rates, prepayment speeds, credit risks, etc.)
3) Level 3-significant unobservable inputs (including the Manager’s own judgments about assumptions that market participants would use in pricing the asset or liability).
The inputs used for valuing securities are not necessarily an indication of the risks associated with investing in those securities.
The table below categorizes amounts that are included in the Fund’s Statement of Assets and Liabilities at period end based on valuation input level:
| | | | | | | | | | | | | | | | |
| | | Level 1— Unadjusted Quoted Prices | | | Level 2— Other Significant Observable Inputs | | | Level 3— Significant Unobservable Inputs | | | Value | |
| |
| Assets Table | | | | | | | | | | | | | | | | |
| Investments, at Value: | | | | | | | | | | | | | | | | |
| Municipal Bonds and Notes | | | | | | | | | | | | | | | | |
California | | $ | — | | | $ | 1,283,214,037 | | | $ | 20 | | | $ | 1,283,214,057 | |
U.S. Possessions | | | — | | | | 172,454,490 | | | | — | | | | 172,454,490 | |
| | | | |
| Total Assets | | $ | — | | | $ | 1,455,668,527 | | | $ | 20 | | | $ | 1,455,668,547 | |
| | | | |
Forward currency exchange contracts and futures contracts, if any, are reported at their unrealized appreciation/depreciation at measurement date, which represents the change in the contract’s value from trade date. All additional assets and liabilities included in the above table are reported at their market value at measurement date.
4. Investments and Risks
Inverse Floating Rate Securities. The Fund invests in inverse floating rate securities that pay interest at a rate that varies inversely with short-term interest rates. Because inverse floating rate securities are leveraged instruments, the value of an inverse floating rate security will change more significantly in response to changes in interest rates and other market fluctuations than the market value of a conventional fixed-rate municipal security of similar maturity and credit quality, including the municipal bond underlying an inverse floating rate security.
An inverse floating rate security is created as part of a financial transaction referred to as a “tender option bond” transaction. In most cases, in a tender option bond transaction the Fund
61 OPPENHEIMER ROCHESTER CALIFORNIA MUNICIPAL FUND
NOTES TO FINANCIAL STATEMENTS Continued
4. Investments and Risks (Continued)
sells a fixed-rate municipal bond (the “underlying municipal bond”) to a trust (the “Trust”). The Trust then issues and sells short-term floating rate securities with a fixed principal amount representing a senior interest in the underlying municipal bond to third parties and a residual, subordinate interest in the underlying municipal bond (referred to as an “inverse floating rate security”) to the Fund. The interest rate on the short-term floating rate securities resets periodically, usually weekly, to a prevailing market rate and holders of these securities are granted the option to tender their securities back to the Trust for repurchase at their principal amount plus accrued interest thereon (the “purchase price”) periodically, usually daily or weekly. A remarketing agent for the Trust is required to attempt to re-sell any tendered short-term floating rate securities to new investors for the purchase price. If the remarketing agent is unable to successfully re-sell the tendered short-term floating rate securities, a liquidity provider to the Trust must contribute cash to the Trust to ensure that the tendering holders receive the purchase price of their securities on the repurchase date.
Because holders of the short-term floating rate securities are granted the right to tender their securities to the Trust for repurchase at frequent intervals for the purchase price, with such payment effectively guaranteed by the liquidity provider, the securities generally bear short-term rates of interest commensurate with money market instruments. When interest is paid on the underlying municipal bond to the Trust, such proceeds are first used to pay the Trust’s administrative expenses and accrued interest to holders of the short-term floating rate securities, with any remaining amounts being paid to the Fund, as the holder of the inverse floating rate security. Accordingly, the amount of such interest on the underlying municipal bond paid to the Fund is inversely related to the rate of interest on the short-term floating rate securities. Additionally, because the principal amount of the short-term floating rate securities is fixed and is not adjusted in response to changes in the market value of the underlying municipal bond, any change in the market value of the underlying municipal bond is reflected entirely in a change to the value of the inverse floating rate security.
Typically, the terms of an inverse floating rate security grant certain rights to the Fund, as holder. For example, the Fund typically has the right upon request to require that the Trust compel a tender of the short-term floating rate securities to facilitate the Fund’s acquisition of the underlying municipal bond. Following such a request, the Fund pays the Trust the purchase price of the short-term floating rate securities and a specified portion of any market value gain on the underlying municipal bond since its deposit into the Trust, which the Trust uses to redeem the short-term floating rate securities. The Trust then distributes the underlying municipal bond to the Fund. Through the exercise of this right, the Fund can voluntarily terminate or “collapse” the Trust, terminate its investment in the related inverse floating rate security and obtain the underlying municipal bond. Additionally, the Fund also typically has the right to exchange with the Trust (i) a principal amount of short-term floating rate securities held by the Fund for a corresponding additional principal amount of the inverse floating rate security or (ii) a principal amount of the inverse floating rate security held by the Fund for a corresponding additional principal amount of short-term floating rate securities (which are typically then sold to other investors). Through the exercise of this right, the Fund may increase (or decrease) the principal amount of short-term floating rate securities outstanding, thereby
62 OPPENHEIMER ROCHESTER CALIFORNIA MUNICIPAL FUND
4. Investments and Risks (Continued)
increasing (or decreasing) the amount of leverage provided by the short-term floating rate securities to the Fund’s investment exposure to the underlying municipal bond.
The Fund’s investments in inverse floating rate securities involve certain risks. As short-term interest rates rise, an inverse floating rate security produces less current income (and, in extreme cases, may pay no income) and as short-term interest rates fall, an inverse floating rate security produces more current income. Thus, if short-term interest rates rise after the issuance of the inverse floating rate security, any yield advantage is reduced or eliminated. All inverse floating rate securities entail some degree of leverage represented by the outstanding principal amount of the related short-term floating rate securities, relative to the par value of the underlying municipal bond. The value of, and income earned on, an inverse floating rate security that has a higher degree of leverage will fluctuate more significantly in response to changes in interest rates and to changes in the market value of the related underlying municipal bond than that of an inverse floating rate security with a lower degree of leverage, and is more likely to be eliminated entirely under adverse market conditions. Changes in the value of an inverse floating rate security will also be more significant than changes in the market value of the related underlying municipal bond because the leverage provided by the related short-term floating rate securities increases the sensitivity of an inverse floating rate security to changes in interest rates and to the market value of the underlying municipal bond. An inverse floating rate security can be expected to underperform fixed-rate municipal bonds when the difference between long-term and short-term interest rates is decreasing (or is already small) or when long-term interest rates are rising, but can be expected to outperform fixed-rate municipal bonds when the difference between long-term and short-term interest rates is increasing (or is already large) or when long-term interest rates are falling. Additionally, a tender option bond transaction typically provides for the automatic termination or “collapse” of a Trust upon the occurrence of certain adverse events, usually referred to as “mandatory tender events” or “tender option termination events.” These events may include, among others, a credit ratings downgrade of the underlying municipal bond below a specified level, a decrease in the market value of the underlying municipal bond below a specified amount, a bankruptcy of the liquidity provider or the inability of the remarketing agent to re-sell to new investors short-term floating rate securities that have been tendered for repurchase by holders thereof. Following the occurrence of such an event, the underlying municipal bond is generally sold for current market value and the proceeds distributed to holders of the short-term floating rate securities and inverse floating rate security, with the holder of the inverse floating rate security (the Fund) generally receiving the proceeds of such sale only after the holders of the short-term floating rate securities have received proceeds equal to the purchase price of their securities (and the liquidity provider is generally required to contribute cash to the Trust only in an amount sufficient to ensure that the holders of the short-term floating rate securities receive the purchase price of their securities in connection with such termination of the Trust). Following the occurrence of such events, the Fund could potentially lose the entire amount of its investment in the inverse floating rate security.
Finally, the Fund may enter into shortfall/reimbursement agreements with the liquidity provider of certain tender option bond transactions in connection with certain inverse floating
63 OPPENHEIMER ROCHESTER CALIFORNIA MUNICIPAL FUND
NOTES TO FINANCIAL STATEMENTS Continued
4. Investments and Risks (Continued)
rate securities held by the Fund. These agreements commit the Fund to reimburse the liquidity provider to the extent that the liquidity provider must provide cash to a Trust, including following the termination of a Trust resulting from the occurrence of a “mandatory tender event.” In connection with the occurrence of such an event and the termination of the Trust triggered thereby, the shortfall/reimbursement agreement will make the Fund liable for the amount of the negative difference, if any, between the liquidation value of the underlying municipal bond and the purchase price of the short-term floating rate securities issued by the Trust. Under the standard terms of a tender option bond transaction, absent such a shortfall/ reimbursement agreement, the Fund, as holder of the inverse floating rate security, would not be required to make such a reimbursement payment to the liquidity provider. The Manager monitors the Fund’s potential exposure with respect to these agreements on a daily basis and intends to take action to terminate the Fund’s investment in related inverse floating rate securities, if it deems it appropriate to do so. At period end, the Fund’s maximum exposure under such agreements is estimated at $39,355,000.
When the Fund creates an inverse floating rate security in a tender option bond transaction by selling an underlying municipal bond to a Trust, the transaction is considered a secured borrowing for financial reporting purposes. As a result of such accounting treatment, the Fund includes the underlying municipal bond on its Statement of Investments and as an asset on its Statement of Assets and Liabilities (but does not separately include the related inverse floating rate security on either). The Fund also includes a liability on its Statement of Assets and Liabilities equal to the outstanding principal amount and accrued interest on the related short-term floating rate securities issued by the Trust. Interest on the underlying municipal bond is recorded as investment income on the Fund’s Statement of Operations, while interest payable on the related short-term floating rate securities is recorded as interest expense. At period end, municipal bond holdings with a value of $191,189,422 shown on the Fund’s Statement of Investments are held by such Trusts and serve as the underlying municipal bonds for the related $102,420,000 in short-term floating rate securities issued and outstanding at that date.
At period end, the inverse floating rate securities associated with tender option bond transactions accounted for as secured borrowings were as follows:
| | | | | | | | | | | | | | | | |
Principal Amount | | | Inverse Floater1 | | Coupon Rate2 | | | Maturity Date | | | Value | |
| | |
| | $ 2,500,000 | | | Anaheim, CA Public Financing Authority Tender Option Bond Series 2015-XF2139 Trust3 | | | 15.197% | | | | 10/1/39 | | | $ | 3,627,750 | |
| | 5,000,000 | | | CA Dept. of Water Resources (Center Valley) Tender Option Bond Series 2015-XF2030 Trust3 | | | 8.033 | | | | 12/1/35 | | | | 6,869,900 | |
| | 7,110,000 | | | CA Health Facilities Financing Authority (Providence Health & Services) Tender Option Bond Series 2015-XF0036 Trust | | | 8.520 | | | | 10/1/39 | | | | 9,140,545 | |
| | 3,375,000 | | | CA Health Facilities Financing Authority (SHlth / EBPC / EMC / MCHlth / MPHS / PAMFHCR&E / SCHosp / SCVH / SEBH / SGMF Obligated Group) Tender Option Bond Series 2015-XF0236 Trust | | | 19.394 | | | | 8/15/31 | | | | 6,050,700 | |
64 OPPENHEIMER ROCHESTER CALIFORNIA MUNICIPAL FUND
4. Investments and Risks (Continued)
| | | | | | | | | | | | | | | | |
Principal
Amount | | | Inverse Floater1 | | Coupon
Rate2 | | | Maturity
Date | | | Value | |
| | |
| | $ 7,500,000 | | | East Bay, CA Municipal Utility District (Water System) Tender Option Bond Series 2015-XF2026 Trust3 | | | 7.599% | | | | 6/1/36 | | | $ | 9,781,050 | |
| | 1,290,000 | | | Grossmont, CA Union High School District Tender Option Bond Series 2015 XF-2141 Trust3 | | | 13.244 | | | | 8/1/30 | | | | 2,040,909 | |
| | 1,225,000 | | | Grossmont, CA Union High School District Tender Option Bond Series 2015-XF2141-2 Trust3 | | | 13.267 | | | | 8/1/31 | | | | 1,939,420 | |
| | 4,735,000 | | | Los Angeles, CA Dept. of Airports (Los Angeles International Airport) Tender Option Bond Series 2015 XF-0017 Trust | | | 11.352 | | | | 5/15/24 | | | | 5,872,205 | |
| | 3,335,000 | | | Los Angeles, CA Dept. of Airports Tender Option Bond Series 2015-XF0017-2 Trust | | | 11.669 | | | | 5/15/26 | | | | 4,136,867 | |
| | 3,665,000 | | | Los Angeles, CA Dept. of Airports Tender Option Bond Series 2015-XF0017-3 Trust | | | 11.679 | | | | 5/15/27 | | | | 4,538,919 | |
| | 3,365,000 | | | Los Angeles, CA Dept. of Airports Tender Option Bond Series 2015-XF0017-4 Trust | | | 11.674 | | | | 5/15/28 | | | | 4,157,558 | |
| | 3,405,000 | | | Los Angeles, CA Dept. of Airports Tender Option Bond Series 2015-XF2022 Trust3 | | | 11.785 | | | | 5/15/25 | | | | 4,224,992 | |
| | 1,500,000 | | | Los Angeles, CA Dept. of Water & Power Tender Option Bond Series 2015 XF-0018 Trust | | | 8.199 | | | | 7/1/34 | | | | 1,830,120 | |
| | 6,000,000 | | | Los Angeles, CA Dept. of Water & Power Tender Option Bond Series 2015 XF-0018-2 Trust | | | 8.199 | | | | 7/1/38 | | | | 7,326,600 | |
| | 8,150,000 | | | Los Angeles, CA Harbor Dept. Tender Option Bond Series 2015-XF0035 Trust | | | 8.088 | | | | 8/1/34 | | | | 10,293,287 | |
| | 5,000,000 | | | San Marcos, CA Unified School District Tender Option Bond Series 2015-XF2029 Trust3 | | | 8.033 | | | | 8/1/31 | | | | 6,938,600 | |
| | | | | | | | | | | | | | | | |
| | | | | | | | | | | | | | $ | 88,769,422 | |
| | | | | | | | | | | | | | | | |
1. For a list of abbreviations used in the Inverse Floater table see the Portfolio Abbreviations table at the end of the Statement of Investments.
2. Represents the current interest rate for the inverse floating rate security.
3. Represents an inverse floating rate security that is subject to a shortfall/reimbursement agreement.
The Fund may also purchase an inverse floating rate security created as part of a tender option bond transaction not initiated by the Fund when a third party, such as a municipal issuer or financial institution, transfers an underlying municipal bond to a Trust. For financial reporting purposes, the Fund includes the inverse floating rate security related to such transaction on its Statement of Investments and as an asset on its Statement of Assets and Liabilities, and interest on the security is recorded as investment income on the Fund’s Statement of Operations.
The Fund may invest in inverse floating rate securities with any degree of leverage (as measured by the outstanding principal amount of related short-term floating rate securities). However, the Fund may only expose up to 20% of its total assets to the effects of leverage from its investments in inverse floating rate securities. This limitation is measured by comparing the aggregate principal amount of the short-term floating rate securities that are related to the inverse floating rate securities held by the Fund to the total assets of the Fund.
65 OPPENHEIMER ROCHESTER CALIFORNIA MUNICIPAL FUND
NOTES TO FINANCIAL STATEMENTS Continued
4. Investments and Risks (Continued)
The Fund’s exposure to the effects of leverage from its investments in inverse floating rate securities amounts to $102,420,000 or 6.91% of its total assets at period end.
Securities on a When-Issued or Delayed Delivery Basis. The Fund may purchase securities on a “when-issued” basis, and may purchase or sell securities on a “delayed delivery” basis. “When-issued” or “delayed delivery” refers to securities whose terms and indenture are available and for which a market exists, but which are not available for immediate delivery. Delivery and payment for securities that have been purchased by the Fund on a when-issued basis normally takes place within six months and possibly as long as two years or more after the trade date. During this period, such securities do not earn interest, are subject to market fluctuation and may increase or decrease in value prior to their delivery. The purchase of securities on a when-issued basis may increase the volatility of the Fund’s net asset value to the extent the Fund executes such transactions while remaining substantially fully invested. When the Fund engages in when-issued or delayed delivery transactions, it relies on the buyer or seller, as the case may be, to complete the transaction. Their failure to do so may cause the Fund to lose the opportunity to obtain or dispose of the security at a price and yield it considers advantageous. The Fund may also sell securities that it purchased on a when-issued basis or forward commitment prior to settlement of the original purchase.
At period end, the Fund had purchased securities issued on a when-issued or delayed delivery basis and sold securities issued on a delayed delivery basis as follows:
| | | | |
| | | When-Issued or
Delayed Delivery
Basis Transactions | |
| |
| Sold securities | | | 1,725,424 | |
Credit Risk. The Fund invests in high-yield, non-investment-grade bonds, which may be subject to a greater degree of credit risk. Credit risk relates to the ability of the issuer to meet interest or principal payments or both as they become due. The Fund may acquire securities that have missed an interest payment, and is not obligated to dispose of securities whose issuers or underlying obligors subsequently miss an interest payment.
Information concerning securities not accruing interest at period end is as follows:
| | | | | | |
| | | | | | |
| Cost | | $48,468,717 | |
| Market Value | | $31,879,524 | |
| Market Value as % of Net Assets | | 2.34% | |
The Fund has entered into forbearance agreements with certain obligors under which the Fund has agreed to temporarily forego receipt of the original principal or coupon interest rates. At period end, securities with an aggregate market value of $30,471,091, representing 2.24% of the Fund’s net assets, were subject to these forbearance agreements.
Concentration Risk. The Fund invests in obligations of issuers within certain states and
66 OPPENHEIMER ROCHESTER CALIFORNIA MUNICIPAL FUND
4. Investments and Risks (Continued)
U.S. territories. Risks may arise from geographic concentration in any state, commonwealth or territory, such as Puerto Rico, the U.S. Virgin Islands, Guam or the Northern Mariana Islands. Certain economic, regulatory or political developments occurring in the state, commonwealth or territory such as ongoing developments in Puerto Rico may impair the ability of certain issuers of municipal securities to pay principal and interest on their obligations.
5. Market Risk Factors
The Fund’s investments in securities and/or financial derivatives may expose the Fund to various market risk factors:
Commodity Risk. Commodity risk relates to the change in value of commodities or commodity indexes as they relate to increases or decreases in the commodities market. Commodities are physical assets that have tangible properties. Examples of these types of assets are crude oil, heating oil, metals, livestock, and agricultural products.
Credit Risk. Credit risk relates to the ability of the issuer of debt to meet interest and principal payments, or both, as they come due. In general, lower-grade, higher-yield debt securities are subject to credit risk to a greater extent than lower-yield, higher-quality securities.
Equity Risk. Equity risk relates to the change in value of equity securities as they relate to increases or decreases in the general market.
Foreign Exchange Rate Risk. Foreign exchange rate risk relates to the change in the U.S. dollar value of a security held that is denominated in a foreign currency. The U.S. dollar value of a foreign currency denominated security will decrease as the dollar appreciates against the currency, while the U.S. dollar value will increase as the dollar depreciates against the currency.
Interest Rate Risk. Interest rate risk refers to the fluctuations in value of fixed-income securities resulting from the inverse relationship between price and yield. For example, an increase in general interest rates will tend to reduce the market value of already issued fixed-income investments, and a decline in general interest rates will tend to increase their value. In addition, debt securities with longer maturities, which tend to have higher yields, are subject to potentially greater fluctuations in value from changes in interest rates than obligations with shorter maturities.
Volatility Risk. Volatility risk refers to the magnitude of the movement, but not the direction of the movement, in a financial instrument’s price over a defined time period. Large increases or decreases in a financial instrument’s price over a relative time period typically indicate greater volatility risk, while small increases or decreases in its price typically indicate lower volatility risk.
6. Shares of Beneficial Interest
The Fund has authorized an unlimited number of $0.001 par value shares of beneficial interest of each class. Transactions in shares of beneficial interest were as follows:
67 OPPENHEIMER ROCHESTER CALIFORNIA MUNICIPAL FUND
NOTES TO FINANCIAL STATEMENTS Continued
6. Shares of Beneficial Interest (Continued)
| | | | | | | | | | | | | | | | |
| | | Year Ended July 31, 2016 | | | Year Ended July 31, 2015 | |
| | | Shares | | | Amount | | | Shares | | | Amount | |
| |
| Class A | | | | | | | | | | | | | | | | |
| Sold | | | 18,929,540 | | | $ | 159,130,441 | | | | 19,476,340 | | | $ | 165,223,553 | |
| Dividends and/or distributions reinvested | | | 4,469,939 | | | | 37,437,161 | | | | 4,669,160 | | | | 39,546,142 | |
| Redeemed | | | (22,886,962) | | | | (191,692,964) | | | | (23,955,908) | | | | (201,691,148) | |
| | | | |
| Net increase | | | 512,517 | | | $ | 4,874,638 | | | | 189,592 | | | $ | 3,078,547 | |
| | | | |
|
| |
| Class B | | | | | | | | | | | | | | | | |
| Sold | | | 23,323 | | | $ | 196,440 | | | | 13,802 | | | $ | 117,831 | |
| Dividends and/or distributions reinvested | | | 9,445 | | | | 79,072 | | | | 16,290 | | | | 138,272 | |
| Redeemed | | | (188,306) | | | | (1,566,151) | | | | (162,936) | | | | (1,381,386) | |
| | | | |
| Net decrease | | | (155,538) | | | $ | (1,290,639) | | | | (132,844) | | | $ | (1,125,283) | |
| | | | |
|
| |
| Class C | | | | | | | | | | | | | | | | |
| Sold | | | 4,689,605 | | | $ | 39,169,511 | | | | 4,204,580 | | | $ | 35,520,654 | |
| Dividends and/or distributions reinvested | | | 1,021,968 | | | | 8,521,425 | | | | 1,076,760 | | | | 9,088,104 | |
| Redeemed | | | (6,414,434) | | | | (53,565,060) | | | | (6,172,432) | | | | (51,818,763) | |
| | | | |
| Net decrease | | | (702,861) | | | $ | (5,874,124) | | | | (891,092) | | | $ | (7,210,005) | |
| | | | |
|
| |
| Class Y | | | | | | | | | | | | | | | | |
| Sold | | | 10,785,100 | | | $ | 90,686,882 | | | | 8,503,951 | | | $ | 72,117,115 | |
| Dividends and/or distributions reinvested | | | 589,687 | | | | 4,945,261 | | | | 532,239 | | | | 4,508,490 | |
| Redeemed | | | (6,253,910) | | | | (52,577,406) | | | | (6,057,304) | | | | (51,055,368) | |
| | | | |
| Net increase | | | 5,120,877 | | | $ | 43,054,737 | | | | 2,978,886 | | | $ | 25,570,237 | |
| | | | |
7. Purchases and Sales of Securities
The aggregate cost of purchases and proceeds from sales of securities, other than short-term obligations, for the reporting period were as follows:
| | | | | | | | |
| | | Purchases | | | Sales | |
| |
| Investment securities | | $ | 228,012,907 | | | $ | 209,191,313 | |
8. Fees and Other Transactions with Affiliates
Management Fees. Under the investment advisory agreement, the Fund pays the Manager a management fee based on the daily net assets of the Fund at an annual rate as shown in the following table:
| | | | |
| Fee Schedule | | | |
| |
| Up to $200 million | | | 0.60% | |
| Next $100 million | | | 0.55 | |
| Next $200 million | | | 0.50 | |
| Next $250 million | | | 0.45 | |
| Next $250 million | | | 0.40 | |
| Next $4 billion | | | 0.35 | |
| Over $5 billion | | | 0.33 | |
68 OPPENHEIMER ROCHESTER CALIFORNIA MUNICIPAL FUND
8. Fees and Other Transactions with Affiliates (Continued)
The Fund’s effective management fee for the reporting period was 0.45% of average annual net assets before any applicable waivers.
Sub-Adviser Fees. The Manager has retained the Sub-Adviser to provide the day-to-day portfolio management of the Fund. Under the Sub-Advisory Agreement, the Manager pays the Sub-Adviser an annual fee in monthly installments, equal to a percentage of the investment management fee collected by the Manager from the Fund, which shall be calculated after any investment management fee waivers. The fee paid to the Sub-Adviser is paid by the Manager, not by the Fund.
Transfer Agent Fees. OFI Global (the “Transfer Agent”) serves as the transfer and shareholder servicing agent for the Fund. The Fund pays the Transfer Agent a fee based on annual net assets. Fees incurred and average net assets for each class with respect to these services are detailed in the Statement of Operations and Financial Highlights, respectively.
Sub-Transfer Agent Fees. The Transfer Agent has retained Shareholder Services, Inc., a wholly-owned subsidiary of OFI (the “Sub-Transfer Agent”), to provide the day-to-day transfer agent and shareholder servicing of the Fund. Under the Sub-Transfer Agency Agreement, the Transfer Agent pays the Sub-Transfer Agent an annual fee in monthly installments, equal to a percentage of the transfer agent fee collected by the Transfer Agent from the Fund, which shall be calculated after any applicable fee waivers. The fee paid to the Sub-Transfer Agent is paid by the Transfer Agent, not by the Fund.
Trustees’ Compensation. The Fund has adopted an unfunded retirement plan (the “Plan”) for the Fund’s Independent Trustees. Benefits are based on years of service and fees paid to each Trustee during their period of service. The Plan was frozen with respect to adding new participants effective December 31, 2006 (the “Freeze Date”) and existing Plan Participants as of the Freeze Date will continue to receive accrued benefits under the Plan. Active
Independent Trustees as of the Freeze Date have each elected a distribution method with respect to their benefits under the Plan. During the reporting period, the Fund’s projected benefit obligations, payments to retired Trustees and accumulated liability were as follows:
| | | | |
| Projected Benefit Obligations Increased | | $ | — | |
| Payments Made to Retired Trustees | | | 14,088 | |
| Accumulated Liability as of July 31, 2016 | | | 97,004 | |
The Fund’s Board of Trustees (“Board”) has adopted a compensation deferral plan for Independent Trustees that enables Trustees to elect to defer receipt of all or a portion of the annual compensation they are entitled to receive from the Fund. For purposes of determining the amount owed to the Trustee under the plan, deferred amounts are treated as though equal dollar amounts had been invested in shares of the Fund or in other Oppenheimer funds selected by the Trustee. The Fund purchases shares of the funds selected for deferral by the Trustee in amounts equal to his or her deemed investment, resulting in a Fund asset equal
69 OPPENHEIMER ROCHESTER CALIFORNIA MUNICIPAL FUND
NOTES TO FINANCIAL STATEMENTS Continued
8. Fees and Other Transactions with Affiliates (Continued)
to the deferred compensation liability. Such assets are included as a component of “Other” within the asset section of the Statement of Assets and Liabilities. Deferral of Trustees’ fees under the plan will not affect the net assets of the Fund and will not materially affect the Fund’s assets, liabilities or net investment income per share. Amounts will be deferred until distributed in accordance with the compensation deferral plan.
Distribution and Service Plan (12b-1) Fees. Under its General Distributor’s Agreement with the Fund, OppenheimerFunds Distributor, Inc. (the “Distributor”) acts as the Fund’s principal underwriter in the continuous public offering of the Fund’s classes of shares.
Service Plan for Class A Shares. The Fund has adopted a Service Plan (the “Plan”) for Class A shares pursuant to Rule 12b-1 under the 1940 Act. Under the Plan, the Fund reimburses the Distributor for a portion of its costs incurred for services provided to accounts that hold Class A shares. Reimbursement is made periodically at an annual rate of up to 0.25% of the daily net assets of Class A shares of the Fund. The Distributor currently uses all of those fees to pay dealers, brokers, banks and other financial institutions periodically for providing personal service and maintenance of accounts of their customers that hold Class A shares. Any unreimbursed expenses the Distributor incurs with respect to Class A shares in any fiscal year cannot be recovered in subsequent periods. Fees incurred by the Fund under the Plan are detailed in the Statement of Operations.
Distribution and Service Plans for Class B and Class C Shares. The Fund has adopted Distribution and Service Plans (the “Plans”) for Class B and Class C shares pursuant to Rule 12b-1 under the 1940 Act to compensate the Distributor for distributing those share classes, maintaining accounts and providing shareholder services. Under the Plans, the Fund pays the Distributor an annual asset-based sales charge of 0.75% on Class B and Class C shares’ daily net assets. The Fund also pays a service fee under the Plans at an annual rate of 0.25% of daily net assets. The Plans continue in effect from year to year only if the Fund’s Board of Trustees votes annually to approve their continuance at an in person meeting called for that purpose. Fees incurred by the Fund under the Plans are detailed in the Statement of Operations.
Sales Charges. Front-end sales charges and CDSC do not represent expenses of the Fund. They are deducted from the proceeds of sales of Fund shares prior to investment or from redemption proceeds prior to remittance, as applicable. The sales charges retained by the Distributor from the sale of shares and the CDSC retained by the Distributor on the redemption of shares is shown in the following table for the period indicated.
70 OPPENHEIMER ROCHESTER CALIFORNIA MUNICIPAL FUND
8. Fees and Other Transactions with Affiliates (Continued)
| | | | | | | | | | | | | | | | |
| Year Ended | | Class A
Front-End
Sales Charges
Retained by
Distributor | | | Class A
Contingent
Deferred
Sales Charges
Retained by
Distributor | | | Class B
Contingent
Deferred
Sales Charges
Retained by
Distributor | | | Class C
Contingent
Deferred
Sales Charges
Retained by
Distributor | |
| July 31, 2016 | | | $157,211 | | | | $39,719 | | | | $2,464 | | | | $13,467 | |
9. Borrowings and Other Financing
Borrowings. The Fund can borrow money from banks in amounts up to one third of its total assets (including the amount borrowed) less all liabilities and indebtedness other than borrowings (meaning that the value of those assets must be at least 300% of the amount borrowed). The Fund can use those borrowings for investment-related purposes such as purchasing portfolio securities. The Fund also may borrow to meet redemption obligations or for temporary and emergency purposes. When the Fund invests borrowed money in portfolio securities, it is using a speculative investment technique known as leverage and changes in the value of the Fund’s investments will have a larger effect on its share price than if it did not borrow because of the effect of leverage.
The Fund can also use the borrowings for other investment-related purposes, including in connection with the Fund’s inverse floater investments as discussed in Note 4. The Fund may use the borrowings to reduce the leverage amount of, or unwind or “collapse” trusts that issued “inverse floaters” owned by the Fund, or in circumstances in which the Fund has entered into a shortfall and forbearance agreement with the sponsor of the inverse floater trust to meet the Fund’s obligation to reimburse the sponsor of the inverse floater for the difference between the liquidation value of the underlying bond and the amount due to holders of the short-term floating rate notes issued by the Trust. See the discussion in Note 4 (Inverse Floating Rate Securities) for additional information.
The Fund will pay interest and may pay other fees in connection with loans. If the Fund does borrow, it will be subject to greater expenses than funds that do not borrow. The interest on borrowed money and the other fees incurred in conjunction with loans are an expense that might reduce the Fund’s yield and return. Expenses incurred by the Fund with respect to interest on borrowings and commitment fees are disclosed separately or as other expenses on the Statement of Operations.
The Fund entered into a Revolving Credit and Security Agreement (the “Agreement”) with conduit lenders and Citibank N.A. which enables it to participate with certain other Oppenheimer funds in a committed, secured borrowing facility that permits borrowings of up to $2.5 billion, collectively, by the Oppenheimer Rochester Funds. To secure the loan, the Fund pledges investment securities in accordance with the terms of the Agreement. Securities held in collateralized accounts to cover these borrowings are noted in the Statement of Investments. Interest is charged to the Fund, based on its borrowings, at current commercial paper issuance rates (0.5739% at period end). The Fund pays additional fees monthly to its lender on its outstanding borrowings to manage and administer the facility and is allocated
71 OPPENHEIMER ROCHESTER CALIFORNIA MUNICIPAL FUND
NOTES TO FINANCIAL STATEMENTS Continued
9. Borrowings and Other Financing (Continued)
its pro-rata share of an annual structuring fee and ongoing commitment fees both of which are based on the total facility size. Total fees and interest that are included in expenses on the Fund’s Statement of Operations related to its participation in the borrowing facility during the reporting period equal 0.03% of the Fund’s average net assets on an annualized basis. The Fund has the right to prepay such loans and terminate its participation in the conduit loan facility at any time upon prior notice.
At period end, the Fund had borrowings outstanding at an interest rate of 0.5739 %.
Details of the borrowings for the reporting period are as follows:
| | | | |
| Average Daily Loan Balance | | $ | 1,378,415 | |
| Average Daily Interest Rate | | | 0.528 | % |
| Fees Paid | | $ | 586,764 | |
| Interest Paid | | $ | 6,569 | |
Reverse Repurchase Agreements. The Fund may engage in reverse repurchase agreements. A reverse repurchase agreement is the sale of one or more securities to a counterparty at an agreed-upon purchase price with the simultaneous agreement to repurchase those securities on a future date at a higher repurchase price. The repurchase price represents the repayment of the purchase price and interest accrued thereon over the term of the repurchase agreement. The cash received by the Fund in connection with a reverse repurchase agreement may be used for investment-related purposes such as purchasing portfolio securities or for other purposes such as those described in the preceding “Borrowings” note.
The Fund entered into a Committed Repurchase Transaction Facility (the “Facility”) with J.P. Morgan Securities LLC (the “counterparty”) which enables it to participate with certain other Oppenheimer funds in a committed reverse repurchase agreement facility that permits aggregate outstanding reverse repurchase agreements of up to $750 million, collectively. Interest is charged to the Fund on the purchase price of outstanding reverse repurchase agreements at current LIBOR rates plus an applicable spread. The Fund is also allocated its pro-rata share of an annual structuring fee based on the total Facility size and ongoing commitment fees based on the total unused amount of the Facility. The Fund retains the economic exposure to fluctuations in the value of securities subject to reverse repurchase agreements under the Facility and therefore these transactions are considered secured borrowings for financial reporting purposes. The Fund also continues to receive the economic benefit of interest payments received on securities subject to reverse repurchase agreements, in the form of a direct payment from the counterparty. These payments are included in interest income on the Statement of Operations. Total fees and interest related to the Fund’s participation in the Facility during the reporting period are included in expenses on the Fund’s Statement of Operations and equal 0.02% of the Fund’s average net assets on an annualized basis.
The securities subject to reverse repurchase agreements under the Facility are valued on a daily basis. To the extent this value, after adjusting for certain margin requirements of the Facility, exceeds the cash proceeds received, the Fund may request the counterparty to
72 OPPENHEIMER ROCHESTER CALIFORNIA MUNICIPAL FUND
9. Borrowings and Other Financing (Continued)
return securities equal in margin value to this excess. To the extent that the cash proceeds received exceed the margin value of the securities subject to the transaction, the counterparty may request additional securities from the Fund. The Fund has the right to declare each Wednesday as the repurchase date for any outstanding reverse repurchase agreement upon delivery of advanced notification and may also recall any security subject to such a transaction by substituting eligible securities of equal or greater margin value according to the Facility’s terms.
The Fund executed no transactions under the Facility during the reporting period.
Details of reverse repurchase agreement transactions for the reporting period are as follows:
10. Pending Litigation
In 2009, several lawsuits were filed as putative class actions and later consolidated before the U.S. District Court for the District of Colorado in connection with the investment performance of Oppenheimer Rochester California Municipal Fund (the “Fund”), a fund advised by OppenheimerFunds, Inc. (“OFI”), and distributed by its subsidiary OppenheimerFunds Distributor, Inc. ( “OFDI”). The plaintiffs asserted claims against OFI, OFDI and certain present and former trustees and officers of the Fund under the federal securities laws, alleging, among other things, that the disclosure documents of the Fund contained misrepresentations and omissions and the investment policies of the Fund were not followed. Plaintiffs in the suit filed an amended complaint and defendants filed a motion to dismiss. In 2011, the court issued an order which granted in part and denied in part the defendants’ motion to dismiss. In 2012, plaintiffs filed a motion, which defendants opposed, to certify a class and appoint class representatives and class counsel. In March 2015, the court granted plaintiffs’ motion for class certification. In May 2015, the U.S. Court of Appeals for the Tenth Circuit vacated the class certification order and remanded the matter to the district court for further proceedings. In July 2015, the district court held an evidentiary hearing on plaintiffs’ motion for class certification. In October 2015, the district court reaffirmed its order and determined that the suit will proceed as a class action. In December 2015, the Tenth Circuit denied defendants’ petition to appeal the district court’s reaffirmed class certification order.
OFI and OFDI believe the suit is without merit; that it is premature to render any opinion as to the likelihood of an outcome unfavorable to them in the suit; and that no estimate can yet be made as to the amount or range of any potential loss. Furthermore, OFI believes that the suit should not impair the ability of OFI or OFDI to perform their respective duties to the Fund and that the outcome of the suit should not have any material effect on the operations of any of the Oppenheimer funds.
11. Subsequent Event
Puerto Rico has defaulted on certain interest and principal payments on the commonwealth’s general obligation bonds as well as interest and/or principal payments on the debt issued by
73 OPPENHEIMER ROCHESTER CALIFORNIA MUNICIPAL FUND
NOTES TO FINANCIAL STATEMENTS Continued
11. Subsequent Event (Continued)
certain other instrumentalities held by the Fund. As a result, after July 31, 2016, the Fund established an additional allowance, which decreased recognized income of the Fund, related to $1,160,980 of defaulted interest payments. The Fund’s financial statements have been adjusted to reflect this allowance, resulting in net asset values per share as reported per the financial statements that differ from the net asset values per share at which shares of beneficial interest activity were transacted.
74 OPPENHEIMER ROCHESTER CALIFORNIA MUNICIPAL FUND
REPORT OF INDEPENDENT REGISTERED PUBLIC ACCOUNTING FIRM
The Board of Trustees and Shareholders of Oppenheimer Rochester California Municipal Fund:
We have audited the accompanying statement of assets and liabilities of Oppenheimer Rochester California Municipal Fund, including the statement of investments, as of July 31, 2016, and the related statements of operations and cash flows for the year then ended, the statements of changes in net assets for each of the years in the two-year period then ended, and the financial highlights for each of the years in the five-year period then ended. These financial statements and financial highlights are the responsibility of the Fund’s management. Our responsibility is to express an opinion on these financial statements and financial highlights based on our audits.
We conducted our audits in accordance with the standards of the Public Company Accounting Oversight Board (United States). Those standards require that we plan and perform the audit to obtain reasonable assurance about whether the financial statements and financial highlights are free of material misstatement. An audit includes examining, on a test basis, evidence supporting the amounts and disclosures in the financial statements. Our procedures included confirmation of securities owned as of July 31, 2016, by correspondence with the custodian and brokers, or by other appropriate auditing procedures where replies from brokers were not received. An audit also includes assessing the accounting principles used and significant estimates made by management, as well as evaluating the overall financial statement presentation. We believe that our audits provide a reasonable basis for our opinion.
In our opinion, the financial statements and financial highlights referred to above present fairly, in all material respects, the financial position of Oppenheimer Rochester California Municipal Fund as of July 31, 2016, the results of its operations and cash flows for the year then ended, the changes in its net assets for each of the years in the two-year period then ended, and the financial highlights for each of the years in the five-year period then ended, in conformity with U.S. generally accepted accounting principles.
KPMG LLP
Denver, Colorado
September 28, 2016
75 OPPENHEIMER ROCHESTER CALIFORNIA MUNICIPAL FUND
FEDERAL INCOME TAX INFORMATION Unaudited
In early 2016, if applicable, shareholders of record received information regarding all dividends and distributions paid to them by the Fund during calendar year 2015.
None of the dividends paid by the Fund during the reporting period are eligible for the corporate dividend-received deduction. 99.57% of the dividends were derived from interest on municipal bonds and are not subject to federal income taxes. To the extent a shareholder is subject to any state or local tax laws, some or all of the dividends received may be taxable.
The foregoing information is presented to assist shareholders in reporting distributions received from the Fund to the Internal Revenue Service. Because of the complexity of the federal regulations which may affect your individual tax return and the many variations in state and local tax regulations, we recommend that you consult your tax advisor for specific guidance.
76 OPPENHEIMER ROCHESTER CALIFORNIA MUNICIPAL FUND
PORTFOLIO PROXY VOTING POLICIES AND GUIDELINES;
UPDATES TO STATEMENTS OF INVESTMENTS Unaudited
The Fund has adopted Portfolio Proxy Voting Policies and Guidelines under which the Fund votes proxies relating to securities (“portfolio proxies”) held by the Fund. A description of the Fund’s Portfolio Proxy Voting Policies and Guidelines is available (i) without charge, upon request, by calling the Fund toll-free at 1.800.CALL OPP (225.5677), (ii) on the Fund’s website at www.oppenheimerfunds.com, and (iii) on the SEC’s website at www.sec.gov. In addition, the Fund is required to file Form N-PX, with its complete proxy voting record for the 12 months ended June 30th, no later than August 31st of each year. The Fund’s voting record is available (i) without charge, upon request, by calling the Fund toll-free at 1.800.CALL OPP (225.5677), and (ii) in the Form N-PX filing on the SEC’s website at www.sec.gov.
The Fund files its complete schedule of portfolio holdings with the SEC for the first quarter and the third quarter of each fiscal year on Form N-Q. The Fund’s Form N-Q filings are available on the SEC’s website at www.sec.gov. Those forms may be reviewed and copied at the SEC’s Public Reference Room in Washington, D.C. Information on the operation of the Public Reference Room may be obtained by calling 1-800-SEC-0330.
Householding—Delivery of Shareholder Documents
This is to inform you about OppenheimerFunds’ “householding” policy. If more than one member of your household maintains an account in a particular fund, OppenheimerFunds will mail only one copy of the fund’s prospectus (or, if available, the fund’s summary prospectus), annual and semiannual report and privacy policy. The consolidation of these mailings, called householding, benefits your fund through reduced mailing expense, and benefits you by reducing the volume of mail you receive from OppenheimerFunds. Householding does not affect the delivery of your account statements.
Please note that we will continue to household these mailings for as long as you remain an OppenheimerFunds shareholder, unless you request otherwise. If you prefer to receive multiple copies of these materials, please call us at 1.800.CALL-OPP (225-5677). You may also notify us in writing or via email. We will begin sending you individual copies of the prospectus (or, if available, the summary prospectus), reports and privacy policy within 30 days of receiving your request to stop householding.
77 OPPENHEIMER ROCHESTER CALIFORNIA MUNICIPAL FUND
TRUSTEES AND OFFICERS Unaudited
| | |
| Name, Position(s) Held with the Fund, Length of Service, Year of Birth | | Principal Occupation(s) During the Past 5 Years; Other Trusteeships/Directorships Held; Number of Portfolios in the Fund Complex Currently Overseen |
| |
| INDEPENDENT TRUSTEES | | The address of each Trustee in the chart below is 6803 S. Tucson Way, Centennial, Colorado 80112-3924. Each Trustee serves for an indefinite term, or until his or her resignation, retirement, death or removal. |
| |
Brian F. Wruble, Chairman of the Board of Trustees (since 2007) and Trustee (since 2005) Year of Birth: 1943 | | Governor and Vice Chairman of Community Foundation of the Florida Keys (non-profit) (since July 2012); Trustee of the Board of Trustees, The Jackson Laboratory (non-profit) (1991-2011 and since May 2014); Chairman Emeritus (since August 2011) of The Jackson Laboratory (non-profit); Member of Zurich Insurance Group’s Investment Management Advisory Council (insurance) (since 2004); Treasurer (since 2007) and Trustee of the Institute for Advanced Study (non-profit educational institute) (since May 1992); Director of Special Value Opportunities Fund, LLC (registered investment company) (affiliate of the Sub-Adviser’s parent company) (September 2004-June 2015); General Partner of Odyssey Partners, L.P. (hedge fund) (September 1995-December 2007); Special Limited Partner of Odyssey Investment Partners, LLC (private equity investment) (January 1999-September 2004). Oversees 55 portfolios in the OppenheimerFunds complex. Mr. Wruble has served on the Boards of certain Oppenheimer funds since April 2001, during which time he has become familiar with the Fund’s (and other Oppenheimer funds’) financial, accounting, regulatory and investment matters and has contributed to the Boards’ deliberations. |
| |
Beth Ann Brown, Trustee (since 2016) Year of Birth: 1968 | | Advisor, Board of Advisors of Caron Engineering Inc. (since December 2014); Independent Consultant (since September 2012); held the following positions at Columbia Management Investment Advisers LLC: Head of Intermediary Distribution (2008-2012), Managing Director, Strategic Relations (2005-2008), Managing Director, Head of National Accounts (2004-2005); Senior Vice President, National Account Manager (2002-2004), Senior Vice President, Key Account Manager (1999-2002) and Vice President, Key Account Manager (1996-1999) of Liberty Funds Distributor, Inc.; President and Director, of Acton Shapleigh Youth Conservation Corps (non-profit) (since 2012); and Vice President and Director of Grahamtastic Connection (non-profit) (since May 2013). Oversees 55 portfolios in the OppenheimerFunds complex. Ms. Brown has served on the Boards of certain Oppenheimer funds since January 2016, during which time she has become familiar with the Fund’s (and other Oppenheimer funds’) financial, accounting, regulatory and investment matters and has contributed to the Boards’ deliberations. |
| |
Matthew P. Fink, Trustee (since 2005) Year of Birth: 1941 | | Trustee of the Committee for Economic Development (policy research foundation) (2005-2011); Director of ICI Education Foundation (education foundation) (October 1991-August 2006); President of the Investment Company Institute (trade association) (October 1991-June 2004); Director of ICI Mutual Insurance Company (insurance company) (October 1991-June 2004); Author of The Rise of Mutual Funds: An Insider’s View published by Oxford University Press (second edition 2011). Oversees 55 portfolios in the OppenheimerFunds complex. Mr. Fink has served on the Boards of certain Oppenheimer funds since January 2005, during which time he has become familiar with the Fund’s (and other Oppenheimer funds’) financial, accounting, regulatory and investment matters and has contributed to the Boards’ deliberations. |
78 OPPENHEIMER ROCHESTER CALIFORNIA MUNICIPAL FUND
| | |
Edmund P. Giambastiani, Jr., Trustee (since 2013) Year of Birth: 1948 | | Advisory Board Member of the Maxwell School of Citizenship and Public Affairs of Syracuse University (since April 2012); Director of Mercury Defense Systems Inc. (information technology) (August 2011-February 2013); Trustee of the U.S. Naval Academy Foundation (since November 2010); Advisory Board Member of the Massachusetts Institute of Technology Lincoln Laboratory (federally-funded research development center) (since May 2010); Director of The Boeing Company (aerospace and defense) (since October 2009); Trustee of MITRE Corporation (federally-funded research development center) (since September 2008); Independent Director of QinetiQ Group Plc (defense technology and security) (February 2008-August 2011); Chairman of Monster Worldwide, Inc. (on-line career services) (since March 2015), Lead Director (June 2011-March 2015); Chairman of Alenia North America, Inc. (military and defense products) (January 2008-October 2009); Director of SRA International, Inc. (information technology and services) (January 2008-July 2011); President of Giambastiani Group LLC (national security and energy consulting) (since October 2007); United States Navy, career nuclear submarine officer (June 1970-October 2007), Vice Chairman of the Joint Chiefs of Staff (2005-October 2007), Supreme Allied Commander of NATO Commander Transformation (2003-2005), Commander, U.S. Joint Forces Command (2002-2005). Since his retirement from the U.S. Navy in October 2007, Admiral Giambastiani has also served on numerous U.S. Government advisory boards, investigations and task forces for the Secretaries of Defense, State and Interior and the Central Intelligence Agency. He currently serves as a federal commissioner on the Military Compensation and Retirement Modernization Commission. Oversees 55 portfolios in the OppenheimerFunds complex. Admiral Giambastiani has served on the Boards of certain Oppenheimer funds since February 2013, during which time he has become familiar with the Fund’s (and other Oppenheimer funds’) financial, accounting, regulatory and investment matters and has contributed to the Boards’ deliberations. For purposes of this report, Admiral Giambastiani is identified as a Trustee. |
| |
Elizabeth Krentzman, Trustee (since 2014) Year of Birth: 1959 | | Advisory Board Member of the University of Florida Law Center Association (since 2016) and the Securities and Exchange Commission Historical Society (since 2007); held the following positions at Deloitte & Touche LLP: Principal and Chief Regulatory Advisor for Asset Management Services (2007-2014) and U.S. Mutual Fund Leader (2011-2014); General Counsel of the Investment Company Institute (trade association) (June 2004-April 2007); held the following positions at Deloitte & Touche LLP: National Director of the Investment Management Regulatory Consulting Practice (1997-2004), Principal (2003-2004), Director (1998-2003) and Senior Manager (1997-1998); Assistant Director of the Division of Investment Management – Office of Disclosure and Investment Adviser Regulation (1996-1997) and various positions with the Division of Investment Management – Office of Regulatory Policy (1991-1996) of the U.S. Securities and Exchange Commission; Associate at Ropes & Gray (1987-1991). Oversees 55 portfolios in the OppenheimerFunds complex. Ms. Krentzman has served on the Boards of certain Oppenheimer funds since August 2014, during which time she has become familiar with the Fund’s (and other Oppenheimer funds’) financial, accounting, regulatory and investment matters and has contributed to the Boards’ deliberations. |
79 OPPENHEIMER ROCHESTER CALIFORNIA MUNICIPAL FUND
TRUSTEES AND OFFICERS Unaudited / Continued
| | |
Mary F. Miller, Trustee (since 2004) Year of Birth: 1942 | | Trustee of International House (not-for-profit) (since June 2007); Trustee of the American Symphony Orchestra (not-for-profit) (October 1998-November 2011); and Senior Vice President and General Auditor of American Express Company (financial services company) (July 1998-February 2003). Oversees 55 portfolios in the OppenheimerFunds complex. Ms. Miller has served on the Boards of certain Oppenheimer funds since August 2004, during which time she has become familiar with the Fund’s (and other Oppenheimer funds’) financial, accounting, regulatory and investment matters and has contributed to the Boards’ deliberations. |
| |
Joel W. Motley, Trustee (since 2002) Year of Birth: 1952 | | Director of Greenwall Foundation (since October 2013); Member of Board and Investment Committee of The Greenwall Foundation (since April 2013); Member of the Vestry of Trinity Wall Street (since April 2012); Director of Southern Africa Legal Services Foundation (since March 2012); Board Member of Pulitzer Center for Crisis Reporting (non-profit journalism) (since March 2011); Managing Director of Public Capital Advisors, LLC (privately-held financial advisor) (since January 2006); Managing Director of Carmona Motley, Inc. (privately-held financial advisor) (since January 2002); Director of Columbia Equity Financial Corp. (privately-held financial advisor) (2002-2007); Managing Director of Carmona Motley Hoffman Inc. (privately-held financial advisor) (January 1998-December 2001); Member of the Finance and Budget Committee of the Council on Foreign Relations, Member of the Investment Committee and Board of Human Rights Watch (since July 2000) and Member of the Investment Committee and Board of Historic Hudson Valley (since February 2010). Oversees 55 portfolios in the OppenheimerFunds complex. Mr. Motley has served on the Boards of certain Oppenheimer funds since October 2002, during which time he has become familiar with the Fund’s (and other Oppenheimer funds’) financial, accounting, regulatory and investment matters and has contributed to the Boards’ deliberations. |
| |
Joanne Pace, Trustee (since 2012) Year of Birth: 1958 | | Advisory Board Director of Massey Quick and Company, LLC (since October 2014); Board Director of Horizon Blue Cross Blue Shield of New Jersey (since November 2012); Advisory Board Director of The Alberleen Group LLC (since March, 2012); Board Member (since January 2015), Advisory Council Member (December 2012-December 2014) of 100 Women in Hedge Funds (non-profit) (since December, 2012); Advisory Council Member of Morgan Stanley Children’s Hospital (non-profit) (since May, 2012); Board Director of The Komera Project (non-profit) (since April, 2012); New York Advisory Board Director of Peace First (non-profit) (2010-2015); Senior Advisor of SECOR Asset Management, LP (2010-2011); Managing Director and Chief Operating Officer of Morgan Stanley Investment Management (2006-2010); Partner and Chief Operating Officer of FrontPoint Partners, LLC (hedge fund) (2005-2006); held the following positions at Credit Suisse: Managing Director (2003-2005); Global Head of Human Resources and member of Executive Board and Operating Committee (2004-2005), Global Head of Operations and Product Control (2003-2004); held the following positions at Morgan Stanley: Managing Director (1997-2003), Controller and Principal Accounting Officer (1999-2003); Chief Financial Officer (temporary assignment) for the Oversight Committee, Long Term Capital Management (1998-1999). Lead Independent Director and Chair of the Audit and Nominating Committee of The Global Chartist Fund, LLC of Oppenheimer Asset Management (2011-2012); Board Director of Managed Funds Association (2008-2010); Board Director of Morgan |
80 OPPENHEIMER ROCHESTER CALIFORNIA MUNICIPAL FUND
| | |
Joanne Pace, Continued | | Stanley Foundation (2007-2010) and Investment Committee Chair (2008-2010). Oversees 55 portfolios in the OppenheimerFunds complex. Ms. Pace has served on the Boards of certain Oppenheimer funds since November 2012, including as an Advisory Board Member for certain Oppenheimer funds, during which time she has become familiar with the Fund’s (and other Oppenheimer funds’) financial, accounting, regulatory and investment matters and has contributed to the Board’s deliberations. For purposes of this report, Ms. Pace is identified as a Trustee. |
| |
Daniel Vandivort, Trustee (since 2014) Year of Birth: 1954 | | Chairman and Lead Independent Director/Trustee (March 2010-September 2014), Chairman of the Audit Committee (March 2009-September 2014) and Director/Trustee (December 2008-September 2014) of the Board of Directors/Trustees of Value Line Funds; Trustee, Board of Trustees of Huntington Disease Foundation of America (since January 2015 and June 2007-December 2013): Trustee, Board of Trustees, RIM Retirement Savings Plan (2005-2007); President and Chief Investment Officer, Robeco Investment Management, formerly known as Weiss Peck and Greer (January 2005-June 2007); Member, Management Committee of Robeco Investment Management (2001-2007); Chairman and Trustee of the Board of Trustees of Weiss, Peck and Greer Funds (2004-2005); Managing Director and Head of Fixed Income, Weiss, Peck and Greer (November 1994-January 2005); Managing Director and Head of Fixed Income, CS First Boston Investment Management (January 1992-November 1994); Director, Global Product Development, First Boston Asset Management (November 1989 to January 1992); Vice President, Fixed Income Sales, First Boston Corp. (May 1984-November 1989). Oversees 55 portfolios in the OppenheimerFunds complex. Mr. Vandivort has served on the Boards of certain Oppenheimer funds since 2014, during which time he has become familiar with the Fund’s (and other Oppenheimer funds’) financial, accounting, regulatory and investment matters and has contributed to the Boards’ deliberations. |
| | |
| INTERESTED TRUSTEE AND OFFICER | | Mr. Steinmetz is an “Interested Trustee” because he is affiliated with the Manager and the Sub-Adviser by virtue of his positions as Chairman of the Sub-Adviser and officer and director of the Manager. Both as a Trustee and as an officer, Mr. Steinmetz serves for an indefinite term, or until his resignation, retirement, death or removal. Mr. Steinmetz’s address is 225 Liberty Street, New York, New York 10281-1008. |
| |
Arthur P. Steinmetz, Trustee (since 2015), President and Principal Executive Officer (since 2014) Year of Birth: 1958 | | Chairman of the Sub-Adviser (since January 2015); CEO and Chairman of the Manager (since July 2014), President of the Manager (since May 2013), a Director of the Manager (since January 2013), Director of the Sub-Adviser (since July 2014), President, Management Director and CEO of Oppenheimer Acquisition Corp. (the Sub-Adviser’s parent holding company) (since July 2014), and President and Director of OFI SteelPath, Inc. (since January 2013). Chief Investment Officer of the OppenheimerFunds advisory entities from (January 2013-December 2013); Executive Vice President of the Manager (January 2013-May 2013); Chief Investment Officer of the Sub-Adviser (October 2010-December 2012); Chief Investment Officer, Fixed-Income, of the Sub-Adviser (April 2009-October 2010); Executive Vice President of the Sub-Adviser (October 2009-December 2012); Director of Fixed Income of the Sub-Adviser (January 2009-April 2009); and a Senior Vice President of the Sub-Adviser (March 1993-September 2009). An officer of 101 portfolios in the OppenheimerFunds complex. |
| | |
| OTHER OFFICERS OF THE FUND | | The addresses of the Officers in the chart below are as follows: for Messrs. Cottier, Willis, DeMitry, Camarella, Pulire, Stein, Mss. Mossow, Lo Bessette, Sexton and Picciotto, 225 Liberty Street, New York, New York 10281-1008, for Mr. Petersen, 6803 S. Tucson Way, Centennial, Colorado 80112-3924. Each Officer serves for an indefinite term or until his or her resignation, retirement, death or removal. |
81 OPPENHEIMER ROCHESTER CALIFORNIA MUNICIPAL FUND
TRUSTEES AND OFFICERS Unaudited / Continued
| | |
Scott S. Cottier, Vice President (since 2005) Year of Birth: 1971 | | Vice President of the Sub-Adviser and a Senior Portfolio Manager (since September 2002). Portfolio Manager and trader at Victory Capital Management (1999-2002). Team Leader, a Senior Portfolio Manager, an officer and a trader for the Fund and other Oppenheimer funds. |
| |
Troy E. Willis, Vice President (since 2005) Year of Birth: 1972 | | Vice President of the Sub-Adviser (since July 2009) and a Senior Portfolio Manager (since January 2006); Assistant Vice President of the Sub-Adviser (July 2005-June 2009). Portfolio Manager of the Sub-Adviser (June 2002-December 2005). Corporate Attorney for Southern Resource Group (June 1999-July 2001). Team Leader, a Senior Portfolio Manager, an officer and a trader for the Fund and other Oppenheimer funds. |
| |
Mark R. DeMitry, Vice President (since 2009) Year of Birth: 1976 | | Vice President of the Sub-Adviser and a Senior Portfolio Manager (since July 2009); Associate Portfolio Manager of the Fund (September 2006-June 2009). Research Analyst of the Sub-Adviser (June 2003-September 2006) and a Credit Analyst of the Sub-Adviser (July 2001-May 2003). Senior Portfolio Manager, an officer and a trader for the Fund and other Oppenheimer funds. |
| |
Michael L. Camarella. Vice President (since 2009) Year of Birth: 1976 | | Vice President of the Sub-Adviser and a Senior Portfolio Manager (since January 2011); Assistant Vice President of the Sub-Adviser (July 2009-December 2010); Associate Portfolio Manager of the Sub-Adviser (January 2008-December 2010). Research Analyst of the Sub-Adviser (April 2006-December 2007) and a Credit Analyst of the Sub-Adviser (June 2003-March 2006). Senior Portfolio Manager, an officer and a trader for the Fund and other Oppenheimer funds. |
| |
Charles S. Pulire, Vice President (since 2011) Year of Birth: 1977 | | Vice President of the Sub-Adviser and a Senior Portfolio Manager (since February 2013); Assistant Vice President of the Sub-Adviser (December 2010-January 2013); Research Analyst of the Manager (February 2008-November 2010); Credit Analyst of the Sub-Adviser (May 2006-January 2008). Senior Portfolio Manager, an officer and a trader for the Fund and other Oppenheimer funds. |
| |
Elizabeth Mossow, Vice President (since 2016) Year of Birth: 1978 | | Vice President and Portfolio Manager of the Sub-Adviser (since January 2016) and Assistant Vice President of the Sub-Adviser (January 2011-January 2016). Associate Portfolio Manager (June 2013-January 2016). Research Analyst of the Sub-Adviser (June 2011-June 2013) and was a Credit Analyst of the Sub-Adviser (May 2007-May 2011). Portfolio Manager, an officer and a trader for the Fund and other Oppenheimer funds. |
| |
Richard Stein, Vice President (since 2007) Year of Birth: 1957 | | Director of the Rochester Credit Analysis team (since March 2004); Senior Vice President of the Sub-Adviser (since June 2011) and a Vice President of the Sub-Adviser (November 1997-May 2011); heads up the Rochester Credit Analysis team (since May 1993). |
82 OPPENHEIMER ROCHESTER CALIFORNIA MUNICIPAL FUND
| | |
Cynthia Lo Bessette, Secretary and Chief Legal Officer (since 2016) Year of Birth: 1969 | | Senior Vice President and Deputy General Counsel (March 2015-February 2016) and Executive Vice President, General Counsel and Secretary of the Manager (since February 2016); Chief Legal Officer of the Sub-Adviser and the Distributor (since February 2016); Vice President, General Counsel and Secretary of Oppenheimer Acquisition Corp. (since February 2016); General Counsel of OFI SteelPath, Inc., VTL Associates, LLC and Index Management Solutions, LLC (since February 2016); Chief Legal Officer of OFI Global Institutional, Inc., HarbourView Asset Management Corporation, OFI Global Trust Company, Oppenheimer Real Asset Management, Inc., OFI Private Investments Inc., Shareholder Services, Inc. and Trinity Investment Management Corporation (since February 2016); Vice President, Corporate Counsel (February 2012-March 2015) and Deputy Chief Legal Officer (April 2013-March 2015) of Jennison Associates LLC; Assistant General Counsel (April 2008-September 2009) and Deputy General Counsel (October 2009-February 2012) of Lord Abbett & Co. LLC. An officer of 101 portfolios in the OppenheimerFunds complex. |
| |
Jennifer Sexton, Vice President and Chief Business Officer (since 2014) Year of Birth: 1969 | | Senior Vice President of OppenheimerFunds Distributor, Inc. (since June 2014); Vice President of OppenheimerFunds Distributor, Inc. (April 2006-June 2014); Vice President of the Sub-Adviser (January 1998-March 2006); Assistant Vice President of the Sub-Adviser (October 1991-December 1998). An officer of 101 portfolios in the OppenheimerFunds complex. |
| |
Mary Ann Picciotto, Chief Compliance Officer and Chief Anti-Money Laundering Officer (since 2014) Year of Birth: 1973 | | Senior Vice President and Chief Compliance Officer of the Manager (since March 2014); Chief Compliance Officer of the Sub-Adviser, OFI SteelPath, Inc., OFI Global Trust Company, OFI Global Institutional, Inc., Oppenheimer Real Asset Management, Inc., OFI Private Investments, Inc., Harborview Asset Management Corporation, Trinity Investment Management Corporation, and Shareholder Services, Inc. (since March 2014); Managing Director of Morgan Stanley Investment Management Inc. and certain of its various affiliated entities; Chief Compliance Officer of various Morgan Stanley Funds (May 2010-January 2014); Chief Compliance Officer of Morgan Stanley Investment Management Inc. (April 2007-January 2014). An officer of 101 portfolios in the OppenheimerFunds complex. |
| |
Brian S. Petersen, Treasurer and Principal Financial & Accounting Officer (since 2016) Year of Birth: 1970 | | Vice President of the Manager (since January 2013); Vice President of the Sub-Adviser (February 2007-December 2012); Assistant Vice President of the Sub- Adviser (August 2002-2007). An officer of 101 portfolios in the OppenheimerFunds complex. |
The Fund’s Statement of Additional Information contains additional information about the Fund’s Trustees and Officers and is available without charge upon request by calling 1.800.CALL OPP (225.5677).
83 OPPENHEIMER ROCHESTER CALIFORNIA MUNICIPAL FUND
OPPENHEIMER ROCHESTER CALIFORNIA MUNICIPAL FUND
| | |
| Manager | | OFI Global Asset Management, Inc. |
| |
| Sub-Adviser | | OppenheimerFunds, Inc. |
| |
| Distributor | | OppenheimerFunds Distributor, Inc. |
| |
| Transfer and Shareholder Servicing Agent | | OFI Global Asset Management, Inc. |
| |
| Sub-Transfer Agent | | Shareholder Services, Inc. |
| | DBA OppenheimerFunds Services |
| |
| Independent Registered Public Accounting Firm | | KPMG LLP |
| |
| Legal Counsel | | Kramer Levin Naftalis & Frankel LLP |
© 2016 OppenheimerFunds, Inc. All rights reserved.
84 OPPENHEIMER ROCHESTER CALIFORNIA MUNICIPAL FUND
PRIVACY POLICY NOTICE
As an Oppenheimer fund shareholder, you are entitled to know how we protect your personal information and how we limit its disclosure.
Information Sources
We obtain nonpublic personal information about our shareholders from the following sources:
| ● | | Applications or other forms |
| ● | | When you create a user ID and password for online account access |
| ● | | When you enroll in eDocs Direct, our electronic document delivery service |
| ● | | Your transactions with us, our affiliates or others |
| ● | | A software program on our website, often referred to as a “cookie,” which indicates which parts of our site you’ve visited |
| ● | | When you set up challenge questions to reset your password online |
If you visit oppenheimerfunds.com and do not log on to the secure account information areas, we do not obtain any personal information about you. When you do log on to a secure area, we do obtain your user ID and password to identify you. We also use this information to provide you with products and services you have requested, to inform you about products and services that you may be interested in and assist you in other ways.
We do not collect personal information through our website unless you willingly provide it to us, either directly by email or in those areas of the website that request information. In order to update your personal information (including your mailing address, email address and phone number) you must first log on and visit your user profile.
If you have set your browser to warn you before accepting cookies, you will receive the warning message with each cookie. You can refuse cookies by turning them off in your browser. However, doing so may limit your access to certain sections of our website.
We use cookies to help us improve and manage our website. For example, cookies help us recognize new versus repeat visitors to the site, track the pages visited, and enable some special features on the website. This data helps us provide a better service for our website visitors.
Protection of Information
We do not disclose any non-public personal information (such as names on a customer list) about current or former customers to anyone, except as permitted by law.
Disclosure of Information
Copies of confirmations, account statements and other documents reporting activity in your fund accounts are made available to your financial advisor (as designated by you). We may also use details about you and your investments to help us, our financial service affiliates, or firms that jointly market their financial products and services with ours, to better serve your investment needs or suggest financial services or educational material that may be of interest to you. If this requires us to provide you with an opportunity to “opt in” or “opt out” of such information sharing with a firm not affiliated with us, you will receive notification on how to do so, before any such sharing takes place.
Right of Refusal
We will not disclose your personal information to unaffiliated third parties (except as permitted by law), unless we first offer you a reasonable opportunity to refuse or “opt out” of such disclosure.
85 OPPENHEIMER ROCHESTER CALIFORNIA MUNICIPAL FUND
PRIVACY POLICY NOTICE Continued
Internet Security and Encryption
In general, the email services provided by our website are encrypted and provide a secure and private means of communication with us. To protect your own privacy, confidential and/or personal information should only be communicated via email when you are advised that you are using a secure website. As a security measure, we do not include personal or account information in non-secure emails, and we advise you not to send such information to us in non-secure emails. Instead, you may take advantage of the secure features of our website to encrypt your email correspondence. To do this, you will need to use a browser that supports Secure Sockets Layer (SSL) protocol.
We do not guarantee or warrant that any part of our website, including files available for download, are free of viruses or other harmful code. It is your responsibility to take appropriate precautions, such as use of an anti-virus software package, to protect your computer hardware and software.
| ● | | All transactions, including redemptions, exchanges and purchases, are secured by SSL and 256-bit encryption. SSL is used to establish a secure connection between your PC and OppenheimerFunds’ server. It transmits information in an encrypted and scrambled format. |
| ● | | Encryption is achieved through an electronic scrambling technology that uses a “key” to code and then decode the data. Encryption acts like the cable converter box you may have on your television set. It scrambles data with a secret code so that no one can make sense of it while it is being transmitted. When the data reaches its destination, the same software unscrambles the data. |
| ● | | You can exit the secure area by either closing your browser, or for added security, you can use the Log Out button before you close your browser. |
Other Security Measures
We maintain physical, electronic and procedural safeguards to protect your personal account information. Our employees and agents have access to that information only so that they may offer you products or provide services, for example, when responding to your account questions.
How You Can Help
You can also do your part to keep your account information private and to prevent unauthorized transactions. If you obtain a user ID and password for your account, do not allow it to be used by anyone else. Also, take special precautions when accessing your account on a computer used by others.
Who We Are
This joint notice describes the privacy policies of the Oppenheimer funds, OppenheimerFunds, Inc., each of its investment adviser subsidiaries, OppenheimerFunds Distributor, Inc. and OFI Global Trust Co. It applies to all Oppenheimer fund accounts you presently have, or may open in the future, using your Social Security number—whether or not you remain a shareholder of our funds. This notice was last updated March 2015. In the event it is updated or changed, we will post an updated notice on our website at oppenheimerfunds.com. If you have any questions about this privacy policy, write to us at P.O. Box 5270, Denver, CO 80217-5270, email us by clicking on the Contact Us section of our website at oppenheimerfunds.com or call us at 1.800.CALL OPP (225.5677).
86 OPPENHEIMER ROCHESTER CALIFORNIA MUNICIPAL FUND
THIS PAGE INTENTIONALLY LEFT BLANK.
87 OPPENHEIMER ROCHESTER CALIFORNIA MUNICIPAL FUND
| | | | |
| |  | | |
| | Visit us at oppenheimerfunds.com for 24-hr access to account information and transactions or call us at 800.CALL OPP (800.225.5677) for 24-hr automated information and automated transactions. Representatives also available Mon–Fri 8am-8pm ET. | | |
Visit Us
oppenheimerfunds.com
Call Us
800 225 5677
Follow Us
| | |
 | | Oppenheimer funds are distributed by OppenheimerFunds Distributor, Inc. 225 Liberty Street, New York, NY 10281-1008 © 2016 OppenheimerFunds Distributor, Inc. All rights reserved. RA0790.001.0716 September 27, 2016 |
| |
| |
| |
The registrant has adopted a code of ethics that applies to the registrant’s principal executive officer, principal financial officer, principal accounting officer or controller or persons performing similar functions.
| Item 3. | Audit Committee Financial Expert. |
The Board of Trustees of the registrant has determined that Joanne Pace, the Board’s Audit Committee Chairwoman, is an audit committee financial expert and that Ms. Pace is “independent” for purposes of this Item 3.
| Item 4. | Principal Accountant Fees and Services. |
The principal accountant for the audit of the registrant’s annual financial statements billed $48,200 in fiscal 2016 and $45,900 in fiscal 2015.
The principal accountant for the audit of the registrant’s annual financial statements billed $4,404 in fiscal 2016 and $2,500 in fiscal 2015.
The principal accountant for the audit of the registrant’s annual financial statements billed $736,335 in fiscal 2016 and $897,697 in fiscal 2015 to the registrant’s investment adviser or any entity controlling, controlled by, or under common control with the adviser that provides ongoing services to the registrant.
Such services include: Internal control reviews, GIPS attestation procedures, additional audit services, custody exams and system conversion testing
The principal accountant for the audit of the registrant’s annual financial statements billed no such fees in fiscal 2016 and no such fees in fiscal 2015.
The principal accountant for the audit of the registrant’s annual financial statements billed $298,261 in fiscal 2016 and $559,556 in fiscal 2015 to the registrant’s investment adviser or any entity controlling, controlled by, or under common control with the adviser that provides ongoing services to the registrant.
Such services include: tax compliance, tax planning and tax advice. Tax compliance generally involves preparation of original and amended tax returns, claims for a refund and tax payment-planning services. Tax planning and tax advice includes assistance with tax audits and appeals, tax advice related to mergers and acquisitions and requests for rulings or technical advice from taxing authorities.
The principal accountant for the audit of the registrant’s annual financial statements billed no such fees in fiscal 2016 and no such fees in fiscal 2015.
The principal accountant for the audit of the registrant’s annual financial statements billed no such fees in fiscal 2016 and no such fees in fiscal 2015 to the registrant’s investment adviser or any entity controlling, controlled by, or under common control with the adviser that provides ongoing services to the registrant.
Such fees would include the cost to the principal accountant of attending audit committee meetings and consultations regarding the registrant’s retirement plan with respect to its Trustees.
| (e) | (1) During its regularly scheduled periodic meetings, the registrant’s audit committee will pre-approve all audit, audit-related, tax and other services to be provided by the principal accountants of the registrant. |
The audit committee has delegated pre-approval authority to its Chairwoman for any subsequent new engagements that arise between regularly scheduled meeting dates provided that any fees such pre-approved are presented to the audit committee at its next regularly scheduled meeting.
Under applicable laws, pre-approval of non-audit services may be waived provided that: 1) the aggregate amount of all such services provided constitutes no more than five percent of the total amount of fees paid by the registrant to its principal accountant during the fiscal year in which services are provided 2) such services were not recognized by the registrant at the time of engagement as non-audit services and 3) such services are promptly brought to the attention of the audit committee of the registrant and approved prior to the completion of the audit.
(2) 0%
| (f) | Not applicable as less than 50%. |
| (g) | The principal accountant for the audit of the registrant’s annual financial statements billed $1,039,000 in fiscal 2016 and $1,459,753 in fiscal 2015 to the registrant and the registrant’s investment adviser or any entity controlling, controlled by, or under common control with the adviser that provides ongoing services to the registrant related to non-audit fees. Those billings did not include any prohibited non-audit services as defined by the Securities Exchange Act of 1934. |
| (h) | The registrant’s audit committee of the board of Trustees has considered whether the provision of non-audit services that were rendered to the registrant’s investment adviser, and any entity controlling, controlled by, or under common control with the investment adviser that provides ongoing services to the registrant that were not pre-approved pursuant to paragraph (c)(7)(ii) of Rule 2-01 of Regulation S-X is compatible with maintaining the principal accountant’s independence. No such services were rendered. |
| Item 5. | Audit Committee of Listed Registrants |
Not applicable.
| Item 6. | Schedule of Investments. |
a) Not applicable. The complete schedule of investments is included in Item 1 of this Form N-CSR.
b) Not applicable.
| Item 7. | Disclosure of Proxy Voting Policies and Procedures for Closed-End Management Investment Companies. |
Not applicable.
| Item 8. | Portfolio Managers of Closed-End Management Investment Companies. |
Not applicable.
| Item 9. | Purchases of Equity Securities by Closed-End Management Investment Company and Affiliated Purchasers. |
Not applicable.
| Item 10. | Submission of Matters to a Vote of Security Holders. |
The Fund’s Governance Committee Provisions with Respect to Nominations of Directors/Trustees to the Respective Boards
None
| Item 11. | Controls and Procedures. |
Based on their evaluation of the registrant’s disclosure controls and procedures (as defined in rule 30a-3(c) under the Investment Company Act of 1940 (17 CFR 270.30a-3(c)) as of 7/31/2016, the registrant’s principal executive officer and principal financial officer found the registrant’s disclosure controls and procedures to provide reasonable assurances that information required to be disclosed by the registrant in the reports that it files under the Securities Exchange Act of 1934 (a) is accumulated and communicated to registrant’s management, including its principal executive officer and principal financial officer, to allow timely decisions regarding required disclosure, and (b) is recorded, processed, summarized and reported, within the time periods specified in the rules and forms adopted by the U.S. Securities and Exchange Commission.
There have been no changes in the registrant’s internal controls over financial reporting that occurred during the registrant’s second fiscal quarter of the period covered by this report that have materially affected, or are reasonably likely to materially affect, the registrant’s internal control over financial reporting.
| (a) | (1) Exhibit attached hereto. |
(2) Exhibits attached hereto.
(3) Not applicable.
| (b) | Exhibit attached hereto. |
SIGNATURES
Pursuant to the requirements of the Securities Exchange Act of 1934 and the Investment Company Act of 1940, the registrant has duly caused this report to be signed on its behalf by the undersigned, thereunto duly authorized.
Oppenheimer Rochester California Municipal Fund
| | |
| By: | | /s/ Arthur P. Steinmetz |
| | Arthur P. Steinmetz |
| | Principal Executive Officer |
| |
| Date: | | 9/14/2016 |
Pursuant to the requirements of the Securities Exchange Act of 1934 and the Investment Company Act of 1940, this report has been signed below by the following persons on behalf of the registrant and in the capacities and on the dates indicated.
| | |
| By: | | /s/ Arthur P. Steinmetz |
| | Arthur P. Steinmetz |
| | Principal Executive Officer |
| |
| Date: | | 9/14/2016 |
| | |
| By: | | /s/ Brian S. Petersen |
| | Brian S. Petersen |
| | Principal Financial Officer |
| |
| Date: | | 9/14/2016 |