| OMB APPROVAL |
| OMB Number: 3235-0570 |
| Expires: November 30, 2005 |
| Estimated average burden
hours per response. . . . . 5.0 |
UNITED STATES
SECURITIES AND EXCHANGE COMMISSION
Washington, D.C. 20549
FORM N-CSR
CERTIFIED SHAREHOLDER REPORT OF REGISTERED
MANAGEMENT INVESTMENT COMPANIES
Investment Company Act file number 811-05642
American Income Fund, Inc.
(Exact name of registrant as specified in charter)
800 Nicollet Mall, Minneapolis, MN | | 55402 |
(Address of principal executive offices) | | (Zip code) |
Charles D. Gariboldi 800 Nicollet Mall, Minneapolis, MN 55402
(Name and address of agent for service)
Registrant’s telephone number, including area code: 800-677-3863
Date of fiscal year end: August 31
Date of reporting period: February 28, 2006
Form N-CSR is to be used by management investment companies to file reports with the Commission not later than 10 days after the transmission to stockholders of any report that is required to be transmitted to stockholders under Rule 30e-1 under the Investment Company Act of 1940 (17 CFR 270.30e-1). The Commission may use the information provided on Form N-CSR in its regulatory, disclosure review, inspection, and policymaking roles.
A registrant is required to disclose the information specified by Form N-CSR, and the Commission will make this information public. A registrant is not required to respond to the collection of information contained in Form N-CSR unless the Form displays a currently valid Office of Management and Budget (“OMB”) control number. Please direct comments concerning the accuracy of the information collection burden estimate and any suggestions for reducing the burden to Secretary, Securities and Exchange Commission, 450 Fifth Street, NW, Washington, DC 20549-0609. The OMB has reviewed this collection of information under the clearance requirements of 44 U.S.C. Section 3507.
Item 1. Report to Shareholders

AMERICAN | | |
INCOME FUND | | |
| | |
MRF | | |
| |
| |
| February 28, 2006 |
| SEMIANNUAL REPORT |
AMERICAN INCOME FUND
Our Image – George Washington
His rich legacy as patriot and leader is widely recognized as embodying the sound judgment, reliability, and strategic vision that are central to our brand. Fashioned in a style reminiscent of an 18th century engraving, the illustration conveys the symbolic strength and vitality of Washington, which are attributes that we value at First American.
Table of Contents
Financial Statements | 2 |
| |
Notes to Financial Statements | 6 |
| |
Schedule of Investments | 12 |
| |
Notice to Shareholders | 19 |
NOT FDIC INSURED NO BANK GUARANTEE MAY LOSE VALUE
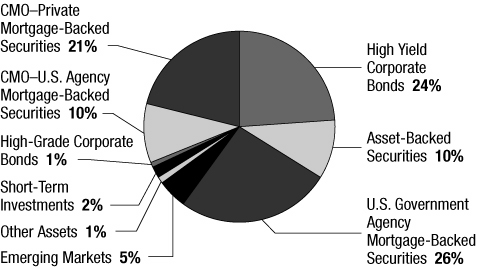
Portfolio Allocation
As a percentage of total assets on February 28, 2006
2006 Semiannual Report
American Income Fund
1
Financial STATEMENTS
Statement of Assets and Liabilities February 28, 2006 (unaudited)
| Assets: | |
| Investments in unaffiliated securities, at value (cost: $101,287,551) (note 2) | | $ | 101,202,500 | | |
| Investment in affiliated money market fund, at value (cost: $2,172,757) (note 3) | | | 2,172,757 | | |
| Cash | | | 9,141 | | |
| Receivable for accrued interest | | | 977,889 | | |
| Prepaid expenses | | | 4,325 | | |
| Total assets | | | 104,366,612 | | |
| Liabilities: | |
| Payable for securities purchased on a when-issued basis (note 2) | | | 1,505,273 | | |
| Payable for reverse repurchase agreements (note 2) | | | 19,152,114 | | |
| Payable for investment advisory fees (note 3) | | | 41,453 | | |
| Payable for administrative fees (note 3) | | | 10,282 | | |
| Payable for interest expense | | | 35,909 | | |
| Payable for professional fees | | | 22,574 | | |
| Payable for variation margin (note 2) | | | 24,812 | | |
| Payable for other expenses | | | 22,083 | | |
| Total liabilities | | | 20,814,500 | | |
| Net assets applicable to outstanding capital stock | | $ | 83,552,112 | | |
| Composition of net assets: | |
| Capital stock and additional paid-in capital | | $ | 95,888,834 | | |
| Undistributed net investment income | | | 101,365 | | |
| Accumulated net realized loss on investments (note 5) | | | (12,368,780 | ) | |
| Net unrealized depreciation of investments | | | (85,051 | ) | |
| Net unrealized appreciation of futures contracts | | | 15,744 | | |
| Total – representing net assets applicable to capital stock | | $ | 83,552,112 | | |
| Net asset value and market price of capital stock: | |
| Net assets outstanding | | $ | 83,552,112 | | |
| Shares outstanding (authorized 200 million shares of $0.01 par value) | | | 9,454,221 | | |
| Net asset value per share | | $ | 8.84 | | |
| Market price per share | | $ | 7.83 | | |
See accompanying Notes to Financial Statements.
2006 Semiannual Report
American Income Fund
2
Statement of Operations For the Six-Month Period Ended February 28, 2006 (unaudited)
| Investment income: | |
| Interest from unaffiliated securities | | $ | 3,324,483 | | |
| Dividends from affiliated money market fund | | | 28,886 | | |
| Total investment income | | | 3,353,369 | | |
| Expenses (note 3): | |
| Investment advisory fees | | | 267,946 | | |
| Interest expense | | | 427,412 | | |
| Administrative fees | | | 41,222 | | |
| Custodian fees | | | 2,061 | | |
| Professional fees | | | 13,306 | | |
| Postage and printing fees | | | 23,121 | | |
| Transfer agent fees | | | 10,248 | | |
| Listing fees | | | 25,556 | | |
| Directors' fees | | | 18,105 | | |
| Other expenses | | | 13,047 | | |
| Total expenses | | | 842,024 | | |
| Less: Indirect payments from the custodian | | | (847 | ) | |
| Total net expenses | | | 841,177 | | |
| Net investment income. | | | 2,512,192 | | |
| Net realized and unrealized gains (losses) on investments in securities, futures contracts, and options written (notes 2 and 4): | |
| Net realized gain (loss) on: | |
| Investments in securities | | | (332,344 | ) | |
| Futures contracts | | | 288,589 | | |
| Options written | | | 5,172 | | |
| Net change in unrealized appreciation or depreciation of: | |
| Investments in securities | | | (1,452,496 | ) | |
| Futures contracts | | | 62,580 | | |
| Options written | | | (242 | ) | |
| Net loss on investments | | | (1,428,741 | ) | |
| Net increase in net assets resulting from operations | | $ | 1,083,451 | | |
See accompanying Notes to Financial Statements.
2006 Semiannual Report
American Income Fund
3
Financial STATEMENTS continued
Statement of Changes in Net Assets
| | | Six-Month
Period Ended
2/28/06
(unaudited) | | Ten-Month
Fiscal
Period Ended
8/31/05 | | Year Ended
10/31/04 | |
| Operations: | |
| Net investment income | | $ | 2,512,192 | | | $ | 4,496,729 | | | $ | 5,975,168 | | |
Net realized gain (loss) on:
Investments in securities | | | (332,344 | ) | | | 77,696 | | | | 1,821,219 | | |
| Futures contracts | | | 288,589 | | | | (185,988 | ) | | | (478,981 | ) | |
| Options written | | | 5,172 | | | | 78,866 | | | | 135,111 | | |
Net change in unrealized appreciation or depreciation of:
Investments in securities | | | (1,452,496 | ) | | | (1,899,600 | ) | | | (60,094 | ) | |
| Futures contracts | | | 62,580 | | | | 258,948 | | | | (305,784 | ) | |
| Options written | | | (242 | ) | | | 242 | | | | (27,784 | ) | |
| Net increase in net assets resulting from operations | | | 1,083,451 | | | | 2,826,893 | | | | 7,058,855 | | |
| Distributions to shareholders (note 2): | |
| From net investment income | | | (2,410,827 | ) | | | (4,496,729 | ) | | | (5,975,168 | ) | |
| From return of capital | | | — | | | | (154,087 | ) | | | (51,902 | ) | |
| Total distributions | | | (2,410,827 | ) | | | (4,650,816 | ) | | | (6,027,070 | ) | |
| Total increase (decrease) in net assets | | | (1,327,376 | ) | | | (1,823,923 | ) | | | 1,031,785 | | |
| Net assets at beginning of period | | | 84,879,488 | | | | 86,703,411 | | | | 85,671,626 | | |
| Net assets at end of period | | $ | 83,552,112 | | | $ | 84,879,488 | | | $ | 86,703,411 | | |
See accompanying Notes to Financial Statements.
2006 Semiannual Report
American Income Fund
4
Statement of Cash Flows For the Six-Month Period Ended February 28, 2006 (unaudited)
| Cash flows from operating activities: | |
| Net increase in net assets resulting from operations | | $ | 1,083,451 | | |
Adjustments to reconcile net increase/decrease in net assets resulting from operations to net cash provided by
(used in) operating activities: | |
| Purchases of investments | | | (36,947,297 | ) | |
| Proceeds from sales of investments | | | 40,920,672 | | |
| Net purchases/sales of short-term securities | | | (549,318 | ) | |
| Net amortization of bond discount and premium | | | (9,105 | ) | |
Net change in unrealized appreciation or depreciation of investments in securities, futures contracts, and
options written | | | 1,390,158 | | |
| Net realized gain/loss on investments in securities, futures contracts, and options written | | | 38,583 | | |
| Net premiums received for options written | | | (3,039 | ) | |
| Increase/decrease in receivable for accrued interest | | | 137,433 | | |
| Increase/decrease in prepaid expenses | | | 32,926 | | |
| Net change in variation margin | | | 335,356 | | |
| Increase/decrease in accrued fees and expenses | | | (19,587 | ) | |
| Net cash provided by (used in) operating activities | | | 6,410,233 | | |
| Cash flows from financing activities: | |
| Net payments from reverse repurchase agreements | | | (4,000,325 | ) | |
| Distributions paid to shareholders | | | (2,410,827 | ) | |
| Net cash provided by (used in) in financing activities | | | (6,411,152 | ) | |
| Net decrease in cash | | | (919 | ) | |
| Cash at beginning of period | | | 10,060 | | |
| Cash at end of period | | $ | 9,141 | | |
Supplemental disclosure of cash flow information:
Cash paid for interest | | $ | 430,689 | | |
See accompanying Notes to Financial Statements.
2006 Semiannual Report
American Income Fund
5
Notes to Financial STATEMENTS (unaudited as to February 28, 2006)
| (1) Organization | | American Income Fund, Inc. (the "fund") is registered under the Investment Company Act of 1940 as a diversified, closed-end management investment company. The fund invests in fixed-income securities, primarily in mortgage-backed securities. The fund also invests in other debt securities, such as collateralized mortgage obligations (CMOs) and asset-backed securities, high-yield bonds, corporate bonds, and preferred stock. The fund will invest at least 65% of its total assets in investment-grade securities under normal market conditions. No more than 35% of the fund's total assets may be held in high-yield issues. The fund is authorized to borrow funds or issue senior securities in amounts not exceeding 33 1/3% of its total assets. Fund shares are listed on the New York Stock Exchange under the symbol MRF. | |
|
| | | On June 22, 2005, the fund's board of directors approved a change in the fund's fiscal year-end from October 31 to August 31, effective with the ten-month fiscal period ended August 31, 2005. | |
|
| (2) Summary of Significant Accounting Policies | | Security Valuations | |
|
| | | Security valuations for the fund's investments are furnished by one or more independent pricing services that have been approved by the fund's board of directors. Debt obligations exceeding 60 days to maturity are valued by an independent pricing service. The pricing service may employ methodologies that utilize actual market transactions, broker-dealer supplied valuations, or other formula-driven valuation techniques. These techniques generally consider such factors as yields or prices of bonds of comparable quality, type of issue, coupon, maturity, ratings, and general market conditions. Securities for which prices are not available from an independent pricing service but where an active market exists are valued using market quotations obtained from one or more dealers that make markets in the securities or from a widely-used quotation system. When market quotations are not readily available, securities are valued at fair value as determined in good faith by procedures established and approved by the fund's board of directors. Some of the factors which may be considered in determining fair value are fundamental analytical data relating to the investment; the nature and duration of any restrictions on disposition; trading in similar securities of the same issuer or comparable companies; information from broker-dealers; and an evaluation of the forces that influence the market in which the securities are purchased and sold. If events occur that materially affect the value of securities (including non-U.S. securities) between the close of trading in those securities and the close of regular trading on the New York Stock Exchange, the securities will be valued at fair value. Debt obligations with 60 days or less remaining until maturity may be valued at their amortized cost, which approximates market value. Security valuations are performed once a week and at the end of each month. | |
|
| | | As of February 28, 2006, the fund had no fair valued securities. | |
|
| | | Securities Transactions and Investment Income | |
|
| | | For financial statement purposes, the fund records security transactions on the trade date of the security purchase or sale. Dividend income is recorded on the ex-dividend date. Interest income, including accretion of bond discounts and amortization of bond premiums, is recorded on an accrual basis. Security gains and losses are determined on the basis of identified cost, which is the same basis used for federal income tax purposes. | |
|
| | | Reverse Repurchase Agreements | |
|
| | | Reverse repurchase agreements involve the sale of a portfolio-eligible security by the fund, coupled with an agreement to repurchase the security at a specified date and price. Reverse repurchase agreements may increase volatility of the fund's net asset value and involve the risk that interest costs on money borrowed may exceed the return on securities purchased with that borrowed money. Reverse repurchase agreements are considered to be borrowings by the fund, and are subject to the fund's overall restriction on borrowing under which it must maintain asset coverage of at least 300%. For the six-month period ended February 28, 2006, the weighted average borrowings outstanding were $20,494,194. The weighted average interest rate was 4.21%. | |
|
2006 Semiannual Report
American Income Fund
6
| Futures Transactions | |
|
| In order to protect against changes in interest rates, the fund may buy and sell interest rate futures contracts. Upon entering into a futures contract, the fund is required to deposit cash or pledge U.S. government securities in an amount equal to 5% of the purchase price indicated in the futures contract (initial margin). Subsequent payments, which are dependent on the daily fluctuations in the value of the underlying security or securities, are made or received by the fund each day (daily variation margin) and recorded as unrealized gains (losses) until the contract is closed. When the contract is closed, the fund records a realized gain (loss) equal to the difference between the proceeds from (or cost of) the closing transaction and the fund's basis in the contract. | |
|
| Risks of entering into futures contracts, in general, include the possibility that there will not be a perfect price correlation between the futures contracts and the underlying securities. Second, it is possible that a lack of liquidity for futures contracts could exist in the secondary market, resulting in an inability to close a futures position prior to its maturity date. Third, the purchase of a futures contract involves the risk that the fund could lose more than the original margin deposit required to initiate a futures transaction. These contracts involve market risk in excess of the amount reflected in the fund's statement of assets and liabilities. Unrealized gains (losses) on outstanding positions in futures contracts held at the close of the period will be recognized as capital gains (losses) for federal income tax purposes. | |
|
| Options Transactions | |
|
| The fund may utilize options in an attempt to manage market or business risk or enhance its yield. When a call or put option is written, an amount equal to the premium received is recorded as a liability. The liability is marked-to-market daily to reflect the current market value of the option written. When a written option expires, a gain is realized in the amount of the premium originally received. If a closing purchase contract is entered into, a gain or loss is realized in the amount of the original premium less the cost of the closing transaction. If a written call is exercised, a gain or loss is realized from the sale of the underlying security, and the proceeds from such sale are increased by the premium originally received. If a written put option is exercised, the amount of the premium originally received reduces the cost of the security that is purchased upon exercise of the option. | |
|
| Purchased options are recorded as investments and marked-to-market daily to reflect the current market value of the option contract. If a purchased option expires, a loss is realized in the amount of the cost of the option. If a closing transaction is entered into, a gain or loss is realized, to the extent that the proceeds from the sale are greater or less than the cost of the option. If a put option is exercised, a gain or loss is realized from the sale of the underlying security by adjusting the proceeds from such sale by the amount of the premium originally paid. If a call option is exercised, the cost of the security purchased upon exercise is increased by the premium originally paid. | |
|
| The fund had no options outstanding as of February 28, 2006. | |
|
| Transactions in options written for the six-month period ended February 28, 2006, were as follows: | |
|
| | | Put Options Written | | Call Options Written | |
| Balance at | | Number of
Contracts | | Premium
Amount | | Number of
Contracts | | Premium
Amount | |
| August 31, 2005 | | | 10 | | | $ | 4,496 | | | | 10 | | | $ | 3,715 | | |
| Opened | | | — | | | | — | | | | — | | | | — | | |
| Expired | | | — | | | | — | | | | — | | | | — | | |
| Closed | | | (10 | ) | | | (4,496 | ) | | | (10 | ) | | | (3,715 | ) | |
| February 28, 2006 | | | — | | | $ | — | | | | — | | | $ | — | | |
2006 Semiannual Report
American Income Fund
7
Notes to Financial STATEMENTS continued
| Securities Purchased on a When-Issued Basis | |
|
| Delivery and payment for securities that have been purchased by the fund on a when-issued or forward-commitment basis can take place a month or more after the transaction date. Such securities do not earn interest, are subject to market fluctuation, and may increase or decrease in value prior to their delivery. The fund segregates assets with a market value equal to or greater than the amount of its purchase commitments. The purchase of securities on a when-issued or forward-commitment basis may increase the volatility of the fund's net asset value if the fund makes such purchases while remaining substantially fully invested. As of February 28, 2006, the fund had $1,505,273 of when-issued or forward-commitment securities outstanding. | |
|
| In connection with the ability to purchase securities on a when-issued basis, the fund may also enter into dollar rolls in which the fund sells securities purchased on a forward-commitment basis and simultaneously contracts with a counterparty to repurchase similar (same type, coupon, and maturity), but not identical securities on a specified future date. As an inducement for the fund to "rollover" its purchase commitments, the fund receives negotiated amounts in the form of reductions of the purchase price of the commitment. Dollar rolls are considered a form of leverage. As of February 28, 2006, the fund had no outstanding dollar roll transactions. | |
|
| Illiquid Securities and Restricted Securities | |
|
| A security may be considered illiquid if it lacks a readily available market. Securities are generally considered liquid if they can be sold or disposed of in the ordinary course of business within seven days at approximately the value at which the security is valued by the fund. Illiquid securities may be valued under methods approved by the fund's board of directors as reflecting fair value. | |
|
| Illiquid securities may include restricted securities, which are often purchased in private placement transactions, are not registered under the Securities Act of 1933, and may have contractual restrictions on resale. However, certain restricted securities eligible for resale to qualified institutional investors, including Rule 144A securities, are not subject to the limitation on a fund's investment in illiquid securities if they are determined to be liquid in accordance with procedures adopted by the fund's board of directors. | |
|
| As of February 28, 2006, the fund held one illiquid security, the value of which was $12,875, which represents 0.02% of net assets. This security's valuation was furnished by an independent pricing service. As of February 28, 2006, there were no restricted securities. Information concerning the illiquid security, is as follows: | |
|
| Security | | Par | | Date
Acquired | | Cost
Basis | |
| California Federal Bank Los Angeles | | $ | 12,906 | | | | 7/93 | | | $ | 1,758 | | |
| Federal Taxes | |
|
| The fund intends to continue to qualify as a regulated investment company as provided in Subchapter M of the Internal Revenue Code, as amended, and to distribute all taxable income, if any, to its shareholders. Accordingly, no provision for federal income taxes is required. The fund also intends to distribute its taxable net investment income and realized gains, if any, to avoid the payment of any federal excise taxes. | |
|
2006 Semiannual Report
American Income Fund
8
| The tax character of distributions paid during the six-month period ended February 28, 2006, the ten-month fiscal period ended August 31, 2005 and the fiscal year ended October 31, 2004 were as follows: | |
|
| | | 2/28/06 | | 8/31/05 | | 10/31/04 | |
| Distributions paid from: | |
| Ordinary income | | $ | 2,410,827 | | | $ | 4,496,729 | | | $ | 5,975,168 | | |
| Return of capital | | | — | | | | 154,087 | | | | 51,902 | | |
| | | $ | 2,410,827 | | | $ | 4,650,816 | | | $ | 6,027,070 | | |
| At August 31, 2005, the components of accumulated deficit on a tax basis were as follows: | |
|
| Accumulated capital losses | | $ | (12,376,791 | ) | |
| Unrealized appreciation | | | 1,367,445 | | |
| Accumulated deficit | | $ | (11,009,346 | ) | |
| Distributions to Shareholders | |
|
| Distributions from net investment income are declared and paid on a monthly basis. Any net realized capital gains on sales of securities for the fund are distributed to shareholders at least annually. Such distributions are payable in cash or, pursuant to the fund's dividend reinvestment plan, reinvested in additional shares of the fund's capital stock. | |
|
| Repurchase Agreements | |
|
| For repurchase agreements entered into with broker-dealers, the fund, along with other affiliated registered investment companies, may transfer uninvested cash balances into a joint trading account, the daily aggregate balance of which is invested in repurchase agreements secured by U.S. government or agency obligations. Securities pledged as collateral for all individual and joint repurchase agreements are held by the fund's custodian bank until maturity of the repurchase agreement. All agreements require that the daily market value of the collateral be in excess of the repurchase amount, including accrued interest, to protect the fund in the event of a default. As of February 28, 2006, the fund had no outstanding repurchase agreements. | |
|
| Deferred Compensation Plan | |
|
| Under a Deferred Compensation Plan (the "Plan"), non-interested directors of the First American Fund family may participate and elect to defer receipt of their annual compensation. Deferred amounts are treated as though equivalent dollar amounts had been invested in shares of selected open-end First American Funds as designated by the board of directors. All amounts in the Plan are 100% vested and accounts under the Plan are obligations of the funds. Deferred amounts remain in the funds until distributed in accordance with the Plan. | |
|
| Use of Estimates in the Preparation of Financial Statements | |
|
| The preparation of financial statements, in conformity with U.S. generally accepted accounting principles, requires management to make estimates and assumptions that affect the reported amount of assets and liabilities at the date of the financial statements and the reported results of operations during the reporting period. Actual results could differ from these estimates. | |
|
| Reclassifications | |
|
| Certain amounts in the 2004 financial statements have been reclassified to conform to the current presentation. | |
|
2006 Semiannual Report
American Income Fund
9
Notes to Financial STATEMENTS continued
(3) Expenses
| | Investment Advisory Fees | |
|
| | | Pursuant to an investment advisory agreement (the "Agreement"), U.S. Bancorp Asset Management, Inc. ("USBAM"), a subsidiary of U.S. Bank National Association ("U.S. Bank"), manages the fund's assets and furnishes related office facilities, equipment, research, and personnel. The Agreement provides USBAM with a monthly investment advisory fee in an amount equal to an annualized rate of 0.65% of the fund's average weekly net assets. For its fee, USBAM provides investment advice, and in general, conducts the management and investment activities of the fund. | |
|
| | | The fund may invest in related money market funds that are series of First American Funds, Inc. ("FAF"), subject to certain limitations. In order to avoid the payment of duplicative investment advisory fees to USBAM, which acts as the investment advisor to both the fund and the related money market funds, USBAM will reimburse the fund an amount equal to the investment advisory fee received from the related money market funds that is attributable to the assets of the fund. For financial statement purposes, this reimbursement is recorded as investment income. | |
|
| | | Administrative Fees | |
|
| | | USBAM serves as the fund's administrator pursuant to an administration agreement between USBAM and the fund. Under this administration agreement, USBAM receives a monthly administrative fee equal to an annualized rate of 0.10% of the fund's average weekly net assets. For its fee, USBAM provides numerous services to the fund including, but not limited to, handling the general business affairs, financial and regulatory reporting, and various other services. | |
|
| | | Custodian Fees | |
|
| | | U.S. Bank serves as the fund's custodian pursuant to a custodian agreement with the fund. The custodian fee charged to the fund is equal to an annual rate of 0.005% of average weekly net assets. These fees are computed weekly and paid monthly. | |
|
| | | Under this agreement, interest earned on uninvested cash balances is used to reduce a portion of the fund's custodian expenses. These credits, if any, are disclosed as "Indirect payments from the custodian" in the Statement of Operations. Conversely, the custodian charges a fee for any cash overdrafts incurred, which will increase the fund's custodian expenses. For the six-month period ended February 28, 2006, custodian fees were reduced by $847 as a result of interest earned. There were no overdraft charges during the period. | |
|
| | | Other Fees and Expenses | |
|
| | | In addition to the investment advisory, administrative, and custodian fees, the fund is responsible for paying most other operating expenses, including: legal, auditing, and accounting services, postage and printing of shareholder reports, transfer agent fees and expenses, listing fees, outside directors' fees and expenses, insurance, interest, taxes, and other miscellaneous expenses. For the six-month period ended February 28, 2006, legal fees and expenses were paid to a law firm of which an Assistant Secretary of the fund is a partner. | |
|
| (4) Investment Security Transactions | | Cost of purchases and proceeds from sales of securities, other than temporary investments in short-term securities, for the six-month period ended February 28, 2006, aggregated $28,669,757 and $40,920,672, respectively. | |
|
| (5) Capital Loss Carryover | | For federal income tax purposes, the fund had capital loss carryovers at August 31, 2005, which, if not offset by subsequent capital gains, will expire on the fund's fiscal year-ends as indicated below. | |
|
Capital Loss
Carryover | | Expiration | |
| $ | 847,451 | | | | 2006 | | |
| | 2,573,283 | | | | 2007 | | |
| | 4,931,683 | | | | 2008 | | |
| | 662,186 | | | | 2009 | | |
| | 3,362,188 | | | | 2010 | | |
| $ | 12,376,791 | | | | | | |
2006 Semiannual Report
American Income Fund
10
| (6) Indemnifications | | The fund enters into contracts that contain a variety of indemnifications. The fund's maximum exposure under these arrangements is unknown. However, the fund has not had prior claims or losses pursuant to these contracts and expects the risk of loss to be remote. | |
|
(7) Investment Advisor Name
Change | | Effective March 31, 2006, USBAM changed its name to FAF Advisors, Inc. | |
|
| (8) Financial Highlights | | Per-share data for a share of capital stock outstanding throughout each period and selected information for each period are as follows: | |
|
| | | Six-Month
Period Ended
2/28/06 | | Ten-Month
Fiscal
Period Ended | |
| | | (unaudited) | | 8/31/05 | |
| Per-Share Data | | | | | | | | | |
| Net asset value, beginning of period | | $ | 8.98 | | | $ | 9.17 | | |
| Operations: | |
| Net investment income | | | 0.27 | | | | 0.48 | | |
Net realized and unrealized gains (losses)
on investments | | | (0.15 | ) | | | (0.18 | ) | |
| Total from operations | | | 0.12 | | | | 0.30 | | |
| Distributions to shareholders: | |
| From net investment income | | | (0.26 | ) | | | (0.47 | ) | |
| Tax return of capital | | | — | | | | (0.02 | ) | |
| Total distributions to shareholders | | | (0.26 | ) | | | (0.49 | ) | |
| Net asset value, end of period | | $ | 8.84 | | | $ | 8.98 | | |
| Market value, end of period | | $ | 7.83 | | | $ | 8.13 | | |
| Selected Information | | | | | | | | | |
| Total return, net asset value (a) | | | 1.69 | % (h) | | | 3.86 | % (h) | |
| Total return, market value (b) | | | (0.51 | )% (h) | | | 0.85 | % (h) | |
| Net assets at end of period (in millions) | | $ | 84 | | | $ | 85 | | |
Ratio of expenses to average weekly net assets
excluding interest expense | | | 1.00 | % (g) | | | 0.96 | % (g) | |
| Ratio of expenses to average weekly net assets | | | 2.04 | % (g) | | | 1.62 | % (g) | |
Ratio of net investment income to average
weekly net assets | | | 6.09 | % (g) | | | 6.35 | % (g) | |
| Portfolio turnover rate | | | 27 | % | | | 168 | % | |
Amount of borrowings outstanding at
end of period (in millions) | | $ | 19 | | | $ | 23 | | |
Per-share amount of borrowings outstanding at
end of period | | $ | 2.02 | | | $ | 2.45 | | |
Per-share amount of net assets, excluding
borrowings, at end of period | | $ | 10.86 | | | $ | 11.43 | | |
| Asset coverage ratio (c) | | | 536 | % | | | 467 | % | |
| | |
Year Ended October 31, | |
| | | 2004 | | 2003 | | 2002 | | 2001 | | 2000 (d) | |
| Per-Share Data | | | | | | | | | | | | | | | | | | | | | |
| Net asset value, beginning of period | | $ | 9.06 | | | $ | 8.70 | | | $ | 9.19 | | | $ | 8.90 | | | $ | 9.23 | | |
| Operations: | |
| Net investment income | | | 0.64 | | | | 0.67 | | | | 0.70 | | | | 0.65 | | | | 0.68 | | |
Net realized and unrealized gains (losses)
on investments | | | 0.11 | | | | 0.37 | | | | (0.50 | ) | | | 0.26 | | | | (0.29 | ) | |
| Total from operations | | | 0.75 | | | | 1.04 | | | | 0.20 | | | | 0.91 | | | | 0.39 | | |
| Distributions to shareholders: | |
| From net investment income | | | (0.64 | ) | | | (0.68 | ) | | | (0.69 | ) | | | (0.59 | ) | | | (0.67 | ) | |
| Tax return of capital | | | — | (e) | | | — | (e) | | | — | | | | (0.03 | ) | | | (0.05 | ) | |
| Total distributions to shareholders | | | (0.64 | ) | | | (0.68 | ) | | | (0.69 | ) | | | (0.62 | ) | | | (0.72 | ) | |
| Net asset value, end of period | | $ | 9.17 | | | $ | 9.06 | | | $ | 8.70 | | | $ | 9.19 | | | $ | 8.90 | | |
| Market value, end of period | | $ | 8.55 | | | $ | 8.55 | | | $ | 8.37 | | | $ | 8.53 | | | $ | 8.60 | | |
| Selected Information | | | | | | | | | | | | | | | | | | | | | |
| Total return, net asset value (a) | | | 9.02 | % | | | 12.53 | % | | | 2.48 | % | | | 10.96 | % | | | 5.97 | % | |
| Total return, market value (b) | | | 7.71 | % | | | 10.38 | % | | | 6.22 | % | | | 13.69 | % | | | 17.20 | % | |
| Net assets at end of period (in millions) | | $ | 87 | | | $ | 86 | | | $ | 82 | | | $ | 87 | | | $ | 105 | | |
Ratio of expenses to average weekly net assets
excluding interest expense | | | 0.93 | % | | | 0.95 | % | | | 0.96 | % | | | 0.89 | % | | | 1.06 | % | |
| Ratio of expenses to average weekly net assets | | | 1.23 | % | | | 1.48 | % | | | 2.00 | % | | | 2.06 | % | | | 1.59 | % | |
Ratio of net investment income to average
weekly net assets | | | 7.00 | % | | | 7.49 | % | | | 7.88 | % | | | 7.37 | % | | | 7.52 | % | |
| Portfolio turnover rate | | | 193 | % (f) | | | 135 | % | | | 54 | % | | | 82 | % | | | 65 | % | |
Amount of borrowings outstanding at
end of period (in millions) | | $ | 22 | | | $ | 10 | | | $ | 33 | | | $ | 33 | | | $ | — | | |
Per-share amount of borrowings outstanding at
end of period | | $ | 2.28 | | | $ | 1.04 | | | $ | 3.48 | | | $ | 3.46 | | | $ | — | | |
Per-share amount of net assets, excluding
borrowings, at end of period | | $ | 11.45 | | | $ | 10.10 | | | $ | 12.18 | | | $ | 12.66 | | | $ | 8.90 | | |
| Asset coverage ratio (c) | | | 502 | % | | | 970 | % | | | 350 | % | | | 366 | % | | | N/A | | |
(a) Assumes reinvestment of distributions at net asset value.
(b) Assumes reinvestment of distributions at actual prices pursuant to the fund's dividend reinvestment plan.
(c) Represents net assets, excluding borrowings, at end of period divided by borrowings outstanding at end of period.
(d) Effective October 24, 2000, the advisor was changed from Mentor Investment Advisors, a wholly-owned subsidiary of First Union Corporation, to U.S. Bank National Association, acting through its First American Asset Management division. U.S. Bancorp Asset Management, Inc., a subsidiary of U.S. Bank National Association, is the successor to First American Asset Management.
(e) Less than $0.01 per share.
(f) The large turnover is due to increased activity in mortgage dollar roll transactions.
(g) Annualized.
(h) Total return has not been annualized.
2006 Semiannual Report
American Income Fund
11
Schedule of INVESTMENTS (unaudited)
American Income Fund February 28, 2006
| Description of Security | | Par
Value | |
Value (a) | |
| (Percentages of each investment category relate to net assets) | |
| High Yield Corporate Bonds — 36.5% | |
| Basic Industry — 3.0% | |
| Abitibi-Consolidated, 8.55%, 8/1/10 | | $ | 170,000 | | | $ | 167,025 | | |
| Allegheny Technologies, 8.38%, 12/15/11 | | | 110,000 | | | | 120,312 | | |
| Caraustar Industries, Callable 4/1/06 @ 105.25, 9.88%, 4/1/11 | | | 300,000 | | | | 315,750 | | |
| Georgia-Pacific, 8.88%, 5/15/31 | | | 200,000 | | | | 210,000 | | |
| Borden U.S., Callable 7/15/09 @ 104.50, 9.00%, 7/15/14 | | | 250,000 | | | | 258,125 | | |
| Huntsman ICI Chemicals, Callable 4/17/06 @ 103.38, 10.13%, 7/1/09 | | | 105,000 | | | | 107,625 | | |
| LPG International, 7.25%, 12/20/15 (c) | | | 250,000 | | | | 250,688 | | |
| Newark Group, Callable 3/15/09 @ 104.88, 9.75%, 3/15/14 | | | 200,000 | | | | 176,000 | | |
| OM Group, Callable 12/15/06 @ 104.62, 9.25%, 12/15/11 | | | 300,000 | | | | 300,000 | | |
| Polyone, 8.88%, 5/1/12 | | | 200,000 | | | | 204,500 | | |
| Southern Peru Copper, 7.50%, 7/27/35 | | | 200,000 | | | | 210,250 | | |
| Stone Container, Callable 7/1/07 @ 104.19, 8.38%, 7/1/12 | | | 200,000 | | | | 197,000 | | |
| | | | | | | | 2,517,275 | | |
| Brokerage — 0.6% | |
| E*Trade Financial, Callable 6/15/08 @ 104.00, 8.00%, 6/15/11 | | | 250,000 | | | | 263,125 | | |
| Lazard, 7.13%, 5/15/15 | | | 250,000 | | | | 264,151 | | |
| | | | | | | | 527,276 | | |
| Capital Goods — 2.7% | |
| Case New Holland, Callable 8/1/07 @ 104.62, 9.25%, 8/1/11 | | | 200,000 | | | | 214,750 | | |
| Compression Polymers, Callable 7/1/09 @ 105.25, 10.50%, 7/1/13 (c) | | | 250,000 | | | | 251,250 | | |
| Graham Packaging, Callable 10/15/09 @ 104.94, 9.88%, 10/15/14 | | | 250,000 | | | | 252,812 | | |
| Greif Brothers, Callable 8/1/07 @ 104.44, 8.88%, 8/1/12 | | | 300,000 | | | | 319,125 | | |
| L-3 Communications, Callable 1/15/10 @ 102.94, 5.88%, 1/15/15 | | | 200,000 | | | | 193,000 | | |
| Owens-Broadway Glass Container, Callable 4/17/06 @ 104.44, 8.88%, 2/15/09 | | | 500,000 | | | | 521,875 | | |
| Sequa, 9.00%, 8/1/09 | | | 500,000 | | | | 537,500 | | |
| | | | | | | | 2,290,312 | | |
| Communications — 4.9% | |
| Charter Communications Holdings, 8.00%, 4/30/12 (c) | | | 400,000 | | | | 402,000 | | |
| Citizens Communications, 9.25%, 5/15/11 | | | 250,000 | | | | 276,875 | | |
| CSC Holdings, Series B, 7.63%, 4/1/11 | | | 250,000 | | | | 253,125 | | |
| Dex Media, Callable 11/15/08 @ 104.00, 8.00%, 11/15/13 | | | 200,000 | | | | 206,500 | | |
| DirectTV Holdings, Callable 3/15/08 @ 104.19, 8.38%, 3/15/13 | | | 81,000 | | | | 87,277 | | |
| Echostar, 6.63%, 10/1/14 | | | 300,000 | | | | 291,750 | | |
| Horizon PCS, Callable 7/15/08 @ 105.69, 11.38%, 7/15/12 | | | 200,000 | | | | 229,500 | | |
| Houghton-Mifflin, Callable 10/15/08 @ 105.75, 0.00% through 10/15/08 thereafter 11.50%, 10/15/13 (b) | | | 400,000 | | | | 334,000 | | |
| Insight Midwest, Callable 11/1/05 @ 105.25, 10.50%, 11/1/10 | | | 200,000 | | | | 210,750 | | |
| Intelsat, Callable 1/15/10 @ 104.31, 8.63%, 1/15/15 (c) | | | 250,000 | | | | 258,437 | | |
| Panamsat, Callable 8/15/09 @ 104.50, 9.00%, 8/15/14 | | | 195,000 | | | | 206,212 | | |
| Qwest, 8.88%, 3/15/12 | | | 400,000 | | | | 449,000 | | |
| Qwest Capital Funding, 7.00%, 8/3/09 | | | 400,000 | | | | 408,000 | | |
| Rogers Wireless, 6.38%, 3/1/14 | | | 300,000 | | | | 303,750 | | |
| Time Warner Telecommunications Holdings, Callable 2/15/09 @ 104.62, 9.25%, 2/15/14 | | | 175,000 | | | | 188,781 | | |
| | | | | | | | 4,105,957 | | |
| Consumer Cyclical — 5.2% | |
| Buffets, Callable 7/15/06 @ 105.63, 11.25%, 7/15/10 | | | 200,000 | | | | 208,000 | | |
| Dominos, Series B, Callable 7/1/07 @ 104.13, 8.25%, 7/1/11 | | | 364,000 | | | | 378,105 | | |
| Ford Motor, 7.00%, 10/1/13 | | | 500,000 | | | | 439,796 | | |
| Hovnanian K Enterprises, 6.25%, 1/15/16 | | | 250,000 | | | | 230,625 | | |
| Isle of Capri Casinos, Callable 3/1/09 @ 103.50, 7.00%, 3/1/14 | | | 500,000 | | | | 501,250 | | |
| Landry's Restaurants, Series B, Callable 12/15/09 @ 103.75, 7.50%, 12/15/14 | | | 250,000 | | | | 242,188 | | |
See accompanying Notes to Schedule of Investments.
2006 Semiannual Report
American Income Fund
12
American Income Fund February 28, 2006
| Description of Security | | Par
Value | |
Value (a) | |
| Mandalay Resort, Series B, 10.25%, 8/1/07 | | $ | 250,000 | | | $ | 265,000 | | |
| Mohegan Tribal Gaming, 6.38%, 7/15/09 | | | 250,000 | | | | 251,250 | | |
| Neiman Marcus Group, Callable 10/15/10 @ 105.19, 10.38%, 10/15/15 (c) | | | 300,000 | | | | 316,500 | | |
| Service Corporation International, 7.70%, 4/15/09 | | | 500,000 | | | | 523,750 | | |
| Six Flags, Callable 4/15/08 @ 104.88, 9.75%, 4/15/13 | | | 250,000 | | | | 255,000 | | |
| WCI Communities, Callable 5/1/07 @ 104.56, 9.13%, 5/1/12 | | | 500,000 | | | | 506,250 | | |
| Wynn Las Vegas, Callable 12/1/09 @ 103.31, 6.63%, 12/1/14 | | | 250,000 | | | | 246,875 | | |
| | | | | | | | 4,364,589 | | |
| Consumer NonCyclical — 2.2% | |
| Ahold Finance USA, 8.25%, 7/15/10 | | | 300,000 | | | | 321,000 | | |
| Delhaize America, 9.00%, 4/15/31 | | | 250,000 | | | | 297,799 | | |
| Iasis Healthcare, Callable 6/15/09 @ 104.38, 8.75%, 6/15/14 | | | 250,000 | | | | 255,938 | | |
| RJ Reynolds Tobacco Holdings, 6.50%, 7/15/10 (c) | | | 250,000 | | | | 251,875 | | |
| Stater Brothers Holdings, Callable 6/15/08 @ 104.06, 8.13%, 6/15/12 | | | 250,000 | | | | 252,500 | | |
| Swift & Co., Callable 10/1/06 @ 106.25, 12.50%, 1/1/10 | | | 250,000 | | | | 248,125 | | |
| Triad Hospitals, Callable 11/15/08 @ 103.50, 7.00%, 11/15/13 | | | 200,000 | | | | 202,000 | | |
| | | | | | | | 1,829,237 | | |
| Electric — 2.5% | |
| CMS Energy, 8.50%, 4/15/11 | | | 500,000 | | | | 546,250 | | |
| Dynegy – Roseton Danskammer, Series B, 7.67%, 11/8/16 | | | 200,000 | | | | 205,500 | | |
| Mission Energy Holdings, 13.50%, 7/15/08 | | | 250,000 | | | | 288,750 | | |
| Nevada Power, Callable 8/15/08 @ 104.50, 9.00%, 8/15/13 | | | 262,000 | | | | 289,824 | | |
| Reliant Energy, Callable 7/15/08 @ 104.75, 9.50%, 7/15/13 | | | 250,000 | | | | 255,000 | | |
| Teco Energy, 7.20%, 5/1/11 | | | 250,000 | | | | 264,063 | | |
| TXU, Series P, 5.55%, 11/15/14 | | | 250,000 | | | | 238,319 | | |
| | | | | | | | 2,087,706 | | |
| Energy — 0.7% | |
| Bluewater Finance, Callable 2/15/07 @ 105.12, 10.25%, 2/15/12 | | | 290,000 | | | | 313,200 | | |
| Harvest Operations, Callable 10/15/08 @ 103.94, 7.88%, 10/15/11 | | | 250,000 | | | | 250,625 | | |
| | | | | | | | 563,825 | | |
| Industrials Other (c) — 0.6% | |
| Amsted Industries, Callable 10/15/07 @ 105.12, 10.25%, 10/15/11 | | | 200,000 | | | | 216,000 | | |
| Chart Industries, Callable 10/15/10 @ 104.56, 9.13%, 10/15/15 | | | 300,000 | | | | 311,250 | | |
| | | | | | | | 527,250 | | |
| Insurance — 0.3% | |
| Fairfax Financial Holdings, 7.75%, 4/26/12 | | | 250,000 | | | | 237,500 | | |
| Miscellaneous (c) — 6.6% | |
| Dow Jones, 7.25%, 12/29/10 | | | 3,500,000 | | | | 3,500,000 | | |
| Dow Jones, 8.25%, 6/29/10 | | | 30,450 | | | | 30,755 | | |
| Dow Jones, 8.75%, 12/29/10 | | | 1,960,000 | | | | 2,004,100 | | |
| | | | | | | | 5,534,855 | | |
| Natural Gas — 1.5% | |
| El Paso, 7.75%, 6/15/10 | | | 200,000 | | | | 208,500 | | |
| SemGroup, Callable 11/15/10 @ 104.38, 8.75%, 11/15/15 (c) | | | 250,000 | | | | 259,375 | | |
| Tennessee Gas Pipeline, 7.50%, 4/1/17 | | | 250,000 | | | | 274,688 | | |
| Williams, 7.13%, 9/1/11 | | | 500,000 | | | | 524,375 | | |
| | | | | | | | 1,266,938 | | |
| Sovereign — 4.7% | |
| Federal Republic of Brazil | |
| 7.13%, 1/20/37 | | | 250,000 | | | | 266,000 | | |
| 7.88%, 3/7/15 | | | 500,000 | | | | 560,000 | | |
| 10.25%, 6/17/13 | | | 500,000 | | | | 623,750 | | |
See accompanying Notes to Schedule of Investments.
2006 Semiannual Report
American Income Fund
13
Schedule of INVESTMENTS (unaudited) continued
American Income Fund February 28, 2006
| Description of Security | | Par
Value | |
Value (a) | |
| Republic of Panama | |
| 7.13%, 1/29/26 | | $ | 500,000 | | | $ | 529,250 | | |
| 7.25%, 3/15/15 | | | 500,000 | | | | 538,250 | | |
| Republic of Philippines, 8.38%, 2/15/11 | | | 500,000 | | | | 540,625 | | |
| Republic of Turkey, 9.00%, 6/30/11 | | | 500,000 | | | | 570,625 | | |
| Republic of Uruguay, 8.00%, 11/18/22 | | | 250,000 | | | | 270,625 | | |
| | | | | | | | 3,899,125 | | |
| Technology — 0.3% | |
| Lucent Technologies, 6.45%, 3/15/29 | | | 250,000 | | | | 210,000 | | |
| Transportation — 0.7% | |
| Continental Airlines, 7.57%, 3/15/20 | | | 313,565 | | | | 293,967 | | |
| Hertz, Callable 1/1/10 @ 104.44, 8.88%, 1/1/14 (c) | | | 250,000 | | | | 261,250 | | |
| | | | | | | | 555,217 | | |
Total High Yield Corporate Bonds
(cost: $29,687,860) | | | | | | | 30,517,062 | | |
| U.S. Government Agency Mortgage-Backed Securities — 32.3% | |
| Adjustable Rate (f) — 1.3% | |
| Federal Home Loan Mortgage Corporation, 4.96%, 9/1/18, #605911 | | | 240 | | | | 245 | | |
| Federal National Mortgage Association | |
| 5.41%, 7/1/27, #70179 | | | 2,787 | | | | 2,850 | | |
| 5.56%, 10/1/32, #725110 (h) | | | 645,286 | | | | 657,647 | | |
| Government National Mortgage Association, 5.13%, 12/20/22, #8096 (h) | | | 399,734 | | | | 405,397 | | |
| | | | | | | | 1,066,139 | | |
| Fixed Rate —31.0% | |
| Federal Home Loan Mortgage Corporation, 6.50%, 8/1/30, #C43641 | | | 139,835 | | | | 143,767 | | |
| Federal Home Loan Mortgage Corporation Gold | |
| 6.50%, 11/1/28, #C00676 | | | 385,711 | | | | 396,560 | | |
| 5.50%, 10/1/33, #A15120 (h) | | | 1,366,671 | | | | 1,356,848 | | |
| Federal National Mortgage Association | |
| 4.00%, 11/1/10, #254956 (h) | | | 2,187,097 | | | | 2,118,067 | | |
| 6.00%, 12/1/13, #190179 | | | 443,890 | | | | 449,578 | | |
| 7.50%, 5/1/15, #537440 (h) | | | 78,011 | | | | 81,676 | | |
| 7.00%, 6/1/17, #254384 (h) | | | 330,257 | | | | 343,811 | | |
| 7.00%, 7/1/17, #254414 (h) | | | 419,087 | | | | 436,287 | | |
| 6.00%, 9/1/17, #653368 (h) | | | 369,213 | | | | 376,751 | | |
| 5.00%, 11/1/18, #750989 (h) | | | 684,590 | | | | 677,245 | | |
| 5.00%, 2/1/19, #767182 (h) | | | 1,103,333 | | | | 1,088,047 | | |
| 6.00%, 5/1/29, #323702 | | | 647,690 | | | | 657,001 | | |
| 6.50%, 5/1/31, #540814 | | | 158,786 | | | | 163,252 | | |
| 7.00%, 9/1/31, #596680 (h) | | | 571,200 | | | | 590,656 | | |
| 7.00%, 3/1/32, #635970 | | | 269,932 | | | | 279,127 | | |
| 6.50%, 6/1/32, #596712 (h) | | | 729,200 | | | | 746,518 | | |
| 5.50%, 6/1/33, #709700 (h) | | | 916,927 | | | | 910,337 | | |
| 5.50%, 11/1/33, #555967 | | | 2,233,352 | | | | 2,217,300 | | |
| 6.00%, 11/1/33, #743642 (h) | | | 672,826 | | | | 679,554 | | |
| 5.50%, 12/1/33, #756202 (h) | | | 1,286,398 | | | | 1,276,348 | | |
| 6.00%, 1/1/34, #763687 (h) | | | 1,168,472 | | | | 1,180,157 | | |
| 5.50%, 2/1/34, #766070 (h) | | | 1,167,617 | | | | 1,158,495 | | |
| 6.00%, 1/1/35, #810225 | | | 1,046,555 | | | | 1,056,366 | | |
| 6.50%, 2/1/35, #735273 (h) | | | 1,380,923 | | | | 1,416,741 | | |
| 5.50%, 3/1/35, #815979 | | | 1,910,939 | | | | 1,893,621 | | |
| Federal National Mortgage Association (When-Issued Security), 5.50%, 4/1/21 (i) | | | 1,500,000 | | | | 1,504,219 | | |
See accompanying Notes to Schedule of Investments.
2006 Semiannual Report
American Income Fund
14
American Income Fund February 28, 2006
| Description of Security | | Par
Value | |
Value (a) | |
| Government National Mortgage Association | |
| 6.50%, 4/15/33, #602233 | | $ | 490,395 | | | $ | 511,186 | | |
| 5.50%, 8/15/33, #604567 (h) | | | 1,454,494 | | | | 1,459,494 | | |
| 6.00%, 7/15/34, #631574 (h) | | | 722,896 | | | | 736,902 | | |
| | | | | | | | 25,905,911 | | |
Total U.S. Government Agency Mortgage-Backed Securities
(cost: $27,335,406) | | | | | | | 26,972,050 | | |
| Collateralized Mortgage Obligation-Private Mortgage-Backed Securities — 25.8% | |
| Adjustable Rate (f) — 5.0% | |
| California Federal Bank Los Angeles, Series 1991-C12, Class A, 6.15%, 7/15/21(g) | | | 12,906 | | | | 12,875 | | |
| Goldman Sachs Mortgage Securities, Series 2003-1, Class B2, 6.91%, 3/25/43 | | | 1,921,377 | | | | 1,951,108 | | |
| Sequoia Mortgage Trust, Series 2004-5, Class X1, 0.80%, 6/20/34 (d) | | | 53,738,708 | | | | 424,600 | | |
| Washington Mutual MCS Mortgage, Series 2003-AR3, Class B1, 4.96%, 6/25/33 (j) | | | 1,433,262 | | | | 1,485,931 | | |
| Wells Fargo Mortgage-Backed Securities Trust, Series 2003-D, Class A1, 4.82%, 2/25/33 | | | 269,907 | | | | 273,349 | | |
| | | | | | | | 4,147,863 | | |
| Fixed Rate — 20.8% | |
| Citicorp Mortgage Securities | |
| Series 2004-5, Class B3, 5.27%, 8/25/34 | | | 1,228,294 | | | | 1,133,648 | | |
| Series 2005-4, Class 1A6, 5.50%, 7/25/35 | | | 1,000,000 | | | | 965,715 | | |
| Countrywide Alternative Loan Trust Series 2005-7CB, Class 2A4, 5.50%, 4/25/35 | | | 750,000 | | | | 733,358 | | |
| Crown Castle Towers LLC, 5.61%, 6/15/35 | | | 1,000,000 | | | | 959,747 | | |
| GMAC Mortgage Corporation Loan Trust | |
| Series 2003-GH2, Class A3, 5.00%, 3/25/23 | | | 1,500,000 | | | | 1,480,571 | | |
| Series 2003-J9, Class A15, 5.00%, 1/25/34 | | | 1,325,000 | | | | 1,277,381 | | |
| Series 2004-J5, Class A7, 6.50%, 1/25/35 | | | 1,028,930 | | | | 1,034,671 | | |
| Goldman Sachs Mortgage Securities Series 2001-2, Class A, 7.50%, 6/19/32 (c) | | | 425,812 | | | | 441,863 | | |
| GRP/AG Real Estate Asset Trust | |
| Series 2004-2, Class A, 4.21%, 7/25/34 (b) (c) | | | 187,553 | | | | 183,494 | | |
| Series 2005-1, Class A, 4.85%, 1/25/35 (b) (c) | | | 124,001 | | | | 122,785 | | |
| Morgan Stanley Mortgage Loan Trust Series 2004-9, Class 1A, 6.25%, 11/25/34 | | | 867,154 | | | | 868,219 | | |
| Nomura Asset Acceptance Corporation Series 2004-R2, Class B1, 6.74%, 10/25/34 (c) | | | 1,115,784 | | | | 1,128,488 | | |
| Prime Mortgage Trust | |
| Series 2004-2, Class B2, 5.04%, 11/25/19 | | | 404,256 | | | | 384,541 | | |
| Series 2004-2, Class B3, 5.04%, 11/25/19 | | | 302,958 | | | | 283,005 | | |
| Residential Accredit Loans Series 2003-QS12, Class M1, 5.00%, 6/25/18 | | | 1,001,626 | | | | 954,249 | | |
| Residential Asset Mortgage Products | |
| Series 2003-SL1, Class M2, 7.32%, 4/25/31 | | | 1,066,612 | | | | 1,064,347 | | |
| Series 2004-SL4, Class A3, 6.50%, 7/25/32 | | | 939,568 | | | | 950,943 | | |
| Residential Asset Securitization Trust Series 2002-A12, Class 1A1, 5.20%, 11/25/32 | | | 36,414 | | | | 36,189 | | |
| Structured Asset Securities Corporation Series 2005-6, Class 5A6, 5.00%, 5/25/35 | | | 1,000,000 | | | | 978,813 | | |
| Washington Mutual MSC Mortgage Series 2003-MS9, Class CB2, 7.45%, 12/25/33 | | | 413,074 | | | | 410,193 | | |
| Wells Fargo Mortgage-Backed Securities Trust | |
| Series 2003-7, Class A3, 4.50%, 8/25/18 (j) | | | 937,426 | | | | 911,215 | | |
| Series 2004-7, Class B2, 4.72%, 7/25/19 | | | 681,882 | | | | 641,090 | | |
| Series 2004-7, Class B3, 4.72%, 7/25/19 | | | 511,641 | | | | 464,984 | | |
| | | | | | | | 17,409,509 | | |
Total Collateralized Mortgage Obligation-Private Mortgage-Backed Securities
(cost:$22,317,855) | | | | | | | 21,557,372 | | |
See accompanying Notes to Schedule of Investments.
2006 Semiannual Report
American Income Fund
15
Schedule of INVESTMENTS (unaudited) continued
American Income Fund February 28, 2006
| Description of Security | | Par
Value | |
Value (a) | |
| Asset-Backed Securities — 12.3% | |
| Commercial — 0.1% | |
| Morgan Stanley Capital, Series 1999-FNV1, Class A1, 6.12%, 3/15/31 (j) | | $ | 107,088 | | | $ | 107,080 | | |
| Home Equity — 10.7% | |
| Ace Securities, Series 2003-OP1, Class M3, 6.23%, 12/25/33 (b) (f) (k) | | | 1,500,000 | | | | 1,519,016 | | |
| First Franklin Mortgage Loan, Series 2004-FFA, Class M2F, 4.62%, 3/25/24 (b) (j) | | | 2,760,000 | | | | 2,707,532 | | |
| Home Equity Mortgage Trust, Series 2004-6, Class M2, 5.32%, 4/25/35 (b) (j) | | | 500,000 | | | | 484,721 | | |
| Residential Funding Mortgage Securities I | |
| Series 2004-HI2, Class A4, 5.24%, 9/25/18 | | | 2,000,000 | | | | 1,992,026 | | |
| Series 2003-HI4, Class M1, 5.53%, 2/25/29 (b) (j) | | | 2,327,000 | | | | 2,254,554 | | |
| | | | | | | | 8,957,849 | | |
| Manufactured Housing — 1.5% | |
| Green Tree Financial, Series 1994-2, Class A5, 8.30%, 5/15/19 (j) | | | 444,181 | | | | 447,421 | | |
| Origen Manufactured Hsg, Series 2005-B, Class M1, 5.99%, 1/15/37 | | | 750,000 | | | | 749,198 | | |
| | | | | | | | 1,196,619 | | |
Total Asset-Backed Securities
(cost: $10,420,328) | | | | | | | 10,261,548 | | |
| Collateralized Mortgage Obligation-U.S. Agency Mortgage-Backed Securities — 12.7% | |
| Fixed Rate – 7.7% | |
| Federal Home Loan Mortgage Corporation | |
| Series 2690, Class OE, 5.00%, 11/15/28 (h) | | | 1,274,000 | | | | 1,241,781 | | |
| Federal National Mortgage Association | |
| Series 2004-27, Class HB, 4.00%, 5/25/19 (j) | | | 1,923,137 | | | | 1,724,343 | | |
| Series 2004-29, Class WG, 4.50%, 5/25/19 | | | 942,115 | | | | 871,782 | | |
| Series 2004-90, Class GA, 4.35%, 3/25/34 | | | 970,822 | | | | 929,439 | | |
| Series 2002-WI, Class 2A, 7.50%, 2/25/42 (j) | | | 620,122 | | | | 634,920 | | |
| Freddie Mac, Series 2972 | |
| Class KA, 4.50%, 6/15/18 | | | 1,044,067 | | | | 1,019,714 | | |
| | | | | | | | 6,421,979 | | |
| Z-Bonds (e) — 5.0% | |
| Federal Home Loan Mortgage Corporation | |
| Series 2676, Class GZ, 4.50%, 9/15/33 | | | 1,690,047 | | | | 1,396,760 | | |
| Government National Mortgage Association | |
| Series 2001-8, Class Z, 6.50%, 3/20/31 (h) | | | 2,750,735 | | | | 2,809,349 | | |
| | | | | | | | 4,206,109 | | |
Total Collateralized Mortgage Obligation-U.S. Agency Mortgage-Backed Securities
(cost: $10,299,575) | | | | | | | 10,628,088 | | |
| Corporate Bonds — 1.4% | |
| Basic Industry — 0.3% | |
| Vale Overseas, 6.25%, 1/11/16 (b) | | | 250,000 | | | | 255,000 | | |
| Communications — 0.2% | |
| AT&T, 9.05% through 5/15/06 thereafter 7.30%, 11/15/11 (b) | | | 142,000 | | | | 155,444 | | |
| Consumer NonCyclical — 0.3% | |
| Glencore Funding, 6.00%, 4/15/14 (c) | | | 250,000 | | | | 234,211 | | |
| Transportation — 0.6% | |
| American Airlines, Series 99-1, 7.02%, 10/15/09 | | | 500,000 | | | | 517,500 | | |
Total Corporate Bonds
(cost: $1,122,302) | | | | | | | 1,162,155 | | |
See accompanying Notes to Schedule of Investments.
2006 Semiannual Report
American Income Fund
16
American Income Fund February 28, 2006
| Description of Security | | Shares/
Par Value | |
Value (a) | |
| Short-Term Investments — 2.7% | |
| Affiliated Money Market Fund — 2.6% | |
| First American Prime Obligations Fund, Class Z (l) | | | 2,172,757 | | | $ | 2,172,757 | | |
| U.S. Treasury Obligations — 0.1% | |
| U.S. Treasury Bill, 4.31%, 4/20/06 (m) | | $ | 65,000 | | | | 64,611 | | |
| U.S. Treasury Bill, 4.46%, 5/18/06 (m) | | | 40,000 | | | | 39,614 | | |
Total U.S. Treasury Obligations
(cost: $104,225) | | | | | | | 104,225 | | |
Total Short-Term Investments
(cost: $2,276,982) | | | | | | | 2,276,982 | | |
Total Investments in Securities (n) — 123.7%
(cost: $103,460,308) | | | | | | $ | 103,375,257 | | |
Notes to Schedule of Investments:
(a) Securities are valued in accordance with procedures described in note 2 in Notes to Financial Statements.
(b) Delayed interest (Step Bonds) – Securities for which the coupon rate of interest will adjust on specified future date(s).
(c) Securities sold within the terms of a private placement memorandum, exempt from registration under Rule 144A of the Securities Act of 1933, as amended, which may be sold only to dealers in that program or other "qualified institutional buyers." These securities have been determined to be liquid under guidelines established by the fund's board of directors. As of February 28, 2006, the value of these investments was $10,424,321 or 12.5% of net assets. See note 2 in Notes to Financial Statements.
(d) Interest only – Represents securities that entitle holders to receive only interest payments on the underlying mortgages. The yield to maturity of an interest only is extremely sensitive to the rate of principal payments on the underlying mortgage assets. A rapid (slow) rate of principal repayments may have an adverse (positive) effect on yield to maturity. The principal amount shown is the notional amount of the underlying mortgages. The interest disclosed represents the coupon rate in effect February 28, 2006.
(e) Z-Bond – Represents securities that pay no interest or principal during their accrual periods, but accrue additional principal at specified rates. Interest rate shown represents the current yield based upon the current cost basis and estimated future cash flows.
(f) Variable Rate Security – The rate shown is the rate in effect as of February 28, 2006.
(g) Security considered illiquid. As of February 28, 2006, the value of this investment was $12,875 or 0.02% of net assets. See note 2 in Notes to Financial Statements.
(h) On February 28, 2006, securities valued at $21,748,108 were pledged as collateral for the following outstanding reverse repurchase agreements:
| Amount | | Acquisition
Date | | Rate* | | Due | | Accrued
Interest | | Name of
Broker
and Description
of Collateral | |
| $ | 8,630,206 | | | 2/17/06 | | | 4.76 | % | | 5/18/06 | | $ | 102,699 | | | | (1 | ) | |
| | 3,875,850 | | | 2/9/06 | | | 4.70 | % | | 5/9/06 | | | 45,035 | | | | (2 | ) | |
| | 6,646,058 | | | 2/15/06 | | | 4.68 | % | | 4/17/06 | | | 52,703 | | | | (2 | ) | |
| $ | 19,152,114 | | | | | | | | | | | $ | 200,437 | | | | | | |
* Interest rate as of February 28, 2006. Rates are based on the London InterBank Offered Rate (LIBOR) and reset monthly.
Name of broker and description of collateral:
(1) Goldman:
Federal Home Loan Mortgage Corporation Gold, 5.50%, 10/1/33, $1,366,671 par
Federal Home Loan Mortgage Corporation, 5.00%, 11/15/28, 1,274,000 par
Federal National Mortgage Association, 4.00%, 11/1/10, $2,187,097 par
Federal National Mortgage Association, 4.65%, 10/1/32, $645,286 par
Federal National Mortgage Association, 5.50%, 6/1/33, $916,927 par
Federal National Mortgage Association, 5.50%, 12/1/33, $1,286,398 par
Government National Mortgage Association, 5.50%, 8/15/33, $1,454,494 par
2006 Semiannual Report
American Income Fund
17
Schedule of INVESTMENTS (unaudited) continued
(2) Morgan Stanley:
Federal National Mortgage Association, 7.50%, 5/1/15, $78,011 par
Federal National Mortgage Association, 7.00%, 6/1/17, $330,257 par
Federal National Mortgage Association, 7.00%, 7/1/17, $419,087 par
Federal National Mortgage Association, 6.00%, 9/1/17, $369,213 par
Federal National Mortgage Association, 5.00%, 11/1/18, $684,590 par
Federal National Mortgage Association, 5.00%, 2/1/19, $1,103,333 par
Federal National Mortgage Association, 7.00%, 9/1/31, $571,200 par
Federal National Mortgage Association, 6.50%, 6/1/32, $729,200 par
Federal National Mortgage Association, 6.00%, 11/1/33, $672,826 par
Federal National Mortgage Association, 6.00%, 1/1/34, $1,168,472 par
Federal National Mortgage Association, 5.50%, 2/1/34, $1,167,617 par
Federal National Mortgage Association, 6.50%, 2/1/35, $1,380,923 par
Government National Mortgage Association, 6. 50%, 3/20/31, $2,750,735 par
Government National Mortgage Association, 5.13%, 12/20/22, $399,734 par
Government National Mortgage Association, 6.00%, 7/15/34, $722,896 par
(i) This security has been purchased on a when-issued basis. On February 28, 2006, the total cost of investments purchased on a when-issued basis was $1,505,273.
(j) This security or a portion of this security is pledged as collateral for positions purchased on a when-issued basis. See note 2 in Notes to Financial Statements.
(k) This security or a portion of this security is pledged as initial margin deposits for open futures contracts. See note 2 in Notes to Financial Statements.
(l) Investment in affiliated security. This money market fund is advised by U.S. Bancorp Asset Management, Inc., which also serves as advisor for this fund. See note 3 in Notes to Financial Statements.
(m) Security has been deposited as initial margin on open futures contracts. Yield shown is effective yield at date of purchase. See note 2 in Notes to Financial Statements.
(n) On February 28, 2006, the cost of investments in securities for federal income tax purposes was $103,460,308. The aggregate gross unrealized appreciation and depreciation of investments in securities, based on this cost, were as follows:
| Gross unrealized appreciation | | $ | 1,617,796 | | |
| Gross unrealized depreciation | | | (1,702,847 | ) | |
| Net unrealized depreciation | | $ | (85,051 | ) | |
| Schedule of Open Futures Contracts | |
| Description | | Number of
Contracts
(Sold) | | Notional
Contract
Value | | Settlement
Month | | Unrealized
Appreciation
(Depreciation) | |
| U.S. 20 Year Treasury Long Bond Futures | | | (5 | ) | | $ | (500,000 | ) | | Jun-06 | | $ | (1,027 | ) | |
| U.S. 5 Year Treasury Note Futures | | | (46 | ) | | | (4,600,000 | ) | | Jun-06 | | | 3,804 | | |
| U.S. 10 Year Treasury Note Futures | | | (25 | ) | | | (2,500,000 | ) | | Jun-06 | | | 3,457 | | |
| 90 Day Eurodollar Futures | | | (15 | ) | | | (15,000,000 | ) | | Dec-06 | | | 9,510 | | |
| | | | (91 | ) | | $ | (22,600,000 | ) | | | | $ | 15,744 | | |
2006 Semiannual Report
American Income Fund
18
NOTICE TO SHAREHOLDERS (unaudited)
How to Obtain a Copy of the Fund's Proxy Voting Policies and Proxy Voting Record
A description of the policies and procedures that the fund uses to determine how to vote proxies relating to portfolio securities, as well as information regarding how the fund voted proxies relating to portfolio securities during the most recent 12 month period ended June 30, is available (1) without charge upon request by calling 800.677.FUND; (2) at www.firstamericanfunds.com; and (3) on the U.S. Securities and Exchange Commission's website at http://www.sec.gov.
Form N-Q Holdings Information
The fund is required to file its complete schedule of portfolio holdings for the first and third quarters of each fiscal year with the Securities and Exchange Commission on Form N-Q. The fund's Forms N-Q are available (1) without charge upon request by calling 800.677.FUND and (2) on the U.S. Securities and Exchange Commission's website at http://www.sec.gov. In addition, you may review and copy the fund's Forms N-Q at the Commissions Public Reference Room in Washington D.C. You may obtain information on the operation of the Public Reference Room by calling 1-800-SEC-0330.
2006 Semiannual Report
American Income Fund
19
(This page has been left blank intentionally.)
Board of DIRECTORS
VIRGINIA STRINGER
Chairperson of American Income Fund, Inc.
Owner and President of Strategic Management Resources, Inc.
BENJAMIN FIELD III
Director of American Income Fund, Inc.
Retired; former Senior Vice President, Chief Financial Officer, and
Treasurer of Bemis Company, Inc.
ROGER GIBSON
Director of American Income Fund, Inc.
Retired; former Vice President of Cargo-United Airlines
VICTORIA HERGET
Director of American Income Fund, Inc.
Investment Consultant; former Managing Director of Zurich Scudder Investments
LEONARD KEDROWSKI
Director of American Income Fund, Inc.
Owner and President of Executive and Management Consulting, Inc.
RICHARD RIEDERER
Director of American Income Fund, Inc.
Retired; former President and Chief Executive Officer of Weirton Steel
JOSEPH STRAUSS
Director of American Income Fund, Inc.
Owner and President of Strauss Management Company
JAMES WADE
Director of American Income Fund, Inc.
Owner and President of Jim Wade Homes
American Income Fund’s Board of Directors is comprised entirely of independent directors.

AMERICAN INCOME FUND
2006 Semiannual Report
FAF Advisors, Inc., is a wholly owned subsidiary of
U.S. Bank National Association, which is a
wholly owned subsidiary of U.S. Bancorp.

| This document is printed on paper |
containing 10% postconsumer waste. |
4/2006 0070-06 MRF-SAR
Item 2—Code of Ethics
Not applicable to semi-annual report.
Item 3—Audit Committee Financial Expert
Not applicable to semi-annual report.
Item 4—Principal Accountant Fees and Services
Not applicable to semi-annual report.
Item 5—Audit Committee of Listed Registrants
Not applicable to semi-annual report.
Item 6 – Schedule of Investments
This schedule is included as part of the report to shareholders filed under Item 1 of this Form.
Item 7—Disclosure of Proxy Voting Policies and Procedures for Closed-End Management Investment Companies
Not applicable to semi-annual report.
Item 8 – Portfolio Managers of Closed-End Management Investment Companies
Not applicable until first annual report for a fiscal year ending on or after December 31, 2005.
Item 9 – Purchases of Equity Securities by Closed-End Management Investment Company and Affiliated Purchasers
Neither the registrant nor any “affiliated purchaser,” as defined in Rule 10b-18(a)(3) under the Exchange Act, purchased any shares or other units of any class of the registrant’s equity securities that is registered pursuant to Section 12 of the Exchange Act.
Item 10 – Submission of Matters to a Vote of Security Holders
There have been no material changes to the procedures by which shareholders may recommend nominees to the registrant’s board of directors, where those changes were implemented after the registrant last provided disclosure in response to the requirements of Item 7(d)(2)(ii)(G) of Schedule 14A, or this Item.
Item 11 – Controls and Procedures
(a) The registrant’s Principal Executive Officer and Principal Financial Officer have evaluated the registrant’s disclosure controls and procedures within 90 days of the date of this filing and have concluded that the registrant’s disclosure controls and procedures were effective, as of that date, in ensuring that information required to be disclosed by the registrant in this Form N-CSR was recorded, processed, summarized and reported timely.
(b) There were no changes in the registrant’s internal control over financial reporting that occurred during the second fiscal quarter of the period covered by this report that have materially affected, or are reasonably likely to materially affect, the registrant’s internal control over financial reporting.
Item 12 – Exhibits
(a)(1) Not applicable.
(a)(2) Certifications of the Principal Executive Officer and Principal Financial Officer of the registrant as required by Rule 30a-2(a) under the Investment Company Act are filed as exhibits hereto.
(a)(3) Not applicable.
(b) Certifications of the Principal Executive Officer and Principal Financial Officer of the registrant as required by Rule 30a-2(b) under the Investment Company Act are filed as exhibits hereto.
Signatures
Pursuant to the requirements of the Securities Exchange Act of 1934 and the Investment Company Act of 1940, the registrant has duly caused this report to be signed on its behalf by the undersigned, thereunto duly authorized.
American Income Fund, Inc. |
|
By: | /s/ Thomas S. Schreier, Jr. | |
Thomas S. Schreier, Jr. |
President |
|
Date: May 8, 2006 |
Pursuant to the requirements of the Securities Exchange Act of 1934 and the Investment Company Act of 1940, this report has been signed below by the following persons on behalf of the registrant and in the capacities and on the dates indicated.
By: | /s/ Thomas S. Schreier, Jr. | |
Thomas S. Schreier, Jr. |
President |
|
Date: May 8, 2006 |
|
By: | /s/ Charles D. Gariboldi | |
Charles D. Gariboldi |
Treasurer |
|
Date: May 8, 2006 |