UNITED STATES
SECURITIES AND EXCHANGE COMMISSION
Washington, D.C. 20549
FORM N-CSR
CERTIFIED SHAREHOLDER REPORT OF REGISTERED
MANAGEMENT INVESTMENT COMPANIES
Investment Company Act file number | 811-05642 |
Nuveen Multi-Market Income Fund
(Exact name of registrant as specified in charter)
Nuveen Investments
333 West Wacker Drive
Chicago, IL 60606
(Address of principal executive offices) (Zip code)
Kevin J. McCarthy
Nuveen Investments
333 West Wacker Drive
Chicago, IL 60606
(Name and address of agent for service)
Registrant’s telephone number, including area code: (312) 917-7700
Date of fiscal year end: June 30
Date of reporting period: June 30, 2015
Form N-CSR is to be used by management investment companies to file reports with the Commission not later than 10 days after the transmission to stockholders of any report that is required to be transmitted to stockholders under Rule 30e-1 under the Investment Company Act of 1940 (17 CFR 270.30e-1). The Commission may use the information provided on Form N-CSR in its regulatory, disclosure review, inspection, and policymaking roles.
A registrant is required to disclose the information specified by Form N-CSR, and the Commission will make this information public. A registrant is not required to respond to the collection of information contained in Form N-CSR unless the Form displays a currently valid Office of Management and Budget (“OMB”) control number. Please direct comments concerning the accuracy of the information collection burden estimate and any suggestions for reducing the burden to Secretary, Securities and Exchange Commission, 450 Fifth Street, NW, Washington, DC 20549-0609. The OMB has reviewed this collection of information under the clearance requirements of 44 U.S.C. ss. 3507.
ITEM 1. REPORTS TO STOCKHOLDERS.
 | ||
| Closed-End Funds |
| Nuveen Investments | ||
| Closed-End Funds |
| Annual Report June 30, 2015
| |||||
| JMM | ||||||
| Nuveen Multi-Market Income Fund | ||||||
| ||||||||||||
| ||||||||||||
Life is Complex | ||||||||||||
Nuveen makes things e-simple.
It only takes a minute to sign up for e-Reports. Once enrolled, you’ll receive an e-mail as soon as your Nuveen Investments Fund information is ready – no more waiting for delivery by regular mail. Just click on the link within the e-mail to see the report and save it on your computer if you wish. | ||||||||||||
| Free e-Reports right to your e-mail! | ||
www.investordelivery.com If you receive your Nuveen Fund dividends and statements from your financial advisor or brokerage account. | ||
| or | www.nuveen.com/accountaccess If you receive your Nuveen Fund dividends and statements directly from Nuveen. | |
| ||||||

Table
of Contents
| 4 | ||||
| 5 | ||||
| 9 | ||||
| 10 | ||||
| 12 | ||||
| 13 | ||||
| 15 | ||||
| 16 | ||||
| 17 | ||||
| 25 | ||||
| 26 | ||||
| 27 | ||||
| 28 | ||||
| 30 | ||||
| 32 | ||||
| 41 | ||||
| 42 | ||||
| 43 | ||||
| 44 | ||||
| 49 | ||||
| Nuveen Investments | 3 |
to Shareholders

Dear Shareholders,
For better or for worse, the financial markets have spent the past year waiting for the U.S. Federal Reserve (Fed) to end its ultra-loose monetary policy. The policy has propped up stock and bond markets since the Great Recession, but the question remains: how will markets behave without its influence? This uncertainty has been a considerable source of volatility for stock and bond prices lately, despite the Fed carefully conveying its intention to raise rates slowly and only when the economy shows evidence of readiness.
A large consensus expects at least one rate hike before the end of 2015. After all, the U.S. has reached “full employment” by the Fed’s standards and growth has resumed – albeit unevenly. But the picture is somewhat muddled. Inflation has remained stubbornly low, most recently weighed down by an unexpectedly sharp decline in commodity prices since mid-2014. With the Fed poised to tighten and foreign central banks easing, the U.S. dollar has surged against other currencies, which has weighed on corporate earnings and further contributed to commodity price weakness. U.S. consumers have benefited from an improved labor market and lower prices at the gas pump, but the overall pace of economic expansion has been lackluster.
Nevertheless, the global recovery continues to be led by the U.S. Policy makers around the world are deploying their available tools to try to bolster Europe and Japan’s fragile growth, and manage China’s slowdown. Contagion fears ebb and flow with the headlines about Greece and China. Greece reluctantly agreed to a third bailout package from the European Union in July and China’s central bank and government intervened aggressively to try to stem the sell-off in stock prices. But persistent structural problems in these economies will continue to garner market attention.
Wall Street is fond of saying “markets don’t like uncertainty,” and asset prices are likely to continue to churn in the current macro environment. In times like these, you can look to a professional investment manager with the experience and discipline to maintain the proper perspective on short-term events. And if the daily headlines do concern you, I encourage you to reach out to your financial advisor. Your financial advisor can help you evaluate your investment strategies in light of current events, your time horizon and risk tolerance. On behalf of the other members of the Nuveen Fund Board, we look forward to continuing to earn your trust in the months and years ahead.
Sincerely,

William J. Schneider
Chairman of the Board
August 24, 2015
| 4 | Nuveen Investments |
Comments
Nuveen Multi-Market Income Fund (JMM)
Nuveen Multi-Market Income Fund (JMM) is advised by Nuveen Fund Advisors, LLC (NFAL) and features portfolio management by Nuveen Asset Management, LLC (NAM). Prior to September 8, 2014, the Fund was named American Income Fund, Inc. (MRF), and was advised by U.S. Bancorp Asset Management, Inc. (USBAM) and sub-advised by NFAL and NAM. The Fund’s investment strategy and portfolio management team remained unchanged after the transition from USBAM to NFAL.
The Fund’s performance, distribution and pricing history date back to MRF’s inception on December 30, 1988.
All three members of the Fund’s current portfolio management team previously served as managers for MRF. The portfolio management team includes Jason J. O’Brien, CFA, Chris J. Neuharth and John T. Fruit, CFA. Here they discuss economic and market conditions, their management strategy and the performance of the Fund for the twelve-month reporting period ended June 30, 2015.
What factors affected the U.S. economy and domestic and global markets during the twelve-month reporting period ended June 30, 2015?
During this reporting period, the U.S. economy continued to expand at a moderate pace. The Federal Reserve (Fed) maintained efforts to bolster growth and promote progress toward its mandates of maximum employment and price stability by holding the benchmark fed funds rate at the record low level of zero to 0.25% that it established in December 2008. At its October 2014 meeting, the Fed announced that it would end its bond-buying stimulus program as of November 1, 2014, after tapering its monthly asset purchases of mortgage-backed and longer-term Treasury securities from the original $85 billion per month to $15 billion per month over the course of seven consecutive meetings (December 2013 through September 2014). In making the announcement, the Fed cited substantial improvement in the outlook for the labor market since the inception of the current asset purchase program as well as sufficient underlying strength in the broader economy to support ongoing progress toward maximum employment in a context of price stability. The Fed also reiterated that it would continue to look at a wide range of factors, including labor market conditions, indicators of inflationary pressures and readings on financial developments, in determining future actions. Additionally, the Fed stated that it would likely maintain the current target range for the fed funds rate for a considerable time after the end of the asset purchase program, especially if projected inflation continues to run below the Fed’s 2% longer run goal. However, if economic data shows faster progress, the Fed indicated that it could raise the fed funds rate sooner than expected.
The Fed changed its language slightly in December, indicating it would be “patient” in normalizing monetary policy. This shift helped ease investors’ worries that the Fed might raise rates too soon. However, as employment data released early in the year continued to look strong, anticipation began building that the Fed could raise its main policy rate as
Certain statements in this report are forward-looking statements. Discussions of specific investments are for illustration only and are not intended as recommendations of individual investments. The forward-looking statements and other views expressed herein are those of the portfolio managers as of the date of this report. Actual future results or occurrences may differ significantly from those anticipated in any forward-looking statements and the views expressed herein are subject to change at any time, due to numerous market and other factors. The Fund disclaims any obligation to update publicly or revise any forward-looking statements or views expressed herein.
Ratings shown are the highest rating given by one of the following national rating agencies: Standard & Poor’s (S&P), Moody’s Investors Service, Inc. (Moody’s) or Fitch, Inc. (Fitch). Credit ratings are subject to change. AAA, AA, A and BBB are investment grade ratings; BB, B, CCC, CC, C and D are below investment grade ratings. Certain bonds backed by U.S. Government or agency securities are regarded as having an implied rating equal to the rating of such securities. Holdings designated N/R are not rated by these national rating agencies.
Refer to the Glossary of Terms Used in this Report for further definition of the terms used within this section.
| Nuveen Investments | 5 |
Portfolio Managers’ Comments (continued)
soon as June. As widely expected, after its March meeting, the Fed eliminated “patient” from its statement but also highlighted the policy makers’ less optimistic view of the economy’s overall health as well as downgraded their inflation projections. The Fed’s April meeting seemed to further signal that a June rate hike was off the table. While the Fed attributed the first quarter’s economic weakness to temporary factors, the meeting minutes from April revealed that many Committee members believed the economic data available in June would be insufficient to meet the Fed’s criteria for initiating a rate increase. The June meeting bore out that presumption, and the Fed decided to keep the target rate near zero. But the Committee also continued to telegraph the likelihood of at least one rate increase in 2015, which many analysts forecasted for September.
According to the government’s advanced estimate, the U.S. economy increased at a 2.3% annualized rate in the second quarter of 2015, as measured by GDP, compared with a decrease of 0.6% in the first quarter of 2015 and increases of 5.0% in the third quarter 2014 and 2.2% in the fourth quarter 2014. The increase in real GDP growth rate from the first quarter of 2015 to the second quarter of 2015 primarily reflects positive contributions from personal consumption expenditures (PCE), exports, state and local government spending, and residential fixed investment that were partly offset by negative contributions from federal government spending, private inventory investment and non-residential fixed investment. The Consumer Price Index (CPI), rose 0.1% year-over-year as of June 2015. The core CPI (which excludes food and energy) increased 1.8% during the same period, below the Fed’s unofficial longer term inflation objective of 2.0%. As of June 2015, the U.S. unemployment rate was 5.3%, a level not seen since mid-2008. This figure is also considered “full employment” by some Fed officials. The housing market continued to post consistent gains as of its most recent reading in May 2015. The average home price in the S&P/Case-Shiller Index of 20 major metropolitan areas rose 4.9% for the twelve months ended May 2015 (most recent data available at the time this report was prepared).
A number of challenges weighed on global economies and financial markets during the reporting period, as oil price moves drove large swings in market sentiment. Additionally concerns around the pace of domestic and global economic growth, continued signs of weakness out of China, Greece’s continuing debt crisis, a strengthening dollar and geopolitical concerns emanating from the Middle East appeared to further provoke economic and market uncertainty. Central banks around the globe began to loosen their monetary policies in an effort to pump additional liquidity into their economies, while at the same time the U.S. Fed began to taper. For the reporting period, U.S. equity markets posted generally positive returns as investor appetite for risk returned to the market and risk aversion appeared to subside. However, while broad market performance was admirable for the reporting period, it came with fairly significant volatility.
Likewise, U.S. interest rates were volatile in response to changes in monetary policy and global capital flows, with yields on the benchmark 10-year Treasury fluctuating in a broad range during the year with no sustained trend. Yields moved higher in mid-2014, then declined significantly as concerns about global economic weakness captured the spotlight. Yields hit a low point in early February before rising again, then settling into a trading range by the end of June. The U.S. Treasury yield curve flattened significantly as yields on long Treasuries dropped, while yields in the short to intermediate section of the curve rose modestly as investors anticipated a Fed tightening in mid-2015. However, disappointing U.S. economic data in early 2015 pushed out expectations for a lift-off in the fed funds rate and the yield curve steepened again somewhat.
The environment over much of the reporting period proved to be challenging for the riskier areas of the bond market with corporate bonds, particularly in the high-yield area, falling short of Treasuries and the broader bond market. High yield bonds from energy and commodity-related issuers exhibited significant volatility, particularly in the final months of 2014, as the sharp drop in oil prices and uncertainty about base commodity prices affected these sectors. Bonds from these issuers partially recovered later in the reporting period as prices for oil and other commodities gained back some of their lost ground. Generally speaking, higher yielding bonds outperformed in the reporting period’s latter months because they were better able to absorb the impact of rising rates versus sectors with less income.
| 6 | Nuveen Investments |
What key strategies were used to manage the Fund during this twelve-month reporting period ended June 30, 2015?
The Fund’s investment objective is to achieve high monthly income consistent with prudent risk to capital. The management team invests the Fund’s assets primarily in taxable fixed income securities including, but not limited to: U.S. agency and privately issued mortgage-backed securities; high yield and investment grade corporate bonds; and asset-backed securities.
How did the Fund perform during this twelve-month reporting period ended June 30, 2015?
The table in the Performance Overview and Holding Summaries section of this report provides total return performance for the Fund for the one-year, five-year and ten-year periods ended June 30, 2015. The Fund’s total return at net asset value (NAV) is compared with the performance of a corresponding market index. For the twelve-month reporting period ended June 30, 2015, JMM outperformed its blended benchmark, which is composed of 75% Barclays U.S. Government/Mortgage Index and 25% Barclays U.S. Corporate High-Yield Index.
Global economies struggled to deal with a number of challenges in the first half of the reporting period, including disappointing economic growth levels, a dramatic drop in commodity prices and ongoing geopolitical unrest. While the Fed was in the process of tapering its quantitative easing program in the U.S. in late 2014, central banks outside of the U.S. began to incorporate more accommodative policies in an effort to pump additional liquidity into their economies. U.S. bond yields changed little over the reporting period, but at times were quite volatile in response to changes in monetary policy and global capital flows. The shape of the U.S. Treasury curve was also volatile with the yield curve flattening dramatically in late 2014 as yields on long Treasuries plunged, while yields on short to intermediate maturities rose modestly in response to investors pulling forward the timing of Fed tightening into mid-2015. Subsequently, weak U.S. economic data in early 2015 caused the market to view a mid-year tightening as unlikely and the yield curve flattening that occurred in late 2014 partially reversed course.
For virtually all of the reporting period, investors favored higher quality sectors of the market, causing government securities to outpace corporate bonds by a wide margin. Global growth concerns, commodity weakness, heightened geopolitical risk and a heavy new issue calendar caused general weakness in the corporate bond market and credit spreads reached their widest level in several years. The market showed little tolerance for negative news or downgrades of credit issuers. Energy and metals/mining related issuers were hardest hit during this period, a reflection of the dramatic drop in commodity prices that occurred in the second half of 2014 and early 2015. Although spreads leveled off early in 2015, they began to widen again due to a large amount of new issue supply and increasing investor worries about a disorderly Greek exit from the European Monetary Union. As oil prices recovered some lost ground, energy issues stabilized, but still proved to be a major detractor during the reporting period. Broadly speaking, despite heightened levels of investor risk aversion, the high yield sector performed reasonably well relative to investment grade corporates as the additional income generated by this sector provided a buffer against market volatility.
Among the securitized sectors of the bond market, mortgage-backed securities (MBS) issued by government agencies such as Fannie Mae (FNMA), Ginnie Mae (GNMA) and Freddie Mac (FHLMC) struggled to keep pace with Treasuries for much of the year due to higher volatility and concerns about the Fed normalizing policy. In early 2015, investors became concerned about prepayment risk due to lower rates and a reduction in mortgage insurance costs for Federal Housing Administration (FHA) loans, which comprise the bulk of GNMA securities. The lower insurance costs created an incentive for FHA borrowers to refinance, resulting in dramatic underperformance among GNMA pass-through securities and creating broader concerns about policy risk for the MBS market. For much of the reporting period, commercial mortgage-backed securities (CMBS) benefited from improving commercial real estate fundamentals and relative immunity to energy-related spread volatility. However, late in the reporting period, CMBS spreads widened due to increased supply, ongoing concerns about loan origination quality and wider corporate spreads. Non-agency MBS continued to perform well and were a safe haven from the volatility in the corporate bonds sectors as improving residential housing fundamentals and a dearth of supply supported valuations.
| Nuveen Investments | 7 |
Portfolio Managers’ Comments (continued)
Our sector exposures generated mixed results, but overall were positive drivers of returns for the reporting period. The Fund’s performance benefited from our significant allocations to non-agency MBS and non-government mortgage-related asset-backed securities (ABS), which in aggregate represented between 35%-40% of the portfolio’s net assets over most of the reporting period. These segments once again outperformed the government and corporate sectors of the market. The Fund also maintained significant exposure to the CMBS sector. Although this broad segment of the market lagged Treasuries by a small margin during the reporting period, it outperformed agency MBS and the credit sectors by wide margins and had a positive impact on returns. Conversely, our allocations to the credit sectors were a drag on investment results as the Fund allocated roughly one-third of its net assets to the credit sectors over most of the reporting period. Within credit, the Fund’s exposure to the metals/mining and energy sectors held back investment performance. In addition, we positioned the Fund with a defensive duration strategy in expectation of higher rates during the reporting period. While short-term rates rose modestly, long-term rates fell slightly and our interest rate strategy proved to be a slight drag on performance.
Our U.S. economic forecast calls for ongoing moderate growth and gradually rising inflation. While we expect the Fed to begin tightening policy later this year, we believe that rate hikes will be very gradual and that policy will remain accommodative well into 2016. This environment should keep rates reasonably low and should not be overly disruptive to financial markets. We continue to maintain the Fund’s emphasis on the non-agency MBS and CMBS sectors as both credit fundamentals and technicals remain supportive. We expect the high grade and high yield sectors of the corporate market will remain volatile; however, we increasingly believe that valuations are attractive enough to compensate investors for the slight deterioration in credit fundamentals and the current challenging liquidity environment. As always, we will continually evaluate relative value opportunities and shift the Fund’s exposures toward the segments of the market where we see the best long-term risk/reward equation. Because we expect rates to gradually rise as 2015 progresses, we are maintaining a defensive bias with the Fund’s duration strategy.
We used U.S. Treasury futures as part of an overall portfolio construction strategy to manage portfolio duration and yield curve exposure. The effect of these activities during the reporting period was slightly negative. These derivative exposures are integrated with the overall portfolio construction and as such, losses and gains may be naturally related to/may offset impacts elsewhere in the portfolio.
| 8 | Nuveen Investments |
Leverage
IMPACT OF THE FUND’S LEVERAGE STRATEGY ON PERFORMANCE
One important factor impacting the returns of the Fund relative to its benchmark was the Fund’s use of leverage through the use of reverse repurchase agreements and mortgage dollar rolls. The Fund uses leverage because our research has shown that, over time, leveraging provides opportunities for additional income and total return for common shareholders. However, use of leverage also can expose shareholders to additional volatility. For example, as the prices of securities held by the Fund decline, the negative impact of these valuation changes on NAV and total return is magnified by the use of leverage. Conversely, leverage may enhance common share returns during periods when the prices of securities held by the Fund generally are rising. The Fund’s use of leverage had a slightly positive impact on performance during this reporting period.
As of June 30, 2015, the Fund’s percentages of leverage are shown in the accompanying table.
| JMM | ||||
Effective Leverage* | 29.51 | % | ||
Regulatory Leverage* | 0.00 | % | ||
| * | Effective leverage is a Fund’s effective economic leverage, and includes both regulatory leverage and the leverage effects of certain derivative and other investments in a Fund’s portfolio that increase the Fund’s investment exposure. Regulatory leverage consists of preferred shares issued or borrowings of a Fund. Both of these are part of a Fund’s capital structure. Regulatory leverage is subject to asset coverage limits set forth in the Investment Company Act of 1940. |
| Nuveen Investments | 9 |
Information
DISTRIBUTION INFORMATION
The following information regarding the Fund’s distributions is current as of June 30, 2015. The Fund’s distribution levels may vary over time based on the Fund’s investment activities and portfolio investment value changes.
During the current reporting period, the Fund’s distributions to shareholders were as shown in the accompanying table.
| Ex-Dividend Date | Per Share Amounts | |||
July 2014 | $ | 0.0400 | ||
August | 0.0400 | |||
September | 0.0400 | |||
October | 0.0400 | |||
November | 0.0400 | |||
December | 0.0400 | |||
January | 0.0400 | |||
February | 0.0400 | |||
March | 0.0400 | |||
April | 0.0400 | |||
May | 0.0400 | |||
June 2015 | 0.0400 | |||
Current Distribution Rate* | 6.66 | % | ||
| * | Current distribution rate is based on the Fund’s current annualized monthly distribution divided by the Fund’s current market price. The Fund’s monthly distributions to its shareholders may be comprised of ordinary income, net realized capital gains and, if at the end of the fiscal year the Fund’s cumulative net ordinary income and net realized gains are less than the amount of the Fund’s distributions, a return of capital for tax purposes. |
The Fund seeks to pay regular monthly dividends out of its net investment income at a rate that reflects its past and projected net income performance. To permit the Fund to maintain a more stable monthly dividend, the Fund may pay dividends at a rate that may be more or less than the amount of net income actually earned by the Fund during the period. If the Fund has cumulatively earned more than it has paid in dividends, it will hold the excess in reserve as undistributed net investment income (UNII) as part of the Fund’s net asset value. Conversely, if the Fund has cumulatively paid in dividends more than it has earned, the excess will constitute a negative UNII that will likewise be reflected in the Fund’s net asset value. The Fund will, over time, pay all its net investment income as dividends to shareholders.
As of June 30, 2015, the Fund had a positive UNII balance for income tax purposes and a negative UNII balance for financial reporting purposes.
All monthly dividends paid by the Fund during the current reporting period, were paid from net investment income. If a portion of the Fund’s monthly distributions was sourced from or comprised of elements other than net investment income, including capital gains and/or a return of capital, shareholders would have received a notice to that effect. For financial reporting purposes, the composition and per share amounts of the Fund’s dividends for the reporting period are presented in this report’s Statement of Changes in Net Assets and Financial Highlights, respectively. For income tax purposes, distribution information for the Fund as of its most recent tax year end is presented in Note 6 – Income Tax Information within the Notes to Financial Statements of this report.
| 10 | Nuveen Investments |
SHARE REPURCHASES
During September 2014, the Fund’s Board of Trustees authorized the Fund to participate in Nuveen’s closed-end fund complex-wide share repurchase program. Under the share repurchase program, the Fund may repurchase up to 10% of its outstanding shares as of the authorization date (approximately 945,000 shares) in open-market transactions at the Adviser’s discretion.
As of June 30, 2015, and since the inception of the Fund’s repurchase program, the Fund did not repurchase any of its outstanding shares.
OTHER SHARE INFORMATION
As of June 30, 2015, and during the current reporting period, the Fund’s common share price was trading at premium/(discount) to its NAV as shown in the accompanying table.
NAV | $ | 8.40 | ||
Share Price | $ | 7.21 | ||
Premium/(Discount) to NAV | (14.17 | )% | ||
12-Month Average Premium/(Discount) to NAV | (11.04 | )% |
| Nuveen Investments | 11 |
Considerations
Fund shares are not guaranteed or endorsed by any bank or other insured depository institution, and are not federally insured by the Federal Deposit Insurance Corporation.
Investing in closed-end funds involves risk; principal loss is possible. There is no guarantee the Fund’s investment objectives will be achieved. Closed-end fund shares may frequently trade at a discount or premium to their net asset value. Investing in mortgage-backed securities entails credit risk, the risk that the servicer fails to perform its duties, liquidity risks, interest rate risks, structure risks, pre-payment risk, and geographical concentration risks. Leverage increases return volatility and magnifies the Fund’s potential return and its risks; there is no guarantee a fund’s leverage strategy will be successful. These and other risk considerations including hedging risk are described in more detail on the Fund’s web page at www.nuveen.com/JMM
| 12 | Nuveen Investments |
JMM
Nuveen Multi-Market Income Fund
Performance Overview and Holding Summaries as of June 30, 2015
Refer to the Glossary of Terms Used in this Report for further definition of the terms used within this section.
Average Annual Total Returns as of June 30, 2015
| Average Annual | ||||||||||||
| 1-Year | 5-Year | 10-Year | ||||||||||
| JMM at NAV | 1.88% | 7.51% | 6.49% | |||||||||
| JMM at Share Price | (1.24)% | 4.35% | 6.38% | |||||||||
| JMM Blended Benchmark | 1.62% | 4.21% | 5.28% | |||||||||
Past performance is not predictive of future results. Current performance may be higher or lower than the data shown. Returns do not reflect the deduction of taxes that shareholders may have to pay on Fund distributions or upon the sale of Fund shares. Returns at NAV are net of Fund expenses, and assume reinvestment of distributions. Comparative index return information is provided for the Fund’s shares at NAV only. Indexes are not available for direct investment.
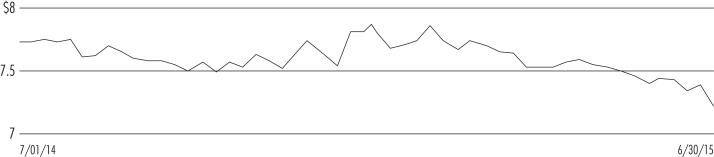
Share Price Performance — Weekly Closing Price
| Nuveen Investments | 13 |
This data relates to the securities held in the Fund’s portfolio of investments as of the end of the reporting period. It should not be construed as a measure of performance for the Fund itself. Holdings are subject to change.
Ratings shown are the highest rating given by one of the following national rating agencies: Standard & Poor’s Group, Moody’s Investors Service, Inc. or Fitch, Inc. Credit ratings are subject to change. AAA, AA, A and BBB are investment grade ratings; BB, B, CCC, CC, C and D are below-investment grade ratings. Certain bonds backed by U.S. Government or agency securities are regarded as having an implied rating equal to the rating of such securities. Holdings designated N/R are not rated by these national rating agencies.
Fund Allocation
(% of net assets)
| Convertible Preferred Securities | 0.7% | |||
| $25 Par (or similar) Retail Preferred | 0.5% | |||
| Corporate Bonds | 31.9% | |||
| $1,000 Par (or similar) Institutional Preferred | 0.4% | |||
| Asset-Backed and Mortgage-Backed Securities | 103.9% | |||
| Investment Companies | 0.6% | |||
| Sovereign Debt | 0.2% | |||
Repurchase Agreements | 2.9% | |||
| Other Assets Less Liabilities | (15.1)% | |||
| Net Assets Plus Reverse Repurchase Agreements | 126.0% | |||
| Reverse Repurchase Agreements | (26.0)% | |||
| Net Assets | 100% |
Portfolio Composition
(% of total investments)1
| Asset-Backed and Mortgage-Backed Securities | 73.6% | |||
| Oil, Gas & Consumable Fuels | 3.4% | |||
| Metals & Mining | 2.1% | |||
| Diversified Telecommunication Services | 1.8% | |||
| Banks | 1.6% | |||
| Media | 1.5% | |||
| Health Care Providers & Services | 1.2% | |||
| Other | 12.8% | |||
Repurchase Agreements | 2.0% | |||
| Total | 100% |
Portfolio Credit Quality
(% of total long-term investments)
| AAA/U.S. Guaranteed | 24.8% | |||
| AA | 5.0% | |||
| A | 12.1% | |||
| BBB | 14.5% | |||
| BB or Lower | 29.2% | |||
| N/R (not rated) | 14.0% | |||
| N/A (not applicable) | 0.4% | |||
| Total | 100% |
| 1 | Excluding investments in derivatives. |
| 14 | Nuveen Investments |
Meeting Report
The annual meeting of shareholders was held in the offices of Nuveen Investments on March 26, 2015 for JMM; at this meeting the shareholders were asked to elect Board Members.
| JMM | ||||
| Common Shares | ||||
Approval of the Board Members was reached as follows: | ||||
Jack B. Evans | ||||
For | 7,978,749 | |||
Withhold | 217,160 | |||
Total | 8,195,909 | |||
William J. Schneider | ||||
For | 7,978,982 | |||
Withhold | 216,927 | |||
Total | 8,195,909 | |||
Thomas S. Schreier, Jr. | ||||
For | 7,944,123 | |||
Withhold | 251,786 | |||
Total | 8,195,909 | |||
| Nuveen Investments | 15 |
Report of
Independent Registered Public Accounting Firm
To the Board of Trustees and Shareholders of
Nuveen Multi-Market Income Fund:
We have audited the accompanying statement of assets and liabilities, including the portfolio of investments, of Nuveen Multi-Market Income Fund (the “Fund”) as of June 30, 2015, and the related statements of operations, changes in net assets and cash flows and the financial highlights for the year then ended. These financial statements and financial highlights are the responsibility of the Fund’s management. Our responsibility is to express an opinion on these financial statements and financial highlights based on our audit. The statements of changes in net assets and the financial highlights for the periods presented through June 30, 2014, were audited by other auditors whose report dated August 22, 2014, expressed an unqualified opinion on those statements and those financial highlights.
We conducted our audit in accordance with the standards of the Public Company Accounting Oversight Board (United States). Those standards require that we plan and perform the audit to obtain reasonable assurance about whether the financial statements and financial highlights are free of material misstatement. An audit includes examining, on a test basis, evidence supporting the amounts and disclosures in the financial statements. Our procedures included confirmation of securities owned as of June 30, 2015, by correspondence with the custodian and brokers or other appropriate auditing procedures. An audit also includes assessing the accounting principles used and significant estimates made by management, as well as evaluating the overall financial statement presentation. We believe that our audit provides a reasonable basis for our opinion.
In our opinion, the financial statements and financial highlights referred to above present fairly, in all material respects, the financial position of the Fund as of June 30, 2015, the results of its operations, the changes in its net assets, its cash flows and the financial highlights for the year then ended, in conformity with U.S. generally accepted accounting principles.
/s/ KPMG LLP
Chicago, Illinois
August 28, 2015
| 16 | Nuveen Investments |
JMM
Nuveen Multi-Market Income Fund | ||
| June 30, 2015 |
| Shares | Description (1) | Coupon | Ratings (2) | Value | ||||||||||||||||
LONG-TERM INVESTMENTS – 138.2% (98.0% of Total Investments) |
| |||||||||||||||||||
CONVERTIBLE PREFERRED SECURITIES – 0.7% (0.5% of Total Investments) |
| |||||||||||||||||||
| Banks – 0.7% | ||||||||||||||||||||
| 200 | Bank of America Corporation | 7.250% | BB+ | $ | 222,400 | |||||||||||||||
| 16,830 | Bank of America Corporation | 4.000% | BB+ | 355,450 | ||||||||||||||||
Total Convertible Preferred Securities (cost $439,296) | 577,850 | |||||||||||||||||||
| Shares | Description (1) | Coupon | Ratings (2) | Value | ||||||||||||||||
| $25 PAR (OR SIMILAR) RETAIL PREFERRED – 0.5% (0.4% of Total Investments) | ||||||||||||||||||||
| Capital Markets – 0.4% | ||||||||||||||||||||
| 12,000 | Goldman Sachs Group, Inc. | 5.500% | Ba1 | $ | 294,240 | |||||||||||||||
| Metals & Mining – 0.1% | ||||||||||||||||||||
| 7,500 | ArcelorMittal | 6.000% | BB– | 117,075 | ||||||||||||||||
Total $25 Par (or similar) Retail Preferred (cost $455,588) | 411,315 | |||||||||||||||||||
| Principal Amount (000) | Description (1) | Coupon | Maturity | Ratings (2) | Value | |||||||||||||||
CORPORATE BONDS – 31.9% (22.7% of Total Investments) |
| |||||||||||||||||||
| Aerospace & Defense – 0.3% | ||||||||||||||||||||
| $ | 200 | Bombardier Inc., 144A | 4.750% | 4/15/19 | B+ | $ | 194,500 | |||||||||||||
| Automobiles – 0.2% | ||||||||||||||||||||
| 100 | Ford Motor Company | 7.450% | 7/16/31 | BBB– | 127,781 | |||||||||||||||
| Banks – 1.4% | ||||||||||||||||||||
| 500 | Bank of America Corporation | 5.000% | 5/13/21 | A | 548,884 | |||||||||||||||
| 500 | Citigroup Inc. | 4.500% | 1/14/22 | A | 538,579 | |||||||||||||||
| 1,000 | Total Banks | 1,087,463 | ||||||||||||||||||
| Building Products – 0.3% | ||||||||||||||||||||
| 250 | NCI Building Systems, Inc., 144A | 8.250% | 1/15/23 | B+ | 266,250 | |||||||||||||||
| Capital Markets – 0.7% | ||||||||||||||||||||
| 500 | Goldman Sachs Group, Inc. | 5.750% | 1/24/22 | A | 568,735 | |||||||||||||||
| Chemicals – 1.1% | ||||||||||||||||||||
| 100 | Hexion Inc. | 6.625% | 4/15/20 | B3 | 91,750 | |||||||||||||||
| 200 | Momentive Performance Materials Inc., 144A, (6), (7) | 8.875% | 10/15/20 | N/R | — | |||||||||||||||
| 200 | Momentive Performance Materials Inc. | 3.880% | 10/24/21 | B | 179,500 | |||||||||||||||
| 375 | NOVA Chemicals Corporation, 144A | 5.000% | 5/01/25 | BBB– | 376,406 | |||||||||||||||
| 200 | Platform Specialty Products Corporation, 144A | 6.500% | 2/01/22 | BB– | 206,500 | |||||||||||||||
| 1,075 | Total Chemicals | 854,156 | ||||||||||||||||||
| Construction Materials – 0.5% | ||||||||||||||||||||
| 385 | Norbord Inc., 144A | 5.375% | 12/01/20 | Ba2 | 383,075 | |||||||||||||||
| Consumer Finance – 0.3% | ||||||||||||||||||||
| 250 | Covenant Surgical Partners Inc., 144A | 8.750% | 8/01/19 | B– | 253,375 | |||||||||||||||
| Diversified Consumer Services – 0.2% | ||||||||||||||||||||
| 200 | Nine West Holdings Incorporated, 144A | 8.250% | 3/15/19 | CCC | 134,000 | |||||||||||||||
| Nuveen Investments | 17 |
| Nuveen Multi-Market Income Fund | ||
| Portfolio of Investments (continued) | June 30, 2015 |
| Principal Amount (000) | Description (1) | Coupon | Maturity | Ratings (2) | Value | |||||||||||||||
| Diversified Financial Services – 0.7% | ||||||||||||||||||||
| $ | 100 | Argos Merger Sub Inc., 144A | 7.125% | 3/15/23 | B– | $ | 104,750 | |||||||||||||
| 200 | James Hardie International Finance Limited, 144A | 5.875% | 2/15/23 | BBB– | 206,000 | |||||||||||||||
| 250 | Nationstar Mortgage LLC Capital Corporation | 7.875% | 10/01/20 | B+ | 249,375 | |||||||||||||||
| 550 | Total Diversified Financial Services | 560,125 | ||||||||||||||||||
| Diversified Telecommunication Services – 2.3% | ||||||||||||||||||||
| 250 | CenturyLink Inc. | 6.750% | 12/01/23 | BB+ | 250,781 | |||||||||||||||
| 200 | CenturyLink Inc. | 7.650% | 3/15/42 | BB+ | 181,000 | |||||||||||||||
| 250 | Frontier Communications Corporation | 8.500% | 4/15/20 | BB | 261,375 | |||||||||||||||
| 410 | IntelSat Jackson Holdings | 6.625% | 12/15/22 | CCC+ | 373,100 | |||||||||||||||
| 400 | Qualitytech LP/QTS Finance Corp. | 5.875% | 8/01/22 | B+ | 402,000 | |||||||||||||||
| 390 | SBA Tower Trust, 144A | 3.598% | 4/15/43 | BBB | 388,772 | |||||||||||||||
| 1,900 | Total Diversified Telecommunication Services | 1,857,028 | ||||||||||||||||||
| Electric Utilities – 1.1% | ||||||||||||||||||||
| 225 | FirstEnergy Corporation | 4.250% | 3/15/23 | Baa3 | 226,404 | |||||||||||||||
| 400 | Intergen NV, 144A | 7.000% | 6/30/23 | B+ | 356,000 | |||||||||||||||
| 250 | PPL Energy Supply LLC, 144A | 6.500% | 6/01/25 | BB– | 250,000 | |||||||||||||||
| 875 | Total Electric Utilities | 832,404 | ||||||||||||||||||
| Energy Equipment & Services – 0.9% | ||||||||||||||||||||
| 250 | Compressco Partners LP / Compressco Finance Corporation, 144A | 7.250% | 8/15/22 | B | 238,750 | |||||||||||||||
| 200 | Drill Rigs Holdings Inc., 144A | 6.500% | 10/01/17 | B– | 175,500 | |||||||||||||||
| 300 | Ensco PLC | 4.700% | 3/15/21 | BBB+ | 305,580 | |||||||||||||||
| 750 | Total Energy Equipment & Services | 719,830 | ||||||||||||||||||
| Food Products – 0.5% | ||||||||||||||||||||
| 200 | JBS Investments GmbH, 144A | 7.250% | 4/03/24 | BB+ | 207,000 | |||||||||||||||
| 200 | Pilgrim’s Pride Corporation, 144A | 5.750% | 3/15/25 | BB+ | 202,000 | |||||||||||||||
| 400 | Total Food Products | 409,000 | ||||||||||||||||||
| Gas Utilities – 0.7% | ||||||||||||||||||||
| 300 | Ferrellgas LP | 6.750% | 1/15/22 | B+ | 300,750 | |||||||||||||||
| 250 | LBC Tank Terminals Holdings Netherlands BV, 144A | 6.875% | 5/15/23 | B | 258,125 | |||||||||||||||
| 550 | Total Gas Utilities | 558,875 | ||||||||||||||||||
| Health Care Equipment & Supplies – 0.4% | ||||||||||||||||||||
| 350 | Tenet Healthcare Corporation | 6.875% | 11/15/31 | B3 | 323,750 | |||||||||||||||
| Health Care Providers & Services – 1.7% | ||||||||||||||||||||
| 500 | Community Health Systems, Inc. | 6.875% | 2/01/22 | B+ | 527,499 | |||||||||||||||
| 300 | Iasis Healthcare Capital Corporation | 8.375% | 5/15/19 | CCC+ | 310,500 | |||||||||||||||
| 275 | Kindred Healthcare Inc. | 6.375% | 4/15/22 | B2 | 274,656 | |||||||||||||||
| 250 | Select Medical Corporation | 6.375% | 6/01/21 | B– | 252,500 | |||||||||||||||
| 1,325 | Total Health Care Providers & Services | 1,365,155 | ||||||||||||||||||
| Hotels, Restaurants & Leisure – 0.2% | ||||||||||||||||||||
| 200 | Wynn Macau Limited, 144A | 5.250% | 10/15/21 | BB | 189,000 | |||||||||||||||
| Household Durables – 0.9% | ||||||||||||||||||||
| 250 | Brookfield Residential Properties Inc., 144A | 6.500% | 12/15/20 | BB– | 248,855 | |||||||||||||||
| 250 | KB Home | 7.000% | 12/15/21 | B+ | 258,125 | |||||||||||||||
| 200 | William Lyon Homes Incorporated | 8.500% | 11/15/20 | B– | 216,000 | |||||||||||||||
| 700 | Total Household Durables | 722,980 | ||||||||||||||||||
| Independent Power & Renewable Electricity Producers – 0.6% | ||||||||||||||||||||
| 200 | AES Corporation | 5.500% | 3/15/24 | BB | 192,500 | |||||||||||||||
| 300 | GenOn Energy Inc. | 9.500% | 10/15/18 | B | 306,000 | |||||||||||||||
| 500 | Total Independent Power & Renewable Electricity Producers | 498,500 | ||||||||||||||||||
| 18 | Nuveen Investments |
| Principal Amount (000) | Description (1) | Coupon | Maturity | Ratings (2) | Value | |||||||||||||||
| Insurance – 0.2% | ||||||||||||||||||||
| $ | 190 | Genworth Holdings Inc. | 4.800% | 2/15/24 | Ba1 | $ | 165,775 | |||||||||||||
| IT Services – 0.4% | ||||||||||||||||||||
| 350 | Zayo Group LLC / Zayo Capital Inc., 144A | 6.000% | 4/01/23 | B– | 345,695 | |||||||||||||||
| Machinery – 0.3% | ||||||||||||||||||||
| 250 | Commercial Vehicle Group | 7.875% | 4/15/19 | B | 256,250 | |||||||||||||||
| Media – 2.1% | ||||||||||||||||||||
| 200 | Altice S.A, 144A | 7.750% | 5/15/22 | B | 193,500 | |||||||||||||||
| 250 | Cablevision Systems Corporation | 5.875% | 9/15/22 | B1 | 242,500 | |||||||||||||||
| 300 | DIRECTV Holdings LLC | 3.800% | 3/15/22 | BBB | 301,726 | |||||||||||||||
| 200 | Midcontinent Communications Finance Company, 144A | 6.250% | 8/01/21 | B– | 204,000 | |||||||||||||||
| 200 | Quebecor Media Inc. | 5.750% | 1/15/23 | B+ | 199,500 | |||||||||||||||
| 250 | Tribune Media Company, 144A | 5.875% | 7/15/22 | BB– | 251,875 | |||||||||||||||
| 300 | WMG Acquisition Group, 144A | 6.000% | 1/15/21 | B+ | 306,000 | |||||||||||||||
| 1,700 | Total Media | 1,699,101 | ||||||||||||||||||
| Metals & Mining – 2.8% | ||||||||||||||||||||
| 325 | Alcoa Inc. | 5.400% | 4/15/21 | BBB– | 340,639 | |||||||||||||||
| 200 | Anglogold Holdings PLC | 5.125% | 8/01/22 | Baa3 | 192,329 | |||||||||||||||
| 200 | Coeur d’Alene Mines Corporation | 7.875% | 2/01/21 | B | 169,500 | |||||||||||||||
| 300 | Eldorado Gold Corporation, 144A | 6.125% | 12/15/20 | BB | 297,000 | |||||||||||||||
| 500 | Freeport McMoRan, Inc. | 3.550% | 3/01/22 | BBB | 462,813 | |||||||||||||||
| 250 | Hudbay Minerals, Inc. | 9.500% | 10/01/20 | B– | 265,000 | |||||||||||||||
| 200 | Lundin Mining Corporation, 144A | 7.500% | 11/01/20 | Ba2 | 215,500 | |||||||||||||||
| 300 | Vale Overseas Limited | 4.375% | 1/11/22 | BBB+ | 293,086 | |||||||||||||||
| 2,275 | Total Metals & Mining | 2,235,867 | ||||||||||||||||||
| Oil, Gas & Consumable Fuels – 4.8% | ||||||||||||||||||||
| 100 | California Resources Corporation | 6.000% | 11/15/24 | BB | 86,000 | |||||||||||||||
| 200 | Calumet Specialty Products | 7.625% | 1/15/22 | B+ | 204,000 | |||||||||||||||
| 200 | Carrizo Oil and Gas Inc. | 6.250% | 4/15/23 | B | 200,500 | |||||||||||||||
| 200 | Chesapeake Energy Corporation | 6.875% | 11/15/20 | BB+ | 195,000 | |||||||||||||||
| 240 | Concho Resources Inc. | 5.500% | 10/01/22 | BB+ | 238,800 | |||||||||||||||
| 300 | Denbury Resources Inc. | 5.500% | 5/01/22 | BB | 267,750 | |||||||||||||||
| 200 | EV Energy Partners LP / EV Energy Finance Corporation | 8.000% | 4/15/19 | B– | 186,000 | |||||||||||||||
| 245 | Gibson Energy, 144A | 6.750% | 7/15/21 | BB | 252,963 | |||||||||||||||
| 250 | NGL Energy Partners LP/Fin Co | 5.125% | 7/15/19 | BB– | 249,375 | |||||||||||||||
| 200 | Niska Gas Storage Canada ULC Finance Corporation | 6.500% | 4/01/19 | CCC+ | 188,000 | |||||||||||||||
| 175 | Rose Rock Midstream LP / Rose Rock Finance Corporation | 5.625% | 7/15/22 | B1 | 171,063 | |||||||||||||||
| 250 | Sanchez Energy Corporation | 7.750% | 6/15/21 | B– | 248,750 | |||||||||||||||
| 300 | Tesoro Logistics LP Finance Corporation, 144A | 6.250% | 10/15/22 | BB | 310,500 | |||||||||||||||
| 500 | Transocean Inc. | 3.800% | 10/15/22 | BBB– | 376,250 | |||||||||||||||
| 150 | Vanguard Natural Resources Finance | 7.875% | 4/01/20 | B | 143,250 | |||||||||||||||
| 450 | Western Refining Inc. | 6.250% | 4/01/21 | B+ | 453,375 | |||||||||||||||
| 3,960 | Total Oil, Gas & Consumable Fuels | 3,771,576 | ||||||||||||||||||
| Paper & Forest Products – 1.3% | ||||||||||||||||||||
| 250 | Domtar Corporation | 4.400% | 4/01/22 | BBB– | 254,067 | |||||||||||||||
| 200 | Mercer International Inc. | 7.750% | 12/01/22 | B+ | 215,000 | |||||||||||||||
| 200 | Millar Western Forest Products Ltd | 8.500% | 4/01/21 | B | 192,500 | |||||||||||||||
| 375 | Resolute Forest Products | 5.875% | 5/15/23 | BB– | 341,250 | |||||||||||||||
| 1,025 | Total Paper & Forest Products | 1,002,817 | ||||||||||||||||||
| Personal Products – 0.3% | ||||||||||||||||||||
| 250 | Albea Beauty Holdings SA, 144A | 8.375% | 11/01/19 | B | 267,500 | |||||||||||||||
| Real Estate Investment Trust – 0.4% | ||||||||||||||||||||
| 300 | CommomWealth REIT | 5.875% | 9/15/20 | BBB– | 329,495 | |||||||||||||||
| Nuveen Investments | 19 |
| Nuveen Multi-Market Income Fund | ||
| Portfolio of Investments (continued) | June 30, 2015 |
| Principal Amount (000) | Description (1) | Coupon | Maturity | Ratings (2) | Value | |||||||||||||||
| Real Estate Management & Development – 0.4% | ||||||||||||||||||||
| $ | 350 | Mattamy Group Corporation, 144A | 6.500% | 11/15/20 | BB | $ | 337,750 | |||||||||||||
| Road & Rail – 0.4% | ||||||||||||||||||||
| 300 | Watco Companies LLC Finance, 144A | 6.375% | 4/01/23 | B | 303,750 | |||||||||||||||
| Software – 1.3% | ||||||||||||||||||||
| 1,000 | Computer Sciences Corporation | 4.450% | 9/15/22 | BBB+ | 1,026,480 | |||||||||||||||
| Specialty Retail – 0.5% | ||||||||||||||||||||
| 150 | Neiman Marcus Mariposa Borrower / Merger Sub LLC, 144A | 8.000% | 10/15/21 | CCC+ | 157,875 | |||||||||||||||
| 200 | The Men’s Wearhouse Inc. | 7.000% | 7/01/22 | B2 | 214,000 | |||||||||||||||
| 350 | Total Specialty Retail | 371,875 | ||||||||||||||||||
| Textiles, Apparel & Luxury Goods – 0.2% | ||||||||||||||||||||
| 175 | Levi Strauss & Company, 144A | 5.000% | 5/01/25 | BB | 169,313 | |||||||||||||||
| Wireless Telecommunication Services – 1.5% | ||||||||||||||||||||
| 200 | Digicel Limited, 144A | 6.000% | 4/15/21 | B1 | 192,824 | |||||||||||||||
| 175 | FairPoint Communications Inc., 144A | 8.750% | 8/15/19 | B | 182,000 | |||||||||||||||
| 200 | Frontier Communications Corporation | 7.625% | 4/15/24 | BB– | 176,500 | |||||||||||||||
| 200 | Sprint Corporation | 7.250% | 9/15/21 | B+ | 195,000 | |||||||||||||||
| 200 | T-Mobile USA Inc. | 6.731% | 4/28/22 | BB | 208,500 | |||||||||||||||
| 200 | Wind Acquisition Finance SA, 144A | 4.750% | 7/15/20 | BB | 197,000 | |||||||||||||||
| 1,175 | Total Wireless Telecommunication Services | 1,151,824 | ||||||||||||||||||
| $ | 25,710 | Total Corporate Bonds (cost $25,751,999) | 25,341,050 | |||||||||||||||||
| Principal Amount (000) | Description (1) | Coupon | Maturity | Ratings (2) | Value | |||||||||||||||
$1,000 PAR (OR SIMILAR) INSTITUTIONAL PREFERRED – 0.4% (0.3% of Total Investments) |
| |||||||||||||||||||
| Banks – 0.1% | ||||||||||||||||||||
| $ | 100 | Lloyd’s Banking Group PLC | 7.500% | N/A (3) | BB+ | $ | 103,000 | |||||||||||||
| Insurance – 0.3% | ||||||||||||||||||||
| 225 | White Mountains Insurance Group, 144A | 7.506% | N/A (3) | BB+ | 235,125 | |||||||||||||||
Total $1,000 Par (or similar) Institutional Preferred (cost $341,491) | 338,125 | |||||||||||||||||||
| Principal Amount (000) | Description (1) | Coupon | Maturity | Ratings (2) | Value | |||||||||||||||
ASSET-BACKED AND MORTGAGE-BACKED SECURITIES – 103.9% (73.6% of Total Investments) |
| |||||||||||||||||||
| $ | 500 | 321 Henderson Receivables LLC, Series 2012-1A, 144A | 7.140% | 2/15/67 | Baa2 | $ | 595,194 | |||||||||||||
| 439 | 321 Henderson Receivables LLC., Series 2010-1A, 144A | 9.310% | 7/15/61 | Aa2 | 537,907 | |||||||||||||||
| 500 | 321 Henderson Receivables Trust Series 2012-2A, 144A | 6.770% | 10/17/61 | Baa2 | 592,229 | |||||||||||||||
| 403 | ACE Securities Corporation, Manufactured Housing Trust Series 2003-MH1, 144A | 6.500% | 8/15/30 | AA | 440,667 | |||||||||||||||
| 405 | AmeriCold LLC Trust, Series 2010, 144A | 6.811% | 1/14/29 | A+ | 462,709 | |||||||||||||||
| 500 | Bank of America Commercial Mortgage Inc., Commercial Mortgage Pass-Through Certificates, Series 2005-4 | 4.997% | 7/10/45 | AAA | 499,713 | |||||||||||||||
| 245 | Bank of America Funding Trust, Mortgage Pass-Through Certificates, Series 2007-4 | 5.500% | 6/25/37 | C | 59,809 | |||||||||||||||
| 558 | Barclays BCAP LLC Trust, Resecuritized Series 2009-RR14, 144A | 6.000% | 5/26/37 | BBB | 589,136 | |||||||||||||||
| 189 | Bayview Financial Acquisition Trust 2003-AA, 144A | 6.072% | 2/25/33 | A+ | 189,236 | |||||||||||||||
| 252 | Bayview Financial Acquisition Trust Series 2006C | 5.852% | 11/28/36 | CCC | 248,222 | |||||||||||||||
| 222 | Bayview Financial Acquisition Trust, Series 2006-C | 5.638% | 11/28/36 | Ba1 | 221,147 | |||||||||||||||
| 132 | Bayview Financial Acquisition Trust, Series 2006-D | 5.660% | 12/28/36 | Aaa | 131,407 | |||||||||||||||
| 750 | Bayview Financial Mortgage Pass-Through Trust, Mortgage Pass-Through Certificate Series 2005-D | 5.500% | 12/28/35 | BB+ | 739,178 | |||||||||||||||
| 345 | Bayview Financial Mortgage Pass-Through Trust, Mortgage Pass-Through Certificate Series 2006-A | 5.704% | 2/28/41 | AAA | 360,576 | |||||||||||||||
| 20 | Nuveen Investments |
| Principal Amount (000) | Description (1) | Coupon | Maturity | Ratings (2) | Value | |||||||||||||||
ASSET-BACKED AND MORTGAGE-BACKED SECURITIES (continued) |
| |||||||||||||||||||
| $ | 500 | Bear Stearns Commercial Mortgage Securities Trust, Commercial Mortgage Pass-Through Certificates, Series 2006-PW13 AM | 5.582% | 9/11/41 | AAA | $ | 521,026 | |||||||||||||
| 500 | CAM Mortgage Trust 2015-1, 144A | 4.750% | 7/15/64 | N/R | 497,150 | |||||||||||||||
| 500 | CarFinance Capital Auto Trust, Automobile Receivables-Backed Notes, Series 2013-1, 144A | 3.450% | 3/15/19 | A2 | 505,838 | |||||||||||||||
| 268 | Chase Funding Mortgage Loan Asset-Backed Certificates, Series 2003-3 | 4.660% | 3/25/33 | BBB– | 274,358 | |||||||||||||||
| 500 | Citigroup Commercial Mortgage Trust, Commercial Mortgage Pass-Through Certificates, Series 2006-CD3 | 5.688% | 10/15/48 | B+ | 477,113 | |||||||||||||||
| 327 | CountryWide Alternative Loan Trust 2005-86CB A10 | 5.500% | 2/25/36 | Caa3 | 300,574 | |||||||||||||||
| 229 | Countrywide Alternative Loan Trust, Mortgage Pass-Through Certificates, Series 2004-J2 | 6.500% | 3/25/34 | A+ | 240,512 | |||||||||||||||
| 302 | Countrywide Alternative Loan Trust, Mortgage Pass-Through Certificates, Series 2005-47CB | 5.500% | 10/25/35 | Caa3 | 274,765 | |||||||||||||||
| 940 | Countrywide Alternative Loan Trust, Mortgage Pass-Through Certificates, Series 2007-6 A4 | 5.750% | 4/25/47 | Ca | 825,964 | |||||||||||||||
| 409 | Countrywide Asset Backed Certificates, Series 2007-4 A2 | 5.529% | 4/25/47 | Caa1 | 432,223 | |||||||||||||||
| 970 | Credit Suisse Commercial Mortgage Trust 2009-3R, 144A | 6.000% | 1/27/37 | BBB | 1,011,281 | |||||||||||||||
| 470 | Credit Suisse CSMC Mortgage-Backed Trust, Pass-Through Certificates, Series 2006-7 | 6.000% | 8/25/36 | Caa3 | 405,630 | |||||||||||||||
| 669 | Credit Suisse First Boston Mortgage Securities Corporation, Mortgage-Backed Pass-Through Certificates, Series 2003-8 | 6.195% | 4/25/33 | A | 640,352 | |||||||||||||||
| 835 | Credit Suisse First Boston Mortgage Securities Corporation, Mortgage-Backed Pass-Through Certificates, Series 2005-11 6A7 | 6.000% | 12/25/35 | CC | 250,128 | |||||||||||||||
| 467 | Credit Suisse First Boston Mortgage Securities, Home Equity Mortgage Pass-Through Certificates, Series 2004-6 | 5.821% | 4/25/35 | B1 | 476,189 | |||||||||||||||
| 1,187 | Credit-Based Asset Servicing and Securitization Pool 2007-SP1, 144A | 6.020% | 12/25/37 | A+ | 1,240,798 | |||||||||||||||
| — | (5) | Fannie Mae Mortgage Pool | 3.121% | 7/01/27 | Aaa | 292 | ||||||||||||||
| 23 | Fannie Mae Mortgage Pool, (4) | 7.000% | 7/01/17 | Aaa | 24,082 | |||||||||||||||
| 44 | Fannie Mae Mortgage Pool, (4) | 5.000% | 11/01/18 | Aaa | 46,290 | |||||||||||||||
| 81 | Fannie Mae Mortgage Pool, (4) | 5.000% | 2/01/21 | Aaa | 87,510 | |||||||||||||||
| 1,673 | Fannie Mae Mortgage Pool, (4) | 3.500% | 12/01/26 | Aaa | 1,769,012 | |||||||||||||||
| 1,604 | Fannie Mae Mortgage Pool, (4) | 3.500% | 1/01/27 | Aaa | 1,695,561 | |||||||||||||||
| 69 | Fannie Mae Mortgage Pool, (4) | 6.000% | 5/01/29 | Aaa | 79,118 | |||||||||||||||
| 28 | Fannie Mae Mortgage Pool, (4) | 7.000% | 9/01/31 | Aaa | 31,096 | |||||||||||||||
| 44 | Fannie Mae Mortgage Pool, (4) | 5.500% | 6/01/33 | Aaa | 49,487 | |||||||||||||||
| 99 | Fannie Mae Mortgage Pool, (4) | 6.000% | 1/01/34 | Aaa | 112,058 | |||||||||||||||
| 197 | Fannie Mae Mortgage Pool, (4) | 5.500% | 2/01/34 | Aaa | 220,545 | |||||||||||||||
| 145 | Fannie Mae Mortgage Pool, (4) | 6.000% | 3/01/34 | Aaa | 163,935 | |||||||||||||||
| 133 | Fannie Mae Mortgage Pool, (4) | 6.000% | 1/01/35 | Aaa | 151,904 | |||||||||||||||
| 107 | Fannie Mae Mortgage Pool, (4) | 5.000% | 7/01/35 | Aaa | 118,895 | |||||||||||||||
| 52 | Fannie Mae Mortgage Pool, (4) | 5.500% | 3/01/36 | Aaa | 58,700 | |||||||||||||||
| 205 | Fannie Mae Mortgage Pool, (4) | 6.000% | 6/01/36 | Aaa | 232,331 | |||||||||||||||
| 170 | Fannie Mae Mortgage Pool, (4) | 5.500% | 4/01/37 | Aaa | 190,222 | |||||||||||||||
| 217 | Fannie Mae Mortgage Pool, (4) | 5.000% | 6/01/37 | Aaa | 238,913 | |||||||||||||||
| 167 | Fannie Mae Mortgage Pool, (4) | 5.500% | 6/01/38 | Aaa | 187,618 | |||||||||||||||
| 2,491 | Fannie Mae Mortgage Pool, (4) | 3.500% | 2/01/44 | Aaa | 2,569,870 | |||||||||||||||
| 151 | Fannie Mae REMIC Pass-Through Certificates | 6.418% | 2/25/42 | Aaa | 175,119 | |||||||||||||||
| 707 | Fannie Mae REMIC Pass-Through Certificates | 4.323% | 12/25/42 | B3 | 443,551 | |||||||||||||||
| 786 | Fannie Mae REMIC Pass-Through Certificates | 5.527% | 7/25/44 | CC | 313,634 | |||||||||||||||
| 4,605 | Fannie Mae TBA Mortgage Pool, (MDR), (WI/DD) | 4.000% | TBA | N/R | 4,878,906 | |||||||||||||||
| 2,500 | Fannie Mae TBA Mortgage Pool, (MDR), (WI/DD) | 3.000% | TBA | N/R | 2,490,674 | |||||||||||||||
| 2,000 | Fannie Mae TBA Mortgage Pool, (MDR), (WI/DD) | 3.500% | TBA | N/R | 2,061,094 | |||||||||||||||
| 2,975 | Fannie Mae TBA Mortgage Pool, (MDR), (WI/DD) | 4.500% | TBA | N/R | 3,216,253 | |||||||||||||||
| 4,355 | Federal Home Loan Mortgage Corporation, Mortgage Pool, (4) | 3.000% | 4/01/43 | Aaa | 4,341,863 | |||||||||||||||
| 201 | First Horizon Alternative Mortgage Securities Trust, Pass-Through Certificates, Series 2005-FA5 | 5.500% | 8/25/35 | C | 12,571 | |||||||||||||||
| 3,302 | Freddie Mac Gold Mortgage Pool, (4) | 3.000% | 1/01/29 | Aaa | 3,421,904 | |||||||||||||||
| 2,217 | Freddie Mac Mortgage Pool, (4) | 3.500% | 1/01/44 | Aaa | 2,283,278 | |||||||||||||||
| 2,170 | Freddie Mac Mortgage Pool, (4) | 3.500% | 2/01/44 | Aaa | 2,235,041 | |||||||||||||||
| 45 | Freddie Mac Mortgage Pool, Various, (4) | 6.500% | 11/01/28 | Aaa | 52,278 | |||||||||||||||
| 282 | Freddie Mac Mortgage Trust 2012-K708, 144A | 3.755% | 2/25/45 | Aaa | 292,242 | |||||||||||||||
| 460 | Freddie Mac Mortgage Trust 2013-KF02, 144A | 3.191% | 12/25/45 | AAA | 473,430 | |||||||||||||||
| 255 | Freddie Mac Mortgage Trust, Multifamily Mortgage Pass-Through Certificates, Series 2012-K706, 144A | 4.027% | 11/25/44 | AA+ | 267,455 | |||||||||||||||
| 500 | Freddie Mac Mortgage Trust, Multifamily Mortgage Pass-Through Certificates, Series 2012-K706, 144A | 4.027% | 11/25/44 | Baa2 | 517,408 | |||||||||||||||
| Nuveen Investments | 21 |
| Nuveen Multi-Market Income Fund | ||
| Portfolio of Investments (continued) | June 30, 2015 |
| Principal Amount (000) | Description (1) | Coupon | Maturity | Ratings (2) | Value | |||||||||||||||
ASSET-BACKED AND MORTGAGE-BACKED SECURITIES (continued) |
| |||||||||||||||||||
| $ | 500 | Freddie Mac Mortgage Trust, Multifamily Mortgage Pass-Through Certificates, Series 2012-K708, 144A | 3.755% | 2/25/45 | BBB | $ | 510,940 | |||||||||||||
| 500 | Freddie Mac Mortgage Trust, Multifamily Mortgage Pass-Through Certificates, Series 2012-K711, 144A | 3.562% | 8/25/45 | Aaa | 518,187 | |||||||||||||||
| 750 | Freddie Mac Mortgage Trust, Multifamily Mortgage Pass-Through Certificates, Series 2013-K712, 144A | 3.368% | 5/25/45 | BBB | 750,451 | |||||||||||||||
| 750 | Freddie Mac Mortgage Trust, Multifamily Mortgage-Pass Through Certificates, Series 2012-K709, 144A | 3.741% | 4/25/45 | Aaa | 768,896 | |||||||||||||||
| 235 | Freddie Mac Mortgage Trust, Series 2010-K7, 144A | 5.441% | 4/25/20 | A– | 262,960 | |||||||||||||||
| 500 | Freddie Mac Multifamily Mortgage Trust, Series 2011-K704, 144A | 4.535% | 10/25/30 | AA+ | 527,263 | |||||||||||||||
| — | (5) | Freddie Mac Non Gold Participation Certificates | 2.118% | 9/01/18 | Aaa | 5 | ||||||||||||||
| 500 | GMAT Trust Mortgage Pool 2013-1A, 144A | 5.000% | 11/25/43 | N/R | 477,774 | |||||||||||||||
| 1,000 | Goldman Sachs Mortgage Securities Corporation II, Commercial Mortgage Pass-Through Certificates, Series 2014-GSFL, 144A | 2.437% | 7/15/31 | A– | 988,527 | |||||||||||||||
| 136 | Goldman Sachs Mortgage Securities Corporation, GSMPS Mortgage Pass-Through Certificates, Series 2001-2, 144A | 7.500% | 6/19/32 | B | 141,243 | |||||||||||||||
| 1,322 | Goldman Sachs Mortgage Securities Corporation, GSMPS Mortgage Pass-Through Certificates, Series 2006-RP2 B1 | 6.043% | 4/25/36 | CC | 207,183 | |||||||||||||||
| 966 | Goldman Sachs Mortgage Securities Corporation, GSMPS Mortgage Pass-Through Certificates, Series 2006-RP2 B2 | 6.043% | 4/25/36 | C | 48,196 | |||||||||||||||
| 1,223 | Goldman Sachs Mortgage Securities Corporation, Mortgage Pass-Through Certificates, Series 2003-1 B2, (6) | 0.066% | 3/25/43 | Ca | 12 | |||||||||||||||
| 113 | Goldman Sachs Mortgage Securities Corporation, Mortgage Pass-Through Certificates, Series 2003-10 1A1 | 2.661% | 10/25/33 | BBB+ | 112,382 | |||||||||||||||
| 489 | Goldman Sachs Mortgage Securities Corporation, Mortgage Pass-Through Certificates, Series 2005-RP2 1A2, 144A | 7.500% | 3/25/35 | B1 | 538,462 | |||||||||||||||
| 488 | Goldman Sachs Mortgage Securities Corporation, Mortgage Pass-Through Certificates, Series 2005-RP3 1A2, 144A | 7.500% | 9/25/35 | B1 | 539,642 | |||||||||||||||
| 89 | Government National Mortgage Association Pool, (4) | 1.625% | 12/20/22 | Aaa | 92,444 | |||||||||||||||
| 362 | Government National Mortgage Association Pool, (4) | 5.500% | 8/15/33 | Aaa | 418,093 | |||||||||||||||
| 226 | Government National Mortgage Association Pool, (4) | 6.000% | 7/15/34 | Aaa | 264,436 | |||||||||||||||
| 210 | Greenwich Capital Commercial Funding Corporation, Commercial Mortgage Pass-Through Certificates, Series 2007-GG11 | 5.736% | 12/10/49 | AAA | 222,868 | |||||||||||||||
| 900 | Home Loan Servicing Solutions, HLSS Servicer Advance Receivables Backed Notes 2012-T1, 144A | 4.458% | 1/15/48 | BBB | 886,860 | |||||||||||||||
| 750 | Home Loan Servicing Solutions, HLSS Servicer Advance Receivables Backed Notes 2012-T1, 144A | 3.228% | 1/16/46 | BBB | 750,234 | |||||||||||||||
| 750 | Home Loan Servicing Solutions, HLSS Servicer Advance Receivables Backed Notes 2012-T2, 144A | 4.940% | 10/15/45 | BBB | 749,250 | |||||||||||||||
| 500 | Home Loan Servicing Solutions, HLSS Servicer Advance Receivables Backed Notes 2013-T3, 144A | 3.130% | 5/15/46 | BBB | 487,500 | |||||||||||||||
| 368 | Impac Secured Assets Corporation, Mortgage Pass-Through Certificates, Series 2000-3 | 8.000% | 10/25/30 | CCC | 357,512 | |||||||||||||||
| 833 | IndyMac INDX Mortgage Loan Trust, Series 2006-AR13 A3 | 4.523% | 7/25/36 | Caa1 | 722,300 | |||||||||||||||
| 456 | IndyMac MBS Inc., Residential Asset Securitization Trust, Mortgage Pass-Through Certificates, Series 2003-A15 | 4.250% | 2/25/34 | A | 456,418 | |||||||||||||||
| 205 | IndyMac MBS Inc., Residential Asset Securitization Trust, Mortgage Pass-Through Certificates, Series 2004-A2 | 4.000% | 5/25/34 | A+ | 206,077 | |||||||||||||||
| 15 | Jeffries & Company Securitization Trust 2009-R4, 144A | 5.750% | 1/26/36 | AA | 15,252 | |||||||||||||||
| 494 | JP Morgan Alternative Loan Trust 2006-S1, Mortgage Pass-Through Certificates | 6.500% | 3/25/36 | D | 432,867 | |||||||||||||||
| 750 | JP Morgan Chase Commercial Mortgage Securities Corporation, Commercial Mortgage Pass-Through Certificates, Series 2011-C4 C, 144A | 5.278% | 7/15/46 | A | 821,153 | |||||||||||||||
| 270 | Lavender Trust, Mortgage Pass-Through Certificates, Series 2010-R10A, 144A | 6.250% | 9/26/36 | N/R | 273,731 | |||||||||||||||
| 449 | LB-UBS Commercial Mortgage Trust, Commercial Mortgage Pass-Through Certificates, Series 2007-C7 | 5.866% | 9/15/45 | AAA | 485,475 | |||||||||||||||
| 181 | Lehman ABS Manufactured Housing Contract Asset Backed Certificates, Series 2001B | 4.350% | 4/15/40 | AA | 186,479 | |||||||||||||||
| 79 | Lehman Mortgage Trust, Mortgage Pass-Through Certificates, Series 2008-6 | 5.517% | 7/25/47 | BB+ | 80,178 | |||||||||||||||
| 528 | Master RePerforming Loan Trust 2005-1, 144A | 7.500% | 8/25/34 | Ba3 | 551,334 | |||||||||||||||
| 635 | Master Resecuritization Trust 2009-1, 144A | 6.000% | 10/25/36 | A | 669,149 | |||||||||||||||
| 484 | Merrill Lynch Alternative Note Asset, 2007-F1 2A7 | 6.000% | 3/25/37 | Caa3 | 380,244 | |||||||||||||||
| 885 | Mid-State Capital Corporation Trust Notes, Series 2004-1 A | 6.005% | 8/15/37 | AAA | 925,190 | |||||||||||||||
| 1,237 | Mid-State Capital Corporation Trust Notes, Series 2005-1 | 5.745% | 1/15/40 | AA | 1,330,472 | |||||||||||||||
| 281 | Mid-State Trust 2010-1, 144A | 7.000% | 12/15/45 | A | 301,683 | |||||||||||||||
| 1,148 | Mid-State Trust 2010-1, 144A | 5.250% | 12/15/45 | AA | 1,200,202 | |||||||||||||||
| 368 | Mid-State Trust XI | 5.598% | 7/15/38 | A+ | 385,176 | |||||||||||||||
| 22 | Nuveen Investments |
| Principal Amount (000) | Description (1) | Coupon | Maturity | Ratings (2) | Value | |||||||||||||||
ASSET-BACKED AND MORTGAGE-BACKED SECURITIES (continued) |
| |||||||||||||||||||
| $ | 250 | Morgan Stanley Capital I Trust, Commercial Mortgage Pass-Through Certificates, Series 2011-C1 C, 144A | 5.331% | 9/15/47 | A+ | $ | 274,229 | |||||||||||||
| 236 | Morgan Stanley Mortgage Loan Trust, Pass-Through Certificates, 2006-2 | 5.750% | 2/25/36 | Caa2 | 223,210 | |||||||||||||||
| 500 | Morgan Stanley Re REMIC Trust Series 2009-GG10, 144A | 5.795% | 8/12/45 | A | 532,664 | |||||||||||||||
| — | (5) | Mortgage Asset Securitization Transaction Inc., Adjustable Rate Mortgage Pass-Through Certificates, Series 2003-5 | 2.226% | 11/25/33 | A+ | — | ||||||||||||||
| 365 | Mortgage Asset Securitization Transaction Inc., Alternative Loan Trust Mortgage Pass-Through Certificates Series 2004-1 | 7.000% | 1/25/34 | BBB– | 377,384 | |||||||||||||||
| 586 | Mortgage Asset Securitization Transaction Inc., Alternative Loan Trust Mortgage Pass-Through Certificates, 2004-5 6A1 | 7.000% | 6/25/34 | A+ | 624,715 | |||||||||||||||
| 165 | Mortgage Asset Securitization Transaction Inc., Mortgage Pass-Through Certificates, Series 2003-5 | 5.000% | 6/25/18 | AA | 170,175 | |||||||||||||||
| 525 | Nationstar Agency Fund Trust, Series 2013-T2A, 144A | 7.385% | 2/18/48 | B | 527,268 | |||||||||||||||
| 350 | Nationstar Agency Fund Trust, Series 2013-T2A, 144A | 4.212% | 2/18/48 | BBB | 352,114 | |||||||||||||||
| 335 | New Residential Mortgage Loan Trust, Mortgage Pass-Through Certificates, Series 2014-2A, 144A | 3.750% | 5/25/54 | AAA | 345,550 | |||||||||||||||
| 91 | Oakwood Mortgage Investors Inc., Series 1999-A | 6.090% | 4/15/29 | A | 91,452 | |||||||||||||||
| 179 | Origen Manufactured Housing Contract Trust Collateralized Notes Series 2004-B MI | 5.730% | 11/15/35 | AA | 186,771 | |||||||||||||||
| 384 | Origen Manufactured Housing Contract Trust Collateralized Notes Series 2005B | 5.990% | 1/15/37 | A+ | 402,511 | |||||||||||||||
| 915 | Origen Manufactured Housing Contract Trust Notes, Series 2004A | 6.640% | 1/15/35 | A | 991,831 | |||||||||||||||
| 510 | Renaissance Home Equity Loan Trust Asset Backed Certificates, Series 2005-4 A6 | 5.749% | 2/25/36 | Caa1 | 464,046 | |||||||||||||||
| 540 | Residential Asset Mortgage Products Inc., Mortgage Asset-Backed Pass-Through Certificates, Series 2003-SL1 M2 | 7.363% | 4/25/31 | CC | 5 | |||||||||||||||
| 850 | Residential Asset Securities Corporation , Home Equity Mortgage Asset Backed Pass-Through Certificates, Series 2004-KS1 | 5.221% | 2/25/34 | BB+ | �� | 881,566 | ||||||||||||||
| 209 | Residential Funding Mortgage Securities II, Inc., Home Loan Backed Notes Trust 2003-HI4 | 6.030% | 2/25/29 | A+ | 219,456 | |||||||||||||||
| 365 | Residential Funding Mortgage Trust I, 2007-S9 | 6.000% | 10/25/37 | D | 309,156 | |||||||||||||||
| 349 | Salomon Brothers Commercial Mortgage Trust Pass-Through VII Certificates, Series 2003-1 A2, 144A | 6.000% | 9/25/33 | BB | 345,845 | |||||||||||||||
| 500 | Springleaf Mortgage Loan Trust 2013-2A, 144A | 3.520% | 12/25/65 | AA | 509,185 | |||||||||||||||
| 750 | Springleaf Mortgage Loan Trust, Series 2012-3, 144A | 5.300% | 12/25/59 | BBB | 770,518 | |||||||||||||||
| 770 | Springleaf Mortgage Loan Trust, Series 2013-1A, 144A | 4.440% | 6/25/58 | BBB | 777,445 | |||||||||||||||
| 500 | V Mortgage LLC, Pass-Through Certificate , Series 2014-NPL1, 144A | 4.750% | 4/27/54 | N/R | 486,268 | |||||||||||||||
| 141 | Vanderbilt Acquisition Loan Trust, Series 2002-1 | 6.570% | 5/07/27 | AAA | 144,941 | |||||||||||||||
| 500 | Vericrest Opportunity Loan Transferee, Series 2014-NPL7, 144A | 4.750% | 8/27/57 | N/R | 499,320 | |||||||||||||||
| 500 | Vericrest Opportunity Loan Transferee, Series 2015-NLP4, 144A | 4.250% | 2/25/55 | N/R | 493,462 | |||||||||||||||
| 234 | Wachovia Bank Commercial Mortgage Trust, Commercial Mortgage Pass-Through Certificates, Series 2007-C30 | 5.246% | 12/15/43 | AAA | 237,358 | |||||||||||||||
| 470 | Walter Investment Management Company Capital Trust, Series 2012-AA, 144A | 4.549% | 10/16/50 | BBB | 473,780 | |||||||||||||||
| 97 | Washington Mutual Mortgage Securities Corporation, Mortgage Pass-Through Certificates, Series 2003-MS1 | 5.250% | 2/25/18 | AA+ | 98,581 | |||||||||||||||
| 62 | Washington Mutual Mortgage Securities Corporation, Mortgage Pass-Through Certificates, Series 2004-RA3 | 6.342% | 8/25/38 | AA | 65,863 | |||||||||||||||
| 750 | Wells Fargo-RBS Commercial Mortgage Trust, Commercial Mortgage Pass-Through Certificates, Series 2011-C3, 144A | 5.335% | 3/15/44 | A2 | 816,334 | |||||||||||||||
| 250 | WF-RBS Commercial Mortgage Trust, Commercial Mortgage Pass-Through Certificates, Series 2011-C2, 144A | 5.392% | 2/15/44 | A2 | 272,714 | |||||||||||||||
| $ | 85,726 | Total Asset-Backed and Mortgage-Backed Securities (cost $83,595,562) | 82,555,588 | |||||||||||||||||
| Shares | Description (1), (8) | Value | ||||||||||||||||||
INVESTMENT COMPANIES – 0.6% (0.4% of Total Investments) | ||||||||||||||||||||
| 32,000 | Blackrock Credit Allocation Income Trust IV | $ | 405,440 | |||||||||||||||||
| 7,000 | Pioneer Floating Rate Trust | 79,660 | ||||||||||||||||||
Total Investment Companies (cost $486,936) | 485,100 | |||||||||||||||||||
| Principal Amount (000) | Description (1) | Coupon | Maturity | Ratings (2) | Value | |||||||||||||||
SOVEREIGN DEBT – 0.2% (0.1% of Total Investments) | ||||||||||||||||||||
| Uruguay – 0.2% | ||||||||||||||||||||
| $ | 123 | Republic of Uruguay | 8.000% | 11/18/22 | BBB | $ | 157,591 | |||||||||||||
| $ | 123 | Total Sovereign Debt (cost $125,900) | 157,591 | |||||||||||||||||
Total Long-term Investments (cost $111,196,772) | 109,866,619 | |||||||||||||||||||
| Nuveen Investments | 23 |
| Nuveen Multi-Market Income Fund | ||
| Portfolio of Investments (continued) | June 30, 2015 |
| Principal Amount (000) | Description (1) | Coupon | Maturity | Value | ||||||||||||||
SHORT-TERM INVESTMENTS – 2.9% (2.0% of Total Investments) | ||||||||||||||||||
| REPURCHASE AGREEMENTS – 2.9% (2.0% of Total Investments) | ||||||||||||||||||
| $ | 2,267 | Repurchase Agreement with State Street Bank, dated 6/30/15, repurchase price $2,267,486, collateralized by $1,690,000 U.S. Treasury Bonds, 8.000%, due 11/15/21, value $2,319,261 | 0.000% | 7/01/15 | $ | 2,267,486 | ||||||||||||
Total Short-Term Investments (cost $2,267,486) | 2,267,486 | |||||||||||||||||
Total Investments (cost $113,464,258) – 141.1% | 112,134,105 | |||||||||||||||||
Reverse Repurchase Agreements – (26.0)% | (20,631,000 | ) | ||||||||||||||||
Other Assets Less Liabilities – (15.1)% (9) | (12,005,312 | ) | ||||||||||||||||
Net Assets – 100% | $ | 79,497,793 | ||||||||||||||||
Investments in Derivatives as of June 30, 2015
Futures Contracts outstanding:
| Description | Contract Position | Number of Contracts | Contract Expiration | Notional Amount at Value | Variation Margin Receivable/ (Payable) | Unrealized Appreciation (Depreciation) | ||||||||||||||||
U.S. Treasury 2-Year Note | Short | (3 | ) | 9/15 | $ | (656,813 | ) | $ | 141 | $ | (1,035 | ) | ||||||||||
U.S. Treasury 5-Year Note | Short | (101 | ) | 9/15 | (12,045,039 | ) | 3,945 | (2,962 | ) | |||||||||||||
U.S. Treasury 10-Year Note | Short | (75 | ) | 9/15 | (9,462,891 | ) | 2,344 | 54,630 | ||||||||||||||
U.S. Ultra Bond | Short | (9 | ) | 9/15 | (1,386,562 | ) | 562 | 41,054 | ||||||||||||||
| $ | (23,551,305 | ) | $ | 6,992 | $ | 91,687 | ||||||||||||||||
| For Fund portfolio compliance purposes, the Fund’s industry classifications refer to any one or more of the industry sub-classifications used by one or more widely recognized market indexes or ratings group indexes, and/or as defined by Fund management. This definition may not apply for purposes of this report, which may combine industry sub-classifications into sectors for reporting ease. |
| (1) | All percentages shown in the Portfolio of Investments are based on net assets. |
| (2) | Ratings (not covered by the report of independent registered public accounting firm): Using the highest of Standard & Poor’s Group (“Standard & Poor’s”), Moody’s Investors Service, Inc. (“Moody’s”) or Fitch, Inc. (“Fitch”) rating. Ratings below BBB by Standard & Poor’s, Baa by Moody’s or BBB by Fitch are considered to be below investment grade. Holdings designated N/R are not rated by any of these national rating agencies. |
| (3) | Perpetual security. Maturity date is not applicable. |
| (4) | Investment, or portion of investment, has been pledged to collateralize the net payment obligations for investments in reverse repurchase agreements. |
| (5) | Principal Amount (000) rounds to less than $1,000. |
| (6) | As of, or subsequent to, the end of the reporting period this security is non-income producing. Non-income producing, in the case of a fixed-income security, generally denotes that the issuer has (1) defaulted on the payment of principal or interest, (2) is under the protection of the Federal Bankruptcy Court or (3) the Fund’s Adviser has concluded that the issue is not likely to meet its future interest payment obligations and has ceased accruing additional income on the Fund’s records. |
| (7) | Investment valued at fair value using methods determined in good faith by, or at the discretion of, the Board. For fair value measurement disclosure purposes, investment classified as Level 3. See Notes to Financial Statements, Note 2 – Investment Valuation and Fair Value Measurements for more information. |
| (8) | A copy of the most recent financial statements for these investment companies can be obtained directly from the Securities and Exchange Commission on its website at http://www.sec.gov. |
| (9) | Other assets less liabilities includes the unrealized appreciation (depreciation) of certain over-the-counter derivatives as presented on the Statement of Assets and Liabilities. The unrealized appreciation (depreciation) of exchange-cleared and exchange-traded derivatives is recognized as part of the cash collateral at brokers and/or the receivable or payable for variation margin as presented on the Statement of Assets and Liabilities, when applicable. |
| MDR | Denotes investment is subject to dollar roll transactions. |
| REIT | Real Estate Investment Trust |
| TBA | To be announced. Maturity date not known prior to settlement of this transaction. |
| 144A | Investment is exempt from registration under Rule 144A of the Securities Act of 1933, as amended. These investments may only be resold in transactions exempt from registration, which are normally those transactions with qualified institutional buyers. |
| (WI/DD) | Investment, or portion of investment, purchased on a when-issued or delayed delivery basis. |
See accompanying notes to financial statements.
| 24 | Nuveen Investments |
Assets and Liabilities | June 30, 2015 | |||||
Assets | ||||
Long-term investments, at value (cost $111,196,772) | $ | 109,866,619 | ||
Short-term investments, at value (cost approximates value) | 2,267,486 | |||
Cash | 519,482 | |||
Cash and cash equivalent collateral at brokers(1) | 835,309 | |||
Receivable for: | ||||
Dividends | 6,858 | |||
Interest | 811,944 | |||
Investments sold | 259,609 | |||
Paydowns | 145,911 | |||
Variation margin on futures contracts | 6,992 | |||
Other assets | 4,935 | |||
Total assets | 114,725,145 | |||
Liabilities | ||||
Reverse repurchase agreements | 20,631,000 | |||
Payable for: | ||||
Dividends | 352,827 | |||
Investments purchased | 14,092,498 | |||
Accrued expenses: | ||||
Interest | 9,628 | |||
Management fees | 80,312 | |||
Trustees fees | 615 | |||
Other | 60,472 | |||
Total liabilities | 35,227,352 | |||
Net assets | $ | 79,497,793 | ||
Shares outstanding | 9,464,150 | |||
Net asset value (“NAV”) per share outstanding | $ | 8.40 | ||
Net assets consist of: | ||||
Shares, $0.01 par value per share | $ | 94,642 | ||
Paid-in surplus | 82,360,816 | |||
Undistributed (Over-distribution of) net investment income | (78,702 | ) | ||
Accumulated net realized gain (loss) | (1,640,497 | ) | ||
Net unrealized appreciation (depreciation) | (1,238,466 | ) | ||
Net assets | $ | 79,497,793 | ||
Authorized shares | Unlimited |
| (1) | Cash pledged to collateralize the net payment obligations for investments in derivatives in addition to the Fund’s securities pledged as collateral as noted in the Fund’s portfolio of investments. |
See accompanying notes to financial statements.
| Nuveen Investments | 25 |
Operations | Year Ended June 30, 2015 | |||||
Investment Income | ||||
Dividends | $ | 121,467 | ||
Interest | 5,323,846 | |||
Total investment income | 5,445,313 | |||
Expenses | ||||
Management fees | 899,797 | |||
Interest expense | 93,590 | |||
Administration fees | 18,333 | |||
Custodian fees | 60,722 | |||
Directors/Trustees fees | 15,967 | |||
Professional fees | 70,388 | |||
Shareholder reporting expenses | 61,581 | |||
Shareholder servicing agent fees | 12,640 | |||
Stock exchange listing fees | 25,931 | |||
Investor relations expenses | 11,976 | |||
Other | 19,888 | |||
Total expenses before fee waiver/expense reimbursement | 1,290,813 | |||
Fee waiver/expense reimbursement | (271,347 | ) | ||
Net expenses | 1,019,466 | |||
Net investment income (loss) | 4,425,847 | |||
Realized and Unrealized Gain (Loss) | ||||
Net realized gain (loss) from: | ||||
Investments | (273,820 | ) | ||
Futures contracts | (738,305 | ) | ||
Change in net unrealized appreciation (depreciation) of: | ||||
Investments | (1,973,567 | ) | ||
Futures contracts | 42,825 | |||
Net realized and unrealized gain (loss) | (2,942,867 | ) | ||
Net increase (decrease) in net assets from operations | $ | 1,482,980 |
See accompanying notes to financial statements.
| 26 | Nuveen Investments |
Changes in Net Assets | ||||||
| Year Ended 6/30/15 | Ten Months Ended 6/30/14 | Year Ended 8/31/13 | ||||||||||
Operations | ||||||||||||
Net investment income (loss) | $ | 4,425,847 | $ | 3,815,802 | $ | 5,023,348 | ||||||
Net realized gain (loss) from: | ||||||||||||
Investments | (273,820 | ) | 2,196,299 | 1,057,050 | ||||||||
Futures contracts | (738,305 | ) | (935,053 | ) | 794,371 | |||||||
Change in net unrealized appreciation (depreciation) of: | ||||||||||||
Investments | (1,973,567 | ) | 2,325,767 | (3,025,776 | ) | |||||||
Futures contracts | 42,825 | 113,785 | 29,936 | |||||||||
Net increase (decrease) in net assets from operations | 1,482,980 | 7,516,600 | 3,878,929 | |||||||||
Distributions to Shareholders | ||||||||||||
From net investment income | (4,542,792 | ) | (3,861,373 | ) | (5,207,765 | ) | ||||||
From accumulated net realized gains | — | — | — | |||||||||
From return of capital | — | — | (134,748 | ) | ||||||||
Decrease in net assets from distributions to shareholders | (4,542,792 | ) | (3,861,373 | ) | (5,342,513 | ) | ||||||
Net increase (decrease) in net assets | (3,059,812 | ) | 3,655,227 | (1,463,584 | ) | |||||||
Net assets at the beginning of period | 82,557,605 | 78,902,378 | 80,365,962 | |||||||||
Net assets at the end of period | $ | 79,497,793 | $ | 82,557,605 | $ | 78,902,378 | ||||||
Undistributed (Over-distribution of) net investment income at the end of period | $ | (78,702 | ) | $ | 36,910 | $ | (7,843 | ) | ||||
See accompanying notes to financial statements.
| Nuveen Investments | 27 |
Cash Flows | Year Ended June 30, 2015 | |||||
Cash Flows from Operating Activities: | ||||
Net Increase (Decrease) in Net Assets from Operations | $ | 1,482,980 | ||
Adjustments to reconcile the net increase (decrease) in net assets from operations to net cash provided by (used in) | ||||
Purchases of investments | (160,385,290 | ) | ||
Proceeds from sales and maturities of investments | 163,729,402 | |||
Proceeds from (Purchases of) short-term investments, net | (827,207 | ) | ||
Investment transaction adjustments, net | 8,998 | |||
Amortization (Accretion) of premiums and discounts, net | (142,276 | ) | ||
(Increase) Decrease in: | ||||
Cash collateral at brokers | (560,309 | ) | ||
Receivable for dividends | (6,846 | ) | ||
Receivable for interest | (95,156 | ) | ||
Receivable for investments sold | (259,609 | ) | ||
Receivable for paydowns | (145,911 | ) | ||
Receivable for variation margin on futures contracts | (6,992 | ) | ||
Other assets | (4,474 | ) | ||
Increase (Decrease) in: | ||||
Payable for investments purchased | 2,863,436 | |||
Payable for variation margin on futures contracts | (19,930 | ) | ||
Accrued interest | 3,241 | |||
Accrued management fees | 37,231 | |||
Accrued Trustees fees | 615 | |||
Accrued other expenses | (32,230 | ) | ||
Net realized (gain) loss from: | ||||
Investments | 273,820 | |||
Paydowns | 94,364 | |||
Change in net unrealized appreciation (depreciation) of investments | 1,973,567 | |||
Net cash provided by (used in) operating activities | 7,981,424 | |||
Cash Flows from Financing Activities: | ||||
Increase (decrease) in cash overdraft | (977 | ) | ||
Net borrowings through reverse repurchase agreements | (3,271,000 | ) | ||
Cash distributions paid to shareholders | (4,189,965 | ) | ||
Net cash provided by (used in) financing activities | (7,461,942 | ) | ||
Net Increase (Decrease) in Cash | 519,482 | |||
Cash at the beginning of period | — | |||
Cash at the end of period | $ | 519,482 | ||
| Supplemental Disclosures of Cash Flow Information | ||||
Cash paid for interest | $ | 90,349 | ||
See accompanying notes to financial statements.
| 28 | Nuveen Investments |
THIS PAGE INTENTIONALLY LEFT BLANK
| Nuveen Investments | 29 |
Highlights
Selected data for a share outstanding throughout each period:
| Investment Operations | Less Distributions | |||||||||||||||||||||||||||||||||||||||
| Beginning NAV | Net Investment Income (Loss)(a) | Net | Total | From Net Investment Income | From Accumulated Net Realized Gains | Return of Capital | Total | Ending NAV | Ending Share Price | |||||||||||||||||||||||||||||||
Year Ended 6/30: | ||||||||||||||||||||||||||||||||||||||||
2015 | $ | 8.72 | $ | 0.47 | $ | (0.31 | ) | $ | 0.16 | $ | (0.48 | ) | — | $ | — | $ | (0.48 | ) | $ | 8.40 | $ | 7.21 | ||||||||||||||||||
2014(f) | 8.34 | 0.40 | 0.39 | 0.79 | (0.41 | ) | — | — | (0.41 | ) | 8.72 | 7.77 | ||||||||||||||||||||||||||||
Year Ended 8/31: | ||||||||||||||||||||||||||||||||||||||||
2013 | 8.49 | 0.53 | (0.12 | ) | 0.41 | (0.56 | ) | — | — | (0.56 | ) | 8.34 | 7.25 | |||||||||||||||||||||||||||
2012 | 8.42 | 0.59 | 0.10 | 0.69 | (0.60 | ) | — | (0.02 | ) | (0.62 | ) | 8.49 | 8.10 | |||||||||||||||||||||||||||
2011 | 8.37 | 0.63 | 0.08 | 0.71 | (0.66 | ) | — | — | (0.66 | ) | 8.42 | 7.72 | ||||||||||||||||||||||||||||
2010 | 7.50 | 0.71 | 0.91 | 1.62 | (0.72 | ) | — | (0.03 | ) | (0.75 | ) | 8.37 | 8.64 | |||||||||||||||||||||||||||
| 30 | Nuveen Investments |
| Ratios/Supplemental Data | ||||||||||||||||||||||||||||||
| Total Returns | Ratios to Average Net Assets Before Reimbursement(c) | Ratios to Average Net Assets After Reimbursement(c)(d) | ||||||||||||||||||||||||||||
| Based on NAV(b) | Based on Share Price(b) | Ending Net Assets (000) | Expenses | Net Investment Income (Loss) | Expenses | Net Investment Income (Loss) | Portfolio Turnover Rate(e) | |||||||||||||||||||||||
| 1.88 | % | (1.24 | )% | $ | 79,498 | 1.60 | % | 5.14 | % | 1.26 | % | 5.47 | % | 143 | % | |||||||||||||||
| 9.68 | 13.10 | 82,558 | 1.22 | * | 5.68 | * | 1.22 | * | 5.68 | * | 251 | |||||||||||||||||||
| 4.93 | (4.19 | ) | 78,902 | 1.18 | 6.20 | 1.18 | 6.20 | 310 | ||||||||||||||||||||||
| 8.56 | 13.58 | 80,366 | 1.25 | 7.05 | 1.25 | 7.05 | 260 | |||||||||||||||||||||||
| 8.75 | (3.15 | ) | 79,671 | 1.17 | 7.37 | 1.17 | 7.37 | 265 | ||||||||||||||||||||||
| 22.59 | 32.84 | 79,122 | 1.11 | 8.88 | 1.11 | 8.88 | 273 | |||||||||||||||||||||||
| (a) | Per share Net Investment Income (Loss) is calculated using the average daily shares method. |
| (b) | Total Return Based on NAV is the combination of changes in NAV, reinvested dividend income at NAV and reinvested capital gains distributions at NAV, if any. The last dividend declared in the period, which is typically paid on the first business day of the following month, is assumed to be reinvested at the ending NAV. The actual reinvest price for the last dividend declared in the period may often be based on the Fund’s market price (and not its NAV), and therefore may be different from the price used in the calculation. Total returns are not annualized. |
Total Return Based on Share Price is the combination of changes in the market price per share and the effect of reinvested dividend income and reinvested capital gains distributions, if any, at the average price paid per share at the time of reinvestment. The last dividend declared in the period, which is typically paid on the first business day of the following month, is assumed to be reinvested at the ending market price. The actual reinvestment for the last dividend declared in the period may take place over several days, and in some instances may not be based on the market price, so the actual reinvestment price may be different from the price used in the calculation. Total returns are not annualized.
| (c) • | Net Investment Income (Loss) ratios reflect income earned and expenses incurred on assets attributable to reverse repurchase agreements, where applicable, as described in Note 3 – Portfolio Securities and Investments in Derivatives, Reverse Repurchase Agreements. |
| • | Each ratio includes the effect of all interest expenses paid and other costs related to reverse repurchase agreements, where applicable, as follows: |
Ratios of Interest Expense to Average Net Assets | ||||
Year Ended 6/30: |
| |||
2015 | 0.12 | % | ||
2014(f) | 0.06 | * | ||
Year Ended 8/31: | ||||
2013 | 0.04 | |||
2012 | 0.06 | |||
2011 | 0.06 | |||
2010 | 0.08 | |||
| (d) | After fee waiver and/or expense reimbursement from the Adviser, where applicable. |
| (e) | Portfolio Turnover Rate is calculated based on the lesser of long-term purchases or sales (as disclosed in Note 5 – Investment Transactions) divided by the average long-term market value during the period. |
| (f) | For the ten months ended June 30, 2014. |
| * | Annualized. |
See accompanying notes to financial statements.
| Nuveen Investments | 31 |
Financial Statements
1. General Information and Significant Accounting Policies
General Information
Fund Information
Nuveen Multi-Market Income Fund (the “Fund”) is registered under the Investment Company Act of 1940, as amended, as a diversified closed-end management investment company. The Fund’s shares are listed on the New York Stock Exchange (“NYSE”) and trade under the ticker symbol “JMM.” The Fund was organized as a Massachusetts business trust on May 27, 2014.
The end of the reporting period for the Fund is June 30, 2015, and the period covered by these Notes to Financial Statements is the fiscal year ended June 30, 2015. (“the current fiscal period”).
The Fund was previously named American Income Fund, Inc. (MRF) and was advised by U.S. Bancorp Asset Management, Inc. (“USBSM”) and sub-advised by Nuveen Fund Advisors, LLC (“NFAL”) and Nuveen Asset Management, LLC (“NAM”). On September 8, 2014, NFAL (the “Adviser”), a wholly-owned subsidiary of Nuveen Investments, Inc. (“Nuveen”), became the Fund’s investment adviser and assumed management responsibility for the Fund, and NAM became the sole sub-adviser to the Fund (the “Transition”). At the same time, the Fund’s name was changed to Nuveen Multi-Market Income Fund (JMM) and the trustees who oversee the funds in the Nuveen Fund complex became trustees of the Fund. The Fund’s investment strategy and portfolio management team remained unchanged after the Transition. In conjunction with the Transition, a change-of-domicile transaction converting the Fund from a Virginia corporation to a Massachusetts business trust occurred on November 19, 2014.
Investment Objective and Principal Investment Strategies
The Fund seeks to provide high monthly income consistent with prudent risk to capital. The Fund will invest primarily in debt securities, including, but not limited to, U.S. agency and privately issued mortgage-backed securities, corporate debt securities, and asset-backed securities. Under normal market conditions, at least 65% of the Fund’s total assets must be invested in securities that, at the time of purchase, are rated investment-grade or of comparable quality. No more than 35% of the Fund’s total assets may be held in high-yield issues. The Fund is authorized to borrow funds or issue senior securities in amounts not exceeding 33 1⁄3% of its total assets. The Fund may utilize derivatives including options; futures contracts; options on futures contracts; interest-rate caps, collars and floors; interest-rate, total return, and credit default swap agreements; and options on the foregoing type of swap agreements.
Significant Accounting Policies
The Fund is an investment company and follows accounting and reporting guidance under Financial Accounting Standards Board (FASB) Accounting Standards Codification (ASC) Topic 946 “Financial Services – Investment Companies.” The following is a summary of significant accounting policies followed by the Fund in the preparation of its financial statements in accordance with U.S. generally accepted accounting principles (“U.S. GAAP”).
Investment Transactions
Investment transactions are recorded on a trade date basis. Realized gains and losses from investment transactions are determined on the specific identification method, which is the same basis used for federal income tax purposes. Investments purchased on a when-issued/delayed delivery basis may have extended settlement periods. Any investments so purchased are subject to market fluctuation during this period. The Fund has earmarked securities in its portfolio with a current value at least equal to the amount of the when-issued/delayed delivery purchase commitments.
As of the end of the reporting period, the Fund’s outstanding when-issued/delayed delivery purchase commitments were as follows:
Outstanding when-issued/delayed delivery purchase commitments | $12,619,813 |
Investment Income
Dividend income is recorded on the ex-dividend date or, for foreign securities, when information is available. Interest income, which reflects the amortization of premiums and includes accretion of discounts for financial reporting purposes, is recorded on an accrual basis. Interest income also reflects paydown gains and losses, if any.
| 32 | Nuveen Investments |
Professional Fees
Professional fees presented on the Statement of Operations consist of legal fees incurred in the normal course of operations, audit fees, tax consulting fees and, in some cases, workout expenditures. Workout expenditures are incurred in an attempt to protect or enhance an investment or to pursue other claims or legal actions on behalf of Fund shareholders. If a refund is received for workout expenditures paid in a prior reporting period, such amounts will be recognized as “Legal fee refund” on the Statement of Operations.
Dividends and Distributions to Shareholders
Dividends from net investment income are declared monthly. Net realized capital gains from investment transactions, if any, are distributed to shareholders at least annually. Furthermore, capital gains are distributed only to the extent they exceed available capital loss carryforwards.
Distributions to shareholders are recorded on the ex-dividend date. The amount and timing of distributions are determined in accordance with federal income tax regulations, which may differ from U.S. GAAP.
Indemnifications
Under the Fund’s organizational documents, its officers and trustees are indemnified against certain liabilities arising out of the performance of their duties to the Fund. In addition, in the normal course of business, the Fund enters into contracts that provide general indemnifications to other parties. The Fund’s maximum exposure under these arrangements is unknown as this would involve future claims that may be made against the Fund that have not yet occurred. However, the Fund has not had prior claims or losses pursuant to these contracts and expects the risk of loss to be remote.
Netting Agreements
In the ordinary course of business, the Fund may enter into transactions subject to enforceable master repurchase agreements, International Swaps and Derivative Association, Inc. (“ISDA”) master agreements or other similar arrangements (“netting agreements”). Generally, the right to offset in netting agreements allows the Fund to offset certain securities and derivatives with a specific counterparty as well as any collateral received or delivered to that counterparty based on the terms of the agreements. Generally, the Fund manages its cash collateral and securities collateral on a counterparty basis.
The Fund’s investments subject to netting agreements as of the end of the reporting period, if any, are further described in Note 3 - Portfolio Securities and Investments in Derivatives.
Use of Estimates
The preparation of financial statements in conformity with U.S. GAAP requires management to make estimates and assumptions that affect the reported amounts of assets and liabilities at the date of the financial statements and the reported amounts of increases and decreases in net assets from operations during the reporting period. Actual results may differ from those estimates.
2. Investment Valuation and Fair Value Measurements
The fair valuation input levels as described below are for fair value measurement purposes.
Fair value is defined as the price that would be received upon selling an investment or transferring a liability in an orderly transaction to an independent buyer in the principal or most advantageous market for the investment. A three-tier hierarchy is used to maximize the use of observable market data and minimize the use of unobservable inputs and to establish classification of fair value measurements for disclosure purposes. Observable inputs reflect the assumptions market participants would use in pricing the asset or liability. Observable inputs are based on market data obtained from sources independent of the reporting entity. Unobservable inputs reflect the reporting entity’s own assumptions about the assumptions market participants would use in pricing the asset or liability. Unobservable inputs are based on the best information available in the circumstances. The following is a summary of the three-tiered hierarchy of valuation input levels.
| Level 1 – | Inputs are unadjusted and prices are determined using quoted prices in active markets for identical securities. | |
| Level 2 – | Prices are determined using other significant observable inputs (including quoted prices for similar securities, interest rates, prepayment speeds, credit risk, etc.). | |
| Level 3 – | Prices are determined using significant unobservable inputs (including management’s assumptions in determining the fair value of investments). |
Common stocks and other equity-type securities are valued at the last sales price on the securities exchange on which such securities are primarily traded and are generally classified as level 1. Securities primarily traded on the NASDAQ National Market (“NASDAQ”) are valued at the NASDAQ Official Closing price and are generally classified as Level 1. However, securities traded on a securities exchange or NASDAQ for which there were no transactions on a given day or securities not listed on a securities exchange or NASDAQ are valued at the quoted bid price and are generally classified as Level 2.
Prices of fixed-income securities are provided by a pricing service approved by the Board. The pricing service establishes a security’s fair value using methods that may include consideration of the following: yields or prices of investments of comparable quality, type of issue, coupon, maturity and rating, market
| Nuveen Investments | 33 |
Notes to Financial Statements (continued)
quotes or indications of value from security dealers, evaluations of anticipated cash flows or collateral, general market conditions and other information and analysis, including the obligor’s credit characteristics considered relevant. These securities are generally classified as Level 2. In pricing certain securities, particularly less liquid and lower quality securities, the pricing service may consider information about a security, its issuer or market activity, provided by the Adviser. These securities are generally classified as Level 2 or Level 3 depending on the priority of the significant inputs.
Investments in investment companies are valued at their respective net asset value (“NAV”) on valuation date and are generally classified as Level 1.
Futures contracts are valued using the closing settlement price or, in the absence of such a price, the last traded price, and are generally classified as Level 1.
Repurchase agreements are valued at contract amount plus accrued interest, which approximates market value. These securities are generally classified as Level 2.
Certain securities may not be able to be priced by the pre-established pricing methods as described above. Such securities may be valued by the Board and/or its appointee at fair value. These securities generally include, but are not limited to, restricted securities (securities which may not be publicly sold without registration under the Securities Act of 1933, as amended) for which a pricing service is unable to provide a market price; securities whose trading has been formally suspended; debt securities that have gone into default and for which there is no current market quotation; a security whose market price is not available from a pre-established pricing source; a security with respect to which an event has occurred that is likely to materially affect the value of the security after the market has closed but before the calculation of the Fund’s NAV (as may be the case in non-U.S. markets on which the security is primarily traded) or make it difficult or impossible to obtain a reliable market quotation; and a security whose price, as provided by the pricing service, is not deemed to reflect the security’s fair value. As a general principle, the fair value of a security would appear to be the amount that the owner might reasonably expect to receive for it in a current sale. A variety of factors may be considered in determining the fair value of such securities, which may include consideration of the following: yields or prices of investments of comparable quality, type of issue, coupon, maturity and rating, market quotes or indications of value from security dealers, evaluations of anticipated cash flows or collateral, general market conditions and other information and analysis, including the obligor’s credit characteristics considered relevant. These securities are generally classified as Level 2 or Level 3 depending on the priority of the significant inputs. Regardless of the method employed to value a particular security, all valuations are subject to review by the Board and/or its appointee.
The inputs or methodologies used for valuing securities are not an indication of the risks associated with investing in those securities. The following is a summary of the Fund’s fair value measurements as of the end of the reporting period:
| Level 1 | Level 2 | Level 3 | Total | |||||||||||||
Long-Term Investments*: | ||||||||||||||||
Convertible Preferred Securities | $ | 577,850 | $ | — | $ | — | $ | 577,850 | ||||||||
$25 Par (or similar) Retail Preferred | 411,315 | — | — | 411,315 | ||||||||||||
Corporate Bonds**** | — | 25,341,050 | — | *** | 25,341,050 | |||||||||||
$1,000 Par (or similar) Institutional Preferred | — | 338,125 | — | 338,125 | ||||||||||||
Asset-Backed and Mortgage-Backed Securities | — | 82,555,588 | — | 82,555,588 | ||||||||||||
Investment Companies | 485,100 | — | — | 485,100 | ||||||||||||
Sovereign Debt | — | 157,591 | — | 157,591 | ||||||||||||
Short-Term Investments: | ||||||||||||||||
Repurchase Agreements | — | 2,267,486 | — | 2,267,486 | ||||||||||||
Investments in Derivatives: | ||||||||||||||||
Futures Contracts** | 91,687 | — | — | 91,687 | ||||||||||||
Total | $ | 1,565,952 | $ | 110,659,840 | $ | — | *** | $ | 112,225,792 | |||||||
| * | Refer to the Fund’s Portfolio of Investments for industry and country classifications, where applicable. |
| ** | Represents net unrealized appreciation (depreciation) as reported in the Fund’s Portfolio of Investments. |
| *** | Value equals zero as of the end of the reporting period. |
| **** | Refer to Fund’s Portfolio of Investments for breakdown of these securities classified as Level 3. |
The Board is responsible for the valuation process and has appointed the oversight of the daily valuation process to the Adviser’s Valuation Committee. The Valuation Committee, pursuant to the valuation policies and procedures adopted by the Board, is responsible for making fair value determinations, evaluating the effectiveness of the Fund’s pricing policies and reporting to the Board. The Valuation Committee is aided in its efforts by the Adviser’s dedicated Securities Valuation Team, which is responsible for administering the daily valuation process and applying fair value methodologies as approved by the Valuation Committee. When determining the reliability of independent pricing services for investments owned by the Fund, the Valuation Committee, among other things, conducts due diligence reviews of the pricing services and monitors the quality of security prices received through various testing reports conducted by the Securities Valuation Team.
| 34 | Nuveen Investments |
The Valuation Committee will consider pricing methodologies it deems relevant and appropriate when making a fair value determination, based on the facts and circumstances specific to the portfolio instrument. Fair value determinations generally will be derived as follows, using public or private market information:
| (i) | If available, fair value determinations shall be derived by extrapolating from recent transactions or quoted prices for identical or comparable securities. |
| (ii) | If such information is not available, an analytical valuation methodology may be used based on other available information including, but not limited to: analyst appraisals, research reports, corporate action information, issuer financial statements and shelf registration statements. Such analytical valuation methodologies may include, but are not limited to: multiple of earnings, discount from market value of a similar freely-traded security, discounted cash flow analysis, book value or a multiple thereof, risk premium/yield analysis, yield to maturity and/or fundamental investment analysis. |
The purchase price of a portfolio instrument will be used to fair value the instrument only if no other valuation methodology is available or deemed appropriate, and it is determined that the purchase price fairly reflects the instrument’s current value.
For each portfolio security that has been fair valued pursuant to the policies adopted by the Board, the fair value price is compared against the last available and next available market quotations. The Valuation Committee reviews the results of such testing and fair valuation occurrences are reported to the Board.
3. Portfolio Securities and Investments in Derivatives
Portfolio Securities
Dollar Roll Transactions
The Fund is authorized to enter into dollar roll transactions (“dollar rolls”) in which the Fund purchases or sells mortgage-backed securities (“MBS”) for delivery in the future and simultaneously contracts to sell or repurchase a substantially similar (same type, coupon, and maturity) MBS on a different specified future date. Dollar rolls are identified in the Portfolio of Investments as “MDR”, when applicable. During the roll period, the Fund foregoes principal and interest paid on the MBS. The Fund is compensated by the difference between the current sales price and the lower forward price for the future purchase. Such compensation is recognized as a component of “Net realized gain (loss) from investments” on the Statement of Operations. Dollar rolls are valued daily.
Dollar rolls involve the risk that the market value of the MBS the Fund is obligated to repurchase under an agreement may decline below the repurchase price. These transactions also involve some risk to the Fund if the other party should default on its obligation and the Fund is delayed or prevented from completing the transaction. In the event that the buyer of securities under a dollar roll files for bankruptcy or becomes insolvent, the Fund’s use of proceeds of the dollar roll may be restricted pending a determination by the other party, or its trustee or receiver, whether to enforce the Fund’s obligation to repurchase the securities.
Repurchase Agreements
In connection with transactions in repurchase agreements, it is the Fund’s policy that its custodian take possession of the underlying collateral securities, the fair value of which exceeds the principal amount of the repurchase transaction, including accrued interest, at all times. If the counterparty defaults, and the fair value of the collateral declines, realization of the collateral may be delayed or limited.
The following table presents the repurchase agreements for the Fund that are subject to netting agreements as of the end of the reporting period, and the collateral delivered related to those repurchase agreements.
| Counterparty | Short-Term Investments, at Value | Collateral Pledged (From) Counterparty* | Net Exposure | |||||||||
State Street Bank | $ | 2,267,486 | $ | (2,267,486 | ) | $ | — | |||||
| * | As of the end of the reporting period, the value of the collateral pledged from the counterparty exceeded the value of the repurchase agreements. Refer to the Fund’s Portfolio of Investments for details on the repurchase agreements. |
Reverse Repurchase Agreements
In a reverse repurchase agreement, the Fund sells to the counterparty a security that it holds with a contemporaneous agreement to repurchase the same security at an agreed-upon price and date, with the Fund retaining the risk of loss that is associated with that security. The Fund will segregate assets determined to be liquid by the Adviser to cover its obligations under reverse repurchase agreements. Securities sold under reverse repurchase agreements are recorded and recognized as “Reverse repurchase agreements” on the Statement of Assets and Liabilities.
| Nuveen Investments | 35 |
Notes to Financial Statements (continued)
Interest payments made on reverse repurchase agreements are recognized as a component of “Interest expense” on the Statement of Operations. In periods of increased demand for the security, the Fund received a fee for use of the security by the counterparty, which may result in interest income to the Fund.
As of the end of the reporting period, the Fund’s outstanding balances on its reverse repurchase agreements were as follows:
| Counterparty | Coupon | Principal Amount | Maturity | Value | Value and Accrued Interest | �� | ||||||||||||||
Goldman Sachs | 0.42 | % | $ | (20,631,000 | ) | 7/22/15 | $ | (20,631,000 | ) | $ | (20,640,628 | ) | ||||||||
During the current fiscal period, the average daily balance outstanding and weighted average interest rate on the Fund’s reverse repurchase agreements were as follows:
Average daily balance outstanding | $22,451,000 | |||
Weighted average interest rate | 0.41 | % |
The following table presents the reverse repurchase agreements subject to netting agreements and the collateral delivered related to those reverse repurchase agreements.
| Counterparty | Reverse Repurchase* Agreements | Collateral Pledged to Counterparty | Net Exposure | |||||||||
Goldman Sachs | $ | (20,640,628 | ) | $ | 19,608,597 | $ | (1,032,031 | ) | ||||
| * | Represents gross value and accrued interest for the counterparty as reported in the preceding table |
Zero Coupon Securities
A zero coupon security does not pay a regular interest coupon to its holders during the life of the security. Income to the holder of the security comes from accretion of the difference between the original purchase price of the security at issuance and the par value of the security at maturity and is effectively paid at maturity. The market prices of zero coupon securities generally are more volatile than the market prices of securities that pay interest periodically.
Investment in Derivatives
The Fund is authorized to invest in certain derivative instruments, such as futures, options and swap contracts. The Fund limits its investments in futures, options on futures and swap contracts to the extent necessary for the Adviser to claim the exclusion from registration by the Commodity Futures Trading Commission as a commodity pool operator with respect to the Fund. The Fund records derivative instruments at fair value, with changes in fair value recognized on the Statement of Operations, when applicable. Even though the Fund’s investments in derivatives may represent economic hedges, they are not considered to be hedge transactions for financial reporting purposes.
Futures Contracts
Upon execution of a futures contract, the Fund is obligated to deposit cash or eligible securities, also known as “initial margin,” into an account at its clearing broker equal to a specified percentage of the contract amount. Cash held by the broker to cover initial margin requirements on open futures contracts, if any, is recognized as “Cash collateral at brokers” on the Statement of Assets and Liabilities. Investments in futures contracts obligate the Fund and the clearing broker to settle monies on a daily basis representing changes in the prior days “mark-to-market” of the open contracts. If the Fund has unrealized appreciation the clearing broker would credit the Fund’s account with an amount equal to appreciation and conversely if the Fund has unrealized depreciation the clearing broker would debit the Fund’s account with an amount equal to depreciation. These daily cash settlements are also known as “variation margin.” Variation margin is recognized as a receivable and/or payable for “Variation margin on futures contracts” on the Statement of Assets and Liabilities.
During the period the futures contract is open, changes in the value of the contract are recognized as an unrealized gain or loss by “marking-to-market” on a daily basis to reflect the changes in market value of the contract, which is recognized as a component of “Change in net unrealized appreciation (depreciation) of futures contracts” on the Statement of Operations. When the contract is closed or expired, the Fund records a realized gain or loss equal to the difference between the value of the contract on the closing date and value of the contract when originally entered into, which is recognized as a component of “Net realized gain (loss) from futures contracts” on the Statement of Operations.
Risks of investments in futures contracts include the possible adverse movement in the price of the securities or indices underlying the contracts, the possibility that there may not be a liquid secondary market for the contracts and/or that a change in the value of the contract may not correlate with a change in the value of the underlying securities or indices.
| 36 | Nuveen Investments |
During the current fiscal period, the Fund used U.S. Treasury futures as part of an overall portfolio construction strategy to manage portfolio duration and yield curve exposure.
The average notional amount of futures contracts outstanding during the current fiscal period was as follows:
Average notional amount of futures contracts outstanding* | $26,185,885 |
| * | The average notional amount is calculated based on the absolute aggregate national amount of contracts outstanding at the beginning of the fiscal period and at the end of each quarter within the current fiscal period. |
The following table presents the fair value of all futures contracts held by the Fund as of the end of the reporting period, the location of these instruments on the Statement of Assets and Liabilities and the primary underlying risk exposure.
Location on the Statement of Assets and Liabilities | ||||||||||||||||
|
|
| Asset Derivatives | (Liability) Derivatives | |||||||||||||
Underlying Risk Exposure | Derivative Instrument | Location | Value | Location | Value | |||||||||||
| Interest rate | Futures contracts | Receivable for variation margin on futures contracts* | $ | 91,687 | — | $ | — | |||||||||
| * | Value represents unrealized appreciation (depreciation) of futures contracts as reported in the Fund’s Portfolio of Investments and not the asset and/or liability derivatives location as described in the table above. |
The following table presents the amount of net realized gain (loss) and change in net unrealized appreciation (depreciation) recognized on futures contracts on the Statement of Operations during the current fiscal period, and the primary underlying risk exposure.
| Risk Underlying Exposure | Derivative Instrument | Net Realized Gain (Loss) from Futures Contracts | Change in Net Unrealized Appreciation (Depreciation) of Futures Contracts | |||||||
Interest rate | Futures contracts | $ | (738,305 | ) | $ | 42,825 | ||||
Market and Counterparty Credit Risk
In the normal course of business the Fund may invest in financial instruments and enter into financial transactions where risk of potential loss exists due to changes in the market (market risk) or failure of the other party to the transaction to perform (counterparty credit risk). The potential loss could exceed the value of the financial assets recorded on the financial statements. Financial assets, which potentially expose the Fund to counterparty credit risk, consist principally of cash due from counterparties on forward, option and swap transactions, when applicable. The extent of the Fund’s exposure to counterparty credit risk in respect to these financial assets approximates their carrying value as recorded on the Statement of Assets and Liabilities.
The Fund helps manage counterparty credit risk by entering into agreements only with counterparties the Adviser believes have the financial resources to honor their obligations and by having the Adviser monitor the financial stability of the counterparties. Additionally, counterparties may be required to pledge collateral daily (based on the daily valuation of the financial asset) on behalf of the Fund with a value approximately equal to the amount of any unrealized gain above a pre-determined threshold. Reciprocally, when the Fund has an unrealized loss, the Fund has instructed the custodian to pledge assets of the Fund as collateral with a value approximately equal to the amount of the unrealized loss above a pre-determined threshold. Collateral pledges are monitored and subsequently adjusted if and when the valuations fluctuate, either up or down, by at least the pre-determined threshold amount.
4. Fund Shares
Share Repurchase Program
On September 28, 2014, the Fund’s Board of Trustees ( the “Board”) authorized the Fund to participate in Nuveen’s closed-end fund complex-wide share repurchase program. Under the share repurchase program, the Fund may repurchase up to 10% of its outstanding shares as of the authorization date (approximately 945,000 shares) in open-market transactions at the Adviser’s discretion.
Share Transactions
The Fund did not have any transactions in shares during the current or prior fiscal periods.
5. Investment Transactions
Long-term purchases and sales (including maturities and dollar roll transactions, but excluding derivative transactions) during the current fiscal period, aggregated $160,385,290 and $163,729,402, respectively.
| Nuveen Investments | 37 |
Notes to Financial Statements (continued)
6. Income Tax Information
The Fund intends to distribute substantially all of its net investment company taxable income to shareholders and to otherwise comply with the requirements of Subchapter M of the Internal Revenue Code applicable to regulated investment companies. Therefore, no federal income tax provision is required.
For all open tax years and all major taxing jurisdictions, management of the Fund has concluded that there are no significant uncertain tax positions that would require recognition in the financial statements. Open tax years are those that are open for examination by taxing authorities (i.e., generally the last four tax year ends and the interim tax period since then). Furthermore, management of the Fund is also not aware of any tax positions for which it is reasonably possible that the total amounts of unrecognized tax benefits will significantly change in the next twelve months.
The following information is presented on an income tax basis. Differences between amounts for financial statement and federal income tax purposes are primarily due to timing differences in recognizing certain gains and losses on investment transactions. To the extent that differences arise that are permanent in nature, such amounts are reclassified within the capital accounts as detailed below. Temporary differences do not require reclassification. Temporary and permanent differences do not impact the NAV of the Fund.
As of June 30, 2015, the cost and unrealized appreciation (depreciation) of investments (excluding investments in derivatives), as determined on a federal income tax basis, were as follows:
Cost of investments | $113,486,664 | |||
Gross unrealized: | ||||
Appreciation | $ | 3,304,183 | ||
Depreciation | (4,656,742 | ) | ||
Net unrealized appreciation (depreciation) of investments | $ | (1,352,559 | ) |
Permanent differences, primarily due to paydowns and distribution reallocations, resulted in reclassifications among the Fund’s components of net assets as of June 30, 2015, the Fund’s tax year end, as follows:
Paid-in surplus | $ | (2 | ) | |
Undistributed (Over-distribution of) net investment income | 1,333 | |||
Accumulated net realized gain (loss) | (1,331 | ) | ||
| The tax components of undistributed net ordinary income and net long-term capital gains as of June 30, 2015, the Fund’s tax year end, were as follows: | ||||
Undistributed net ordinary income1 | $ | 299,864 | ||
Undistributed net long-term capital gains | — | |||
1 Net ordinary income consists of net taxable income derived from dividends and interest, and net short-term capital gains, if any. |
| |||
| The tax character of distributions paid during the Fund’s tax year ended June 30, 2015, ten month period ended June 30, 2014 and year ended August 31, 2013, was designated for purposes of the dividends paid deduction as follows: | ||||
| Year ended June 30, 2015 | ||||
Distributions from net ordinary income1 | $ | 4,162,893 | ||
Distributions from net long-term capital gains2 | 1,333 | |||
Return of capital | — | |||
| Ten months ended June 30, 2014 | ||||
Distributions from net ordinary income1 | $ | 3,861,373 | ||
Distributions from net long-term capital gains | — | |||
Return of capital | — | |||
| Year ended August 31, 2013 | ||||
Distributions from net ordinary income1 | $ | 5,207,765 | ||
Distributions from net long-term capital gains | — | |||
Return of capital | 134,748 | |||
| 1 | Net ordinary income consists of net taxable income derived from dividends and interest, and net short-term capital gains, if any. |
| 2 | The Fund designates as long-term capital gain dividend, pursuant to the Internal Revenue Code Section 852 (b)(3), the amount necessary to reduce earnings and profits of the Fund related to net capital gain to zero for the tax year ended June 30, 2015. |
| 38 | Nuveen Investments |
As of June 30, 2015, the Fund’s tax year end, the Fund had unused capital loss carryforwards available for federal income tax purposes to be applied against future capital gains, if any. The capital losses are not subject to expiration.
Capital loss carryforwards – not subject to expiration | $1,526,404 |
7. Management Fees and Other Transactions with Affiliates
Investment Advisory Fees
Prior to the Transition, pursuant to an investment advisory agreement (the “Agreement”), USBAM, a subsidiary of U.S. Bank National Association (“U.S. Bank”), managed the Fund’s assets and furnished related office facilities, equipment, research, and personnel. The Agreement provided USBAM with a monthly investment advisory fee in an amount equal to an annualized rate of 0.65% of the Fund’s average weekly net assets. For its fee, USBAM provided investment advice and, in general, conducted the management and investment activities of the Fund. NFAL and NAM each served as an investment sub-advisor to the Fund pursuant to separate investment sub-advisory agreements with USBAM.
Effective September 8, 2014, NFAL became the Fund’s investment advisor pursuant to a new investment advisory agreement (the “New Agreement”) Under the New Agreement, the Fund’s management fee consists of two components – a fund-level fee, based only on the amount of assets within the Fund, and a complex-level fee, based on the aggregate amount of all eligible fund assets managed by NFAL. This pricing structure enables Fund shareholders to benefit from growth in the assets within the Fund as well as from growth in the amount of complex-wide assets managed by NFAL. The management fee compensates NFAL for the overall investment advisory and administrative services and general office facilities it provides for the Fund.
Also effective September 8, 2014, NFAL entered into a new sub-advisory agreement with NAM, and NAM will be compensated for its services to the Fund from the management fees paid to NFAL.
The annual Fund-level fee, payable monthly, is calculated according to the following schedule:
| Average Daily Managed Assets* | Fund-Level Fee | |||
For the first $125 million | 0.7000 | % | ||
For the next $125 million | 0.6875 | |||
For the next $250 million | 0.6750 | |||
For the next $500 million | 0.6625 | |||
For managed assets over $1 billion | 0.6500 | |||
The annual complex-level fee, payable monthly, is calculated according to the following schedule:
| Complex-Level Managed Asset Breakpoint Level* | Effective Rate at Breakpoint Level | |||
$55 billion | 0.2000 | % | ||
$56 billion | 0.1996 | |||
$57 billion | 0.1989 | |||
$60 billion | 0.1961 | |||
$63 billion | 0.1931 | |||
$66 billion | 0.1900 | |||
$71 billion | 0.1851 | |||
$76 billion | 0.1806 | |||
$80 billion | 0.1773 | |||
$91 billion | 0.1691 | |||
$125 billion | 0.1599 | |||
$200 billion | 0.1505 | |||
$250 billion | 0.1469 | |||
$300 billion | 0.1445 | |||
| * | For the fund-level and complex-level fees, managed assets include closed-end fund assets managed by the Adviser that are attributable to certain types of leverage. For these purposes, leverage includes the funds’ use of preferred stock and borrowings and certain investments in the residual interest certificates (also called inverse floating rate securities) in tender option bond (TOB) trusts, including the portion of assets held by a TOB trust that has been effectively financed by the trust’s issuance of floating rate securities, subject to an agreement by the Adviser as to certain funds to limit the amount of such assets for determining managed assets in certain circumstances. The complex-level fee is calculated based upon the aggregate daily managed assets of all Nuveen funds that constitute “eligible assets.” Eligible assets do not include assets attributable to investments in other Nuveen funds and assets in excess of $2 billion added to the Nuveen fund complex in connection with the Adviser’s assumption of the management of the former First American Funds effective January 1, 2011. As of June 30, 2015, the complex-level fee rate for the Fund was 0.1643%. |
NFAL has agreed to waive fees and/or reimburse expenses of the Fund through September 8, 2016, so that total annual operating expenses, after fee waivers and/or expense reimbursements and excluding any costs of leverage, do not exceed 1.15% of the Fund’s average net assets.
| Nuveen Investments | 39 |
Notes to Financial Statements (continued)
Prior to the Transition, if the Fund invested in money market funds advised by USBAM, in order to avoid the payment of duplicative investment advisory fees to USBAM, which also acted as the investment advisor to the Fund, USBAM reimbursed the Fund an amount equal to that portion of USBAM’s investment advisory fee received from the related money market funds that was attributable to the assets of the Fund. These reimbursements, if any, are recognized as a component of “Fee waivers/expense reimbursements” on the Statement of Operations and terminated with respect to the Fund on September 8, 2014, in connection with the Transition.
Prior to the Transition, independent directors of the Fund may have participated and elected to defer receipt of part or all of their annual compensation under a deferred compensation plan (the “Plan”). Deferred amounts were treated as though equivalent dollar amounts had been invested in shares of selected funds managed by USBAM as designated by each director. All amounts in the Plan were 100% vested and accounts under the Plan were obligations of the Fund. Deferred amounts remain in the Fund until distributed in accordance with the Plan.
Effective September 8, 2014, independent trustees of the Fund may elect to defer receipt of all as though or a portion of the annual compensation they are entitled to receive from certain funds advised by NFAL. Under the plan, deferred amounts are treated equal dollar amounts had been invested in shares of select funds advised by NFAL.
Administration Fees
Prior to the Transition, USBAM served as the Fund’s administrator pursuant to an administration agreement between USBAM and the Fund. Under this administration agreement, USBAM received a monthly administration fee equal to an annualized rate of 0.10% of the Fund’s average weekly net assets. For its fee, USBAM provided numerous services to the Fund including, but not limited to, handling the general business affairs, financial and regulatory reporting, and various other services.
Pursuant to a sub-administration agreement between USBAM and NFAL, USBAM also paid NFAL an annual fee, calculated weekly and paid monthly, equal to 0.05% of the average weekly net assets of the Fund for certain administrative and other services that NFAL provided to the Fund.
Effective September 8, 2014, USBAM and NFAL no longer serve as the Fund’s administrator and sub-administrator, respectively.
Custodian Fees
Prior to the Transition, U.S. Bank served as the Fund’s custodian pursuant to a custodian agreement with the Fund. The custodian fee charged to the Fund was equal to an annual rate of 0.005% of average weekly net assets. These fees were computed weekly and paid monthly.
Under this agreement, interest earned on uninvested cash balances was used to reduce a portion of the Fund’s custodian expenses. These credits, if any, were disclosed as “ Custodian fee credit” on the Statement of Operations. Conversely, the custodian charged a fee for any cash overdrafts incurred, which would increase the Fund’s custodian expenses. Effective September 8, 2014, U.S. Bank no longer serves as the Fund’s custodian.
8. New Accounting Pronouncement
Financial Accounting Standards Board (“FASB”) Transfers and Servicing (Topic 860): Repurchase-to-Maturity Transactions, Repurchase Financings, and Disclosures
In June 2014, the FASB issued Accounting Standards Update (“ASU”) 2014-11, Transfers and Servicing (Topic 860): Repurchase-to-Maturity Transactions, Repurchase Financings, and Disclosures” (“ASU 2014-11”), that expanded secured borrowing accounting for certain reverse repurchase agreements. ASU 2014-11 also sets forth additional disclosure requirements for certain transactions accounted for as sales in order to provide financial statement users with information to compare to similar transactions accounted for as secured borrowings. ASU 2014-11 is effective prospectively for annual periods beginning after December 15, 2014, and interim periods beginning after March 15, 2015. Management is currently evaluating the impact, if any, of ASU 2014-11 on the Fund’s financial statement disclosures.
| 40 | Nuveen Investments |
Fund Information (Unaudited)
| Board of Trustees | ||||||||||
| William Adams IV* | Jack B. Evans | William C. Hunter | David J. Kundert | John K. Nelson | William J. Schneider | |||||
| Thomas S. Schreier, Jr.* | Judith M. Stockdale | Carole E. Stone | Virginia L. Stringer | Terence J. Toth |
| * | Interested Board Member. |
Fund Manager Nuveen Fund Advisors, LLC 333 West Wacker Drive Chicago, IL 60606 | Custodian State Street Bank Boston, MA 02111 | Legal Counsel Chapman and Cutler LLP Chicago, IL 60603 | Independent Registered KPMG LLP Chicago, IL 60601 | Transfer Agent and State Street Bank Nuveen Funds P.O. Box 43071 Providence, Rl 02940-3071 (800) 257-8787 | ||||
Quarterly Form N-Q Portfolio of Investments Information
The Fund is required to file its complete schedule of portfolio holdings with the Securities and Exchange Commission (SEC) for the first and third quarters of each fiscal year on Form N-Q. You may obtain this information directly from the SEC. Visit the SEC on-line at http://www.sec.gov or in person at the SEC’s Public Reference Room in Washington, D.C. Call the SEC toll-free at (800) SEC-0330 for room hours and operation.
Nuveen Funds’ Proxy Voting Information
You may obtain (i) information regarding how each fund voted proxies relating to portfolio securities held during the most recent twelve-month period ended June 30, without charge, upon request, by calling Nuveen Investments toll-free at (800) 257-8787 or on Nuveen’s website at www.nuveen.com and (ii) a description of the policies and procedures that each fund used to determine how to vote proxies relating to portfolio securities without charge, upon request, by calling Nuveen Investments toll free at (800) 257-8787. You may also obtain this information directly from the SEC. Visit the SEC on-line at http://www.sec.gov.
CEO Certification Disclosure
The Fund’s Chief Executive Officer (CEO) has submitted to the New York Stock Exchange (NYSE) the annual CEO certification as required by Section 303A.12(a) of the NYSE Listed Company Manual. The Fund has filed with the SEC the certification of its CEO and Chief Financial Officer required by Section 302 of the Sarbanes-Oxley Act.
Share Repurchases
The Fund intends to repurchase, through its open-market share repurchase program, shares of its own common stock at such times and in such amounts as is deemed advisable. During the period covered by this report, the Fund repurchased shares of its common stock, as shown in the accompanying table. Any future repurchases will be reported to shareholders in the next annual or semi-annual report.
| JMM | ||||
Shares repurchased | — | |||
FINRA BrokerCheck
The Financial Industry Regulatory Authority (FINRA) provides information regarding the disciplinary history of FINRA member firms and associated investment professionals. This information as well as an investor brochure describing FlNRA BrokerCheck is available to the public by calling the FINRA BrokerCheck Hotline number at (800) 289-9999 or by visiting www.FINRA.org.
| Nuveen Investments | 41 |
Used in this Report
| n | Average Annual Total Return: This is a commonly used method to express an investment’s performance over a particular, usually multi-year time period. It expresses the return that would have been necessary each year to equal the investment’s actual cumulative performance (including change in NAV or market price and reinvested dividends and capital gains distributions, if any) over the time period being considered. |
| n | Beta: A measure of the variability of the change in the share price for a fund in relation to a change in the value of the fund’s market benchmark. Securities with betas higher than 1.0 have been, and are expected to be, more volatile than the benchmark; securities with betas lower than 1.0 have been, and are expected to be, less volatile than the benchmark. |
| n | Duration: Duration is a measure of the expected period over which a bond’s principal and interest will be paid, and consequently is a measure of the sensitivity of a bond’s or bond fund’s value to changes when market interest rates change. Generally, the longer a bond’s or fund’s duration, the more the price of the bond or fund will change as interest rates change. |
| n | Effective Leverage: Effective leverage is a fund’s effective economic leverage, and includes both regulatory leverage (see below) and the leverage effects of certain derivative investments in the fund’s portfolio. |
| n | JMM Blended Benchmark: A two index blend comprised of weightings approximating the Fund’s proposed portfolio: 25% Barclays U.S. Corporate High-Yield Index and 75% Barclays U.S. Government/Mortgage Index. 1) Barclays U.S. Corporate High-Yield Index: An unmanaged index that covers the universe of domestic fixed-rate non-investment grade debt; and 2) Barclays U.S. Government/Mortgage Index: An unmanaged index considered representative of U.S. government treasury securities and agency mortgage-back securities. Benchmark returns assume reinvestment of distributions, but do not reflect any applicable sales charges or management fees. |
| n | Leverage: Leverage is created whenever a fund has investment exposure (both reward and/or risk) equivalent to more than 100% of the investment capital. |
| n | Net Asset Value (NAV) Per Share: A fund’s Net Assets is equal to its total assets (securities, cash, accrued earnings and receivables) less its total liabilities. NAV per share is equal to the fund’s Net Assets divided by its number of shares outstanding. |
| n | Regulatory Leverage: Regulatory leverage consists of preferred shares issued by or borrowings of the fund. Both of these are part of the fund’s capital structure. Regulatory leverage is subject to asset coverage limits set in the Investment Company Act of 1940. |
| 42 | Nuveen Investments |
Easily and Conveniently
Nuveen makes reinvesting easy. A phone call is all it takes to set up your reinvestment account.
Nuveen Closed-End Funds Automatic Reinvestment Plan
Your Nuveen Closed-End Fund allows you to conveniently reinvest distributions in additional Fund shares.
By choosing to reinvest, you’ll be able to invest money regularly and automatically, and watch your investment grow through the power of compounding. Just like distributions in cash, there may be times when income or capital gains taxes may be payable on distributions that are reinvested.
It is important to note that an automatic reinvestment plan does not ensure a profit, nor does it protect you against loss in a declining market.
Easy and convenient
To make recordkeeping easy and convenient, each quarter you’ll receive a statement showing your total distributions, the date of investment, the shares acquired and the price per share, and the total number of shares you own.
How shares are purchased
The shares you acquire by reinvesting will either be purchased on the open market or newly issued by the Fund. If the shares are trading at or above net asset value at the time of valuation, the Fund will issue new shares at the greater of the net asset value or 95% of the then-current market price. If the shares are trading at less than net asset value, shares for your account will be purchased on the open market. If the Plan Agent begins purchasing Fund shares on the open market while shares are trading below net asset value, but the Fund’s shares subsequently trade at or above their net asset value before the Plan Agent is able to complete its purchases, the Plan Agent may cease open-market purchases and may invest the uninvested portion of the distribution in newly-issued Fund shares at a price equal to the greater of the shares’ net asset value or 95% of the shares’ market value on the last business day immediately prior to the purchase date. Distributions received to purchase shares in the open market will normally be invested shortly after the distribution payment date. No interest will be paid on distributions awaiting reinvestment. Because the market price of the shares may increase before purchases are completed, the average purchase price per share may exceed the market price at the time of valuation, resulting in the acquisition of fewer shares than if the distribution had been paid in shares issued by the Fund. A pro rata portion of any applicable brokerage commissions on open market purchases will be paid by Plan participants. These commissions usually will be lower than those charged on individual transactions.
Flexible
You may change your distribution option or withdraw from the Plan at any time, should your needs or situation change.
You can reinvest whether your shares are registered in your name, or in the name of a brokerage firm, bank, or other nominee. Ask your investment advisor if his or her firm will participate on your behalf. Participants whose shares are registered in the name of one firm may not be able to transfer the shares to another firm and continue to participate in the Plan.
The Fund reserves the right to amend or terminate the Plan at any time. Although the Fund reserves the right to amend the Plan to include a service charge payable by the participants, there is no direct service charge to participants in the Plan at this time.
Call today to start reinvesting distributions
For more information on the Nuveen Automatic Reinvestment Plan or to enroll in or withdraw from the Plan, speak with your financial advisor or call us at (800) 257-8787.
| Nuveen Investments | 43 |
Members & Officers
The management of the Funds, including general supervision of the duties performed for the Funds by the Adviser, is the responsibility of the Board of Trustees of the Funds. The number of trustees of the Funds is currently set at eleven. None of the trustees who are not “interested” persons of the Funds (referred to herein as “independent trustees”) has ever been a director or employee of, or consultant to, Nuveen or its affiliates. The names and business addresses of the trustees and officers of the Funds, their principal occupations and other affiliations during the past five years, the number of portfolios each oversees and other directorships they hold are set forth below.
Name, Year of Birth & Address | Position(s) Held with the Funds | Year First Elected or Appointed and Term(1) | Principal Occupation(s) Including other Directorships During Past 5 Years | Number of Portfolios in Fund Complex Overseen by Board Member | ||||
| Independent Board Members: | ||||||||
n WILLIAM J. SCHNEIDER | Chairman of Miller-Valentine Partners, a real estate investment company; formerly, Senior Partner and Chief Operating Officer (retired (2004) of Miller-Valentine Group; an owner in several other Miller Valentine entities; Board Member of Med-America Health System, and WDPR Public Radio station; formerly, member, Business Advisory Council, Cleveland Federal Reserve Bank and University of Dayton Business School Advisory Council. | |||||||
1944 333 W. Wacker Drive Chicago, IL 60606 | Chairman and Board Member | 1996 Class III | 194 | |||||
| ||||||||
| ||||||||
n JACK B. EVANS | President, The Hall-Perrine Foundation, a private philanthropic corporation (since 1996); Director and Chairman, United Fire Group, a publicly held company; formerly, President Pro-Tem of the Board of Regents for the State of Iowa University System; Director, Source Media Group; Life Trustee of Coe College; formerly, Director, Alliant Energy; formerly, Director, Federal Reserve Bank of Chicago; formerly, President and Chief Operating Officer, SCI Financial Group, Inc., a regional financial services firm. | |||||||
1948 333 W. Wacker Drive Chicago, IL 60606 | Board Member | 1999 Class III | 194 | |||||
| ||||||||
| ||||||||
n WILLIAM C. HUNTER | Dean Emeritus, formerly, Dean, Tippie College of Business, University of Iowa (2006-2012); Director (since 2004) of Xerox Corporation; Director (since 2005), and President (since July 2012) Beta Gamma Sigma, Inc., The International Business Honor Society; Director of Wellmark, Inc. (since 2009); formerly, Dean and Distinguished Professor of Finance, School of Business at the University of Connecticut (2003-2006); previously, Senior Vice President and Director of Research at the Federal Reserve Bank of Chicago (1995-2003); formerly, Director (1997-2007), Credit Research Center at Georgetown University. | |||||||
1948 333 W. Wacker Drive Chicago, IL 60606 | Board Member | 2004 Class I | 194 | |||||
| ||||||||
| ||||||||
n DAVID J. KUNDERT | Formerly, Director, Northwestern Mutual Wealth Management Company (2006-2013), retired (since 2004) as Chairman, JPMorgan Fleming Asset Management, President and CEO, Banc One Investment Advisors Corporation, and President, One Group Mutual Funds; prior thereto, Executive Vice President, Banc One Corporation and Chairman and CEO, Banc One Investment Management Group; Regent Emeritus, Member of Investment Committee, Luther College; member of the Wisconsin Bar Association; member of Board of Directors and Chair of Investment Committee, Greater Milwaukee Foundation; member of the Board of Directors (Milwaukee), College Possible. | |||||||
1942 333 W. Wacker Drive Chicago, IL 60606 | Board Member | 2005 Class II | 194 | |||||
| ||||||||
| ||||||||
| 44 | Nuveen Investments |
Name, Year of Birth & Address | Position(s) Held with the Funds | Year First Elected or Appointed and Term(1) | Principal Occupation(s) Including other Directorships During Past 5 Years | Number of Portfolios in Fund Complex Overseen by Board Member | ||||
| Independent Board Members (continued): | ||||||||
n JOHN K. NELSON | Member of Board of Directors of Core12 LLC (since 2008), a private firm which develops branding, marketing and communications strategies for clients; Director of The Curran Center for Catholic American Studies (since 2009) and The President’s Council, Fordham University (since 2010); formerly, senior external advisor to the financial services practice of Deloitte Consulting LLP (2012-2014); formerly, Chairman of the Board of Trustees of Marian University (2010 as trustee, 2011-2014 as Chairman); formerly, Chief Executive Officer of ABN AMRO N.V. North America, and Global Head of its Financial Markets Division (2007-2008); prior senior positions held at ABN AMRO include Corporate Executive Vice President and Head of Global Markets-the Americas (2006-2007), CEO of Wholesale Banking North America and Global Head of Foreign Exchange and Futures Markets (2001-2006), and Regional Commercial Treasurer and Senior Vice President Trading-North America (1996-2001); formerly, Trustee at St. Edmund Preparatory School in New York City. | |||||||
1962 333 W. Wacker Drive Chicago, IL 60606 | Board Member | 2013 Class II | 194 | |||||
| ||||||||
| ||||||||
| ||||||||
| ||||||||
| ||||||||
n JUDITH M. STOCKDALE | Board Member, Land Trust Alliance (since 2013) and U.S. Endowment for Forestry and Communities (since 2013); formerly, Executive Director (1994-2012), Gaylord and Dorothy Donnelley Foundation; prior thereto, Executive Director, Great Lakes Protection Fund (1990-1994). | |||||||
1947 333 W. Wacker Drive Chicago, IL 60606 | Board Member | 1997 Class I | 194 | |||||
n CAROLE E. STONE | Director, Chicago Board Options Exchange, Inc. (since 2006); Director, C2 Options Exchange, Incorporated (since 2009); Director, CBOE Holdings, Inc. (since 2010); formerly, Commissioner, New York State Commission on Public Authority Reform (2005-2010). | |||||||
1947 333 W. Wacker Drive Chicago, IL 60606 | Board Member | 2007 Class I | 194 | |||||
n VIRGINIA L. STRINGER | Board Member, Mutual Fund Directors Forum; non-profit board member; former governance consultant; former owner, and President Strategic Management Resources, Inc., a management consulting firm; former Member, Governing Board, Investment Company Institute’s Independent Directors Council; previously, held several executive positions in general management, marketing and human resources at IBM and The Pillsbury Company; Independent Director, First American Fund Complex (1987-2010) and Chair (1997-2010). | |||||||
1944 333 W. Wacker Drive Chicago, IL 60606 | Board Member | 2011 Class I | 194 | |||||
| ||||||||
| ||||||||
| ||||||||
n TERENCE J. TOTH | Managing Partner, Promus Capital (since 2008); Director, Fulcrum IT Service LLC (since 2010), Quality Control Corporation (since 2012) and LogicMark LLC (since 2012); formerly, Director, Legal & General Investment Management America, Inc. (2008-2013); formerly, CEO and President, Northern Trust Global Investments (2004-2007); Executive Vice President, Quantitative Management & Securities Lending (2000-2004); prior thereto, various positions with Northern Trust Company (since 1994); member: Chicago Fellowship Board (since 2005), Catalyst Schools of Chicago Board (since 2008) and Mather Foundation Board (since 2012), and a member of its investment committee; formerly, Member, Northern Trust Mutual Funds Board (2005-2007), Northern Trust Global Investments Board (2004-2007), Northern Trust Japan Board (2004-2007), Northern Trust Securities Inc. Board (2003-2007) and Northern Trust Hong Kong Board (1997-2004). | |||||||
1959 333 W. Wacker Drive Chicago, IL 60606 | Board Member | 2008 Class II | 194 | |||||
| ||||||||
| ||||||||
| ||||||||
| ||||||||
| ||||||||
| ||||||||
| Nuveen Investments | 45 |
Board Members & Officers (continued)
Name, Year of Birth & Address | Position(s) Held with the Funds | Year First Elected or Appointed(1) | Principal Occupation(s) Including other Directorships During Past 5 Years | Number of Portfolios | ||||
| Interested Board Members: | ||||||||
n WILLIAM ADAMS IV(2) | Senior Executive Vice President, Global Structured Products (since 2010); formerly, Executive Vice President, U.S. Structured Products, of Nuveen Investments, Inc. (1999-2010); Co-President of Nuveen Fund Advisors, LLC (since 2011); Executive Vice President of Nuveen Securities, LLC; President (since 2011), formerly, Managing Director (2010-2011) of Nuveen Commodities Asset Management, LLC; Board Member of the Chicago Symphony Orchestra and of Gilda’s Club Chicago. | |||||||
1955 333 W. Wacker Drive Chicago, IL 60606 | Board Member | 2013 Class II | 194 | |||||
| ||||||||
| ||||||||
n THOMAS S. SCHREIER, JR.(2) | Vice Chairman, Wealth Management of Nuveen Investments, Inc. (since 2011); Co-President of Nuveen Fund Advisors, LLC; Chairman of Nuveen Asset Management, LLC (since 2011); Co-Chief Executive Officer of Nuveen Securities, LLC (since 2011); Member of Board of Governors and Chairman’s Council of the Investment Company Institute; Director of Allina Health and a member of its Finance, Audit and Investment Committees: formerly, Chief Executive Officer (2000-2010) and Chief Investment Officer (2007-2010) of FAF Advisors, Inc.; formerly, President of First American Funds (2001-2010).
| |||||||
1962 333 W. Wacker Drive Chicago, IL 60606 | Board Member | 2013 Class III | 194 | |||||
| ||||||||
| ||||||||
| ||||||||
Name, Year of Birth & Address | Position(s) Held with the Funds | Year First Elected or Appointed(3) | Principal Occupation(s) During Past 5 Years | Number of Portfolios | ||||
| Officers of the Funds: | ||||||||
n GIFFORD R. ZIMMERMAN | Managing Director (since 2002), and Assistant Secretary of Nuveen Securities, LLC; Managing Director (since 2004) and Assistant Secretary (since 1994) of Nuveen Investments, Inc.; Managing Director (since 2002), Assistant Secretary (since 1997) and Co-General Counsel (since 2011) of Nuveen Fund Advisors, LLC; Managing Director, Assistant Secretary and Associate General Counsel of Nuveen Asset Management, LLC (since 2011); Managing Director and Assistant Secretary of Symphony Asset Management LLC (since 2003); Vice President and Assistant Secretary of NWQ Investment Management Company, LLC (since 2002), Nuveen Investments Advisers Inc. (since 2002), Santa Barbara Asset Management, LLC (since 2006), and of Winslow Capital Management, LLC, (since 2010); Vice President and Assistant Secretary (since 2013), formerly, Chief Administrative Officer and Chief Compliance Officer (2006-2013) of Nuveen Commodities Asset Management, LLC; Chartered Financial Analyst. | |||||||
1956 333 W. Wacker Drive Chicago, IL 60606 | Chief Administrative Officer | 1988 | 195 | |||||
| ||||||||
| ||||||||
| ||||||||
| ||||||||
| ||||||||
| ||||||||
| ||||||||
n CEDRIC H. ANTOSIEWICZ | Managing Director of Nuveen Securities, LLC. (since 2004); Managing Director of Nuveen Fund Advisors, LLC (since 2014). | |||||||
1962 333 W. Wacker Drive Chicago, IL 60606 | Vice President | 2007 | 88 | |||||
n MARGO L. COOK | Senior Executive Vice President of Nuveen Investments, Inc.; Executive Vice President, Investment Services of Nuveen Fund Advisors, LLC (since 2011); Managing Director-Investment Services of Nuveen Commodities Asset Management, LLC (since 2011); Co-Chief Executive Officer (since 2015) previously, Executive Vice President (2013-2015) of Nuveen Securities, LLC; Chartered Financial Analyst. | |||||||
1964 333 W. Wacker Drive Chicago, IL 60606 | Vice President | 2009 | 195 | |||||
| ||||||||
| 46 | Nuveen Investments |
Name, Year of Birth & Address | Position(s) Held with the Funds | Year First Elected or Appointed(3) | Principal Occupation(s) During Past 5 Years | Number of Portfolios in Fund Complex Overseen by Officer | ||||
| Officers of the Funds (continued): | ||||||||
n LORNA C. FERGUSON | Managing Director (since 2004) of Nuveen Investments Holdings, Inc. | |||||||
1945 333 W. Wacker Drive Chicago, IL 60606 | Vice President | 1998 | 195 | |||||
n STEPHEN D. FOY | Managing Director (since 2014), formerly, Senior Vice President (2013-2014) and Vice President (2005-2013) of Nuveen Fund Advisors, LLC; Chief Financial Officer of Nuveen Commodities Asset Management, LLC (since 2010); Certified Public Accountant. | |||||||
1954 333 W. Wacker Drive Chicago, IL 60606 | Vice President and Controller | 1998 | 195 | |||||
n SHERRI A. HLAVACEK | Managing Director and Controller of Nuveen Fund Advisors, LLC and Nuveen Commodities Asset Management, LLC; Managing Director, Treasurer and Controller of Nuveen Asset Management, LLC; Managing Director, Treasurer and Corporate Controller of Nuveen Investments, Inc., Nuveen Investments Advisers Inc. and Nuveen Investments Holdings, Inc.; Managing Director, Chief Financial Officer and Corporate Controller of Nuveen Securities, LLC; Vice President, Controller and Treasurer of NWQ Investment Management Company, LLC, Santa Barbara Asset Management, LLC , Tradewinds Global Investors, LLC, Symphony Asset Management LLC and Winslow Capital Management, LLC; Certified Public Accountant. | |||||||
1962 333 W. Wacker Drive Chicago, IL 60606 | Vice President and Treasurer | 2015 | 195 | |||||
| ||||||||
| ||||||||
| ||||||||
| ||||||||
n WALTER M. KELLY | Senior Vice President (since 2008) of Nuveen Investment Holdings, Inc. | |||||||
1970 333 W. Wacker Drive Chicago, IL 60606 | Chief Compliance Officer and Vice President | 2003 | 195 | |||||
n TINA M. LAZAR | Senior Vice President of Nuveen Investments Holdings, Inc. and Nuveen Securities, LLC. | |||||||
1961 333 W. Wacker Drive Chicago, IL 60606 | Vice President | 2002 | 195 | |||||
n KEVIN J. MCCARTHY | Managing Director and Assistant Secretary (since 2008), Nuveen Securities, LLC; Managing Director (since 2008), Assistant Secretary since 2007) and Co-General Counsel (since 2011) of Nuveen Fund Advisors, LLC; Managing Director, Assistant Secretary and Associate General Counsel (since 2011) of Nuveen Asset Management, LLC; Managing Director and Assistant Secretary, Nuveen Investments, Inc.; Vice President (since 2007) and Assistant Secretary of Nuveen Investments Advisers Inc., NWQ Investment Management Company, LLC, Symphony Asset Management LLC, Santa Barbara Asset Management, LLC, and of Winslow Capital Management, LLC. (since 2010); Vice President and Secretary (since 2010) of Nuveen Commodities Asset Management, LLC. | |||||||
1966 333 W. Wacker Drive Chicago, IL 60606 | Vice President and Secretary | 2007 | 195 | |||||
| ||||||||
| ||||||||
| ||||||||
n KATHLEEN L. PRUDHOMME | Managing Director, Assistant Secretary and Co-General Counsel (since 2011) of Nuveen Fund Advisors, LLC; Managing Director, Assistant Secretary and Associate General Counsel (since 2011) of Nuveen Asset Management, LLC; Managing Director and Assistant Secretary (since 2011) of Nuveen Securities, LLC; formerly, Deputy General Counsel, FAF Advisors, Inc. (2004-2010). | |||||||
1953 901 Marquette Avenue Minneapolis, MN 55402 | Vice President and Assistant Secretary | 2011 | 195 | |||||
| ||||||||
| Nuveen Investments | 47 |
Board Members & Officers (continued)
Name, Year of Birth & Address | Position(s) Held with the Funds | Year First Elected or Appointed(3) | Principal Occupation(s) During Past 5 Years | Number of Portfolios in Fund Complex Overseen by Officer | ||||
| Officers of the Funds (continued): | ||||||||
n JOEL T. SLAGER | Fund Tax Director for Nuveen Funds (since 2013); previously, Vice President of Morgan Stanley Investment Management, Inc., Assistant Treasurer of the Morgan Stanley Funds (from 2010 to 2013). | |||||||
1978 333 W. Wacker Drive Chicago, IL 60606 | Vice President and Assistant Secretary | 2013 | 195 | |||||
| (1) | The Board of Trustees is divided into three classes, Class I, Class II, and Class III, with each being elected to serve until the third succeeding annual shareholders’ meeting subsequent to its election or thereafter in each case when its respective successors are duly elected or appointed, except two board members are elected by the holders of Preferred Shares to serve until the next annual shareholders’ meeting subsequent to its election or thereafter in each case when its respective successors are duly elected or appointed. The year first elected or appointed represents the year in which the board member was first elected or appointed to any fund in the Nuveen Complex. |
| (2) | “Interested person” as defined in the 1940 Act, by reason of his position with Nuveen Investments, Inc. and certain of its subsidiaries, which are affiliates of the Nuveen Funds. |
| (3) | Officers serve one year terms through August of each year. The year first elected or appointed represents the year in which the Officer was first elected or appointed to any fund in the Nuveen Complex. |
| 48 | Nuveen Investments |
Management Agreement Approval Process (Unaudited)
The Board of Trustees of the Fund (the “Board,” and each Trustee, a “Board Member”), including the Board Members who are not parties to the Fund’s advisory or sub-advisory agreements or “interested persons” of any such parties (the “Independent Board Members”), is responsible for overseeing the performance of the investment adviser and sub-adviser to the Fund and determining whether to continue the Fund’s advisory agreement (the “Investment Management Agreement”) between the Fund and Nuveen Fund Advisors, LLC (the “Adviser”) and the sub-advisory agreement (the “Sub-Advisory Agreement” and, together with the Investment Management Agreement, the “Advisory Agreements”) between the Adviser and Nuveen Asset Management, LLC (the “Sub-Adviser”). Following an initial term with respect to the Fund upon its commencement of operations, the Board is required to consider the continuation of the Advisory Agreements on an annual basis pursuant to the requirements of the Investment Company Act of 1940, as amended (the “1940 Act”). Accordingly, at an in-person meeting held on May 11-13, 2015 (the “May Meeting”), the Board, including a majority of the Independent Board Members, considered and approved the existing Advisory Agreements for the Fund.
In preparation for its considerations at the May Meeting, the Board received in advance of the meeting extensive materials prepared in connection with the review of the Advisory Agreements. The materials provided a broad range of information regarding the Fund, including, among other things, the nature, extent and quality of services provided by the Adviser and the Sub-Adviser (the Adviser and Sub-Adviser are collectively, the “Fund Advisers” and each, a “Fund Adviser”); Fund performance including performance assessments against peers and the appropriate benchmark(s); fee and expense information of the Fund compared to peers; a description and assessment of shareholder service levels for the Fund; a summary of the performance of certain service providers; a review of product initiatives and shareholder communications; and profitability information of the Fund Advisers as described in further detail below. As part of its annual review, the Board also held a separate meeting on April 14-15, 2015 to review the Fund’s investment performance and consider an analysis by the Adviser of the Sub-Adviser which generally evaluated the Sub-Adviser’s investment team, investment mandate, organizational structure and history, investment philosophy and process, and the performance of the Fund, and any significant changes to the foregoing. During the review, the Independent Board Members asked questions of and requested additional information from management.
The Board considered that the evaluation process with respect to the Fund Advisers is an ongoing process that encompassed the information and knowledge gained throughout the year. The Board, acting directly or through its committees, met regularly during the course of the year and received information and considered factors at each meeting that would be relevant to its annual consideration of the Advisory Agreements, including information relating to Fund performance; Fund expenses; investment team evaluations; and valuation, compliance, regulatory and risk matters. In addition to regular reports, the Adviser provided special reports to the Board to enhance the Board’s understanding on topics that impact some or all of the Nuveen funds and the Adviser (such as presentations on risk and stress testing; the new governance, risk and compliance system; cybersecurity developments; Nuveen fund accounting and reporting matters; regulatory developments impacting the investment company industry and the business plans or other matters impacting the Adviser). The Board also met with key investment personnel managing certain Nuveen fund portfolios during the year.
The Board had created several standing committees including the Open-End Funds Committee and the Closed-End Funds Committee to assist the full Board in monitoring and gaining a deeper insight into the distinctive business practices of closed-end and open-end funds. These Committees met prior to each quarterly Board meeting, and the Adviser provided presentations to these Committees permitting them to delve further into specific matters or initiatives impacting the respective product line.
The Board also continued its program of seeking to have the Board Members or a subset thereof visit each sub-adviser to the Nuveen funds at least once over a multiple year rotation, meeting with key investment and business personnel. In this regard, the Independent Board Members made site visits to multiple equity and fixed-income investment teams of the Sub-Adviser in June 2014.
The Board considered the information provided and knowledge gained at these meetings and visits during the year when performing its annual review of the Advisory Agreements. The Independent Board Members also were assisted throughout the
| Nuveen Investments | 49 |
Annual Investment Management Agreement Approval Process (Unaudited) (continued)
process by independent legal counsel. During the course of the year and during their deliberations regarding the review of advisory contracts, the Independent Board Members met with independent legal counsel in executive sessions without management present. The Independent Board Members also received a memorandum from independent legal counsel outlining the legal standards for their consideration of the proposed continuation of the Advisory Agreements. In addition, it is important to recognize that the management arrangements for the Nuveen funds are the result of many years of review and discussion between the Independent Board Members and Fund management and that the Board Members’ conclusions may be based, in part, on their consideration of fee arrangements and other factors developed in previous years.
The Board took into account all factors it believed relevant with respect to the Fund, including, among other things: (a) the nature, extent and quality of the services provided by the Fund Advisers; (b) the investment performance of the Fund and Fund Advisers; (c) the advisory fees and costs of the services to be provided to the Fund and the profitability of the Fund Advisers; (d) the extent of any economies of scale; (e) any benefits derived by the Fund Advisers from the relationship with the Fund; and (f) other factors. Each Board Member may have accorded different weight to the various factors in reaching his or her conclusions with respect to the Advisory Agreements of the Fund. The Independent Board Members did not identify any single factor as all-important or controlling. The Independent Board Members’ considerations were instead based on a comprehensive consideration of all the information presented. The principal factors considered by the Board and its conclusions are described below.
| A. | Nature, Extent and Quality of Services |
In evaluating the renewal of the Advisory Agreements, the Independent Board Members received and considered information regarding the nature, extent and quality of the applicable Fund Adviser’s services provided to the Fund. The Board reviewed information regarding, among other things, each Fund Adviser’s organization and business, the types of services that each Fund Adviser or its affiliates provided to the Fund, the performance record of the Fund (as described in further detail below), and any initiatives that had been undertaken on behalf of the closed-end product line. The Board recognized the high quality of services the Adviser had provided to the Fund over the years and the conscientiousness with which the Adviser provided these services. The Board also considered the improved capital structure of Nuveen Investments, Inc. (“Nuveen”) (the parent of the Adviser) following the acquisition of Nuveen by TIAA-CREF in 2014 (the “TIAA-CREF Transaction”).
With respect to the services, the Board noted the Fund was a registered investment company that operated in a regulated industry and considered the myriad of investment management, administrative, compliance, oversight and other services the Adviser provided to manage and operate the Fund. Such services included, among other things: (a) product management (such as analyzing ways to better position a Nuveen fund in the marketplace, setting dividends; maintaining relationships to gain access to distribution platforms; and providing shareholder communications); (b) fund administration (such as preparing tax returns and other tax compliance services, preparing regulatory filings and shareholder reports; managing fund budgets and expenses; overseeing a fund’s various service providers and supporting and analyzing new and existing funds); (c) Board administration (such as supporting the Board and its committees, in relevant part, by organizing and administering the Board and committee meetings and preparing the necessary reports to assist the Board in its duties); (d) compliance (such as monitoring adherence to a fund’s investment policies and procedures and applicable law; reviewing the compliance program periodically and developing new policies or updating existing compliance policies and procedures as considered necessary or appropriate; responding to regulatory requests; and overseeing compliance testing of the funds’ sub-advisers); (e) legal support (such as preparing or reviewing fund registration statements, proxy statements and other necessary materials; interpreting regulatory requirements and compliance thereof; and maintaining applicable registrations); and (f) investment services (such as overseeing and reviewing the funds’ sub-advisers and their investment teams; analyzing performance of the funds; overseeing investment and risk management; evaluating brokerage transactions and securities lending, overseeing the daily valuation process for portfolio securities and developing and recommending valuation policies and methodologies and changes thereto; reporting to the Board on various matters including performance, risk and valuation; and participating in fund development, leverage management, and the developing or interpreting of investment policies and parameters). With respect to closed-end funds, the Adviser also monitored asset coverage levels on leveraged funds, managed leverage, negotiated the terms of leverage, evaluated alternative forms and types of leverage, promoted an orderly secondary market for common shares and maintained an asset maintenance system for compliance with certain rating agency criteria.
In its review, the Board considered information highlighting the various initiatives that the Adviser had implemented or continued during the last year to enhance its services to the Nuveen funds. The Board recognized that some of these
| 50 | Nuveen Investments |
initiatives are a result of a multi-year process. In reviewing the activities of 2014, the Board recognized the Adviser’s continued focus on fund rationalization for closed-end funds through mergers, fund closures or repositioning the funds in seeking to enhance shareholder value, reduce costs, improve performance, eliminate fund overlap and better meet shareholder needs. The Board noted the Adviser’s investment in additional staffing to strengthen and improve its services to the Nuveen funds, including with respect to risk management and valuation. The Board recognized that expanding the depth and range of its risk oversight activities had been a major priority for the Adviser in recent years, and the Adviser continued to add to the risk management team, develop additional risk management programs and create committees or other teams designated to oversee or evaluate certain risks, such as liquidity risk, enterprise risk, investment risk and cybersecurity risk. The Adviser had also continued to add to the valuation team, launched its centralized securities valuation system which is intended to provide for uniform pricing and reporting across the complex as the system continues to develop, continued to refine its valuation analysis and updated related policies and procedures and evaluated and assessed pricing services. The Board considered the Adviser’s ongoing investment in information technology and operations and the various projects of the information technology team to support the continued growth and complexity of the Nuveen funds and increase efficiencies in their operations. The Board also recognized the Adviser’s strong commitment to compliance and reviewed information reflecting the compliance group’s ongoing activities to enhance its compliance system and refine its compliance procedures as well as the Chief Compliance Officer’s report regarding the compliance team, the initiatives the team had undertaken in 2014 and proposed for 2015, the compliance functions and reporting process, the record of compliance with the policies and procedures and its supervision activities of other service providers.
With respect to the closed-end funds, the Board recognized the extensive resources, expertise and efforts required to oversee and manage the various forms of leverage utilized by various funds, including the development of new forms of leverage to achieve cost savings and/or broaden the array of leverage structures available to the closed-end funds, the development of enhanced reports analyzing the impact of leverage on performance, and the development of new forms of tender option bond structures to address new regulatory requirements. The Board also noted the Adviser’s continued capital management services conducting share repurchases and/or share issuances throughout the year and monitoring market conditions to capitalize on opportunities for the closed-end funds. The Board further recognized the Adviser’s use of data systems to more effectively solicit shareholder participation when seeking shareholder approvals and to monitor flow trends in various closed-end funds. The Board considered Nuveen’s continued commitment to supporting the closed-end fund product line by providing an extensive investor relations program that encompassed, among other things, maintaining and enhancing the closed-end fund website; participating in conferences and education seminars; enhancing the ability for investors to access information; preparing educational materials; and implementing campaigns to educate financial advisers and investors on topics related to closed-end funds and their strategies.
As noted, the Adviser also oversees the Sub-Adviser who primarily provides the portfolio advisory services to the Fund. The Board recognized the skill and competency of the Adviser in monitoring and analyzing the performance of the Sub-Adviser and managing the sub-advisory relationship. In considering the Sub-Advisory Agreement and supplementing its prior knowledge, the Board considered a current report provided by the Adviser analyzing, among other things, the Sub-Adviser’s investment team and changes thereto, investment approach, organization and history, and assets under management, and the investment performance of the Fund.
Based on their review, the Independent Board Members found that, overall, the nature, extent and quality of services provided to the Fund under each respective Advisory Agreement were satisfactory.
| B. | The Investment Performance of the Fund and Fund Advisers |
The Board, including the Independent Board Members, considered the performance history of the Fund over various time periods. The Board reviewed reports, including an analysis of the Fund’s performance and the investment team. The Board reviewed, among other things, the Fund’s investment performance both on an absolute basis and in comparison to peer funds (the “Performance Peer Group”) and to recognized and/or customized benchmarks (i.e., generally benchmarks derived from multiple recognized benchmarks) for the quarter, one-, three- and five-year periods ending December 31, 2014, as well as performance information reflecting the first quarter of 2015. With respect to closed-end funds, the Independent Board Members also recognized the importance of the secondary market trading levels for the closed-end fund shares and therefore devoted significant time and focus evaluating the premium and discount levels of the closed-end funds at each of the
| Nuveen Investments | 51 |
Annual Investment Management Agreement Approval Process (Unaudited) (continued)
quarterly meetings throughout the year. At these prior meetings as well as the May Meeting, the Board reviewed, among other things, the respective closed-end fund’s premium or discount to net asset value as of a specified date and over various periods as well as in comparison to the premium/discount average in its Lipper peer category. At the May Meeting and/or prior meetings, the Board also reviewed information regarding the key economic, market and competitive trends affecting the closed-end fund market and considered any actions periodically proposed by the Adviser to address the trading discounts of certain funds. The Independent Board Members considered the evaluation of the premium and discount levels of the closed-end funds (either at the Board level or through the Closed-End Funds Committee) to be a continuing priority in their oversight of the closed-end funds. In its review, the Board noted that it also reviewed Fund performance results at each of its quarterly meetings.
In evaluating performance, the Board recognized several factors that may impact the performance data as well as the consideration given to particular performance data.
| • | The performance data reflected a snapshot in time, in this case as of the end of the most recent calendar year or quarter. A different performance period, however, could generate significantly different results. |
| • | Long-term performance can be adversely affected by even one period of significant underperformance so that a single investment decision or theme had the ability to disproportionately affect long-term performance. |
| • | The investment experience of a particular shareholder in a fund would vary depending on when such shareholder invested in the fund, the class held (if multiple classes are offered in the fund) and the performance of the fund (or respective class) during that shareholder’s investment period. |
| • | The Board recognized that the funds in the Performance Peer Group may differ somewhat from the Nuveen fund with which it is being compared and due to these differences, performance comparisons between certain of the Nuveen funds and their Performance Peer Groups may be inexact and the relevancy limited. The Board considered that management had classified the Performance Peer Group as low, medium and high in relevancy. The Board took the analysis of the relevancy of the Performance Peer Group into account when considering the comparative performance data. The Board also considered comparative performance of an applicable benchmark. While the Board was cognizant of the relative performance of the Fund’s peer set and/or benchmark(s), the Board evaluated Fund performance in light of the Fund’s investment objectives, investment parameters and guidelines and considered that the variations between the objectives and investment parameters or guidelines of the Fund with its peers and/or benchmarks result in differences in performance results. Further, for funds that utilized leverage, the Board understood that leverage during different periods could provide both benefits and risks to a portfolio as compared to an unlevered benchmark. |
With respect to any Nuveen funds for which the Board has identified performance concerns, the Board monitors such funds closely until performance improves, discusses with the Adviser the reasons for such results, considers those steps necessary or appropriate to address such issues, and reviews the results of any efforts undertaken. The Board is aware, however, that shareholders chose to invest or remain invested in a fund knowing that the Adviser manages the fund and knowing the fund’s fee structure.
In considering the performance data, the Independent Board Members noted that the Fund ranked in its Performance Peer Group in the third quartile in the one-, three- and five-year periods and outperformed its benchmark in each of such periods.
Based on their review, the Independent Board Members determined that the Fund’s investment performance had been satisfactory.
| C. | Fees, Expenses and Profitability |
| 1. | Fees and Expenses |
The Board evaluated the management fees and other fees and expenses of the Fund (expressed as a percentage of average net assets) in absolute terms and in comparison to the fee and expense levels of a comparable universe of funds (the “Peer Universe”) selected by an independent third-party fund data provider. The Independent Board Members reviewed the methodology regarding the construction of the Peer Universe for the Fund. The Board reviewed, among other things, the Fund’s gross management fees, net management fees and net expense ratios in absolute terms as well as compared to the
| 52 | Nuveen Investments |
average and median fee and expense levels of the Peer Universe. The Board noted that the net total expense ratio paid by investors in the Fund was the most representative of an investor’s net experience. The Board Members also considered any fee waivers and/or expense reimbursement arrangements currently in effect for the Fund.
In reviewing the comparative fee and expense information, the Independent Board Members recognized that various factors such as the limited size and particular composition of the Peer Universe (including the inclusion of other Nuveen funds in the peer set); expense anomalies; changes in the funds comprising the Peer Universe from year to year; levels of reimbursement or fee waivers; the timing of information used; the differences in the type and use of leverage (with respect to closed-end funds); and differences in services provided can impact the comparative data limiting the usefulness of the data to help make a conclusive assessment of the Fund’s fees and expenses.
In reviewing the fee schedule for a fund, the Independent Board Members also considered the fund-level and complex-wide breakpoint schedules (described in further detail below) and any fee waivers and reimbursements provided by Nuveen. In reviewing fees and expenses (excluding leverage costs and leveraged assets for the closed-end funds), the Board considered the expenses and fees to be higher if they were over 10 basis points higher, slightly higher if they were approximately 6 to 10 basis points higher, in line if they were within approximately 5 basis points higher than the peer average and below if they were below the peer average of the Peer Universe. In reviewing the reports, the Board noted that the majority of the Nuveen funds had a net expense ratio near or below their peer average.
The Independent Board Members noted that the Fund had a net management fee and net expense ratio below the peer average.
Based on their review of the fee and expense information provided, the Independent Board Members determined that the Fund’s management fees (as applicable) to a Fund Adviser were reasonable in light of the nature, extent and quality of services provided to the Fund.
| 2. | Comparisons with the Fees of Other Clients |
The Board considered information regarding the fees a Fund Adviser assessed to the Nuveen funds compared to that of other clients as described in further detail below. With respect to non-municipal funds, such other clients of the Adviser and/or its affiliated sub-advisers may include: separately managed accounts (such as retail, institutional or wrap accounts), hedge funds, other investment companies that are not offered by Nuveen but are sub-advised by one of Nuveen’s affiliated sub-advisers, foreign investment companies offered by Nuveen, and collective investment trusts.
The Board recognized that the Fund had an affiliated sub-adviser and therefore the overall Fund management fee can be divided into two components, the fee retained by the Adviser and the fee paid to the Sub-Adviser. In reviewing the nature of the services provided by the Adviser, including through its affiliated sub-advisers, the Board considered the range of advisory fee rates for retail and institutional managed accounts advised by Nuveen-affiliated sub-advisers. The Board also reviewed, among other things, the average fee the affiliated sub-advisers assessed such clients as well as the range of fee rates assessed to the different types of clients (such as retail, institutional and wrap accounts as well as non-Nuveen funds) applicable to such sub-advisers.
In reviewing the comparative information, the Board also reviewed information regarding the differences between the Fund and the other clients, including differences in services provided, investment policies, investor profiles, compliance and regulatory requirements and account sizes. The Board recognized the breadth of services necessary to operate a registered investment company (as described above) and that, in general terms, the Adviser provided the administrative and other support services to the Fund and, although the Sub-Adviser may provide some of these services, the Sub-Adviser essentially provided the portfolio management services. In general, the Board noted that higher fee levels reflected higher levels of service provided by the Fund Adviser, increased investment management complexity, greater product management requirements and higher levels of business risk or some combination of the foregoing. The Independent Board Members considered the differences in structure and operations of separately managed accounts and hedge funds from registered funds and noted that the range of day-to-day services was not generally of the breadth required for the registered funds. Many of the additional administrative services provided by the Adviser were not required for institutional clients or funds sub-advised by a Nuveen-affiliated sub-adviser that were offered by other fund groups. The Independent Board Members also recognized that the management fee rates of the foreign funds advised by the Adviser may vary due to, among other things,
| Nuveen Investments | 53 |
Annual Investment Management Agreement Approval Process (Unaudited) (continued)
differences in the client base, governing bodies, operational complexities and services covered by the management fee. Given the inherent differences in the various products, particularly the extensive services provided to the Fund, the Independent Board Members believed such facts justify the different levels of fees.
| 3. | Profitability of Fund Advisers |
In conjunction with their review of fees, the Independent Board Members also considered the profitability of Nuveen for its advisory activities and its financial condition. The Independent Board Members reviewed, among other things, the adjusted operating margins for Nuveen for the last two calendar years, the revenues, expenses, net income (pre-tax and after-tax) and net revenue margins (pre-tax and after-tax) of Nuveen’s managed fund advisory activities for the last two calendar years, the allocation methodology used by Nuveen in preparing the profitability data and a history of the adjustments to the methodology due to changes in the business over time. The Independent Board Members also reviewed the revenues, expenses, net income (pre-tax and after-tax) and revenue margin (pre-tax and post-tax) of the Adviser and, as described in further detail below, each affiliated sub-adviser for the 2014 calendar year. In reviewing the profitability data, the Independent Board Members noted the subjective nature of cost allocation methodologies used to determine profitability as other reasonable methods could also have been employed but yield different results. The Independent Board Members reviewed an analysis of the key drivers behind the changes in revenues and expenses that impacted profitability in 2014. The Independent Board Members recognized that Nuveen’s net revenue margin from advisory activities for 2014 was consistent with 2013. The Independent Board Members also considered the profitability of Nuveen in comparison to the adjusted operating margins of other investment advisers with publicly available data and with comparable assets under management (based on asset size and asset composition) to Nuveen. The Independent Board Members noted that Nuveen’s adjusted operating margins appeared to be reasonable in relation to such other advisers. The Independent Board Members, however, recognized the difficulty of making comparisons of profitability from fund investment advisory contracts as the information is not generally publicly available, the information for the investment advisers that was publicly available may not be representative of the industry and various other factors would impact the profitability data such as differences in services offered, business mix, expense methodology and allocations, capital structure and costs, complex size, and types of funds and other accounts managed.
The Independent Board Members noted this information supplemented the profitability information requested and received during the year and noted that two Independent Board Members served as point persons to review the profitability analysis and methodologies employed, and any changes thereto, and to keep the Board apprised of such changes during the year.
The Independent Board Members determined that Nuveen appeared to be sufficiently profitable to operate as a viable investment management firm and to honor its obligations as a sponsor of the Nuveen funds. The Independent Board Members noted the Adviser’s continued expenditures to upgrade its investment technology and increase personnel and recognized the Adviser’s continued commitment to its business to enhance the Adviser’s capacity and capabilities in providing the services necessary to meet the needs of the Nuveen funds as they grow or change over time. The Independent Board Members also noted that the sub-advisory fees for the Nuveen funds are paid by the Adviser, however, the Board recognized that many of the sub-advisers, including the Sub-Adviser, are affiliated with Nuveen. The Independent Board Members also noted the increased resources and support available to Nuveen as well as an improved capital structure as a result of the TIAA-CREF Transaction.
With respect to the Sub-Adviser, the Independent Board Members reviewed the Sub-Adviser’s revenues, expenses and revenue margins (pre- and post-tax) for its advisory activities for the calendar year ended December 31, 2014. The Independent Board Members also reviewed profitability analysis reflecting the revenues, expenses and the revenue margin (pre- and post-tax) by asset type for the Sub-Adviser for the calendar year ended December 31, 2014.
In evaluating the reasonableness of the compensation, the Independent Board Members also considered other amounts paid to a Fund Adviser by the Fund as well as indirect benefits (such as soft dollar arrangements), if any, the Fund Adviser and its affiliates received or were expected to receive that were directly attributable to the management of the Fund. See Section E below for additional information on indirect benefits a Fund Adviser may receive as a result of its relationship with the Fund.
Based on their review, the Independent Board Members determined that the Adviser’s and the Sub-Adviser’s level of profitability was reasonable in light of the respective services provided.
| 54 | Nuveen Investments |
| D. | Economies of Scale and Whether Fee Levels Reflect These Economies of Scale |
The Independent Board Members recognized that, as the assets of a particular fund or the Nuveen complex in the aggregate increase over time, economies of scale may be realized, and the Independent Board Members considered the extent to which the funds benefit from such economies of scale. Although the Independent Board Members recognized that economies of scale are difficult to measure, the Board recognized that one method to help ensure the shareholders share in these benefits is to include breakpoints in the management fee schedule reducing fee rates as asset levels grow. The Independent Board Members noted that, subject to certain exceptions, the management fees of the funds in the Nuveen complex are generally comprised of a fund-level component and complex-level component. Each component of the management fee for the Fund included breakpoints to reduce management fee rates of the Fund as the Fund grows and, as described below, as the Nuveen complex grows. The Independent Board Members noted that, in the case of closed-end funds, however, such funds may from time-to-time make additional share offerings, but the growth of their assets would occur primarily through the appreciation of such funds’ investment portfolios. In addition to fund-specific breakpoint schedules which reduce the fee rates of a particular fund as its assets increase, the Independent Board Members recognized that the Adviser also passed on the benefits of economies of scale through the complex-wide fee arrangement which reduced management fee rates as assets in the fund complex reached certain levels. The complex-wide fee arrangement seeks to provide the benefits of economies of scale to fund shareholders when total fund complex assets increase, even if assets of a particular fund are unchanged or have decreased. The approach reflected the notion that some of Nuveen’s costs were attributable to services provided to all its funds in the complex, and therefore all funds benefit if these costs were spread over a larger asset base. The Independent Board Members reviewed the breakpoint and complex-wide schedules and the fee reductions achieved as a result of such structures for the 2014 calendar year.
The Independent Board Members also noted that additional economies of scale were shared with shareholders of the Fund through the adoption of a temporary expense cap. The Independent Board Members further considered that as part of the TIAA-CREF Transaction, Nuveen agreed, for a period of two years from the date of the closing of the TIAA-CREF Transaction, not to increase contractual management fees for any Nuveen fund and, with respect to funds with expense caps, not to raise expense cap levels for such funds from levels in effect at that time or scheduled to go into effect prior to the closing of the TIAA-CREF Transaction. The commitment would not limit or otherwise affect mergers or liquidations of any funds in the ordinary course.
Based on their review, the Independent Board Members concluded that the current fee structure was acceptable and reflected economies of scale to be shared with shareholders when assets under management increase.
| E. | Indirect Benefits |
The Independent Board Members received and considered information regarding potential “fall out” or ancillary benefits the respective Fund Adviser or its affiliates may receive as a result of its relationship with the Fund. With respect to closed-end funds, the Independent Board Members noted any revenues received by affiliates of the Adviser for serving as co-manager in initial public offerings of new closed-end funds.
In addition to the above, the Independent Board Members considered whether the Fund Adviser received any benefits from soft dollar arrangements whereby a portion of the commissions paid by the Fund for brokerage may be used to acquire research that may be useful to the Fund Adviser in managing the assets of the Fund and other clients. The Fund’s portfolio transactions are allocated by the Sub-Adviser. Accordingly, the Independent Board Members considered that the Sub-Adviser may benefit from research provided by broker-dealers executing portfolio transactions on behalf of the Fund. With respect to any fixed income securities, however, the Board recognized that such securities generally trade on a principal basis that does not generate soft dollar credits. Similarly, the Board recognized that any research received pursuant to soft dollar arrangements by the Sub-Adviser may also benefit the Fund and shareholders to the extent the research enhanced the ability of the Sub-Adviser to manage the Fund. The Independent Board Members noted that the Sub-Adviser’s profitability may be somewhat lower if it had to acquire any such research services directly.
Based on their review, the Independent Board Members concluded that any indirect benefits received by a Fund Adviser as a result of its relationship with the Fund were reasonable and within acceptable parameters.
| Nuveen Investments | 55 |
Annual Investment Management Agreement Approval Process (Unaudited) (continued)
| F. | Other Considerations |
The Independent Board Members did not identify any single factor discussed previously as all-important or controlling. The Board Members, including the Independent Board Members, concluded that the terms of each Advisory Agreement were fair and reasonable, that the respective Fund Adviser’s fees were reasonable in light of the services provided to the Fund and that the Advisory Agreements be renewed.
| 56 | Nuveen Investments |
Notes
| Nuveen Investments | 57 |
Notes
| 58 | Nuveen Investments |
Notes
| Nuveen Investments | 59 |
| ||||||||||||||
| ||||||||||||||
| Nuveen Investments: | ||||||||||||||
| Serving Investors for Generations | ||||||||||||||
| ||||||||||||||
| Since 1898, financial advisors and their clients have relied on Nuveen Investments to provide dependable investment solutions through continued adherence to proven, long-term investing principles. Today, we offer a range of high quality equity and fixed-income solutions designed to be integral components of a well-diversified core portfolio. | ||||||||||||||
| ||||||||||||||
Focused on meeting investor needs.
Nuveen Investments provides high-quality investment services designed to help secure the long-term goals of institutional and individual investors as well as the consultants and financial advisors who serve them. Nuveen Investments markets a wide range of specialized investment solutions which provide investors access to capabilities of its high-quality boutique investment affiliates – Nuveen Asset Management, Symphony Asset Management, NWQ Investment Management Company, Santa Barbara Asset Management, Tradewinds Global Investors, Winslow Capital Management and Gresham Investment Management. In total, Nuveen Investments managed $230 billion as of June 30, 2015. | ||||||||||||||
| ||||||||||||||
Find out how we can help you.
To learn more about how the products and services of Nuveen Investments may be able to help you meet your financial goals, talk to your financial advisor, or call us at (800) 257-8787. Please read the information provided carefully before you invest. Investors should consider the investment objective and policies, risk considerations, charges and expenses of any investment carefully. Where applicable, be sure to obtain a prospectus, which contains this and other relevant information. To obtain a prospectus, please contact your securities representative or Nuveen Investments, 333 W. Wacker Dr., Chicago, IL 60606. Please read the prospectus carefully before you invest or send money.
Learn more about Nuveen Funds at: www.nuveen.com/cef | ||||||||||||||
| ||||||||||||||
Distributed by Nuveen Securities, LLC | 333 West Wacker Drive | Chicago, IL 60606 | www.nuveen.com/cef
EAN-A-0615D 10001-INV-Y-08/16
ITEM 2. CODE OF ETHICS.
As of the end of the period covered by this report, the registrant has adopted a code of ethics that applies to the registrant’s principal executive officer, principal financial officer, principal accounting officer or controller, or persons performing similar functions. There were no amendments to or waivers from the Code during the period covered by this report. The registrant has posted the code of ethics on its website at www.nuveen.com/CEF/Shareholder/FundGovernance.aspx. (To view the code, click on Code of Conduct.)
ITEM 3. AUDIT COMMITTEE FINANCIAL EXPERT.
The registrant’s Board of Directors or Trustees (“Board”) determined that the registrant has at least one “audit committee financial expert” (as defined in Item 3 of Form N-CSR) serving on its Audit Committee. The registrant’s audit committee financial experts are Carole E. Stone and Jack B. Evans, who are “independent” for purposes of Item 3 of Form N-CSR.
Ms. Stone served for five years as Director of the New York State Division of the Budget. As part of her role as Director, Ms. Stone was actively involved in overseeing the development of the State’s operating, local assistance and capital budgets, its financial plan and related documents; overseeing the development of the State’s bond-related disclosure documents and certifying that they fairly presented the State’s financial position; reviewing audits of various State and local agencies and programs; and coordinating the State’s system of internal audit and control. Prior to serving as Director, Ms. Stone worked as a budget analyst/examiner with increasing levels of responsibility over a 30 year period, including approximately five years as Deputy Budget Director. Ms. Stone has also served as Chair of the New York State Racing Association Oversight Board, as Chair of the Public Authorities Control Board, as a Commissioner on the New York State Commission on Public Authority Reform and as a member of the Boards of Directors of several New York State public authorities. These positions have involved overseeing operations and finances of certain entities and assessing the adequacy of project/entity financing and financial reporting. Currently, Ms. Stone is on the Board of Directors of CBOE Holdings, Inc., of the Chicago Board Options Exchange, and of C2 Options Exchange. Ms. Stone’s position on the boards of these entities and as a member of both CBOE Holdings’ Audit Committee and its Finance Committee has involved, among other things, the oversight of audits, audit plans and preparation of financial statements.
Mr. Evans was formerly President and Chief Operating Officer of SCI Financial Group, Inc., a full service registered broker-dealer and registered investment adviser (“SCI”). As part of his role as President and Chief Operating Officer, Mr. Evans actively supervised the Chief Financial Officer (the “CFO”) and actively supervised the CFO’s preparation of financial statements and other filings with various regulatory authorities. In such capacity, Mr. Evans was actively involved in the preparation of SCI’s financial statements and the resolution of issues raised in connection therewith. Mr. Evans has also served on the audit committee of various reporting companies. At such companies, Mr. Evans was involved in the oversight of audits, audit plans, and the preparation of financial statements. Mr. Evans also formerly chaired the audit committee of the Federal Reserve Bank of Chicago.
ITEM 4. PRINCIPAL ACCOUNTANT FEES AND SERVICES.
Nuveen Multi-Market Income Fund
The following tables show the amount of fees that KPMG LLP, the Fund’s auditor, billed to the Fund during the Fund’s last two full fiscal years. For engagements with KPMG LLP the Audit Committee approved in advance all audit services and non-audit services that KPMG LLP provided to the Fund, except for those non-audit services that were subject to the pre-approval exception under Rule 2-01 of Regulation S-X (the “pre-approval exception”). The pre-approval exception for services provided directly to the Fund waives the pre-approval requirement for services other than audit, review or attest services if: (A) the aggregate amount of all such services provided constitutes no more than 5% of the total amount of revenues paid by the Fund to its accountant during the fiscal year in which the services are provided; (B) the Fund did not recognize the services as non-audit services at the time of the engagement; and (C) the services are promptly brought to the Audit Committee’s attention, and the Committee (or its delegate) approves the services before the audit is completed.
The Audit Committee has delegated certain pre-approval responsibilities to its Chairman (or, in his absence, any other member of the Audit Committee).
SERVICES THAT THE FUND’S AUDITOR BILLED TO THE FUND
Fiscal Year Ended | Audit Fees Billed to Fund 1 | Audit-Related Fees Billed to Fund 2 | Tax Fees Billed to Fund 3 | All Other Fees Billed to Fund 4 | ||||||||||||
June 30, 2015 | $ | 32,500 | $ | 0 | $ | 0 | $ | 0 | ||||||||
|
|
|
|
|
|
|
| |||||||||
Percentage approved pursuant to pre-approval exception | 0 | % | 0 | % | 0 | % | 0 | % | ||||||||
|
|
|
|
|
|
|
| |||||||||
* June 30, 2014 | $ | 0 | $ | 0 | $ | 0 | $ | 0 | ||||||||
|
|
|
|
|
|
|
| |||||||||
Percentage approved pursuant to pre-approval exception | 0 | % | 0 | % | 0 | % | 0 | % | ||||||||
|
|
|
|
|
|
|
| |||||||||
1 “Audit Fees” are the aggregate fees billed for professional services for the audit of the Fund’s annual financial statements and services provided in connection with statutory and regulatory filings or engagements.
2 “Audit Related Fees” are the aggregate fees billed for assurance and related services reasonably related to the performance of the audit or review of financial statements that are not reported under “Audit Fees”. These fees include offerings related to the Fund’s common shares and leverage.
3 “Tax Fees” are the aggregate fees billed for professional services for tax advice, tax compliance, and tax planning. These fees include: all global withholding tax services; excise and state tax reviews; capital gain, tax equalization and taxable basis calculation performed by the principal accountant.
4 “All Other Fees” are the aggregate fees billed for products and services other than “Audit Fees”, “Audit-Related Fees” and “Tax Fees”. These fees represent all “Agreed-Upon Procedures” engagements pertaining to the Fund’s use of leverage.
* Fund commenced operations 09/08/2014.
SERVICES THAT THE FUND’S AUDITOR BILLED TO THE
ADVISER AND AFFILIATED FUND SERVICE PROVIDERS
The following tables show the amount of fees billed by KPMG LLP to Nuveen Fund Advisors, LLC (formerly Nuveen Fund Advisors, Inc.) (the “Adviser”), and any entity controlling, controlled by or under common control with the Adviser that provides ongoing services to the Fund (“Affiliated Fund Service Provider”), for engagements directly related to the Fund’s operations and financial reporting, during the Fund’s last two full fiscal years.
The tables also show the percentage of fees subject to the pre-approval exception. The pre-approval exception for services provided to the Adviser and any Affiliated Fund Service Provider (other than audit, review or attest services) waives the pre-approval requirement if: (A) the aggregate amount of all such services provided constitutes no more than 5% of the total amount of revenues paid to KPMG LLP by the Fund, the Adviser and Affiliated Fund Service Providers during the fiscal year in which the services are provided that would have to be pre-approved by the Audit Committee; (B) the Fund did not recognize the services as non-audit services at the time of the engagement; and (C) the services are promptly brought to the Audit Committee’s attention, and the Committee (or its delegate) approves the services before the Fund’s audit is completed.
Fiscal Year Ended | Audit-Related Fees Billed to Adviser and Affiliated Fund Service Providers | Tax Fees Billed to Adviser and Affiliated Fund Service Providers | All Other Fees Billed to Adviser and Affiliated Fund Service Providers | |||||||||
June 30, 2015 | $ | 0 | $ | 0 | $ | 0 | ||||||
|
|
|
|
|
| |||||||
Percentage approved pursuant to pre-approval exception | 0 | % | 0 | % | 0 | % | ||||||
|
|
|
|
|
| |||||||
June 30, 2014 | $ | 0 | $ | 0 | $ | 0 | ||||||
|
|
|
|
|
| |||||||
Percentage approved pursuant to pre-approval exception | 0 | % | 0 | % | 0 | % | ||||||
|
|
|
|
|
| |||||||
NON-AUDIT SERVICES
The following table shows the amount of fees that KPMG LLP billed during the Fund’s last two full fiscal years for non-audit services. The Audit Committee is required to pre-approve non-audit services that KPMG LLP provides to the Adviser and any Affiliated Fund Services Provider, if the engagement related directly to the Fund’s operations and financial reporting (except for those subject to the pre-approval exception described above). The Audit Committee requested and received information from KPMG LLP about any non-audit services that KPMG LLP rendered during the Fund’s last fiscal year to the Adviser and any Affiliated Fund Service Provider. The Committee considered this information in evaluating KPMG LLP ’s independence.
Fiscal Year Ended | Total Non-Audit Fees Billed to Fund | Total Non-Audit Fees billed to Adviser and Affiliated Fund Service Providers (engagements related directly to the operations and financial reporting of the Fund) | Total Non-Audit Fees billed to Adviser and Affiliated Fund Service Providers (all other engagements) | Total | ||||||||||||
June 30, 2015 | $ | 0 | $ | 0 | $ | 0 | $ | 0 | ||||||||
June 30, 2014 | $ | 0 | $ | 0 | $ | 0 | $ | 0 | ||||||||
“Non-Audit Fees billed to Fund” for both fiscal year ends represent “Tax Fees” and “All Other Fees” billed to Fund in their respective amounts from the previous table.
Less than 50 percent of the hours expended on the principal accountant’s engagement to audit the registrant’s financial statements for the most recent fiscal year were attributed to work performed by persons other than the principal accountant’s full-time, permanent employees.
Audit Committee Pre-Approval Policies and Procedures. Generally, the Audit Committee must approve (i) all non-audit services to be performed for the Fund by the Fund’s independent accountants and (ii) all audit and non-audit services to be performed by the Fund’s independent accountants for the Affiliated Fund Service Providers with respect to operations and financial reporting of the Fund. Regarding tax and research projects conducted by the independent accountants for the Fund and Affiliated Fund Service Providers (with respect to operations and financial reports of the Fund) such engagements will be (i) pre-approved by the Audit Committee if they are expected to be for amounts greater than $10,000; (ii) reported to the Audit Committee chairman for his verbal approval prior to engagement if they are expected to be for amounts under $10,000 but greater than $5,000; and (iii) reported to the Audit Committee at the next Audit Committee meeting if they are expected to be for an amount under $5,000.
ITEM 5. AUDIT COMMITTEE OF LISTED REGISTRANTS.
The registrant’s Board has a separately designated Audit Committee established in accordance with Section 3(a)(58)(A) of the Securities Exchange Act of 1934, as amended (15 U.S.C. 78c(a)(58)(A)). The members of the audit committee are Jack B. Evans, David J. Kundert, John K. Nelson, Carole E. Stone and Terence J. Toth.
ITEM 6. SCHEDULE OF INVESTMENTS.
(a) See Portfolio of Investments in Item 1.
(b) Not applicable.
ITEM 7. DISCLOSURE OF PROXY VOTING POLICIES AND PROCEDURES FOR CLOSED-END MANAGEMENT INVESTMENT COMPANIES.
Nuveen Fund Advisors, LLC, formerly known as Nuveen Fund Advisors, Inc., is the registrant’s investment adviser (also referred to as the “Adviser”). The Adviser is responsible for the on-going monitoring of the Fund’s investment portfolio, managing the Fund’s business affairs and providing certain clerical, bookkeeping and administrative services. The Adviser has engaged Nuveen Asset Management, LLC (“Sub-Adviser”) as Sub-Adviser to provide discretionary investment advisory services. As part of these services, the Adviser has delegated to the Sub-Adviser the full responsibility for proxy voting on securities held in the registrant’s portfolio and related duties in accordance with the Sub-Adviser’s policies and procedures. The Adviser periodically monitors the Sub-Adviser’s voting to ensure that it is carrying out its duties. The Sub-Adviser’s proxy voting policies and procedures are attached to this filing as an exhibit and incorporated herein by reference.
ITEM 8. PORTFOLIO MANAGERS OF CLOSED-END MANAGEMENT INVESTMENT COMPANIES.
Nuveen Fund Advisors, LLC (“NFALLC”) is the registrant’s investment adviser (NFALLC is also referred to as the “Adviser”). NFALLC is responsible for the selection and on-going monitoring of the Fund’s investment portfolio, managing the Fund’s business affairs and providing certain clerical, bookkeeping and administrative services. The Adviser has engaged Nuveen Asset Management, LLC (“Nuveen Asset Management” or “Sub-Adviser”), as Sub-Adviser to provide discretionary investment advisory services. The following section provides information on the portfolio managers at the Sub-Adviser:
| Item 8(a)(1). | PORTFOLIO MANAGER BIOGRAPHIES |
John T. Fruit, CFA, entered the financial services industry in 1988 and joined FAF Advisors in 2001 as a senior fixed-income research analyst. He became a portfolio manager in 2005 and most recently served as Senior Fixed-Income Portfolio Manager at FAF Advisors until joining Nuveen Asset Management. He joined Nuveen Asset Management as Senior Vice President, Portfolio Manager and Head of High-Yield Credit Sector Team on January 1, 2011 in connection with its acquisition of a portion of FAF’s asset management business.
Chris J. Neuharth, CFA, entered the financial services industry in 1981 and became a portfolio manager in 1985. He rejoined FAF Advisors (“FAF”) in 2000 and most recently served as Senior Fixed-Income Portfolio Manager at FAF until joining Nuveen Asset Management. He joined Nuveen Asset Management as Managing Director, Portfolio Manager and Head of Securitized Debt Sector Team on January 1, 2011 in connection with its acquisition of a portion of FAF’s asset management business.
Jason J. O’Brien, CFA, entered the financial services industry in 1993 when he joined FAF. He became a portfolio manager in 2001 and most recently served as Fixed-Income Portfolio Manager at FAF until joining Nuveen Asset Management. He joined Nuveen Asset Management as Vice President and Portfolio Manager on January 1, 2011 in connection with its acquisition of a portion of FAF’s asset management business.
| Item 8(a)(2). | OTHER ACCOUNTS MANAGED BY PORTFOLIO MANAGERS |
In addition to the Fund, as of June 30, 2015, the portfolio managers are also primarily responsible for the day-to-day portfolio management of the following accounts:
(ii) Number of Other Accounts Managed and Assets by Account Type* | (iii) Number of Other Accounts and Assets for Which Advisory Fee is Performance-Based | |||||||||||||||||||||||||||||||||||
(i) Name of Portfolio Manager | Other Registered Investment Companies | Other Pooled Investment Vehicles | Other Accounts | Other Registered Investment Companies | Other Pooled Investment Vehicles | Other Accounts | ||||||||||||||||||||||||||||||
John Fruit | 2 | $1.32 billion | 0 | 0 | 2 | $1.574 million | 0 | 0 | 0 | 0 | 0 | 0 | ||||||||||||||||||||||||
Chris Neuharth | 7 | $2.44 billion | 0 | $0 | 13 | $880 million | 0 | 0 | 0 | 0 | 0 | 0 | ||||||||||||||||||||||||
Jason O’Brien | 1 | $75.9 million | 0 | $0 | 10 | $340 million | 0 | 0 | 0 | 0 | 0 | 0 | ||||||||||||||||||||||||
* Assets are as of June 30, 2015.
POTENTIAL MATERIAL CONFLICTS OF INTEREST
Actual or apparent conflicts of interest may arise when a portfolio manager has day-to-day management responsibilities with respect to more than one account. More specifically, portfolio managers who manage multiple accounts are presented a number of potential conflicts, including, among others, those discussed below.
The management of multiple accounts may result in a portfolio manager devoting unequal time and attention to the management of each account. Nuveen Asset Management seeks to manage such competing interests for the time and attention of portfolio managers by having portfolio managers focus on a particular investment discipline. Most accounts managed by a portfolio manager in a particular investment strategy are managed using the same investment models.
If a portfolio manager identifies a limited investment opportunity which may be suitable for more than one account, an account may not be able to take full advantage of that opportunity due to an allocation of filled purchase or sale orders across all eligible accounts. To deal with these situations, Nuveen Asset Management has adopted procedures for allocating limited opportunities across multiple accounts.
With respect to many of its clients’ accounts, Nuveen Asset Management determines which broker to use to execute transaction orders, consistent with its duty to seek best execution of the transaction. However, with respect to certain other accounts, Nuveen Asset Management may be limited by the client with respect to the selection of brokers or may be instructed to direct trades through a particular broker. In these cases, Nuveen Asset Management may place separate, non-simultaneous, transactions for a Fund and other accounts which may temporarily affect the market price of the security or the execution of the transaction, or both, to the detriment of the Fund or the other accounts. Some clients are subject to different regulations. As a consequence of this difference in regulatory requirements, some clients may not be permitted to engage in all the investment techniques or transactions or to engage in these transactions to the same extent as the other accounts managed by the portfolio manager. Finally, the appearance of a conflict of interest may arise where Nuveen Asset Management has an incentive, such as a performance-based management fee, which relates to the management of some accounts, with respect to which a portfolio manager has day-to-day management responsibilities.
Nuveen Asset Management has adopted certain compliance procedures which are designed to address these types of conflicts common among investment managers. However, there is no guarantee that such procedures will detect each and every situation in which a conflict arises.
| Item 8(a)(3). | FUND MANAGER COMPENSATION |
Portfolio manager compensation consists primarily of base pay, an annual cash bonus and long term incentive payments.
Base pay. Base pay is determined based upon an analysis of the portfolio manager’s general performance, experience, and market levels of base pay for such position.
Annual cash bonus. The Fund’s portfolio managers are eligible for an annual cash bonus based on investment performance, qualitative evaluation and financial performance of Nuveen Asset Management.
A portion of each portfolio manager’s annual cash bonus is based on the Fund’s pre-tax investment performance, generally measured over the past one- and three or five-year periods unless the portfolio manager’s tenure is shorter. Investment performance for the Fund generally is determined by evaluating the Fund’s performance relative to its benchmark(s) and/or Lipper industry peer group.
A portion of the cash bonus is based on a qualitative evaluation made by each portfolio manager’s supervisor taking into consideration a number of factors, including the portfolio manager’s team collaboration, expense management, support of personnel responsible for asset growth, and his or her compliance with Nuveen Asset Management’s policies and procedures.
The final factor influencing a portfolio manager’s cash bonus is the financial performance of Nuveen Asset Management based on its operating earnings.
Long-term incentive compensation. Certain key employees of Nuveen Investments and its affiliates, including certain portfolio managers, participate in a Long-Term Performance Plan designed to provide compensation
opportunities that links a portion of each participant’s compensation to Nuveen Investments’ financial and operational performance. In addition, certain key employees of Nuveen Asset Management, including certain portfolio managers, have received profits interests in Nuveen Asset Management which entitle their holders to participate in the firm’s growth over time.
There are generally no differences between the methods used to determine compensation with respect to the Fund and the Other Accounts shown in the table above.
| Item 8(a)(4). | OWNERSHIP OF JMM SECURITIES AS OF JUNE 30, 2015 |
Name of Portfolio Manager | None | $1 - $10,000 | $10,001- $50,000 | $50,001- $100,000 | $100,001- $500,000 | $500,001- $1,000,000 | Over $1,000,000 | |||||||||||||||||||
John Fruit | X | |||||||||||||||||||||||||
Chris Neuharth | X | |||||||||||||||||||||||||
Jason O’Brien | X | |||||||||||||||||||||||||
ITEM 9. PURCHASES OF EQUITY SECURITIES BY CLOSED-END MANAGEMENT INVESTMENT COMPANY AND AFFILIATED PURCHASERS.
Not applicable.
ITEM 10. SUBMISSION OF MATTERS TO A VOTE OF SECURITY HOLDERS.
There have been no material changes to the procedures by which shareholders may recommend nominees to the registrant’s Board implemented after the registrant last provided disclosure in response to this Item.
ITEM 11. CONTROLS AND PROCEDURES.
| (a) | The registrant’s principal executive and principal financial officers, or persons performing similar functions, have concluded that the registrant’s disclosure controls and procedures (as defined in Rule 30a-3(c) under the Investment Company Act of 1940, as amended (the “1940 Act”) (17 CFR 270.30a-3(c))) are effective, as of a date within 90 days of the filing date of this report that includes the disclosure required by this paragraph, based on their evaluation of the controls and procedures required by Rule 30a-3(b) under the 1940 Act (17 CFR 270.30a-3(b)) and Rules 13a-15(b) or 15d-15 (b) under the Securities Exchange Act of 1934, as amended (the “Exchange Act”) (17 CFR 240.13a-15(b) or 240.15d-15 (b)). |
| (b) | There were no changes in the registrant’s internal control over financial reporting (as defined in Rule 30a-3(d) under the 1940 Act (17 CFR 270.30a-3(d)) that occurred during the second fiscal quarter of the period covered by this report that has materially affected, or is reasonably likely to materially affect, the registrant’s internal control over financial reporting. |
ITEM 12. EXHIBITS.
File the exhibits listed below as part of this Form.
(a)(1) Any code of ethics, or amendment thereto, that is the subject of the disclosure required by Item 2, to the extent that the registrant intends to satisfy the Item 2 requirements through filing of an exhibit: Not applicable because the code is posted on registrant’s website at www.nuveen.com/CEF/Shareholder/FundGovernance.aspx and there were no amendments during the period covered by this report. (To view the code, click on Code of Conduct.)
(a)(2) A separate certification for each principal executive officer and principal financial officer of the registrant as required by Rule 30a-2(a) under the 1940 Act (17 CFR 270.30a-2(a)) in the exact form set forth below: Ex-99.CERT Attached hereto.
(a)(3) Any written solicitation to purchase securities under Rule 23c-1 under the 1940 Act (17 CFR 270.23c-1) sent or given during the period covered by the report by or on behalf of the registrant to 10 or more persons. Not applicable.
(b) If the report is filed under Section 13(a) or 15(d) of the Exchange Act, provide the certifications required by Rule 30a-2(b) under the 1940 Act (17 CFR 270.30a-2(b)); Rule 13a-14(b) or Rule 15d-14(b) under the Exchange Act (17 CFR 240.13a-14(b) or 240.15d-14(b)), and Section 1350 of Chapter 63 of Title 18 of the United States Code (18 U.S.C. 1350) as an exhibit. A certification furnished pursuant to this paragraph will not be deemed “filed” for purposes of Section 18 of the Exchange Act (15 U.S.C. 78r), or otherwise subject to the liability of that section. Such certification will not be deemed to be incorporated by reference into any filing under the Securities Act of 1933 or the Exchange Act, except to the extent that the registrant specifically incorporates it by reference. Ex-99.906 CERT attached hereto.
SIGNATURES
Pursuant to the requirements of the Securities Exchange Act of 1934 and the Investment Company Act of 1940, the registrant has duly caused this report to be signed on its behalf by the undersigned, thereunto duly authorized.
(Registrant) Nuveen Multi-Market Income Fund
| By (Signature and Title) | /s/ Kevin J. McCarthy | |||
| Kevin J. McCarthy | ||||
| Vice President and Secretary | ||||
| Date: September 8, 2015 | ||||
Pursuant to the requirements of the Securities Exchange Act of 1934 and the Investment Company Act of 1940, this report has been signed below by the following persons on behalf of the registrant and in the capacities and on the dates indicated.
| By (Signature and Title) | /s/ Gifford R. Zimmerman | |||
| Gifford R. Zimmerman | ||||
| Chief Administrative Officer | ||||
| (principal executive officer) | ||||
| Date: September 8, 2015 | ||||
| By (Signature and Title) | /s/ Stephen D. Foy | |||
| Stephen D. Foy | ||||
| Vice President and Controller | ||||
| (principal financial officer) | ||||
| Date: September 8, 2015 | ||||