UNITED STATES
SECURITIES AND EXCHANGE COMMISSION
Washington, D.C. 20549
FORM N-CSR
CERTIFIED SHAREHOLDER REPORT OF REGISTERED
MANAGEMENT INVESTMENT COMPANIES
| | |
| Investment Company Act file number | | 811-05642 |
Nuveen Multi-Market Income Fund
(Exact name of registrant as specified in charter)
Nuveen Investments
333 West Wacker Drive
Chicago, IL 60606
(Address of principal executive offices) (Zip code)
Mark L. Winget
333 West Wacker Drive
Chicago, IL 60606
(Name and address of agent for service)
| | |
| Registrant’s telephone number, including area code: | | (312) 917-7700 |
| | |
| Date of fiscal year end: | | June 30 |
| | |
| Date of reporting period: | | June 30, 2021 |
Form N-CSR is to be used by management investment companies to file reports with the Commission not later than 10 days after the transmission to stockholders of any report that is required to be transmitted to stockholders under Rule 30e-1 under the Investment Company Act of 1940 (17 CFR 270.30e-1). The Commission may use the information provided on Form N-CSR in its regulatory, disclosure review, inspection, and policymaking roles.
A registrant is required to disclose the information specified by Form N-CSR, and the Commission will make this information public. A registrant is not required to respond to the collection of information contained in Form N-CSR unless the Form displays a currently valid Office of Management and Budget (“OMB”) control number. Please direct comments concerning the accuracy of the information collection burden estimate and any suggestions for reducing the burden to Secretary, Securities and Exchange Commission, 450 Fifth Street, NW, Washington, DC 20549-0609. The OMB has reviewed this collection of information under the clearance requirements of 44 U.S.C. ss. 3507.
| ITEM 1. | REPORTS TO STOCKHOLDERS. |

Closed-End Funds
30 June 2021
Nuveen Closed-End Funds
| | |
| JMM | | Nuveen Multi-Market Income Fund |
As permitted by regulations adopted by the Securities and Exchange Commission, paper copies of the Fund’s annual and semi-annual shareholder reports will not be sent to you by mail unless you specifically request paper copies of the reports. Instead, the reports will be made available on the Fund’s website (www.nuveen.com), and you will be notified by mail each time a report is posted and provided with a website link to access the report.
You may elect to receive shareholder reports and other communications from the Fund electronically at any time by contacting the financial intermediary (such as a broker-dealer or bank) through which you hold your Fund shares or, if you are a direct investor, by enrolling at www.nuveen.com/e-reports.
You may elect to receive all future shareholder reports in paper free of charge at any time by contacting your financial intermediary or, if you are a direct investor, by calling 800-257-8787 and selecting option #2 or (ii) by logging into your Investor Center account at www.computershare.com/investor and clicking on “Communication Preferences”. Your election to receive reports in paper will apply to all funds held in your account with your financial intermediary or, if you are a direct investor, to all your directly held Nuveen Funds and any other directly held funds within the same group of related investment companies.
Annual Report
Life is Complex.
Nuveen makes things e-simple.
It only takes a minute to sign up for e-Reports. Once enrolled, you’ll receive an e-mail as soon as your Nuveen Fund information is ready—no more waiting for delivery by regular mail. Just click on the link within the e-mail to see the report and save it on your computer if you wish.
Free e-Reports right to your e-mail!
www.investordelivery.com
If you receive your Nuveen Fund dividends and statements from your financial professional or brokerage account.
or
www.nuveen.com/client-access
If you receive your Nuveen Fund dividends and statements directly from Nuveen.
NOT FDIC INSURED MAY LOSE VALUE NO BANK GUARANTEE
Table of Contents
3
Chair’s Letter to Shareholders

Dear Shareholders,
More than a year has passed since the World Health Organization declared COVID-19 a global pandemic in March 2020, resulting in a year marked by a global economic downturn, financial market turbulence and some immeasurable losses of life. Although the health crisis persists, with the widespread distribution of vaccines in the U.S. and extraordinary economic interventions by governments and central banks around the world, we collectively look forward to what our “new normal” might be.
Global economic activity has continued to rebound, driving both gross domestic product growth and inflation higher, especially in the U.S. Vaccinations have enabled a further reopening of economies while governments and central banks have taken extraordinary measures to support the recoveries. To extend relief programs enacted earlier in the crisis, the U.S. government passed $900 billion in aid to individuals and businesses in late December 2020. Another $1.9 trillion relief package was signed into law in March 2021, providing extended unemployment benefits, direct payments to individuals and families, assistance to state and local municipalities, grants to education and public health, and other support. Currently, Congress is working on an infrastructure spending plan, although its final shape and whether it passes remains to be seen. The U.S. Federal Reserve (Fed) and other central banks around the world have upgraded their economic forecasts but remain committed to sustaining the recovery by maintaining accommodative monetary conditions. However, as economies have reopened, the surge in consumer demand has outpaced supply chain capacity, resulting in a jump in inflation indicators in recent months. Whether inflation persists is a subject of debate by economists and some market observers, while the Fed and other central banks believe it to be more transitory.
While the markets’ longer-term outlook has brightened, we expect intermittent bouts of volatility to continue. Markets are closely monitoring central bank signals, particularly if inflation remains elevated, as a sooner-than-expected shift to monetary tightening could slow the economic recovery. Additionally, COVID-19 cases are rising again, as more virulent strains such as the delta variant have spread, both case counts and hospitalizations are rising, and vaccination rollouts have been uneven around the country and around the world. The recovery hinges on controlling the virus, and estimates vary considerably on when economic activity might be fully restored and what level of public inoculation would be sufficient to contain the spread of the virus, particularly in light of new variants. On the political front, the Biden administration’s full policy agenda and the potential for Congressional gridlock remain to be seen, either of which could cause investment outlooks to shift. Short-term market fluctuations can provide your Fund opportunities to invest in new ideas as well as upgrade existing positioning while providing long-term value for shareholders. For more than 120 years, the careful consideration of risk and reward has guided Nuveen’s focus on delivering long-term results to our shareholders.
If you have concerns about what’s coming next, it may be an opportune time to assess your portfolio. We encourage you to review your time horizon, risk tolerance and investment goals with your financial professional.
On behalf of the other members of the Nuveen Fund Board, we look forward to continuing to earn your trust in the months and years ahead.
Sincerely,

Terence J. Toth
Chair of the Board
August 23, 2021
4
Portfolio Managers’ Comments
Nuveen Multi-Market Income Fund (JMM)
Nuveen Multi-Market Income Fund (JMM) features portfolio management by Nuveen Asset Management, LLC (NAM), an affiliate of Nuveen Fund Advisers, LLC, the Fund’s investment adviser. The Fund’s portfolio managers are Jason J. O’Brien, CFA, and Peter L. Agrimson, CFA.
Here the Fund’s portfolio management team discusses economic and market conditions, key investment strategies and the Fund’s performance for the twelve-month reporting period June 30, 2021.
What factors affected the U.S. economy and the global stock markets during the twelve-month annual reporting period ended June 30, 2021?
The U.S. economy rebounded more quickly than expected from the deep downturn caused by the COVID-19 crisis and containment measures, but gross domestic product (GDP) shrank 3.5% in 2020 compared to 2019’s annual level. U.S. GDP growth picked up pace in the first half of 2021, expanding at an annualized rate of 6.3% in the first quarter and 6.5% in the second quarter according to the Bureau of Economic Analysis “advance” estimate, up from 4.5% (annualized) in the fourth quarter of 2020.
Consumer spending, the largest driver of the economy, rebounded markedly from the steep declines early in the health crisis. Although the momentum slowed toward the end of 2020 amid a resurgence of COVID-19 infections, consumer demand resumed in 2021 as vaccination rates increased and lockdown restrictions eased, eligible Americans received another government stimulus check and the job market continued to improve. By June 2021, the U.S. unemployment rate had fallen to 5.9%, a significant improvement from the pandemic peak of 14.8% in April 2020, according to the Bureau of Labor Statistics. The overall trend of inflation accelerated, largely due to rising energy prices and the improving economy. Notably, the higher annual inflation rate in June 2021 was also the result of the comparison to the year before, when retail prices fell sharply after the first lockdowns were imposed in March 2020.
With the onset of the COVID-19 crisis, the Fed enacted an array of emergency measures in March 2020 to stabilize the financial system and support the markets. These included cutting its main interest rate to near zero, offering lending programs to aid small and large companies and engaging in expanded bond purchases, known as quantitative easing. In August 2020, the Fed announced a change in its inflation targeting policy, moving from a program of absolute targeting to an average inflation targeting policy. Under this regime, the Fed will tolerate the inflation rate temporarily overshooting the target rate to offset periods of below target inflation, so that inflation averages a 2% target rate over
This material is not intended to be a recommendation or investment advice, does not constitute a solicitation to buy, sell or hold a security or an investment strategy and is not provided in a fiduciary capacity. The information provided does not take into account the specific objectives or circumstances of any particular investor, or suggest any specific course of action. Investment decisions should be made based on an investor’s objectives and circumstances and in consultation with his or her advisors.
Certain statements in this report are forward-looking statements. Discussions of specific investments are for illustration only and are not intended as recommendations of individual investments. The forward-looking statements and other views expressed herein are those of the portfolio manager as of the date of this report. Actual future results or occurrences may differ significantly from those anticipated in any forward-looking statements and the views expressed herein are subject to change at any time, due to numerous market and other factors. The Funds disclaim any obligation to update publicly or revise any forward-looking statements or views expressed herein.
For financial recording purposes, the ratings disclosed are the highest rating given by one of the following national rating agencies: Standard & Poor’s (S&P), Moody’s Investors Service, Inc. (Moody’s) or Fitch, Inc. (Fitch). This treatment of split-rated securities may differ from that used for other purposes as for Fund investment policies. Credit ratings are subject to change. AAA, AA, A and BBB are investment grade ratings; BB, B, CCC, CC, C and D are below investment grade ratings. Holdings designated N/R are not rated by these national rating agencies.
Refer to the Glossary of Terms Used in this Report for further definition of the terms used within this section.
5
Portfolio Managers’ Comments
time. In their meetings throughout the first half of 2021, Fed officials continued to signal that accommodative monetary policy measures would stay in place, although they moved their expectations for the first rate hike forward to 2023 at their June 2021 meeting. Nevertheless, the Fed maintained its view that recently higher inflation readings were transitory and the economic recovery remained far from its goals.
The federal government also intervened with historic relief measures, starting with three aid packages in March and April 2020. These included $2 trillion allocated across direct payments to individuals, an expansion of unemployment insurance, loans to large and small businesses, funding to hospitals and health agencies and support to state and local governments, and more than $100 billion in funding to employers offering paid leave. In December 2020, the government enacted a $900 billion relief package extending some of these programs, and followed in March 2021 with another $1.9 trillion in aid to provide support to individuals and families, small businesses, state and local governments, education and public health/vaccination. The Biden administration has proposed another $2 trillion stimulus plan focused on infrastructure and jobs, but it was expected to face legislative hurdles. (In August 2021, after the close of this reporting period, the Senate approved a $1 trillion infrastructure and jobs plan, which will move to the House for consideration.)
What key strategies were used to manage the Fund during this twelve-month reporting period ended June 30, 2021?
The Fund’s investment objective is to achieve high monthly income consistent with prudent risk to capital. The portfolio management team invests the Fund’s assets primarily in debt securities, including, but not limited to, U.S. agency and privately issued mortgage-backed securities, corporate debt securities, and asset-backed securities. At least 65% of the Fund’s total assets must be invested in securities that, at the time of purchase, are rated investment grade or of comparable quality. The Fund may utilize derivatives. The Fund uses leverage.
From a positioning standpoint, the Fund maintained its overweights to asset backed securities (ABS), commercial mortgage-backed securities (CMBS) and mortgage backed securities (MBS) and remained focused on bottom-up security selection to generate income and price appreciation in those sectors. Given the strong demand for high yield credit during the reporting period, valuations in that sector became less compelling as the reporting period progressed and the Fund maintained its underweight position in high yield. Instead, the Fund increased allocations to the leverage loan and preferred securities segments where spreads were more attractive. Notably, the Fund’s MBS sector weight drifted lower during the reporting period due to pay downs on some legacy non-agency bonds that were added following the 2007-2008 financial crisis, as well as from faster prepayments from agency mortgage-backed pools. Because opportunities were more compelling elsewhere, the Fund reinvested the mortgage pay downs into investment grade credit.
How did the Fund perform during this twelve-month reporting period ended June 30, 2021?
For the twelve-month reporting period ended June 30, 2021, JMM outperformed it’s Custom Blended Fund Performance Benchmark, which is composed of 75% Bloomberg Barclays U.S. Government/Mortgage Bond Index and 25% Bloomberg Barclays U.S. Corporate High-Yield Index. For the purposes of this Performance Commentary, references to relative performance are in comparison to the JMM Custom Blended Fund Performance Benchmark.
6
The portfolio outperformed its benchmark for the reporting period in large part due to its sector allocations. The faster-than-expected economic recovery from the COVID-19 crisis and investors’ ongoing quest for yield in the low interest rate environment drove all spread sectors to post positive excess returns over U.S. Treasuries. As a result, the portfolio’s underweight to U.S. Treasury securities and corresponding overweights to sectors such as ABS, CMBS and investment grade credit all benefited performance. Security selection also contributed favorably, but to a much lesser degree.
Within the securitized segments, the portfolio’s positioning in out-of-benchmark tactical acquisitions of esoteric ABS (which are backed by more unique assets such as aircraft securitizations and franchise deals) and subordinated, investment grade CMBS aided benchmark-relative results as investors continued to reach for yield. The ABS saw material spread tightening as the segment benefited from clear expectations of a strong post-COVID-19 crisis macroeconomic recovery. By early February 2021, most ABS valuations had reached or surpassed pre-COVID-19 levels but then the momentum slowed as rates continued rising on inflation concerns. In the CMBS market, a supply/demand imbalance resulted in a continuous tightening of spreads across the risk spectrum. Even as CMBS supply came to the market, the segment continued to rally primarily as a result of the “catch-up” trade to other non-securitized asset classes that had previously recovered to pre-COVID-19 levels. Delinquency rates for all property types fell following peaks hit in June 2020.
The portfolio’s underweight position in high yield was a modest detractor to results relative to the benchmark. Spreads narrowed across the sector as the early 2020 liquidity crisis was bridged by the markets and massive government stimulus measures. Among its high yield holdings, the portfolio had a bias toward higher quality, more defensive issues, particularly early on in the reporting period. This detracted from performance since lower rated high yield bonds were the clear outperformers during the reporting period as a whole.
The Fund used U.S. Treasury futures as part of an overall portfolio construction strategy to manage portfolio duration and yield curve exposure. These future positions had a negative impact on performance during the reporting period. The Fund also used interest rate swaps to partially hedge its interest cost of leverage. The swap positions had a positive impact on performance during the reporting period largely due to the improvement in mark-to-market values driven by the increase in long-term rates.
7
Fund Leverage
IMPACT OF THE FUND’S LEVERAGE STRATEGY ON PERFORMANCE
One important factor impacting the returns of the Fund’s common shares relative to its comparative benchmarks was the Fund’s use of leverage through reverse repurchase agreements and mortgage dollar rolls. The Fund uses leverage because our research has shown that, over time, leveraging provides opportunities for additional income. The opportunity arises when short-term rates that the Fund pays on its leveraging instruments are lower than the interest the Fund earns on its portfolio securities that it has bought with the proceeds of that leverage. This has been particularly true in the recent market environment where short-term rates have been low by historical standards.
However, use of leverage can expose Fund common shares to additional price volatility. When the Fund uses leverage, the Fund’s common shares will experience a greater increase in their net asset value if the securities acquired through the use of leverage increase in value, but will also experience a correspondingly larger decline in their net asset value if the securities acquired through leverage decline in value. All this will make the shares’ total return performance more variable over time.
In addition, common share income in levered funds will typically decrease in comparison to unlevered funds when short-term interest rates increase and increase when short-term interest rates decrease. In recent quarters, fund leverage expenses have generally tracked the overall movement of short-term interest rates. While fund leverage expenses are somewhat higher than their recent lows, leverage nevertheless continues to provide the opportunity for incremental common share income, particularly over longer-term periods.
The Fund’s use of leverage had a positive impact on total return performance during this reporting period.
As of June 30, 2021, the Fund’s percentages of leverage are shown in the accompanying table.
| | | | |
| | | JMM | |
Effective Leverage* | | | 25.95 | % |
Regulatory Leverage* | | | 0.00 | % |
| * | Effective leverage is a Fund’s effective economic leverage, and includes both regulatory leverage and the leverage effects of reverse repurchase agreements, certain derivative and other investments in the Fund’s portfolio that increase the Fund’s investment exposure. Regulatory leverage consists of preferred shares issued or borrowings of a Fund. Both of these are part of a Fund’s capital structure. The Fund, however, may from time to time borrow on a typically transient basis in connection with its day-to-day operations, primarily in connection with the need to settle portfolio trades. Such incidental borrowings are excluded from the calculation of the Fund’s effective leverage ratio. Regulatory leverage is subject to asset coverage limits set forth in the Investment Company Act of 1940. |
THE FUND’S LEVERAGE
Reverse Repurchase Agreements
As noted above, the Fund utilized reverse repurchase agreements in which, the Fund sells to a counterparty a security that it holds with a contemporaneous agreement to repurchase the same security at an agreed-upon price and date. The Fund’s transactions in reverse repurchase agreements are as shown in the accompanying table.
| | | | | | | | | | | | | | | | | | | | | | | | | | | | | | | | | | |
| Current Reporting Period | | | | | | Subsequent to the Close of
the Reporting Period | |
| July 1, 2020 | | | Sales | | | Purchases | | | June 30, 2021 | | | Average Balance Outstanding | | | | | | Sales | | | Purchases | | | August 26, 2021 | |
| | $24,776,000 | | | | $6,486,763 | | | | $(8,915,763) | | | | $22,347,000 | | | | $22,930,382 | | | | | | | | $15,776,000 | | | | $(18,935,000) | | | | $19,188,000 | |
Refer to Notes to Financial Statements, Note 8 – Fund Leverage for further details.
8
Common Share Information
DISTRIBUTION INFORMATION
The following information regarding the Fund’s distributions is current as of June 30, 2021, the Fund’s fiscal and tax year end, and may differ from previously issued distribution notifications.
Effective with the Fund’s March 2021 distribution, the Fund has implemented a level distribution program. The goal of the Fund’s level distribution program is to provide shareholders with stable, but not guaranteed, cash flow, independent of the amount or timing of income earned or capital gains realized by the Fund. The Fund intends to distribute all or substantially all of its net investment income through its regular monthly distribution and to distribute realized capital gains at least annually. In any monthly period, in order to maintain its level distribution amount, the Fund may pay out more or less than its net investment income during the period. As a result, regular distributions throughout the year are expected to include net investment income and potentially a return of capital or capital gains for tax purposes. You should not draw any conclusions about the Fund’s investment performance from the amount of the distribution or from the terms of the level distribution program. A return of capital is a non-taxable distribution of a portion of a Fund’s capital. A return of capital distribution does not necessarily reflect a Fund’s investment performance and should not be confused with “yield” or “income.”
The amounts and sources of distributions reported in this notice are for financial reporting purposes and are not being provided for tax reporting purposes. The actual amounts and character of the distributions for tax reporting purposes will be reported to shareholders on Form 1099-DIV, which will be sent to shareholders shortly after calendar year-end. Because distribution source estimates are updated throughout the current fiscal year based on the Fund’s performance, those estimates may differ from both the tax information reported to you in your Fund’s 1099 statement, as well as the ultimate economic sources of distributions over the life of your investment. The figures in the table below provide the sources of distributions and may include amounts attributed to realized gains and/or returns of capital. More details about the Fund’s distributions are available on www.nuveen.com/en-us/closed-end-funds.
Data as of June 30, 2021
| | | | | | | | | | | | | | | | | | | | | | | | | | | | |
Current Month
Percentage of Distributions | | | | | Calendar YTD
Per Share Amounts | |
Net
Investment
Income | | | Realized
Gains | | | Return of
Capital | | | | | Total
Distributions | | | Net
Investment
Income | | | Realized
Gains | | | Return of
Capital | |
| | 100.00% | | | | 0.0% | | | | 0.00% | | | | | | $0.3235 | | | | $0.3235 | | | | $0.000 | | | | $0.000 | |
The following table provides information regarding Fund distributions and total return performance over various time periods. This information is intended to help you better understand whether Fund returns for the specified time periods were sufficient to meet Fund distributions.
Data as of June 30, 2021
| | | | | | | | | | | | | | | | | | | | | | | | | | | | |
| | | | | | | | Annualized | | | | | Cumulative | |
Inception
Date | | Latest
Monthly
Per Share
Distribution | | | | | Current
Distribution on
NAV | | | 1-Year
Return on
NAV | | | 5-Year
Return on
NAV | | | | | Fiscal YTD
Distributions on
NAV | | | Fiscal
YTD Return
on NAV | |
| 12/30/1988 | | | $0.0300 | | | | | | 4.60% | | | | 9.13% | | | | 4.16% | | | | | | 4.13% | | | | 9.13% | |
9
| | |
| JMM | | Nuveen Multi-Market Income Fund Performance Overview and Holding Summaries as of June 30, 2021 |
Refer to the Glossary of Terms Used in this Report for further definition of the terms used within this section.
Average Annual Total Returns as of June 30, 2021
| | | | | | | | | | | | |
| | | Average Annual | |
| | | 1-Year | | | 5-Year | | | 10-Year | |
| JMM at Common Share NAV | | | 9.13% | | | | 4.16% | | | | 4.64% | |
| JMM at Common Share Price | | | 13.13% | | | | 5.20% | | | | 5.27% | |
| JMM Custom Blended Fund Performance Benchmark(1) | | | 2.09% | | | | 3.57% | | | | 3.73% | |
| Bloomberg Barclays U.S. Government/Mortgage Bond Index | | | (2.01)% | | | | 2.25% | | | | 2.72% | |
Past performance is not predictive of future results. Current performance may be higher or lower than the data shown. Returns do not reflect the deduction of taxes that shareholders may have to pay on Fund distributions or upon the sale of Fund shares. Returns at NAV are net of Fund expenses, and assume reinvestment of distributions. Comparative index return information is provided for the Fund’s shares at NAV only. Indexes are not available for direct investment.
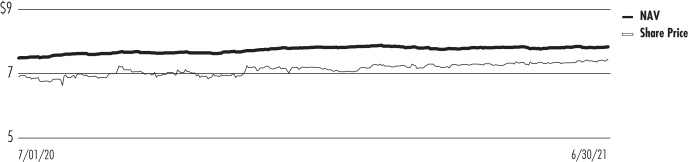
Daily Common Share NAV and Share Price
Growth of an Assumed $10,000 Investment as of June 30, 2021 — Common Share Price
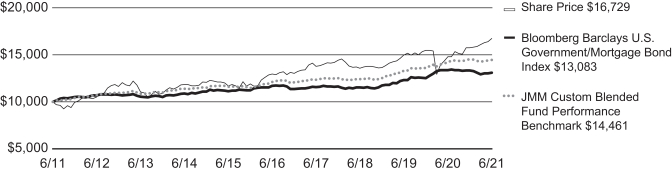
| 1. | The Blended Benchmark consists of: 1) 25% of the Bloomberg Barclays U.S. Corporate High-Yield Index and 2) 75% of the Bloomberg Barclays U.S. Government/Mortgage Bond Index. |
10
This data relates to the securities held in the Fund’s portfolio of investments as of the end of the reporting period. It should not be construed as a measure of performance for the Fund itself. Holdings are subject to change.
For financial reporting purposes, the ratings disclosed are the highest rating given by one of the following national rating agencies: Standard & Poor’s Group, Moody’s Investors Service, Inc. or Fitch, Inc. This treatment of split-rated securities may differ from that used for other purposes, such as for Fund investment policies. Credit ratings are subject to change. AAA, AA, A and BBB are investment grade ratings; BB, B, CCC, CC, C and D are below-investment grade ratings. Holdings designated N/R are not rated by these national rating agencies.
Fund Allocation
(% of net assets)
| | | | |
| Asset-Backed and Mortgage-Backed Securities | | | 88.0% | |
| Corporate Bonds | | | 38.3% | |
| Variable Rate Senior Loan Interests | | | 2.7% | |
| Sovereign Debt | | | 1.4% | |
| Contingent Capital Securities | | | 0.9% | |
| Municipal Bonds | | | 0.8% | |
$25 Par (or similar) Retail Preferred | | | 0.2% | |
| Repurchase Agreements | | | 3.3% | |
| Other Assets Less Liabilities | | | (5.4)% | |
Net Assets Plus Reverse Repurchase Agreements | | | 130.2% | |
| Reverse Repurchase Agreements | | | (30.2)% | |
Net Assets | | | 100% | |
Portfolio Composition
(% of total investments)
| | | | |
| Asset-Backed and Mortgage-Backed Securities | | | 64.9% | |
| Banks | | | 3.6% | |
| Equity Real Estate Investment Trust | | | 3.3% | |
| Oil, Gas & Consumable Fuels | | | 2.4% | |
| Diversified Financial Services | | | 1.8% | |
| Chemicals | | | 1.7% | |
| Other1 | | | 19.9% | |
| Repurchase Agreements | | | 2.4% | |
Total | | | 100% | |
Portfolio Credit Quality
(% of total long-term investments)
| | | | |
| AAA | | | 3.2% | |
| AA | | | 6.1% | |
| A | | | 6.9% | |
| BBB | | | 31.5% | |
| BB or Lower | | | 21.4% | |
| U.S. Treasury/Agency | | | 23.1% | |
| N/R | | | 7.8% | |
Total | | | 100% | |
| 1 | See Portfolio of Investments for details on “other” Portfolio Composition. |
11
Shareholder Meeting Report
The annual meeting of shareholders was held on April 6, 2021 for JMM. The meeting was held virtually due to public health concerns regarding the ongoing COVID-19 pandemic; at this meeting the shareholders were asked to elect Board members. The meeting was subsequently adjourned to April 20, 2021 and additionally to May 25, 2021 in order to seek additional shareholder participation.
| | | | |
| | | JMM | |
| | | Common
Shares* | |
The vote results in the Election of Class III Trustees were as follows: | | | | |
Jack B. Evans | | | | |
For | | | 3,910,988 | |
Withhold | | | 558,687 | |
Total | | | 4,469,675 | |
Albin F. Moschner | | | | |
For | | | 3,917,600 | |
Withhold | | | 552,075 | |
Total | | | 4,469,675 | |
Matthew Thornton III | | | | |
For | | | 4,359,875 | |
Withhold | | | 109,800 | |
Total | | | 4,469,675 | |
| * | Each Board Member will continue to serve on the Board as a “holdover” Board Member until his successor has been duly elected and qualified. |
12
Report of Independent Registered Public Accounting Firm
To the Shareholders and Board of Trustees
Nuveen Multi-Market Income Fund:
Opinion on the Financial Statements
We have audited the accompanying statement of assets and liabilities of Nuveen Multi-Market Income Fund (the Fund), including the portfolio of investments, as of June 30, 2021, the related statements of operations and cash flows for the year then ended, the statements of changes in net assets for each of the years in the two-year period then ended, and the related notes (collectively, the financial statements) and the financial highlights for each of the years in the five-year period then ended. In our opinion, the financial statements and financial highlights present fairly, in all material respects, the financial position of the Fund as of June 30, 2021, the results of its operations and its cash flows for the year then ended, the changes in its net assets for each of the years in the two-year period then ended, and the financial highlights for each of the years in the five-year period then ended, in conformity with U.S. generally accepted accounting principles.
Basis for Opinion
These financial statements and financial highlights are the responsibility of the Fund’s management. Our responsibility is to express an opinion on these financial statements and financial highlights based on our audits. We are a public accounting firm registered with the Public Company Accounting Oversight Board (United States) (PCAOB) and are required to be independent with respect to the Fund in accordance with the U.S. federal securities laws and the applicable rules and regulations of the Securities and Exchange Commission and the PCAOB.
We conducted our audits in accordance with the standards of the PCAOB. Those standards require that we plan and perform the audit to obtain reasonable assurance about whether the financial statements and financial highlights are free of material misstatement, whether due to error or fraud. Our audits included performing procedures to assess the risks of material misstatement of the financial statements and financial highlights, whether due to error or fraud, and performing procedures that respond to those risks. Such procedures included examining, on a test basis, evidence regarding the amounts and disclosures in the financial statements and financial highlights. Such procedures also included confirmation of securities owned as of June 30, 2021, by correspondence with custodians and brokers or other appropriate auditing procedures. Our audits also included evaluating the accounting principles used and significant estimates made by management, as well as evaluating the overall presentation of the financial statements and financial highlights. We believe that our audits provide a reasonable basis for our opinion.
/s/ KPMG LLP
We have served as the auditor of one or more Nuveen investment companies since 2014.
Chicago, Illinois
August 26, 2021
13
| | |
| JMM | | Nuveen Multi-Market Income Fund Portfolio of Investments June 30, 2021 |
| | | | | | | | | | | | | | | | | | | | |
| | | | | |
Principal Amount (000) | | | Description (1) | | Coupon | | | Maturity | | | Ratings (2) | | | Value | |
| | | | | |
| | | | LONG-TERM INVESTMENTS – 132.3% (97.6% of Total Investments) | | | | | | | | | | | | | | | | |
| |
| | | | ASSET-BACKED AND MORTGAGE-BACKED SECURITIES – 88.0% (64.9% of Total Investments) | |
| | | | | |
| $ | 191 | | | 321 Henderson Receivables VI LLC, Series 2010-1A, 144A | | | 9.310% | | | | 7/15/61 | | | | Aaa | | | $ | 220,618 | |
| | 250 | | | ACE Securities Corp Manufactured Housing Trust, Series 2003-MH1, 144A | | | 6.500% | | | | 8/15/30 | | | | A+ | | | | 256,926 | |
| | 500 | | | ACRE Commercial Mortgage Series 2021-FL4 Ltd, 144A, (1-Month LIBOR reference rate + 2.600% spread), (3) | | | 2.683% | | | | 12/18/37 | | | | N/R | | | | 496,261 | |
| | 500 | | | Adams Outdoor Advertising LP, Series 2018-1B, 144A | | | 5.653% | | | | 11/15/48 | | | | BBB | | | | 518,475 | |
| | 400 | | | AIMCO CLO Series 2017-AA, 144A, (3-Month LIBOR reference rate + 1.500% spread), (3) | | | 1.688% | | | | 4/20/34 | | | | AA | | | | 400,358 | |
| | 53 | | | Alternative Loan Trust, Series 2003-J3 | | | 5.250% | | | | 11/25/33 | | | | Aaa | | | | 53,615 | |
| | 81 | | | Alternative Loan Trust, Series 2004-J2 | | | 6.500% | | | | 3/25/34 | | | | AA+ | | | | 82,706 | |
| | 1,647 | | | American Homes 4 Rent Trust, Series 2015-SFR2 Trust, (I/O), 144A | | | 0.000% | | | | 10/17/52 | | | | N/R | | | | 16 | |
| | 175 | | | AMSR 2019-SFR1 Trust, 144A | | | 3.247% | | | | 1/19/39 | | | | Baa1 | | | | 181,772 | |
| | 187 | | | Bayview Financial Mortgage Pass-Through Trust, Series 2005-D | | | 5.500% | | | | 12/28/35 | | | | Aa3 | | | | 186,168 | |
| | 26 | | | Bayview Financial Mortgage Pass-Through Trust, Series 2006-C | | | 6.352% | | | | 11/28/36 | | | | Caa3 | | | | 25,406 | |
| | 398 | | | BX Commercial Mortgage Trust 2019-XL, 144A, (1-Month LIBOR reference rate + 1.800% spread), (3) | | | 1.873% | | | | 10/15/36 | | | | N/R | | | | 398,701 | |
| | 500 | | | CARS-DB4 LP, Series 2020-1A, 144A | | | 4.520% | | | | 2/15/50 | | | | BBB | | | | 515,348 | |
| | 954 | | | CF Hippolyta LLC, Series 2020-1 B2, 144A | | | 2.600% | | | | 7/15/60 | | | | A– | | | | 966,662 | |
| | 85 | | | Chase Funding Trust, Series 2003-3 | | | 5.160% | | | | 3/25/33 | | | | BBB | | | | 87,169 | |
| | 500 | | | CHL GMSR Issuer Trust, Series 2018-GT1, 144A, (1-Month LIBOR reference rate + 2.750% spread), (3) | | | 2.842% | | | | 5/25/23 | | | | N/R | | | | 500,929 | |
| | 425 | | | Citigroup Commercial Mortgage Trust 2015-GC29 | | | 4.288% | | | | 4/10/48 | | | | A– | | | | 454,634 | |
| | 600 | | | Citigroup Commercial Mortgage Trust 2016-P5, 144A | | | 3.000% | | | | 10/10/49 | | | | BBB– | | | | 487,263 | |
| | 450 | | | Citigroup Commercial Mortgage Trust 2018-TBR, 144A, (1-Month LIBOR reference rate + 1.800% spread), (3) | | | 1.873% | | | | 12/15/36 | | | | BBB– | | | | 446,334 | |
| | 241 | | | Citigroup Commercial Mortgage Trust 2019-GC41 | | | 3.502% | | | | 8/10/56 | | | | A– | | | | 253,234 | |
| | 83 | | | Citigroup Global Markets Mortgage Securities VII Inc, Series 2003-1, 144A | | | 6.000% | | | | 9/25/33 | | | | CCC | | | | 82,516 | |
| | 500 | | | COMM 2013-LC13 Mortgage Trust, 144A | | | 5.437% | | | | 8/10/46 | | | | BB– | | | | 461,286 | |
| | 775 | | | COMM 2015-CCRE22 Mortgage Trust | | | 4.244% | | | | 3/10/48 | | | | A– | | | | 826,029 | |
| | 450 | | | COMM 2015-CCRE25 Mortgage Trust | | | 4.682% | | | | 8/10/48 | | | | A– | | | | 483,595 | |
| | 500 | | | COMM 2015-CCRE26 Mortgage Trust | | | 4.625% | | | | 10/10/48 | | | | A– | | | | 541,982 | |
| | 108 | | | COMM 2015-LC23 Mortgage Trust | | | 4.771% | | | | 10/10/48 | | | | A– | | | | 116,711 | |
| | 54 | | | Commonbond Student Loan Trust, Series 2017-BGS, 144A | | | 4.440% | | | | 9/25/42 | | | | Aa3 | | | | 56,460 | |
| | 250 | | | CPT MORTGAGE TRUST, Series 2019-CPT, 144A | | | 3.097% | | | | 11/13/39 | | | | N/R | | | | 247,692 | |
| | 325 | | | Credit Suisse First Boston Mortgage Securities Corp, Series 2003-8 | | | 6.173% | | | | 4/25/33 | | | | AAA | | | | 328,800 | |
| | 500 | | | Credit Suisse Mortgage Capital Certificates 2019-ICE4, 144A, (1-Month LIBOR reference rate + 1.600% spread), (3) | | | 1.673% | | | | 5/15/36 | | | | Baa3 | | | | 500,784 | |
| | 137 | | | Credit-Based Asset Servicing and Securitization LLC, Series 2007-SP1, 144A | | | 4.875% | | | | 12/25/37 | | | | Aaa | | | | 138,796 | |
| | 250 | | | CSMC 2014-USA OA LLC, 144A | | | 4.373% | | | | 9/15/37 | | | | B– | | | | 223,851 | |
| | 109 | | | CSMC Mortgage-Backed Trust 2006-7 | | | 6.000% | | | | 8/25/36 | | | | Caa3 | | | | 67,207 | |
| | 1,161 | | | DB Master Finance LLC, Series 2017-1A, 144A | | | 4.030% | | | | 11/20/47 | | | | BBB | | | | 1,236,639 | |
| | 1,146 | | | Domino’s Pizza Master Issuer LLC, Series 2015-1A, 144A | | | 4.474% | | | | 10/25/45 | | | | BBB+ | | | | 1,201,650 | |
| | 601 | | | Driven Brands Funding LLC, Series 2018-1A, 144A | | | 4.739% | | | | 4/20/48 | | | | BBB– | | | | 639,457 | |
| | 1,442 | | | Driven Brands Funding LLC, Series 2019-1A, 144A | | | 4.641% | | | | 4/20/49 | | | | BBB– | | | | 1,552,241 | |
| | 400 | | | Dryden 49 Senior Loan Fund, 144A, (3-Month LIBOR reference rate + 1.600% spread), (3) | | | 1.790% | | | | 7/18/30 | | | | Aa1 | | | | 400,009 | |
| | 2,000 | | | Fannie Mae TBA, (MDR), (WI/DD) | | | 3.000% | | | | TBA | | | | Aaa | | | | 2,083,398 | |
| | 1,500 | | | Fannie Mae TBA, (MDR), (WI/DD) | | | 2.000% | | | | TBA | | | | Aaa | | | | 1,511,602 | |
| | 102 | | | Fannie Mae Mortgage Pool FN 310200 | | | 3.000% | | | | 11/01/48 | | | | N/R | | | | 105,900 | |
| | 11 | | | Fannie Mae Mortgage Pool FN 709700, (4) | | | 5.500% | | | | 6/01/33 | | | | N/R | | | | 12,876 | |
| | 56 | | | Fannie Mae Mortgage Pool FN 745324, (4) | | | 6.000% | | | | 3/01/34 | | | | Aaa | | | | 61,760 | |
| | 27 | | | Fannie Mae Mortgage Pool FN 763687, (4) | | | 6.000% | | | | 1/01/34 | | | | N/R | | | | 30,418 | |
| | 63 | | | Fannie Mae Mortgage Pool FN 766070, (4) | | | 5.500% | | | | 2/01/34 | | | | N/R | | | | 71,376 | |
| | 20 | | | Fannie Mae Mortgage Pool FN 828346, (4) | | | 5.000% | | | | 7/01/35 | | | | N/R | | | | 23,120 | |
| | 11 | | | Fannie Mae Mortgage Pool FN 878059, (4) | | | 5.500% | | | | 3/01/36 | | | | N/R | | | | 12,442 | |
| | 12 | | | Fannie Mae Mortgage Pool FN 882685, (4) | | | 6.000% | | | | 6/01/36 | | | | N/R | | | | 13,799 | |
| | 37 | | | Fannie Mae Mortgage Pool FN 995018, (4) | | | 5.500% | | | | 6/01/38 | | | | N/R | | | | 42,576 | |
| | 543 | | | Fannie Mae Mortgage Pool FN AW4182, (4) | | | 3.500% | | | | 2/01/44 | | | | N/R | | | | 583,116 | |
14
| | | | | | | | | | | | | | | | | | | | |
Principal Amount (000) | | | Description (1) | | Coupon | | | Maturity | | | Ratings (2) | | | Value | |
| | | | | |
| | | | ASSET-BACKED AND MORTGAGE-BACKED SECURITIES (continued) | | | | | | | | | | | | |
| $ | 1,128 | | | Fannie Mae Mortgage Pool FN BM5126, (4) | | | 3.500% | | | | 1/01/48 | | | | N/R | | | $ | 1,222,706 | |
| | 303 | | | Fannie Mae Mortgage Pool FN BM5839, (4) | | | 3.500% | | | | 11/01/47 | | | | Aaa | | | | 328,262 | |
| | 319 | | | Fannie Mae Mortgage Pool FN BM6038, (4) | | | 4.000% | | | | 1/01/45 | | | | Aaa | | | | 347,617 | |
| | 664 | | | Fannie Mae Mortgage Pool FN AS8583, (4) | | | 3.500% | | | | 1/01/47 | | | | Aaa | | | | 704,216 | |
| | 49 | | | Fannie Mae Mortgage Pool FN BH4019, (4) | | | 4.000% | | | | 9/01/47 | | | | N/R | | | | 52,226 | |
| | 935 | | | Fannie Mae Mortgage Pool FN MA3305, (4) | | | 3.500% | | | | 3/01/48 | | | | N/R | | | | 988,230 | |
| | 61 | | | Fannie Mae Mortgage Pool FN MA3332, (4) | | | 3.500% | | | | 4/01/48 | | | | Aaa | | | | 64,443 | |
| | 781 | | | Fannie Mae Mortgage Pool FN MA3333, (4) | | | 4.000% | | | | 4/01/48 | | | | Aaa | | | | 830,469 | |
| | 2,414 | | | Fannie Mae Mortgage Pool FN MA4356, (4) | | | 2.500% | | | | 6/01/51 | | | | N/R | | | | 2,498,914 | |
| | 67 | | | Fannie Mae REMIC Trust 2002-W1 | | | 5.314% | | | | 2/25/42 | | | | Aaa | | | | 74,374 | |
| | 340 | | | Fannie Mae REMIC Trust 2003-W1 | | | 3.056% | | | | 12/25/42 | | | | AAA | | | | 126,873 | |
| | 13 | | | Freddie Mac Gold Pool FG C00676, (4) | | | 6.500% | | | | 11/01/28 | | | | N/R | | | | 14,661 | |
| | 1,491 | | | Freddie Mac Gold Pool FG G08528, (4) | | | 3.000% | | | | 4/01/43 | | | | Aaa | | | | 1,580,401 | |
| | 464 | | | Freddie Mac Gold Pool FG G08566, (4) | | | 3.500% | | | | 1/01/44 | | | | N/R | | | | 499,772 | |
| | 1,168 | | | Freddie Mac Gold Pool FG G08747, (4) | | | 3.000% | | | | 2/01/47 | | | | Aaa | | | | 1,237,335 | |
| | 815 | | | Freddie Mac Gold Pool FG G18497, (4) | | | 3.000% | | | | 1/01/29 | | | | N/R | | | | 862,952 | |
| | 1,003 | | | Freddie Mac Gold Pool FG G60138, (4) | | | 3.500% | | | | 8/01/45 | | | | Aaa | | | | 1,097,458 | |
| | 517 | | | Freddie Mac Gold Pool FG G60238, (4) | | | 3.500% | | | | 10/01/45 | | | | Aaa | | | | 561,288 | |
| | 706 | | | Freddie Mac Gold Pool FG Q40718, (4) | | | 3.500% | | | | 5/01/46 | | | | N/R | | | | 753,343 | |
| | 1,042 | | | Freddie Mac Gold Pool FG Q40841, (4) | | | 3.000% | | | | 6/01/46 | | | | N/R | | | | 1,097,747 | |
| | 1,441 | | | Freddie Mac Pool FR ZT0541, (4) | | | 4.000% | | | | 6/01/48 | | | | N/R | | | | 1,569,238 | |
| | 402 | | | Freddie Mac Pool FR ZT0542, (4) | | | 4.000% | | | | 7/01/48 | | | | N/R | | | | 437,636 | |
| | 600 | | | Freddie Mac STACR Remic Trust 2020-DNA2, 144A, (1-Month LIBOR reference rate + 2.500% spread), (3) | | | 2.592% | | | | 2/25/50 | | | | B | | | | 601,479 | |
| | 300 | | | Freddie Mac STACR Remic Trust 2021-HQA1, 144A, (SOFR30A reference rate + 2.250% spread), (3) | | | 2.268% | | | | 8/25/33 | | | | Ba1 | | | | 303,943 | |
| | 500 | | | FREMF 2017-K724 Mortgage Trust, 144A | | | 3.598% | | | | 12/25/49 | | | | BBB– | | | | 521,733 | |
| | 119 | | | Ginnie Mae I Pool GN 604567, (4) | | | 5.500% | | | | 8/15/33 | | | | N/R | | | | 138,760 | |
| | 69 | | | Ginnie Mae I Pool GN 631574, (4) | | | 6.000% | | | | 7/15/34 | | | | N/R | | | | 79,531 | |
| | 500 | | | GS Mortgage Securities Corp Trust, Series 2018-TWR, 144A, (1-Month LIBOR reference rate + 0.900% spread), (3) | | | 0.973% | | | | 7/15/31 | | | | AAA | | | | 498,733 | |
| | 62 | | | GSMPS Mortgage Loan Trust, Series 2001-2, 144A | | | 7.500% | | | | 6/19/32 | | | | N/R | | | | 61,622 | |
| | 370 | | | GSMPS Mortgage Loan Trust, Series 2003-3, 144A | | | 7.000% | | | | 6/25/43 | | | | N/R | | | | 417,359 | |
| | 343 | | | GSMPS Mortgage Loan Trust, Series 2005-RP1, 144A | | | 8.500% | | | | 1/25/35 | | | | B2 | | | | 391,298 | |
| | 462 | | | GSMPS Mortgage Loan Trust, Series 2005-RP2, 144A | | | 7.500% | | | | 3/25/35 | | | | AAA | | | | 478,373 | |
| | 436 | | | GSMPS Mortgage Loan Trust, Series 2005-RP3, 144A | | | 7.500% | | | | 9/25/35 | | | | AAA | | | | 454,273 | |
| | 293 | | | GSMPS Mortgage Loan Trust, Series 2005-RP3, 144A | | | 8.000% | | | | 9/25/35 | | | | Caa1 | | | | 313,080 | |
| | 497 | | | Hardee’s Funding LLC, Series 2020-1A A2, 144A | | | 3.981% | | | | 12/20/50 | | | | BBB | | | | 526,464 | |
| | 478 | | | Horizon Aircraft Finance II Ltd, Series 2019-1, 144A | | | 4.703% | | | | 7/15/39 | | | | BBB | | | | 449,086 | |
| | 244 | | | Horizon Aircraft Finance III Ltd, Series 2019-2, 144A | | | 4.458% | | | | 11/15/39 | | | | BBB | | | | 236,661 | |
| | 500 | | | Hudson Yards, Trust, Series 2019-55HY, 144A | | | 3.041% | | | | 12/10/41 | | | | A3 | | | | 519,794 | |
| | 205 | | | Impac Secured Assets CMN Owner Trust, Series 2000-3 | | | 8.000% | | | | 10/25/30 | | | | N/R | | | | 201,103 | |
| | 476 | | | JG Wentworth XXXVII LLC, Series 2016-1A, 144A | | | 5.190% | | | | 6/17/69 | | | | Baa2 | | | | 523,318 | |
| | 778 | | | JGWPT XXV LLC, Series 2012-1A, 144A | | | 7.140% | | | | 2/15/67 | | | | Aa3 | | | | 973,712 | |
| | 335 | | | JGWPT XXVI LLC, Series 2012-2A, 144A | | | 6.770% | | | | 10/17/61 | | | | A1 | | | | 409,167 | |
| | 224 | | | JP Morgan Alternative Loan Trust, Series 2006-S1 | | | 6.500% | | | | 3/25/36 | | | | N/R | | | | 180,044 | |
| | 430 | | | JP Morgan Chase Commercial Mortgage Securities Trust, Series 2018-AON, 144A | | | 4.767% | | | | 7/05/31 | | | | BBB– | | | | 449,282 | |
| | 500 | | | JP Morgan Chase Commercial Mortgage Securities Trust, Series 2016-JP4, 144A | | | 3.555% | | | | 12/15/49 | | | | BBB– | | | | 430,107 | |
| | 500 | | | JP Morgan Chase Commercial Mortgage Securities Trust, Series 2018-BCON, 144A | | | 3.881% | | | | 1/05/31 | | | | BBB– | | | | 502,433 | |
| | 500 | | | JPMDB Commercial Mortgage Securities Trust, Series 2017-C7, 144A | | | 3.000% | | | | 10/15/50 | | | | BBB– | | | | 470,155 | |
| | 400 | | | Manhattan West, Series 2020-1MW, 144A | | | 2.413% | | | | 9/10/39 | | | | Baa3 | | | | 396,867 | |
| | 267 | | | MASTR Alternative Loan Trust, Series 2004-1 | | | 7.000% | | | | 1/25/34 | | | | Aaa | | | | 286,474 | |
| | 174 | | | MASTR Alternative Loan Trust, Series 2004-5 | | | 7.000% | | | | 6/25/34 | | | | AA+ | | | | 180,312 | |
| | 162 | | | MASTR Asset Securitization Trust, Series 2003-11 | | | 5.250% | | | | 12/25/33 | | | | A | | | | 164,713 | |
| | 261 | | | MASTR Reperforming Loan Trust, Series 2005-1, 144A | | | 7.500% | | | | 8/25/34 | | | | N/R | | | | 237,221 | |
| | 536 | | | Mid-State Capital Corp 2004-1 Trust | | | 6.005% | | | | 8/15/37 | | | | AA+ | | | | 564,817 | |
| | 37 | | | Mid-State Capital Corp 2004-1 Trust | | | 8.900% | | | | 8/15/37 | | | | A1 | | | | 39,875 | |
| | 556 | | | Mid-State Capital Corp 2005-1 Trust | | | 5.745% | | | | 1/15/40 | | | | AA | | | | 593,098 | |
| | 138 | | | Mid-State Capital Trust, Series 2010-1, 144A | | | 5.250% | | | | 12/15/45 | | | | AAA | | | | 141,218 | |
| | 118 | | | Mid-State Capital Trust, Series 2010-1, 144A | | | 7.000% | | | | 12/15/45 | | | | AAA | | | | 121,720 | |
| | 174 | | | Mid-State Trust XI | | | 5.598% | | | | 7/15/38 | | | | Baa2 | | | | 184,168 | |
| | 230 | | | Morgan Stanley Bank of America Merrill Lynch Trust, Series 2014-C14 | | | 5.028% | | | | 2/15/47 | | | | Aa3 | | | | 248,356 | |
| | 500 | | | Morgan Stanley Bank of America Merrill Lynch Trust, Series 2016-C28 | | | 4.781% | | | | 1/15/49 | | | | A3 | | | | 519,868 | |
15
| | |
| |
| JMM | | Nuveen Multi-Market Income Fund (continued) |
| | Portfolio of Investments June 30, 2021 |
| | | | | | | | | | | | | | | | | | | | |
Principal Amount (000) | | | Description (1) | | Coupon | | | Maturity | | | Ratings (2) | | | Value | |
| | | | | |
| | | | ASSET-BACKED AND MORTGAGE-BACKED SECURITIES (continued) | | | | | | | | | | | | |
| $ | 47 | | | Morgan Stanley Mortgage Loan Trust, Series 2006-2 | | | 5.750% | | | | 2/25/36 | | | | N/R | | | $ | 45,963 | |
| | 500 | | | MSCG Trust 2015-ALDR, 144A | | | 3.577% | | | | 6/07/35 | | | | BBB– | | | | 406,149 | |
| | 253 | | | MVW Owner Trust, Series 2017-1, 144A | | | 2.420% | | | | 12/20/34 | | | | AAA | | | | 258,456 | |
| | 1,000 | | | Natixis Commercial Mortgage Securities Trust, Series 2019-MILE, 144A, (1-Month LIBOR reference rate + 2.750% spread), (3) | | | 2.823% | | | | 7/15/36 | | | | N/R | | | | 999,699 | |
| | 400 | | | Neuberger Berman Loan Advisers CLO 31 Ltd, 144A, (3-Month LIBOR reference rate + 1.550% spread), (3) | | | 0.000% | | | | 4/20/31 | | | | AA | | | | 399,522 | |
| | 160 | | | New Residential Mortgage LLC, Series 2018-FNT2, 144A | | | 4.920% | | | | 7/25/54 | | | | N/R | | | | 159,826 | |
| | 381 | | | New Residential Mortgage Loan Trust, Series 2014-1, 144A | | | 6.078% | | | | 1/25/54 | | | | BBB | | | | 413,042 | |
| | 687 | | | New Residential Mortgage Loan Trust, Series 2015-2, 144A | | | 5.490% | | | | 8/25/55 | | | | Baa1 | | | | 728,776 | |
| | 134 | | | NRZ Excess Spread-Collateralized Notes, Series 2018-FNT1 144A | | | 4.690% | | | | 5/25/23 | | | | N/R | | | | 134,333 | |
| | 486 | | | Planet Fitness Master Issuer LLC, Series 2018-1A, 144A | | | 4.666% | | | | 9/05/48 | | | | BBB– | | | | 507,237 | |
| | 500 | | | PNMAC FMSR ISSUER TRUST, Series 2018-FT1, 144A, (1-Month LIBOR reference rate + 2.350% spread), (3) | | | 2.442% | | | | 4/25/23 | | | | N/R | | | | 497,745 | |
| | 500 | | | PNMAC GMSR ISSUER TRUST, Series 2018-GT1, 144A, (1-Month LIBOR reference rate + 2.850% spread), (3) | | | 2.942% | | | | 2/25/23 | | | | N/R | | | | 500,930 | |
| | 500 | | | PNMAC GMSR ISSUER TRUST, Series 2018-GT2, 144A, (1-Month LIBOR reference rate + 2.650% spread), (3) | | | 2.742% | | | | 8/25/25 | | | | N/R | | | | 499,233 | |
| | 485 | | | RBS Commercial Funding Inc 2013-SMV Trust, 144A | | | 3.704% | | | | 3/11/31 | | | | BBB– | | | | 477,734 | |
| | 500 | | | SERVPRO Master Issuer LLC, Series 2021-1A, 144A | | | 2.394% | | | | 4/25/51 | | | | BBB– | | | | 504,520 | |
| | 275 | | | Sesac Finance LLC, Series 2019-1,144A | | | 5.216% | | | | 7/25/49 | | | | N/R | | | | 293,526 | |
| | 271 | | | Sierra Timeshare 2019-3 Receivables Funding LLC, 144A | | | 4.180% | | | | 8/20/36 | | | | BB | | | | 275,524 | |
| | 135 | | | SLG Office Trust, Series 2021-OVA, 144A | | | 2.851% | | | | 7/15/41 | | | | BBB– | | | | 136,191 | |
| | 487 | | | Sonic Capital LLC, Series 2018-1A, 144A | | | 4.026% | | | | 2/20/48 | | | | BBB | | | | 498,627 | |
| | 381 | | | Sonic Capital LLC, Series 2020-1A, 144A | | | 3.845% | | | | 1/20/50 | | | | BBB | | | | 402,114 | |
| | 500 | | | Stack Infrastructure Issuer LLC, Series 2020-1A A2, 144A | | | 1.893% | | | | 8/25/45 | | | | A– | | | | 502,344 | |
| | 750 | | | STACR Trust, Series 2018-HRP2, 144A, (1-Month LIBOR reference rate + 2.400% spread), (3) | | | 2.492% | | | | 2/25/47 | | | | BBB– | | | | 763,836 | |
| | 324 | | | START Ireland, Series 2019-1, 144A | | | 5.095% | | | | 3/15/44 | | | | BB | | | | 304,144 | |
| | 341 | | | Start Ltd/Bermuda, Series 2018-1, 144A | | | 4.089% | | | | 5/15/43 | | | | BBB+ | | | | 342,944 | |
| | 164 | | | Structured Receivables Finance, Series 2010-A LLC, 144A | | | 5.218% | | | | 1/16/46 | | | | AAA | | | | 175,098 | |
| | 480 | | | Taco Bell Funding LLC, Series 2016-1A, 144A | | | 4.377% | | | | 5/25/46 | | | | BBB | | | | 482,650 | |
| | 600 | | | Taco Bell Funding LLC, Series 2016-1A, 144A | | | 4.970% | | | | 5/25/46 | | | | BBB | | | | 647,892 | |
| | 250 | | | VNDO Mortgage Trust, Series 2016-350P, 144A | | | 4.033% | | | | 1/10/35 | | | | AA– | | | | 271,687 | |
| | 13 | | | Washington Mutual MSC Mortgage Pass-Through Certificates Series 2004-RA3 Trust | | | 5.936% | | | | 8/25/38 | | | | Aaa | | | | 13,248 | |
| | 195 | | | Wells Fargo Commercial Mortgage Trust, Series 2016-C33 | | | 3.896% | | | | 3/15/59 | | | | A– | | | | 205,317 | |
| | 472 | | | Wendy’s Funding LLC, Series 2019-1A, 144A | | | 3.783% | | | | 6/15/49 | | | | BBB | | | | 504,162 | |
| | 580 | | | Wendy’s Funding LLC, Series 2021-1A, 144A | | | 2.370% | | | | 6/15/51 | | | | BBB | | | | 585,040 | |
| | 997 | | | Wingstop Funding LLC, Series 2020-1A A2, 144A | | | 2.841% | | | | 12/05/50 | | | | N/R | | | | 1,034,517 | |
| | 220 | | | Zaxby’s Funding LLC, Series 2021-1A A2, 144A | | | 3.238% | | | | 7/30/51 | | | | N/R | | | | 222,746 | |
| $ | 64,701 | | | Asset-Backed and Mortgage-Backed Securities (cost $63,626,626) | | | | | | | | | | | | | | | 65,145,833 | |
| | | | | |
Principal Amount (000) | | | Description (1) | | Coupon | | | Maturity | | | Ratings (2) | | | Value | |
| | | | | |
| | | | CORPORATE BONDS – 38.3% (28.3% of Total Investments) | | | | | | | | | | | | | | | | |
| | | | | |
| | | | Aerospace & Defense – 1.0% | | | | | | | | | | | | | | | | |
| | | | | |
| $ | 350 | | | Boeing Co/The | | | 3.250% | | | | 2/01/28 | | | | Baa2 | | | $ | 371,031 | |
| | 100 | | | Howmet Aerospace Inc | | | 6.875% | | | | 5/01/25 | | | | BBB– | | | | 116,398 | |
| | 200 | | | Rolls-Royce PLC, 144A | | | 5.750% | | | | 10/15/27 | | | | BB– | | | | 220,298 | |
| | 650 | | | Total Aerospace & Defense | | | | | | | | | | | | | | | 707,727 | |
| | | | | |
| | | | Air Freight & Logistics – 0.1% | | | | | | | | | | | | |
| | | | | |
| | 100 | | | Cargo Aircraft Management Inc, 144A | | | 4.750% | | | | 2/01/28 | | | | BB | | | | 101,983 | |
| | | | | |
| | | | Airlines – 0.2% | | | | | | | | | | | | |
| | | | | |
| | 100 | | | Delta Air Lines Inc, 144A | | | 7.000% | | | | 5/01/25 | | | | Baa2 | | | | 116,699 | |
| | | | | |
| | | | Auto Components – 1.1% | | | | | | | | | | | | |
| | | | | |
| | 250 | | | Adient Global Holdings Ltd, 144A | | | 4.875% | | | | 8/15/26 | | | | B | | | | 257,307 | |
| | 100 | | | Adient US LLC, 144A | | | 9.000% | | | | 4/15/25 | | | | BB– | | | | 110,125 | |
16
| | | | | | | | | | | | | | | | | | | | |
Principal Amount (000) | | | Description (1) | | Coupon | | | Maturity | | | Ratings (2) | | | Value | |
| | | | | |
| | | | Auto Components (continued) | | | | | | | | | | | | |
| $ | 250 | | | Dana Inc, (4) | | | 5.375% | | | | 11/15/27 | | | | BB+ | | | $ | 266,250 | |
| | 50 | | | Dana Inc | | | 4.250% | | | | 9/01/30 | | | | BB+ | | | | 51,438 | |
| | 100 | | | Goodyear Tire & Rubber Co | | | 5.250% | | | | 4/30/31 | | | | BB– | | | | 104,375 | |
| | 750 | | | Total Auto Components | | | | | | | | | | | | | | | 789,495 | |
| | | | | |
| | | | Automobiles – 1.0% | | | | | | | | | | | | |
| | | | | |
| | 125 | | | Ford Motor Co | | | 8.500% | | | | 4/21/23 | | | | BB+ | | | | 139,494 | |
| | 200 | | | Ford Motor Credit Co LLC | | | 3.625% | | | | 6/17/31 | | | | BB+ | | | | 203,876 | |
| | 400 | | | General Motors Financial Co Inc, (4) | | | 3.600% | | | | 6/21/30 | | | | BBB | | | | 433,100 | |
| | 725 | | | Total Automobiles | | | | | | | | | | | | | | | 776,470 | |
| | | | | |
| | | | Banks – 4.0% | | | | | | | | | | | | |
| | | | | |
| | 400 | | | Banco Santander SA | | | 2.749% | | | | 12/03/30 | | | | BBB+ | | | | 396,247 | |
| | 1,100 | | | Bank of America Corp | | | 1.898% | | | | 7/23/31 | | | | AA– | | | | 1,069,473 | |
| | 250 | | | Caelus Re VI Ltd, 144A, (3-Month U.S. Treasury Bill reference rate + 5.500% spread), (3) | | | 5.541% | | | | 6/07/23 | | | | N/R | | | | 255,850 | |
| | 500 | | | JPMorgan Chase & Co | | | 2.580% | | | | 4/22/32 | | | | AA– | | | | 513,170 | |
| | 300 | | | Truist Financial Corp | | | 4.800% | | | | 3/01/70 | | | | Baa2 | | | | 315,000 | |
| | 400 | | | Wells Fargo & Co | | | 3.900% | | | | N/A (8) | | | | Baa2 | | | | 414,120 | |
| | 2,950 | | | Total Banks | | | | | | | | | | | | | | | 2,963,860 | |
| | | | | |
| | | | Beverages – 0.2% | | | | | | | | | | | | |
| | | | | |
| | 75 | | | Primo Water Holdings Inc, 144A | | | 4.375% | | | | 4/30/29 | | | | B1 | | | | 75,000 | |
| | 50 | | | Triton Water Holdings Inc, 144A | | | 6.250% | | | | 4/01/29 | | | | CCC+ | | | | 50,125 | |
| | 125 | | | Total Beverages | | | | | | | | | | | | | | | 125,125 | |
| | | | | |
| | | | Capital Markets – 1.7% | | | | | | | | | | | | |
| | | | | |
| | 300 | | | Bank of New York Mellon Corp/The | | | 4.700% | | | | N/A (8) | | | | Baa1 | | | | 327,375 | |
| | 250 | | | Charles Schwab Corp/The | | | 4.000% | | | | 6/01/70 | | | | BBB | | | | 260,625 | |
| | 75 | | | Compass Group Diversified Holdings LLC, 144A | | | 5.250% | | | | 4/15/29 | | | | B+ | | | | 78,000 | |
| | 500 | | | Goldman Sachs Group Inc/The, (4) | | | 1.992% | | | | 1/27/32 | | | | A2 | | | | 485,597 | |
| | 100 | | | LPL Holdings Inc, 144A | | | 4.625% | | | | 11/15/27 | | | | BB | | | | 103,625 | |
| | 1,225 | | | Total Capital Markets | | | | | | | | | | | | | | | 1,255,222 | |
| | | | | |
| | | | Chemicals – 1.8% | | | | | | | | | | | | |
| | | | | |
| | 250 | | | Calumet Specialty Products Partners LP / Calumet Finance Corp, 144A | | | 11.000% | | | | 4/15/25 | | | | B– | | | | 271,875 | |
| | 375 | | | NOVA Chemicals Corp, 144A | | | 5.000% | | | | 5/01/25 | | | | BB– | | | | 401,250 | |
| | 179 | | | OCI NV, 144A | | | 4.625% | | | | 10/15/25 | | | | BB | | | | 186,664 | |
| | 50 | | | Rayonier AM Products Inc, 144A | | | 7.625% | | | | 1/15/26 | | | | B1 | | | | 52,125 | |
| | 175 | | | Tronox Inc, 144A | | | 6.500% | | | | 5/01/25 | | | | Ba3 | | | | 185,201 | |
| | 150 | | | Tronox Inc, 144A | | | 4.625% | | | | 3/15/29 | | | | B | | | | 151,497 | |
| | 100 | | | Univar Solutions USA Inc/Washington, 144A | | | 5.125% | | | | 12/01/27 | | | | BB+ | | | | 105,125 | |
| | 1,279 | | | Total Chemicals | | | | | | | | | | | | | | | 1,353,737 | |
| | | | | |
| | | | Commercial Services & Supplies – 0.6% | | | | | | | | | | | | |
| | | | | |
| | 100 | | | GFL Environmental Inc, 144A | | | 4.250% | | | | 6/01/25 | | | | BB– | | | | 104,154 | |
| | 150 | | | GFL Environmental Inc, 144A | | | 3.500% | | | | 9/01/28 | | | | BB– | | | | 149,625 | |
| | 200 | | | Prime Security Services Borrower LLC / Prime Finance Inc, 144A | | | 5.750% | | | | 4/15/26 | | | | BB– | | | | 220,934 | |
| | 450 | | | Total Commercial Services & Supplies | | | | | | | | | | | | | | | 474,713 | |
| | | | | |
| | | | Communications Equipment – 1.1% | | | | | | | | | | | | |
| | | | | |
| | 325 | | | Gray Television Inc, 144A, (4) | | | 4.750% | | | | 10/15/30 | | | | BB– | | | | 323,872 | |
| | 500 | | | T-Mobile USA Inc, (4) | | | 2.250% | | | | 11/15/31 | | | | BBB– | | | | 493,235 | |
| | 825 | | | Total Communications Equipment | | | | | | | | | | | | | | | 817,107 | |
| | | | | |
| | | | Consumer Finance – 0.6% | | | | | | | | | | | | |
| | | | | |
| | 200 | | | Curo Group Holdings Corp, 144A | | | 8.250% | | | | 9/01/25 | | | | B– | | | | 207,000 | |
| | 250 | | | Navient Corp | | | 6.125% | | | | 3/25/24 | | | | Ba3 | | | | 269,815 | |
| | 450 | | | Total Consumer Finance | | | | | | | | | | | | | | | 476,815 | |
17
| | |
| |
| JMM | | Nuveen Multi-Market Income Fund (continued) |
| | Portfolio of Investments June 30, 2021 |
| | | | | | | | | | | | | | | | | | | | |
Principal Amount (000) | | | Description (1) | | Coupon | | | Maturity | | | Ratings (2) | | | Value | |
| | | | | |
| | | | Containers & Packaging – 0.5% | | | | | | | | | | | | |
| | | | | |
| $ | 200 | | | Ardagh Metal Packaging Finance USA LLC / Ardagh Metal Packaging Finance PLC, 144A | | | 3.250% | | | | 9/01/28 | | | | BB+ | | | $ | 199,421 | |
| | 75 | | | Ball Corp | | | 2.875% | | | | 8/15/30 | | | | BB+ | | | | 73,621 | |
| | 100 | | | Silgan Holdings Inc | | | 4.125% | | | | 2/01/28 | | | | BB | | | | 103,750 | |
| | 375 | | | Total Containers & Packaging | | | | | | | | | | | | | | | 376,792 | |
| | | | | |
| | | | Distributors – 0.1% | | | | | | | | | | | | |
| | | | | |
| | 100 | | | H&E Equipment Services Inc, 144A | | | 3.875% | | | | 12/15/28 | | | | BB– | | | | 98,400 | |
| | | | | |
| | | | Diversified Financial Services – 2.5% | | | | | | | | | | | | |
| | | | | |
| | 250 | | | GE Capital International Funding Co Unlimited Co | | | 3.373% | | | | 11/15/25 | | | | BBB+ | | | | 272,782 | |
| | 500 | | | GE Capital International Funding Co Unlimited Co, (4) | | | 4.418% | | | | 11/15/35 | | | | BBB+ | | | | 599,241 | |
| | 300 | | | Jefferies Finance LLC / JFIN Co-Issuer Corp, 144A, (4) | | | 6.250% | | | | 6/03/26 | | | | BB | | | | 313,500 | |
| | 170 | | | OneMain Finance Corp | | | 3.500% | | | | 1/15/27 | | | | BB– | | | | 171,275 | |
| | 250 | | | Putnam RE PTE Ltd, 144A, (1-Month U.S. Treasury Bill reference rate + 5.500% spread), (3) | | | 5.541% | | | | 6/07/24 | | | | N/R | | | | 249,525 | |
| | 225 | | | Quicken Loans LLC, 144A | | | 5.250% | | | | 1/15/28 | | | | BB+ | | | | 236,250 | |
| | 1,695 | | | Total Diversified Financial Services | | | | | | | | | | | | | | | 1,842,573 | |
| | | | | |
| | | | Diversified Telecommunication Services – 2.2% | | | | | | | | | | | | |
| | | | | |
| | 200 | | | Altice France SA/France, 144A | | | 5.125% | | | | 7/15/29 | | | | B | | | | 200,980 | |
| | 300 | | | AT&T Inc, (4) | | | 4.300% | | | | 2/15/30 | | | | BBB+ | | | | 346,748 | |
| | 600 | | | AT&T Inc, (4) | | | 2.750% | | | | 6/01/31 | | | | BBB+ | | | | 623,693 | |
| | 100 | | | Avaya Inc, 144A | | | 6.125% | | | | 9/15/28 | | | | BB– | | | | 107,030 | |
| | 200 | | | Vmed O2 UK Financing I PLC, 144A (WI/DD) | | | 4.750% | | | | 7/15/31 | | | | BB– | | | | 203,000 | |
| | 175 | | | Zayo Group Holdings Inc, 144A | | | 4.000% | | | | 3/01/27 | | | | B1 | | | | 173,796 | |
| | 1,575 | | | Total Diversified Telecommunication Services | | | | | | | | | | | | | | | 1,655,247 | |
| | | | |
| | | | Electronic Equipment, Instruments & Components – 0.3% | | | | | | | | | | |
| | | | | |
| | 200 | | | Imola Merger Corp, 144A | | | 4.750% | | | | 5/15/29 | | | | BB | | | | 205,750 | |
| | | | | |
| | | | Energy Equipment & Services – 0.4% | | | | | | | | | | | | |
| | | | | |
| | 250 | | | Archrock Partners LP / Archrock Partners Finance Corp, 144A | | | 6.875% | | | | 4/01/27 | | | | B+ | | | | 265,312 | |
| | | | | |
| | | | Entertainment – 0.1% | | | | | | | | | | | | |
| | | | | |
| | 100 | | | Cinemark USA Inc, 144A | | | 8.750% | | | | 5/01/25 | | | | BB+ | | | | 109,500 | |
| | | | | |
| | | | Equity Real Estate Investment Trust – 4.4% | | | | | | | | | | | | |
| | | | | |
| | 650 | | | Brixmor Operating Partnership LP, (4) | | | 4.050% | | | | 7/01/30 | | | | BBB– | | | | 727,258 | |
| | 500 | | | GLP Capital LP / GLP Financing II Inc, (4) | | | 4.000% | | | | 1/15/30 | | | | BBB– | | | | 536,655 | |
| | 150 | | | GLP Capital LP / GLP Financing II Inc | | | 4.000% | | | | 1/15/31 | | | | BBB– | | | | 161,622 | |
| | 250 | | | HAT Holdings I LLC / HAT Holdings II LLC, 144A | | | 3.375% | | | | 6/15/26 | | | | BB+ | | | | 251,875 | |
| | 250 | | | Iron Mountain Inc, 144A | | | 5.250% | | | | 3/15/28 | | | | BB– | | | | 261,637 | |
| | 75 | | | Iron Mountain Inc, 144A | | | 4.500% | | | | 2/15/31 | | | | BB– | | | | 75,937 | |
| | 150 | | | MPH Acquisition Holdings LLC, 144A | | | 5.750% | | | | 11/01/28 | | | | B– | | | | 150,736 | |
| | 325 | | | MPT Operating Partnership LP / MPT Finance Corp, (4) | | | 3.500% | | | | 3/15/31 | | | | BBB– | | | | 328,247 | |
| | 500 | | | Regency Centers LP, (4) | | | 2.950% | | | | 9/15/29 | | | | BBB+ | | | | 526,533 | |
| | 250 | | | SITE Centers Corp, (4) | | | 4.250% | | | | 2/01/26 | | | | BBB | | | | 270,708 | |
| | 3,100 | | | Total Equity Real Estate Investment Trust | | | | | | | | | | | | | | | 3,291,208 | |
| | | | | |
| | | | Food & Staples Retailing – 0.3% | | | | | | | | | | | | |
| | | | | |
| | 250 | | | Chobani LLC / Chobani Finance Corp Inc, 144A | | | 4.625% | | | | 11/15/28 | | | | B1 | | | | 259,063 | |
| |
| | | | Gas Utilities – 0.3% | |
| | | | | |
| | 200 | | | Suburban Propane Partners LP/Suburban Energy Finance Corp | | | 5.875% | | | | 3/01/27 | | | | BB– | | | | 209,981 | |
| |
| | | | Health Care Providers & Services – 0.8% | |
| | | | | |
| | 100 | | | Centene Corp | | | 4.250% | | | | 12/15/27 | | | | BBB– | | | | 105,375 | |
| | 35 | | | Centene Corp | | | 2.450% | | | | 7/15/28 | | | | BBB– | | | | 35,472 | |
| | 100 | | | Centene Corp | | | 4.625% | | | | 12/15/29 | | | | BBB– | | | | 109,977 | |
| | 50 | | | CHS/Community Health Systems Inc, 144A | | | 5.625% | | | | 3/15/27 | | | | B | | | | 53,375 | |
| | 50 | | | CHS/Community Health Systems Inc, 144A | | | 6.000% | | | | 1/15/29 | | | | B | | | | 53,500 | |
| | 100 | | | DaVita Inc, 144A | | | 4.625% | | | | 6/01/30 | | | | Ba3 | | | | 102,822 | |
18
| | | | | | | | | | | | | | | | | | | | |
Principal Amount (000) | | | Description (1) | | Coupon | | | Maturity | | | Ratings (2) | | | Value | |
| |
| | | | Health Care Providers & Services (continued) | |
| $ | 100 | | | Molina Healthcare Inc, 144A | | | 4.375% | | | | 6/15/28 | | | | BB– | | | $ | 104,250 | |
| | 50 | | | Tenet Healthcare Corp, 144A | | | 4.625% | | | | 6/15/28 | | | | B+ | | | | 51,460 | |
| | 585 | | | Total Health Care Providers & Services | | | | | | | | | | | | | | | 616,231 | |
| | | | | |
| | | | Hotels, Restaurants & Leisure – 0.7% | | | | | | | | | | | | |
| | | | | |
| | 100 | | | Cedar Fair LP / Canada’s Wonderland Co / Magnum Management Corp / Millennium Op, 144A | | | 5.500% | | | | 5/01/25 | | | | Ba2 | | | | 104,375 | |
| | 50 | | | International Game Technology PLC, 144A | | | 4.125% | | | | 4/15/26 | | | | BB | | | | 52,063 | |
| | 55 | | | Marriott Ownership Resorts Inc, 144A | | | 4.500% | | | | 6/15/29 | | | | B1 | | | | 55,756 | |
| | 50 | | | MGM Growth Properties Operating Partnership LP / MGP Finance Co-Issuer Inc, 144A | | | 4.625% | | | | 6/15/25 | | | | BB+ | | | | 53,418 | |
| | 250 | | | Scientific Games International Inc, 144A | | | 8.625% | | | | 7/01/25 | | | | B– | | | | 273,750 | |
| | 505 | | | Total Hotels, Restaurants & Leisure | | | | | | | | | | | | | | | 539,362 | |
| | | | | |
| | | | Household Durables – 0.5% | | | | | | | | | | | | |
| | | | | |
| | 50 | | | Kronos Acquisition Holdings Inc / KIK Custom Products Inc, 144A | | | 5.000% | | | | 12/31/26 | | | | B2 | | | | 50,750 | |
| | 250 | | | M/I Homes Inc | | | 5.625% | | | | 8/01/25 | | | | BB | | | | 257,500 | |
| | 50 | | | WASH Multifamily Acquisition Inc, 144A | | | 5.750% | | | | 4/15/26 | | | | B– | | | | 52,205 | |
| | 350 | | | Total Household Durables | | | | | | | | | | | | | | | 360,455 | |
| | | |
| | | | Independent Power & Renewable Electricity Producers – 0.3% | | | | | | | |
| | | | | |
| | 200 | | | Calpine Corp, 144A | | | 3.750% | | | | 3/01/31 | | | | BB+ | | | | 190,470 | |
| |
| | | | Interactive Media & Services – 0.1% | |
| | | | | |
| | 50 | | | Arches Buyer Inc, 144A | | | 4.250% | | | | 6/01/28 | | | | B1 | | | | 49,438 | |
| |
| | | | Internet Software & Services – 0.2% | |
| | | | | |
| | 175 | | | J2 Global Inc, 144A | | | 4.625% | | | | 10/15/30 | | | | BB | | | | 181,178 | |
| |
| | | | IT Services – 0.1% | |
| | | | | |
| | 50 | | | Booz Allen Hamilton Inc, 144A | | | 3.875% | | | | 9/01/28 | | | | Ba2 | | | | 51,000 | |
| | 45 | | | Booz Allen Hamilton Inc, 144A | | | 4.000% | | | | 7/01/29 | | | | Ba2 | | | | 46,013 | |
| | 95 | | | Total IT Services | | | | | | | | | | | | | | | 97,013 | |
| | | | | |
| | | | Life Sciences Tools & Services – 0.1% | | | | | | | | | | | | |
| | | | | |
| | 75 | | | Avantor Funding Inc, 144A | | | 4.625% | | | | 7/15/28 | | | | BB | | | | 79,183 | |
| |
| | | | Media – 1.3% | |
| | | | | |
| | 300 | | | Altice France SA/France, 144A, (4) | | | 7.375% | | | | 5/01/26 | | | | B | | | | 311,979 | |
| | 200 | | | DISH DBS Corp | | | 5.875% | | | | 11/15/24 | | | | B2 | | | | 214,750 | |
| | 200 | | | LCPR Senior Secured Financing DAC, 144A | | | 5.125% | | | | 7/15/29 | | | | BB+ | | | | 206,750 | |
| | 135 | | | Sirius XM Radio Inc, 144A | | | 4.000% | | | | 7/15/28 | | | | BB | | | | 139,050 | |
| | 75 | | | Univision Communications Inc, 144A | | | 4.500% | | | | 5/01/29 | | | | B1 | | | | 75,562 | |
| | 910 | | | Total Media | | | | | | | | | | | | | | | 948,091 | |
| | | | | |
| | | | Metals & Mining – 0.6% | | | | | | | | | | | | |
| | | | | |
| | 250 | | | Constellium SE, 144A | | | 3.750% | | | | 4/15/29 | | | | B | | | | 247,500 | |
| | 150 | | | Freeport-McMoRan Inc | | | 3.875% | | | | 3/15/23 | | | | BB+ | | | | 156,399 | |
| | 66 | | | Joseph T Ryerson & Son Inc, 144A | | | 8.500% | | | | 8/01/28 | | | | B | | | | 73,260 | |
| | 466 | | | Total Metals & Mining | | | | | | | | | | | | | | | 477,159 | |
| | | | | |
| | | | Mortgage Real Estate Investment Trust – 0.2% | | | | | | | | | | | | |
| | | | | |
| | 125 | | | HAT Holdings I LLC / HAT Holdings II LLC, 144A | | | 6.000% | | | | 4/15/25 | | | | BB+ | | | | 131,764 | |
| |
| | | | Oil, Gas & Consumable Fuels – 3.3% | |
| | | | | |
| | 35 | | | DT Midstream Inc, 144A | | | 4.125% | | | | 6/15/29 | | | | BB+ | | | | 35,537 | |
| | 30 | | | DT Midstream Inc, 144A | | | 4.375% | | | | 6/15/31 | | | | BB+ | | | | 30,654 | |
| | 250 | | | Enable Midstream Partners LP, (4) | | | 4.400% | | | | 3/15/27 | | | | BBB– | | | | 275,619 | |
| | 100 | | | EnLink Midstream LLC | | | 5.375% | | | | 6/01/29 | | | | BB+ | | | | 104,362 | |
| | 50 | | | EQT Corp, 144A | | | 3.125% | | | | 5/15/26 | | | | BB+ | | | | 51,235 | |
| | 500 | | | MPLX LP, (4) | | | 4.800% | | | | 2/15/29 | | | | BBB | | | | 586,729 | |
| | 100 | | | NuStar Logistics LP | | | 5.750% | | | | 10/01/25 | | | | BB– | | | | 108,750 | |
19
| | |
| |
| JMM | | Nuveen Multi-Market Income Fund (continued) |
| | Portfolio of Investments June 30, 2021 |
| | | | | | | | | | | | | | | | | | | | |
Principal Amount (000) | | | Description (1) | | Coupon | | | Maturity | | | Ratings (2) | | | Value | |
| |
| | | | Oil, Gas & Consumable Fuels (continued) | |
| $ | 200 | | | Occidental Petroleum Corp, (4) | | | 5.875% | | | | 9/01/25 | | | | Ba2 | | | $ | 222,500 | |
| | 50 | | | Occidental Petroleum Corp | | | 5.500% | | | | 12/01/25 | | | | Ba2 | | | | 55,251 | |
| | 125 | | | Parkland Corp/Canada, 144A | | | 4.500% | | | | 10/01/29 | | | | BB | | | | 127,024 | |
| | 275 | | | PBF Holding Co LLC / PBF Finance Corp | | | 7.250% | | | | 6/15/25 | | | | B+ | | | | 209,000 | |
| | 125 | | | Santos Finance Ltd, 144A | | | 3.649% | | | | 4/29/31 | | | | BBB | | | | 127,943 | |
| | 200 | | | Southwestern Energy Co | | | 7.500% | | | | 4/01/26 | | | | BB | | | | 211,750 | |
| | 250 | | | Western Midstream Operating LP | | | 5.050% | | | | 2/01/30 | | | | BB | | | | 280,001 | |
| | 2,290 | | | Total Oil, Gas & Consumable Fuels | | | | | | | | | | | | | | | 2,426,355 | |
| | | | | |
| | | | Pharmaceuticals – 1.2% | | | | | | | | | | | | |
| | 225 | | | Endo Dac / Endo Finance LLC / Endo Finco Inc, 144A | | | 5.875% | | | | 10/15/24 | | | | B | | | | 221,062 | |
| | 200 | | | Jazz Securities DAC, 144A | | | 4.375% | | | | 1/15/29 | | | | BB+ | | | | 207,360 | |
| | 200 | | | ORGANON & CO/ORG, 144A | | | 5.125% | | | | 4/30/31 | | | | BB– | | | | 206,040 | |
| | 220 | | | Teva Pharmaceutical Finance Netherlands III BV | | | 6.750% | | | | 3/01/28 | | | | Ba2 | | | | 240,900 | |
| | 845 | | | Total Pharmaceuticals | | | | | | | | | | | | | | | 875,362 | |
| | | | | |
| | | | Professional Services – 0.3% | | | | | | | | | | | | |
| | | | | |
| | 200 | | | Dun & Bradstreet Corp/The, 144A | | | 6.875% | | | | 8/15/26 | | | | BB+ | | | | 212,000 | |
| | | | | |
| | | | Real Estate Management & Development – 0.4% | | | | | | | | | | | | |
| | | | | |
| | 50 | | | Howard Hughes Corp, 144A | | | 4.125% | | | | 2/01/29 | | | | BB | | | | 50,001 | |
| | 75 | | | Howard Hughes Corp, 144A | | | 4.375% | | | | 2/01/31 | | | | BB | | | | 74,729 | |
| | 75 | | | Kennedy-Wilson Inc | | | 4.750% | | | | 3/01/29 | | | | BB | | | | 77,250 | |
| | 75 | | | Kennedy-Wilson Inc | | | 5.000% | | | | 3/01/31 | | | | BB | | | | 77,156 | |
| | 275 | | | Total Real Estate Management & Development | | | | | | | | | | | | | | | 279,136 | |
| | | | | |
| | | | Road & Rail – 0.4% | | | | | | | | | | | | |
| | | | | |
| | 250 | | | United Rentals North America Inc | | | 4.875% | | | | 1/15/28 | | | | BB | | | | 265,125 | |
| | | | | |
| | | | Semiconductors & Semiconductor Equipment – 0.7% | | | | | | | | | | | | |
| | | | | |
| | 500 | | | Broadcom Inc, 144A, (4) | | | 2.450% | | | | 2/15/31 | | | | BBB– | | | | 491,347 | |
| | | | | |
| | | | Software – 0.0% | | | | | | | | | | | | |
| | | | | |
| | 35 | | | Clarivate Science Holdings Corp, 144A | | | 3.875% | | | | 6/30/28 | | | | B1 | | | | 35,319 | |
| | | | | |
| | | | Specialty Retail – 0.6% | | | | | | | | | | | | |
| | | | | |
| | 75 | | | Ferrellgas LP / Ferrellgas Finance Corp, 144A | | | 5.375% | | | | 4/01/26 | | | | B– | | | | 74,344 | |
| | 100 | | | Ferrellgas LP / Ferrellgas Finance Corp, 144A | | | 5.875% | | | | 4/01/29 | | | | B– | | | | 98,750 | |
| | 50 | | | L Brands Inc, 144A | | | 6.625% | | | | 10/01/30 | | | | BB– | | | | 57,875 | |
| | 75 | | | LCM Investments Holdings II LLC, 144A | | | 4.875% | | | | 5/01/29 | | | | BB– | | | | 76,875 | |
| | 50 | | | Magic Mergeco Inc, 144A | | | 5.250% | | | | 5/01/28 | | | | Ba3 | | | | 51,297 | |
| | 75 | | | Superior Plus LP / Superior General Partner Inc, 144A | | | 4.500% | | | | 3/15/29 | | | | BB– | | | | 77,251 | |
| | 425 | | | Total Specialty Retail | | | | | | | | | | | | | | | 436,392 | |
| | | | | |
| | | | Tobacco – 0.8% | | | | | | | | | | | | |
| | | | | |
| | 600 | | | BAT Capital Corp, (4) | | | 2.726% | | | | 3/25/31 | | | | BBB+ | | | | 592,366 | |
| | | | | |
| | | | Trading Companies & Distributors – 0.8% | | | | | | | | | | | | |
| | 450 | | | Air Lease Corp | | | 3.000% | | | | 2/01/30 | | | | BBB | | | | 456,446 | |
| | 40 | | | WESCO Distribution Inc, 144A | | | 7.125% | | | | 6/15/25 | | | | BB– | | | | 43,228 | |
| | 50 | | | WESCO Distribution Inc, 144A | | | 7.250% | | | | 6/15/28 | | | | BB– | | | | 55,693 | |
| | 540 | | | Total Trading Companies & Distributors | | | | | | | | | | | | | | | 555,367 | |
| | | | | |
| | | | Wireless Telecommunication Services – 0.4% | | | | | | | | | | | | |
| | 250 | | | Hughes Satellite Systems Corp, (4) | | | 6.625% | | | | 8/01/26 | | | | BB | | | | 280,312 | |
| $ | 27,220 | | | Total Corporate Bonds (cost $27,623,939) | | | | | | | | | | | | | | | 28,392,204 | |
20
| | | | | | | | | | | | | | | | | | | | | | | | | | | | |
Principal
Amount (000) | | | Description (1) | | Coupon (5) | | | Reference
Rate (5) | | | Spread (5) | | | Maturity (6) | | | Ratings (2) | | | Value | |
| | |
| | | | VARIABLE RATE SENIOR LOAN INTERESTS – 2.7% (2.0% of Total Investments) (5) | | | | | |
| | | | | | | |
| | | | Aerospace & Defense – 0.3% | | | | | | | | | | | | | | | | | | |
| | | | | | | |
| $ | 250 | | | Maxar Technologies Ltd., Term Loan B | | | 2.854% | | | | 1-Month LIBOR | | | | 2.750% | | | | 10/05/24 | | | | B | | | $ | 248,048 | |
| | | | | | | |
| | | | Beverages – 0.4% | | | | | | | | | | | | | | | | | | |
| | | | | | | |
| | 300 | | | Triton Water Holdings, Inc, Term Loan | | | 4.500% | | | | 3-Month LIBOR | | | | 3.500% | | | | 3/31/28 | | | | B1 | | | | 300,042 | |
| | | | | | | |
| | | | Building Products – 0.4% | | | | | | | | | | | | | | | | | | |
| | | | | | | |
| | 299 | | | Quikrete Holdings, Inc., Term Loan, First Lien | | | 2.604% | | | | 1-Month LIBOR | | | | 2.500% | | | | 1/31/27 | | | | BB– | | | | 296,996 | |
| | | | | | | |
| | | | Chemicals – 0.6% | | | | | | | | | | | | | | | | | | |
| | | | | | | |
| | 250 | | | Atotech B.V., Term Loan B | | | 3.000% | | | | 3-Month LIBOR | | | | 2.500% | | | | 3/18/28 | | | | B+ | | | | 249,011 | |
| | 200 | | | INEOS Styrolution US Holding LLC, Term Loan B | | | 3.250% | | | | 1-Month LIBOR | | | | 2.750% | | | | 1/29/26 | | | | BB+ | | | | 199,750 | |
| | 450 | | | Total Chemicals | | | | | | | | | | | | | | | | | | | | | | | 448,761 | |
| | | | | | | |
| | | | Insurance – 0.3% | | | | | | | | | | | | | | | | | | |
| | | | | | | |
| | 200 | | | Alliant Holdings Intermediate LLC, Term Loan B3 | | | 4.250% | | | | 1-Month LIBOR | | | | 3.750% | | | | 11/06/27 | | | | B | | | | 200,597 | |
| | | | | | | |
| | | | Software – 0.3% | | | | | | | | | | | | | | | | | | |
| | | | | | | |
| | 250 | | | Informatica LLC, Term Loan B, (WI/DD) | | | 3.354% | | | | 1-Month LIBOR | | | | 3.250% | | | | 2/14/27 | | | | B1 | | | | 248,864 | |
| | | |
| | | | Trading Companies & Distributors – 0.4% | | | | | | | |
| | | | | | | |
| | 150 | | | Core & Main LP Term Loan B | | | 3.750% | | | | 1-Month LIBOR | | | | 2.750% | | | | 8/01/24 | | | | B1 | | | | 150,373 | |
| | 100 | | | Core & Main LP Term Loan B | | | 3.750% | | | | 3-Month LIBOR | | | | 2.750% | | | | 8/01/24 | | | | B1 | | | | 99,215 | |
| | 250 | | | Total Trading Companies & Distributors | | | | | | | | | | | | | | | | | | | | 249,588 | |
| $ | 1,999 | | | Total Variable Rate Senior Loan Interests (cost $1,991,815) | | | | | | | | 1,992,896 | |
| | | | | | | |
Principal
Amount (000) | | | Description (1) | | | | | | | | Coupon | | | Maturity | | | Ratings (2) | | | Value | |
| | | | |
| | | | SOVEREIGN DEBT – 1.4% (1.0% of Total Investments) | | | | | | | | | | |
| | | | | | | |
| | | | Bahrain – 0.4% | | | | | | | | | | | | | | | | | | |
| | | | | | |
| $ | 250 | | | Bahrain Government International Bond, 144A | | | | | | | | 7.000% | | | | 10/12/28 | | | | B+ | | | $ | 280,281 | |
| | | | | | | |
| | | | Egypt – 0.6% | | | | | | | | | | | | | | | | | | |
| | | | | | |
| | 400 | | | Egypt Government International Bond, 144A | | | | | | | | 5.875% | | | | 6/11/25 | | | | B+ | | | | 426,568 | |
| | | | | | | |
| | | | El Salvador – 0.1% | | | | | | | | | | | | | | | | | | |
| | | | | | |
| | 100 | | | El Salvador Government International Bond, 144A | | | | | | | | 5.875% | | | | 1/30/25 | | | | B+ | | | | 92,250 | |
| | | | | | | |
| | | | Turkey – 0.3% | | | | | | | | | | | | | | | | | | |
| | | | | | |
| | 250 | | | Turkey Government International Bond | | | | | | | | 5.950% | | | | 1/15/31 | | | | BB– | | | | 244,756 | |
| $ | 1,000 | | | Total Sovereign Debt (cost $1,002,432) | | | | | | | | | | | | | | | | | | | | 1,043,855 | |
| | | | | | | |
Principal
Amount (000) | | | Description (1), (7) | | | | | | | | Coupon | | | Maturity | | | Ratings (2) | | | Value | |
| | |
| | | | CONTINGENT CAPITAL SECURITIES – 0.9% (0.6% of Total Investments) | | | | |
| | | | | | | |
| | | | Banks – 0.6% | | | | | | | | | | | | | | | | | | |
| | | | | | | |
| $ | 200 | | | Banco Bilbao Vizcaya Argentaria SA | | | | | | | | | | | 6.500% | | | | N/A (8) | | | | Ba2 | | | $ | 217,750 | |
| | 200 | | | Societe Generale SA, 144A | | | | | | | | | | | 4.750% | | | | N/A (8) | | | | BB+ | | | | 207,250 | |
| | 400 | | | Total Banks | | | | | | | | | | | | | | | | | | | | | | | 425,000 | |
21
| | |
| |
| JMM | | Nuveen Multi-Market Income Fund (continued) |
| | Portfolio of Investments June 30, 2021 |
| | | | | | | | | | | | | | | | | | | | | | | | | | | | |
Principal
Amount (000) | | | Description (1), (7) | | | | | | | | Coupon | | | Maturity | | | Ratings (2) | | | Value | |
| | | | | | | |
| | | | Capital Markets – 0.3% | | | | | | | | | | | | | | | | | | |
| | | | | | | |
| $ | 200 | | | UBS Group AG, 144A | | | | | | | | | | | 7.000% | | | | N/A (8) | | | | BBB | | | $ | 220,250 | |
| $ | 600 | | | Total Contingent Capital Securities (cost $600,000) | | | | | | | | | | | | | | | | | | | | 645,250 | |
| | | | | | | |
Principal
Amount (000) | | | Description (1) | | | | | | | | | | | Optional Call
Provision (9) | | | Ratings (2) | | | Value | |
| | | |
| | | | MUNICIPAL BONDS – 0.8% (0.6% of Total Investments) | | | | | | | | | |
| | | | | | | |
| | | | Illinois – 0.8% | | | | | | | | | | | | | | | | | | |
| | | | | |
| $ | 500 | | | Illinois State, General Obligation Bonds, Pension Funding Series 2003, 5.100%, 6/01/33 | | | | | | | | No Opt. Call | | | | BBB– | | | $ | 588,320 | |
| $ | 500 | | | Total Municipal Bonds (cost $514,280) | | | | | | | | | | | | | | | | | | | | 588,320 | |
| | | | | | | |
| Shares | | | Description (1) | | | | | | | | Coupon | | | | | | Ratings (2) | | | Value | |
| | | |
| | | | $25 PAR (OR SIMILAR) RETAIL PREFERRED – 0.2% (0.2% of Total Investments) | | | | | | | | | |
| | | | | | | |
| | | | Banks – 0.2% | | | | | | | | | | | | | | | | | | |
| | | | | | | |
| | 6,000 | | | JPMorgan Chase & Co | | | | | | | | �� | | | 4.550% | | | | | | | | BBB+ | | | $ | 159,720 | |
| | | | Total $25 Par (or similar) Retail Preferred (cost $150,000) | | | | | | | | | | | | | | | | 159,720 | |
| | | | Total Long-Term Investments (cost $95,509,092) | | | | | | | | | | | | 97,968,078 | |
| | | | | | | |
Principal
Amount (000) | | | Description (1) | | | | | | | | Coupon | | | Maturity | | | | | | Value | |
| | | |
| | | | SHORT-TERM INVESTMENTS – 3.3% (2.4% of Total Investments) | | | | | | | | | |
| | | |
| | | | REPURCHASE AGREEMENTS – 3.3% (2.4% of Total Investments) | | | | | | | |
| | | | | |
| $ | 2,417 | | | Repurchase Agreement with Fixed Income Clearing Corporation, dated 6/30/21, repurchase price $2,417,283, collateralized $1,794,100 U.S. Treasury Government Bonds, 4.250%, due 11/15/40, value $2,465,766 | | | | 0.000% | | | | 7/01/21 | | | | | | | $ | 2,417,283 | |
| | | | Total Short-Term Investments (cost $2,417,283) | | | | | | | | | | | | | | | | 2,417,283 | |
| | | | Total Investments (cost $97,926,375) – 135.6% | | | | | | | | | | | | | | | | 100,385,361 | |
| | | | Reverse Repurchase Agreements, including accrued interest – (30.2)% (10) | | | | | | | | | | | | | | | | (22,351,054 | ) |
| | | | Other Assets Less Liabilities – (5.4)% (11) | | | | | | | | | | | | | | | | (3,992,849 | ) |
| | | | Net Assets Applicable to Common Shares – 100% | | | | | | | | | | | | | | | | | | | $ | 74,041,458 | |
Investments in Derivatives
Futures Contracts – Long
| | | | | | | | | | | | | | | | | | | | | | | | |
| Description | | Number of
Contracts | | | Expiration
Date | | | Notional
Amount | | | Value | | | Unrealized
Appreciation
(Depreciation) | | | Variation
Margin
Receivable/
(Payable) | |
U.S. Treasury Ultra Bond | | | 9 | | | | 9/21 | | | $ | 1,671,206 | | | $ | 1,734,188 | | | $ | 62,982 | | | $ | 10,125 | |
Total receivable for variation margin on futures contracts | | | | | | | | | | | | | | | | | | | | | | $ | 10,125 | |
Total payable for variation margin on futures contracts | | | | | | | | | | | | | | | | | | | | | | $ | — | |
Futures Contracts – Short
| | | | | | | | | | | | | | | | | | | | | | | | |
| Description | | Number of
Contracts | | | Expiration
Date | | | Notional
Amount | | | Value | | | Unrealized
Appreciation
(Depreciation) | | | Variation
Margin
Receivable/
(Payable) | |
U.S. Treasury 10-Year Ultra Note | | | (32 | ) | | | 9/21 | | | $ | (4,667,686 | ) | | $ | (4,710,500 | ) | | $ | (42,814 | ) | | $ | (15,500 | ) |
Total receivable for variation margin on futures contracts | | | | | | | | | | | | | | | | | | | | | | $ | — | |
Total payable for variation margin on futures contracts | | | | | | | | | | | | | | | | | | | | | | $ | (15,500 | ) |
22
Interest Rate Swaps – OTC Uncleared
| | | | | | | | | | | | | | | | | | | | | | | | | | | | | | | | | | | | | | | | |
| Counterparty | | Notional
Amount | | | Fund
Pay/Receive
Floating Rate | | | Floating Rate Index | | | Fixed Rate
(Annualized) | | | Fixed Rate
Payment
Frequency | | | Effective
Date (12) | | | Optional
Termination
Date | | | Maturity
Date | | | Value | | | Unrealized
Appreciation
(Depreciation) | |
Morgan Stanley Capital Services LLC | | $ | 17,000,000 | | | | Receive | | | | 1-Month LIBOR | | | | 1.994 | % | | | Monthly | | | | 6/01/18 | | | | 7/01/25 | | | | 7/01/27 | | | $ | (1,178,616 | ) | | $ | (1,178,616 | ) |
For Fund portfolio compliance purposes, the Fund’s industry classifications refer to any one or more of the industry sub-classifications used by one or more widely recognized market indexes or ratings group indexes, and/or as defined by Fund management. This definition may not apply for purposes of this report, which may combine industry sub-classifications into sectors for reporting ease.
| (1) | All percentages shown in the Portfolio of Investments are based on net assets applicable to common shares unless otherwise noted. |
| (2) | For financial reporting purposes, the ratings disclosed are the highest of Standard & Poor’s Group (“Standard & Poor’s”), Moody’s Investors Service, Inc. (“Moody’s”) or Fitch, Inc. (“Fitch”) rating. This treatment of split-rated securities may differ from that used for other purposes, such as for Fund investment policies. Ratings below BBB by Standard & Poor’s, Baa by Moody’s or BBB by Fitch are considered to be below investment grade. Holdings designated N/R are not rated by any of these national rating agencies. Ratings are not covered by the report of independent registered public accounting firm. |
| (3) | Variable rate security. The rate shown is the coupon as of the end of the reporting period. |
| (4) | Investment, or portion of investment, has been pledged to collateralize the net payment obligations for investments in derivatives and/or reverse repurchase agreements. As of the end of the reporting period, investments with a value of $24,419,460 have been pledged as collateral for reverse repurchase agreements. |
| (5) | Senior loans generally pay interest at rates which are periodically adjusted by reference to a base short-term, floating lending rate (Reference Rate) plus an assigned fixed rate (Spread). These floating lending rates are generally (i) the lending rate referenced by the London Inter-Bank Offered Rate (“LIBOR”), or (ii) the prime rate offered by one or more major United States banks. Senior loans may be considered restricted in that the Fund ordinarily is contractually obligated to receive approval from the agent bank and/or borrower prior to the disposition of a senior loan. The rate shown is the coupon as of the end of the reporting period. |
| (6) | Senior Loans generally are subject to mandatory and/or optional prepayment. Because of these mandatory prepayment conditions and because there may be significant economic incentives for a borrower to prepay, prepayments of senior loans may occur. As a result, the actual remaining maturity of senior loans held may be substantially less than the stated maturities shown. |
| (7) | Contingent Capital Securities (“CoCos”) are hybrid securities with loss absorption characteristics built into the terms of the security for the benefit of the issuer. For example, the terms may specify an automatic write-down of principal or a mandatory conversion into the issuer’s common stock under certain adverse circumstances, such as the issuer’s capital ratio falling below a specified level. |
| (8) | Perpetual security. Maturity date is not applicable. |
| (9) | Optional Call Provisions: Dates (month and year) and prices of the earliest optional call or redemption. There may be other call provisions at varying prices at later dates. Certain mortgage-backed securities may be subject to periodic principal paydowns. Optional Call Provisions are not covered by the report of independent registered public accounting firm. |
| (10) | Reverse Repurchase Agreements as a percentage of Total Investments is 22.3%. |
| (11) | Other assets less liabilities includes the unrealized appreciation (depreciation) of certain over-the-counter (“OTC”) derivatives as well as the OTC cleared and exchange-traded derivatives, when applicable. |
| (12) | Effective date represents the date on which both the Fund and counterparty commence interest payment accruals on each contract. |
| 144A | Investment is exempt from registration under Rule 144A of the Securities Act of 1933, as amended. These investments may only be resold in transactions exempt from registration, which are normally those transactions with qualified institutional buyers. |
| LIBOR | London Inter-Bank Offered Rate |
| I/O | Interest only security. |
| MDR | Denotes investment is subject to dollar roll transactions. |
| TBA | To be announced. Maturity date not known prior to settlement of this transaction. |
| WI/DD | Purchased on a when issued or delayed delivery basis. |
See accompanying notes to financial statements.
23
Statement of Assets and Liabilities
June 30, 2021
| | | | |
Assets | | | | |
Long-term investments, at value (cost $95,509,092) | | $ | 97,968,078 | |
Short-term investments, at value (cost approximates value) | | | 2,417,283 | |
Cash | | | 1,596 | |
Cash collateral at broker for investments in futures contracts(1) | | | 55,553 | |
Cash collateral at broker for investments in reverse repurchase agreements(1) | | | 926,041 | |
Receivable for: | | | | |
Interest | | | 553,337 | |
Investments sold | | | 229,826 | |
Variation margin on futures contracts | | | 10,125 | |
Total assets | | | 102,161,839 | |
Liabilities | | | | |
Reverse repurchase agreements, including accrued interest | | | 22,351,054 | |
Unrealized depreciation on interest rate swaps | | | 1,178,616 | |
Payable for: | | | | |
Dividends | | | 269,046 | |
Investments purchased – regular settlement | | | 35,000 | |
Investments purchased – when-issued/delayed-delivery settlement | | | 4,040,390 | |
Variation margin on futures contracts | | | 15,500 | |
Accrued expenses: | | | | |
Management fees | | | 70,247 | |
Trustees fees | | | 1,197 | |
Other | | | 159,331 | |
Total liabilities | | | 28,120,381 | |
Net assets applicable to common shares | | $ | 74,041,458 | |
Common shares outstanding | | | 9,462,350 | |
Net asset value (“NAV”) per common share outstanding | | $ | 7.82 | |
Net assets applicable to common shares consist of: | | | | |
Common shares, $0.01 par value per share | | $ | 94,624 | |
Paid-in surplus | | | 82,347,965 | |
Total distributable earnings | | | (8,401,131 | ) |
Net assets applicable to common shares | | $ | 74,041,458 | |
Authorized common shares | | | Unlimited | |
| (1) | Cash pledged to collateralize the net payment obligations for investments in derivatives and reverse repurchase agreements. |
See accompanying notes to financial statements.
24
Statement of Operations
Year Ended June 30, 2021
| | | | |
Investment Income | | | | |
Dividends | | $ | 1,403 | |
Interest | | | 3,628,700 | |
Total investment income | | | 3,630,103 | |
Expenses | | | | |
Management fees | | | 857,187 | |
Interest expense | | | 70,862 | |
Custodian fees | | | 89,183 | |
Trustees fees | | | 2,810 | |
Professional fees | | | 50,103 | |
Shareholder reporting expenses | | | 28,803 | |
Shareholder servicing agent fees | | | 6,614 | |
Stock exchange listing fees | | | 6,626 | |
Investor relations expense | | | 4,754 | |
Other | | | 17,543 | |
Total expenses | | | 1,134,485 | |
Net investment income (loss) | | | 2,495,618 | |
Realized and Unrealized Gain (Loss) | | | | |
Net realized gain (loss) from: | | | | |
Investments | | | (86,383 | ) |
Futures contracts | | | (373,095 | ) |
Swaps | | | (314,292 | ) |
Change in net unrealized appreciation (depreciation) of: | | | | |
Investments | | | 3,731,026 | |
Futures contracts | | | 29,867 | |
Swaps | | | 839,707 | |
Net realized and unrealized gain (loss) | | | 3,826,830 | |
Net increase (decrease) in net assets applicable to common shares from operations | | $ | 6,322,448 | |
See accompanying notes to financial statements.
25
Statement of Changes in Net Assets
| | | | | | | | |
| | | Year Ended
6/30/21 | | | Year
Ended
6/30/20 | |
Operations | | | | | | | | |
Net investment income (loss) | | $ | 2,495,618 | | | $ | 2,846,108 | |
Net realized gain (loss) from: | | | | | | | | |
Investments | | | (86,383 | ) | | | (183,919 | ) |
Futures contracts | | | (373,095 | ) | | | (74,189 | ) |
Swaps | | | (314,292 | ) | | | (35,576 | ) |
Change in net unrealized appreciation (depreciation) of: | | | | | | | | |
Investments | | | 3,731,026 | | | | (2,958,899 | ) |
Futures contracts | | | 29,867 | | | | 186,441 | |
Swaps | | | 839,707 | | | | (1,546,405 | ) |
Net increase (decrease) in net assets applicable to common shares from operations | | | 6,322,448 | | | | (1,766,439 | ) |
Distributions to Common Shareholders | | | | | | | | |
Dividends | | | (3,061,070 | ) | | | (3,292,898 | ) |
Decrease in net assets applicable to common shares from distributions to common shareholders | | | (3,061,070 | ) | | | (3,292,898 | ) |
Net increase (decrease) in net assets applicable to common shares | | | 3,261,378 | | | | (5,059,337 | ) |
Net assets applicable to common shares at the beginning of period | | | 70,780,080 | | | | 75,839,417 | |
Net assets applicable to common shares at the end of period | | $ | 74,041,458 | | | $ | 70,780,080 | |
See accompanying notes to financial statements.
26
Statement of Cash Flows
Year Ended June 30, 2021
| | | | |
Cash Flows from Operating Activities: | | | | |
Net Increase (Decrease) in Net Assets Applicable to Common Shares from Operations | | $ | 6,322,448 | |
Adjustments to reconcile the net increase (decrease) in net assets applicable to common shares from operations to net cash provided by (used in) operating activities: | | | | |
Purchases of investments | | | (104,413,258 | ) |
Proceeds from sales and maturities of investments | | | 105,832,650 | |
Proceeds from (Purchases of) short-term investments, net | | | (918,272 | ) |
Amortization (Accretion) of premiums and discounts, net | | | 58,382 | |
(Increase) Decrease in: | | | | |
Receivable for interest | | | (38,140 | ) |
Receivable for investments sold | | | 1,011,070 | |
Receivable for variation margin on futures contracts | | | 4,719 | |
Other assets | | | 4,262 | |
Increase (Decrease) in: | | | | |
Payable for investments purchased - regular settlement | | | 35,000 | |
Payable for investments purchased - when-issued/delayed-delivery settlement | | | 21,431 | |
Payable for variation margin on futures contracts | | | (17,500 | ) |
Accrued interest | | | 3,572 | |
Accrued management fees | | | (126 | ) |
Accrued Trustees fees | | | 658 | |
Accrued other expenses | | | 72,482 | |
Net realized (gain) loss from: | | | | |
Investments | | | 86,383 | |
Paydowns | | | 335,154 | |
Change in net unrealized appreciation (depreciation) of: | | | | |
Investments | | | (3,731,026 | ) |
Swaps | | | (839,707 | ) |
Net cash provided by (used in) operating activities | | | 3,830,182 | |
Cash Flows from Financing Activities: | | | | |
Proceeds from reverse repurchase agreements | | | 6,486,763 | |
(Purchase) for reverse repurchase agreements | |
| (8,915,763
| )
|
Cash distributions paid to shareholders | | | (3,033,200 | ) |
Net cash provided by (used in) financing activities | | | (5,462,200 | ) |
Net Increase (Decrease) in Cash and Cash Collateral at Brokers | | | (1,632,018 | ) |
Cash and cash collateral at brokers at the beginning of period | | | 2,615,208 | |
Cash and cash collateral at brokers at the end of period | | $ | 983,190 | |
The following table provides a reconciliation of cash and cash collateral at brokers to the statement of assets and liabilities: | | | | |
Cash | | $ | 1,596 | |
Cash collateral at brokers for investments in futures | | | 55,553 | |
Cash collateral at brokers for investments in reverse repurchase agreements | | | 926,041 | |
Total cash and cash collateral at brokers | | $ | 983,190 | |
| |
| Supplemental Disclosures of Cash Flow Information | | | |
Cash paid for interest | | $ | 67,290 | |
See accompanying notes to financial statements.
27
Financial Highlights
Selected data for a share outstanding throughout each period:
| | | | | | | | | | | | | | | | | | | | | | | | | | | | | | | | | | | | | | | | | | | | |
| | | | |
| | | | | | Investment Operations | | | Less Distributions to
Common Shareholders | | | Common Share | |
| | | Beginning Common Share NAV | | | Net
Investment
Income
(Loss)(a) | | | Net
Realized/
Unrealized
Gain (Loss) | | | Total | | | From
Net
Investment
Income | | | From
Accumulated
Net
Realized
Gains | | | Return
of
Capital | | | Total | | | Discount
From
Shares
Repurchase
and Retired | | | Ending
NAV | | | Ending
Share
Price | |
Year Ended 6/30: | | | | | | | | | | | | | | | | | | | | | | | | | | | | | | | | | | | | | | | | | | | | |
2021 | | $ | 7.48 | | | $ | 0.26 | | | $ | 0.40 | | | $ | 0.66 | | | $ | (0.32 | ) | | $ | — | | | $ | — | | | $ | (0.32 | ) | | $ | — | | | $ | 7.82 | | | $ | 7.46 | |
2020 | | | 8.01 | | | | 0.30 | | | | (0.48 | ) | | | (0.18 | ) | | | (0.35 | ) | | | — | | | | — | | | | (0.35 | ) | | | — | | | | 7.48 | | | | 6.90 | |
2019 | | | 7.97 | | | | 0.32 | | | | 0.08 | | | | 0.40 | | | | (0.36 | ) | | | — | | | | — | | | | (0.36 | ) | | | — | | | | 8.01 | | | | 7.33 | |
2018 | | | 8.15 | | | | 0.35 | | | | (0.13 | ) | | | 0.22 | | | | (0.40 | ) | | | — | | | | — | | | | (0.40 | ) | | | — | | | | 7.97 | | | | 7.00 | |
2017 | | | 8.07 | | | | 0.39 | | | | 0.12 | | | | 0.51 | | | | (0.43 | ) | | | — | | | | — | | | | (0.43 | ) | | | — | | | | 8.15 | | | | 7.49 | |
28
| | | | | | | | | | | | | | | | | | | | | | | | | | | | | | |
| | | | | | | Common Share Supplemental Data/
Ratios Applicable to Common Shares | |
Common Share
Total Returns | | | | | | Ratios to Average Net Assets
Before Reimbursement(c) | | | Ratios to Average Net Assets
After Reimbursement(c)(d) | | | | |
Based
on
NAV(b) | | |
Based
on
Share
Price(b) | | | Ending
Net
Assets
(000) | | | Expenses | | | Net
Investment
Income (Loss) | | | Expenses | | | Net
Investment
Income (Loss) | | | Portfolio
Turnover
Rate(e) | |
| | | | | | | | | | | | | | | | | | | | | | | | | | | | | | |
| | 9.13 | % | | | 13.13 | % | | $ | 74,041 | | | | 1.55 | % | | | 3.41 | % | | | 1.55 | % | | | 3.41 | % | | | 107 | % |
| | (2.34 | ) | | | (1.14 | ) | | | 70,780 | | | | 2.24 | | | | 3.88 | | | | 2.24 | | | | 3.88 | | | | 87 | |
| | 5.16 | | | | 10.14 | | | | 75,839 | | | | 2.19 | | | | 4.08 | | | | 2.19 | | | | 4.08 | | | | 159 | |
| | 2.60 | | | | (1.37 | ) | | | 75,408 | | | | 1.88 | | | | 4.28 | | | | 1.88 | | | | 4.28 | | | | 165 | |
| | 6.62 | | | | 6.08 | | | | 77,147 | | | | 1.71 | | | | 4.72 | | | | 1.64 | | | | 4.79 | | | | 191 | |
| (a) | Per share Net Investment Income (Loss) is calculated using the average daily shares method. |
| (b) | Total Return Based on Common Share NAV is the combination of changes in common share NAV, reinvested dividend income at NAV and reinvested capital gains distributions at NAV, if any. The last dividend declared in the period, which is typically paid on the first business day of the following month, is assumed to be reinvested at the ending NAV. The actual reinvest price for the last dividend declared in the period may often be based on the Fund’s market price (and not its NAV), and therefore may be different from the price used in the calculation. Total returns are not annualized. |
Total Return Based on Common Share Price is the combination of changes in the market price per share and the effect of reinvested dividend income and reinvested capital gains distributions, if any, at the average price paid per share at the time of reinvestment. The last dividend declared in the period, which is typically paid on the first business day of the following month, is assumed to be reinvested at the ending market price. The actual reinvestment for the last dividend declared in the period may take place over several days, and in some instances may not be based on the market price, so the actual reinvestment price may be different from the price used in the calculation. Total returns are not annualized.
| | | | |
| (c) | | • | | Net Investment Income (Loss) ratios reflect income earned and expenses incurred on assets attributable to reverse repurchase agreements (as described in Note 8 – Fund Leverage), where applicable. |
| | • | | Each ratio includes the effect of all interest expenses paid and other costs related to reverse repurchase agreements, where applicable, as follows: |
| | | | |
Ratios of Interest Expense
to Average Net Assets
Applicable to Common Shares | |
Year Ended 6/30: | |
2021 | | | 0.10 | % |
2020 | | | 0.75 | |
2019 | | | 0.69 | |
2018 | | | 0.41 | |
2017 | | | 0.23 | |
| (d) | After fee waiver and/or expense reimbursement from the Adviser, where applicable. As of September 8, 2016, the Adviser is no longer contractually reimbursing the Fund for any fees and expenses. |
| (e) | Portfolio Turnover Rate is calculated based on the lesser of long-term purchases or sales (as disclosed in Note 4 – Portfolio Securities and Investments in Derivatives) divided by the average long-term market value during the period. |
See accompanying notes to financial statements.
29
Notes to Financial Statements
1. General Information
Fund Information
Nuveen Multi-Market Income Fund (the “Fund”) is registered under the Investment Company Act of 1940, as amended, as a diversified closed-end management investment company. The Fund’s shares are listed on the New York Stock Exchange (“NYSE”) and trade under the ticker symbol “JMM.” The Fund was organized as a Massachusetts business trust on May 27, 2014 (previously organized as a Virginia corporation).
The end of the reporting period for the Fund is June 30, 2021, and the period covered by these Notes to Financial Statements is the fiscal year ended June 30, 2021 (the “current fiscal period”).
Investment Adviser and Sub-Adviser
The Fund’s investment adviser is Nuveen Fund Advisors, LLC (the “Adviser”), a subsidiary of Nuveen, LLC (“Nuveen”). Nuveen is the investment management arm of Teachers Insurance and Annuity Association of America (TIAA). The Adviser has overall responsibility for management of the Fund, oversees the management of the Fund’s portfolio, manages the Fund’s business affairs and provides certain clerical, bookkeeping and other administrative services, and, if necessary, asset allocation decisions. The Adviser has entered into a sub-advisory agreement with Nuveen Asset Management, LLC (the “Sub-Adviser”), a subsidiary of the Adviser, under which the Sub-Adviser manages the Fund’s investment portfolio.
Other Matters
The outbreak of the novel coronavirus (“COVID-19”) and subsequent global pandemic began significantly impacting the U.S. and global financial markets and economies during the calendar quarter ended March 31, 2020. The worldwide spread of COVID-19 has created significant uncertainty in the global economy. The duration and extent of COVID-19 over the long term cannot be reasonably estimated at this time. The ultimate impact of COVID-19 and the extent to which COVID-19 impacts the Fund’s normal course of business, results of operations, investments, and cash flows will depend on future developments, which are highly uncertain and difficult to predict. Management continues to monitor and evaluate this situation.
2. Significant Accounting Policies
The accompanying financial statements were prepared in accordance with accounting principles generally accepted in the United States of America (“U.S. GAAP”), which may require the use of estimates made by management and the evaluation of subsequent events. Actual results may differ from those estimates. The Fund is an investment company and follows the accounting guidance in the Financial Accounting Standards Board (“FASB”) Accounting Standards Codification 946, Financial Services – Investment Companies. The net asset value (“NAV”) for financial reporting purposes may differ from the NAV for processing security and common share transactions. The NAV for financial reporting purposes includes security and common share transactions through the date of the report. Total return is computed based on the NAV used for processing security and common share transactions. The following is a summary of the significant accounting policies consistently followed by the Fund.
Compensation
The Fund pays no compensation directly to those of its trustees who are affiliated with the Adviser or to its officers, all of whom receive remuneration for their services to the Fund from the Adviser or its affiliates. The Fund’s Board of Trustees (the “Board”) has adopted a deferred compensation plan for independent trustees that enables trustees to elect to defer receipt of all or a portion of the annual compensation they are entitled to receive from certain Nuveen-advised funds. Under the plan, deferred amounts are treated as though equal dollar amounts had been invested in shares of select Nuveen-advised funds.
Distributions to Common Shareholders
Distributions to common shareholders are recorded on the ex-dividend date. The amount, character and timing of distributions are determined in accordance with federal income tax regulations, which may differ from U.S. GAAP.
Effective in conjunction with the declaration of the March 2021 distribution, the Fund has implemented a level distribution program to provide shareholders with stable, but not guaranteed, cash flow, independent of the amount or timing of income earned or capital gains realized by the Fund. Under this program, the Fund’s regular monthly distribution, in order to maintain its level distribution amount, may include net investment income, return of capital and potentially capital gains for tax purposes. The amounts and sources of distributions are reported for financial reporting purposes and are not being provided for tax reporting purposes. The actual amounts and character of the distributions for tax reporting purposes will be reported to shareholders on Form 1099-DIV which will be sent to shareholders shortly after calendar year-end. More details about the Fund’s distributions and the basis for these estimates are available on www.nuveen.com/cef.
30
Indemnifications
Under the Fund’s organizational documents, its officers and trustees are indemnified against certain liabilities arising out of the performance of their duties to the Fund. In addition, in the normal course of business, the Fund enters into contracts that provide general indemnifications to other parties. The Fund’s maximum exposure under these arrangements is unknown as this would involve future claims that may be made against the Fund that have not yet occurred. However, the Fund has not had prior claims or losses pursuant to these contracts and expects the risk of loss to be remote.
Investments and Investment Income
Securities transactions are accounted for as of the trade date for financial reporting purposes. Realized gains and losses on securities transactions are based upon the specific identification method. Dividend income is recorded on the ex-dividend date or, for foreign securities, when information is available. Non-cash dividends received in the form of stock, if any, are recognized on the ex-dividend date and recorded at fair value. Interest income, which reflects the amortization of premiums and includes accretion of discounts for financial reporting purposes, is recorded on an accrual basis. Interest income also reflects payment-in-kind (“PIK”) interest, fees earned from reverse repurchase agreements and paydown gains and losses, if any. PIK interest represents income received in the form of securities in lieu of cash. Fees earned from reverse repurchase agreements are further described in Note 8 – Fund Leverage, Reverse Repurchase Agreements.
Netting Agreements
In the ordinary course of business, the Fund may enter into transactions subject to enforceable master repurchase agreements, International Swaps and Derivatives Association, Inc. (ISDA) master agreements or other similar arrangements (“netting agreements”). Generally, the right to offset in netting agreements allows the Fund to offset certain securities and derivatives with a specific counterparty, when applicable, as well as any collateral received or delivered to that counterparty based on the terms of the agreements. Generally, the Fund manages its cash collateral and securities collateral on a counterparty basis.
The Fund’s investments subject to netting agreements as of the end of the reporting period, if any, are further described in Note 4 – Portfolio Securities and Investments in Derivatives.
New Accounting Pronouncements and Rule Issuances
Reference Rate Reform
In March 2020, FASB issued Accounting Standards Update (“ASU”) 2020-04, Reference Rate Reform: Facilitation of the Effects of Reference Rate Reform on Financial Reporting. The main objective of the new guidance is to provide relief to companies that will be impacted by the expected change in benchmark interest rates, when participating banks will no longer be required to submit London Interbank Offered Rate (LIBOR) quotes by the UK Financial Conduct Authority (FCA). The new guidance allows companies to, provided the only changes to existing contracts are a change to an approved benchmark interest rate, account for modifications as a continuance of the existing contract without additional analysis. For new and existing contracts, the Fund may elect to apply the amendments as of March 12, 2020 through December 31, 2022. Management has not yet elected to apply the amendments, is continuously evaluating the potential effect a discontinuation of LIBOR could have on the Fund’s investments and has currently determined that it is unlikely the ASU’s adoption will have a significant impact on the Fund’s financial statements and various filings.
Securities and Exchange Commission (“SEC”) Adopts New Rules to Modernize Fund Valuation Framework
In December 2020, the SEC voted to adopt a new rule governing fund valuation practices. New Rule 2a-5 under the 1940 Act establishes requirements for determining fair value in good faith for purposes of the 1940 Act. Rule 2a-5 will permit fund boards to designate certain parties to perform fair value determinations, subject to board oversight and certain other conditions. Rule 2a-5 also defines when market quotations are “readily available” for purposes of Section 2(a)(41) of the 1940 Act, which requires a fund to fair value a security when market quotations are not readily available. The SEC also adopted new Rule 31a-4 under the 1940 Act, which sets forth the recordkeeping requirements associated with fair value determinations. Finally, the SEC is rescinding previously issued guidance on related issues, including the role of a board in determining fair value and the accounting and auditing of fund investments. Rule 2a-5 and Rule 31a-4 became effective on March 8, 2021, with a compliance date of September 8, 2022. A fund may voluntarily comply with the rules after the effective date, and in advance of the compliance date, under certain conditions. Management is currently assessing the impact of these provisions on the Fund’s financial statements.
3. Investment Valuation and Fair Value Measurements
The Fund’s investments in securities are recorded at their estimated fair value utilizing valuation methods approved by the Board. Fair value is defined as the price that would be received upon selling an investment or transferring a liability in an orderly transaction to an independent buyer in the principal or most advantageous market for the investment. U.S. GAAP establishes the three-tier hierarchy which is used to maximize the use of observable market data and minimize the use of unobservable inputs and to establish classification of fair value measurements for disclosure purposes. Observable inputs reflect the assumptions market participants would use in pricing the asset or liability. Observable inputs are based on market data obtained from sources
31
Notes to Financial Statements (continued)
independent of the reporting entity. Unobservable inputs reflect management’s assumptions about the assumptions market participants would use in pricing the asset or liability. Unobservable inputs are based on the best information available in the circumstances. The following is a summary of the three-tiered hierarchy of valuation input levels.
| | |
| Level 1 – | | Inputs are unadjusted and prices are determined using quoted prices in active markets for identical securities. |
| Level 2 – | | Prices are determined using other significant observable inputs (including quoted prices for similar securities, interest rates, credit spreads, etc.). |
| Level 3 – | | Prices are determined using significant unobservable inputs (including management’s assumptions in determining the fair value of investments). |
A description of the valuation techniques applied to the Fund’s major classifications of assets and liabilities measured at fair value follows:
Equity securities and exchange-traded funds listed or traded on a national market or exchange are valued based on their sale price at the official close of business of such market or exchange on the valuation date. Foreign equity securities and registered investment companies that trade on a foreign exchange are valued at the last sale price or official closing price reported on the exchange where traded and converted to U.S. dollars at the prevailing rates of exchange on the date of valuation. To the extent these securities are actively traded and that valuation adjustments are not applied, they are generally classified as Level 1. If there is no official close of business, then the latest available sale price is utilized. If no sales are reported, then the mean of the latest available bid and ask prices is utilized and these securities are generally classified as Level 2.
Prices of fixed-income securities are generally provided by an independent pricing service (“pricing service”) approved by the Board. The pricing service establishes a security’s fair value using methods that may include consideration of the following: yields or prices of investments of comparable quality, type of issue, coupon, maturity and rating, market quotes or indications of value from security dealers, evaluations of anticipated cash flows or collateral, general market conditions and other information and analysis, including the obligor’s credit characteristics considered relevant. In pricing certain securities, particularly less liquid and lower quality securities, the pricing service may consider information about a security, its issuer or market activity provided by the Adviser. These securities are generally classified as Level 2.
Repurchase agreements are valued at contract amount plus accrued interest, which approximates market value. These securities are generally classified as Level 2.
Futures contracts are valued using the closing settlement price or, in the absence of such a price, the last traded price and are generally classified as Level 1.
Swap contracts are marked-to-market daily based upon a price supplied by a pricing service. Swaps are generally classified as Level 2.
Any portfolio security or derivative for which market quotations are not readily available or for which the above valuation procedures are deemed not to reflect fair value are valued at fair value, as determined in good faith using procedures approved by the Board. As a general principle, the fair value of a security would appear to be the amount that the owner might reasonably expect to receive for it in a current sale. A variety of factors may be considered in determining the fair value of such securities, which may include consideration of the following: yields or prices of investments of comparable quality, type of issue, coupon, maturity and rating, market quotes or indications of value from security dealers, evaluations of anticipated cash flows or collateral, general market conditions and other information and analysis, including the obligor’s credit characteristics considered relevant. To the extent the inputs are observable and timely, the values would be classified as Level 2 of the fair value hierarchy; otherwise they would be classified as Level 3.
The following table summarizes the market value of the Funds’ investments as of the end of the reporting period, based on the inputs used to value them:
| | | | | | | | | | | | | | | | |
| | | Level 1 | | | Level 2 | | | Level 3 | | | Total | |
Long-Term Investments*: | | | | | | | | | | | | | | | | |
Asset-Backed and Mortgage-Backed Securities | | $ | — | | | $ | 65,145,833 | | | $ | — | | | $ | 65,145,833 | |
Corporate Bonds | | | — | | | | 28,392,204 | | | | — | | | | 28,392,204 | |
Variable Rate Senior Loan Interests | | | — | | | | 1,992,896 | | | | — | | | | 1,992,896 | |
Sovereign Debt | | | — | | | | 1,043,855 | | | | — | | | | 1,043,855 | |
Contingent Capital Securities | | | — | | | | 645,250 | | | | — | | | | 645,250 | |
Municipal Bonds | | | — | | | | 588,320 | | | | — | | | | 588,320 | |
$25 Par (or similar) Retail Preferred | | | 159,720 | | | | — | | | | — | | | | 159,720 | |
| | | | |
Short-Term Investments: | | | | | | | | | | | | | | | | |
Repurchase Agreements | | | — | | | | 2,417,283 | | | | — | | | | 2,417,283 | |
| | | | |
Investments in Derivatives: | | | | | | | | | | | | | | | | |
Futures Contracts** | | | 20,168 | | | | — | | | | — | | | | 20,168 | |
Interest Rate Swaps** | | | — | | | | (1,178,616 | ) | | | — | | | | (1,178,616 | ) |
Total | | $ | 179,888 | | | $ | 99,047,025 | | | $ | — | | | $ | 99,226,913 | |
| * | Refer to the Fund’s Portfolio of Investments for industry and country classifications, where applicable. |
| ** | Represents net unrealized appreciation (depreciation) as reported in the Fund’s Portfolio of Investments. |
32
4. Portfolio Securities and Investments in Derivatives
Portfolio Securities
Dollar Roll Transactions
The Fund may enter into mortgage dollar rolls in which a Fund sells mortgage securities for delivery in the current month, realizing a gain (loss), and simultaneously contracts to repurchase similar securities on a specified future date. During the roll period, a Fund forgoes principal and interest paid on the securities. The Fund is compensated by the interest earned on the cash proceeds of the initial sale and by the lower repurchase price at the future date. The difference between the sales proceeds and the repurchase price is recorded as a realized gain or loss.
Repurchase Agreements
In connection with transactions in repurchase agreements, it is the Fund’s policy that its custodian take possession of the underlying collateral securities, the fair value of which exceeds the principal amount of the repurchase transaction, including accrued interest, at all times. If the counterparty defaults, and the fair value of the collateral declines, realization of the collateral may be delayed or limited.
The following table presents the repurchase agreements for the Fund that are subject to netting agreements as of the end of the reporting period, and the collateral delivered related to those repurchase agreements.
| | | | | | | | |
| Counterparty | | Short-Term
Investments, at Value | | | Collateral
Pledged (From)
Counterparty | |
Fixed Income Clearing Corporation | | $ | 2,417,283 | | | $ | (2,465,766 | ) |
Zero Coupon Securities
A zero coupon security does not pay a regular interest coupon to its holders during the life of the security. Income to the holder of the security comes from accretion of the difference between the original purchase price of the security at issuance and the par value of the security at maturity and is effectively paid at maturity. The market prices of zero coupon securities generally are more volatile than the market prices of securities that pay interest periodically.
Investment Transactions
Long-term purchases and sales (including maturities and dollar roll transactions, but excluding derivative transactions) during the current fiscal period aggregated $104,413,258 and $105,832,650 respectively.
The Fund may purchase securities on a when-issued or delayed-delivery basis. Securities purchased on a when-issued or delayed-delivery basis may have extended settlement periods; interest income is not accrued until settlement date. Any securities so purchased are subject to market fluctuation during this period. The Fund has earmarked securities in its portfolio with a current value at least equal to the amount of the when-issued/delayed-delivery purchase commitments. If the Fund has outstanding when-issued/delayed-delivery purchases commitments as of the end of the reporting period, such amounts are recognized on the Statement of Assets and Liabilities.
Investments in Derivatives
The Fund is authorized to invest in certain derivative instruments such as futures, options and swap contracts. The Fund limits its investments in futures, options on futures and swap contracts to the extent necessary for the Adviser to claim the exclusion from registration by the Commodity Futures Trading Commission as a commodity pool operator with respect to the Fund. The Fund records derivative instruments at fair value, with changes in fair value recognized on the Statement of Operations, when applicable. Even though the Fund’s investments in derivatives may represent economic hedges, they are not considered to be hedge transactions for financial reporting purposes.
Futures Contracts
Upon execution of a futures contract, the Fund is obligated to deposit cash or eligible securities, also known as “initial margin,” into an account at its clearing broker equal to a specified percentage of the contract amount. Cash held by the broker to cover initial margin requirements on open futures contracts, if any, is recognized as “Cash collateral at brokers for investments in futures contracts” on the Statement of Assets and Liabilities. Investments in futures contracts obligate the Fund and the clearing broker to settle monies on a daily basis representing changes in the prior days “mark-to-market” of the open contracts. If the Fund has unrealized appreciation the clearing broker will credit the Fund’s account with an amount equal to appreciation. Conversely, if the Fund has unrealized depreciation the clearing broker will debit the Fund’s account with an amount equal to depreciation. These daily cash settlements are also known as “variation margin.” Variation margin is recognized as a receivable and/or payable for “Variation margin on futures contracts” on the Statement of Assets and Liabilities.
33
Notes to Financial Statements (continued)
During the period the futures contract is open, changes in the value of the contract are recognized as an unrealized gain or loss by “marking-to-market” on a daily basis to reflect the changes in market value of the contract, which is recognized as a component of “Change in net unrealized appreciation (depreciation) of futures contracts” on the Statement of Operations. When the contract is closed or expired, a Fund records a realized gain or loss equal to the difference between the value of the contract on the closing date and value of the contract when originally entered into, which is recognized as a component of “Net realized gain (loss) from futures contracts” on the Statement of Operations.
Risks of investments in futures contracts include the possible adverse movement in the price of the securities or indices underlying the contracts, the possibility that there may not be a liquid secondary market for the contracts and/or that a change in the value of the contract may not correlate with a change in the value of the underlying securities or indices.
During the current fiscal period, the Fund used U.S. Treasury futures as part of an overall portfolio construction strategy to manage portfolio duration and yield curve exposure.
The average notional amount of futures contracts outstanding during the current fiscal period was as follows:
| | | | |
Average notional amount of futures contracts outstanding* | | | $11,226,281 | |
| * | The average notional amount is calculated based on the absolute aggregate notional amount of contracts outstanding at the beginning of the current fiscal period and at the end of each fiscal quarter within the current fiscal period. |
The following table presents the fair value of all futures contracts held by the Fund as of the end of the reporting period, the location of these instruments on the Statement of Assets and Liabilities and the primary underlying risk exposure.
| | | | | | | | | | | | | | | | | | |
| | | | | Location on the Statement of Assets and Liabilities | |
Underlying
Risk Exposure | | Derivative
Instrument | | Asset Derivatives | | | | | | (Liability) Derivatives | |
| | Location | | Value | | | | | | Location | | Value | |
| Interest rate | | Futures contracts | | Receivable for variation margin on futures contracts* | | $ | 62,982 | | | | | | | Payable for variation margin on futures contracts* | | $ | (42,814 | ) |
| * | Value represents unrealized appreciation (depreciation) of futures contracts as reported in the Fund’s Portfolio of Investments and not the asset and/or liability derivative location as described in the table above. |
The following table presents the amount of net realized gain (loss) and change in net unrealized appreciation (depreciation) recognized on futures contracts on the Statement of Operations during the current fiscal period, and the primary underlying risk exposure.
| | | | | | | | | | |
| Underlying Risk Exposure | | Derivative Instrument | | Net Realized
Gain (Loss)
from Futures
Contracts | | | Change in Net
Unrealized
Appreciation
(Depreciation) of
Futures Contracts | |
| Interest rate | | Futures contracts | | $ | (373,095 | ) | | $ | 29,867 | |
Interest Rate Swap Contracts
Interest rate swap contracts involve the Fund’s agreement with the counterparty to pay or receive a fixed rate payment in exchange for the counterparty receiving or paying a variable rate payment. Forward interest rate swap contracts involve the Fund’s agreement with a counterparty to pay, in the future, a fixed or variable rate payment in exchange for the counterparty paying the Fund a variable or fixed rate payment, the accruals for which would begin at a specified date in the future (the “effective date”).
The amount of the payment obligation for an interest rate swap is based on the notional amount and the termination date of the contract. Interest rate swap contracts do not involve the delivery of securities or other underlying assets or principal. Accordingly, the risk of loss with respect to the swap counterparty on such transactions is limited to the net amount of interest payments that the Fund is to receive.
Interest rate swap contracts are valued daily. Upon entering into an interest rate swap contract (and beginning on the effective date for a forward interest rate swap contract), the Fund accrues the fixed rate payment expected to be paid or received and the variable rate payment expected to be received or paid on the interest rate swap contracts on a daily basis, and recognizes the daily change in the fair value of the Fund’s contractual rights and obligations under the contracts. For an over-the-counter (“OTC”) swap that is not cleared through a clearing house (“OTC Uncleared”), the amount recorded on these transactions is recognized on the Statement of Assets and Liabilities as a component of “Unrealized appreciation or depreciation on interest rate swaps.”
Upon the execution of an OTC swap cleared through a clearing house (“OTC Cleared”), the Fund is obligated to deposit cash or eligible securities, also known as “initial margin,” into an account at its clearing broker equal to a specified percentage of the contract amount. Cash deposited by the Fund to cover initial margin requirements on open swap contracts, if any, is recognized as a component of “Cash collateral at brokers for investments in swaps” on the Statement of Assets and Liabilities. Investments in OTC Cleared swaps obligate the Fund and the clearing broker to settle monies on a daily basis
34
representing changes in the prior day’s “mark-to-market” of the swap contract. If the Fund has unrealized appreciation, the clearing broker will credit the Fund’s account with an amount equal to the appreciation. Conversely, if the Fund has unrealized depreciation, the clearing broker will debit the Fund’s account with an amount equal to the depreciation. These daily cash settlements are also known as “variation margin.” Variation margin for OTC Cleared swaps is recognized as a receivable and/or payable for “Variation margin on swap contracts” on the Statement of Assets and Liabilities. Upon the execution of an OTC Uncleared swap, neither the Fund nor the counterparty is required to deposit initial margin as the trades are recorded bilaterally between both parties to the swap contract, and the terms of the variation margin are subject to a predetermined threshold negotiated by the Fund and the counterparty. Variation margin for OTC Uncleared swaps is recognized as a component of “Unrealized appreciation or depreciation on interest rate swaps” as described in the preceding paragraph.
The net amount of periodic payments settled in cash are recognized as a component of “Net realized gain (loss) from swaps” on the Statement of Operations, in addition to the net realized gain or loss recorded upon the termination of the swap contract. For tax purposes, payments expected to be received or paid on the swap contracts are treated as ordinary income or expense, respectively. Changes in the value of the swap contracts during the fiscal period are recognized as a component of “Change in net unrealized appreciation (depreciation) of swaps” on the Statement of Operations. In certain instances, payments are made or received upon entering into the swap contract to compensate for differences between the stated terms of the swap agreements and prevailing market conditions (credit spreads, currency exchange rates, interest rates, and other relevant factors). Payments received or made at the beginning of the measurement period, if any, are recognized as “Interest rate swaps premiums received and/or paid” on the Statement of Assets and Liabilities.
During the current fiscal period, the Fund used interest rate swap contracts to partially hedge its interest cost of leverage.
The average notional amount of interest rate swap contracts outstanding during the current fiscal period was as follows:
| | | | |
Average notional amount of interest rate swap contracts outstanding* | | $ | 17,000,000 | |
| * | The average notional amount is calculated based on the outstanding notional at the beginning of the current fiscal period and at the end of each fiscal quarter within the current fiscal period. |
The following table presents the fair value of all swap contracts held by the Fund as of the end of the reporting period, the location of these instruments on the Statement of Assets and Liabilities and the primary underlying risk exposure.
| | | | | | | | | | | | | | | | | | |
| | | | | Location on the Statements of Assets and Liabilities | |
Underlying Risk Exposure | | Derivative Instrument | | Asset Derivatives | | | | | | (Liability) Derivatives | |
| | Location | | Value | | | | | | Location | | Value | |
| Interest rate | | Swaps (OTC Uncleared) | | — | | $ | — | | | | | | | Unrealized depreciation on interest rate swaps | | $ | (1,178,616 | ) |
The following table presents the swap contracts subject to netting agreements and the collateral delivered related to those swap contracts as of the end of the reporting period.
| | | | | | | | | | | | | | | | | | | | | | | | |
| | | | | | | | | | | | Gross Amounts not
offset on the Statement of
Assets and Liabilities | | | | |
| Counterparty | | Gross
Unrealized
Appreciation
on Interest
Rate Swaps** | | | Gross
Unrealized
(Depreciation)
on Interest
Rate Swaps** | | | Net Unrealized
Appreciation
(Depreciation) on
Interest Rate
Swaps | | | Interest
Rate Swaps
Premiums Paid | | | Collateral
Pledged to (from)
Counterparty | | | Net
Exposure | |
Morgan Stanley Capital Services LLC | | $ | — | | | $ | (1,178,616 | ) | | $ | (1,178,616 | ) | | $ | — | | | $ | 1,324,826 | | | $ | 146,210 | |
| ** | Represents gross unrealized appreciation (depreciation) for the counterparty as reported in the Fund’s Portfolio of Investments. |
The following table presents the amount of net realized gain (loss) and change in net unrealized appreciation (depreciation) recognized on swap contracts on the Statement of Operations during the current fiscal period, and the primary underlying risk exposure.
| | | | | | | | | | | | |
Underlying Risk Exposure | | Derivative
Instrument | | Net Realized
Gain (Loss)
from Swaps | | | Change in Net
Unrealized
Appreciation
(Depreciation)
of Swaps | |
| Interest rate | | | | Swaps | | $ | (314,292 | ) | | $ | 839,707 | |
35
Notes to Financial Statements (continued)
Market and Counterparty Credit Risk
In the normal course of business the Fund may invest in financial instruments and enter into financial transactions where risk of potential loss exists due to changes in the market (market risk) or failure of the other party to the transaction to perform (counterparty credit risk). The potential loss could exceed the value of the financial assets recorded on the financial statements. Financial assets, which potentially expose the Fund to counterparty credit risk, consist principally of cash due from counterparties on forward, option and swap transactions, when applicable. The extent of the Fund’s exposure to counterparty credit risk in respect to these financial assets approximates their carrying value as recorded on the Statement of Assets and Liabilities.
The Fund helps manage counterparty credit risk by entering into agreements only with counterparties the Adviser believes have the financial resources to honor their obligations and by having the Adviser monitor the financial stability of the counterparties. Additionally, counterparties may be required to pledge collateral daily (based on the daily valuation of the financial asset) on behalf of the Fund with a value approximately equal to the amount of any unrealized gain above a pre-determined threshold. Reciprocally, when the Fund has an unrealized loss, the Fund has instructed the custodian to pledge assets of the Fund as collateral with a value approximately equal to the amount of the unrealized loss above a pre-determined threshold. Collateral pledges are monitored and subsequently adjusted if and when the valuations fluctuate, either up or down, by at least the pre-determined threshold amount.
5. Fund Shares
Common Share Transactions
The Fund did not have any transactions in common shares during the current and prior fiscal periods.
6. Income Tax Information
The Fund intends to distribute substantially all of its net investment company taxable income to common shareholders and to otherwise comply with the requirements of Subchapter M of the Internal Revenue Code applicable to regulated investment companies. Therefore, no federal income tax provision is required.
For all open tax years and all major taxing jurisdictions, management of the Fund has concluded that there are no significant uncertain tax positions that would require recognition in the financial statements. Open tax years are those that are open for examination by taxing authorities (i.e., generally the last four tax year ends and the interim tax period since then). Furthermore, management of the Fund is also not aware of any tax positions for which it is reasonably possible that the total amounts of unrecognized tax benefits will significantly change in the next twelve months.
The following information is presented on an income tax basis. Differences between amounts for financial statement and federal income tax purposes are primarily due to timing differences in recognizing certain gains and losses on investment transactions. To the extent that differences arise that are permanent in nature, such amounts are reclassified within the capital accounts as detailed below. Temporary differences do not require reclassification. Temporary and permanent differences do not impact the common share NAV of the Fund.
The table below presents the cost and unrealized appreciation (depreciation) of the Fund’s investment portfolio, as determined on a federal income tax basis as of June 30, 2021.
For purposes of this disclosure, derivative tax cost is generally the sum of any upfront fees or premiums exchanged and any amounts unrealized for income statement reporting but realized in income and/or capital gains for tax reporting. If a particular derivative category does not disclose any tax unrealized appreciation or depreciation, the change in value of those derivatives have generally been fully realized for tax purposes.
| | | | |
Tax cost of investments | | $ | 98,116,824 | |
Gross unrealized: | | | | |
Appreciation | | $ | 2,961,016 | |
Depreciation | | | (1,850,927 | ) |
Net unrealized appreciation (depreciation) of investments | | $ | 1,110,089 | |
|
| Permanent differences, primarily due to paydowns, bond premium amortization adjustments, treatment of notional principal contracts and complex securities character adjustments, resulted in reclassifications among the Fund’s components of net assets as of June 30, 2021, the Fund’s tax year end. | |
|
| The tax components of undistributed net ordinary income and net long-term capital gains as of June 30, 2021, the Fund’s tax year end, were as follows: | |
Undistributed net ordinary income1 | | $ | 19,914 | |
Undistributed net long-term capital gains | | | — | |
| 1 | Net ordinary income consists of net taxable income derived from dividends, interest, and net short-term capital gains, if any. |
36
The tax character of distributions paid during the Fund’s tax years ended June 30, 2021 and June 30, 2020, was designated for purposes of the dividends paid deduction as follows:
| | | | |
| 2021 | | | |
Distributions from net ordinary income1 | | $ | 3,061,070 | |
Distributions from net long-term capital gains | | | — | |
| |
| 2020 | | | |
Distributions from net ordinary income1 | | $ | 3,292,898 | |
Distributions from net long-term capital gains | | | — | |
| 1 | Net ordinary income consists of net taxable income derived from dividends, interest, and net short-term capital gains, if any. |
As of June 30, 2021, the Fund’s tax year end, the Fund had unused capital losses carrying forward available for federal income tax purposes to be applied against future capital gains, if any. The capital losses are not subject to expiration.
| | | | |
Not subject to expiration: | | | | |
Short-term | | $ | 517,313 | |
Long-term | | | 8,759,501 | |
Total | | $ | 9,276,814 | |
7. Management Fees
The Fund’s management fee compensates the Adviser for overall investment advisory and administrative services and general office facilities. The Sub-Adviser is compensated for its services to the Fund from the management fees paid to the Adviser.
The Fund’s management fee consists of two components – a fund-level fee, based only on the amount of assets within the Fund, and a complex-level fee, based on the aggregate amount of all eligible fund assets managed by the Adviser. This pricing structure enables Fund shareholders to benefit from growth in the assets within the Fund as well as from growth in the amount of complex-wide assets managed by the Adviser.
The annual fund-level fee, payable monthly, is calculated according to the following schedule:
| | | | |
| Average Daily Managed Assets* | | Fund-Level Fee Rate | |
For the first $125 million | | | 0.7000 | % |
For the next $125 million | | | 0.6875 | |
For the next $150 million | | | 0.6750 | |
For the next $600 million | | | 0.6625 | |
For managed assets over $1 billion | | | 0.6500 | |
37
Notes to Financial Statements (continued)
The annual complex-level fee, payable monthly, is calculated by multiplying the current complex-wide fee rate, determined according to the following schedule by the Fund’s daily managed assets:
| | | | |
| Complex-Level Eligible Asset Breakpoint Level* | | Effective Complex-Level Fee Rate at Breakpoint Level | |
$55 billion | | | 0.2000 | % |
$56 billion | | | 0.1996 | |
$57 billion | | | 0.1989 | |
$60 billion | | | 0.1961 | |
$63 billion | | | 0.1931 | |
$66 billion | | | 0.1900 | |
$71 billion | | | 0.1851 | |
$76 billion | | | 0.1806 | |
$80 billion | | | 0.1773 | |
$91 billion | | | 0.1691 | |
$125 billion | | | 0.1599 | |
$200 billion | | | 0.1505 | |
$250 billion | | | 0.1469 | |
$300 billion | | | 0.1445 | |
| * | For the complex-level fees, managed assets include closed-end fund assets managed by the Adviser that are attributable to certain types of leverage. For these purposes, leverage includes the funds’ use of preferred stock and borrowings and certain investments in the residual interest certificates (also called inverse floating rate securities) in tender option bond (TOB) trusts, including the portion of assets held by a TOB trust that has been effectively financed by the trust’s issuance of floating rate securities, subject to an agreement by the Adviser as to certain funds to limit the amount of such assets for determining managed assets in certain circumstances. The complex-level fee is calculated based upon the aggregate daily managed assets of all Nuveen open-end and closed-end funds that constitute “eligible assets.” Eligible assets do not include assets attributable to investments in other Nuveen funds or assets in excess of a determined amount (originally $2 billion) added to the Nuveen fund complex in connection with the Adviser’s assumption of the management of the former First American Funds effective January 1, 2011, but do include certain assets of certain Nuveen Funds that were reorganized into funds advised by an affiliate of the Adviser during the 2019 calendar year. As of June 30, 2021, the complex-level fee for the Fund was 0.1539%. |
8. Fund Leverage
Reverse Repurchase Agreements
During the current fiscal period, the Fund entered into reverse repurchase agreements as a means of leverage.
The Fund may enter into a reverse repurchase agreement with brokers, dealers, banks or other financial institutions that have been determined by the Adviser to be creditworthy. In a reverse repurchase agreement, the Fund sells to the counterparty a security that it holds with a contemporaneous agreement to repurchase the same security at an agreed-upon price and date, reflecting the interest rate effective for the term of the agreement. It may also be viewed as the borrowing of money by the Fund. Cash received in exchange for securities delivered, plus accrued interest payments to be made by the Fund to a counterparty, are reflected as a liability on the Statement of Assets and Liabilities. Interest payments made by the Fund to counterparties are recognized as a component of “Interest expense” on the Statement of Operations.
In a reverse repurchase agreement, the Fund retains the risk of loss associated with the sold security. In order to minimize risk, the Fund identifies for coverage securities and cash as collateral with a fair value at least equal to its purchase obligations under these agreements (including accrued interest). Reverse repurchase agreements also involve the risk that the purchaser fails to return the securities as agreed upon, files for bankruptcy or becomes insolvent. Upon a bankruptcy or insolvency of a counterparty, the Fund is considered to be an unsecured creditor with respect to excess collateral and as such the return of excess collateral may be delayed. The Fund will pledge assets determined to be liquid by the Adviser to cover its obligations under reverse repurchase agreements.
As of the end of the reporting period, the Fund’s outstanding balances on its reverse repurchase agreements were as follows:
| | | | | | | | | | | | | | | | | | | | |
| Counterparty | | Coupon | | | Principal
Amount | | | Maturity | | | Value | | | Value and
Accrued
Interest | |
BNP Paribas | | | 0.150 | % | | $ | (12,527,000 | ) | | | 7/07/21 | | | $ | (12,527,000 | ) | | $ | (12,528,253 | ) |
Goldman Sachs | | | 0.220 | % | | | (4,805,000 | ) | | | 7/07/21 | | | | (4,805,000 | ) | | | (4,805,705 | ) |
| TD Securities (USA), LLC | | | 0.557 | % | | | (5,015,000 | ) | | | 7/01/21 | | | | (5,015,000 | ) | | | (5,017,096 | ) |
| | | | | | | $ | (22,347,000 | ) | | | | | | $ | (22,347,000 | ) | | $ | (22,351,054 | ) |
During the current fiscal period, the average daily balance outstanding (which was for the entire current reporting period) and average interest rate on the Fund’s reverse repurchase agreements were as follows:
| | | | |
| Average daily balance outstanding | | $ | 22,930,382 | |
| Average interest rate | | | 0.30 | % |
38
The following table presents the reverse repurchase agreements subject to netting agreements and the collateral delivered related to those reverse repurchase agreements.
| | | | | | | | |
| Counterparty | | Reverse Repurchase
Agreements* | | | Collateral Pledged
to Counterparty | |
BNP Paribas | | $ | (12,528,253 | ) | | $ | 13,453,977 | |
Goldman Sachs | | | (4,805,705 | ) | | | 5,065,803 | |
TD Securities (USA), LLC | | | (5,017,096 | ) | | | 5,899,680 | |
| | | $ | (22,351,054 | ) | | $ | 24,419,460 | |
| * | Represents gross value and accrued interest for the counterparty as reported in the preceding table. |
9. Borrowing Arrangements
Inter-Fund Borrowing and Lending
The SEC has granted an exemptive order permitting registered open-end and closed-end Nuveen funds to participate in an inter-fund lending facility whereby the Nuveen funds may directly lend to and borrow money from each other for temporary purposes (e.g., to satisfy redemption requests or when a sale of securities “fails,” resulting in an unanticipated cash shortfall) (the “Inter-Fund Program”). The closed-end Nuveen funds, including the Fund covered by this shareholder report, will participate only as lenders, and not as borrowers, in the Inter-Fund Program because such closed-end funds rarely, if ever, need to borrow cash to meet redemptions. The Inter-Fund Program is subject to a number of conditions, including, among other things, the requirements that (1) no fund may borrow or lend money through the Inter-Fund Program unless it receives a more favorable interest rate than is typically available from a bank or other financial institution for a comparable transaction; (2) no fund may borrow on an unsecured basis through the Inter-Fund Program unless the fund’s outstanding borrowings from all sources immediately after the inter-fund borrowing total 10% or less of its total assets; provided that if the borrowing fund has a secured borrowing outstanding from any other lender, including but not limited to another fund, the inter-fund loan must be secured on at least an equal priority basis with at least an equivalent percentage of collateral to loan value; (3) if a fund’s total outstanding borrowings immediately after an inter-fund borrowing would be greater than 10% of its total assets, the fund may borrow through the inter-fund loan on a secured basis only; (4) no fund may lend money if the loan would cause its aggregate outstanding loans through the Inter-Fund Program to exceed 15% of its net assets at the time of the loan; (5) a fund’s inter-fund loans to any one fund shall not exceed 5% of the lending fund’s net assets; (6) the duration of inter-fund loans will be limited to the time required to receive payment for securities sold, but in no event more than seven days; and (7) each inter-fund loan may be called on one business day’s notice by a lending fund and may be repaid on any day by a borrowing fund. In addition, a Nuveen fund may participate in the Inter-Fund Program only if and to the extent that such participation is consistent with the fund’s investment objective and investment policies. The Board is responsible for overseeing the Inter-Fund Program.
The limitations detailed above and the other conditions of the SEC exemptive order permitting the Inter-Fund Program are designed to minimize the risks associated with Inter-Fund Program for both the lending fund and the borrowing fund. However, no borrowing or lending activity is without risk. When a fund borrows money from another fund, there is a risk that the loan could be called on one day’s notice or not renewed, in which case the fund may have to borrow from a bank at a higher rate or take other actions to payoff such loan if an inter-fund loan is not available from another fund. Any delay in repayment to a lending fund could result in a lost investment opportunity or additional borrowing costs.
During the current reporting period, the Fund did not enter into any inter-fund loan activity.
39
SHAREHOLDER UPDATE
(UNAUDITED)
CURRENT INVESTMENT OBJECTIVE, INVESTMENT POLICIES AND PRINCIPAL RISKS OF THE FUND
NUVEEN MULTI-MARKET INCOME FUND (JMM)
Investment Objective
The Fund’s investment objective is to provide high monthly income consistent with prudent risk to capital.
Investment Policies
The Fund invests primarily in debt securities including, but not limited to residential and commercial mortgage-backed securities (both U.S. agency-backed and privately issued), asset-backed securities, corporate debt obligations, convertible debt securities, U.S government securities, municipal securities, repurchase agreements, dollar denominated debt obligations of foreign governments, and short-term, high quality fixed-income investments. The Fund also may invest in preferred stock. Preferred stock and convertible securities have characteristics of both common stock and debt.
The fund may invest in securities of any maturity.
“Managed Assets” mean the total assets of the Fund, minus the sum of its accrued liabilities (other than Fund liabilities incurred for the express purpose of creating leverage). Total assets shall include assets attributable to the Fund’s use of leverage (whether or not those assets are reflected in the Fund’s financial statements for purposes of generally accepted accounting principles), and derivatives will be valued at their market value.
Under normal circumstances:
| | • | | The Fund will invest at least 65% of its total assets in securities that are rated investment grade at the time of purchase or are unrated and of comparable quality as determined by the Fund’s investment adviser. |
| | • | | The Fund may invest up to 35% of its total assets in securities that, at the time of purchase, are rated lower than investment grade or of comparable quality. These non-investment-grade securities are commonly referred to as “high yield” or “junk” bonds. |
| | • | | The Fund will not purchase futures or options on futures or sell futures if as a result the sum of the initial margin deposits on the Fund’s existing futures positions and premiums paid for outstanding options on futures contracts would exceed 5% of the Fund’s total assets. (For options that are “in-the-money” at the time of purchase, the amount by which the option is “in-the-money” is excluded from this calculation). |
The foregoing policies apply only at the time of any new investment.
Approving Changes in Investment Policies
The Board of Trustees of the Fund may change the policies described above without a shareholder vote.
Portfolio Contents
The Fund generally invests primarily in debt securities including, but not limited to residential and commercial mortgage-backed securities (“RMBS” and “CMBS”) (both U.S. agency-backed and privately issued), asset-backed securities (“ABS”), corporate debt obligations, convertible debt securities, U.S government securities, municipal securities, repurchase agreements, dollar denominated debt obligations of foreign governments, and short-term, high quality fixed-income investments.
The Fund may invest in mortgage-backed securities (“MBS”). MBS are structured debt obligations collateralized by pools of commercial or residential mortgages. Pools of mortgage loans and mortgage-related loans, such as mezzanine loans, are assembled into pools of assets that secure or back securities sold to investors by various governmental, government-related and private organizations. MBS in which the Fund may invest include those with fixed, floating or variable interest rates, those with interest rates that change based on a specified index of interest rates and those with interest rates that change inversely to changes in interest rates, as well as those that do not bear interest.
The Fund may invest in RMBS. RMBS are securities with payments which depend (except for rights or other assets designed to assure the servicing or timely distribution of proceeds to holders of such securities) primarily on the cash flow from residential mortgage loans made to borrowers that are secured on a first priority basis or second priority basis, subject to permitted liens, easements and other encumbrances by residential real estate (one-to four-family properties) the proceeds of which are used to purchase real estate and purchase or construct dwellings thereon (or to refinance indebtedness previously so used). Residential mortgage loans are obligations of the borrowers thereunder only and are not typically insured or guaranteed by any other person or entity. The ability of a borrower to repay a loan secured by residential property is dependent upon the income or assets of the borrower. A number of factors, including a general economic downturn, acts of God, terrorism, social unrest and civil disturbances, may impair borrowers’ abilities to repay their loans.
40
The Fund may invest in CMBS. CMBS generally are multi-class debt or pass-through certificates secured or backed by mortgage loans on commercial properties. CMBS generally are structured to provide protection to the senior class investors against potential losses on the underlying mortgage loans. This protection generally is provided by having the holders of subordinated classes of securities take the first loss if there are defaults on the underlying commercial mortgage loans. Other protection, which may benefit all of the classes or particular classes, may include issuer guarantees, reserve funds, cross-collateralization and over-collateralization. The Fund may invest in CMBS issued or sponsored by commercial banks, savings and loan institutions, mortgage bankers, private mortgage insurance companies and other non-governmental issuers. CMBS have no governmental guarantee.
The Fund may also invest in ABS. ABS are securities that are primarily serviced by the cash flows of a discrete pool of receivables or other financial assets, either fixed or revolving, that by their terms convert into cash within a finite time period. Asset-backed securitization is a financing technique in which financial assets, in many cases themselves less liquid, are pooled and converted into instruments that may be offered and sold in the capital markets. While residential mortgages were the first financial assets to be securitized in the form of MBS, non-mortgage related securitizations have grown to include many other types of financial assets, such as credit card receivables, auto loans and student loans.
The Fund’s investments in debt securities may include investment grade and below investment grade securities. Below investment grade securities (such securities are commonly referred to as “high yield” or “junk”) generally provide high income in an effort to compensate investors for their higher risk of default, which is the failure to make required interest or principal payments.
The Fund may invest in U.S. Government securities. U.S. Government securities include (1) U.S. Treasury obligations, which differ in their interest rates, maturities and times of issuance: U.S. Treasury bills (maturities of one year or less), U.S. Treasury notes (maturities of one year to ten years) and U.S. Treasury bonds (generally maturities of greater than ten years) and (2) obligations issued or guaranteed by U.S. Government agencies and instrumentalities that are supported by any of the following: (i) the full faith and credit of the U.S. Treasury, (ii) the right of the issuer to borrow an amount limited to a specific line of credit from the U.S. Treasury, (iii) discretionary authority of the U.S. Government to purchase certain obligations of the U.S. Government agency or instrumentality or (iv) the credit of the agency or instrumentality.
The Fund may invest in corporate debt securities, including corporate bonds. Corporate debt securities are fully taxable debt obligations issued by corporations. These securities fund capital improvements, expansions, debt refinancing or acquisitions that require more capital than would ordinarily be available from a single lender. Investors in corporate debt securities lend money to the issuing corporation in exchange for interest payments and repayment of the principal at a set maturity date. Rates on corporate debt securities are set according to prevailing interest rates at the time of the issue, the credit rating of the issuer, the length of the maturity and other terms of the security, such as a call feature.
The Fund may invest in convertible securities, which may include convertible debt, convertible preferred stock, synthetic convertible securities and may also include secured and unsecured debt, based upon the judgment of the Fund’s sub-adviser. Convertible securities may pay interest or dividends that are based on a fixed or floating rate. A convertible security is a preferred stock, warrant or other security that may be converted into or exchanged for a prescribed amount of common stock or other security of the same or a different issuer or into cash within a particular period of time at a specified price or formula.
The Fund may invest in securities issued by foreign companies, including securities issued by companies located in emerging market countries.
The Fund may invest in international debt securities of foreign governments. These securities will be U.S. dollar denominated and include debt obligations issued or guaranteed by foreign national, provincial, state, municipal or other governments with taxing authority or by their agencies or instrumentalities.
The Fund may invest in emerging market debt securities. Emerging market debt securities include a broad range of securities of emerging market issuers such as sovereign bonds, corporate bonds, and other sovereign or quasi-sovereign debt instruments. The Fund will classify an issuer of a security as being a U.S. or non-U.S. issuer based on the determination of an unaffiliated, recognized financial data provider. Such determinations are based on a number of criteria, such as the issuer’s country of domicile, the primary exchange on which the security predominately trades, the location from which the majority of the issuer’s revenue comes, and the issuer’s reporting currency. Furthermore, a country is considered to be an “emerging market” if it has a relatively low gross national product per capita compared to the world’s major economies and the potential for rapid economic growth. The Fund considers a country an emerging market country based on the determination of an international organization, such as the IMF, or an unaffiliated, recognized financial data provider.
The Fund may invest in taxable and tax-exempt municipal securities. Municipal securities include municipal bonds, notes, securities issued to finance and refinance public projects, certificates of participation, variable rate demand obligations, lease obligations, municipal notes, pre-refunded municipal bonds, private activity bonds, securities issued by tender option bond trusts, including inverse floating rate securities, and other forms of municipal bonds and securities, and other related instruments that create exposure to municipal bonds, notes and securities that provide for the payment of interest income that is exempt from regular U.S. federal income tax.
41
Shareholder Update (continued)
(Unaudited)
Municipal securities are debt obligations generally issued by states, cities and local authorities and certain possessions and territories of the United States (such as Puerto Rico and Guam) to finance or refinance public purpose projects such as roads, schools, and water supply systems.
The Fund may enter into mortgage dollar rolls in which the Fund sells mortgage securities for delivery in the current month, realizing a gain (loss), and simultaneously contracts to repurchase similar securities on a specified future date. During the roll period, the Fund forgoes principal and interest paid on the securities. The Fund is compensated by the interest earned on the cash proceeds of the initial sale and by the lower repurchase price at the future date. The difference between the sales proceeds and the repurchase price is recorded as a realized gain or loss.
The Fund may enter into repurchase agreements (the purchase of a security coupled with an agreement to resell that security at a higher price) with respect to its permitted investments. The Fund’s repurchase agreements will provide that the value of the collateral underlying the repurchase agreement will always be at least equal to the repurchase price, including any accrued interest earned on the agreement, and will be marked-to-market daily. The Fund may also utilize reverse repurchase agreements when it is anticipated that the interest income to be earned from the investment of the proceeds of the transaction is greater than the interest expense of the transaction.
The Fund may invest in contingent capital securities (sometimes referred to as “CoCos”). CoCos are hybrid securities, issued primarily by non-U.S. financial institutions, which have loss absorption mechanisms benefitting the issuer built into their terms. CoCos generally provide for mandatory conversion into the common stock of the issuer or a write-down of the principal amount or value of the CoCos upon the occurrence of certain triggers linked to regulatory capital thresholds. In addition, they may provide for mandatory conversion or a principal write-down upon the occurrence of certain events such as regulatory actions calling into question the issuing banking institution’s continued viability as a going-concern. Equity conversion or principal write-down features are tailored to the issuer and its regulatory requirements and, unlike traditional convertible securities, conversions are not voluntary.
The Fund may invest in zero coupon bonds. A zero coupon bond is a bond that typically does not pay interest for the entire life of the obligation or for an initial period after the issuance of the obligation.
The Fund may buy and sell securities on a when-issued or delayed delivery basis, making payment or taking delivery at a later date, normally within 15 to 45 days of the trade date.
The Fund may enter into certain derivative instruments in pursuit of its investment objective, including to seek to enhance return, to hedge certain risks of its investments or as a substitute for a position in the underlying asset. Such instruments include financial futures contracts, swap contracts (including total return, interest rate and credit default swaps), interest rate caps, collars and floors, options on financial futures, options on swap contracts or other derivative instruments.
The Fund may invest in illiquid securities (i.e., securities that are not readily marketable), including, but not limited to, restricted securities (securities the disposition of which is restricted under the federal securities laws), securities that may be resold only pursuant to Rule 144A under the Securities Act of 1933, as amended (the “1933 Act”), and repurchase agreements with maturities in excess of seven days.
The Fund may also invest in securities of other open- or closed-end investment companies (including exchange-traded funds (“ETFs”)) that invest primarily in securities of the types in which the Fund may invest directly, to the extent permitted by the Investment Company Act of 1940, as amended (the “1940 Act”), the rules and regulations issued thereunder and applicable exemptive orders issued by the Securities and Exchange Commission (“SEC”).
Use of Leverage
The Fund uses leverage to pursue its investment objective. The Fund may use leverage to the extent permitted by the 1940 Act. The Fund may source leverage through a number of methods including reverse repurchase agreements and dollar roll transactions. As a fundamental policy, the Fund may only borrow funds in amounts not exceeding 33-1/3% of its total assets. The amount and sources of leverage will vary depending on market conditions.
With respect to the Fund’s fundamental policy that it may only borrow funds in amounts not exceeding 33-1/3% of its total assets, such policy may not be changed without the approval of the holders of a majority of the outstanding common shares and preferred shares voting together as a single class, and the approval of the holders of a majority of the outstanding preferred shares, voting separately as a single class. A “majority of the outstanding” shares means (i) 67% or more of the shares present at a meeting, if the holders of more than 50% of the shares are present or represented by proxy or (ii) more than 50% of the shares, whichever is less.
Temporary Defensive Periods
During temporary defensive periods, the Fund may deviate from its investment policies and objective. During such periods, the Fund may invest up to 100% of its assets in high quality, short-term securities, and in short-, intermediate-, or long-term U.S. Treasury securities. There can be no assurance that such techniques will be successful. Accordingly, during such periods, the Fund may not achieve its investment objective.
42
PRINCIPAL RISKS OF THE FUND
The factors that are most likely to have a material effect on the Fund’s portfolio as a whole are called “principal risks.” The Fund is subject to the principal risks indicated below, whether through direct investment or derivative positions. The Fund may be subject to additional risks other than those identified and described below because the types of investments made by the Fund can change over time.
| | |
| Risk | | Nuveen Multi-Market Income Fund (JMM) |
| |
| Portfolio Level Risks | | |
| |
Asset-Backed Securities (“ABS”) Risk | | X |
Below Investment Grade Risk | | X |
Bond Market Liquidity Risk | | X |
Call Risk | | X |
Commercial Mortgage-Backed Securities (“CMBS”) Risk | | X |
Contingent Capital Securities (“CoCos”) Risk | | X |
Convertible Securities Risk | | X |
Credit Risk | | X |
Credit Risk Associated with Originators and Servicers of Residential and Commercial Mortgage Loans | | X |
Credit Spread Risk | | X |
Debt Securities Risk | | X |
Deflation Risk | | X |
Derivatives Risk | | X |
Distressed Securities Risk | | X |
Dollar Roll Transactions Risk | | X |
Duration Risk | | X |
Emerging Markets Risk | | X |
Extension Risk | | X |
Financial Futures and Options Risk | | X |
Frequent Trading Risk | | X |
Hedging Risk | | X |
Illiquid Investments Risk | | X |
Income Risk | | X |
Inflation Risk | | X |
Interest Rate Risk | | X |
Interest Rate Risk Associated with Non-Agency RMBS and CMBS | | X |
Loan Risk | | X |
London Interbank Offered Rate (“LIBOR”) Replacement Risk | | X |
Mortgage-Backed Securities (“MBS”) Risk | | X |
MBS Prepayment Risk | | X |
Non-Agency RMBS Risk | | X |
Non-Mortgage Related ABS Risk | | X |
43
Shareholder Update (continued)
(Unaudited)
| | |
| Risk | | Nuveen Multi-Market Income Fund (JMM) |
| |
| Portfolio Level Risks | | |
Non-U.S. Investments Risk | | X |
| |
Other Investment Companies Risk | | X |
Preferred Securities Risk | | X |
Reinvestment Risk | | X |
Senior Loan Agent Risk | | X |
Senior Loan Risk | | X |
Structural Risks Associated with CMBS and Non-Agency RMBS | | X |
Subordination Risk Associated with Non-Agency RMBS and CMBS | | X |
Swap Transactions Risk | | X |
Unrated Securities Risk | | X |
U.S. Government Securities Risk | | X |
Valuation Risk | | X |
When-Issued and Delayed-Delivery Transactions Risk | | X |
“Widening” Risk | | X |
Zero Coupon Bonds Risk | | X |
| |
| Fund Level and Other Risks | | |
| |
Anti-Takeover Provisions | | X |
Counterparty Risk | | X |
Cybersecurity Risk | | X |
Global Economic Risk | | X |
Investment and Market Risk | | X |
Legislation and Regulatory Risk | | X |
Leverage Risk | | X |
Market Discount from Net Asset Value | | X |
Recent Market Conditions | | X |
Reverse Repurchase Agreement Risk | | X |
Tax Risk | | X |
Portfolio Level Risks:
Asset-Backed Securities Risk. Asset-backed securities represent participations in, or are secured by and payable from, pools of assets including company receivables, truck and auto loans, leases and credit card receivables. These securities may be in the form of pass-through instruments or asset-backed bonds. Asset-backed securities are issued by non-governmental entities and carry no direct or indirect government guarantee; the asset pools that back asset-backed securities are securitized through the use of privately-formed trusts or special purpose corporations. Payments on asset-backed securities depend upon assets held by the issuer and collections of the underlying loans. The value of these securities depends on many factors, including changing interest rates, the availability of information about the pool and its structure, the credit quality of the underlying assets, the market’s perception of the servicer of the pool, and any credit enhancement provided. In certain market conditions, asset-backed securities may experience volatile fluctuations in value and periods of illiquidity.
Below Investment Grade Risk. Securities of below investment grade quality are regarded as having speculative characteristics with respect to the issuer’s capacity to pay interest and repay principal, and may be subject to higher price volatility and default risk than investment grade securities of comparable terms and duration. Issuers of lower grade securities may be highly leveraged and may not have available to them more traditional methods of financing.
44
The prices of these lower grade securities are typically more sensitive to negative developments, such as a decline in the issuer’s revenues or a general economic downturn. The secondary market for lower rated securities may not be as liquid as the secondary market for more highly rated securities, a factor which may have an adverse effect on the Fund’s ability to dispose of a particular security. If a below investment grade security goes into default, or its issuer enters bankruptcy, it might be difficult to sell that security in a timely manner at a reasonable price.
Bond Market Liquidity Risk. Dealer inventories of bonds, which provide an indication of the ability of financial intermediaries to “make markets” in those bonds, are at or near historic lows in relation to market size. This reduction in market making capacity has the potential to decrease liquidity and increase price volatility in the fixed income markets in which the Fund invests, particularly during periods of economic or market stress. In addition, recent federal banking regulations may cause certain dealers to reduce their inventories of bonds, which may further decrease the Fund’s ability to buy or sell bonds. As a result of this decreased liquidity, the Fund may have to accept a lower price to sell a security, sell other securities to raise cash, or give up an investment opportunity, any of which could have a negative effect on performance. If the Fund needed to sell large blocks of bonds to raise cash, those sales could further reduce the bonds’ prices and hurt performance.
Call Risk. The Fund may invest in securities that are subject to call risk. Such securities may be redeemed at the option of the issuer, or “called,” before their stated maturity or redemption date. In general, an issuer will call its instruments if they can be refinanced by issuing new instruments that bear a lower interest rate. The Fund is subject to the possibility that during periods of falling interest rates, an issuer will call its high yielding securities. The Fund would then be forced to invest the unanticipated proceeds at lower interest rates, resulting in a decline in the Fund’s income.
Commercial Mortgage-Backed Securities (“CMBS”) Risk. CMBS are, generally, securities backed by obligations (including certificates of participation in obligations) that are principally secured by mortgages on real property or interests therein having a multifamily or commercial use, such as regional malls, other retail space, office buildings, industrial or warehouse properties, hotels, nursing homes and senior living centers. The market for CMBS developed more recently and, in terms of total outstanding principal amount of issues, is relatively small compared to the market for residential single-family mortgage-related securities. CMBS are subject to particular risks, including lack of standardized terms, shorter maturities than residential mortgage loans and payment of all or substantially all of the principal only at maturity rather than regular amortization of principal. Additional risks may be presented by the type and use of a particular commercial property. Commercial property values and net operating income are subject to volatility, which may result in net operating income becoming insufficient to cover debt service on the related mortgage loan. The repayment of loans secured by income-producing properties is typically dependent upon the successful operation of the related real estate project rather than upon the liquidation value of the underlying real estate. Furthermore, the net operating income from and value of any commercial property is subject to various risks, including changes in general or local economic conditions and/or specific industry segments; the solvency of the related tenants; declines in real estate values; declines in rental or occupancy rates; increases in interest rates, real estate tax rates and other operating expenses; changes in governmental rules, regulations and fiscal policies; acts of God; terrorist threats and attacks and social unrest and civil disturbances. Consequently, adverse changes in economic conditions and circumstances are more likely to have an adverse impact on mortgage-related securities secured by loans on commercial properties than on those secured by loans on residential properties. In addition, commercial lending generally is viewed as exposing the lender to a greater risk of loss than one- to four- family residential lending. Commercial lending, for example, typically involves larger loans to single borrowers or groups of related borrowers than residential one- to four- family mortgage loans. The exercise of remedies and successful realization of liquidation proceeds relating to CMBS is also highly dependent on the performance of the servicer or special servicer. There may be a limited number of special servicers available, particularly those that do not have conflicts of interest. CMBS are also subject to prepayment risk. Risk of prepayment may vary depending on whether underlying commercial loans contain significant prepayment penalties or prohibitions on principal payments for some period following origination.
Contingent Capital Securities (“CoCos”) Risk. A loss absorption mechanism trigger event for CoCos would likely be the result of, or related to, the deterioration of the issuer’s financial condition (e.g., a decrease in the issuer’s capital ratio) and status as a going concern. In such a case, with respect to CoCos that provide for conversion into common stock upon the occurrence of the trigger event, the market price of the issuer’s common stock received by the Fund will have likely declined, perhaps substantially, and may continue to decline, which may adversely affect the Fund’s net asset value. Further, the issuer’s common stock would be subordinate to the issuer’s other classes of securities and therefore would worsen the Fund’s standing in a bankruptcy proceeding. In addition, because the common stock of the issuer may not pay a dividend, investors in these instruments could experience a reduced income rate, potentially to zero. In view of the foregoing, CoCos are often rated below investment grade and are subject to the risks of below investment grade securities.
CoCos may be subject to an automatic write-down (i.e., the automatic write-down of the principal amount or value of the securities, potentially to zero, and the cancellation of the securities) under certain circumstances, which could result in the Fund losing a portion or all of its investment in such securities. In addition, the Fund may not have any rights with respect to repayment of the principal amount of the securities that has not become due or the payment of interest or dividends on such securities for any period from (and including) the interest or dividend payment date falling immediately prior to the occurrence of such automatic write-down. An automatic write-down could also result in a reduced income rate if the dividend or interest payment is based on the security’s par value. Coupon payments on CoCos may be discretionary and may be cancelled by the issuer for any reason or may be subject to approval by the issuer’s regulator and may be suspended in the event there are insufficient distributable reserves.
45
Shareholder Update (continued)
(Unaudited)
In certain scenarios, investors in CoCos may suffer a loss of capital ahead of equity holders or when equity holders do not. There is no guarantee that the Fund will receive a return of principal on CoCos. Any indication that an automatic write-down or conversion event may occur can be expected to have a material adverse effect on the market price of CoCos.
The prices of CoCos may be volatile. Additionally, the trading behavior of a given issuer’s CoCo may be strongly impacted by the trading behavior of other issuers’ CoCos, such that negative information from an unrelated CoCo may cause a decline in value of one or more CoCos held by afund. Accordingly, the trading behavior of CoCos may not follow the trading behavior of other similarly structured securities.
CoCos are issued primarily by financial institutions. Therefore, CoCos present substantially increased risks at times of financial turmoil, which could affect financial institutions more than companies in other sectors and industries.
Convertible Securities Risk. Convertible securities have characteristics of both equity and debt securities and, as a result, are exposed to certain additional risks that are typically associated with debt, including but not limited to Interest Rate Risk, Credit Risk, Below Investment Grade Risk and Unrated Securities Risk. The value of a convertible security is influenced by both the yield of non-convertible securities of comparable issuers and by the value of the underlying common stock. Convertible securities generally offer lower interest or dividend yields than non-convertible securities of similar credit quality. The market values of convertible securities tend to decline as interest rates increase and, conversely, to increase as interest rates decline. However, the convertible security’s market value tends to reflect the market price of the common stock of the issuing company when that stock price is greater than the convertible security’s “conversion price.” The conversion price is defined as the predetermined price at which the convertible security could be exchanged for the associated common stock. As the market price of the underlying common stock declines, the price of the convertible security tends to be influenced more by the yield of the convertible security. Thus, the convertible security may not decline in price to the same extent as the underlying common stock. Convertible securities fall below debt obligations of the same issuer in order of preference or priority in the event of a liquidation and are typically unrated or rated lower than such debt obligations.
Credit Risk. Issuers of securities in which the Fund may invest may default on their obligations to pay principal or interest when due. This non-payment would result in a reduction of income to the Fund, a reduction in the value of a security experiencing non-payment and potentially a decrease in the net asset value (“NAV”) of the Fund. To the extent that the credit rating assigned to a security in the Fund’s portfolio is downgraded, the market price and liquidity of such security may be adversely affected.
Credit Risk Associated with Originators and Servicers of Residential and Commercial Mortgage Loans. In the past, a number of originators and servicers of residential and commercial mortgage loans, including some of the largest originators and servicers in the residential and commercial mortgage loan market, experienced serious financial difficulties. These difficulties resulted from many factors, including increased competition among originators for borrowers, decreased originations by such originators of mortgage loans and increased delinquencies and defaults on such mortgage loans, as well as increases in claims for repurchases of mortgage loans previously sold by them under agreements that require repurchase in the event of breaches of representations regarding loan quality and characteristics. Such difficulties may affect the performance of non-agency RMBS and CMBS backed by mortgage loans. Furthermore, the inability of the originator to repurchase such mortgage loans in the event of loan representation breaches or the servicer to repurchase such mortgage loans upon a breach of its servicing obligations also may affect the performance of related non-agency RMBS and CMBS. Delinquencies and losses on mortgage loans originated by mortgage lenders may arise or increase as a result of inadequate underwriting procedures and policies, including inadequate due diligence, failure to comply with predatory and other lending laws and, particularly in the case of any “no documentation” or “limited documentation” mortgage loans that may support non-agency RMBS, inadequate verification of income and employment history. Delinquencies and losses on, and claims for repurchase of, mortgage loans originated by mortgage lenders also may arise from fraudulent activities of borrowers, lenders, appraisers, and other residential mortgage industry participants such as mortgage brokers, including misstatements of income and employment history, identity theft and overstatements of the appraised value of mortgaged properties. Many of these originators and servicers are highly leveraged. These difficulties may also increase the chances that these entities may default on their warehousing or other credit lines or become insolvent or bankrupt and thereby increase the likelihood that repurchase obligations will not be fulfilled and the potential for loss to holders of non-agency RMBS, CMBS and subordinated security holders.
The servicers of non-agency RMBS and CMBS are often the same entities as, or affiliates of, the originators of these mortgage loans. Accordingly, the financial risks relating to originators of non-agency RMBS and CMBS described immediately above also may affect the servicing of non-agency RMBS and CMBS. In the case of such servicers, and other servicers, financial difficulties may have a negative effect on the ability of servicers to pursue collection on mortgage loans that are experiencing increased delinquencies and defaults and to maximize recoveries on sale of underlying properties following foreclosure.
Non-agency RMBS and CMBS typically provide that the servicer is required to make advances in respect of delinquent mortgage loans. However, servicers experiencing financial difficulties may not be able to perform these obligations or obligations that they may have to other parties of transactions involving these securities. Like originators, these entities are typically highly leveraged. Such difficulties may cause servicers to default under their financing arrangements. In certain cases, such entities may be forced to seek bankruptcy protection. Due to the application of the provisions of
46
bankruptcy law, servicers who have sought bankruptcy protection may not be required to advance such amounts. Even if a servicer were able to advance amounts in respect of delinquent mortgage loans, its obligation to make such advances may be limited to the extent that it does not expect to recover such advances due to the deteriorating credit of the delinquent mortgage loans or declining value of the related mortgaged properties. Moreover, servicers may over advance against a particular mortgage loan or charge too many costs of resolution or foreclosure of a mortgage loan to a securitization, which could increase the potential losses to holders of non-agency RMBS and CMBS. In such transactions, a servicer’s obligation to make such advances may also be limited to the amount of its servicing fee. In addition, if an issue of non-agency RMBS and CMBS provides for interest on advances made by the servicer, in the event that foreclosure proceeds or payments by borrowers are not sufficient to cover such interest, such interest will be paid to the servicer from available collections or other mortgage income, thereby reducing distributions made on the non-agency RMBS and CMBS and, in the case of senior-subordinated non-agency RMBS and CMBS described below, first from distributions that would otherwise be made on the most subordinated non-agency RMBS and CMBS of such issue. Any such financial difficulties may increase the possibility of a servicer termination and the need for a transfer of servicing and any such liabilities or inability to assess such liabilities may increase the difficulties and costs in affecting such transfer and the potential loss, through the allocation of such increased cost of such transfer, to subordinated security holders.
There can be no assurance that originators and servicers of mortgage loans will not experience serious financial difficulties, including becoming subject to bankruptcy or insolvency proceedings, or that underwriting procedures and policies and protections against fraud will be sufficient in the future to prevent such financial difficulties or significant levels of default or delinquency on mortgage loans.
Credit Spread Risk. Credit spread risk is the risk that credit spreads (i.e., the difference in yield between securities that is due to differences in their credit quality) may increase when the market believes that securities generally have a greater risk of default. Increasing credit spreads may reduce the market values of the Fund’s securities. Credit spreads often increase more for lower rated and unrated securities than for investment grade securities. In addition, when credit spreads increase, reductions in market value will generally be greater for longer-maturity securities.
Debt Securities Risk. Issuers of debt instruments in which the Fund may invest may default on their obligations to pay principal or interest when due. This non-payment would result in a reduction of income to the Fund, a reduction in the value of a debt instrument experiencing non-payment and, potentially, a decrease in the NAV of the Fund. There can be no assurance that liquidation of collateral would satisfy the issuer’s obligation in the event of non-payment of scheduled interest or principal or that such collateral could be readily liquidated. In the event of bankruptcy of an issuer, the Fund could experience delays or limitations with respect to its ability to realize the benefits of any collateral securing a security. To the extent that the credit rating assigned to a security in the Fund’s portfolio is downgraded, the market price and liquidity of such security may be adversely affected.
Deflation Risk. Deflation risk is the risk that prices throughout the economy decline over time. Deflation may have an adverse effect on the creditworthiness of issuers and may make issuer default more likely, which may result in a decline in the value of the Fund’s portfolio.
Derivatives Risk. The use of derivatives involves additional risks and transaction costs which could leave the Fund in a worse position than if it had not used these instruments. Derivative instruments can be used to acquire or to transfer the risk and returns of a security or other asset without buying or selling the security or asset. These instruments may entail investment exposures that are greater than their cost would suggest. As a result, a small investment in derivatives can result in losses that greatly exceed the original investment. Derivatives can be highly volatile, illiquid and difficult to value. An over-the-counter derivative transaction between the Fund and a counterparty that is not cleared through a central counterparty also involves the risk that a loss may be sustained as a result of the failure of the counterparty to the contract to make required payments. The payment obligation for a cleared derivative transaction is guaranteed by a central counterparty, which exposes the Fund to the creditworthiness of the central counterparty.
It is possible that developments in the derivatives market, including changes in government regulation, could adversely impact the Fund’s ability to invest in certain derivatives.
Distressed Securities Risk. The Fund may invest in low-rated securities or securities unrated but judged by the sub-adviser to of comparable quality. Some or many of these low-rated securities, although not in default, may be “distressed,” meaning that the issuer is experiencing financial difficulties or distress at the time of acquisition. Such securities would present a substantial risk of future default which may cause the Fund to incur losses, including additional expenses, to the extent it is required to seek recovery upon a default in the payment of principal or interest on those securities. In any reorganization or liquidation proceeding relating to a portfolio security, the Fund may lose its entire investment or may be required to accept cash or securities with a value less than its original investment. Distressed securities may be subject to restrictions on resale.
Dollar Roll Transaction Risk. In a dollar roll transaction, the Fund sells mortgage-backed securities for delivery in the current month while contracting with the same party to repurchase similar securities at a future date. Because the Fund gives up the right to receive principal and interest paid on the securities sold, a dollar roll transaction will diminish the investment performance of the Fund unless the difference between the price received for the securities sold and the price to be paid for the securities to be purchased in the future, plus any fee income received, exceeds any income, principal payments and appreciation on the securities sold as part of the dollar roll. Whether dollar rolls will benefit the Fund may depend upon the investment adviser’s ability to predict mortgage prepayments and interest rates. These transactions are subject to the risk that the counterparty to the transaction may not or be unable to perform in accordance with the terms of the instrument.
47
Shareholder Update (continued)
(Unaudited)
Duration Risk. Duration is the sensitivity, expressed in years, of the price of a fixed-income security to changes in the general level of interest rates (or yields). Securities with longer durations tend to be more sensitive to interest rate (or yield) changes, which typically corresponds to increased volatility and risk, than securities with shorter durations. For example, if a security or portfolio has a duration of three years and interest rates increase by 1%, then the security or portfolio would decline in value by approximately 3%. Duration differs from maturity in that it considers potential changes to interest rates, and a security’s coupon payments, yield, price and par value and call features, in addition to the amount of time until the security matures. The duration of a security will be expected to change over time with changes in market factors and time to maturity.
Emerging Markets Risk. Risks of investing in securities of emerging markets issuers include: smaller market capitalization of securities markets, which may suffer periods of relative illiquidity; significant price volatility; restrictions on foreign investment; and possible restrictions on repatriation of investment income and capital. In addition, foreign investors may be required to register the proceeds of sales; and future economic or political crises could lead to price controls, forced mergers, expropriation or confiscatory taxation, seizure, nationalization, or creation of government monopolies. Certain emerging markets also may face other significant internal or external risks, including a heightened risk of war, and ethnic, religious and racial conflicts. In addition, governments in many emerging market countries participate to a significant degree in their economies and securities markets, which may impair investment and economic growth, and which may in turn diminish the value of the securities in those markets. The considerations noted below in “Non-U.S. Securities Risk” are generally intensified for investments in emerging market countries.
Extension Risk. Extension risk is the flip side of call or prepayment risk. Extension, or slower prepayments of the underlying mortgage loans, would extend the time it would take to receive cash flows and would generally compress the yield on non-agency RMBS and CMBS. Rising interest rates can cause the average maturity of the Fund to lengthen due to a drop in mortgage prepayments. This will increase both the sensitivity to rising interest rates and the potential for price declines of the Fund.
Financial Futures and Options Transactions Risk. The Fund may use certain transactions for hedging the portfolio’s exposure to credit risk and the risk of increases in interest rates, which could result in poorer overall performance for the Fund. There may be an imperfect correlation between price movements of the futures and options and price movements of the portfolio securities being hedged.
If the Fund engages in futures transactions or in the writing of options on futures, it will be required to maintain initial margin and maintenance margin and may be required to make daily variation margin payments in accordance with applicable rules of the exchanges and the Commodity Futures Trading Commission (“CFTC”). If the Fund purchases a financial futures contract or a call option or writes a put option in order to hedge the anticipated purchase of securities, and if the Fund fails to complete the anticipated purchase transaction, the Fund may have a loss or a gain on the futures or options transaction that will not be offset by price movements in the securities that were the subject of the anticipatory hedge. There can be no assurance that a liquid market will exist at a time when the Fund seeks to close out a derivatives or futures or a futures option position, and the Fund would remain obligated to meet margin requirements until the position is closed.
Frequent Trading Risk. The Fund’s portfolio turnover rate may exceed 100%. Frequent trading of portfolio securities may produce capital gains, which are taxable to shareholders when distributed. Frequent trading may also increase the amount of commissions or mark-ups to broker-dealers that the Fund pays when it buys and sells securities, which may detract from the Fund’s performance.
Hedging Risk. The Fund’s use of derivatives or other transactions to reduce risk involves costs and will be subject to the investment adviser’s and/or the sub-adviser’s ability to predict correctly changes in the relationships of such hedge instruments to the Fund’s portfolio holdings or other factors. No assurance can be given that the investment adviser’s and/or the sub-adviser’s judgment in this respect will be correct, and no assurance can be given that the Fund will enter into hedging or other transactions at times or under circumstances in which it may be advisable to do so. Hedging activities may reduce the Fund’s opportunities for gain by offsetting the positive effects of favorable price movements and may result in net losses.
Illiquid Investments Risk. Illiquid investments are investments that are not readily marketable and may include restricted securities, which are securities that may not be resold unless they have been registered under the 1933 Act or that can be sold in a private transaction pursuant to an available exemption from such registration. Illiquid investments involve the risk that the investments will not be able to be sold at the time desired by the Fund or at prices approximating the value at which the Fund is carrying the investments on its books from time to time.
Income Risk. The Fund’s income could decline due to falling market interest rates. This is because, in a falling interest rate environment, the Fund generally will have to invest the proceeds from maturing portfolio securities in lower-yielding securities.
Inflation Risk. Inflation risk is the risk that the value of assets or income from investments will be worth less in the future as inflation decreases the value of money. As inflation increases, the real value of the common shares and distributions can decline.
Interest Rate Risk. Interest rate risk is the risk that securities in the Fund’s portfolio will decline in value because of changes in market interest rates. Generally, when market interest rates rise, the market value of such securities will fall, and vice versa. As interest rates decline, issuers of securities may prepay principal earlier than scheduled, forcing the Fund to reinvest in lower-yielding securities and potentially reducing the Fund’s income. As interest rates increase, slower than expected principal payments may extend the average life of securities, potentially locking in a below-market interest rate and
48
reducing the Fund’s value. In typical market interest rate environments, the prices of longer-term securities generally fluctuate more than prices of shorter-term securities as interest rates change.
Interest Rate Risk Associated with Non-Agency RMBS and CMBS. The rate of interest payable on certain non-agency RMBS and CMBS may be set or effectively capped at the weighted average net coupon of the underlying mortgage loans themselves, often referred to as an “available funds cap.” As a result of this cap, the return to the holder of such non-agency RMBS and CMBS is dependent on the relative timing and rate of delinquencies and prepayments of mortgage loans bearing a higher rate of interest. In general, early prepayments will have a greater negative impact on the yield to the holder of such non-agency RMBS and CMBS.
The value of fixed rate debt securities can be expected to vary inversely with changes in prevailing interest rates. Fixed rate debt securities with longer maturities, which tend to produce higher yields, are subject to potentially greater capital appreciation and depreciation than securities with shorter maturities.
Loan Risk. The lack of an active trading market for certain loans may impair the ability of the Fund to realize full value in the event of the need to sell a loan and may make it difficult to value such loans. Portfolio transactions in loans may settle in as short as seven days but typically can take up to two or three weeks, and in some cases much longer. As a result of these extended settlement periods, the Fund may incur losses if it is required to sell other investments or temporarily borrow to meet its cash needs, including satisfying redemption requests. The risks associated with unsecured loans, which are not backed by a security interest in any specific collateral, are higher than those for comparable loans that are secured by specific collateral. For secured loans, there is a risk that the value of any collateral securing a loan in which the Fund has an interest may decline and that the collateral may not be sufficient to cover the amount owed on the loan. Interests in loans made to finance highly leveraged companies or transactions such as corporate acquisitions may be especially vulnerable to adverse changes in economic or market conditions. Loans may have restrictive covenants limiting the ability of a borrower to further encumber its assets. However, in periods of high demand by lenders like the Fund for loan investments, borrowers may limit these covenants and weaken a lender’s ability to access collateral securing the loan; reprice the credit risk associated with the borrower; and mitigate potential loss. The Fund may experience relatively greater realized or unrealized losses or delays and expenses in enforcing its rights with respect to loans with fewer restrictive covenants. Additionally, loans may not be considered “securities” and, as a result, the Fund may not be entitled to rely on the anti-fraud protections of the securities laws. Because junior loans have a lower place in an issuer’s capital structure and may be unsecured, junior loans involve a higher degree of overall risk than senior loans of the issuer.
London Interbank Offered Rate (“LIBOR”) Replacement Risk. The use of LIBOR will begin to be phased out in the near future, which may adversely affect the Fund’s investments whose value is tied to LIBOR. There remains uncertainty regarding the future use of LIBOR and the nature of any replacement reference rate. Actions by regulators have resulted in the establishment of alternative reference rates to LIBOR in most major currencies and markets are slowly developing in response to these new rates. The transition process away from LIBOR may involve, among other things, increased volatility in markets for instruments that currently rely on LIBOR. The potential effect of a discontinuation of LIBOR on the Fund’s investments will vary depending on, among other things: (1) existing fallback provisions that provide a replacement reference rate if LIBOR is no longer available; (2) termination provisions in individual contracts; and (3) whether, how, and when industry participants develop and adopt new reference rates and fallbacks for both legacy and new products and instruments held by the Fund. Accordingly, it is difficult to predict the full impact of the transition away from LIBOR until it is clearer how the Fund’s products an instruments will be impacted by this transition.
Mortgage-Backed Securities (“MBS”) Risk. An MBS (including a CMBS) may be negatively affected by the quality of the mortgages underlying such security and the structure of its issuer. For example, if a mortgage underlying a particular mortgage-backed security defaults, the value of that security may decrease. Moreover, a downturn in the markets for residential or commercial real estate or a general economic downturn could negatively affect both the price and liquidity of privately issued mortgage-backed securities, as was the case during the recession of 2007 and 2009. Mortgage-backed securities are subject to pre-payment risk, which is the risk that the borrowers under the mortgage loans underlying the Fund’s mortgage-backed securities might pay off their mortgage loans sooner than expected, which could happen when interest rates fall or for other reasons, which could cause the value of the Fund’s mortgage-backed securities to fall. Moreover, if the underlying mortgage loans are paid off sooner than expected, the Fund may have to reinvest the proceeds in other securities that have lower yields. Mortgage-backed securities are also subject to extension risk, which is the risk that rising interest rates could cause mortgages underlying the securities to be prepaid more slowly than expected, resulting in slower prepayments of the securities. This would, in effect, convert a short- or medium-duration mortgage-backed security into a longer-duration security, increasing its sensitivity to interest rate changes and likely causing its price to decline. Mortgage-backed securities issued by a private issuer, including essentially each CMBS, generally entail greater risk than obligations directly or indirectly guaranteed by the U.S. government or a government-sponsored entity.
MBS Prepayment Risk. MBS represent an interest in a pool of mortgages. These mortgages typically permit borrowers to prepay amounts owing, often with no penalty. In periods of falling interest rates, the rate of prepayments tends to increase, forcing the Fund to reinvest in lower-yielding securities. However, MBS prepayment risk may not be the same as call risk for a corporate bond of similar maturity, making this risk difficult to estimate.
Non-Agency RMBS Risk. Non-agency RMBS are securities issued by non-governmental issuers, the payments on which depend (except for rights or other assets designed to assure the servicing or timely distribution of proceeds to holders of such securities) primarily on the cash flow from residential
49
Shareholder Update (continued)
(Unaudited)
mortgage loans made to borrowers that are secured (on a first priority basis or second priority basis, subject to permitted liens, easements and other encumbrances) by residential real estate (one- to four- family properties) the proceeds of which are used to purchase real estate and purchase or construct dwellings thereon (or to refinance indebtedness previously so used). Non-agency RMBS have no direct or indirect government guarantees of payment and are subject to various risks as described herein.
Non-Mortgage Related ABS Risk. Investing in ABS entails various risks, including credit risks, liquidity risks, interest rate risks, market risks and legal risks. Credit risk is an important issue in ABS because of the significant credit risks inherent in the underlying collateral and because issuers are primarily private entities. The structure of ABS and the terms of the investors’ interest in the collateral can vary widely depending on the type of collateral, the desires of investors and the use of credit enhancements. Although the basic elements of all ABS are similar, individual transactions can differ markedly in both structure and execution. Important determinants of the risk associated with issuing or holding the securities include the process by which principal and interest payments are allocated and distributed to investors, how credit losses affect the issuing vehicle and the return to investors in such ABS, whether collateral represents a fixed set of specific assets or accounts, whether the underlying collateral assets are revolving or closed-end, under what terms (including the maturity of the ABS itself) any remaining balance in the accounts may revert to the issuing entity and the extent to which the entity that is the actual source of the collateral assets is obligated to provide support to the issuing vehicle or to the investors in such ABS. The Fund may invest in ABS that are subordinate in right of payment and rank junior to other securities that are secured by or represent an ownership interest in the same pool of assets. In addition, many of the transactions in which such securities are issued have structural features that divert payments of interest and/or principal to more senior classes when the delinquency or loss experience of the pool exceeds certain levels. As a result, such securities have a higher risk of loss as a result of delinquencies or losses on the underlying assets.
Non-U.S. Securities Risk. Investments in securities of non-U.S. issuers involve special risks, including: less publicly available information about non-U.S. issuers or markets due to less rigorous disclosure or accounting standards or regulatory practices; many non-U.S. markets are smaller, less liquid and more volatile; the economies of non-U.S. countries may grow at slower rates than expected or may experience a downturn or recession; the impact of economic, political, social or diplomatic events; and withholding and other non-U.S. taxes may decrease the Fund’s return. These risks are more pronounced to the extent that the Fund invests a significant amount of its assets in issuers located in one region.
Other Investment Companies Risk. The Fund may invest in the securities of other investment companies, including ETFs. Investing in an investment company exposes the Fund to all of the risks of that investment company’s investments. The Fund, as a holder of the securities of other investment companies, will bear its pro rata portion of the other investment companies’ expenses, including advisory fees. These expenses are in addition to the direct expenses of the Fund’s own operations. As a result, the cost of investing in investment company shares may exceed the costs of investing directly in its underlying investments. In addition, securities of other investment companies may be leveraged. As a result, the Fund may be indirectly exposed to leverage through an investment in such securities and therefore magnify the Fund’s leverage risk.
With respect to ETF’s, an ETF that is based on a specific index may not be able to replicate and maintain exactly the composition and relative weighting of securities in the index. The value of an ETF based on a specific index is subject to change as the values of its respective component assets fluctuate according to market volatility. ETFs typically rely on a limited pool of authorized participants to create and redeem shares, and an active trading market for ETF shares may not develop or be maintained. The market value of shares of ETFs and closed-end funds may differ from their NAV.
Preferred Securities Risk. Preferred securities are subordinated to bonds and other debt instruments in a company’s capital structure, and therefore are subject to greater credit risk. In addition, preferred stockholders (such as the Fund, to the extent it invests in preferred stocks of other issuers) generally have no voting rights with respect to the issuing company unless preferred dividends have been in arrears for a specified number of periods, at which time the preferred stockholders may elect a number of directors to the issuer’s board. Generally, once all the arrearages have been paid, the preferred stockholders no longer have voting rights. In the case of certain taxable preferred stocks, holders generally have no voting rights, except (i) if the issuer fails to pay dividends for a specified period of time or (ii) if a declaration of default occurs and is continuing. In such an event, rights of preferred stockholders generally would include the right to appoint and authorize a trustee to enforce the trust or special purpose entity’s rights as a creditor under the agreement with its operating company. In certain varying circumstances, an issuer of preferred stock may redeem the securities prior to a specified date. For instance, for certain types of preferred stock, a redemption may be triggered by a change in U.S. federal income tax or securities laws. As with call provisions, a redemption by the issuer may negatively impact the return of the security held by the Fund.
Reinvestment Risk. Reinvestment risk is the risk that income from the Fund’s portfolio will decline if and when the Fund invests the proceeds from matured, traded or called securities at market interest rates that are below the portfolio’s current earnings rate. A decline in income could affect the common shares’ market price, NAV and/or a common shareholder’s overall returns.
Senior Loan Agent Risk. A financial institution’s employment as an agent under a senior loan might be terminated in the event that it fails to observe a requisite standard of care or becomes insolvent. A successor agent would generally be appointed to replace the terminated agent, and assets held by the agent under the loan agreement would likely remain available to holders of such indebtedness. However, if assets held by the terminated agent for the benefit of the Fund were determined to be subject to the claims of the agent’s general creditors, the Fund might incur certain costs and delays in realizing
50
payment on a senior loan or loan participation and could suffer a loss of principal and/or interest. In situations involving other interposed financial institutions (e.g., an insurance company or government agency) similar risks may arise.
Senior Loan Risk. Senior loans typically hold the most senior position in the capital structure of a business entity, are typically secured with specific collateral and have a claim on the assets and/or stock of the issuer that is senior to that held by subordinated debt holders and stockholders of the issuer. Senior loans are usually rated below investment grade, and share the same risks of other below investment grade debt instruments.
Although the Fund may invest in senior loans that are secured by specific collateral, there can be no assurance that the liquidation of such collateral would satisfy an issuer’s obligation to the Fund in the event of issuer default or that such collateral could be readily liquidated under such circumstances. If the terms of a senior loan do not require the issuer to pledge additional collateral in the event of a decline in the value of the already pledged collateral, the Fund will be exposed to the risk that the value of the collateral will not at all times equal or exceed the amount of the issuer’s obligations under the senior loan.
In the event of bankruptcy of an issuer, the Fund could also experience delays or limitations with respect to its ability to realize the benefits of any collateral securing a senior loan. Some senior loans are subject to the risk that a court, pursuant to fraudulent conveyance or other similar laws, could subordinate the senior loans to presently existing or future indebtedness of the issuer or take other action detrimental to lenders, including the Fund. Such court action could under certain circumstances include invalidation of senior loans.
Structural Risks Associated with CMBS and Non-Agency RMBS. Because non-agency RMBS generally are ownership or participation interests in pools of mortgage loans secured by a pool of one- to four-family residential properties underlying the mortgage loan pool, the non-agency RMBS are entitled to payments provided for in the underlying agreement only when and if funds are generated by the underlying mortgage loan pool. This likelihood of the return of interest and principal may be assessed as a credit matter. However, the holders of non-agency RMBS do not have the legal status of secured creditors, and cannot accelerate a claim for payment on their securities, or force a sale of the mortgage loan pool in the event that insufficient funds exist to pay such amounts on any date designated for such payment. The holders of non-agency RMBS do not typically have any right to remove a servicer solely as a result of a failure of the mortgage pool to perform as expected. A similar risk is associated with CMBS.
Subordination Risk Associated with Non-Agency RMBS and CMBS. Non-agency RMBS and CMBS may be subordinated to one or more other senior classes of securities of the same series for purposes of, among other things, offsetting losses and other shortfalls with respect to the related underlying mortgage loans. For example, in the case of certain non-agency RMBS and CMBS, no distributions of principal will generally be made with respect to any class until the aggregate principal balances of the corresponding senior classes of securities have been reduced to zero. As a result, non-agency RMBS and CMBS may be more sensitive to risk of loss, writedowns, the non-fulfillment of repurchase obligations, overadvancing on a pool of loans and the costs of transferring servicing than senior classes of securities.
Swap Transactions Risk. The Fund may enter into debt-related derivative instruments such as credit default swap contracts and interest rate swaps. Like most derivative instruments, the use of swaps is a highly specialized activity that involves investment techniques and risks different from those associated with ordinary portfolio securities transactions. In addition, the use of swaps requires an understanding by the adviser and/or the sub-adviser of not only the referenced asset, rate or index, but also of the swap itself. If the investment adviser and/or the sub-adviser is incorrect in its forecasts of default risks, market spreads or other applicable factors or events, the investment performance of the Fund would diminish compared with what it would have been if these techniques were not used.
Unrated Securities Risk. The Fund may purchase securities that are not rated by any rating organization. The investment adviser may, after assessing such securities’ credit quality, internally assign ratings to certain of those securities in categories similar to those of rating organizations. Some unrated securities may not have an active trading market or may be difficult to value, which means the Fund might have difficulty selling them promptly at an acceptable price. To the extent that the Fund invests in unrated securities, the Fund’s ability to achieve its investment objective will be more dependent on the investment adviser’s credit analysis than would be the case when the Fund invests in rated securities.
U.S. Government Securities Risk. U.S. government securities are guaranteed only as to the timely payment of interest and the payment of principal when held to maturity. Accordingly, the current market values for these securities will fluctuate with changes in interest rates. Securities issued or guaranteed by U.S. government agencies and instrumentalities are supported by varying degrees of credit but generally are not backed by the full faith and credit of the U.S. government. No assurance can be given that the U.S. government will provide financial support to its agencies and instrumentalities if it is not obligated by law to do so.
Valuation Risk. The securities in which the Fund invests typically are valued by a pricing service utilizing a range of market-based inputs and assumptions, including readily available market quotations obtained from broker-dealers making markets in such instruments, cash flows and transactions for comparable instruments. There is no assurance that the Fund will be able to sell a portfolio security at the price established by the pricing service, which could result in a loss to the Fund. Pricing services generally price securities assuming orderly transactions of an institutional “round lot” size, but some trades may occur in smaller, “odd lot” sizes, often at lower prices than institutional round lot trades. Different pricing services may incorporate different assumptions and inputs into their valuation methodologies, potentially resulting in different values for the same securities. As a result, if the Fund were to
51
Shareholder Update (continued)
(Unaudited)
change pricing services, or if the Fund’s pricing service were to change its valuation methodology, there could be a material impact, either positive or negative, on the Fund’s NAV.
When-Issued and Delayed-Delivery Transactions Risk. The Fund may invest in securities on a “when-issued” or “delayed-delivery” basis. When-issued and delayed-delivery transactions may involve an element of risk because no interest accrues on the securities prior to settlement and, because securities are subject to market fluctuations, the value of the securities at time of delivery may be less (or more) than their cost. A separate account of the Fund will be established with its custodian consisting of cash equivalents or liquid securities having a market value at all times at least equal to the amount of any delayed payment commitment.
“Widening” Risk. The prices of non-agency RMBS or CMBS may decline substantially, for reasons that may not be attributable to any of the other risks described herein. In particular, purchasing assets at what may appear to be “undervalued” levels is no guarantee that these assets will not be trading at even more “undervalued” levels at a time of valuation or at the time of sale. It may not be possible to predict, or to protect against, such “spread widening” risk.
Zero Coupon Bonds Risk. Because interest on zero coupon bonds is not paid on a current basis, the values of zero coupon bonds will be more volatile in response to interest rate changes than the values of bonds that distribute income regularly. Although zero coupon bonds generate income for accounting purposes, they do not produce cash flow, and thus the Fund could be forced to liquidate securities at an inopportune time in order to generate cash to distribute to shareholders as required by tax laws.
Fund Level and Other Risks:
Anti-Takeover Provisions. The Fund’s organizational documents include provisions that could limit the ability of other entities or persons to acquire control of the Fund or convert the Fund to open-end status. Further, the Fund’s by-laws provide that a shareholder who obtains beneficial ownership of common shares in a “Control Share Acquisition” shall have the same voting rights as other common shares only to the extent authorized by shareholders. These provisions could have the effect of depriving the common shareholders of opportunities to sell their common shares at a premium over the then-current market price of the common shares.
Counterparty Risk. Changes in the credit quality of the companies that serve as the Fund’s counterparties with respect to derivatives or other transactions supported by another party’s credit will affect the value of those instruments. Certain entities that have served as counterparties in the markets for these transactions have incurred or may incur in the future significant financial hardships including bankruptcy and losses as a result of exposure to sub-prime mortgages and other lower-quality credit investments. As a result, such hardships have reduced these entities’ capital and called into question their continued ability to perform their obligations under such transactions. By using such derivatives or other transactions, the Fund assumes the risk that its counterparties could experience similar financial hardships. In the event of the insolvency of a counterparty, the Fund may sustain losses or be unable to liquidate a derivatives position.
Cybersecurity Risk. The Fund and its service providers are susceptible to operational and information security risk resulting from cyber incidents. Cyber incidents refer to both intentional attacks and unintentional events including: processing errors, human errors, technical errors including computer glitches and system malfunctions, inadequate or failed internal or external processes, market-wide technical-related disruptions, unauthorized access to digital systems (through “hacking” or malicious software coding), computer viruses, and cyber-attacks which shut down, disable, slow or otherwise disrupt operations, business processes or website access or functionality (including denial of service attacks). Cyber incidents could adversely impact the Fund and cause the Fund to incur financial loss and expense, as well as face exposure to regulatory penalties, reputational damage, and additional compliance costs associated with corrective measures. In addition, substantial costs may be incurred in order to prevent any cyber incidents in the future. Furthermore, the Fund cannot control the cybersecurity plans and systems put in place by its service providers or any other third parties whose operations may affect the Fund.
Global Economic Risk. National and regional economies and financial markets are becoming increasingly interconnected, which increases the possibilities that conditions in one country, region or market might adversely impact issuers in a different country, region or market. Changes in legal, political, regulatory, tax and economic conditions may cause fluctuations in markets and securities prices around the world, which could negatively impact the value of the Fund’s investments. Major economic or political disruptions, particularly in large economies like China’s, may have global negative economic and market repercussions. Additionally, events such as war, terrorism, natural and environmental disasters and the spread of infectious illnesses or other public health emergencies may adversely affect the global economy and the markets and issuers in which the Fund invests. Recent examples of such events include the outbreak of a novel coronavirus known as COVID-19 that was first detected in China in December 2019 and heightened concerns regarding North Korea’s nuclear weapons and long-range ballistic missile programs. These events could reduce consumer demand or economic output, result in market closure, travel restrictions or quarantines, and generally have a significant impact on the economy. These events could also impair the information technology and other operational systems upon which the Fund’s service providers, including the investment adviser and sub-adviser, rely, and could otherwise disrupt the ability of employees of the Fund’s service providers to perform essential tasks on behalf of the Fund. Governmental and
52
quasi-governmental authorities and regulators throughout the world have in the past responded to major economic disruptions with a variety of significant fiscal and monetary policy changes, including but not limited to, direct capital infusions into companies, new monetary programs and dramatically lower interest rates. An unexpected or quick reversal of these policies, or the ineffectiveness of these policies, could increase volatility in securities markets, which could adversely affect the Fund’s investments.
Investment and Market Risk. An investment in common shares is subject to investment risk, including the possible loss of the entire principal amount that you invest. Common shares frequently trade at a discount to their NAV. An investment in common shares represents an indirect investment in the securities owned by the Fund. Common shares at any point in time may be worth less than your original investment, even after taking into account the reinvestment of Fund dividends and distributions.
Legislation and Regulatory Risk. At any time after the date of this report, legislation or additional regulations may be enacted that could negatively affect the assets of the Fund, securities held by the Fund or the issuers of such securities. Fund shareholders may incur increased costs resulting from such legislation or additional regulation. There can be no assurance that future legislation, regulation or deregulation will not have a material adverse effect on the Fund or will not impair the ability of the Fund to achieve its investment objective.
The SEC recently adopted rules governing the use of derivatives by registered investment companies, which could affect the nature and extent of derivatives used by the Fund. The full impact of such rules is uncertain at this time. It is possible that such rules, as interpreted, applied and enforced by the SEC, could limit the implementation of the Fund’s use of derivatives, which could have an adverse impact on the Fund.
Leverage Risk. The use of leverage creates special risks for common shareholders, including potential interest rate risks and the likelihood of greater volatility of NAV and market price of, and distributions on, the common shares. The use of leverage in a declining market will likely cause a greater decline in the Fund’s NAV, which may result at a greater decline of the common share price, than if the Fund were not to have used leverage.
The Fund will pay (and common shareholders will bear) any costs and expenses relating to the Fund’s use of leverage, which will result in a reduction in the Fund’s NAV. The investment adviser may, based on its assessment of market conditions and composition of the Fund’s holdings, increase or decrease the amount of leverage. Such changes may impact the Fund’s distributions and the price of the common shares in the secondary market.
The Fund may seek to refinance its leverage over time, in the ordinary course, as current forms of leverage mature or it is otherwise desirable to refinance; however, the form that such leverage will take cannot be predicted at this time. If the Fund is unable to replace existing leverage on comparable terms, its costs of leverage will increase. Accordingly, there is no assurance that the use of leverage may result in a higher yield or return to common shareholders.
The amount of fees paid to the investment adviser and the sub-adviser for investment advisory services will be higher if the Fund uses leverage because the fees will be calculated based on the Fund’s Managed Assets—this may create an incentive for the investment adviser and the sub-adviser to leverage the Fund or increase the Fund’s leverage.
Market Discount from Net Asset Value. Shares of closed-end investment companies like the Fund frequently trade at prices lower than their NAV. This characteristic is a risk separate and distinct from the risk that the Fund’s NAV could decrease as a result of investment activities. Whether investors will realize gains or losses upon the sale of the common shares will depend not upon the Fund’s NAV but entirely upon whether the market price of the common shares at the time of sale is above or below the investor’s purchase price for the common shares. Furthermore, management may have difficulty meeting the Fund’s investment objective and managing its portfolio when the underlying securities are redeemed or sold during periods of market turmoil and as investors’ perceptions regarding closed-end funds or their underlying investments change. Because the market price of the common shares will be determined by factors such as relative supply of and demand for the common shares in the market, general market and economic circumstances, and other factors beyond the control of the Fund, the Fund cannot predict whether the common shares will trade at, below or above NAV. The common shares are designed primarily for long-term investors, and you should not view the Fund as a vehicle for short-term trading purposes.
Recent Market Conditions. In response to the financial crisis and recent market events, policy and legislative changes by the United States government and the Federal Reserve to assist in the ongoing support of financial markets, both domestically and in other countries, are changing many aspects of financial regulation. The impact of these changes on the markets, and the practical implications for market participants, may not be fully known for some time. Withdrawal of government support, failure of efforts in response to the crisis, or investor perception that such efforts are not succeeding, could adversely impact the value and liquidity of certain securities. The severity or duration of adverse economic conditions may also be affected by policy changes made by governments or quasi-governmental organizations, including changes in tax laws and the imposition of trade barriers. The impact of new financial regulation legislation on the markets and the practical implications for market participants may not be fully known for some time. Changes to the Federal Reserve policy may affect the value, volatility and liquidity of dividend and interest paying securities. In addition, the contentious domestic political environment, as well as political and diplomatic events within the United States and abroad, such as the U.S. government’s inability at times to agree on a long-term budget and deficit reduction plan, the threat of a federal government shutdown and threats not to increase the federal government’s debt limit, may affect investor and consumer confidence and may adversely impact financial markets and the broader economy, perhaps suddenly and to a significant degree.
53
Shareholder Update (continued)
(Unaudited)
Interest rates have been unusually low in recent years in the United States and abroad but there is consensus that interest rates will increase during the life of the Fund, which could negatively impact the price of debt securities. Because there is little precedent for this situation, it is difficult to predict the impact of a significant rate increase on various markets.
The current political climate has intensified concerns about a potential trade war between China and the United States, as each country has recently imposed tariffs on the other country’s products. These actions may trigger a significant reduction in international trade, the oversupply of certain manufactured goods, substantial price reductions of goods and possible failure of individual companies and/or large segments of China’s export industry, which could have a negative impact on the Fund’s performance.
The impact of these developments in the near- and long-term is unknown and could have additional adverse effects on economies, financial markets and asset valuations around the world.
Reverse Repurchase Agreement Risk. A reverse repurchase agreement, in economic essence, constitutes a securitized borrowing by the Fund from the security purchaser. In a reverse repurchase agreement, the Fund retains the risk of loss associated with the sold security. The Fund may enter into reverse repurchase agreements for the purpose of creating a leveraged investment exposure and, as such, their usage involves essentially the same risks associated with a leveraging strategy generally since the proceeds from these agreements may be invested in additional portfolio securities. Reverse repurchase agreements tend to be short-term in tenor, and there can be no assurances that the purchaser (lender) will commit to extend or “roll” a given agreement upon its agreed-upon repurchase date or an alternative purchaser can be identified on similar terms. Reverse repurchase agreements also involve the risk that the purchaser fails to return the securities as agreed upon, files for bankruptcy or becomes insolvent. Upon the bankruptcy or insolvency of a counterparty, the Fund is considered to be an unsecured creditor with respect to excess collateral and as such the return of the excess collateral may be delayed. The Fund also may be restricted from taking normal portfolio actions during such time, could be subject to loss to the extent that the proceeds of the agreement are less than the value of securities subject to the agreement and may experience adverse tax consequences.
Tax Risk. The Fund has elected to be treated and intends to qualify each year as a Regulated Investment Company (“RIC”) under the Internal Revenue Code of 1986, as amended (the “Code”). As a RIC, the Fund is not expected to be subject to U.S. federal income tax to the extent that it distributes its investment company taxable income and net capital gains. To qualify for the special tax treatment available to a RIC, the Fund must comply with certain investment, distribution, and diversification requirements. Under certain circumstances, the Fund may be forced to sell certain assets when it is not advantageous in order to meet these requirements, which may reduce the Fund’s overall return. If the Fund fails to meet any of these requirements, subject to the opportunity to cure such failures under applicable provisions of the Code, the Fund’s income would be subject to a double level of U.S. federal income tax. The Fund’s income, including its net capital gain, would first be subject to U.S. federal income tax at regular corporate rates, even if such income were distributed to shareholders and, second, all distributions by the Fund from earnings and profits, including distributions of net capital gain (if any), would be taxable to shareholders as dividends.
54
EFFECTS OF LEVERAGE
The following table is furnished in response to requirements of the SEC. It is designed to illustrate the effects of leverage through the use of senior securities, as that term is defined under Section 18 of the 1940 Act, as well as certain other forms of leverage, such as reverse repurchase agreements and dollar roll transactions, on common share total return, assuming investment portfolio total returns (consisting of income and changes in the value of investments held in the Fund’s portfolio) of -10%, -5%, 0%, 5% and 10%. The table below reflects the Fund’s (i) continued use of leverage as of June 30, 2021 as a percentage of Managed Assets (including assets attributable to such leverage), (ii) the estimated annual effective interest expense rate payable by the Fund on such instruments (based on actual leverage costs incurred during the fiscal year ended June 30, 2021) as set forth in the table, and (iii) the annual return that the Fund’s portfolio must experience (net of expenses) in order to cover such costs of leverage based on such estimated annual effective interest expense rate. The information below does not reflect any Fund’s use of certain other forms of economic leverage achieved through the use of certain derivative instruments.
The numbers are merely estimates, used for illustration. The costs of leverage may vary frequently and may be significantly higher or lower than the estimated rate. The assumed investment portfolio returns in the table below are hypothetical figures and are not necessarily indicative of the investment portfolio returns experienced or expected to be experienced by the Fund. Your actual returns may be greater or less than those appearing below.
| | | | |
| | | Nuveen Multi- Market Income Fund (JMM) | |
Estimated Leverage as a Percentage of Managed Assets (Including Assets Attributable to Leverage) | | | 25.94% | |
Estimated Annual Effective Leverage Expense Rate Payable by Fund on Leverage | | | 0.31% | |
Annual Return Fund Portfolio Must Experience (net of expenses) to Cover Estimated Annual Effective Interest Expense Rate on Leverage | | | 0.08% | |
Common Share Total Return for (10.00)% Assumed Portfolio Total Return | | | -13.61% | |
Common Share Total Return for (5.00)% Assumed Portfolio Total Return | | | -6.86% | |
Common Share Total Return for 0.00% Assumed Portfolio Total Return | | | -0.11% | |
Common Share Total Return for 5.00% Assumed Portfolio Total Return | | | 6.64% | |
Common Share Total Return for 10.00% Assumed Portfolio Total Return | | | 13.39% | |
Common Share total return is composed of two elements — the distributions paid by the Fund to holders of common shares (the amount of which is largely determined by the net investment income of the Fund after paying dividend payments on any preferred shares issued by the Fund and expenses on any forms of leverage outstanding) and gains or losses on the value of the securities and other instruments the Fund owns. As required by SEC rules, the table assumes that the Fund are more likely to suffer capital losses than to enjoy capital appreciation. For example, to assume a total return of 0%, the Fund must assume that the income it receives on its investments is entirely offset by losses in the value of those investments. This table reflects hypothetical performance of the Fund’s portfolio and not the actual performance of the Fund’s common shares, the value of which is determined by market forces and other factors. Should the Fund elect to add additional leverage to its portfolio, any benefits of such additional leverage cannot be fully achieved until the proceeds resulting from the use of such leverage have been received by the Fund and invested in accordance with the Fund’s investment objective and policies. As noted above, the Fund’s willingness to use additional leverage, and the extent to which leverage is used at any time, will depend on many factors.
55
Shareholder Update (continued)
(Unaudited)
DIVIDEND REINVESTMENT PLAN
Nuveen Closed-End Funds Automatic Reinvestment Plan
Your Nuveen Closed-End Fund allows you to conveniently reinvest distributions in additional Fund shares. By choosing to reinvest, you’ll be able to invest money regularly and automatically, and watch your investment grow through the power of compounding. Just like distributions in cash, there may be times when income or capital gains taxes may be payable on distributions that are reinvested. It is important to note that an automatic reinvestment plan does not ensure a profit, nor does it protect you against loss in a declining market.
Easy and convenient
To make recordkeeping easy and convenient, each quarter you’ll receive a statement showing your total distributions, the date of investment, the shares acquired and the price per share, and the total number of shares you own.
How shares are purchased
The shares you acquire by reinvesting will either be purchased on the open market or newly issued by the Fund. If the shares are trading at or above NAV at the time of valuation, the Fund will issue new shares at the greater of the NAV or 95% of the then-current market price. If the shares are trading at less than NAV, shares for your account will be purchased on the open market. If Computershare Trust Company, N.A. (the “Plan Agent”) begins purchasing Fund shares on the open market while shares are trading below NAV, but the Fund’s shares subsequently trade at or above their NAV before the Plan Agent is able to complete its purchases, the Plan Agent may cease open-market purchases and may invest the uninvested portion of the distribution in newly-issued Fund shares at a price equal to the greater of the shares’ NAV or 95% of the shares’ market value on the last business day immediately prior to the purchase date. Distributions received to purchase shares in the open market will normally be invested shortly after the distribution payment date. No interest will be paid on distributions awaiting reinvestment. Because the market price of the shares may increase before purchases are completed, the average purchase price per share may exceed the market price at the time of valuation, resulting in the acquisition of fewer shares than if the distribution had been paid in shares issued by the Fund. A pro rata portion of any applicable brokerage commissions on open market purchases will be paid by Dividend Reinvestment Plan (the “Plan”) participants. These commissions usually will be lower than those charged on individual transactions.
Flexible
You may change your distribution option or withdraw from the Plan at any time, should your needs or situation change. You can reinvest whether your shares are registered in your name, or in the name of a brokerage firm, bank, or other nominee. Ask your investment advisor if his or her firm will participate on your behalf. Participants whose shares are registered in the name of one firm may not be able to transfer the shares to another firm and continue to participate in the Plan. The Fund reserves the right to amend or terminate the Plan at any time. Although the Fund reserves the right to amend the Plan to include a service charge payable by the participants, there is no direct service charge to participants in the Plan at this time.
Call today to start reinvesting distributions
For more information on the Nuveen Automatic Reinvestment Plan or to enroll in or withdraw from the Plan, speak with your financial professional or call us at (800) 257-8787.
56
CHANGES OCCURRING DURING THE FISCAL YEAR
The following information in this annual report is a summary of certain changes during the most recent fiscal year. This information may not reflect all of the changes that have occurred since you purchased shares of the Fund.
During the most recent fiscal year, there have been no changes to: (i) the Fund’s investment objective and principal investment policies that have not been approved by shareholders, (ii) the principal risks of the Fund, (iii) the portfolio managers of the Fund; (iv) the Fund’s charter or by-laws that would delay or prevent a change of control of the Fund that have not been approved by shareholders except as follows:
Amended and Restated By-Laws
On October 5, 2020, after a rigorous and deliberative review, and consistent with the interests of the Nuveen Multi-Market Income Fund (the “Fund”) long-term shareholders, the Board of Trustees of the Fund adopted Amended and Restated By-Laws.
Among other changes, the Amended and Restated By-Laws require compliance with certain amended deadlines and procedural and informational requirements in connection with advance notice of shareholder proposals or nominations, including certain information about the proponent and the proposal, or in the case of a nomination, the nominee. Any shareholder considering making a nomination or other proposal should carefully review and comply with those provisions of the Amended and Restated By-Laws.
The Amended and Restated By-Laws also include provisions (the “Control Share By-Law”) pursuant to which, in summary, a shareholder who obtains beneficial ownership of common shares of the Fund in a “Control Share Acquisition” may exercise voting rights with respect to such shares only to the extent the authorization of such voting rights is approved by other shareholders of the Fund. The Control Share By-Law is primarily intended to protect the interests of the Fund and its long-term shareholders by limiting the risk that the Fund will become subject to undue influence by opportunistic traders pursuing short-term agendas adverse to the best interests of the Fund and its long-term shareholders. The Control Share By-Law does not eliminate voting rights for common shares acquired in Control Share Acquisitions, but rather entrusts the Fund’s other “non-interested” shareholders with determining whether to approve the authorization of the voting rights of the person acquiring such shares.
Subject to various conditions and exceptions, the Control Share By-Law defines a “Control Share Acquisition” to include an acquisition of common shares that, but for the Control Share By-Law, would give the beneficial owner, upon the acquisition of such shares, the ability to exercise voting power in the election of Trustees of the Fund in any of the following ranges:
| | (i) | one-tenth or more, but less than one-fifth of all voting power; |
| | (ii) | one-fifth or more, but less than one-third of all voting power; |
| | (iii) | one-third or more, but less than a majority of all voting power; or |
| | (iv) | a majority or more of all voting power. |
The Control Share By-Law generally excludes certain acquisitions of common shares from the definition of a Control Share Acquisition, including acquisitions of common shares that occurred prior to October 5, 2020, though such shares are included in assessing whether any subsequent share acquisition exceeds one of the enumerated thresholds.
Subject to certain conditions and procedural requirements set forth in the Control Share By-Law, including the delivery of a “Control Share Acquisition Statement” to the Fund’s Secretary setting forth certain required information, a shareholder who obtains or proposes to obtain beneficial ownership of common shares in a Control Share Acquisition generally may demand a special meeting of shareholders for the purpose of considering whether the voting rights of such acquiring person with respect to such shares shall be authorized.
This discussion is only a high-level summary of certain aspects of the Amended and Restated By-Laws, and is qualified in its entirety by reference to the Amended and Restated By-Laws. Shareholders should refer to the Amended and Restated By-Laws for more information. A copy of the Amended and Restated By-Laws can be found in the Current Report on Form 8-K filed by the Fund with the Securities and Exchange Commission on October 6, 2020, which is available at www.sec.gov, and may also be obtained by writing to the Secretary of the Fund at 333 West Wacker Drive, Chicago, Illinois 60606.
57
Additional Fund Information (Unaudited)
| | | | | | | | | | |
| Board of Trustees | | | | | | | | | | |
| Jack B. Evans | | William C. Hunter | | Amy B. R. Lancellotta | | Joanne T. Medero | | Albin F. Moschner | | John K. Nelson |
Judith M. Stockdale | | Carole E. Stone | | Matthew Thornton III | | Terence J. Toth | | Margaret L. Wolff | | Robert L. Young |
| | | | | | | | |
| | | | | |
Investment Adviser Nuveen Fund Advisors, LLC 333 West Wacker Drive Chicago, IL 60606 | | Custodian State Street Bank
& Trust Company One Lincoln Street Boston, MA 02111 | | Legal Counsel Chapman and Cutler LLP Chicago, IL 60603 | | Independent Registered
Public Accounting Firm KPMG LLP 200 East Randolph Street Chicago, IL 60601 | | Transfer Agent and
Shareholder Services Computershare Trust
Company, N.A.
150 Royall Street Canton, MA 02021 (800) 257-8787 |
Distribution Information
The Fund hereby designates its percentage of dividends paid from net ordinary income as dividends qualifying for the dividends received deduction (“DRD”) for corporations and its percentage of qualified dividend income (“QDI”) for individuals under Section 1(h)(11) of the Internal Revenue Code as shown in the accompanying table. The actual qualified dividend income distributions will be reported to shareholders on Form 1099-DIV which will be sent to shareholders shortly after calendar year end.
| | | | |
| | | JMM | |
% DRD | | | 0.0% | |
% QDI | | | 1.3% | |
The Fund hereby designates its percentage of dividends paid from net ordinary income as dividends qualifying as Interest-Related Dividends and/or short term capital gain dividends as defined in Internal Revenue Code Section 871(k) for the taxable periods ending December 31, 2020 and June 30, 2021:
| | | | |
| | | JMM | |
July 1, 2020 through December 31, 2020 | | | 95.4% | |
January 1, 2021 through June 30, 2021 | | | 97.9% | |
The Fund had the following percentage, or maximum amount allowable, of ordinary dividends treated as Section 163(j) interest dividends pursuant to Section 163(j) of the Internal Revenue Code for the taxable year ended June 30, 2021:
| | | | |
| | | JMM | |
% of Section 163(j) Interest Dividends | | | 100.0% | |
Portfolio of Investments Information
The Fund is required to file its complete schedule of portfolio holdings with the Securities and Exchange Commission (SEC) for the first and third quarters of each fiscal year as an exhibit to its report on Form N-PORT. You may obtain this information on the SEC’s website at http://www.sec.gov.
Nuveen Funds’ Proxy Voting Information
You may obtain (i) information regarding how each fund voted proxies relating to portfolio securities held during the most recent twelve-month period ended June 30, without charge, upon request, by calling Nuveen toll-free at (800) 257-8787 or on Nuveen’s website at www.nuveen.com and (ii) a description of the policies and procedures that each fund used to determine how to vote proxies relating to portfolio securities without charge, upon request, by calling Nuveen toll free at (800) 257-8787. You may also obtain this information directly from the SEC. Visit the SEC on-line at http://www.sec.gov.
CEO Certification Disclosure
The Fund’s Chief Executive Officer (CEO) has submitted to the New York Stock Exchange (NYSE) the annual CEO certification as required by Section 303A.12(a) of the NYSE Listed Company Manual. The Fund has filed with the SEC the certification of its CEO and Chief Financial Officer required by Section 302 of the Sarbanes-Oxley Act.
58
Common Share Repurchases
The Fund intends to repurchase, through its open-market share repurchase program, shares of its own common stock at such times and in such amounts as is deemed advisable. During the period covered by this report, the Fund repurchased shares of its common stock, as shown in the accompanying table. Any future repurchases will be reported to shareholders in the next annual or semi-annual report.
| | | | |
| | | JMM | |
Common shares repurchased | | | 0 | |
FINRA BrokerCheck
The Financial Industry Regulatory Authority (FINRA) provides information regarding the disciplinary history of FINRA member firms and associated investment professionals. This information as well as an investor brochure describing FlNRA BrokerCheck is available to the public by calling the FINRA BrokerCheck Hotline number at (800) 289-9999 or by visiting www.FINRA.org.
59
Glossary of Terms Used in this Report
(Unaudited)
| ∎ | | Average Annual Total Return: This is a commonly used method to express an investment’s performance over a particular, usually multi-year time period. It expresses the return that would have been necessary each year to equal the investment’s actual cumulative performance (including change in NAV or market price and reinvested dividends and capital gains distributions, if any) over the time period being considered. |
| ∎ | | Beta: A measure of the variability of the change in the share price for a fund in relation to a change in the value of the fund’s market benchmark. Securities with betas higher than 1.0 have been, and are expected to be, more volatile than the benchmark; securities with betas lower than 1.0 have been, and are expected to be, less volatile than the benchmark. |
| ∎ | | JMM Custom Blended Fund Performance Benchmark: A two index blend comprised of weightings approximating the Fund’s proposed portfolio: 25% Bloomberg Barclays U.S. Corporate High-Yield Index and 75% Bloomberg Barclays U.S. Government/Mortgage Index. 1) Bloomberg Barclays U.S. Corporate High-Yield Index: An unmanaged index that covers the universe of domestic fixed-rate non-investment grade debt; and 2) Bloomberg Barclays U.S. Government/Mortgage Index: An unmanaged index considered representative of U.S. government treasury securities and agency mortgage-back securities. Benchmark returns assume reinvestment of distributions, but do not reflect any applicable sales charges or management fees. |
| ∎ | | Bloomberg Barclays U.S. Government/Mortgage Bond Index: The index measures the performance of U.S. government bonds and mortgage-related securities. Index returns assume reinvestment of distributions, but do not include the effects of any applicable sales charges or management fees. |
| ∎ | | Contingent Capital Securities (CoCos): CoCos are debt or capital securities of primarily non-U.S. issuers with loss absorption contingency mechanisms built into the terms of the security, for example a mandatory conversion into common stock of the issuer, or a principal write-down, which if triggered would likely cause the CoCo investment to lose value. Loss absorption mechanisms would become effective upon the occurrence of a specified contingency event, or at the discretion of a regulatory body. Specified contingency events, as identified in the CoCo’s governing documents, usually reference a decline in the issuer’s capital below a specified threshold level, and/or certain regulatory events. A loss absorption contingency event for CoCos would likely be the result of, or related to, the deterioration of the issuer’s financial condition and/or its status as a going concern. In such a case, with respect to CoCos that provide for conversion into common stock upon the occurrence of the contingency event, the market price of the issuer’s common stock received by the Acquiring Fund will have likely declined, perhaps substantially, and may continue to decline after conversion. CoCos rated below investment grade should be considered high yield securities, or “junk,” but often are issued by entities whose more senior securities are rated investment grade. CoCos are a relatively new type of security; and there is a risk that CoCo security issuers may suffer the sort of future financial distress that could materially increase the likelihood (or the market’s perception of the likelihood) that an automatic write-down or conversion event on those issuers’ CoCos will occur. Additionally, the trading behavior of a given issuer’s CoCo may be strongly impacted by the trading behavior of other issuers’ CoCos, such that negative information from an unrelated CoCo security may cause a decline in value of one or more CoCos held by the Fund. Accordingly, the trading behavior of CoCos may not follow the trading behavior of other types of debt and preferred securities. Despite these concerns, the prospective reward vs. risk characteristics of at least certain CoCos may be very attractive relative to other fixed-income alternatives. |
| ∎ | | Duration: Duration is a measure of the expected period over which a bond’s principal and interest will be paid, and consequently is a measure of the sensitivity of a bond’s or bond fund’s value to changes when market interest rates change. Generally, the longer a bond’s or fund’s duration, the more the price of the bond or fund will change as interest rates change. |
| ∎ | | Effective Leverage: Effective leverage is a fund’s effective economic leverage, and includes both regulatory leverage (see below) and the leverage effects of certain derivative investments in the fund’s portfolio. |
| ∎ | | Gross Domestic Product (GDP): The total market value of all final goods and services produced in a country/region in a given year, equal to total consumer, investment and government spending, plus the value of exports, minus the value of imports. |
60
| ∎ | | Leverage: Leverage is created whenever a fund has investment exposure (both reward and/or risk) equivalent to more than 100% of the investment capital. |
| ∎ | | Net Asset Value (NAV) Per Share: A fund’s Net Assets is equal to its total assets (securities, cash, accrued earnings and receivables) less its total liabilities. NAV per share is equal to the fund’s Net Assets divided by its number of shares outstanding. |
| ∎ | | Regulatory Leverage: Regulatory leverage consists of preferred shares issued by or borrowings of the fund. Both of these are part of the fund’s capital structure. Regulatory leverage is subject to asset coverage limits set in the Investment Company Act of 1940. |
61
Annual Investment Management Agreement Approval Process
(Unaudited)
At a meeting held on May 25-27, 2021 (the “May Meeting”), the Board of Trustees (the “Board” and each Trustee, a “Board Member”) of the Fund, which is comprised entirely of Board Members who are not “interested persons” (as defined under the Investment Company Act of 1940 (the “1940 Act”)) (the “Independent Board Members”), approved the renewal of the management agreement (the “Investment Management Agreement”) with Nuveen Fund Advisors, LLC (the “Adviser”) pursuant to which the Adviser serves as the investment adviser to the Fund and the sub-advisory agreement (the “Sub-Advisory Agreement”) with Nuveen Asset Management, LLC (the “Sub-Adviser”) pursuant to which the Sub-Adviser serves as the sub-adviser to the Fund. Although the 1940 Act requires that continuances of the Advisory Agreements (as defined below) be approved by the in-person vote of a majority of the Independent Board Members, the May Meeting was held virtually through the internet in view of the health risks associated with holding an in-person meeting during the COVID-19 pandemic and governmental restrictions on gatherings. The May Meeting was held virtually in reliance on certain exemptive relief the Securities and Exchange Commission provided to registered investment companies providing temporary relief from the in-person voting requirements of the 1940 Act with respect to the approval of a fund’s advisory agreement in light of these challenges.
Following up to an initial two-year period, the Board considers the renewal of the Investment Management Agreement and Sub-Advisory Agreement on an annual basis. The Investment Management Agreement and Sub-Advisory Agreement are collectively referred to as the “Advisory Agreements” and the Adviser and the Sub-Adviser are collectively, the “Fund Advisers” and each, a “Fund Adviser.” Throughout the year, the Board and its committees meet regularly and, at these meetings, receive regular and/or special reports that cover an extensive array of topics and information that are relevant to its annual consideration of the renewal of the advisory agreements for the Nuveen funds. Such information may address, among other things, fund performance and risk information; the Adviser’s strategic plans; product initiatives for various funds; the review of the funds and investment teams; compliance, regulatory and risk management matters; the trading practices of the various sub-advisers to the funds; valuation of securities; fund expenses; securities lending; liquidity management; overall market and regulatory developments; and with respect to closed-end funds, capital management initiatives, institutional ownership, management of leverage financing and the secondary market trading of the closed-end funds and any actions to address discounts. The Board also seeks to meet periodically with the Nuveen funds’ sub-advisers and portfolio teams, when feasible.
In addition, in connection with the annual consideration of the advisory agreements for the Nuveen funds, the Board, through its independent legal counsel, requested and received extensive materials and information prepared specifically for its annual consideration of the renewal of such advisory agreements by the Adviser and by Broadridge Financial Solutions, Inc. (“Broadridge”), an independent provider of investment company data. The materials cover a wide range of topics including, but not limited to, a description of the nature, extent and quality of services provided by the Fund Advisers; a review of product actions taken during 2020 (such as mergers, liquidations, fund launches, changes to investment teams, and changes to investment policies); a review of each sub-adviser to the Nuveen funds and the applicable investment teams; an analysis of fund performance in absolute terms and as compared to the performance of certain peer funds and benchmarks with a focus on any performance outliers; an analysis of the fees and expense ratios of the Nuveen funds in absolute terms and as compared to those of certain peer funds with a focus on any expense outliers; a review of management fee schedules; a description of portfolio manager compensation; an overview of the secondary market trading of shares of the Nuveen closed-end funds (including, among other things, an analysis of performance, distribution and valuation and capital-raising trends in the broader closed-end fund market and with respect to Nuveen closed-end funds and a review of the leverage management actions taken on behalf of the closed-end funds particularly during the periods of market volatility generally caused by the COVID-19 pandemic); a review of the performance of various service providers; a description of various initiatives Nuveen had undertaken or continued during the year for the benefit of particular fund(s) and/or the complex; a description of the profitability or financial data of Nuveen and the sub-advisers to the Nuveen funds; and a description of indirect benefits received by the Adviser and the sub-advisers as a result of their relationships with the Nuveen funds. The information prepared specifically for the annual review supplemented the information provided to the Board and its committees and the evaluations of the Nuveen funds by the Board and its committees during the year.
62
In continuing its practice, the Board met prior to the May Meeting to begin its considerations of the renewal of the Advisory Agreements. Accordingly, on April 21-22, 2021 (the “April Meeting”), the Board met to review and discuss, in part, the performance of the Nuveen funds and the Adviser’s evaluation of each sub-adviser to the Nuveen funds. At the April Meeting, the Board Members asked questions and requested additional information that was provided for the May Meeting. The Board reviewed fund performance throughout the year and in its review, the Board recognized the volatile market conditions that occurred in early 2020 arising, in part, from the public health crisis caused by the novel coronavirus known as COVID-19 and the resulting impact on a fund’s performance for 2020 and thereafter. Accordingly, the Board considered performance data measured over various periods of time as summarized in more detail below.
The Independent Board Members considered the review of the advisory agreements for the Nuveen funds to be an ongoing process and employed the accumulated information, knowledge and experience the Board Members had gained during their tenure on the boards governing the Nuveen funds and working with the Adviser and sub-advisers in their review of the advisory agreements. The contractual arrangements are a result of multiple years of review, negotiation and information provided in connection with the boards’ annual review of the Nuveen funds’ advisory arrangements and oversight of the Nuveen funds.
The Independent Board Members were advised by independent legal counsel during the annual review process as well as throughout the year, including meeting in executive sessions with such counsel at which no representatives from the Adviser or the Sub-Adviser were present. In connection with their annual review, the Independent Board Members also received a memorandum from independent legal counsel outlining their fiduciary duties and legal standards in reviewing the Advisory Agreements.
The Board’s decision to renew the Advisory Agreements was not based on a single identified factor, but rather the decision reflected the comprehensive consideration of all the information provided throughout the year and at the April and May Meetings, and each Board Member may have attributed different levels of importance to the various factors and information considered in connection with the approval process. The following summarizes the principal factors and information, but not all the factors, the Board considered in deciding to renew the Advisory Agreements as well as the Board’s conclusions.
| A. | | Nature, Extent and Quality of Services |
In evaluating the renewal of the Advisory Agreements, the Independent Board Members received and considered information regarding the nature, extent and quality of the applicable Fund Adviser’s services provided to the Fund with particular focus on the services and enhancements to such services provided during the last year. The Independent Board Members considered the Investment Management Agreement and the Sub-Advisory Agreement separately in the course of their review. With this approach, they considered the respective roles of the Adviser and the Sub-Adviser in providing services to the Fund.
The Board recognized that the Nuveen funds operate in a highly regulated industry and, therefore, the Adviser has provided a wide array of management, oversight and administrative services to manage and operate the funds, and the scope and complexity of these services have expanded over time as a result of, among other things, regulatory and other developments. The Board accordingly considered the extensive resources, tools and capabilities available to the Adviser to operate and manage the Nuveen funds. With respect to the Adviser, as a general matter, some of these services it and its affiliates provide to the Nuveen funds include, but are not limited to: product management (such as setting dividends, analyzing fund expenses, providing competitive analysis, and providing due diligence support); investment oversight, risk management and securities valuation services (such as overseeing and reviewing the various sub-advisers to the Nuveen funds and their investment teams; analyzing fund performance and risk data; overseeing operational and risk management; participating in financial statement, marketing and risk disclosures; providing daily valuation services and developing related valuation policies, procedures and methodologies; periodic testing of audit and regulatory requirements; participating in product development and management processes; participating in leverage management, liquidity monitoring and counterparty credit oversight; providing due diligence and overseeing fund accounting and custody providers; overseeing third party pricing services and periodically assessing investment and liquidity risks); fund administration (such as preparing fund tax returns and other tax compliance services; preparing regulatory filings; overseeing the funds’ independent public accountants and other service providers; analyzing products and enhancements; and managing fund budgets and expenses); oversight of shareholder services and transfer agency functions (such as overseeing transfer agent service providers which include
63
Annual Investment Management Agreement Approval Process (continued)
(Unaudited)
registered shareholder customer service and transaction processing; overseeing proxy solicitation and tabulation services; and overseeing the production and distribution of financial reports by service providers); Board relations services (such as organizing and administering Board and committee meetings, preparing various reports to the Board and committees and providing other support services); compliance and regulatory oversight services (such as managing compliance policies; monitoring compliance with applicable fund policies and laws and regulations; devising internal compliance programs and a framework to review and assess compliance programs; evaluating the compliance programs of the various sub-advisers to the Nuveen funds and certain other service providers; responding to regulatory requests; and preparing compliance training materials); legal support and oversight of outside law firms (such as helping to prepare and file registration statements and proxy statements; overseeing fund activities and providing legal interpretations regarding such activities; maintaining regulatory registrations and negotiating agreements with other fund service providers; and monitoring changes in regulatory requirements and commenting on rule proposals impacting investment companies); and with respect to closed-end funds, managing leverage, monitoring asset coverage and promoting an orderly secondary market.
In evaluating services, the Board reviewed various highlights of the initiatives the Adviser and its affiliates have undertaken or continued in 2020 to benefit the Nuveen complex and/or particular Nuveen funds and meet the requirements of an increasingly complex regulatory environment including, but not limited to:
| | • | | Centralization of Functions – ongoing initiatives to centralize investment leadership, market approach and shared support functions within Nuveen and its affiliates in seeking to operate more effectively the business and enhance the services to the Nuveen funds; |
| | • | | Fund Improvements and Product Management Initiatives – continuing to proactively manage the Nuveen fund complex as a whole and at the individual fund level with an aim to continually improve product platforms and investment strategies to better serve shareholders through, among other things, rationalizing the product line and gaining efficiencies through mergers, repositionings and liquidations; launching new funds; reviewing and updating investment policies and benchmarks; and modifying portfolio management teams for various funds; |
| | • | | Investment Team Integrations – continuing to integrate and adjust the members of certain investment teams, in part, to allow greater access to tools and resources within the Nuveen organization and its affiliates; |
| | • | | Capital Initiatives – continuing to invest capital to support new Nuveen funds with initial capital as well as to support existing funds and facilitate regulatory or logistical changes; |
| | • | | Compliance Program Initiatives – continuing efforts to mitigate compliance risk, increase operating efficiencies, implement enhancements to strengthen key compliance program elements and support international business growth and other corporate objectives; |
| | • | | Investment Oversight – preparing reports to the Board addressing, among other things, fund performance; market conditions; investment teams; new products; changes to mandates, policies and benchmarks; and other management proposals; |
| | • | | Risk Management and Valuation Services – continuing to oversee and manage risk including, among other things, conducting daily calculations and monitoring of risk measures across the Nuveen funds, instituting appropriate investment risk controls, providing risk reporting throughout the firm, participating in internal oversight committees, and continuing to implement an operational risk framework that seeks to provide greater transparency of operational risk matters across the complex as well as provide multiple other risk programs that seek to provide a more disciplined and consistent approach to identifying and mitigating Nuveen’s operational risks. Further, the securities valuation team continues, among other things, to oversee the daily valuation process of the portfolio securities of the funds, maintains the valuation policies and procedures, facilitates valuation committee meetings, manages relationships with pricing vendors, and prepares relevant valuation reports and designs methods to simplify and enhance valuation workflow within the organization; |
64
| | • | | Regulatory Matters – continuing efforts to monitor regulatory trends and advocate on behalf of Nuveen and/or the Nuveen funds, to implement and comply with new or revised rules and mandates and to respond to regulatory inquiries and exams; |
| | • | | Government Relations – continuing efforts of various Nuveen teams and Nuveen’s affiliates to develop policy positions on a broad range of issues that may impact the Nuveen funds, advocate and communicate these positions to lawmakers and other regulatory authorities and work with trade associations to ensure these positions are represented; |
| | • | | Business Continuity, Disaster Recovery and Information Security – continuing efforts of Nuveen to periodically test and update business continuity and disaster recovery plans and, together with its affiliates, to maintain an information security program designed to identify and manage information security risks, and provide reports to the Board, at least annually, addressing, among other things, management’s security risk assessment, cyber risk profile, potential impact of new or revised laws and regulations, incident tracking and other relevant information technology risk-related reports; |
| | • | | Dividend Management Services – continuing to manage the dividends among the varying types of Nuveen funds within the Nuveen complex to be consistent with the respective fund’s product design and positioning in striving to deliver those earnings to shareholders in a relatively consistent manner over time as well as assisting in the development of new products or the restructuring of existing funds; and |
| | • | | with respect specifically to closed-end funds, such continuing services also included: |
| | • | | Leverage Management Services – continuing to actively manage the various forms of leverage utilized across the complex, including through committing resources and focusing on sourcing/structure development and bank provider management, which was key to navigating the respective funds through the COVID-related market volatility in 2020; |
| | • | | Capital Management, Market Intelligence and Secondary Market Services – ongoing capital management efforts through shelf offerings, share repurchases, tender offers and capital return programs as well as providing market data analysis to help understand closed-end fund ownership cycles and their impact on secondary market trading as well as to improve proxy solicitation efforts; and |
| | • | | Closed-end Fund Investor Relations Program – maintaining the closed-end fund investor relations program which, among other things, raises awareness, provides educational materials and cultivates advocacy for closed-end funds and the Nuveen closed-end fund product line. |
In its review, the Board recognized that Nuveen’s risk management, compliance, technology and operations capabilities are all integral to providing its investment management services to the Nuveen funds. Further, the Board noted the benefits to shareholders of investing in a Nuveen fund, as each Nuveen fund is a part of a large fund complex with a variety of investment disciplines, capabilities, expertise and resources available to navigate and support the funds including during stressed times as occurred in the market in the first half of 2020. The Board recognized the impact of the COVID-19 pandemic during the year and the adaptations required by service providers to continue to deliver their services to the Nuveen funds, including working remotely. In this regard, the Board noted the ability of the Adviser and the various sub-advisers to the Nuveen funds to provide continuously their services notwithstanding the significant disruptions caused by the pandemic. In addition to the services provided by the Adviser, the Board also considered the risks borne by the Adviser and its affiliates in managing the Nuveen funds, including entrepreneurial, operational, reputational, regulatory and litigation risks.
The Board further considered the division of responsibilities between the Adviser and the Sub-Adviser and recognized that the Sub-Adviser and its investment personnel generally are responsible for the management of the Fund’s portfolio under the oversight of the Adviser and the Board. The Board considered an analysis of the Sub-Adviser provided by the Adviser which included, among other things, the assets under management of the applicable investment team and changes thereto, a summary of the applicable investment team and changes thereto, the investment process and philosophy of the applicable investment team, the performance of the Nuveen funds sub-advised by the Sub-Adviser over various periods of time and a summary of any significant policy and/or other changes to the Nuveen funds sub-advised by the Sub-Adviser. The Board further considered at the May Meeting or prior meetings evaluations of the Sub-Adviser’s compliance programs and trade
65
Annual Investment Management Agreement Approval Process (continued)
(Unaudited)
execution. The Board also considered the structure of investment personnel compensation programs and whether this structure provides appropriate incentives to act in the best interests of the respective Nuveen funds. The Board noted that the Adviser recommended the renewal of the Sub-Advisory Agreement.
Based on its review, the Board determined, in the exercise of its reasonable business judgment, that it was satisfied with the nature, extent and quality of services provided to the Fund under each applicable Advisory Agreement.
| B. | | The Investment Performance of the Fund and Fund Advisers |
In evaluating the quality of the services provided by the Fund Advisers, the Board also received and considered a variety of investment performance data of the Nuveen funds they advise. In evaluating performance, the Board recognized that performance data may differ significantly depending on the ending date selected, particularly during periods of market volatility, and therefore considered performance over a variety of time periods that may include full market cycles. In this regard, the Board reviewed, among other things, Fund performance over the quarter, one-, three- and five-year periods ending December 31, 2020 as well as performance data periods ending nearer to the May Meeting, including the quarter, one-, three- and five-year periods ending March 31, 2021 and May 14, 2021. The performance data prepared for the annual review of the advisory agreements for the Nuveen funds supplemented the fund performance data that the Board received throughout the year at its meetings representing differing time periods. In its review, the Board took into account the discussions with representatives of the Adviser; the Adviser’s analysis regarding fund performance that occurred at these Board meetings with particular focus on funds that were considered performance outliers (both overperformance and underperformance); the factors contributing to the performance; and any recommendations or steps taken to address performance concerns. Regardless of the time period reviewed by the Board, the Board recognized that shareholders may evaluate performance based on their own holding periods which may differ from the periods reviewed by the Board and lead to differing results.
In its review, the Board reviewed both absolute and relative fund performance during the annual review over the various time periods. With respect to the latter, the Board considered fund performance in comparison to the performance of peer funds (the “Performance Peer Group”) and recognized and/or customized benchmarks (i.e., generally benchmarks derived from multiple recognized benchmarks). For Nuveen funds that had changes in portfolio managers since 2018 or significant changes, among other things, to their investment strategies or policies since 2019, the Board reviewed certain performance data comparing the performance of such funds before and after such changes. In considering performance data, the Board is aware of certain inherent limitations with such data, including that differences between the objective(s), strategies and other characteristics of the Nuveen funds compared to the respective Performance Peer Group and/or benchmark(s) (such as differences in the use of leverage) as well as differences in the composition of the Performance Peer Group over time will necessarily contribute to differences in performance results and limit the value of the comparative information. To assist the Board in its review of the comparability of the relative performance, the Adviser has ranked the relevancy of the peer group to the funds as low, medium or high.
The Board also evaluated performance in light of various relevant factors, including, among other things, general market conditions, issuer-specific information, asset class information, leverage and fund cash flows. In relation to general market conditions, the Board recognized the significant market decline in the early part of 2020 in connection with, among other things, the impact of the COVID-19 pandemic and that such a period of underperformance and market volatility may significantly weigh on the longer term performance results. Accordingly, depending on the facts and circumstances including any differences between the respective Nuveen fund and its benchmark and/or Performance Peer Group, the Board may be satisfied with a fund’s performance notwithstanding that its performance may be below that of its benchmark or peer group for certain periods. However, with respect to any Nuveen funds for which the Board had identified performance issues, the Board monitors such funds closely until performance improves, discusses with the Adviser the reasons for such results, considers whether any steps are necessary or appropriate to address such issues, and reviews the results of any steps undertaken.
The secondary market trading of shares of the Nuveen closed-end funds continues to be a priority for the Board given its importance to shareholders, and therefore data reflecting the premiums and discounts at which the shares of the closed-end funds trade are reviewed by the Board during its annual review and by the Board and/or its Closed-end Fund committee
66
during its respective quarterly meetings throughout the year. The Board continuously reviews all closed-end fund discounts and the fund’s performance relative to both primary and secondary benchmarks and peers. In its review, the Board considers, among other things, changes to investment mandates and guidelines, enhanced and attractive distribution policies, leverage levels and types, fund reorganizations, share repurchases and similar capital market actions and effective communications programs to build greater awareness and deepen understanding of closed-end funds.
The Board noted that although the Fund’s performance was below the performance of its blended benchmark for the one-, three- and five-year periods ended December 31, 2020, the Fund ranked in the second quartile of its Performance Peer Group for the one- and three-year periods ended December 31, 2020 and third quartile for the five-year period ended December 31, 2020. Although the Fund’s performance was below the performance of its blended benchmark for the three-year period ended March 31, 2021, the Fund outperformed its blended benchmark for the one- and five-year periods and ranked in the third quartile of its Performance Peer Group for the one- and three-year periods and second quartile for the five-year period ended March 31, 2021. For periods ended May 14, 2021, although the Fund’s performance was below the performance of its blended benchmark for the three-year period, the Fund outperformed its blended benchmark for the one- and five-year periods and ranked in the third quartile of its Performance Peer Group for the one-, three- and five-year periods. In considering performance, the Board recognized that the Performance Peer Group was classified as low for relevancy. Based on its review, the Board was satisfied with the Fund’s overall performance.
| C. | | Fees, Expenses and Profitability |
As part of its annual review, the Board considered the contractual management fee and net management fee (the management fee after taking into consideration fee waivers and/or expense reimbursements, if any) paid by a Nuveen fund to the Adviser in light of the nature, extent and quality of the services provided. The Board also considered the total operating expense ratio of each fund before and after any fee waivers and/or expense reimbursements. More specifically, the Independent Board Members reviewed, among other things, each fund’s gross and net management fee rates (i.e., before and after expense reimbursements and/or fee waivers, if any) and net total expense ratio in relation to those of a comparable universe of funds (the “Peer Universe”) established by Broadridge. The Independent Board Members reviewed the methodology Broadridge employed to establish its Peer Universe and recognized that differences between the applicable fund and its respective Peer Universe as well as changes to the composition of the Peer Universe from year to year may limit some of the value of the comparative data. The Independent Board Members also considered a fund’s operating expense ratio as it more directly reflected the shareholder’s costs in investing in the respective fund.
In their review, the Independent Board Members considered, in particular, each fund with a net expense ratio (excluding investment-related costs of leverage) of six basis points or higher compared to that of its peer average (each, an “Expense Outlier Fund”), including the Fund, and an analysis as to the factors contributing to each such fund’s higher relative net expense ratio. In addition, although the Board reviewed a fund’s total net expenses both including and excluding investment-related expenses (i.e., leverage costs) and taxes for certain of the closed-end funds, the Board recognized that leverage expenses will vary across funds and in comparison to peers because of differences in the forms and terms of leverage employed by the respective fund. Accordingly, in reviewing the comparative data between a fund and its peers, the Board generally considered the fund’s net expense ratio and fees (excluding leverage costs and leveraged assets) to be higher if they were over 10 basis points higher, slightly higher if they were 6 to 10 basis points higher, in line if they were within approximately 5 basis points higher than the peer average and below if they were below the peer average of the Peer Universe. The Independent Board Members also considered, in relevant part, a fund’s net management fee and net total expense ratio in light of its performance history.
In their review of the fee arrangements for the Nuveen funds, the Independent Board Members considered the management fee schedules, including the complex-wide and fund-level breakpoint schedules. The Board noted that across the Nuveen fund complex, the complex-wide fee breakpoints reduced fees by approximately $58.4 million and fund-level breakpoints reduced fees by approximately $69.6 million in 2020.
67
Annual Investment Management Agreement Approval Process (continued)
(Unaudited)
With respect to the Sub-Adviser, the Board also considered the sub-advisory fee schedule paid to the Sub-Adviser in light of the sub-advisory services provided to the Fund, the breakpoint schedule and comparative data of the fees the Sub-Adviser charges to other clients, if any. In its review, the Board recognized that the compensation paid to the Sub-Adviser is the responsibility of the Adviser, not the Fund.
The Independent Board Members noted that the Fund had a net management fee and a net expense ratio that were higher than the respective peer averages. The Independent Board Members noted that the Fund’s net expense ratio was higher than the peer average due, in part, to the small size of the Fund, the small composition of the peer group and the temporary reimbursement of expenses by one of the peers.
Based on its review of the information provided, the Board determined that the Fund’s management fees (as applicable) to a Fund Adviser were reasonable in light of the nature, extent and quality of services provided to the Fund.
| | 2. | | Comparisons with the Fees of Other Clients |
In determining the appropriateness of fees, the Board also considered information regarding the fee rates the respective Fund Advisers charged to certain other types of clients and the type of services provided to these other clients. With respect to the Adviser and/or the Sub-Adviser, such other clients may include retail and institutional managed accounts advised by the Sub-Adviser; hedge funds managed by the Sub-Adviser; investment companies offered outside the Nuveen family and sub-advised by the Sub-Adviser; foreign investment companies offered by Nuveen and sub-advised by the Sub-Adviser; and collective investment trusts sub-advised by the Sub-Adviser. The Board further noted that the Adviser also advised certain exchange-traded funds (“ETFs”) sponsored by Nuveen.
The Board recognized that the Fund had an affiliated sub-adviser and, with respect to affiliated sub-advisers, reviewed, among other things, the range of fees assessed for managed accounts, hedge funds (along with their performance fee) and foreign investment companies offered by Nuveen. The Board also reviewed the fee range and average fee rate of certain selected investment strategies offered in retail and institutional managed accounts advised by the Sub-Adviser, the hedge funds advised by the Sub-Adviser (along with their performance fee) and non-Nuveen investment companies sub-advised by certain affiliated sub-advisers.
In considering the fee data of other clients, the Board recognized, among other things, the differences in the amount, type and level of services provided to the Nuveen funds relative to other clients as well as the differences in portfolio investment policies, investor profiles, account sizes and regulatory requirements, all of which contribute to the variations in the fee schedules. The Board recognized the breadth of services the Adviser had provided to the Nuveen funds compared to the other types of clients as the funds operate in a highly regulated industry with increasing regulatory requirements as well as the increased entrepreneurial, legal and regulatory risks that the Adviser incurs in sponsoring and managing the funds. Further, with respect to ETFs, the Board considered that Nuveen ETFs were passively managed compared to the active management of the other Nuveen funds which contributed to the differences in fee levels between the Nuveen ETFs and other Nuveen funds. In general, higher fee levels reflect higher levels of service provided by the Adviser, increased investment management complexity, greater product management requirements, and higher levels of business risk or some combination of these factors. The Board further considered that the Sub-Adviser’s fee is essentially for portfolio management services and therefore more comparable to the fees it receives for retail wrap accounts and other external sub-advisory mandates. The Board concluded the varying levels of fees were justified given, among other things, the inherent differences in the products and the level of services provided to the Nuveen funds versus other clients, the differing regulatory requirements and legal liabilities and the entrepreneurial, legal and regulatory risks incurred in sponsoring and advising a registered investment company.
| | 3. | | Profitability of Fund Advisers |
In their review, the Independent Board Members considered information regarding Nuveen’s level of profitability for its advisory services to the Nuveen funds for the calendar years 2020 and 2019. The Board reviewed, among other things, Nuveen’s net margins (pre-tax) (both including and excluding distribution expenses); gross and net revenue margins (pre- and post-tax and excluding distribution) from Nuveen funds only; revenues, expenses and net income (pre- and post-tax and
68
before distribution expenses) of Nuveen for fund advisory services; and comparative profitability data comparing the operating margins of Nuveen compared to the adjusted operating margins of certain peers that had publicly available data and with the most comparable assets under management (based on asset size and asset composition) for each of the last two calendar years. In reviewing the peer comparison data, the Independent Board Members noted that Nuveen Investments, Inc.’s operating margins were on the low range compared to the total company adjusted operating margins of the peers. The Board also reviewed the revenues and expenses the Adviser derived from its ETF product line for the 2019 and 2020 calendar years.
In reviewing the profitability data, the Independent Board Members recognized the subjective nature of calculating profitability as the information is not audited and is dependent on cost allocation methodologies to allocate corporate-wide expenses to the Nuveen complex and its affiliates and to further allocate such Nuveen complex expenses between the Nuveen fund and non-fund businesses. Generally, fund-specific expenses are allocated to the Nuveen funds and partial fund-related expenses and/or corporate overhead and shared costs (such as legal and compliance, accounting and finance, information technology and human resources and office services) are partially attributed to the funds pursuant to cost allocation methodologies. The Independent Board Members reviewed a description of the cost allocation methodologies employed to develop the financial information, a summary of the history of changes to the methodology over the years from 2010 to 2020, and the net revenue margins derived from the Nuveen funds (pre-tax and including and excluding distribution) and total company margins from Nuveen Investments, Inc. compared to the firm-wide adjusted margins of the peers for each calendar year from 2010 to 2020. The Board had also appointed three Independent Board Members to serve as the Board’s liaisons, with the assistance of independent counsel, to review the development of the profitability data and any proposed changes to the cost allocation methodology prior to incorporating any such changes and to report to the full Board. The Board recognized that other reasonable and valid allocation methodologies could be employed and could lead to significantly different results. The Independent Board Members also considered the key drivers behind the revenue and expense changes that impacted Nuveen’s net margins between 2019 and 2020. The Board also noted the reinvestments Nuveen and/or its parent made into its business through, among other things, the investment of seed capital in certain Nuveen funds and continued investments in enhancements to information technology, portfolio accounting systems and the global trading platform.
In reviewing the comparative peer data noted above, the Board considered that the operating margins of Nuveen Investments, Inc. were in the lower half of the peer group range; however, the Independent Board Members also recognized the limitations of the comparative data given that peer data is not generally public and the calculation of profitability is subjective and affected by numerous factors (such as types of funds a peer manages, its business mix, its cost of capital, the numerous assumptions underlying the methodology used to allocate expenses and other factors) that can have a significant impact on the results.
Aside from Nuveen’s profitability, the Board recognized that the Adviser is a subsidiary of Nuveen, LLC, the investment management arm of Teachers Insurance and Annuity Association of America (“TIAA”). Accordingly, the Board also reviewed a balance sheet for TIAA reflecting its assets, liabilities and capital and contingency reserves for the 2020 and 2019 calendar years to consider the financial strength of TIAA. The Board recognized the benefit of an investment adviser and its parent with significant resources, particularly during periods of market volatility as experienced with the COVID-19 pandemic.
In addition to Nuveen, the Independent Board Members considered the profitability of the Sub-Adviser from its relationships with the Nuveen funds. In this regard, the Independent Board Members reviewed, among other things, the Sub-Adviser’s revenues, expenses and net revenue margins (pre- and post-tax) for its advisory activities for the calendar year ended December 31, 2020 as well as its pre- and post-tax net revenue margins for 2020 compared to such margins for 2019. The Independent Board Members also reviewed a profitability analysis reflecting the revenues, expenses and revenue margin (pre- and post-tax) by asset type for the Sub-Adviser for the calendar year ending December 31, 2020 and the pre- and post-tax revenue margins from 2020 and 2019.
In evaluating the reasonableness of the compensation, the Independent Board Members also considered any other ancillary benefits derived by the respective Fund Adviser from its relationship with the Nuveen funds as discussed in further detail below.
69
Annual Investment Management Agreement Approval Process (continued)
(Unaudited)
Based on a consideration of all the information provided, the Board noted that Nuveen’s and the Sub-Adviser’s level of profitability was acceptable and not unreasonable in light of the services provided.
| D. | | Economies of Scale and Whether Fee Levels Reflect These Economies of Scale |
The Board considered whether there have been economies of scale with respect to the management of the Nuveen funds and whether these economies of scale have been appropriately shared with the funds. The Board recognized that although economies of scale are difficult to measure and certain expenses may not decline with a rise in assets, there are several methods to help share the benefits of economies of scale, including breakpoints in the management fee schedule, fee waivers and/or expense limitations, the pricing of Nuveen funds at scale at inception and investments in Nuveen’s business which can enhance the services provided to the funds for the fees paid. The Board noted that Nuveen generally has employed these various methods, and the Board considered the extent to which the Nuveen funds will benefit from economies of scale as their assets grow. In this regard, the Board noted that the management fee of the Adviser is generally comprised of a fund-level component and a complex-level component each with its own breakpoint schedule, subject to certain exceptions. The Board reviewed the fund-level and complex-level fee schedules. The Board considered that the fund-level breakpoint schedules are designed to share economies of scale with shareholders if the particular fund grows, and the complex-level breakpoint schedule is designed to deliver the benefits of economies of scale to shareholders when the eligible assets in the complex pass certain thresholds even if the assets of a particular fund are unchanged or have declined. With respect to the Nuveen closed-end funds, the Independent Board Members noted that, although such funds may from time to time make additional share offerings, the growth of their assets would occur primarily through the appreciation of such funds’ investment portfolios. Further, in the calculation of the complex-level component, the Board noted that it had approved the acquisition of several Nuveen funds by similar TIAA-CREF funds in 2019. However, to mitigate the loss of the assets of these Nuveen funds deemed eligible to be included in the calculation of the complex-wide fee when these Nuveen funds left the complex upon acquisition, Nuveen agreed to credit approximately $604.5 million to assets under management to the Nuveen complex in calculating the complex-wide component.
The Independent Board Members also recognized the Adviser’s continued reinvestment in its business through various initiatives including maintaining a seed account available for investments into Nuveen funds and investing in its internal infrastructure, information technology and other systems that will, among other things, consolidate and enhance accounting systems, integrate technology platforms to support growth and efficient data processing, and further develop its global trading platform to enhance the investment process for the investment teams.
Based on its review, the Board concluded that the current fee arrangements together with the Adviser’s reinvestment in its business appropriately shared any economies of scale with shareholders.
The Independent Board Members received and considered information regarding other benefits the respective Fund Adviser or its affiliates may receive as a result of their relationship with the Nuveen funds. The Board considered the compensation that an affiliate of the Adviser received for serving as co-manager in the initial public offerings of new closed-end funds and for serving as an underwriter on shelf offerings of existing closed-end funds. In addition, the Independent Board Members also noted that various sub-advisers (including the Sub-Adviser) may engage in soft dollar transactions pursuant to which they may receive the benefit of research products and other services provided by broker-dealers executing portfolio transactions on behalf of the applicable Nuveen funds. However, the Board noted that any benefits for the Sub-Adviser when transacting in fixed-income securities may be more limited as such securities generally trade on a principal basis and therefore do not generate brokerage commissions.
Based on its review, the Board concluded that any indirect benefits received by a Fund Adviser as a result of its relationship with the Fund were reasonable and within acceptable parameters.
70
The Board Members did not identify any single factor discussed previously as all-important or controlling. The Board Members, including the Independent Board Members, concluded that the terms of each Advisory Agreement were fair and reasonable, that the respective Fund Adviser’s fees were reasonable in light of the services provided to the Fund and that the Advisory Agreements be renewed.
71
Board Members & Officers
(Unaudited)
The management of the Funds, including general supervision of the duties performed for the Funds by the Adviser, is the responsibility of the Board of Trustees of the Funds. None of the trustees who are not “interested” persons of the Funds (referred to herein as “independent board members”) has ever been a director or employee of, or consultant to, Nuveen or its affiliates. The names and business addresses of the trustees and officers of the Funds, their principal occupations and other affiliations during the past five years, the number of portfolios each Trustee oversees and other directorships they hold are set forth below.
| | | | | | | | |
| | | | | |
| | | | | | | | | |
Name, Year of Birth & Address | | Position(s) Held
with the Funds | | Year First
Elected or
Appointed
and Term(1)
| | Principal Occupation(s) Including other Directorships During Past 5 Years | | Number
of Portfolios
in Fund Complex
Overseen by
Board Member |
| | | | | |
| | | | | | | | | |
| | | |
| Independent Board Members: | | | | |
| | | | |
∎ TERENCE J. TOTH | | | | Formerly, a Co-Founding Partner, Promus Capital (investment advisory firm) (2008-2017); Director, Quality Control Corporation (manufacturing) (since 2012); member: Catalyst Schools of Chicago Board (since 2008) and Mather Foundation Board (philanthropy) (since 2012), and chair of its Investment Committee; formerly, Director, Fulcrum IT Services LLC (information technology services firm to government entities) (2010-2019); formerly, Director, LogicMark LLC (health services) (2012-2016); formerly, Director, Legal & General Investment Management America, Inc. (asset management) (2008-2013); formerly, CEO and President, Northern Trust Global Investments (financial services) (2004-2007): Executive Vice President, Quantitative Management & Securities Lending (2000-2004); prior thereto, various positions with Northern Trust Company (financial services) (since 1994); formerly, Member, Northern Trust Mutual Funds Board (2005-2007), Northern Trust Global Investments Board (2004-2007), Northern Trust Japan Board (2004-2007), Northern Trust Securities Inc. Board (2003-2007) and Northern Trust Hong Kong Board (1997-2004). | | |
1959 333 W. Wacker Drive Chicago, IL 6o6o6 | | Chair and Board Member | | 2008 Class II | | 143 |
| | | | | | | |
| | | | |
∎ JACK B. EVANS | | | | Chairman (since 2019), formerly, President (1996-2019), The Hall-Perrine Foundation, (private philanthropic corporation); Life Trustee of Coe College and the Iowa College Foundation; formerly, Member and President Pro-Tem of the Board of Regents for the State of Iowa University System (2007- 2013); Director and Chairman (2009-2021), United Fire Group, a publicly held company; Director, Public Member, American Board of Orthopaedic Surgery (2015-2020); Director (2000-2004), Alliant Energy; Director (1996-2015), The Gazette Company (media and publishing); Director (1997- 2003), Federal Reserve Bank of Chicago; President and Chief Operating Officer (1972-1995), SCI Financial Group, Inc., (regional financial services firm). | | |
1948 333 W. Wacker Drive Chicago, IL 6o6o6 | | Board Member | | 1999 Class III | | 143 |
| | | | | | | |
| | | | |
∎ WILLIAM C. HUNTER | | | | Dean Emeritus, formerly, Dean, Tippie College of Business, University of Iowa (2006-2012); Director of Wellmark, Inc. (since 2009); past Director (2005-2015), and past President (2010-2014) Beta Gamma Sigma, Inc., The International Business Honor Society; formerly, Director (2004-2018) of Xerox Corporation; formerly, Dean and Distinguished Professor of Finance, School of Business at the University of Connecticut (2003-2006); previously, Senior Vice President and Director of Research at the Federal Reserve Bank of Chicago (1995-2003); formerly, Director (1997-2007), Credit Research Center at Georgetown University. | | |
1948 333 W. Wacker Drive Chicago, IL 6o6o6 | | Board Member | | 2003 Class I | | 143 |
| | | | | | | |
| | | | |
∎ AMY B. R. LANCELLOTTA | | | | Formerly, Managing Director, Independent Directors Council (IDC) (supports the fund independent director community and is part of the Investment Company Institute (ICI), which represents regulated investment companies) (2006-2019); formerly, various positions with ICI (1989-2006); Member of the Board of Directors, Jewish Coalition Against Domestic Abuse (JCADA) (since 2020). | | |
1959 333 W. Wacker Drive Chicago, IL 6o6o6 | | Board Member | | 2021 Class II | | 143 |
| | | | | | | |
72
| | | | | | | | |
| | | | | |
| | | | | | | | | |
Name, Year of Birth & Address | | Position(s) Held
with the Funds | | Year First
Elected or
Appointed
and Term(1)
| | Principal Occupation(s) Including other Directorships During Past 5 Years | | Number
of Portfolios
in Fund Complex
Overseen by
Board Member |
| | | | | |
| | | | | | | | | |
| | | |
| Independent Board Members (continued): | | | | |
| | | | |
∎ JOANNE T. MEDERO | | | | Formerly, Managing Director, Government Relations and Public Policy (2009-2020) and Senior Advisor to the Vice Chairman (2018-2020), BlackRock, Inc. (global investment management firm); formerly, Managing Director, Global Head of Government Relations and Public Policy, Barclays Group (IBIM) (investment banking, investment management and wealth management businesses) (2006-2009); formerly, Managing Director, Global General Counsel and Corporate Secretary, Barclays Global Investors (global investment management firm) (1996-2006); formerly, Partner, Orrick, Herrington & Sutcliffe LLP (law firm) (1993-1995); formerly, General Counsel, Commodity Futures Trading Commission (government agency overseeing U.S. derivatives markets) (1989-1993); formerly, Deputy Associate Director/ Associate Director for Legal and Financial Affairs, Office of Presidential Personnel, The White House (1986-1989); Member of the Board of Directors, Baltic-American Freedom Foundation (seeks to provide opportunities for citizens of the Baltic states to gain education and professional development through exchanges in the U.S.) (since 2019). | | |
1954 333 W. Wacker Drive Chicago, IL 6o6o6 | | Board Member | | 2021 Class III | | 143 |
| | | | | | | |
| | | | |
∎ ALBIN F. MOSCHNER | | | | Founder and Chief Executive Officer, Northcroft Partners, LLC, (management consulting) (since 2012); formerly, Chairman (2019), and Director (2012-2019), USA Technologies, Inc., (provider of solutions and services to facilitate electronic payment transactions); formerly, Director, Wintrust Financial Corporation (1996-2016); previously, held positions at Leap Wireless International, Inc., (consumer wireless services) including Consultant (2011-2012), Chief Operating Officer (2008-2011), and Chief Marketing Officer (2004-2008); formerly, President, Verizon Card Services division of Verizon Communications, Inc. (2000-2003); formerly, President, One Point Services at One Point Communications (telecommunication services) (1999-2000); formerly, Vice Chairman of the Board, Diba, Incorporated (internet technology provider) (1996-1997); formerly, various executive positions (1991-1996) including Chief Executive Officer (1995-1996) of Zenith Electronics Corporation (consumer electronics). | | |
1952 333 W. Wacker Drive Chicago, IL 6o6o6 | | Board Member | | 2016 Class III | | 143 |
| | | | | | | |
| | | | |
∎ JOHN K. NELSON | | | | Member of Board of Directors of Core12 LLC. (private firm which develops branding, marketing and communications strategies for clients) (since 2008); served on The President’s Council of Fordham University (2010- 2019) and previously a Director of the Curran Center for Catholic American Studies (2009-2018); formerly, senior external advisor to the Financial Services practice of Deloitte Consulting LLP. (2012-2014); former Chair of the Board of Trustees of Marian University (2010-2014 as trustee, 2011-2014 as Chair); formerly Chief Executive Officer of ABN AMRO Bank N.V., North America, and Global Head of the Financial Markets Division (2007-2008), with various executive leadership roles in ABN AMRO Bank N.V. between 1996 and 2007. | | |
1962 333 W. Wacker Drive Chicago, IL 6o6o6 | | Board Member | | 2013 Class II | | 143 |
| | | | | | | |
| | | | |
∎ JUDITH M. STOCKDALE | | | | Board Member, Land Trust Alliance (national public charity addressing natural land and water conservation in the U.S.) (since 2013); formerly, Board Member, U.S. Endowment for Forestry and Communities (national endowment addressing forest health, sustainable forest production and markets, and economic health of forest-reliant communities in the U.S.) (2013-2019); formerly, Executive Director (1994-2012), Gaylord and Dorothy Donnelley Foundation (private foundation endowed to support both natural land conservation and artistic vitality); prior thereto, Executive Director, Great Lakes Protection Fund (endowment created jointly by seven of the eight Great Lake states’ Governors to take a regional approach to improving the health of the Great Lakes) (1990-1994). | | |
1947 333 W. Wacker Drive Chicago, IL 6o6o6 | | Board Member | | 1997 Class I | | 143 |
| | | | | | | |
73
Board Members & Officers (continued)
(Unaudited)
| | | | | | | | |
| | | | | |
| | | | | | | | | |
Name, Year of Birth & Address | | Position(s) Held
with the Funds | | Year First
Elected or
Appointed
and Term(1)
| | Principal Occupation(s) Including other Directorships During Past 5 Years | | Number
of Portfolios
in Fund Complex
Overseen by
Board Member |
| | | | | |
| | | | | | | | | |
| | | |
| Independent Board Members (continued): | | | | |
| | | | | |
∎ CAROLE E. STONE | | | | | | Former Director, Chicago Board Options Exchange, Inc. (2006-2017); and C2 Options Exchange, Incorporated (2009-2017); formerly, Director, Cboe, Global Markets, Inc. (2010-2020) (formerly named CBOE Holdings, Inc.; formerly, Commissioner, New York State Commission on Public Authority Reform (2005-2010). | | |
1947 333 W. Wacker Drive Chicago, IL 6o6o6 | | Board Member | | 2007 Class I | | 143 |
| | | | | | | |
| | | | | |
∎ MATTHEW THORNTON III | | | | | | Formerly, Executive Vice President and Chief Operating Officer (2018-2019), FedEx Freight Corporation, a subsidiary of FedEx Corporation (“FedEx”) (provider of transportation, e-commerce and business services through its portfolio of companies); formerly, Senior Vice President, U.S. Operations (2006-2018), Federal Express Corporation, a subsidiary of FedEx; formerly, Member of the Board of Directors (2012-2018), Safe Kids Worldwide® (a non-profit organization dedicated to preventing childhood injuries). Member of the Board of Directors (since 2014), The Sherwin-Williams Company (develops, manufactures, distributes and sells paints, coatings and related products); Director (since 2020), Crown Castle International (provider of communications infrastructure) | | |
1958 333 W. Wacker Drive Chicago, IL 6o6o6 | | Board Member | | 2020 Class III | | 143 |
| | | | | | | |
| | | | | |
∎ MARGARET L. WOLFF | | | | | | Formerly, member of the Board of Directors (2013-2017) of Travelers Insurance Company of Canada and The Dominion of Canada General Insurance Company (each, a part of Travelers Canada, the Canadian operation of The Travelers Companies, Inc.); formerly, Of Counsel, Skadden, Arps, Slate, Meagher & Flom LLP (legal services, Mergers & Acquisitions Group) (2005-2014); Member of the Board of Trustees of New York-Presbyterian Hospital (since 2005); Member (since 2004) and Chair (since 2015) of the Board of Trustees of The John A. Hartford Foundation (philanthropy dedicated to improving the care of older adults); formerly, Member (2005-2015) and Vice Chair (2011-2015) of the Board of Trustees of Mt. Holyoke College. | | |
1955 333 W. Wacker Drive Chicago, IL 6o6o6 | | Board Member | | 2016 Class I | | 143 |
| | | | | | | |
| | | | | |
∎ ROBERT L. YOUNG | | | | | | Formerly, Chief Operating Officer and Director, J.P.Morgan Investment Management Inc. (financial services) (2010-2016); formerly, President and Principal Executive Officer (2013-2016), and Senior Vice President and Chief Operating Officer (2005-2010), of J.P.Morgan Funds; formerly, Director and various officer positions for J.P.Morgan Investment Management Inc. (formerly, JPMorgan Funds Management, Inc. and formerly, One Group Administrative Services) and JPMorgan Distribution Services, Inc. (financial services) (formerly, One Group Dealer Services, Inc.) (1999-2017). | | |
1963 333 W. Wacker Drive Chicago, IL 6o6o6 | | Board Member | | 2017 Class II | | 143 |
| | | | | | | |
74
| | | | | | |
| | | | |
| | | | | | | |
Name, Year of Birth & Address | | Position(s) Held
with the Funds | | Year First
Elected or
Appointed(2) | | Principal Occupation(s) During Past 5 Years |
| | | | |
| | | | | | | |
| | |
| Officers of the Funds: | | |
| | | |
∎ DAVID J. LAMB | | | | Managing Director of Nuveen Fund Advisors, LLC and Nuveen Securities, LLC (since 2020); Senior Managing Director (since 2021), formerly, Managing Director (2017-2021), Senior Vice President of Nuveen (2006-2017), Vice President prior to 2006 |
1963 333 W. Wacker Drive Chicago, IL 6o6o6 | | Chief Administrative Officer | | 2015 |
| | | | | |
| | | |
∎ MARK J. CZARNIECKI | | | | Vice President and Assistant Secretary of Nuveen Securities, LLC (since 2016) and Nuveen Fund Advisors, LLC (since 2017); Vice President and Associate General Counsel of Nuveen (since 2013) and Vice President, Assistant Secretary and Associate General Counsel of Nuveen Asset Management, LLC (since 2018). |
1979 901 Marquette Avenue Minneapolis, MN 55402 | | Vice President and Assistant Secretary | | 2013 |
| | | | | |
| | | |
∎ DIANA R. GONZALEZ | | | | Vice President and Assistant Secretary of Nuveen Fund Advisors, LLC (since 2017); Vice President and Associate General Counsel of Nuveen (since 2017); Associate General Counsel of Jackson National Asset Management, LLC (2012-2017). |
1978 333 W. Wacker Drive Chicago, IL 6o6o6 | | Vice President and Assistant Secretary | | 2017 |
| | | | | |
| | | |
∎ NATHANIEL T. JONES | | | | Senior Managing Director (since 2021), formerly, Managing Director (2017-2021), Senior Vice President (2016-2017), formerly, Vice President (2011-2016) of Nuveen; Managing Director (since 2015) of Nuveen Fund Advisors, LLC; Chartered Financial Analyst. |
1979 333 W. Wacker Drive Chicago, IL 6o6o6 | | Vice President and Treasurer | | 2016 |
| | | | | |
| | | |
∎ TINA M. LAZAR | | | | Managing Director (since 2017), formerly, Senior Vice President (2014-2017) of Nuveen Securities, LLC. |
1961 333 W. Wacker Drive Chicago, IL 6o6o6 | | Vice President | | 2002 |
| | | | | |
| | | |
∎ BRIAN J. LOCKHART | | | | Managing Director (since 2019) of Nuveen Fund Advisors, LLC; Senior Managing Director (since 2021), formerly, Managing Director (2017-2021), Vice President (2010-2017) of Nuveen; Head of Investment Oversight (since 2017), formerly, Team Leader of Manager Oversight (2015-2017); Chartered Financial Analyst and Certified Financial Risk Manager. |
1974 333 W. Wacker Drive Chicago, IL 6o6o6 | | Vice President | | 2019 |
| | | | | |
| | | |
∎ JACQUES M. LONGERSTAEY | | | | Senior Managing Director, Chief Risk Officer, Nuveen (since May 2019); Senior Managing Director (since May 2019) of Nuveen Fund Advisors, LLC; formerly, Chief Investment and Model Risk Officer, Wealth & Investment Management Division, Wells Fargo Bank (NA) (2013-2019). |
1963 8500 Andrew Carnegie Blvd. Charlotte, NC 28262 | | Vice President | | 2019 |
| | | | | |
| | | |
∎ KEVIN J. MCCARTHY | | | | Senior Managing Director (since 2017) and Secretary and General Counsel (since 2016) of Nuveen Investments, Inc., formerly, Executive Vice President (2016-2017) and Managing Director and Assistant Secretary (2008-2016); Senior Managing Director (since 2017) and Assistant Secretary (since 2008) of Nuveen Securities, LLC, formerly Executive Vice President (2016-2017) and Managing Director (2008-2016); Senior Managing Director (since 2017), and Secretary (since 2016) of Nuveen Fund Advisors, LLC, formerly, Co-General Counsel (2011-2020), Executive Vice President (2016-2017), Managing Director (2008-2016) and Assistant Secretary (2007-2016); Senior Managing Director (since 2017), Secretary (since 2016) of Nuveen Asset Management, LLC, formerly, Associate General Counsel (2011-2020), Executive Vice President (2016-2017) and Managing Director and Assistant Secretary (2011- 2016); Vice President (since 2007) and Secretary (since 2016), formerly, Assistant Secretary, of NWQ Investment Management Company, LLC, Santa Barbara Asset Management, LLC and Winslow Capital Management, LLC (since 2010). Senior Managing Director (since 2017) and Secretary (since 2016) of Nuveen Alternative Investments, LLC. |
1966 333 W. Wacker Drive Chicago, IL 6o6o6 | | Vice President and Assistant Secretary | | 2007 |
| | | | | |
75
Board Members & Officers (continued)
(Unaudited)
| | | | | | |
| | | | |
| | | | | | | |
Name, Year of Birth & Address | | Position(s) Held
with the Funds | | Year First
Elected or
Appointed(2) | | Principal Occupation(s) During Past 5 Years |
| | | | |
| | | | | | | |
| | |
| Officers of the Funds (continued): | | |
| | | |
∎ JON SCOTT MEISSNER | | | | Managing Director of Mutual Fund Tax and Financial Reporting groups at Nuveen (since 2017); Managing Director of Nuveen Fund Advisors, LLC (since 2019); Senior Director of Teachers Advisors, LLC and TIAA-CREF Investment Management, LLC (since 2016); Senior Director (since 2015) Mutual Fund Taxation to the TIAA-CREF Funds, the TIAA-CREF Life Funds, the TIAA Separate Account VA-1 and the CREF Accounts; has held various positions with TIAA since 2004. |
1973 8500 Andrew Carnegie Blvd. Charlotte, NC 28262 | | Vice President and Assistant Secretary | | 2019 |
| | | | | |
| | | |
∎ DEANN D. MORGAN | | | | President, Nuveen Fund Advisors, LLC (since 2020); Executive Vice President, Global Head of Product at Nuveen (since 2019); Co-Chief Executive Officer of Nuveen Securities, LLC since 2020); Managing Member of MDR Collaboratory LLC (since 2018); Managing Director, (Head of Wealth Management Product Structuring & COO Multi Asset Investing. The Blackstone Group (2013-2017) |
1969 730 Third Avenue New York, NY 10017 | | Vice President | | 2020 |
| | | | | |
| | | |
∎ CHRISTOPHER M. ROHRBACHER | | | | Managing Director and Assistant Secretary (since 2017) of Nuveen Securities, LLC; Managing Director (since 2017) General Counsel (since 2020), and Assistant Secretary (since 2016), formerly, Senior Vice President (2016-2017), of Nuveen Fund Advisors, LLC; Managing Director, Associate General Counsel and Assistant Secretary of Nuveen Asset Management, LLC (since 2020); Managing Director (since 2017), and Associate General Counsel (since 2016), formerly, Senior Vice President (2012-2017) and Assistant General Counsel (2008-2016) of Nuveen. |
1971 333 W. Wacker Drive Chicago, IL 6o6o6 | | Vice President and Assistant Secretary | | 2008 |
| | | | | |
| | | |
∎ WILLIAM A. SIFFERMANN | | | | Managing Director (since 2017), formerly Senior Vice President (2016-2017) and Vice President (2011-2016) of Nuveen. |
1975 333 W. Wacker Drive Chicago, IL 6o6o6 | | Vice President | | 2017 |
| | | | | |
| | | |
∎ E. SCOTT WICKERHAM | | | | Senior Managing Director, Head of Public Investment Finance at Nuveen (since 2019), formerly, Managing Director; Senior Managing Director (since 2019) of Nuveen Fund Advisers, (LLC; Principal Financial Officer, Principal Accounting Officer and Treasurer (since 2017) of the TIAA-CREF Funds, the TIAA-CREF Life Funds, the TIAA Separate Account VA-1 and Principal Financial Officer, Principal Accounting Officer (since 2020) and Treasurer (since 2017) to the CREF Accounts; formerly, Senior Director, TIAA-CREF Fund Administration (2014-2015); has held various positions with TIAA since 2006. |
1973 8500 Andrew Carnegie Blvd. Charlotte, NC 28262 | | Vice President and Controller | | 2019 |
| | | | | |
| | | |
∎ MARK L. WINGET | | | | Vice President and Assistant Secretary of Nuveen Securities, LLC (since 2008), and Nuveen Fund Advisors, LLC (since 2019); Vice President, Associate General Counsel and Assistant Secretary of Nuveen Asset Management, LLC (since 2020); Vice President (since 2010) and Associate General Counsel (since 2019), formerly, Assistant General Counsel (2008-2016) of Nuveen. |
1968 333 W. Wacker Drive Chicago, IL 60606 | | Vice President and Secretary | | 2008 |
| | | | | |
| | | |
∎ GIFFORD R. ZIMMERMAN | | | | Formerly: Managing Director (2002-2020) and Assistant Secretary (2002-2020) of Nuveen Securities, LLC; formerly, Managing Director (2002-2020), Assistant Secretary (1997-2020) and Co-General Counsel (2011- 2020) of Nuveen Fund Advisors, LLC; formerly, Managing Director (2004-2020) and Assistant Secretary (1994-2020) of Nuveen Investments, Inc.; formerly, Managing Director, Assistant Secretary and Associate General Counsel of Nuveen Asset Management, LLC (2011-2020); formerly, Vice President and Assistant Secretary of NWQ Investment Management Company, LLC (2002-2020), Santa Barbara Asset Management, LLC (2006-2020) and Winslow Capital Management, LLC (2010-2020); Chartered Financial Analyst. |
1956 333 W. Wacker Drive Chicago, IL 60606 | | Vice President and Chief Compliance Officer | | 1988 |
| | | | | |
| (1) | The Board of Trustees is divided into three classes, Class I, Class II, and Class III, with each being elected to serve until the third succeeding annual shareholders’ meeting subsequent to its election or thereafter in each case when its respective successors are duly elected or appointed, except two board members are elected by the holders of Preferred Shares, when applicable, to serve until the next annual shareholders’ meeting subsequent to its election or thereafter in each case when its respective successors are duly elected or appointed. The year first elected or appointed represents the year in which the board member was first elected or appointed to any fund in the Nuveen complex. |
| (2) | Officers serve indefinite terms until their successor has been duly elected and qualified, their death or their resignation or removal. The year first elected or appointed represents the year in which the Officer was first elected or appointed to any fund in the Nuveen complex. |
76
Notes
77
Notes
78
Notes
79
Nuveen:
Serving Investors for Generations
Since 1898, financial professionals and their clients have relied on Nuveen to provide
dependable investment solutions through continued adherence to proven, long-term investing
principles. Today, we offer a range of high quality solutions designed to
be integral components of a well-diversified core portfolio.
Focused on meeting investor needs.
Nuveen is the investment manager of TIAA. We have grown into one of the world’s premier global asset managers, with specialist knowledge across all major asset classes and particular strength in solutions that provide income for investors and that draw on our expertise in alternatives and responsible investing. Nuveen is driven not only by the independent investment processes across the firm, but also the insights, risk management, analytics and other tools and resources that a truly world-class platform provides. As a global asset manager, our mission is to work in partnership with our clients to create solutions which help them secure their financial future.
Find out how we can help you.
To learn more about how the products and services of Nuveen may be able to help you meet your financial goals, talk to your financial professional, or call us at (800) 257-8787. Please read the information provided carefully before you invest. Investors should consider the investment objective and policies, risk considerations, charges and expenses of any investment carefully. Where applicable, be sure to obtain a prospectus, which contains this and other relevant information. To obtain a prospectus, please contact your securities representative or Nuveen, 333 W. Wacker Dr., Chicago, IL 60606. Please read the prospectus carefully before you invest or send money.
Learn more about Nuveen Funds at: www.nuveen.com/closed-end-funds
| | | | |
| Nuveen Securities, LLC, member FINRA and SIPC | 333 West Wacker Drive Chicago, IL 60606 | www.nuveen.com | | | | EAN-A-0621D
1739030-INV-Y-08/22 |
As of the end of the period covered by this report, the registrant has adopted a code of ethics that applies to the registrant’s principal executive officer, principal financial officer, principal accounting officer or controller, or persons performing similar functions. There were no amendments to or waivers from the Code during the period covered by this report. The registrant has posted the code of ethics on its website at www.nuveen.com/fund-governance. (To view the code, click on Code of Conduct.)
| ITEM 3. | AUDIT COMMITTEE FINANCIAL EXPERT. |
As of the end of the period covered by this report, the registrant’s Board of Directors or Trustees (“Board”) determined that the registrant has at least one “audit committee financial expert” (as defined in Item 3 of Form N-CSR) serving on its Audit Committee. The registrant’s audit committee financial experts are Carole E. Stone, Jack B. Evans, William C. Hunter and Albin F. Moschner, who are “independent” for purposes of Item 3 of Form N-CSR.
Ms. Stone served for five years as Director of the New York State Division of the Budget. As part of her role as Director, Ms. Stone was actively involved in overseeing the development of the State’s operating, local assistance and capital budgets, its financial plan and related documents; overseeing the development of the State’s bond-related disclosure documents and certifying that they fairly presented the State’s financial position; reviewing audits of various State and local agencies and programs; and coordinating the State’s system of internal audit and control. Prior to serving as Director, Ms. Stone worked as a budget analyst/examiner with increasing levels of responsibility over a 30 year period, including approximately five years as Deputy Budget Director. Ms. Stone has also served as Chair of the New York State Racing Association Oversight Board, as Chair of the Public Authorities Control Board, as a Commissioner on the New York State Commission on Public Authority Reform and as a member of the Boards of Directors of several New York State public authorities. These positions have involved overseeing operations and finances of certain entities and assessing the adequacy of project/entity financing and financial reporting. Currently, Ms. Stone is on the Board of Directors of CBOE Holdings, Inc., of the Chicago Board Options Exchange, and of C2 Options Exchange. Ms. Stone’s position on the boards of these entities and as a member of both CBOE Holdings’ Audit Committee and its Finance Committee has involved, among other things, the oversight of audits, audit plans and preparation of financial statements.
Mr. Evans was formerly President and Chief Operating Officer of SCI Financial Group, Inc., a full service registered broker-dealer and registered investment adviser (“SCI”). As part of his role as President and Chief Operating Officer, Mr. Evans actively supervised the Chief Financial Officer (the “CFO”) and actively supervised the CFO’s preparation of financial statements and other filings with various regulatory authorities. In such capacity, Mr. Evans was actively involved in the preparation of SCI’s financial statements and the resolution of issues raised in connection therewith. Mr. Evans has also served on the audit committee of various reporting companies. At such companies, Mr. Evans was involved in the oversight of audits, audit plans, and the preparation of financial statements. Mr. Evans also formerly chaired the audit committee of the Federal Reserve Bank of Chicago.
Mr. Hunter was formerly a Senior Vice President at the Federal Reserve Bank of Chicago. As part of his role as Senior Vice President, Mr. Hunter was the senior officer responsible for all operations of each of the Economic Research, Statistics, and Community and Consumer Affairs units at the Federal Reserve Bank of Chicago. In such capacity, Mr. Hunter oversaw the subunits of the Statistics and Community and Consumer Affairs divisions responsible for the analysis and evaluation of bank and bank holding company financial statements and financial filings. Prior to serving as Senior Vice President at the Federal Reserve Bank of Chicago, Mr. Hunter was the Vice President of the Financial Markets unit at the Federal Reserve Bank of Atlanta where he supervised financial staff and bank holding company analysts who analyzed and evaluated bank and bank holding company financial statements. Mr. Hunter also currently serves on the Boards of Directors of Xerox Corporation and Wellmark, Inc. as well as on the Audit Committees of such Boards. As an Audit Committee member, Mr. Hunter’s responsibilities include, among other things, reviewing financial statements, internal audits and internal controls over financial reporting. Mr. Hunter also formerly was a Professor of Finance at the University of Connecticut School of Business and has authored numerous scholarly articles on the topics of finance, accounting and economics.
Mr. Moschner, Founder and Chief Executive Officer, Northcroft Partners, LLC, (management consulting) (since 2012); formerly, Chairman (2019), and Director (2012-2019), USA Technologies, Inc., (provider of solutions and services to facilitate electronic payment transactions); formerly, Director, Wintrust Financial Corporation (1996-2016); previously, held positions at Leap Wireless International, Inc., (consumer wireless services) including Consultant (2011-2012), Chief Operating Officer (2008-2011), and Chief Marketing Officer (2004-2008); formerly, President, Verizon Card Services division of Verizon Communications, Inc. (2000-2003); formerly, President, One Point Services at One Point Communications (telecommunication services) (1999-2000); formerly, Vice Chairman of the Board, Diba, Incorporated (internet technology provider) (1996-1997); formerly, various executive positions (1991-1996), including Chief Executive Officer (1995-1996) of Zenith Electronics Corporation (consumer electronics).
| ITEM 4. | PRINCIPAL ACCOUNTANT FEES AND SERVICES. |
Nuveen Multi-Market Income Fund
The following tables show the amount of fees that KPMG LLP, the Fund’s auditor, billed to the Fund during the Fund’s last two full fiscal years. For engagements with KPMG LLP the Audit Committee approved in advance all audit services and non-audit services that KPMG LLP provided to the Fund, except for those non-audit services that were subject to the pre-approval exception under Rule 2-01 of Regulation S-X (the “pre-approval exception”). The pre-approval exception for services provided directly to the Fund waives the pre-approval requirement for services other than audit, review or attest services if: (A) the aggregate amount of all such services provided constitutes no more than 5% of the total amount of revenues paid by the Fund to its accountant during the fiscal year in which the services are provided; (B) the Fund did not recognize the services as non-audit services at the time of the engagement; and (C) the services are promptly brought to the Audit Committee’s attention, and the Committee (or its delegate) approves the services before the audit is completed.
The Audit Committee has delegated certain pre-approval responsibilities to its Chair (or, in her absence, any other member of the Audit Committee).
SERVICES THAT THE FUND’S AUDITOR BILLED TO THE FUND
| | | | | | | | | | | | | | | | |
Fiscal Year Ended | | Audit Fees
Billed to Fund 1 | | | Audit-Related Fees
Billed to Fund 2 | | | Tax Fees
Billed to Fund 3 | | | All Other Fees
Billed to Fund 4 | |
June 30, 2021 | | $ | 36,990 | | | $ | 0 | | | $ | 0 | | | $ | 0 | |
| | | | | | | | | | | | | | | | |
| | | | |
Percentage approved pursuant to pre-approval exception | | | 0 | % | | | 0 | % | | | 0 | % | | | 0 | % |
| | | | | | | | | | | | | | | | |
| | | | |
June 30, 2020 | | $ | 36,270 | | | $ | 0 | | | $ | 0 | | | $ | 0 | |
| | | | | | | | | | | | | | | | |
| | | | |
Percentage approved pursuant to pre-approval exception | | | 0 | % | | | 0 | % | | | 0 | % | | | 0 | % |
| | | | | | | | | | | | | | | | |
1 “Audit Fees” are the aggregate fees billed for professional services for the audit of the Fund’s annual financial statements and services provided in connection with statutory and regulatory filings or engagements.
2 “Audit Related Fees” are the aggregate fees billed for assurance and related services reasonably related to the performance of the audit or review of financial statements that are not reported under “Audit Fees”. These fees include offerings related to the Fund’s common shares and leverage.
3 “Tax Fees” are the aggregate fees billed for professional services for tax advice, tax compliance, and tax planning. These fees include: all global withholding tax services; excise and state tax reviews; capital gain, tax equalization and taxable basis calculation performed by the principal accountant.
4 “All Other Fees” are the aggregate fees billed for products and services other than “Audit Fees”, “Audit-Related Fees” and “Tax Fees”. These fees represent all engagements pertaining to the Fund’s use of leverage.
SERVICES THAT THE FUND’S AUDITOR BILLED TO THE
ADVISER AND AFFILIATED FUND SERVICE PROVIDERS
The following tables show the amount of fees billed by KPMG LLP to Nuveen Fund Advisors, LLC (formerly Nuveen Fund Advisors, Inc.) (the “Adviser”), and any entity controlling, controlled by or under common control with the Adviser that provides ongoing services to the Fund (“Affiliated Fund Service Provider”), for engagements directly related to the Fund’s operations and financial reporting, during the Fund’s last two full fiscal years.
The tables also show the percentage of fees subject to the pre-approval exception. The pre-approval exception for services provided to the Adviser and any Affiliated Fund Service Provider (other than audit, review or attest services) waives the pre-approval requirement if: (A) the aggregate amount of all such services provided constitutes no more than 5% of the total amount of revenues paid to KPMG LLP by the Fund, the Adviser and Affiliated Fund Service Providers during the fiscal year in which the services are provided that would have to be pre-approved by the Audit Committee; (B) the Fund did not recognize the services as non-audit services at the time of the engagement; and (C) the services are promptly brought to the Audit Committee’s attention, and the Committee (or its delegate) approves the services before the Fund’s audit is completed.
| | | | | | | | | | | | |
Fiscal Year Ended | | Audit-Related Fees
Billed to Adviser and
Affiliated Fund
Service Providers | | | Tax Fees
Billed to Adviser and
Affiliated Fund
Service Providers | | | All Other Fees
Billed to Adviser and
Affiliated Fund
Service Providers | |
June 30, 2021 | | $ | 0 | | | $ | 0 | | | $ | 0 | |
| | | | | | | | | | | | |
| | | |
Percentage approved pursuant to pre-approval exception | | | 0 | % | | | 0 | % | | | 0 | % |
| | | | | | | | | | | | |
| | | |
June 30, 2020 | | $ | 0 | | | $ | 0 | | | $ | 0 | |
| | | | | | | | | | | | |
| | | |
Percentage approved pursuant to pre-approval exception | | | 0 | % | | | 0 | % | | | 0 | % |
| | | | | | | | | | | | |
NON-AUDIT SERVICES
The following table shows the amount of fees that KPMG LLP billed during the Fund’s last two full fiscal years for non-audit services. The Audit Committee is required to pre-approve non-audit services that KPMG LLP provides to the Adviser and any Affiliated Fund Services Provider, if the engagement related directly to the Fund’s operations and financial reporting (except for those subject to the pre-approval exception described above). The Audit Committee requested and received information from KPMG LLP about any non-audit services that KPMG LLP rendered during the Fund’s last fiscal year to the Adviser and any Affiliated Fund Service Provider. The Committee considered this information in evaluating KPMG LLP’s independence.
| | | | | | | | | | | | | | | | |
Fiscal Year Ended | | Total Non-Audit Fees
Billed to Fund | | | Total Non-Audit Fees
billed to Adviser and
Affiliated Fund Service
Providers (engagements
related directly to the
operations and financial
reporting of the Fund) | | | Total Non-Audit Fees
billed to Adviser and
Affiliated Fund Service
Providers (all other
engagements) | | | Total | |
June 30, 2021 | | $ | 0 | | | $ | 0 | | | $ | 0 | | | $ | 0 | |
June 30, 2020 | | $ | 0 | | | $ | 0 | | | $ | 0 | | | $ | 0 | |
“Non-Audit Fees billed to Fund” for both fiscal year ends represent “Tax Fees” and “All Other Fees” billed to Fund in their respective amounts from the previous table.
Less than 50 percent of the hours expended on the principal accountant’s engagement to audit the registrant’s financial statements for the most recent fiscal year were attributed to work performed by persons other than the principal accountant’s full-time, permanent employees.
Audit Committee Pre-Approval Policies and Procedures. Generally, the Audit Committee must approve (i) all non-audit services to be performed for the Fund by the Fund’s independent accountants and (ii) all audit and non-audit services to be performed by the Fund’s independent accountants for the Affiliated Fund Service Providers with respect to operations and financial reporting of the Fund. Regarding tax and research projects conducted by the independent accountants for the Fund and Affiliated Fund Service Providers (with respect to operations and financial reports of the Fund) such engagements will be (i) pre-approved by the Audit Committee if they are expected to be for amounts greater than $10,000; (ii) reported to the Audit Committee chair for her verbal approval prior to engagement if they are expected to be for amounts under $10,000 but greater than $5,000; and (iii) reported to the Audit Committee at the next Audit Committee meeting if they are expected to be for an amount under $5,000.
| ITEM 5. | AUDIT COMMITTEE OF LISTED REGISTRANTS. |
The registrant’s Board has a separately designated Audit Committee established in accordance with Section 3(a)(58)(A) of the Securities Exchange Act of 1934, as amended (15 U.S.C. 78c(a)(58)(A)). As of the end of the period covered by this report the members of the audit committee are Jack B. Evans, William C. Hunter, John K. Nelson, Albin F. Moschner, Judith M. Stockdale and Carole E. Stone, Chair.
| ITEM 6. | SCHEDULE OF INVESTMENTS. |
| (a) | | See Portfolio of Investments in Item 1. |
| ITEM 7. | DISCLOSURE OF PROXY VOTING POLICIES AND PROCEDURES FOR CLOSED-END MANAGEMENT INVESTMENT COMPANIES. |
Nuveen Fund Advisors, LLC is the registrant’s investment adviser (also referred to as the “Adviser”). The Adviser is responsible for the on-going monitoring of the Fund’s investment portfolio, managing the Fund’s business affairs and providing certain clerical, bookkeeping and administrative services. The Adviser has engaged Nuveen Asset Management, LLC (“Sub-Adviser”) as Sub-Adviser to provide discretionary investment advisory services. As part of these services, the Adviser has delegated to the Sub-Adviser the full responsibility for proxy voting on securities held in the registrant’s portfolio and related duties in accordance with the Sub-Adviser’s policies and procedures. The Adviser periodically monitors the Sub-Adviser’s voting to ensure that it is carrying out its duties. The Sub-Adviser’s proxy voting policies and procedures are attached to this filing as an exhibit and incorporated herein by reference.
| ITEM 8. | PORTFOLIO MANAGERS OF CLOSED-END MANAGEMENT INVESTMENT COMPANIES |
Nuveen Fund Advisors, LLC (“NFALLC”) is the registrant’s investment adviser (NFALLC is also referred to as the “Adviser”.) NFALLC is responsible for the selection and on-going monitoring of the Fund’s investment portfolio, managing the Fund’s business affairs and providing certain clerical, bookkeeping and administrative services. The Adviser has engaged Nuveen Asset Management, LLC (“Nuveen Asset Management” or “Sub-Adviser”), as Sub-Adviser to provide discretionary investment advisory services. The following section provides information on the portfolio managers at the Sub-Adviser:
| Item 8(a)(1). | PORTFOLIO MANAGER BIOGRAPHIES |
As of the date of filing this report, the following individuals at the Sub-Adviser (the “Portfolio Managers”) have primary responsibility for the day-to-day implementation of the Fund’s investment strategy:
Jason J. O’Brien, CFA, is a portfolio manager for Nuveen’s global fixed income team. He is a portfolio manager on the Nuveen Core Fixed Income and Public Funds strategies. Previously, he oversaw the securitized debt sector team and is a member of the global fixed income strategy committee. He entered the financial services industry in 1993 and became a portfolio manager in 2001.
Peter L. Agrimson, CFA, is a portfolio manager for Nuveen’s global fixed income team and the lead portfolio of the Short Duration Multi-Sector strategy and related institutional portfolios. Prior to his current role, he was a member of the Securitized Debt Sector Team, responsible for trading mortgage-backed securities, asset-backed securities and commercial mortgage-backed securities. He began working in the financial services industry in 2005 and joined the firm in 2008.
| Item 8(a)(2). | OTHER ACCOUNTS MANAGED BY PORTFOLIO MANAGERS |
Other Accounts Managed. In addition to managing the registrant, the Portfolio Managers are also primarily responsible for the day-to-day portfolio management of the following accounts:
| | | | | | | | | | | | | | | | | | | | | | | | | | | | | | | | | | | | | | |
| | | (ii) Number of Other Accounts Managed and Assets by Account Type* | | (iii) Number of Other Accounts and Assets for Which Advisory Fee is Performance-Based | |
(i) Name of Portfolio Manager | | Other
Registered
Investment
Companies | | Other
Pooled
Investment
Vehicles | | | Other
Accounts | | Other
Registered
Investment
Companies | | | Other
Pooled
Investment
Vehicles | | | Other
Accounts | |
Jason O’Brien | | 2 | | $23.60 billion | | 0 | | | $0 | | | 42 | | $1.88 billion | | | 0 | | | | 0 | | | | 0 | | | | 0 | | | | 0 | | | | 0 | |
Peter Agrimson | | 4 | | $ 4.09 billion | | 0 | | | $0 | | | 8 | | $285 million | | | 0 | | | | 0 | | | | 0 | | | | 0 | | | | 0 | | | | 0 | |
* Assets are as of June 30, 2021.
POTENTIAL MATERIAL CONFLICTS OF INTEREST
Actual or apparent conflicts of interest may arise when a portfolio manager has day-to-day management responsibilities with respect to more than one account. More specifically, portfolio managers who manage multiple accounts are presented a number of potential conflicts, including, among others, those discussed below.
The management of multiple accounts may result in a portfolio manager devoting unequal time and attention to the management of each account. Nuveen Asset Management seeks to manage such competing interests for the time and attention of portfolio managers by having portfolio managers focus on a particular investment discipline. Most accounts managed by a portfolio manager in a particular investment strategy are managed using the same investment models.
If a portfolio manager identifies a limited investment opportunity which may be suitable for more than one account, an account may not be able to take full advantage of that opportunity due to an allocation of filled purchase or sale orders across all eligible accounts. To deal with these situations, Nuveen Asset Management has adopted procedures for allocating limited opportunities across multiple accounts.
With respect to many of its clients’ accounts, Nuveen Asset Management determines which broker to use to execute transaction orders, consistent with its duty to seek best execution of the transaction. However, with respect to certain other accounts, Nuveen Asset Management may be limited by the client with respect to the selection of brokers or may be instructed to direct trades through a particular broker. In these cases, Nuveen Asset Management may place separate, non-simultaneous, transactions for a Fund and other accounts which may temporarily affect the market price of the security or the execution of the transaction, or both, to the detriment of the Fund or the other accounts.
Some clients are subject to different regulations. As a consequence of this difference in regulatory requirements, some clients may not be permitted to engage in all the investment techniques or transactions or to engage in these transactions to the same extent as the other accounts managed by a portfolio manager. Finally, the appearance of a conflict of interest may arise where Nuveen Asset Management has an incentive, such as a performance-based management fee, which relates to the management of some accounts, with respect to which a portfolio manager has day-to-day management responsibilities.
Conflicts of interest may also arise when the Sub-Adviser invests one or more of its client accounts in different or multiple parts of the same issuer’s capital structure, including investments in public versus private securities, debt versus equity, or senior versus junior/subordinated debt, or otherwise where there are different or inconsistent rights or benefits. Decisions or actions such as investing, trading, proxy voting, exercising, waiving or amending rights or covenants, workout activity, or serving on a board, committee or other involvement in governance may result in conflicts of interest between clients holding different securities or investments. Generally, individual portfolio managers will seek to act in a manner that they believe serves the best interest of the accounts they manage. In cases where a portfolio manager or team faces a conflict among its client accounts, it will seek to act in a manner that it believes best reflects its overall fiduciary duty, which may result in relative advantages or disadvantages for particular accounts.
Nuveen Asset Management has adopted certain compliance procedures which are designed to address these types of conflicts common among investment managers. However, there is no guarantee that such procedures will detect each and every situation in which a conflict arises.
| Item 8(a)(3). | FUND MANAGER COMPENSATION |
As of the most recently completed fiscal year end, the primary Portfolio Managers’ compensation is as follows:
Portfolio managers are compensated through a combination of base salary and variable components consisting of (i) a cash bonus; (ii) a long-term performance award; and (iii) participation in a profits interest plan.
Base salary. A portfolio manager’s base salary is determined based upon an analysis of the portfolio manager’s general performance, experience and market levels of base pay for such position.
Cash bonus. A portfolio manager is eligible to receive an annual cash bonus that is based on three variables: risk-adjusted investment performance relative to benchmark generally measured over the most recent one, three and five year periods (unless the portfolio manager’s tenure is shorter), ranking versus Morningstar peer funds generally measured over the most recent one, three and five year periods (unless the portfolio manager’s tenure is shorter), and management and peer reviews.
Long-term performance award. A portfolio manager is eligible to receive a long-term performance award that vests after three years. The amount of the award when granted is based on the same factors used in determining the cash bonus. The value of the award at the completion of the three-year vesting period is adjusted based on the risk-adjusted investment performance of Fund(s) managed by the portfolio manager during the vesting period and the performance of the TIAA organization as a whole.
Profits interest plan. Portfolio managers are eligible to receive profits interests in Nuveen Asset Management and its affiliate, Teachers Advisors, LLC, which vest over time and entitle their holders to a percentage of the firms’ annual profits. Profits interests are allocated to each portfolio manager based on such person’s overall contribution to the firms.
There are generally no differences between the methods used to determine compensation with respect to the Fund and the Other Accounts shown in the table above.
| Item 8(a)(4). | OWNERSHIP OF JMM SECURITIES AS OF JUNE 30, 2021 |
| | | | | | | | | | | | | | |
Name of Portfolio Manager | | None | | $1-
$10,000 | | $10,001-
$50,000 | | $50,001-
$100,000 | | $100,001-
$500,000 | | $500,001-
$1,000,000 | | Over $1,000,000 |
Peter Agrimson | | X | | | | | | | | | | | | |
Jason O’Brien | | X | | | | | | | | | | | | |
| ITEM 9. | PURCHASES OF EQUITY SECURITIES BY CLOSED-END MANAGEMENT INVESTMENT COMPANY AND AFFILIATED PURCHASERS. |
Not applicable.
| ITEM 10. | SUBMISSION OF MATTERS TO A VOTE OF SECURITY HOLDERS. |
There have been no material changes to the procedures by which shareholders may recommend nominees to the registrant’s Board implemented after the registrant last provided disclosure in response to this Item.
| ITEM 11. | CONTROLS AND PROCEDURES. |
| (a) | | The registrant’s principal executive and principal financial officers, or persons performing similar functions, have concluded that the registrant’s disclosure controls and procedures (as defined in Rule 30a-3(c) under the Investment Company Act of 1940, as amended (the “1940 Act”) (17 CFR 270.30a-3(c))) are effective, as of a date within 90 days of the filing date of this report that includes the disclosure required by this paragraph, based on their evaluation of the controls and procedures required by Rule 30a-3(b) under the 1940 Act (17 CFR 270.30a-3(b)) and Rules 13a-15(b) or 15d-15 (b) under the Securities Exchange Act of 1934, as amended (the “Exchange Act”) (17 CFR 240.13a-15(b) or 240.15d-15 (b)). |
| (b) | | There were no changes in the registrant’s internal control over financial reporting (as defined in Rule 30a-3(d) under the 1940 Act (17 CFR 270.30a-3(d)) that occurred during the period covered by this report that has materially affected, or is reasonably likely to materially affect, the registrant’s internal control over financial reporting. |
| ITEM 12. | DISCLOSURE OF SECURITIES LENDING ACTIVITIES FOR CLOSED-END MANAGEMENT INVESTMENT COMPANIES. |
Not applicable.
File the exhibits listed below as part of this Form.
(a)(1) Any code of ethics, or amendment thereto, that is the subject of the disclosure required by Item 2, to the extent that the registrant intends to satisfy the Item 2 requirements through filing of an exhibit: Not applicable because the code is posted on registrant’s website at www.nuveen.com/fund-governance and there were no amendments during the period covered by this report. (To view the code, click on Code of Conduct.)
(a)(2) A separate certification for each principal executive officer and principal financial officer of the registrant as required by Rule 30a-2(a) under the 1940 Act (17 CFR 270.30a-2(a)) in the exact form set forth below: Ex-99.CERT Attached hereto.
(a)(3) Any written solicitation to purchase securities under Rule 23c-1 under the 1940 Act (17 CFR 270.23c-1) sent or given during the period covered by the report by or on behalf of the registrant to 10 or more persons. Not applicable.
(a)(4) Change in the registrant’s independent public accountant. Not applicable.
(b) If the report is filed under Section 13(a) or 15(d) of the Exchange Act, provide the certifications required by Rule 30a-2(b) under the 1940 Act (17 CFR 270.30a-2(b)); Rule 13a-14(b) or Rule 15d-14(b) under the Exchange Act (17 CFR 240.13a-14(b) or 240.15d-14(b)), and Section 1350 of Chapter 63 of Title 18 of the United States Code (18 U.S.C. 1350) as an exhibit. A certification furnished pursuant to this paragraph will not be deemed “filed” for purposes of Section 18 of the Exchange Act (15 U.S.C. 78r), or otherwise subject to the liability of that section. Such certification will not be deemed to be incorporated by reference into any filing under the Securities Act of 1933 or the Exchange Act, except to the extent that the registrant specifically incorporates it by reference. Ex-99.906 CERT attached hereto.
SIGNATURES
Pursuant to the requirements of the Securities Exchange Act of 1934 and the Investment Company Act of 1940, the registrant has duly caused this report to be signed on its behalf by the undersigned, thereunto duly authorized.
(Registrant) Nuveen Multi-Market Income Fund
| | |
| By (Signature and Title) | | /s/ Mark L. Winget |
| | Mark L. Winget |
| | Vice President and Secretary |
Date: September 2, 2021
Pursuant to the requirements of the Securities Exchange Act of 1934 and the Investment Company Act of 1940, this report has been signed below by the following persons on behalf of the registrant and in the capacities and on the dates indicated.
| | |
| By (Signature and Title) | | /s/ David J. Lamb |
| | David J. Lamb |
| | Chief Administrative Officer |
| | (principal executive officer) |
Date: September 2, 2021
| | |
| By (Signature and Title) | | /s/ E. Scott Wickerham |
| | E. Scott Wickerham |
| | Vice President and Controller |
| | (principal financial officer) |
Date: September 2, 2021