UNITED STATES
SECURITIES AND EXCHANGE COMMISSION
Washington, D.C. 20549
FORM N-CSR
CERTIFIED SHAREHOLDER REPORT OF REGISTERED
MANAGEMENT INVESTMENT COMPANIES
Investment Company Act file number | 811-05654 | |||||||
| ||||||||
Morgan Stanley Income Trust | ||||||||
(Exact name of registrant as specified in charter) | ||||||||
| ||||||||
522 Fifth Avenue, New York, New York |
| 10036 | ||||||
(Address of principal executive offices) |
| (Zip code) | ||||||
| ||||||||
Ronald E. Robison 522 Fifth Avenue, New York, New York 10036 | ||||||||
(Name and address of agent for service) | ||||||||
| ||||||||
Registrant’s telephone number, including area code: | 212-296-6990 |
| ||||||
| ||||||||
Date of fiscal year end: | August 31, 2007 |
| ||||||
| ||||||||
Date of reporting period: | August 31, 2007 |
| ||||||
Item 1 - Report to Shareholders
Welcome, Shareholder:
In this report, you'll learn about how your investment in Morgan Stanley Income Trust performed during the annual period. We will provide an overview of the market conditions, and discuss some of the factors that affected performance during the reporting period. In addition, this report includes the Fund's financial statements and a list of Fund investments.
This material must be preceded or accompanied by a prospectus for the fund being offered.
Market forecasts provided in this report may not necessarily come to pass. There is no assurance that the Fund will achieve its investment objective. The Fund is subject to market risk, which is the possibility that market values of securities owned by the Fund will decline and, therefore, the value of the Fund's shares may be less than what you paid for them. Accordingly, you can lose money investing in this Fund. Please see the prospectus for more complete information on investment risks.
Fund Report
For the year ended August 31, 2007
| Total Return for the 12 Months Ended August 31, 2007 | |||||||||||||||||||||||
| Class A | Class B | Class C | Class D | Lehman Brothers U.S. Corporate Index1 | Lipper Corporate Debt Funds BBB-Rated Index2 | ||||||||||||||||||
| 3.99 | % | 3.25 | % | 3.37 | % | 4.12 | % | 4.32 | % | 4.99 | % | ||||||||||||
The performance of the Fund's four share classes varies because each has different expenses. The Fund's total returns assume the reinvestment of all distributions but do not reflect the deduction of any applicable sales charges. Such costs would lower performance. See Performance Summary for standardized performance and benchmark information.
Market Conditions
Fears stemming from the residential housing downturn and subprime mortgage market troubles accelerated over the course of the one-year period. With them came growing concerns about the impact on financial markets, the financial system, and the broader economy as a re-pricing of risk across all credit markets put a considerable strain on liquidity.
Although the Federal Open Market Committee (the "Fed") held "official interest rates", or the target federal funds rate, steady throughout the fiscal year, it did respond in other ways to the problems in the latter months of the period. The Fed issued a statement modifying its outlook to make it clear that economic growth risks were becoming skewed to the downside. In August 2007, following requests from a handful of district banks, it lowered the discount rate (the rate charged to banks to borrow directly from a central bank) by half a percent, from 6.25 percent to 5.75 percent, in an effort to encourage member banks to make greater use of the discount window and to inject cash into the system. This turn of events was the highlight of an eventful summer, one which brought with it a series of negative headlines and a strong dose of unfavorable news concerning the broader implications of the housing market downturn, especially wi th regard to its effect on mortgage securities and mortgage lenders. However, as we have seen before and will probably see again, markets tend to overreact and move excessively in one direction before correcting themselves.
Clearly, the economic outlook has dimmed. Still, the Fed is on the case, and financial markets have exhibited a bit more stability and rationality entering September. No one can say if the worst is over, but what we do know is that some areas of the bond market are already reflecting a set of extreme outcomes.
Throughout the 12-month period, U.S. Treasury yields fluctuated but overall, shorter-dated Treasury yields experienced the greatest decline, while longer dated yields were little changed. As a result, the shape of the yield curve went from relatively flat to fairly steep. At the end of the reporting period, market expectations were for a reduction in the federal funds rate, which could push short-term rates even lower in the coming months.
In the corporate bond market, spreads widened causing the sector to underperform other areas of the fixed income market for the overall period. Within the investment-grade corporate sector, lower-rated (Baa) and higher-rated (AAA) issues outpaced middle investment-grade issues. Utilities posted the highest returns, while financials, hit hardest by the recent liquidity crisis, posted the lowest returns. Within the below investment-grade sector, B rated issues outperformed the other, lower-rated high yield segments.
2
The mortgage market suffered from the turmoil surrounding residential housing, and especially by its spillover effects on secondary market activity, most notably in the non-agency mortgage area. Much of the growth in mortgage issuance over the past few years has been in the non-agency sector. This was driven by the development of a new array of loan types with payment and interest-rate features appealing to a broader set of borrowers than those available in the traditional agency space. While this helped fuel both the housing boom and a vibrant secondary market for these non-agency mortgages, the subprime meltdown cast a pall across the entire non-agency sector, with little regard for whether or not the securities or loans in question were subprime or prime. The result was a further reduction in mortgage market liquidity, as well as a sharp diminishment in the availability of non-conforming mortgage loans to the general public. For market participants, it became a challenge to price some of these non-agency bonds, let alone trade them, and a process of price discovery unfolded throughout August. While most agency mortgage-backed issues outperformed equal-risk Treasuries, non-agency mortgage issues fared poorly in recent months.
Performance Analysis
All share classes of Morgan Stanley Income Trust underperformed the Lehman Brothers U.S. Corporate Index and the Lipper Corporate Debt Funds BBB-Rated Index for the 12 months ended August 31, 2007, assuming no deduction of applicable sales charges.
The primary contributor to the Fund's underperformance relative to the benchmark Lehman Brothers U.S. Corporate Index was its mortgage position. The Fund holds a small allocation to the mortgage sector in the form of short-dated, high coupon mortgage-backed securities. Despite the good performance of these issues initially, the turmoil in the mortgage market and the drying up of liquidity hurt price performance later in the period and the Fund's position detracted from overall returns.
During the period, we kept the Fund's overall duration* below that of the Lehman Brothers U.S. Corporate Index, underweighting long-dated exposure while overweighting the intermediate area of the curve. Although this position detracted from performance during periods of yield declines, it benefited performance as yields rose and the yield curve steepened. As of the end of the period, much of this defensive position has been removed.
We have held an underweight corporate position in the Fund's portfolio for some time now, and this position detracted from relative performance in the first half of the period. However, as credit spreads widened in the latter months, the underweight to the sector was beneficial to performance. While we are looking for areas to take advantage of this spread widening and add to corporate positions, we are taking a cautious approach because we believe the credit market remains vulnerable to potential credit downgrades and/or an economic downturn.
There is no guarantee that any sectors mentioned will continue to perform as discussed herein or that securities in such sectors will be held by the Fund in the future.
* A measure of the sensitivity of a bond's price to changes in interest rates, expressed in years. Each year of duration represents an expected 1 percent change in the price of a bond for every 1 percent change in interest rates. The longer a bond's duration, the greater the effect of interest-rate movements on its price. Typically, funds with shorter durations perform better in rising-interest-rate environments, while funds with longer durations perform better when rates decline.
3
| PORTFOLIO COMPOSITION** | |||||||
| Corporate Bonds | 55.7 | % | |||||
| Short-Term Investments | 19.0 | ||||||
| U.S. Government Obligations | 14.3 | ||||||
| Commercial Mortgage-Backed Securities | 6.5 | ||||||
| Asset-Backed Securities | 3.0 | ||||||
| Collateralized Mortgage Obligations | 0.9 | ||||||
| Foreign Government Obligations | 0.6 | ||||||
| LONG-TERM CREDIT ANALYSIS | |||||||
| AAA | 31.4 | % | |||||
| AA | 7.8 | ||||||
| A | 22.0 | ||||||
| BBB | 34.2 | ||||||
| BB | 3.7 | ||||||
| B or Below | 0.8 | ||||||
| Not Rated | 0.1 | ||||||
**Does not include open long futures contracts with an underlying face amount of $7,396,720 with unrealized appreciation of $19,640 and open short futures contracts with an underlying face amount of $16,008,236 with unrealized depreciation of $50,899. Also does not include open swap contracts with net unrealized appreciation of $314,824.
Data as of August 31, 2007. Subject to change daily. All percentages for portfolio composition are as a percentage of total investments and all percentages for long-term credit analysis are as a percentage of total long-term investments. These data are provided for informational purposes only and should not be deemed a recommendation to buy or sell the securities mentioned. Morgan Stanley is a full-service securities firm engaged in securities trading and brokerage activities, investment banking, research and analysis, financing and financial advisory services.
Investment Strategy
The Fund will normally invest at least 80 percent of its assets in investment grade fixed-income securities. These securities may include corporate debt securities, preferred stocks, U.S. government securities, mortgage-backed securities, including collateralized mortgage obligations and commercial mortgage-backed securities, asset-backed securities and securities issued by foreign governments or corporations. In deciding which securities to buy, hold or sell, the Fund's "Investment Adviser," Morgan Stanley Investment Advisors Inc., considers domestic and international economic developments, interest rate trends, bond ratings and other factors relating to the issuers.
For More Information About Portfolio Holdings
Each Morgan Stanley fund provides a complete schedule of portfolio holdings in its semiannual and annual reports within 60 days of the end of the fund's second and fourth fiscal quarters. The semiannual reports and the annual reports are filed electronically with the Securities and Exchange Commission (SEC) on Form N-CSRS and Form N-CSR, respectively. Morgan Stanley also delivers the semiannual and annual reports to fund shareholders and makes these reports available on its public web site, www.morganstanley.com. Each Morgan Stanley fund also files a complete schedule of portfolio holdings with the SEC for the fund's first and third fiscal quarters on Form N-Q. Morgan Stanley does not deliver the reports for the first and third fiscal quarters to shareholders, nor are the reports posted to the Morgan Stanley public web site. You may, however, obtain the Form N-Q filings (as well as the Form N-CSR and N-CSRS filings) by access ing the SEC's web site, http://www.sec.gov. You may also review and copy them
4
at the SEC's public reference room in Washington, DC. Information on the operation of the SEC's public reference room may be obtained by calling the SEC at (800) SEC-0330. You can also request copies of these materials, upon payment of a duplicating fee, by electronic request at the SEC's e-mail address (publicinfo@sec.gov) or by writing the public reference section of the SEC, Washington, DC 20549-0102.
Proxy Voting Policy and Procedures and Proxy Voting Record
You may obtain a copy of the Fund's Proxy Voting Policy and Procedures without charge, upon request, by calling toll free (800) 869-NEWS or by visiting the Mutual Fund Center on our Web site at www.morganstanley.com. It is also available on the Securities and Exchange Commission's Web site at http://www.sec.gov.
You may obtain information regarding how the Fund voted proxies relating to portfolio securities during the most recent twelve-month period ended June 30 without charge by visiting the Mutual Fund Center on our Web site at www.morganstanley.com. This information is also available on the Securities and Exchange Commission's Web site at http://www.sec.gov.
Householding Notice
To reduce printing and mailing costs, the Fund attempts to eliminate duplicate mailings to the same address. The Fund delivers a single copy of certain shareholder documents, including shareholder reports, prospectuses and proxy materials, to investors with the same last name who reside at the same address. Your participation in this program will continue for an unlimited period of time unless you instruct us otherwise. You can request multiple copies of these documents by calling (800) 350-6414, 8:00 a.m. to 8:00 p.m., ET. Once our Customer Service Center has received your instructions, we will begin sending individual copies for each account within 30 days.
5
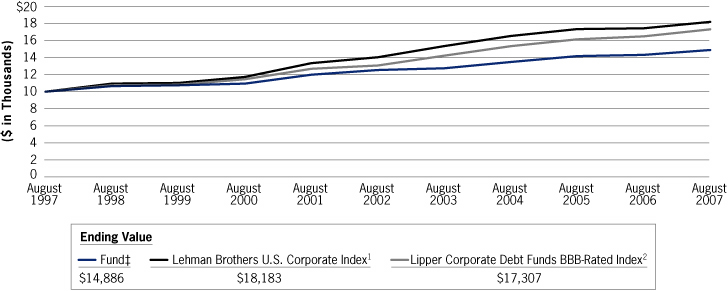
Performance Summary
Performance of $10,000 Investment—Class B
6
| Average Annual Total Returns—Period Ended August 31, 2007 | |||||||||||||||||||||||||||||||||||
| Symbol | Class A Shares* (since 07/28/97) IISAX | Class B Shares** (since 05/03/89) IISBX | Class C Shares† (since 07/28/97) IISCX | Class D Shares†† (since 07/28/97) IISDX | |||||||||||||||||||||||||||||||
| 1 Year | 3.99% (0.43) | 3 4 | 3.25% (1.71) | 3 4 | 3.37% 2.38 | 3 4 | 4.12% — | 3 | |||||||||||||||||||||||||||
| 5 Years | 3.89 2.99 | 3 4 | 3.24 2.89 | 3 4 | 3.27 3.27 | 3 4 | 4.09 — | 3 | |||||||||||||||||||||||||||
| 10 Years | 4.69 4.23 | 3 4 | 4.06 4.06 | 3 4 | 3.93 3.93 | 3 4 | 4.78 — | 3 | |||||||||||||||||||||||||||
| Since Inception | 4.59 4.14 | 3 4 | 5.19 5.19 | 3 4 | 3.86 3.86 | 3 4 | 4.69 — | 3 | |||||||||||||||||||||||||||
Performance data quoted represents past performance, which is no guarantee of future results and current performance may be lower or higher than the figures shown. For most recent month-end performance figures, please visit www.morganstanley.com/msim or speak with your Financial Advisor. Investment returns and principal value will fluctuate and fund shares, when redeemed, may be worth more or less than their original cost. The graph and table do not reflect the deduction of taxes that a shareholder would pay on fund distributions or the redemption of fund shares. Performance for Class A, Class B, Class C, and Class D shares will vary due to differences in sales charges and expenses.
* The maximum front-end sales charge for Class A is 4.25%.
** The maximum contingent deferred sales charge (CDSC) for Class B is 5.0%. The CDSC declines to 0% after six years. Effective April 2005, Class B shares will generally convert to Class A shares approximately eight years after the end of the calendar month in which the shares were purchased. Performance for periods greater than eight years reflects this conversion (beginning April 2005).
† The maximum contingent deferred sales charge for Class C is 1.0% for shares redeemed within one year of purchase.
†† Class D has no sales charge.
(1) The Lehman Brothers U.S. Corporate Index covers U.S. dollar-denominated, investment-grade, fixed rate, taxable securities sold by industrial, utility and financial issuers. It includes publicly issued U.S. corporate and foreign debentures and secured notes that meet specified maturity, liquidity and quality requirements. The Index is unmanaged and its returns do not include any sales charges or fees. Such costs would lower performance. It is not possible to invest directly in an index.
(2) The Lipper Corporate Debt Funds BBB-Rated Index is an equally weighted performance index of the largest qualifying funds (based on net assets) in the Lipper Corporate Debt Funds BBB-Rated classification. The Index, which is adjusted for capital gains distributions and income dividends, is unmanaged and should not be considered an investment. There are currently 30 funds represented in this Index. The Fund is in the Lipper Corporate Debt Funds BBB-Rated classification as of the date of this report.
(3) Figure shown assumes reinvestment of all distributions and does not reflect the deduction of any sales charges.
(4) Figure shown assumes reinvestment of all distributions and the deduction of the maximum applicable sales charge. See the Fund's current prospectus for complete details on fees and sales charges.
‡ Ending value assuming a complete redemption on August 31, 2007.
7
Expense Example
As a shareholder of the Fund, you incur two types of costs: (1) transaction costs, including sales charges (loads) on purchase payments and redemption fees; and (2) ongoing costs, including advisory fees; distribution and service (12b-1) fees; and other Fund expenses. This example is intended to help you understand your ongoing costs (in dollars) of investing in the Fund and to compare these costs with the ongoing costs of investing in other mutual funds.
The example is based on an investment of $1,000 invested at the beginning of the period and held for the entire period 03/01/07 – 08/31/07.
Actual Expenses
The first line of the table below provides information about actual account values and actual expenses. You may use the information in this line, together with the amount you invested, to estimate the expenses that you paid over the period. Simply divide your account value by $1,000 (for example, an $8,600 account value divided by $1,000 = 8.6), then multiply the result by the number in the first line under the heading entitled "Expenses Paid During Period" to estimate the expenses you paid on your account during this period.
Hypothetical Example for Comparison Purposes
The second line of the table below provides information about hypothetical expenses based on the Fund's actual expense ratio and an assumed rate of return of 5% per year before expenses, which is not the Fund's actual return. The hypothetical account values and expenses may not be used to estimate the actual ending account balance or expenses you paid for the period. You may use this information to compare the ongoing cost of investing in the Fund and other funds. To do so, compare this 5% hypothetical example with the 5% hypothetical examples that appear in the shareholder reports of the other funds.
Please note that the expenses shown in the table are meant to highlight your ongoing costs only and do not reflect any transactional costs, such as sales charges (loads) and redemption fees. Therefore, the second line of the table is useful in comparing ongoing costs, and will not help you determine the relative total cost of owning different funds. In addition, if these transactional costs were included, your costs would have been higher.
| Beginning Account Value | Ending Account Value | Expenses Paid During Period * | |||||||||||||
| 03/01/07 | 08/31/07 | 03/01/07 – 08/31/07 | |||||||||||||
| Class A | |||||||||||||||
| Actual (-0.17% return) | $ | 1,000.00 | $ | 998.30 | $ | 5.29 | |||||||||
| Hypothetical (5% annual return before expenses) | $ | 1,000.00 | $ | 1,019.91 | $ | 5.35 | |||||||||
| Class B | |||||||||||||||
| Actual (-0.49% return) | $ | 1,000.00 | $ | 995.10 | $ | 8.30 | |||||||||
| Hypothetical (5% annual return before expenses) | $ | 1,000.00 | $ | 1,016.89 | $ | 8.39 | |||||||||
| Class C | |||||||||||||||
| Actual (-0.48% return) | $ | 1,000.00 | $ | 995.20 | $ | 8.30 | |||||||||
| Hypothetical (5% annual return before expenses) | $ | 1,000.00 | $ | 1,016.89 | $ | 8.39 | |||||||||
| Class D | |||||||||||||||
| Actual (-0.07% return) | $ | 1,000.00 | $ | 999.30 | $ | 4.03 | |||||||||
| Hypothetical (5% annual return before expenses) | $ | 1,000.00 | $ | 1,021.17 | $ | 4.08 | |||||||||
* Expenses are equal to the Fund's annualized expense ratios of 1.05%, 1.65%, 1.65% and 0.80% for Class A, Class B, Class C and Class D shares, respectively, multiplied by the average account value over the period, multiplied by 184/365 (to reflect the one-half year period). If the Fund had borne all of its expenses that were waived by the Investment Adviser and Administrator, the annualized expense ratios would have been 1.42%, 2.02%, 2.02% and 1.17% for Class A, Class B, Class C and Class D shares, respectively.
8
Investment Advisory Agreement Approval
Nature, Extent and Quality of Services
The Board reviewed and considered the nature and extent of the investment advisory services provided by the Investment Adviser under the Advisory Agreement, including portfolio management, investment research and fixed income securities trading. The Board also reviewed and considered the nature and extent of the non-advisory, administrative services provided by the Fund's Administrator under the Administration Agreement, including accounting, clerical, bookkeeping, compliance, business management and planning, and the provision of supplies, office space and utilities at the Investment Adviser's expense. (The Investment Adviser and the Administrator together are referred to as the "Adviser" and the Advisory and Administration Agreements together are referred to as the "Management Agreement.") The Board also compared the nature of the services provided by the Adviser with similar services provided by non-affiliated advisers as rep orted to the Board by Lipper Inc. ("Lipper").
The Board reviewed and considered the qualifications of the portfolio managers, the senior administrative managers and other key personnel of the Adviser who provide the advisory and administrative services to the Fund. The Board determined that the Adviser's portfolio managers and key personnel are well qualified by education and/or training and experience to perform the services in an efficient and professional manner. The Board concluded that the nature and extent of the advisory and administrative services provided were necessary and appropriate for the conduct of the business and investment activities of the Fund. The Board also concluded that the overall quality of the advisory and administrative services was satisfactory.
Performance Relative to Comparable Funds Managed by Other Advisers
On a regular basis, the Board reviews the performance of all funds in the Morgan Stanley Fund Complex, including the Fund, compared to their peers, paying specific attention to the underperforming funds. In addition, the Board specifically reviewed the Fund's performance for the one-, three- and five-year periods ended November 30, 2006, as shown in a report provided by Lipper (the "Lipper Report"), compared to the performance of comparable funds selected by Lipper (the "performance peer group"). The Board also discussed with the Adviser the performance goals and the actual results achieved in managing the Fund. The Board concluded that the Fund's performance was competitive with that of its performance peer group.
Fees Relative to Other Proprietary Funds Managed by the Adviser with Comparable Investment Strategies
The Board reviewed the advisory and administrative fee (together, the "management fee") rate paid by the Fund under the Management Agreement. The Board noted that the management fee rate was comparable to the management fee rates charged by the Adviser to other proprietary funds it manages with investment strategies comparable to those of the Fund taking into account the scope of the services provided.
9
Fees and Expenses Relative to Comparable Funds Managed by Other Advisers
The Board reviewed the management fee rate and total expense ratio of the Fund as compared to the average management fee rate and average total expense ratio for funds, selected by Lipper (the "expense peer group"), managed by other advisers with investment strategies comparable to those of the Fund, as shown in the Lipper Report. The Board concluded that the Fund's management fee rate and total expense ratio were competitive with those of its expense peer group.
Breakpoints and Economies of Scale
The Board reviewed the structure of the Fund's management fee schedule under the Management Agreement and noted that it includes breakpoints. The Board also reviewed the level of the Fund's management fee and noted that the fee, as a percentage of the Fund's net assets, would decrease as net assets increase because the management fee includes a breakpoint. The Board concluded that the Fund's management fee would reflect economies of scale as assets increase.
Profitability of the Adviser and Affiliates
The Board considered information concerning the costs incurred and profits realized by the Adviser and affiliates during the last year from their relationship with the Fund and during the last two years from their relationship with the Morgan Stanley Fund Complex and reviewed with the Adviser the cost allocation methodology used to determine the profitability of the Adviser and affiliates. Based on its review of the information it received, the Board concluded that the profits earned by the Adviser and affiliates were not excessive in light of the advisory, administrative and other services provided to the Fund.
Fall-Out Benefits
The Board considered so-called "fall-out benefits" derived by the Adviser and affiliates from their relationship with the Fund and the Morgan Stanley Fund Complex, such as sales charges on sales of Class A shares and "float" benefits derived from handling of checks for purchases and sales of Fund shares, through a broker-dealer affiliate of the Adviser. The Board also considered that a broker-dealer affiliate of the Adviser receives from the Fund 12b-1 fees for distribution and shareholder services. The Board concluded that the float benefits were relatively small and the sales charges and 12b-1 fees were competitive with those of other broker-dealers.
Soft Dollar Benefits
The Board considered whether the Adviser realizes any benefits from commissions paid to brokers who execute securities transactions for the Fund ("soft dollars"). The Board noted that the Fund invests only in fixed income securities, which do not generate soft dollars.
10
Adviser Financially Sound and Financially Capable of Meeting the Fund's Needs
The Board considered whether the Adviser is financially sound and has the resources necessary to perform its obligations under the Management Agreement. The Board concluded that the Adviser has the financial resources necessary to fulfill its obligations under the Management Agreement.
Historical Relationship Between the Fund and the Adviser
The Board also reviewed and considered the historical relationship between the Fund and the Adviser, including the organizational structure of the Adviser, the policies and procedures formulated and adopted by the Adviser for managing the Fund's operations and the Board's confidence in the competence and integrity of the senior managers and key personnel of the Adviser. The Board concluded that it is beneficial for the Fund to continue its relationship with the Adviser.
Other Factors and Current Trends
The Board considered the controls and procedures adopted and implemented by the Adviser and monitored by the Fund's Chief Compliance Officer and concluded that the conduct of business by the Adviser indicates a good faith effort on its part to adhere to high ethical standards in the conduct of the Fund's business.
General Conclusion
On April 25, 2007, after considering and weighing all of the above factors, the Board concluded that it would be in the best interest of the Fund and its shareholders to approve renewal of the Management Agreement for another year until April 30, 2008. On June 20, 2007, the Board again considered and weighed all of the above factors and concluded that it would be in the best interest of the Fund and its shareholders to approve renewal of the Management Agreement to continue until June 30, 2008.
11
Morgan Stanley Income Trust
Portfolio of Investments n August 31, 2007
| PRINCIPAL AMOUNT IN THOUSANDS | COUPON RATE | MATURITY DATE | VALUE | ||||||||||||||||
| Corporate Bonds (66.8%) | |||||||||||||||||||
| Advertising/Marketing Services (0.1%) | |||||||||||||||||||
| $ | 55 | Interpublic Group of Companies, Inc. (The) | 6.25 | % | 11/15/14 | $ | 49,225 | ||||||||||||
| Aerospace & Defense (1.2%) | |||||||||||||||||||
| 120 | DAE Aviation Holdings, Inc. - 144A** | 11.25 | 08/01/15 | 120,000 | |||||||||||||||
| 175 | Raytheon Co. | 4.50 | 11/15/07 | 174,567 | |||||||||||||||
| 242 | Systems 2001 Asset Trust - 144A** (Cayman Islands) | 6.664 | 09/15/13 | 257,803 | |||||||||||||||
| 552,370 | |||||||||||||||||||
| Air Freight/Couriers (0.5%) | |||||||||||||||||||
| 220 | FedEx Corp. | 7.25 | 02/15/11 | 235,044 | |||||||||||||||
| Airlines (0.5%) | |||||||||||||||||||
| 224 | America West Airlines, Inc. (Series 01-1) | 7.10 | 04/02/21 | 236,695 | |||||||||||||||
| Auto Parts: O.E.M. (0.3%) | |||||||||||||||||||
| 150 | ArvinMeritor, Inc. (a) | 8.75 | 03/01/12 | 149,250 | |||||||||||||||
| Beverages: Alcoholic (1.6%) | |||||||||||||||||||
| 330 | FBG Finance Ltd. - 144A** (Australia) | 5.125 | 06/15/15 | 312,275 | |||||||||||||||
| 430 | Miller Brewing Co. - 144A** | 4.25 | 08/15/08 | 424,175 | |||||||||||||||
| 736,450 | |||||||||||||||||||
| Cable/Satellite TV (1.8%) | |||||||||||||||||||
| 270 | Comcast Cable Communications, Inc. | 6.75 | 01/30/11 | 280,622 | |||||||||||||||
| 80 | Comcast Cable Communications, Inc. | 7.125 | 06/15/13 | 85,218 | |||||||||||||||
| 230 | Comcast Corp. | 6.50 | 01/15/15 | 237,594 | |||||||||||||||
| 245 | EchoStar DBS Corp. | 6.375 | 10/01/11 | 241,325 | |||||||||||||||
| 844,759 | |||||||||||||||||||
| Department Stores (2.4%) | |||||||||||||||||||
| 80 | JC Penney Corp., Inc. | 5.75 | 02/15/18 | 77,408 | |||||||||||||||
| 1,045 | May Department Stores Co. | 5.95 | 11/01/08 | 1,044,126 | |||||||||||||||
| 1,121,534 | |||||||||||||||||||
| Drugstore Chains (1.3%) | |||||||||||||||||||
| 170 | CVS Caremark Corp. | 5.75 | 06/01/17 | 166,451 | |||||||||||||||
| 165 | CVS Corp. | 5.75 | 08/15/11 | 166,909 | |||||||||||||||
| 291 | CVS Lease Pass Through - 144A** | 6.036 | 12/10/28 | 284,349 | |||||||||||||||
| 617,709 | |||||||||||||||||||
| Electric Utilities (7.9%) | |||||||||||||||||||
| 400 | Arizona Public Service Co. | 5.80 | 06/30/14 | 398,451 | |||||||||||||||
| 90 | CenterPoint Energy Resources, Corp. | 6.25 | 02/01/37 | 89,585 | |||||||||||||||
See Notes to Financial Statements
12
Morgan Stanley Income Trust
Portfolio of Investments n August 31, 2007 continued
| PRINCIPAL AMOUNT IN THOUSANDS | COUPON RATE | MATURITY DATE | VALUE | ||||||||||||||||
| $ | 45 | CenterPoint Energy Resources, Corp. (Series B) | 7.875 | % | 04/01/13 | $ | 49,235 | ||||||||||||
| 310 | Consumers Energy Co. (Series H) | 4.80 | 02/17/09 | 307,663 | |||||||||||||||
| 205 | Detroit Edison Co. (The) | 6.125 | 10/01/10 | 210,991 | |||||||||||||||
| 340 | Duquesne Light Co. (Series O) | 6.70 | 04/15/12 | 360,865 | |||||||||||||||
| 255 | Entergy Gulf States, Inc. | 3.60 | 06/01/08 | 250,005 | |||||||||||||||
| 365 | Entergy Gulf States, Inc. | 5.76 | † | 12/01/09 | 361,784 | ||||||||||||||
| 200 | Entergy Gulf States, Inc. - 144A** | 6.11 | † | 12/08/08 | 200,600 | ||||||||||||||
| 230 | Exelon Corp. | 6.75 | 05/01/11 | 238,729 | |||||||||||||||
| 245 | Ohio Edison Co. | 6.40 | 07/15/16 | 253,882 | |||||||||||||||
| 290 | Ohio Power Company (Series K) | 6.00 | 06/01/16 | 294,536 | |||||||||||||||
| 32 | PSEG Energy Holdings Inc. | 8.625 | 02/15/08 | 32,442 | |||||||||||||||
| 100 | Public Service Electric & Gas Co. (Series B) | 5.00 | 01/01/13 | 97,498 | |||||||||||||||
| 200 | Texas Eastern Transmission | 7.00 | 07/15/32 | 221,352 | |||||||||||||||
| 195 | TXU Energy Co. | 7.00 | 03/15/13 | 200,514 | |||||||||||||||
| 130 | Union Electric Co. | 6.40 | 06/15/17 | 135,075 | |||||||||||||||
| 3,703,207 | |||||||||||||||||||
| Electrical Products (0.7%) | |||||||||||||||||||
| 340 | Cooper Industries, Inc. | 5.25 | 11/15/12 | 339,342 | |||||||||||||||
| Electronic Equipment/Instruments (0.2%) | |||||||||||||||||||
| 110 | Xerox Corp. | 5.50 | 05/15/12 | 108,855 | |||||||||||||||
| Electronics/Appliances (0.6%) | |||||||||||||||||||
| 260 | LG Electronics Inc. - 144A** (South Korea) | 5.00 | 06/17/10 | 256,038 | |||||||||||||||
| Environmental Services (0.4%) | |||||||||||||||||||
| 200 | Waste Management, Inc. | 6.875 | 05/15/09 | 206,298 | |||||||||||||||
| Finance/Rental/Leasing (3.8%) | |||||||||||||||||||
| 120 | Capital One Financial Corp. (WI) | 6.75 | 09/15/17 | 119,578 | |||||||||||||||
| 270 | Capmark Financial Group Inc. - 144A** | 5.875 | 05/10/12 | 239,361 | |||||||||||||||
| 115 | Capmark Financial Group Inc. - 144A** | 6.30 | 05/10/17 | 93,571 | |||||||||||||||
| 250 | CIT Group, Inc. | 5.65 | 02/13/17 | 219,089 | |||||||||||||||
| 325 | Countrywide Home Loans, Inc. (Series MTN) | 3.25 | 05/21/08 | 313,653 | |||||||||||||||
| 395 | Ford Motor Credit Co. LLC | 7.25 | 10/25/11 | 360,396 | |||||||||||||||
| 475 | Nationwide Building Society - 144A** (United Kingdom) | 4.25 | 02/01/10 | 467,223 | |||||||||||||||
| 1,812,871 | |||||||||||||||||||
See Notes to Financial Statements
13
Morgan Stanley Income Trust
Portfolio of Investments n August 31, 2007 continued
| PRINCIPAL AMOUNT IN THOUSANDS | COUPON RATE | MATURITY DATE | VALUE | ||||||||||||||||
| Financial Conglomerates (1.4%) | |||||||||||||||||||
| $ | 75 | Brookfield Asset Management Inc. (Canada) | 5.80 | % | 04/25/17 | $ | 75,445 | ||||||||||||
| 240 | Citigroup Inc. (a) | 5.25 | 02/27/12 | 239,163 | |||||||||||||||
| 400 | GMAC LLC | 6.875 | 09/15/11 | 357,046 | |||||||||||||||
| 671,654 | |||||||||||||||||||
| Food Retail (0.6%) | |||||||||||||||||||
| 185 | Delhaize America, Inc. | 9.00 | 04/15/31 | 217,375 | |||||||||||||||
| 80 | Kroger Co. (The) | 6.40 | 08/15/17 | 81,855 | |||||||||||||||
| 299,230 | |||||||||||||||||||
| Food: Major Diversified (1.1%) | |||||||||||||||||||
| 165 | ConAgra Foods, Inc. | 7.00 | 10/01/28 | 172,347 | |||||||||||||||
| 130 | ConAgra Foods, Inc. | 8.25 | 09/15/30 | 153,390 | |||||||||||||||
| 195 | Kraft Foods Inc. | 6.00 | 02/11/13 | 199,163 | |||||||||||||||
| 524,900 | |||||||||||||||||||
| Food: Meat/Fish/Dairy (0.6%) | |||||||||||||||||||
| 100 | Pilgrim's Pride Corp. | 7.625 | 05/01/15 | 100,250 | |||||||||||||||
| 50 | Pilgrim's Pride Corp. | 9.625 | 09/15/11 | 51,667 | |||||||||||||||
| 105 | Smithfield Foods, Inc. (Series B) | 8.00 | 10/15/09 | 108,150 | |||||||||||||||
| 260,067 | |||||||||||||||||||
| Gas Distributors (1.0%) | |||||||||||||||||||
| 370 | NiSource Finance Corp. | 6.064 | † | 11/23/09 | 366,879 | ||||||||||||||
| 100 | NiSource Finance Corp. | 7.875 | 11/15/10 | 106,288 | |||||||||||||||
| 473,167 | |||||||||||||||||||
| Home Improvement Chains (0.9%) | |||||||||||||||||||
| 445 | Home Depot Inc. | 5.485 | 12/16/09 | 439,787 | |||||||||||||||
| Insurance Brokers/Services (1.8%) | |||||||||||||||||||
| 360 | Catlin Insurance Co., Ltd. - 144A** (Bahamas) | 7.249 | † | ## | 335,244 | ||||||||||||||
| 485 | Farmers Exchange Capital - 144A** | 7.05 | 07/15/28 | 490,055 | |||||||||||||||
| 825,299 | |||||||||||||||||||
| Integrated Oil (0.8%) | |||||||||||||||||||
| 190 | Hess Corp. | 6.65 | 08/15/11 | 198,536 | |||||||||||||||
| 205 | Petro-Canada (Canada) | 5.95 | 05/15/35 | 191,725 | |||||||||||||||
| 390,261 | |||||||||||||||||||
See Notes to Financial Statements
14
Morgan Stanley Income Trust
Portfolio of Investments n August 31, 2007 continued
| PRINCIPAL AMOUNT IN THOUSANDS | COUPON RATE | MATURITY DATE | VALUE | ||||||||||||||||
| Investment Banks/Brokers (1.8%) | |||||||||||||||||||
| $ | 160 | Bear Stearns Companies Inc. (The) (a) | 5.55 | % | 01/22/17 | $ | 147,571 | ||||||||||||
| 495 | Goldman Sachs Capital II | 5.793 | † | # | 454,672 | ||||||||||||||
| 250 | Lehman Brothers Holdings, Inc. | 6.875 | 07/17/37 | 235,579 | |||||||||||||||
| 837,822 | |||||||||||||||||||
| Major Banks (5.0%) | |||||||||||||||||||
| 200 | Bank of America Corp. | 4.875 | 09/15/12 | 196,799 | |||||||||||||||
| 485 | HSBC Finance Corp. | 6.75 | 05/15/11 | 503,623 | |||||||||||||||
| 685 | Unicredit Luxembourg Finance S.A. - 144A** (Luxembourg) | 5.41 | † | 10/24/08 | 685,212 | ||||||||||||||
| 285 | USB Capital IX | 6.189 | † | # | 286,408 | ||||||||||||||
| 685 | Wachovia Capital Trust III | 5.80 | † | # | 683,823 | ||||||||||||||
| 2,355,865 | |||||||||||||||||||
| Major Telecommunications (6.1%) | |||||||||||||||||||
| 565 | AT&T Corp. (a) | 8.00 | † | 11/15/31 | 674,290 | ||||||||||||||
| 150 | Deutsche Telekom International Finance BV (Netherlands) | 8.00 | † | 06/15/10 | 159,776 | ||||||||||||||
| 310 | France Telecom S.A. (France) | 8.50 | † | 03/01/31 | 396,942 | ||||||||||||||
| 300 | SBC Communications, Inc. | 6.15 | 09/15/34 | 291,761 | |||||||||||||||
| 305 | Sprint Capital Corp. | 8.75 | 03/15/32 | 353,036 | |||||||||||||||
| 255 | Telecom Italia Capital SA (Luxembourg) | 4.00 | 11/15/08 | 250,497 | |||||||||||||||
| 215 | Telecom Italia Capital SA (Luxembourg) | 4.00 | 01/15/10 | 208,116 | |||||||||||||||
| 330 | Telefonica Europe BV (Netherlands) | 8.25 | 09/15/30 | 388,113 | |||||||||||||||
| 165 | Verizon Global Funding Corp. | 7.25 | 12/01/10 | 174,269 | |||||||||||||||
| 2,896,800 | |||||||||||||||||||
| Managed Health Care (0.1%) | |||||||||||||||||||
| 55 | WellPoint, Inc. | 4.25 | 12/15/09 | 54,026 | |||||||||||||||
| Media Conglomerates (1.9%) | |||||||||||||||||||
| 350 | Time Warner, Inc. | 5.73 | † | 11/13/09 | 347,219 | ||||||||||||||
| 240 | Time Warner, Inc. (a) | 5.875 | 11/15/16 | 235,591 | |||||||||||||||
| 295 | Viacom, Inc. | 6.875 | 04/30/36 | 288,150 | |||||||||||||||
| 870,960 | |||||||||||||||||||
| Medical Specialties (0.9%) | |||||||||||||||||||
| 405 | Hospira, Inc. | 5.84 | † | 03/30/10 | 406,260 | ||||||||||||||
| Motor Vehicles (0.9%) | |||||||||||||||||||
| 335 | DaimlerChrysler North America LLC | 8.50 | 01/18/31 | 415,617 | |||||||||||||||
See Notes to Financial Statements
15
Morgan Stanley Income Trust
Portfolio of Investments n August 31, 2007 continued
| PRINCIPAL AMOUNT IN THOUSANDS | COUPON RATE | MATURITY DATE | VALUE | ||||||||||||||||
| Multi-Line Insurance (2.0%) | |||||||||||||||||||
| $ | 450 | AIG SunAmerica Global Financing VI - 144A** | 6.30 | % | 05/10/11 | $ | 464,504 | ||||||||||||
| 485 | American General Finance Corp. (Series H) | 4.625 | 09/01/10 | 479,512 | |||||||||||||||
| 944,016 | |||||||||||||||||||
| Oil & Gas Pipelines (2.2%) | |||||||||||||||||||
| 190 | Colorado Interstate Gas Co. | 6.80 | 11/15/15 | 197,019 | |||||||||||||||
| 165 | Enterprise Products Operating L.P. (Series B) | 5.60 | 10/15/14 | 162,009 | |||||||||||||||
| 320 | Kinder Morgan Finance Co. (Canada) | 5.70 | 01/05/16 | 285,335 | |||||||||||||||
| 125 | Kinder Morgan Energy Partners, L.P. | 5.85 | 09/15/12 | 125,336 | |||||||||||||||
| 290 | Plains All American Pipeline | 6.70 | 05/15/36 | 289,778 | |||||||||||||||
| 1,059,477 | |||||||||||||||||||
| Oil & Gas Production (1.3%) | |||||||||||||||||||
| 120 | Chesapeake Energy Corp. | 7.625 | 07/15/13 | 123,300 | |||||||||||||||
| 230 | Devon Financing Corp. ULC | 6.875 | 09/30/11 | 243,473 | |||||||||||||||
| 230 | Kerr-McGee Corp. | 6.625 | 10/15/07 | 230,160 | |||||||||||||||
| 596,933 | |||||||||||||||||||
| Oil Refining/Marketing (0.3%) | |||||||||||||||||||
| 160 | Valero Energy Corp. | 3.50 | 04/01/09 | 156,420 | |||||||||||||||
| Other Metals/Minerals (0.9%) | |||||||||||||||||||
| 385 | Brascan Corp. (Canada) | 7.125 | 06/15/12 | 412,850 | |||||||||||||||
| Property - Casualty Insurers (3.7%) | |||||||||||||||||||
| 645 | Mantis Reef Ltd. - 144A** (Cayman Islands) | 4.692 | 11/14/08 | 642,720 | |||||||||||||||
| 205 | Platinum Underwriters Finance Inc. (Series B) | 7.50 | 06/01/17 | 218,751 | |||||||||||||||
| 350 | Platinum Underwriters Holdings, Ltd. (Series B) (Bermuda) | 6.371 | 11/16/07 | 349,224 | |||||||||||||||
| 510 | Xlliac Global Funding - 144A** | 4.80 | 08/10/10 | 505,029 | |||||||||||||||
| 1,715,724 | |||||||||||||||||||
| Railroads (1.8%) | |||||||||||||||||||
| 235 | Burlington Northern Santa Fe Corp. | 6.125 | 03/15/09 | 238,110 | |||||||||||||||
| 250 | Union Pacific Corp. | 5.45 | 01/31/13 | 250,002 | |||||||||||||||
| 200 | Union Pacific Corp. | 6.625 | 02/01/08 | 200,577 | |||||||||||||||
| 160 | Union Pacific Corp. (Series E) | 6.79 | 11/09/07 | 160,194 | |||||||||||||||
| 848,883 | |||||||||||||||||||
See Notes to Financial Statements
16
Morgan Stanley Income Trust
Portfolio of Investments n August 31, 2007 continued
| PRINCIPAL AMOUNT IN THOUSANDS | COUPON RATE | MATURITY DATE | VALUE | ||||||||||||||||
| Real Estate Development (1.0%) | |||||||||||||||||||
| $ | 272 | World Financial Properties - 144A** | 6.91 | % | 09/01/13 | $ | 275,926 | ||||||||||||
| 201 | World Financial Properties - 144A** | 6.95 | 09/01/13 | 204,107 | |||||||||||||||
| 480,033 | |||||||||||||||||||
| Real Estate Investment Trusts (0.9%) | |||||||||||||||||||
| 455 | iStar Financial Inc. | 5.71 | † | 03/09/10 | 430,693 | ||||||||||||||
| Restaurants (0.5%) | |||||||||||||||||||
| 230 | Tricon Global Restaurants, Inc. (a) | 8.875 | 04/15/11 | 256,247 | |||||||||||||||
| Savings Banks (3.8%) | |||||||||||||||||||
| 70 | Household Finance Corp. | 4.125 | 11/16/09 | 68,311 | |||||||||||||||
| 170 | Household Finance Corp. | 8.00 | 07/15/10 | 182,098 | |||||||||||||||
| 600 | Sovereign Bancorp, Inc. | 5.59 | † | 03/23/10 | 600,176 | ||||||||||||||
| 685 | Washington Mutual Bank | 5.50 | 01/15/13 | 661,961 | |||||||||||||||
| 300 | Washington Mutual Preferred Funding II (a) | 6.665 | † | # | 262,837 | ||||||||||||||
| 1,775,383 | |||||||||||||||||||
| Tobacco (0.2%) | |||||||||||||||||||
| 105 | Reynolds American Inc. | 6.50 | 07/15/10 | 107,678 | |||||||||||||||
| Total Corporate Bonds (Cost $31,985,817) | 31,475,699 | ||||||||||||||||||
| U.S. Government Obligations (17.1%) | |||||||||||||||||||
| 2,310 | U.S. Treasury Bond (a) | 6.125 | 08/15/29 | 2,699,632 | |||||||||||||||
| 2,000 | U.S. Treasury Note (a) | 3.50 | 08/15/09 | 1,974,532 | |||||||||||||||
| 1,700 | U.S. Treasury Note (a) | 5.375 | 02/15/31 | 1,822,587 | |||||||||||||||
| 1,500 | U.S. Treasury Note (a) | 6.50 | 02/15/10 | 1,579,571 | |||||||||||||||
| Total U.S. Government Obligations (Cost $8,070,989) | 8,076,322 | ||||||||||||||||||
| Commercial Mortgage-Backed Securities (7.8%) | |||||||||||||||||||
| 200 | Banc of America Commercial Mortgage Inc. 2007-2 A4 | 5.866 | 04/10/49 | 200,325 | |||||||||||||||
| 200 | Banc of America Commercial Mortgage Inc. 2007-3 A4 | 5.838 | 06/10/49 | 199,538 | |||||||||||||||
| 250 | Bear Stearns Commercial Mortgage Securities Inc. 2007-PW16 A4 | 5.902 | 06/11/40 | 251,065 | |||||||||||||||
| 175 | Citigroup Commercial Mortgage Trust 2007-C6 A4 | 5.889 | 12/10/49 | 175,615 | |||||||||||||||
| 400 | Commercial Mortgage Pass-Through Certificate 2007-C9 A4 | 6.01 | 12/10/49 | 404,659 | |||||||||||||||
See Notes to Financial Statements
17
Morgan Stanley Income Trust
Portfolio of Investments n August 31, 2007 continued
| PRINCIPAL AMOUNT IN THOUSANDS | COUPON RATE | MATURITY DATE | VALUE | ||||||||||||||||
| $ | 150 | Greenwich Capital Commercial Funding Corp. 2007-GG9 A4 | 5.444 | % | 03/10/39 | $ | 147,132 | ||||||||||||
| 375 | GS Mortgage Securities Corporation II 2007-GG10 A4 | 5.993 | 08/10/45 | 378,608 | |||||||||||||||
| 125 | JP Morgan Chase Commercial Mortgage Securities 2007-CB18 A4 | 5.44 | 06/12/47 | 122,367 | |||||||||||||||
| 200 | JP Morgan Chase Commercial Mortgage Securities 2007-CB19 Class A4 | 5.937 | 02/12/49 | 200,772 | |||||||||||||||
| 275 | JP Morgan Chase Commercial Mortgage Securities Corp. 2007-LD11 A4 | 6.007 | 06/15/49 | 277,793 | |||||||||||||||
| 200 | LB Commercial Conduit Mortgage Trust 2007-C3 A4 | 6.134 | 07/15/44 | 204,242 | |||||||||||||||
| 125 | LB-UBS Commercial Mortgage Trust 2007-C2 A3 | 5.43 | 02/15/40 | 122,419 | |||||||||||||||
| 300 | Wachovia Bank Commercial Mortgage Trust 2007-C30 A5 | 5.342 | 12/15/43 | 291,548 | |||||||||||||||
| 400 | Wachovia Bank Commercial Mortgage Trust 2007-C32 A3 | 5.929 | 06/15/49 | 400,792 | |||||||||||||||
| 300 | Wachovia Bank Commercial Mortgage Trust 2007-C33 A4 | 6.10 | 02/15/51 | 305,845 | |||||||||||||||
| Total Commercial Mortgage-Backed Securities (Cost $3,603,550) | 3,682,720 | ||||||||||||||||||
| Asset-Backed Securities (3.6%) | |||||||||||||||||||
| 43 | CIT Equipment Collateral 2004-EF1 A3 | 3.50 | 09/20/08 | 42,548 | |||||||||||||||
| 58 | Ford Credit Auto Owner Trust 2005-B A3 | 4.17 | 01/15/09 | 57,891 | |||||||||||||||
| 400 | Ford Credit Auto Owner Trust 2007-A A3A | 5.40 | 08/15/11 | 400,623 | |||||||||||||||
| 375 | GS Auto Loan Trust 2007-1 A3 | 5.39 | 12/15/11 | 375,106 | |||||||||||||||
| 332 | Harley-Davidson Motorcycle Trust 2004-2 A2 | 3.56 | 02/15/12 | 327,477 | |||||||||||||||
| 2 | Volkswagen Auto Lease Trust 2005-A A3 | 3.82 | 05/20/08 | 2,346 | |||||||||||||||
| 500 | TXU Electric Delivery Transition Bond Co. LLC 2004-1 A2 | 4.81 | 11/17/14 | 495,342 | |||||||||||||||
| Total Asset-Backed Securities (Cost $1,709,524) | 1,701,333 | ||||||||||||||||||
| Collateralized Mortgage Obligations (1.1%) | |||||||||||||||||||
| 149 | American Home Mortgage Assets 2007-5 A3 | 5.805 | † | 06/25/47 | 133,512 | ||||||||||||||
| 75 | Countrywide Alternative Loan Trust 2006-0A16 M4 | 6.025 | † | 10/25/46 | 50,740 | ||||||||||||||
See Notes to Financial Statements
18
Morgan Stanley Income Trust
Portfolio of Investments n August 31, 2007 continued
| PRINCIPAL AMOUNT IN THOUSANDS | COUPON RATE | MATURITY DATE | VALUE | ||||||||||||||||
| $ | 75 | Harborview Mortgage Loan Trust 2006-8 B4 | 6.06 | † % | 08/21/36 | $ | 51,682 | ||||||||||||
| 75 | Luminent Mortgage Trust 2006-5 B1 | 5.865 | † | 07/25/36 | 65,475 | ||||||||||||||
| 125 | Mastr Adjustable Rate Mortgages Trust 2007-3 1M1 | 6.355 | † | 05/25/47 | 93,359 | ||||||||||||||
| 125 | Lehman XS Trust 2007-4N M4 | 6.505 | † | 03/25/47 | 99,688 | ||||||||||||||
| Total Collateralized Mortgage Obligations (Cost $500,160) | 494,456 | ||||||||||||||||||
| Foreign Government Obligations (0.7%) | |||||||||||||||||||
| MXN | 2,555 | Mexican Fixed Rate Bonds (Series M20) (Mexico) | 9.50 | 12/18/14 | 253,485 | ||||||||||||||
| $ | 92 | Republic of Argentina (Argentina)†† | 8.28 | 12/31/33 | 77,860 | ||||||||||||||
| Total Foreign Government Obligations (Cost $331,839) | 331,345 | ||||||||||||||||||
| U.S. Government Agencies - Mortgage-Backed Securities (0.1%) | |||||||||||||||||||
| 14 | Federal Home Loan Mortgage Corp. | 7.50 | 09/01/30 | 14,922 | |||||||||||||||
| 20 | Federal National Mortgage Association | 7.50 | 09/01/29 - 04/01/32 | 21,155 | |||||||||||||||
| Total U.S. Government Agencies - Mortgage-Backed Securities (Cost $36,366) | 36,077 | ||||||||||||||||||
| Short-Term Investments (22.7%) | |||||||||||||||||||
| U.S. Government Obligations (c) (0.3%) | |||||||||||||||||||
| U.S. Treasury Bills* | |||||||||||||||||||
| 10 | 4.55 | 01/10/08 | 9,839 | ||||||||||||||||
| 25 | 4.735 | 01/10/08 | 24,579 | ||||||||||||||||
| 100 | 4.845 | 01/10/08 | 98,277 | ||||||||||||||||
| Total U.S. Government Obligations (Cost $132,641) | 132,695 | ||||||||||||||||||
| Security Purchased from Securities Lending Collateral (21.4%) | |||||||||||||||||||
| 10,139 | The Bank of New York Institutional Cash Reserve Fund (Cost $10,139,043) | 10,139,043 | |||||||||||||||||
See Notes to Financial Statements
19
Morgan Stanley Income Trust
Portfolio of Investments n August 31, 2007 continued
| NUMBER OF SHARES (000) | VALUE | ||||||||||||||||||
| Investment Company (b) (1.0%) | |||||||||||||||||||
| 453 | Morgan Stanley Institutional Liquidity Money Market Portfolio - Institutional Class (Cost $453,071) | $ | 453,071 | ||||||||||||||||
| Total Short-Term Investments (Cost $10,724,755) | 10,724,809 | ||||||||||||||||||
| Total Investments (Cost $56,963,000) (d)(e) | 119.9 | % | 56,522,761 | ||||||||||||||||
| Liabilities in Excess of Other Assets | (19.9 | ) | (9,369,499 | ) | |||||||||||||||
| Net Assets | 100.0 | % | $ | 47,153,262 | |||||||||||||||
MTN Medium Term Note.
MXN Mexican New Peso.
WI Security purchased on a when-issued basis.
* A portion of this security has been physically segregated in connection with open futures contracts in an amount equal to $117,950.
** Resale is restricted to qualified institutional investors.
† Floating rate security, rate shown is the rate in effect at August 31, 2007.
†† Securities with a total market value equal to $77,860 have been valued at their fair value as determined in good determined in good faith under procedures established by and under the general supervision of the Fund's Trustees.
# Security issued with perpetual maturity.
## Foreign issued security with perpetual maturity.
(a) All or a portion of this security was on loan as of August 31, 2007.
(b) See Note 4 to the financial statements regarding investments in Morgan Stanley Institutional Liquidity Money Market Portfolio - Institutional Class.
(c) Purchased on a discount basis. The interest rate shown has been adjusted to reflect a money market equivalent yield.
(d) Securities have been designated as collateral in an amount equal to $23,651,180 in connection with open futures contracts and open swap contracts.
(e) The aggregate cost for federal income tax purposes is $57,420,400. The aggregate gross unrealized appreciation is $268,064 and the aggregate gross unrealized depreciation is $1,165,703 resulting in net unrealized depreciation of $897,639.
Futures Contracts Open at August 31, 2007:
| NUMBER OF CONTRACTS | LONG/SHORT | DESCRIPTION, DELIVERY MONTH AND YEAR | UNDERLYING FACE AMOUNT AT VALUE | UNREALIZED APPRECIATION (DEPRECIATION) | |||||||||||||||
| 50 | Long | U.S. Treasury Notes 5 Year, December 2007 | $ | 5,335,157 | $ | 18,057 | |||||||||||||
| 10 | Long | U.S. Treasury Notes 2 Year, December 2007 | 2,061,563 | 1,583 | |||||||||||||||
| 7 | Short | U.S. Treasury Bonds 20 Year, | (782,469 | ) | (17,301 | ) | |||||||||||||
| September 2007 | |||||||||||||||||||
| 20 | Short | U.S. Treasury Notes 10 Year, | (2,189,688 | ) | (8,796 | ) | |||||||||||||
| September 2007 | |||||||||||||||||||
| 51 | Short | U.S. Treasury Notes 10 Year, | (5,561,391 | ) | (3,471 | ) | |||||||||||||
| December 2007 | |||||||||||||||||||
| 67 | Short | U.S. Treasury Bonds 20 Year, December 2007 | (7,474,688 | ) | (21,331 | ) | |||||||||||||
| Net Unrealized Depreciation | $ | (31,259 | ) | ||||||||||||||||
See Notes to Financial Statements
20
Morgan Stanley Income Trust
Portfolio of Investments n August 31, 2007 continued
Credit Default Swap Contracts Open at August 31, 2007:
| SWAP COUNTERPARTY & REFERENCE OBLIGATION | BUY/SELL PROTECTION | NOTIONAL AMOUNT (000's) | PAY/RECEIVE FIXED RATE | TERMINATION DATE | UNREALIZED APPRECIATION (DEPRECIATION) | ||||||||||||||||||
| Goldman Sachs Capital Markets, LP Dow Jones CDX.NA.IG.HVOL.6 | Buy | $ | 1,200 | 0.75 | % | June 20, 2011 | $ | 20,200 | |||||||||||||||
| Goldman Sachs International Dow Jones CDX.NA.IG.HVOL.7 | Buy | 1,000 | 0.75 | December 20, 2011 | 20,940 | ||||||||||||||||||
| Goldman Sachs International Hartford Financial Services Group, Inc. | Buy | 550 | 0.12 | December 20, 2011 | 4,982 | ||||||||||||||||||
| Goldman Sachs International Motorola, Inc. | Buy | 180 | 0.15 | December 20, 2011 | 1,442 | ||||||||||||||||||
| Goldman Sachs International Motorola, Inc. | Buy | 360 | 0.157 | December 20, 2011 | 2,787 | ||||||||||||||||||
| Goldman Sachs International Union Pacific Corp. | Buy | 265 | 0.20 | December 20, 2011 | 1,273 | ||||||||||||||||||
| Citibank, N.A., New York Covidien Ltd. | Buy | 103 | 0.43 | March 20, 2012 | (479 | ) | |||||||||||||||||
| Citibank, N.A., New York Covidien Ltd. | Buy | 53 | 0.43 | March 20, 2012 | (247 | ) | |||||||||||||||||
| Citibank, N.A., New York Tyco Electronics Ltd. | Buy | 103 | 0.43 | March 20, 2012 | 542 | ||||||||||||||||||
| Citibank, N.A., New York Tyco Electronics Ltd. | Buy | 53 | 0.43 | March 20, 2012 | 280 | ||||||||||||||||||
| Citibank, N.A., New York Tyco International Ltd. | Buy | 103 | 0.43 | March 20, 2012 | 542 | ||||||||||||||||||
| Citibank, N.A., New York Tyco International Ltd. | Buy | 53 | 0.43 | March 20, 2012 | 280 | ||||||||||||||||||
| Goldman Sachs International Chubb Corp. | Buy | 510 | 0.10 | March 20, 2012 | 6,181 | ||||||||||||||||||
| Goldman Sachs International Dell Inc. | Buy | 255 | 0.22 | March 20, 2012 | 92 | ||||||||||||||||||
| Goldman Sachs International Gap, Inc. | Buy | 300 | 1.19 | March 20, 2012 | (2,864 | ) | |||||||||||||||||
| JP Morgan Chase Bank, N.A. Belo Corp. | Buy | 90 | 1.18 | June 20, 2014 | (493 | ) | |||||||||||||||||
| JP Morgan Chase Bank, N.A. Belo Corp. | Buy | 250 | 1.30 | June 20, 2014 | (3,050 | ) | |||||||||||||||||
| Bank of America, N.A. Centurytel, Inc. | Buy | 120 | 0.88 | September 20, 2017 | (649 | ) | |||||||||||||||||
| Net Unrealized Appreciation | $ | 51,759 | |||||||||||||||||||||
See Notes to Financial Statements
21
Morgan Stanley Income Trust
Portfolio of Investments n August 31, 2007 continued
| Interest Rate Swap Contracts Open at August 31, 2007: | |||||||||||||||||||||||
| SWAP COUNTERPARTY | NOTIONAL AMOUNT (000's) | PAYMENTS RECEIVED BY FUND | PAYMENTS MADE BY FUND† | TERMINATION DATE | UNREALIZED APPRECIATION | ||||||||||||||||||
| Deutsche Bank AG, New York | $ | 9,975 | Fixed Rate 5.389% | Floating Rate 5.505% | May 25, 2017 | $ | 123,391 | ||||||||||||||||
| Citibank N.A. New York | 1,475 | Fixed Rate 5.44 | Floating Rate 5.506 | May 29, 2017 | 23,969 | ||||||||||||||||||
| J.P. Morgan Chase N.A. New York | 1,500 | Fixed Rate 5.448 | Floating Rate 5.506 | May 29, 2017 | 25,290 | ||||||||||||||||||
| J.P. Morgan Chase N.A. New York | 5,350 | Fixed Rate 5.454 | Floating Rate 5.36 | June 4, 2017 | 90,415 | ||||||||||||||||||
| Total Unrealized Appreciation | $ | 263,065 | |||||||||||||||||||||
† Floating rate represents USD-3 months LIBOR.
See Notes to Financial Statements
22
Morgan Stanley Income Trust
Financial Statements
Statement of Assets and Liabilities
August 31, 2007
| Assets: | |||||||
| Investments in securities, at value (cost $56,509,929) (including $9,892,433 for securities loaned) | $ | 56,069,690 | |||||
| Investments in affiliate (cost $453,071) | 453,071 | ||||||
| Unrealized appreciation on open swap contracts | 322,606 | ||||||
| Cash | 973 | ||||||
| Receivable for: | |||||||
| Interest | 543,458 | ||||||
| Periodic interest on swap contracts | 257,371 | ||||||
| Variation margin | 37,033 | ||||||
| Shares of beneficial interest sold | 13,918 | ||||||
| Dividends from affiliate | 10,153 | ||||||
| Prepaid expenses and other assets | 33,713 | ||||||
| Total Assets | 57,741,986 | ||||||
| Liabilities: | |||||||
| Collateral on securities loaned at value | 10,139,043 | ||||||
| Unrealized depreciation on open swap contracts | 7,782 | ||||||
| Payable for: | |||||||
| Investments purchased | 119,659 | ||||||
| Periodic interest payment on swap contracts | 88,681 | ||||||
| Shares of beneficial interest redeemed | 63,706 | ||||||
| Distribution fee | 20,706 | ||||||
| Dividends | 11,632 | ||||||
| Administration fee | 3,199 | ||||||
| Transfer agent fee | 692 | ||||||
| Investment advisory fee | 140 | ||||||
| Accrued expenses and other payables | 133,484 | ||||||
| Total Liabilities | 10,588,724 | ||||||
| Net Assets | $ | 47,153,262 | |||||
| Composition of Net Assets: | |||||||
| Paid-in-capital | $ | 55,732,958 | |||||
| Net unrealized depreciation | (156,712 | ) | |||||
| Dividends in excess of net investment income | (399,766 | ) | |||||
| Accumulated net realized loss | (8,023,218 | ) | |||||
| Net Assets | $ | 47,153,262 | |||||
| Class A Shares: | |||||||
| Net Assets | $ | 24,967,422 | |||||
| Shares Outstanding (unlimited authorized, $.01 par value) | 2,703,061 | ||||||
| Net Asset Value Per Share | $ | 9.24 | |||||
| Maximum Offering Price Per Share, | |||||||
| (net asset value plus 4.44% of net asset value) | $ | 9.65 | |||||
| Class B Shares: | |||||||
| Net Assets | $ | 17,999,872 | |||||
| Shares Outstanding (unlimited authorized, $.01 par value) | 1,965,111 | ||||||
| Net Asset Value Per Share | $ | 9.16 | |||||
| Class C Shares: | |||||||
| Net Assets | $ | 3,328,426 | |||||
| Shares Outstanding (unlimited authorized, $.01 par value) | 362,683 | ||||||
| Net Asset Value Per Share | $ | 9.18 | |||||
| Class D Shares: | |||||||
| Net Assets | $ | 857,542 | |||||
| Shares Outstanding (unlimited authorized, $.01 par value) | 93,888 | ||||||
| Net Asset Value Per Share | $ | 9.13 | |||||
See Notes to Financial Statements
23
Morgan Stanley Income Trust
Financial Statements continued
Statement of Operations
For the year ended August 31, 2007
| Net Investment Income: Income | |||||||
| Interest | $ | 2,699,016 | |||||
| Dividends from affiliate | 24,239 | ||||||
| Income from securities loaned - net | 8,455 | ||||||
| Total Income | 2,731,710 | ||||||
| Expenses | |||||||
| Investment advisory fee | 214,331 | ||||||
| Distribution fee (Class A shares) | 64,667 | ||||||
| Distribution fee (Class B shares) | 174,052 | ||||||
| Distribution fee (Class C shares) | 30,299 | ||||||
| Shareholder reports and notices | 81,664 | ||||||
| Transfer agent fees and expenses | 73,338 | ||||||
| Professional fees | 67,204 | ||||||
| Registration fees | 54,119 | ||||||
| Administration fee | 40,825 | ||||||
| Custodian fees | 29,546 | ||||||
| Trustees' fees and expenses | 5,622 | ||||||
| Other | 23,360 | ||||||
| Total Expenses | 859,027 | ||||||
| Less: amounts waived/reimbursed | (181,596 | ) | |||||
| Less: expense offset | (453 | ) | |||||
| Net Expenses | 676,978 | ||||||
| Net Investment Income | 2,054,732 | ||||||
| Net Realized and Unrealized Gain (Loss): Net Realized Gain (Loss) on: | |||||||
| Investments | (228,705 | ) | |||||
| Futures contracts | (259,169 | ) | |||||
| Swap contracts | (209,670 | ) | |||||
| Foreign exchange transactions | 3,670 | ||||||
| Net Realized Loss | (693,874 | ) | |||||
| Net Change in Unrealized Appreciation/Depreciation on: | |||||||
| Investments | 290,015 | ||||||
| Futures contracts | (94,959 | ) | |||||
| Swap contracts | 314,824 | ||||||
| Translation of other assets and liabilities denominated in foreign curencies | (52 | ) | |||||
| Net Change in Unrealized Appreciation/Depreciation | 509,828 | ||||||
| Net Loss | (184,046 | ) | |||||
| Net Increase | $ | 1,870,686 | |||||
See Notes to Financial Statements
24
Morgan Stanley Income Trust
Financial Statements continued
Statements of Changes in Net Assets
| FOR THE YEAR ENDED AUGUST 31, 2007 | FOR THE YEAR ENDED AUGUST 31, 2006 | ||||||||||
| Increase (Decrease) in Net Assets: | |||||||||||
| Operations: | |||||||||||
| Net investment income | $ | 2,054,732 | $ | 2,478,624 | |||||||
| Net realized loss | (693,874 | ) | (548,116 | ) | |||||||
| Net change in unrealized appreciation/depreciation | 509,828 | (1,912,952 | ) | ||||||||
| Net Increase | 1,870,686 | 17,556 | |||||||||
| Dividends to Shareholders from Net Investment Income: | |||||||||||
| Class A shares | (1,218,023 | ) | (1,351,335 | ) | |||||||
| Class B shares | (833,233 | ) | (1,148,059 | ) | |||||||
| Class C shares | (145,780 | ) | (195,369 | ) | |||||||
| Class D shares | (44,560 | ) | (87,255 | ) | |||||||
| Total Dividends | (2,241,596 | ) | (2,782,018 | ) | |||||||
| Net decrease from transactions in shares of beneficial interest | (8,553,977 | ) | (19,844,812 | ) | |||||||
| Net Decrease | (8,924,887 | ) | (22,609,274 | ) | |||||||
| Net Assets: | |||||||||||
| Beginning of period | 56,078,149 | 78,687,423 | |||||||||
| End of Period (Including dividends in excess of net investment income of $399,766 and $468,099, respectively) | $ | 47,153,262 | $ | 56,078,149 | |||||||
See Notes to Financial Statements
25
Morgan Stanley Income Trust
Notes to Financial Statements n August 31, 2007
1. Organization and Accounting Policies
Morgan Stanley Income Trust (the "Fund") is registered under the Investment Company Act of 1940, as amended (the "Act"), as a diversified, open-end management investment company. The Fund's investment objective is high current income consistent with safety of principal. The Fund was organized as a Massachusetts business trust on September 1, 1988 and commenced operations on May 3, 1989. On July 28, 1997, the Fund converted to a multiple class share structure.
The Fund offers Class A shares, Class B shares, Class C shares and Class D shares. The four classes are substantially the same except that most Class A shares are subject to a sales charge imposed at the time of purchase and some Class A shares, and most Class B shares and Class C shares are subject to a contingent deferred sales charge imposed on shares redeemed within eighteen months, six years and one year, respectively. Class D shares are not subject to a sales charge. Additionally, Class A shares, Class B shares and Class C shares incur distribution expenses.
The Fund will assess a 2% redemption fee, on Class A shares, Class B shares, Class C shares, and Class D shares, which is paid directly to the Fund, for shares redeemed or exchanged within seven days of purchase, subject to certain exceptions. The redemption fee is designed to protect the Fund and its remaining shareholders from the effects of short-term trading.
The following is a summary of significant accounting policies:
A. Valuation of Investments — (1) certain portfolio securities may be valued by an outside pricing service approved by the Fund's Trustees; (2) portfolio securities for which over-the-counter market quotations are readily available are valued at the mean between the last reported bid and asked price; (3) futures are valued at the latest price published by the commodities exchange on which they trade; (4) credit default/interest rate swaps are marked-to-market daily based upon quotations from market markers and the change, if any, is recorded as unrealized appreciation or depreciation in the Statement of Operations; (5) when market quotations are not readily available including circumstances under which Morgan Stanley Investment Advisors Inc. (the "Investment Adviser") determines that the market quotations are not reflective of a security's market value, portfolio securities are valued at their fair value as determined in go od faith under procedures established by and under the general supervision of the Fund's Trustees; (6) investments in open-end mutual funds, including the Morgan Stanley Institutional Liquidity Funds, are valued at the net asset value as of the close of each business day; and (7) short-term debt securities having a maturity date of more than sixty days at time of purchase are valued on a mark-to-market basis until sixty days prior to maturity and thereafter at amortized cost based on their value on the 61st day. Short-term debt securities having a maturity date of sixty days or less at the time of purchase are valued at amortized cost.
26
Morgan Stanley Income Trust
Notes to Financial Statements n August 31, 2007 continued
B. Accounting for Investments — Security transactions are accounted for on the trade date (date the order to buy or sell is executed). Realized gains and losses on security transactions are determined by the identified cost method. Discounts are accreted and premiums are amortized over the life of the respective securities and are included in interest income. Interest income is accrued daily.
C. Multiple Class Allocations — Investment income, expenses (other than distribution fees), and realized and unrealized gains and losses are allocated to each class of shares based upon the relative net asset value on the date such items are recognized. Distribution fees are charged directly to the respective class.
D. Foreign Currency Translation and Forward Foreign Currency Contracts — The books and records of the Fund are maintained in U.S. dollars as follows: (1) the foreign currency market value of investment securities, other assets and liabilities and forward foreign currency contracts ("forward contracts") are translated at the exchange rates prevailing at the end of the period; and (2) purchases, sales, income and expenses are translated at the exchange rates prevailing on the respective dates of such transactions. The resultant exchange gains and losses are recorded as realized and unrealized gain/loss on foreign exchange transactions. Pursuant to U.S. federal income tax regulations, certain foreign exchange gains/losses included in realized and unrealized gain/loss are included in or are a reduction of ordinary income for federal income tax purposes. The Fund does not isolate that portion of the results of operations arising as a result of changes in the foreign exchange rates from the changes in the market prices of the securities. Forward contracts are valued daily at the appropriate exchange rates. The resultant unrealized exchange gains and losses are recorded as unrealized foreign currency gain or loss. The Fund records realized gains or losses on delivery of the currency or at the time the forward contract is extinguished (compensated) by entering into a closing transaction prior to delivery.
E. Futures Contracts — A futures contract is an agreement between two parties to buy and sell financial instruments or contracts based on financial indices at a set price on a future date. Upon entering into such a contract, the Fund is required to pledge to the broker cash, U.S. Government securities or other liquid portfolio securities equal to the minimum initial margin requirements of the applicable futures exchange. Pursuant to the contract, the Fund agrees to receive from or pay to the broker an amount of cash equal to the daily fluctuation in the value of the contract. Such receipts or payments known as variation margin are recorded by the Fund as unrealized gains and losses. Upon closing of the contract, the Fund realizes a gain or loss equal to the difference between the value of the contract at the time it was opened and the value at the time it was closed.
F. Credit Default Swaps — A credit default swap is an agreement between two parties to exchange the credit risk of an issuer. The Fund may purchase credit protection on the referenced obligation of the credit default swap ("Buy Contract"), or provide credit protection on the referenced obligation of the credit default swap ("Sale Contract"). A buyer of a credit default swap is said to buy protection by
27
Morgan Stanley Income Trust
Notes to Financial Statements n August 31, 2007 continued
paying periodic fees in return for a contingent payment from the seller if the issuer has a credit event such as bankruptcy, or a failure to pay outstanding obligations while the swap is outstanding. A seller of a credit default swap is said to sell protection and thus collects the periodic fees and profits if the credit of the issuer remains stable or improves while the swap is outstanding. If a credit event occurs, the seller pays to the buyer an agreed amount, which approximates the notional amount of the swap as disclosed in the table following the Portfolio of Investments. During the term of the swap agreement, the Fund receives or pays periodic fixed payments from or to the respective counterparty calculated at the agreed upon interest rate applied to the notional amount. These periodic payments are accrued daily and recorded as realized gains or losses in the Statement of Operations. In addition, upon termination of the s wap contract, gains and losses are also realized. Any upfront payment received or paid by the Fund is recorded as assets/liabilities on the Fund's books.
G. Interest Rate Swaps — Interest rate swaps involve the exchange of commitments to pay and receive interest based on notional principal amount. Net periodic interest payments to be received or paid are accrued daily and are recorded as realized gains or losses in the Statement of Operations.
H. Securities Lending — Fund may lend securities to qualified financial institutions, such as broker-dealers, to earn additional income. Any increase or decrease in the fair value of the securities loaned that might occur and any interest earned or dividends declared on those securities during the term of the loan would remain in the Fund. The Fund receives cash or securities as collateral in an amount equal to or exceeding 100% of the current fair value of the loaned securities. The collateral is marked-to-market daily, by the securities lending agent, to ensure that a minimum of 100% collateral coverage is maintained.
Based on pre-established guidelines, the securities lending agent invests any cash collateral that is received in high-quality short-term investments. Securities lending income is generated from the earnings on the invested collateral and borrowing fees, less any rebates owed to the borrowers and compensation to the lending agent.
The value of loaned securities and related collateral outstanding at August 31, 2007 were $9,892,433 and $10,139,043, respectively. The Fund received cash collateral which was subsequently invested in The Bank of New York Institutional Cash Reserve Fund as reported in the Portfolio of Investments. The Fund has the right under the lending agreement to recover the securities from the borrower on demand.
I. Federal Income Tax Policy — It is the Fund's policy to comply with the requirements of the Internal Revenue Code applicable to regulated investment companies and to distribute substantially all of its taxable income to its shareholders. Accordingly, no federal income tax provision is required.
28
Morgan Stanley Income Trust
Notes to Financial Statements n August 31, 2007 continued
J. Dividends and Distributions to Shareholders — Dividends and distributions to shareholders are recorded on the ex-dividend date.
K. Use of Estimates — The preparation of financial statements in accordance with generally accepted accounting principles requires management to make estimates and assumptions that affect the reported amounts and disclosures. Actual results could differ from those estimates.
2. Investment Advisory/Administration Agreements
Pursuant to an Investment Advisory Agreement with the Investment Adviser, the Fund pays the Investment Adviser an advisory fee, accrued daily and payable monthly, by applying the following annual rates to the net assets of the Fund determined as of the close of each business day: 0.42% to the portion of the daily net assets not exceeding $500 million; 0.35% to the portion of the daily net assets exceeding $500 million but not exceeding $1.25 billion; and 0.22% to the portion of the daily net assets exceeding $1.25 billion.
Pursuant to an Administration Agreement with Morgan Stanley Services Company Inc. (the "Administrator"), an affiliate of the Investment Adviser, the Fund pays an administration fee, accrued daily and payable monthly, by applying the annual rate of 0.08% to the Fund's daily net assets.
The Investment Adviser has agreed to cap the Fund's operating expenses (except for brokerage and 12b-1 fees) by assuming the Fund's "other expenses" and/or waiving the Fund's advisory fees, and the Administrator has agreed to waive the Fund's administrative fees, to the extent such operating expenses on an annualized basis exceed 0.80% of the average daily net assets of the Fund.
3. Plan of Distribution
Shares of the Fund are distributed by Morgan Stanley Distributors Inc. (the "Distributor"), an affiliate of the Investment Adviser and Administrator. The Fund has adopted a Plan of Distribution (the "Plan") pursuant to Rule 12b-1 under the Act. The Plan provides that the Fund will pay the Distributor a fee which is accrued daily and paid monthly at the following annual rates: (i) Class A — up to 0.25% of the average daily net assets of Class A shares; (ii) Class B — up to 0.85% of the lesser of: (a) the average daily aggregate gross sales of the Class B shares since the inception of the Fund (not including reinvestment of dividend or capital gain distributions) less the average daily aggregate net asset value of the Class B shares redeemed since the Fund's inception upon which a contingent deferred sales charge has been imposed or waived; or (b) the average daily net assets of Class B shares; and (iii) Class C — u p to 0.85% of the average daily net assets of Class C shares.
In the case of Class B shares, provided that the Plan continues in effect, any cumulative expenses incurred by the Distributor but not yet recovered may be recovered through the payment of future
29
Morgan Stanley Income Trust
Notes to Financial Statements n August 31, 2007 continued
distribution fees from the Fund pursuant to the Plan and contingent deferred sales charges paid by investors upon redemption of Class B shares. Although there is no legal obligation for the Fund to pay expenses incurred in excess of payments made to the Distributor under the Plan and the proceeds of contingent deferred sales charges paid by investors upon redemption of shares, if for any reason the Plan is terminated, the Trustees will consider at that time the manner in which to treat such expenses. The Distributor has advised the Fund that such excess amounts totaled $4,102,384 at August 31, 2007.
In the case of Class A shares and Class C shares, expenses incurred pursuant to the Plan in any calendar year in excess of 0.25% or 0.85% of the average daily net assets of Class A or Class C, respectively, will not be reimbursed by the Fund through payments in any subsequent year, except that expenses representing a gross sales credit to Morgan Stanley Financial Advisors and other authorized financial representatives at the time of sale may be reimbursed in the subsequent calendar year. For the year ended August 31, 2007, the distribution fee was accrued for Class A shares and Class C shares at the annual rate of 0.25% and 0.85%, respectively.
The Distributor has informed the Fund that for the year ended August 31, 2007, it received contingent deferred sales charges from certain redemptions of the Fund's Class B shares and Class C shares of $46,806 and $578, respectively and received $8,928 in front-end sales charges from sales of the Fund's Class A shares. The respective shareholders pay such charges which are not an expense of the Fund.
4. Security Transactions and Transactions with Affiliates
The Fund invests in Morgan Stanley Institutional Liquidity Money Market Portfolio — Institutional Class, an open-end management investment company managed by the Investment Adviser. Investment advisory fees paid by the Fund are reduced by an amount equal to the advisory and administrative services fees paid by Morgan Stanley Institutional Liquidity Money Market Portfolio — Institutional Class with respect to assets invested by the Fund in Morgan Stanley Institutional Liquidity Money Market Portfolio — Institutional Class. For the year ended August 31, 2007, advisory fees paid were reduced by $291 relating to the Fund's investment in Morgan Stanley Institutional Liquidity Money Market Portfolio — Institutional Class. Income distributions earned by the Fund are recorded as dividends from affiliate in the Statement of Operations and totaled $24,239 for the year ended August 31, 2007. During the year ended August 31, 2007, cost of purchases and sales in investments in Morgan Stanley Institutional Liquidity Money Market Portfolio — Institutional Class aggregated $10,479,536 and $10,026,465, respectively.
The cost of purchases and proceeds from sales/prepayments/maturities of portfolio securities, excluding short-term investments, for the year ended August 31, 2007, aggregated $30,213,347, and $27,881,603, respectively. Included in the aforementioned are purchases and sales/prepayments/maturities of U.S. Government securities of $11,506,601 and $8,838,428, respectively.
30
Morgan Stanley Income Trust
Notes to Financial Statements n August 31, 2007 continued
Morgan Stanley Trust, an affiliate of the Investment Adviser, Administrator and Distributor, is the Fund's transfer agent.
The Fund has an unfunded noncontributory defined benefit pension plan covering certain independent Trustees of the Fund who will have served as independent Trustees for at least five years at the time of retirement. Benefits under this plan are based on factors which include years of service and compensation. The Trustees voted to close the plan to new participants and eliminate the future benefits growth due to increases to compensation after July 31, 2003. Aggregate pension costs for the year ended August 31 2007, included in Trustees' fees and expenses in the Statement of Operations amounted to $4,158. At August 31 2007, the Fund had an accrued pension liability of $61,212 which is included in accrued expenses in the Statement of Assets and Liabilities.
The Fund has an unfunded Deferred Compensation Plan (the "Compensation Plan") which allows each independent Trustee to defer payment of all, or a portion, of the fees he or she receives for serving on the Board of Trustees. Each eligible Trustee generally may elect to have the deferred amounts credited with a return equal to the total return on one or more of the Morgan Stanley funds that are offered as investment options under the Compensation Plan. Appreciation/depreciation and distributions received from these investments are recorded with an offsetting increase/decrease in the deferred compensation obligation and do not affect the net asset value of the Fund.
31
Morgan Stanley Income Trust
Notes to Financial Statements n August 31, 2007 continued
5. Shares of Beneficial Interest
Transactions in shares of beneficial interest were as follows:
| FOR THE YEAR ENDED AUGUST 31, 2007 | FOR THE YEAR ENDED AUGUST 31, 2006 | ||||||||||||||||||
| SHARES | AMOUNT | SHARES | AMOUNT | ||||||||||||||||
| CLASS A SHARES | |||||||||||||||||||
| Sold | 265,232 | $ | 2,483,248 | 156,715 | $ | 1,466,141 | |||||||||||||
| Conversion from Class B | 160,863 | 1,501,162 | 190,685 | 1,777,314 | |||||||||||||||
| Reinvestment of dividends | 83,493 | 779,235 | 94,149 | 875,029 | |||||||||||||||
| Redeemed | (753,329 | ) | (7,029,452 | ) | (814,473 | ) | (7,559,395 | ) | |||||||||||
| Net decrease — Class A | (243,741 | ) | (2,265,807 | ) | (372,924 | ) | (3,440,911 | ) | |||||||||||
| CLASS B SHARES | |||||||||||||||||||
| Sold | 299,278 | 2,773,805 | 208,457 | 1,938,867 | |||||||||||||||
| Conversion to Class A | (162,203 | ) | (1,501,162 | ) | (192,286 | ) | (1,777,314 | ) | |||||||||||
| Reinvestment of dividends | 60,340 | 558,593 | 83,528 | 770,628 | |||||||||||||||
| Redeemed | (788,570 | ) | (7,310,646 | ) | (1,277,420 | ) | (11,801,546 | ) | |||||||||||
| Net decrease — Class B | (591,155 | ) | (5,479,410 | ) | (1,177,721 | ) | (10,869,365 | ) | |||||||||||
| CLASS C SHARES | |||||||||||||||||||
| Sold | 67,236 | 625,030 | 32,134 | 297,455 | |||||||||||||||
| Reinvestment of dividends | 11,261 | 104,464 | 16,168 | 149,433 | |||||||||||||||
| Redeemed | (146,605 | ) | (1,364,622 | ) | (265,696 | ) | (2,463,606 | ) | |||||||||||
| Net decrease — Class C | (68,108 | ) | (635,128 | ) | (217,394 | ) | (2,016,718 | ) | |||||||||||
| CLASS D SHARES | |||||||||||||||||||
| Sold | 9,782 | 90,375 | 19,239 | 177,050 | |||||||||||||||
| Reinvestment of dividends | 3,483 | 32,144 | 6,396 | 59,077 | |||||||||||||||
| Redeemed | (31,969 | ) | (296,151 | ) | (405,325 | ) | (3,753,945 | ) | |||||||||||
| Net decrease — Class D | (18,704 | ) | (173,632 | ) | (379,690 | ) | (3,517,818 | ) | |||||||||||
| Net decrease in Fund | (921,708 | ) | $ | (8,553,977 | ) | (2,147,729 | ) | $ | (19,844,812 | ) | |||||||||
6. Federal Income Tax Status
The amount of dividends and distributions from net investment income and net realized capital gains are determined in accordance with federal income tax regulations which may differ from generally accepted accounting principles. These "book/tax" differences are either considered temporary or permanent in nature. To the extent these differences are permanent in nature, such amounts are reclassified within the capital accounts based on their federal tax-basis treatment; temporary differences do not require reclassification. Dividends and distributions which exceed net investment income and net realized capital gains for tax purposes are reported as distributions of paid-in-capital.
32
Morgan Stanley Income Trust
Notes to Financial Statements n August 31, 2007 continued
The tax character of distributions paid was as follows:
| FOR THE YEAR ENDED AUGUST 31, 2007 | FOR THE YEAR ENDED AUGUST 31, 2006 | ||||||||||
| Ordinary income | $ | 2,243,259 | $ | 2,786,370 | |||||||
| As of August 31, 2007, the tax-basis components of accumulated losses were as follows: | |||||||||||
| Undistributed ordinary income | $ | 49,040 | |||||||||
| Undistributed long-term gains | — | ||||||||||
| Net accumulated earnings | 49,040 | ||||||||||
| Capital loss carryforward* | (6,981,778 | ) | |||||||||
| Post-October losses | (990,901 | ) | |||||||||
| Temporary differences | (73,204 | ) | |||||||||
| Net unrealized depreciation | (582,853 | ) | |||||||||
| Total accumulated losses | $ | (8,579,696 | ) | ||||||||
*As of August 31, 2007, the Fund had a net capital loss carryforward of $6,981,778 of which $1,146,203 will expire on August 31, 2008, $2,891,735 will expire on August 31, 2009, $313,469 will expire on August 31, 2010, $1,513,272 will expire on August 31, 2012, $226,730 will expire on August 31, 2014 and $890,369 will expire on August 31, 2015 to offset future capital gains to the extent provided by regulations.
As of August 31, 2007, the Fund had temporary book/tax differences primarily attributable to post-October losses (capital losses incurred after October 31 within the taxable year which are deemed to arise on the first business day of the Fund's next taxable year), mark-to-market of open futures contracts, capital loss deferrals on straddles and book amortization of premiums on debt securities.
Permanent differences, primarily due to losses on paydowns and swaps and tax adjustments on debt securities sold by the Fund, resulted in the following reclassifications among the Fund's components of net assets at August 31, 2007:
| DIVIDENDS IN EXCESS OF NET INVESTMENT INCOME | ACCUMULATED NET REALIZED LOSS | PAID-IN-CAPITAL | |||||||||
| $ | 255,197 | $ | (254,505 | ) | $ | (692 | ) | ||||
7. Expense Offset
The expense offset represents a reduction of the fees and expenses for interest earned on cash balances maintained by the Fund with the transfer agent.
33
Morgan Stanley Income Trust
Notes to Financial Statements n August 31, 2007 continued
8. Purposes of and Risks Relating to Certain Financial Instruments
The Fund may enter into forward contracts for many purposes, including to facilitate settlement of foreign currency denominated portfolio transactions or to manage foreign currency exposure associated with foreign currency denominated securities.
To hedge against adverse interest rate, foreign currency and market risks, the Fund may purchase and sell interest rate, currency and index futures contracts ("futures contract").
Forward contracts and futures contracts involve elements of market risk in excess of the amount reflected in the Statement of Assets and Liabilities. The Fund bears the risk of an unfavorable change in the underlying securities or currencies. Risks may also arise upon entering into these contracts from the potential inability of the counterparties to meet the terms of their contracts.
The Fund may enter into credit default swaps for hedging purposes to add leverage to its portfolio or to gain exposure to credit in which the Fund may otherwise invest. Credit default swaps may involve greater risks than if a Fund had invested in the issuer directly. Credit default swaps are subject to general market risk, counterparty risk and credit risk. If the Fund is a buyer and no credit event occurs, it will lose its investment. In addition, if the Fund is a seller and a credit event occurs, the value of the referenced obligation received by the Fund coupled with the periodic payments previously received may be less than the maximum payout amount it pays to the buyer, resulting in a loss to the Fund.
The Fund may enter into interest rate swaps and may purchase or sell interest rate caps, floors and collars. The Fund expects to enter into these transactions primarily to manage interest rate risk, hedge portfolio positions and preserve a return or spread on a particular investment or portion of its portfolio. The Fund may also enter into these transactions to protect against any increase in the price of securities the Fund anticipates purchasing at a later date. Interest rate swap transactions are subject to market risk, risk of default by the other party to the transaction, risk of imperfect correlation and manager risk. Such risks may exceed the related amounts shown in the Statement of Assets and Liabilities.
The Fund may lend securities to qualified institutions, such as broker-dealers, to earn additional income. Risks in securities lending transactions are that a borrower may not provide additional collateral when required or return the securities when due, and that the value of the short-term investments will be less than the amount of cash collateral plus any rebate that is required to be returned to the borrower.
9. Accounting Pronouncements
In July 2006, the Financial Accounting Standards Board (FASB) issued Interpretation 48, Accounting for Uncertainty in Income Taxes — an interpretation of FASB Statement 109 (FIN 48). FIN 48 clarifies the accounting for income taxes by prescribing the minimum recognition threshold a tax position must
34
Morgan Stanley Income Trust
Notes to Financial Statements n August 31, 2007 continued
meet before being recognized in the financial statements. FIN 48 is effective for fiscal years beginning after December 15, 2006 and is to be applied to all open tax years as of the effective date. The impact to the Fund's financial statements, if any is currently being assessed.
In addition, in September 2006, Statement of Financial Accounting Standards No. 157, Fair Value Measurements (SFAS 157), was issued and is effective for fiscal years beginning after November 15, 2007. SFAS 157 defines fair value, establishes a framework for measuring fair value and expands disclosures about fair value measurements. Management is currently evaluating the impact the adoption of SFAS 157 will have on the Trust's financial statement disclosures.
35
Morgan Stanley Income Trust
Financial Highlights
Selected ratios and per share data for a share of beneficial interest outstanding throughout each period:
| FOR THE YEAR ENDED AUGUST 31, | |||||||||||||||||||||||
| 2007 | 2006 | 2005 | 2004 | 2003 | |||||||||||||||||||
| Class A Shares | |||||||||||||||||||||||
| Selected Per Share Data: | |||||||||||||||||||||||
| Net asset value, beginning of period | $ | 9.31 | $ | 9.65 | $ | 9.56 | $ | 9.39 | $ | 9.53 | |||||||||||||
| Income (loss) from investment operations: | |||||||||||||||||||||||
| Net investment income | 0.39 | 0.40 | 0.38 | 0.35 | 0.20 | ||||||||||||||||||
| Net realized and unrealized gain (loss) | (0.02 | ) | (0.31 | ) | 0.16 | 0.26 | 0.01 | ||||||||||||||||
| Total income from investment operations | 0.37 | 0.09 | 0.54 | 0.61 | 0.21 | ||||||||||||||||||
| Less dividends from net investment income | (0.44 | ) | (0.43 | ) | (0.45 | ) | (0.44 | ) | (0.35 | ) | |||||||||||||
| Net asset value, end of period | $ | 9.24 | $ | 9.31 | $ | 9.65 | $ | 9.56 | $ | 9.39 | |||||||||||||
| Total Return† | 3.99 | % | 1.01 | % | 5.81 | % | 6.57 | % | 2.17 | % | |||||||||||||
| Ratios to Average Net Assets(1): | |||||||||||||||||||||||
| Total expenses (before expense offset) | 1.05 | %(2)(3) | 1.05 | %(3) | 1.03 | %(3) | 1.19 | %(3) | 1.14 | % | |||||||||||||
| Net investment income | 4.30 | %(2)(3) | 4.12 | %(3) | 4.08 | %(3) | 3.86 | %(3) | 2.14 | % | |||||||||||||
| Supplemental Data: | |||||||||||||||||||||||
| Net assets, end of period, in thousands | $ | 24,967 | $ | 27,445 | $ | 32,038 | $ | 7,628 | $ | 9,636 | |||||||||||||
| Portfolio turnover rate | 68 | % | 28 | % | 46 | % | 164 | % | 429 | % | |||||||||||||
† Does not reflect the deduction of sales charge. Calculated based on the net asset value as of the last business day of the period.
(1) Reflects overall Fund ratios for investment income and non-class specific expenses.
(2) Reflects waivers of certain Fund expenses in connection with the investments in Morgan Stanley Institutional Liquidity Money Market
Portfolio - Institutional Class during the period. As a result of such waivers the expenses as a percentage of its net assets had an effect of less than 0.005%.
(3) If the Fund had borne all expenses that were waived by the Investment Adviser and Administrator, the annualized expense and net investment income ratios, before expense offset, would have been as follows:
| PERIOD ENDED | EXPENSE RATIO | NET INVESTMENT INCOME RATIO | |||||||||
| August 31, 2007 | 1.40 | % | 3.95 | % | |||||||
| August 31, 2006 | 1.35 | 3.82 | |||||||||
| August 31, 2005 | 1.18 | 3.93 | |||||||||
| August 31, 2004 | 1.24 | 3.81 | |||||||||
See Notes to Financial Statements
36
Morgan Stanley Income Trust
Financial Highlights continued
| FOR THE YEAR ENDED AUGUST 31, | |||||||||||||||||||||||
| 2007 | 2006 | 2005 | 2004 | 2003 | |||||||||||||||||||
| Class B Shares | |||||||||||||||||||||||
| Selected Per Share Data: | |||||||||||||||||||||||
| Net asset value, beginning of period | $ | 9.24 | $ | 9.57 | $ | 9.48 | $ | 9.32 | $ | 9.45 | |||||||||||||
| Income (loss) from investment operations: | |||||||||||||||||||||||
| Net investment income | 0.33 | 0.37 | 0.31 | 0.29 | 0.14 | ||||||||||||||||||
| Net realized and unrealized gain (loss) | (0.03 | ) | (0.33 | ) | 0.16 | 0.24 | 0.02 | ||||||||||||||||
| Total income from investment operations | 0.30 | 0.04 | 0.47 | 0.53 | 0.16 | ||||||||||||||||||
| Less dividends from net investment income | (0.38 | ) | (0.37 | ) | (0.38 | ) | (0.37 | ) | (0.29 | ) | |||||||||||||
| Net asset value, end of period | $ | 9.16 | $ | 9.24 | $ | 9.57 | $ | 9.48 | $ | 9.32 | |||||||||||||
| Total Return† | 3.25 | % | 0.48 | % | 5.13 | % | 5.78 | % | 1.63 | % | |||||||||||||
| Ratios to Average Net Assets(1): | |||||||||||||||||||||||
| Total expenses (before expense offset) | 1.65 | %(2)(3) | 1.65 | %(3) | 1.65 | %(3) | 1.85 | %(3) | 1.79 | % | |||||||||||||
| Net investment income | 3.70 | %(2)(3) | 3.52 | %(3) | 3.46 | %(3) | 3.20 | %(3) | 1.49 | % | |||||||||||||
| Supplemental Data: | |||||||||||||||||||||||
| Net assets, end of period, in thousands | $ | 18,000 | $ | 23,610 | $ | 35,739 | $ | 73,650 | $ | 99,695 | |||||||||||||
| Portfolio turnover rate | 68 | % | 28 | % | 46 | % | 164 | % | 429 | % | |||||||||||||
† Does not reflect the deduction of sales charge. Calculated based on the net asset value as of the last business day of the period.
(1) Reflects overall Fund ratios for investment income and non-class specific expenses.
(2) Reflects waivers of certain Fund expenses in connection with the investments in Morgan Stanley Institutional Liquidity Money Market Portfolio - Institutional Class during the period. As a result of such waivers the expenses as a percentage of its net assets had an effect of less than 0.005%.
(3) If the Fund had borne all expenses that were waived by the Investment Adviser and Administrator, the annualized expense and net investment income ratios, before expense offset, would have been as follows:
| PERIOD ENDED | EXPENSE RATIO | NET INVESTMENT INCOME RATIO | |||||||||
| August 31, 2007 | 2.01 | % | 3.34 | % | |||||||
| August 31, 2006 | 1.95 | 3.22 | |||||||||
| August 31, 2005 | 1.80 | 3.31 | |||||||||
| August 31, 2004 | 1.90 | 3.15 | |||||||||
See Notes to Financial Statements
37
Morgan Stanley Income Trust
Financial Highlights continued
| FOR THE YEAR ENDED AUGUST 31, | |||||||||||||||||||||||
| 2007 | 2006 | 2005 | 2004 | 2003 | |||||||||||||||||||
| Class C Shares | |||||||||||||||||||||||
| Selected Per Share Data: | |||||||||||||||||||||||
| Net asset value, beginning of period | $ | 9.25 | $ | 9.59 | $ | 9.50 | $ | 9.34 | $ | 9.46 | |||||||||||||
| Income (loss) from investment operations: | |||||||||||||||||||||||
| Net investment income | 0.33 | 0.37 | 0.31 | 0.29 | 0.14 | ||||||||||||||||||
| Net realized and unrealized gain (loss) | (0.02 | ) | (0.34 | ) | 0.17 | 0.24 | 0.03 | ||||||||||||||||
| Total income from investment operations | 0.31 | 0.03 | 0.48 | 0.53 | 0.17 | ||||||||||||||||||
| Less dividends from net investment income | (0.38 | ) | (0.37 | ) | (0.39 | ) | (0.37 | ) | (0.29 | ) | |||||||||||||
| Net asset value, end of period | $ | 9.18 | $ | 9.25 | $ | 9.59 | $ | 9.50 | $ | 9.34 | |||||||||||||
| Total Return† | 3.37 | % | 0.42 | % | 5.16 | % | 5.77 | % | 1.74 | % | |||||||||||||
| Ratios to Average Net Assets(1): | |||||||||||||||||||||||
| Total expenses (before expense offset) | 1.65 | %(2)(3) | 1.61 | %(3) | 1.62 | %(3) | 1.85 | %(3) | 1.79 | % | |||||||||||||
| Net investment income | 3.70 | %(2)(3) | 3.56 | %(3) | 3.49 | %(3) | 3.20 | %(3) | 1.49 | % | |||||||||||||
| Supplemental Data: | |||||||||||||||||||||||
| Net assets, end of period, in thousands | $ | 3,328 | $ | 3,986 | $ | 6,215 | $ | 7,474 | $ | 10,389 | |||||||||||||
| Portfolio turnover rate | 68 | % | 28 | % | 46 | % | 164 | % | 429 | % | |||||||||||||
† Does not reflect the deduction of sales charge. Calculated based on the net asset value as of the last business day of the period.
(1) Reflects overall Fund ratios for investment income and non-class specific expenses.
(2) Reflects waivers of certain Fund expenses in connection with the investments in Morgan Stanley Institutional Liquidity Money Market Portfolio - Institutional Class during the period. As a result of such waivers the expenses as a percentage of its net assets had an effect of less than 0.005%.
(3) If the Fund had borne all expenses that were waived by the Investment Adviser and Administrator, the annualized expense and net investment income ratios, before expense offset, would have been as follows:
| PERIOD ENDED | EXPENSE RATIO | NET INVESTMENT INCOME RATIO | |||||||||
| August 31, 2007 | 2.00 | % | 3.35 | % | |||||||
| August 31, 2006 | 1.91 | 3.26 | |||||||||
| August 31, 2005 | 1.77 | 3.34 | |||||||||
| August 31, 2004 | 1.90 | 3.15 | |||||||||
See Notes to Financial Statements
38
Morgan Stanley Income Trust
Financial Highlights continued
| FOR THE YEAR ENDED AUGUST 31, | |||||||||||||||||||||||
| 2007 | 2006 | 2005 | 2004 | 2003 | |||||||||||||||||||
| Class D Shares | |||||||||||||||||||||||
| Selected Per Share Data: | |||||||||||||||||||||||
| Net asset value, beginning of period | $ | 9.21 | $ | 9.54 | $ | 9.45 | $ | 9.29 | $ | 9.43 | |||||||||||||
| Income (loss) from investment operations: | |||||||||||||||||||||||
| Net investment income | 0.40 | 0.43 | 0.39 | 0.37 | 0.22 | ||||||||||||||||||
| Net realized and unrealized gain (loss) | (0.03 | ) | (0.31 | ) | 0.16 | 0.24 | 0.01 | ||||||||||||||||
| Total income from investment operations | 0.37 | 0.12 | 0.55 | 0.61 | 0.23 | ||||||||||||||||||
| Less dividends from net investment income | (0.45 | ) | (0.45 | ) | (0.46 | ) | (0.45 | ) | (0.37 | ) | |||||||||||||
| Net asset value, end of period | $ | 9.13 | $ | 9.21 | $ | 9.54 | $ | 9.45 | $ | 9.29 | |||||||||||||
| Total Return† | 4.12 | % | 1.33 | % | 6.03 | % | 6.68 | % | 2.39 | % | |||||||||||||
| Ratios to Average Net Assets(1): | |||||||||||||||||||||||
| Total expenses (before expense offset) | 0.80 | %(2)(3) | 0.80 | %(3) | 0.80 | %(3) | 1.00 | %(3) | 0.94 | % | |||||||||||||
| Net investment income | 4.55 | %(2)(3) | 4.37 | %(3) | 4.31 | %(3) | 4.05 | %(3) | 2.34 | % | |||||||||||||
| Supplemental Data: | |||||||||||||||||||||||
| Net assets, end of period, in thousands | $ | 858 | $ | 1,037 | $ | 4,695 | $ | 5,687 | $ | 7,113 | |||||||||||||
| Portfolio turnover rate | 68 | % | 28 | % | 46 | % | 164 | % | 429 | % | |||||||||||||
† Calculated based on the net asset value as of the last business day of the period.
(1) Reflects overall Fund ratios for investment income and non-class specific expenses.
(2) Reflects waivers of certain Fund expenses in connection with the investments in Morgan Stanley Institutional Liquidity Money Market Portfolio - Institutional Class during the period. As a result of such waivers the expenses as a percentage of its net assets had an effect of less than 0.005%.
(3) If the Fund had borne all expenses that were waived by the Investment Adviser and Administrator, the annualized expense and net investment income ratios, before expense offset, would have been as follows:
| PERIOD ENDED | EXPENSE RATIO | NET INVESTMENT INCOME RATIO | |||||||||
| August 31, 2007 | 1.16 | % | 4.19 | % | |||||||
| August 31, 2006 | 1.10 | 4.07 | |||||||||
| August 31, 2005 | 0.95 | 4.16 | |||||||||
| August 31, 2004 | 1.05 | 4.00 | |||||||||
See Notes to Financial Statements
39
Morgan Stanley Income Trust
Report of Independent Registered Public Accounting Firm
To the Shareholders and Board of Trustees of
Morgan Stanley Income Trust:
We have audited the accompanying statement of assets and liabilities of Morgan Stanley Income Trust (the "Fund"), including the portfolio of investments, as of August 31, 2007, and the related statements of operations for the year then ended and changes in net assets for each of the two years in the period then ended, and the financial highlights for each of the five years in the period then ended. These financial statements and financial highlights are the responsibility of the Fund's management. Our responsibility is to express an opinion on these financial statements and financial highlights based on our audits.
We conducted our audits in accordance with the standards of the Public Company Accounting Oversight Board (United States). Those standards require that we plan and perform the audit to obtain reasonable assurance about whether the financial statements and financial highlights are free of material misstatement. The Fund is not required to have, nor were we engaged to perform, an audit of its internal control over financial reporting. Our audits included consideration of internal control over financial reporting as a basis for designing audit procedures that are appropriate in the circumstances, but not for the purpose of expressing an opinion on the effectiveness of the Fund's internal control over financial reporting. Accordingly, we express no such opinion. An audit also includes examining, on a test basis, evidence supporting the amounts and disclosures in the financial statements, assessing the accounting principles used and significant estimates made by management, as well as evaluating the overall financial statement presentation. Our procedures included confirmation of securities owned as of August 31, 2007, by correspondence with the custodian and brokers; where replies were not received from brokers, we performed other auditing procedures. We believe that our audits provide a reasonable basis for our opinion.
In our opinion, the financial statements and financial highlights referred to above present fairly, in all material respects, the financial position of Morgan Stanley Income Trust as of August 31, 2007, the results of its operations for the year then ended, the changes in its net assets for each of the two years in the period then ended, and the financial highlights for each of the five years in the period then ended, in conformity with accounting principles generally accepted in the United States of America.
Deloitte & Touche LLP
New York, New York
October 22, 2007
40
Morgan Stanley Income Trust
Trustee and Officer Information (unaudited)
Independent Trustees:
| Name, Age and Address of Independent Trustee | Position(s) Held with Registrant | Term of Office and Length of Time Served* | Principal Occupation(s) During Past 5 Years | Number of Portfolios in Fund Complex Overseen by Independent Trustee** | Other Directorships Held by Independent Trustee | ||||||||||||||||||
| Frank L. Bowman (62) c/o Kramer Levin Naftalis & Frankel LLP Counsel to the Independent Trustees 1177 Avenue of the Americas New York, NY 10036 | Trustee | Since August 2006 | President and Chief Executive Officer, Nuclear Energy Institute (policy organization) (since February 2005); Director or Trustee of various Retail Funds and Institutional Funds (since August 2006); Chairperson of the Insurance Sub-Committee of the Valuation, Insurance and Compliance Committee (since February 2007); formerly, variously, Admiral in the U.S. Navy, Director of Naval Nuclear Propulsion Program and Deputy Administrator – Naval Reactors in the National Nuclear Security Administration at the U.S. Department of Energy (1996-2004). Honorary Knight Commander of the Most Excellent Order of the British Empire. | 171 | Director of the National Energy Foundation, the U.S. Energy Association, the American Council for Capital Formation and the Armed Services YMCA of the USA. | ||||||||||||||||||
| Michael Bozic (66) c/o Kramer Levin Naftalis & Frankel LLP Counsel to the Independent Trustees 1177 Avenue of the Americas New York, NY 10036 | Trustee | Since April 1994 | Private investor; Chairperson of the Valuation, Insurance and Compliance Committee (since October 2006); Director or Trustee of the Retail Funds (since April 1994) and the Institutional Funds (since July 2003); formerly, Chairperson of the Insurance Committee (July 2006-September 2006); Vice Chairman of Kmart Corporation (December 1998-October 2000), Chairman and Chief Executive Officer of Levitz Furniture Corporation (November 1995-November 1998) and President and Chief Executive Officer of Hills Department Stores (May 1991-July 1995); variously Chairman, Chief Executive Officer, President and Chief Operating Officer (1987-1991) of the Sears Merchandise Group of Sears, Roebuck & Co. | 173 | Director of various business organizations. | ||||||||||||||||||
41
Morgan Stanley Income Trust
Trustee and Officer Information (unaudited) continued
| Name, Age and Address of Independent Trustee | Position(s) Held with Registrant | Term of Office and Length of Time Served* | Principal Occupation(s) During Past 5 Years | Number of Portfolios in Fund Complex Overseen by Independent Trustee** | Other Directorships Held by Independent Trustee | ||||||||||||||||||
| Kathleen A. Dennis (54) c/o Kramer Levin Naftalis & Frankel LLP Counsel to the Independent Trustees 1177 Avenue of the Americas New York, NY 10036 | Trustee | Since August 2006 | President, Cedarwood Associates (mutual fund consulting) (since July 2006); Chairperson of the Money Market and Alternatives Sub-Committee of the Investment Committee (since October 2006) and Director or Trustee of various Retail Funds and Institutional Funds (since August 2006); formerly, Senior Managing Director of Victory Capital Management (1993-2006). | 171 | None. | ||||||||||||||||||
| Dr. Manuel H. Johnson (58) c/o Johnson Smick Group, Inc. 888 16th Street, N.W. Suite 740 Washington, D.C. 20006 | Trustee | Since July 1991 | Senior Partner, Johnson Smick International, Inc. (consulting firm); Chairperson of the Investment Committee (since October 2006) and Director or Trustee of the Retail Funds (since July 1991) and the Institutional Funds (since July 2003); Co-Chairman and a founder of the Group of Seven Council (G7C) (international economic commission); formerly, Chairperson of the Audit Committee (July 1991-September 2006); Vice Chairman of the Board of Governors of the Federal Reserve System and Assistant Secretary of the U.S. Treasury. | 173 | Director of NVR, Inc. (home construction); Director of Evergreen Energy. | ||||||||||||||||||
| Joseph J. Kearns (65) c/o Kearns & Associates LLC PMB754 23852 Pacific Coast Highway Malibu, CA 90265 | Trustee | Since August 1994 | President, Kearns & Associates LLC (investment consulting); Chairperson of the Audit Committee (since October 2006) and Director or Trustee of the Retail Funds (since July 2003) and the Institutional Funds (since August 1994); formerly, Deputy Chairperson of the Audit Committee (July 2003-September 2006) and Chairperson of the Audit Committee of the Institutional Funds (October 2001-July 2003); CFO of the J. Paul Getty Trust. | 174 | Director of Electro Rent Corporation (equipment leasing), The Ford Family Foundation, and the UCLA Foundation. | ||||||||||||||||||
42
Morgan Stanley Income Trust
Trustee and Officer Information (unaudited) continued
| Name, Age and Address of Independent Trustee | Position(s) Held with Registrant | Term of Office and Length of Time Served* | Principal Occupation(s) During Past 5 Years | Number of Portfolios in Fund Complex Overseen by Independent Trustee** | Other Directorships Held by Independent Trustee | ||||||||||||||||||
| Michael F. Klein (48) c/o Kramer Levin Naftalis & Frankel LLP Counsel to the Independent Trustees 1177 Avenue of the Americas New York, NY 10036 | Trustee | Since August 2006 | Managing Director, Aetos Capital, LLC (since March 2000) and Co-President, Aetos Alternatives Management, LLC (since January 2004); Chairperson of the Fixed-Income Sub-Committee of the Investment Committee (since October 2006) and Director or Trustee of various Retail Funds and Institutional Funds (since August 2006); formerly, Managing Director, Morgan Stanley & Co. Inc. and Morgan Stanley Dean Witter Investment Management, President, Morgan Stanley Institutional Funds (June 1998-March 2000) and Principal, Morgan Stanley & Co. Inc. and Morgan Stanley Dean Witter Investment Management (August 1997-December 1999). | 171 | Director of certain investment funds managed or sponsored by Aetos Capital, LLC. Director of Sanitized AG and Sanitized Marketing AG (specialty chemicals). | ||||||||||||||||||
| Michael E. Nugent (71) c/o Triumph Capital, L.P. 445 Park Avenue New York, NY 10022 | Chairperson of the Board and Trustee | Chairperson of the Boards since July 2006 and Trustee since July 1991 | General Partner, Triumph Capital, L.P. (private investment partnership); Chairperson of the Boards of the Retail Funds and Institutional Funds (since July 2006); Director or Trustee of the Retail Funds (since July 1991) and the Institutional Funds (since July 2001); formerly, Chairperson of the Insurance Committee (until July 2006); Vice President, Bankers Trust Company and BT Capital Corporation (1984-1988). | 173 | None. | ||||||||||||||||||
43
Morgan Stanley Income Trust
Trustee and Officer Information (unaudited) continued
| Name, Age and Address of Independent Trustee | Position(s) Held with Registrant | Term of Office and Length of Time Served* | Principal Occupation(s) During Past 5 Years | Number of Portfolios in Fund Complex Overseen by Independent Trustee** | Other Directorships Held by Independent Trustee | ||||||||||||||||||
| W. Allen Reed (60) c/o Kramer Levin Naftalis & Frankel LLP Counsel to the Independent Trustees 1177 Avenue of the Americas New York, NY 10036 | Trustee | Since August 2006 | Chairperson of the Equity Sub-Commitee of the Investment Committee (since October 2006) and Director or Trustee of various Retail Funds and Institutional Funds (since August 2006); formerly, President and CEO of General Motors Asset Management; Chairman and Chief Executive Officer of the GM Trust Bank and Corporate Vice President of General Motors Corporation (August 1994-December 2005). | 171 | Director of GMAC (financial services) and Temple-Inland Industries (packaging, banking and forest products); Director of Legg Mason, Inc. and Director of the Auburn University Foundation. | ||||||||||||||||||
| Fergus Reid (75) c/o Lumelite Plastics Corporation 85 Charles Colman Blvd. Pawling, NY 12564 | Trustee | Since June 1992 | Chairman of Lumelite Plastics Corporation; Chairperson of the Governance Committee and Director or Trustee of the Retail Funds (since July 2003) and the Institutional Funds (since June 1992). | 174 | Trustee and Director of certain investment companies in the JPMorgan Funds complex managed by J.P. Morgan Investment Management Inc. | ||||||||||||||||||
44
Morgan Stanley Income Trust
Trustee and Officer Information (unaudited) continued
Interested Trustee:
| Name, Age and Address of Interested Trustee | Position(s) Held with Registrant | Term of Office and Length of Time Served* | Principal Occupation(s) During Past 5 Years | Number of Portfolios in Fund Complex Overseen by Interested Trustee** | Other Directorships Held by Interested Trustee | ||||||||||||||||||
| James F. Higgins (59) c/o Morgan Stanley Trust Harborside Financial Center Plaza Two Jersey City, NJ 07311 | Trustee | Since June 2000 | Director or Trustee of the Retail Funds (since June 2000) and the Institutional Funds (since July 2003); Senior Advisor of Morgan Stanley (since August 2000). | 173 | Director of AXA Financial, Inc. and The Equitable Life Assurance Society of the United States (financial services). | ||||||||||||||||||
* This is the earliest date the Trustee began serving the funds advised by Morgan Stanley Investment Advisors Inc. (the "Investment Adviser") (the "Retail Funds") or the funds advised by Morgan Stanley Investment Management Inc. and Morgan Stanley AIP GP LP (the "Institutional Funds").
** The Fund Complex includes all open-end and closed-end funds (including all of their portfolios) advised by the Investment Adviser and any funds that have an investment adviser that is an affiliated person of the Investment Adviser (including, but not limited to, Morgan Stanley Investment Management Inc.).
45
Morgan Stanley Income Trust
Trustee and Officer Information (unaudited) continued
Executive Officers:
| Name, Age and Address of Executive Officer | Position(s) Held with Registrant | Term of Office and Length of Time Served* | Principal Occupation(s) During Past 5 Years | ||||||||||||
| Ronald E. Robison (68) 522 Fifth Avenue New York, NY 10036 | President and Principal Executive Officer | President since September 2005 and Principal Executive Officer since May 2003 | President (since September 2005) and Principal Executive Officer (since May 2003) of funds in the Fund Complex; President (since September 2005) and Principal Executive Officer (since May 2003) of the Van Kampen Funds; Managing Director, Director and/or Officer of the Investment Adviser and various entities affiliated with the Investment Adviser; Director of Morgan Stanley SICAV (since May 2004). Formerly, Executive Vice President (July 2003-September 2005) of funds in the Fund Complex and the Van Kampen Funds; President and Director of the Institutional Funds (March 2001-July 2003); Chief Administrative Officer of the Investment Adviser; Chief Administrative Officer of Morgan Stanley Services Company Inc. | ||||||||||||
| J. David Germany (53) Morgan Stanley Investment Management Limited 20 Bank Street Canary Wharf, London, England E144AD | Vice President | Since February 2006 | Managing Director and (since December 2005) Chief Investment Officer – Global Fixed Income of Morgan Stanley Investment Management; Managing Director and Director of Morgan Stanley Investment Management Limited; Vice President of the Retail Funds and Institutional Funds (since February 2006). | ||||||||||||
| Dennis F. Shea (54) 522 Fifth Avenue New York, NY 10036 | Vice President | Since February 2006 | Managing Director and (since February 2006) Chief Investment Officer – Global Equity of Morgan Stanley Investment Management; Vice President of the Retail Funds and Institutional Funds (since February 2006). Formerly, Managing Director and Director of Global Equity Research at Morgan Stanley. | ||||||||||||
| Amy R. Doberman (45) 522 Fifth Avenue New York, NY 10036 | Vice President | Since July 2004 | Managing Director and General Counsel, U.S. Investment Management of Morgan Stanley Investment Management (since July 2004); Vice President of the Retail Funds and the Institutional Funds (since July 2004); Vice President of the Van Kampen Funds (since August 2004); Secretary (since February 2006) and Managing Director (since July 2004) of the Investment Adviser and various entities affiliated with the Investment Adviser. Formerly, Managing Director and General Counsel – Americas, UBS Global Asset Management (July 2000-July 2004). | ||||||||||||
| Carsten Otto (43) 522 Fifth Avenue New York, NY 10036 | Chief Compliance Officer | Since October 2004 | Managing Director and Global Director of Compliance for Morgan Stanley Investment Management (since April 2007); Managing Director and Chief Compliance Officer of Morgan Stanley Investment Management. Formerly, U.S. Director of Compliance (October 2004-April 2007) and Assistant Secretary and Assistant General Counsel of the Retail Funds. | ||||||||||||
| Stefanie V. Chang Yu (40) 522 Fifth Avenue New York, NY 10036 | Vice President | Since December 1997 | Executive Director of the Investment Adviser and various entities affiliated with the Investment Adviser; Vice President of the Retail Funds (since July 2002) and the Institutional Funds (since December 1997). Formerly, Secretary of various entities affiliated with the Investment Adviser. | ||||||||||||
46
Morgan Stanley Income Trust
Trustee and Officer Information (unaudited) continued
| Name, Age and Address of Executive Officer | Position(s) Held with Registrant | Term of Office and Length of Time Served* | Principal Occupation(s) During Past 5 Years | ||||||||||||
| Francis J. Smith (42) c/o Morgan Stanley Trust Harborside Financial Center Plaza Two Jersey City, NJ 07311 | Treasurer and Chief Financial Officer | Treasurer since July 2003 and Chief Financial Officer since September 2002 | Executive Director of the Investment Adviser and various entities affiliated with the Investment Adviser; Treasurer and Chief Financial Officer of the Retail Funds (since July 2003). Formerly, Vice President of the Retail Funds (September 2002-July 2003). | ||||||||||||
| Mary E. Mullin (40) 522 Fifth Avenue New York, NY 10036 | Secretary | Since June 1999 | Executive Director of the Investment Adviser and various entities affiliated with the Investment Adviser; Secretary of the Retail Funds (since July 2003) and the Institutional Funds (since June 1999). | ||||||||||||
* This is the earliest date the Officer began serving the Retail Funds or the Institutional Funds.
2007 Federal Tax Notice (unaudited)
Of the Fund's ordinary dividends paid during the fiscal year ended August 31, 2007, 2.46% was attributable to qualifying Federal obligations. Please consult your tax advisor to determine if any portion of the dividends you received is exempt from state income tax.
47
Trustees
Frank L. Bowman
Michael Bozic
Kathleen A. Dennis
James F. Higgins
Dr. Manuel H. Johnson
Joseph J. Kearns
Michael F. Klein
Michael E. Nugent
W. Allen Reed
Fergus Reid
Officers
Michael E. Nugent
Chairperson of the Board
Ronald E. Robison
President and Principal Executive Officer
J. David Germany
Vice President
Dennis F. Shea
Vice President
Amy R. Doberman
Vice President
Carsten Otto
Chief Compliance Officer
Stefanie V. Chang Yu
Vice President
Francis J. Smith
Treasurer and Chief Financial Officer
Mary E. Mullin
Secretary
Transfer Agent
Morgan Stanley Trust
Harborside Financial Center, Plaza Two
Jersey City, New Jersey 07311
Independent Registered Public Accounting Firm
Deloitte & Touche LLP
Two World Financial Center
New York, New York 10281
Legal Counsel
Clifford Chance US LLP
31 West 52nd Street
New York, New York 10019
Counsel to the Independent Trustees
Kramer Levin Naftalis & Frankel LLP
1177 Avenue of the Americas
New York, New York 10036
Investment Adviser
Morgan Stanley Investment Advisors Inc.
522 Fifth Avenue
New York, New York 10036
This report is submitted for the general information of the shareholders of the Fund. For more detailed information about the Fund, its fees and expenses and other pertinent information, please read its Prospectus. The Fund's Statement of Additional Information contains additional information about the Fund, including its trustees. It is available, without charge, by calling (800) 869-NEWS.
This report is not authorized for distribution to prospective investors in the Fund unless preceded or accompanied by an effective Prospectus. Read the Prospectus carefully before investing.
Morgan Stanley Distributors Inc., member FINRA.
© 2007 Morgan Stanley

MORGAN STANLEY FUNDS
Morgan Stanley
Income Trust
Annual Report
August 31, 2007
IISANN IU07-04108P-Y08/07
![]()
Item 2. Code of Ethics.
(a) The Fund has adopted a code of ethics (the “Code of Ethics”) that applies to its principal executive officer, principal financial officer, principal accounting officer or controller, or persons performing similar functions, regardless of whether these individuals are employed by the Fund or a third party.
(b) No information need be disclosed pursuant to this paragraph.
(c) Not applicable.
(d) Not applicable.
(e) Not applicable.
(f)
(1) The Fund’s Code of Ethics is attached hereto as Exhibit 12 A.
(2) Not applicable.
(3) Not applicable.
Item 3. Audit Committee Financial Expert.
The Fund’s Board of Trustees has determined that Joseph J. Kearns, an “independent” Trustee, is an “audit committee financial expert” serving on its audit committee. Under applicable securities laws, a person who is determined to be an audit committee financial expert will not be deemed an “expert” for any purpose, including without limitation for the purposes of Section 11 of the Securities Act of 1933, as a result of being designated or identified as an audit committee financial expert. The designation or identification of a person as an audit committee financial expert does not impose on such person any duties, obligations, or liabilities that are greater than the duties, obligations, and liabilities imposed on such person as a member of the audit committee and Board of Trustees in the absence of such designation or identification
Item 4. Principal Accountant Fees and Services.
(a)(b)(c)(d) and (g). Based on fees billed for the periods shown:
2007
| Registrant |
| Covered Entities(1) |
| |||
Audit Fees |
| $ | 34,700 |
| N/A |
| |
|
|
|
|
|
| ||
Non-Audit Fees |
|
|
|
|
| ||
Audit-Related Fees |
| $ |
| (2) | $ | 5,041,000 | (2) |
Tax Fees |
| $ | 6,055 | (3) | $ | 761,000 | (4) |
All Other Fees |
| $ | — |
| $ | — |
|
Total Non-Audit Fees |
| $ | 6,055 |
| $ | 5,802,000 |
|
|
|
|
|
|
| ||
Total |
| $ | 40,755 |
| $ | 5,802,000 |
|
2006
| Registrant |
| Covered Entities(1) |
| |||
Audit Fees |
| $ | 32,666 |
| N/A |
| |
|
|
|
|
|
| ||
Non-Audit Fees |
|
|
|
|
| ||
Audit-Related Fees |
| $ |
| (2) | $ | 5,328,768 | (2) |
Tax Fees |
| $ | 540 | (3) | $ | 1,640,675 | (4) |
All Other Fees |
| $ | 6,161 |
| $ | — |
|
Total Non-Audit Fees |
| $ | 6,701 |
| $ | 6,969,443 |
|
|
|
|
|
|
| ||
Total |
| $ | 39,367 |
| $ | 6,969,443 |
|
N/A- Not applicable, as not required by Item 4. | ||
| ||
(1) |
| Covered Entities include the Adviser (excluding sub-advisors) and any entity controlling, controlled by or under common control with the Adviser that provides ongoing services to the Registrant. |
(2) |
| Audit-Related Fees represent assurance and related services provided that are reasonably related to the performance of the audit of the financial statements of the Covered Entities’ and funds advised by the Adviser or its affiliates, specifically data verification and agreed-upon procedures related to asset securitizations and agreed-upon procedures engagements. |
(3) |
| Tax Fees represent tax compliance, tax planning and tax advice services provided in connection with the preparation and review of the Registrant’s tax returns. |
(4) |
| Tax Fees represent tax compliance, tax planning and tax advice services provided in connection with the review of Covered Entities’ tax returns. |
(e)(1) The audit committee’s pre-approval policies and procedures are as follows:
APPENDIX A
AUDIT COMMITTEE
AUDIT AND NON-AUDIT SERVICES
PRE-APPROVAL POLICY AND PROCEDURES
OF THE
MORGAN STANLEY RETAIL AND INSTITUTIONAL FUNDS
AS ADOPTED AND AMENDED JULY 23, 2004,(1)
1. Statement of Principles
The Audit Committee of the Board is required to review and, in its sole discretion, pre-approve all Covered Services to be provided by the Independent Auditors to the Fund and Covered Entities in order to assure that services performed by the Independent Auditors do not impair the auditor’s independence from the Fund.
The SEC has issued rules specifying the types of services that an independent auditor may not provide to its audit client, as well as the audit committee’s administration of the engagement of the independent auditor. The SEC’s rules establish two different approaches to pre-approving services, which the SEC considers to be equally valid. Proposed services either: may be pre-approved without consideration of specific case-by-case services by the Audit Committee (“general pre-approval”); or require the specific pre-approval of the Audit Committee or its delegate (“specific pre-approval”). The Audit Committee believes that the combination of these two approaches in this Policy will result in an effective and efficient procedure to pre-approve services performed by the Independent Auditors. As set forth in this Policy, unless a type of service has received general pre-approval, it will require specific pre-approval by the Audit Committee (or by any member of the Audit Committee to which pre-approval authority has been delegated) if it is to be provided by the Independent Auditors. Any proposed services exceeding pre-approved cost levels or budgeted amounts will also require specific pre-approval by the Audit Committee.
The appendices to this Policy describe the Audit, Audit-related, Tax and All Other services that have the general pre-approval of the Audit Committee. The term of any general pre-approval is 12 months from the date of pre-approval, unless the Audit Committee considers and provides a different period and states otherwise. The Audit Committee will annually review and pre-approve the services that may be provided by the Independent Auditors without obtaining specific pre-approval from the Audit Committee. The Audit Committee will add to or subtract from the list of general pre-approved services from time to time, based on subsequent determinations.
(1) This Audit Committee Audit and Non-Audit Services Pre-Approval Policy and Procedures (the “Policy”), adopted as of the date above, supersedes and replaces all prior versions that may have been adopted from time to time.
The purpose of this Policy is to set forth the policy and procedures by which the Audit Committee intends to fulfill its responsibilities. It does not delegate the Audit Committee’s responsibilities to pre-approve services performed by the Independent Auditors to management.
The Fund’s Independent Auditors have reviewed this Policy and believes that implementation of the Policy will not adversely affect the Independent Auditors’ independence.
2. Delegation
As provided in the Act and the SEC’s rules, the Audit Committee may delegate either type of pre-approval authority to one or more of its members. The member to whom such authority is delegated must report, for informational purposes only, any pre-approval decisions to the Audit Committee at its next scheduled meeting.
3. Audit Services
The annual Audit services engagement terms and fees are subject to the specific pre-approval of the Audit Committee. Audit services include the annual financial statement audit and other procedures required to be performed by the Independent Auditors to be able to form an opinion on the Fund’s financial statements. These other procedures include information systems and procedural reviews and testing performed in order to understand and place reliance on the systems of internal control, and consultations relating to the audit. The Audit Committee will approve, if necessary, any changes in terms, conditions and fees resulting from changes in audit scope, Fund structure or other items.
In addition to the annual Audit services engagement approved by the Audit Committee, the Audit Committee may grant general pre-approval to other Audit services, which are those services that only the Independent Auditors reasonably can provide. Other Audit services may include statutory audits and services associated with SEC registration statements (on Forms N-1A, N-2, N-3, N-4, etc.), periodic reports and other documents filed with the SEC or other documents issued in connection with securities offerings.
The Audit Committee has pre-approved the Audit services in Appendix B.1. All other Audit services not listed in Appendix B.1 must be specifically pre-approved by the Audit Committee (or by any member of the Audit Committee to which pre-approval has been delegated).
4. Audit-related Services
Audit-related services are assurance and related services that are reasonably related to the performance of the audit or review of the Fund’s financial statements and, to the extent they are Covered Services, the Covered Entities or that are traditionally performed by the Independent Auditors. Because the Audit Committee believes that the provision of Audit-related services does not impair the independence of the auditor and is consistent with the SEC’s rules on auditor independence, the Audit Committee may grant general pre-approval to Audit-related services. Audit-related services include, among others, accounting consultations related to accounting, financial reporting or disclosure matters
not classified as “Audit services”; assistance with understanding and implementing new accounting and financial reporting guidance from rulemaking authorities; agreed-upon or expanded audit procedures related to accounting and/or billing records required to respond to or comply with financial, accounting or regulatory reporting matters; and assistance with internal control reporting requirements under Forms N-SAR and/or N-CSR.
The Audit Committee has pre-approved the Audit-related services in Appendix B.2. All other Audit-related services not listed in Appendix B.2 must be specifically pre-approved by the Audit Committee (or by any member of the Audit Committee to which pre-approval has been delegated).
5. Tax Services
The Audit Committee believes that the Independent Auditors can provide Tax services to the Fund and, to the extent they are Covered Services, the Covered Entities, such as tax compliance, tax planning and tax advice without impairing the auditor’s independence, and the SEC has stated that the Independent Auditors may provide such services.
Pursuant to the preceding paragraph, the Audit Committee has pre-approved the Tax Services in Appendix B.3. All Tax services in Appendix B.3 must be specifically pre-approved by the Audit Committee (or by any member of the Audit Committee to which pre-approval has been delegated).
6. All Other Services
The Audit Committee believes, based on the SEC’s rules prohibiting the Independent Auditors from providing specific non-audit services, that other types of non-audit services are permitted. Accordingly, the Audit Committee believes it may grant general pre-approval to those permissible non-audit services classified as All Other services that it believes are routine and recurring services, would not impair the independence of the auditor and are consistent with the SEC’s rules on auditor independence.
The Audit Committee has pre-approved the All Other services in Appendix B.4. Permissible All Other services not listed in Appendix B.4 must be specifically pre-approved by the Audit Committee (or by any member of the Audit Committee to which pre-approval has been delegated).
7. Pre-Approval Fee Levels or Budgeted Amounts
Pre-approval fee levels or budgeted amounts for all services to be provided by the Independent Auditors will be established annually by the Audit Committee. Any proposed services exceeding these levels or amounts will require specific pre-approval by the Audit Committee. The Audit Committee is mindful of the overall relationship of fees for audit and non-audit services in determining whether to pre-approve any such services.
8. Procedures
All requests or applications for services to be provided by the Independent Auditors that do not require specific approval by the Audit Committee will be submitted to the Fund’s Chief Financial Officer and must include a detailed description of the services to be
rendered. The Fund’s Chief Financial Officer will determine whether such services are included within the list of services that have received the general pre-approval of the Audit Committee. The Audit Committee will be informed on a timely basis of any such services rendered by the Independent Auditors. Requests or applications to provide services that require specific approval by the Audit Committee will be submitted to the Audit Committee by both the Independent Auditors and the Fund’s Chief Financial Officer, and must include a joint statement as to whether, in their view, the request or application is consistent with the SEC’s rules on auditor independence.
The Audit Committee has designated the Fund’s Chief Financial Officer to monitor the performance of all services provided by the Independent Auditors and to determine whether such services are in compliance with this Policy. The Fund’s Chief Financial Officer will report to the Audit Committee on a periodic basis on the results of its monitoring. Both the Fund’s Chief Financial Officer and management will immediately report to the chairman of the Audit Committee any breach of this Policy that comes to the attention of the Fund’s Chief Financial Officer or any member of management.
9. Additional Requirements
The Audit Committee has determined to take additional measures on an annual basis to meet its responsibility to oversee the work of the Independent Auditors and to assure the auditor’s independence from the Fund, such as reviewing a formal written statement from the Independent Auditors delineating all relationships between the Independent Auditors and the Fund, consistent with Independence Standards Board No. 1, and discussing with the Independent Auditors its methods and procedures for ensuring independence.
10. Covered Entities
Covered Entities include the Fund’s investment adviser(s) and any entity controlling, controlled by or under common control with the Fund’s investment adviser(s) that provides ongoing services to the Fund(s). Beginning with non-audit service contracts entered into on or after May 6, 2003, the Fund’s audit committee must pre-approve non-audit services provided not only to the Fund but also to the Covered Entities if the engagements relate directly to the operations and financial reporting of the Fund. This list of Covered Entities would include:
Morgan Stanley Retail Funds
Morgan Stanley Investment Advisors Inc.
Morgan Stanley & Co. Incorporated
Morgan Stanley DW Inc.
Morgan Stanley Investment Management Inc.
Morgan Stanley Investment Management Limited
Morgan Stanley Investment Management Private Limited
Morgan Stanley Asset & Investment Trust Management Co., Limited
Morgan Stanley Investment Management Company
Van Kampen Asset Management
Morgan Stanley Services Company, Inc.
Morgan Stanley Distributors Inc.
Morgan Stanley Trust FSB
Morgan Stanley Institutional Funds
Morgan Stanley Investment Management Inc.
Morgan Stanley Investment Advisors Inc.
Morgan Stanley Investment Management Limited
Morgan Stanley Investment Management Private Limited
Morgan Stanley Asset & Investment Trust Management Co., Limited
Morgan Stanley Investment Management Company
Morgan Stanley & Co. Incorporated
Morgan Stanley Distribution, Inc.
Morgan Stanley AIP GP LP
Morgan Stanley Alternative Investment Partners LP
(e)(2) Beginning with non-audit service contracts entered into on or after May 6, 2003, the audit committee also is required to pre-approve services to Covered Entities to the extent that the services are determined to have a direct impact on the operations or financial reporting of the Registrant. 100% of such services were pre-approved by the audit committee pursuant to the Audit Committee’s pre-approval policies and procedures (attached hereto).
(f) Not applicable.
(g) See table above.
(h) The audit committee of the Board of Trustees has considered whether the provision of services other than audit services performed by the auditors to the Registrant and Covered Entities is compatible with maintaining the auditors’ independence in performing audit services.
Item 5. Audit Committee of Listed Registrants.
(a) The Fund has a separately-designated standing audit committee established in accordance with Section 3(a)(58)(A) of the Exchange Act whose members are: Joseph Kearns, Michael Nugent and Allen Reed.
(b) Not applicable.
Item 6. Schedule of Investments
Refer to Item 1.
Item 7. Disclosure of Proxy Voting Policies and Procedures for Closed-End Management Investment Companies.
Applicable only to reports filed by closed-end funds.
Item 8. Portfolio Managers of Closed-End Management Investment Companies
Applicable only to reports filed by closed-end funds.
Item 9. Closed-End Fund Repurchases
Applicable only to reports filed by closed-end funds.
Item 10. Submission of Matters to a Vote of Security Holders
Not applicable.
Item 11. Controls and Procedures
(a) The Fund’s principal executive officer and principal financial officer have concluded that the Fund’s disclosure controls and procedures are sufficient to ensure that information required to be disclosed by the Fund in this Form N-CSR was recorded, processed, summarized and reported within the time periods specified in the Securities and Exchange Commission’s rules and forms, based upon such officers’ evaluation of these controls and procedures as of a date within 90 days of the filing date of the report.
(b) There were no changes in the registrant’s internal control over financial reporting that occurred during the second fiscal quarter of the period covered by this report that has materially affected, or is reasonably likely to materially affect, the registrant’s internal control over financial reporting.
Item 12. Exhibits
(a) The Code of Ethics for Principal Executive and Senior Financial Officers is attached hereto.
(b) A separate certification for each principal executive officer and principal financial officer of the registrant are attached hereto as part of EX-99.CERT.
SIGNATURES
Pursuant to the requirements of the Securities Exchange Act of 1934 and the Investment Company Act of 1940, the registrant has duly caused this report to be signed on its behalf by the undersigned, thereunto duly authorized.
Morgan Stanley Income Trust | |
| |
/s/ Ronald E. Robison |
|
Ronald E. Robison | |
Principal Executive Officer | |
October 18, 2007 | |
Pursuant to the requirements of the Securities Exchange Act of 1934 and the Investment Company Act of 1940, this report has been signed by the following persons on behalf of the registrant and in the capacities and on the dates indicated.
/s/ Ronald E. Robison |
| |
Ronald E. Robison | ||
Principal Executive Officer | ||
October 18, 2007 | ||
| ||
/s/ Francis Smith |
| |
Francis Smith | ||
Principal Financial Officer | ||
October 18, 2007 | ||