TABLE OF CONTENTS
Arrowhead Community Bank
Asian Bank of Arizona
Bank of Tucson
Camelback Community Bank
Central Arizona Bank
Colonia Bank
Mesa Bank
Southern Arizona Community Bank
Sunrise Bank of Albuquerque
Sunrise Bank of Arizona
Yuma Community Bank
Bank of Escondido
Bank of Feather River
Bank of San Francisco
Bank of Santa Barbara
Napa Community Bank
Point Loma Community Bank
Sunrise Bank of San Diego
Sunrise Community Bank
Fort Collins Commerce Bank
Larimer Bank of Commerce
Loveland Bank of Commerce
Mountain View Bank of Commerce
Ann Arbor Commerce Bank
Bank of Auburn Hills
Bank of Maumee
Bank of Michigan
Brighton Commerce Bank
Capitol National Bank
Detroit Commerce Bank
Macomb Community Bank
Oakland Commerce Bank
Ohio Commerce Bank
Elkhart Community Bank
Evansville Commerce Bank
Goshen Community Bank
Grand Haven Bank
Kent Commerce Bank
Muskegon Commerce Bank
Paragon Bank & Trust
Portage Commerce Bank
Adams Dairy Bank
Bank of Belleville
Community Bank of Lincoln
Summit Bank of Kansas City
1st Commerce Bank
Bank of Las Vegas
Black Mountain Community Bank
Desert Community Bank
Red Rock Community Bank
USNY Bank
Bank of Bellevue
Bank of Everett
Bank of Tacoma
High Desert Bank
Issaquah Community Bank
Bank of Valdosta
Community Bank of Rowan
First Carolina State Bank
Peoples State Bank
Pisgah Community Bank
Sunrise Bank of Atlanta
Bank of Fort Bend
Bank of Las Colinas
Amera Mortgage Corporation
Capitol Wealth
“The American banking industry is undergoing a challenge, which is unprecedented in the past half century.”
Many annual reports to shareholders this year will start out with a comment similar to this in their shareholder letter. The letter will remind the shareholders of conditions which have become all too obvious, even to the most passive investor.
Other shareholder letters may choose to attempt to explain the condition which afflicts financial institutions in this country, rightfully pointing blame to the greed of Wall Street and the numerous transactions which led up to the current financial crisis.
A better way to start may be to explain what the company is doing to meet the challenge, rather than a lengthy narrative on how the industry got here. This is where we begin.
The name of the game for financial institutions today is, in a word, “survival.” Earnings reports and asset growth metrics have been superseded by the all important capital ratio—the amount of capital which the financial institution retains in order to support its stability. Capital is the lifeblood of a financial institution.
I am pleased to report to you that, as of December 31, 2008, our capital ratios were calculated as follows:
Tier 1 Leverage Ratio – 10.72%
Tier 1 Capital Ratio – 12.07%
Total Risk-based Capital Ratio – 13.75%
Our objective has been, and continues to be, the preservation of capital. There are a number of strategies which we have implemented to achieve this objective.
First and foremost was the termination of a series of new bank development programs which were under way. We did complete the organization of four banking affiliates in the first half of 2008, including Adams Dairy Bank in Blue Springs, Missouri; Mountain View Bank of Commerce in Westminster, Colorado; Colonia Bank in Phoenix, Arizona; and Pisgah Community Bank in Asheville, North Carolina. All other efforts were terminated, eliminating the need for additional start-up capital.
Second was the reduction of operating expenses:
■ During the 4th quarter of 2008, our employee count on a national basis was reduced by 7%.
■ The Corporation suspended contributions to its employee stock ownership plan.
■ The Corporation suspended contributions to its 401(k) plan.
■ An analysis of the entire Corporation was completed in the 4th quarter, eliminating discretionary expenses.
■ A freeze was imposed on all salary adjustments.
■ Year-end bonuses were eliminated.
■ A voluntary 10% salary reduction for the top executive officers of the Corporation was implemented beginning in 2009.
Third, a plan was devised seeking the consolidation of a number of our banking affiliates and further centralization of operational functions in order to reduce expenses within certain geographical areas:
■ A nine-bank merger application was filed in December 2008 affecting our Michigan banks.
■ A four-bank merger application was filed in February 2009 affecting our banking affiliates in the Greater Phoenix market.
■ Initiatives to re-engineer operational functions have been deployed which reflect the Corporation’s more modest growth objectives.
■ Other consolidation alternatives are currently being explored.
Fourth, other methods of capital preservation and conservation included the addition of $57 million of capital to our balance sheet in 2008. This involved the sale of trust preferred securities and common stock, coupled with a reduction in the corporate dividend.
Fifth, we have applied for funding under the U.S. Treasury’s Capital Purchase Plan as part of what is commonly referred to as “TARP.” As of this writing, we have received no definitive response to the application, although the matter is pending.
Sixth, we have embarked upon a program to more efficiently allocate capital within our system by methodically right-sizing the balance sheets of certain bank affiliates currently facing operating challenges.
And, lastly, we continue to diligently explore the availability and cost of capital through any and all outside sources, including private equity.
There is no silver-bullet solution to the dilemma facing the banking sector today. Weathering this economic storm requires vigilance and commitment on the part of the board of directors and management. This is a commitment that absolutely demands daily action—not simply words. We have done, and will continue to do, anything and everything necessary to preserve the viability of our enterprise and restore it to the former valuation levels that it once enjoyed.
Before closing, I would like to acknowledge the long-standing, stalwart board service provided to this company by former director, Leonard Maas. His oversight and guidance has been a source of strength to our board of directors. We wish him well in his retirement.
Thank you for your continued support of Capitol Bancorp Limited.
Joseph D. Reid
Chairman & CEO
Capitol Bancorp Limited
Capitol Bancorp Limited
Board of Directors
Joseph D. Reid
Chairman & CEO
Capitol Bancorp Limited
Michael L. Kasten
Vice Chairman
Capitol Bancorp Limited
Managing Partner
Kasten Investments, LLC
Lyle W. Miller
Vice Chairman
Capitol Bancorp Limited
President
L W. Miller Holding Co.
David J. O’Leary
Secretary
Capitol Bancorp Limited
Chairman
O’Leary Paint Company
Paul R. Ballard
Retired President & CEO
Portage Commerce Bank
David L. Becker
Retired Founder
Becker Insurance Agency, P.C.
Douglas E. Crist
President
Developers of SW Florida, Inc.
Michael J. Devine
Attorney at Law
James C. Epolito
President & CEO
Michigan Economic
Development Corporation
Gary A. Falkenberg
Gary A. Falkenberg, D.O., P.C.
Joel I. Ferguson
Chairman
Ferguson Development, LLC
Kathleen A. Gaskin
Associate Broker/State Appraiser
Tomie Raines, Inc. Realtors
H. Nicholas Genova
Chairman & CEO
Washtenaw News Co. Inc. and
H. N. Genova Development
Michael F. Hannley
President & CEO
Bank of Tucson
Richard A. Henderson
President
Henderson & Associates, P.C.
Lewis D. Johns
President
Mid-Michigan Investment Co.
John S. Lewis
President of Bank Performance
Capitol Bancorp Limited
Steven L. Maas
Co-Owner
River Valley Title, LLC
Myrl F. Nofziger
President
Hoogenboom Nofziger
Cristin K. Reid
Corporate President
Capitol Bancorp Limited
Ronald K. Sable
President
Concord Solutions Ltd.
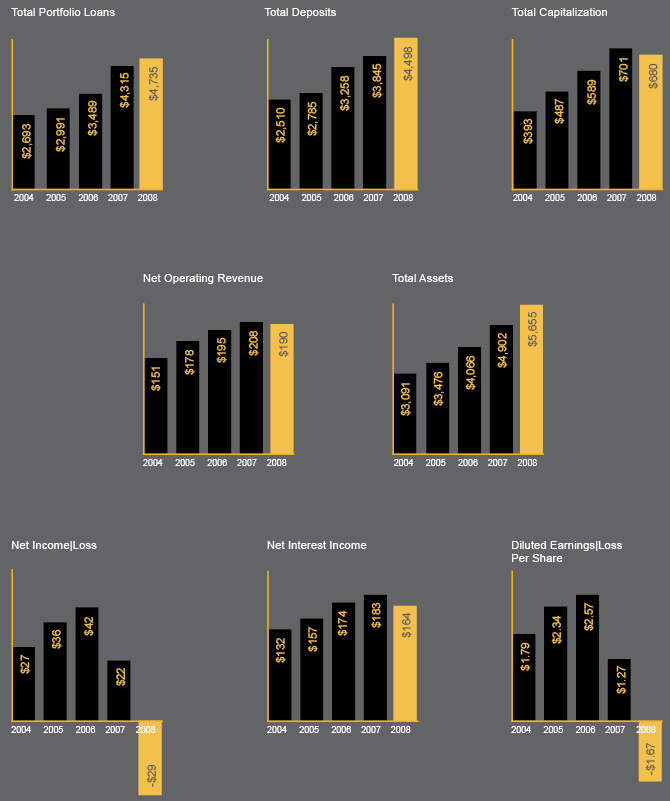
In millions, except per share amounts
John S. Lewis, Region President
06 Arrowhead Community Bank
07 Asian Bank of Arizona
08 Bank of Tucson
09 Camelback Community Bank
10 Central Arizona Bank
11 Colonia Bank
12 Mesa Bank
13 Southern Arizona Community Bank
14 Sunrise Bank of Albuquerque
15 Sunrise Bank of Arizona
16 Yuma Community Bank
Arizona’s economy has been built on population growth that, in turn, has fueled dynamic market growth. Although there have been efforts to diversify the state’s economy, there remains a heavy reliance on residential real estate. As a result, Arizona was hit hard as the nation’s housing crisis became evident in 2008. The housing market will begin its correction, but in the meantime other industries have slowed, creating challenges for bankers in the Arizona Region.
Strong client relationships can sustain banks in challenging times like this. Our affiliate banks in the Phoenix metropolitan area, Tucson, Yuma and Albuquerque, New Mexico, have worked hard to build deep and lasting relationships with their clients. These meaningful relationships will help our banks remain strong as they contend with lingering challenges.
ARROWHEAD COMMUNITY BANK
Arlene Kulzer, President & CEO
How has Arrowhead Community Bank established its footprint in the growing West Valley of Phoenix?
When the bank opened in 2000, we had limited funds budgeted for advertising. Realizing that advertising in regional publications would be expensive and ineffective, management made the strategic decision to promote the bank through vigorous community service and sponsorship of nonprofit fundraising events. Sponsorships have included partnering with clients and vendors to construct two homes for Habitat for Humanity of the West Valley. We also organized motorcycle runs to benefit the New Life Center, a domestic violence center located in Goodyear and The Anthony Holly Foundation, a charity honoring fallen police officer Tony Holly and benefiting children.
Senior officers are engaged and involved in civic, service and social organizations, assuming leadership roles and positioning themselves and the bank at the center of this vibrant, growing community. Arrowhead Community Bank, which has developed a culture of community service through hands-on volunteerism and board service, in addition to financial support, considers education one of its primary giving focuses. Our staff has lectured to kindergarten classes, business schools and universities and has served on advisory boards for several local colleges and universities. Most recently the bank participated in the Arizona Corporate Income Tax Credit for private school tuition assistance and directed $100,000 of its taxes to education. We at Arrowhead Community Bank understand and embrace the fact that our children are our future.
— Arlene Kulzer, President & CEO
Board of Directors
Janet G. Betts
Attorney at Law
Holme Roberts & Owen LLP
W. Patrick Daggett, CPA
Daggett, McConachie & Moore,
CPAs, LLP
Michael J. Devine
Attorney at Law
Hon. Thomas R. Eggleston Sr.
Retired
Vice Mayor of Glendale
George L. Evans, PE, RLS
President & Co-Founder
Evans, Kuhn & Associates, Inc.
Richard J. Hilde
Retired CEO
EPW Inc.
Dr. David R. Hunter, DDS
Orthodontist
Hunter Orthodontics
Arlene Kulzer
President & CEO
Arrowhead Community Bank
James J. McCue, AAE
Aviation Consultant
Sherwin Industries
Terrance C. Mead
Attorney at Law
Mead & Associates, PC
John C. Ogden
Retired CEO
SunCor Development Company
Richard A. Shelton
Agent
RE/MAX Desert Showcase
Officers
John C. Ogden
Chairman
Michael J. Devine
Vice Chairman
Arlene Kulzer
President & CEO
James J. McCue
Secretary
W. Patrick Daggett
Chair, Directors Loan
Committee
John D. Sherman
Executive Vice President
& CCO
Mary Catherine Mireles
Senior Vice President
Richard L. Oliver
Senior Vice President
Michael T. Ganahl
Vice President
Stacey J. Morrison
Vice President
Justin M. Muramoto
Vice President
Arrowhead Community Bank
17235 North 75th Avenue, Suite B100
Glendale, AZ 85308
623.776.0800
www.arrowheadcommunitybank.com
ASIAN BANK OF ARIZONA
Leslie M. Gin, President
What efforts have been made to expand the bank’s customer base?
In 2008, Asian Bank of Arizona continued developing its local success story by aggressively focusing on its core customers, Arizona small business entrepreneurs.
While other banks have snubbed the “little guy” to focus on acquiring deposits from larger companies and corporations, Asian Bank of Arizona continues an aggressive grassroots program targeted to entrepreneurs in previously underserved communities of metropolitan Phoenix.
Staying true to its roots, Asian Bank of Arizona has specifically built strong community partnerships with the Philippine American Chamber of Commerce, Chinese American Citizens Alliance, Asian American Community in Action and The Asian Chamber of Commerce, often hosting functions for each organization. These hardworking entrepreneurs have learned to turn to Asian Bank of Arizona for financial answers, including SBA 504 loans, land acquisition loans, tenant improvement loans and other custom-tailored solutions we proudly offer.
Asian Bank of Arizona “walks the walk and talks the talk.” Our team of professionals speaks 10 different languages, ensuring a culturally relevant experience for metropolitan Phoenix’s diverse population. But Asian Bank of Arizona is not solely focused on the Valley of the Sun’s Asian communities. In fact, more and more professionals valley-wide are turning to the commercial and real estate lending products we provide.
Asian Bank of Arizona will continue its commitment to Arizona’s small businesses in 2009, while aggressively building its presence outside of the Asian community. We are passionate about serving entrepreneurs throughout metropolitan Phoenix and providing a level of customer service that only a locally operated bank can provide.
— Leslie M. Gin, President
Board of Directors
Jay A. Bansal
Attorney
Law Offices of Jay A. Bansal
Dr. David M. Chei, DMD
Doctor of Dentistry
Somer Dental PLLC
Jae M. Chin
Business Owner
J C Prince LLC
Leslie M. Gin
President
Asian Bank of Arizona
Robert E. Hite
President
Securitech, Inc.
John S. Lewis
President of Bank Performance
Capitol Bancorp Limited
Rano K. Singh-Sidhu
Business Owner
DPS Biotech SW
Officers
John S. Lewis
Chairman
Leslie M. Gin
President
James A. Klussman
Executive Vice President
& CCO
Ryan J. Mulligan
Vice President
Beverly F. Santiago
Vice President
Asian Bank of Arizona
668 North 44th Street, Suite 123
Phoenix, AZ 85008
602.263.8888
www.asianbankaz.com
BANK OF TUCSON
Michael F. Hannley, President & CEO
What steps is Bank of Tucson taking to develop its board of directors so it continues to play a vital role in developing business for the bank well into the future?
At Bank of Tucson, we incorporate the philosophy that “Knowledge is Power” in our day-to-day activities. What is knowledge? Knowledge is: every member of the team having an understanding of all facets of banking, including being educated on products and services offered; knowing our customers; knowing the regulatory expectations; as well as what is required to achieve the financial success of our bank.
This knowledge is vital in the continued development of our board of directors. The success of our board of directors relies heavily on the effectiveness of our management. The way in which we are accomplishing this is through day-to-day interaction between management and all directors.
To ensure continued success well into the future, especially with a challenging economic environment and complete paradigm shift in banking, we have placed our focus on the future leaders of Bank of Tucson. We have created a Young Management Leaders Program within the bank where members are identified by senior management along with an advisory board consisting of young up-and-coming business leaders within the community. Our senior management works together with our young leaders to develop the knowledge needed to run a successful bank. Utilizing the aforementioned knowledge and strategies, we equip the bank with a strong group of leaders who have the power to continue contributing effectively toward the future success of the bank.
— The Young Management Leaders of Bank of Tucson
Board of Directors
Bruce I. Ash
President & CEO
Paul Ash Management
Company, LLC
John H. Bremond
Regional Vice President
KB Home
Bradley H. Feder
Managing Partner
Simply Bits, LLC
Sally G. Fernandez
President & CEO
Fernandez Group, LLC
Michael F. Hannley
President & CEO
Bank of Tucson
Michael J. Harris
Vice President
Long Realty Company
Richard F. Imwalle
President
Richard F. Imwalle & Associates
David Jeong, CPA
President
Jeong Lizardi, PC
Michael L. Kasten
Managing Partner
Kasten Investments, LLC
Burton J. Kinerk
Attorney at Law
Kinerk, Beal, Schmidt, Dyer &
Sethi, PC
Harold H. Kitay
Partner & Manager
Whirlygig Properties
Commercial Developers, LLC
Lawrence M. Muehlebach
Attorney at Law
Hecker & Muehlebach, PLLC
Officers
Richard F. Imwalle
Chairman
Michael L. Kasten
Vice Chairman
Michael F. Hannley
President & CEO
Harold H. Kitay
Secretary
C. David Foust
Executive Vice President
& CCO
Sandra L. Smithe
Executive Vice President
& COO
David A. Esquivel
Senior Vice President
Donald E. Jenks
Senior Vice President
Richard A. Garcia
Vice President
Kenneth J. Krapf
Vice President
Clay A. Naff
Vice President
Robert D. Placzek
Vice President
Patricia A. Taylor
Vice President
Bank of Tucson
4400 East Broadway
Tucson, AZ 85711
520.321.4500
Nogales Office
825 North Grand Avenue, Suite 104
Nogales, AZ 85621
520.397.9220
www.bankoftucson.com
CAMELBACK COMMUNITY BANK
Gail E. Grace, President & CEO
The bank recently celebrated its 10-year anniversary. What do you consider to be the major factors in the steady success of the bank?
Camelback Community Bank celebrated its 10th anniversary in 2008. While it was a challenging year for financial institutions, as the economy faced unprecedented market pressures, we have many opportunities to continue to grow and succeed. We have seen more emphasis on the safety and soundness of the banking community. With the help of the temporary increase in the FDIC insurance coverage and our CDARS® product, we have been successful in addressing customers’ concerns about their banking and deposit relationships.
Through the past 10 years, Camelback Community Bank has enjoyed steady growth and success and has been able to weather some of the economic challenges felt in our industry. We attribute this to maintaining good basic and fundamental banking principles. We have developed a well-diversified loan portfolio and avoided concentrations in riskier speculative real estate transactions and consistently sustained sound underwriting standards. As a result, we have been able to minimize the adverse impact of the current economic environment. This has also allowed us to remain healthy and well-positioned to continue to help our customers meet their financial needs.
We could not have achieved the success we have enjoyed over the past 10 years without the hard work and dedication of our staff and board of directors. We deliver our services with honesty and integrity and as a result have enjoyed many years of longstanding, loyal relationships. We continue to focus on our vision of “Relationships that last a lifetime.”
— Gail E. Grace, President & CEO
Board of Directors
Shirley A. Agnos
President Emerita
Arizona Town Hall
Cord D. Armstrong, CPA, CCIFP
Senior Tax Manager
CBIZ MHM, LLC
Michael J. Devine
Attorney at Law
James L. Essert
Vice President & Portfolio Manager
ING Investment Management Co.
Gail E. Grace
President & CEO
Camelback Community Bank
S. Jill Hastings, JD
Principal
Pension Strategies, LLC
Robert V. Lester, CLU, ChFC
President
Progressive Financial Concepts
Susan C. Mulligan, CPA
Community Volunteer
Barbara J. Ralston
President & CEO
Fresh Start Women’s Foundation
Daniel A. Robledo
Senior Vice President
Land America Financial Group, Inc.
Robert S. Roda, DDS, MS
Roda & Sluyk Ltd.
Kenneth Van Winkle Jr.
Managing Partner
Lewis & Roca, LLP
Officers
Michael J. Devine
Chairman
Daniel A. Robledo
Vice Chairman
Gail E. Grace
President & CEO
Shirley A. Agnos
Secretary
Timothy J. Hoekstra
Executive Vice President
& CCO
Tricia A. Blaylock
Vice President
Darrin R. Davidson
Vice President
Rosina French
Vice President
Todd W. Grady
Vice President
Jennifer S. Higgins
Vice President
William F. Von Hatten
Vice President
Camelback Community Bank
2777 East Camelback Road, Suite 100
Phoenix, AZ 85016
602.224.5800
www.camelbackbank.com
CENTRAL ARIZONA BANK
Franklin C. Shelton, President
What opportunities does expansion into the Casa Grande market bring for the bank?
Central Arizona Bank opened in Casa Grande on November 24, 2008, joining forces with Valley First Community Bank in Scottsdale.
Expansion into the Casa Grande market provides the city, and a large portion of Pinal County, with a community bank, which it has not had for some time. In Pinal County, Casa Grande is the hub and the most developed city. This market area provides a niche that can be filled by a community bank that recognizes the need for full-service banking and hometown service. Hometown service includes local decision-making and tailoring products and services to the community’s needs.
Larger, “big box” banks were the only choice in this market until Central Arizona Bank opened. We feel our bank has a tremendous opportunity to assist individuals, small businesses and entrepreneurs currently underserved by larger, dominant financial institutions. When the local economy rebounds, Central Arizona Bank will find success due to our quicker response time for credit and banking inquiries and our understanding of the underlying community fundamentals.
Casa Grande is poised for long-term growth despite current economic woes. Casa Grande and Pinal County are strategically located because of their proximity to two interstate freeways, transcontinental railways and a newly-proposed freeway. Central Arizona Bank is looking forward to sharing in the growth opportunities in the future.
— Franklin C. Shelton, President
Board of Directors
Jeril S. Benedict
Partner & Principal
Capital Real Estate & Development
Evelyn M. Casuga
General Manager
Arizona Public Service
James E. Don
Retired Judge
Pinal County Superior Court
William R. Fitzpatrick, CPA
Eide Bailly
Michael L. Kasten
Managing Partner
Kasten Investments, LLC
Stewart Larsen
Designated Broker
The Larsen Company
John S. Lewis
President of Bank Performance
Capitol Bancorp Limited
Gordon D. Murphy
Retired Executive Vice President
Arizona Bankers Association
Shea K. Nieto
Owner
AMS Real Estate & Finance
Timothy A. Robinson
President
Arizona Machinery & Supply, Inc.
Eileen S. Rogers
President
Allegra Print & Imaging
Ronald K. Sable
President
Concord Solutions Ltd.
Lynn A. Serrano
Investor & Owner
Cow Creek & Eagle Eye Ranches
Franklin C. Shelton
President
Central Arizona Bank
Carol Wuertz-Behrens
Vice President & Treasurer
Arizona Drip Systems
Officers
John S. Lewis
Chairman
Michael L. Kasten
Vice Chairman
Gordon D. Murphy
Secretary
Franklin C. Shelton
President
Roni M. Grodnick
Executive Vice President
& CCO
Nancy E. Selby
Executive Vice President
Richard L. Fleming
Senior Vice President
H.R. Paddock
Senior Vice President & CCO
Cheryl L. DeGroot
Vice President
Cathy J. Dixon
Vice President
Linda L. Kirkpatrick
Vice President
Daniel R. Klenske
Vice President
A. George Vensel
Vice President
Michele J. Yates
Vice President
Central Arizona Bank
7001 North Scottsdale Road, Suite 1000
Scottsdale, AZ 85253
480.596.0883
1433 North Pinal Avenue
Casa Grande, AZ 85222
520.423.4900
www.centralarizonabank.com
COLONIA BANK
Gilbert Jimenez, President
Explain your desire to serve the multi-cultural community and what unique business opportunities does this market niche bring to the bank?
Current trends in our region have shown the need for a bank that recognizes, supports and celebrates the diversity of its community. We seek to perpetuate the culture, traditions and values within the broader community. To be truly successful, Colonia Bank must fulfill the dream of uniting the multi-cultural segments within the Phoenix metropolitan area, while delivering financial services that help businesses grow and become vibrant.
Colonia Bank will focus on companies with revenues of $1 million to $50 million, not-for-profit organizations and individual customers who are looking for a multi-faceted relationship with a bank that provides innovative solutions and services that are professional and personalized. Our goal is to build and maintain lasting relationships with business clients (both for-profit and not-for-profit), community leaders and individual customers.
Colonia Bank’s team includes bankers who understand the needs of our diverse community. They represent experience, flexibility and connectivity.
— Gilbert Jimenez, President
Board of Directors
Jeffrey P. Anderson
Consultant
Tony M. Astorga
Senior Vice President & CFO
Blue Cross Blue Shield of Arizona
Azez N. Basha Jr.
Vice Chairman
Bashas’ Inc.
Ernest Calderon
Attorney at Law
Calderon Law Offices
Yolanda Collazos Kizer
President & CEO
CASA Fenix Merchandising, Inc.
Armando B. Flores
Director of Community Relations
& Operations
Arizona State University Baseball
Gilbert Jimenez
President
Colonia Bank
Michael L. Kasten
Managing Partner
Kasten Investments, LLC
John S. Lewis
President of Bank Performance
Capitol Bancorp Limited
Patrick A. Maloney
Owner & Clinician
Maloney Chiropractic Clinic, Inc.
Manuel C. Molina
President
Molina Media Group Inc.
Armando G. Roman
Partner
Johnson, Harris & Goff, PLLC
Officers
John S. Lewis
Chairman
Michael L. Kasten
Vice Chairman
Ernest Calderon
Secretary
Gilbert Jimenez
President
Sara T. Gordon
Senior Vice President
& CCO
Dennis A. Bourgeois
Senior Vice President
& Senior Banker
Maria L. Cabral
Vice President &
Operations Manager
Lisa G. Lerner
Vice President & Loan
Operations Manager
Vivian Painter
Vice President & Credit
Documentation Manager
Colonia Bank
3033 North Central Avenue
Suite 125
Phoenix, AZ 85012
602.283.1460
www.coloniabankaz.com
MESA BANK
Neil R. Barna, President & CEO
What role did the bank play in the development of, and ongoing support for, the Mesa Arts Center?
The $92 million Mesa Arts Center and the eight-story Mesa Bank Building make up the most impressive city block in downtown Mesa. Mesa Bank has participated in all aspects of the Mesa Arts Center from the very beginning of its design phase. We attended many design meetings and we worked with the city of Mesa on parking and pedestrian traffic issues. Many of our clients and directors are prominent donors, so it was important that we were engaged in the project.
Throughout its development, Mesa Arts Center representatives spoke to our staff about the opportunities available, from buying tickets and taking art classes, to attending free events. We hold our annual holiday party there each year.
Since we are heavily involved in our community, we think it is important to take a leadership role in projects like the Mesa Arts Center. Our board committed funds to the initial capital campaign for the Mesa Arts Center Foundation, a nonprofit group that supports the arts in Mesa. We continue to be recognized as Friends of the Arts Center and attend many events at this multi-functional facility. We find that meeting clients and new friends in a relaxed and inviting environment is another great way to spread the word “Our clientele is our sales force!”
— Neil R. Barna, President & CEO
Board of Directors
Neil R. Barna
President & CEO
Mesa Bank
Stephen D. Chader
Operating Principal
Keller Williams Integrity First
Michael J. Devine
Attorney at Law
Debra L. Duvall, EdD
Superintendent
Mesa Public Schools
Stewart A. Hogue
Principal
SALK Management, LLC
Philip S. Kellis
President
Kellstar, LLC
Ruth L. Nesbitt
Community Volunteer
Wayne C. Pomeroy
Owner
Pomeroy’s Men’s Stores
Daniel P. Skinner
Managing Member
LeBaron & Carroll LLC
James K. Zaharis, EdD
President
The Zaharis Group
Officers
Stewart A. Hogue
Chairman
Michael J. Devine
Vice Chairman
Neil R. Barna
President & CEO
Staci L. Charles
Executive Vice President
Rita E. Leaf
Executive Vice President
& CCO
Sandra S. Zazula
Executive Vice President
& Secretary
Christine A. Bond
Vice President
Susan E. Haverstrom
Vice President
James G. LeCheminant
Vice President
Conrad B. Morin
Vice President
Mesa Bank
63 East Main Street, Suite 100
Mesa, AZ 85201
480.649.5100
Falcon Field Office
1733 North Greenfield Road, Suite 101
Mesa, AZ 85205
480.324.3500
www.mesabankers.com
East Valley Bank,
a unit of Mesa Bank
1940 North Alma School Road
Chandler, AZ 85224
480.726.6500
www.eastvalleybank.com
SOUTHERN ARIZONA COMMUNITY BANK
John P. Lewis, President & CEO
How has your bank fared in these unprecedented, turbulent times?
Panic, Desperation, Anxiety, Crisis, Fear; all words we have heard and come to live with in 2008. Never in our history has there been more of a lack of customer confidence in the financial industry. One Wall Street broker was quoted, “the last twelve months on Wall Street can be described as going from Nirvana to Armageddon.” The herd mentality rules during a crisis as people are wired to follow the crowd when times are uncertain.
Nationally, banks are experiencing an unprecedented lack of liquidity. The government’s involvement on a national level to inject capital and the bank’s willingness to work with our local customers will restore confidence in the financial system.
Our philosophy, born in 1998 of strong directors and management leadership, is the underlying reason our bank has remained strong. Over two years ago, our board and management team saw signs of trouble in the residential-construction lending market. Our board and management group stayed the course and made a conscious decision not to participate in any form of reckless lending. We felt subprime lending was a product that would violate the very integrity of our lending philosophy and the foundation on which this bank was built.
Southern Arizona Community Bank is as strong today as it was before this crisis. We were pleased with the recent move by the FDIC to increase insurance to $250,000 per depositor. Banks are rebuilding customer confidence.
Thank you for your continued support. We appreciate you and your business. Please tell your friends about us.
— John P. Lewis, President & CEO
Board of Directors
William R. Assenmacher
President
T. A. Caid Industries, Inc.
Jody A. Comstock, MD
Physician & Owner
Skin Spectrum
Amram Dahukey, DPM
Physician & Owner
Premier Foot & Ankle Surgeons
Robert A. Elliott
President & Owner
The Elliott Accounting Group
Michael W. Franks
Principal
Seaver Franks Architects
Michael L. Kasten
Managing Partner
Kasten Investments, LLC
Yoram S. Levy
Partner
Triangle Ventures, LLC
John P. Lewis
President & CEO
Southern Arizona
Community Bank
Jim Livengood
Director of Athletics
The University of Arizona
James A. Mather, CPA
Attorney at Law
Susan C. Ong, CCIM
Broker & Owner
Broadstone, Ltd.
James M. Sakrison
Principal & Attorney at Law
Slutes, Sakrison & Rogers, PC
Jean M. Tkachyk
CFO
University Physicians Healthcare
Paul A. Zucarelli
Principal
CBIZ, Gordon, Zucarelli &
Handley Insurance, Ltd.
Officers
Paul A. Zucarelli
Chairman
Michael L. Kasten
Vice Chairman
John P. Lewis
President & CEO
Robert A. Elliott
Secretary
Michael J. Trueba
Executive Vice President
& CCO
Terri R. Gomez
Senior Vice President
Minette Goldsmith
Vice President
Mindy C. Webb
Vice President
Southern Arizona Community Bank
6400 North Oracle Road
Tucson, AZ 85704
520.219.5000
www.southernarizonabank.com
SUNRISE BANK OF ALBUQUERQUE
Steven A. Marcum, President & CEO
How has the move to a historic building in downtown Albuquerque enhanced the bank’s ability to attract new business?
Our new offices are described by many as the most beautiful and unique in Albuquerque. In 2008, our bank was awarded the “Best Historical Use” award by Albuquerque’s Downtown Action Team (a private, nonprofit membership organization dedicated to the revitalization of downtown Albuquerque).
Moving to this location has provided Sunrise Bank of Albuquerque with better visibility, improved our image as a community partner and allowed us to leverage the long history of this building. Sunrise Bank of Albuquerque’s investment in revitalizing this historic location has enhanced our name recognition through the tremendous amount of publicity we have received and it has helped garner significant goodwill from the business community.
Our building housed, in its time, the premier bank in Albuquerque and was also the center of the banking community for nearly half a century. The memory of that historic premier bank still exists in the minds of many business people today. As such, customers associate the location and building with a bank that has stability, strength, history and longevity. These are the very qualities that help us attract and retain business customers who also have a shared interest in the growth and prosperity of the Albuquerque community.
— Steven A. Marcum, President & CEO
Board of Directors
Annette Arrigoni
Account Executive
Berger Briggs Real Estate
and Insurance, Inc.
Turner W. Branch
President
Branch Law Firm, PA
Helen A. Elliott, CPA
Elliott, Pohlman & Co., CPAs, PC
Steven A. Marcum
President & CEO
Sunrise Bank of Albuquerque
James Rogers
Chief Manager
Sunland Development Group LLC
Ronald K. Sable
President
Concord Solutions Ltd.
Todd A. Sandoval
President
Sandia Office Supply, Inc.
J. Brad Steward, CPA
Shareholder & Partner
Pulakos & Alongi, Ltd.
Stephen D. Todd
Chief of Bank Financial Analysis
Capitol Bancorp Limited
Officers
J. Brad Steward
Chairman
Ronald K. Sable
Vice Chairman
Steven A. Marcum
President & CEO
Robert J. Valdiviez
Executive Vice President
& CCO
Benjamin R. Raskob
Senior Vice President
Antoinette E. Creel
Vice President
Brad L. Sackett
Vice President
Sunrise Bank of Albuquerque
219 Central Avenue NW, Suite 100
Albuquerque, NM 87102
505.244.8000
www.sunrisebankabq.com
SUNRISE BANK OF ARIZONA
Douglas E. White, President & CEO
What has been done to reposition the bank for success in the highly competitive Scottsdale market?
Sunrise Bank of Arizona’s team has embarked upon a journey to reconstitute our bank, rebuild its image, hire high-impact team members and reposition itself to compete in the highly competitive Scottsdale and Arcadia markets.
Branding is tantamount to the heart and soul of a company. Therefore, our first step was to establish a bright, young, fresh and lively image. This new image is reflected in our hard copy brochures and advertisements, and on our updated Web site through vibrant colors, smiling sunflowers, bright sunbursts and blue skies. Most will agree that we are not visually like any other bank in our community.
We built our Sunrise Bank philosophy S.T.A.F.F., Strategic, Team, Accessible, Flexible, and Friendly. Our team of specialists works with our business and consumer clients to help them build their strategic plans and to meet their specific needs. We are available for our clients twenty-four hours a day and seven days a week. We clearly determine how our clients want to do their business and we create a plan that does just that. We are their neighbor, friend and fellow business member.
Our focus is always on delivering exceptional service and building long-term relationships; consequently, we give our clients a departmental service guarantee — “our focus is on you.”
— Douglas E. White, President & CEO
Board of Directors
Thomas W. Beal
President
Beal Benefit Solutions
Patrick M. Devine
Vice President
CB Richard Ellis Brokerage Services
Richard E. Garcia
President & Designated Broker
Garcia Realty Advisors, Inc.
Craig Henig
Senior Managing Director
CB Richard Ellis Brokerage Services
George B. Jackson
Financial Consultant
A. G. Edwards & Sons
Michael L. Kasten
Managing Partner
Kasten Investments, LLC
John S. Lewis
President of Bank Performance
Capitol Bancorp Limited
Glen M. Lineberry
Director
Bentley Gallery, Inc.
Richard Lustiger
General Counsel
Harkins Theatres
Gregory G. McGill
Attorney at Law
Gregory G. McGill, PC
Jamie A. Molera
Partner
Molera Alvarez Group, LLC
Andrew C. Pacheco
Attorney at Law
Sanders & Parks
Joe W. Panter
Partner
Wildflower Bread Co.
Whitestone Financial
Douglas E. White
President & CEO
Sunrise Bank of Arizona
Officers
Michael L. Kasten
Chairman
Richard E. Garcia
Vice Chairman
Douglas E. White
President & CEO
Shari A. White
Secretary
David W. Tracy
Executive Vice President
& CCO
Gary M. Gibbs
Senior Vice President
Mary S. Madison
Senior Vice President
Robert J. Cantazaro
Vice President
Jon M. Chase
Vice President
Richard M. Manning
Vice President
George Sarkis
Vice President
Alex Solis
Vice President
Sunrise Bank of Arizona
4350 East Camelback Road, Suite 100A
Phoenix, AZ 85018
480.624.2600
6263 North Scottsdale Road, Suite 100
Scottsdale, AZ 85250
480.624.2600
www.sunrisebankofarizona.com
YUMA COMMUNITY BANK
Katherine M. Brandon, President & CEO
Describe the recent growth in the Yuma area, and what opportunities have been presented to the bank as a result.
Yuma Community Bank opened a second location in January 2008 in the Fortuna Foothills CDP (census-designated place), located in Yuma County, approximately 18 miles from Yuma. The Foothills are nestled in the Yuma and Gila Valleys of southern Arizona, offering a climate that blends pleasant desert sunshine with the cool waters of the Colorado River. The clean air affords residents and visitors alike a year-round vista of surrounding rugged mountains.
This area’s population grew from 20,478 in 2000 to an estimated 28,400 in mid-2008, an increase of 38.56%. However, the winter visitors are what makes Yuma and the Foothills explode for approximately five months out of the year. A Canadian newspaper referred to Yuma as the “winter-visitor capital of North America.” Over 99,000 winter visitors make Yuma their annual winter residence. Tourism continues to be one of Yuma’s largest industries, contributing over $600 million annually ($458 million attributed to winter visitor trade). While the economy has slowed down somewhat, the winter visitors are still coming back, with the largest concentration staying in the Foothills.
Deposits at our new location have exceeded projected growth by 23% in nine months. The value is our ability to gather deposits and meet the personal and small business banking needs of our community.
Yuma Community Bank continues to emphasize the fundamentals of sound banking. We look forward to ongoing growth in both locations in 2009.
— Katherine M. Brandon, President & CEO
Board of Directors
Dwayne T. Alford
General Manager & Vice President
Yuco Gin, Inc. II
Katherine M. Brandon
President & CEO
Yuma Community Bank
Clarence B. Cheatham
Vice President
DPE Construction
Raymond R. Corona
Optometrist & President
Corona Optique
Michael L. Didier
Treasurer
Select Seed of Arizona, Inc.
Ram R. Krishna, MD
President
Ram R. Krishna, MD, PC
John T. Osterman
President
Osterman Financial Group
Ronald K. Sable
President
Concord Solutions Ltd.
David S. Sellers
President
Sellers Petroleum
John R. Sternitzke
Owner
Sternco Engineers, Inc.
Pamela K. Walsma
Attorney at Law
Shadle & Walsma, PLC
Robert R. Woodman
Owner
Woodman Realty
Leonard C. Zazula
Corporate Cashier
Capitol Bancorp Limited
Officers
David S. Sellers
Chairman
Pamela K. Walsma
Vice Chairman
Katherine M. Brandon
President & CEO
Michael L. Didier
Secretary
Keith L. Simmonds
Executive Vice President
& CCO
Kari M. Reily
Senior Vice President
Theresa N. Wine
Senior Vice President
Jami L. Frandsen
Vice President
Yuma Community Bank
2285 South 4th Avenue
Yuma, AZ 85364
928.782.7000
11242 South Foothills Boulevard
Yuma, AZ 85367
928.345.3888
www.yumabank.com
Scott R. Andrews, Region President
18 Bank of Escondido
19 Bank of Feather River
20 Bank of San Francisco
21 Bank of Santa Barbara
22 Napa Community Bank
23 Point Loma Community Bank
24 Sunrise Bank of San Diego
25 Sunrise Community Bank
California is known as the Golden State and, for the Capitol Bancorp Limited banks in the California Region, this is an appropriate description. The Region consists of eight banks located from San Diego in the south to Yuba City in the north. With bank locations from Palm Desert to Santa Barbara to San Francisco and the Napa Valley, the uniqueness of California is evident in each of the California Region banks.
The various markets served by our banks all have their own opportunities and challenges. Each bank enjoys the strength of the markets they serve, as illustrated by wine industry financing in Napa, sportfishing industry financing in Point Loma, crop financing for almond and peach farmers in Yuba City, and traditional community bank lending in Escondido. We serve metropolitan areas in San Diego and San Francisco where our banks provide working capital lines of credit and commercial real estate loans to professionals and entrepreneurs. Finally, our banks in beautiful Santa Barbara and the resort community of Palm Desert offer market-specific products to clients in hospitality, medical and real estate-related industries.
The strength of the California Region can be found in its geographic and economic diversity as exemplified by each bank.
BANK OF ESCONDIDO
Michael R. Peters, President & CEO
How important are the long-term relationships with customers and the local community to the ongoing success and financial strength of Bank of Escondido?
Bank of Escondido was founded on the basis of long-term relationships. When we first embarked on organizing the bank, we selected members for the board of directors who were not only pillars of the community, but individuals who understood the value of relationship banking.
When it came time to bring the staff together, we hired a team of local bankers, many of whom had worked together for over 25 years. This experienced staff, with a proven track record for success, provided the base on which the bank has grown.
Another benefit of our emphasis on relationships was illustrated during the original stock offering of the bank. Virtually all of our investors had known the bank officers and employees, and many became our first customers. This focus has been a keystone to the ongoing financial strength and success of Bank of Escondido.
After five successful years, the bank has matured into a major contributor to the Escondido economy. Many of our staff members are active in community events and are ardent supporters of a variety of local community organizations. The Bank of Escondido has been recognized by the Downtown Business Association of Escondido for its contributions to the community. Our success and strength can be attributed to our success in building relationships among our directors, staff members and customers, which will stand the test of time.
— Michael R. Peters, President & CEO
Board of Directors
Scott R. Andrews
President, California Region
Capitol Bancorp Limited
Robert M. Cahan
President
Cahan Properties
Richard J. Fleck
President
Southland Paving, Inc.
Marvin L. Gilbert
President
North County Insurance
L. Richard Greenstein, MD
Anesthesiologist
Anesthesiologist Consultants
of California
Ronald G. Guiles
Senior Partner
GEM Educational Consultants
Mark E. Hayes
Owner
Mark E. Hayes, CPA
Joan M. Meyer, DPM
Podiatric Medicine
And Surgery
Michael F. Murphy
President
Computer Protection
Technology, Inc.
Michael R. Peters
President & CEO
Bank of Escondido
Officers
Michael F. Murphy
Chairman
Christopher S. Burt
Secretary & Executive
Vice President
Michael R. Peters
President & CEO
Michael C. Churchwell
Executive Vice President
& CCO
Linda I. Blakley
Senior Vice President
Helen M. Johnson
Vice President
Bank of Escondido
200 West Grand Avenue
Escondido, CA 92025
760.520.0400
Major Market Office
1855 South Centre City Parkway
Escondido, CA 92025
760.743.1198
www.bankescondido.com
BANK OF FEATHER RIVER
Julie A. Shackleford, President & CEO
What strengths do the experienced and talented local bankers at Bank of Feather River bring to the varied and unique communities it serves?
The Bank of Feather River was formed based on the core banking and customer-service values held by a group of local individuals who have spent almost their entire lives in the Yuba City area. We employ a team of experts who thoroughly understand the local marketplace and have assisted with building the dreams of many of the hardworking people who are the backbone of the local economy.
Our talented bankers, both lenders and operations staff, bring a level of experience not found in other local banks. Each of our loan officers know their respective industries, whether it be agriculture, commercial or construction lending and they know the people they are dealing with as friends and long-time business associates.
In these challenging economic times we are able to bring a wealth of experience and constructive advice for our clients. We are still in the business of helping our community members build their dreams for the future and that is what community banking is all about.
Even though Bank of Feather River is just one year old, our staff has spent many years serving our clients and community. People in our small community have confidence in us because we know how to give that special kind of service only a true community banker can provide.
— Julie A. Shackleford, President & CEO
Board of Directors
Scott R. Andrews
President, California Region
Capitol Bancorp Limited
Dinesh Bajaj
President
Natural Fashions Inc.
dba Natural Nut
Robert S. Deatsch
Vice President
Deatsch Insurance Agency
Brent W. Hastey
Owner
Hastey Consulting
Thomas A. Iverson, DDS, MS
Orthodontist & President
Iverson-Vota Dental Corp.
Murry D. Lewis
General Manager
Dow Lewis Motors, Inc.
Daniel V. Martinez
Partner
Martinez Hayes Hyatt & Hill LLP
Sean M. O’Neill
President
Genesis Engineering Inc.
Julie A. Shackleford
President & CEO
Bank of Feather River
Officers
Scott R. Andrews
Chairman
Julie A. Shackleford
President & CEO
Jeffery W. Cryer
Senior Vice President
Elizabeth J. Gates
Senior Vice President & COO
Harman S. Gosal
Vice President
Barbara J. VanGilder
Vice President
Bank of Feather River
1227 Bridge Street, Suite D
Yuba City, CA 95991
530.755.3700
www.bankoffeatherriver.com
BANK OF SAN FRANCISCO
Edward C. Obuchowski, President & CEO
How is Bank of San Francisco, with its experienced team of bankers, serving the financial and social needs of the greater Bay Area?
We are proud of our reputation as a bank that supports a wide variety of nonprofit organizations representing the diversity and divergent needs of the San Francisco Bay Area community. Employees volunteer for and serve on boards of organizations that provide services such as mental health assistance, after-school programs for children of low-income residents and training programs for low-income women entrepreneurs. Additionally, the bank has created a well-received tradition of having our client holiday gift be a special donation to a nonprofit organization.
We pride ourselves as the bank of choice for many nonprofits. Our diverse client base includes one of the oldest private high schools in San Francisco, a documentary film company, an organization that facilitates bone marrow transplants and a low-income neighborhood coalition group.
Along with our involvement with nonprofits, we have tackled the Bay Area’s economic challenge of affordable housing through the creation of our “Homes Within Reach” employer-assisted housing program. We were honored by the Mayor of San Francisco who recognized the program by proclaiming February 6, 2008 as “Bank of San Francisco Day.”
Having spent our entire careers in the San Francisco Bay Area, it gives our team special satisfaction knowing that we are giving back to the community that we so cherish.
— Edward C. Obuchowski, President & CEO
Board of Directors
Roberta Achtenberg
Member, Board of Trustees
The California State University
Scott R. Andrews
President, California Region
Capitol Bancorp Limited
Joseph P. Cristiano
Chairman
The MCM Group
James R. Dobberstein
Managing Director & Principal
Shea Labagh Dobberstein CPAs
Arthur F. Evans
President & CEO
AF Evans Company, Inc.
Susan E. Lowenberg
Vice President
Lowenberg Corporation
Kelly McCown
Co-Founder & Partner
McCown & Evans LLP
Susan S. Morse, CFA, CFP
Senior Advisor & Chief
Compliance Officer
Mosaic Financial Partners, Inc.
Edward C. Obuchowski
President & CEO
Bank of San Francisco
David J. O’Leary
Chairman
O’Leary Paint Company
George J. Vukasin Jr.
Executive Vice President
Peerless Coffee & Tea
Officers
Joseph P. Cristiano
Chairman
Scott R. Andrews
Vice Chairman
Edward C. Obuchowski
President & CEO
Raymond C. Brown
Executive Vice President
& CCO
Wendy A. Ross
Executive Vice President
Joan T. Bolduc
Senior Vice President
Edward G. Damgen
Senior Vice President
Gerry H. Klein
Senior Vice President
David J. Neagle
Senior Vice President
Ikuo Ogata
Senior Vice President
Donna D. Ostrowski
Senior Vice President
Timothy R. Rosenthal
Senior Vice President
Katherine J. Zinsser
Senior Vice President
Jollin H. Gonzales
Vice President
Lisa Lau
Vice President, Secretary
Satya W. Reddy
Vice President
Bank of San Francisco
575 Market Street, Suite 2400
San Francisco, CA 94105
415.744.6700
www.bankofsf.com
BANK OF SANTA BARBARA
Andy L. Clark, President & CEO
How do the custom financial solutions and personalized customer service provided by Bank of Santa Barbara meet the needs of the unique markets it serves?
At Bank of Santa Barbara, our lending activities are focused on local, small-to-medium-sized businesses and professional firms. This has proven to be a successful strategy as this market segment has remained relatively sound and steady. Our experienced team of banking professionals continues to work hard to develop new client relationships that bring additional low-cost core deposits to the bank.
We are able to customize financial solutions and provide a high level of personalized, professional service for our clients. We have had excellent success in deploying our new remote deposit product and we were one of the first banks in our region to introduce this new technology to the local businesses in our community. We are one of only a few local banks that offer the CDARS® product. Our cash management products are state-of-the-art and our clients have been extremely pleased with the capabilities of these services.
During 2008, Tom Caesar was elected as chairman of the board. Born and raised in Santa Barbara, he is a graduate of Santa Barbara High School and the University of California, Santa Barbara, and is a prominent local businessman. We pride ourselves on being a local bank with local experience. We are very pleased to have a true native son to lead our board of directors, sharing his business experience and providing us with great leadership at the Bank of Santa Barbara and in the community.
— Andy L. Clark, President & CEO
Board of Directors
Scott R. Andrews
President, California Region
Capitol Bancorp Limited
Greggory M. Bigger
President
Santa Barbara Bancorp
Ronald M. Blitzer
Member
Be Green Packaging, LLC
Thomas E. Caesar
Senior Vice President
Hub International Insurance
Thomas G. Carey
President
Carey & Kutay
Thomas Carey Construction
Andy L. Clark
President & CEO
Bank of Santa Barbara
David W. Grotenhuis
Partner
Santa Barbara Capital
Michael F. Hannley
President & CEO
Bank of Tucson
John L. Kavanagh
President
Kavanagh Companies
Craig A. Makela
President
Santa Barbara Olive Company
Frank E. McGinity, CPA
President
Frank E. McGinity Accountancy
Corporation
Timothy O’Connor, MD
President
Ventura Radiation
Oncology Group
Robert M. Ornstein, Esq.
Philanthropist &
Nonprofit Consultant
Officers
Thomas E. Caesar
Chairman
Andy L. Clark
President & CEO
Robert H. Rothenberg
Secretary
Executive Vice President
& CCO
Greggory M. Bigger
Senior Vice President
Andrew E. Chung
Vice President
Michael D. Duhamel
Vice President
Lisa M. Howard
Vice President
Paveena Luangprasert
Vice President
Elizabeth A. Winterhalter
Vice President
Bank of Santa Barbara
12 East Figueroa Street
Santa Barbara, CA 93101
805.730.7860
www.bankofsantabarbara.com
NAPA COMMUNITY BANK
Dennis J. Pedisich, President & CEO
What are the key factors to the consistently high level of success of Napa Community Bank, both financially and as an active community supporter?
Napa Community Bank’s success is due to the commitment of our employees to serve our clients and our community. We are not “just a bank” to our clients; we are part of their community — a part of their extended families. This does not happen overnight. It has to be earned and maintained. In today’s competitive environment, it is important for the bank to clearly differentiate itself. We have done so by making a trip to the bank a pleasurable experience. As a result, our clients consistently refer their friends to us.
Having the right team in place has enabled us to achieve a high level of success, both financially and as an active community supporter. We may not always have the highest deposit rates or the lowest loan rates, but we continue to grow along with our profits because our clientele is loyal. Our clients know we do what we say we will do.
Another way we are very proud to serve our community is sharing our success by supporting many nonprofit causes with our time and financial contributions. A recent customer satisfaction survey asked the question, “Where is the bank the most visible to you?” and many answered, “Employees attending and volunteering at local events.” It is a testament to the character of the bank when our clients let us know we are, in fact, “Putting Community Back Into Banking.”
— Dennis J. Pedisich, President & CEO
Board of Directors
Kevin S. Alfaro
Partner
G & J Seiberlich & Co., LLP
Thomas M. Andrews
Owner & CFO
Andrews & Thornley
Construction, Inc.
Geni A. Bennetts
Medical Consulting
Charles H. Dickenson
Partner
Dickenson, Peatman & Fogarty
Jeffrey L. Epps
President
Epps Chevrolet
Betty L. O’Shaughnessy-Woolls
Owner
O’Shaughnessy Estate Winery
John R. Pappas, DDS, MD
Oral & Maxillo-Facial Surgery
Advisory Directors
Scott R. Andrews
President, California Region
Capitol Bancorp Limited
Richard A. Bennett
Retired
Superior Court Judge
Joseph P. Cristiano
Chairman
The MCM Group
William H. Dodd
Napa County Board of Supervisors
Doug W. Hill
Vineyard Manager
Oak Knoll Farming, Inc.
Paul J. Krsek
Managing Partner
K & A Asset Management
Harold D. Morrison
President
Bridgeford Flying Service
David J. O’Leary
Chairman
O’Leary Paint Company
Dennis J. Pedisich
President & CEO
Napa Community Bank
Salvador S. Ramos
Vineyard Supervisor
Jaeger Vineyards
Officers
Geni A. Bennetts
Chairman
Jeffrey L. Epps
Vice Chairman
Dennis J. Pedisich
President & CEO
Charles H. Dickenson
Secretary
Douglas C. Haigh
Executive Vice President
& CCO
Mark C. Richmond
Senior Vice President
Joen M. McDaniel
Senior Vice President
James K. Fehring
Vice President
Shiloh M. Fehring
Vice President
Todd W. Horne
Vice President
Patrick J. McArdle
Vice President
Sandra J. Re
Vice President
Sheila G. Rogers
Vice President
Napa Community Bank
700 Trancas Street
Napa, CA 94558
707.227.9300
www.napacommunitybank.com
POINT LOMA COMMUNITY BANK
Anthony D. Calabrese Sr., President & CEO
How has community involvement and leadership led to the consistent and solid financial performance of Point Loma Community Bank?
Our business is based on relationships and our growth is based on the continued development of those relationships.
For the past four years we have immersed ourselves in the community. Our officers and staff are well known and serve on the boards of several local schools and organizations. Over time, those organizations and many of their members have moved their account relationships to Point Loma Community Bank. We are bankers they can trust. Our customers know our bankers are committed to the Point Loma community.
Not a day goes by that I am not thanked by someone in the community for a project or organization that our bank has supported. From the scoreboard for the local high school baseball team, our partnerships in education, the Point Loma Summer Concert Series, the Day at the Docks, or the Point Loma Association’s planting of trees, we give our time and talent, and the community has favorably responded to us.
As we move forward, we are confident that the strong foundation and relationships we have built in the community will continue to drive the consistent and solid financial performance of Point Loma Community Bank.
— Anthony D. Calabrese Sr., President & CEO
Board of Directors
Scott R. Andrews
President, California Region
Capitol Bancorp Limited
Gregg W. Beaty, DMD
Center for Oral, Maxillofacial &
Implant Reconstructive Surgery
Anthony D. Calabrese Sr.
President & CEO
Point Loma Community Bank
Maurice P. Correia, CPA
Correia & Associates
Arthur DeFever
President
DeFever Marine Enterprises
William T. Fiedler
President
Fiedler Construction Corporation
Harold O. Grafton
President
Cement Cutting, Inc.
Theodore Griffith
President
Pacific Tugboat Service &
Pearson Marine Fuel
Marcia Haas
Owner & Managing Partner
Aristocrat Apartments
Julius S. Paeske Jr.
President
Commercial Facilities, Inc.
Richard D. Thorn
Attorney & Owner
Ward & Thorn, PLC
Mark A. Winkler
Broker Associate
Prudential Realty
Officers
Scott R. Andrews
Chairman
Anthony D. Calabrese Sr.
President & CEO
William D. Scheffel
Executive Vice President
& CCO
Donald H. Gruhl
Senior Vice President
Millicent M. McKibbin
Senior Vice President
Leticia C. Trujillo
Senior Vice President
Jill M. Faucher
Vice President
Point Loma Community Bank
1350 Rosecrans Street
San Diego, CA 92106
619.243.7900
www.pointlomabank.com
SUNRISE BANK OF SAN DIEGO
Randall S. Cundiff, President & CEO
What are the key elements to the success of Sunrise Bank of San Diego, especially among the niche markets so effectively served by your experienced local bankers?
Consistency and focus are the key elements that have contributed to Sunrise Bank of San Diego’s success in this unique environment. The bank’s consistent, fundamental practices are designed to ensure safety and soundness. The stability and experience of our core management team and staff, which have been together for over five years, create a strong foundation. This continuity is a significant factor in our ongoing efforts to build client trust and manage the risks of our lending practices.
Oversight in our day-to-day practices, from lending and operations, to sales and relationship management, help maintain client loyalty and build shareholder value. Our bank is built on referral business from our client base. We continue to focus our efforts on niche markets that have contributed to the bank’s success. Small business and real estate construction lending remain focal segment markets for the bank. Converting transactions into long-lasting business relationships is our goal.
Leveraging our secondary market lender relationships will continue to be an important component to the bank’s success. Sunrise Bank of San Diego is well-positioned in the local market to take advantage of the opportunities ahead.
— Randall S. Cundiff, President & CEO
Board of Directors
Scott R. Andrews
President, California Region
Capitol Bancorp Limited
Craig V. Castanos
Owner
Craig V. Castanos, CPA
Randall S. Cundiff
President & CEO
Sunrise Bank of San Diego
Michael R. Labelle
Senior Director
Studley
Jack J. Landers
Account Executive
Teague Insurance Agency
John F. McColl
President
Trinity Capital Group
John M. Rooney
President
Torrey Financial Group
Elizabeth K. Strom
Leasing Director
The Irvine Company Office
Properties
Officers
Scott R. Andrews
Chairman
Randall S. Cundiff
President & CEO
Suzanne K. Gregory
Executive Vice President,
CCO & Secretary
Jill M. Campos
Vice President
Tammy L. DeWitt
Vice President
Gregory S. Fletcher
Vice President
Mary Jane Gertino
Vice President
Robin Hill
Vice President
Miranda E. Klassen
Vice President
Carla M. Kraft
Vice President
Michael H. Markie
Vice President
Sunrise Bank of San Diego
4445 Eastgate Mall, Suite 110
San Diego, CA 92121
858.625.9050
www.sunrisebanksd.com
SUNRISE COMMUNITY BANK
Stuart E. Bailey, President
How have innovation and a strong sales and service culture enabled Sunrise Community Bank to achieve such early success?
At Sunrise Community Bank, complete customer satisfaction is our main objective. Our two primary goals for 2008 were to provide the highest level of personal service and utilize the latest in technological support. With this technology, we developed our lockbox department for processing customers’ payments, notably, gated communities and country club dues payments. Offering remote deposit helped to expand our market and provide enhanced customer service.
Sunrise Community Bank maintains a sales philosophy stating, “Nothing happens until somebody sells something.” To that end, we established a Shareholder Advisory Committee of highly engaged investors who meet quarterly to recommend prospective bank customers and provide senior management with guidance for improving our bank’s performance.
Another key accomplishment was our work with our Capitol Wealth insurance affiliate to cross-sell employee health benefit programs to the bank’s business customers. This successful partnership has led to new insurance clients and bank customers.
In 2009, we will continue customer-service excellence, maintain our strategic sales culture for a changing, challenging economy, develop stronger referral networks to penetrate untapped markets and be our market’s provider of choice for financial products and services.
— Stuart E. Bailey, President
Board of Directors
Scott R. Andrews
President, California Region
Capitol Bancorp Limited
Stuart E. Bailey
President
Sunrise Community Bank
Debra L. Clark
Partner
Godecke Clark
George L. Gonzalez
President
Sierra Landscape Co., Inc.
Ronald B. Gregory
President
RGA Landscape Architects, Inc.
Brian S. Harnik
Attorney at Law
Roemer & Harnik LLP
Michael C. Hilgenberg
Owner & Operating Principal
Keller Williams Realty
William G. Kleindienst
Architect
WWCOT Mills Architects
Bruce J. Legawiec, CPA
Peterson Slater & Osborne
Karen Moller
Owner
Moller’s Garden Center
Robert S. Smith
President & Principal Engineer
MSA Consulting, Inc.
Richard E. Warfield
President
Personalized Property
Management
Officers
Scott R. Andrews
Chairman
Stuart E. Bailey
President
Fereshteh (Tay) Fried
Executive Vice President
Daniel T. Grenci
Executive Vice President
JoAnn Dangwillo
Vice President
William E. Johnston
Vice President
Deborah O. McGarrey
Vice President
Sheila D. Stillman
Vice President
Sunrise Community Bank
41990 Cook Street, Suite 701
Palm Desert, CA 92211
760.346.6139
www.sunrisecommunitybank.com
C. Gerard Nalezny, Region President
27 Fort Collins Commerce Bank
28 Larimer Bank of Commerce
29 Loveland Bank of Commerce
30 Mountain View Bank of Commerce
It is said that all politics are local and, to some extent, the same holds true for the economy. The Colorado market is by no means booming but, compared to the rest of the country, we have much for which to be grateful. Colorado did not experience the kind of appreciation or growth that was seen in much of the U.S. over the past few years. Ironically, this is now a strength in that we are not impacted as much by the current market correction. We were fairly flat before, and that was relatively weak compared to the rest of the nation. Our economy is still flat but relatively strong in comparison to economic conditions elsewhere.
That being said, the national economy does have a material impact on Colorado. This market, however, tends to play toward our strengths. We are rigorous in our underwriting and conservative in our approach to risk. Over the past several years we were able to grow despite these perceived obstacles due to the strength of our relationships and service. In today’s environment, our careful approach is viewed as a clear positive in the market and positions our Colorado banks to take advantage of the unique opportunities that develop.
FORT COLLINS COMMERCE BANK
C. Gerard Nalezny, President & CEO
How is the bank positioned to prudently take advantage of current market conditions?
Fort Collins Commerce Bank has continued to enjoy success in these challenging economic circumstances. We are setting higher performance standards for 2009 because the bar keeps rising. We are focused on customer service, employee appreciation, cost management, a more rigorous underwriting/risk management discipline and strategic business development.
One advantage of being in the Capitol Bancorp Limited family of banks is that we have many peer institutions from which to gain good ideas on how to be more efficient and effective. Focusing on these fundamentals of sound banking will allow us to continue to take advantage of our market.
One critique of the industry is that some loans that were funded should not have been; currently, however, we are seeing the opposite as good business is often challenged to find a home. Bluntly, we have less competition for quality relationships. We have seen increasing numbers of relationships that we have been calling on for years suddenly become available. A case in point would be a heart surgeon who moved an account to our bank in 2008. Taking advantage of these types of opportunities will allow us to succeed in 2009 and beyond.
— C. Gerard Nalezny, President & CEO
Board of Directors
Margaret A. Brown
Attorney at Law
Fischer, Brown, Bartlett & Gunn, PC
Rhys P. Christensen
Broker & Partner
Realtec
Thomas W. Hoogendyk, CPA
Hoogendyk and Associates
Danielle C. Korkegi
President
Cellular Junction, Inc.
Mark A. Kross
President & CEO
Larimer Bank of Commerce
Charles L. Lasky
President
Lasky, Fifarek & Hogan, PC
C. Gerard Nalezny
President, Colorado Region
Capitol Bancorp Limited
President & CEO
Fort Collins Commerce Bank
Richard F. Spillman, CPA
Hunt, Spillman & Associates, PC
Jack D. Vahrenwald
Attorney at Law
Allen, Vahrenwald & Johnson, LLC
Officers
Charles L. Lasky
Chairman
C. Gerard Nalezny
President, CEO
& Vice Chairman
Todd D. Guymon
Vice President
Erin N. Hunt
Vice President
Melissa D. Unter
Vice President
Fort Collins Commerce Bank
3700 South College, Unit 102
Fort Collins, CO 80525
970.204.1010
www.fortcollinscommercebank.com
LARIMER BANK OF COMMERCE
Mark A. Kross, President & CEO
How do the strengths of Larimer Bank of Commerce align with the current challenges and opportunities in this market?
Despite these challenging economic times, 2008 was a good year for Larimer Bank of Commerce. The bank is well-positioned to compete in the current weak economy because of its conservative lending philosophy, seasoned business development staff and aggressive resource management. As a result, Larimer Bank of Commerce will continue to do business in a much less competitive marketplace. Our experienced staff will continue to build new relationships in 2009, applying new products that will create efficiencies for both their personal and business accounts. The 2009 strategic focus will be rooted in our foundation of lean staffing and emphasis on client service.
Cost controls and internal oversight have put Larimer Bank of Commerce in a solid, profitable position that allows the bank the option of slower growth, stabilizing expenses and providing opportunities to target customers who we have invested time with since opening the bank.
Larimer Bank of Commerce is ready to continue working hard to meet customer needs while cautiously growing as we prepare for an improved economic climate.
— Mark A. Kross, President & CEO
Board of Directors
Michael L. Allen
President
Allen Plumbing & Heating, Inc.
Robin Bachelet
Owner & Broker
Maxiiimo Development
Venture Pro LLLP
Jason Ells
Partner & Broker
Realtec Commercial
Real Estate Services
Steven A. Hitz
President
US-Reports, Inc.
Peter Kelly
Partner & Broker
Realtec Commercial
Real Estate Services
Mark A. Kross
President & CEO
Larimer Bank of Commerce
Charles L. Lasky
President
Lasky, Fifarek & Hogan, PC
C. Gerard Nalezny
President, Colorado Region
Capitol Bancorp Limited
Wynne Odell
President
Odell Brewing Company
Officers
Charles L. Lasky
Chairman
C. Gerard Nalezny
Vice Chairman
Mark A. Kross
President & CEO
Jeff Schoonover
Senior Vice President
Ruth T. Johnson
Vice President
Larimer Bank of Commerce
1432 East Mulberry Street, Unit B
Fort Collins, CO 80524
970.224.7200
www.larimerbank.com
LOVELAND BANK OF COMMERCE
John A. Busby, President & CEO
What opportunities are Loveland Bank of Commerce seeing that are unique to this time in history?
We believe difficult economic times bring out the best in entrepreneurs and, despite present challenges, the vast majority of companies operate with strong business fundamentals, remain successful and take advantage of market conditions. Loveland’s business community is no different.
Business activity remains vibrant, albeit more diligent and reserved, given the current local economy. This entrepreneurial approach delivers opportunities across a wide spectrum of the greater economy from manufacturing to real estate and service-based business. Opportunities for growth, diversification, business acquisition or simply distancing one’s company from competitors, represent a few examples of the possibilities.
As Loveland Bank of Commerce enters into its second year of operation, we embrace the spirit of our business community. Companies which exhibit sound business fundamentals are looking for relationships with bankers and banks that can deliver diverse products and innovative solutions in difficult times. This is what we are about!
— John A. Busby, President & CEO
Board of Directors
John A. Busby
President & CEO
Loveland Bank of Commerce
Ryan J. Ferrero
Owner
Ferrero Mazda/
Ferrero Longmont Kia
Nanci J. Garnand
Real Estate Agent
RE/MAX Alliance
Eric L. Holsapple, PhD
Partner
Loveland Commercial LLC
Mark A. Kross
President & CEO
Larimer Bank of Commerce
Kenneth G. Larson
President & Treasurer
River Stone Management Co.
Charles L. Lasky
President
Lasky, Fifarek & Hogan, PC
Leon J. McCauley Jr.
President & Founder
McCauley Constructors, Inc.
C. Gerard Nalezny
President, Colorado Region
Capitol Bancorp Limited
Jon C. Patterson
Partner
Patterson-Talbert Law Offices
Officers
Charles L. Lasky
Chairman
C. Gerard Nalezny
Vice Chairman
John A. Busby
President & CEO
Steve K. Skaar
Executive Vice President
& CCO
Stephanie L. Rankin
Vice President &
Operations Manager
Loveland Bank of Commerce
102 East 29th Street
Loveland, CO 80538
970.679.7150
www.lovelandbankofcommerce.com
MOUNTAIN VIEW BANK OF COMMERCE
J. Andy Ellison, President & CEO
How is Mountain View Bank of Commerce adapting to current market conditions?
Current market conditions have presented a unique set of challenges and opportunities for our bank, our market area and our country as a whole. At Mountain View Bank of Commerce, we have focused on growing our deposit base while selectively adding new loan clients. We have also redoubled our efforts with our existing clients in order to assure that they will be part of our bank for many years to come.
At Mountain View Bank of Commerce, we maintain conservative loan underwriting practices. We are experiencing loan growth opportunities due to the tightening of loan underwriting at some of our competitors rather than from any changes we have made at the bank. We continue to believe that focusing on good credit quality and providing the best client care is our key to success. This is true in good times and even more so in challenging times.
— J. Andy Ellison, President & CEO
Board of Directors
James L. Carr
Retired
J. Andy Ellison
President & CEO
Mountain View Bank of Commerce
Ronald S. Faillaci
Retired
Kenneth E. Heuer, CPA
Office Director
Brock and Company CPAs, PC
Mason Carrington Jones
Owner
Carrington Jones LLC
Charles L. Lasky
President
Lasky, Fifarek & Hogan, PC
C. Gerard Nalezny
President, Colorado Region
Capitol Bancorp Limited
Tyr R. Peterson, DDS
Tyr R. Peterson, DDS, PC
Mark P. Russell
Managing Member
Steel Dimensions/Construction
Dimensions LLC
Michelle H. Welsh
Owner
American Family Insurance
Michelle Welsh Agency
Officers
Charles L. Lasky
Chairman
C. Gerard Nalezny
Vice Chairman
J. Andy Ellison
President & CEO
Thomas K. Courson
Executive Vice President
& CCO
Stephen L. Faillaci
Vice President
Jennifer M. Maes
Vice President
Mountain View Bank of Commerce
12365 Huron Street
Westminster, CO 80234
303.243.5400
www.mvbofc.com
John C. Smythe, Region President
32 Ann Arbor Commerce Bank
33 Bank of Auburn Hills
34 Bank of Maumee
35 Bank of Michigan
36 Brighton Commerce Bank
37 Capitol National Bank
38 Detroit Commerce Bank
39 Macomb Community Bank
40 Oakland Commerce Bank
41 Ohio Commerce Bank
It is widely known that Michigan and Ohio have experienced serious economic challenges during the last two years. What is not as well known is that we continue to enjoy pockets of opportunity in the region.
Ann Arbor Commerce Bank, Brighton Commerce Bank and Capitol National Bank, each a mature bank, continue to strengthen their core commercial banking operations by concentrating on relationship building within their respective local communities.
Our de novo banks, Bank of Auburn Hills, Bank of Michigan, Ohio Commerce Bank and Bank of Maumee, have each made good progress during 2008.
Current and future economic prospects have encouraged us to reexamine aspects of our Michigan operations to develop a more cost-efficient business strategy. To that end, we have centralized certain deposit and loan operation functions at banks that are geographically close to one another. This reorganization will provide significant operational cost savings while improving asset quality and credit administration through enhanced underwriting and monitoring procedures. Ongoing analysis of our loan portfolios is a priority.
Bank presidents and their senior management teams have worked diligently to strengthen their banks. I am confident we will see the rewards of our many current initiatives as we move through 2009, while we continue to draw upon the strength of Capitol Bancorp Limited to reinforce the principles of banking safety and soundness in the communities we serve.
ANN ARBOR COMMERCE BANK
Richard G. Dorner, President & CEO
The Ann Arbor region has been recognized as a unique, economically stable community existing within the challenged southeast Michigan economy. What sets Ann Arbor Commerce Bank apart?
Ann Arbor is a great place to live, work and play as has been demonstrated by numerous “Best Place to . . .” rankings over the years. During economic upturns and downturns, “brain gain” university towns embrace the challenge, recreating themselves with collective organic ideas that maximize the elements of today to become the substance of tomorrow.
Since our inception, Ann Arbor Commerce Bank has embraced this entrepreneurial philosophy, creating a strategic focus connecting our heritage with our mission of stewardship. Our foundation is built upon a commitment of excellence to customers, staff, shareholders and community. Our unchanging values have allowed Ann Arbor Commerce Bank to be successful over the years and will help us grow and flourish into the future.
We have created permanent positions in our local job market for ourselves and our clients. We purchase locally, so that our neighboring businesses thrive. We help customers improve their financial strength, constantly striving to create new products and services to meet our community’s ever-changing financial needs. Our staff and directors are connected and committed to our communities, providing time and energy to keep our community strong. The continued success of any organization is based upon a timely evaluation of conditions followed by a well-thought-through action plan. Our team has stood the “test of time”, and looks forward to the ever-changing landscape of the future.
— Richard G. Dorner, President & CEO
Board of Directors
Henry E. Alvarez, CPA
President & Managing Principal
Curtis, Bailey, Exelby & Sposito, PC
Richard G. Dorner
President & CEO
Ann Arbor Commerce Bank
Brian K. English
General Counsel
Capitol Bancorp Limited
James A. Fajen
Attorney at Law
Fajen & Miller, PLLC
James W. Finn
Chairman & CEO
Finn’s – JM&J Insurance
Agency, Inc.
H. Nicholas Genova
Chairman & CEO
Washtenaw News Co., Inc.
Richard M. Greene
Consultant
Richard Greene Point Training
Rene B. Greff
Owner
Corner Brewery
James C. Keen Sr.
CEO
Cliff Keen Athletic
David W. Lutton
President
Charles Reinhart Company
Realtors
David M. O’Leary
Co-President
O’Leary Paint Company
Fritz Seyferth
Principal
Fritz Seyferth & Associates
Clifford G. Sheldon
Retired Banker
Ann Arbor Commerce Bank
Carl Van Appledorn, MD
President & COO
Urological Surgery Associates, PC
Officers
James A. Fajen
Chairman
Richard G. Dorner
President & CEO
Clifford G. Sheldon
Secretary
John J. Wilkins
Executive Vice President
& CCO
Mary Hays
Senior Vice President
James L. Jeszke
Senior Vice President
Mary D. Gyorke
First Vice President
John Nixon III
First Vice President
Mark S. Aben
Vice President
Noelle C. Grigg
Vice President
Patrick J. McKeon
Vice President
Kathleen Slocum
Vice President
Ann Arbor Commerce Bank
2950 State Street South
Ann Arbor, MI 48104
734.887.3100
www.annarborcommerce.com
BANK OF AUBURN HILLS
Neal J. Searle, President
The Michigan Bankers Association recently requested the use of a letter you wrote that was sent to Bank of Auburn Hills’ customers as an example of how a bank can proactively communicate about safety and soundness. In addition to posting the letter on the bank’s Web site, how else does the bank protect customers?
Consumer protection is always a top priority. We value our customers and take every precaution to safeguard their deposits and make certain that their personal and financial information is secure.
Part of our responsibility, we feel, is to alert our customers to the latest trends in financial crimes. By being aware, they can protect themselves and their finances. Our awareness campaign includes posting the most recent consumer fraud warnings from the financial industry on the bank’s Web site. Online visitors simply access the Consumer Protection link at the top of our home page where they can access information about identity theft, fraud and Internet scams. We also post the current consumer warnings from the financial industry.
My letter to customers is also posted on the home page of the bank’s Web site. We want the community to know that money deposited at Bank of Auburn Hills is safe and secure.
Banking with us is all about security and convenience. These efforts begin at the bank and extend to the front doors of our customers. We can save our customers a trip to the bank by sending our courier who is a retired police officer. And even more convenient and secure is our remote deposit product that allows business customers to scan checks and make deposits right from their own offices.
Safety and soundness are a priority at the Bank of Auburn Hills.
— Neal J. Searle, President
Board of Directors
Kenneth D. Currie
Business Consultant
Currie and Associates
Frederick Gordon
Attorney at Law
Jerome D. Hill, JD
Of Counsel
Butzel Long
Jason M. Horton
Independent Consultant
Grand Sakwa Properties
Richard L. Horvath
Retired Vice President
Finance & Administration
Atlas Copco Tools & Assembly
Systems, Inc.
Elena H. Houlihan
President & Owner
Elena’s
Brian G. McGinnity
Director & Chief Financial Officer
Hirotec America
Michael M. Moran
Chief of Capital Markets
Capitol Bancorp Limited
Frank Salucci, CPA
Capital Resources of Michigan, Inc.
Retired – Derderian, Kann, Seyferth
& Salucci, PC
Neal J. Searle
President
Bank of Auburn Hills
John C. Smythe
President, Great Lakes Region - East
Capitol Bancorp Limited
Advisory Directors
David L. Polk, CPA
Principal, Polk &
Associates PLC
Gary M. Wetstein, CPA
Retired
William N. Widmyer
Business Consultant
and Real Estate Investor
Marc I. Wittenberg, MD
Pain Care Associates
Officers
John C. Smythe
Chairman
Brian G. McGinnity
Secretary
Neal J. Searle
President
Julie B. Pellerito
Vice President & CCO
Cheryl L. Gault
Vice President - Lending
Bank of Auburn Hills
1988 North Opdyke Road
Auburn Hills, MI 48326
248.370.8200
www.bankofauburnhills.com
BANK OF MAUMEE
H. Lee Dunn Jr., President & CEO
What steps is Bank of Maumee taking to ensure that the bank reflects the community, both in physical and economic reinvestment?
Now in its third year of business, the Bank of Maumee started with close to 300 initial investors, many of whom do business with the bank today. We lease our office space from a local real estate holding company that has made a significant investment in building improvements and we purchased furniture and fixtures from area vendors.
Our bank employs 11 local financial services professionals, who enjoy competitive wages and benefits that indirectly stimulate the local economy. Additionally, the bank has paid a considerable sum in state and local taxes that help fund a myriad of public services for our fellow Ohioans.
The real benefit to the community has been the economic development our bank has financed since its debut in 2006. Each month we enlist new customers — small business owners, professionals, entrepreneurs and homeowners. We retain their business through personalized service and a complete platform of financial services that are designed to be efficient, convenient and cost effective. Plus we offer added value to our business customers by publicizing their services on our Web site and in the bank with our program called Spotlight on our Small Business Clients.
Our employees donate hundreds of hours each year by serving on nonprofit boards and taking part in other community activities. Of course we want to make customers for life, but we are also committed to making our community the best place to work, do business and raise families.
— H. Lee Dunn Jr., President & CEO
Board of Directors
Robert E. Alexander
President & CEO
YMCA of Greater Toledo
Thomas J. Beutler, CPA, CVA
Mosely, Pfundt, Platz and Glick Inc.
Alan W. Brass
Chief Executive Officer
ProMedica Health System
Thomas P. Cox, MD
ProMedica Physicians
Peter A. Dewhirst
Attorney at Law
Shindler, Neff, Holmes,
Schlageter & Mohler, LLP
H. Lee Dunn Jr.
President & CEO
Bank of Maumee
Brian K. English
General Counsel
Capitol Bancorp Limited
C. Edward Harmon
President
Spartan Logistics
Juan A. Hinojosa
Owner
Mondo Mechanical
Brian J. Pribis, CPA, MT, CVA
Owner
Ohio Table Pad Company
James L. Regan
President
Regan Insurance Agency
Peter S. Shawaker, CCIM, SIOR
Commercial Realtor
CB Richard Ellis/Reichle Klein
Officers
Brian K. English
Chairman
H. Lee Dunn Jr.
President & CEO
Richard D. Heltzel
Executive Vice President,
CCO & Secretary
Kevin T. Rahe
Executive Vice President
& Senior Loan Officer
Roxie A. Hill
Vice President
Susan C. Martin
Vice President
Bank of Maumee
3425 Briarfield Boulevard, Suite 100
Maumee, OH 43537
419.868.1750
www.bankofmaumee.com
BANK OF MICHIGAN
Michael G. Sarafa, President & CEO
How does Bank of Michigan maintain high-credit quality while steadily increasing its client base?
Honor in banking is a core principle at Bank of Michigan when it comes to customer care and treatment. At Bank of Michigan, our staff prides itself on ensuring that our clients want to bank with us. Each and every client contact and transaction is based on friendliness, professionalism and mutual respect.
Similarly, it is our goal at Bank of Michigan to bank with clients who value honor in their professional relationships. The vast majority of our clients are referred to us by our board members or existing clients. Our ability to know our clients has been a key component to our success and is the single most important reason why we have been able to perform well during difficult times. This culture pervades the bank with our staff, management and board of directors.
Our directors have kept us in good stead with their informed directness on matters relating to loan quality and business development, and their approach to managing risk. Our strategy of smart growth demonstrates a decision-making process that is patient and mature. It is grounded in years of practical business experience and strong relationships.
This ethic has been carefully developed over the last several years and has prepared Bank of Michigan for continued success in the years to come.
— Michael G. Sarafa, President & CEO
Board of Directors
Ronald G. Acho
Senior Partner
Cummings, McClorey,
Davis & Acho
Anthony G. Antone
Vice President of Development
Kojaian Management Corporation
Randall A. Denha
Attorney
Cox, Hodgman & Giamarco, PC
Nitin P. Desai, CPA
Director of Assurance
& Tax Services
Martin Arrington Desai &
Meyers PL
Patrick J. Gregory, CPA
Managing Director
UHY Advisors
Burt S. Kassab
Vice President
Kullen & Kassab, PC
Martin F. Manna
Managing Partner
Interlink Media
Nick M. Sandiha
Manager
Sandiha Holdings, LLC
Michael G. Sarafa
President & CEO
Bank of Michigan
Bruce A. Thomas
President of Bank Operations
Capitol Bancorp Limited
Al S. Yaldo, CPA
Vice President
Shimoun, Yaldo & Associates, PC
Officers
Bruce A. Thomas
Chairman
Michael G. Sarafa
President & CEO
Thomas M. Linden
Executive Vice President
& CCO
Cindy L. Jensen
Executive Vice President
Carrie L. Mika
Senior Vice President
Jack Abbo
Vice President
Barry J. Boozan
Vice President
Roxanne C. Wiemer
Vice President
Bank of Michigan
30095 Northwestern Highway
Farmington Hills, MI 48334
248.865.1300
www.bankofmi.com
BRIGHTON COMMERCE BANK
Gary T. Nickerson Sr., President & CEO
How has Brighton Commerce Bank established a base for the continued sound development of the bank?
Our associates’ keen understanding of the Brighton community, their involvement in the organizations that keep the community strong and prosperous and their unwavering work for the bank, both internally and in the community, have all contributed to Brighton Commerce Bank’s success.
If knowing the customer is an important rule for safety and soundness in banking, then understanding the community is an important characteristic of a successful hometown bank. Our associates continue to build on their local knowledge by staying active with the community schools, municipal governments, chamber of commerce, realtor association and the United Way. Our team meets with numerous prospective customers to learn about various proposed economic development projects while participating in community activities.
Our professional staff has extensive knowledge gained from their banking careers that they share with customers and management. They also do their homework by reviewing the necessary financial documents ahead of time so that they can make informed decisions about the various business proposals the bank may help finance.
By taking a vested interest in the community, which assists in making informed business decisions on loans, products and services, our associates contribute significantly to the ongoing success of Brighton Commerce Bank.
— Gary T. Nickerson Sr., President & CEO
Board of Directors
John C. Codere
Consultant
Building Industry
Michael B. Corrigan
President
Corrigan Oil Company, Inc.
Scott C. Griffith
President
ERA Griffith Realty
William LaMarra
Chairman & CEO
Excelda Manufacturing
Piet W. Lindhout
CEO
Lindhout Associates Architects, AIA
Lyle W. Miller
President
L. W. Miller Holding Co.
Gary T. Nickerson Sr.
President & CEO
Brighton Commerce Bank
Kacee M. Reid
Attorney at Law
Kacee M. Reid PLC
Mitchell J. Stanley
President
Mickey Stanley Associates
Officers
Lyle W. Miller
Chairman
Michael B. Corrigan
Vice Chairman
Gary T. Nickerson Sr.
President & CEO
Linda K. Lavely
Senior Vice President
Joseph M. Petrucci
Senior Vice President & CCO
John Szydzik
Senior Vice President
& Cashier
William R. Anderson
Vice President
Mark R. DuShane
Vice President
John M. Hulyk
Vice President
Corey M. Ruthig
Vice President
Brighton Commerce Bank
8700 North Second Street
Brighton, MI 48116
810.220.1199
www.brightoncommerce.com
CAPITOL NATIONAL BANK
Paula D. Cunningham, President & CEO
With many challenges facing mid-Michigan, how has Capitol National Bank continued to attract new customers while retaining its original, loyal base of investors?
At year-end 2008, the unemployment rate in Lansing exceeded 9.6%. General Motors, Ford and Chrysler were poised to file bankruptcy. More than 650 families in Lansing needed winter coats. Property values were plummeting and more than 143,000 homes in Michigan were identified for foreclosure.
These are not just statistics. These are customers, community partners and friends. When an economic tsunami hits one business we all feel the aftermath. It would be easy to succumb to the recession as an excuse for not building on relationships with customers. However, this is the time that customers need us the most and the time when we must maximize our potential.
In 2008, our entire team, including our board of directors, worked to become more knowledgeable about the products and services we offer. Everyone was briefed on the benefits of health savings accounts (HSAs), remote deposit, online banking, credit cards, and other products and services. We became more entrepreneurial in our thinking. As a result, we sold more than 74 HSAs; as customers switched to remote deposit, we were able to reduce courier hours and CDARS® has helped us maintain and grow deposit relationships. Our health care division continues to be a valuable resource. Special thanks to Kevin Kelly, our most honored director, who passed away in December 2008. He was instrumental in launching the Capitol National Bank Health Care Council.
Customer retention and loyalty can still thrive in a poor economy. When we build relationships we not only enhance our business, we enhance lives.
— Paula D. Cunningham, President & CEO
Board of Directors
Christopher J. Abood, MD
President & CEO
Centis Health
Nan Elizabeth Casey
Attorney at Law
Oade, Stroud & Kleiman, PC
Charles J. Clark
President
Clark Construction Company
Paula D. Cunningham
President & CEO
Capitol National Bank
Frank Garrison
Past President
AFL-CIO of Michigan
Patrick F. Hayes
President
F. D. Hayes Electric Company
Richard A. Henderson
President
Henderson & Associates, PC
J. Christopher Holman
Publisher
The Greater Lansing Business
Monthly
Lewis D. Johns II
Vice President
Mid-Michigan Investment Co.
Charles J. McDonald
Director of Product Development &
Management
Capitol Bancorp Limited
Kelly D. Miller
Director of Specialty Finance
Capitol Bancorp Limited
John D. O’Leary
Co-President
O’Leary Paint Company
Cristin K. Reid
Corporate President
Capitol Bancorp Limited
Robert L. Reid
Owner
Reid Real Estate, LLC
Patricia A. Reynolds
Community Volunteer
John C. Smythe
President, Great Lakes Region - East
Capitol Bancorp Limited
Officers
Cristin K. Reid
Chairman
John C. Smythe
Vice Chairman
Paula D. Cunningham
President & CEO
Patrick F. Hayes
Secretary
Patricia Lloyd-Barnas
Senior Vice President
David E. Feldpausch
Senior Vice President
Nancy J. Fox
Vice President
Lori M. Garcia
Vice President
Michael S. Heath
Vice President
Capitol Wealth Advisors
Deborah R. Keyes
Vice President
Kathryn H. Korpi
Vice President
Jennifer S. Marsh
Vice President
Theodore M. Terzian
Vice President
Capitol Wealth Advisors
Ronda M. Thompson
Vice President
Capitol National Bank
200 Washington Square North
Lansing, MI 48933
517.484.5080
Meridian Office
4792 Marsh Road
Okemos, MI 48864
517.347.1006
Delta Office
644 Migaldi Lane
Lansing, MI 48917
517.627.8881
www.capitolnational.com
DETROIT COMMERCE BANK
Harold G. Curry, President & CEO
The strategic plan for Detroit Commerce Bank has many facets, including identifying potential customers outside of the dominant auto-related industries. How has the bank positioned itself to prepare for the future?
The majority of the businesses in the Detroit area and surrounding Wayne County market have a direct, indirect or relevant tie to, and reliance upon, the automotive industry. Since its inception, the strategic plan for Detroit Commerce Bank has included proactively diversifying its client base to reduce concentrations in any one business segment, including auto-related businesses.
While Detroit Commerce Bank has provided commercial banking services primarily to the dominant auto business community, it has positioned itself to service a diversified client base with products and services that limit its reliance on the automotive industry. Detroit Commerce Bank is expanding its customer base to include the professional services area in this market with new relationships in the medical, accounting, insurance and legal services communities. We have also developed a direct relationship with the public, private and charter schools, as well as community colleges. In addition, we have focused new business with those that provide contract services and other support to the education field.
We are engaging in new relationships with the not-for-profit community and provide other community support beyond the traditional bank services. In addition, we are also targeting the niche businesses that service other industries in our primary market to minimize the direct exposure to the automotive industry.
Detroit Commerce Bank’s future includes expanding the quality of its products and financial services for existing and prospective customers while sustaining exemplary bank safety and soundness practices.
— Harold G. Curry, President & CEO
Board of Directors
James P. Allen Sr., Esq.
Attorney at Law
Allen Brothers, PLLC
Richard B. Broder, CPM
President
Broder & Sachse
Real Estate Services, Inc.
Ralph J. Burrell
President
SymCon
Harold G. Curry
President & CEO
Detroit Commerce Bank
Donald M. Davis Jr.
Vice President
Human Resources and
Customer Relations
Health Alliance Plan
Edward Deeb
President
Michigan Business &
Professional Association
Dr. Curtis L. Ivery
Chancellor
Wayne County Community
College District
Gregory Kelser
Broadcaster, FSN Detroit
Detroit Pistons
Raymond Lozano
Executive Director
Michigan Hispanic Chamber
of Commerce
Kelly D. Miller
Director of Specialty Finance
Capitol Bancorp Limited
Shirley R. Stancato
President & CEO
New Detroit, Inc.
James F. Stapleton
President
B & R Consultants
Edward Tinsley
Principal
Longfellow Group
Neal F. Zalenko, CPA
Retired Partner
VIrchow, Krause & Company
Officers
Edward Tinsley
Chairman
Neal F. Zalenko
Vice Chairman
Harold G. Curry
President & CEO
Donald M. Davis Jr.
Secretary
Mark V. McCulloch
Senior Vice President
Joyce A. Sutton
First Vice President
James R. Blanks
Vice President
Valora L. Cook
Vice President
Richmond J. Hawkins
Vice President
Willie L. Smith
Vice President
Detroit Commerce Bank
645 Griswold Street, Suite 70
Detroit, MI 48226
313.967.9700
www.detroitcommerce.com
MACOMB COMMUNITY BANK
James R. Kaye, President & CEO
How has Macomb Community Bank embraced the philosophy of its local chamber in creating “Greater Voice, Greater Connections, Greater Value?”
Similar to the Capitol Bancorp Limited affiliation, there is power in numbers with a chamber membership.
Our membership with the Macomb County Chamber of Commerce clearly gives Macomb Community Bank a greater voice in local business matters. As an advocate for small businesses, the chamber is composed of entrepreneurs who understand the wisdom of coordinating their efforts for the advancement and development of the Macomb community. The chamber is a catalyst for economic growth and development through its communications regarding public policy issues that affect the business community as a whole.
The chamber connects our bankers with representatives of small and mid-sized businesses that are potential bank clients. Chamber activities provide some of the most productive venues for developing new business, learning about our community and generating new ideas for improving the delivery of services to our existing clientele.
The added value of chamber membership comes in many forms; it provides instant credibility for businesses of all sizes, along with a wide array of educational, marketing and business development opportunities.
The Capitol Bancorp affiliation provides similar benefits for our bankers. It supplies our bankers with a complete line of banking products and services. It empowers us to connect with entrepreneurs by offering our team a variety of educational, marketing and business development opportunities. It affords us all the tools to compete. It is exactly what bankers need in today’s competitive marketplace.
— James R. Kaye, President & CEO
Board of Directors
Brian K. English
General Counsel
Capitol Bancorp Limited
James R. Kaye
President & CEO
Macomb Community Bank
John S. Lewis
President of Bank Performance
Capitol Bancorp Limited
John C. Smythe
President, Great Lakes Region - East
Capitol Bancorp Limited
Bruce A. Thomas
President of Bank Operations
Capitol Bancorp Limited
Officers
John C. Smythe
Chairman
James R. Kaye
President & CEO
Robert J. Malek
Executive Vice President
& CCO
Nicolet B. Cassidy
Vice President
Andrew G. Harper
Vice President
Macomb Community Bank
16000 Hall Road, Suite 102
Clinton Township, MI 48038
586.228.1600
www.macombcommunity.com
OAKLAND COMMERCE BANK
John C. Smythe, President & CEO
How will Oakland Commerce Bank adapt to better meet the needs of its customers in 2009?
Oakland Commerce Bank recently completed a retooling of its banking facilities to create a more efficient and customer-friendly work environment. The renovations are designed to allow us to better serve our customers in a professional and confidential setting.
Additionally, Oakland Commerce Bank will be part of an operational centralization of Capitol Bancorp Limited’s Michigan affiliates, which will allow our staff to focus on our customers and our community. During these challenging economic times, this centralization will free up the onsite staff so that they can better assist their customers by partnering with them to navigate the difficult environment.
As for many Michigan businesses and banks, 2008 was a thought-provoking year for Oakland Commerce Bank. In response to the new stresses introduced into the economy, our bank specialists invested a great deal of time working with our borrowers to find solutions to their individual circumstances caused by the weak economy, deteriorating asset values and lower income levels.
The centralized operations previously discussed will further strengthen the bank’s loan portfolio management and controls which will then improve overall credit quality and earnings opportunities as we envision a brighter economic future.
— John C. Smythe, President & CEO
Board of Directors
Michael J. Devine
Attorney at Law
Brian K. English
General Counsel
Capitol Bancorp Limited
John S. Lewis
President of Bank Performance
Capitol Bancorp Limited
John C. Smythe
President, Great Lakes Region - East
Capitol Bancorp Limited
President & CEO
Oakland Commerce Bank
Bruce A. Thomas
President of Bank Operations
Capitol Bancorp Limited
Officers
Michael J. Devine
Chairman
John C. Smythe
President & CEO
Paula K. Boegner
Executive Vice President
Robert. J. Malek
Executive Vice President
& CCO
Thomas K. Perkins
Senior Vice President
Oakland Commerce Bank
31731 Northwestern Highway, Suite 100
Farmington Hills, MI 48334
248.855.0550
www.oaklandcommerce.com
OHIO COMMERCE BANK
Dell R. Duncan, President & CEO
As a newer bank, how has Ohio Commerce Bank been able to develop such a loyal and diversified group of depositors while establishing a sound deposit portfolio?
Ohio Commerce Bank opened in 2006 with a mission to serve important segments of our business community; small and mid-sized businesses and professionals. Our strategy from the beginning has been to deliver products and services in a creative and consistent manner designed to build relationships and contribute to the success of our customers.
Most rewarding in this process has been our deposit gathering efforts where the board, management and staff all worked together in raising significant deposits with a high level in the noninterest category. Providing depositors with convenience and reliability of service has been equally critical to the success of this program.
Knowledge of products and services, as well as the needs of each customer, has played an important role in this relationship-building process. Introduction of the CDARS® program and the effective employment of remote deposit, lockbox and cash management products have resulted in increased loyalty to the bank.
At Ohio Commerce Bank, we believe our commitment to our business strategy and believing that “It’s All About Attention” has been key to our success to date.
— Dell R. Duncan, President & CEO
Board of Directors
L. Louis Amoroso
Retired Bank Executive
Commerce Exchange Bank
John P. Andrews
President
Industrial Security Services, Inc.
Dell R. Duncan
President & CEO
Ohio Commerce Bank
Lawrence D. Katz
Owner
L. Katz Coaching & Consulting
Stuart F. Kline
President
Chase Properties, Ltd.
Mark A. Mintz
Director & Founder
SageQuest
Cary M. Root
President
American Logistics Group, Inc.
Kathleen L. Seitz
Director
CBIZ Accounting, Tax & Advisory
Services
Christopher J. Smerglia
Executive Vice President & CCO
Ohio Commerce Bank
John C. Smythe
President, Great Lakes Region - East
Capitol Bancorp Limited
Gary A. Vaccaro
Retired Banker
Ohio Commerce Bank
James R. Wymer
President
WXZ Development, Inc.
Gregory S. Zenczak
President
Orttech Inc.
Stephen J. Zenczak
President
Triad Investments, Inc.
Officers
L. Louis Amoroso
Chairman
Gary A. Vaccaro
Vice Chairman
Mark A. Mintz
Secretary
Dell R. Duncan
President & CEO
Christopher J. Smerglia
Executive Vice President
& CCO
Jamie A. Brotherton
Senior Vice President
Richard J. Miller
Vice President
Ohio Commerce Bank
24400 Chagrin Boulevard, Suite 100
Beachwood, OH 44122
216.910.0550
www.ohiocommercebank.com
Dennis J. Kuhn, Region President
43 Elkhart Community Bank
44 Evansville Commerce Bank
45 Goshen Community Bank
46 Grand Haven Bank
47 Kent Commerce Bank
48 Muskegon Commerce Bank
49 Paragon Bank & Trust
50 Portage Commerce Bank
The Great Lakes Region – West is comprised of eight affiliate banks stretching from Muskegon, Michigan, to Evansville, Indiana, which is approximately 500 miles. While the distance might lead one to believe that these banks would exhibit significant differences, there are far more similarities. Most significantly, the banks maintain an unwavering dedication to the practice of relationship-based banking.
Our banks also share the same daily challenges presented by the current economic climate. As a result, the banks are continually developing new standards to better manage their resources, both human and financial, and enhance asset quality.
We have taken an important step to strengthen banking practices and directly address the challenging market. By focusing on efficient and consistent backroom operations and aligning teams of highly experienced bankers, we have implemented standard operations procedures, which allow the banks to more efficiently allocate resources and capital within their respective communities and place a greater emphasis on serving client needs.
We will continue to adapt our practices to the current environment and look forward to sharing our successes with you now and in the future.
ELKHART COMMUNITY BANK
Steven L. Brown, President & CEO
Your market has faced challenging economic times before. What best practices will the bank utilize in order to weather the current situation?
The key is prudent lending practices before the downturn. Maintaining a strong credit environment when times are good is the best way to survive a market when the economy weakens. As a community bank, we look at each loan individually and maintain a lending discipline based on both the strength of the request and the people supporting the inquiry.
The second most important thing during difficult times is maintaining an active and open line of communication with our clients. Our smaller size gives us an advantage when it comes to relationship banking because we know our clients personally. As part of their inner circle, we are more likely to minimize surprises and make more informed decisions.
Lastly, we have maintained a very low overhead operation. As a single bank location with a small, talented staff, we have minimized our overhead costs.
Although we are monitoring the economic situation as closely as we can, we do not know how long this downturn will last. We do know that by maintaining a strong credit environment, continuing to maintain communications with our clients and controlling costs, we have put ourselves in the best position to successfully respond to issues and look forward to better days ahead.
— Steven L. Brown, President & CEO
Board of Directors
R. Steven Bennett
President
Voyager Products
Danniel L. Brekke
President
Gateway Builders & Properties
Kenneth W. Brink
President
Elkhart Cattle and Land, LLC
Steven L. Brown
President & CEO
Elkhart Community Bank
Lain Ruch Downs
Executive Director
The Centre, PC
Curtis T. Hill Jr.
Attorney at Law
Elkhart County Prosecuting
Attorney Office
Michael L. Kasten
Managing Partner
Kasten Investments, LLC
Richard L. Max Sr.
President & General Manager
Heart City Enterprises -
House of Herbs
Myrl D. Nofziger
President
Hoogenboom Nofziger
Brian J. Smith, CPA
President
The Heritage Group
Officers
Michael L. Kasten
Chairman
Myrl D. Nofziger
Vice Chairman & Secretary
Steven L. Brown
President & CEO
Lori A. Faltynski
Vice President
Duane S. Klein
Vice President & CCO
Vincent J. VonDerVellen
Vice President
Elkhart Community Bank
303 South Third Street
Elkhart, IN 46516
574.295.9600
www.elkhartbank.com
EVANSVILLE COMMERCE BANK
Thomas L. Austerman, President
As a maturing de novo bank, how will Evansville Commerce Bank refine its business practices in order to address the local market trends and generate sustainable performance?
Given the challenges financial institutions are facing today, one of the more appropriate axioms is: “In the end, success or failure is not about what happens to you; rather, it is about your response to what happens to you.” Believing this, we have to behave as if what we do going forward will affect the results far more than where the present economic environment, national or regional, places us.
Our staff is committed to the proposition that it is our complete responsibility to deal with the current economic environment realistically as it is and simply take whatever steps are necessary to preserve capital and maintain profitability.
We recognize that the best, proven way to earn the wider interest margins and noninterest income required to achieve satisfactory performance is to offer outstanding service combined with premium products that result in the best overall value for the client. At the same time, we understand we will not maximize income until we optimize overhead and minimize expenses.
We believe our success in meeting performance goals hinges on profitability and quality of our relationships. Therefore, we are determined to work with our clients more closely than ever to reduce credit risk, while working to help them become as financially strong as possible. Close credit administration, together with providing the best financial advice possible offers the surest path to mutually beneficial relationships.
— Thomas L. Austerman, President
Board of Directors
Thomas L. Austerman
President
Evansville Commerce Bank
John W. Beman, MD
Retired Physician
Marie A. Bussing-Burks
Professor
University of Southern Indiana
College of Business
Gail A. Dunn
Community Affairs Director
Dunn Hospitality
Katherine L. Kleindorfer
Consultant
Drew F. Peyronnin
Executive Vice President
Peyronnin Construction Company
Reed S. Schmitt
Attorney
Rhine Ernest, LLP
Frank J. Schultheis
Chairman & Partner
Evansville Holding Inc.
Insuremax Insurance Co.
John C. Smythe
President, Great Lakes Region - East
Capitol Bancorp Limited
Andrew T. Spurling
Property Manager
Spurling Management, LLC
Laurence R. Steenberg
President
BST Corporation
Kristen K. Tucker
Vice President
Tucker Publishing Group
Robert B. Wright
President
Wright Motors Inc.
Officers
John C. Smythe
Chairman
Nina K. Fink
Recording Secretary
Thomas L. Austerman
President
Christopher M. Pfister
Executive Vice President
Jaron L. Hargis
Vice President & CCO
R. Jeanne Kelly
Vice President
Karen J. Sosh
Vice President
Lucas J. Yaeger
Vice President
Evansville Commerce Bank
20 NW 4th Street
Evansville, IN 47708
812.492.1800
www.evansvillecommercebank.com
GOSHEN COMMUNITY BANK
Douglas A. Johnston, President & CEO
Discuss the bank’s referral team concept highlighting some of the successes.
Business referrals are a driving force for Goshen Community Bank’s growth. We have an incentive program that encourages employees and board members to make referrals.
We launched a referral contest series in 2007 and it has continued with great success. The referral contests consist of three teams, composed of a mix of employees and bank board members. Each contest runs for three months and concludes with a winning team that has identified the most referrals and new banking relationships. During the contest each team meets monthly to discuss referral opportunities and to share ideas and advice on how to identify and obtain referrals. Teams are assisted by 29-year salesman and business development officer, Jeff Showalter, who does not participate in the contest but attends each team meeting to help employees excel at obtaining referrals.
In 2008, we held three contests generating a total of 149 referrals. As a result of the contests, our employees and board members referred $1.4 million in loans to our residential department. Capitol Wealth Advisors received a referral for a person who sold a business and had $2 million to invest. Referrals accounted for $2 million in new deposits for CDARS®, which allows our customers to receive FDIC insurance for deposits up to $50 million.
Referrals from our employees and business partners are crucial to our bank’s success. Goshen Community Bank continues to expand its customer base and relies on its customers to help refer the bank to others.
— Douglas A. Johnston, President & CEO
Board of Directors
David L. Cripe
Doctor of Optometry
& Senior Partner
Cripe, Stephens & Stickel, LLP
Kevin Deary
President & CEO
Boys & Girls Club of
Greater Goshen
Stephen L. Fidler
President
Kuert Concrete, Inc.
Christopher J. Graff
CEO & Chairman
SJC Industries Corp.
Wes Herschberger
CEO
Maple Tronics Computers
Gregory A. Hoogenboom
President
Hoogenboom Nofziger Real Estate
Mgmt. Co., LLC
Douglas A. Johnston
President & CEO
Goshen Community Bank
Michael L. Kasten
Managing Partner
Kasten Investments, LLC
Laura Morris, MD, MBA, FACS
Center for Cancer Care
The Retreat Women’s
Health Center
Matthew J. Pletcher, CPA
President
Insight Accounting Group, PC
Fred M. Ramser
Managing Partner
LMA Development
Douglas A. Stanley, DDS
Owner & President
Douglas A. Stanley, DDS
Alan L. Weldy
General Counsel & Vice President
of Human Resources and
Corporate Compliance
Goshen Health System
Officers
Michael L. Kasten
Chairman
Douglas A. Johnston
President & CEO
Gregory A. Hoogenboom
Secretary
Chris R. Wolfe
Senior Vice President & CCO
Lori J. Cline
Vice President
Robert J. Eichorst
Vice President
Deborah K. Wilson
Vice President
Goshen Community Bank
511 West Lincoln Avenue
Goshen, IN 46526
574.533.2006
www.goshenbank.com
GRAND HAVEN BANK
Douglas F. Jones, President & CEO
How does Grand Haven Bank remain competitive?
Teamwork, customer service and the bank’s employees are the bank’s finest attributes, which define Grand Haven Bank. The bank’s team works together in a way that creates an effective blend of skills, talents and abilities benefiting both customers and the entire community.
The Grand Haven area has a population of about 50,000 residents within an approximate ten-mile radius, which also includes 13 additional banks. As the banking arena continues to change both in the products and services offered and, with the changing nature of big banks, Grand Haven Bank has kept its focus on providing the highest level of customer service to its customers and building relationships to distinguish itself from other financial institutions. We believe that personally knowing and serving our customers, listening to their needs and providing them with all the products and services of big banks sets us apart.
Grand Haven Bank is proud to be a locally chartered bank with its roots planted firmly within the community. Each year, the bank’s employees invest hundreds of volunteer hours in various programs, events and organizations that positively impact the community. Throughout any given year, the bank partners with many different organizations that provide services to further enhance the quality of life in our community. Grand Haven Bank is an avid supporter of schools, churches, the Jaycees, the Rotary Club, health services, community festivals and more. It is an honor to be part of the team that strives to make a positive difference here in our community.
— Douglas F. Jones, President & CEO
Board of Directors
Lee W. Hendrickson
Chief Financial Officer
Capitol Bancorp Limited
Rick H. James
Vice President
Office of the Chairman
Capitol Bancorp Limited
Douglas F. Jones
President & CEO
Grand Haven Bank
Joseph A. King
Corporate Counsel
Capitol Bancorp Limited
John C. Smythe
President, Great Lakes Region - East
Capitol Bancorp Limited
Bruce A. Thomas
President of Bank Operations
Capitol Bancorp Limited
Officers
Bruce A. Thomas
Chairman
Douglas F. Jones
President & CEO
Karen K. Benson
Vice President
Betsy S. Lobdell
Vice President
Becky L. Mattson
Vice President
Sherry J. Patterson
Vice President
Grand Haven Bank
333 Washington Avenue
Grand Haven, MI 49417
616.846.1930
www.grandhavenbank.com
KENT COMMERCE BANK
Mark J. DeWitt, President & CEO
How will centralizing operations benefit Kent Commerce Bank?
The centralization of operations will enhance credit and operational risk management practices, create efficiencies and preserve assets that will strengthen Kent Commerce Bank and improve its financial performance. The bank, along with many of Capitol Bancorp Limited’s Michigan affiliates, is enhancing its operating model by realigning its resources and capitalizing on the collective strengths of these affiliates and their respective operations.
A key aspect of this operating model brings together our best and brightest employees and creates a regional team to support the banks’ backroom functions. The new regional operating team’s expertise will strengthen the bank as employees apply their specific skill sets and share their talents to develop advanced methods to improve processes that benefit the bank, including the management of problem asset portfolios that all banks are currently facing.
Additionally, the team at Kent Commerce Bank will focus on customer service issues and relationship management, in addition to their involvement in the community. Our employees will serve in specialized roles, which will give them a keener ability to deliver added value to our clients by focusing on clients’ specific needs to strengthen our existing client base and open the door for new business development opportunities at our bank.
This strategic action to evolve our business model and adapt to current market conditions will strengthen our core business and promote stable financial performance for years to come.
— Mark DeWitt, President & CEO
Board of Directors
Mark J. DeWitt
President & CEO
Kent Commerce Bank
Rick H. James
Vice President
Office of the Chairman
Capitol Bancorp Limited
Joseph A. King
Corporate Counsel
Capitol Bancorp Limited
Kelly D. Miller
Director of Specialty Finance
Capitol Bancorp Limited
John C. Smythe
President, Great Lakes Region - East
Capitol Bancorp Limited
Bruce A. Thomas
President of Bank Operations
Capitol Bancorp Limited
Officers
Bruce A. Thomas
Chairman
Mark J. DeWitt
President & CEO
John J. Coder
Vice President
Daniel E. McLean
Vice President
Ryan L. Wolthuis
Vice President
Kent Commerce Bank
4050 Lake Drive SE
Grand Rapids, MI 49546
616.974.0200
www.kentcommerce.com
MUSKEGON COMMERCE BANK
Dennis J. Kuhn, President & CEO
How is the team at Muskegon Commerce Bank responding to changes in consumer perceptions about the banking industry?
Frequent, consistent and reassuring communication has become an increasingly important component in our day-to-day interaction with our customers and community. Historically, consumers have had few concerns or questions about their bank or the banking industry. This perception has changed in the wake of a media frenzy that has placed a spotlight on the banking industry, which undoubtedly has raised more consumer awareness and questions.
At Muskegon Commerce Bank we strive to maintain healthy and trusting banking relationships with our customers. Communicating with our customers is key to preserving our customer base as we continue to provide the great service that they have come to expect.
We help customers make decisions that make sense for them. We are committed to providing services to our community and developing a platform for future growth. Our focus is local and we are here to serve the needs of local families and businesses.
By effectively managing our customer relationships and identifying solutions based on individual circumstances, we are preserving relationships while working to open doors to new opportunities, proving to the community that our first priority is the protection of their personal interests.
— Dennis J. Kuhn, President & CEO
Board of Directors
Rick H. James
Vice President
Office of the Chairman
Capitol Bancorp Limited
Joseph A. King
Corporate Counsel
Capitol Bancorp Limited
Dennis J. Kuhn
President Great Lakes Region - West
Capitol Bancorp Limited
President & CEO
Muskegon Commerce Bank
Kelly D. Miller
Director of Specialty Finance
Capitol Bancorp Limited
John C. Smythe
President, Great Lakes Region - East
Capitol Bancorp Limited
Bruce A. Thomas
President of Bank Operations
Capitol Bancorp Limited
Officers
Bruce A. Thomas
Chairman
Dennis J. Kuhn
President & CEO
Terri K. Swarts
Chief of Bank Operations
Great Lakes Region - West
Christopher P. Cassleman
Vice President
Muskegon Commerce Bank
281 Seminole Road
Muskegon, MI 49444
231.737.4431
www.muskegoncommerce.com
PARAGON BANK & TRUST
Mark J. DeWitt, President & CEO
Many of Paragon Bank & Trust’s current customers founded the bank in September 1990. How can this loyal support, with deep roots in the Holland community, provide a competitive edge to expand business?
For the core group of our bank customers, Holland will always be home. This city has long been one of the great financial centers in West Michigan. Paragon’s wise founders created a local financial institution where they could not only secure their savings but also invest money for their future.
This smart financial philosophy is now shared by banking customers throughout Michigan and across the continental United States. Specifically, Paragon Bank & Trust professionals are now available to provide customers throughout the Capitol Bancorp Limited network of individual banks with access to a broad array of trust and investment management products and services. Such support includes financial planning guidance, employee benefits support, asset management advice as well as a complete array of other trust and estate services.
The reputation of Wall Street firms is a paramount concern for many of our individual and business relationships causing them to think twice about who is advising them on managing their wealth. Paragon Bank & Trust is uniquely positioned as a full-service bank with trust services and, from a safety and soundness standpoint, is able to guide its customers in the effective management of their money by utilizing experienced staff.
— Mark J. DeWitt, President & CEO
Board of Directors
Mark J. DeWitt
President & CEO
Paragon Bank & Trust
Lee W. Hendrickson
Chief Financial Officer
Capitol Bancorp Limited
Rick H. James
Vice President
Office of the Chairman
Capitol Bancorp Limited
Joseph A. King
Corporate Counsel
Capitol Bancorp Limited
John C. Smythe
President
Great Lakes Region - East
Capitol Bancorp Limited
Bruce A. Thomas
President of Bank Operations
Capitol Bancorp Limited
Officers
Bruce A. Thomas
Chairman
Mark J. DeWitt
President & CEO
Scott G. Kling
President
Trust Operations
C. Steven DeLoof
Senior Vice President
M. Jane Riemersma
Vice President
Paragon Bank & Trust
240 East 8th Street
Holland, MI 49423
616.394.9600
Trust & Investments Division
616.394.9055
www.paragonbank.com
PORTAGE COMMERCE BANK
Dennis J. Kuhn, President & CEO
How has the bank leveraged the U.S. Small Business Administration Preferred Lender Program to create new opportunities?
Since its founding in 1988, Portage Commerce Bank has been dedicated to small business. This commitment is apparent in many ways, including the expertise we have developed in U.S. Small Business Administration (SBA) lending. Since the bank was granted the Preferred Lender Program status in 2004, we have originated over $33 million in SBA loans for more than 90 small business clients. This has allowed us to finance growing businesses, enabled clients to establish new businesses and provided transitional financing to new owners. In most cases, the proper financing may not have been available otherwise.
The success of our SBA initiative shows the quality of our lending staff, as well as the expertise available to us through Capitol Bancorp Limited.
I would like to recognize the contributions of Robert L. Johnson who passed away in November. Bob was an original investor in the bank and a founding member of the board of directors. He was integral in developing the bank into a steady, high-performing bank and will be missed.
We celebrated the bank’s 20th anniversary last May. I am proud of our team’s dedication to its continuing safe and sound performance, even as our industry has been faced with many unprecedented challenges. It is also a testament to the oversight and wisdom of our outstanding directors many of whom, like Bob, are founding members.
— Dennis J. Kuhn, President & CEO
Board of Directors
Paul R. Ballard
Retired Banker
Portage Commerce Bank
David L. Becker
Retired Founder
Becker Insurance Agency, P.C.
Thomas R. Berglund, MD
Retired
Portage Physicians
Robert B. Borsos
Attorney at Law & Shareholder
Kreis, Enderle, Hudgins &
Borsos, P.C.
John M. Brink, CPA
Partner
Brink, Key & Chludzinski, PC
Patricia E. Dolan
Community Volunteer
Alan A. Halpern, MD
Michigan Orthopedic Surgery &
Rehabilitation, PC
Grant M. Kasten
President
Kasten Insulation Services, Inc.
Michael L. Kasten
Managing Partner
Kasten Investments, LLC
Dennis J. Kuhn
President
Great Lakes Region - West
Capitol Bancorp Limited
President & CEO
Portage Commerce Bank
Paul M. Lane, PhD
Seidman School of Business
Grand Valley State University
William J. Longjohn
Retired Vice President
Midwest Business Exchange
Steven L. Maas
Co-Owner
River Valley Title, LLC
John W. Martens, CPA
Retired
Russell M. Rathburn
President & Owner
Rathco Safety Supply, Inc.
Officers
Michael L. Kasten
Chairman
William J. Longjohn
Vice Chairman & Secretary
Dennis J. Kuhn
President & CEO
Steven K. Piper
Executive Vice President
& CCO
John M. Crandle
Senior Vice President
James V. Lunarde
Senior Vice President
Cheryl M. Germain
Senior Vice President
Kenneth R. Blough
First Vice President
Roy L. Dangel Jr.
First Vice President
James E. Higgins
First Vice President
Carol L. Ludlow
First Vice President
Susan M. Wright
First Vice President
James S. Burkett
Vice President
Steven J. Todd
Vice President
Portage Commerce Bank
800 East Milham
Portage, MI 49002
269.323.2200
www.portagecommerce.com
Stanley E. Ricketts, Region President
52 Adams Dairy Bank
53 Bank of Belleville
54 Community Bank of Lincoln
55 Summit Bank of Kansas City
Capitol Bancorp Limited’s development initiatives in the Midwest Region started in the spring of 2004. Our first objective was to establish banks near the two largest towns in the region, St. Louis and Kansas City, Missouri as well as in the major university town of Lincoln, Nebraska. The most fundamental part of our initiative, however, was to identify an exceptional banker, with a great reputation, rooted in a promising community to lead a bank.
Our strategy has proven to be successful – each of our four bank presidents has established bank operations in growing and vibrant communities. Belleville is located twenty miles southeast of downtown St. Louis in what is referred to as “metro east,” a rapidly growing north-south corridor of Illinois suburban communities. Home to Summit Bank of Kansas City, one of the best family communities in Kansas City is Lee’s Summit. Lincoln is steadily growing and is home to a population of over 250,000 residents, the University of Nebraska and the state capitol. Adams Dairy Bank was founded in Blue Springs, a suburb of Kansas City with a population of 50,000, and is on the cusp of growth with a new regional retail center in construction and a 500-acre bioscience campus in development.
We have enjoyed over four years of development in the Midwest and look forward to building on this foundation.
ADAMS DAIRY BANK
David C. Chinnery, President
What small business-oriented products and services offer the best opportunity to build demand deposit accounts and fee income at Adams Dairy Bank?
Small businesses do not come to Adams Dairy Bank for relationship banking; we meet with customers at their business or home to listen and learn what we can do to help them be successful.
Once we have learned about our customers’ financial services needs, we capitalize on the myriad of products and services made available by our parent, Capitol Bancorp Limited. This allows us to meet those needs and tailor an account specifically for our customers. This customization, along with our truly personalized service, clearly sets us apart from the large money-center banks. We actually do what every other financial institution claims they do. We get to know our customers and tailor services especially for them. It is that simple — individualized service and great products.
Banking is a service-oriented business. By taking care of our customers’ individual needs, we are able to develop additional business with them. This leads to referrals to other small businesses. We are more than willing to work with a small business owner as long as it takes, even if they open just one account. We know once they experience the Adams Dairy Bank level of service, we will earn their business as well as the business of their friends and associates.
— David C. Chinnery, President
Board of Directors
Craig A. Brandon
Vice President
Lytle Construction, Inc.
David C. Chinnery
President
Adams Dairy Bank
William G. Essmann
General Manager
Adams Pointe Conference Center
Gregory A. Jacobson Sr.
CEO
PolySource, LLC
Cathy R. Lincoln
Owner
CBreeze Consulting, LLC
Joseph T. Mackey, MD
Physician
Blue Springs Family Care, PC
Craig S. Montgomery
Broker
Skyline Realty
Stanley E. Ricketts
President, Midwest Region
Capitol Bancorp Limited
Bradley M. Scott
Regional Administrator
General Services Administration
William E. Wrisinger
CEO
Wrisinger-King Franchise Group
Officers
Stanley E. Ricketts
Chairman
David C. Chinnery
President
Joseph T. Mackey, MD
Secretary & Treasurer
Matthew E. Owings
Vice President & CCO
Cheyanne D. Reed
Vice President & COO
Adams Dairy Bank
651 NE Coronado Drive
Blue Springs, MO 64014
816.655.3333
www.adamsdairybank.com
BANK OF BELLEVILLE
Kevin M. Pesko, President
What are the two greatest opportunities Bank of Belleville envisions that will increase the bank customer base and community profile in 2009?
One notable high point occurred in 2008 when the readers of the Belleville News Democrat voted Bank of Belleville as the “Best Financial Institution.” A consistent high level of service by experienced professionals created buzz in the community resulting in this award.
We continued our annual tradition of sponsoring the popular horse-drawn trolley for Belleville’s downtown holiday shoppers. Our staff once again worked after hours several November evenings to create “Santa’s Bank” for the annual Gingerbread Contest. It was one of the many edible creations that are displayed in businesses during the holiday season in downtown Belleville. The tradition recalls Belleville’s heritage with many buildings in the mid-1800s featuring Victorian “gingerbread” architecture. In December, we were the lead sponsor for the first annual “Gingerbread Cookie Walk.” Approximately 200 residents and 24 merchants participated along the route, including Bank of Belleville, supplying each walker with a unique cookie creation. By all reports, it was a huge success.
Further evidence of our asset and manpower growth was the need to expand our facility. We added offices, work stations and much needed storage. As we look forward to 2009, we look to continue to cultivate our growing referral base and build our core customer base. We plan to be the best small community bank on “Main Street” in mid-America.
— Kevin M. Pesko, President
Board of Directors
Dennis E. Bielke
Retired Banker
Community Volunteer
Michael G. Guignon, MD
President & Physician
Michael Guignon, MD, PC
Gary R. Hoelscher
President
Hoelscher Engineering, PC
Edward A. Hoering III, CPA
Principal
Ganim, Meder, Childers
& Hoering, PC
Claire S. Leopold
President
Nester Realty Inc.
Carl J. Miller
President
W. A. Schickedanz Agency, Inc.
Kevin M. Pesko
President
Bank of Belleville
Wyatt Rawlings III, CPA
Owner
Wyatt Rawlings III CPA, LLC
George J. Renner III
Funeral Director
George Renner & Sons Funeral
Homes Inc.
Stanley E. Ricketts
President, Midwest Region
Capitol Bancorp Limited
James E. Shay
President
Shay Roofing, Inc.
Douglas D. Sitton
President
Sitton Consulting Group
Officers
Stanley E. Ricketts
Chairman
Kevin M. Pesko
President
Ronald R. Stephens
Executive Vice President
& CCO
Jean L. Waeltz
Vice President & COO
Mary E. Blackard
Vice President
Jo Ann Bohnenstiehl
Vice President
Ramona A. Friederich
Vice President
Pamela S. Herbeck
Vice President
Jacqueline Lemmon
Vice President
Bank of Belleville
720 West Main Street, Suite 100
Belleville, IL 62220
618.233.6400
www.bankofbelleville.com
COMMUNITY BANK OF LINCOLN
Mary C. Gerdes, President
What strategies has Community Bank of Lincoln implemented to cross-sell deposit products and create new banking relationships?
At Community Bank of Lincoln, we focus on developing lasting banking relationships. We define ourselves with our personal, high-touch customer service. The ability to make quick, local decisions and our willingness to meet with the customers at their place of business, within their timelines, differentiates us from our competition.
Our customers are concerned today with the safety of their principal in their savings and retirement accounts, which has led to significant growth in certificates of deposit. Our focus in 2009 will include expanding these relationships and gaining primary checking and money market accounts. Our intention is to build loyalty with our customers now, while the financial markets are more volatile.
On the business side, we plan to continue to attract business checking accounts with our competitive products and personalized financial services.
Our employees are committed to providing excellent customer service and serving our community. Through our Casual for a Cause program, the employees have funded over $1,600, plus volunteered more than 100 hours of service to local nonprofit organizations. Additionally, our employees donated hats, gloves, coats and toys for children in need in our community at Christmas time.
The team at Community Bank of Lincoln looks forward to continued growth in 2009. Our employees are excited about being the premier bank in Lincoln, Nebraska.
— Mary C. Gerdes, President
Board of Directors
Mary C. Gerdes
President
Community Bank of Lincoln
Kaylyn R. Jackman, OD
Optometrist
Eye Surgical Associates
Gordon V. Karels
Chair, Dept. of Finance
College of Business Administration
University of Nebraska-Lincoln
Alan C. Linderman, MD
Nebraska Internal Medicine, PC
President & CEO
Lincoln Medical
Education Partnership
Paula J. Metcalf
Attorney at Law
Metcalf Law
Gary L. Novotny
Owner & President
Gary Michaels’ Clothiers
Donald W. Pederson
Attorney at Law
Retired State Senator
Steve B. Rexroth
Owner
Miracle Workers Auto Collision
Robert B. Rhodes, MD
President & CEO
Southwest Family Health
Clinic with a Heart
Stanley E. Ricketts
President, Midwest Region
Capitol Bancorp Limited
Kurtis A. Suhr
Architect
Architecture One
Mark L. Vanicek, DDS
Mark Vanicek, DDS, PC
Officers
Stanley E. Ricketts
Chairman
Kaylyn R. Jackman
Secretary
Mary C. Gerdes
President
Brian V. Wolford
Executive Vice President
& CCO
Steve L. Schmidt
Executive Vice President
Joel D. Clements
Vice President
Patrick A. Dettmer
Vice President
Angie R. Schwartz
Vice President
Community Bank of Lincoln
6000 Village Drive, Suite 100
Lincoln, NE 68516
402.423.2111
www.bankoflincoln.com
SUMMIT BANK OF KANSAS CITY
Richard L. Viar, President
What competitive opportunities is Summit Bank of Kansas City seizing to enhance core deposits and to deepen customer relationships?
During 2008, Summit Bank of Kansas City strategically established a unique brand supported by cohesive marketing campaigns that introduced the Plus Relationship not-for-profit deposit program and our new “Lighthouse Philosophy.” These campaigns utilized:
■ Quarterly customer newsletters with staff profiles, new programs, current events and progress updates.
■ Shine the Light On outreach program that leveraged our relationships with local not-for-profit groups using lobby displays, customized bank products and community-wide
events.
■ Testimonial program with prominent customers highlighted each month using high-quality lobby posters.
■ Banking on Business program, which offers a unique focus on business strategies, networking and special incentives for our commercial customers.
In order to capitalize on our successful branding efforts and positive momentum, we will continue our aggressive marketing in the coming year. Additional competitive opportunities will be created through the existing campaigns plus increased use of relatively inexpensive programs focused around teller handouts, ATM signage, point-of-sale lobby advertising and bank statement inserts.
A highlight in 2009 will be the consolidation of our various sponsorship activities throughout the year into Summit Bank Week. This consolidation will provide cost savings for the bank while we boost lobby traffic during the promotional week and improve brand awareness. At the heart of all marketing activity will be the goal of increasing core deposit growth and improving deposit retention by building stronger customer relationships.
— Richard L. Viar, President
Board of Directors
Jack A. Accurso
Chairman
American Foodservice Company
Kathy L. Bennett
President & CEO
Bennett Packaging of K.C., Inc.
Carl L. Chinnery
Attorney at Law
Chinnery, Evans & Nail, P.C.
William W. Coates IV
President
Billy Goat Industries
Roger L. Fender, DDS
Owner
Fender Family Dentistry
Robert F. Glaser
Vice President
Business Development
Summit Bank of Kansas City
Harlan L. Limpus
Executive Member
Winterstone Golf Course
Stanley E. Ricketts
President, Midwest Region
Capitol Bancorp Limited
Carson Ross
Owner
Carson Ross Consulting
Diane J. Seif
President
DVA Enterprises Inc.
Steven M. Silverstein, MD, FACS
President
Silverstein Eye Centers, PC
Richard L. Viar
President
Summit Bank of Kansas City
Officers
Stanley E. Ricketts
Chairman
Richard L. Viar
President
Vicki L. Henderson
Senior Vice President
& COO
Patricia E. Case
Vice President
Commercial Loans
Robert F. Glaser
Vice President
Business Development
Janessa R. Sheehan
Vice President
Loan Administration
Gregory L. Singleton
Vice President
Commercial Loans
Summit Bank of Kansas City
1650 NE Grand Avenue, Suite 100
Lee’s Summit, MO 64086
816.251.9000
www.summitbankofkc.com
Thomas C. Mangione, Region President
57 1st Commerce Bank
58 Bank of Las Vegas
59 Black Mountain Community Bank
60 Desert Community Bank
61 Red Rock Community Bank
Southern Nevada is not immune to the turbulence of our national and world markets. Our local market has been directly impacted by the negative effects of the economy and it now faces challenges that it has never before experienced.
Despite these challenges, there are opportunities for our banks. As interest rates hit all time lows, we are witnessing a resurgence of Federal Home Administration loans for first-time home buyers. The Region is also projected to continue growing throughout 2009. It is expected that the Region will net approximately 3,000 new residents each month and new commercial construction continues throughout Las Vegas.
Our Region has experienced many economic downturns but has always come back stronger. Therefore, we expect nothing but the same performance. Our banks are well-positioned to embrace new opportunities as they present themselves.
1ST COMMERCE BANK
Al G. Gourrier, President
As a de novo bank in a turbulent financial environment, what are 1st Commerce Bank’s biggest challenges and how has it overcome them?
1st Commerce Bank opened its doors for business in October 2006. Not long afterward, the initial signs of what would later be classified as a mortgage crisis began to surface. What was initially planned to be a steady growing market, listed as the second-fastest growing city in the country in 2006, was about to experience some of the highest foreclosure rates in the country. Although 1st Commerce Bank did not directly participate in risky or subprime mortgage lending, the impact was felt across the community. As a result, the bank has had to navigate through turbulent financial times early in its business cycle. The biggest of these challenges initially was liquidity.
As a community bank, 1st Commerce Bank addressed the challenge of lack of liquidity in the market with the core of our business model, relationship banking. We recognized that as liquidity became scarce in the market, developing and maintaining true business relationships would be key to our success. Our dedication and commitment to building the bank through core deposits and business relationships has allowed the bank to sustain healthy levels of liquidity and remain in the business of lending, even through tough financial times. The ability to be there for our community and stand strong among our peers is a cornerstone of our bank and a testament to our commitment and the essence of community banking.
— Al G. Gourrier, President
Board of Directors
Al G. Gourrier
President
1st Commerce Bank
Thomas C. Mangione
President, Nevada Region
Capitol Bancorp Limited
Xavier D. Peterson
President & CEO
Quality Investigations Inc.
Rian M. Ross
Owner
Southwest Commercial Real Estate
Henry B. Soloway, MD
Retired
John J. Zanoni
President
Zanoni & Company LLP
Officers
Thomas C. Mangione
Chairman & Secretary
Al G. Gourrier
President
Kathy S. Jumper
Executive Vice President
Mark L. Huggett
Senior Vice President
Marcel M. Baker
Vice President
Darrell L. Evans
Vice President
Jeff B. Miracle
Vice President
Biagio J. Vultaggio
Vice President
1st Commerce Bank
5135 Camino Al Norte, Suite 100
North Las Vegas, NV 89031
702.942.2050
www.1stcommercebank.com
BANK OF LAS VEGAS
Vincent J. Ciminise, President & CEO
How is Bank of Las Vegas reaching out to the community?
Bank of Las Vegas, a true community bank, has a proud heritage of supporting local charities with donations of time through employee volunteerism. These charities provide essential support to our neighbors who are facing numerous financial and personal challenges. Giving back to the community has always been a top priority at Bank of Las Vegas, and over the past year it has been especially important to our team. During 2008, Bank of Las Vegas assisted the following community-based organizations:
■ United Way of Southern Nevada
■ Nevada Society for the Prevention of Cruelty to Animals
■ Operation Warm Heart at Nellis Air Force Base
■ Salvation Army
■ Child Haven
■ Court Appointed Special Advocates of Clark County
In addition to charitable endeavors, the bank has expanded its residential mortgage products to offer Federal Housing Administration loans. This has allowed the bank to help numerous borrowers refinance their higher interest-rate home mortgages while also providing mortgages for a number of first-time homebuyers. It has been quite gratifying to assist so many individuals with their residential financing needs this past year.
As a business bank, rooted deep in the community, we work hard to understand the challenges that our customers are experiencing and work together to help them through these difficult economic times.
— Vincent J. Ciminise, President & CEO
Board of Directors
Vincent J. Ciminise
President & CEO
Bank of Las Vegas
Darlene Copsey
Secretary & Treasurer
The Alpha Group Ltd.
Leo N. Durant
Owner
LND Construction
Scott R. Gragson
Managing Partner
GKT Acquisitions
Donald K. Hamrick
General Manager
Chapman Dodge
Darryl J. Hardy
Vice President
Hardy Painting & Drywall
Alan R. Houldsworth
Partner
Houldsworth & Company, CPAs
Thomas C. Mangione
President, Nevada Region
Capitol Bancorp Limited
Ronald H. Reynolds
Senior Partner
Callister & Reynolds
Philip T. Saunders
Retired Executive
General Motors Corporation
Michael H. Singer
Owner & President
Michael H. Singer, Ltd.
Herman A. Vander Veldt
Branch Manager
PrimeLending
Eleanor N. Wilcox
District Manager
Stewart Title Company
Officers
Thomas C. Mangione
Chairman & Secretary
Vincent J. Ciminise
President & CEO
Roger S. Mellies
Executive Vice President & CCO
Lynne S. Adams
Senior Vice President
Carol A. Clemens
Senior Vice President
Louis Gonzalez
Senior Vice President
William C. Russell
Senior Vice President & COO
Debbie V. Clarke
Vice President
Norman H. Clow
Vice President
Randall S. Daugherty
Vice President
Tina M. O’Malley
Vice President
Michael Rodriguez
Vice President
Bank of Las Vegas
6001 South Decatur Boulevard, Suite P
Las Vegas, NV 89118
702.939.2400
www.bankoflasvegas.com
BLACK MOUNTAIN COMMUNITY BANK
Peter M. Atkinson, President & CEO
In a very difficult financial environment, what drives Black Mountain Community Bank’s continued success?
Black Mountain Community Bank delivers quality products and services with a high level of attention that exceeds our customers’ expectations. We also create a pleasant work environment that encourages staff members to stay with us. These go hand in hand.
Our employees use their training and maturity to make sure that the products we deliver are the best solutions to satisfy the specific needs of each individual customer. Our focus has always been to get the job done efficiently, while maintaining the quality and integrity of our single largest asset, the loan portfolio. From the beginning, we grew the bank at a slow and steady pace, without compromising quality. Our plan was to build this business to last. For my part as the bank’s founding president, I recruited the best bankers I knew and then let them do their jobs.
Deposit gathering in today’s economic environment; however, is difficult and costly. Equally challenging is providing quality loans with acceptable pricing. We are dedicated to the solution to this challenging environment, which is providing a new generation of high-tech banking products that can generate additional income for our bank.
— Peter M. Atkinson, President & CEO
Board of Directors
Kristine E. Anaya, CPA
Anaya & Company, Ltd.
Peter M. Atkinson
President & CEO
Black Mountain Community Bank
Amador Bengochea
President
Bentar Development Inc.
Betty A. Kincaid
Investor
Thomas C. Mangione
President, Nevada Region
Capitol Bancorp Limited
Michael J. Mixer
Corporate Broker
Colliers International
Colleen C. O’Callaghan-Miele
President & Owner
H.B.C. Publications
Phillip N. Ralston
Executive Vice President & CFO
American Nevada Company
Christopher G. Samson
President & Owner
FN Investments Inc.
Officers
Thomas C. Mangione
Chairman & Secretary
Peter M. Atkinson
President & CEO
David S. Rennick
Executive Vice President
& CCO
Kathy M. Lucero
Senior Vice President
Dennis L. Monson
Senior Vice President
Shari A. Smith
Senior Vice President
Grenell Martin
First Vice President
RaMon McBride
Vice President
Stephen E. Norris
Vice President
Claude D. Rosenthal
Vice President
Black Mountain Community Bank
1700 West Horizon Ridge Parkway
Suite 101
Henderson, NV 89012
702.990.5900
www.bmcb.com
DESERT COMMUNITY BANK
James W. Howard, President & CEO
In the current economic cycle, many banks are being criticized for not lending. Is that also true at Desert Community Bank?
While it is prudent for every institution to think in terms of self-preservation, it is equally important for bankers to remember that they are in the business of lending money. At its core, a credit crunch signals a lack of confidence in the future. Bankers are by nature risk averse and, often, the conservative thing to do when faced with uncertainty is to do nothing. But our economic recovery will be fueled as much by optimism as by the capital markets’ return to stability. It will take both faith and credit to get the economy back on its feet.
Desert Community Bank has maintained conservative underwriting standards, which has insulated us from the current situation affecting credit availability. Community banks, unlike large financial institutions, can bring local community knowledge that can help them stay ahead of trouble. Yet it all comes down to management’s effectiveness. At Desert Community Bank, we stand ready as always to assist with the needs of our local business, professional and individual clients who look to us to provide the capital for expansion, new business or ongoing operation. As always, we stand ready to serve.
— James W. Howard, President & CEO
Board of Directors
Robert A. Albano
President & CEO
American Asphalt & Grading
Robert J. Andrews
Investor & Financial Consultant
Rose M. K. Dominguez
Realtor
AC Sales Real Estate Services
Garry L. Hayes
President
Law Office of Garry L. Hayes
James W. Howard
President & CEO
Desert Community Bank
Larry W. Kifer
Chairman & CEO
Lilack, Inc.
Thomas C. Mangione
President, Nevada Region
Capitol Bancorp Limited
Leland D. Pace
Partner
Stewart, Archibald & Barney, LLP
Vicki Paulbick
Private Property Manager
Thomas A. Smith
President & CEO
Group Two, Inc.
Officers
Thomas C. Mangione
Chairman & Secretary
Garry L. Hayes
Vice Chairman
James W. Howard
President & CEO
Gerald T. Buttaccio
Executive Vice President
& CCO
Robert J. Beck
Senior Vice President
Rodney K. Chaney
Senior Vice President
Eileen S. Hagler
Senior Vice President
Michelle Scalzo
Senior Vice President
John J. Gentile
Vice President
Larry A. Moulton
Vice President
Desert Community Bank
3740 South Pecos-McLeod
Las Vegas, NV 89121
702.938.0500
www.desertcommunity.com
RED ROCK COMMUNITY BANK
J. Randall Boesch, President & CEO
Red Rock Community Bank leads the Las Vegas market in offering non-traditional products and services. How does this benefit the bank’s clients?
Throughout 2008, Red Rock Community Bank has marketed wealth management services provided by Capitol Wealth Advisors to our customers, prospects, directors and employees.
Capitol Wealth provides financial advisory and trust services that expand and deepen our relationships with clients. It offers a wide range of services, including asset management, trust management and insurance, taking a needs-based approach to guiding clients through all aspects of financial planning.
Many individuals and families have used our services to reach their financial goals. They have responded well to our team of professionals who work with clients to develop individualized solutions for managing their assets and achieving their specific goals.
Our clients have told us how helpful and beneficial our wealth management services are for them. Some of the most appreciated services are professional investment management, business and succession planning, tax efficiency and guidance, simplification of accounts and successor trusteeship. With these personalized services comes peace of mind and confidence that our bank can handle all their personal finance and business needs.
At Red Rock Community Bank, our Capitol Wealth team applies time-tested concepts that allow us to truly get to know the financial needs of our clients and their families. By expanding business relationships to include wealth management services, we always have something important to talk about with our valued clients.
— J. Randall Boesch, President & CEO
Board of Directors
J. Randall Boesch
President & CEO
Red Rock Community Bank
Richard H. Bowler
Principal
Piercy Bowler Taylor & Kern
Eric L. Colvin
President
Apex of Nevada
James L. Dunn
Owner & Broker
Dunn Properties, Ltd.
Molly K. Hamrick
President & COO
Coldwell Banker Premier Realty
Philip G. Hardy Jr.
President
Hardy Companies Inc.
James A. Harris
Vice President
The Harris Agency, LLC
Richard Hollander
President
Hollander Capital
Management, Inc.
Thomas C. Mangione
President, Nevada Region
Capitol Bancorp Limited
Lori A. Marrs
Owner
Marrs Bergquist, CPAs
Fredrick P. Waid
Attorney at Law
Perth Consulting & Services, LLC
J. Bruce Wiggins
President
Strategic Medical Management
Officers
Thomas C. Mangione
Chairman & Secretary
J. Randall Boesch
President & CEO
Steven B. Borgna
Executive Vice President
& CCO
Shahzad B. Ali
Senior Vice President
Susan E. Daleiden
Senior Vice President
Brent D. Kamerath
Senior Vice President
Armando C. Rodriguez
Senior Vice President
Michael R. Beal
Vice President
Eloise Dominguez
Vice President
R. Mitch Taylor
Vice President
Red Rock Community Bank
10000 West Charleston Boulevard
Suite 100
Las Vegas, NV 89135
702.948.7500
www.redrockcommunity.com
John S. Lewis, Region President
The national economy has been impacted by the “boom and bust” of the residential housing market. Most of the Northeast, and particularly upstate New York where USNY Bank is located, was not impacted by these historic moves in housing prices.
Over the last few decades, the Region has been transforming to a service, education and technology-based economy while manufacturing has continued to decline. This ongoing transformation has its downside, but generally has provided the regional economy with some consistency.
The regions served by USNY Bank in upstate New York are primarily based on tourism and agriculture, which have thus far been growing sectors of the economy.
USNY BANK
R. Michael Briggs, President & CEO
Why do customers prefer to do business with local community banks?
I have always believed people prefer to work with a bank that treats them with respect and is staffed by people they know. Local community banks have been able to meet these standards because the bankers take the time to understand the needs of their customers, businesses and the communities in which they live. Banks like USNY Bank are truly closer to the customer and can offer more personalized service than the competition, as well as modern banking technology. The staff and directors of USNY Bank are very active in their communities and local civic organizations. They share a strong desire to improve the quality of life where they live.
As a community bank, USNY Bank can make faster loan decisions because we make them right here at our bank. We understand the needs of the small businesses we serve. We strive to be accessible to our customers and know it is important to be able to talk directly with them.
Over the last few months of 2008, we have seen a lack of confidence in other financial institutions and a “flight to safety.” It has been comforting for our customers to know that, at USNY Bank, we continue to take in deposits and make loans to folks we know right here in our communities. It is really nothing very fancy, simply a business model that everyone can see, touch and trust.
— R. Michael Briggs, President & CEO
Board of Directors
R. Michael Briggs
President & CEO
USNY Bank
H. Todd Bullard
Partner
Harris Beach, PLLC
H. Taylor Fitch III
Retired
Jeffrey S. Gifford
President
The Birkett Mills
Murray P. Heaton
Partner
Heaton & Venuti, LLP
J. Michael Moffat
President
Black Ash Holding Company, Inc.
Robert F. O’Neill
Retired
Robert Ranger
Owner
RWR Funding
Joseph D. Reid
Chairman & CEO
Capitol Bancorp Limited
Bruce A. Thomas
President of Bank Operations
Capitol Bancorp Limited
Officers
Joseph D. Reid
Chairman
R. Michael Briggs
President & CEO
James E. Willson
CCO
Jeffrey E. Franklin
President
Bank of the Finger Lakes
Scott D. White
President
Bank of Cooperstown
Michael A. Fratto
Vice President
Dawn E. Maltman
Operations Officer
Bank of Cooperstown,
a unit of USNY Bank
73 Chestnut Street
Cooperstown, NY 13326
607.547.2210
www.bankofcooperstown.com
Bank of the Finger Lakes,
a unit of USNY Bank
389 Hamilton Street
Geneva, NY 14456
315.789.1500
www.bankofthefingerlakes.com
Thomas S. Giovanelli, Region President
65 Bank of Bellevue
66 Bank of Everett
67 Bank of Tacoma
68 High Desert Bank
69 Issaquah Community Bank
When I met with Joseph Reid and learned about the business model for Capitol Bancorp Limited in June 2004, I felt it would be a great fit for the banking environment and economy of the Pacific Northwest.
One of the core values of Capitol Bancorp is entrepreneurship. The Greater Seattle and Puget Sound Regions of Washington state have had a long history of great entrepreneurs starting with Boeing and Weyerhaeuser, and more recently with Microsoft Corporation, Costco, Amazon.com and Starbucks, among others. Developing local community banks built with a similar entrepreneurial spirit is a natural. We have opened four banks in Washington, all named for their cornerstone communities in the Region.
The state of Oregon holds some compelling demographics for community banks. This is especially true for the city of Bend and Deschutes County, where the population has more than doubled in the last eight years. We have successfully launched one bank in the state, High Desert Bank, which opened in 2007.
BANK OF BELLEVUE
Andrew P. Barlass, President
The banking environment in the community of Bellevue is very competitive. How does Bank of Bellevue distinguish itself?
We received a card during the holiday season that sums up why people do their banking with Bank of Bellevue: “Thank you all so very much for your kindness to us. We love Bank of Bellevue.”
This comment epitomizes what distinguishes Bank of Bellevue. We are all about personalized, relationship banking. Our staff knows every customer of the bank. When customers call, they get a real person who knows them and is available and able to assist them. We do not have “1-800” numbers with voice-mail options. At Bank of Bellevue, customers talk to members of a very experienced staff of business professionals who really care about each and every customer.
We also make it easy to bank with Bank of Bellevue. We offer customized loan underwriting with local loan officers versus the “scorecard” approach used by many other banks. With our ATM network, Internet banking, remote deposit capability and lockbox service, we offer many convenient ways for our customers to do their banking with Bank of Bellevue.
In today’s tough, competitive banking environment, a bank must nurture its customers to be successful. At Bank of Bellevue, we can proudly say we do.
— Andrew P. Barlass, President
Board of Directors
Andrew P. Barlass
President
Bank of Bellevue
Richard J. DePosit, CPA
DePosit & Associates
Alvin L. Eerkes
Retired Senior Commercial Banker
Bank of America
Thomas S. Giovanelli
President, Northwest Region
Capitol Bancorp Limited
Susan C. Ho
Executive Director
Lakeville Construction Inc.
Louie J. Micheli
President
Phillips Real Estate Services
H. Cyrus Oskoui
President
Columbia Athletic Clubs
Advisory Director
Peter W. Powell
President
Powell Development Company
Officers
Thomas S. Giovanelli
Chairman & CEO
Richard J. DePosit
Vice Chairman
Andrew P. Barlass
President
Rita E. Dillon
Senior Vice President
Annetta Mirabella
Senior Vice President
John S. Williams
Senior Vice President & CCO
Patrick G. Cleary
Vice President
Debra L. Kirk
Vice President
Bank of Bellevue
155-108th Avenue NE, Suite 100
Bellevue, WA 98004
425.467.5900
www.bankofbellevue.com
BANK OF EVERETT
Michael R. Deller, President & CEO
There are many national, regional and community banks in the Everett and Snohomish County markets. How does Bank of Everett differentiate itself?
In building a de novo bank, a major critical element in establishing a presence in the community is credibility. From the outset, Bank of Everett’s strategy to distinguish itself from the existing banks was to hire experienced bankers and bring together a board of directors whose members are well-respected and broadly known in our marketplace. Those steps helped us build instant credibility.
Banks, in general, offer the same basic products so the differentiators are pricing and service. Our strategy has been to stay in a band of pricing competitiveness but offer the best customer service in the area. What has enabled us to accomplish that is the banking credibility of our staff, averaging over 22 years of experience per employee. This has allowed us to not only be bankers but trusted advisors who know our customers thoroughly.
Our industry is in a challenging environment at this time and under intense scrutiny, not only by the media and elected officials, but also by consumers who want to know that their bank is safe and sound. We continue to maintain capital levels in the well-capitalized category and strong liquidity. These factors, along with our board of directors and experienced staff, have created the differentiation in our marketplace that enables us to consistently exceed our customers’ expectations.
— Michael R. Deller, President & CEO
Board of Directors
Robert W. Bauer, CPA
Bauer Evans, Inc., P.S.
Thomas R. Collins
Attorney
Anderson Hunter Law Firm
Richard H. Cooper
CEO
The Everett Clinic
Michael R. Deller
President & CEO
Bank of Everett
Thomas S. Giovanelli
President, Northwest Region
Capitol Bancorp Limited
Randy K. Hansen
President
PSG Washington, Inc.
Thomas P. Hoban Jr.
CEO
Coast Real Estate Services
Wallace S. Rodland
Owner
Rodland Toyota, Inc.
Mary B. Sievers
Executive Director
EverTrust Foundation
Brenda D. Stonecipher
City Council Member
City of Everett
Officers
Thomas S. Giovanelli
Chairman
Wallace S. Rodland
Vice Chairman
Michael R. Deller
President & CEO
Malcolm R. Harding
Senior Vice President & CCO
Jeffrey R. Mitchell
Senior Vice President
Kenneth V. Pascoe
Senior Vice President
Bank of Everett
2722 Colby Avenue, Suite 100
Everett, WA 98201
425.740.2888
www.bankofeverett.com
BANK OF TACOMA
Michael W. Hansch, President & CEO
What would you like your community to know about the safety and soundness of Bank of Tacoma?
Bank of Tacoma continues to grow due to our strong ties to the community with our management and local board of directors. In addition to our marketing efforts, we are very active in our community. Our affiliation with Capitol Bancorp Limited provides us with a strategic partner that has the resources to assist us with our business plan.
The value proposition to our customers and community is offering local decisions by very experienced, seasoned bankers. With their many years of experience, our bankers are well-qualified to offer sound advice on how to structure loans and cash management in order to aid our borrowers in the Tacoma market.
Our ability to be efficient, combined with our value proposition to our customers, will allow Bank of Tacoma to continue growing and serving the needs of businesses and individuals in the Tacoma area.
— Michael W. Hansch, President & CEO
Board of Directors
Fred Brown
Financial Consultant
Thomas S. Giovanelli
President, Northwest Region
Capitol Bancorp Limited
Michael W. Hansch
President & CEO
Bank of Tacoma
Theodore M. Johnson Jr.
Principal & Owner
Simon Johnson LLC
Eugene S. Lapin, MD
Cardiologist
Cardiac Study Center
John R. Long
President
Good Samaritan Hospital
John S. Wiborg
President & Co-Founder
Stellar Industrial Supply, Inc.
John M. Xitco
Partner
Associated Petroleum Products
ASADO and MASA Restaurants
Advisory Director
Barbara D. Tucci
President
Sound Screening Services
Officers
Thomas S. Giovanelli
Chairman
John R. Long
Vice Chairman
Michael W. Hansch
President & CEO
Ronald H. Goodwin
Senior Vice President
Steve M. Harlow
Senior Vice President
Toni A. Quinn
Vice President
Bank of Tacoma
1015 A Street, Suite 100
Tacoma, WA 98402
253.722.2900
www.bankoftacoma.com
HIGH DESERT BANK
Larry R. Snyder, President & CEO
High Desert Bank is the first local bank to open in Bend, Oregon, since 1977. What is the bank’s plan for success?
High Desert Bank is located in Bend, Oregon, a town with 80,000 people and 14 banks. Only one of those banks is based here and was founded in 1977. It was clear that there was a need for another local community bank because I heard many times, “When I walk into my bank no one knows me and I don’t know anyone there – what happened to personal service?”
Our plan for success addresses that concern: Our goal is to build a true community bank, where service is not just a cliché or tag line on an ad, but actually delivered by every one of the dedicated staff at our institution. We deliver our products to customers packaged the way they want them and in a way that makes economic sense to us — and we do it with exceptional service. This is an easy formula for success; just look at any successful small business and their roots are the same.
Recently I met a new customer in our lobby. After introducing myself I asked how he found us. His response was, “When I called, I was not transferred around and Amy was very knowledgeable and answered all my questions.”
We will continue to be involved in the community and develop business by our reputation, referrals from existing customers, our board of directors and investors — a formula for success.
— Larry R. Snyder, President & CEO
Board of Directors
Gwil T. Evans
Owner
PV Power Inc.
Professional Air
Gary D. Fish
Owner
Deschutes Brewery Inc.
Thomas S. Giovanelli
President, Northwest Region
Capitol Bancorp Limited
Cynthia L. Kane, PhD
Executive Director
Clear One Foundation
John P. Lietz
President
Arrowood Development LLC
Bruce A. McLellan, MD
President
Heart Center Cardiology
Romy E. Mortensen
Vice President
Sales & Marketing
Brooks Resources Corp.
Larry R. Snyder
President & CEO
High Desert Bank
Officers
Thomas S. Giovanelli
Chairman
Cynthia L. Kane
Vice Chairman
Larry R. Snyder
President & CEO
Bruce D. Stephenson
Senior Vice President & CCO
Karyn I. Simonton
Vice President
High Desert Bank
1000 SW Disk Drive
Bend, OR 97702
541.848.4444
www.highdesertbank.com
ISSAQUAH COMMUNITY BANK
Robert M. Ittes, President & CEO
Why do you believe Issaquah was a good market in which to establish a community bank?
Issaquah is a great community in which to live and work. During my 11-year tenure with another community bank in Issaquah, I enjoyed developing relationships within our market, providing financing needs for local businesses and participating in the economic vitality and growth of the community. It was a very rewarding experience; however, the bank was sold to a larger bank conglomerate; hence, shifting the bank’s culture of high-touch, relationship banking.
When Issaquah Community Bank opened in 2007 it filled a void for a community partner that interacted with local businesses to service their financing needs while also engaging as a participant in the continued growth of the local market. Today, we distinguish ourselves and are filling the void:
■ Issaquah Community Bank is governed by a local board of directors.
■ Credit decisions are made locally by a core of seasoned banking veterans.
■ Our bank staff is responsive to and supportive of local business.
■ Our bankers interact daily with the community.
I have always believed that Issaquah Community Bank’s success is coincident with the involvement that we have in the community that we serve. Each relationship is another thread in our fabric. The more relationships the bank develops within our market that support economic activity, the stronger the fabric of our bank will become. If our community is economically vibrant, then Issaquah Community Bank will be successful.
— Robert M. Ittes, President & CEO
Board of Directors
Brett Backues, CPA
Backues & Company, LLC
William J. Baker
President
WJB Enterprises, Inc
Charles E. Burget
President
Pacific Plants, Inc
Carl D. Cangie
President
Concept Engineering, Inc
Thomas S. Giovanelli
President, Northwest Region
Capitol Bancorp Limited
Robert M. Ittes
President & CEO
Issaquah Community Bank
Carolyn Pierce-Dyer
Owner
Refined Design Interiors, LLC
Brett D. Smith
Owner
Mt. Si Mobile Home Park, LLC
Rosemary Warren, DDS
Rosemary Warren, DDS
Officers
Thomas S. Giovanelli
Chairman
Charles E. Burget
Vice Chairman
Robert M. Ittes
President & CEO
Carmen L. Malsbury
Senior Vice President & CCO
Charlotte Jacobs
Vice President
Randy J. Jansons
Vice President
Naomi R. Kennamer
Vice President
Philip A. Milne
Vice President
John P. Snorsky
Vice President
Issaquah Community Bank
1375 NW Mall Street, Suite 1
Issaquah, WA 98027
425.395.1199
www.issaquahcommunitybank.com
Bruce D. Jones, Region President
71 Bank of Valdosta
72 Community Bank of Rowan
73 First Carolina State Bank
74 Peoples State Bank
75 Pisgah Community Bank
76 Sunrise Bank of Atlanta
Our community banks in the Southeast Region have remained strong and well-capitalized despite the recent challenges and uncertainty in the banking community and economy. In times of difficulty, home is where people turn to find security. In our hometown community banks, customers rely on and trust our local bankers because they know their customers and understand them.
Our bankers remain committed to delivering the highest level of customer service with a passion unmatched by our competitors. They volunteer many hours working with local civic groups, schools and other community organizations to help improve the lives of others.
As we move forward in 2009, our customers can count on their friends and neighbors at our community banks to be there for them. Success can only happen by remaining committed to the principles of integrity and hard work. Our goal is to help valued customers remain successful for many years to come.
BANK OF VALDOSTA
Matthew D. Stanaland, President
How has Bank of Valdosta earned the community’s trust?
Bank of Valdosta celebrated its second year of providing dependable financial services in 2008. Even with an uncertain economy, our bank has experienced steady growth. Our team, comprised of 12 seasoned bankers, has sought to apply safe and sound strategies for our customers.
Our lending team, guided by Stephen Sainz and Jeremy Regan, has worked diligently to maintain the superior quality of our loan portfolio. Our loan operations and credit quality department, led by Lisa Harrington, has worked closely with the lending team to ensure our bank’s continued growth.
We welcomed mortgage lender, Beverly Connell, to our banking team in 2008. Her efforts, combined with the decrease in mortgage rates, have generated numerous home refinancing loans. Additionally, Bank of Valdosta has been pleased to offer financial incentives through the Georgia Dream Program and Federal Home Loan Bank.
Beverly Edwards of our marketing and business development department, along with Penny Brogdon and Jackie Jordan in bank operations, deliver products and services that our business and retail customers need to grow and prosper.
We have earned the public’s trust through the good work of our total team, the competitiveness of the products we offer and our willingness to meet with customers when it is convenient for them. Our community is confident in Bank of Valdosta’s support of its financial interests.
— Matthew D. Stanaland, President
Board of Directors
William A. Culbreth
President
Culbreth, Minick & Associates, PC
Thomas W. Hobby, MD
Internal Medicine
Valdosta Medical Clinic
Bruce D. Jones
President, Southeast Region
Capitol Bancorp Limited
Patrick T. Reid
Attorney at Law
Reid & Reid
J. Daniel Schert
Attorney at Law & Partner
Langdale, Vallotton, LLP
Matthew D. Stanaland
President
Bank of Valdosta
Thomas R. Warren
Retired
Private Investor
Teddy W. Welch Sr.
Owner
Strategic Wealth Group, LLC
Sherry C. Wetherington
President
Only Options, Inc.
Officers
Patrick T. Reid
Chairman
Bruce D. Jones
Vice Chairman
William A. Culbreth
Secretary
Matthew D. Stanaland
President
Penny L. Brogdon
Vice President
Beverly G. Edwards
Vice President
Lisa Harrington
Vice President
R. Jeremy Ragan
Vice President
Stephen P. Sainz
Vice President
Bank of Valdosta
301 Woodrow Wilson Drive
Valdosta, GA 31602
229.242.3522
www.bankofvaldosta.com
COMMUNITY BANK OF ROWAN
Bruce D. Jones, President & CEO
How has Community Bank of Rowan been able to grow and prosper in a difficult economic environment?
In times of uncertainty in the economy, it is important to know your bank is strong and able to weather difficult market conditions. At Community Bank of Rowan, 2008 was an outstanding year in growth and profitability.
As a community bank, we know our customers. When you work in the same community, your children play on the same ball team or you attend the same church, it is easy to know the character of your customers. Character remains an important part of community banking and our success.
We distinguish ourselves from the competition by empowering our employees to make decisions. When a customer has a need, our employees have the authority to meet their needs. As community bankers, we also know that it is important to support our customers during difficult times. Our bank is committed to helping see our customers through the uncertainties that we are all facing.
Our bank is different from our competitors because of the commitment, loyalty and hard work of our employees and directors. From the day the bank opened, everyone has worked as a team and has been committed to being the premier community bank in Rowan County. Community is not just part of our name, it is a way of life and it is about treating customers the way they want to be treated. That is why at Community Bank of Rowan our “Customers Are Always First.”
— Bruce D. Jones, President & CEO
Board of Directors
Gregory M. Alcorn
Owner & CEO
Global Contact Services
John T. Bost
Developer
Jim L. Bost Construction Co. Inc.
James L. Comadoll, MD
Orthopedic Surgeon & President
RoMedical Care PA
John W. Ellis II
Area Manager
Baxter Bio Surgery
William M. Graham
Attorney at Law
Wallace and Graham, PA
Dianne Y. Greene
Broker & Owner
Century 21 Towne & Country
Bruce D. Jones
President, Southeast Region
Capitol Bancorp Limited
President & CEO
Community Bank of Rowan
Bobby Clay Lindsay Jr.
President
Summit Developers, Inc.
Patrick T. Reid
Attorney at Law
Reid & Reid
Eric C. Troyer, MD
Troyer Family Practice
Officers
Bruce D. Jones
Chairman, President
& CEO
John W. Ellis II
Secretary
Seamus M. Donaldson
Senior Vice President
& CCO
Robert C. Sieg
Senior Vice President
Judy K. Haire
Vice President
Nancy C. Hildreth
Vice President
Crystal L. Hodges
Vice President
Brad R. Martin
Vice President
Jeff S. Wetmore
Vice President
Heidi W. Whitesell
Vice President
Community Bank of Rowan
322 East Innes Street
Salisbury, NC 28144
704.639.0730
China Grove Office
313 East Centerview Street
China Grove, NC 28023
704.857.3300
www.communitybankofrowan.com
FIRST CAROLINA STATE BANK
Timothy N. Taylor, President & CEO
Given the current market, what prompted First Carolina State Bank to expand into Reidsville and Greenville, North Carolina?
While the current times are indeed challenging, the management and directors of First Carolina State Bank have faith in the resilience of the North Carolina economy. Regardless of the short-term economic volatility, we are confident that our markets will thrive in the long run. We are working tirelessly to make this happen.
The bank leveraged one of our executive’s decades of business development experience when he helped us enter Greenville via a loan production office at minimal cost to the bank. In a very short period of time, the office has built a profitable commercial loan portfolio. Our plan is to convert this office into a full-service branch with a private banking feel.
In Reidsville, the loss of a few key community banks through mergers and acquisitions left this proud community without a bank with a hometown feel. Along with the efforts of our team in Reidsville, more than 300 local people purchased stock in First Carolina State Bank. This allowed our bank to provide the necessary capital to launch Reidsville Community Bank, a division of First Carolina State Bank, near the end of 2008.
For any building to stand the test of time, it must begin with a strong foundation followed by well planned, solidly constructed additions. First Carolina State Bank’s expansion into Greenville and Reidsville exhibit these attributes. Our employees and directors will reinforce our future development with a strong work ethic and a relentless focus on serving our customers.
— Timothy N. Taylor, President & CEO
Board of Directors
Samuel E. Anderson
Commercial Agent
Fountain Roberson & Anderson
Peggy M. Braswell
Retired
Richard C. Davenport
President
Calvin Davenport, Inc.
Kathe M. Henke
Retired
Bruce D. Jones
President, Southeast Region
Capitol Bancorp Limited
W. H. Kimball
Retired Vice President of Sales
Kenan Transport
Thomas W. King
Attorney at Law
David A. Parker
Retired
James E. Rabil
President
Chambliss & Rabil Contractors, Inc.
James R. Rose Jr.
Executive Vice President
First Carolina State Bank
Charles D. Smith
President
First Carolina Communications, Inc
Randall C. Stewart, DPT
President & Physical Therapist
Carolina Physical Therapy
Contractors, Inc.
Timothy N. Taylor
President & CEO
First Carolina State Bank
Officers
Randall C. Stewart
Chairman
David A. Parker
Vice Chairman
Timothy N. Taylor
President & CEO
Kathe M. Henke
Secretary
James R. Rose Jr.
Executive Vice President
William M. Griffith
Senior Vice President
William D. Edgar Jr.
Vice President
John R. Johnson
Vice President
Ella J. Pass
Vice President
Rebecca S. Price
Vice President
Beverley Riley
Vice President
Edward G. Taylor
Vice President
First Carolina State Bank
171 North Winstead Avenue
Rocky Mount, NC 27804
252.937.2152
Greenville Office
300 East Arlington Boulevard
Suite 4-B
Greenville, NC 27858
252.756.4073
Tarboro Office
2100 North Main Street
Tarboro, NC 27886
252.823.8230
Reidsville Community
Bank, a unit of First
Carolina State Bank
112 South Main Street
Reidsville, NC 27320
336.361.4088
www.firstcarolinastatebank.com
PEOPLES STATE BANK
Bruce D. Jones, President
How has Peoples State Bank remained a fixture in the Jeffersonville community?
Peoples State Bank has played an important role in the lives of the people of Jeffersonville and Twiggs County since its founding. Over the decades, our bank has provided financial services that local families needed to purchase their first home, send their children to college and prepare for retirement. “Your Hometown Community Bank” is not just a philosophy; it is a place where residents find friends who care about their customers and neighbors.
As the only bank in Twiggs County, we acknowledge our tremendous responsibility to our community. We continually strive to earn and maintain the trust of residents and businesses, especially since they are our friends and neighbors. We remain committed to providing our community with outstanding products and the highest level of customer service. With our commitment to strengthening small businesses, we can now provide products such as remote deposit, cash management and free checking. Through construction financing, we have also helped a number of nonprofits build additions and entirely new facilities. Additionally, our employees have a proud tradition of supporting civic and nonprofit organizations with time and service.
Strength and stability are important qualities to our community and Peoples State Bank is strong and well-capitalized. We are committed to the principles of integrity, loyalty and hard work. Customer and community service will continue to be our top priorities. By staying close to our friends and working together, Peoples State Bank will remain a fixture in Jeffersonville for decades to come.
— Bruce D. Jones, President
Board of Directors
Alan D. Curtis
President & CEO
Cochran Air Service, Inc.
Charles R. Greene
President & CEO
Allentown Chip Company, Inc.
Bruce D. Jones
President, Southeast Region
Capitol Bancorp Limited
President
Peoples State Bank
Patrick T. Reid
Attorney at Law
Reid & Reid
Matthew D. Stanaland
President
Bank of Valdosta
Bobby G. Wetherington
Partner
Wetherington Farms, LP
Officers
Bruce D. Jones
Chairman & President
B. Kay Howell
Executive Vice President
Brenda M. Best-Youmans
Senior Vice President
Peoples State Bank
207 Main Street
Jeffersonville, GA 31044
478.945.3262
www.psbjeffersonville.com
PISGAH COMMUNITY BANK
Thomas E. Durham Jr., President & CEO
How has Pisgah Community Bank been successful since opening in 2008, given the current challenges of the economy?
Our bank’s successful opening is the result of our team’s vision and passion for community banking and the confidence in our business model by local shareholders. Our commitment —“Big Enough to Serve You, Small Enough to Know You” — has been overwhelmingly embraced by our shareholders and the community.
Pisgah Community Bank’s future success lies in the foundation of a strong, visible and active board of directors and a veteran team of bankers who are committed to serving the community in which they live and work. Our dedication to the Asheville community is displayed by our commitment of time and resources to various nonprofits and charitable organizations.
The involvement of several local business leaders on our board of directors has been integral to our bank’s business development initiatives. Our board members have enthusiastically promoted the bank in the community, which has generated numerous new business relationships. Our bank’s commitment to developing relationships that are deep and lasting have caused our new bank to experience solid loan and deposit growth.
The endorsements from our community, shareholders and customers who wholeheartedly support our vision for community banking promises to fuel our bank’s continued growth for years to come. Our successful opening and early business development achievements affirm our goal of building a strong hometown bank.
— Thomas E. Durham Jr., President & CEO
Board of Directors
Joe C. Brumit II
President & CEO
Brumit Development
Company, LLC
Thomas E. Durham Jr.
President & CEO
Pisgah Community Bank
Kerry A. Friedman
Attorney at Law
Patla, Straus, Robinson
& Moore, PA
Bruce D. Jones
President, Southeast Region
Capitol Bancorp Limited
William W. Mance Jr.
Retired
Keith M. Maxwell, MD
Orthopedic Surgeon
Southeastern Sports Medicine
Charles D. Owen III
President & CEO
Fletcher Warehousing Company
Diana C. Pickering
Vice Chair, Board of Directors
The Biltmore Company
Patrick T. Reid
Attorney at Law
Reid and Reid
Officers
Bruce D. Jones
Chairman
Thomas E. Durham Jr.
President & CEO
William W. Mance Jr.
Secretary
Robert Craig Gourlay
Senior Vice President
& CCO
Mary Alice Mobley
Senior Vice President
& Operations Manager
Vickie L. Kanupp
Vice President
David G. Smith
Vice President
Pisgah Community Bank
1089 Hendersonville Road
Asheville, NC 28803
828.277.7127
www.pisgahcommunitybank.com
SUNRISE BANK OF ATLANTA
Charles H. Green, President
How does Sunrise Bank of Atlanta benefit from the “Art of Banking”?
Our “Art of Banking” concept has developed into vibrant financial relationships that help our clients invest in their future, create jobs, plan for retirement and educate their children.
In competing with larger Atlanta money-center banks, we opened many new accounts through simple listening and caring skills. We are a capable and engaged financial partner for entrepreneurs, small businesses and emerging professionals, as well as for working families, students and many people nearing retirement.
We initiated this effort with an exceptional staff of professional bankers committed to excellence. With the goal of delivering a unique banking idea to our market — that banking can be a creative art — our clients have responded favorably.
As we head into our third full year of operation, we are prepared to continue building the same kind of relationship with new clients, helping to solve more financial problems and providing convenient assistance beyond what our clients ever expected.
And, as always, we will continue to be a safe and sound haven for one of the most valued assets of our clients — their wealth. We bear the responsibility of client trust in every decision we make and will always live up to that standard.
— Charles H. Green, President
Board of Directors
Kim E. Anderson
Director
Boardwalk Consulting LLC
Lawrence E. Cooper, MD
Principal
Bentley Investments, Inc.
Herbert M. Dangerfield
President & Owner
Carey Executive Limousine
Peter G. Davis
President & CEO
Vesdia Corporation
Karen Burkhart Dick
Executive Vice President
Ackerman & Co.
Eugene Jones Duffy
Partner & Senior Vice President
Paradigm Asset Management
Randal A. Enterkin
President & CEO
PrecisionJet, Inc.
Charles H. Green
President
Sunrise Bank of Atlanta
Angela Hsu
Vice President & Attorney
Duke Realty Corporation
Bari R. Love
Principal
Jackson Spalding Communications
Bruce D. Jones
President, Southeast Region
Capitol Bancorp Limited
M. Kasim Reed
Partner
Holland & Knight LLP
Patrick T. Reid
Attorney at Law
Reid and Reid
R. Kirk Rich
President
Rich Real Estate Services, Inc.
Grace M. Lopez-Williams
President
Grace Williams CPA, PC
Officers
Patrick T. Reid
Chairman
Bruce D. Jones
Vice Chairman
Angela Hsu
Secretary
Charles H. Green
President
Guenter C. Kittel
Senior Vice President
& CCO
June F. Kossow
Senior Vice President
& COO
Tareasa P. Sexton
First Vice President
& Senior Loan Officer
Rick S. Darlington
Vice President
& Mortgage Lending
Manager
Miroslava Torres-Young
Vice President
Sunrise Bank of Atlanta
600 West Peachtree Street NW, Suite 300
Atlanta, GA 30308
404.249.6500
www.sunrisebankofatlanta.com
Clinton D. Dunn, Region President
78 Bank of Fort Bend
79 Bank of Las Colinas
The Texas economy has remained relatively strong over the past several years. Before the 1980s, Texas’ major economic engine was the oil industry with tentacles that spread throughout the state. The downturn of this sector in the 1980s hit the state hard and contributed to the collapse of the real estate and banking industries. These events resulted in a proactive program by the state of Texas and its cities to attract businesses that represented economic diversification that has set the table for the state to remain strong, even in the face of economic decline in other parts of the country.
The strategy to develop Capitol Bancorp Limited in Texas mirrors the macro strategy of Capitol Bancorp and the state of Texas to achieve a balanced, strong portfolio through geographic diversification. As the state recovered from the problems of the 1980s, each population hub developed its own economic drivers taking advantage of geographic location as well as human and natural resources. Dallas, Houston, San Antonio and Austin each have their own set of economic drivers.
As we continue to develop the Texas market, careful attention will be paid to diversifying geographically to take advantage of the strengths of each market and to fill the voids created by bank consolidations.
BANK OF FORT BEND
R. Bruce Mercer, President
What is Bank of Fort Bend’s plan to meet shareholders’ expectations over the first three years of operations?
We feel very strongly that the current turmoil in the economy can create opportunities for those careful enough to take advantage of them. Many banks in our market have curtailed lending due to capital or liquidity restrictions; however, Bank of Fort Bend has opportunities and we are advertising accordingly.
We are finding ways to improve performance and efficiency. We just hired a senior lender because he is a strong producer with good credit skills. We are also training one of our lobby services personnel in the loan operations area so that she is available to work between both areas as needed.
Finally, we are being proactive in following our underwriting guidelines to ensure that we have superior credit quality and can avoid future loan losses. We are fortunate to have a very experienced loan committee comprised of successful businesspeople whose careers started in banking, so we have a wealth of experience to help us weather these times.
— R. Bruce Mercer, President
Board of Directors
William E. Anderson
President & Owner
Fort Bend Publishing Group
Ronald W. Bickers
President
Southwest Calibration Service, Inc.
Robert P. Brooks
Owner
Robert P. Brooks Investments
Clinton D. Dunn
President, Texas Region
Capitol Bancorp Limited
Douglas A. Heath
Director
Butler Waddell Interests
Rajni Jain, CPA
Partner
Jain & Jain, PC
Mark I. Kaufman
Investor
R. Bruce Mercer
President
Bank of Fort Bend
Rajesh M. Naran
President
ALS | e-Lab Analytical, Inc.
John M. Null, CPA
Managing Partner
Null-Lairson, PC
Mehran Rafizadeh
Dealer & Principal
Republic Harley-Davidson/Buell
Mark A. Simmons
Managing Director
The Avalon Group
William J. Swinbank
General Manager
The Sprint Companies
Officers
Clinton D. Dunn
Chairman
R. Bruce Mercer
President
Jim Q. Dearing
Executive Vice President
Sandi S. Otero
Executive Vice President
& CCO
Claudia S. Riggins
Senior Vice President
Jeremy J. Bills
Vice President
Jean C. Goff
Vice President
Amy C. Marsters
Vice President
J. Keith Miller
Vice President
Bank of Fort Bend
12946 Dairy Ashford Road, Suite 100
Sugar Land, TX 77478
281.276.1800
www.bankoffortbend.com
BANK OF LAS COLINAS
Gerold L. Hooker, President
As Bank of Las Colinas moves forward, how will it differentiate itself and its banking team from competitors?
Bank of Las Colinas opened for business in December 2007. The bank was founded on the simple but fundamental belief that people will bank where they are appreciated and well served. The principle has proven true throughout 2008 as our bank grew to over $30 million in assets.
The upcoming year will present challenges to the financial community due to the unique economic conditions. We feel well prepared to face those challenges. While the major banks consolidate decision making and replace experienced bankers with order takers, we have an excellent staff of seasoned bankers, strong capital and a quality loan portfolio.
Our organization has embraced the available technology to enhance what we feel is an excellent level of customer service. Our facility lends itself to customer comfort. In lieu of traditional teller lines, we employ customer service representatives who greet each customer personally to discuss their financial needs.
We understand that solid banking relationships are built by delivering a superior level of customer service to the client year after year. We believe that our staff has proven our capabilities in this pursuit and we will strive to continue this tradition in the upcoming years.
— Gerold L. Hooker, President
Board of Directors
Gary L. Cain
President & Chairman
Cain Foods Industries, Inc.
Clinton D. Dunn
President, Texas Region
Capitol Bancorp Limited
Gerold L. Hooker
President
Bank of Las Colinas
Nicholas F. Leber, DDS
President
Nicholas F. Leber, DDS, PC
Felix J. Lozano III
Partner
Whitley Penn LLP
Paul L. Moore
Chairman
Southwestern Shaver
Company, Inc.
Robert B. Neely
Chairman & CEO
TCP Realty Services, LLC
Kelly G. Saxton
President
Saxton Pierce Restaurant
Corporation
John D. Settle Jr.
Shareholder & Secretary
SettlePou, a Professional
Corporation
Darrell W. Wilson
Owner
The Slalom Shop Boats & Yachts
Officers
Clinton D. Dunn
Chairman
Gerold L. Hooker
President
Brad D. Tidwell
Executive Vice President
D. Wes Griffin
Senior Vice President
Cody D. Edge
Vice President
Ann N. Glockzin
Vice President
Ginny E. Guerra
Vice President
Bank of Las Colinas
300 East John Carpenter Freeway
Suite 100
Irving, TX 75062
214.574.4900
www.bankoflascolinas.com
81 Amera Mortgage Corporation
82 Capitol Wealth
AMERA MORTGAGE CORPORATION
Mark A. Janssen, CEO
How has Amera Mortgage Corporation navigated the tumultuous mortgage lending environment in 2008 to position itself for the future?
During 2008, many large and small mortgage lending firms disappeared from the residential lending landscape. Amera Mortgage confronted disruptions in the market, including product scope, pricing, valuation and interim financing availability by narrowing our business focus to our core lending competencies, liquidity and expense controls.
A conscious effort was made as early as December 2007 to eliminate nonessential expenses and preserve human capital in our critical support areas. This effort, combined with renegotiation of our warehouse funding line early in 2008, enabled us to bolster cash and loan loss reserves throughout the year and contribute a net profit to the bottom line. Our lending focus shifted back to our core strength of originating conforming conventional and government loans.
A concerted effort was made during 2008 to sponsor and educate Capitol Bancorp Limited affiliated banks with regard to Federal Housing Administration and Veterans Administration residential lending with great results. The focus on this type of lending has positioned both Amera and Capitol’s affiliated banks to engage in new customer relationships quickly as interest rates have dropped and the secondary market for these products has reliquified heading into 2009.
We look forward to expanding our relationships within the Capitol Bancorp system through increased education of lenders and bank directors. This training will help increase the opportunities for additional profit available to affiliates in 2009.
— Mark A. Janssen, CEO
Board of Directors
Susan L. Bowen
Executive Vice President
Amera Mortgage Corporation
Melinda F. Cain
Executive Vice President
Amera Mortgage Corporation
Lee W. Hendrickson
Chief Financial Officer
Capitol Bancorp Limited
Mark A. Janssen
CEO
Amera Mortgage Corporation
Lyle W. Miller
President
L. W. Miller Holding Co.
Jerald H. Rock
President
Amera Mortgage Corporation
John C. Smythe
President, Great Lakes Region - East
Capitol Bancorp Limited
Bruce A. Thomas
President of Bank Operations
Capitol Bancorp Limited
Kathleen M. DeFrances
Executive Vice President
Amera Mortgage Corporation
Officers
John C. Smythe
Chairman
Mark A. Janssen
CEO
Jerald H. Rock
President
Lee W. Hendrickson
Secretary & Treasurer
Susan L. Bowen
Executive Vice President
Melinda F. Cain
Executive Vice President
Kathleen M. DeFrances
Executive Vice President
John A. Korch
Senior Vice President
Sharon A. Pastori
Senior Vice President
& CFO
James A. Sellick
Senior Vice President
Nancy J. Caruso
Vice President
Susan Good
Vice President
Melodie A. Haverkate
Vice President
Kathleen E. S. Lawrence
Vice President
Robert A. Risher
Vice President
Susan L. Shaffer
Vice President
Amera Mortgage Corporation
1050 Corporate Office Drive, Suite 200
Milford, MI 48381
248.685.1700
www.ameramortgage.com
CAPITOL WEALTH
Robert R. Hogan, President & CEO
Given the market volatility and an overabundance of financial advice in the media, how can a customer make sound long-term plans with confidence?
Billions of dollars in liquidity have been injected into the financial system by our government with billions more on the way. Additional investments are being made in the largest economic stimulus plan of all time. Roads will be built, infrastructure improved and jobs will be created. Given the enormity of the plan, we know our economy will recover over time, markets will stabilize and our customers’ investment portfolios will benefit.
In today’s world, Capitol Wealth is uniquely positioned to support customers through these challenges and respond to their questions:
■ How soon before market conditions improve?
■ Will my money be safe?
■ What do I do now?
Answering these questions begins with providing a customer reassurance. At Capitol Wealth, customer reassurance comes in the form of continually assessing their wants, needs and expectations, whether impacting previously defined life goals or rebalancing an established investment approach. Through this assessment, we can move a customer forward with a successful action plan that includes:
■ Updating financial plans that reinforce the realities of an existing portfolio;
■ Rebalancing current portfolios in line with newly defined risk tolerances;
■ Being selective and systematic with investment choices;
■ Evaluating debt positions by directing reduction of costly loans or referring refinancing options;
■ Reviewing retirement plans and insurance policies that meet and protect a family’s needs;
■ Providing price transparency of transaction and account costs; and,
■ Offering input and advice from multiple wealth product experts.
Capitol Wealth offers customers a complete array of wealth management advice, service and products. We provide all the support available from a bigger institution, but we do it through a personal relationship based on trust.
— Robert R. Hogan, President & CEO
Board of Directors
Jay J. Butler
Retired Bank Executive
Robert R. Hogan
President & CEO
Capitol Wealth, Inc.
Michael M. Moran
Chief of Capital Markets
Capitol Bancorp Limited
Enrico S. Piraino
Business Entrepreneur
Joseph D. Reid
Chairman & CEO
Capitol Bancorp Limited
Patrick T. Reid
Attorney at Law
Reid & Reid
Jeffrey D. Saunders
Chief Accounting Officer
Capitol Bancorp Limited
Pamela E. West
Retired Bank Executive
Ben E. Yeakley
Retired Trust Executive
Business Entrepreneur
Officers
Joseph D. Reid
Chairman
Robert R. Hogan
Vice Chairman
David M. Paventi
Secretary, Treasurer & COO
Capitol Wealth
9300 Harris Corners Parkway, Suite 410
Charlotte, NC 28269
704.599.1055
www.capitolwealth.com
Table of Contents
| F-2 |
| F-3 |
| F-4 |
| F-4 |
| F-5 |
| F-6 |
| |
| F-7 |
| F-7 |
| F-8 |
| F-9 |
| F-12 |
| F-16 |
| F-22 |
| F-26 |
| F-31 |
| F-31 |
| F-32 |
| F-32 |
| F-32 |
| F-33 |
| F-34 |
| F-35 |
| Consolidated Financial Statements: | |
| F-37 |
| F-38 |
| F-39 |
| F-40 |
| F-41 |
| F-42 |
(in $1,000s, except per share data)
| | | As of and for the Year Ended December 31 |
| | | 2008(1) | | | 2007(2) | | | 2006(3) | | | 2005(4) | | | 2004(5) |
| For the year: | | | | | | | | | | | | | | |
| Interest income | | $ | 304,315 | | | $ | 330,439 | | | $ | 279,353 | | | $ | 224,439 | | | $ | 179,089 |
| Interest expense | | | 140,466 | | | | 147,162 | | | | 105,586 | | | | 67,579 | | | | 47,496 |
| Net interest income | | | 163,849 | | | | 183,277 | | | | 173,767 | | | | 156,860 | | | | 131,593 |
| Provision for loan losses | | | 82,492 | | | | 25,340 | | | | 12,156 | | | | 10,960 | | | | 12,708 |
| Noninterest income | | | 26,432 | | | | 24,381 | | | | 21,532 | | | | 21,048 | | | | 19,252 |
| Noninterest expense | | | 190,388 | | | | 176,160 | | | | 137,804 | | | | 117,289 | | | | 97,787 |
| Net income (loss) | | | (28,607 | ) | | | 21,937 | | | | 42,391 | | | | 35,925 | | | | 26,716 |
| Net income (loss) per share: | | | | | | | | | | | | | | | | | | | |
| Basic | | | (1.67 | ) | | | 1.29 | | | | 2.69 | | | | 2.42 | | | | 1.88 |
| Diluted | | | (1.67 | ) | | | 1.27 | | | | 2.57 | | | | 2.34 | | | | 1.79 |
| Cash dividends paid per share | | | 0.50 | | | | 1.00 | | | | 0.95 | | | | 0.72 | | | | 0.65 |
| | | | | | | | | | | | | | | | | | | | |
| At end of year: | | | | | | | | | | | | | | | | | | | |
| Total assets | | $ | 5,654,836 | | | $ | 4,901,763 | | | $ | 4,065,816 | | | $ | 3,475,721 | | | $ | 3,091,418 |
| Total earning assets | | | 5,282,010 | | | | 4,527,006 | | | | 3,743,041 | | | | 3,204,646 | | | | 2,885,545 |
| Portfolio loans | | | 4,735,229 | | | | 4,314,701 | | | | 3,488,678 | | | | 2,991,189 | | | | 2,692,904 |
| Deposits | | | 4,497,612 | | | | 3,844,745 | | | | 3,258,485 | | | | 2,785,259 | | | | 2,510,072 |
Notes payable and short-term borrowings | | | 446,925 | | | | 320,384 | | | | 191,154 | | | | 175,729 | | | | 172,534 |
| Subordinated debentures | | | 167,293 | | | | 156,130 | | | | 101,035 | | | | 100,940 | | | | 100,845 |
Minority interests in consolidated subsidiaries | | | 159,220 | | | | 156,198 | | | | 126,512 | | | | 83,838 | | | | 39,520 |
| Stockholders' equity | | | 353,848 | | | | 389,145 | | | | 361,879 | | | | 301,866 | | | | 252,159 |
| | | | | | Quarterly Results of Operations (unaudited) |
| | | Total for the Year | | | Fourth Quarter | | | Third Quarter | | | Second Quarter | | | First Quarter |
Year ended December 31, 2008:(1) | | | | | | | | | | | | | | |
| Interest income | | $ | 304,315 | | | $ | 73,179 | | | $ | 75,496 | | | $ | 76,137 | | | $ | 79,503 |
| Interest expense | | | 140,466 | | | | 34,496 | | | | 34,457 | | | | 33,945 | | | | 37,568 |
| Net interest income | | | 163,849 | | | | 38,683 | | | | 41,039 | | | | 42,192 | | | | 41,935 |
| Provision for loan losses | | | 82,492 | | | | 10,705 | | | | 53,810 | | | | 9,019 | | | | 8,958 |
| Net income (loss) | | | (28,607 | ) | | | 1,074 | | | | (32,495 | ) | | | 623 | | | | 2,191 |
Net income (loss) per share:(6) | | | | | | | | | | | | | | | | | | | |
| Basic | | | (1.67 | ) | | | 0.06 | | | | (1.90 | ) | | | 0.04 | | | | 0.13 |
| Diluted | | | (1.67 | ) | | | 0.06 | | | | (1.90 | ) | | | 0.04 | | | | 0.13 |
| Cash dividends paid per share | | | 0.50 | | | | 0.05 | | | | 0.05 | | | | 0.15 | | | | 0.25 |
| | | | | | | | | | | | | | | | | | | | |
Year ended December 31, 2007:(2) | | | | | | | | | | | | | | | | | | | |
| Interest income | | $ | 330,439 | | | $ | 86,310 | | | $ | 85,036 | | | $ | 81,254 | | | $ | 77,839 |
| Interest expense | | | 147,162 | | | | 39,924 | | | | 38,368 | | | | 35,712 | | | | 33,158 |
| Net interest income | | | 183,277 | | | | 46,386 | | | | 46,668 | | | | 45,542 | | | | 44,681 |
| Provision for loan losses | | | 25,340 | | | | 9,528 | | | | 7,890 | | | | 3,990 | | | | 3,932 |
| Net income | | | 21,937 | | | | 3,394 | | | | 5,974 | | | | 6,298 | | | | 6,271 |
Net income per share:(6) | | | | | | | | | | | | | | | | | | | |
| Basic | | | 1.29 | | | | 0.20 | | | | 0.35 | | | | 0.37 | | | | 0.38 |
| Diluted | | | 1.27 | | | | 0.20 | | | | 0.35 | | | | 0.37 | | | | 0.36 |
| Cash dividends paid per share | | | 1.00 | | | | 0.25 | | | | 0.25 | | | | 0.25 | | | | 0.25 |
| (1) | Includes Adams Dairy Bank, effective January 2008 (located in Blue Springs, Missouri), Mountain View Bank of Commerce, effective February 2008 (located in Westminster, Colorado), Colonia Bank, effective April 2008 (located in Phoenix, Arizona) and Pisgah Community Bank, effective May 2008 (located in Asheville, North Carolina). |
| (2) | Includes Bank of Tacoma, effective January 2007 (located in Tacoma, Washington), Sunrise Community Bank, effective February 2007 (located in Palm Desert, California), Larimer Bank of Commerce, effective May 2007 (located in Fort Collins, Colorado), Issaquah Community Bank (located in Issaquah, Washington) and USNY Bank (located in Geneva, New York), both effective July 2007, High Desert Bank, effective September 2007 (located in Bend, Oregon), Loveland Bank of Commerce, effective October 2007 (located in Loveland, Colorado), Bank of Feather River, effective November 2007 (located in Yuba City, California) and Community Bank of Lincoln (located in Lincoln, Nebraska), Bank of Fort Bend (located in Sugar Land, Texas) and Bank of Las Colinas (located in Irving, Texas), each effective December 2007. |
| (3) | Includes Community Bank of Rowan, effective February 2006 (located in Salisbury, North Carolina), Asian Bank of Arizona, effective April 2006 (located in Phoenix, Arizona), Evansville Commerce Bank, effective May 2006 (located in Evansville, Indiana), Bank of Valdosta (located in Valdosta, Georgia), Sunrise Bank of Atlanta (located in Atlanta, Georgia) and Bank of Everett (located in Everett, Washington), all effective June 2006, Bank of Maumee (located in Maumee, Ohio) and 1st Commerce Bank (located in North Las Vegas, Nevada), both effective October 2006, and Ohio Commerce Bank (located in Beachwood, Ohio), effective November 2006. |
| (4) | Includes Bank of Michigan, effective January 2005 (located in Farmington Hills, Michigan), Peoples State Bank, acquired April 7, 2005 (located in Jeffersonville, Georgia), Bank of Bellevue (located in Bellevue, Washington) and Fort Collins Commerce Bank (located in Fort Collins, Colorado), both effective June 2005, Bank of Auburn Hills, effective July 2005 (located in Auburn Hills, Michigan), Bank of San Francisco, effective August 2005 (located in San Francisco, California), Bank of Belleville (located in Belleville, Illinois) and Summit Bank of Kansas City (located in Lee's Summit, Missouri), both effective November 2005, and Bank of Santa Barbara, effective December 2005 (located in Santa Barbara, California). |
| (5) | Includes First Carolina State Bank (located in Rocky Mount, North Carolina), acquired April 1, 2004 and Point Loma Community Bank (located in San Diego, California), effective August 2004. |
| (6) | Each period's computation of net income per share is performed independently and, accordingly, net income per share for the year (basic and diluted) may not equal the sum of the amounts shown for the quarterly periods. |
Capitol's common stock is traded on the New York Stock Exchange (NYSE) under the symbol "CBC." Market quotations regarding the range of high and low sales prices of Capitol's common stock, as reported by the NYSE, were as follows:
| | | 2008 | | | 2007 |
| | | Low | | | High | | | Low | | | High |
| Quarter Ended: | | | | | | | | | | | |
| March 31 | | $ | 16.30 | | | $ | 23.52 | | | $ | 36.81 | | | $ | 47.06 |
| June 30 | | | 8.97 | | | | 21.42 | | | | 27.06 | | | | 37.60 |
| September 30 | | | 7.08 | | | | 25.40 | | | | 20.00 | | | | 27.86 |
| December 31 | | | 3.84 | | | | 20.49 | | | | 18.15 | | | | 27.24 |
Below is a graph which summarizes the cumulative return earned by Capitol's shareholders over the last five years compared with the SNL (SNL Financial LC) $5B-$10B Asset-Size Index (SNL) and the cumulative total return on the Russell 2000 Index (R-2000). This presentation assumes the value of an investment in Capitol's common stock and each index was $100 on December 31, 2003 and that subsequent cash dividends were reinvested.
| | | Period Ending |
| Index | | 12/31/03 | 12/31/04 | 12/31/05 | 12/31/06 | 12/31/07 | 12/31/08 |
| Capitol Bancorp Ltd. | | 100.00 | 126.97 | 137.95 | 174.06 | 78.78 | 31.59 |
| Russell 2000 | | 100.00 | 118.33 | 123.72 | 146.44 | 144.15 | 95.44 |
| SNL Bank $5B-$10B | | 100.00 | 119.22 | 115.52 | 124.67 | 99.98 | 87.71 |
INFORMATION REGARDING CAPITOL'S COMMON STOCK--Continued
During 2008, Capitol paid quarterly cash dividends of $0.25 per share for the first quarter, $0.15 in the second quarter and $0.05 in the third and fourth quarters. In 2007, Capitol paid quarterly cash dividends of $0.25 per share. Future payment of dividends is subject to approval by Capitol's board of directors, future operating performance and management's assessment of the consolidated organization's capital adequacy.
As of February 9, 2009, there were 9,620 beneficial holders of Capitol's common stock, based on information supplied to Capitol from its stock transfer agent and other sources.
At February 9, 2009, 17,290,623 shares of common stock were outstanding. Capitol's stock transfer agent is BNY Mellon Shareowner Services, 480 Washington Blvd., Jersey City, NJ 07310 (telephone 866/205-7090). The web site for BNY Mellon Shareowner Services is http://www.bnymellon.com/shareowner/isd.
Capitol has a direct purchase and dividend reinvestment plan, the Capitol Bancorp Limited Direct Purchase and Dividend Reinvestment Plan ("Capitol Bancorp Direct"), which offers a variety of convenient features including dividend reinvestment, certain fee-free transactions, certificate safekeeping and other benefits. For a copy of the Capitol Bancorp Direct prospectus, informational brochure and enrollment materials, contact BNY Mellon Shareowner Services at 866/205-7090 or Capitol at 517/487-6555.
In addition to Capitol's common stock, trust-preferred securities of Capitol Trust I and Capitol Trust XII (each a subsidiary of Capitol) are listed on the NYSE under the symbol "CBCPrA" and "CBCPrB," respectively. The trust-preferred securities have a liquidation amount of $10 per preferred security and are guaranteed by Capitol. Capitol Trust I consists of 2,530,000, 8.5% cumulative preferred securities scheduled to mature in 2027, which are currently callable and may be extended to 2036 if certain conditions are met. Capitol Trust XII consists of 3,805,000, 10.5% cumulative preferred securities scheduled to mature in 2038 and become callable in 2013.
Capitol has filed with the U.S. Securities and Exchange Commission (SEC) all required certifications of its Chief Executive Officer (CEO) and Chief Financial Officer (CFO) regarding the quality of Capitol's public disclosures. In addition, Capitol's CEO submitted to the NYSE an annual CEO certification stating that he is not aware of any violation by Capitol of the NYSE's corporate governance listing standards. Further, Capitol filed certifications by its CEO and CFO with the SEC in accordance with the Sarbanes-Oxley Act of 2002 as exhibits to Capitol's Form 10-K for the year ended December 31, 2008.
A copy of Capitol's 2008 report on Form 10-K, without exhibits, is available to holders of its common stock or trust-preferred securities without charge, upon written request. Form 10-K includes certain statistical and other information regarding Capitol and its business. Requests to obtain Form 10-K should be addressed to Investor Relations, Capitol Bancorp Limited, Capitol Bancorp Center, 200 N. Washington Square, Lansing, Michigan 48933.
AVAILABILITY OF FORM 10-K AND CERTAIN OTHER REPORTS--Continued
Form 10-K and certain other periodic reports are filed with the SEC. The SEC maintains an Internet web site that contains reports, proxy and information statements and other information regarding companies which file electronically (which includes Capitol). The SEC's web site address is http://www.sec.gov. Capitol's filings with the SEC are also available at Capitol's web site, http://www.capitolbancorp.com.
EXECUTIVE OFFICES
| Capitol Bancorp Center | 2777 East Camelback Road |
| 200 N. Washington Square | Suite 375 |
| Lansing, Michigan 48933 | Phoenix, Arizona 85016 |
| 517/487-6555 | 602/955-6100 |
| www.capitolbancorp.com |
INDEPENDENT AUDITORS
BDO Seidman, LLP
Grand Rapids, Michigan
SHAREHOLDER INFORMATION
ANNUAL MEETING
Capitol's 2008 Annual Meeting of Shareholders will be held on Wednesday, April 22, 2009 at 4:00 p.m. at the Capitol Bancorp Center, located at 200 N. Washington Square, Lansing, Michigan.
COMMON STOCK TRADING INFORMATION
Capitol's common stock trades on the NYSE under the trading symbol "CBC."
COMMON STOCK TRANSFER AGENT
BNY Mellon Shareowner Services
480 Washington Blvd.
Jersey City, NJ 07310
866/205-7090
DIRECT PURCHASE AND DIVIDEND REINVESTMENT PLAN
Capitol offers an easy and affordable way to invest in Capitol's common stock through its direct purchase and dividend reinvestment plan, Capitol Bancorp Direct. Capitol Bancorp Direct's benefits include the ability to make an initial investment in common stock with as little as $50, reinvestment of dividends in additional common stock, direct deposit of dividends, ability to purchase common stock as frequently as once a month, and the option to make transfers or gifts of Capitol's common stock to another person. Participation in Capitol Bancorp Direct is voluntary and shareholders and prospective investors are eligible. Purchases under Capitol Bancorp Direct are not currently subject to any brokerage fees or commissions. For further information regarding Capitol Bancorp Direct or a copy of Capitol Bancorp Direct's prospectus, informational brochure and enrollment materials, contact BNY Mellon Shareowner Services at 866/205-7090 or Capitol at 517/487-6555.
SHAREHOLDER INFORMATION--Continued
TRUST-PREFERRED SECURITIES TRADING INFORMATION
Preferred securities of Capitol Trust I and Capitol Trust XII (each a subsidiary of Capitol) trade on the NYSE under the trading symbols "CBCPrA" and "CBCPrB," respectively.
TRUST-PREFERRED SECURITIES TRUSTEE
Capitol Trust I: JP Morgan Institutional Trust Services – Tempe, Arizona
Capitol Trust XII: Wells Fargo Delaware Trust Company
Some of the statements contained in this annual report that are not historical facts may constitute forward-looking statements. Those forward-looking statements, within the meaning of the Private Securities Litigation Reform Act of 1995, are subject to known and unknown risks, uncertainties and other factors which may cause the actual future results, performance or achievements of Capitol and/or its subsidiaries and other operating units to differ materially from those contemplated in such forward-looking statements. The words "intend," "expect," "project," "estimate," "predict," "anticipate," "should," "will," "may," "believe" and similar expressions also identify forward-looking statements. Important factors which may cause actual results to differ from those contemplated in such forward-looking statements include, but are not limited to: (i) the results of Capitol's efforts to implement its business strategy, (ii) changes in interest rates, (iii) legislation or regulatory requirements adversely impacting Capitol's banking business and/or growth strategy, (iv) adverse changes in business conditions or inflation, (v) general economic conditions, either nationally or regionally, which are less favorable than expected and that result in, among other things, a deterioration in credit quality and/or loan performance and collectability, (vi) competitive pressures among financial institutions, (vii) changes in securities markets, (viii) actions of competitors of Capitol's banks and Capitol's ability to respond to such actions, (ix) the cost of and access to capital, which may depend in part on Capitol's asset quality, prospects and outlook, (x) changes in governmental regulation, tax rates and similar matters, (xi) availability of funds under the U.S. Treasury's Capital Purchase Program, (xii) changes in management and (xiii) other risks detailed in Capitol's other filings with the Securities and Exchange Commission. If one or more of these risks or uncertainties materialize, or if underlying assumptions prove incorrect, actual outcomes may vary materially from those indicated. The preparation of consolidated financial statements in conformity with generally accepted accounting principles in the United States of America requires management to make certain estimates and assumptions, many of which are based on assumptions relating to the above-stated forward-looking statements, that affect the reported amounts of assets and liabilities at the date of the consolidated financial statements and the reported amounts of revenues and expenses during the reporting period. Actual results will differ from those estimates because of the inherent subjectivity and inaccuracy of any estimation. All subsequent written or oral forward-looking statements attributable to Capitol or persons acting on its behalf are expressly qualified in their entirety by the foregoing factors. Investors and other interested parties are cautioned not to place undue reliance on such statements, which speak as of the date of such statements. Capitol undertakes no obligation to release publicly any revisions to these forward-looking statements to reflect events or circumstances after the date of such statements or to reflect the occurrence of unanticipated events.
This section of the Annual Report is intended to discuss, from management's perspective, matters of importance regarding Capitol's operations, financial position and other things which have a significant effect on Capitol, its business and its banks. This narrative includes some comments about future events and other forward-looking statements and readers are advised to carefully read the cautionary statement about forward-looking statements which is on page F-6 of this Annual Report.
Capitol is unique in the banking industry. Capitol operates community banks in a wide variety of markets during an era of industry consolidation. Capitol operates in one business segment, community banking. Capitol's banks are staffed with banking professionals, serving customers who desire professional banking services delivered personally.
No other bank holding company in the U.S. is believed to hold as many bank 'charters' (i.e., individually capitalized, licensed and managed, community banks) as distinct operating subsidiaries. Capitol had 64 banks operating in 17 states as of December 31, 2008.
In recent years, Capitol has expanded significantly through the addition of de novo banks. In 2007, 11 new banks were added and, in 2006, 9 new banks were formed. Capitol previously announced plans to expand to 100 banks. Four de novo banks were formed in the first half of 2008. Plans for formation of additional de novo banks were terminated mid-year 2008, eliminating the need for start-up capital.
Capitol's community bank model, in a stable economic environment, is intended to maintain a scalable, low overhead structure which is focused on delivering return-on-equity results, while empowering its individual banks with operating autonomy in all areas which impact the customer relationship. Capitol's centralized 'back-office' functions, which support the banks, are capable of expanding coverage in concert with growth in both the number and size of affiliate banks.
2008 was a challenging year due to significantly elevated levels of loan losses caused by economic stress on borrowers and depressed real estate collateral values primarily at Capitol's Michigan banks, resulting in a net loss of $28.6 million ($1.67 per share) compared to net income of $21.9 million ($1.27 per diluted share) in 2007.
Each bank begins as a single-location office, led by a bank president and a team of banking professionals with significant local experience, overseen by an independent board of directors composed of business leaders drawn from that local community. Each bank has complete on-site authority to make all decisions which directly affect the customer, such as credit approval and the pricing and structure of both loans and deposits. The philosophy of banking as a
profession is key to Capitol's model where its banks' customers seek a relationship with banking professionals to meet their needs as opposed to transaction-oriented financial institutions pushing financial products at customers and emphasizing market share.
With Capitol's focused banking model, bank development on a national scale has been a natural extension of this business philosophy. As mentioned previously, new bank development plans were terminated in mid-2008, after significant additions of de novo banks in 2007 (eleven) and 2006 (nine); four de novo banks were added in the first half of 2008. Capitol's bank development approach has been based on just a few key ingredients necessary to operate a successful bank:
· | A bank president with a significant background in the future bank's business community, capable of attracting customer relationships and other banking professionals |
· | An office address from which to operate, optimally located in that business community |
· | A strong group of board members, drawn from the local business community, to oversee the bank's activities and assist in business development |
· | In a start-up bank, the availability of capital from community investors seeking to invest up to 49% in the future bank's equity |
Notably, 'market size' is not a big factor in Capitol's approach to bank-development. Rather, the key is people. Capitol has recognized from its beginning that its banking focus always has been, and always will be, a people business. Capitol's banks are small in market stature, emphasizing personalized banking relationships.
Young banks, just like most start-up businesses, are not profitable from the outset. Each bank is started with sufficient capital to absorb early period losses and to support balance-sheet growth. During these early periods of operation, Capitol's management works closely with the de novo bank's president in providing guidance and assistance to help achieve the bank's goals and objectives as it navigates toward future profitability. When a de novo bank achieves certain developmental milestones (age, cumulative profitability, return on equity or other measures), Capitol may offer the bank's community investors (which invested up to 49% of the bank's start-up capital) an opportunity to exchange their bank investment for shares of Capitol's common stock. The exchange offer (which is not a contractual obligation of Capitol) is generally subject to approval by the bank's shareholders. When an exchange offer is made, the bank is often 'turning the corner' on cumulative profitability and the share-exchange enables the bank's shareholders to achieve both a return on their original investment in the bank and liquidity in the form of marketable shares of Capitol's common stock, if the shareholders elect to enter into the share-exchange transaction.
Capitol monitors and manages its investments in community banks working through regional presidents, supported by Capitol's bank financial analysis group. Capitol's regional presidents and bank financial analysis group assist the banks in the development of detailed budgets, implement asset/liability management strategies, monitor progress on the banks' business plans and review monthly operating results for each bank. In addition to monitoring operating results, Capitol assists the banks in managing capital, including funding supplemental capital when needed to support bank growth.
Capitol's unique relationship with its banks is multidimensional, as an investor, mentor and service provider. As investor, Capitol closely monitors the financial performance of its bank subsidiaries. Capitol's mentoring role of providing assistance and guidance when and where necessary to help enhance bank performance is most important for its youngest affiliates where guidance is needed during their early formative stages. Capitol provides efficient back-office support services which can be performed centrally for all of its banks and which do not involve a direct interface with the bank customer, such as:
· | Accounting |
· | Capital management |
· | Credit administration |
· | Data processing |
· | Human resources administration |
· | Internal audit |
· | Legal support |
· | Risk management |
Some of these functions are performed nationally from a single location, while others are performed regionally, where it is more efficient to have personnel located geographically based on their respective responsibilities in relation to the physical location of the banks.
[The remainder of this page intentionally left blank]
Total assets and revenues of each bank within Capitol's regions are summarized below as of and for the years ended December 31, 2008 and 2007 (in $1,000s):
| | | Total Assets | | | Total Revenues(4) |
| | | 2008 | | | 2007 | | | 2008 | | | 2007 |
| Arizona Region: | | | | | | | | | | | |
| Arrowhead Community Bank | | $ | 80,606 | | | $ | 89,060 | | | $ | 5,919 | | | $ | 8,161 |
| Asian Bank of Arizona | | | 38,127 | | | | 25,017 | | | | 1,990 | | | | 1,760 |
| Bank of Tucson | | | 189,869 | | | | 187,468 | | | | 13,383 | | | | 16,000 |
| Camelback Community Bank | | | 93,754 | | | | 84,671 | | | | 6,001 | | | | 6,780 |
Central Arizona Bank(1) | | | 79,775 | | | | 77,306 | | | | 4,641 | | | | 5,544 |
Colonia Bank(2) | | | 12,522 | | | | | | | | 149 | | | | |
| Mesa Bank | | | 248,262 | | | | 217,861 | | | | 13,953 | | | | 19,685 |
| Southern Arizona Community Bank | | | 88,146 | | | | 85,158 | | | | 5,907 | | | | 6,872 |
| Sunrise Bank of Albuquerque | | | 81,977 | | | | 71,726 | | | | 5,203 | | | | 6,168 |
| Sunrise Bank of Arizona | | | 119,395 | | | | 116,245 | | | | 8,069 | | | | 9,336 |
| Yuma Community Bank | | | 73,028 | | | | 78,489 | | | | 5,273 | | | | 6,078 |
| Arizona Region Total | | | 1,105,461 | | | | 1,033,001 | | | | 70,488 | | | | 86,384 |
| | | | | | | | | | | | | | | | |
| California Region: | | | | | | | | | | | | | | | |
| Bank of Escondido | | | 96,803 | | | | 89,557 | | | | 5,036 | | | | 5,914 |
Bank of Feather River(3) | | | 29,218 | | | | 17,283 | | | | 1,350 | | | | 171 |
| Bank of San Francisco | | | 74,670 | | | | 68,902 | | | | 3,748 | | | | 3,250 |
| Bank of Santa Barbara | | | 72,076 | | | | 58,738 | | | | 4,056 | | | | 4,282 |
| Napa Community Bank | | | 149,093 | | | | 131,457 | | | | 8,732 | | | | 9,483 |
| Point Loma Community Bank | | | 61,514 | | | | 56,428 | | | | 3,804 | | | | 4,161 |
| Sunrise Bank of San Diego | | | 86,322 | | | | 81,905 | | | | 5,415 | | | | 7,092 |
Sunrise Community Bank(3) | | | 36,139 | | | | 21,113 | | | | 1,620 | | | | 1,099 |
| California Region Total | | | 605,835 | | | | 525,383 | | | | 33,761 | | | | 35,452 |
| | | | | | | | | | | | | | | | |
| Colorado Region: | | | | | | | | | | | | | | | |
| Fort Collins Commerce Bank | | | 80,247 | | | | 61,083 | | | | 4,628 | | | | 4,696 |
Larimer Bank of Commerce(3) | | | 88,725 | | | | 51,906 | | | | 4,567 | | | | 2,199 |
Loveland Bank of Commerce(3) | | | 32,034 | | | | 15,941 | | | | 1,434 | | | | 234 |
Mountain View Bank of Commerce(2) | | | 37,740 | | | | | | | | 1,192 | | | | |
| Colorado Region Total | | | 238,746 | | | | 128,930 | | | | 11,821 | | | | 7,129 |
| | | | | | | | | | | | | | | | |
| Great Lakes Region: | | | | | | | | | | | | | | | |
| Ann Arbor Commerce Bank | | | 361,953 | | | | 362,429 | | | | 23,210 | | | | 25,800 |
| Bank of Auburn Hills | | | 43,856 | | | | 44,767 | | | | 2,766 | | | | 3,298 |
| Bank of Maumee | | | 56,812 | | | | 35,576 | | | | 2,829 | | | | 1,552 |
| Bank of Michigan | | | 78,716 | | | | 69,909 | | | | 4,902 | | | | 4,945 |
| Brighton Commerce Bank | | | 114,423 | | | | 108,664 | | | | 7,305 | | | | 8,308 |
| Capitol National Bank | | | 245,354 | | | | 228,556 | | | | 14,649 | | | | 17,794 |
| Detroit Commerce Bank | | | 101,001 | | | | 113,243 | | | | 7,040 | | | | 9,083 |
| Elkhart Community Bank | | | 99,917 | | | | 89,064 | | | | 5,684 | | | | 6,876 |
| Evansville Commerce Bank | | | 63,228 | | | | 50,819 | | | | 4,014 | | | | 2,789 |
| Goshen Community Bank | | | 87,419 | | | | 93,173 | | | | 5,140 | | | | 6,128 |
| Grand Haven Bank | | | 120,903 | | | | 130,492 | | | | 7,000 | | | | 9,575 |
| Kent Commerce Bank | | | 80,197 | | | | 87,060 | | | | 5,408 | | | | 6,545 |
| Macomb Community Bank | | | 92,232 | | | | 93,045 | | | | 4,946 | | | | 6,666 |
| Muskegon Commerce Bank | | | 91,649 | | | | 98,975 | | | | 5,551 | | | | 7,117 |
| Oakland Commerce Bank | | | 91,847 | | | | 109,370 | | | | 5,773 | | | | 9,288 |
| Ohio Commerce Bank | | | 60,678 | | | | 35,690 | | | | 2,672 | | | | 1,533 |
| Paragon Bank & Trust | | | 107,491 | | | | 103,711 | | | | 7,024 | | | | 7,034 |
| Portage Commerce Bank | | | 217,657 | | | | 189,944 | | | | 14,364 | | | | 15,479 |
| Great Lakes Region Total | | | 2,115,333 | | | | 2,044,487 | | | | 130,277 | | | | 149,810 |
| | | | | | | | | | | | | | | | |
| Midwest Region: | | | | | | | | | | | | | | | |
Adams Dairy Bank(2) | | | 33,867 | | | | | | | | 1,621 | | | | |
| Bank of Belleville | | | 73,901 | | | | 50,485 | | | | 3,640 | | | | 2,389 |
Community Bank of Lincoln(3) | | | 53,222 | | | | 12,960 | | | | 2,117 | | | | 65 |
| Summit Bank of Kansas City | | | 53,429 | | | | 50,142 | | | | 3,074 | | | | 3,452 |
| Midwest Region Total | | | 214,419 | | | | 113,587 | | | | 10,452 | | | | 5,906 |
Summary of total assets and revenues – continued:
| | | Total Assets | | | Total Revenues(4) |
| | | 2008 | | | 2007 | | | 2008 | | | 2007 |
| Nevada Region: | | | | | | | | | | | |
1st Commerce Bank | | $ | 52,622 | | | $ | 32,091 | | | $ | 2,353 | | | $ | 1,762 |
| Bank of Las Vegas | | | 73,692 | | | | 72,768 | | | | 4,853 | | | | 5,966 |
| Black Mountain Community Bank | | | 157,545 | | | | 147,433 | | | | 10,739 | | | | 12,282 |
| Desert Community Bank | | | 100,312 | | | | 101,840 | | | | 7,240 | | | | 8,216 |
| Red Rock Community Bank | | | 126,993 | | | | 120,750 | | | | 7,709 | | | | 9,319 |
| Nevada Region Total | | | 511,164 | | | | 474,882 | | | | 32,894 | | | | 37,545 |
| | | | | | | | | | | | | | | | |
| Northeast Region: | | | | | | | | | | | | | | | |
USNY Bank(3) | | | 49,620 | | | | 17,171 | | | | 1,845 | | | | 438 |
| | | | | | | | | | | | | | | | |
| Northwest Region: | | | | | | | | | | | | | | | |
| Bank of Bellevue | | | 55,841 | | | | 45,122 | | | | 2,909 | | | | 3,152 |
| Bank of Everett | | | 44,756 | | | | 28,946 | | | | 2,144 | | | | 1,907 |
Bank of Tacoma(3) | | | 44,241 | | | | 24,325 | | | | 2,060 | | | | 1,304 |
High Desert Bank(3) | | | 41,904 | | | | 11,501 | | | | 1,497 | | | | 221 |
Issaquah Community Bank(3) | | | 36,942 | | | | 13,696 | | | | 1,296 | | | | 330 |
| Northwest Region Total | | | 223,684 | | | | 123,590 | | | | 9,906 | | | | 6,914 |
| | | | | | | | | | | | | | | | |
| Southeast Region: | | | | | | | | | | | | | | | |
| Bank of Valdosta | | | 58,995 | | | | 43,842 | | | | 3,156 | | | | 2,574 |
| Community Bank of Rowan | | | 138,341 | | | | 117,495 | | | | 7,311 | | | | 6,195 |
| First Carolina State Bank | | | 119,774 | | | | 115,243 | | | | 6,076 | | | | 7,556 |
| Peoples State Bank | | | 29,233 | | | | 26,159 | | | | 1,705 | | | | 2,226 |
Pisgah Community Bank(2) | | | 36,897 | | | | | | | | 691 | | | | |
| Sunrise Bank of Atlanta | | | 62,198 | | | | 48,664 | | | | 4,434 | | | | 3,922 |
| Southeast Region Total | | | 445,438 | | | | 351,403 | | | | 23,373 | | | | 22,473 |
| | | | | | | | | | | | | | | | |
| Texas Region: | | | | | | | | | | | | | | | |
Bank of Ford Bend(3) | | | 26,424 | | | | 9,551 | | | | 922 | | | | 27 |
Bank of Las Colinas(3) | | | 31,354 | | | | 11,383 | | | | 1,288 | | | | 37 |
| Texas Region Total | | | 57,778 | | | | 20,934 | | | | 2,210 | | | | 64 |
| | | | | | | | | | | | | | | | |
Other, net(5) | | | 87,358 | | | | 68,395 | | | | 3,720 | | | | 2,705 |
| | | | | | | | | | | | | | | | |
| Consolidated Totals | | $ | 5,654,836 | | | $ | 4,901,763 | | | $ | 330,747 | | | $ | 354,820 |
| (1) | Formerly Valley First Community Bank, which was renamed in 2008 upon adding a second location in Casa Grande, Arizona. |
| (2) | Became a Capitol affiliate in 2008 and is included for periods after addition to the Capitol banking network. |
| (3) | Became a Capitol affiliate in 2007 and is included for periods after addition to the Capitol banking network. |
| (4) | Total revenues is the sum of interest income and noninterest income. |
| (5) | Includes corporate and other nonbank entities. |
[The remainder of this page intentionally left blank]
For 2008, Capitol incurred a net loss of approximately $28.6 million ($1.67 per share) compared to net income of $21.9 million ($1.27 per diluted share) in 2007. Net income in 2006 approximated $42.4 million ($2.57 per diluted share).
The table below summarizes, for Capitol's banks individually and regionally, net income (loss) (in $1,000s) and the related rates of return on average equity and assets, where applicable:
| | | Net Income (Loss) | | | Return on Average Equity | | | Return on Average Assets | |
| | | 2008 | | | 2007 | | | 2006 | | | 2008 | | | 2007 | | | 2006 | | | 2008 | | | 2007 | | | 2006 | |
| Arizona Region: | | | | | | | | | | | | | | | | | | | | | | | | | | | |
| Arrowhead Community Bank | | $ | (2,428 | ) | | $ | 762 | | | $ | 1,293 | | | | | | | 9.24 | % | | | 15.68 | % | | | | | | 0.89 | % | | | 1.49 | % |
Asian Bank of Arizona(4) | | | (956 | ) | | | (507 | ) | | | (567 | ) | | | | | | | | | | | | | | | | | | | | | | |
| Bank of Tucson | | | 3,717 | | | | 4,527 | | | | 4,656 | | | | 20.56 | % | | | 26.48 | % | | | 29.93 | % | | | 2.04 | % | | | 2.52 | % | | | 2.62 | % |
| Camelback Community Bank | | | 965 | | | | 992 | | | | 1,119 | | | | 10.39 | % | | | 11.14 | % | | | 13.64 | % | | | 1.05 | % | | | 1.13 | % | | | 1.36 | % |
Central Arizona Bank(1) | | | (1,004 | ) | | | 327 | | | | 716 | | | | | | | | 4.10 | % | | | 9.67 | % | | | | | | | 0.46 | % | | | 0.97 | % |
Colonia Bank(2) | | | (770 | ) | | | | | | | | | | | | | | | | | | | | | | | | | | | | | | | | |
| Mesa Bank | | | (9,881 | ) | | | 3,983 | | | | 4,509 | | | | | | | | 21.46 | % | | | 25.51 | % | | | | | | | 1.89 | % | | | 2.32 | % |
| Southern Arizona Community Bank | | | 639 | | | | 1,082 | | | | 1,189 | | | | 7.06 | % | | | 12.04 | % | | | 13.51 | % | | | 0.72 | % | | | 1.22 | % | | | 1.39 | % |
| Sunrise Bank of Albuquerque | | | 224 | | | | 601 | | | | 494 | | | | 3.05 | % | | | 8.95 | % | | | 7.50 | % | | | 0.29 | % | | | 0.86 | % | | | 0.86 | % |
| Sunrise Bank of Arizona | | | (435 | ) | | | 409 | | | | 1,372 | | | | | | | | 3.51 | % | | | 10.82 | % | | | | | | | 0.35 | % | | | 1.17 | % |
| Yuma Community Bank | | | 565 | | | | 936 | | | | 1,199 | | | | 7.23 | % | | | 12.09 | % | | | 16.95 | % | | | 0.75 | % | | | 1.28 | % | | | 1.70 | % |
| Arizona Region Total | | | (9,364 | ) | | | 13,112 | | | | 15,980 | | | | | | | | | | | | | | | | | | | | | | | | | |
| | | | | | | | | | | | | | | | | | | | | | | | | | | | | | | | | | | | | |
| California Region: | | | | | | | | | | | | | | | | | | | | | | | | | | | | | | | | | | | | |
| Bank of Escondido | | | 361 | | | | 505 | | | | 787 | | | | 2.53 | % | | | 3.54 | % | | | 7.70 | % | | | 0.38 | % | | | 0.58 | % | | | 1.04 | % |
Bank of Feather River(3) | | | (487 | ) | | | (576 | ) | | | | | | | | | | | | | | | | | | | | | | | | | | | | |
| Bank of San Francisco | | | 43 | | | | (397 | ) | | | (484 | ) | | | 0.51 | % | | | | | | | | | | | 0.07 | % | | | | | | | | |
| Bank of Santa Barbara | | | (420 | ) | | | (191 | ) | | | (630 | ) | | | | | | | | | | | | | | | | | | | | | | | | |
| Napa Community Bank | | | 1,223 | | | | 1,542 | | | | 1,572 | | | | 8.39 | % | | | 11.73 | % | | | 13.65 | % | | | 0.93 | % | | | 1.29 | % | | | 1.86 | % |
| Point Loma Community Bank | | | 294 | | | | 168 | | | | 196 | | | | 4.00 | % | | | 2.37 | % | | | 2.84 | % | | | 0.50 | % | | | 0.31 | % | | | 0.48 | % |
| Sunrise Bank of San Diego | | | 300 | | | | 432 | | | | 885 | | | | 2.81 | % | | | 4.06 | % | | | 8.18 | % | | | 0.33 | % | | | 0.50 | % | | | 1.27 | % |
Sunrise Community Bank(3) | | | (646 | ) | | | (998 | ) | | | | | | | | | | | | | | | | | | | | | | | | | | | | |
| California Region Total | | | 668 | | | | 485 | | | | 2,326 | | | | | | | | | | | | | | | | | | | | | | | | | |
| | | | | | | | | | | | | | | | | | | | | | | | | | | | | | | | | | | | | |
| Colorado Region: | | | | | | | | | | | | | | | | | | | | | | | | | | | | | | | | | | | | |
| Fort Collins Commerce Bank | | | 620 | | | | 588 | | | | 170 | | | | 6.71 | % | | | 6.81 | % | | | 2.10 | % | | | 0.89 | % | | | 1.07 | % | | | 0.42 | % |
Larimer Bank of Commerce(3) | | | 465 | | | | (586 | ) | | | | | | | 6.09 | % | | | | | | | | | | | 0.66 | % | | | | | | | | |
Loveland Bank of Commerce(3) | | | (458 | ) | | | (426 | ) | | | | | | | | | | | | | | | | | | | | | | | | | | | | |
Mountain View Bank of Commerce(2) | | | (819 | ) | | | | | | | | | | | | | | | | | | | | | | | | | | | | | | | | |
| Colorado Region Total | | | (192 | ) | | | (424 | ) | | | 170 | | | | | | | | | | | | | | | | | | | | | | | | | |
| | | | | | | | | | | | | | | | | | | | | | | | | | | | | | | | | | | | | |
| Great Lakes Region: | | | | | | | | | | | | | | | | | | | | | | | | | | | | | | | | | | | | |
| Ann Arbor Commerce Bank | | | 2,588 | | | | 3,635 | | | | 3,739 | | | | 9.00 | % | | | 13.56 | % | | | 14.19 | % | | | 0.72 | % | | | 1.08 | % | | | 1.21 | % |
| Bank of Auburn Hills | | | (957 | ) | | | (335 | ) | | | (332 | ) | | | | | | | | | | | | | | | | | | | | | | | | |
Bank of Maumee(4) | | | (774 | ) | | | (1,063 | ) | | | (619 | ) | | | | | | | | | | | | | | | | | | | | | | | | |
| Bank of Michigan | | | 543 | | | | (136 | ) | | | (343 | ) | | | 7.95 | % | | | | | | | | | | | 0.76 | % | | | | | | | | |
| Brighton Commerce Bank | | | 370 | | | | 621 | | | | 845 | | | | 3.77 | % | | | 6.63 | % | | | 8.93 | % | | | 0.33 | % | | | 0.58 | % | | | 0.80 | % |
| Capitol National Bank | | | (766 | ) | | | 1,977 | | | | 2,879 | | | | | | | | 10.45 | % | | | 14.97 | % | | | | | | | 0.84 | % | | | 1.20 | % |
| Detroit Commerce Bank | | | (1,647 | ) | | | 241 | | | | 942 | | | | | | | | 2.57 | % | | | 11.23 | % | | | | | | | 0.22 | % | | | 0.99 | % |
| Elkhart Community Bank | | | 39 | | | | 766 | | | | 948 | | | | 0.45 | % | | | 8.67 | % | | | 11.18 | % | | | 0.04 | % | | | 0.90 | % | | | 1.16 | % |
Evansville Commerce Bank(4) | | | (248 | ) | | | (689 | ) | | | (851 | ) | | | | | | | | | | | | | | | | | | | | | | | | |
| Goshen Community Bank | | | 178 | | | | 431 | | | | 383 | | | | 2.23 | % | | | 5.72 | % | | | 5.58 | % | | | 0.22 | % | | | 0.54 | % | | | 0.55 | % |
| Grand Haven Bank | | | (2,756 | ) | | | 483 | | | | 1,284 | | | | | | | | 4.43 | % | | | 11.75 | % | | | | | | | 0.37 | % | | | 1.01 | % |
| Kent Commerce Bank | | | (1,686 | ) | | | (161 | ) | | | 365 | | | | | | | | | | | | 4.72 | % | | | | | | | | | | | 0.44 | % |
| Macomb Community Bank | | | (4,842 | ) | | | (1,118 | ) | | | 58 | | | | | | | | | | | | 0.66 | % | | | | | | | | | | | 0.06 | % |
| Muskegon Commerce Bank | | | (2,661 | ) | | | (1,145 | ) | | | 158 | | | | | | | | | | | | 1.87 | % | | | | | | | | | | | 0.16 | % |
| Oakland Commerce Bank | | | (4,690 | ) | | | (461 | ) | | | 1,143 | | | | | | | | | | | | 11.50 | % | | | | | | | | | | | 0.94 | % |
Ohio Commerce Bank(4) | | | (149 | ) | | | (770 | ) | | | (383 | ) | | | | | | | | | | | | | | | | | | | | | | | | |
| Paragon Bank & Trust | | | (1,501 | ) | | | (187 | ) | | | 858 | | | | | | | | | | | | 7.71 | % | | | | | | | | | | | 0.85 | % |
| Portage Commerce Bank | | | 2,366 | | | | 2,252 | | | | 2,706 | | | | 13.41 | % | | | 13.82 | % | | | 16.72 | % | | | 1.13 | % | | | 1.21 | % | | | 1.51 | % |
| Great Lakes Region Total | | | (16,593 | ) | | | 4,341 | | | | 13,780 | | | | | | | | | | | | | | | | | | | | | | | | | |
Net income (loss) and the related rates of return on average equity and assets – continued:
| | | Net Income (Loss) | | | Return on Average Equity | | | Return on Average Assets | |
| | | 2008 | | | 2007 | | | 2006 | | | 2008 | | | 2007 | | | 2006 | | | 2008 | | | 2007 | | | 2006 | |
| Midwest Region | | | | | | | | | | | | | | | | | | | | | | | | | | | |
Adams Dairy Bank(2) | | $ | (669 | ) | | | | | | | | | | | | | | | | | | | | | | | | |
| Bank of Belleville | | | 35 | | | $ | (572 | ) | | $ | (548 | ) | | | 0.49 | % | | | | | | | | | 0.06 | % | | | | | | |
Community Bank of Lincoln(3) | | | (643 | ) | | | (500 | ) | | | | | | | | | | | | | | | | | | | | | | | | |
| Summit Bank of Kansas City | | | (97 | ) | | | (404 | ) | | | (593 | ) | | | | | | | | | | | | | | | | | | | | |
| Midwest Region Total | | | (1,374 | ) | | | (1,476 | ) | | | (1,141 | ) | | | | | | | | | | | | | | | | | | | | |
| | | | | | | | | | | | | | | | | | | | | | | | | | | | | | | | | |
| Nevada Region: | | | | | | | | | | | | | | | | | | | | | | | | | | | | | | | | |
1st Commerce Bank(4) | | | (1,158 | ) | | | (578 | ) | | | (432 | ) | | | | | | | | | | | | | | | | | | | | |
| Bank of Las Vegas | | | 44 | | | | 608 | | | | 707 | | | | 0.51 | % | | | 6.77 | % | | | 7.24 | % | | | 0.06 | % | | | 0.83 | % | | | 1.09 | % |
| Black Mountain Community Bank | | | 2,001 | | | | 2,612 | | | | 2,556 | | | | 13.40 | % | | | 18.40 | % | | | 20.40 | % | | | 1.30 | % | | | 1.81 | % | | | 1.96 | % |
| Desert Community Bank | | | 596 | | | | 1,296 | | | | 1,302 | | | | 5.87 | % | | | 13.54 | % | | | 15.29 | % | | | 0.58 | % | | | 1.35 | % | | | 1.51 | % |
| Red Rock Community Bank | | | 660 | | | | 1,652 | | | | 2,162 | | | | 4.83 | % | | | 12.34 | % | | | 17.38 | % | | | 0.54 | % | | | 1.44 | % | | | 2.09 | % |
| Nevada Region Total | | | 2,143 | | | | 5,590 | | | | 6,295 | | | | | | | | | | | | | | | | | | | | | | | | | |
| | | | | | | | | | | | | | | | | | | | | | | | | | | | | | | | | | | | | |
| Northeast Region: | | | | | | | | | | | | | | | | | | | | | | | | | | | | | | | | | | | | |
USNY Bank(3) | | | (748 | ) | | | (908 | ) | | | | | | | | | | | | | | | | | | | | | | | | | | | | |
| | | | | | | | | | | | | | | | | | | | | | | | | | | | | | | | | | | | | |
| Northwest Region: | | | | | | | | | | | | | | | | | | | | | | | | | | | | | | | | | | | | |
| Bank of Bellevue | | | (146 | ) | | | (154 | ) | | | (384 | ) | | | | | | | | | | | | | | | | | | | | | | | | |
Bank of Everett(4) | | | (956 | ) | | | (636 | ) | | | (733 | ) | | | | | | | | | | | | | | | | | | | | | | | | |
Bank of Tacoma(3) | | | (824 | ) | | | (1,067 | ) | | | | | | | | | | | | | | | | | | | | | | | | | | | | |
High Desert Bank(3) | | | (801 | ) | | | (514 | ) | | | | | | | | | | | | | | | | | | | | | | | | | | | | |
Issaquah Community Bank(3) | | | (627 | ) | | | (574 | ) | | | | | | | | | | | | | | | | | | | | | | | | | | | | |
| Northwest Region Total | | | (3,354 | ) | | | (2,945 | ) | | | (1,117 | ) | | | | | | | | | | | | | | | | | | | | | | | | |
| | | | | | | | | | | | | | | | | | | | | | | | | | | | | | | | | | | | | |
| Southeast Region: | | | | | | | | | | | | | | | | | | | | | | | | | | | | | | | | | | | | |
Bank of Valdosta(4) | | | (139 | ) | | | (423 | ) | | | (822 | ) | | | | | | | | | | | | | | | | | | | | | | | | |
Community Bank of Rowan(4) | | | 945 | | | | (183 | ) | | | (1,095 | ) | | | 9.39 | % | | | | | | | | | | | 0.76 | % | | | | | | | | |
| First Carolina State Bank | | | (403 | ) | | | 539 | | | | 637 | | | | | | | | 4.52 | % | | | 5.59 | % | | | | | | | 0.53 | % | | | 0.75 | % |
| Peoples State Bank | | | (72 | ) | | | 254 | | | | 282 | | | | | | | | 5.14 | % | | | 6.57 | % | | | | | | | 0.93 | % | | | 0.55 | % |
Pisgah Community Bank(2) | | | (920 | ) | | | | | | | | | | | | | | | | | | | | | | | | | | | | | | | | |
Sunrise Bank of Atlanta(4) | | | (554 | ) | | | (338 | ) | | | (820 | ) | | | | | | | | | | | | | | | | | | | | | | | | |
| Southeast Region Total | | | (1,143 | ) | | | (151 | ) | | | (1,818 | ) | | | | | | | | | | | | | | | | | | | | | | | | |
| | | | | | | | | | | | | | | | | | | | | | | | | | | | | | | | | | | | | |
| Texas Region: | | | | | | | | | | | | | | | | | | | | | | | | | | | | | | | | | | | | |
Bank of Fort Bend(3) | | | (829 | ) | | | (461 | ) | | | | | | | | | | | | | | | | | | | | | | | | | | | | |
Bank of Las Colinas(3) | | | (623 | ) | | | (658 | ) | | | | | | | | | | | | | | | | | | | | | | | | | | | | |
| Texas Region Total | | | (1,452 | ) | | | (1,119 | ) | | | | | | | | | | | | | | | | | | | | | | | | | | | | |
| | | | | | | | | | | | | | | | | | | | | | | | | | | | | | | | | | | | | |
Other, net(5) | | | 2,802 | | | | 5,432 | | | | 7,916 | | | | | | | | | | | | | | | | | | | | | | | | | |
| | | | | | | | | | | | | | | | | | | | | | | | | | | | | | | | | | | | | |
| Consolidated totals | | $ | (28,607 | ) | | $ | 21,937 | | | $ | 42,391 | | | | | | | | 5.72 | % | | | 12.94 | % | | | | | | | 0.49 | % | | | 1.12 | % |
| (1) | Formerly Valley First Community Bank, which was renamed in 2008 upon adding a second location in Casa Grande, Arizona. |
| (2 | Became a Capitol affiliate in 2008 and is included for periods after addition to the Capitol banking network. |
| (3) | Became a Capitol affiliate in 2007 and is included for periods after addition to the Capitol banking network. |
| (4) | Became a Capitol affiliate in 2006 and is included for periods after addition to the Capitol banking network. |
| (5) | Includes corporate, nonbank units and credit for minority interests in losses of consolidated subsidiaries. |
The preceding table presents net income (or loss) of each bank without regard to Capitol's direct or indirect ownership percentage. Young de novo banks are expected to incur operating losses in their early periods of operations and, due to Capitol's ownership percentage, individual start-up losses at banks typically do not have a material effect on consolidated earnings.
Earnings or losses at wholly-owned banks have a more significant and direct impact on consolidated earnings. The preceding table indicates significant losses incurred at banks within the Great Lakes Region. Dominating the Great Lakes Region are Capitol's eleven mature,
wholly-owned banks located in Michigan. Operating results of this group of banks amounted to a net loss of $15.2 million in 2008, compared to net income of $6.1 million in 2007 and $15 million in 2006. The unprecedented 2008 operating losses of this group of banks were attributable to loan losses stemming from a sustained difficult economy, significant increases in nonearning assets, related depressed real estate valuation, a weak or nonexistent real estate sales environment and elevated collection costs. These, coupled with loan losses incurred at Mesa Bank in Arizona, are the largest items adversely impacting Capitol's 2008 consolidated operating results, followed by compression in margins and related net interest income.
The principal revenue source for Capitol's banks is interest income from loans. Net interest income is the total of all interest income minus all interest expense. This is an important measure that is used to help determine the amount of net operating revenues for financial institutions. Net operating revenue is the sum of net interest income and noninterest income.
Net interest income totaled $163.8 million in 2008, an 11% decrease from the $183.3 million reported in 2007, compared to a 5% increase in 2007 versus an 11% increase in 2006. The 2008 decrease in net interest income is due to growth in nonperforming loans and a challenging interest rate environment which reduced the spread between interest earned on loans and rates paid on deposits. The modest 2007 increase in net interest income was due to balance-sheet growth offset by compression in margins resulting from lower rates earned on loans and elevated levels of nonperforming loans, coupled with the slower repricing of rates paid on deposits.
Combined with noninterest income, total consolidated net operating revenues approximated $190.3 million in 2008, $207.7 million in 2007 and $195.3 million in 2006. Noninterest income for these periods was $26.4 million, $24.4 million and $21.5 million, respectively. Noninterest income increased 8% in 2008.
Service charges, which approximated $5.9 million in 2008, increased 23% from the 2007 level of $4.8 million ($4.3 million in 2006). Revenue from trust and wealth management activities increased 20% in 2008, 54% in 2007 and 61% in 2006, following the late-2005 launch of Capitol Wealth, Inc., an initiative to expand Capitol's banks' scope of services in meeting the needs of their clients beyond loans and deposits. Full-time Capitol Wealth advisors are located at many of Capitol's banks to work in tandem with their traditional banking colleagues to expand the availability of financial services to the banks' clientele, while increasing noninterest revenues. Capitol Wealth has not yet achieved profitability and its revenues decreased in the fourth quarter of 2008 due to market volatility and client activity.
In 2008, 2007 and 2006, revenue from mortgage loans originated for sale amounted to $3.6 million, $4.5 million and $5.4 million, respectively. Loan origination volume decreased in 2008 and 2006 and increased slightly in 2007. Instability of residential real estate market conditions have negatively impacted residential mortgage origination volume. Other noninterest income increased 26% in 2008 and 21% in 2007. Due to the nature of these revenues, as well as gains on the sale of government-guaranteed loans, the amount of the revenue can vary significantly from year to year depending on interest rates and business opportunities.
The provision for loan losses approximated $82.5 million, $25.3 million and $12.2 million in 2008, 2007 and 2006, respectively. The dramatic increase in the provision for loan losses in 2008 is primarily associated with loan losses incurred in the Great Lakes Region's mature, wholly-owned Michigan banks and Arizona-based Mesa Bank and related elevated levels of nonperforming loans. The amount of the provision for loan losses is determined based on management's analysis of amounts necessary for the allowance for loan losses; this is discussed in greater detail later in Capitol's Financial Position section of this narrative.
Noninterest expense totaled $190.4 million, $176.2 million and $137.8 million in 2008, 2007 and 2006, respectively. In total, these expenses increased 8.1% in 2008, 27.8% in 2007 and 17.5% in 2006. Increases in the components of noninterest expense in 2008 were primarily associated with added staffing and other costs associated with growing young banks and adding new banks (four in 2008, eleven in 2007 and nine in 2006).
Costs associated with foreclosed properties and other real estate owned increased significantly in 2008 to $6.9 million from $1 million in 2007 and $417,000 in 2006; such increase corresponded with the increased number of foreclosed properties and other real estate owned during 2008.
FDIC insurance premiums and other regulatory fees increased 49% in 2008 after increasing dramatically in 2007 from a relatively nominal level in 2006. FDIC insurance premiums are expected to increase significantly in the future as the FDIC seeks to bolster its insurance fund after incurring numerous losses due to bank failures and higher levels of deposit insurance.
Preopening and start-up costs of de novo banks decreased in 2008 in concert with the reduced number of banks opened during the year and Capitol's mid-2008 termination of new bank development activity.
The more significant elements of other noninterest expense consisted of the following (in $1,000s):
| | | 2008 | | | 2007 | | | 2006 |
| | | | | | | | | |
| Advertising | | $ | 3,261 | | | $ | 3,315 | | | $ | 2,921 |
| Professional fees | | | 3,037 | | | | 2,468 | | | | 2,547 |
| Travel, lodging and meals | | | 2,998 | | | | 3,080 | | | | 2,322 |
| Directors' fees | | | 2,828 | | | | 2,819 | | | | 2,196 |
| Paper, printing and supplies | | | 2,825 | | | | 2,870 | | | | 2,409 |
Bank services (ATMs, telephone banking and Internet banking) | | | 2,622 | | | | 2,115 | | | | 1,564 |
| Communications | | | 2,197 | | | | 1,728 | | | | 1,380 |
| Loan and collection expense | | | 1,990 | | | | 1,952 | | | | 1,116 |
| Postage | | | 1,323 | | | | 1,113 | | | | 1,009 |
| Dues and memberships | | | 974 | | | | 928 | | | | 810 |
| Courier service | | | 902 | | | | 997 | | | | 872 |
| Taxes other than income taxes | | | 825 | | | | 1,786 | | | | 1,372 |
| Insurance expense | | | 629 | | | | 473 | | | | 398 |
| Contracted labor | | | 426 | | | | 496 | | | | 549 |
| Other | | | 10,974 | | | | 8,951 | | | | 4,880 |
| Total | | $ | 37,811 | | | $ | 35,091 | | | $ | 26,345 |
Capitol's effective tax rate was 36.5% in 2008 (rate applicable to tax benefit resulting from net operating loss), 45.9% in 2007 and 34.1% in 2006. The statutory federal income tax rate applicable to Capitol is currently 35%. The effective tax rate includes state income taxes, but excludes taxes incurred in states which are based on measures other than income (which are shown in the preceding table). The higher effective tax rate in 2007 resulted primarily from lower taxable income while nondeductible items were relatively consistent with prior years.
Consolidated total assets increased in 2008 to $5.7 billion from $4.9 billion at the end of 2007 and $4.1 billion at the beginning of 2007.
Key to the balance-sheet strength of Capitol is its total capital position (subordinated debentures, minority interests in consolidated subsidiaries and stockholders' equity totaling approximately $680.4 million or 12% of total assets) and liquidity (cash and cash equivalents of $624.4 million or 11% of total assets) at December 31, 2008. Both of those key elements are discussed in the next section, Liquidity, Capital Resources and Capital Adequacy.
During 2008, a new accounting standard became effective which clarified the application of ‘fair value’ when used to account for certain assets and liabilities. While standard-setters argued the new guidance did not represent an accounting change, others felt it brought on market upheaval and turmoil. For Capitol, the new guidance did not have a material effect on its consolidated financial statements. Disclosures relating to fair value appear in the notes to the consolidated financial statements.
When considering Capitol's financial position, as shown in its consolidated balance sheet, it is clear that the single largest asset category is portfolio loans. Accordingly, the narrative in this section is devoted primarily to loans.
Net portfolio loans (total portfolio loans after subtracting the allowance for loan losses) approximated $4.6 billion at December 31, 2008 and $4.3 billion at December 31, 2007. These amounts approximated 82% of total consolidated assets at December 31, 2008 and 87% at December 31, 2007. Loan growth slowed during 2008 in response to a difficult economic environment and an effort to enhance balance-sheet liquidity. Loan growth in 2008 approximated $421 million ($826 million in 2007). On a consolidated basis, portfolio loan growth at banks less than three years of age as of year-end 2008 comprised all of the banks' portfolio loan growth.
Capitol's banks emphasize commercial loans, consistent with their focus on lending to local entrepreneurs, professional service firms and other businesses. All of Capitol's banks use a common credit policy; however, as emphasized earlier, credit decisions are made at the local level at each community bank. The utilization of an enterprise-wide credit policy has several key benefits to Capitol and its banks, such as procedural guidance for:
· | Loan underwriting and documentation |
· | Credit granting authorities within the bank |
· | Acceptable collateral and loan structuring |
· | Loan participations amongst other affiliates or other funding sources when proposals exceed an individual bank's limitations |
· | Collections and workouts |
· | Documenting and evaluating the adequacy of the allowance for loan losses |
· | Establishing corporate credit administration resources to aid the banks when needed |
As part of the banks' emphasis on commercial lending, commercial real estate is sought as the primary source of collateral for commercial loans when possible. This emphasis on use of commercial real estate as collateral has been a consistent practice of Capitol and its banks from their earliest days of operation, based on the use of appropriate loan-to-value ratios, avoidance of large real estate development projects and the belief that, even in soft economies, commercial real estate tends to have substantially less loss potential than other types of business-asset collateral, such as receivables, inventory and equipment.
Due to local and regional economic conditions, there is uncertainty in future real estate values, appraisal results and the resulting potential impact on valuation of collateral-dependent loans and real estate owned. The fair value measurement of collateral-dependent loans and other real estate owned is dependent primarily upon appraisal of the underlying property value. Fair value measurement has been recently defined in a new accounting standard, Financial Accounting Standards Board Statement No. 157, which became effective January 1, 2008 for Capitol. Management cautiously monitors real estate values and related appraisal data when evaluating such valuations.
A potentially negative aspect of real estate as a primary source of collateral for commercial loans is that when some commercial loans develop performance difficulties and reach nonperforming status (i.e., becoming 90 days past due or being placed on nonaccrual status), the resolution period can be long due to the foreclosure process and may be further extended if the real estate sales environment is weak or nonexistent as in the current severe recessionary environment. In contrast, a commercial loan secured by receivables, inventory or equipment which becomes nonperforming tends to have a higher loss potential due to the probable dissipation of collateral value.
At December 31, 2008, the consolidated allowance for loan losses approximated $93 million or 1.96% of total portfolio loans outstanding, compared with $58.1 million or 1.35% at December 31, 2007. As stated earlier, the allowance is based on management's analysis of inherent losses in the loan portfolio at the balance sheet date.
Nonperforming loans approximated $170.2 million and $72.6 million at December 31, 2008 and 2007, and approximated 3.59% and 1.68% of portfolio loans and 3.01% and 1.48% of total assets, respectively. Of the nonperforming loans at December 31, 2008, about 90% were real-estate secured. At December 31, 2008, the coverage ratio of the allowance for loan losses to nonperforming loans (i.e., the allowance as a percentage of nonperforming loans) was 55%,
compared to 80% at the beginning of the year. The coverage ratio decreased in 2008 as the growth rate of nonperforming loans exceeded the growth rate of the allowance for loan losses.
At December 31, 2008, about 53% of Capitol's total nonperforming loans were Michigan-based (including nonperforming loans held at the parent level) where nonperforming loans increased $39.3 million or 76% in 2008. In concert with sharply elevated levels of nonperforming loans at Michigan banks, their combined allowance ratio of about 2.84% and 1.58% of portfolio loans at year-end 2008 and 2007, respectively, has been maintained at a higher level than the consolidated ratio, and some banks have allowance ratios exceeding 3%. Although the majority of nonperforming loans at December 31, 2008 were Michigan-based, it should be noted that other regions (Arizona and Nevada, in specific) experienced increases in this category in 2008. Increases in other regions' nonperforming loans were expected due to softened economic conditions and the historically low levels of such loans in prior periods.
Due to a combination of commercial real estate collateral and a depressed economic climate, resolution of nonperforming loans and other nonperforming assets take extended periods of time. Levels of nonperforming loans are likely to increase further and general economic conditions may not recover in the foreseeable future. Management believes that nonperforming loans have been properly considered in its evaluation of the adequacy of the allowance for loan losses as of December 31, 2008.
In addition to the identification of nonperforming loans involving borrowers with payment performance difficulties (i.e., nonaccrual loans and loans past-due 90 days or more), management utilizes an internal loan review process to identify other potential problem loans which may warrant additional monitoring or other attention. This loan review process is a continuous activity which periodically updates internal loan classifications. At inception, all loans are individually assigned a classification which grades the credits on a risk basis, assessing the financial strength of the borrower and guarantors and other factors such as the borrowers' historical and projected financial performance, local economic conditions and other subjective factors. The loan classification process is fluid and subjective.
Potential problem loans include loans which are generally performing as agreed; however, because of loan review's and/or lending staff's risk assessment, increased monitoring is deemed appropriate. In addition, some loans are identified for monitoring because of specific performance issues or other risk factors requiring closer management attention and the development of specific remedial action plans.
At December 31, 2008, potential problem loans (which include nonperforming loans) approximated $551 million or nearly 12% of total consolidated portfolio loans. Such totals have historically approximated 4% to 5% of loans outstanding and are an important part of management's ongoing and proactive loan review activities which are designed to early-identify loans which warrant close monitoring at the bank and corporate credit-administration levels. During 2008, the amount of potential problem loans increased significantly as management downgraded many credit relationships in response to the impact of the severe recessionary environment and also as a result of growth in nonperforming loans. It is important to note that these potential problem loans do not necessarily have significant loss
exposure (nor are they necessarily deemed ‘impaired’), but rather are identified by management in this manner to aid in loan administration and risk management. These loans are considered in management's evaluation of the adequacy of the allowance for loan losses.
As noted in the Critical Accounting Policies section, which appears later in this narrative, the use of estimates in determining the allowance for loan losses is very important for an understanding of Capitol's consolidated financial statements. Simply stated, the allowance for loan losses is management's estimate of loan losses inherent in the loan portfolio at the balance-sheet date. The allowance for loan losses is increased by provisions for loan losses, which are charged against operations, and reduced by net loan write-offs which are charged against the allowance. There are many ways to estimate losses or ‘loss reserves’ and there is no one ‘right’ way. Management's experience is that its estimation techniques have accurately estimated historical losses.
Capitol had 64 separately chartered banks at year-end 2008. Each bank separately documents the adequacy of its respective allowance for loan losses. As mentioned previously, Capitol has a uniform, enterprise-wide credit policy which, among other things, provides the banks guidance on evaluating and documenting the adequacy of the allowance for loan losses. Essentially, a standardized computational template is used consistently by all of Capitol's banks. The template includes elements for all portfolio loan categories for performing loans, nonperforming loans, watch credits and environmental factors. While a standardized template is utilized, management is required to apply subjective judgment in determining risk factors specific to their banks and other matters in determining the allowance needed at the bank level. Further, the combined results of the banks' separate analyses are evaluated at the Capitol, or parent, level on a judgmental basis. The process to evaluate and determine the adequacy of the allowance for loan losses at each individual bank and on a consolidated basis is labor intensive and requires a high degree of judgment. It is possible that others, given the same information, may at any point in time reach different reasonable conclusions.
[The remainder of this page intentionally left blank]
The following table summarizes portfolio loans, the allowance for loan losses and nonperforming loans for each of the banks, regionally, and on a consolidated basis (in $1,000s):
| | | Total Portfolio Loans | | | Allowance for Loan Losses | | | Nonperforming Loans | | | Allowance as a % of Total Portfolio Loans | |
| | | 2008 | | | 2007 | | | 2008 | | | 2007 | | | 2008 | | | 2007 | | | 2008 | | | 2007 | |
| Arizona Region: | | | | | | | | | | | | | | | | | | | | | | | | |
| Arrowhead Community Bank | | $ | 69,487 | | | $ | 81,836 | | | $ | 2,375 | | | $ | 818 | | | $ | 7,430 | | | $ | 361 | | | | 3.42 | % | | | 1.00 | % |
| Asian Bank of Arizona | | | 33,023 | | | | 21,514 | | | | 694 | | | | 405 | | | | 1,898 | | | | 314 | | | | 2.10 | % | | | 1.88 | % |
| Bank of Tucson | | | 168,390 | | | | 168,427 | | | | 1,550 | | | | 1,385 | | | | 2,462 | | | | 752 | | | | 0.92 | % | | | 0.82 | % |
| Camelback Community Bank | | | 84,957 | | | | 79,869 | | | | 789 | | | | 800 | | | | 2,030 | | | | 451 | | | | 0.93 | % | | | 1.00 | % |
Central Arizona Bank(1) | | | 69,372 | | | | 71,689 | | | | 1,339 | | | | 653 | | | | 1,895 | | | | | | | | 1.93 | % | | | 0.91 | % |
Colonia Bank(2) | | | 7,483 | | | | | | | | 120 | | | | | | | | | | | | | | | | 1.60 | % | | | | |
| Mesa Bank | | | 147,853 | | | | 202,511 | | | | 3,250 | | | | 1,760 | | | | 21,423 | | | | 3,699 | | | | 2.20 | % | | | 0.87 | % |
| Southern Arizona Community Bank | | | 79,434 | | | | 78,467 | | | | 875 | | | | 792 | | | | | | | | 600 | | | | 1.10 | % | | | 1.01 | % |
| Sunrise Bank of Albuquerque | | | 74,115 | | | | 67,192 | | | | 933 | | | | 866 | | | | 43 | | | | 183 | | | | 1.26 | % | | | 1.29 | % |
| Sunrise Bank of Arizona | | | 110,131 | | | | 112,211 | | | | 1,159 | | | | 1,125 | | | | 3,707 | | | | 4,250 | | | | 1.05 | % | | | 1.00 | % |
| Yuma Community Bank | | | 63,804 | | | | 66,092 | | | | 730 | | | | 525 | | | | 1,506 | | | | 600 | | | | 1.14 | % | | | 0.79 | % |
| Arizona Region Total | | | 908,049 | | | | 949,808 | | | | 13,814 | | | | 9,129 | | | | 42,394 | | | | 11,210 | | | | 1.52 | % | | | 0.96 | % |
| | | | | | | | | | | | | | | | | | | | | | | | | | | | | | | | | |
| California Region: | | | | | | | | | | | | | | | | | | | | | | | | | | | | | | | | |
| Bank of Escondido | | | 62,608 | | | | 54,707 | | | | 810 | | | | 560 | | | | 817 | | | | 311 | | | | 1.29 | % | | | 1.02 | % |
Bank of Feather River(3) | | | 22,962 | | | | 13,345 | | | | 320 | | | | 187 | | | | | | | | | | | | 1.39 | % | | | 1.40 | % |
| Bank of San Francisco | | | 60,772 | | | | 44,989 | | | | 823 | | | | 695 | | | | 299 | | | | 392 | | | | 1.35 | % | | | 1.54 | % |
| Bank of Santa Barbara | | | 60,535 | | | | 52,340 | | | | 1,138 | | | | 741 | | | | 1,841 | | | | | | | | 1.88 | % | | | 1.42 | % |
| Napa Community Bank | | | 130,150 | | | | 100,253 | | | | 1,890 | | | | 1,069 | | | | 1,848 | | | | 1,459 | | | | 1.45 | % | | | 1.07 | % |
| Point Loma Community Bank | | | 52,497 | | | | 49,607 | | | | 797 | | | | 695 | | | | 795 | | | | | | | | 1.52 | % | | | 1.40 | % |
| Sunrise Bank of San Diego | | | 76,282 | | | | 74,526 | | | | 1,048 | | | | 908 | | | | 1,444 | | | | 2,386 | | | | 1.37 | % | | | 1.22 | % |
Sunrise Community Bank(3) | | | 28,355 | | | | 17,624 | | | | 440 | | | | 255 | | | | | | | | | | | | 1.55 | % | | | 1.45 | % |
| California Region Total | | | 494,161 | | | | 407,391 | | | | 7,266 | | | | 5,110 | | | | 7,044 | | | | 4,548 | | | | 1.47 | % | | | 1.25 | % |
| | | | | | | | | | | | | | | | | | | | | | | | | | | | | | | | | |
| Colorado Region: | | | | | | | | | | | | | | | | | | | | | | | | | | | | | | | | |
| Fort Collins Commerce Bank | | | 74,280 | | | | 59,388 | | | | 1,101 | | | | 889 | | | | 48 | | | | | | | | 1.48 | % | | | 1.50 | % |
Larimer Bank of Commerce(3) | | | 78,638 | | | | 50,927 | | | | 1,160 | | | | 765 | | | | | | | | | | | | 1.48 | % | | | 1.50 | % |
Loveland Bank of Commerce(3) | | | 27,251 | | | | 15,253 | | | | 652 | | | | 229 | | | | 1,090 | | | | | | | | 2.39 | % | | | 1.50 | % |
Mountain View Bank of Commerce(2) | | | 32,180 | | | | | | | | 474 | | | | | | | | | | | | | | | | 1.47 | % | | | | |
| Colorado Region Total | | | 212,349 | | | | 125,568 | | | | 3,387 | | | | 1,883 | | | | 1,138 | | | | | | | | 1.60 | % | | | 1.50 | % |
| | | | | | | | | | | | | | | | | | | | | | | | | | | | | | | | | |
| Great Lakes Region: | | | | | | | | | | | | | | | | | | | | | | | | | | | | | | | | |
| Ann Arbor Commerce Bank | | | 321,687 | | | | 332,624 | | | | 4,771 | | | | 4,504 | | | | 3,740 | | | | 5,161 | | | | 1.48 | % | | | 1.35 | % |
| Bank of Auburn Hills | | | 39,914 | | | | 36,586 | | | | 988 | | | | 820 | | | | 2,895 | | | | 1,293 | | | | 2.48 | % | | | 2.24 | % |
| Bank of Maumee | | | 50,094 | | | | 32,102 | | | | 752 | | | | 482 | | | | 37 | | | | | | | | 1.50 | % | | | 1.50 | % |
| Bank of Michigan | | | 67,700 | | | | 63,448 | | | | 996 | | | | 952 | | | | 306 | | | | 370 | | | | 1.47 | % | | | 1.50 | % |
| Brighton Commerce Bank | | | 100,112 | | | | 99,627 | | | | 1,386 | | | | 1,018 | | | | 1,993 | | | | 18 | | | | 1.38 | % | | | 1.02 | % |
| Capitol National Bank | | | 213,392 | | | | 206,449 | | | | 8,341 | | | | 3,421 | | | | 12,828 | | | | 3,449 | | | | 3.91 | % | | | 1.66 | % |
| Detroit Commerce Bank | | | 95,066 | | | | 108,992 | | | | 2,476 | | | | 1,355 | | | | 4,901 | | | | 3,948 | | | | 2.60 | % | | | 1.24 | % |
| Elkhart Community Bank | | | 87,971 | | | | 83,754 | | | | 1,702 | | | | 1,282 | | | | 3,941 | | | | 2,677 | | | | 1.93 | % | | | 1.53 | % |
| Evansville Commerce Bank | | | 55,779 | | | | 48,113 | | | | 943 | | | | 720 | | | | 158 | | | | 80 | | | | 1.69 | % | | | 1.50 | % |
| Goshen Community Bank | | | 74,144 | | | | 70,799 | | | | 1,501 | | | | 874 | | | | 876 | | | | 491 | | | | 2.02 | % | | | 1.23 | % |
| Grand Haven Bank | | | 103,104 | | | | 122,208 | | | | 3,693 | | | | 2,644 | | | | 12,483 | | | | 6,970 | | | | 3.58 | % | | | 2.16 | % |
| Kent Commerce Bank | | | 71,151 | | | | 83,357 | | | | 2,097 | | | | 1,527 | | | | 1,789 | | | | 2,456 | | | | 2.95 | % | | | 1.83 | % |
| Macomb Community Bank | | | 82,168 | | | | 87,670 | | | | 4,565 | | | | 2,283 | | | | 16,051 | | | | 11,846 | | | | 5.56 | % | | | 2.60 | % |
| Muskegon Commerce Bank | | | 77,046 | | | | 90,031 | | | | 3,693 | | | | 1,762 | | | | 8,557 | | | | 2,362 | | | | 4.79 | % | | | 1.96 | % |
| Oakland Commerce Bank | | | 79,612 | | | | 99,770 | | | | 5,369 | | | | 1,816 | | | | 12,369 | | | | 3,803 | | | | 6.74 | % | | | 1.82 | % |
| Ohio Commerce Bank | | | 48,207 | | | | 29,110 | | | | 723 | | | | 437 | | | | | | | | | | | | 1.50 | % | | | 1.50 | % |
| Paragon Bank & Trust | | | 87,651 | | | | 91,481 | | | | 2,990 | | | | 1,431 | | | | 6,447 | | | | 2,220 | | | | 3.41 | % | | | 1.56 | % |
| Portage Commerce Bank | | | 193,775 | | | | 179,219 | | | | 2,208 | | | | 1,812 | | | | 1,207 | | | | 1,127 | | | | 1.14 | % | | | 1.01 | % |
| Great Lakes Region Total | | | 1,848,573 | | | | 1,865,340 | | | | 49,194 | | | | 29,140 | | | | 90,578 | | | | 48,271 | | | | 2.66 | % | | | 1.56 | % |
| | | | | | | | | | | | | | | | | | | | | | | | | | | | | | | | | |
| Midwest Region: | | | | | | | | | | | | | | | | | | | | | | | | | | | | | | | | |
Adams Dairy Bank(2) | | | 28,834 | | | | | | | | 450 | | | | | | | | | | | | | | | | 1.56 | % | | | | |
| Bank of Belleville | | | 65,150 | | | | 46,951 | | | | 923 | | | | 700 | | | | | | | | | | | | 1.42 | % | | | 1.49 | % |
Community Bank of Lincoln(3) | | | 43,657 | | | | 10,501 | | | | 674 | | | | 168 | | | | | | | | | | | | 1.54 | % | | | 1.60 | % |
| Summit Bank of Kansas City | | | 44,068 | | | | 45,165 | | | | 709 | | | | 641 | | | | 779 | | | | | | | | 1.61 | % | | | 1.42 | % |
| Midwest Region Total | | | 181,709 | | | | 102,617 | | | | 2,756 | | | | 1,509 | | | | 779 | | | | | | | | 1.52 | % | | | 1.47 | % |
Summary of loan information – continued:
| | | Total Portfolio Loans | | | Allowance for Loan Losses | | | Nonperforming Loans | | | Allowance as a % of Total Portfolio Loans | |
| | | 2008 | | | 2007 | | | 2008 | | | 2007 | | | 2008 | | | 2007 | | | 2008 | | | 2007 | |
| Nevada Region: | | | | | | | | | | | | | | | | | | | | | | | | |
1st Commerce Bank | | $ | 30,663 | | | $ | 27,030 | | | $ | 740 | | | $ | 393 | | | $ | 1,000 | | | | | | | 2.41 | % | | | 1.45 | % |
| Bank of Las Vegas | | | 64,648 | | | | 61,662 | | | | 901 | | | | 751 | | | | 4,399 | | | | | | | 1.39 | % | | | 1.22 | % |
| Black Mountain Community Bank | | | 143,654 | | | | 137,308 | | | | 1,765 | | | | 1,415 | | | | 1,722 | | | $ | 659 | | | | 1.23 | % | | | 1.03 | % |
| Desert Community Bank | | | 87,388 | | | | 90,050 | | | | 943 | | | | 837 | | | | 3,671 | | | | 356 | | | | 1.08 | % | | | 0.93 | % |
| Red Rock Community Bank | | | 110,143 | | | | 106,559 | | | | 1,200 | | | | 977 | | | | 5,488 | | | | 64 | | | | 1.09 | % | | | 0.92 | % |
| Nevada Region Total | | | 436,496 | | | | 422,609 | | | | 5,549 | | | | 4,373 | | | | 16,280 | | | | 1,079 | | | | 1.27 | % | | | 1.03 | % |
| | | | | | | | | | | | | | | | | | | | | | | | | | | | | | | | | |
| Northeast Region: | | | | | | | | | | | | | | | | | | | | | | | | | | | | | | | | |
USNY Bank(3) | | | 43,471 | | | | 12,421 | | | | 680 | | | | 187 | | | | | | | | | | | | 1.56 | % | | | 1.51 | % |
| | | | | | | | | | | | | | | | | | | | | | | | | | | | | | | | | |
| Northwest Region: | | | | | | | | | | | | | | | | | | | | | | | | | | | | | | | | |
| Bank of Bellevue | | | 48,838 | | | | 37,364 | | | | 850 | | | | 665 | | | | 170 | | | | 222 | | | | 1.74 | % | | | 1.78 | % |
| Bank of Everett | | | 32,735 | | | | 24,170 | | | | 686 | | | | 418 | | | | 92 | | | | | | | | 2.10 | % | | | 1.73 | % |
Bank of Tacoma(3) | | | 40,175 | | | | 19,639 | | | | 770 | | | | 285 | | | | 1,183 | | | | | | | | 1.92 | % | | | 1.45 | % |
High Desert Bank(3) | | | 35,407 | | | | 9,080 | | | | 624 | | | | 126 | | | | | | | | | | | | 1.76 | % | | | 1.39 | % |
Issaquah Community Bank(3) | | | 24,238 | | | | 6,598 | | | | 385 | | | | 93 | | | | | | | | | | | | 1.59 | % | | | 1.41 | % |
| Northwest Region Total | | | 181,393 | | | | 96,851 | | | | 3,315 | | | | 1,587 | | | | 1,445 | | | | 222 | | | | 1.83 | % | | | 1.64 | % |
| | | | | | | | | | | | | | | | | | | | | | | | | | | | | | | | | |
| Southeast Region: | | | | | | | | | | | | | | | | | | | | | | | | | | | | | | | | |
| Bank of Valdosta | | | 51,629 | | | | 41,629 | | | | 835 | | | | 619 | | | | | | | | | | | | 1.62 | % | | | 1.49 | % |
| Community Bank of Rowan | | | 109,290 | | | | 96,271 | | | | 1,634 | | | | 1,444 | | | | 1,688 | | | | | | | | 1.50 | % | | | 1.50 | % |
| First Carolina State Bank | | | 97,670 | | | | 94,047 | | | | 1,312 | | | | 1,157 | | | | 2,421 | | | | 829 | | | | 1.34 | % | | | 1.23 | % |
| Peoples State Bank | | | 21,314 | | | | 13,609 | | | | 366 | | | | 247 | | | | 937 | | | | 86 | | | | 1.72 | % | | | 1.81 | % |
Pisgah Community Bank(2) | | | 27,746 | | | | | | | | 475 | | | | | | | | 100 | | | | | | | | 1.71 | % | | | | |
| Sunrise Bank of Atlanta | | | 52,763 | | | | 45,024 | | | | 1,063 | | | | 760 | | | | 269 | | | | | | | | 2.01 | % | | | 1.69 | % |
| Southeast Region Total | | | 360,412 | | | | 290,580 | | | | 5,685 | | | | 4,227 | | | | 5,415 | | | | 915 | | | | 1.58 | % | | | 1.45 | % |
| | | | | | | | | | | | | | | | | | | | | | | | | | | | | | | | | |
| Texas Region: | | | | | | | | | | | | | | | | | | | | | | | | | | | | | | | | |
Bank of Fort Bend(3) | | | 19,859 | | | | 3,140 | | | | 305 | | | | 46 | | | | | | | | | | | | 1.54 | % | | | 1.47 | % |
Bank of Las Colinas(3) | | | 29,657 | | | | 9,830 | | | | 435 | | | | 144 | | | | | | | | | | | | 1.47 | % | | | 1.46 | % |
| Texas Region Total | | | 49,516 | | | | 12,970 | | | | 740 | | | | 190 | | | | | | | | | | | | 1.49 | % | | | 1.46 | % |
| | | | | | | | | | | | | | | | | | | | | | | | | | | | | | | | | |
| Other, net | | | 19,100 | | | | 28,546 | | | | 654 | | | | 789 | | | | 5,137 | | | | 6,385 | | | | 3.42 | % | | | 2.76 | % |
| | | | | | | | | | | | | | | | | | | | | | | | | | | | | | | | | |
| Consolidated totals | | $ | 4,735,229 | | | $ | 4,314,701 | | | $ | 93,040 | | | $ | 58,124 | | | $ | 170,210 | | | $ | 72,630 | | | | 1.96 | % | | | 1.35 | % |
| (1) | Formerly Valley First Community Bank, which was renamed in 2008 upon adding a second location in Casa Grande, Arizona. |
| (2) | Became a Capitol affiliate in 2008 and is included for periods after addition to the Capitol banking network. |
| (3) | Became a Capitol affiliate in 2007 and is included for periods after addition to the Capitol banking network. |
There are several other asset categories. Loans held for sale ($10.5 million and $16.4 million at December 31, 2008 and 2007, respectively) are home mortgages which are sold into the secondary market generally within 30-60 days of closing (discussed in more detail in the following section of this narrative). There is also a modest amount of investment securities on the balance sheet ($48.4 million and $39.6 million at December 31, 2008 and 2007, respectively). Goodwill approximated $72.3 million at year-end 2008, a slight decrease from 2007; accounting for goodwill is described in the Critical Accounting Policies section of this narrative.
Other real estate owned (approximated $67.2 million at December 31, 2008) consists of properties acquired through foreclosure or acceptance of a deed in lieu of foreclosure. Other real estate owned increased significantly in 2008 ($50.8 million) due to borrower difficulties and lack of sales activity. Other real estate owned at December 31, 2008 consists of a combination of commercial and residential real estate properties. A substantial portion
of the 2008 increase ($27.5 million) related to a series of construction loan foreclosures at Mesa Bank. Other real estate owned is carried at estimated fair value (less estimated selling cost), which is generally based on independent appraisals, which are subject to change. Continued deterioration of real estate market conditions, for both residential and commercial properties, has negative implications on future sales and valuation of other real estate owned.
The primary source for the funding of loans is deposits, which is discussed in the next section of this narrative.
Asset liquidity for financial institutions typically consists of cash and cash equivalents, loans held for sale and investment securities available for sale. These categories totaled $650.4 million at year-end 2008 or about 11.5% of total assets. This compares to $382.9 million or about 7.8% of total assets at year-end 2007. The increased ratio in 2008 is the result of management's efforts to raise liquidity levels. Liquidity is important for financial institutions because of their need to meet loan funding commitments, depositor withdrawal requests and various other commitments discussed in the accompanying notes to consolidated financial statements. Liquidity can vary significantly on a daily basis, based on customer activity.
About a third of the investment securities portfolio is classified as available for sale, although the banks generally have not sold investments to meet liquidity needs. During 2008, 2007 and 2006, there were no significant sales of investment securities available for sale. Sales of investment securities available for sale are typically made to facilitate changes in risk-management strategies.
Loans held for sale, as previously mentioned, approximated $10.5 million at December 31, 2008, compared to $16.4 million at year-end 2007. These loans are residential real estate mortgages originated by the banks, primarily through Capitol's mortgage affiliate, Amera Mortgage Corporation. These loans are subsequently sold into the secondary market, rather than being held in the banks' portfolios, to reduce interest rate risk. Mortgage loan origination volume in 2008 decreased to approximately $207 million, compared to $500 million in 2007 and $484 million in 2006. Origination volume decreased in 2008 primarily due to falling home values in a recessionary environment. Future volume will depend in large part on interest rates, real estate valuation and the relative strength of residential real estate market conditions. Also, to the extent warranted, the banks may sell other loans from time to time.
The primary source of funds for the banks is deposits. The banks rely upon interest-bearing time deposits as part of their funding strategy. The banks also emphasize noninterest-bearing deposits, or checking accounts, which reduce the banks' cost of funds. Noninterest-bearing deposits were about 16% of total deposits at year-end 2008 (about 17% at year-end 2007). The decrease in this ratio is significant inasmuch as a lower percentage of noninterest-bearing deposits has the effect of increasing a bank's funding costs and, accordingly, reducing net interest income.
In recent periods, many banks within the industry have experienced competitive challenges in obtaining additional deposits to fuel growth. Capitol's banks have had similar experiences in their individual markets. As depositors have wider access to the Internet and other real-time interest rate monitoring resources, deposit sourcing and pricing has become more competitive. Deposit growth requires competitive pricing, resulting in tight net interest margins, especially during periods of relatively low interest rates. As interest rates have recently decreased, customers are more attracted to aggressively-priced time deposits, and growth in noninterest-bearing balances is very difficult to achieve. The banks have increased the use of brokered deposits as a funding source (approximately $1.1 billion at year-end 2008 or 24.5% of deposits compared to 13.9% in 2007); however, brokered deposits are used selectively to help meet funding needs and manage interest rate risk.
To supplement their funding sources, some of the banks have lines of credit from the Federal Home Loan Bank system. At year-end 2008, a total of approximately $430 million ($299 million at year-end 2007) was borrowed under those facilities and additional borrowing availability approximated $213 million. Some of the banks also have smaller lines of credit with their correspondent banks. Borrowings under those facilities are generally at short-term market rates of interest and, although the repayment dates can be extended, are generally outstanding for brief periods of time.
During 2008, Capitol completed a private offering of $14 million of promissory notes, which were purchased by accredited investors. The promissory notes become callable in 2010, mature in 2013 and bear interest at 9%.
Capitol's longer-term contractual obligations are disclosed in the notes to the consolidated financial statements. Such obligations consist principally of time deposits of the banks, debt and lease obligations and trust-preferred securities, the principal amounts of which are summarized as follows (in $1,000s):
| | | | | | Payments Due by Period |
| | | Total(1) | | | Within 1 Year | | | Within 1-3 Years | | | Within 3-5 Years | | | After 5 Years |
| | | | | | | | | | | | | | | |
Deposits without a stated maturity | | $ | 1,931,956 | | | $ | 1,931,956 | | | | | | | | | |
| Time deposits | | | 2,565,656 | | | | 2,153,763 | | | $ | 366,431 | | | $ | 40,679 | | | $ | 4,783 |
| Debt obligations | | | 446,925 | | | | 263,613 | | | | 163,980 | | | | 13,949 | | | | 5,383 |
Rent commitments under noncancelable leases | | | 70,345 | | | | 11,481 | | | | 20,734 | | | | 16,113 | | | | 22,017 |
| Trust-preferred securities | | | 167,293 | | | | | | | | | | | | | | | | 167,293 |
| | | | | | | | | | | | | | | | | | | | |
| Total | | $ | 5,182,175 | | | $ | 4,360,813 | | | $ | 551,145 | | | $ | 70,741 | | | $ | 199,476 |
Loan commitments of Capitol's banks (stand-by letters of credit and unfunded loans) generally expire within one year. Other than the items set forth above, there are no individually material contractual obligations, such as purchase obligations.
A significant source of capital has been investments made by community investors, or minority shareholders, in the subsidiaries which are consolidated for financial reporting purposes. Total minority interests in consolidated subsidiaries amounted to $159.2 million at year-end 2008, a net increase of $3 million from the $156.2 million level at year-end 2007. The net increase in minority interests in 2008 resulted from Capitol's formation of new banks and bank-development subsidiaries.
Capitol has formed several bank-development subsidiaries, each capitalized with two classes of common stock, voting and nonvoting. All of the voting common stock (an investment of $1 million for each bank-development entity) is owned by Capitol. All of the nonvoting common stock, ranging from $12.7 million to $15.8 million for each of the bank-development companies, was sold in private offerings to accredited investors, some of whom are related parties of Capitol. These entities have been engaged in bank-development activities, through Capitol, either on a de novo basis or through acquisition opportunities. Each of these entities bear a similar name, Capitol Development Bancorp Limited ("CDBL"), numbered in their sequential formation, CDBL-I through CDBL-VIII. CDBL-I became wholly-owned via a share-exchange with Capitol effective November 30, 2006. CDBL-II became wholly-owned via a share exchange with Capitol completed in February 2007 through the issuance of approximately 371,000 shares of previously unissued common stock.
Capitol's capital structure consists of these primary elements:
· | Stockholders' equity |
· | Minority interests in consolidated subsidiaries |
· | Trust-preferred securities and related subordinated debentures |
Total stockholders' equity approximated $353.8 million at year-end 2008, a decrease of $35.3 million for the year. The 2008 decrease in stockholders' equity resulted primarily from the net loss from operations for the year and cash dividends paid. The book value per share of common stock (i.e., stockholders' equity divided by the number of common shares outstanding) was $20.46 at year-end 2008, compared with $22.47 at year-end 2007. Cash dividends per share of $0.50 were paid in 2008, compared to $1.00 in 2007 and $0.95 in 2006. Future payment of dividends is subject to approval by Capitol's board of directors, future operating performance and management's assessment of the consolidated organization's capital adequacy.
Minority interests in consolidated subsidiaries represent the underlying noncontrolling interests in the equity of banks and bank-development subsidiaries owned by others. Those shareholders include some shareholders of Capitol; however, these equity interests are separate from their ownership of Capitol's common stock. These minority interests increase as new banks are added with investors other than Capitol, decrease when minority interests are exchanged for Capitol's common stock (and those interests then "migrate" to Capitol's stockholders' equity) and increase or decrease for the minority interests' share of their entity's income or losses.
Capitol has previously raised a total of $167 million of capital through issuance of trust-preferred securities, including $13 million in July 2008 through a public offering. Most of these funds have been obtained through private placements of pooled trust-preferred securities. Trust-preferred securities are long-term debt obligations which are treated as elements of capital for regulatory purposes. As noted in the accompanying financial statements, the trusts relating to Capitol's trust-preferred securities are classified as debt obligations on the consolidated balance sheet. Future availability of trust-preferred securities as a near-term capital resource is uncertain due to the instability of U.S. capital markets.
Total capitalization (the sum of stockholders' equity, minority interests in consolidated subsidiaries and trust-preferred securities) at year-end 2008 amounted to $680.4 million or 12.03% of total assets. This compares to $701.5 million or 14.3% at year-end 2007.
Capitol's common stock was trading at historical lows in late 2008 and at prices not believed by management to be indicative of Capitol's perceived value, resulting in its market capitalization being less than recorded stockholders' equity. As a result of market volatility, all financial institutions' equity securities have recently been trading at historical lows. Stockholders' equity is determined by GAAP, while market capitalization is driven by share prices in the marketplace and, hence, there is no correlation between the two amounts and that such difference does not imply an impairment of goodwill. Capitol's goodwill has resulted from a series of relatively small, past transactions involving share-exchanges regarding the minority interests of majority-owned banks at modest premiums. Further, Capitol's past performance (exclusive of its 2008 net loss) has produced strong earnings results which would further suggest no impairment of goodwill. Additional discussion of Capitol's annual review for potential impairment of goodwill appears in the Critical Accounting Policies section of this narrative.
Capitol and each of its banks and bank-development subsidiaries are subject to a complex series of regulatory rules and requirements which require specific levels of capital adequacy at both the bank level and on a consolidated basis. Under those rules and regulations, banks are categorized as well capitalized, adequately capitalized or inadequately capitalized using several ratio measurements, including a risk-weighting approach to assets and financial commitments. Banks falling into the inadequately capitalized category are subject to the prompt corrective action provisions of the FDIC Improvement Act, which can result in significant regulatory agency intervention and other adverse action. Although it is permissible to maintain capital adequacy at the adequately capitalized level, Capitol operates with the objective of its banks meeting the well capitalized standard. The well capitalized banks have previously benefitted from lower FDIC deposit insurance costs and less restrictive limitations on some banking activities which are attributable to that classification. Increases in FDIC insurance premiums experienced by Capitol's banks in 2008 were attributable to general increases in FDIC assessments, not due to their capital classification.
New banks, as a condition of regulatory charter approval, are required to maintain higher ratios of capital adequacy. Generally, they are required to keep a specific ratio of capital-to-average-total-assets of not less than 8% during their first three years of operation.
In the opinion of management, Capitol and its banks met the criteria to be classified as well capitalized at year-end 2008.
In October 2008, Capitol applied to its primary federal regulator and the FDIC for up to $142 million of preferred stock to be purchased by the U.S. Treasury pursuant to the Capitol Purchase Program (CPP) under the Troubled Asset Relief Program (TARP). If the U.S. Treasury purchases such preferred stock from Capitol, Capitol would also issue warrants up to $4.5 million in shares of its common stock, which would be immediately exercisable. The preferred stock issued under CPP bears a 5% annual dividend for the first five years, increasing to 9% thereafter, and would be treated as permanent Tier 1 capital for regulatory purposes. Entering into a CPP stock purchase agreement with the U.S. Treasury under TARP restricts the issuer of preferred stock from increasing its dividends on common stock and repurchasing its common stock, places restrictions on executive compensation and has other evolving conditions and reporting obligations. There is no certainty Capitol will be approved for the CPP or, if approved, whether Capitol will choose to participate.
On February 25, 2009, the U.S. Treasury announced its new Capital Assistance Program (CAP) under which U.S. banking organizations may apply for a U.S. Treasury investment in mandatorily convertible preferred stock in an amount of up to 1% or 2% of risk-weighted assets. The purpose of the CAP is to provide eligible banking organizations with capital in the form of a preferred security which is convertible into common equity. Participating banking organizations would also issue warrants to the U.S. Treasury. Eligibility will be consistent with the criteria and deliberative process established under the TARP/CPP. The CAP is open immediately and the application deadline for participation is in May 2009. Capitol has not yet determined whether it will submit a CAP application.
The most significant trends which can impact the financial condition and results of operations of financial institutions are changes in market rates of interest and changes in general economic conditions.
Quantitative and Qualitative Disclosure About Market Risk
Changes in interest rates, either up or down, have an impact on net interest income (plus or minus), depending upon the direction and timing of such changes. At any point in time, there is an imbalance between interest rate-sensitive assets and interest rate-sensitive liabilities. This means that when interest rates change, the timing and magnitude of the effect of such interest rate changes can alter the relationship between asset yields and the cost of funds. This timing difference between interest rate-sensitive assets and interest rate-sensitive liabilities is characterized as a "gap" which is quantified by the distribution of rate-sensitive amounts within various time periods in which they reprice or mature.
The following table summarizes the consolidated financial position in relation to the "gap" at December 31, 2008 (in $1,000s):
| | | Interest Rate Sensitivity | | | |
| | | 0 to 3 Months | | | 4 to 12 Months | | | 1 to 5 Years | | | Over 5 Years | | | Total |
| ASSETS | | | | | | | | | | | | | | |
| Money market and interest-bearing deposits | | $ | 379,681 | | | $ | 12,057 | | | $ | 98 | | | | | | $ | 391,836 |
| Federal funds sold | | | 96,031 | | | | | | | | | | | | | | | 96,031 |
| Loans held for sale | | | 10,474 | | | | | | | | | | | | | | | 10,474 |
| Investment securities | | | 27,115 | | | | 4,653 | | | | 5,541 | | | $ | 11,131 | | | | 48,440 |
| Portfolio loans | | | 1,758,086 | | | | 479,353 | | | | 2,039,536 | | | | 458,254 | | | | 4,735,229 |
| Nonearning assets | | | | | | | | | | | | | | | | | | | 372,826 |
| | | | | | | | | | | | | | | | | | | | |
| Total assets | | $ | 2,271,387 | | | $ | 496,063 | | | $ | 2,045,175 | | | $ | 469,385 | | | $ | 5,654,836 |
| | | | | | | | | | | | | | | | | | | | |
| LIABILITIES AND STOCKHOLDERS' EQUITY | | | | | | | | | | | | | | | | | | | |
| Interest-bearing deposits: | | | | | | | | | | | | | | | | | | | |
| Time deposits under $100,000 | | $ | 442,104 | | | $ | 506,621 | | | $ | 210,987 | | | $ | 509 | | | $ | 1,160,221 |
| Time deposits $100,000 and over | | | 529,821 | | | | 675,217 | | | | 196,123 | | | | 4,274 | | | | 1,405,435 |
| All other interest-bearing deposits | | | 678,039 | | | | 244,463 | | | | 106,339 | | | | 202,329 | | | | 1,231,170 |
| Total interest-bearing deposits | | | 1,649,964 | | | | 1,426,301 | | | | 513,449 | | | | 207,112 | | | | 3,796,826 |
| Notes payable and short-term borrowings | | | 125,578 | | | | 138,035 | | | | 177,929 | | | | 5,383 | | | | 446,925 |
| Trust preferred securities | | | 68,000 | | | | | | | | 33,000 | | | | 69,841 | | | | 170,841 |
| Noninterest-bearing liabilities | | | | | | | | | | | | | | | | | | | 727,176 |
| Minority interests in consolidated subsidiaries | | | | | | | | | | | | | | | | | | | 159,220 |
| Stockholders' equity | | | | | | | | | | | | | | | | | | | 353,848 |
| | | | | | | | | | | | | | | | | | | | |
| Total liabilities and stockholders' equity | | $ | 1,843,542 | | | $ | 1,564,336 | | | $ | 724,378 | | | $ | 282,336 | | | $ | 5,654,836 |
| | | | | | | | | | | | | | | | | | | | |
| Interest rate sensitive period gap | | $ | 427,845 | | | $ | (1,068,273 | ) | | $ | 1,320,797 | | | $ | 187,049 | | | | |
| | | | | | | | | | | | | | | | | | | | |
| Interest rate sensitive cumulative gap | | $ | 427,845 | | | $ | (640,428 | ) | | $ | 680,369 | | | $ | 867,418 | | | | |
| | | | | | | | | | | | | | | | | | | | |
Period rate sensitive assets/period rate sensitive liabilities | | | 1.23 | | | | 0.32 | | | | 2.82 | | | | 1.66 | | | | |
Cumulative rate sensitive assets/cumulative rate sensitive liabilities | | | 1.23 | | | | 0.81 | | | | 1.16 | | | | 1.20 | | | | |
| Cumulative gap to total assets | | | 7.57 | % | | | (11.33 | )% | | | 12.03 | % | | | 15.34 | % | | | |
[The remainder of this page intentionally left blank]
The table on the preceding page indicates that, in the immediate short-term, Capitol is slightly “asset sensitive” (i.e., interest-rate sensitive assets exceed interest-rate sensitive liabilities) and, accordingly, if interest rates increase it would favorably impact net interest income. Reality in 2008, however, was a falling rate environment with unprecedented large rate cuts made by the Federal Reserve to the point of bringing short-term interbank rates to near zero. The "gap" changes daily based upon changes in the underlying assets and liabilities at the banks. Analyzing exposure to interest rate risk is prone to imprecision because the "gap" is constantly changing, the "gap" differs at each of the banks and it is difficult to predict the timing, amount and direction of future changes in market interest rates and the potential corresponding effect on customers' balances and transactions.
The banks endeavor to manage and monitor interest rate risk in concert with market conditions and risk parameters. Management strives to maintain a reasonably balanced position of interest rate-sensitive assets and liabilities. Capitol and its banks have not engaged in speculative positions, for example through the use of derivatives, in anticipation of interest rate movements. In periods of relatively lower interest rates, the banks emphasize variable rate loans and time deposits to the extent possible in a competitive environment; however, competitive influences often result in making fixed rate loans, although the banks seek to limit the duration of such loans. Similarly, low interest rates generally make competition more intense for deposits since loan demand will typically increase during periods of lower rates and, accordingly, result in higher interest costs on deposits as competitors bid-up rates, adversely impacting interest margins. Future interest rates and the impact on earnings are difficult to predict. In addition to interest rate risk relating to interest-bearing assets and liabilities, changes in interest rates also can impact future transaction volume of loans and deposits at the banks. For activities which are influenced by levels of interest rates for transaction volume (for example, origination of residential mortgage loans), pricing margins and demand can become impacted significantly by changes in interest rates.
As a means of monitoring and managing exposure to interest rate risk, management uses a computerized simulation model which is intended to estimate pro forma effects of changes in interest rates. Using the simulation model, the following table illustrates, on a consolidated basis, changes which would occur in annual levels of interest income, interest expense and net interest income (in $1,000s) assuming both 100 and 200 basis point ("bp") parallel increases and decreases in interest rates:
| | | Pro Forma Assuming No Change in | | | Pro Forma Effect of Interest Rate Increases | | | Pro Forma Effect of Interest Rate Decreases |
| | | Interest Rates | | | | +100 bp | | | | +200 bp | | | | -100 bp | | | | -200 bp |
| | | | | | | | | | | | | | | | | | | |
| Interest income | | $ | 330,263 | | | $ | 358,789 | | | $ | 388,175 | | | $ | 305,333 | | | $ | 283,976 |
| Interest expense | | | 155,130 | | | | 183,026 | | | | 210,923 | | | | 128,288 | | | | 106,934 |
| | | | | | | | | | | | | | | | | | | | |
| Net interest income | | $ | 175,133 | | | $ | 175,763 | | | $ | 177,252 | | | $ | 177,045 | | | $ | 177,042 |
The pro forma analysis on the preceding page is intended to quantify theoretical changes in interest income based on stated assumptions. The pro forma analysis excludes the effect of numerous other variables such as borrowers' ability to repay loans, the ability of banks to obtain deposits in a radically changed interest-rate environment and how management would revise its asset and liability management priorities in concert with rate changes.
While the pro forma analysis above is intended to estimate the impact of an immediate 100 and 200 basis point change in rates, actual results will be different. Those results will differ (and may be materially different) because a change in market rates does not result in an instantaneous parallel shift in rates on loans and deposits at banks. Further, any financial model intended to estimate the impact of interest rate changes will not necessarily incorporate other variables, including management's efforts to manage its asset and liability interest rate sensitivity, or customer behavior.
As mentioned previously, the Federal Reserve took unprecedented action in late 2008 to reduce market interest rates to near zero. Because of Capitol's consolidated asset-sensitive gap position such action is expected to have an adverse impact on net interest margin (and profitability) as interest rates on loans reprice quickly while rates paid on deposits will reprice over an extended period of time. It is impossible to speculate further on the timing, size and direction of future interest rate changes.
General economic conditions also have a significant impact on both the results of operations and the financial condition of financial institutions. Local economic conditions, and to some extent national economic conditions, have a significant impact on levels of loan demand as well as the ability of borrowers to repay loans timely and the availability of funds for customers to make deposits. As discussed earlier, Michigan's economic climate has entered into recession much earlier than the rest of the nation. Capitol's Michigan-based banks have minimal amounts of loans made directly to auto industry-related businesses; however, the stress and potential bankruptcy of the U.S. auto industry and weaknesses in other commerce in Michigan is likely to have a continuing adverse impact on the communities in which the banks are located. Stresses of the domestic economic and global instability preclude prediction of near-term recovery.
Bank regulatory agencies have recently issued commentary regarding asset concentrations, with particular emphasis on commercial real estate when used as collateral for loans. As discussed elsewhere in this narrative, Capitol's banks have intentionally sought commercial real estate as collateral when making loans because its experience suggests lower loss potential on those loans than ones merely secured by accounts receivable, inventory or equipment. Further, many of these loans at Capitol's banks are made to borrowers with owner-occupied businesses, where the real estate collateral is obtained as part of a broader collateral package for business loans, with less emphasis on loans solely dependent on speculative real estate development projects.
Capitol's geographic footprint serves to minimize or avoid a concentration of assets in a particular region. The Great Lakes Region comprised 37% of consolidated assets at December 31, 2008, compared to 42% at December 31, 2007, and is disproportionate to other denominated regions of Capitol. Future asset growth is expected to emphasize other regions, improving the balance of Capitol's geographic presence and to reduce the exposure to adverse economic conditions of any particular region.
While Capitol's community banking model has been focused on single-location, stand-alone banks, management has recently reevaluated the efficiency of that model in certain markets. In October 2008, Capitol announced the consolidation of its banks located in eastern and western Michigan. These two groups of banks are closely geographically clustered. In December 2008, the next step of this consolidation initiative occurred with the filing of merger applications with the FDIC and the Michigan banking regulator for permission to merge nine Michigan banks into one charter. This charter consolidation effort has several objectives, chiefly expense reduction, improved efficiency, coordinated management of problem loans and defined asset shrinkage goals. Similar consolidation initiatives are under consideration in other geographic markets.
Start-up banks generally incur operating losses during their early periods of operation. Recently formed start-up banks will detract from consolidated earnings performance and will similarly negatively impact short-term consolidated profitability. On a consolidated basis, such operating losses reduce net income by the pro rata share of Capitol's ownership percentage in those banks. Capitol reduces the net income impact of early-period losses of start-up banks through its unique ownership structure of substantially less than 100% of those banks either directly or indirectly through bank-development subsidiaries. When those banks become profitable, their operating results will contribute to consolidated earnings to the extent of Capitol's ownership percentage.
Commercial banks continue to be subject to significant regulatory requirements which impact current and future operations. In addition to the extent of regulatory interaction with financial institutions, extensive rules and regulations governing lending activities, deposit gathering and capital adequacy (to name a few), translate into a significant cost burden of financial institution regulation. Such costs include the significant amount of management time and expense which is incurred in maintaining compliance and developing systems for compliance with those rules and regulations as well as the cost of examinations, audits and other compliance activities. The future of financial institution regulation, and its costs, is uncertain and difficult to predict.
FDIC deposit insurance premium levels became a much more significant expense in 2008 ($3.2 million) and 2007 ($2.0 million) compared to 2006 ($362,000), and will increase in future periods as a result of the FDIC imposing a risk-based matrix approach for assessment of premiums for deposit insurance, as it seeks to replenish its insurance fund for the costs of bank failures and addresses higher deposit insurance coverage.
International bank regulatory agencies are currently contemplating revisions to the existing risk-based capital adequacy framework through the Basel l-A and other proposals. As currently proposed, management does not expect those proposals to have a material impact on Capitol and its banks.
Note B of the notes to the consolidated financial statements is captioned Significant Accounting Policies. That disclosure spans numerous pages, all of which are deemed "significant" and are required disclosures under generally accepted accounting principles (GAAP). For purposes of this narrative, current SEC guidance requires the selection of a few of those for discussion as "critical accounting policies." The selection of which few will differ from company to company, even within a common industry, such as within the business of banking. Capitol considers its critical accounting policies to include the following:
Use of Estimates in Determining the Allowance for Loan Losses. Bank regulatory agencies, accounting standard setters and the SEC have all issued commentary, guidance and a variety of rule-making releases on how financial institutions are to determine the amount of their allowance for loan losses. Determining the allowance is a process and methodology which is inherently subjective in how and when to recognize and record a loss allowance or 'reserve' for loans. It is not a process or methodology which can be merely reduced to a strict absolute computation, like a mathematical formula to compute taxes. The process and methodology will differ from one financial institution to another and there is no 'one size fits all' format or approach to loss reserving. All of Capitol's banks use a consistent computational template, combined with judgmental factors unique to the loan portfolio at each bank, to determine their respective allowances for loan losses. Management believes its process and methodology for determining the allowance for loan losses is appropriate and adequate to properly estimate losses inherent in the loan portfolio at the balance-sheet date; however, actual future losses will differ from amounts considered in the allowance methodology. Further, bank regulatory agencies may have differing perspectives on the process, methodology and adequacy of the allowance for loan losses when examining the banks and, in addition, such agencies' examination teams may not be consistent in their review and conclusions from one bank to another. The process of determining the level of the allowance for loan losses at each individual bank and on a consolidated basis requires a high degree of subjective judgment. It is possible that others, given the same information, may at any point in time reach different reasonable conclusions. At December 31, 2008, Capitol's allowance for loan losses approximated 1.96% of portfolio loans outstanding. Based on portfolio loans outstanding at that date, any 1 basis-point (.01%) change in the allowance would have an approximate $474,000 impact on both the allowance for loan losses and income (loss) before income taxes.
Accounting for Goodwill and Other Intangibles. At December 31, 2008, Capitol had $72.3 million of goodwill on its balance sheet. Goodwill arises in acquisition accounting. In Capitol's transactions, most of this goodwill is the result of share-exchange transactions when Capitol has issued shares of its common stock at a premium over the book value of the minority interest of a subsidiary bank's shares. Current accounting rules require an annual review of goodwill for potential impairment. Goodwill is reviewed for impairment by management by comparing estimated entity fair value (using discounted cash flow analysis) to net assets of the entity. If any amount of the goodwill is deemed to be impaired, such amount is to be written off in the period the determination is made. This is an area involving significant judgment. During the fourth quarter of 2008, management completed its review for potential goodwill impairment using discounted cash flow analysis at the subsidiary reporting unit level and on a consolidated basis. The analysis is performed annually, as of November 30. The discount rate was developed using a number of market factors relevant to determining entity value. To the extent any subsidiaries failed to pass step 1 of the impairment test (the discounted cash flow analysis), such subsidiaries passed the second step of the impairment test (fair value of net assets). Accordingly, no amount of goodwill was deemed to be impaired at December 31, 2008. As mentioned previously, the review for potential impairment is performed annually. In future reviews, if higher discount rates are applied, and subsidiaries fail to pass the second step of the impairment test, some portion of recorded goodwill could be deemed impaired, requiring write-down of goodwill.
Consolidation Policy. Current accounting rules require consolidation of entities which are majority-owned or controlled by Capitol. This means that partially-owned banks and bank-development subsidiaries are combined with Capitol for financial reporting purposes along with banks and other subsidiaries which are wholly-owned. The consolidated balance sheet includes all assets and liabilities of those entities. However, after giving effect to the minority interest in net income or losses of consolidated subsidiaries, Capitol's net income (loss) only includes the entities' net income or loss to the extent of Capitol's ownership. Reported results would be materially different if Capitol had 100% ownership of those entities. Capitol has typically gained full ownership at a later date through share-exchange transactions.
There were several new accounting standards which were issued or became effective in 2008, in addition to some which have later effective dates. Those are listed and discussed in Note B of the consolidated financial statements, beginning on page F-45.
The summary below is not a complete list of all risk factors identified by management and readers are encouraged to review Capitol's Form 10-K (Item 1A) and other SEC filings, particularly registration statements, for a more comprehensive review of risk factors, which include the following, among others:
· | The regulatory environment for the banking industry could change significantly and adversely |
· | The adverse economic environment of 2008 may worsen further resulting in higher levels of nonperforming loans and loan losses |
· | Young banks, which include Capitol's newer affiliates, incur operating losses and may not contribute to consolidated operating results for an extended period of time |
· | The environment for raising capital has become unstable and may limit growth plans and operations |
· | Changes in regulations, or regulatory action regarding Capitol or its banks could limit future expansion plans and operations |
· | The allowance for loan losses is based on estimates |
· | Concentrations in loans secured by commercial real estate could limit or delay future expansion plans and loss estimates could change significantly if real estate market conditions deteriorate further |
· | Loss estimates for real estate collateral-dependent loans are based on independent appraisals which are subject to change |
· | Investments in Federal Home Loan Bank stock are carried at cost and are a restricted security which may be redeemed only by the issuer; the issuer's future ability to redeem the security is subject to its liquidity and capital adequacy |
· | Capitol may participate in the U.S. Treasury's Capital Purchase Program which may be dilutive to Capitol's common stock and earnings |
· | The complexity of Capitol's structure (a mixture of partially-owned and wholly-owned banks and related entities) complicates financial analysis |
In addition to the items listed above, of course, changes in interest rates can have a pervasive impact on Capitol and its banks.
Capitol has a risk management program in place which endeavors to manage these and other risks.
Internal Control Over Financial Reporting
Capitol Bancorp Ltd. is responsible for the preparation, integrity and fair presentation of the consolidated financial statements included in this annual report. The consolidated financial statements and notes included in this annual report have been prepared in conformity with United States generally accepted accounting principles and necessarily include some amounts that are based on management's best estimates and judgments.
We, as management of Capitol Bancorp Ltd., are responsible for establishing and maintaining effective internal control over financial reporting that is designed to produce reliable financial statements in conformity with United States generally accepted accounting principles. The system of internal control over financial reporting, as it relates to the financial statements, is evaluated for effectiveness by management and tested for reliability through a program of internal audits. Actions are taken to correct potential deficiencies as they are identified. Any system of internal control, no matter how well designed, has inherent limitations, including the possibility that a control can be circumvented or overridden and misstatements due to error or fraud may occur and not be detected. Also, because of changes in conditions, internal control effectiveness may vary over time. Accordingly, even an effective system of internal control will provide only reasonable assurance with respect to financial statement preparation.
Capitol's Audit Committee, consisting entirely of independent directors, meets regularly with management, internal auditors and the independent registered public accounting firm, and reviews audit plans and results, as well as management's actions taken in discharging responsibilities for accounting, financial reporting and internal control. BDO Seidman, LLP, independent registered public accounting firm, and the internal auditors have direct and confidential access to Capitol's Audit Committee at all times to discuss the results of their examinations.
Management assessed Capitol's system of internal control over financial reporting as of December 31, 2008, in relation to criteria for effective internal control over financial reporting as described in Internal Control – Integrated Framework, issued by the Committee of Sponsoring Organizations of the Treadway Commission. Based on this assessment, management concluded that, as of December 31, 2008, its system of internal control over financial reporting was effective and met the criteria of the Internal Control – Integrated Framework. BDO Seidman, LLP, independent registered public accounting firm, has issued an attestation report on Capitol's internal control over financial reporting.
Joseph D. Reid Chairman and CEO Lansing, Michigan March 11, 2009 | Lee W. Hendrickson Chief Financial Officer |
| BDO Seidman, LLP Accountants and Consultants | | 99 Monroe Avenue N.W., Suite 800 Grand Rapids, Michigan 49503-2654 Telephone: (616) 774-7000 Fax: (616) 776-3680 |
Board of Directors and Stockholders
Capitol Bancorp Ltd.
We have audited Capitol Bancorp Ltd. and subsidiaries' internal control over financial reporting as of December 31, 2008, based on criteria established in Internal Control-Integrated Framework issued by the Committee of Sponsoring Organizations of the Treadway Commission (the COSO criteria). Capitol Bancorp Ltd.'s management is responsible for maintaining effective internal control over financial reporting and for its assessment of the effectiveness of internal control over financial reporting, included in the accompanying Management's Report on Internal Control Over Financial Reporting. Our responsibility is to express an opinion on the Corporation's internal control over financial reporting based on our audit.
We conducted our audit in accordance with the standards of the Public Company Accounting Oversight Board (United States). Those standards require that we plan and perform the audit to obtain reasonable assurance about whether effective internal control over financial reporting was maintained in all material respects. Our audit included obtaining an understanding of internal control over financial reporting, assessing the risk that a material weakness exists, and testing and evaluating the design and operating effectiveness of internal control based on the assessed risk. Our audit also included performing such other procedures as we considered necessary in the circumstances. We believe that our audit provides a reasonable basis for our opinion.
A company's internal control over financial reporting is a process designed to provide reasonable assurance regarding the reliability of financial reporting and the preparation of financial statements for external purposes in accordance with generally accepted accounting principles. A company's internal control over financial reporting includes those policies and procedures that (1) pertain to the maintenance of records that, in reasonable detail, accurately and fairly reflect the transactions and dispositions of the assets of the company; (2) provide reasonable assurance that transactions are recorded as necessary to permit preparation of financial statements in accordance with generally accepted accounting principles, and that receipts and expenditures of the company are being made only in accordance with authorizations of management and directors of the company; and (3) provide reasonable assurance regarding prevention or timely detection of unauthorized acquisition, use, or disposition of the company's assets that could have a material effect on the financial statements.
Because of its inherent limitations, internal control over financial reporting may not prevent or detect misstatements. Also, projections of any evaluation of effectiveness to future periods are subject to the risk that controls may become inadequate because of changes in conditions, or that the degree of compliance with the policies or procedures may deteriorate.
In our opinion, Capitol Bancorp Ltd. and subsidiaries maintained, in all material respects, effective internal control over financial reporting as of December 31, 2008, based on the COSO criteria.
We have also audited, in accordance with the standards of the Public Company Accounting Oversight Board (United States), the accompanying consolidated balance sheets of Capitol Bancorp Ltd. and subsidiaries as of December 31, 2008 and 2007, and the related consolidated statements of operations, changes in stockholders' equity and cash flows for each of the three years in the period ended December 31, 2008, and our report dated March 11, 2009 expressed an unqualified opinion thereon.
Grand Rapids, Michigan March 11, 2009 |
| BDO Seidman, LLP Accountants and Consultants | | 99 Monroe Avenue N.W., Suite 800 Grand Rapids, Michigan 49503-2654 Telephone: (616) 774-7000 Fax: (616) 776-3680 |
Board of Directors and Stockholders
Capitol Bancorp Ltd.
We have audited the accompanying consolidated balance sheets of Capitol Bancorp Ltd. and subsidiaries as of December 31, 2008 and 2007, and the related consolidated statements of operations, changes in stockholders' equity and cash flows for each of the three years in the period ended December 31, 2008. These financial statements are the responsibility of the Corporation's management. Our responsibility is to express an opinion on these financial statements based on our audits.
We conducted our audits in accordance with the standards of the Public Company Accounting Oversight Board (United States). Those standards require that we plan and perform the audit to obtain reasonable assurance about whether the financial statements are free of material misstatement. An audit includes examining, on a test basis, evidence supporting the amounts and disclosures in the financial statements, assessing the accounting principles used and significant estimates made by management, as well as evaluating the overall financial statement presentation. We believe that our audits provide a reasonable basis for our opinion.
In our opinion, the consolidated financial statements referred to above present fairly, in all material respects, the financial position of Capitol Bancorp Ltd. and subsidiaries as of December 31, 2008 and 2007, and the results of their operations and their cash flows for each of the three years in the period ended December 31, 2008, in conformity with accounting principles generally accepted in the United States of America.
We have also audited, in accordance with the standards of the Public Company Accounting Oversight Board (United States), Capitol Bancorp Ltd. and subsidiaries' internal control over financial reporting as of December 31, 2008, based on criteria established in Internal Control – Integrated Framework issued by the Committee of Sponsoring Organizations of the Treadway Commission (COSO) and our report dated March 11, 2009 expressed an unqualified opinion thereon.
Grand Rapids, Michigan March 11, 2009 |
| | | -December 31- | |
| | | 2008 | | | 2007 | |
| | | (in $1,000s) | |
| ASSETS | | | | | | |
| Cash and due from banks | | $ | 136,499 | | | $ | 196,083 | |
| Money market and interest-bearing deposits | | | 391,836 | | | | 26,924 | |
| Federal funds sold | | | 96,031 | | | | 129,365 | |
| Cash and cash equivalents | | | 624,366 | | | | 352,372 | |
| Loans held for sale | | | 10,474 | | | | 16,419 | |
| Investment securities—Note C: | | | | | | | | |
| Available for sale, carried at fair value | | | 15,584 | | | | 14,119 | |
Held for long-term investment, carried at amortized cost which approximates fair value | | | 32,856 | | | | 25,478 | |
| Total investment securities | | | 48,440 | | | | 39,597 | |
Portfolio loans, less allowance for loan losses of $93,040 in 2008 and $58,124 in 2007—Note D | | | 4,642,189 | | | | 4,256,577 | |
| Premises and equipment—Note F | | | 59,249 | | | | 60,031 | |
| Accrued interest income | | | 18,871 | | | | 19,417 | |
| Goodwill—Note B | | | 72,342 | | | | 72,722 | |
| Other real estate owned | | | 67,171 | | | | 16,357 | |
| Other assets | | | 111,734 | | | | 68,271 | |
| | | | | | | | | |
| TOTAL ASSETS | | $ | 5,654,836 | | | $ | 4,901,763 | |
| | | | | | | | | |
| | | | | | | | | |
| LIABILITIES AND STOCKHOLDERS' EQUITY | | | | | | | | |
| Deposits: | | | | | | | | |
| Noninterest bearing | | $ | 700,786 | | | $ | 671,688 | |
| Interest-bearing—Note G | | | 3,796,826 | | | | 3,173,057 | |
| Total deposits | | | 4,497,612 | | | | 3,844,745 | |
| Debt obligations: | | | | | | | | |
| Notes payable and short-term borrowings—Note H | | | 446,925 | | | | 320,384 | |
| Subordinated debentures—Note I | | | 167,293 | | | | 156,130 | |
| Total debt obligations | | | 614,218 | | | | 476,514 | |
| Accrued interest on deposits and other liabilities | | | 29,938 | | | | 35,161 | |
| Total liabilities | | | 5,141,768 | | | | 4,356,420 | |
| | | | | | | | | |
| MINORITY INTERESTS IN CONSOLIDATED SUBSIDIARIES—Note A | | | 159,220 | | | | 156,198 | |
| | | | | | | | | |
| STOCKHOLDERS' EQUITY—Notes B, J and P | | | | | | | | |
Preferred stock, 20,000,000 shares authorized; none issued and outstanding | | | | | | | | |
Common stock, no par value, 50,000,000 shares authorized; issued and outstanding: 2008 – 17,293,908 shares 2007 – 17,316,568 shares | | | 274,018 | | | | 272,208 | |
| Retained earnings | | | 80,255 | | | | 117,520 | |
| Undistributed common stock held by employee-benefit trust | | | (569 | ) | | | (586 | ) |
Fair value adjustment (net of tax effect) for investment securities available for sale (accumulated other comprehensive income/loss) | | | 144 | | | | 3 | |
| Total stockholders' equity | | | 353,848 | | | | 389,145 | |
| | | | | | | | | |
| TOTAL LIABILITIES AND STOCKHOLDERS' EQUITY | | $ | 5,654,836 | | | $ | 4,901,763 | |
See notes to consolidated financial statements.
| | | | -Year Ended December 31- |
| | | | 2008 | | | | 2007 | | | | 2006 |
| | | (in $1,000s except per share data) |
| Interest income: | | | | | | | | |
| Portfolio loans (including fees) | | $ | 296,689 | | | $ | 314,800 | | | $ | 264,701 |
| Loans held for sale | | | 774 | | | | 2,133 | | | | 2,740 |
| Taxable investment securities | | | 571 | | | | 773 | | | | 956 |
| Federal funds sold | | | 3,822 | | | | 10,687 | | | | 8,703 |
| Other | | | 2,459 | | | | 2,046 | | | | 2,253 |
| Total interest income | | | 304,315 | | | | 330,439 | | | | 279,353 |
| Interest expense: | | | | | | | | | | | |
| Deposits | | | 112,370 | | | | 124,160 | | | | 88,629 |
| Debt obligations and other | | | 28,096 | | | | 23,002 | | | | 16,957 |
| Total interest expense | | | 140,466 | | | | 147,162 | | | | 105,586 |
| Net interest income | | | 163,849 | | | | 183,277 | | | | 173,767 |
| Provision for loan losses—Note D | | | 82,492 | | | | 25,340 | | | | 12,156 |
Net interest income after provision for loan losses | | | 81,357 | | | | 157,937 | | | | 161,611 |
| Noninterest income: | | | | | | | | | | | |
| Service charges on deposit accounts | | | 5,881 | | | | 4,787 | | | | 4,318 |
| Trust and wealth-management revenue | | | 6,182 | | | | 5,149 | | | | 3,336 |
Fees from origination of non-portfolio residential mortgage loans | | | 3,642 | | | | 4,482 | | | | 5,439 |
| Gain on sales of government-guaranteed loans | | | 2,060 | | | | 2,733 | | | | 2,434 |
Gain on sales of other non-portfolio commercial loans | | | 1,058 | | | | 1,244 | | | | 1,052 |
Realized gains (losses) on sales of investment securities available for sale | | | 50 | | | | (2 | ) | | | |
| Other | | | 7,559 | | | | 5,988 | | | | 4,953 |
| Total noninterest income | | | 26,432 | | | | 24,381 | | | | 21,532 |
| Noninterest expense: | | | | | | | | | | | |
| Salaries and employee benefits | | | 108,702 | | | | 106,563 | | | | 85,196 |
| Occupancy | | | 18,648 | | | | 15,079 | | | | 12,116 |
| Equipment rent, depreciation and maintenance | | | 12,361 | | | | 10,022 | | | | 8,389 |
Costs associated with foreclosed properties and other real estate owned | | | 6,878 | | | | 989 | | | | 417 |
| FDIC insurance premiums and other regulatory fees | | | 4,060 | | | | 2,723 | | | | 879 |
Preopening and start-up costs of de novo banks and bank-development subsidiaries | | | 1,928 | | | | 5,693 | | | | 4,462 |
| Other | | | 37,811 | | | | 35,091 | | | | 26,345 |
| Total noninterest expense | | | 190,388 | | | | 176,160 | | | | 137,804 |
Income (loss) before income taxes (benefit) and minority interest | | | (82,599 | ) | | | 6,158 | | | | 45,339 |
| Income taxes (benefit)—Note L | | | (30,148 | ) | | | 2,824 | | | | 15,463 |
| Income (loss) before minority interest | | | (52,451 | ) | | | 3,334 | | | | 29,876 |
| Minority interest in net losses of consolidated subsidiaries | | | 23,844 | | | | 18,603 | | | | 12,515 |
| | | | | | | | | | | | |
| NET INCOME (LOSS) | | $ | (28,607 | ) | | $ | 21,937 | | | $ | 42,391 |
| | | | | | | | | | | | |
NET INCOME (LOSS) PER SHARE— Note M: | | | | | | | | | | | |
| Basic | | $ | (1.67 | ) | | $ | 1.29 | | | $ | 2.69 |
| | | | | | | | | | | | |
| Diluted | | $ | (1.67 | ) | | $ | 1.27 | | | $ | 2.57 |
See notes to consolidated financial statements.
| | | Common Stock | | | Retained Earnings | | | Undistributed Common Stock Held by Employee- Benefit Trust | | | Accumulated Other Comprehensive Income (Loss) | | | Total | |
| | | | | | | | | | | | | | | | |
| Balanced at January 1, 2006 | | $ | 216,539 | | | $ | 85,553 | | | | | | $ | (226 | ) | | $ | 301,866 | |
Issuance of 555,280 shares of common stock to acquire minority interest in subsidiaries | | | 24,962 | | | | | | | | | | | | | | | 24,962 | |
Issuance of 299,939 shares of common stock upon exercise of stock options | | | 5,924 | | | | | | | | | | | | | | | 5,924 | |
Surrender of 55,680 shares of common stock to facilitate exercise of stock options and vesting of restricted stock | | | (2,351 | ) | | | | | | | | | | | | | | (2,351 | ) |
Issuance of 80,750 unvested shares of restricted common stock, net of related unearned employee compensation | | | -- | | | | | | | | | | | | | | | -- | |
Recognition of compensation expense relating to restricted common stock | | | 1,689 | | | | | | | | | | | | | | | 1,689 | |
| Tax benefit from share-based payments | | | 2,481 | | | | | | | | | | | | | | | 2,481 | |
| Cash dividends paid ($0.95 per share) | | | | | | | (15,165 | ) | | | | | | | | | | (15,165 | ) |
| Components of comprehensive income: | | | | | | | | | | | | | | | | | | | |
| Net income for 2006 | | | | | | | 42,391 | | | | | | | | | | | 42,391 | |
Fair value adjustment for investment securities available for sale (net of income tax effect) | | | | | | | | | | | | | | 82 | | | | 82 | |
| Comprehensive income for 2006 | | | | | | | | | | | | | | | | | | 42,473 | |
| | | | | | | | | | | | | | | | | | | | |
| BALANCES AT DECEMBER 31, 2006 | | | 249,244 | | | | 112,779 | | | | | | | (144 | ) | | | 361,879 | |
| | | | | | | | | | | | | | | | | | | | |
Issuance of 371,314 shares of common stock to acquire minority interest in subsidiary | | | 15,927 | | | | | | | | | | | | | | | 15,927 | |
Issuance of 277,149 shares of common stock upon exercise of stock options | | | 4,706 | | | | | | | | | | | | | | | 4,706 | |
Surrender of 54,855 shares of common stock to facilitate exercise of stock options and vesting of restricted stock | | | (1,870 | ) | | | | | | | | | | | | | | (1,870 | ) |
Recognition of compensation expense relating to restricted common stock ($1,562) and stock options | | | 1,972 | | | | | | | | | | | | | | | 1,972 | |
Issuance of 43,972 unvested shares of restricted common stock, net of related unearned employee compensation and 2,000 forfeited shares | | | -- | | | | | | | | | | | | | | | -- | |
| Tax benefit from share-based payments | | | 1,688 | | | | | | | | | | | | | | | 1,688 | |
| Issuance of 24,506 shares of common stock to ESOP | | | 1,132 | | | | | | | | | | | | | | | 1,132 | |
| Acquisition of 85,543 shares for employee benefit trust | | | | | | | | | | $ | (2,482 | ) | | | | | | | (2,482 | ) |
Transfer of 64,430 shares to ESOP and distribution of 435 shares to employees upon anniversary of employment | | | (591 | ) | | | | | | | 1,896 | | | | | | | | 1,305 | |
| Cash dividends paid ($1.00 per share) | | | | | | | (17,196 | ) | | | | | | | | | | | (17,196 | ) |
| Components of comprehensive income: | | | | | | | | | | | | | | | | | | | | |
| Net income for 2007 | | | | | | | 21,937 | | | | | | | | | | | | 21,937 | |
Fair value adjustment for investment securities available for sale (net of income tax effect) | | | | | | | | | | | | | | | 147 | | | | 147 | |
| Comprehensive income for 2007 | | | | | | | | | | | | | | | | | | | 22,084 | |
| | | | | | | | | | | | | | | | | | | | | |
| BALANCES AT DECEMBER 31, 2007 | | | 272,208 | | | | 117,520 | | | | (586 | ) | | | 3 | | | | 389,145 | |
| | | | | | | | | | | | | | | | | | | | | |
Issuance of 108,935 shares of common stock upon exercise of stock options | | | 1,950 | | | | | | | | | | | | | | | | 1,950 | |
Surrender of 108,163 shares of common stock to facilitate exercise of stock options and vesting of restricted stock | | | (2,376 | ) | | | | | | | | | | | | | | | (2,376 | ) |
Issuance of 32,290 unvested shares of restricted common stock, net of related unearned employee compensation and 55,722 forfeited shares | | | -- | | | | | | | | | | | | | | | | -- | |
Recognition of compensation expense relating to restricted common stock and stock options | | | 2,227 | | | | | | | | | | | | | | | | 2,227 | |
| Tax benefit from share-based payments | | | 20 | | | | | | | | | | | | | | | | 20 | |
Transfer of 205 shares to ESOP and distribution of 370 shares to employees upon anniversary of employment | | | (11 | ) | | | | | | | 17 | | | | | | | | 6 | |
| Cash dividends paid ($0.50 per share) | | | | | | | (8,658 | ) | | | | | | | | | | | (8,658 | ) |
| Components of comprehensive income (loss): | | | | | | | | | | | | | | | | | | | | |
| Net loss for 2008 | | | | | | | (28,607 | ) | | | | | | | | | | | (28,607 | ) |
Fair value adjustment for investment securities available for sale (net of income tax effect) | | | | | | | | | | | | | | | 141 | | | | 141 | |
| Comprehensive loss for 2008 | | | | | | | | | | | | | | | | | | | (28,466 | ) |
| | | | | | | | | | | | | | | | | | | | | |
| BALANCES AT DECEMBER 31, 2008 | | $ | 274,018 | | | $ | 80,255 | | | $ | (569 | ) | | $ | 144 | | | $ | 353,848 | |
See notes to consolidated financial statements.
| | | -Year Ended December 31- | |
| | | 2008 | | | 2007 | | | 2006 | |
| | | (in $1,000s) | |
| OPERATING ACTIVITIES | | | | | | | | | |
| Net income (loss) | | $ | (28,607 | ) | | $ | 21,937 | | | $ | 42,391 | |
Adjustments to reconcile net income (loss) to net cash provided by operating activities: | | | | | | | | | | | | |
| Provision for loan losses | | | 82,492 | | | | 25,340 | | | | 12,156 | |
| Depreciation of premises and equipment | | | 10,547 | | | | 8,980 | | | | 7,219 | |
| Amortization of intangibles | | | 510 | | | | 315 | | | | 585 | |
Net amortization (accretion) of investment security premiums (discounts) | | | (32 | ) | | | 11 | | | | (8 | ) |
| Loss (gain) on sales of premises and equipment | | | 165 | | | | (57 | ) | | | 18 | |
| Gain on sales of government-guaranteed loans | | | (2,060 | ) | | | (2,733 | ) | | | (2,434 | ) |
Gain on sales of other non-portfolio commercial loans | | | (1,058 | ) | | | (1,244 | ) | | | (1,052 | ) |
Realized gains (losses) on sales of investment securities available for sale | | | (50 | ) | | | 2 | | | | | |
Minority interest in net losses of consolidated subsidiaries | | | (23,844 | ) | | | (18,603 | ) | | | (12,515 | ) |
| Share-based compensation expense | | | 2,227 | | | | 1,972 | | | | 1,689 | |
| Deferred federal income tax credit | | | (26,029 | ) | | | (10,397 | ) | | | (5,493 | ) |
| Originations and purchases of loans held for sale | | | (206,544 | ) | | | (499,787 | ) | | | (483,850 | ) |
| Proceeds from sales of loans held for sale | | | 212,489 | | | | 517,961 | | | | 470,895 | |
| Increase in accrued interest income and other assets | | | (7,293 | ) | | | (5,967 | ) | | | (13,791 | ) |
Increase (decrease) in accrued interest expense on deposits and other liabilities | | | (5,223 | ) | | | 8,410 | | | | (1,338 | ) |
| NET CASH PROVIDED BY OPERATING ACTIVITIES | | | 7,690 | | | | 46,140 | | | | 14,472 | |
| | | | | | | | | | | | | |
| INVESTING ACTIVITIES | | | | | | | | | | | | |
Proceeds from sales of investment securities available for sale | | | 890 | | | | 299 | | | | | |
Proceeds from calls, prepayments and maturities of investment securities | | | 20,392 | | | | 11,303 | | | | 14,266 | |
| Purchases of investment securities | | | (30,933 | ) | | | (10,629 | ) | | | (9,347 | ) |
| Net increase in portfolio loans | | | (537,124 | ) | | | (851,892 | ) | | | (510,174 | ) |
| Proceeds from sales of premises and equipment | | | 1,197 | | | | 407 | | | | 708 | |
| Purchases of premises and equipment | | | (11,127 | ) | | | (15,066 | ) | | | (20,611 | ) |
| Proceeds from sale of other real estate owned | | | 10,377 | | | | 10,021 | | | | 2,806 | |
| NET CASH USED BY INVESTING ACTIVITIES | | | (546,328 | ) | | | (855,557 | ) | | | (522,352 | ) |
| | | | | | | | | | | | | |
| FINANCING ACTIVITIES | | | | | | | | | | | | |
Net increase (decrease) in demand deposits, NOW accounts and savings accounts | | | (91,672 | ) | | | 185,376 | | | | 134,250 | |
| Net increase in certificates of deposit | | | 744,539 | | | | 400,884 | | | | 338,976 | |
| Net borrowings from debt obligations | | | 126,541 | | | | 129,230 | | | | 15,425 | |
| Net proceeds from issuance of subordinated debentures | | | 11,046 | | | | 55,000 | | | | | |
| Resources provided by minority interests | | | 26,866 | | | | 55,713 | | | | 68,751 | |
| Net proceeds from issuance of common stock | | | 1,950 | | | | 4,706 | | | | 5,924 | |
| Tax benefit from share-based payments | | | 20 | | | | 1,688 | | | | 2,481 | |
| Acquisition of shares for employee benefit trust | | | | | | | (2,482 | ) | | | | |
| Cash dividends paid | | | (8,658 | ) | | | (17,196 | ) | | | (15,165 | ) |
NET CASH PROVIDED BY FINANCING ACTIVITIES | | | 810,632 | | | | 812,919 | | | | 550,642 | |
| INCREASE IN CASH AND CASH EQUIVALENTS | | | 271,994 | | | | 3,502 | | | | 42,762 | |
| Cash and cash equivalents at beginning of year | | | 352,372 | | | | 348,870 | | | | 306,108 | |
| | | | | | | | | | | | | |
| CASH AND CASH EQUIVALENTS AT END OF YEAR | | $ | 624,366 | | | $ | 352,372 | | | $ | 348,870 | |
| | | | | | | | | | | | | |
| Supplemental disclosures of cash flow information: | | | | | | | | | | | | |
| Cash paid during the year for interest | | | 138,506 | | | | 148,273 | | | | 103,226 | |
| Transfers of loans to other real estate owned | | | 72,138 | | | | 17,216 | | | | 8,870 | |
Surrender of common stock to facilitate exercise of stock options and vesting of restricted stock | | | 2,376 | | | | 1,870 | | | | 2,351 | |
See notes to consolidated financial statements.
Capitol Bancorp Limited
NOTE A—NATURE OF OPERATIONS, BASIS OF PRESENTATION AND
PRINCIPLES OF CONSOLIDATION
Capitol Bancorp Limited ("Capitol" or the "Corporation") is a multibank holding company. Consolidated bank subsidiaries consist of the following:
Affiliate | | Location | | Percentage Owned at December 31, 2008 | | Year Formed or Acquired |
| | | | | | | |
| Arizona Region: | | | | | | |
| Arrowhead Community Bank | | Glendale, Arizona | | 100% | | 2000 |
| Asian Bank of Arizona | | Phoenix, Arizona | | (1) | | 2006 |
| Bank of Tucson | | Tucson, Arizona | | 100% | | 1996 |
| Camelback Community Bank | | Phoenix, Arizona | | 100% | | 1998 |
Central Arizona Bank(2) | | Casa Grande, Arizona | | 73% | | 1997 |
| Colonia Bank | | Phoenix, Arizona | | (1) | | 2008 |
| Mesa Bank | | Mesa, Arizona | | 100% | | 1998 |
| Southern Arizona Community Bank | | Tucson, Arizona | | 100% | | 1998 |
| Sunrise Bank of Albuquerque | | Albuquerque, New Mexico | | 100% | | 2000 |
| Sunrise Bank of Arizona | | Phoenix, Arizona | | 100% | | 1998 |
| Yuma Community Bank | | Yuma, Arizona | | 100% | | 2000 |
| | | | | | | |
| California Region: | | | | | | |
| Bank of Escondido | | Escondido, California | | 100% | | 2003 |
| Bank of Feather River | | Yuba City, California | | (1) | | 2007 |
| Bank of San Francisco | | San Francisco, California | | 51% | | 2005 |
| Bank of Santa Barbara | | Santa Barbara, California | | (1) | | 2005 |
| Napa Community Bank | | Napa, California | | 87% | | 2002 |
| Point Loma Community Bank | | Point Loma, California | | 51% | | 2004 |
| Sunrise Bank of San Diego | | San Diego, California | | 100% | | 2001 |
| Sunrise Community Bank | | Palm Desert, California | | (1) | | 2007 |
| | | | | | | |
| Colorado Region: | | | | | | |
| Fort Collins Commerce Bank | | Fort Collins, Colorado | | 51% | | 2005 |
| Larimer Bank of Commerce | | Fort Collins, Colorado | | 51% | | 2007 |
| Loveland Bank of Commerce | | Loveland, Colorado | | 51% | | 2007 |
| Mountain View Bank of Commerce | | Westminster, Colorado | | (1) | | 2008 |
| | | | | | | |
| Great Lakes Region: | | | | | | |
| Ann Arbor Commerce Bank | | Ann Arbor, Michigan | | 100% | | 1990 |
| Bank of Auburn Hills | | Auburn Hills, Michigan | | 51% | | 2005 |
| Bank of Maumee | | Maumee, Ohio | | (1) | | 2006 |
| Bank of Michigan | | Farmington Hills, Michigan | | 51% | | 2005 |
| Brighton Commerce Bank | | Brighton, Michigan | | 100% | | 1997 |
| Capitol National Bank | | Lansing, Michigan | | 100% | | 1982 |
| Detroit Commerce Bank | | Detroit, Michigan | | 100% | | 1998 |
| Elkhart Community Bank | | Elkhart, Indiana | | 100% | | 1999 |
| Evansville Commerce Bank | | Evansville, Indiana | | (1) | | 2006 |
| Goshen Community Bank | | Goshen, Indiana | | 100% | | 2000 |
| Grand Haven Bank | | Grand Haven, Michigan | | 100% | | 1995 |
| Kent Commerce Bank | | Grand Rapids, Michigan | | 100% | | 1998 |
| Macomb Community Bank | | Clinton Township, Michigan | | 100% | | 1996 |
| Muskegon Commerce Bank | | Muskegon, Michigan | | 100% | | 1997 |
| Oakland Commerce Bank | | Farmington Hills, Michigan | | 100% | | 1992 |
| Ohio Commerce Bank | | Beachwood, Ohio | | (1) | | 2006 |
| Paragon Bank & Trust | | Holland, Michigan | | 100% | | 1994 |
| Portage Commerce Bank | | Portage, Michigan | | 100% | | 1988 |
NOTES TO CONSOLIDATED FINANCIAL STATEMENTS
Capitol Bancorp Limited
NOTE A—NATURE OF OPERATIONS, BASIS OF PRESENTATION AND
PRINCIPLES OF CONSOLIDATION—Continued
Consolidated bank subsidiaries – continued:
Affiliate | | Location | | Percentage Owned at December 31, 2008 | | Year Formed or Acquired |
| | | | | | | |
| Midwest Region: | | | | | | |
| Adams Dairy Bank | | Blue Springs, Missouri | | (1) | | 2008 |
| Bank of Belleville | | Belleville, Illinois | | 51% | | 2005 |
| Community Bank of Lincoln | | Lincoln, Nebraska | | (1) | | 2007 |
| Summit Bank of Kansas City | | Lee's Summit, Missouri | | (1) | | 2005 |
| | | | | | | |
| Nevada Region: | | | | | | |
1st Commerce Bank | | North Las Vegas, Nevada | | (1) | | 2006 |
| Bank of Las Vegas | | Las Vegas, Nevada | | 100% | | 2002 |
| Black Mountain Community Bank | | Henderson, Nevada | | 100% | | 2000 |
| Desert Community Bank | | Las Vegas, Nevada | | 100% | | 1999 |
| Red Rock Community Bank | | Las Vegas, Nevada | | 100% | | 1999 |
| | | | | | | |
| Northeast Region: | | | | | | |
| USNY Bank | | Geneva, New York | | (1) | | 2007 |
| | | | | | | |
| Northwest Region: | | | | | | |
| Bank of Bellevue | | Bellevue, Washington | | 51% | | 2005 |
| Bank of Everett | | Everett, Washington | | (1) | | 2006 |
| Bank of Tacoma | | Tacoma, Washington | | (1) | | 2007 |
| High Desert Bank | | Bend, Oregon | | (1) | | 2007 |
| Issaquah Community Bank | | Issaquah, Washington | | (1) | | 2007 |
| | | | | | | |
| Southeast Region: | | | | | | |
| Bank of Valdosta | | Valdosta, Georgia | | (1) | | 2006 |
| Community Bank of Rowan | | Salisbury, North Carolina | | (1) | | 2006 |
| First Carolina State Bank | | Rocky Mount, North Carolina | | 89% | | 2004 |
| Peoples State Bank | | Jeffersonville, Georgia | | 100% | | 2005 |
| Pisgah Community Bank | | Asheville, North Carolina | | (1) | | 2008 |
| Sunrise Bank of Atlanta | | Atlanta, Georgia | | (1) | | 2006 |
| | | | | | | |
| Texas Region: | | | | | | |
| Bank of Fort Bend | | Sugar Land, Texas | | (1) | | 2007 |
| Bank of Las Colinas | | Irving, Texas | | (1) | | 2007 |
(1) Majority-owned by a bank development subsidiary in which Capitol holds a controlling interest.
(2) Formerly Valley First Community Bank.
Capitol has formed several bank-development subsidiaries, each capitalized with two classes of common stock, voting and nonvoting. All of the voting common stock (an investment of $1 million for each bank-development entity) is owned by Capitol. All of the nonvoting common stock, ranging from $12.7 million to $15.8 million for each of the bank-development companies, was sold in private offerings to accredited investors, some of whom are related parties of Capitol. These entities are engaged in bank development activities, through Capitol, either on a de novo basis or through acquisition opportunities. Each of these entities bear a similar name, Capitol Development Bancorp Limited ("CDBL"), numbered in their sequential formation, CDBL-I through CDBL-VIII. CDBL-I and CDBL-II became wholly-owned by Capitol effective November 30, 2006 and February 9, 2007, respectively (see Note Q), and were merged with and into Capitol in late 2007.
NOTES TO CONSOLIDATED FINANCIAL STATEMENTS
Capitol Bancorp Limited
NOTE A—NATURE OF OPERATIONS, BASIS OF PRESENTATION AND
PRINCIPLES OF CONSOLIDATION—Continued
Capitol views itself as a bank-development company. It has been engaged in the formation and management of de novo banks through majority ownership made directly by Capitol, or through a subsidiary bank-development company, with the remainder of a bank's start-up capital provided by local investors in the community of that bank. When a de novo bank achieves certain developmental milestones (age, cumulative profitability, return on equity or other measures), Capitol may offer the bank's minority shareholders an opportunity to exchange their bank shares for shares of Capitol's common stock. Capitol has made similar exchange proposals regarding the minority interests of some of its prior bank-development company subsidiaries which, after the share exchange, were merged with and into Capitol. In each instance, however, Capitol is under no obligation to offer such a share exchange and such share exchange proposals are generally subject to approval by the minority shareholders in each proposed transaction. Capitol also pursues bank-development activities through exploring acquisition opportunities.
Capitol and its subsidiaries are engaged in a single business activity--banking. Capitol's bank affiliates provide a full range of banking services to individuals, businesses and other customers located in the respective communities of the bank. Many of the banks operate from a single location and all are primarily commercially-focused (as contrasted to retail or transaction-oriented banks) on meeting the various credit and other financial needs of entrepreneurs, professionals and other businesses and individuals. A variety of deposit products are offered, including checking, savings, money market, certificates of deposit and individual retirement accounts. In addition, wealth management, trust and investment services are offered through a wealth management subsidiary. The principal markets for the banks' financial services are the communities in which the banks are located and the areas immediately surrounding those communities. The majority of Capitol's banks are state-chartered institutions and, commencing in 2007, some have been chartered as federal savings banks. In addition to banking units, mortgage banking activities are offered through Amera Mortgage Corporation, a less than 50%-owned affiliate, which is accounted for under the equity method.
Each bank is viewed by management as being a separately identifiable business or segment from the perspective of monitoring performance and allocation of financial resources. Although the banks operate independently and are managed and monitored separately, each bank is substantially similar in terms of business focus, type of customers, products, services and economic characteristics. Further, each of the banks and the Corporation are subject to substantially similar laws and regulations unique to the financial institution industry. Accordingly, the Corporation's consolidated financial statements reflect the presentation of segment information on an aggregated basis.
NOTES TO CONSOLIDATED FINANCIAL STATEMENTS
Capitol Bancorp Limited
NOTE A—NATURE OF OPERATIONS, BASIS OF PRESENTATION AND
PRINCIPLES OF CONSOLIDATION—Continued
The consolidated financial statements include the accounts of the Corporation and its majority-owned and/or controlled subsidiaries, after elimination of intercompany accounts and transactions, and after giving effect to applicable minority interests. Banks formed or acquired during 2006, 2007 and 2008 are included in the consolidated financial statements for periods after joining the consolidated group. Certain 2007 and 2006 amounts have been reclassified to conform to the 2008 presentation.
NOTE B—SIGNIFICANT ACCOUNTING POLICIES
Estimates: The preparation of consolidated financial statements in conformity with generally accepted accounting principles in the United States of America requires management to make certain estimates and assumptions that affect the reported amounts of assets and liabilities at the date of the consolidated financial statements and the reported amounts of revenues and expenses during the reporting period. Actual results will differ from those estimates because of the inherent subjectivity and inaccuracy of any estimation.
Cash and Cash Equivalents: Cash and cash equivalents include cash on hand, amounts due from banks (interest-bearing and noninterest-bearing), money-market funds and federal funds sold. Generally, federal funds transactions are entered into for a one-day period.
Loans Held For Sale: Loans held for sale represent residential real estate mortgage loans held for sale into the secondary market. Loans held for sale are stated at the aggregate lower of cost or market. Fees from the origination of loans held for sale are recognized in the period the loans are originated.
Investment Securities: Investment securities available for sale (generally most debt investment securities of Capitol's banks) are carried at fair value with unrealized gains and losses reported as a separate component of stockholders' equity, net of tax effect (accumulated other comprehensive income). All other investment securities are classified as held for long-term investment and are carried at amortized cost which approximates fair value (see Note C).
Investments are classified at the date of purchase based on management's analysis of liquidity and other factors. The adjusted cost of the specific securities sold is used to compute realized gains or losses. Premiums and discounts are recognized in interest income using the interest method over the period to maturity.
Loans, Credit Risk and Allowance for Loan Losses: Portfolio loans are carried at their principal balance based on management's intent and ability to hold such loans for the foreseeable future until maturity or repayment.
NOTES TO CONSOLIDATED FINANCIAL STATEMENTS
Capitol Bancorp Limited
NOTE B—SIGNIFICANT ACCOUNTING POLICIES—Continued
Credit risk arises from making loans and loan commitments in the ordinary course of business. Substantially all portfolio loans are made to borrowers in the banks' geographic areas. Consistent with the banks' emphasis on business lending, there are concentrations of credit in loans secured by commercial real estate and less significant concentrations exist in loans secured by equipment and other business assets. The maximum potential credit risk to Capitol, without regard to underlying collateral and guarantees, is the total of loans and loan commitments outstanding. Management reduces Capitol's exposure to losses from credit risk by requiring collateral and/or guarantees for loans granted and by monitoring concentrations of credit, in addition to recording provisions for loan losses and maintaining an allowance for loan losses.
The allowance for loan losses is maintained at a level believed adequate by management to absorb estimated losses inherent in the portfolio at the balance sheet date. Management's determination of the adequacy of the allowance is an estimate based on evaluation of the portfolio (including potential impairment of individual loans and concentrations of credit), past loss experience, current economic conditions, volume, amount and composition of the loan portfolio, loan commitments outstanding and other factors. The allowance is increased by provisions charged to operations and reduced by net charge-offs.
Capitol has stand-by letters of credit outstanding that, when issued, commit the banks to make payments on behalf of customers if certain specified future events occur, generally being non-payment by the customer. These obligations generally expire within one year and require collateral and/or personal guarantees based on management's credit assessment. The maximum credit risk associated with these instruments equals their contractual amounts, assuming that the counterparty defaults and the collateral proves to be worthless. The total contractual amounts do not necessarily represent future cash requirements since many of these guarantees may expire without being drawn upon. Capitol records a liability, generally equal to the fees received, for these stand-by letters of credit.
Credit risk also arises from amounts of funds on deposit at other financial institutions (i.e., due from banks) to the extent balances exceed the limits of federal deposit insurance. Capitol monitors the financial position of such financial institutions to evaluate credit risk periodically.
Transfers of Financial Assets: Transfers of financial assets are accounted for as sales when control over the transferred asset has been surrendered. Control over transferred assets is deemed to be surrendered when (1) the assets have been isolated from the bank, (2) the transferee obtains the right (free of conditions that constrain it from taking advantage of that right) to pledge or exchange the transferred assets and (3) the bank does not maintain effective control over the transferred asset through an agreement to repurchase it before its maturity. Transfers of financial assets are generally limited to commercial loan participations sold, which were insignificant for the periods presented, and the sale of
NOTES TO CONSOLIDATED FINANCIAL STATEMENTS
Capitol Bancorp Limited
NOTE B—SIGNIFICANT ACCOUNTING POLICIES—Continued
residential mortgage loans into the secondary market, the extent of which is disclosed in the consolidated statements of cash flows.
Interest and Fees on Loans: Interest income on loans is recognized based upon the principal balance of loans outstanding. Direct costs of successful origination of portfolio loans generally exceed fees from loan originations (net deferred costs approximated $15.5 million and $13.9 million at December 31, 2008 and 2007, respectively).
The accrual of interest is generally discontinued when a loan becomes 90 days past due as to interest. When interest accruals are discontinued, interest previously accrued (but unpaid) is reversed. Management may elect to continue the accrual of interest when the estimated net realizable value of collateral is sufficient to cover the principal balance and accrued interest and the loan is in process of collection.
Premises and Equipment: Premises and equipment are stated on the basis of cost. Depreciation, which relates primarily to equipment, furniture and software with estimated useful lives of approximately three to seven years, is computed principally by the straight-line method. Buildings are generally depreciated on a straight-line basis with estimated useful lives of approximately 40 years. Leasehold improvements are generally depreciated over the shorter of the respective lease term or estimated useful life.
Goodwill: Goodwill is reviewed annually by management for impairment by comparing estimated entity fair value to net assets of the entity. This review is performed at the applicable subsidiary reporting-unit level which has recorded goodwill resulting from specific share-exchange transactions or acquisitions. Impairment adjustments of goodwill (none through December 31, 2008) are charged against earnings, when determined. Other intangibles ($1.7 million at December 31, 2008), which generally consist of acquired customer lists and core deposit intangibles, are amortized over varying periods of 7 years or less.
Other Real Estate: Other real estate is comprised of properties acquired through a foreclosure proceeding or acceptance of a deed in lieu of foreclosure. These properties held for sale are carried at estimated fair value (net of estimated selling cost) at the date acquired and are periodically reviewed for subsequent changes in fair value.
Stock-Based Compensation: Stock options state a specific exercise price and expiration date and may be exercised by the optionee upon payment of the exercise price and related taxes due from the optionee; the Corporation, in its discretion, may permit cashless exercises of stock options. Generally, previously unissued shares of common stock are issued upon exercise of stock options. Compensation expense for awards of stock options is recognized ratably over the vesting period of the award based on the fair value of the option, computed using the Black-Scholes valuation model. Compensation expense for awards of restricted
NOTES TO CONSOLIDATED FINANCIAL STATEMENTS
Capitol Bancorp Limited
NOTE B—SIGNIFICANT ACCOUNTING POLICIES—Continued
stock is recognized ratably over the vesting periods of such awards (generally ranging from four years to fifteen years), based on the fair value of the common stock on the date of grant.
Stock price volatility used in the valuation model is based on historical volatility. The risk-free interest rate was based on the yield of U.S. government securities with a maturity date that coincides with the expected option life. The expected option life was estimated based on past exercise behavior of optionees and the related option term.
Trust Assets and Related Income: Customer property, other than funds on deposit, held in a fiduciary or agency capacity by Capitol's banks is not included in the consolidated balance sheet because it is not an asset of the banks or Capitol. Trust and wealth management revenue are recorded on the accrual method.
Federal Income Taxes: Capitol and subsidiaries owned 80% or more by Capitol file a consolidated federal income tax return. Deferred federal income taxes are recognized for the tax consequences of temporary differences by applying enacted tax rates applicable to future years to differences between the financial statement carrying amounts and the tax bases of existing assets and liabilities. If it is determined that realization of deferred tax assets is in doubt, a valuation allowance is required to reduce deferred tax assets to the amount which is more-likely-than-not realizable. The effect on deferred income taxes of a change in tax laws or rates is recognized in income in the period that includes the enactment date.
Net Income (Loss) Per Share: Basic net income (loss) per share is computed by dividing net income (loss) by the weighted-average number of common shares outstanding, exclusive of unvested restricted shares outstanding. Diluted net income (loss) per share is based on the weighted-average number of common shares outstanding, plus common share equivalents calculated for stock options and restricted common stock outstanding using the treasury stock method.
Comprehensive Income (Loss): Comprehensive income (loss) is the sum of net income (loss) and certain other items which are charged or credited to stockholders' equity. For the periods presented, Capitol's only element of comprehensive income (loss) other than net income (loss) was the net change in the fair value adjustment for investment securities available for sale. Accordingly, the elements and total of comprehensive income (loss) are shown within the statement of changes in stockholders' equity presented herein.
New Accounting Standards: In September 2006, the Financial Accounting Standards Board (FASB) issued Statement No. 157, Fair Value Measurements, which provides a definition of fair value for accounting purposes, establishes a framework for measuring fair value and expands related financial statement disclosures. Statement No. 157 does not require any new
NOTES TO CONSOLIDATED FINANCIAL STATEMENTS
Capitol Bancorp Limited
NOTE B—SIGNIFICANT ACCOUNTING POLICIES—Continued
fair value measurements and was initially effective for the Corporation beginning January 1, 2008. In February 2008, the FASB issued FASB Staff Position (FSP) FAS 157-2 which defers the effective date of SFAS No. 157 until January 1, 2009 for nonfinancial assets and nonfinancial liabilities except those items recognized or disclosed at fair value on an annual or on a more frequently recurring basis. The partial implementation of Statement No. 157 in 2008 (as permitted by FSP FAS 157-2) did not have a material effect on the Corporation's results of operations or financial position. Fair value disclosures are set forth in Note N to the consolidated financial statements.
In February 2007, the FASB issued Statement No. 159, The Fair Value Option for Financial Assets and Financial Liabilities, which permits entities to choose to measure, on an item-by-item basis, specified financial instruments and certain other items at fair value. Unrealized gains and losses on items for which the fair value option has been elected are required to be reported in earnings at each reporting date. Statement No. 159 was applied prospectively and implemented by Capitol effective January 1, 2008. As of December 31, 2008, Capitol has not elected the fair value option.
In June 2007, the FASB ratified an Emerging Issues Task Force (EITF) consensus regarding Accounting for Income Tax Benefits of Dividends on Share-Based Payment Awards, which became effective for Capitol January 1, 2008. This new guidance did not have a material effect on Capitol's consolidated financial statements upon implementation.
In December 2007, the FASB issued Statement No. 141(R), Business Combinations, to further enhance the accounting and financial reporting related to business combinations. Statement No. 141(R) establishes principles and requirements for how the acquirer in a business combination (1) recognizes and measures in its financial statements the identifiable assets acquired, the liabilities assumed and any noncontrolling interest in the acquiree, (2) recognizes and measures goodwill acquired in the business combination or a gain from a bargain purchase, (3) requires that acquisition-related and restructuring costs be recognized separately from the acquisition, generally charged to expense when incurred and (4) determines information to disclose to enable users of the financial statements to evaluate the nature and financial effects of the business combination. Statement No. 141(R) applies prospectively to business combinations for which the acquisition date is on or after January 1, 2009. The effects of the Corporation's adoption of Statement No. 141(R) will depend upon the extent and magnitude of acquisitions after December 31, 2008.
Also in December 2007, the FASB issued Statement No. 160, Noncontrolling Interests in Consolidated Financial Statements – an amendment of ARB No. 51, to create accounting and reporting standards for the noncontrolling interest in a subsidiary and for the deconsolidation of a subsidiary. Statement No. 160 establishes accounting and reporting standards that require (1) the ownership interest in subsidiaries held by parties other than the parent to be clearly
NOTES TO CONSOLIDATED FINANCIAL STATEMENTS
Capitol Bancorp Limited
NOTE B—SIGNIFICANT ACCOUNTING POLICIES—Continued
identified and presented in the consolidated balance sheet within equity, but separate from the parent's equity, (2) the amount of consolidated net income attributable to the parent and the noncontrolling interest to be clearly identified and presented on the face of the consolidated statement of income, (3) changes in a parent's ownership interest while the parent retains its controlling financial interest in its subsidiary to be accounted for consistently, (4) when a subsidiary is deconsolidated, any retained noncontrolling equity investment in the former subsidiary to be initially measured at fair value and (5) entities provide sufficient disclosures that clearly identify and distinguish between the interests of the parent and the interests of the noncontrolling owners. Statement No. 160 applies to years beginning on or after December 15, 2008. This new guidance will result in reclassification of minority interests in consolidated subsidiaries on Capitol's consolidated balance sheet to the equity section and will eliminate the recording of goodwill in future share-exchange transactions involving noncontrolling interests of subsidiaries, in addition to other changes in presentation in the statement of results of operations, upon implementation in 2009.
In December 2008, the FASB issued FSP FAS 140-4 and FIN 46(R)-8, Disclosures by Public Entities about Transfers of Financial Assets and Variable Interest Entities. This new guidance expands on disclosures regarding financial assets transferred in a securitization or asset-backed financing arrangement, servicing assets and information about variable-interest entities and became effective for Capitol on December 31, 2008. The new disclosure requirements had no material effect on Capitol's consolidated financial statements, inasmuch as Capitol has not engaged in securitizations or asset-backed financing arrangements, does not have significant servicing assets and has no investments in variable-interest entities.
In February 2008, the FASB issued FSB FAS 140-3, Accounting for Transfers of Financial Assets and Repurchase Financing Transactions. The new guidance clarifies transfers and certain transactions' accounting subject to the provisions of FAS 140 and becomes effective January 1, 2009. Management does not expect this new guidance to have a material impact on Capitol's financial position or results of operations upon implementation.
Also recently, the FASB has issued several proposals to amend, supersede or interpret existing accounting standards which may impact Capitol's financial statements at a later date:
· | Proposed amendment to Statement No. 128, Earnings per Share; and |
· | FASB FSP to require recalculation of leveraged leases if the timing of tax benefits affect cash flows. |
Capitol's management has not completed its analysis of this new guidance (as proposed, where applicable) although it anticipates the potential impact (if finalized, where applicable) would not be material to Capitol's consolidated financial statements.
NOTES TO CONSOLIDATED FINANCIAL STATEMENTS
Capitol Bancorp Limited
NOTE B—SIGNIFICANT ACCOUNTING POLICIES—Continued
A variety of proposed or otherwise potential accounting standards are currently under study by standard-setting organizations and various regulatory agencies. Because of the tentative and preliminary nature of these proposed standards, management has not determined whether implementation of such proposed standards would be material to Capitol's consolidated financial statements.
NOTE C—INVESTMENT SECURITIES
Investment securities consisted of the following at December 31 (in $1,000s):
| | | 2008 | | | 2007 |
| | | Amortized Cost | | | Estimated Fair Value | | | Amortized Cost | | | Estimated Fair Value |
| Available for sale: | | | | | | | | | | | |
| United States treasury securities | | | | | | | | $ | 499 | | | $ | 499 |
United States government agency securities | | $ | 9,785 | | | $ | 9,913 | | | | 8,991 | | | | 9,025 |
| Mortgage backed securities | | | 4,813 | | | | 4,890 | | | | 3,402 | | | | 3,368 |
| Municipals | | | 768 | | | | 781 | | | | 1,222 | | | | 1,227 |
| | | | 15,366 | | | | 15,584 | | | | 14,114 | | | | 14,119 |
| Held for long-term investment: | | | | | | | | | | | | | | | |
| Federal Reserve Bank stock | | | 146 | | | | 146 | | | | 563 | | | | 563 |
| Federal Home Loan Bank stock | | | 26,053 | | | | 26,053 | �� | | | 18,765 | | | | 18,765 |
| Corporate | | | 6,591 | | | | 6,591 | | | | 6,085 | | | | 6,085 |
| Other | | | 66 | | | | 66 | | | | 65 | | | | 65 |
| | | | 32,856 | | | | 32,856 | | | | 25,478 | | | | 25,478 |
| | | $ | 48,222 | | | $ | 48,440 | | | $ | 39,592 | | | $ | 39,597 |
At December 31, 2008, securities with a fair value approximating $13 million were pledged to secure public and trust deposits and for other purposes as required by law. Investments in Federal Reserve Bank stock and Federal Home Loan Bank stock are restricted and may only be resold to, or redeemed by, the issuer.
Gross unrealized gains and losses on investment securities available for sale were as follows at December 31 (in $1,000s):
| | | 2008 | | | 2007 |
| | | Gains | | | Losses | | | Gains | | | Losses |
United States government agency securities | | $ | 128 | | | $ | -- | | | $ | 38 | | | $ | 4 |
| Mortgage backed securities | | | 85 | | | | 8 | | | | 23 | | | | 57 |
| Municipals | | | 13 | | | | -- | | | | 14 | | | | 9 |
| | | $ | 226 | | | $ | 8 | | | $ | 75 | | | $ | 70 |
NOTES TO CONSOLIDATED FINANCIAL STATEMENTS
Capitol Bancorp Limited
NOTE C—INVESTMENT SECURITIES—Continued
The age of gross unrealized losses and carrying value (at estimated fair value) of securities available for sale are summarized below (in $1,000s):
| | | 2008 | | | 2007 |
| | | Unrealized Loss | | | Carrying Value | | | Unrealized Loss | | | Carrying Value |
| One year or less: | | | | | | | | | | | |
| Mortgage backed securities | | $ | 4 | | | $ | 281 | | | $ | -- | | | $ | -- |
| | | $ | 4 | | | $ | 281 | | | $ | -- | | | $ | -- |
| | | | | | | | | | | | | | | | |
| In excess of one year: | | | | | | | | | | | | | | | |
United States government agency securities | | $ | -- | | | $ | -- | | | $ | 4 | | | $ | 1,552 |
| Mortgage backed securities | | | 4 | | | | 501 | | | | 57 | | | | 2,823 |
| Municipals | | | -- | | | | -- | | | | 9 | | | | 235 |
| | | | 4 | | | | 501 | | | | 70 | | | | 4,610 |
| | | $ | 8 | | | $ | 782 | | | $ | 70 | | | $ | 4,610 |
Management does not believe any individual unrealized loss as of December 31, 2008 represents an other-than-temporary loss (primarily due to such amounts being attributable to changes in interest rates) and has both the intent and ability to hold these securities for a time period necessary to recover the amortized cost.
Gross realized gains and losses from sales and maturities of investment securities were insignificant for each of the periods presented.
Scheduled maturities of investment securities held as of December 31, 2008 were as follows (in $1,000s):
| | | Amortized Cost | | | Estimated Fair Value |
| | | | | | |
| Due in one year or less | | $ | 4,622 | | | $ | 4,678 |
| After one year, through five years | | | 6,093 | | | | 6,169 |
| After five years, through ten years | | | 120 | | | | 126 |
| After ten years | | | 4,531 | | | | 4,611 |
Securities held for long-term investment, without standard maturities | | | 32,856 | | | | 32,856 |
| | | $ | 48,222 | | | $ | 48,440 |
NOTES TO CONSOLIDATED FINANCIAL STATEMENTS
Capitol Bancorp Limited
NOTE D—LOANS
Portfolio loans consisted of the following at December 31 (in $1,000s):
| | | 2008 | | | 2007 | |
| | | | | | | |
| Loans secured by real estate: | | | | | | |
| Commercial | | $ | 2,115,515 | | | $ | 1,917,113 | |
| Residential (including multi-family) | | | 879,754 | | | | 698,960 | |
Construction, land development and other land | | | 797,486 | | | | 852,595 | |
| Total loans secured by real estate | | | 3,792,755 | | | | 3,468,668 | |
| Commercial and other business-purpose loans | | | 845,593 | | | | 768,473 | |
| Consumer | | | 61,340 | | | | 48,041 | |
| Other | | | 35,541 | | | | 29,519 | |
| Total portfolio loans | | | 4,735,229 | | | | 4,314,701 | |
| Less allowance for loan losses | | | (93,040 | ) | | | (58,124 | ) |
| Net portfolio loans | | $ | 4,642,189 | | | $ | 4,256,577 | |
Loans serviced for the benefit of others, which are not recorded on the consolidated balance sheet, approximated $104 million and $90 million at December 31, 2008 and 2007, respectively. Loan servicing assets are not material.
Transactions in the allowance for loan losses are summarized below (in $1,000s):
| | | 2008 | | | 2007 | | | 2006 | |
| | | | | | | | | | |
| Balance at January 1 | | $ | 58,124 | | | $ | 45,414 | | | $ | 40,559 | |
| Provision charged to operations | | | 82,492 | | | | 25,340 | | | | 12,156 | |
| Net charge-offs: | | | | | | | | | | | | |
| Loans charged off (deduction) | | | (50,447 | ) | | | (14,219 | ) | | | (8,699 | ) |
| Recoveries | | | 2,871 | | | | 1,589 | | | | 1,398 | |
| Net charge-offs | | | (47,576 | ) | | | (12,630 | ) | | | (7,301 | ) |
| Balance at December 31 | | $ | 93,040 | | | $ | 58,124 | | | $ | 45,414 | |
[The remainder of this page intentionally left blank]
NOTES TO CONSOLIDATED FINANCIAL STATEMENTS
Capitol Bancorp Limited
NOTE D—LOANS—Continued
Nonperforming loans (i.e., loans which are 90 days or more past due and loans on nonaccrual status) are summarized below (in $1,000s):
| | | December 31 |
| | | 2008 | | | 2007 |
| Nonaccrual loans: | | | | | |
| Loans secured by real estate: | | | | | |
| Commercial | | $ | 39,892 | | | $ | 19,016 |
| Residential (including multi-family) | | | 35,675 | | | | 13,381 |
| Construction, land development and other land | | | 72,996 | | | | 29,756 |
| Total loans secured by real estate | | | 148,563 | | | | 62,153 |
| Commercial and other business-purpose loans | | | 16,283 | | | | 5,782 |
| Consumer | | | 190 | | | | 66 |
| Other | | | -- | | | | 84 |
| Total nonaccrual loans | | | 165,036 | | | | 68,085 |
| | | | | | | | |
Past due (>90 days) loans and accruing interest: | | | | | | | |
| Loans secured by real estate: | | | | | | | |
| Commercial | | | 1,623 | | | | 113 |
| Residential (including multi-family) | | | 365 | | | | 1,116 |
| Construction, land development and other land | | | 2,293 | | | | 2,531 |
| Total loans secured by real estate | | | 4,281 | | | | 3,760 |
| Commercial and other business-purpose loans | | | 747 | | | | 714 |
| Consumer | | | 146 | | | | 66 |
| Other | | | -- | | | | 5 |
| Total past due loans | | | 5,174 | | | | 4,545 |
| | | | | | | | |
| Total nonperforming loans | | $ | 170,210 | | | $ | 72,630 |
If nonperforming loans had performed in accordance with their contractual terms during the year, additional interest income of $11.4 million, $4.8 million and $2.3 million would have been recorded in 2008, 2007 and 2006, respectively. Interest income recognized on loans in nonaccrual status in 2008, 2007 and 2006 operations approximated $479,000, $1,876,000 and $888,000, respectively. At December 31, 2008, there were no material amounts of loans which were restructured or otherwise renegotiated as a concession to troubled borrowers.
NOTES TO CONSOLIDATED FINANCIAL STATEMENTS
Capitol Bancorp Limited
NOTE D—LOANS—Continued
Loans are considered impaired when it is probable that all amounts due according to the contractual terms of a loan agreement will not be collected, including contractually scheduled interest and principal payments. Impaired loans, which are included in nonperforming loans, are summarized below (in $1,000s):
| | | December 31 |
| | | 2008 | | | 2007 |
| | | | | | |
| Impaired loans: | | | | | |
| Loans which have an allowance requirement | | $ | 82,387 | | | $ | 52,275 |
Loans which do not have an allowance requirement | | | 82,649 | | | | 15,810 |
| Total impaired loans | | $ | 165,036 | | | $ | 68,085 |
| | | | | | | | |
Allowance for loan losses related to impaired loans | | $ | 16,769 | | | $ | 7,281 |
Impaired loans which do not have an allowance requirement include collateral-dependent loans for which direct write-downs have been made and, accordingly, no allowance requirement or allocation is necessary. During 2008, the average recorded investment in impaired loans approximated $105.9 million. Interest income is recorded on impaired loans if not on nonaccrual status, or may be recorded on a cash basis in some circumstances, if such payments are not credited to principal. In 2008, interest income recorded on impaired loans approximated $479,000.
The amounts of the allowance for loan losses allocated in the following table (in $1,000s) are based on management's estimate of losses inherent in the portfolio at the balance sheet date, and should not be interpreted as an indication of future charge-offs:
| | | December 31, 2008 | | | December 31, 2007 | |
| | | Amount | | | Percentage of Total Portfolio Loans | | | Amount | | | Percentage of Total Portfolio Loans | |
| |
| |
| |
| | | | | | | | | | | | | |
| Loans secured by real estate: | | | | | | | | | | | | |
| Commercial | | $ | 30,007 | | | | 0.63 | % | | $ | 21,918 | | | | 0.51 | % |
| Residential (including multi-family) | | | 21,645 | | | | 0.46 | | | | 10,235 | | | | 0.24 | |
Construction, land development and other land | | | 17,496 | | | | 0.37 | | | | 11,278 | | | | 0.26 | |
| Total loans secured by real estate | | | 69,148 | | | | 1.46 | | | | 43,431 | | | | 1.01 | |
Commercial and other business-purpose loans | | | 22,547 | | | | 0.47 | | | | 13,727 | | | | 0.32 | |
| Consumer | | | 1,032 | | | | 0.02 | | | | 667 | | | | 0.01 | |
| Other | | | 313 | | | | 0.01 | | | | 299 | | | | 0.01 | |
| Total allowance for loan losses | | $ | 93,040 | | | | 1.96 | % | | $ | 58,124 | | | | 1.35 | % |
NOTES TO CONSOLIDATED FINANCIAL STATEMENTS
Capitol Bancorp Limited
NOTE E—RELATED PARTY TRANSACTIONS
In the ordinary course of business, Capitol's banking subsidiaries make loans to officers and directors of Capitol and its subsidiaries, including their immediate families and companies in which they are principal owners. At December 31, 2008 and 2007, total loans to these persons were $167 million and $184 million, respectively. During 2008, $100 million of new loans were made to these persons and repayments totaled $117 million. Such loans are made at the banking subsidiaries' normal credit terms.
Officers and directors of Capitol (and their associates, family and/or affiliates) are also depositors of the banking subsidiaries. Such deposits, which approximated $223 million and $210 million at December 31, 2008 and 2007, respectively, are accepted based upon the banks' normal terms as to interest rate, term and deposit insurance.
NOTE F—PREMISES AND EQUIPMENT
Major classes of premises and equipment consisted of the following at December 31 (in $1,000s):
| | | 2008 | | | 2007 | |
| | | | | | | |
| Land, buildings and improvements | | $ | 21,047 | | | $ | 20,064 | |
| Leasehold improvements | | | 27,862 | | | | 25,257 | |
| Equipment, furniture and software | | | 57,587 | | | | 52,639 | |
| | | | 106,496 | | | | 97,960 | |
| Less accumulated depreciation | | | (47,247 | ) | | | (37,929 | ) |
| | | $ | 59,249 | | | $ | 60,031 | |
Capitol and certain subsidiaries rent office space and equipment under operating leases. Rent expense (net of sublease income) under these lease agreements approximated $11.6 million, $9.2 million and $7.6 million in 2008, 2007 and 2006, respectively (including rent expense approximating $1.7 million, $1.6 million and $1.5 million, respectively, under leases with related parties).
At December 31, 2008, future minimum rental payments under operating leases that have initial or remaining noncancelable lease terms in excess of one year were as follows (in $1,000s):
| 2009 | | $ | 11,481 |
| 2010 | | | 10,443 |
| 2011 | | | 10,291 |
| 2012 | | | 9,226 |
| 2013 | | | 6,887 |
| 2014 and thereafter | | | 22,017 |
| | | $ | 70,345 |
NOTES TO CONSOLIDATED FINANCIAL STATEMENTS
Capitol Bancorp Limited
NOTE G—DEPOSITS
The aggregate amount of time deposits of $100,000 or more approximated $1.4 billion and $1.1 billion as of December 31, 2008 and 2007, respectively.
At December 31, 2008, the scheduled maturities of time deposits were as follows (in $1,000s):
| 2009 | | $ | 2,153,763 |
| 2010 | | | 288,834 |
| 2011 | | | 77,597 |
| 2012 | | | 26,042 |
| 2013 | | | 14,637 |
| 2014 and thereafter | | | 4,783 |
| | | $ | 2,565,656 |
Interest paid approximates amounts charged to operations on an accrual basis for the periods presented.
NOTE H—NOTES PAYABLE AND SHORT-TERM BORROWINGS
Notes payable and short-term borrowings consisted of the following at December 31 (in $1,000s):
| | | 2008 | | | 2007 |
Borrowings from Federal Home Loan Banks | | $ | 429,889 | | | $ | 298,744 |
| Promissory notes | | | 14,011 | | | | |
| Federal funds purchased | | | 2,000 | | | | 20,850 |
| Repurchase agreements | | | 1,025 | | | | 790 |
| | | $ | 446,925 | | | $ | 320,384 |
Borrowings from Federal Home Loan Banks (FHLB) represent advances secured by certain portfolio residential real estate mortgage loans and other eligible collateral. Such advances become due at varying dates and bear interest at market short-term rates (approximately 3.14% at December 31, 2008). At December 31, 2008, unused lines of credit under these facilities approximated $213 million. Assets pledged to secure these credit facilities approximated $642 million at December 31, 2008.
During 2008, Capitol completed a private offering of 9% promissory notes (series A). The promissory notes were purchased by accredited investors, including certain related parties of Capitol. The promissory notes mature in 2013. Interest is payable quarterly and the promissory notes become callable in 2010.
For the periods presented, interest paid on debt obligations approximated amounts charged to expense.
NOTES TO CONSOLIDATED FINANCIAL STATEMENTS
Capitol Bancorp Limited
NOTE H—NOTES PAYABLE AND SHORT-TERM BORROWINGS—Continued
At December 31, 2008, scheduled debt maturities of notes payable and short-term borrowings were as follows (in $1,000s):
| 2009 | | $ | 263,613 |
| 2010 | | | 139,857 |
| 2011 | | | 24,123 |
| 2012 | | | 6,489 |
| 2013 | | | 7,460 |
| 2014 and thereafter | | | 5,383 |
| | | $ | 446,925 |
In addition to the foregoing, Capitol has guaranteed some obligations of its subsidiaries (see Note O).
NOTE I—SUBORDINATED DEBT
Subordinated debt relates to trust-preferred securities issued by Capitol which are summarized as follows:
| | Interest Rate at | | | | Aggregate Liquidation | | | Net Carrying Amount at December 31 |
| | December 31, | | Scheduled | | Amount | | | (in $1,000s) |
| | 2008 | | Maturity | | (in $1,000s) | | | 2008 | | | 2007 |
| | | | | | | | | | | | |
| Capitol Trust I | 8.50% fixed | | 2027 | | $ | 25,300 | | | $ | 24,615 | | | $ | 24,579 |
| Capitol Trust II | 10.25% fixed | | 2031 | | | 10,000 | | | | 9,773 | | | | 9,763 |
| Capitol Statutory Trust III | 7.00% variable | | 2031 | | | 15,000 | | | | 14,660 | | | | 14,645 |
| Capitol Trust IV | 4.74% variable | | 2032 | | | 3,000 | | | | 2,921 | | | | 2,918 |
| Capitol Trust VI | 8.12% variable | | 2033 | | | 10,000 | | | | 9,758 | | | | 9,748 |
| Capitol Trust VII | 7.78% fixed | | 2033 | | | 10,000 | | | | 9,876 | | | | 9,871 |
| Capitol Statutory Trust VIII | 4.82% variable | | 2033 | | | 20,000 | | | | 19,676 | | | | 19,663 |
| Capitol Trust IX | 7.69% fixed | | 2034 | | | 10,000 | | | | 9,945 | | | | 9,943 |
| Capitol Trust X | 6.55% fixed | | 2037 | | | 33,000 | | | | 33,000 | | | | 35,000 |
| Capitol Trust XI | 3.65% variable | | 2037 | | | 20,000 | | | | 20,000 | | | | 20,000 |
| Capitol Trust XII | 10.50% fixed | | 2038 | | | 14,541 | | | | 13,069 | | | | |
| | | | | | $ | 170,841 | | | $ | 167,293 | | | $ | 156,130 |
Securities of Capitol Trust I and XII were issued in public offerings in 1997 and 2008, respectively. All other Capitol Trust securities were formed in conjunction with private placements of trust-preferred securities. Each of these securities has similar terms and, subject to certain provisions, may be called by the issuer five years after issuance. The liquidation amount of these securities is guaranteed by Capitol.
NOTES TO CONSOLIDATED FINANCIAL STATEMENTS
Capitol Bancorp Limited
NOTE I—SUBORDINATED DEBT—Continued
Interest paid to the trusts by Capitol (which is recorded as interest expense in its consolidated financial statements) is distributed by the trusts to the holders of the trust-preferred securities. Under certain conditions, Capitol may defer payment of interest on the subordinated debentures for periods of up to five years. The documents governing the trusts restrict Capitol's right to pay a dividend on its common stock under certain circumstances and give holders of the securities preference on liquidation over the holders of Capitol's common stock. Under current regulatory guidelines, such trust-preferred securities are included as capital for purposes of meeting certain ratio requirements.
NOTE J—RESTRICTED COMMON STOCK AND STOCK OPTIONS
Shares of restricted common stock have been granted to certain officers. Compensation expense related to restricted stock approximated $1.5 million in 2008, $1.6 million in 2007 and $1.7 million in 2006. Tax benefits associated with such compensation expense approximated $436,000 in 2007 and $351,000 in 2006 (none in 2008). Future compensation expense related to unvested restricted common stock as of December 31, 2008 approximates $1.4 million (based on grants through December 31, 2008), to be recorded ratably over a period of approximately 4.4 years, based on the weighted-average remaining vesting period at that date.
Restricted share activity is summarized below:
| | | 2008 | | | 2007 | | | 2006 |
| | | Restricted Shares | | | Weighted- Average Grant Date Fair Value | | | Restricted Shares | | | Weighted- Average Grant Date Fair Value | | | Restricted Shares | | | Weighted- Average Grant Date Fair Value |
| | | | | | | | | | | | | | | | | | |
| Unvested at January 1 | | | 207,422 | | | $ | 27.80 | | | | 224,416 | | | $ | 27.72 | | | | 200,631 | | | $ | 21.76 |
| Granted | | | 31,790 | | | | 16.17 | | | | 43,972 | | | | 21.55 | | | | 80,750 | | | | 38.69 |
| Vested | | | (47,000 | ) | | | 21.23 | | | | (58,966 | ) | | | 22.28 | | | | (56,965 | ) | | | 22.27 |
| Forfeited | | | (55,722 | ) | | | 22.41 | | | | (2,000 | ) | | | 44.56 | | | | -- | | | | -- |
| Unvested at December 31 | | | 136,490 | | | $ | 29.55 | | | | 207,422 | | | $ | 27.80 | | | | 224,416 | | | $ | 27.72 |
NOTES TO CONSOLIDATED FINANCIAL STATEMENTS
Capitol Bancorp Limited
NOTE J—RESTRICTED COMMON STOCK AND STOCK OPTIONS—Continued
Stock options have been granted to certain officers and directors which provide for the purchase of shares of common stock. Generally, stock options are granted at an exercise price equal to the fair value of common stock on the grant date. All such stock options expire at varying periods up to seven years after the date granted. Stock option activity is summarized as follows:
| | | Number of Stock Options Outstanding | | | Exercise Price Range | | | Weighted Average Exercise Price |
| | | | | | | | | | | | | |
| Outstanding at January 1, 2006 | | | 2,882,283 | | | $ | 10.81 | | to | | $ | 37.48 | | | $ | 26.07 |
| Granted in 2006 | | | -- | | | | | | | | | | | | | |
| Exercised in 2006 | | | (312,192 | ) | | | 10.81 | | to | | | 37.48 | | | | 19.59 |
| Cancelled or expired in 2006 | | | -- | | | | | | | | | | | | |
| Outstanding at December 31, 2006 | | | 2,570,091 | | | | 10.81 | | to | | | 37.48 | | | | 26.86 |
| | | | | | | | | | | | | | | | | |
| Granted in 2007 | | | 168,720 | | | | 22.46 | | to | | | 46.20 | | | | 25.09 |
| Exercised in 2007 | | | (277,149 | ) | | | 10.81 | | to | | | 33.01 | | | | 16.98 |
| Cancelled or expired in 2007 | | | (1,580 | ) | | | | | | | | | | | |
| Outstanding at December 31, 2007 | | | 2,460,082 | | | | 13.50 | | to | | | 46.20 | | | | 27.85 |
| | | | | | | | | | | | | | | | | |
| Granted in 2008 | | | 52,360 | | | | 20.12 | | to | | | 20.12 | | | | 20.12 |
| Exercised in 2008 | | | (108,935 | ) | | | 15.52 | | to | | | 20.90 | | | | 17.90 |
| Cancelled or expired in 2008 | | | (29,348 | ) | | | | | | | | | | | |
| Outstanding at December 31, 2008 | | | 2,374,159 | | | $ | 13.50 | | to | | $ | 46.20 | | | $ | 28.28 |
The aggregate intrinsic value of exercised stock options approximated $1.9 million, $4.7 million and $8.3 million in 2008, 2007 and 2006, respectively.
Stock options with an aggregate fair value of $255,000 and $1,102,000 were granted in 2008 and 2007, respectively. Fair value was computed using the Black-Scholes valuation model. Fair value assumptions included the following:
| | | 2008 | | 2007 |
| | | | | |
| Risk-free interest rate | | 3.8% | | 4.6% |
| Stock price volatility | | 0.36 | | 0.37 |
| Dividend yield | | 5.0% | | 4.5% |
| Expected option life | | 7 years | | 7 years |
Compensation expense related to such stock options approximated $693,000 in 2008 and $410,000 in 2007 and associated tax benefits approximated $243,000 in 2008 and $144,000 in 2007. Future compensation expense relating to stock options as of December 31, 2008 approximates $254,000 (based on grants subject to FASB Statement 123(R) through December 31, 2008) and will be recorded ratably over a period of 1.6 years, based on the weighted-average remaining vesting period at that date.
NOTES TO CONSOLIDATED FINANCIAL STATEMENTS
Capitol Bancorp Limited
NOTE J—RESTRICTED COMMON STOCK AND STOCK OPTIONS—Continued
As of December 31, 2008, substantially all outstanding stock options were vested, currently exercisable and had a weighted average remaining contractual life of 2.6 years (excluding certain stock options granted in 2008 which are not vested and are not currently exercisable). The following table summarizes stock options outstanding segregated by exercise price range:
| | | | | | | Weighted Average |
Exercise Price Range | | | Number Outstanding | | | Exercise Price | | | Remaining Contractual Life |
| | | | | | | | | | |
| $ | 10.00 to 14.99 | | | | 2,866 | | | $ | 13.50 | | | -- |
| $ | 15.00 to 19.99 | | | | 138,300 | | | | 16.67 | | | 1.70 years |
| $ | 20.00 to 24.99 | | | | 584,956 | | | | 21.67 | | | 2.79 years |
| $ | 25.00 to 29.99 | | | | 585,415 | | | | 27.09 | | | 1.65 years |
| $ | 30.00 to 34.99 | | | | 695,115 | | | | 32.10 | | | 2.69 years |
| $ | 35.00 or more | | | | 367,507 | | | | 37.92 | | | 3.92 years |
| | | | | | 2,374,159 | | | | | | | |
Cash received from optionees upon exercise of stock options approximated $44,000, $3.7 million and $5.1 million and tax benefits realized approximated $24,000, $1.3 million and $2.1 million in 2008, 2007 and 2006, respectively.
NOTE K—EMPLOYEE RETIREMENT PLANS
Capitol has a contributory employee retirement savings 401(k) plan which covers substantially all full-time employees of Capitol and certain subsidiaries over age 21. The Plan provides for employer contributions in amounts determined annually by Capitol's board of directors. Eligible employees make voluntary contributions to the Plan. Employer contributions to the Plan, a partial match based on employee contributions (50%, subject to certain limitations), charged to expense for the years ended December 31, 2008, 2007 and 2006 were $2.4 million, $2.2 million and $1.5 million, respectively.
Capitol also has a defined contribution employee stock ownership plan (ESOP) which covers substantially all employees of Capitol and certain subsidiaries. ESOP contributions charged to expense in 2007 and 2006 approximated $1,324,000 and $1,134,000, respectively (none in 2008). As of December 31, 2008, the ESOP held approximately 343,000 shares of Capitol's common stock which have been allocated to participants' accounts; there were no unallocated shares as of that date.
NOTES TO CONSOLIDATED FINANCIAL STATEMENTS
Capitol Bancorp Limited
NOTE L—INCOME TAXES
Income taxes include the following components (in $1,000s):
| | | 2008 | | | 2007 | | | 2006 | |
| Federal: | | | | | | | | | |
| Current expense (benefit) | | $ | (823 | ) | | $ | 13,003 | | | $ | 21,367 | |
| Deferred (benefit) | | | (26,029 | ) | | | (10,397 | ) | | | (5,493 | ) |
| | | | (26,852 | ) | | | 2,606 | | | | 15,874 | |
| State income taxes (benefit) | | | (3,296 | ) | | | 218 | | | | (411 | ) |
| | | | | | | | | | | | | |
| Total income tax expense (benefit) | | $ | (30,148 | ) | | $ | 2,824 | | | $ | 15,463 | |
In addition to state income taxes, certain states in which the banks operate impose taxes based on measures other than income. Tax expense incurred associated with those jurisdictions approximated $585,000 in 2008 ($1.5 million in 2007 and $1.2 million in 2006) and is excluded from income tax expense (included as a component of other noninterest expense).
Federal income taxes paid in 2008, 2007 and 2006 approximated $7.3 million, $10.1 million and $20.9 million, respectively. State income taxes approximating $248,000 were paid in 2008 and $521,000 was received in refunds for a net refund of $273,000 ($735,000 was paid in 2007 and $1.8 million was paid in 2006). Federal income taxes payable at December 31, 2007 were reduced by tax benefits approximating $1.9 million arising from the exercise of stock options (no material benefit in 2008).
Differences between income tax expense recorded and amounts computed using the statutory tax rate are reconciled below (in $1,000s):
| | | 2008 | | | 2007 | | | 2006 | |
| Federal income tax expense (benefit) | | | | | | | | | |
| computed at statutory rate of 35% | | $ | (28,910 | ) | | $ | 2,155 | | | $ | 15,869 | |
| State income taxes (benefit) | | | (3,296 | ) | | | 218 | | | | (411 | ) |
| Federal tax effect of: | | | | | | | | | | | | |
| Amortization of intangibles | | | 19 | | | | 54 | | | | 205 | |
| State income taxes | | | 1,154 | | | | (76 | ) | | | 144 | |
| Other | | | 885 | | | | 473 | | | | (344 | ) |
| | | | | | | | | | | | | |
| Total income tax expense (benefit) | | $ | (30,148 | ) | | $ | 2,824 | | | $ | 15,463 | |
NOTES TO CONSOLIDATED FINANCIAL STATEMENTS
Capitol Bancorp Limited
NOTE L—INCOME TAXES—Continued
Net deferred income tax assets, which are a component of other assets, consisted of the following at December 31 (in $1,000s):
| | | 2008 | | | 2007 | |
| | | | | | | |
| Allowance for loan losses | | $ | 32,573 | | | $ | 20,134 | |
| Net operating losses of subsidiaries | | | 24,936 | | | | 14,247 | |
| Deferred compensation | | | 3,255 | | | | 2,890 | |
| Depreciation | | | (3,674 | ) | | | (2,843 | ) |
Start-up costs of de novo banks | | | 4,802 | | | | 4,463 | |
Fair value adjustment for investment securities available for sale | | | (74 | ) | | | 14 | |
| Other, net | | | (565 | ) | | | (3,593 | ) |
| | | $ | 61,253 | | | $ | 35,312 | |
Certain subsidiaries (generally less than 80%-owned entities) have federal net operating loss carryforwards which may reduce federal income taxes payable in future periods, which have been recognized for financial reporting purposes and, as of December 31, 2008, expire at the following dates and amounts (in $1,000s):
| 2024 | | $ | 98 | | | | | |
| 2025 | | | 5,083 | | | | | |
| 2026 | | | 12,987 | | | | | |
| 2027 | | | 21,320 | | | | | |
| 2028 | | | 31,758 | | | | | |
| | | $ | 71,246 | | | | | |
In conjunction with its annual review, management concluded that there were no significant uncertain tax positions requiring recognition in the consolidated financial statements. The evaluation was performed for the tax years ended 2004, 2005, 2006, 2007 and 2008, which are the tax years which remain subject to examination by major tax jurisdictions and was updated as of December 31, 2008.
The Internal Revenue Service (IRS) commenced and completed an examination of the Corporation's consolidated federal income tax return for the year ended December 31, 2005 during 2007. No significant adjustments to taxable income or taxes due arose from that examination. During 2008, the IRS commenced an examination of the Corporation's consolidated federal income tax return for the year ended December 31, 2006; the examination was incomplete as of December 31, 2008.
Capitol may from time to time be assessed interest or penalties associated with tax liabilities by major tax jurisdictions, although any such assessments are estimated to be minimal and immaterial. To the extent Capitol has received an assessment for interest and/or penalties, it has been classified in the consolidated statements of income as a component of other noninterest expense.
NOTES TO CONSOLIDATED FINANCIAL STATEMENTS
Capitol Bancorp Limited
NOTE M—NET INCOME (LOSS) PER SHARE
The computations of basic and diluted net income per share were as follows (in 1,000s):
| | | 2008 | | | 2007 | | | 2006 |
| | | | | | | | | |
| Numerator—net income (loss) | | $ | (28,607 | ) | | $ | 21,937 | | | $ | 42,391 |
| | | | | | | | | | | | |
| Denominator: | | | | | | | | | | | |
Weighted average number of shares outstanding, excluding unvested restricted shares (denominator for basic earnings per share) | | | 17,147 | | | | 16,967 | | | | 15,772 |
| | | | | | | | | | | | |
| Effect of dilutive securities: | | | | | | | | | | | |
| Unvested restricted shares | | | -- | | | | 70 | | | | 86 |
| Stock options | | | -- | | | | 179 | | | | 623 |
| Potential dilution | | | -- | | | | 249 | | | | 709 |
| | | | | | | | | | | | |
Denominator for diluted earnings per share—weighted average number of shares and potential dilution | | | 17,147 | | | | 17,216 | | | | 16,481 |
| | | | | | | | | | | | |
Number of antidilutive stock options excluded from diluted earnings per share computation | | | 2,374 | | | | 1,063 | | | | -- |
Additional disclosures regarding restricted shares and stock options are set forth in Note J.
NOTE N—FAIR VALUE
Effective January 1, 2008, Capitol implemented FAS No. 157, as discussed in Note B. FAS 157 defines fair value as the price that would be received to sell an asset or paid to transfer a liability in an orderly transaction between market participants. A fair value measurement assumes that a transaction to sell an asset or transfer a liability occurs in the principal market for the asset or liability or, in the absence of a principal market, the most advantageous market for the asset or liability. The price in the principal (or most advantageous) market used to measure the fair value of the asset or liability is not to be adjusted for transaction costs. An orderly transaction is one that assumes exposure to the market for a period prior to the measurement date to allow for marketing activities that are usual and customary for transactions involving such assets and liabilities; it is not a forced transaction. Market participants are buyers and sellers in the principal market that are (i) independent, (ii) knowledgeable, (iii) able to transact and (iv) willing to transact.
FAS 157 requires the use of valuation techniques which are consistent with a market approach, income approach and/or cost method. The market approach uses prices and other relevant information generated by market transactions involving identical or comparable assets and liabilities. The income approach uses valuation techniques to convert future amounts, such as cash flows or earnings, to a single present amount on a discounted basis. The cost method is based on the amount that currently would be required to replace the
NOTES TO CONSOLIDATED FINANCIAL STATEMENTS
Capitol Bancorp Limited
NOTE N—FAIR VALUE—Continued
service capacity of an asset (replacement cost). Valuation techniques are to be consistently applied. Inputs to valuation techniques refer to the assumptions that market participants would use in pricing the asset or liability. Inputs may be observable, meaning those that reflect the assumptions market participants would use in pricing the asset or liability developed based on market data obtained from independent sources, or unobservable, meaning those that reflect the reporting entity's own assumptions about the assumptions market participants would use in pricing the asset or liability developed based on the best information available in the circumstances. In that regard, FAS 157 establishes a fair value hierarchy for valuation inputs that gives the highest priority to quoted prices in active markets for identical assets or liabilities and the lowest priority to unobservable inputs. The fair value hierarchy follows:
Level 1: Quoted prices (unadjusted) for identical assets or liabilities in active markets that the entity has the ability to access as of the measurement date.
Level 2: Significant other observable inputs other than Level 1 prices such as quoted prices for similar assets or liabilities in active markets; quoted prices for identical or similar assets or liabilities in markets that are not active; or other inputs that are observable or can be derived from or corroborated by observable market data by correlation or other means.
Level 3: Significant unobservable inputs that reflect the reporting entity's own assumptions about the assumptions that market participants would use in pricing an asset or liability.
The following is a description of Capitol's valuation methodologies used to measure and disclose the fair values of its financial assets and liabilities on a recurring or nonrecurring basis:
Investment securities available for sale: Securities available for sale are recorded at fair value on a recurring basis. Fair value measurement is based on quoted prices, when available. If quoted prices are not available, fair values are measured using independent pricing models, as Level 2 values. Earlier in 2008, substantially all investment securities available for sale were considered to be valued using Level 1 inputs; however, information provided to management later in the year by its third-party securities pricing vendor suggested that a Level 2 classification would be more appropriate at December 31, 2008.
Mortgage loans held for sale: Mortgage loans held for sale are carried at the lower of cost or fair value and are measured on a nonrecurring basis. Mortgage loans held for sale written down to fair value are included in the table below (none at December 31, 2008). Fair value is based on independent quoted market prices, where applicable, or the prices for other mortgage whole loans with similar characteristics.
Loans: The Corporation does not record loans at fair value on a recurring basis. However, from time to time, nonrecurring fair value adjustments to collateral-dependent loans are recorded to reflect partial write-downs based on the observable market price or current appraised value of the collateral.
NOTES TO CONSOLIDATED FINANCIAL STATEMENTS
Capitol Bancorp Limited
NOTE N—FAIR VALUE—Continued
Fair value measurements for assets and liabilities where there exists limited or no observable market data and, therefore, are based primarily upon estimates, are often calculated based on current pricing policy, the economic and competitive environment, the characteristics of the asset or liability and other such factors. Therefore, the results cannot be determined with precision and may not be realized in an actual sale or immediate settlement of the asset or liability. Additionally, there may be inherent weaknesses in any calculation technique and, further, changes in the underlying assumptions used, including discount rates and estimates of future cash flows, could significantly affect the results of current or future values.
The balances of assets and liabilities measured at fair value on a recurring basis as of December 31, 2008 were as follows (in $1,000s):
| | | Total | | | Significant Other Observable Inputs (Level 2) | |
| | | | | | | |
| Securities available for sale | | $ | 15,584 | | | $ | 15,584 | |
The balances of assets and liabilities measured at fair value on a nonrecurring basis as of December 31, 2008 were as follows (in $1,000s):
| | | Total | | | Significant Other Observable Inputs (Level 2) | | | Total Gains (Losses) | |
| | | | | | | | | | |
Impaired loans (1) | | $ | 103,580 | | | $ | 103,580 | | | $ | (24,654 | ) |
| (1) | Represents carrying value and related write-downs for which adjustments are based on the appraised value of the collateral. |
Capitol will apply the fair value measurement and disclosure provisions of FAS No. 157 effective January 1, 2009 to nonfinancial assets and liabilities measured on a nonrecurring basis. The Corporation measures the fair value of the following on a nonrecurring basis: (1) long-lived assets, (2) foreclosed assets, (3) the reporting unit under step one of its goodwill impairment test and (4) indefinite lived assets.
NOTES TO CONSOLIDATED FINANCIAL STATEMENTS
Capitol Bancorp Limited
NOTE N—FAIR VALUE—Continued
Carrying values and estimated fair values of financial instruments for FAS No. 107 disclosure purposes were as follows at December 31 (in $1,000s):
| | | 2008 | | | 2007 | |
| | | Carrying Value | | | Estimated Fair Value | | | Carrying Value | | | Estimated Fair Value | |
| Financial Assets: | | | | | | | | | | | | |
| Cash and cash equivalents | | $ | 624,366 | | | $ | 624,366 | | | $ | 352,372 | | | $ | 352,372 | |
| Loans held for sale | | | 10,474 | | | | 10,474 | | | | 16,419 | | | | 16,419 | |
| Investment securities: | | | | | | | | | | | | | | | | |
| Available for sale | | | 15,584 | | | | 15,584 | | | | 14,119 | | | | 14,119 | |
| Held for long-term investment | | | 32,856 | | | | 32,856 | | | | 25,478 | | | | 25,478 | |
| | | | 48,440 | | | | 48,440 | | | | 39,597 | | | | 39,597 | |
| Portfolio loans: | | | | | | | | | | | | | | | | |
| Loans secured by real estate: | | | | | | | | | | | | | | | | |
| Commercial | | | 2,115,515 | | | | 2,105,204 | | | | 1,917,113 | | | | 1,923,373 | |
| Residential (including multi-family) | | | 879,754 | | | | 865,406 | | | | 698,960 | | | | 699,216 | |
Construction, land development and other land | | | 797,486 | | | | 753,028 | | | | 852,595 | | | | 854,965 | |
| Total loans secured by real estate | | | 3,792,755 | | | | 3,723,638 | | | | 3,468,668 | | | | 3,477,554 | |
Commercial and other business-purpose loans | | | 845,593 | | | | 830,283 | | | | 768,473 | | | | 774,043 | |
| Consumer | | | 61,340 | | | | 62,313 | | | | 48,041 | | | | 48,983 | |
| Other | | | 35,541 | | | | 32,504 | | | | 29,519 | | | | 30,421 | |
| Total portfolio loans | | | 4,735,229 | | | | 4,648,738 | | | | 4,314,701 | | | | 4,331,001 | |
| Less allowance for loan losses | | | (93,040 | ) | | | (93,040 | ) | | | (58,124 | ) | | | (58,124 | ) |
| Net portfolio loans | | | 4,642,189 | | | | 4,555,698 | | | | 4,256,577 | | | | 4,272,877 | |
| | | | | | | | | | | | | | | | | |
| Financial Liabilities: | | | | | | | | | | | | | | | | |
| Deposits: | | | | | | | | | | | | | | | | |
| Noninterest-bearing | | | 700,786 | | | | 700,786 | | | | 671,688 | | | | 671,688 | |
| Interest-bearing: | | | | | | | | | | | | | | | | |
| Demand accounts | | | 1,231,170 | | | | 1,231,172 | | | | 1,351,940 | | | | 1,351,939 | |
| Time certificates of less than $100,000 | | | 1,160,221 | | | | 1,161,411 | | | | 753,912 | | | | 753,817 | |
| Time certificates of $100,000 or more | | | 1,405,435 | | | | 1,408,431 | | | | 1,067,205 | | | | 1,069,111 | |
| Total interest-bearing | | | 3,796,826 | | | | 3,801,014 | | | | 3,173,057 | | | | 3,174,867 | |
| Total deposits | | | 4,497,612 | | | | 4,501,800 | | | | 3,844,745 | | | | 3,846,555 | |
| Notes payable and short-term borrowings | | | 446,925 | | | | 447,490 | | | | 320,384 | | | | 320,038 | |
| Subordinated debentures | | | 167,293 | | | | 170,841 | | | | 156,130 | | | | 158,300 | |
NOTES TO CONSOLIDATED FINANCIAL STATEMENTS
Capitol Bancorp Limited
NOTE N—FAIR VALUE—Continued
Estimated fair values of financial assets and liabilities in the preceding table are based upon a comparison of current interest rates on financial instruments and the timing of related scheduled cash flows to the estimated present value of such cash flows using current estimated market rates of interest (unless quoted market values or other fair value information is more readily available). For example, the estimated fair value of portfolio loans is based on discounted cash flow computations. Similarly, the estimated fair value of time deposits, debt obligations and subordinated debentures were determined through discounted cash flow computations. Such estimates of fair value are not intended to represent market value or portfolio liquidation value, and only represent an estimate of fair value based on current financial reporting requirements.
Given current market conditions, a portion of the loan portfolio is not readily marketable and market prices do not exist. Capitol has not attempted to market the loan portfolio to potential buyers, if any exist, to determine the fair value of those instruments in accordance with the definition in FAS No. 157. Since negotiated prices in illiquid markets depend upon the then present motivations of the buyer and seller, it is reasonable to assume that actual sales prices could vary widely from any estimate of fair value made without the benefit of negotiations. Additionally, changes in market interest rates can dramatically impact the value of financial instruments in a short period of time. Accordingly, the fair value measurements for loans included in the preceding table above are unlikely to represent the instruments' liquidation values.
NOTE O—COMMITMENTS, GUARANTEES AND OTHER CONTINGENCIES
In the ordinary course of business, loan commitments are made to accommodate the financial needs of bank customers. Loan commitments include stand-by letters of credit, lines of credit, and other commitments for commercial, installment and mortgage loans. Stand-by letters of credit, when issued, commit the bank to make payments on behalf of customers if certain specified future events occur and are used infrequently by the banks ($24.6 million and $28.8 million outstanding at December 31, 2008 and 2007, respectively). Other loan commitments outstanding consist of unused lines of credit and approved, but unfunded, specific loan commitments ($781.3 million and $1 billion at December 31, 2008 and 2007, respectively). These loan commitments (stand-by letters of credit and unfunded loans) generally expire within one year and are reviewed periodically for continuance or renewal.
All loan commitments have credit risk essentially the same as that involved in routinely making loans to customers and are made subject to the banks' normal credit policies. In making these loan commitments, collateral and/or personal guarantees of the borrowers are generally obtained based on management's credit assessment.
NOTES TO CONSOLIDATED FINANCIAL STATEMENTS
Capitol Bancorp Limited
NOTE O—COMMITMENTS, GUARANTEES AND OTHER CONTINGENCIES—
Continued
The banking subsidiaries are required to maintain average reserve balances in the form of cash on hand and balances due from the Federal Reserve Bank and correspondent banks. The amount of reserve balances required as of December 31, 2008 and 2007 was $7.9 million and $6.3 million, respectively.
Deposits at each of the banks are insured up to the maximum amount covered by FDIC insurance. Some of the banks have municipal government deposits which are guaranteed by Capitol ($16.3 million at December 31, 2008).
Capitol has guaranteed up to $2.5 million of secured borrowings by Amera Mortgage Corporation, a less than 50%-owned affiliate.
NOTE P—DIVIDEND LIMITATIONS OF SUBSIDIARIES AND OTHER CAPITAL
REQUIREMENTS
Current banking regulations restrict the ability to transfer funds from subsidiaries to their parent in the form of cash dividends, loans or advances. Subject to various regulatory capital requirements, bank subsidiaries' current and retained earnings are available for distribution as dividends to Capitol (and other bank shareholders, as applicable) without prior approval from regulatory authorities. Substantially all of the remaining net assets of the subsidiaries are restricted as to payments to Capitol.
Each bank and Capitol are subject to certain other capital requirements. Federal financial institution regulatory agencies have established certain risk-based capital guidelines for banks and bank holding companies. Those guidelines require all banks and bank holding companies to maintain certain minimum ratios and related amounts based on 'Tier 1' and 'Tier 2' capital and 'risk-weighted assets' as defined and periodically prescribed by the respective regulatory agencies. Failure to meet these capital requirements can result in severe regulatory enforcement action or other adverse consequences for a depository institution and, accordingly, could have a material impact on Capitol's consolidated financial statements.
Under the regulatory capital adequacy guidelines and related framework for prompt corrective action, the specific capital requirements involve quantitative measures of assets, liabilities and certain off-balance-sheet items calculated under regulatory accounting practices. The capital amounts and classifications are also subject to qualitative judgments by regulatory agencies with regard to components, risk weighting and other factors.
As a condition of their charter approval, de novo banks are generally required to maintain a core capital (Tier 1) to average assets ratio of not less than 8% (4% for other banks) and an allowance for loan losses of not less than 1% for the first three years of operations.
NOTES TO CONSOLIDATED FINANCIAL STATEMENTS
Capitol Bancorp Limited
NOTE P—DIVIDEND LIMITATIONS OF SUBSIDIARIES AND OTHER CAPITAL
REQUIREMENTS—Continued
As of December 31, 2008, the most recent notifications received by the banks from regulatory agencies have advised that the banks are classified as 'well capitalized' as defined by the applicable agencies. There are no conditions or events since those notifications that management believes would change the regulatory classification of the banks.
Management believes, as of December 31, 2008, that Capitol and its banks meet all capital adequacy requirements to which the entities are subject.
The following table summarizes the amounts (in $1,000s) and related ratios of Capitol's consolidated regulatory capital position:
| | | December 31 | |
| | | 2008 | | | | 2007 | |
| Tier 1 capital to average adjusted total assets: | | | | | | | |
| Minimum required amount | ≥ | $ | 219,176 | | | ≥ | $ | 188,551 | |
| Actual amount | | $ | 587,475 | | | | $ | 628,747 | |
| Ratio | | | 10.72 | % | | | | 13.34 | % |
| | | | | | | | | | |
| Tier 1 capital to risk-weighted assets: | | | | | | | | | |
Minimum required amount(1) | ≥ | $ | 194,689 | | | ≥ | $ | 177,353 | |
| Actual amount | | $ | 587,475 | | | | $ | 628,747 | |
| Ratio | | | 12.07 | % | | | | 14.18 | % |
| | | | | | | | | | |
Combined Tier 1 and Tier 2 capital to risk- weighted assets: | | | | | | | | | |
Minimum required amount(2) | ≥ | $ | 389,379 | | | ≥ | $ | 354,706 | |
Amount required to meet 'Well-Capitalized' category(3) | ≥ | $ | 486,724 | | | ≥ | $ | 443,382 | |
| Actual amount | | $ | 669,113 | | | | $ | 684,204 | |
| Ratio | | | 13.75 | % | | | | 15.43 | % |
| (1) | The minimum required ratio of Tier 1 capital to risk-weighted assets is 4%. |
| (2) | The minimum required ratio of Tier 1 and Tier 2 capital to risk-weighted assets is 8%. |
| (3) | In order to be classified as a 'well-capitalized' institution, the ratio of Tier 1 and Tier 2 capital to risk-weighted assets must be 10% or more. |
| |
NOTE Q—ACQUISITION OF MINORITY INTERESTS
During February of 2007, a share-exchange transaction was completed, whereby approximately 371,000 shares of Capitol common stock were exchanged for minority interests in Capitol Development Bancorp Limited II. Had this acquisition occurred at the beginning of 2006, unaudited pro forma consolidated net income would have approximated $21.7 million in 2007 and $41.4 million in 2006; diluted earnings per share would have been $1.24 in 2007 and $2.46 in 2006.
NOTES TO CONSOLIDATED FINANCIAL STATEMENTS
Capitol Bancorp Limited
NOTE R—PARENT COMPANY FINANCIAL INFORMATION
Condensed Balance Sheets
| | | -December 31- |
| | | 2008 | | | 2007 |
| | | (in $1,000s) |
| Assets | | | | | |
| Cash on deposit principally with subsidiary banks | | $ | 2,037 | | | $ | 2,460 |
Money market funds on deposit principally with subsidiary banks | | | 25,058 | | | | 7,347 |
| Time deposits principally with subsidiary banks | | | | | | | 9,377 |
| Cash and cash equivalents | | | 27,095 | | | | 19,184 |
| Investment securities | | | 3,401 | | | | 3,321 |
| Loans, net | | | 18,691 | | | | 28,242 |
| Investments in and advances to subsidiaries | | | 492,776 | | | | 474,436 |
| Investment in and advances to Amera Mortgage Corporation | | | 482 | | | | 482 |
| Equipment, software and furniture, net | | | 9,359 | | | | 10,320 |
| Other assets | | | 31,496 | | | | 23,960 |
| | | | | | | | |
| Total assets | | $ | 583,300 | | | $ | 559,945 |
| | | | | | | | |
| Liabilities and Stockholders' Equity | | | | | | | |
| Accounts payable, accrued expenses and other liabilities | | $ | 10,702 | | | $ | 9,770 |
| Debt obligations | | | 20,011 | | | | |
| Subordinated debentures | | | 198,739 | | | | 161,030 |
| Total liabilities | | | 229,452 | | | | 170,800 |
| Stockholders' equity | | | 353,848 | | | | 389,145 |
| | | | | | | | |
| Total liabilities and stockholders' equity | | $ | 583,300 | | | $ | 559,945 |
Condensed Statements of Operations
| | | -Year Ended December 31- | |
| | | 2008 | | | 2007 | | | 2006 | |
| | | (in $1,000s) | |
| Income: | | | | | | | | | |
| Dividends from subsidiaries | | $ | 19,634 | | | $ | 32,750 | | | $ | 30,475 | |
| Intercompany fees | | | 28,847 | | | | 24,854 | | | | 23,039 | |
| Interest | | | 169 | | | | 610 | | | | 199 | |
| Other | | | 3,318 | | | | 2,021 | | | | 943 | |
| Total income | | | 51,968 | | | | 60,235 | | | | 54,656 | |
| Expenses: | | | | | | | | | | | | |
| Interest | | | 14,372 | | | | 12,174 | | | | 8,896 | |
| Salaries and employee benefits | | | 22,415 | | | | 11,756 | | | | 10,482 | |
| Occupancy | | | 2,509 | | | | 2,049 | | | | 1,584 | |
| Amortization, equipment rent and depreciation | | | 4,700 | | | | 3,499 | | | | 2,146 | |
| Other | | | 5,332 | | | | 8,800 | | | | 1,606 | |
| Total expenses | | | 49,328 | | | | 38,278 | | | | 24,714 | |
Income before equity in undistributed net earnings (losses) of consolidated subsidiaries and income tax credit | | | 2,640 | | | | 21,957 | | | | 29,942 | |
Equity in undistributed net earnings (losses) of consolidated subsidiaries | | | (39,320 | ) | | | (4,469 | ) | | | 11,773 | |
| Income (loss) before income tax credit | | | (36,680 | ) | | | 17,488 | | | | 41,715 | |
| Income tax credit | | | (8,073 | ) | | | (4,449 | ) | | | (676 | ) |
| | | | | | | | | | | | | |
| Net income (loss) | | $ | (28,607 | ) | | $ | 21,937 | | | $ | 42,391 | |
| NOTES TO CONSOLIDATED FINANCIAL STATEMENTS |
NOTE R—PARENT COMPANY FINANCIAL INFORMATION—Continued
Condensed Statements of Cash Flows
| | | -Year Ended December 31- | |
| | | 2008 | | | 2007 | | | 2006 | |
| | | (in $1,000s) | |
| | | | | | | | | | |
| OPERATING ACTIVITIES | | | | | | | | | |
| Net income (loss) | | $ | (28,607 | ) | | $ | 21,937 | | | $ | 42,391 | |
Adjustments to reconcile net income (loss) to net cash provided (used) by operating activities: | | | | | | | | | | | | |
Equity in undistributed net earnings (losses) of subsidiaries | | | 39,320 | | | | 4,469 | | | | (11,773 | ) |
| Depreciation and amortization of intangibles | | | 2,583 | | | | 2,189 | | | | 1,459 | |
| Loss on sale of equipment and furniture | | | | | | | | | | | 3 | |
Decrease (increase) in amounts due from subsidiaries and other assets | | | (25,179 | ) | | | (33,586 | ) | | | 21,037 | |
Increase (decrease) in accounts payable, accrued expenses and other liabilities | | | 932 | | | | 1,428 | | | | (3,214 | ) |
NET CASH PROVIDED (USED) BY OPERATING ACTIVITIES | | | (10,951 | ) | | | (3,563 | ) | | | 49,903 | |
| | | | | | | | | | | | | |
| INVESTING ACTIVITIES | | | | | | | | | | | | |
| Net cash investments in subsidiaries | | | (35,145 | ) | | | (16,830 | ) | | | (36,193 | ) |
| Purchases of investment securities | | | (1,800 | ) | | | | | | | (2,000 | ) |
| Net decrease (increase) in loans | | | 9,551 | | | | (16,928 | ) | | | (8,449 | ) |
| Proceeds from sales of equipment and furniture | | | | | | | 126 | | | | | |
| Purchases of equipment and furniture | | | (1,622 | ) | | | (3,170 | ) | | | (5,098 | ) |
| NET CASH USED BY INVESTING ACTIVITIES | | | (29,016 | ) | | | (36,802 | ) | | | (51,740 | ) |
| | | | | | | | | | | | | |
| FINANCING ACTIVITIES | | | | | | | | | | | | |
| Net borrowings from debt obligations | | | 20,011 | | | | | | | | | |
| Net proceeds from issuance of subordinated debentures | | | 34,555 | | | | 55,000 | | | | | |
| Net proceeds from issuance of common stock | | | 1,950 | | | | 4,706 | | | | 5,924 | |
| Tax benefit from share-based payments | | | 20 | | | | 1,688 | | | | 2,481 | |
| Acquisition of shares for employee benefit trust | | | | | | | (2,482 | ) | | | | |
| Cash dividends paid | | | (8,658 | ) | | | (17,196 | ) | | | (15,165 | ) |
NET CASH PROVIDED (USED) BY FINANCING ACTIVITIES | | | 47,878 | | | | 41,716 | | | | (6,760 | ) |
INCREASE (DECREASE) IN CASH AND CASH EQUIVALENTS | | | 7,911 | | | | 1,351 | | | | (8,597 | ) |
| Cash and cash equivalents at beginning of year | | | 19,184 | | | | 17,833 | | | | 26,430 | |
| | | | | | | | | | | | | |
| CASH AND CASH EQUIVALENTS AT END OF YEAR | | $ | 27,095 | | | $ | 19,184 | | | $ | 17,833 | |