EXHIBIT 13
20 ANNUAL
09 REPORT MESSAGE FROM THE CHAIRMAN
CAPITOL BANCORP LIMITED
BOARD OF DIRECTORS
Joseph D. Reid
Chairman & CEO
Capitol Bancorp Limited
Michael L. Kasten
Vice Chairman
Capitol Bancorp Limited
Managing Partner
Kasten Investments, LLC
Lyle W. Miller
Vice Chairman
Capitol Bancorp Limited
President
L.W. Miller Holding Co.
David J. O’Leary
Secretary
Capitol Bancorp Limited
Chairman
O’Leary Paint Company
Paul R. Ballard
Retired President & CEO
Portage Commerce Bank
David L. Becker
Retired Founder
Becker Insurance Agency, PC
Michael J. Devine
Attorney at Law
James C. Epolito
Entrepreneur
Gary A. Falkenberg, DO
Retired Physician
Gary A. Falkenberg, PC
Joel I. Ferguson
Chairman
Ferguson Development, LLC
Kathleen A. Gaskin
Retired Real Estate
Associate Broker
H. Nicholas Genova
Chairman & CEO
Washtenaw News Co. Inc.
President
H. N. Genova Development
Richard A. Henderson, CPA
President
Henderson & Associates, PC
Lewis D. Johns
President
Mid-Michigan Investment Co.
Steven L. Maas
Co-Owner
River Valley Title, LLC
Myrl D. Nofziger
President
Hoogenboom Nofziger
Cristin K. Reid
Corporate President
Capitol Bancorp Limited
Ronald K. Sable
President
Concord Solutions Ltd.
Dear Shareholder:
During the past year and throughout 2010, Capitol Bancorp Limited continues to execute a major restructuring plan for the Corporation. Our primary objective is the preservation of capital for our banking affiliates. The current state of the national economy has significantly impacted the banking industry, in general, and Capitol Bancorp, specifically. The escalation of adverse valuation of nonperforming loans has materially diminished capital ratios at some of our banking affiliates. This, in turn, has imposed upon the Corporation the need to seek other sources of capital which can be infused into these institutions.
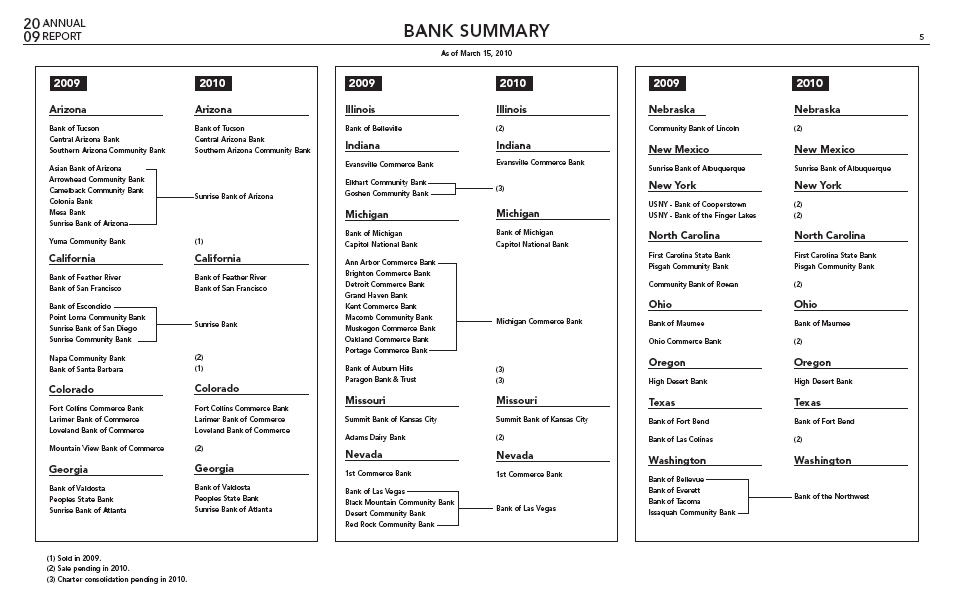
The plan has three fundamental strategies. First, we have embarked upon a balance sheet deleveraging program that resulted in the sale of two banks in 2009 – Yuma Community Bank and Bank of Santa Barbara. Efforts in 2009 contributed to the recently announced sales of eight more banking affiliates which are expected to close mid-year. Currently there are an additional number of affiliates at various stages of discussion regarding sale. The net sale proceeds from this ongoing effort are then being used as capital for our other banking affiliates.
Additionally, deleveraging has occurred through the reduction of bank assets at our existing banks. The reduction in bank assets serves to reduce the need for capital at the respective institution. For example, in the nine months ended December 31, 2009, the newly merged Michigan Commerce Bank reduced risk-weighted assets from $1.1 billion to $927 million, thereby reducing the need for supporting capital by approximately $14 million.
The second strategy has been the consolidation of several bank affiliates into single charters. Operating expenses of the combined banks are thereby reduced, furthering the preservation of capital. In 2009, we merged nine banking
2
affiliates into a single charter under the new name of Michigan Commerce Bank. Included within the Michigan Commerce merger were the following:
■ Ann Arbor Commerce Bank
■ Brighton Commerce Bank
■ Detroit Commerce Bank
■ Grand Haven Bank
■ Kent Commerce Bank
■ Macomb Community Bank
■ Muskegon Commerce Bank
■ Oakland Commerce Bank
■ Portage Commerce Bank
In December 2009, we merged six of our Arizona banking affiliates into a single charter to operate under one name, Sunrise Bank of Arizona. The five other banks combined in this merger included:
■ Arrowhead Community Bank
■ Asian Bank of Arizona
■ Camelback Community Bank
■ Colonia Bank
■ Mesa Bank
During the first quarter of 2010, we completed the merger of four banks based in Las Vegas, Nevada, into a single charter under the existing name, Bank of Las Vegas. The following banks were included in the merger:
■ Bank of Las Vegas
■ Black Mountain Community Bank
■ Desert Community Bank
■ Red Rock Community Bank
In Washington state we merged our four Seattle-area banks into a single charter under the new name, Bank of the Northwest. Included in the February 2010 merger were:
■ Bank of Bellevue
■ Bank of Everett
■ Bank of Tacoma
■ Issaquah Community Bank
In southern California, we have completed the merger of four banks in early 2010 that will be known as Sunrise Bank. They are:
■ Bank of Escondido
■ Point Loma Community Bank
■ Sunrise Bank of San Diego
■ Sunrise Community Bank
We have an application pending in 2010 to merge two affiliate banks in the state of Indiana, currently operating as Elkhart Community Bank and Goshen Community Bank.
Our third capital preservation strategy involves ongoing operational assessment and expense reduction. This will continue throughout 2010.
We remain committed to the successful execution of each of these strategies in our effort to manage through the consequences of the “Great Recession.”
The Capitol family lost a respected board member in 2009. Doug Crist was a member of the board that launched the first bank in 1982 in Lansing, Michigan, Capitol National Bank, and continued serving Capitol Bancorp as a director and chair of the Compensation Committee until his death. We miss his guidance.

JOSEPH D. REID
Chairman & CEO
20 ANNUAL
09 REPORT MESSAGE FROM THE PRESIDENT
Dear Shareholder:
Our operational focus for 2010 emphasizes risk mitigation and operational efficiency. During the course of the year we will continue to focus on the following initiatives:
■ Enhanced credit administration;
■ Consolidated credit review;
■ The engagement of additional risk support specialists;
■ Restructured financial strategic management;
■ Expanded fraud detection and prevention procedures which include tech-based platforms;
■ Ongoing operational assessment in all areas; and
■ Consolidation of bank charters while retaining a local, community presence.
We are adapting to the changing financial industry by treating this down cycle as an opportunity to improve our operations to best prepare us for future growth and performance.
Enterprise risk management is the focus of all operating departments. Managers are being asked to mitigate risk and evaluate their internal processes. Our Board of Directors has adopted an enhanced enterprise risk management process which provides management and directors with a defined structure for the assessment, reporting and management of risk on an enterprise-wide basis. Additionally, the Risk Management Committee, which is responsible for reviewing and approving our risk management framework, including the development of proactive policies, processes and procedures, has been expanded to include the entire Board of Directors.
We work closely with regulatory agencies and have common objectives to appropriately address the challenges faced by banks in this difficult operating environment. Adopting a capital strategy which helps ensure that each bank has the funding support it needs is one of the primary objectives.
We look forward to progress in 2010. As always, we appreciate your loyalty and support of Capitol Bancorp Limited.

CRISTIN K. REID
Corporate President
FINANCIAL INFORMATION
Table of Contents
| F-2 | |
| F-3 | |
| F-5 | |
| F-5 | |
| F-5 | |
| F-6 | |
Results of Operations: | |
| F-11 | |
| F-12 | |
| F-12 | |
| F-16 | |
| F-21 | |
| F-29 | |
| F-35 | |
| F-37 | |
| F-37 | |
| F-41 | |
| F-41 | |
| F-42 | |
| F-42 | |
| F-43 | |
| F-45 | |
| F-46 | |
| F-46 | |
| F-47 | |
| F-48 | |
Control Over Financial Reporting | F-49 |
| Consolidated Financial Statements: | |
| F-51 | |
| F-52 | |
| F-53 | |
| F-54 | |
| F-56 | |
| F-57 |
F-1
(in $1,000s, except per share data)
| As of and for the Year Ended December 31 | ||||||||||||||||||||
2009(1) | 2008(2) | 2007(3) | 2006(4) | 2005(5) | ||||||||||||||||
| For the year: | ||||||||||||||||||||
| Interest income | $ | 266,899 | $ | 304,315 | $ | 330,439 | $ | 279,353 | $ | 224,439 | ||||||||||
| Interest expense | 110,517 | 140,466 | 147,162 | 105,586 | 67,579 | |||||||||||||||
| Net interest income | 156,382 | 163,849 | 183,277 | 173,767 | 156,860 | |||||||||||||||
| Provision for loan losses | 190,680 | 82,492 | 25,340 | 12,156 | 10,960 | |||||||||||||||
| Noninterest income | 28,773 | 26,432 | 24,381 | 21,532 | 21,048 | |||||||||||||||
| Noninterest expense | 240,597 | 190,388 | 176,160 | 137,804 | 117,289 | |||||||||||||||
| Net income (loss) | (264,540 | ) | (52,451 | ) | 3,334 | 29,876 | 30,427 | |||||||||||||
| Net income (loss) attributable to Capitol Bancorp Limited | (195,169 | ) | (28,607 | ) | 21,937 | 42,391 | 35,925 | |||||||||||||
| Net income (loss) per share attributable to Capitol | ||||||||||||||||||||
| Bancorp Limited: | ||||||||||||||||||||
| Basic | (11.28 | ) | (1.67 | ) | 1.29 | 2.69 | 2.42 | |||||||||||||
| Diluted | (11.28 | ) | (1.67 | ) | 1.27 | 2.57 | 2.34 | |||||||||||||
| Cash dividends paid per share | 0.05 | 0.50 | 1.00 | 0.95 | 0.72 | |||||||||||||||
| At end of year: | ||||||||||||||||||||
| Total assets | $ | 5,131,940 | $ | 5,654,836 | $ | 4,901,763 | $ | 4,065,816 | $ | 3,475,721 | ||||||||||
| Total earning assets | 4,855,309 | 5,282,010 | 4,527,006 | 3,743,041 | 3,204,646 | |||||||||||||||
| Portfolio loans | 4,047,101 | 4,735,229 | 4,314,701 | 3,488,678 | 2,991,189 | |||||||||||||||
| Deposits | 4,410,633 | 4,497,612 | 3,844,745 | 3,258,485 | 2,785,259 | |||||||||||||||
| Notes payable and short-term borrowings | 276,159 | 446,925 | 320,384 | 191,154 | 175,729 | |||||||||||||||
| Subordinated debentures | 167,441 | 167,293 | 156,130 | 101,035 | 100,940 | |||||||||||||||
| Noncontrolling interests in consolidated subsidiaries | 72,271 | 159,220 | 156,198 | 126,512 | 83,838 | |||||||||||||||
| Capitol Bancorp Limited stockholders' equity | 161,335 | 353,848 | 389,145 | 361,879 | 301,866 | |||||||||||||||
| Quarterly Results of Operations (unaudited) | ||||||||||||||||||||
Total for the Year | Fourth Quarter | Third Quarter | Second Quarter | First Quarter | ||||||||||||||||
Year ended December 31, 2009:(1) | ||||||||||||||||||||
| As previously reported: | ||||||||||||||||||||
| Interest income | $ | 266,899 | $ | 61,366 | $ | 67,345 | $ | 69,472 | $ | 68,716 | ||||||||||
| Interest expense | 110,517 | 23,075 | 27,293 | 28,890 | 31,259 | |||||||||||||||
| Net interest income | 156,382 | 38,291 | 40,052 | 40,582 | 37,457 | |||||||||||||||
Provision for loan losses(8) | 190,680 | 77,924 | 48,771 | 35,813 | 28,172 | |||||||||||||||
Net loss(8) | (264,540 | ) | (87,107 | ) | (129,174 | ) | (25,354 | ) | (22,905 | ) | ||||||||||
Net loss attributable to Capitol Bancorp Limited(8) | (195,169 | ) | (77,051 | ) | (83,748 | ) | (18,698 | ) | (15,672 | ) | ||||||||||
Net loss per share attributable to Capitol Bancorp Limited – basic and diluted(6)(8) | (11.28 | ) | (4.43 | ) | (4.81 | ) | (1.08 | ) | (0.91 | ) | ||||||||||
| Cash dividends paid per share | 0.05 | -- | -- | -- | 0.05 | |||||||||||||||
As revised:(7) | ||||||||||||||||||||
Provision for loan losses(8) | 190,680 | 75,771 | 47,335 | 33,658 | 33,916 | |||||||||||||||
Net loss(8) | (264,540 | ) | (85,558 | ) | (128,115 | ) | (22,960 | ) | (27,907 | ) | ||||||||||
Net loss attributable to Capitol Bancorp Limited(8) | (195,169 | ) | (75,502 | ) | (82,689 | ) | (16,304 | ) | (20,674 | ) | ||||||||||
Net loss per share attributable to Capitol Bancorp Limited – basic and diluted(6)(8) | (11.28 | ) | (4.34 | ) | (4.75 | ) | (0.95 | ) | (1.20 | ) | ||||||||||
Year ended December 31, 2008:(2) | ||||||||||||||||||||
| Interest income | $ | 304,315 | $ | 73,179 | $ | 75,496 | $ | 76,137 | $ | 79,503 | ||||||||||
| Interest expense | 140,466 | 34,496 | 34,457 | 33,945 | 37,568 | |||||||||||||||
| Net interest income | 163,849 | 38,683 | 41,039 | 42,192 | 41,935 | |||||||||||||||
| Provision for loan losses | 82,492 | 10,705 | 53,810 | 9,019 | 8,958 | |||||||||||||||
| Net loss | (52,451 | ) | (4,866 | ) | (38,880 | ) | (5,437 | ) | (3,268 | ) | ||||||||||
| Net income (loss) attributable to Capitol Bancorp Limited | (28,607 | ) | 1,074 | (32,495 | ) | 623 | 2,191 | |||||||||||||
Net income (loss) per share attributable to Capitol Bancorp Limited – basic and diluted(6) | (1.67 | ) | 0.06 | (1.90 | ) | 0.04 | 0.13 | |||||||||||||
| Cash dividends paid per share | 0.50 | 0.05 | 0.05 | 0.15 | 0.25 | |||||||||||||||
| (1) | Includes Yuma Community Bank's operations through September 21, 2009 (date at which Capitol sold its ownership of that bank) and Bank of Santa Barbara, Community Bank of Rowan, Summit Bank of Kansas City and Capitol Development Bancorp Limited III's operations through September 30, 2009 (the date when these entities ceased to be consolidated with Capitol due to a change in control). |
| (2) | Includes Adams Dairy Bank, effective January 2008 (located in Blue Springs, Missouri), Mountain View Bank of Commerce, effective February 2008 (located in Westminster, Colorado), Colonia Bank, effective April 2008 (located in Phoenix, Arizona) and Pisgah Community Bank, effective May 2008 (located in Asheville, North Carolina). |
| (3) | Includes Bank of Tacoma, effective January 2007 (located in Tacoma, Washington), Sunrise Community Bank, effective February 2007 (located in Palm Desert, California), Larimer Bank of Commerce, effective May 2007 (located in Fort Collins, Colorado), Issaquah Community Bank (located in Issaquah, Washington) and USNY Bank (located in Geneva, New York), both effective July 2007, High Desert Bank, effective September 2007 (located in Bend, Oregon), Loveland Bank of Commerce, effective October 2007 (located in Loveland, Colorado), Bank of Feather River, effective November 2007 (located in Yuba City, California) and Community Bank of Lincoln (located in Lincoln, Nebraska), Bank of Fort Bend (located in Sugar Land, Texas) and Bank of Las Colinas (located in Irving, Texas), each effective December 2007. |
| (4) | Includes Community Bank of Rowan, effective February 2006 (located in Salisbury, North Carolina), Asian Bank of Arizona, effective April 2006 (located in Phoenix, Arizona), Evansville Commerce Bank, effective May 2006 (located in Evansville, Indiana), Bank of Valdosta (located in Valdosta, Georgia), Sunrise Bank of Atlanta (located in Atlanta, Georgia) and Bank of Everett (located in Everett, Washington), all effective June 2006, Bank of Maumee (located in Maumee, Ohio) and 1st Commerce Bank (located in North Las Vegas, Nevada), both effective October 2006, and Ohio Commerce Bank (located in Beachwood, Ohio), effective November 2006. |
| (5) | Includes Bank of Michigan, effective January 2005 (located in Farmington Hills, Michigan), Peoples State Bank, acquired April 7, 2005 (located in Jeffersonville, Georgia), Bank of Bellevue (located in Bellevue, Washington) and Fort Collins Commerce Bank (located in Fort Collins, Colorado), both effective June 2005, Bank of Auburn Hills, effective July 2005 (located in Auburn Hills, Michigan), Bank of San Francisco, effective August 2005 (located in San Francisco, California), Bank of Belleville (located in Belleville, Illinois) and Summit Bank of Kansas City (located in Lee's Summit, Missouri), both effective November 2005, and Bank of Santa Barbara, effective December 2005 (located in Santa Barbara, California). |
| (6) | Each period's computation of net income (loss) per share is performed independently and, accordingly, net income per share for the year (basic and diluted) may not equal the sum of the amounts shown for the quarterly periods. |
| (7) | As-adjusted to reflect revised interpretation of fair-value accounting guidance (FSP FAS 157-4) which was implemented in error in the first quarter of 2009, to properly base fair-value estimates of collateral-dependent loans and other real estate owned upon appraisal data rather than use of alternative valuation methods. |
| (8) | Fourth quarter 2009 results of operations include additional provisions for loan losses approximating $20.7 million relating to regulatory exam reports received after year-end 2009 and approximately $9.6 million of write-downs (and related expense recognition) resulting from appraisal data received after year-end 2009 for collateral-dependent loans and other real estate owned. |
F-2
Capitol's common stock is traded on the New York Stock Exchange (NYSE) under the symbol "CBC." Market quotations regarding the range of high and low sales prices of Capitol's common stock, as reported by the NYSE, were as follows:
| 2009 | 2008 | ||||||||||||||
| Low | High | Low | High | ||||||||||||
| Quarter Ended: | |||||||||||||||
| March 31 | $ | 2.50 | $ | 7.96 | $ | 16.30 | $ | 23.52 | |||||||
| June 30 | 2.38 | 7.08 | 8.97 | 21.42 | |||||||||||
| September 30 | 1.79 | 6.06 | 7.08 | 25.40 | |||||||||||
| December 31 | 1.55 | 3.45 | 3.84 | 20.49 | |||||||||||
Below is a graph which summarizes the cumulative return earned by Capitol's shareholders over the last five years compared with the SNL (SNL Financial LC) $5B-$10B Asset-Size Index (SNL) and the cumulative total return on the Russell 2000 Index (R-2000). This presentation assumes the initial value of an investment in Capitol's common stock and each index was $100 on December 31, 2004 and that any subsequent cash dividends were reinvested.
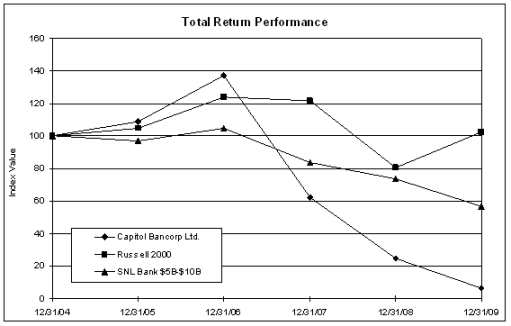
| Period Ending | |||||||
| Index | 12/31/04 | 12/31/05 | 12/31/06 | 12/31/07 | 12/31/08 | 12/31/09 | |
| Capitol Bancorp Ltd. | 100.00 | 108.65 | 137.09 | 62.05 | 24.88 | 6.31 | |
| Russell 2000 | 100.00 | 104.55 | 123.76 | 121.82 | 80.66 | 102.58 | |
| SNL Bank $5B-$10B | 100.00 | 96.89 | 104.56 | 83.86 | 73.57 | 56.56 | |
F-3
INFORMATION REGARDING CAPITOL'S COMMON STOCK—Continued
In the first quarter of 2009, Capitol paid a cash dividend of $0.05 per share. During 2008, Capitol paid quarterly cash dividends of $0.25 per share for the first quarter, $0.15 in the second quarter and $0.05 in the third and fourth quarters. In 2007, Capitol paid quarterly cash dividends of $0.25 per share. Payment of dividends is not currently permitted without prior written approval of the Federal Reserve, Capitol's primary federal regulator (see subsequent discussion of certain regulatory matters in the section captioned "Management's Discussion and Analysis of Capitol's Business, Financial Condition and Results of Operations").
As of March 2, 2010, there were 10,287 beneficial holders of Capitol's common stock, based on information supplied to Capitol from its stock transfer agent and other sources.
At March 2, 2010, 17,544,501 shares of common stock were outstanding. Capitol's stock transfer agent is BNY Mellon Shareowner Services, 480 Washington Blvd., Jersey City, NJ 07310 (telephone 866-205-7090). The website for BNY Mellon Shareowner Services is http://www.bnymellon.com/shareowner/isd.
Capitol has a direct purchase and dividend reinvestment plan, the Capitol Bancorp Limited Direct Purchase and Dividend Reinvestment Plan ("Capitol Bancorp Direct"), which offers a variety of convenient features including dividend reinvestment, certain fee-free transactions, certificate safekeeping and other benefits. For a copy of the Capitol Bancorp Direct prospectus, informational brochure and enrollment materials, contact BNY Mellon Shareowner Services at 866-205-7090 or Capitol at 517-487-6555.
In addition to Capitol's common stock, trust-preferred securities of Capitol Trust I and Capitol Trust XII (each a subsidiary of Capitol) are listed on the NYSE under the symbol "CBCPrA" and "CBCPrB," respectively. The trust-preferred securities have a liquidation amount of $10 per preferred security and are guaranteed by Capitol. Capitol Trust I consists of 2,530,000, 8.5% cumulative preferred securities scheduled to mature in 2027, which are currently callable and may be extended to 2036 if certain conditions are met. Capitol Trust XII consists of 3,805,000, 10.5% cumulative preferred securities scheduled to mature in 2038 and become callable in 2013. In 2009, Capitol commenced the deferral of interest payments on its various trust-preferred securities, as is permitted under the terms of the securities, to conserve cash and capital resources. The payment of interest may be deferred for periods up to five years. During such deferral periods, Capitol is generally prohibited from paying dividends on its common stock and will continue to accrue interest payable on such securities. Holders of the trust-preferred securities will continue to recognize current taxable income relating to the deferred interest payments. Payment of interest on the trust-preferred securities is also not permitted without prior written approval of the Federal Reserve (see subsequent discussion of certain regulatory matters in the section captioned "Management's Discussion and Analysis of Capitol's Business, Financial Condition and Results of Operations").
F-4
Capitol will file with the U.S. Securities and Exchange Commission (SEC) all required certifications regarding the quality of Capitol's public disclosures upon filing of Capitol's 2009 Report on Form 10-K. In addition, Capitol's CEO submitted to the NYSE an annual CEO certification stating that he is not aware of any violation by Capitol of the NYSE's corporate governance listing standards. Further, Capitol will file certifications with the SEC in accordance with the Sarbanes-Oxley Act of 2002 as exhibits to Capitol's 2009 Report on Form 10-K.
A copy of Capitol's 2009 report on Form 10-K, without exhibits, will be available to holders of its common stock or trust-preferred securities without charge, upon written request. Form 10-K includes certain statistical and other information regarding Capitol and its business. Requests to obtain a copy of Form 10-K should be addressed to Investor Relations, Capitol Bancorp Limited, Capitol Bancorp Center, 200 N. Washington Square, Lansing, Michigan 48933.
Form 10-K and certain other periodic reports have been or will be filed with the SEC. The SEC maintains an Internet website that contains reports, proxy and information statements and other information regarding companies which file electronically (which includes Capitol). The SEC's website address is http://www.sec.gov. Capitol's filings with the SEC are also available at Capitol's website, http://www.capitolbancorp.com.
EXECUTIVE OFFICES
| Capitol Bancorp Center | 2777 E. Camelback Road |
| 200 N. Washington Square | Suite 375 |
| Lansing, Michigan 48933 | Phoenix, Arizona 85016 |
| 517-487-6555 | 602-955-6100 |
| website: www.capitolbancorp.com | |
INDEPENDENT AUDITORS
BDO Seidman, LLP
Grand Rapids, Michigan
SHAREHOLDER INFORMATION
ANNUAL MEETING
Capitol's 2009 Annual Meeting of Shareholders will be held on Wednesday, April 28, 2010 at 4:00 p.m. at the Capitol Bancorp Center, located at 200 N. Washington Square, Lansing, Michigan.
F-5
SHAREHOLDER INFORMATION—Continued
DIRECT PURCHASE AND DIVIDEND REINVESTMENT PLAN
Capitol offers an easy and affordable way to invest in Capitol's common stock through its direct purchase and dividend reinvestment plan, Capitol Bancorp Direct. Capitol Bancorp Direct's benefits include the ability to make an initial investment in common stock with as little as $50, reinvestment of dividends in additional common stock (if and when paid), direct deposit of dividends (if and when paid), ability to purchase common stock as frequently as once a month, and the option to make transfers or gifts of Capitol's common stock to another person. Participation in Capitol Bancorp Direct is voluntary and shareholders and prospective investors are eligible. Purchases under Capitol Bancorp Direct are not currently subject to any brokerage fees or commissions. For further information regarding Capitol Bancorp Direct or for a copy of Capitol Bancorp Direct's prospectus, informational brochure and enrollment materials, please contact BNY Mellon Shareowner Services at 866-205-7090 or Capitol at 517-487-6555.
TRUST-PREFERRED SECURITIES TRADING INFORMATION
Preferred securities of Capitol Trust I and Capitol Trust XII (each a subsidiary of Capitol) trade on the NYSE under the trading symbols "CBCPrA" and "CBCPrB," respectively.
TRUST-PREFERRED SECURITIES TRUSTEE
Capitol Trust I: JP Morgan Institutional Trust Services – Tempe, Arizona
Capitol Trust XII: Wells Fargo Delaware Trust Company
Some of the statements contained in this annual report, including Capitol's consolidated financial statements, Management's Discussion and Analysis of Capitol's Business, Financial Condition and Results of Operations and in documents incorporated into this document by reference that are not historical facts, including, without limitation, statements of future expectations, projections of results of operations and financial condition, statements of future economic performance and other forward-looking statements within the meaning of the Private Securities Litigation Reform Act of 1995, are subject to known and unknown risks, uncertainties and other factors which may cause the actual future results, performance or achievements of Capitol and/or its subsidiaries and other operating units to differ materially from those contemplated in such forward-looking statements. The words "intend," "expect," "project," "estimate," "predict," "anticipate," "should," "could," "believe," "may," "might," and similar expressions also are intended to identify forward-looking statements. Important factors which may cause actual results to differ from those contemplated in such forward-looking statements include, but are not limited to: (i) the results of Capitol's efforts to implement its business strategy, (ii) changes in interest rates, (iii) legislation or regulatory requirements adversely impacting Capitol's banking business and/or expansion strategy, (iv) adverse changes in business conditions or inflation, (v) general economic conditions, either nationally or regionally, which are less favorable than expected and that result in, among other things, a deterioration in credit quality and/or loan performance and collectability, (vi) competitive pressures among financial institutions, (vii) changes in securities markets, (viii) actions of competitors of Capitol's banks and Capitol's ability to respond to such actions,
F-6
CAUTIONS REGARDING FORWARD-LOOKING STATEMENTS—Continued
(ix) the cost of and access to capital, which may depend in part on Capitol's asset quality, prospects and outlook, (x) changes in governmental regulation, tax rates and similar matters, (xi) availability of funds under the U.S. Treasury's Capital Assistance Program and Capital Purchase Program, (xii) changes in management, (xiii) Capitol's proposed spin-off of Michigan Commerce Bancorp Limited; (xiv) consummation of pending sales of certain bank subsidiaries, (xv) other risks detailed in Capitol's other filings with the SEC, and (xvi) and the following, among others:
· Management's ability to effectively manage interest rate risk and the impact of interest rates in general on the volatility of Capitol's net interest income;
· The effect of the Emergency Economic Stabilization Act of 2008, the American Recovery and Reinvestment Act of 2009, the implementation by the Department of the U.S. Treasury and federal banking regulators of a number of programs to address capital and liquidity issues within the banking system and additional programs that may apply to Capitol in the future, all of which may have significant effects on Capitol and the financial services industry;
· The decline in commercial and residential real estate values and sales volume and the likely potential for continuing illiquidity in the real estate market;
· The risks associated with the high concentration of commercial real estate loans within Capitol's portfolio;
· The uncertainties in estimating the fair value of developed real estate and undeveloped land relating to collateral-dependent loans and other real estate owned in light of declining demand for such assets, falling prices and continuing illiquidity in the real estate market;
· Negative developments and disruptions in the credit and lending markets, including the impact of the ongoing credit crisis on Capitol's business and on the businesses of its customers as well as other banks and lending institutions with which Capitol has commercial relationships;
· A continuation of unprecedented volatility in the capital markets;
· The risks associated with implementing Capitol's business strategy, including its ability to preserve and access sufficient capital to execute its strategy;
· Rising unemployment and its impact on Capitol's customers' savings rates and their ability to service debt obligations;
· Fluctuations in the value of Capitol's investment securities;
· The ability to attract and retain senior management experienced in banking and financial services;
· The sufficiency of the allowance for loan losses to absorb the amount of actual losses inherent within the loan portfolio;
F-7
CAUTIONS REGARDING FORWARD-LOOKING STATEMENTS—Continued
· Capitol's ability to adapt successfully to technological changes to compete effectively in the marketplace;
· Credit risks and risks from concentrations (by geographic area and by industry) within Capitol's consolidated loan portfolio and individual large loans;
· The effects of competition from other commercial banks, thrifts, mortgage banking firms, consumer finance companies, credit unions, securities brokerage firms, insurance companies, money market and other mutual funds, and other financial institutions operating in Capitol's market or elsewhere or providing similar services;
· The failure of assumptions underlying the establishment of the allowance for loan losses and estimation of values of collateral or cash flow projections and various financial assets and liabilities;
· Volatility of rate sensitive deposits;
· Operational risks, including data processing system failures or fraud;
· Liquidity risks;
· The ability to successfully acquire deposits for funding and the pricing thereof;
· The ability to successfully execute strategies to increase noninterest income;
· Changes in the economic environment, competition or other factors that may influence loan demand and repayment, deposit inflows and outflows, and the quality of the loan portfolio and loan and deposit pricing;
· The impact from liabilities arising from legal or administrative proceedings on the financial condition of Capitol;
· The current prohibition of Capitol's subsidiary banks to pay dividends to Capitol without prior written authorization from regulatory agencies;
· The current prohibition of Capitol's payment of cash dividends on its common stock without prior written regulatory authorization;
· Possible administrative or enforcement actions of banking regulators in connection with any material failure of Capitol or its subsidiary banks to comply with banking laws, rules or regulations or formal agreements with regulatory agencies;
· Capitol's compliance with the terms of its written agreement with the Federal Reserve Bank, amendments thereto or subsequent regulatory agreements;
· The continued availability of credit facilities provided by Federal Home Loan Banks to Capitol's banking subsidiaries;
· The uncertainties of future depositor activity regarding potentially uninsured deposits upon expiration of the FDIC's Transaction Account Guarantee Program;
F-8
CAUTIONS REGARDING FORWARD-LOOKING STATEMENTS—Continued
· The possibility of the FDIC assessing Capitol's bank subsidiaries for any cross-guaranty liability;
· Governmental monetary and fiscal policies, as well as legislative and regulatory changes, that may result in the imposition of costs and constraints on Capitol through higher FDIC insurance premiums, significant fluctuations in market interest rates, increases in capital requirements, and operational limitations;
· Changes in general economic or industry conditions, nationally or in the communities in which Capitol conducts business;
· Changes in legislation or regulatory and accounting principles, policies, or guidelines affecting the business conducted by Capitol;
· The impact of possible future goodwill and other material impairment charges;
· Acts of war or terrorism;
· Capitol's ability to manage fluctuations in the value of its assets and liabilities and maintain sufficient capital and liquidity to support its operations;
· The concentration of Capitol's nonperforming assets by loan type in certain geographic regions and with affiliated borrowing groups;
· The risk of additional future losses if the proceeds Capitol receives upon the liquidation of assets are less than the carrying value of such assets;
· Restrictions or limitations on access to funds from subsidiaries and potential obligations to contribute additional capital to Capitol's subsidiaries, which may restrict its ability to make payments on its obligations;
· The availability and cost of capital and liquidity on favorable terms, if at all;
· Changes in accounting standards or applications and determinations made thereunder;
· The risk that the realization of deferred tax assets and recoverable income taxes may extend beyond 2010;
· The risk that Capitol will not be able to complete its various proposed mergers and consolidations of certain of its subsidiary banks or, if completed, realize the anticipated benefits of the proposed mergers and/or consolidations;
· The impact on Capitol's financial results, reputation and business if it is unable to comply with all applicable federal and state regulations and applicable formal agreements, consent orders, other regulatory actions and any related capital initiatives;
· The costs and effects of litigation, investigations, inquiries or similar matters, or adverse facts and developments related thereto;
F-9
CAUTIONS REGARDING FORWARD-LOOKING STATEMENTS—Continued
· The risk that, if economic conditions worsen or regulatory capital requirements are modified, Capitol may be required to seek additional liquidity and/or capital from external sources, if available;
· The risk that Capitol could have an "ownership change" under Section 382 of the Internal Revenue Code, which could impair its ability to timely and fully utilize its net operating losses for tax purposes and so-called built-in losses that may exist if such an "ownership change" occurs;
· Other factors and other information contained in this document and in other reports and filings that Capitol makes with the SEC under the Exchange Act, including, without limitation, under the caption "Risk Factors"; and
· Other economic, competitive, governmental, regulatory, and technical factors affecting Capitol's operations, products, services, and prices.
For a discussion of these and other risks that may cause actual results to differ from expectations, you should refer to the risk factors and other information in this Annual Report and Capitol's other periodic filings, including quarterly reports on Form 10-Q and current reports on Form 8-K, that Capitol files from time to time with the SEC. All written or oral forward-looking statements that are made by or are attributable to Capitol are expressly qualified by this cautionary notice. You should not place undue reliance on any forward-looking statements, since those statements speak only as of the date on which the statements are made. Capitol undertakes no obligation to update any forward-looking statement to reflect events or circumstances after the date on which the statement is made to reflect the occurrence of new information or unanticipated events, except as may otherwise be required by law.
[The remainder of this page intentionally left blank]
F-10
Financial Condition and Results of Operations
This section of the Annual Report is intended to discuss, from management's perspective, matters of importance regarding Capitol's operations, financial position and other things which have a significant effect on Capitol, its business and its banks. This narrative includes some comments about future events and other forward-looking statements and readers are advised to carefully read the cautionary statement about forward-looking statements which is on page F-6 of this Annual Report.
Capitol is unique in the banking industry with its number of individually-chartered community banks. Capitol operates community banks in a wide variety of markets during an era of industry consolidation. Capitol operates in one business segment, community banking. Its banks are staffed with banking professionals, serving customers who desire professional banking services delivered personally.
In recent years, Capitol had expanded significantly through the addition of de novo banks. In 2007, 11 new banks were formed and, in 2006, 9 new banks were formed. Four de novo banks were formed in the first half of 2008. Plans for formation of additional de novo banks were terminated mid-year 2008, due to an unfavorable regulatory and capital-raising environment.
During 2009, to streamline bank operations and reduce expenses, Capitol consolidated some of its individual bank charters regionally and has plans for further charter consolidation activities in 2010. Additionally, in mid-2009, as part of its capital strategies and restructuring activities, Capitol announced plans to selectively divest some banks as a means to raise additional capital and redeploy capital resources to its remaining banks. Several divestiture transactions have been recently announced, which are subject to regulatory approval.
Capitol's community bank model, in a stable economic environment, is intended to maintain a scalable, low overhead structure which is focused on delivering return-on-equity results, while empowering its individual banks with operating autonomy in all areas which impact the customer relationship. Capitol's centralized 'back-office' functions, which support the banks, are capable of expanding coverage in concert with growth in both the number and size of affiliate banks.
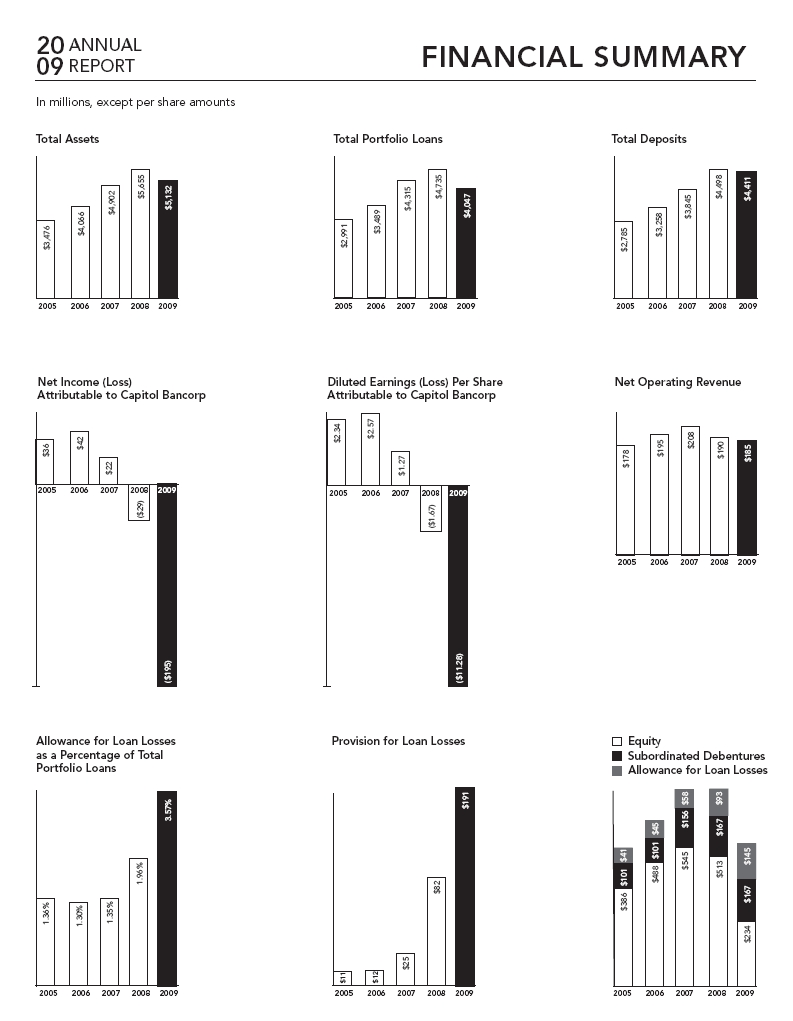
2009 and 2008 have been challenging due to significantly elevated levels of loan losses caused by economic stress on borrowers and depressed real estate collateral values, primarily at Capitol's Michigan and Arizona banks, resulting in a net loss attributable to Capitol of $195.2 million ($11.28 per share) in 2009 compared to a net loss attributable to Capitol of $28.6 million ($1.67 per share) in 2008. In 2007, Capitol reported net income attributable to Capitol of $21.9 million ($1.27 per diluted share).
F-11
Each bank began as a single-location office, led by a bank president and a team of banking professionals with significant local experience, overseen by an independent board of directors composed of business leaders drawn from that local community. Generally, each bank has significant on-site authority to make all decisions which directly affect the customer, such as credit approval and the pricing and structure of both loans and deposits. The philosophy of banking as a profession is key to Capitol's model where its banks' customers seek a relationship with banking professionals to meet their needs, as opposed to transaction-oriented financial institutions pushing financial products at customers and emphasizing market share.
With Capitol's focused banking model, bank development on a national scale has been a natural extension of this business philosophy. Bank development consists of management and oversight of banks in which Capitol has a direct or indirect controlling interest and, through mid-2008, included formation of start-up banks. Some of Capitol's banks were formed with a portion of their start-up capital provided by local investors in the communities of those banks.
Notably, 'market size' is not a big factor in Capitol's approach to bank development. Rather, the key is people. Capitol has recognized from its beginning that its banking focus always has been, and always will be, a people business. Capitol's banks are small in market stature in relation to their competitors, emphasizing personalized banking relationships.
Capitol has monitored and managed its investments in community banks working through regional presidents, supported by Capitol's bank performance group. Capitol's regional presidents and bank performance group assist the banks in the development of detailed budgets, implement asset/liability management strategies, monitor progress on the banks' business plans and review monthly operating results for each bank. In addition to monitoring operating results, Capitol assists in managing capital, including funding supplemental capital needed by the banks, subject to the availability of resources.
Bank performance and capital adequacy have been particularly challenging recently due to adverse operating results attributable to significant loan losses, adverse valuation trends in real estate and material increases in nonperforming assets.
[The remainder of this page intentionally left blank]
F-12
Capitol's relationship with its banks is multidimensional as an investor, mentor and service provider. As investor, Capitol closely monitors the financial performance of its bank subsidiaries. Capitol's mentoring role of providing assistance and guidance when and where necessary to help enhance bank performance is most important for its youngest affiliates where guidance is needed during their early formative stages. As a service provider, Capitol provides efficient back-office support services which can be performed centrally for all of its banks and which do not involve a direct interface with the bank customer, such as:
· | Accounting |
· | Capital management |
· | Credit administration |
· | Data processing |
· | Human resources administration |
· | Internal audit |
· | Legal support |
· | Risk management |
Some of these functions are performed nationally from a single location, while others are performed regionally, where it is more efficient to have personnel located geographically based on their respective responsibilities in relation to the physical location of the banks.
[The remainder of this page intentionally left blank]
F-13
Total assets and revenues of each bank within Capitol's regions are summarized below as of and for the years ended December 31, 2009 and 2008 (in $1,000s):
| Total Assets | Total Revenues(6) | ||||||||||||||
| 2009 | 2008 | 2009 | 2008 | ||||||||||||
| Arizona Region: | |||||||||||||||
| Bank of Tucson | $ | 204,933 | $ | 189,869 | $ | 12,709 | $ | 13,383 | |||||||
| Central Arizona Bank | 95,303 | 79,775 | 4,089 | 4,641 | |||||||||||
| Southern Arizona Community Bank | 94,585 | 88,146 | 5,188 | 5,907 | |||||||||||
| Sunrise Bank of Albuquerque | 78,930 | 81,977 | 4,110 | 5,203 | |||||||||||
Sunrise Bank of Arizona(4) | 495,168 | 592,666 | 23,712 | 36,081 | |||||||||||
Yuma Community Bank(5) | 73,028 | 3,225 | 5,273 | ||||||||||||
| Arizona Region Total | 968,919 | 1,105,461 | 53,033 | 70,488 | |||||||||||
| California Region: | |||||||||||||||
| Bank of Escondido | 103,469 | 96,803 | 4,767 | 5,036 | |||||||||||
| Bank of Feather River | 33,693 | 29,218 | 2,111 | 1,350 | |||||||||||
| Bank of San Francisco | 87,740 | 74,670 | 4,639 | 3,748 | |||||||||||
Bank of Santa Barbara(3) | 72,076 | 2,571 | 4,056 | ||||||||||||
| Napa Community Bank | 166,873 | 149,093 | 9,147 | 8,732 | |||||||||||
| Point Loma Community Bank | 66,700 | 61,514 | 3,400 | 3,804 | |||||||||||
| Sunrise Bank of San Diego | 83,825 | 86,322 | 4,557 | 5,415 | |||||||||||
| Sunrise Community Bank | 42,203 | 36,139 | 2,111 | 1,620 | |||||||||||
| California Region Total | 584,503 | 605,835 | 33,303 | 33,761 | |||||||||||
| Colorado Region: | |||||||||||||||
| Fort Collins Commerce Bank | 93,908 | 80,247 | 5,381 | 4,628 | |||||||||||
| Larimer Bank of Commerce | 89,623 | 88,725 | 5,333 | 4,567 | |||||||||||
| Loveland Bank of Commerce | 40,032 | 32,034 | 2,148 | 1,434 | |||||||||||
Mountain View Bank of Commerce(1) | 50,621 | 37,740 | 2,388 | 1,192 | |||||||||||
| Colorado Region Total | 274,184 | 238,746 | 15,250 | 11,821 | |||||||||||
| Great Lakes Region: | |||||||||||||||
| Bank of Auburn Hills | 35,546 | 43,856 | 2,231 | 2,766 | |||||||||||
| Bank of Maumee | 46,796 | 56,812 | 2,592 | 2,829 | |||||||||||
| Bank of Michigan | 99,344 | 78,716 | 4,860 | 4,902 | |||||||||||
| Capitol National Bank | 200,597 | 245,354 | 11,605 | 14,649 | |||||||||||
| Elkhart Community Bank | 94,163 | 99,917 | 4,558 | 5,684 | |||||||||||
| Evansville Commerce Bank | 56,392 | 63,228 | 3,458 | 4,014 | |||||||||||
| Goshen Community Bank | 81,244 | 87,419 | 4,358 | 5,140 | |||||||||||
Michigan Commerce Bank(2) | 1,089,508 | 1,275,125 | 62,982 | 79,937 | |||||||||||
| Ohio Commerce Bank | 66,175 | 60,678 | 3,263 | 2,672 | |||||||||||
| Paragon Bank & Trust | 108,235 | 107,491 | 6,271 | 7,024 | |||||||||||
| Great Lakes Region Total | 1,878,000 | 2,118,596 | 106,178 | 129,617 | |||||||||||
| Midwest Region: | |||||||||||||||
Adams Dairy Bank(1) | 44,309 | 33,867 | 2,337 | 1,621 | |||||||||||
| Bank of Belleville | 70,502 | 73,901 | 3,711 | 3,640 | |||||||||||
| Community Bank of Lincoln | 60,356 | 53,222 | 3,551 | 2,117 | |||||||||||
Summit Bank of Kansas City (3) | 53,429 | 2,780 | 3,074 | ||||||||||||
| Midwest Region Total | 175,167 | 214,419 | 12,379 | 10,452 | |||||||||||
| Nevada Region: | |||||||||||||||
1st Commerce Bank | 38,811 | 52,622 | 2,315 | 2,353 | |||||||||||
| Bank of Las Vegas | 75,313 | 73,692 | 4,430 | 4,853 | |||||||||||
| Black Mountain Community Bank | 177,822 | 157,545 | 9,479 | 10,739 | |||||||||||
| Desert Community Bank | 98,003 | 100,312 | 5,757 | 7,240 | |||||||||||
| Red Rock Community Bank | 137,648 | 126,993 | 5,810 | 7,709 | |||||||||||
| Nevada Region Total | 527,597 | 511,164 | 27,791 | 32,894 | |||||||||||
F-14
Summary of total assets and revenues – continued:
| Total Assets | Total Revenues(6) | ||||||||||||||
| 2009 | 2008 | 2009 | 2008 | ||||||||||||
| Northeast Region: | |||||||||||||||
| USNY Bank | $ | 64,176 | $ | 49,620 | $ | 3,265 | $ | 1,845 | |||||||
| Northwest Region: | |||||||||||||||
| Bank of Bellevue | 53,279 | 55,841 | 2,553 | 2,909 | |||||||||||
| Bank of Everett | 43,876 | 44,756 | 2,384 | 2,144 | |||||||||||
| Bank of Tacoma | 39,223 | 44,241 | 2,350 | 2,060 | |||||||||||
| High Desert Bank | 41,849 | 41,904 | 2,429 | 1,497 | |||||||||||
| Issaquah Community Bank | 37,627 | 36,942 | 2,105 | 1,296 | |||||||||||
| Northwest Region Total | 215,854 | 223,684 | 11,821 | 9,906 | |||||||||||
| Southeast Region: | |||||||||||||||
| Bank of Valdosta | 55,156 | 58,995 | 2,782 | 3,156 | |||||||||||
Community Bank of Rowan(3) | 138,341 | 4,962 | 7,311 | ||||||||||||
| First Carolina State Bank | 115,716 | 119,774 | 5,473 | 6,076 | |||||||||||
| Peoples State Bank | 26,198 | 29,233 | 1,361 | 1,705 | |||||||||||
Pisgah Community Bank(1) | 62,773 | 36,897 | 2,478 | 691 | |||||||||||
| Sunrise Bank of Atlanta | 55,966 | 62,198 | 3,668 | 4,434 | |||||||||||
| Southeast Region Total | 315,809 | 445,438 | 20,724 | 23,373 | |||||||||||
| Texas Region: | |||||||||||||||
| Bank of Fort Bend | 31,548 | 26,424 | 1,640 | 922 | |||||||||||
| Bank of Las Colinas | 43,003 | 31,354 | 1,979 | 1,288 | |||||||||||
| Texas Region Total | 74,551 | 57,778 | 3,619 | 2,210 | |||||||||||
Other, net(7) | 53,180 | 84,095 | 8,309 | 4,380 | |||||||||||
| Consolidated Totals | $ | 5,131,940 | $ | 5,654,836 | $ | 295,672 | $ | 330,747 | |||||||
| (1) | Became a Capitol affiliate in 2008 and is included for periods after addition to the Capitol banking network. |
| (2) | Effective March 31, 2009, Brighton Commerce Bank, Detroit Commerce Bank, Grand Haven Bank, Kent Commerce Bank, Macomb Community Bank, Muskegon Commerce Bank, Oakland Commerce Bank and Portage Commerce Bank merged with and into Ann Arbor Commerce Bank. Upon completion of the merger, the surviving bank was renamed Michigan Commerce Bank. Prior to the merger, each bank was a wholly-owned subsidiary of Capitol. |
| (3) | Bank of Santa Barbara, Community Bank of Rowan and Summit Bank of Kansas City are majority-owned subsidiaries of Capitol Development Bancorp Limited (CDBL) III of which Capitol ceased to have a majority voting control effective September 30, 2009; consequently those banks and CDBL III ceased to be consolidated subsidiaries of Capitol. CDBL III's ownership interest in Bank of Santa Barbara was sold in November 2009. |
| (4) | Effective December 14, 2009, Arrowhead Community Bank, Asian Bank of Arizona, Colonia Bank, Mesa Bank and Sunrise Bank of Arizona merged with and into Camelback Community Bank. Upon completion of the merger, the surviving bank was renamed Sunrise Bank of Arizona. Prior to the merger, each of the banks were either wholly-owned subsidiaries of Capitol or majority-owned by a bank development subsidiary in which Capitol holds a controlling interest. |
| (5) | Capitol sold its ownership in Yuma Community Bank effective September 21, 2009. The bank's operations are included in Capitol's consolidated totals up to the date of sale. |
| (6) | Total revenues is the sum of interest income and noninterest income. |
| (7) | Includes corporate and other nonbank entities. |
[The remainder of this page intentionally left blank]
F-15
For 2009, a net loss attributable to Capitol was incurred of approximately $195.2 million ($11.28 per share) compared to a net loss attributable to Capitol of $28.6 million ($1.67 per share) in 2008. Net income attributable to Capitol in 2007 approximated $21.9 million ($1.27 per diluted share).
The table below summarizes, for Capitol's banks individually and regionally, net income (loss) (in $1,000s) and the related rates of return on average equity and assets, where applicable:
| Net Income (Loss) | Return on Average Equity | Return on Average Assets | ||||||||||||||||||||||||||||||||||
| 2009 | 2008 | 2007 | 2009 | 2008 | 2007 | 2009 | 2008 | 2007 | ||||||||||||||||||||||||||||
| Arizona Region: | ||||||||||||||||||||||||||||||||||||
| Bank of Tucson | $ | 1,833 | $ | 3,717 | $ | 4,527 | 10.12 | % | 20.56 | % | 26.48 | % | 0.91 | % | 2.04 | % | 2.52 | % | ||||||||||||||||||
| Central Arizona Bank | (5,892 | ) | (1,004 | ) | 327 | 4.10 | % | 0.46 | % | |||||||||||||||||||||||||||
| Southern Arizona Community Bank | 434 | 639 | 1,082 | 4.73 | % | 7.06 | % | 12.04 | % | 0.48 | % | 0.72 | % | 1.22 | % | |||||||||||||||||||||
| Sunrise Bank of Albuquerque | (1,746 | ) | 224 | 601 | 3.05 | % | 8.95 | % | 0.29 | % | 0.86 | % | ||||||||||||||||||||||||
Sunrise Bank of Arizona(4) | (48,628 | ) | (13,505 | ) | 5,639 | 10.29 | % | 6.36 | % | |||||||||||||||||||||||||||
Yuma Community Bank(5) | 372 | 565 | 936 | 7.69 | % | 7.23 | % | 12.09 | % | 0.78 | % | 0.75 | % | 1.08 | % | |||||||||||||||||||||
| Arizona Region Total | (53,627 | ) | (9,364 | ) | 13,112 | |||||||||||||||||||||||||||||||
| California Region: | ||||||||||||||||||||||||||||||||||||
| Bank of Escondido | (1,107 | ) | 361 | 505 | 2.53 | % | 3.54 | % | 0.38 | % | 0.58 | % | ||||||||||||||||||||||||
| Bank of Feather River | (714 | ) | (487 | ) | (576 | ) | ||||||||||||||||||||||||||||||
| Bank of San Francisco | 52 | 43 | (397 | ) | 0.63 | % | 0.51 | % | 0.06 | % | 0.07 | % | ||||||||||||||||||||||||
Bank of Santa Barbara(3) | (1,300 | ) | (420 | ) | (191 | ) | ||||||||||||||||||||||||||||||
| Napa Community Bank | 485 | 1,223 | 1,542 | 3.01 | % | 8.39 | % | 11.73 | % | 0.32 | % | 0.93 | % | 1.29 | % | |||||||||||||||||||||
| Point Loma Community Bank | (1,869 | ) | 294 | 168 | 4.00 | % | 2.37 | % | 0.50 | % | 0.31 | % | ||||||||||||||||||||||||
| Sunrise Bank of San Diego | (2,141 | ) | 300 | 432 | 2.81 | % | 4.06 | % | 0.33 | % | 0.50 | % | ||||||||||||||||||||||||
| Sunrise Community Bank | (3,198 | ) | (646 | ) | (998 | ) | ||||||||||||||||||||||||||||||
| California Region Total | (9,792 | ) | 668 | 485 | ||||||||||||||||||||||||||||||||
| Colorado Region: | ||||||||||||||||||||||||||||||||||||
| Fort Collins Commerce Bank | 15 | 620 | 588 | 0.15 | % | 6.71 | % | 6.81 | % | 0.02 | % | 0.89 | % | 1.07 | % | |||||||||||||||||||||
| Larimer Bank of Commerce | 57 | 465 | (586 | ) | 0.70 | % | 6.09 | % | 0.06 | % | 0.66 | % | ||||||||||||||||||||||||
| Loveland Bank of Commerce | (872 | ) | (458 | ) | (426 | ) | ||||||||||||||||||||||||||||||
Mountain View Bank of Commerce(1) | (31 | ) | (819 | ) | ||||||||||||||||||||||||||||||||
| Colorado Region Total | (831 | ) | (192 | ) | (424 | ) | ||||||||||||||||||||||||||||||
| Great Lakes Region: | ||||||||||||||||||||||||||||||||||||
| Bank of Auburn Hills | (3,938 | ) | (957 | ) | (335 | ) | ||||||||||||||||||||||||||||||
| Bank of Maumee | (2,834 | ) | (774 | ) | (1,063 | ) | ||||||||||||||||||||||||||||||
| Bank of Michigan | 152 | 543 | (136 | ) | 2.16 | % | 7.95 | % | 0.16 | % | 0.76 | % | ||||||||||||||||||||||||
| Capitol National Bank | (7,175 | ) | (766 | ) | 1,977 | 10.45 | % | 0.84 | % | |||||||||||||||||||||||||||
| Elkhart Community Bank | (3,535 | ) | 39 | 766 | 0.45 | % | 8.67 | % | 0.04 | % | 0.90 | % | ||||||||||||||||||||||||
| Evansville Commerce Bank | (1,644 | ) | (248 | ) | (689 | ) | ||||||||||||||||||||||||||||||
| Goshen Community Bank | (39 | ) | 178 | 431 | 2.23 | % | 5.72 | % | 0.22 | % | 0.54 | % | ||||||||||||||||||||||||
Michigan Commerce Bank(2) | (69,569 | ) | (13,768 | ) | 6,050 | 5.66 | % | 0.48 | % | |||||||||||||||||||||||||||
| Ohio Commerce Bank | 206 | (149 | ) | (770 | ) | 2.24 | % | 0.33 | % | |||||||||||||||||||||||||||
| Paragon Bank & Trust | (7,555 | ) | (1,501 | ) | (187 | ) | ||||||||||||||||||||||||||||||
| Great Lakes Region Total | (95,931 | ) | (17,403 | ) | 6,044 | |||||||||||||||||||||||||||||||
| Midwest Region | ||||||||||||||||||||||||||||||||||||
Adams Dairy Bank(1) | (66 | ) | (669 | ) | ||||||||||||||||||||||||||||||||
| Bank of Belleville | 122 | 35 | (572 | ) | 1.79 | % | 0.49 | % | 0.17 | % | 0.06 | % | ||||||||||||||||||||||||
| Community Bank of Lincoln | (1,516 | ) | (643 | ) | (500 | ) | ||||||||||||||||||||||||||||||
Summit Bank of Kansas City(3) | (978 | ) | (97 | ) | (404 | ) | ||||||||||||||||||||||||||||||
| Midwest Region Total | (2,438 | ) | (1,374 | ) | (1,476 | ) | ||||||||||||||||||||||||||||||
F-16
Net income (loss) and the related rates of return on average equity and assets – continued:
| Net Income (Loss) | Return on Average Equity | Return on Average Assets | |||||||||||||||||||||||||||||||||||
| 2009 | 2008 | 2007 | 2009 | 2008 | 2007 | 2009 | 2008 | 2007 | |||||||||||||||||||||||||||||
| Nevada Region: | |||||||||||||||||||||||||||||||||||||
1st Commerce Bank | $ | (3,009 | ) | $ | (1,158 | ) | $ | (578 | ) | ||||||||||||||||||||||||||||
| Bank of Las Vegas | (2,112 | ) | 44 | 608 | 0.51 | % | 6.77 | % | 0.06 | % | 0.83 | % | |||||||||||||||||||||||||
| Black Mountain Community Bank | (1,305 | ) | 2,001 | 2,612 | 13.40 | % | 18.40 | % | 1.30 | % | 1.81 | % | |||||||||||||||||||||||||
| Desert Community Bank | (2,423 | ) | 596 | 1,296 | 5.87 | % | 13.54 | % | 0.58 | % | 1.35 | % | |||||||||||||||||||||||||
| Red Rock Community Bank | (5,435 | ) | 660 | 1,652 | 4.83 | % | 12.34 | % | 0.54 | % | 1.44 | % | |||||||||||||||||||||||||
| Nevada Region Total | (14,284 | ) | 2,143 | 5,590 | |||||||||||||||||||||||||||||||||
| Northeast Region: | |||||||||||||||||||||||||||||||||||||
| USNY Bank | (1,188 | ) | (748 | ) | (908 | ) | |||||||||||||||||||||||||||||||
| Northwest Region: | |||||||||||||||||||||||||||||||||||||
| Bank of Bellevue | (1,929 | ) | (146 | ) | (154 | ) | |||||||||||||||||||||||||||||||
| Bank of Everett | (2,670 | ) | (956 | ) | (636 | ) | |||||||||||||||||||||||||||||||
| Bank of Tacoma | (3,710 | ) | (824 | ) | (1,067 | ) | |||||||||||||||||||||||||||||||
| High Desert Bank | (2,948 | ) | (801 | ) | (514 | ) | |||||||||||||||||||||||||||||||
| Issaquah Community Bank | (1,580 | ) | (627 | ) | (574 | ) | |||||||||||||||||||||||||||||||
| Northwest Region Total | (12,837 | ) | (3,354 | ) | (2,945 | ) | |||||||||||||||||||||||||||||||
| Southeast Region: | |||||||||||||||||||||||||||||||||||||
| Bank of Valdosta | (1,643 | ) | (139 | ) | (423 | ) | |||||||||||||||||||||||||||||||
Community Bank of Rowan(3) | 459 | 945 | (183 | ) | 5.73 | % | 9.39 | % | 0.47 | % | 0.76 | % | |||||||||||||||||||||||||
| First Carolina State Bank | (1,885 | ) | (403 | ) | 539 | 4.52 | % | 0.53 | % | ||||||||||||||||||||||||||||
| Peoples State Bank | (2,320 | ) | (72 | ) | 254 | 5.14 | % | 0.93 | % | ||||||||||||||||||||||||||||
Pisgah Community Bank(1) | (1,417 | ) | (920 | ) | |||||||||||||||||||||||||||||||||
| Sunrise Bank of Atlanta | (4,239 | ) | (554 | ) | (338 | ) | |||||||||||||||||||||||||||||||
| Southeast Region Total | (11,045 | ) | (1,143 | ) | (151 | ) | |||||||||||||||||||||||||||||||
| Texas Region: | |||||||||||||||||||||||||||||||||||||
| Bank of Fort Bend | (1,268 | ) | (829 | ) | (461 | ) | |||||||||||||||||||||||||||||||
| Bank of Las Colinas | (1,259 | ) | (623 | ) | (658 | ) | |||||||||||||||||||||||||||||||
| Texas Region Total | (2,527 | ) | (1,452 | ) | (1,119 | ) | |||||||||||||||||||||||||||||||
Other, net(6) | (60,040 | ) | (20,232 | ) | (14,874 | ) | |||||||||||||||||||||||||||||||
| Consolidated totals | $ | (264,540 | ) | $ | (52,451 | ) | $ | 3,334 | 5.72 | % | 0.49 | % | |||||||||||||||||||||||||
| (1) | Became a Capitol affiliate in 2008 and is included for periods after addition to the Capitol banking network. |
| (2) | Effective March 31, 2009, Brighton Commerce Bank, Detroit Commerce Bank, Grand Haven Bank, Kent Commerce Bank, Macomb Community Bank, Muskegon Commerce Bank, Oakland Commerce Bank and Portage Commerce Bank merged with and into Ann Arbor Commerce Bank. Upon completion of the merger, the surviving bank was renamed Michigan Commerce Bank. Prior to the merger, each bank was a wholly-owned subsidiary of Capitol. |
| (3) | Bank of Santa Barbara, Community Bank of Rowan and Summit Bank of Kansas City are majority-owned subsidiaries of CDBL III of which Capitol ceased to have a majority voting control effective September 30, 2009; consequently those banks and CDBL III ceased to be consolidated subsidiaries of Capitol. CDBL III's ownership interest in Bank of Santa Barbara was sold in November 2009. |
| (4) | Effective December 14, 2009, Arrowhead Community Bank, Asian Bank of Arizona, Colonia Bank, Mesa Bank and Sunrise Bank of Arizona merged with and into Camelback Community Bank. Upon completion of the merger, the surviving bank was renamed Sunrise Bank of Arizona. Prior to the merger, each of the banks were either wholly-owned subsidiaries of Capitol or majority-owned by a bank development subsidiary in which Capitol holds a controlling interest. |
| (5) | Capitol sold its ownership in Yuma Community Bank effective September 21, 2009. The bank's operations are included in Capitol's consolidated totals up to the date of the sale. |
| (6) | Includes corporate and other nonbank entities. |
The preceding table presents net income (loss) of each bank without regard to Capitol's direct or indirect ownership percentage and indicates significant losses incurred at banks within the Great Lakes and Arizona Regions. Dominating the Great Lakes Region are Capitol's three mature, majority-owned banks located in Michigan. Operating results of this group of banks amounted to a net loss of $84.3 million in 2009, compared to $16.0 million in 2008 and net income of $7.8 million in 2007. The unprecedented 2009 operating losses of this group of banks was
F-17
attributable to loan losses stemming from a sustained difficult economy, significant increases in nonperforming assets, depressed real estate valuations, a weak or nonexistent real estate sales environment and elevated collection costs. These, coupled with loan losses incurred at Sunrise Bank of Arizona, where its adverse asset quality and related loans as a percentage of capital exceed other regions, are the largest items adversely impacting Capitol's 2009 consolidated operating results, followed by valuation losses recognized at the parent level and compression in margins and related net interest income.
The principal revenue source for Capitol's banks is interest income from loans. Net interest income is the total of all interest income minus all interest expense. This is an important measure that is used to help determine the amount of net operating revenue for financial institutions. Net operating revenue is the sum of net interest income and noninterest income.
Net interest income totaled $156.4 million in 2009, a 4.6% decrease from the $163.8 million reported in 2008, compared to an 11% decrease in 2008 versus a 5% increase in 2007. The decreases in net interest income are due to sharp increases in nonperforming assets and a challenging interest rate environment which reduced the spread between interest earned on loans and rates paid on deposits. The modest 2007 increase in net interest income was due to balance-sheet growth offset by compression in margins, resulting from lower rates earned on loans and elevated levels of nonperforming loans, coupled with the slower repricing of rates paid on deposits and decreased loan volume.
Combined with noninterest income, total consolidated net operating revenue approximated $185.2 million in 2009, $190.3 million in 2008 and $207.7 million in 2007. Noninterest income for these years was $28.8 million, $26.4 million and $24.4 million, respectively. Noninterest income increased 8.9% in 2009.
Service charges approximated $5.9 million in 2009 and 2008 ($4.8 million in 2007). Revenue from trust and wealth management decreased 20% in 2009, following increases of 20% in 2008 and 54% in 2007, after the late-2005 launch of Capitol Wealth, Inc. (Capitol Wealth), an initiative to expand Capitol's banks' scope of services in meeting the needs of their clients beyond loans and deposits. Full-time Capitol Wealth advisors are located at several of Capitol's banks to work in tandem with their traditional banking colleagues to expand the availability of financial services to the banks' clientele, while increasing noninterest revenues. Capitol Wealth has not yet achieved profitability, although it has recently become cash-flow neutral and its revenues decreased in 2009 due to market volatility and client activity.
In 2009, 2008 and 2007, revenue from mortgage loans originated for sale included in other noninterest income amounted to $3.9 million, $3.6 million and $4.5 million, respectively. Loan origination volume fluctuated in these periods as the instability of residential real estate market conditions has negatively impacted residential mortgage origination volume. Total other noninterest income increased 15.7% in 2009 and 19.2% in 2008. Due to the nature of these revenues, including gains on the sale of government-guaranteed loans and other gains, the amounts can vary significantly from year to year depending on interest rates, business opportunities and other activities, including gains on sale of bank subsidiaries.
F-18
Net interest income was insufficient in 2009 to offset the provision for loan losses. The provision for loan losses approximated $190.7 million, $82.5 million and $25.3 million in 2009, 2008 and 2007, respectively. The dramatic increase in the provision for loan losses in 2009 was primarily associated with loan losses and related significantly elevated levels of nonperforming loans incurred within the Great Lakes Region's Michigan banks and the Arizona-based Sunrise Bank of Arizona. The amount of the provision for loan losses is determined based on management's analysis of amounts necessary for the allowance for loan losses; this is discussed in greater detail later in the Capitol's Financial Position section of this narrative.
Noninterest expense totaled $240.6 million, $190.4 million and $176.2 million in 2009, 2008 and 2007, respectively. In total, these expenses increased 26.4% in 2009, 8.1% in 2008 and 27.8% in 2007. Increases in the components of noninterest expense in 2009 were primarily associated with the costs of foreclosed properties and other real estate owned and FDIC insurance premiums.
The largest element of noninterest expense is salaries and employee benefits which approximated $99.6 million, $108.7 million and $106.6 million in 2009, 2008 and 2007, respectively. Employee compensation costs decreased about 8.4% in 2009 as a result of Capitol's efforts to reduce and streamline staffing at its banks and corporate offices. Increases in employee compensation costs in 2008 and 2007 resulted primarily from the formation of start-up banks during those periods. Most recently, for the fourth quarter of 2009 salaries and employee benefits were reduced 13.5% from the corresponding period of 2008. Further reductions are anticipated during 2010.
Preopening and start-up costs of de novo banks and bank-development subsidiaries approximated $1.9 million in 2008 and $5.7 million in 2007 (none in 2009) which related to the number of new affiliates during those periods.
Occupancy costs increased slightly by 3.4% in 2009, after increasing more significantly in 2008 and 2007 (23.7% and 24.5%, respectively), due to newly-formed banks during those years.
Equipment rent, depreciation and maintenance expense increased $6.9 million (55.6%) in 2009, primarily related to estimated loss accruals on certain leased property. This category increased about 23.3% in 2008 and 19.5% in 2007 due to newly-formed banks.
Costs associated with foreclosed properties and other real estate owned increased significantly in 2009 to $45.7 million from $6.9 million in 2008 and $1.0 million in 2007; such increases corresponded with sharp increases in related other real estate owned which increased from $16.4 million at the beginning of 2008 to $67.2 million at year-end 2008, and $111.8 million at December 31, 2009. Most of the costs associated with foreclosed properties and other real estate owned resulted from adverse valuation adjustments.
F-19
FDIC insurance premiums and other regulatory fees increased significantly by 280% in 2009 as compared with a 49% increase in 2008 and a 210% increase in 2007. FDIC insurance premiums are expected to continue increasing significantly in the future as the FDIC seeks to bolster its insurance fund after incurring numerous losses due to bank failures and higher levels of deposit insurance.
The more significant elements of other noninterest expense consisted of the following (in $1,000s):
| 2009 | 2008 | 2007 | |||||||||
| Legal fees | $ | 2,925 | $ | 1,400 | $ | 644 | |||||
| Professional fees | 2,814 | 1,637 | 1,824 | ||||||||
| Loan and collection expense | 2,650 | 1,990 | 1,952 | ||||||||
Bank services (ATMs, telephone banking and Internet banking) | 2,627 | 2,622 | 2,115 | ||||||||
| Directors' fees | 2,288 | 2,828 | 2,819 | ||||||||
| Paper, printing and supplies | 2,025 | 2,825 | 2,870 | ||||||||
| Advertising | 1,988 | 3,261 | 3,315 | ||||||||
| Travel, lodging and meals | 1,828 | 2,998 | 3,080 | ||||||||
| Communications | 1,728 | 2,197 | 1,728 | ||||||||
| Insurance | 1,361 | 629 | 473 | ||||||||
| Postage | 1,230 | 1,323 | 1,113 | ||||||||
| Taxes other than income taxes | 919 | 825 | 1,786 | ||||||||
| Dues and memberships | 859 | 974 | 928 | ||||||||
| Courier service | 711 | 902 | 997 | ||||||||
| Contracted labor | 285 | 426 | 496 | ||||||||
| Other | 15,195 | 10,974 | 8,951 | ||||||||
| Total | $ | 41,433 | $ | 37,811 | $ | 35,091 | |||||
Income tax expense approximated $18.4 million in 2009, primarily resulting from the combined effect of recording a valuation allowance for deferred income tax assets at December 31, 2009 ($104.5 million), recoverable income taxes of $43.8 million and a credit for deferred income taxes of $43.4 million (subject to the valuation allowance). A valuation allowance for deferred income tax assets was recorded based on management's assessment of the realizability of such assets not meeting the requisite more-likely-than-not criteria at December 31, 2009.
The amount of recoverable income taxes increased significantly in 2009 due to the Corporation's operating loss and a nonrecurring opportunity to "carryback" such losses to recover taxes paid during the preceding five years. Loss carryback rules were previously limited to the most recent two-year period, which resumes as the limitation effective January 1, 2010.
The valuation allowance for deferred income tax assets should reduce future income tax expense to the extent of Capitol's profitability.
Capitol's effective tax rate was 36.5% in 2008 and 45.9% in 2007. The statutory federal income tax rate applicable to Capitol is 35%. The effective tax rate includes state income taxes, but excludes taxes incurred in states which are based on measures other than income (which are shown in the table above).
F-20
Consolidated total assets decreased in 2009 to $5.1 billion from $5.7 billion at the end of 2008. Total assets were $4.9 billion at the beginning of 2008. The 2009 decrease in total assets primarily resulted from Capitol's efforts to 'deleverage' its consolidated balance sheet through reductions in portfolio loans and borrowings.
Key to the balance sheet of Capitol is its total capital position (subordinated debentures and total equity approximating $401.0 million or 7.8% of total assets) and liquidity (cash and cash equivalents of $808.9 million or 15.8% of total assets) at December 31, 2009. Both of those key elements are discussed in the next section, Liquidity, Capital Resources and Capital Adequacy.
When considering Capitol's financial position, as shown in its consolidated balance sheet, clearly the single largest asset category is portfolio loans. Accordingly, the narrative in this section is devoted primarily to loans and related aspects of asset quality.
Net portfolio loans (total portfolio loans after subtracting the allowance for loan losses) approximated $3.9 billion at December 31, 2009 and $4.6 billion at December 31, 2008. These amounts approximated 76% of total consolidated assets at December 31, 2009 and 82% at December 31, 2008. Loan growth slowed in 2008 and Capitol's efforts to deleverage its balance sheet, as previously mentioned, helped reduce portfolio loans in 2009.
Capitol's banks have emphasized commercial loans, consistent with their focus on lending to local entrepreneurs, professional service firms and other businesses. All of Capitol's banks use a common credit policy; however, most credit decisions are made at the local level at each community bank. The utilization of an enterprise-wide credit policy has several key benefits to Capitol and its banks, such as procedural guidance for:
· | Loan underwriting and documentation |
· | Credit granting authorities within the bank |
· | Acceptable collateral and loan structuring |
· | Loan participations amongst other affiliates or other funding sources when proposals exceed an individual bank's limitations |
· | Collections and workouts |
· | Documenting and evaluating the adequacy of the allowance for loan losses |
· | Establishing corporate credit administration resources to aid the banks when needed |
F-21
The underwriting standards to be followed for loans secured by real estate are basic credit granting fundamentals applicable to any extension of credit. For construction loans, the banks follow these general underwriting policies enhanced by awareness of the increased risk of construction loans. General underwriting policies include analyzing and documenting:
· | Borrower and project financial data |
· | Contingent liabilities and related cash flows |
· | Adequacy of liquidity and the components of net worth |
· | Historic and projected cash flow data, including interest and vacancy rates sensitivity analysis |
· | Character, credit history and management ability |
· | Appraisal market valuation, local market conditions and volatility |
· | Proposed use of the project and potential future uses of the property |
Additional lending requirements include regulatory loan-to-value guidelines which are calculated based on current appraised value for loans that finance properties acquired by the borrower.
Variable-rate commercial loans are currently emphasized during today's historically-low interest rate environment. Most variable-rate commercial loans have floors and are underwritten with evaluation of the borrower's ability to repay based on fully-indexed rates. Since substantially all residential mortgage loan origination volume is underwritten to secondary-market standards and the loans are sold into those markets without recourse, Capitol and its banks have no material exposure to hybrid loans such as option-ARMs or subprime credits.
As part of the banks' emphasis on commercial lending, commercial real estate has been sought as the primary source of collateral for commercial loans when possible. This emphasis on use of commercial real estate as collateral has been a consistent practice of Capitol and its banks from their earliest days of operation, based on the use of appropriate loan-to-value ratios at the time of loan origination, avoidance of large real estate development projects and the belief that, even in volatile economies, commercial real estate tends to have substantially less loss potential than other types of business-asset collateral, such as receivables, inventory and equipment.
In the current economic environment, market conditions and related values of real estate as collateral have deteriorated significantly as evidenced by adverse asset quality trends in 2009 and 2008 and related large levels of loan losses and negative valuation adjustments of other real estate owned. Other real estate owned results from properties acquired through a foreclosure proceeding or acceptance of a deed in lieu of foreclosure. Those properties are held for sale at the lower of cost or fair value, less estimated selling cost, and are reviewed periodically for subsequent impairment.
F-22
There is significant uncertainty in future real estate values, appraisal results and the resulting potential impact on valuation of collateral-dependent loans and other real estate owned. The fair value measurement of collateral-dependent loans and other real estate owned is dependent primarily upon appraisal of the underlying property value. Management cautiously monitors real estate and related appraisal data when evaluating the fair value of real estate collateral.
Updated appraisals are generally obtained when it has been determined that a collateral-dependent loan has become impaired or when it is likely a real-estate loan will be foreclosed. Adjustments to the loan's carrying value (or requirements for the allowance for loan losses) are made, when appropriate, after review and acceptance of the appraisal or subsequently adjusted if it is determined that estimated fair value declines further. The timing of the recognition of a collateral-dependent loan as nonperforming is dependent on several factors, including the performance of the loan, the payment history of the loan or the receipt of updated borrower financial information.
When borrower performance has deteriorated (for example, sales or leasing has not occurred as expected), the borrower has become late on the required payments or financial information received indicates adverse financial trends, the loan will be downgraded and, if appropriate, an updated appraisal will be ordered. In the interim period between loans being recognized as impaired and receipt of an updated appraisal, the loan will be included within loss contingency pools (for purposes of estimating requirements for the allowance for loan losses). Upon receipt, review and acceptance of an updated appraisal and after any further fair value analysis is completed, the loan will be further evaluated for any appropriate charge-down. Generally, negative differences between appraised value, less the estimated cost to sell, and the carrying value of the loan are charged to the allowance for loan losses when the appraisal has been received, reviewed and accepted. Occasionally, additional amounts may be included in the estimate of requirements for the allowance for loan losses if there are circumstances pending which may adversely impact the fair value estimate. Internally-developed evaluations may be used when the amount of the loan is less than $250,000. Internal evaluations may also be used when the most recent appraisal date is relatively recent (such as within a year) and economic conditions result in corrections or further deterioration. Updated fair value information is generally obtained at least annually for collateral-dependent loans and other real estate owned.
Loans may be deemed collateral-dependent when repayment is expected solely from liquidation of the loan's collateral. Many of Capitol's collateral-dependent impaired loans are located in severely depressed real estate markets, such as Michigan, Arizona and Nevada in 2009. In those markets, appraisal data may be of limited usefulness in estimating fair value because comparable sale transactions are infrequent, may not be orderly and may be distressed or forced. In accordance with recent accounting guidance on fair value estimates, management made adjustments to appraisal data in early 2009, reducing estimated losses which would otherwise be recognized based on appraisals which appear to be biased by forced or distressed sales. Bank regulatory agencies have encouraged Capitol's banks to base fair value estimates upon appraisal data in substantially all valuations of real estate. As of December 31, 2009, substantially all estimates of fair value for collateral-dependent loans and other real estate owned were based on appraisal data or other independent estimates, such as broker price opinions.
F-23
A potentially negative aspect of real estate as a primary source of collateral for commercial loans is that when some commercial loans develop performance difficulties and reach nonperforming status (i.e., becoming 90 days past due or being placed on nonaccrual status), the resolution period can be long due to the foreclosure process and may be further extended if the real estate sales environment is weak or nonexistent as in the current severe recessionary environment. In contrast, a commercial loan secured by receivables, inventory or equipment, which becomes nonperforming, tends to have a higher loss potential due to the probable rapid dissipation of collateral value.
At December 31, 2009, the consolidated allowance for loan losses approximated $145 million or 3.57% of total portfolio loans outstanding, compared with $93 million or 1.96% at December 31, 2008. As stated earlier, the allowance is based on management's analysis of inherent losses in the loan portfolio at the balance-sheet date.
As noted in the Critical Accounting Policies section, which appears later in this narrative, the extensive use of estimates in determining the allowance for loan losses is very important for an understanding of Capitol's consolidated financial statements. Simply stated, the allowance for loan losses is management's estimate of loan losses inherent in the loan portfolio at the balance-sheet date. The allowance for loan losses is increased by provisions for loan losses, which are charged against operations, and reduced by net loan write-offs which are charged against the allowance. There are many ways to estimate losses or 'loss reserves' and there is no one 'right' way. Because the allowance for loan losses and fair values of real estate are based on estimates, actual loss experience will differ from those estimates.
Capitol had 47 separately chartered banks at year-end 2009. Each bank separately computes and documents the adequacy of its respective allowance for loan losses. As mentioned previously, Capitol has a uniform, enterprise-wide credit policy which, among other things, provides the banks guidance on evaluating and documenting the adequacy of the allowance for loan losses. Essentially, a standardized computational template is used consistently by all of Capitol's banks. The template includes elements for all portfolio loan categories for performing loans, nonperforming loans, watch credits and environmental factors. While a standardized template is utilized, management is required to apply subjective judgment in determining risk factors specific to their banks and other matters in determining the allowance needed at the bank level. Further, the combined results of the banks' separate analyses are evaluated at the Capitol, or parent, level on a judgmental basis. The process to evaluate and determine the adequacy of the allowance for loan losses at each individual bank and on a consolidated basis is labor intensive and requires a high degree of judgment. It is possible that others, given the same information, may at any point in time reach different reasonable conclusions.
F-24
The following table summarizes portfolio loans, the allowance for loan losses and nonperforming loans for each of the banks, regionally, and on a consolidated basis (in $1,000s) as of December 31:
Total Portfolio Loans | Allowance for Loan Losses | Nonperforming Loans | Allowance as a % of Total Portfolio Loans | |||||||||||||||||||||||||||||
| 2009 | 2008 | 2009 | 2008 | 2009 | 2008 | 2009 | 2008 | |||||||||||||||||||||||||
| Arizona Region: | ||||||||||||||||||||||||||||||||
| Bank of Tucson | $ | 168,809 | $ | 168,390 | $ | 1,904 | $ | 1,550 | $ | 5,110 | $ | 2,462 | 1.13 | % | 0.92 | % | ||||||||||||||||
| Central Arizona Bank | 66,058 | 69,372 | 3,389 | 1,339 | 3,132 | 1,895 | 5.13 | % | 1.93 | % | ||||||||||||||||||||||
| Southern Arizona Community Bank | 79,190 | 79,434 | 1,150 | 875 | 848 | 1.45 | % | 1.10 | % | |||||||||||||||||||||||
| Sunrise Bank of Albuquerque | 61,077 | 74,115 | 1,256 | 933 | 3,436 | 43 | 2.06 | % | 1.26 | % | ||||||||||||||||||||||
Sunrise Bank of Arizona(4) | 346,134 | 452,934 | 17,382 | 8,387 | 32,929 | 36,488 | 5.02 | % | 1.85 | % | ||||||||||||||||||||||
Yuma Community Bank(5) | 63,804 | 730 | 1,506 | 1.14 | % | |||||||||||||||||||||||||||
| Arizona Region Total | 721,268 | 908,049 | 25,081 | 13,814 | 45,455 | 42,394 | 3.48 | % | 1.52 | % | ||||||||||||||||||||||
| California Region: | ||||||||||||||||||||||||||||||||
| Bank of Escondido | 69,179 | 62,608 | 1,777 | 810 | 2,047 | 817 | 2.57 | % | 1.29 | % | ||||||||||||||||||||||
| Bank of Feather River | 26,941 | 22,962 | 347 | 320 | 1.29 | % | 1.39 | % | ||||||||||||||||||||||||
| Bank of San Francisco | 74,782 | 60,772 | 1,384 | 823 | 243 | 299 | 1.85 | % | 1.35 | % | ||||||||||||||||||||||
Bank of Santa Barbara(3) | 60,535 | 1,138 | 1,841 | 1.88 | % | |||||||||||||||||||||||||||
| Napa Community Bank | 139,497 | 130,150 | 2,493 | 1,890 | 3,746 | 1,848 | 1.79 | % | 1.45 | % | ||||||||||||||||||||||
| Point Loma Community Bank | 51,257 | 52,497 | 1,256 | 797 | 1,742 | 795 | 2.45 | % | 1.52 | % | ||||||||||||||||||||||
| Sunrise Bank of San Diego | 62,970 | 76,282 | 2,486 | 1,048 | 4,362 | 1,444 | 3.95 | % | 1.37 | % | ||||||||||||||||||||||
| Sunrise Community Bank | 31,276 | 28,355 | 1,212 | 440 | 541 | 3.88 | % | 1.55 | % | |||||||||||||||||||||||
| California Region Total | 455,902 | 494,161 | 10,955 | 7,266 | 12,681 | 7,044 | 2.40 | % | 1.47 | % | ||||||||||||||||||||||
| Colorado Region: | ||||||||||||||||||||||||||||||||
| Fort Collins Commerce Bank | 83,047 | 74,280 | 1,308 | 1,101 | 1,291 | 48 | 1.58 | % | 1.48 | % | ||||||||||||||||||||||
| Larimer Bank of Commerce | 79,239 | 78,638 | 1,467 | 1,160 | 1.85 | % | 1.48 | % | ||||||||||||||||||||||||
| Loveland Bank of Commerce | 33,582 | 27,251 | 560 | 652 | 156 | 1,090 | 1.67 | % | 2.39 | % | ||||||||||||||||||||||
Mountain View Bank of Commerce(1) | 40,201 | 32,180 | 621 | 474 | 1.54 | % | 1.47 | % | ||||||||||||||||||||||||
| Colorado Region Total | 236,069 | 212,349 | 3,956 | 3,387 | 1,447 | 1,138 | 1.68 | % | 1.60 | % | ||||||||||||||||||||||
| Great Lakes Region: | ||||||||||||||||||||||||||||||||
| Bank of Auburn Hills | 30,463 | 39,914 | 1,795 | 988 | 1,616 | 2,895 | 5.89 | % | 2.48 | % | ||||||||||||||||||||||
| Bank of Maumee | 40,269 | 50,094 | 918 | 752 | 810 | 37 | 2.28 | % | 1.50 | % | ||||||||||||||||||||||
| Bank of Michigan | 64,374 | 67,700 | 1,172 | 996 | 844 | 306 | 1.82 | % | 1.47 | % | ||||||||||||||||||||||
| Capitol National Bank | 173,338 | 213,392 | 7,920 | 8,341 | 21,346 | 12,828 | 4.57 | % | 3.91 | % | ||||||||||||||||||||||
| Elkhart Community Bank | 71,483 | 87,971 | 2,364 | 1,702 | 8,093 | 3,941 | 3.31 | % | 1.93 | % | ||||||||||||||||||||||
| Evansville Commerce Bank | 44,179 | 55,779 | 1,338 | 943 | 1,244 | 158 | 3.03 | % | 1.69 | % | ||||||||||||||||||||||
| Goshen Community Bank | 61,568 | 74,144 | 1,766 | 1,501 | 1,185 | 876 | 2.87 | % | 2.02 | % | ||||||||||||||||||||||
Michigan Commerce Bank(2) | 949,907 | 1,127,348 | 48,349 | 30,258 | 110,870 | 63,092 | 5.09 | % | 2.68 | % | ||||||||||||||||||||||
| Ohio Commerce Bank | 56,739 | 48,207 | 910 | 723 | 206 | 1.60 | % | 1.50 | % | |||||||||||||||||||||||
| Paragon Bank & Trust | 64,915 | 87,651 | 3,809 | 2,990 | 5,320 | 6,447 | 5.87 | % | 3.41 | % | ||||||||||||||||||||||
| Great Lakes Region Total | 1,557,235 | 1,852,200 | 70,341 | 49,194 | 151,534 | 90,580 | 4.52 | % | 2.66 | % | ||||||||||||||||||||||
| Midwest Region: | ||||||||||||||||||||||||||||||||
Adams Dairy Bank(1) | 35,860 | 28,834 | 655 | 450 | 1.83 | % | 1.56 | % | ||||||||||||||||||||||||
| Bank of Belleville | 58,510 | 65,150 | 938 | 923 | 1.60 | % | 1.42 | % | ||||||||||||||||||||||||
| Community Bank of Lincoln | 44,864 | 43,657 | 1,195 | 674 | 1,661 | 2.66 | % | 1.54 | % | |||||||||||||||||||||||
Summit Bank of Kansas City(3) | 44,068 | 709 | 779 | 1.61 | % | |||||||||||||||||||||||||||
| Midwest Region Total | 139,234 | 181,709 | 2,788 | 2,756 | 1,661 | 779 | 2.00 | % | 1.52 | % | ||||||||||||||||||||||
| Nevada Region: | ||||||||||||||||||||||||||||||||
1st Commerce Bank | 33,482 | 30,663 | 1,910 | 740 | 7,531 | 1,000 | 5.71 | % | 2.41 | % | ||||||||||||||||||||||
| Bank of Las Vegas | 59,004 | 64,648 | 1,715 | 901 | 9,906 | 4,399 | 2.91 | % | 1.39 | % | ||||||||||||||||||||||
| Black Mountain Community Bank | 140,442 | 143,654 | 3,994 | 1,765 | 21,423 | 1,722 | 2.84 | % | 1.23 | % | ||||||||||||||||||||||
| Desert Community Bank | 81,033 | 87,388 | 2,900 | 943 | 12,259 | 3,671 | 3.58 | % | 1.08 | % | ||||||||||||||||||||||
| Red Rock Community Bank | 89,806 | 110,143 | 3,343 | 1,200 | 15,631 | 5,488 | 3.72 | % | 1.09 | % | ||||||||||||||||||||||
| Nevada Region Total | 403,767 | 436,496 | 13,862 | 5,549 | 66,750 | 16,280 | 3.43 | % | 1.27 | % | ||||||||||||||||||||||
| Northeast Region: | ||||||||||||||||||||||||||||||||
| USNY Bank | 57,849 | 43,471 | 905 | 680 | 1.56 | % | 1.56 | % | ||||||||||||||||||||||||
F-25
Summary of loan information – continued:
Total Portfolio Loans | Allowance for Loan Losses | Nonperforming Loans | Allowance as a % of Total Portfolio Loans | |||||||||||||||||||||||||||||
| 2009 | 2008 | 2009 | 2008 | 2009 | 2008 | 2009 | 2008 | |||||||||||||||||||||||||
| Northwest Region: | ||||||||||||||||||||||||||||||||
| Bank of Bellevue | $ | 39,896 | $ | 48,838 | $ | 1,337 | $ | 850 | $ | 2,473 | $ | 170 | 3.35 | % | 1.74 | % | ||||||||||||||||
| Bank of Everett | 35,311 | 32,735 | 1,677 | 686 | 4,292 | 92 | 4.75 | % | 2.10 | % | ||||||||||||||||||||||
| Bank of Tacoma | 31,165 | 40,175 | 1,382 | 770 | 1,534 | 1,183 | 4.43 | % | 1.92 | % | ||||||||||||||||||||||
| High Desert Bank | 34,203 | 35,407 | 805 | 624 | 644 | 2.35 | % | 1.76 | % | |||||||||||||||||||||||
| Issaquah Community Bank | 28,297 | 24,238 | 589 | 385 | 1,315 | 2.08 | % | 1.59 | % | |||||||||||||||||||||||
| Northwest Region Total | 168,872 | 181,393 | 5,790 | 3,315 | 10,258 | 1,445 | 3.43 | % | 1.83 | % | ||||||||||||||||||||||
| Southeast Region: | ||||||||||||||||||||||||||||||||
| Bank of Valdosta | 42,052 | 51,629 | 1,002 | 835 | 1,186 | 2.38 | % | 1.62 | % | |||||||||||||||||||||||
Community Bank of Rowan(3) | 109,290 | 1,634 | 1,688 | 1.50 | % | |||||||||||||||||||||||||||
| First Carolina State Bank | 90,919 | 97,670 | 1,554 | 1,312 | 6,161 | 2,421 | 1.71 | % | 1.34 | % | ||||||||||||||||||||||
| Peoples State Bank | 18,706 | 21,314 | 539 | 366 | 1,075 | 937 | 2.88 | % | 1.72 | % | ||||||||||||||||||||||
Pisgah Community Bank(1) | 45,094 | 27,746 | 1,168 | 475 | 401 | 100 | 2.59 | % | 1.71 | % | ||||||||||||||||||||||
| Sunrise Bank of Atlanta | 43,167 | 52,763 | 2,611 | 1,063 | 5,667 | 269 | 6.05 | % | 2.01 | % | ||||||||||||||||||||||
| Southeast Region Total | 239,938 | 360,412 | 6,874 | 5,685 | 14,490 | 5,415 | 2.87 | % | 1.58 | % | ||||||||||||||||||||||
| Texas Region: | ||||||||||||||||||||||||||||||||
| Bank of Fort Bend | 29,215 | 19,859 | 485 | 305 | 1.66 | % | 1.54 | % | ||||||||||||||||||||||||
| Bank of Las Colinas | 34,725 | 29,657 | 731 | 435 | 2.11 | % | 1.47 | % | ||||||||||||||||||||||||
| Texas Region Total | 63,940 | 49,516 | 1,216 | 740 | 1.90 | % | 1.49 | % | ||||||||||||||||||||||||
| Other, net | 3,027 | 15,473 | 2,896 | 654 | 3,241 | 5,135 | 95.67 | % | 4.23 | % | ||||||||||||||||||||||
| Consolidated totals | $ | 4,047,101 | $ | 4,735,229 | $ | 144,664 | $ | 93,040 | $ | 307,517 | $ | 170,210 | 3.57 | % | 1.96 | % | ||||||||||||||||
| (1) | Became a Capitol affiliate in 2008 and is included for periods after addition to the Capitol banking network. |
| (2) | Effective March 31, 2009, Brighton Commerce Bank, Detroit Commerce Bank, Grand Haven Bank, Kent Commerce Bank, Macomb Community Bank, Muskegon Commerce Bank, Oakland Commerce Bank and Portage Commerce Bank merged with and into Ann Arbor Commerce Bank. Upon completion of the merger, the surviving bank was renamed Michigan Commerce Bank. Prior to the merger, each bank was a wholly-owned subsidiary of Capitol. |
| (3) | Bank of Santa Barbara, Community Bank of Rowan and Summit Bank of Kansas City are majority-owned subsidiaries of CDBL III of which Capitol ceased to have a majority voting control effective September 30, 2009; consequently those banks and CDBL III ceased to be consolidated subsidiaries of Capitol. CDBL III's ownership interest in Bank of Santa Barbara was sold in November 2009. |
| (4) | Effective December 14, 2009, Arrowhead Community Bank, Asian Bank of Arizona, Colonia Bank, Mesa Bank and Sunrise Bank of Arizona merged with and into Camelback Community Bank. Upon completion of the merger, the surviving bank was renamed Sunrise Bank of Arizona. Prior to the merger, each of the banks were either wholly-owned subsidiaries of Capitol or majority-owned by a bank development subsidiary in which Capitol holds a controlling interest. |
| (5) | Capitol sold its ownership in Yuma Community Bank effective September 21, 2009. The bank's operations are included in Capitol's consolidated totals up to the date of sale. |
Nonperforming loans approximated $307.5 million and $170.2 million at December 31, 2009 and 2008, and approximated 7.60% and 3.59% of portfolio loans and 5.99% and 3.01% of total assets, respectively. Of the nonperforming loans at December 31, 2009, about 92% were real-estate secured. At December 31, 2009, the coverage ratio of the allowance for loan losses to nonperforming loans (i.e., the allowance as a percentage of nonperforming loans) was 47.0%, compared to 54.7% at the beginning of the year.
Comparison of the coverage ratio of the allowance to nonperforming loans is complicated by the accounting rules for loss recognition of impaired loans. For example, when an impaired collateral-dependent loan is evaluated based on the fair value as of a particular balance-sheet date, any estimated loss is included as an element of the requirements for the allowance for loan losses. At the subsequent balance-sheet date, that earlier loss estimate is generally charged against the allowance for loan losses via direct write-down of the impaired collateral-dependent loan and, accordingly, no allowance for loan losses component is needed until it is determined
F-26
that the fair value estimate requires revision. As a result, many nonperforming loans are carried at a written-down level and no allowance component may be necessary at the balance-sheet date.
Directional consistency in the allowance for loan losses, loan charge-offs (including partial write-downs resulting from impairment analyses, as discussed above) and asset quality is important. During 2009, impaired loans doubled from $165.0 million at December 31, 2008 to $332.7 million at December 31, 2009 ($68.1 million at the beginning of 2008). The amount of the allowance for loan losses allocable to impaired loans at December 31, 2009 of $20.1 million increased approximately 20% from the year-end 2008 amount of $16.8 million. This was because of an increase in troubled debt restructurings rather than sharply increased levels of loan charge-offs (including partial write-downs) in 2009 which increased 174.9% in 2009 from $50.4 million in 2008 to the level of $138.7 million. As mentioned previously, allowance requirements for impaired loans are reduced through charge-offs and partial loan write-downs.
Provisions for loan losses increased 131.1% in 2009, 225.5% in 2008 and 108.5% in 2007, in concert with net growth in nonperforming loans of 80.7% at year-end 2009 and 134.4% at year-end 2008. During these periods, the provision for loan losses exceeded loan charge-offs by 37.5% in 2009, 63.5% in 2008 and 78.2% in 2007. Fluctuations in these ratios is caused by numerous factors, including the timing of loan charge-offs in relation to timing of the provisions for loan losses. As previously discussed, loss estimation and monitoring of collateral values is an ongoing process.
At December 31, 2009, about 47.3% of total nonperforming loans were Michigan-based (including nonperforming loans held at the parent level) where nonperforming loans increased $54.6 million or 60.2% in 2009. In concert with sharply elevated levels of nonperforming loans at Michigan banks, their combined allowance ratio of about 4.91% and 2.84% of portfolio loans at year-end 2009 and 2008, respectively, has been maintained at a higher level than the consolidated ratio, and some banks have allowance ratios exceeding 4%. It should be noted that other regions (Arizona and Nevada, in particular) experienced significant increases in this category in 2009. Increases in other regions' nonperforming loans were expected due to weak economic conditions and the historically low levels of such loans in prior periods.
Due to a combination of commercial real estate collateral and a depressed economic climate, resolution of nonperforming loans and other nonperforming assets may take an extended period of time. Levels of nonperforming loans are likely to increase further, and general economic conditions may not recover in the foreseeable future.
Loans are accounted for as troubled debt restructurings if, for economic or legal reasons related to the borrower's financial condition, Capitol's banks grant a significant concession to the borrower that they would not otherwise consider. A troubled debt restructuring may involve the receipt of assets from the debtor in partial or full satisfaction of the loan, or a modification of terms such as a reduction of the stated interest rate or loan balance, a reduction of accrued interest, an extension of the maturity date at an interest rate lower than a current market rate for a new loan with similar risk, or some combination thereof. Troubled debt restructurings generally remain classified as nonperforming loans until a consistent and compliant six-month payment history has been maintained.
F-27
In addition to the identification of nonperforming loans involving borrowers with payment performance difficulties (i.e., nonaccrual loans and loans past-due 90 days or more), management utilizes an internal loan review process to identify other potential problem loans which may warrant additional monitoring or other attention. This loan review process is a continuous activity which periodically updates internal loan classifications. At inception, all loans are individually assigned a classification which grades the credits on a risk basis, assessing the financial strength of the borrower and guarantors and other factors such as the borrowers' historical and projected financial performance, local economic conditions and other subjective factors. The loan classification process is fluid and subjective.
Potential problem loans include loans which are generally performing as agreed; however, because of loan review's and/or lending staff's risk assessment, increased monitoring is deemed appropriate. In addition, some loans are identified for monitoring because of specific performance issues or other risk factors requiring closer management attention and the development of specific remedial action plans.
At December 31, 2009, potential problem loans (which include nonperforming loans) approximated $826 million or nearly 20% of total consolidated portfolio loans. Such totals have historically approximated 4% to 5% of loans outstanding and are an important part of management's ongoing and proactive loan review activities, which are designed to early-identify loans which warrant close monitoring at the bank and corporate credit-administration levels. During 2009, the amount of potential problem loans increased significantly as management downgraded many credit relationships in response to the impact of the severe recessionary environment. It is important to note that these potential problem loans do not necessarily have significant loss exposure (nor are they necessarily deemed 'impaired'), but rather are identified by management in this manner to aid in loan administration and risk management. These loans are considered in management's evaluation of the adequacy of the allowance for loan losses.
There are several other asset categories. Loans held for sale ($16.1 million and $10.5 million at December 31, 2009 and 2008, respectively) are home mortgages which are sold into the secondary market generally within 30-60 days of closing (discussed in more detail in the following section of this narrative). There is also a modest amount of investment securities on the balance sheet ($71.3 million and $48.4 million at December 31, 2009 and 2008, respectively). Goodwill approximated $66.1 million at year-end 2009, a decrease from 2008; accounting for goodwill is described in the Critical Accounting Policies section of this narrative.
Other real estate owned approximated $112 million at December 31, 2009. Other real estate owned increased significantly in 2009 ($44.6 million) due to borrower difficulties, foreclosures and lack of sales activity. Most of this increase ($38.6 million) was related to banks located in Michigan and Arizona. Other real estate owned at December 31, 2009 consists of a combination of commercial and residential properties. Continued deterioration of real estate market conditions, for both residential and commercial properties, has negative implications on future sales and valuation of other real estate owned as well as collateral-dependent impaired loans secured by real estate.
F-28
Foreclosure laws in Michigan generally favor borrowers rather than lenders and, accordingly, foreclosure and redemption periods (i.e., the number of months it takes for a financial institution to obtain clear title to freely market the real estate) take much longer than many other states. Further, once the property is available to the bank for sale or liquidation, market conditions, as they are currently (particularly in Michigan, Arizona and Nevada), may not be conducive to rapid marketing or near-term sale of the properties.
The primary source for the funding of loans is deposits, which is discussed in the next section of this narrative.
In a volatile economic environment, financial institution liquidity is very important. Asset liquidity for financial institutions typically consists of cash and cash equivalents, loans held for sale and investment securities available for sale. These categories totaled $865.8 million at year-end 2009 or about 16.9% of total assets. This compares to $650.4 million or about 11.5% of total assets at year-end 2008. The increased liquidity position at year-end 2009 is the result of management's efforts to raise liquidity levels through reductions of portfolio loans and more intense focus on utilization of available funding sources. Liquidity is important for financial institutions because of their need to meet loan funding commitments, depositor withdrawal requests and various other commitments discussed in the accompanying notes to consolidated financial statements. Liquidity can vary significantly on a daily basis, based on customer activity and funding sources.
The FDIC's Transaction Account Guaranty Program (TAGP) provides an unlimited guarantee of certain demand deposits. TAGP is scheduled to end effective June 30, 2010. Capitol estimates $216.9 million of deposits at its banks would become uninsured, based on balances as of December 31, 2009. The effect of depositor activity upon termination of TAGP is not determinable.
Over half of the investment securities portfolio (approximately $40.8 million at December 31, 2009) is classified as available for sale, although the banks generally have not sold investments to meet liquidity needs. During 2009, 2008 and 2007, there were no significant sales of investment securities available for sale to meet liquidity needs or for other purposes. Sales of investment securities available for sale are typically made to facilitate changes in risk-management strategies.
Loans held for sale, as previously mentioned, approximated $16.1 million at December 31, 2009, compared to $10.5 million at year-end 2008. These loans are residential real estate mortgages originated by the banks and are subsequently sold into the secondary market, rather than being held in the banks' portfolios, to reduce interest rate and related credit risk. Mortgage loan origination volume in 2009 increased to approximately $311 million, compared to $207 million in 2008 ($500 million in 2007). Future mortgage origination volume will depend in large part on interest rates, real estate valuation and the relative strength of residential real estate market conditions. Also, to the extent warranted, the banks may sell other loans from time to time.
F-29
The primary source of funds for the banks is deposits. The banks rely upon interest-bearing time deposits as a key part of their funding strategy. The banks also emphasize noninterest-bearing deposits, or checking accounts, which reduce the banks' cost of funds. Noninterest-bearing deposits were about 15% of total deposits at year-end 2009 (about 16% at year-end 2008 and 17% at the beginning of 2008). The decreasing trend in this ratio is significant inasmuch as a lower percentage of noninterest-bearing deposits has the effect of increasing a bank's funding costs and, accordingly, reducing net interest income.
In recent periods, many banks within the industry have experienced competitive challenges in obtaining additional deposits for liquidity, to fund loan demand and other growth. Capitol's banks have had similar experiences in their individual markets. As depositors have wider access to the Internet and other real-time interest rate monitoring resources, deposit sourcing and pricing has become more competitive. Deposit growth requires competitive and often aggressive pricing, adversely impacting net interest margins, especially during periods of relatively low interest rates. As interest rates have remained at record low levels, customers are more attracted to aggressively-priced time deposits, and growth in noninterest-bearing balances is very difficult to achieve. The banks have decreased the use of brokered deposits as a funding source (approximately $807.4 million at year-end 2009 or 18.3% of deposits compared to 24.5% in 2008) as brokered deposits are used selectively to help meet funding needs and manage interest rate risk.
To supplement their funding sources, some of the banks have lines of credit from the Federal Home Loan Bank (FHLB) system. At year-end 2009, a total of approximately $261 million ($430 million at year-end 2008) was borrowed under FHLB facilities and additional borrowing availability approximated $293 million. Some of the banks also have smaller lines of credit with their correspondent banks. Borrowings under those facilities are generally at short-term market rates of interest and, although the repayment dates can be extended, are generally outstanding for brief periods of time. The FHLB may accelerate due-dates of these borrowings under certain circumstances, which could have a material adverse effect on liquidity.
Capitol's longer-term contractual obligations are disclosed in the notes to the consolidated financial statements. Such obligations consist principally of time deposits of the banks, debt and lease obligations and trust-preferred securities, the principal amounts of which are summarized as follows (in $1,000s):
| Payments Due by Period | |||||||||||||||||||
Total(1) | Within 1 Year | Within 1-3 Years | Within 3-5 Years | After 5 Years | |||||||||||||||
Deposits without a stated maturity | $ | 1,981,441 | $ | 1,981,441 | |||||||||||||||
| Time deposits | 2,429,192 | 1,866,810 | $ | 514,254 | $ | 47,752 | $ | 376 | |||||||||||
| Debt obligations | 276,159 | 172,967 | 70,702 | 22,200 | 10,290 | ||||||||||||||
Rent commitments under noncancelable leases | 71,969 | 11,602 | 22,129 | 15,931 | 22,307 | ||||||||||||||
| Subordinated debentures | 167,441 | 167,441 | |||||||||||||||||
| Total | $ | 4,926,202 | $ | 4,032,820 | $ | 607,085 | $ | 85,883 | $ | 200,414 | |||||||||
| (1) | Excludes interest. |
F-30
During 2008, Capitol completed a private offering of $14 million of promissory notes, which were purchased by accredited investors. The promissory notes become callable in 2010, mature in 2013 and bear interest at 9%. In 2010, Capitol may pursue conversion of those notes to common stock in a private-placement transaction.
Loan commitments of Capitol's banks (stand-by letters of credit and unfunded loans) generally expire within one year. Other than the items set forth in the table on the preceding page, there are no individually material contractual obligations, such as purchase obligations.
A significant source of capital in recent years has been investments made by community investors, or noncontrolling interests, in the subsidiaries which are consolidated for financial reporting purposes. Total noncontrolling interests, included as a component of equity, amounted to $72.3 million at year-end 2009, a net decrease of $86.9 million from the $159.2 million level at year-end 2008. The net decrease in noncontrolling interests in 2009 resulted from operating losses largely due to establishment of a valuation allowance for deferred income tax assets.
Capitol has formed several bank-development subsidiaries, each originally capitalized with two classes of common stock, voting and nonvoting. All of the initial voting common stock (an investment of $1 million for each bank-development entity) is owned by Capitol. The nonvoting common stock, ranging from $12.6 million to $15.8 million for each of the bank-development companies, was sold in private offerings to accredited investors, some of whom are related parties of Capitol. Those entities have been engaged in bank-development activities, through Capitol, consisting of formation and investment in start-up banks and management of their investments in young banks. Bank start-up activities were suspended in mid-2008 when the regulatory and capital-raising environment for new banks became unfavorable. Each of these entities bear a similar name, Capitol Development Bancorp Limited ("CDBL"), numbered in their sequential formation, CDBL-I through CDBL-VIII.
CDBL-I became wholly-owned via a share-exchange with Capitol in late 2006. CDBL-II became wholly-owned via a share exchange with Capitol completed in February 2007 through the issuance of approximately 371,000 shares of previously unissued common stock. CDBL III ceased to be a controlled subsidiary in 2009 and, accordingly, its consolidated financial position and results of operations were deconsolidated effective September 30, 2009. Effective December 31, 2009, Capitol increased its ownership in some of the CDBLs through the conversion of intercompany indebtedness to voting common stock of the CDBLs to maintain a controlling (>50%) interest in anticipation of conversion of those CDBLs' nonvoting shares to voting shares.
Capitol's capital structure consists of these primary elements:
· | Equity; and |
· | Trust-preferred securities and related subordinated debentures |
F-31
Total stockholders' equity attributable to Capitol approximated $161.3 million at year-end 2009, a decrease of $192.5 million for the year. The significant 2009 decrease of nearly 54% resulted primarily from the net loss from operations attributable to Capitol for the year. The book value per share of common stock (i.e., stockholders' equity attributable to Capitol divided by the number of common shares outstanding) was $9.20 at year-end 2009, compared with $20.46 at year-end 2008. Cash dividends per share of $0.05 were paid in 2009, compared to $0.50 in 2008 and $1.00 in 2007. Future payment of dividends is not currently permitted without prior written approval of the Federal Reserve, Capitol's primary federal regulator (see subsequent discussion in the Certain Regulatory Matters section of this narrative).
Noncontrolling interests in consolidated subsidiaries (formerly referred to as 'minority interests') represent the interests in the equity of banks and bank-development subsidiaries owned by others. Those shareholders include some shareholders of Capitol; however, these equity interests are separate from their ownership of Capitol's common stock. These noncontrolling interests increased as new banks were added with investors other than Capitol, decreased when noncontrolling interests were exchanged for Capitol's common stock and are adjusted for the noncontrolling interests' share of their entity's income or losses.
Prior to 2009, Capitol raised a total of $167 million of capital through issuance of trust-preferred securities, including $15 million in July 2008 in a public offering. Most have been obtained through private placements of pooled trust-preferred securities. Trust-preferred securities are long-term debt obligations which are treated as elements of capital for regulatory purposes. As noted in the accompanying financial statements, the trusts relating to Capitol's trust-preferred securities are classified as debt obligations on the consolidated balance sheet. Future availability of trust-preferred securities as a near-term capital resource is uncertain due to the instability of U.S. capital markets.
In April 2009, the Corporation determined that it would commence the deferral of interest payments on its various trust-preferred securities, as is permitted under the terms of the securities, to conserve cash and capital resources. The payment of interest may be deferred for periods up to five years. During such deferral periods, Capitol is generally prohibited from paying dividends on its common stock and will continue to accrue interest payable on such securities. Holders of the trust-preferred securities will continue to recognize current taxable income relating to the deferred interest payments. Payment of interest on the trust-preferred securities is also not permitted without prior written approval of the Federal Reserve (see subsequent discussion in the Certain Regulatory Matters section of this narrative).
Total capital (the sum of equity and trust-preferred securities) at year-end 2009 amounted to $401.0 million or 7.8% of total assets. This compares to $680.4 million or 12.0% at year-end 2008.
F-32
Capitol's common stock was trading at historical lows in late 2009 and early 2010, resulting in its market capitalization being substantially less than recorded stockholders' equity. As a result of market volatility, many financial institutions' equity securities have recently been trading at historical lows. Stockholders' equity is determined by GAAP, while market capitalization is driven by share prices in the marketplace and, hence, there is little correlation between the two amounts and such difference does not imply an impairment of goodwill. Capitol's goodwill has resulted from a series of relatively small, past transactions involving share-exchanges regarding the noncontrolling interests of majority-owned banks at modest premiums. Further, Capitol's performance for periods prior to 2008 and the current deep recessionary environment produced strong earnings results. Additional discussion of Capitol's annual review for potential impairment of goodwill appears in the Critical Accounting Policies section of this narrative.
Capitol and each of its bank subsidiaries are subject to a complex series of regulatory rules and requirements which require specific levels of capital adequacy at both the bank level and on a consolidated basis. Under those rules and regulations, banks are categorized as well-capitalized, adequately-capitalized or under-capitalized using several ratio measurements, including a risk-weighting approach to assets and financial commitments. These ratio measurements, in addition to certain other requirements, are used by regulatory agencies to determine the level of regulatory intervention and enforcement applied to financial institutions. Banks are subject to various aspects of the prompt corrective action provisions of the FDIC Improvement Act, which can result in significant regulatory agency intervention and other adverse action. Although it is permissible to maintain capital adequacy at the adequately-capitalized level, it is preferable for banks, when possible, to meet the well-capitalized standard. Well-capitalized banks have previously benefitted from lower FDIC deposit insurance costs and less restrictive limitations on some banking activities which are attributable to that classification. Increases in FDIC insurance premiums experienced by Capitol's banks in 2009 and 2008 were generally attributable to increases in the FDIC's structural assessment rates.
[The remainder of this page intentionally left blank]
F-33
The following comparative analysis summarizes each bank's regulatory capital position as of December 31:
| Tier 1 Risk-Based | Total Risk-Based | |||||||||||||||||||||||||||
Tier 1 Leverage Ratio(1)(5) | Capital Ratio(1)(5) | Capital Ratio(2)(5) | Regulatory Classification(3) | |||||||||||||||||||||||||
| 2009 | 2008 | 2009 | 2008 | 2009 | 2008 | 2009 | 2008 | |||||||||||||||||||||
| Arizona Region: | ||||||||||||||||||||||||||||
| Bank of Tucson | 9.67 | % | 9.53 | % | 10.78 | % | 9.41 | % | 11.86 | % | 10.26 | % | well-capitalized | well-capitalized | ||||||||||||||
| Central Arizona Bank | 5.13 | % | 13.38 | % | 7.13 | % | 13.02 | % | 8.42 | % | 14.27 | % | adequately-capitalized | well-capitalized | ||||||||||||||
Southern Arizona Community Bank | 9.47 | % | 9.14 | % | 11.03 | % | 10.15 | % | 12.28 | % | 11.22 | % | well-capitalized | well-capitalized | ||||||||||||||
| Sunrise Bank of Albuquerque | 6.27 | % | 8.50 | % | 8.07 | % | 9.08 | % | 9.33 | % | 10.33 | % | adequately-capitalized(8) | well-capitalized | ||||||||||||||
Sunrise Bank of Arizona(7) | 3.62 | % | 8.73 | % | 5.01 | % | 9.38 | % | 6.30 | % | 10.41 | % | under-capitalized(8) | well-capitalized | ||||||||||||||
| California Region: | ||||||||||||||||||||||||||||
| Bank of Escondido | 9.55 | % | 11.29 | % | 13.98 | % | 15.50 | % | 15.24 | % | 16.66 | % | well-capitalized | well-capitalized | ||||||||||||||
Bank of Feather River(4) | 18.59 | % | 25.72 | % | 25.84 | % | 27.12 | % | 27.09 | % | 28.37 | % | well-capitalized | well-capitalized | ||||||||||||||
| Bank of San Francisco | 9.12 | % | 11.04 | % | 10.37 | % | 11.53 | % | 11.63 | % | 12.78 | % | well-capitalized | well-capitalized | ||||||||||||||
| Napa Community Bank | 9.82 | % | 11.06 | % | 10.48 | % | 10.79 | % | 11.74 | % | 12.04 | % | well-capitalized | well-capitalized | ||||||||||||||
| Point Loma Community Bank | 7.97 | % | 11.11 | % | 10.57 | % | 12.78 | % | 11.83 | % | 14.04 | % | well-capitalized | well-capitalized | ||||||||||||||
| Sunrise Bank of San Diego | 7.32 | % | 10.27 | % | 9.61 | % | 11.12 | % | 10.90 | % | 12.38 | % | well-capitalized | well-capitalized | ||||||||||||||
Sunrise Community Bank(4) | 7.27 | % | 14.39 | % | 10.82 | % | 18.07 | % | 12.11 | % | 19.32 | % | well-capitalized | well-capitalized | ||||||||||||||
| Colorado Region: | ||||||||||||||||||||||||||||
| Fort Collins Commerce Bank | 10.35 | % | 12.48 | % | 11.77 | % | 12.98 | % | 13.03 | % | 14.23 | % | well-capitalized | well-capitalized | ||||||||||||||
Larimer Bank of Commerce(4) | 8.70 | % | 8.95 | % | 10.96 | % | 9.83 | % | 12.22 | % | 11.08 | % | well-capitalized | well-capitalized | ||||||||||||||
Loveland Bank of Commerce(4) | 15.48 | % | 21.48 | % | 18.01 | % | 24.66 | % | 19.26 | % | 25.92 | % | well-capitalized | well-capitalized | ||||||||||||||
Mountain View Bank of Commerce(4) | 14.20 | % | 20.81 | % | 17.99 | % | 20.53 | % | 19.24 | % | 21.78 | % | well-capitalized | well-capitalized | ||||||||||||||
| Great Lakes Region: | ||||||||||||||||||||||||||||
| Bank of Auburn Hills | 5.93 | % | 11.05 | % | 6.90 | % | 12.64 | % | 8.20 | % | 13.90 | % | adequately-capitalized | well-capitalized | ||||||||||||||
Bank of Maumee(4) | 8.50 | % | 10.47 | % | 10.42 | % | 11.54 | % | 11.68 | % | 12.79 | % | well-capitalized | well-capitalized | ||||||||||||||
| Bank of Michigan | 7.11 | % | 9.15 | % | 11.19 | % | 9.76 | % | 12.44 | % | 11.01 | % | well-capitalized | well-capitalized | ||||||||||||||
| Capitol National Bank | 6.45 | % | 7.95 | % | 8.15 | % | 8.96 | % | 9.44 | % | 10.24 | % | adequately-capitalized(8) | well-capitalized | ||||||||||||||
| Elkhart Community Bank | 5.03 | % | 7.71 | % | 6.94 | % | 8.82 | % | 8.22 | % | 10.08 | % | adequately-capitalized(8) | well-capitalized | ||||||||||||||
Evansville Commerce Bank(4) | 8.01 | % | 8.13 | % | 11.28 | % | 9.81 | % | 12.55 | % | 11.07 | % | well-capitalized | well-capitalized | ||||||||||||||
| Goshen Community Bank | 8.11 | % | 7.96 | % | 10.81 | % | 8.96 | % | 12.08 | % | 10.21 | % | adequately-capitalized(8) | well-capitalized | ||||||||||||||
Michigan Commerce Bank(6) | 4.03 | % | 10.75 | % | 5.00 | % | 10.70 | % | 6.30 | % | 12.19 | % | under-capitalized(8) | well-capitalized | ||||||||||||||
Ohio Commerce Bank(4) | 13.57 | % | 15.29 | % | 16.16 | % | 17.14 | % | 17.41 | % | 18.39 | % | well-capitalized | well-capitalized | ||||||||||||||
| Paragon Bank & Trust | 4.91 | % | 8.09 | % | 7.07 | % | 8.99 | % | 8.37 | % | 10.27 | % | adequately-capitalized(8) | well-capitalized | ||||||||||||||
| Midwest Region: | ||||||||||||||||||||||||||||
Adams Dairy Bank(4) | 16.30 | % | 22.19 | % | 21.04 | % | 25.01 | % | 22.00 | % | 26.27 | % | well-capitalized | well-capitalized | ||||||||||||||
| Bank of Belleville | 8.90 | % | 8.68 | % | 11.81 | % | 9.51 | % | 13.06 | % | 10.76 | % | well-capitalized | well-capitalized | ||||||||||||||
Community Bank of Lincoln(4) | 9.11 | % | 13.68 | % | 12.82 | % | 15.14 | % | 14.09 | % | 16.39 | % | well-capitalized | well-capitalized | ||||||||||||||
| Nevada Region: | ||||||||||||||||||||||||||||
1st Commerce Bank(4) | 7.08 | % | 10.03 | % | 8.89 | % | 16.02 | % | 10.20 | % | 17.28 | % | well-capitalized | well-capitalized | ||||||||||||||
| Bank of Las Vegas | 5.08 | % | 8.78 | % | 6.25 | % | 9.47 | % | 7.51 | % | 10.72 | % | under-capitalized | well-capitalized | ||||||||||||||
Black Mountain Community Bank | 6.73 | % | 8.45 | % | 8.50 | % | 9.10 | % | 9.77 | % | 10.31 | % | adequately-capitalized | well-capitalized | ||||||||||||||
| Desert Community Bank | 5.78 | % | 8.21 | % | 7.18 | % | 9.58 | % | 8.45 | % | 10.65 | % | adequately-capitalized | well-capitalized | ||||||||||||||
| Red Rock Community Bank | 3.80 | % | 8.52 | % | 5.62 | % | 9.39 | % | 6.90 | % | 10.45 | % | under-capitalized | well-capitalized | ||||||||||||||
| Northeast Region: | ||||||||||||||||||||||||||||
USNY Bank(4) | 8.30 | % | 11.72 | % | 9.67 | % | 12.45 | % | 10.93 | % | 13.70 | % | well-capitalized | well-capitalized | ||||||||||||||
| Northwest Region: | ||||||||||||||||||||||||||||
| Bank of Bellevue | 8.91 | % | 10.93 | % | 12.54 | % | 11.99 | % | 13.81 | % | 13.25 | % | well-capitalized | well-capitalized | ||||||||||||||
Bank of Everett(4) | 7.79 | % | 11.98 | % | 10.28 | % | 14.30 | % | 11.58 | % | 15.56 | % | well-capitalized | well-capitalized | ||||||||||||||
Bank of Tacoma(4) | 6.91 | % | 13.54 | % | 9.28 | % | 12.86 | % | 10.57 | % | 14.12 | % | adequately-capitalized(8) | well-capitalized | ||||||||||||||
High Desert Bank(4) | 8.45 | % | 15.86 | % | 11.28 | % | 17.29 | % | 12.55 | % | 18.54 | % | adequately-capitalized(8) | well-capitalized | ||||||||||||||
Issaquah Community Bank(4) | 15.16 | % | 23.27 | % | 20.75 | % | 26.08 | % | 22.01 | % | 27.33 | % | well-capitalized | well-capitalized | ||||||||||||||
F-34
Regulatory capital position – continued:
| Tier 1 Risk-Based | Total Risk-Based | |||||||||||||||||||||||||||
Tier 1 Leverage Ratio(1)(5) | Capital Ratio(1)(5) | Capital Ratio(2)(5) | Regulatory Classification(3) | |||||||||||||||||||||||||
| 2009 | 2008 | 2009 | 2008 | 2009 | 2008 | 2009 | 2008 | |||||||||||||||||||||
| Southeast Region: | ||||||||||||||||||||||||||||
Bank of Valdosta(4) | 7.12 | % | 8.01 | % | 11.19 | % | 10.32 | % | 12.46 | % | 11.58 | % | adequately-capitalized(8) | well-capitalized | ||||||||||||||
| First Carolina State Bank | 7.08 | % | 8.61 | % | 9.18 | % | 9.69 | % | 10.44 | % | 10.94 | % | well-capitalized | well-capitalized | ||||||||||||||
| Peoples State Bank | 8.67 | % | 8.15 | % | 13.07 | % | 10.40 | % | 14.34 | % | 11.65 | % | well-capitalized | well-capitalized | ||||||||||||||
Pisgah Community Bank(4) | 10.17 | % | 22.86 | % | 14.39 | % | 25.11 | % | 15.66 | % | 26.37 | % | well-capitalized | well-capitalized | ||||||||||||||
Sunrise Bank of Atlanta(4) | 3.92 | % | 8.19 | % | 4.91 | % | 9.78 | % | 6.22 | % | 11.04 | % | under-capitalized | well-capitalized | ||||||||||||||
| Texas Region: | ||||||||||||||||||||||||||||
Bank of Fort Bend(4) | 16.05 | % | 23.19 | % | 19.76 | % | 28.46 | % | 21.01 | % | 29.71 | % | well-capitalized | well-capitalized | ||||||||||||||
Bank of Las Colinas(4) | 12.56 | % | 19.54 | % | 16.54 | % | 22.08 | % | 17.81 | % | 23.33 | % | well-capitalized | well-capitalized | ||||||||||||||
| Consolidated totals | 4.61 | % | 10.72 | % | 5.99 | % | 12.07 | % | 9.46 | % | 13.75 | % | adequately-capitalized | well-capitalized | ||||||||||||||
| (1) | The minimum required Tier 1 leverage ratio and Tier 1 risk-based capital ratio is 4% (8% for de novo institutions). |
| (2) | The minimum required total risk-based capital ratio is 8%. |
| (3) | In order to be classified as a 'well-capitalized' institution, the total risk-based capital ratio must be 10% or more. To be classified as an 'adequately-capitalized' institution, the total risk-based capital ratio must be at least 8%. |
| (4) | De novo institution which is subject to higher minimum ratio requirements as noted in (1) above for the first seven years of operations. |
| (5) | Ratios are per the regulatory call reports and Y9-C filed at original due date which is generally within 30 days after quarter-end. |
| (6) | Effective March 31, 2009, Brighton Commerce Bank, Detroit Commerce Bank, Grand Haven Bank, Kent Commerce Bank, Macomb Community Bank, Muskegon Commerce Bank, Oakland Commerce Bank and Portage Commerce Bank merged with and into Ann Arbor Commerce Bank. Upon completion of the merger, the surviving bank was renamed Michigan Commerce Bank. Prior to the merger, each bank was a wholly-owned subsidiary of Capitol. |
| (7) | Effective December 14, 2009, Arrowhead Community Bank, Asian Bank of Arizona, Colonia Bank, Mesa Bank and Sunrise Bank of Arizona merged with and into Camelback Community Bank. Upon completion of the merger, the surviving bank was renamed Sunrise Bank of Arizona. Prior to the merger, each of the banks were either wholly-owned subsidiaries of Capitol or majority-owned by bank development subsidiary in which Capitol holds a controlling interest. |
| (8) | Institution is subject to a regulatory agreement and, accordingly, cannot be classified at a level higher than adequately-capitalized. |
Future regulatory capital compliance, classification and related ratios are difficult to predict and are subject to significant contingencies.
In September 2009, Capitol and its second-tier bank holding companies entered into a written agreement with the Federal Reserve Bank of Chicago (the Reserve Bank) under which Capitol agreed to refrain from the following actions without the prior written consent of the Reserve Bank: (i) declare or pay dividends; (ii) receive dividends or any other form of payment representing a reduction in capital from Michigan Commerce Bank, or from any of Capitol's subsidiary institutions that are subject to any restriction by the institution's federal or state regulator that limits the payment of dividends or other intercorporate payments; (iii) make any distributions of interest, principal, or other sums of subordinated debentures or trust-preferred securities; (v) incur, increase or guarantee any debt; or (vi) purchase or redeem any shares of the stock of Capitol, the second-tier bank holding companies, nonbank subsidiaries or any of the subsidiary banks that are held by shareholders other than Capitol.
Capitol has also agreed to: (i) submit to the Reserve Bank, a written plan to maintain sufficient capital at Capitol on a consolidated basis and at Michigan Commerce Bank (as a separate legal entity on a stand-alone basis); (ii) notify the Reserve Bank no more than 30 days after the end of any quarter in which Capitol's consolidated or Michigan Commerce Bank's capital ratios fall below the approved capital plan's minimum ratios, as well as if any subsidiary institution's ratios fall below the minimum ratios required by the institution's federal or state regulator;
F-35
(iii) review and revise its allowance for loan losses (ALLL) methodology for loans held by Capitol and submit to the Reserve Bank a written program for maintenance of an adequate ALLL for loans held by Capitol; (iv) take all necessary actions to ensure each of its subsidiary institutions comply with Federal Reserve regulations; (v) refrain from increasing any fees or charging new fees to any subsidiary institution without the prior written consent of the Reserve Bank; (vi) submit to the Reserve Bank a written plan to enhance the consolidated organization's risk management practices, a strategic plan to improve the consolidated organization's operating results and a cash flow projection; (vii) comply with laws and regulations regarding senior executive officer positions and severance payments; and (viii) provide quarterly reports to the Reserve Bank regarding these undertakings.
Certain of Capitol's bank subsidiaries have entered into formal agreements or consent orders with their applicable federal and state bank regulatory agencies in response to elevated levels of nonperforming assets, loan losses and adverse operating results. Those agreements provide for certain restrictions and other guidelines and/or limitations to be followed by those banks. Generally, those agreements require the banks to maintain an adequate ALLL, reduce levels of nonperforming and other classified assets and implement revised budgets and liquidity and capital adequacy projections to improve financial performance. When a bank enters into a formal regulatory agreement, it is generally precluded from meeting the criteria as a "well-capitalized" institution although it may meet or exceed such threshold on a computational basis. In addition, the banks' capital classification places limitations on some of their activities, such as the permissibility of accepting or renewing brokered deposits, among other things. Additionally, such banks are subject to higher levels of FDIC insurance assessments, although they may receive some relief from up front payment of the FDIC's advance insurance assessments relating to future years at December 31, 2009.
Generally, banks are subject to cross-guaranty liability regarding other financial institutions the FDIC determines are controlled by any multibank holding company. Pursuant to federal regulations, an insured depository institution may be liable for any loss the FDIC has incurred or expects to incur in connection with the failure of a former affiliate institution and, if the FDIC determines that remaining affiliates have a liability to the FDIC, then they would have to pay that liability to the FDIC. Payment of a cross-guaranty liability to the FDIC could have a material adverse impact on the results of operations, capital adequacy and financial position of Capitol and its banking subsidiaries.
To date, none of Capitol's subsidiary banks have received any notice of assessment of cross-guaranty liability. Capitol's banks have, however, received notice from the FDIC that the FDIC may assess a cross-guaranty liability relating to a failed community bank in Florida which ceased operations in November 2009. The FDIC alleges that the Florida bank was an affiliated institution of Capitol, although Capitol owned no securities of that bank or otherwise controlled the failed institution. The aggregate loss to the FDIC of that failed bank approximated $23.6 million. The FDIC has two years to determine whether to assess that potential cross-guaranty liability, if any.
F-36
In addition to the previously-mentioned potential cross-guaranty liability, some of Capitol's banking subsidiaries were advised in December 2009 that, to mitigate the effects of any possible assessment arising from potential cross-guaranty liability, they should develop a plan to arrange a sale, merger or recapitalization such that Capitol no longer controls the bank. This guidance was preceded by Capitol's previously-announced plans to selectively divest some of its bank subsidiaries in conjunction with reallocating capital resources to the remaining banks. Capitol's pending divestitures are subject to regulatory approval which may take an extended period of time to obtain.
The most significant trends which can impact the financial condition and results of operations of financial institutions are changes in market rates of interest and changes in general economic conditions.
Changes in interest rates, either up or down, have an impact on net interest income (plus or minus), depending upon the direction and timing of such changes. At any point in time, there is an imbalance between interest rate-sensitive assets and interest rate-sensitive liabilities. This means that when interest rates change, the timing and magnitude of the effect of such interest rate changes can alter the relationship between asset yields and the cost of funds. This timing difference between interest rate-sensitive assets and interest rate-sensitive liabilities is characterized as a "gap" which is quantified by the distribution of rate-sensitive amounts within various time periods in which they reprice or mature.
[The remainder of this page intentionally left blank]
F-37
The following table summarizes the consolidated financial position in relation to the "gap" at December 31, 2009 (in $1,000s):
| Interest Rate Sensitivity | |||||||||||||||||||
0 to 3 Months | 4 to 12 Months | 1 to 5 Years | Over 5 Years | Total | |||||||||||||||
| ASSETS | |||||||||||||||||||
| Money market and interest-bearing deposits | $ | 678,374 | $ | 15,033 | $ | 5,475 | $ | 698,882 | |||||||||||
| Federal funds sold | 21,851 | 21,851 | |||||||||||||||||
| Loans held for sale | 16,132 | 16,132 | |||||||||||||||||
| Investment securities | 32,331 | 7,972 | 4,719 | $ | 26,321 | 71,343 | |||||||||||||
| Portfolio loans | 1,569,941 | 496,595 | 1,744,685 | 235,880 | 4,047,101 | ||||||||||||||
| Nonearning assets | 276,631 | ||||||||||||||||||
| Total assets | $ | 2,318,629 | $ | 519,600 | $ | 1,754,879 | $ | 262,201 | $ | 5,131,940 | |||||||||
| LIABILITIES AND EQUITY | |||||||||||||||||||
| Interest-bearing deposits: | |||||||||||||||||||
| Time deposits under $100,000 | $ | 221,598 | $ | 490,195 | $ | 230,015 | $ | 495 | $ | 942,303 | |||||||||
| Time deposits $100,000 and over | 435,642 | 719,375 | 331,871 | 1,486,889 | |||||||||||||||
| All other interest-bearing deposits | 658,959 | 215,048 | 60,216 | 368,119 | 1,302,341 | ||||||||||||||
| Total interest-bearing deposits | 1,316,199 | 1,424,618 | 622,102 | 368,614 | 3,731,533 | ||||||||||||||
| Notes payable and short-term borrowings | 97,073 | 89,904 | 78,891 | 10,290 | 276,159 | ||||||||||||||
| Subordinated debentures | 68,000 | 33,000 | 69,841 | 170,841 | |||||||||||||||
| Noninterest-bearing liabilities | 719,801 | ||||||||||||||||||
| Total liabilities | 4,898,334 | ||||||||||||||||||
| Equity: | |||||||||||||||||||
| Capitol Bancorp stockholders' equity | 161,335 | ||||||||||||||||||
Noncontrolling interests in consolidated subsidiaries | 72,271 | ||||||||||||||||||
| Total equity | 233,606 | ||||||||||||||||||
| Total liabilities and equity | $ | 1,481,272 | $ | 1,514,522 | $ | 733,993 | $ | 448,745 | $ | 5,131,940 | |||||||||
| Interest rate sensitive period gap | $ | 837,357 | $ | (994,922 | ) | $ | 1,020,886 | (186,544 | ) | ||||||||||
| Interest rate sensitive cumulative gap | $ | 837,357 | $ | (157,565 | ) | $ | 863,321 | $ | 676,777 | ||||||||||
Period rate sensitive assets/period rate sensitive liabilities | 1.57 | 0.34 | 2.39 | 0.58 | |||||||||||||||
Cumulative rate sensitive assets/cumulative rate sensitive liabilities | 1.57 | 0.95 | 1.23 | 1.16 | |||||||||||||||
| Cumulative gap to total assets | 16.31 | % | (3.07 | )% | 16.82 | % | 13.19 | % | |||||||||||
[The remainder of this page intentionally left blank]
F-38
The table on the preceding page indicates that, in the immediate short-term, Capitol is slightly "asset sensitive" (i.e., interest-rate sensitive assets exceed interest-rate sensitive liabilities) and, accordingly, if interest rates increase it would favorably impact interest income. Reality in 2009, however, was an extremely low rate environment with unprecedented large rate cuts made by the Federal Reserve to the point of bringing short-term interbank rates to near zero in 2008. The "gap" changes daily based upon changes in the underlying assets and liabilities at the banks. Analyzing exposure to interest rate risk is prone to imprecision because the "gap" is constantly changing, the "gap" differs at each of the banks and it is difficult to predict the timing, amount and direction of future changes in market interest rates and the potential corresponding effect on customers' balances and transactions.
The banks endeavor to manage and monitor interest rate risk in concert with market conditions and risk parameters. Management strives to maintain a reasonably balanced position of interest rate-sensitive assets and liabilities. Capitol and its banks have not engaged in speculative positions, for example, through the use of derivatives, in anticipation of interest rate movements. In periods of relatively lower interest rates, the banks emphasize variable rate loans and time deposits to the extent possible in a competitive environment; however, competitive influences often result in making fixed rate loans, although the banks seek to limit the duration of such loans. Similarly, low interest rates generally make competition more intense for deposits since loan demand will typically increase during periods of lower rates and, accordingly, result in higher interest costs on deposits as competitors bid-up rates, adversely impacting interest margins. Future interest rates and the impact on earnings are difficult to predict. In addition to interest rate risk relating to interest-bearing assets and liabilities, changes in interest rates also can impact future transaction volume of loans and deposits at the banks. For activities which are influenced by levels of interest rates for transaction volume (for example, origination of residential mortgage loans), pricing margins and demand can become impacted significantly by changes in interest rates.
As a means of monitoring and managing exposure to interest rate risk, management uses a computerized simulation model which is intended to estimate pro forma effects of changes in interest rates. Using the simulation model, the following table illustrates, on a consolidated basis, changes which would occur in annual levels of interest income, interest expense and net interest income (in $1,000s) assuming both 100 and 200 basis point ("bp") parallel increases and decreases in interest rates:
| Pro Forma | |||||||||||||||||||
| Assuming No | Pro Forma Effect of | Pro Forma Effect of | |||||||||||||||||
| Change in | Interest Rate Increases | Interest Rate Decreases | |||||||||||||||||
| Interest Rates | +100 bp | +200 bp | -100 bp | -200 bp | |||||||||||||||
| Interest income | $ | 244,873 | $ | 263,168 | $ | 282,309 | $ | 233,345 | $ | 221,857 | |||||||||
| Interest expense | 90,388 | 111,743 | 133,091 | 72,899 | 62,717 | ||||||||||||||
| Net interest income | $ | 154,485 | $ | 151,425 | $ | 149,218 | $ | 160,446 | $ | 159,140 | |||||||||
F-39
The pro forma analysis on the preceding page is intended to quantify theoretical changes in interest income based on stated assumptions. The pro forma analysis excludes the effect of numerous other variables such as borrowers' ability to repay loans, the ability of banks to obtain deposits in a radically changed interest-rate environment and how management would revise its asset and liability management priorities in concert with rate changes.
While the pro forma analysis is intended to estimate the impact of an immediate 100 and 200 basis point change in rates, actual results will be different. Those results will differ (and may be materially different) because a change in market rates does not result in an instantaneous parallel shift in rates on loans and deposits at banks. Further, any financial model intended to estimate the impact of interest rate changes will not necessarily incorporate other variables, including management's efforts to manage its asset and liability interest rate sensitivity, or customer behavior.
As mentioned previously, the Federal Reserve took unprecedented action in late 2008 to reduce market interest rates to near zero. Because of Capitol's consolidated asset-sensitive gap position such rates have an adverse impact on net interest margin (and results of operations) as interest rates on loans reprice quickly while rates paid on deposits will reprice over an extended period of time as well as the difficulty in attracting deposits and deploying liquidity in a very low rate environment. It is impossible to speculate further on the timing, size and direction of future interest rate changes.
General economic conditions also have a significant impact on both the results of operations and the financial condition of financial institutions. As mentioned previously, general economic conditions within the state of Michigan and the national economic recession are uncertain and are likely to continue to have an adverse effect on Capitol's banks and their customers. It is likely that, absent significant catalysts, Michigan's economic recovery in particular may take an extended period of time.
Media reports raising serious concerns about the future health of the domestic economy, and the sustained deep national recession and its difficult prospects for recovery, have continued. During 2009 and 2008, nonperforming assets have increased significantly; it is likely levels of nonperforming assets and related loan losses and adverse valuation adjustments may increase further as economic conditions, locally and nationally, evolve.
Capitol's geographic footprint serves to minimize or avoid a concentration of assets in a particular region. The Great Lakes Region comprised 37% of consolidated assets at December 31, 2009 and 2008, and is disproportionate to other denominated regions of Capitol. Future asset growth is expected to emphasize other regions, improving the balance of Capitol's geographic presence and reducing the exposure to adverse economic conditions of any particular region.
While Capitol's community banking model has been focused on single-location, stand-alone banks, management has reevaluated the efficiency of that model in certain markets. In October 2008, Capitol announced plans to consolidate some of its banks. In 2009, the next step of this consolidation initiative occurred with the merger of nine bank charters in Michigan and six
F-40
bank charters in Arizona. In 2010, additional charter consolidations are likely in Nevada, Washington, southern California, northern Indiana and potentially other states, subject to regulatory approval. These charter consolidation efforts have several objectives, chiefly expense reduction, improved efficiency, further coordination and management of problem loans, enhanced risk-management and defined asset shrinkage goals.
Commercial banks continue to be subject to significant regulatory requirements which impact current and future operations. In addition to the extent of regulatory interaction with financial institutions, extensive rules and regulations governing lending activities, deposit gathering and capital adequacy (to name a few), translate into a significant cost burden of financial institution regulation. Such costs include the significant amount of management time and expense which is incurred in maintaining compliance and developing systems for compliance with those rules and regulations as well as the cost of examinations, audits and other compliance activities. The future of financial institution regulation, and its costs, is uncertain and difficult to predict.
In July 2009, Capitol announced its intention to formally and legally separate the operations of Michigan Commerce Bancorp Limited (MCBL) as an independent publicly-traded company through a spin-off transaction. If completed, Capitol would continue to be a publicly-held bank holding company with national banking operations and MCBL would become a separate publicly-traded bank holding company consisting of the substantial majority of Capitol's prior Michigan-based banks. Total assets of MCBL which would be included in the proposed spin-off approximated $1.1 billion or about 22% of Capitol's total assets as of December 31, 2009. If the proposed spin-off had been completed on December 31, 2009, consolidated total assets of Capitol would have approximated $4 billion, while reflecting a 33% decline in nonperforming assets and a modest increase in the consolidated total capital ratio. If the proposed spin-off would have occurred at January 1, 2009, the consolidated net loss attributable to Capitol would have been reduced 38% to $122 million ($4.25 per share) for the year ended December 31, 2009. Completion of the proposed spin-off transaction is subject to regulatory approval and other contingencies and is unlikely to occur without a significant infusion of additional capital.
During 2009, Capitol announced plans to pursue divestiture of some of its bank subsidiaries (or those which are subsidiaries of Capitol's bank-development subsidiaries) on a selective basis for the purpose of reallocating capital to enhance the capital of its retained bank subsidiaries, to the extent such sales may be completed with an attractive gain upon sale. Capitol and/or its bank-development subsidiaries have entered into definitive agreements to sell its interests (or controlling interest held by bank-development subsidiaries) in the following banks in 2010: Adams Dairy Bank, Bank of Belleville, Bank of Las Colinas, Community Bank of Lincoln, Community Bank of Rowan, Mountain View Bank of Commerce, Napa Community Bank and Ohio Commerce Bank.
F-41
In September 2009, Capitol completed the sale of Yuma Community Bank, previously a wholly-owned subsidiary. Capitol received $9.5 million in proceeds from the sale and recorded a pre-tax gain of approximately $1.2 million. Capitol's consolidated results of operations would not have been materially different if the sale had occurred at the beginning of the periods presented.
In November 2009, the sale of Bank of Santa Barbara, a subsidiary of CDBL III, was completed for aggregate cash consideration of $3.9 million and a pre-tax gain of approximately $1.1 million.
The remaining pending bank sales are subject to regulatory approval and other contingencies. If completed, the pending bank divestitures would result in Capitol receiving estimated proceeds approximating $53.8 million and a pre-tax gain on sale of approximately $15.1 million.
Note B of the notes to the consolidated financial statements is captioned Significant Accounting Policies. That disclosure spans numerous pages, all of which are deemed "significant" and are required disclosures under generally accepted accounting principles (GAAP). For purposes of this narrative, current SEC guidance requires the selection of a few of those for discussion as "critical accounting policies." The selection of which few will differ from company to company, even within a common industry, such as within the business of banking. Capitol considers its critical accounting policies to include the following:
Use of Estimates in Determining the Allowance for Loan Losses. Bank regulatory agencies, accounting standard setters and the SEC have all issued commentary, guidance and a variety of rule-making releases on how financial institutions are to determine the amount of their allowance for loan losses. Determining the allowance is a process and methodology which is inherently subjective in how and when to recognize and record a loss allowance or 'reserve' for loans. It is not a process or methodology which can be merely reduced to a strict absolute computation, like a mathematical formula to compute taxes. The process and methodology will differ from one financial institution to another and there is no 'one size fits all' format or approach to loss reserving.
The consolidated allowance for loan losses is based on the individual allowances for loan losses of each bank and any allowance amount or related adjustments at the parent-company level.
Each bank utilizes a common computational spreadsheet format and related internal guidance through Capitol's enterprise-wide credit policy to estimate potential loan losses at the balance-sheet date, to determine current requirements for the provision for loan losses and to document the adequacy of the allowance. The common format provides for the estimation of loan losses inherent in the loan portfolio at the balance-sheet date for groups of loans which meet certain risk-rating criteria, past-due loans, individual loans for which a specific allowance allocation is deemed necessary, individual collateral-dependent loans for which estimated losses have not
F-42
been previously recorded as direct write-downs to such loans and for all other loans not otherwise included in the allowance computation. Loans are categorized, for purposes of the allowance computations, primarily based on the type of collateral which secures such loans.
Each bank develops historical loss factors based on loan volume, loan quality trends, staffing levels and experience, past loss experience and current economic conditions. The banks then augment these loss factors based on such banks' actual prior loss experience utilizing migration analyses which encompass the preceding four quarters. For banks which do not have seasoned loan portfolios, those migration analyses are sometimes deemed insufficient to estimate potential losses at the balance-sheet date and, accordingly, alternate loss factors are applied using loss migration information of affiliates which are geographically situated near the subject bank in those instances. In addition to the loss migration factors used in each bank's allowance computation, each bank documents local and regional (in addition to consideration of national statistics) environmental considerations which include, but are not limited to, levels of unemployment and jobless claims and anecdotal data regarding real estate market conditions, in addition to consideration of loan concentrations and the levels of experience and expertise of credit personnel at the banks. These allowance computations and related documentation are prepared quarterly. During 2009, the historical loss factors were adjusted as a result of the declining economy throughout all regions and the industry-wide increase in nonperforming loans.
In addition to the banks' allowance computations, adjustments at the parent level or allowance amounts at the parent level are necessary from time to time. For example, at December 31, 2009, the parent had an allowance for loan losses of $2.9 million ($654,000 as of December 31, 2008) relating to loans carried on the parent's books which had been previously purchased from Capitol's bank subsidiaries.
Management believes its process and methodology for determining the allowance for loan losses is appropriate and adequate to properly estimate losses inherent in the loan portfolio at the balance-sheet date; however, actual future losses will differ from amounts considered in the allowance methodology. Further, bank regulatory agencies may have differing perspectives on the process, methodology and adequacy of the allowance for loan losses when examining the banks and, in addition, such agencies' examination teams may not be consistent in their review and conclusions from one bank to another. The process of determining the level of the allowance for loan losses at each individual bank and on a consolidated basis requires a high degree of subjective judgment. It is possible that others, given the same information, may at any point in time reach different reasonable conclusions. At December 31, 2009, Capitol's allowance for loan losses approximated 3.57% of portfolio loans outstanding. Based on portfolio loans outstanding at that date, any 1 basis-point (.01%) change in the allowance would have an approximate $405,000 impact on both the allowance for loan losses and pre-tax income (loss).
Accounting for Goodwill and Other Intangibles. At December 31, 2009, Capitol had $66.1 million of goodwill and other intangibles ($72.3 million at December 31, 2008). Goodwill arises in acquisition accounting. In Capitol's history, most of this goodwill resulted from share-exchange transactions when Capitol issued shares of its common stock at a premium
F-43
over the book value of the noncontrolling interest of a subsidiary banks' shares. Resulting goodwill is recorded at the entity to which the goodwill related. Current accounting rules require at least an annual review of goodwill for potential impairment, which Capitol most recently conducted as of November 30, 2009. An interim review for potential goodwill impairment is deemed necessary when events or circumstances indicate potential for impairment since the annual testing date.
Impairment testing is determined through a two-step process; step one involves using published information regarding comparable bank-sale transactions and related multiples of book values and multiples of earnings, as well as the primary valuation methodology to determine fair value, which is the discounted cash flow method. The second testing step is required in the event that any reporting unit fails step one. Step two involves the determination of the fair value of each component of the reporting unit's balance sheet. The results of this approach to estimating fair value of the reporting unit is compared to the implied fair value determined in step one. The difference between the estimated fair value determined in step two of the impairment test and the implied fair value represents implied goodwill which, in turn, is compared to recorded goodwill. If implied goodwill is less than recorded goodwill, impairment exists and the amount of shortfall between implied goodwill and recorded goodwill is the impairment amount which is to be written off in the period the determination is made.
Capitol initiated an evaluation using August 31, 2009 information to determine if events or circumstances warranted an interim impairment test of goodwill. Such events or circumstances considered included recent increases in the level of nonperforming assets, changes in net interest margin, level of operating expenses, profitability and recent changes to elements of the discount rate. These are considered key inputs and drivers in the step one valuation methodology which is discounted cash flows. Capitol determined that from the interim 2009 impairment test, a number of the key inputs, either individually or collectively, had changed significantly for a number of the reporting units from prior quarter-ends as well as since the last testing date of November 30, 2008. The overall methodology for evaluating potential impairment of goodwill did not change in 2009 from the methodology used for annual testing performed in 2008, but assumptions used in step one and step two analyses were updated to reflect the current environment.
In performing step one of the interim analyses, future cash flows were projected using updated assumptions for asset growth, interest margin, noninterest income and noninterest expense. Those cash flows were then discounted using an updated discount rate that was adjusted for changes in the 20-year U.S. Treasury rate and company-specific risk premiums. The discount rate used for all entities was 16% which was 1.54 basis points higher than the discount rate used for the majority of the entities during the annual impairment testing conducted as of November 30, 2008. Additionally, cash flows were discounted using a lower rate of 15.14% and higher rate of 17.14% in order to stress-test the results of the analysis.
As a result of that interim analysis, nine reporting units were subject to evaluation under step two testing and it was determined one institution, Peoples State Bank, had implied goodwill less than reported goodwill by approximately $1.5 million. Therefore, that amount was charged to noninterest expense effective September 30, 2009.
F-44
During the fourth quarter of 2009, Capitol completed its annual evaluation of goodwill using November 30, 2009 information and performing the similar steps as in the interim evaluation previously discussed, however, the discount rate applied was increased to 26%. The following table provides information as to the amount of goodwill by the reporting unit as of November 30, 2009, the estimated fair value determined in step one under the discounted cash flow methodology as a percentage of carrying value of equity and whether the reporting unit passed step one of the impairment testing:
| Entity | Recorded Goodwill as of November 30, 2009 | Estimated Entity Fair Value as Percentage of Book Value | Did Entity Pass Step One of Impairment Test? | ||||||
| (in $1,000s) | |||||||||
| Bank of Escondido | $ | 2,806 | 52.73 | % | No | ||||
| Bank of Las Vegas | 1,800 | 43.30 | % | No | |||||
| Black Mountain Community Bank | 1,263 | 153.63 | % | Yes | |||||
| Central Arizona Bank | 947 | 66.96 | % | No | |||||
| Desert Community Bank | 1,213 | 122.69 | % | Yes | |||||
| Elkhart Community Bank | 1,228 | 100.69 | % | Yes | |||||
| First Carolina State Bank | 3,926 | 45.51 | % | No | |||||
| Goshen Community Bank | 1,407 | 68.02 | % | No | |||||
| Michigan Commerce Bank | 2,875 | 65.99 | % | No | |||||
| Paragon Bank & Trust | 1,321 | 90.87 | % | No | |||||
| Peoples State Bank | 625 | 14.95 | % | No | |||||
| Red Rock Community Bank | 2,582 | 98.00 | % | No | |||||
| Southern Arizona Community Bank | 916 | 111.92 | % | Yes | |||||
| Sunrise Bank of Albuquerque | 671 | 59.84 | % | No | |||||
| Sunrise Bank of Arizona | 3,090 | 43.55 | % | No | |||||
| Sunrise Bank of San Diego | 1,965 | 69.51 | % | No | |||||
| Capitol Bancorp Limited | $ | 67,352 | 61.59 | % | No | ||||
As noted above, thirteen reporting units did not pass step one of the annual impairment test and, accordingly, were subject to further evaluation under step two testing. The resulting step two analysis determined two institutions, Peoples State Bank and one of the predecessor banks merged into Sunrise Bank of Arizona, in which the implied goodwill was less than the recorded goodwill by approximately $400,000 and $1.6 million, respectively. Therefore, those amounts were charged to noninterest expense effective December 31, 2009. There can be no assurance that future testing will not result in additional material impairment charges at a future date.
Accounting for Income Taxes. Accounting for income taxes requires significant estimates and management judgments. At December 31, 2009, Capitol had a net deferred income tax asset approximating $109.9 million before consideration of the related 2009 valuation allowance ($66.4 million at December 31, 2008). When it is determined that realization of the deferred income tax asset is in doubt, a valuation reserve is required to reduce the deferred tax asset to the amount which is more-likely-than-not realizable.
F-45
As of December 31, 2009, the consolidated deferred income tax asset consisted primarily of components relating to provisions for loan losses and net operating losses of consolidated subsidiaries.
Due to continuing operating losses, management reassessed the potential realization of the deferred tax asset during 2009 and recorded a valuation allowance of $104.5 million, to reduce the deferred income tax asset to approximately $5.4 million, which represents the amount of the asset estimated to be more-likely-than-not realizable. The assessment of the potential realization of the deferred tax asset will be reviewed for future changes affecting realizability and the valuation allowance may be adjusted in future periods accordingly. The ultimate realization of these deferred tax assets is dependent on the generation of future taxable income during the periods in which temporary differences become deductible. Changes in existing tax laws could also affect actual tax results and the valuation of deferred tax assets over time. The accounting for deferred taxes is based, in part, on an estimate of future results. Differences between anticipated and actual outcomes of these future tax consequences could have a material impact on Capitol's consolidated results of operations or financial position.
Consolidation Policy. Current accounting rules require consolidation of entities which are majority-owned or controlled by Capitol. This means that partially-owned banks and bank-development subsidiaries are combined with Capitol for financial reporting purposes along with banks and other subsidiaries which are wholly-owned. The consolidated balance sheet includes all assets and liabilities of those entities. However, after giving effect to the noncontrolling interests in net income or losses of consolidated subsidiaries, net income (loss) attributable to Capitol only includes the entities' net income or loss to the extent of Capitol's ownership. Reported results would be materially different if Capitol had 100% ownership of those entities.
There were several new accounting standards which were issued or became effective in 2009, in addition to some which have later effective dates. Those are listed and discussed in Note B of the consolidated financial statements, beginning on page F-64.
[The remainder of this page intentionally left blank]
F-46
The summary below is not a complete list of all risk factors identified by management and readers are encouraged to review Capitol's Form 10-K (Item 1A), Capitol's cautions regarding forward-looking statements appearing on page F-6 of this Annual Report and other SEC filings, particularly registration statements, for a more comprehensive review of risk factors, which include the following, among others:
· | The regulatory environment for the banking industry could change significantly and adversely |
· | The adverse economic environment of 2009 may worsen further resulting in higher levels of nonperforming loans and loan losses |
· | Young banks, which include Capitol's newer affiliates, incur operating losses and may not contribute to consolidated operating results for an extended period of time |
· | The environment for raising capital has become unstable and may limit growth plans and operations |
· | Changes in regulations, or regulatory action regarding Capitol or its banks could limit future expansion plans and operations |
· | The allowance for loan losses is based on estimates and actual losses may differ materially from those estimates |
· | Concentrations in loans secured by commercial real estate could limit or delay future expansion plans and loss estimates could change significantly if real estate market conditions deteriorate further |
· | Loss estimates for real estate collateral-dependent loans are based on independent appraisals which are subject to change |
· | Investments in Federal Home Loan Bank stock are carried at cost and are a restricted security which may be redeemed only by the issuer; the issuer's future ability to redeem the security is subject to its liquidity and capital adequacy |
· | Capitol may participate in various capital programs of the U.S. Treasury which may be dilutive to Capitol's common stock and results of operations |
· | The complexity of Capitol's structure (a mixture of partially-owned and wholly-owned banks and related entities) complicates financial analysis |
In addition to the items listed above, of course, changes in interest rates can have a pervasive impact on Capitol and its banks.
Capitol has a risk management program in place which endeavors to manage these and other risks.
F-47
Internal Control Over Financial Reporting
Capitol Bancorp Ltd. is responsible for the preparation, integrity and fair presentation of the consolidated financial statements included in this annual report. The consolidated financial statements and notes included in this annual report have been prepared in conformity with United States generally accepted accounting principles and necessarily include some amounts that are based on management's best estimates and judgments.
We, as management of Capitol Bancorp Ltd., are responsible for establishing and maintaining effective internal control over financial reporting that is designed to produce reliable financial statements in conformity with United States generally accepted accounting principles. The system of internal control over financial reporting, as it relates to the financial statements, is evaluated for effectiveness by management and tested for reliability through a program of internal audits. Actions are taken to correct potential deficiencies as they are identified. Any system of internal control, no matter how well designed, has inherent limitations, including the possibility that a control can be circumvented or overridden and misstatements due to error or fraud may occur and not be detected. Also, because of changes in conditions, internal control effectiveness may vary over time. Accordingly, even an effective system of internal control will provide only reasonable assurance with respect to financial statement preparation.
Capitol's Audit Committee, consisting entirely of independent directors, meets regularly with management, internal auditors and the independent registered public accounting firm, and reviews audit plans and results, as well as management's actions taken in discharging responsibilities for accounting, financial reporting and internal control. BDO Seidman, LLP, independent registered public accounting firm, and the internal auditors have direct and confidential access to Capitol's Audit Committee at all times to discuss the results of their examinations.
Management assessed Capitol's system of internal control over financial reporting as of December 31, 2009, in relation to criteria for effective internal control over financial reporting as described in Internal Control – Integrated Framework, issued by the Committee of Sponsoring Organizations of the Treadway Commission. Based on this assessment, management concluded that, as of December 31, 2009, its system of internal control over financial reporting was effective and met the criteria of the Internal Control – Integrated Framework. BDO Seidman, LLP, independent registered public accounting firm, has issued an attestation report on Capitol's internal control over financial reporting.
Joseph D. Reid Chairman and CEO Lansing, Michigan March 19, 2010 |  Lee W. Hendrickson Chief Financial Officer |
F-48
 | BDO Seidman, LLP Accountants and Consultants | 99 Monroe Avenue N.W., Suite 800 Grand Rapids, Michigan 49503-2654 Telephone: (616) 774-7000 Fax: (616) 776-3680 |
Board of Directors and Stockholders
Capitol Bancorp Ltd.
We have audited Capitol Bancorp Ltd. and subsidiaries' internal control over financial reporting as of December 31, 2009, based on criteria established in Internal Control-Integrated Framework issued by the Committee of Sponsoring Organizations of the Treadway Commission (the COSO criteria). Capitol Bancorp Ltd.'s management is responsible for maintaining effective internal control over financial reporting and for its assessment of the effectiveness of internal control over financial reporting, included in the accompanying Management's Report on Internal Control Over Financial Reporting. Our responsibility is to express an opinion on the Corporation's internal control over financial reporting based on our audit.
We conducted our audit in accordance with the standards of the Public Company Accounting Oversight Board (United States). Those standards require that we plan and perform the audit to obtain reasonable assurance about whether effective internal control over financial reporting was maintained in all material respects. Our audit included obtaining an understanding of internal control over financial reporting, assessing the risk that a material weakness exists, and testing and evaluating the design and operating effectiveness of internal control based on the assessed risk. Our audit also included performing such other procedures as we considered necessary in the circumstances. We believe that our audit provides a reasonable basis for our opinion.
A company's internal control over financial reporting is a process designed to provide reasonable assurance regarding the reliability of financial reporting and the preparation of financial statements for external purposes in accordance with generally accepted accounting principles. A company's internal control over financial reporting includes those policies and procedures that (1) pertain to the maintenance of records that, in reasonable detail, accurately and fairly reflect the transactions and dispositions of the assets of the company; (2) provide reasonable assurance that transactions are recorded as necessary to permit preparation of financial statements in accordance with generally accepted accounting principles, and that receipts and expenditures of the company are being made only in accordance with authorizations of management and directors of the company; and (3) provide reasonable assurance regarding prevention or timely detection of unauthorized acquisition, use, or disposition of the company's assets that could have a material effect on the financial statements.
Because of its inherent limitations, internal control over financial reporting may not prevent or detect misstatements. Also, projections of any evaluation of effectiveness to future periods are subject to the risk that controls may become inadequate because of changes in conditions, or that the degree of compliance with the policies or procedures may deteriorate.
F-49
In our opinion, Capitol Bancorp Ltd. and subsidiaries maintained, in all material respects, effective internal control over financial reporting as of December 31, 2009, based on the COSO criteria.
We have also audited, in accordance with the standards of the Public Company Accounting Oversight Board (United States), the accompanying consolidated balance sheets of Capitol Bancorp Ltd. and subsidiaries as of December 31, 2009 and 2008, and the related consolidated statements of operations, changes in stockholders' equity and cash flows for each of the three years in the period ended December 31, 2009, and our report dated March 19, 2010 expressed an unqualified opinion thereon.
 Grand Rapids, Michigan March 19, 2010 |
F-50
| BDO Seidman, LLP Accountants and Consultants | 99 Monroe Avenue N.W., Suite 800 Grand Rapids, Michigan 49503-2654 Telephone: (616) 774-7000 Fax: (616) 776-3680 |
Board of Directors and Stockholders
Capitol Bancorp Ltd.
We have audited the accompanying consolidated balance sheets of Capitol Bancorp Ltd. and subsidiaries as of December 31, 2009 and 2008, and the related consolidated statements of operations, changes in stockholders' equity and cash flows for each of the three years in the period ended December 31, 2009. These financial statements are the responsibility of the Corporation's management. Our responsibility is to express an opinion on these financial statements based on our audits.
We conducted our audits in accordance with the standards of the Public Company Accounting Oversight Board (United States). Those standards require that we plan and perform the audit to obtain reasonable assurance about whether the financial statements are free of material misstatement. An audit includes examining, on a test basis, evidence supporting the amounts and disclosures in the financial statements, assessing the accounting principles used and significant estimates made by management, as well as evaluating the overall financial statement presentation. We believe that our audits provide a reasonable basis for our opinion.
In our opinion, the consolidated financial statements referred to above present fairly, in all material respects, the financial position of Capitol Bancorp Ltd. and subsidiaries as of December 31, 2009 and 2008, and the results of their operations and their cash flows for each of the three years in the period ended December 31, 2009, in conformity with accounting principles generally accepted in the United States of America.
We have also audited, in accordance with the standards of the Public Company Accounting Oversight Board (United States), Capitol Bancorp Ltd. and subsidiaries' internal control over financial reporting as of December 31, 2009, based on criteria established in Internal Control – Integrated Framework issued by the Committee of Sponsoring Organizations of the Treadway Commission (COSO) and our report dated March 19, 2010 expressed an unqualified opinion thereon.
Grand Rapids, Michigan March 19, 2010 |
F-51
| -December 31- | ||||||||
| 2009 | 2008 | |||||||
| (in $1,000s) | ||||||||
| (as adjusted) | ||||||||
| ASSETS | ||||||||
| Cash and due from banks | $ | 88,188 | $ | 136,499 | ||||
| Money market and interest-bearing deposits | 698,882 | 391,836 | ||||||
| Federal funds sold | 21,851 | 96,031 | ||||||
| Cash and cash equivalents | 808,921 | 624,366 | ||||||
| Loans held for sale | 16,132 | 10,474 | ||||||
| Investment securities—Note C: | ||||||||
| Available for sale, carried at fair value | 40,778 | 15,584 | ||||||
Held for long-term investment, principally carried at amortized cost which approximates fair value | 30,565 | 32,856 | ||||||
| Total investment securities | 71,343 | 48,440 | ||||||
Portfolio loans, less allowance for loan losses of $144,664 in 2009 and $93,040 in 2008—Note D | 3,902,437 | 4,642,189 | ||||||
| Premises and equipment—Note F | 48,386 | 59,249 | ||||||
| Accrued interest income | 15,585 | 18,871 | ||||||
| Goodwill—Note B | 66,126 | 72,342 | ||||||
| Other real estate owned | 111,820 | 67,171 | ||||||
| Recoverable income taxes—Note L | 43,763 | 11,063 | ||||||
| Other assets | 47,427 | 100,671 | ||||||
| TOTAL ASSETS | $ | 5,131,940 | $ | 5,654,836 | ||||
| LIABILITIES AND EQUITY | ||||||||
| Deposits: | ||||||||
| Noninterest-bearing | $ | 679,100 | $ | 700,786 | ||||
| Interest-bearing—Note G | 3,731,533 | 3,796,826 | ||||||
| Total deposits | 4,410,633 | 4,497,612 | ||||||
| Debt obligations: | ||||||||
| Notes payable and short-term borrowings—Note H | 276,159 | 446,925 | ||||||
| Subordinated debentures—Note I | 167,441 | 167,293 | ||||||
| Total debt obligations | 443,600 | 614,218 | ||||||
| Accrued interest and other liabilities | 44,101 | 29,938 | ||||||
| Total liabilities | 4,898,334 | 5,141,768 | ||||||
| EQUITY—Notes B, J, P and Q | ||||||||
Capitol Bancorp Limited stockholders' equity: | ||||||||
Preferred stock, 20,000,000 shares authorized; none issued and outstanding | -- | -- | ||||||
Common stock, no par value, 50,000,000 shares authorized; issued and outstanding: 2009 – 17,545,631 shares 2008 – 17,293,908 shares | 277,707 | 274,018 | ||||||
| Retained earnings (deficit) | (115,751 | ) | 80,255 | |||||
| Undistributed common stock held by employee-benefit trust | (558 | ) | (569 | ) | ||||
Fair value adjustment (net of tax effect) for investment securities available for sale (accumulated other comprehensive income/loss) | (63 | ) | 144 | |||||
| Total Capitol Bancorp Limited stockholders' equity | 161,335 | 353,848 | ||||||
| Noncontrolling interests in consolidated subsidiaries | 72,271 | 159,220 | ||||||
| Total equity | 233,606 | 513,068 | ||||||
| TOTAL LIABILITIES AND EQUITY | $ | 5,131,940 | $ | 5,654,836 | ||||
See notes to consolidated financial statements.
F-52
| -Year Ended December 31- | ||||||||||||
| 2009 | 2008 | 2007 | ||||||||||
| (in $1,000s except per share data) | ||||||||||||
| (as adjusted) | (as adjusted) | |||||||||||
| Interest income: | ||||||||||||
| Portfolio loans (including fees) | $ | 263,002 | $ | 296,689 | $ | 314,800 | ||||||
| Loans held for sale | 902 | 774 | 2,133 | |||||||||
| Taxable investment securities | 673 | 571 | 773 | |||||||||
| Federal funds sold | 99 | 3,822 | 10,687 | |||||||||
| Other | 2,223 | 2,459 | 2,046 | |||||||||
| Total interest income | 266,899 | 304,315 | 330,439 | |||||||||
| Interest expense: | ||||||||||||
| Deposits | 87,312 | 112,370 | 124,160 | |||||||||
| Debt obligations and other | 23,205 | 28,096 | 23,002 | |||||||||
| Total interest expense | 110,517 | 140,466 | 147,162 | |||||||||
| Net interest income | 156,382 | 163,849 | 183,277 | |||||||||
| Provision for loan losses—Note D | 190,680 | 82,492 | 25,340 | |||||||||
Net interest income (deficiency) after provision for loan losses | (34,298 | ) | 81,357 | 157,937 | ||||||||
| Noninterest income: | ||||||||||||
| Service charges on deposit accounts | 5,914 | 5,881 | 4,787 | |||||||||
| Trust and wealth-management revenue | 4,957 | 6,182 | 5,149 | |||||||||
Fees from origination of non-portfolio residential mortgage loans | 3,925 | 3,642 | 4,482 | |||||||||
| Gain on sales of government-guaranteed loans | 2,811 | 2,060 | 2,733 | |||||||||
Realized gains (losses) on sales of investment securities available for sale | 7 | 50 | (2 | ) | ||||||||
| Gain on sale of bank subsidiary—Note T | 1,187 | |||||||||||
| Other | 9,972 | 8,617 | 7,232 | |||||||||
| Total noninterest income | 28,773 | 26,432 | 24,381 | |||||||||
| Noninterest expense: | ||||||||||||
| Salaries and employee benefits | 99,554 | 108,702 | 106,563 | |||||||||
| Occupancy | 19,289 | 18,648 | 15,079 | |||||||||
| Equipment rent, depreciation and maintenance | 19,235 | 12,361 | 10,022 | |||||||||
Costs associated with foreclosed properties and other real estate owned | 45,674 | 6,878 | 989 | |||||||||
| FDIC insurance premiums and other regulatory fees | 15,412 | 4,060 | 2,723 | |||||||||
Preopening and start-up costs of de novo banks and bank-development subsidiaries | 1,928 | 5,693 | ||||||||||
| Other | 41,433 | 37,811 | 35,091 | |||||||||
| Total noninterest expense | 240,597 | 190,388 | 176,160 | |||||||||
| Income (loss) before income taxes (benefit) | (246,122 | ) | (82,599 | ) | 6,158 | |||||||
| Income taxes (benefit)—Note L | 18,418 | (30,148 | ) | 2,824 | ||||||||
| NET INCOME (LOSS) | (264,540 | ) | (52,451 | ) | 3,334 | |||||||
| Less net losses attributable to noncontrolling interests | 69,371 | 23,844 | 18,603 | |||||||||
NET INCOME (LOSS) ATTRIBUTABLE TO CAPITOL BANCORP LIMITED | $ | (195,169 | ) | $ | (28,607 | ) | $ | 21,937 | ||||
NET INCOME (LOSS) PER SHARE ATTRIBUTABLE TO CAPITOL BANCORP LIMITED—Note M: | ||||||||||||
| Basic | $ | (11.28 | ) | $ | (1.67 | ) | $ | 1.29 | ||||
| Diluted | $ | (11.28 | ) | $ | (1.67 | ) | $ | 1.27 | ||||
See notes to consolidated financial statements.
F-53
Capitol Bancorp Limited Stockholders' Equity | ||||||||||||||||||||||||||||
Common Stock | Retained Earnings (Deficit) | Undistributed Common Stock Held by Employee- Benefit Trust | Accumulated Other Comprehensive Income (Loss) | Total Capitol Bancorp Limited Stockholders' Equity | Noncontrolling Interests in Consolidated Subsidiaries | Total Equity | ||||||||||||||||||||||
| Balances at January 1, 2007 | $ | 249,244 | $ | 112,779 | $ | (144 | ) | $ | 361,879 | $ | 126,512 | $ | 488,391 | |||||||||||||||
Investment in consolidated subsidiaries by noncontrolling interests | 55,713 | 55,713 | ||||||||||||||||||||||||||
Issuance of 371,314 shares of common stock to acquire noncontrolling interest in subsidiary | 15,927 | 15,927 | (7,424 | ) | 8,503 | |||||||||||||||||||||||
Issuance of 277,149 shares of common stock upon exercise of stock options | 4,706 | 4,706 | 4,706 | |||||||||||||||||||||||||
Surrender of 54,855 shares of common stock to facilitate exercise of stock options and vesting of restricted stock | (1,870 | ) | (1,870 | ) | (1,870 | ) | ||||||||||||||||||||||
Recognition of compensation expense relating to restricted common stock ($1,562) and stock options | 1,972 | 1,972 | 1,972 | |||||||||||||||||||||||||
Issuance of 43,972 unvested shares of restricted common stock, net of related unearned employee compensation and 2,000 forfeited shares | -- | -- | -- | |||||||||||||||||||||||||
| Tax benefit from share-based payments | 1,688 | 1,688 | 1,688 | |||||||||||||||||||||||||
Issuance of 24,506 shares of common stock to ESOP | 1,132 | 1,132 | 1,132 | |||||||||||||||||||||||||
Acquisition of 85,543 shares for employee benefit trust | $ | (2,482 | ) | (2,482 | ) | (2,482 | ) | |||||||||||||||||||||
Transfer of 64,430 shares to ESOP and distribution of 435 shares to employees upon anniversary of employment | (591 | ) | 1,896 | 1,305 | 1,305 | |||||||||||||||||||||||
| Cash dividends paid ($1.00 per share) | (17,196 | ) | (17,196 | ) | (17,196 | ) | ||||||||||||||||||||||
| Components of comprehensive income: | ||||||||||||||||||||||||||||
| Net income for 2007 | 21,937 | 21,937 | (18,603 | ) | 3,334 | |||||||||||||||||||||||
Fair value adjustment for investment securities available for sale (net of income tax effect) | 147 | 147 | 147 | |||||||||||||||||||||||||
| Comprehensive income for 2007 | 22,084 | 3,481 | ||||||||||||||||||||||||||
| BALANCES AT DECEMBER 31, 2007 | 272,208 | 117,520 | (586 | ) | 3 | 389,145 | 156,198 | 545,343 | ||||||||||||||||||||
Investment in consolidated subsidiaries by noncontrolling interests | 26,866 | 26,866 | ||||||||||||||||||||||||||
Issuance of 108,935 shares of common stock upon exercise of stock options | 1,950 | 1,950 | 1,950 | |||||||||||||||||||||||||
Surrender of 108,163 shares of common stock to facilitate exercise of stock options and vesting of restricted stock | (2,376 | ) | (2,376 | ) | (2,376 | ) | ||||||||||||||||||||||
Issuance of 32,290 unvested shares of restricted common stock, net of related unearned employee compensation and 55,722 forfeited shares | -- | -- | -- | |||||||||||||||||||||||||
Recognition of compensation expense relating to restricted common stock and stock options | 2,227 | 2,227 | 2,227 | |||||||||||||||||||||||||
| Tax benefit from share-based payments | 20 | 20 | 20 | |||||||||||||||||||||||||
Transfer of 205 shares to ESOP and distribution of 370 shares to employees upon anniversary of employment | (11 | ) | 17 | 6 | 6 | |||||||||||||||||||||||
| Cash dividends paid ($0.50 per share) | (8,658 | ) | (8,658 | ) | (8,658 | ) | ||||||||||||||||||||||
| Components of comprehensive income (loss): | ||||||||||||||||||||||||||||
| Net loss for 2008 | (28,607 | ) | (28,607 | ) | (23,844 | ) | (52,451 | ) | ||||||||||||||||||||
Fair value adjustment for investment securities available for sale (net of income tax effect) | 141 | 141 | 141 | |||||||||||||||||||||||||
| Comprehensive loss for 2008 | (28,466 | ) | (52,310 | ) | ||||||||||||||||||||||||
| BALANCES AT DECEMBER 31, 2008 | 274,018 | 80,255 | (569 | ) | 144 | 353,848 | 159,220 | 513,068 | ||||||||||||||||||||
See notes to consolidated financial statements.
F-54
Consolidated Statements of Changes in Equity (in $1,000s, except share and per-share data)—Continued
Capitol Bancorp Limited Stockholders' Equity | ||||||||||||||||||||||||||||
Common Stock | Retained Earnings (Deficit) | Undistributed Common Stock Held by Employee- Benefit Trust | Accumulated Other Comprehensive Income (Loss) | Total Capitol Bancorp Limited Stockholders' Equity | Noncontrolling Interests in Consolidated Subsidiaries | Total Equity | ||||||||||||||||||||||
| BALANCES AT DECEMBER 31, 2008 | $ | 274,018 | $ | 80,255 | $ | (569 | ) | $ | 144 | $ | 353,848 | $ | 159,220 | $ | 513,068 | |||||||||||||
Sale of subsidiary's shares to noncontrolling interest | 27 | 27 | 3,793 | 3,820 | ||||||||||||||||||||||||
Reduction in noncontrolling interests of deconsolidated subsidiaries | (18,829 | ) | (18,829 | ) | ||||||||||||||||||||||||
Issuance of 227,357 shares of common stock and 75,719 warrants to purchase shares of common stock to acquire noncontrolling interest in subsidiary | 2,542 | 2,542 | (2,542 | ) | ||||||||||||||||||||||||
Surrender of 3,934 shares of common stock to facilitate vesting of restricted stock | (23 | ) | (23 | ) | (23 | ) | ||||||||||||||||||||||
Issuance of 37,000 unvested shares of restricted common stock, net of related unearned employee compensation and 8,700 forfeited shares | -- | -- | ||||||||||||||||||||||||||
Recognition of compensation expense relating to restricted common stock and stock options | 1,350 | 1,350 | 1,350 | |||||||||||||||||||||||||
| Tax effect of share-based payments | (169 | ) | (169 | ) | (169 | ) | ||||||||||||||||||||||
Distribution of 385 shares to employees upon anniversary of employment | (11 | ) | 11 | |||||||||||||||||||||||||
| Cash dividends paid ($0.05 per share) | (864 | ) | (864 | ) | (864 | ) | ||||||||||||||||||||||
| Components of comprehensive loss: | ||||||||||||||||||||||||||||
| Net loss for 2009 | (195,169 | ) | (195,169 | ) | (69,371 | ) | (264,540 | ) | ||||||||||||||||||||
Fair value adjustment for investment securities available for sale (net of income tax effect) | (207 | ) | (207 | ) | (207 | ) | ||||||||||||||||||||||
| Comprehensive loss for 2009 | (195,376 | ) | (264,747 | ) | ||||||||||||||||||||||||
| BALANCES AT DECEMBER 31, 2009 | $ | 277,707 | $ | (115,751 | ) | $ | (558 | ) | $ | (63 | ) | $ | 161,335 | $ | 72,271 | $ | 233,606 | |||||||||||
See notes to consolidated financial statements.
[The remainder of this page intentionally left blank]
F-55
| -Year Ended December 31- | ||||||||||||
| 2009 | 2008 | 2007 | ||||||||||
| (in $1,000s) | ||||||||||||
| OPERATING ACTIVITIES | ||||||||||||
| Net income (loss) | $ | (264,540 | ) | $ | (52,451 | ) | $ | 3,334 | ||||
Adjustments to reconcile net income (loss) to net cash provided by operating activities: | ||||||||||||
| Provision for loan losses | 190,680 | 82,492 | 25,340 | |||||||||
| Depreciation of premises and equipment | 10,084 | 10,547 | 8,980 | |||||||||
| Amortization and write-down of intangibles | 4,269 | 510 | 315 | |||||||||
Net amortization (accretion) of investment security premiums (discounts) | (33 | ) | (32 | ) | 11 | |||||||
| Loss (gain) on sales of premises and equipment | 254 | 165 | (57 | ) | ||||||||
| Gain on sales of government-guaranteed loans | (2,811 | ) | (2,060 | ) | (2,733 | ) | ||||||
| Gain on sale of bank subsidiary | (1,187 | ) | ||||||||||
Realized losses (gain) on sales of investment securities available for sale | (7 | ) | (50 | ) | 2 | |||||||
| Loss on sales of other real estate owned | 4,400 | 1,191 | 58 | |||||||||
| Write-down of other real estate owned | 32,315 | 10,679 | 307 | |||||||||
| Amortization of issuance costs of subordinated debentures | 148 | 117 | 95 | |||||||||
| Share-based compensation expense | 1,350 | 2,227 | 1,972 | |||||||||
| Deferred income tax credit | (43,354 | ) | (27,577 | ) | (10,397 | ) | ||||||
| Valuation allowance for deferred income tax assets | 104,498 | |||||||||||
| Originations and purchases of loans held for sale | (311,179 | ) | (206,544 | ) | (499,787 | ) | ||||||
| Proceeds from sales of loans held for sale | 305,080 | 212,489 | 517,961 | |||||||||
| Decrease in accrued interest income and other assets | (30,722 | ) | (16,809 | ) | (6,367 | ) | ||||||
| Increase (decrease) in accrued interest and other liabilities | 15,363 | (5,223 | ) | 8,410 | ||||||||
| NET CASH PROVIDED BY OPERATING ACTIVITIES | 14,608 | 9,671 | 47,444 | |||||||||
| INVESTING ACTIVITIES | ||||||||||||
| Proceeds from sales of investment securities available for sale | 798 | 890 | 299 | |||||||||
| Proceeds from calls, prepayments and maturities of investment securities | 16,936 | 20,392 | 11,303 | |||||||||
| Purchases of investment securities | (58,519 | ) | (30,933 | ) | (10,629 | ) | ||||||
| Net decrease (increase) in portfolio loans | 155,438 | (562,032 | ) | (877,790 | ) | |||||||
| Proceeds from sales of government-guaranteed loans | 39,429 | 23,850 | 24,657 | |||||||||
| Proceeds from sales of premises and equipment | 2,033 | 1,197 | 407 | |||||||||
| Purchases of premises and equipment | (5,137 | ) | (11,127 | ) | (15,066 | ) | ||||||
| Proceeds from sale of bank subsidiary | 9,506 | |||||||||||
| Payments received on other real estate owned | 6 | 166 | 60 | |||||||||
| Proceeds from sales of other real estate owned | 17,716 | 9,288 | 9,898 | |||||||||
| NET CASH PROVIDED (USED) BY INVESTING ACTIVITIES | 178,206 | (548,309 | ) | (856,861 | ) | |||||||
| FINANCING ACTIVITIES | ||||||||||||
Net increase (decrease) in demand deposits, NOW accounts and savings accounts | 157,850 | (91,672 | ) | 185,376 | ||||||||
| Net increase in certificates of deposit | 12,300 | 744,539 | 400,884 | |||||||||
| Net borrowings from (payments on) debt obligations | 1,484 | (4,603 | ) | 14,083 | ||||||||
| Proceeds from FHLB borrowings | 3,146,430 | 1,838,858 | 1,035,668 | |||||||||
| Payments on FHLB borrowings | (3,278,820 | ) | (1,707,714 | ) | (920,521 | ) | ||||||
| Net proceeds from issuance of subordinated debentures | 11,046 | 55,000 | ||||||||||
| Resources provided by noncontrolling interests | 3,794 | 26,866 | 55,713 | |||||||||
| Net proceeds from issuance of common stock | 1,950 | 4,706 | ||||||||||
| Tax benefit (cost) from share-based payments | (169 | ) | 20 | 1,688 | ||||||||
| Acquisition of shares for employee benefit trust | (2,482 | ) | ||||||||||
| Cash dividends paid | (864 | ) | (8,658 | ) | (17,196 | ) | ||||||
| NET CASH PROVIDED BY FINANCING ACTIVITIES | 42,005 | 810,632 | 812,919 | |||||||||
| INCREASE IN CASH AND CASH EQUIVALENTS | 234,819 | 271,994 | 3,502 | |||||||||
| Less cash and cash equivalents of deconsolidated subsidiaries | (50,264 | ) | ||||||||||
| Cash and cash equivalents at beginning of year | 624,366 | 352,372 | 348,870 | |||||||||
| CASH AND CASH EQUIVALENTS AT END OF YEAR | $ | 808,921 | $ | 624,366 | $ | 352,372 | ||||||
| Supplemental disclosures: | ||||||||||||
| Cash paid during the year for interest | 114,693 | 138,506 | 148,273 | |||||||||
| Transfers of loans to other real estate owned | 102,487 | 63,458 | 17,216 | |||||||||
Surrender of common stock to facilitate exercise of stock options and vesting of restricted stock | 23 | 2,376 | 1,870 | |||||||||
See notes to consolidated financial statements.
F-56
Capitol Bancorp Limited
NOTE A—NATURE OF OPERATIONS, BASIS OF PRESENTATION AND
PRINCIPLES OF CONSOLIDATION
Capitol Bancorp Limited ("Capitol" or the "Corporation") is a multibank holding company. Consolidated bank subsidiaries consist of the following:
Affiliate | Location | Percentage Owned at December 31, 2009 | Year Formed or Acquired | |||
| Arizona Region: | ||||||
| Bank of Tucson | Tucson, Arizona | 100% | 1996 | |||
Central Arizona Bank(2) | Casa Grande, Arizona | 73% | 1997 | |||
| Southern Arizona Community Bank | Tucson, Arizona | 100% | 1998 | |||
| Sunrise Bank of Albuquerque | Albuquerque, New Mexico | 100% | 2000 | |||
Sunrise Bank of Arizona(4) | Phoenix, Arizona | 81% | 1998 | |||
| California Region: | ||||||
| Bank of Escondido | Escondido, California | 100% | 2003 | |||
| Bank of Feather River | Yuba City, California | (1) | 2007 | |||
| Bank of San Francisco | San Francisco, California | 51% | 2005 | |||
| Napa Community Bank | Napa, California | 87% | 2002 | |||
| Point Loma Community Bank | Point Loma, California | 51% | 2004 | |||
| Sunrise Bank of San Diego | San Diego, California | 100% | 2001 | |||
| Sunrise Community Bank | Palm Desert, California | (1) | 2007 | |||
| Colorado Region: | ||||||
| Fort Collins Commerce Bank | Fort Collins, Colorado | 51% | 2005 | |||
| Larimer Bank of Commerce | Fort Collins, Colorado | 51% | 2007 | |||
| Loveland Bank of Commerce | Loveland, Colorado | 51% | 2007 | |||
| Mountain View Bank of Commerce | Westminster, Colorado | (1) | 2008 | |||
| Great Lakes Region: | ||||||
| Bank of Auburn Hills | Auburn Hills, Michigan | 100% | 2005 | |||
| Bank of Maumee | Maumee, Ohio | (1) | 2006 | |||
| Bank of Michigan | Farmington Hills, Michigan | 51% | 2005 | |||
| Capitol National Bank | Lansing, Michigan | 100% | 1982 | |||
| Elkhart Community Bank | Elkhart, Indiana | 100% | 1999 | |||
| Evansville Commerce Bank | Evansville, Indiana | (1) | 2006 | |||
| Goshen Community Bank | Goshen, Indiana | 100% | 2000 | |||
Michigan Commerce Bank(3) | Ann Arbor, Michigan | 95% | 1990 | |||
| Ohio Commerce Bank | Beachwood, Ohio | (1) | 2006 | |||
| Paragon Bank & Trust | Holland, Michigan | 100% | 1994 | |||
| Midwest Region: | ||||||
| Adams Dairy Bank | Blue Springs, Missouri | (1) | 2008 | |||
| Bank of Belleville | Belleville, Illinois | 51% | 2005 | |||
| Community Bank of Lincoln | Lincoln, Nebraska | (1) | 2007 | |||
| Nevada Region: | ||||||
1st Commerce Bank | North Las Vegas, Nevada | (1) | 2006 | |||
| Bank of Las Vegas | Las Vegas, Nevada | 100% | 2002 | |||
| Black Mountain Community Bank | Henderson, Nevada | 100% | 2000 | |||
| Desert Community Bank | Las Vegas, Nevada | 100% | 1999 | |||
| Red Rock Community Bank | Las Vegas, Nevada | 100% | 1999 | |||
| Northeast Region: | ||||||
| USNY Bank | Geneva, New York | (1) | 2007 | |||
F-57
NOTES TO CONSOLIDATED FINANCIAL STATEMENTS
Capitol Bancorp Limited
NOTE A—NATURE OF OPERATIONS, BASIS OF PRESENTATION AND
PRINCIPLES OF CONSOLIDATION—Continued
Consolidated bank subsidiaries - continued
Affiliate | Location | Percentage Owned at December 31, 2009 | Year Formed or Acquired | |||
| Northwest Region: | ||||||
| Bank of Bellevue | Bellevue, Washington | 51% | 2005 | |||
| Bank of Everett | Everett, Washington | (1) | 2006 | |||
| Bank of Tacoma | Tacoma, Washington | (1) | 2007 | |||
| High Desert Bank | Bend, Oregon | (1) | 2007 | |||
| Issaquah Community Bank | Issaquah, Washington | (1) | 2007 | |||
| Southeast Region: | ||||||
| Bank of Valdosta | Valdosta, Georgia | (1) | 2006 | |||
| First Carolina State Bank | Rocky Mount, North Carolina | 89% | 2004 | |||
| Peoples State Bank | Jeffersonville, Georgia | 100% | 2005 | |||
| Pisgah Community Bank | Asheville, North Carolina | (1) | 2008 | |||
| Sunrise Bank of Atlanta | Atlanta, Georgia | (1) | 2006 | |||
| Texas Region: | ||||||
| Bank of Fort Bend | Sugar Land, Texas | (1) | 2007 | |||
| Bank of Las Colinas | Irving, Texas | (1) | 2007 |
(1) Majority-owned by a bank-development subsidiary (second-tier bank holding company) in which Capitol holds a controlling interest.
(2) Formerly Valley First Community Bank.
(3) Effective March 31, 2009, Brighton Commerce Bank, Detroit Commerce Bank, Grand Haven Bank, Kent Commerce Bank, Macomb Community Bank, Muskegon Commerce Bank, Oakland Commerce Bank and Portage Commerce Bank merged with and into Ann Arbor Commerce Bank. Upon completion of the merger, the surviving bank was renamed Michigan Commerce Bank. Prior to the merger, each of those banks were wholly-owned subsidiaries of Capitol. The merger had no impact on Capitol's consolidated financial statements.
(4) Effective December 14, 2009, Arrowhead Community Bank, Asian Bank of Arizona, Colonia Bank, Mesa Bank and Sunrise Bank of Arizona merged with and into Camelback Community Bank. Upon completion of the merger, the surviving bank was renamed Sunrise Bank of Arizona. Prior to the merger, each of those banks was either a wholly-owned subsidiary of Capitol or majority-owned by a bank-development subsidiary in which Capitol holds a controlling interest. The merger had no impact on Capitol's consolidated financial statements.
Capitol has formed several bank-development subsidiaries, each originally capitalized with two classes of common stock, voting and nonvoting. All of the voting common stock (an investment of $1 million for each bank-development entity) is owned by Capitol. The nonvoting common stock, ranging from $12.7 million to $15.8 million for each of the bank-development companies, was sold in private offerings to accredited investors, some of whom are related parties of Capitol. Those entities have been engaged in bank development activities, through Capitol, consisting of formation and investment in start-up banks and management of their investments in young banks. Bank start-up activities were suspended in mid-2008 when the regulatory and capitol-raising environment for new banks became unfavorable. Each of these entities bear a similar name, Capitol Development Bancorp Limited ("CDBL"), numbered in their sequential formation, CDBL-I through CDBL-VIII. CDBL-I and CDBL-II became wholly-owned by Capitol effective November 30, 2006 and February 9, 2007, respectively (see Note Q), and were merged with and into Capitol in late 2007. CDBL III ceased to be a controlled subsidiary of Capitol in 2009 (see Note S).
F-58
NOTES TO CONSOLIDATED FINANCIAL STATEMENTS
Capitol Bancorp Limited
NOTE A—NATURE OF OPERATIONS, BASIS OF PRESENTATION AND
PRINCIPLES OF CONSOLIDATION—Continued
Capitol views itself as a bank-development company. Bank development consists of management and oversight of banks in which Capitol has a direct or indirect controlling interest and, through mid-2008, included formation of start-up banks. Some of Capitol's banks were formed with a portion of their start-up capital provided by local investors in the communities of those banks. When de novo banks have achieved certain developmental milestones (age, cumulative profitability, return on equity or other measures), Capitol may offer the bank's noncontrolling shareholders an opportunity to exchange their bank shares for shares of Capitol's common stock. Capitol has made similar share-exchange proposals regarding the noncontrolling interests of some of its prior bank-development company subsidiaries which, after the share exchange, were merged with and into Capitol. In each instance, however, Capitol is under no obligation to offer such proposals and such share-exchange proposals, if and when offered, are generally subject to approval by the subsidiaries' noncontrolling shareholders in each proposed transaction. In mid-2009, due to a depressed market environment for securities of financial institutions, Capitol suspended share-exchange activities. Further, as a means to raise and reallocate capital, Capitol commenced an initiative in 2009 to selectively divest of some of its community banks (see Note T).
Capitol and its subsidiaries are engaged in a single business activity--banking. Capitol's bank affiliates provide a full range of banking services to individuals, businesses and other customers located in the respective communities of the bank. Many operate from a single location and all are primarily commercially-focused (as contrasted to retail or transaction-oriented banks) on meeting the various credit and other financial needs of entrepreneurs, professionals and other businesses and individuals. A variety of deposit products are offered, including checking, savings, money market, certificates of deposit and individual retirement accounts. In addition, wealth management, trust and investment services are offered through a wealth management subsidiary. The principal markets for the banks' financial services are the communities in which the banks are located and the areas immediately surrounding those communities. The majority of Capitol's banks are state-chartered institutions and some have been chartered as federal savings banks.
In addition to banking units, mortgage banking activities are offered through Amera Mortgage Corporation, a less than 50%-owned affiliate, which is accounted for under the equity method. Trust and wealth-management products are offered through Capitol Wealth, Inc., a controlled subsidiary.
Each bank is viewed by management as being a separately identifiable business or segment from the perspective of monitoring performance and allocation of financial resources. Although the banks operate and are managed and monitored separately, each bank is substantially similar in terms of business focus, type of customers, products, services and economic characteristics. Further, each of the banks and the Corporation are subject to
F-59
NOTES TO CONSOLIDATED FINANCIAL STATEMENTS
Capitol Bancorp Limited
NOTE A—NATURE OF OPERATIONS, BASIS OF PRESENTATION AND
PRINCIPLES OF CONSOLIDATION—Continued
substantially similar laws and regulations unique to the financial institution industry. Accordingly, the Corporation's consolidated financial statements reflect the presentation of segment information on an aggregated basis.
The consolidated financial statements include the accounts of the Corporation and its majority-owned and/or otherwise controlled subsidiaries, after elimination of intercompany accounts and transactions and after giving effect to applicable noncontrolling interests. Banks formed or acquired are included in the consolidated financial statements for periods after joining the consolidated group. Certain 2008 and 2007 amounts have been reclassified to conform to the 2009 presentation, including retrospective application of a new accounting standard regarding noncontrolling interests in consolidated subsidiaries and presentation of the equity section of the balance sheet (see Note B).
NOTE B—SIGNIFICANT ACCOUNTING POLICIES
Estimates: The preparation of consolidated financial statements in conformity with generally accepted accounting principles in the United States of America requires management to make significant estimates and assumptions that affect the reported amounts of assets and liabilities at the date of the consolidated financial statements and the reported amounts of revenues and expenses during the reporting period. Actual results will differ from those estimates because of the inherent subjectivity and inaccuracy of any estimation.
Cash and Cash Equivalents: Cash and cash equivalents include cash on hand, amounts due from banks (interest-bearing and noninterest-bearing), money-market funds and federal funds sold. Generally, federal funds transactions are entered into for a one-day period.
Loans Held For Sale: Loans held for sale represent residential real estate mortgage loans held for sale into the secondary market. Loans held for sale are stated at the aggregate lower of cost or market. Fees from the origination of loans held for sale are recognized in the period the loans are originated. Government-guaranteed loans which may be sold after origination are not classified as held-for-sale inasmuch as sale of such loans is largely dependent upon the extent to which gains may be realized.
Investment Securities: Investment securities available for sale (generally most debt investment securities of Capitol's banks) are carried at fair value with unrealized gains and losses reported as a separate component of stockholders' equity, net of tax effect (accumulated other comprehensive income). All other investment securities are classified as held for long-term investment and are carried at amortized cost which approximates fair value (see Note C). Investments in Federal Home Loan Bank (FHLB) stock and Federal Reserve Bank stock are carried on the basis of cost (and par value) and are classified as held for long-term investment.
F-60
NOTES TO CONSOLIDATED FINANCIAL STATEMENTS
Capitol Bancorp Limited
NOTE B—SIGNIFICANT ACCOUNTING POLICIES—Continued
Investments are classified at the date of purchase based on management's analysis of liquidity and other factors. The adjusted cost of the specific securities sold is used to compute realized gains or losses. Premiums and discounts are recognized in interest income using the interest method over the period to maturity.
Loans, Credit Risk and Allowance for Loan Losses: Portfolio loans are carried at their principal balance based on management's intent and ability to hold such loans for the foreseeable future until maturity or repayment.
Credit risk arises from making loans and loan commitments in the ordinary course of business. Substantially all portfolio loans are made to borrowers in the banks' communities. Consistent with the banks' emphasis on business lending, there are concentrations of credit risk in loans secured by commercial real estate and less significant levels of concentration-risk may exist in loans secured by equipment and other business assets. The maximum potential credit risk to Capitol, without regard to underlying collateral and guarantees, is the total of loans and loan commitments outstanding. Management reduces exposure to losses from credit risk by requiring collateral and/or guarantees for loans granted and by monitoring concentrations of credit, in addition to recording provisions for loan losses and maintaining an allowance for loan losses.
The allowance for loan losses is maintained at a level believed adequate by management to absorb estimated losses inherent in the portfolio at the balance-sheet date. Management's determination of the adequacy of the allowance for loan losses is an estimate based on evaluation of the portfolio (including potential impairment of individual loans and concentrations of credit), past loss experience, current economic conditions, volume, amount and composition of the loan portfolio, loan commitments outstanding and other factors. The allowance is increased by provisions charged to operations and reduced by net charge-offs. Because the allowance is based on significant estimates, actual future loan losses will differ from such estimates.
Loans are accounted for as troubled debt restructurings if, for economic or legal reasons related to the borrower's financial condition, Capitol's banks grant a significant concession to the borrower that they would not otherwise consider. A troubled debt restructuring may involve the receipt of assets from the debtor in partial or full satisfaction of the loan, or a modification of terms such as a reduction of the stated interest rate or loan balance, a reduction of accrued interest, an extension of the maturity date at an interest rate lower than a current market rate for a new loan with similar risk, or some combination thereof. Troubled debt restructurings generally remain classified as nonperforming loans until a consistent and compliant six-month payment history has been maintained.
F-61
NOTES TO CONSOLIDATED FINANCIAL STATEMENTS
Capitol Bancorp Limited
NOTE B—SIGNIFICANT ACCOUNTING POLICIES—Continued
Capitol's banks have stand-by letters of credit outstanding that, when issued, commit the banks to make payments on behalf of customers if certain specified future events occur, generally being nonpayment by the customer to a counterparty. These obligations generally expire within one year and require collateral and/or personal guarantees by the borrower and its principals based on management's assessment of loss exposure. The maximum credit risk associated with these instruments equals their contractual amounts, assuming that the borrower defaults and related collateral proves to be worthless. The total contractual amounts do not necessarily represent future cash requirements since many of those guarantees expire without being drawn upon. Capitol records a liability, generally equal to the fees received, for these stand-by letters of credit.
Credit risk also arises from amounts of funds on deposit at other financial institutions (i.e., due from banks) to the extent balances exceed the limits of deposit insurance. Capitol monitors the financial position of such financial institutions to evaluate credit risk periodically.
Transfers of Financial Assets: Transfers of financial assets (generally consisting of sales of loans held for sale and loan participations with unaffiliated banks) are accounted for as sales when control over the transferred asset has been surrendered. Control over transferred assets is deemed to be surrendered when (1) the assets have been isolated from the bank and are presumptively beyond the reach of the transferor and its creditors (even in bankruptcy or other receivership), (2) the transferee obtains the right (free of conditions that constrain it from taking advantage of that right) to pledge or exchange the transferred assets and (3) the bank does not maintain effective control over the transferred asset through an agreement to repurchase it before maturity or the ability to unilaterally cause the holder to return specific assets. Transfers of financial assets are generally limited to participating interests in commercial loans sold and the sale of residential mortgage loans into the secondary market, the extent of which is disclosed in the consolidated statements of cash flows.
Interest and Fees on Loans: Interest income on loans is recognized based upon the principal balance of loans outstanding. Loan origination fees and direct loan origination costs are deferred and amortized over the life of the related loans as an adjustment of yield. Direct costs of successful origination of portfolio loans generally exceed fees from loan originations (net deferred costs approximated $10.5 million and $15.5 million at December 31, 2009 and 2008, respectively).
The accrual of interest is generally discontinued when a loan becomes 90 days past due as to interest. When interest accruals are discontinued, interest previously accrued (but unpaid) is reversed. Management may elect to continue the accrual of interest when the estimated net realizable value of collateral is sufficient to cover the principal balance and accrued interest and the loan is in process of collection.
F-62
NOTES TO CONSOLIDATED FINANCIAL STATEMENTS
Capitol Bancorp Limited
NOTE B—SIGNIFICANT ACCOUNTING POLICIES—Continued
Premises and Equipment: Premises and equipment are stated on the basis of cost. Depreciation, which relates primarily to equipment, furniture and software with estimated useful lives of approximately three to seven years, is computed principally by the straight-line method. Buildings are generally depreciated on a straight-line basis with estimated useful lives of approximately 40 years. Leasehold improvements are generally depreciated over the shorter of the respective lease term or estimated useful life.
Goodwill: Goodwill is reviewed annually by management for impairment by comparing estimated entity fair value to net assets of the entity. This review is performed at the applicable subsidiary reporting-unit level which has recorded goodwill resulting from specific share-exchange transactions or acquisitions. Impairment adjustments of goodwill ($3.7 million in 2009; none in 2008 and 2007) are charged against earnings, when determined. Other intangibles ($705,000 at December 31, 2009 and $1.7 million at December 31, 2008), which generally consist of acquired customer lists and core deposit intangibles, are amortized over varying periods of 7 years or less.
Other Real Estate: Other real estate is comprised of properties acquired through a foreclosure proceeding or acceptance of a deed in lieu of foreclosure. At the time of foreclosure, the carrying value of such properties is adjusted to estimated fair value (less estimated costs to sell) when transferred from portfolio loans to other real estate owned, establishing a new accounting basis. These properties held for sale are subsequently carried at the lower of the new cost-basis or estimated fair value (net of estimated selling cost) and are periodically reviewed for subsequent impairment.
Share-Based Compensation: Stock options state a specific exercise price and expiration date and may be exercised by the optionee upon payment of the exercise price and related taxes due from the optionee; the Corporation, in its discretion, may permit cashless exercises of stock options. Generally, previously unissued shares of common stock are issued upon exercise of stock options. Compensation expense for stock option awards is recognized ratably over the vesting period of the award based on the fair value of the option, computed using a Black-Scholes valuation model. Compensation expense for awards of restricted common stock is recognized ratably over the vesting periods of such awards (generally ranging from four to fifteen years), based on the fair value of the common stock on the date of grant. Stock price volatility used in the valuation model is based on historical volatility. The risk-free interest rate was based on the yield of U.S. government securities with a maturity date consistent with the expected option life. The expected option life was estimated based on past exercise behavior of optionees and the related option term.
Trust Assets and Related Income: Customer property, other than funds on deposit, held in a fiduciary or agency capacity by Capitol's banks is not included in the consolidated balance sheet because it is not an asset of the banks or Capitol. Trust and wealth management revenue are recorded on the accrual method.
F-63
NOTES TO CONSOLIDATED FINANCIAL STATEMENTS
Capitol Bancorp Limited
NOTE B—SIGNIFICANT ACCOUNTING POLICIES—Continued
Federal Income Taxes: Capitol and subsidiaries owned 80% or more by Capitol file a consolidated federal income tax return. Deferred federal income taxes are recognized for the tax consequences of temporary differences by applying enacted tax rates applicable to future years to differences between the financial statement carrying amounts and the tax bases of existing assets and liabilities. When it is determined that realization of deferred tax assets may be in doubt, a valuation allowance is recorded to reduce those assets to the amount which is more-likely-than-not realizable. The effect on income taxes of a change in tax laws or rates is recognized in operations in the period that includes the enactment date.
Net Income (Loss) Per Share Attributable to Capitol Bancorp Limited: Basic net income (loss) per share attributable to Capitol is computed by dividing net income (loss) attributable to Capitol by the weighted-average number of common shares outstanding, exclusive of unvested restricted shares outstanding. Diluted net income per share attributable to Capitol is based on the weighted-average number of common shares outstanding, plus common share equivalents calculated for stock options, warrants and restricted common stock outstanding using the treasury stock method. Common stock equivalents are excluded from per-share computations to the extent they are antidilutive.
Comprehensive Income (Loss): Comprehensive income (loss) is the sum of net income (loss) and items which are charged or credited to stockholders' equity which, for Capitol, is the net change in the fair value adjustment for investment securities available for sale. Accordingly, the elements and total of comprehensive income (loss) are shown within the statement of changes in stockholders' equity.
New Accounting Standards: In 2006, an accounting standard was issued which provided a definition of fair value for accounting purposes, established a framework for measuring fair value and expanded related financial statement disclosures. In 2008, the effective date of that standard was deferred until January 1, 2009 for nonfinancial assets and nonfinancial liabilities except those items recognized or disclosed at fair value on an annual or on a more frequently recurring basis. Implementation of previously-deferred aspects of this standard did not have a material effect on the Corporation's results of operations or financial position.
In 2009, fair value guidance was amended to aid in determining fair value when the volume and level of activity for an asset or liability have significantly decreased and identifying transactions that are not orderly, the implementation of which did not have a material effect on Capitol's consolidated financial statements. That amended guidance clarifies that significant adjustments to quoted prices may be necessary to estimate fair value when there has been a significant decrease in the volume and activity for the asset/liability in relation to normal market activity. Fair value is the price that would be received to sell an asset (or paid to transfer a liability) in an orderly transaction (that is, not a forced liquidation or distressed sale) between willing market participants under current market conditions. The Corporation's fair value disclosures are set forth in Note N to the consolidated financial statements.
F-64
NOTES TO CONSOLIDATED FINANCIAL STATEMENTS
Capitol Bancorp Limited
NOTE B—SIGNIFICANT ACCOUNTING POLICIES—Continued
In 2007, new accounting guidance was issued to further enhance the accounting and financial reporting related to business combinations. This guidance establishes principles and requirements for how the acquirer (1) recognizes and measures in its financial statements for identifiable assets acquired, the liabilities assumed and any noncontrolling interests in the acquiree (if not wholly-owned), (2) recognizes and measures goodwill acquired or a gain from a bargain purchase, (3) requires that acquisition-related and restructuring costs be recognized separately from the acquisition, generally charged to expense when incurred and (4) determines information to disclose to enable users of the financial statements to evaluate the nature and financial effects of the business combination. This standard applies prospectively to business combinations occurring on or after January 1, 2009. The effects of the Corporation's adoption of this guidance had no impact upon implementation and its future impact will depend upon the extent and magnitude of acquisitions in the future.
In 2007, a new accounting standard was issued to create accounting and reporting requirements for noncontrolling interests in a subsidiary (when it is not wholly-owned) and for the deconsolidation of a subsidiary. This standard establishes accounting and reporting requirements including that (1) the ownership interest in subsidiaries held by parties other than the parent be clearly identified and presented in the consolidated balance sheet within equity, but separate from the parent's equity, (2) the amount of consolidated net income (loss) attributable to the parent and the noncontrolling interests be clearly identified and presented on the face of the consolidated statement of operations, (3) changes in a parent's ownership interest while the parent continues to retain a controlling financial interest in a subsidiary be accounted for consistently, (4) when a subsidiary is deconsolidated, any retained noncontrolling interest in the former subsidiary be initially measured at fair value and (5) entities provide sufficient disclosures that clearly identify and distinguish between the interests of the parent and the interests of the noncontrolling owners. This standard became effective for the Corporation on January 1, 2009 and the accompanying consolidated financial statements for 2008 and 2007 reflect implementation of the new accounting standard, on an as-adjusted basis, as if it occurred as of the beginning of the periods presented. In January 2010, an accounting standards update was issued clarifying the types of transactions that should be accounted for as a decrease in ownership of a subsidiary which will become effective for the Corporation on January 1, 2010 (with retrospective application to January 1, 2009) and which will not have a material effect on the Corporation's consolidated financial statements upon implementation.
In 2008, new accounting guidance was issued revising presentation and disclosure requirements for derivatives and hedging activities. It became effective for the Corporation on January 1, 2009 and did not have a material impact on the Corporation's consolidated financial statements upon implementation.
In 2008, a new standard was issued clarifying the accounting for transfers of financial assets and repurchase financing transactions. It became effective January 1, 2009 and did not have
F-65
NOTES TO CONSOLIDATED FINANCIAL STATEMENTS
Capitol Bancorp Limited
NOTE B—SIGNIFICANT ACCOUNTING POLICIES—Continued
a material impact on the Corporation's financial position or results of operations upon implementation. Subsequently, further guidance revised requirements for the presentation and disclosure of transfers of financial assets and the effects of a transfer on an entity's financial position, financial performance and cash flows. The guidance applies to transfers of financial assets occurring on or after January 1, 2010. Management does not expect the new standard to materially affect the Corporation's financial position or results of operations upon implementation.
In 2009, a new accounting standard was issued which amended the other-than-temporary impairment guidance for debt securities to make it more operational and to improve the presentation and disclosure of other-than-temporary impairments on debt and equity securities in financial statements. Implementation of this new guidance did not have a material effect on the Corporation's consolidated financial statements.
In 2009, a new accounting standard was issued and became effective which requires adjustment to or disclosure in financial statements of events occurring after the balance-sheet date, but prior to the issuance of the financial statements. This new guidance did not have a material impact upon implementation.
A new accounting standard was issued related to the hierarchy of generally accepted accounting principles (GAAP) in 2009. On the effective date of this standard, the Financial Accounting Standards Board (FASB) Accounting Standards Codification™ (Codification or ASC) superseded all previously-existing GAAP. All other prior guidance not grandfathered and non-GAAP accounting literature excluded from the Codification became nonauthoritative upon the effective date of the Codification. This standard is initially effective for the Corporation's 2009 consolidated financial statements and did not have a material impact upon implementation.
In January 2010, an accounting standards update regarding fair value measurements and disclosures was issued to require more robust disclosures about (1) different classes of assets and liabilities measured at fair value, (2) valuation techniques and inputs used, (3) the activity in Level 3 fair-value measurements, and (4) the transfers between Levels 1, 2, and 3 of fair-value estimates. The new disclosures are effective for the Corporation beginning January 1, 2010, except for the disclosures about purchases, sales, issuances, and settlements in the rollforward of activity in Level 3 fair-value measurements effective for periods beginning January 1, 2011. Management does not expect this new guidance to have a material effect on the Corporation's consolidated financial statements upon implementation.
A variety of proposed or otherwise potential accounting standards are currently under study by standard-setting organizations and various regulatory agencies. Because of the tentative and preliminary nature of these proposed standards, management has not determined whether implementation of such proposed standards would be material to the Corporation's consolidated financial statements.
F-66
NOTES TO CONSOLIDATED FINANCIAL STATEMENTS
Capitol Bancorp Limited
NOTE C—INVESTMENT SECURITIES
Investment securities consisted of the following at December 31 (in $1,000s):
| 2009 | 2008 | ||||||||||||||
Amortized Cost | Estimated Fair Value | Amortized Cost | Estimated Fair Value | ||||||||||||
| Available for sale securities: | |||||||||||||||
| United States treasury | $ | 1,500 | $ | 1,500 | |||||||||||
| United States government agencies | 13,956 | 13,941 | $ | 9,785 | $ | 9,913 | |||||||||
| Mortgage-backed | 24,690 | 24,598 | 4,813 | 4,890 | |||||||||||
| Municipalities | 727 | 739 | 768 | 781 | |||||||||||
| 40,873 | 40,778 | 15,366 | 15,584 | ||||||||||||
| Held for long-term investment: | |||||||||||||||
| Federal Reserve Bank stock | 210 | 210 | 146 | 146 | |||||||||||
| Federal Home Loan Bank stock | 24,464 | 24,464 | 26,053 | 26,053 | |||||||||||
| CDBL III | 672 | 672 | |||||||||||||
| Corporate | 5,119 | 5,119 | 6,591 | 6,591 | |||||||||||
| Other | 100 | 100 | 66 | 66 | |||||||||||
| 30,565 | 30,565 | 32,856 | 32,856 | ||||||||||||
| $ | 71,438 | $ | 71,343 | $ | 48,222 | $ | 48,440 | ||||||||
At December 31, 2009, securities with a fair value approximating $29 million were pledged to secure public and trust deposits and for other purposes as required by law.
Investments in Federal Reserve Bank and Federal Home Loan Bank stock are restricted and may only be resold to, or redeemed by, the issuer.
Corporate investments consist primarily of equity-method investments in limited partnerships and a limited liability company. Those entities, which are involved in making equity investments in banks and small businesses, use the fair value method of accounting in valuing their investment portfolios.
Securities held for long-term investment are not subject to the classification and accounting rules relating to most typical investments. Rather, investments in Federal Home Loan Bank stock and Federal Reserve Bank stock are required to be recorded at cost and generally classified within other assets. In addition, Capitol's corporate investments consist mostly of equity-method investments in limited partnerships which, accordingly, are outside of the scope of accounting rules for available-for-sale investments which often require use of estimated fair value. Although these investments are outside of the scope of such accounting rules, they are included in Capitol's investment securities for financial reporting purposes to summarize all such securities together.
F-67
NOTES TO CONSOLIDATED FINANCIAL STATEMENTS
Capitol Bancorp Limited
NOTE C—INVESTMENT SECURITIES—Continued
Gross unrealized gains and losses on investment securities available for sale were as follows at December 31 (in $1,000s):
| 2009 | 2008 | ||||||||||||||
| Gains | Losses | Gains | Losses | ||||||||||||
| United States government agencies | $ | 7 | $ | 22 | $ | 128 | $ | -- | |||||||
| Mortgage-backed | 122 | 214 | 85 | 8 | |||||||||||
| Municipalities | 12 | -- | 13 | -- | |||||||||||
| $ | 141 | $ | 236 | $ | 226 | $ | 8 | ||||||||
The age of gross unrealized losses and carrying value (at estimated fair value) of securities available for sale are summarized below (in $1,000s):
| 2009 | 2008 | ||||||||||||||
Unrealized Loss | Carrying Value | Unrealized Loss | Carrying Value | ||||||||||||
| One year or less: | |||||||||||||||
| United States government agencies | $ | 22 | $ | 8,979 | $ | -- | $ | -- | |||||||
| Mortgage-backed | 214 | 19,879 | 4 | 281 | |||||||||||
| 236 | 28,858 | 4 | 281 | ||||||||||||
In excess of one year--mortgage- backed | -- | -- | 4 | 501 | |||||||||||
| $ | 236 | $ | 28,858 | $ | 8 | $ | 782 | ||||||||
Management does not believe any individual unrealized loss as of December 31, 2009 represents an other-than-temporary loss (primarily due to such amounts being attributable to changes in interest rates). Further, it does not intend to sell such securities and believes it is unlikely a sale would become required before the amortized cost can be recovered.
Gross realized gains and losses from sales and maturities of investment securities were insignificant for each of the periods presented.
Scheduled maturities of investment securities held as of December 31, 2009 were as follows (in $1,000s):
Amortized Cost | Estimated Fair Value | ||||||
| Due in one year or less | $ | 6,886 | $ | 6,891 | |||
| After one year, through five years | 9,137 | 9,124 | |||||
| After five years, through ten years | 567 | 577 | |||||
| After ten years | 24,283 | 24,186 | |||||
Securities held for long-term investment, without stated maturities | 30,565 | 30,565 | |||||
| $ | 71,438 | $ | 71,343 | ||||
F-68
NOTES TO CONSOLIDATED FINANCIAL STATEMENTS
Capitol Bancorp Limited
NOTE D—LOANS
Portfolio loans consisted of the following at December 31 (in $1,000s):
| 2009 | 2008 | |||||||||||
| Loans secured by real estate: | ||||||||||||
| Commercial | $ | 1,990,332 | $ | 2,115,515 | ||||||||
| Residential (including multi-family) | 785,362 | 879,754 | ||||||||||
Construction, land development and other land | 509,474 | 797,486 | ||||||||||
| Total loans secured by real estate | 3,285,168 | 3,792,755 | ||||||||||
| Commercial and other business-purpose loans | 684,253 | 845,593 | ||||||||||
| Consumer | 44,168 | 61,340 | ||||||||||
| Other | 33,512 | 35,541 | ||||||||||
| Total portfolio loans | 4,047,101 | 4,735,229 | ||||||||||
| Less allowance for loan losses | (144,664 | ) | (93,040 | ) | ||||||||
| Net portfolio loans | $ | 3,902,437 | $ | 4,642,189 | ||||||||
Loans serviced for the benefit of others, which are not recorded on the consolidated balance sheet, approximated $116 million and $104 million at December 31, 2009 and 2008, respectively. Loan servicing assets are not material.
Transactions in the allowance for loan losses are summarized below (in $1,000s):
| 2009 | 2008 | 2007 | ||||||||||
| Balance at beginning of year | $ | 93,040 | $ | 58,124 | $ | 45,414 | ||||||
| Provision for loan losses charged to operations | 190,680 | 82,492 | 25,340 | |||||||||
| Net charge-offs: | ||||||||||||
| Loans charged-off (deduction) | (138,672 | ) | (50,447 | ) | (14,219 | ) | ||||||
| Recoveries | 3,730 | 2,871 | 1,589 | |||||||||
| Net charge-offs | (134,942 | ) | (47,576 | ) | (12,630 | ) | ||||||
Less allowance for loan losses of subsidiaries no longer consolidated | (4,114 | ) | -- | -- | ||||||||
| Balance at end of year | $ | 144,664 | $ | 93,040 | $ | 58,124 | ||||||
[The remainder of this page intentionally left blank]
F-69
NOTES TO CONSOLIDATED FINANCIAL STATEMENTS
Capitol Bancorp Limited
NOTE D—LOANS—Continued
Nonperforming loans (i.e., loans which are 90 days or more past due and loans on nonaccrual status) are summarized below at December 31 (in $1,000s):
| 2009 | 2008 | ||||||
| Nonaccrual loans: | |||||||
| Loans secured by real estate: | |||||||
| Commercial | $ | 131,990 | $ | 39,892 | |||
| Residential (including multi-family) | 55,553 | 35,675 | |||||
| Construction, land development and other land | 84,276 | 72,996 | |||||
| Total loans secured by real estate | 271,819 | 148,563 | |||||
| Commercial and other business-purpose loans | 23,063 | 16,283 | |||||
| Consumer | 380 | 190 | |||||
| Total nonaccrual loans | 295,262 | 165,036 | |||||
Past due (>90 days) loans and accruing interest: | |||||||
| Loans secured by real estate: | |||||||
| Commercial | 6,234 | 1,623 | |||||
| Residential (including multi-family) | 228 | 365 | |||||
| Construction, land development and other land | 3,713 | 2,293 | |||||
| Total loans secured by real estate | 10,175 | 4,281 | |||||
| Commercial and other business-purpose loans | 1,546 | 747 | |||||
| Consumer | 534 | 146 | |||||
| Total past due loans | 12,255 | 5,174 | |||||
| Total nonperforming loans | $ | 307,517 | $ | 170,210 | |||
If nonperforming loans had performed in accordance with their contractual terms during the year, estimated additional interest income of $18.6 million, $11.4 million and $4.8 million would have been recorded in 2009, 2008 and 2007, respectively. Estimated interest income recognized on loans in nonaccrual status in 2009, 2008 and 2007 operations approximated $1 million, $479,000 and $1.9 million, respectively.
Loans are considered impaired when it is probable that all amounts due according to the contractual terms of a loan agreement will not be collected, including contractually scheduled interest and principal payments. Impaired loans are summarized below (in $1,000s):
| December 31 | |||||||
| 2009 | 2008 | ||||||
| Impaired loans: | |||||||
| Loans which have an allowance requirement | $ | 114,782 | $ | 82,387 | |||
| Loans which do not have an allowance requirement | 217,949 | 82,649 | |||||
| Total impaired loans | $ | 332,731 | $ | 165,036 | |||
| Allowance for loan losses related to impaired loans | $ | 20,138 | $ | 16,769 | |||
F-70
NOTES TO CONSOLIDATED FINANCIAL STATEMENTS
Capitol Bancorp Limited
NOTE D—LOANS—Continued
At December 31, 2009, there were approximately $37 million of loans for which the terms were modified as a concession to borrowers experiencing financial difficulties, and which the banks would not otherwise have made, which are troubled debt restructurings and are included within impaired loans.
Impaired loans which do not have an allowance requirement include collateral-dependent loans for which direct write-downs have been made and, accordingly, no allowance requirement or allocation is necessary. During 2009, the average recorded investment in impaired loans approximated $242.1 million ($105.9 million in 2008). Interest income is recorded on impaired loans if not on nonaccrual status, or may be recorded on a cash basis in some circumstances, if such payments are not credited to principal. In 2009, interest income recorded on impaired loans approximated $1 million ($479,000 in 2008).
The amounts of the allowance for loan losses allocated in the following table are based on management's estimate of losses inherent in the portfolio at the balance-sheet date (in $1,000s), and should not be interpreted as an indication of future charge-offs:
| December 31, 2009 | December 31, 2008 | |||||||||||||||
Amount | Percentage of Total Portfolio Loans | Amount | Percentage of Total Portfolio Loans | |||||||||||||
| Loans secured by real estate: | ||||||||||||||||
| Commercial | $ | 57,216 | 1.41 | % | $ | 30,007 | 0.63 | % | ||||||||
| Residential (including multi-family) | 28,331 | 0.70 | 21,645 | 0.46 | ||||||||||||
Construction, land development and other land | 22,864 | 0.57 | 17,496 | 0.37 | ||||||||||||
| Total loans secured by real estate | 108,411 | 2.68 | 69,148 | 1.46 | ||||||||||||
Commercial and other business-purpose loans | 34,638 | 0.85 | 22,547 | 0.47 | ||||||||||||
| Consumer | 1,405 | 0.03 | 1,032 | 0.02 | ||||||||||||
| Other | 210 | 0.01 | 313 | 0.01 | ||||||||||||
| Total allowance for loan losses | $ | 144,664 | 3.57 | % | $ | 93,040 | 1.96 | % | ||||||||
[The remainder of this page intentionally left blank]
F-71
NOTES TO CONSOLIDATED FINANCIAL STATEMENTS
Capitol Bancorp Limited
NOTE E—RELATED PARTY TRANSACTIONS
In the ordinary course of business, Capitol's banking subsidiaries make loans to officers and directors of the Corporation and its subsidiaries, including their immediate families and companies in which they are principal owners. At December 31, 2009 and 2008, total loans outstanding to these persons were $134.9 million and $167 million, respectively. During 2009, $68.4 million of new loans were made to these persons and repayments totaled $100.5 million. Such loans were made at the banking subsidiaries' normal credit terms.
Officers and directors of Capitol (and their associates, family and/or affiliates) are also depositors of the banking subsidiaries. Such deposits, which approximated $151 million and $223 million at December 31, 2009 and 2008, respectively, are accepted based upon the banks' normal terms as to interest rate, term and deposit insurance.
During 2009, certain subsidiaries ceased to be controlled by Capitol and, accordingly, were deconsolidated (see Note S) although such subsidiaries continue to be related parties of Capitol.
NOTE F—PREMISES AND EQUIPMENT
Major classes of premises and equipment consisted of the following at December 31 (in $1,000s):
| 2009 | 2008 | |||||||
| Land, buildings and improvements | $ | 19,303 | $ | 21,047 | ||||
| Leasehold improvements | 27,716 | 27,862 | ||||||
| Equipment, furniture and software | 53,026 | 57,587 | ||||||
| 100,045 | 106,496 | |||||||
| Less accumulated depreciation | (51,659 | ) | (47,247 | ) | ||||
| $ | 48,386 | $ | 59,249 | |||||
Capitol and certain subsidiaries rent office space and equipment under operating leases. Rent expense (net of sublease income) under these lease agreements approximated $12.5 million, $11.6 million and $9.2 million in 2009, 2008 and 2007, respectively (including rent expense approximating $1.7 million in 2009 and 2008 and $1.6 million in 2007, under leases with related parties).
F-72
NOTES TO CONSOLIDATED FINANCIAL STATEMENTS
Capitol Bancorp Limited
NOTE F—PREMISES AND EQUIPMENT—Continued
At December 31, 2009, future minimum rental payments under operating leases that have initial or remaining noncancelable lease terms in excess of one year were as follows (in $1,000s):
| 2010 | $ | 11,602 | ||||||
| 2011 | 11,565 | |||||||
| 2012 | 10,564 | |||||||
| 2013 | 8,489 | |||||||
| 2014 | 7,442 | |||||||
| 2015 and thereafter | 22,307 | |||||||
| $ | 71,969 |
NOTE G—DEPOSITS
The aggregate amount of time deposits of $100,000 or more approximated $1.5 billion and $1.4 billion as of December 31, 2009 and 2008, respectively.
At December 31, 2009, scheduled maturities of time deposits were as follows (in $1,000s):
| 2010 | $ | 1,866,810 | ||||||
| 2011 | 443,493 | |||||||
| 2012 | 70,761 | |||||||
| 2013 | 25,258 | |||||||
| 2014 | 22,494 | |||||||
| 2015 and thereafter | 376 | |||||||
| $ | 2,429,192 |
NOTE H—NOTES PAYABLE AND SHORT-TERM BORROWINGS
Notes payable and short-term borrowings consisted of the following at December 31 (in $1,000s):
| 2009 | 2008 | |||||||
| FHLB borrowings | $ | 260,638 | $ | 429,889 | ||||
| Promissory notes | 14,011 | 14,011 | ||||||
| Federal funds purchased | -- | 2,000 | ||||||
| Repurchase agreements | 1,510 | 1,025 | ||||||
| $ | 276,159 | $ | 446,925 | |||||
F-73
NOTES TO CONSOLIDATED FINANCIAL STATEMENTS
Capitol Bancorp Limited
NOTE H—NOTES PAYABLE AND SHORT-TERM BORROWINGS—Continued
FHLB borrowings represent advances secured by certain portfolio residential real estate mortgage loans and other eligible collateral. Such advances become due at varying dates and bear interest at market short-term rates (approximately 2.76% at December 31, 2009). At December 31, 2009, unused lines of credit under these facilities approximated $293 million. Assets pledged to secure these credit facilities approximated $1.2 billion at December 31, 2009. Continued availability of the FHLB credit facilities is subject to the FHLB's review of the banks' credit worthiness.
During 2008, Capitol completed a private offering of 9% promissory notes. The promissory notes were purchased by accredited investors, including certain related parties of Capitol. The promissory notes mature in 2013. Interest is payable quarterly and the promissory notes become callable in 2010.
At December 31, 2009, scheduled debt maturities of notes payable and short-term borrowings were as follows (in $1,000s):
| 2010 | $ | 172,967 | ||
| 2011 | 50,735 | |||
| 2012 | 19,967 | |||
| 2013 | 19,720 | |||
| 2014 | 2,480 | |||
| 2015 and thereafter | 10,290 | |||
| $ | 276,159 |
NOTE I—SUBORDINATED DEBT
Subordinated debt relates to trust-preferred securities issued by Capitol which are summarized as follows at December 31 (in $1,000s):
| Aggregate | ||||||||||||||||
| Current | Scheduled | Liquidation | Net Carrying Amount | |||||||||||||
| Interest Rate | Maturity | Amount | 2009 | 2008 | ||||||||||||
| Capitol Trust I | 8.50% fixed | 2027 | $ | 25,300 | $ | 24,651 | $ | 24,615 | ||||||||
| Capitol Trust II | 10.25% fixed | 2031 | 10,000 | 9,783 | 9,773 | |||||||||||
| Capitol Statutory Trust III | 3.86% variable | 2031 | 15,000 | 14,676 | 14,660 | |||||||||||
| Capitol Trust IV | 3.93% variable | 2032 | 3,000 | 2,924 | 2,921 | |||||||||||
| Capitol Trust VI | 3.58% variable | 2033 | 10,000 | 9,768 | 9,758 | |||||||||||
| Capitol Trust VII | 7.78% fixed | 2033 | 10,000 | 9,881 | 9,876 | |||||||||||
| Capitol Statutory Trust VIII | 3.20% variable | 2033 | 20,000 | 19,689 | 19,676 | |||||||||||
| Capitol Trust IX | 7.69% fixed | 2034 | 10,000 | 9,947 | 9,945 | |||||||||||
| Capitol Trust X | 6.55% fixed | 2037 | 33,000 | 33,000 | 33,000 | |||||||||||
| Capitol Trust XI | 1.90% variable | 2037 | 20,000 | 20,000 | 20,000 | |||||||||||
| Capitol Trust XII | 10.50% fixed | 2038 | 14,541 | 13,122 | 13,069 | |||||||||||
| $ | 170,841 | $ | 167,441 | $ | 167,293 | |||||||||||
F-74
NOTES TO CONSOLIDATED FINANCIAL STATEMENTS
Capitol Bancorp Limited
NOTE I—SUBORDINATED DEBT—Continued
Securities of Capitol Trust I and XII were issued in public offerings in 1997 and 2008, respectively. All other Capitol Trust securities were formed in conjunction with private placements of trust-preferred securities. Each of these securities has similar terms and, subject to certain provisions, may be called by the Corporation five years after issuance. The liquidation amount of these securities is guaranteed by Capitol.
Interest paid to the trusts by Capitol (which is recorded as interest expense in its consolidated financial statements) is distributed by the trusts to the holders of the trust-preferred securities. Under certain conditions, Capitol may defer payment of interest on the subordinated debentures for periods of up to five years and, in 2009, elected to defer such interest payments. During deferral periods, Capitol is prohibited from paying dividends on its common stock (subject to certain exceptions) and continues to accrue interest payable on such securities. As of December 31, 2009, accrued interest on such securities approximated $11.2 million. Holders of the trust-preferred securities will recognize current taxable income relating to the deferred interest payments.
Upon termination of a deferral-period, all prior accrued and unpaid interest becomes immediately due and payable to holders of the securities at that time.
Documents governing the trusts give holders of the securities preference on liquidation over the holders of Capitol's common stock. Under current regulatory guidelines, such trust-preferred securities are included as capital for purposes of meeting certain ratio requirements.
NOTE J—WARRANTS TO PURCHASE COMMON STOCK, RESTRICTED COMMON
STOCK AND STOCK OPTIONS
Warrants for the purchase of 75,719 shares of Capitol's common stock were issued in 2009 in conjunction with a share-exchange transaction (see Note Q), which were outstanding at December 31, 2009 and expire May 31, 2012. The exercise price is $20.37 per warrant.
Shares of restricted common stock of the Corporation have been granted to certain officers. Compensation expense related to such restricted stock approximated $495,000 in 2009, $1.5 million in 2008 and $1.6 million in 2007. Tax benefits associated with such compensation expense approximated $436,000 in 2007 (none in 2009 and 2008). Future compensation expense related to unvested restricted common stock grants as of December 31, 2009 approximates $701,000 (based on grants through December 31, 2009), to be recorded ratably over a period of approximately 5.4 years, based on the weighted-average remaining vesting period at that date.
F-75
NOTES TO CONSOLIDATED FINANCIAL STATEMENTS
Capitol Bancorp Limited
NOTE J—WARRANTS TO PURCHASE COMMON STOCK, RESTRICTED COMMON
STOCK AND STOCK OPTIONS—Continued
Activity in shares of unvested restricted common stock is summarized as follows:
| 2009 | 2008 | 2007 | ||||||||||||||||||||||
Restricted Shares | Weighted- Average Grant Date Fair Value | Restricted Shares | Weighted- Average Grant Date Fair Value | Restricted Shares | Weighted- Average Grant Date Fair Value | |||||||||||||||||||
| Unvested at January 1 | 136,490 | $ | 29.55 | 207,422 | $ | 27.80 | 224,416 | $ | 27.72 | |||||||||||||||
| Granted | 37,000 | 1.70 | 31,790 | 16.17 | 43,972 | 21.55 | ||||||||||||||||||
| Vested | (19,847 | ) | 29.53 | (47,000 | ) | 21.23 | (58,966 | ) | 22.28 | |||||||||||||||
| Forfeited | (8,700 | ) | 34.69 | (55,722 | ) | 22.41 | (2,000 | ) | 44.56 | |||||||||||||||
| Unvested at December 31 | 144,943 | $ | 22.14 | 136,490 | $ | 29.55 | 207,422 | $ | 27.80 | |||||||||||||||
Stock options have been granted to certain officers and directors which provide for the purchase of shares of the Corporation's common stock. Generally, stock options are granted at an exercise price equal to the fair value of common stock on the grant date. All such stock options expire at varying periods up to seven years after the grant date. Stock option activity is summarized as follows:
Number Outstanding | Exercise Price Range | Weighted Average Exercise Price | |||||||||||||||
| Outstanding at January 1, 2006 | 2,570,091 | $ | 10.81 | to | $ | 37.48 | $ | 26.86 | |||||||||
| Granted in 2007 | 168,720 | 22.46 | to | 46.20 | 25.09 | ||||||||||||
| Exercised in 2007 | (277,149 | ) | 10.81 | to | 33.01 | 16.98 | |||||||||||
| Cancelled or expired in 2007 | (1,580 | ) | |||||||||||||||
| Outstanding at December 31, 2007 | 2,460,082 | 13.50 | to | 46.20 | 27.85 | ||||||||||||
| Granted in 2008 | 52,360 | 20.12 | to | 20.12 | 20.12 | ||||||||||||
| Exercised in 2008 | (108,935 | ) | 15.52 | to | 20.90 | 17.90 | |||||||||||
| Cancelled or expired in 2008 | (29,348 | ) | |||||||||||||||
| Outstanding at December 31, 2008 | 2,374,159 | 13.50 | to | 46.20 | 28.28 | ||||||||||||
| Granted in 2009 | 404,022 | 2.01 | to | 6.04 | 2.70 | ||||||||||||
| Cancelled or expired in 2009 | (273,698 | ) | 13.50 | to | 34.52 | 24.03 | |||||||||||
| Outstanding at December 31, 2009 | 2,504,483 | $ | 2.01 | to | $ | 46.20 | $ | 24.61 | |||||||||
The aggregate intrinsic value of exercised stock options approximated $1.9 million and $4.7 million in 2008 and 2007, respectively (none in 2009).
Stock options with an aggregate fair value of $661,000 and $255,000 were granted in 2009 and 2008, respectively. Fair value was computed using a Black-Scholes valuation model.
F-76
NOTES TO CONSOLIDATED FINANCIAL STATEMENTS
Capitol Bancorp Limited
NOTE J—WARRANTS TO PURCHASE COMMON STOCK, RESTRICTED COMMON
STOCK AND STOCK OPTIONS—Continued
Fair value assumptions included the following:
| 2009 | 2008 | |||
| Risk-free interest rate | 2.62% | 3.8% | ||
| Stock price volatility | 0.76 | 0.36 | ||
| Dividend yield | -- | 5.0% | ||
| Expected option life | 5 years | 7 years |
Compensation expense related to stock options approximated $855,000 in 2009, $693,000 in 2008 and $410,000 in 2007, and associated tax benefits approximated $299,000 in 2009 (before valuation allowance), $243,000 in 2008 and $144,000 in 2007. Future compensation expense relating to stock options outstanding as of December 31, 2009 is less than $100,000 and is to be recorded in 2010.
As of December 31, 2009, substantially all outstanding stock options were vested, currently exercisable and had a weighted average remaining contractual life of 2.34 years (except for stock options granted in 2007 which become vested and exercisable in 2010). The following table summarizes stock options outstanding and segregated by exercise price range as of December 31, 2009:
| Weighted Average | |||||||||||
Exercise Price Range | Number Outstanding | Exercise Price | Remaining Contractual Life | ||||||||
| $ | 1.00 to 14.99 | 404,022 | $ | 2.70 | 5.09 years | ||||||
| $ | 15.00 to 19.99 | 90,411 | 16.53 | 1.40 years | |||||||
| $ | 20.00 to 24.99 | 465,159 | 21.76 | 2.34 years | |||||||
| $ | 25.00 to 29.99 | 541,897 | 27.07 | 0.68 years | |||||||
| $ | 30.00 to 34.99 | 637,484 | 32.00 | 1.80 years | |||||||
| $ | 35.00 or more | 365,510 | 37.93 | 2.93 years | |||||||
| 2,504,483 | |||||||||||
Cash received from optionees upon exercise of stock options approximated $44,000 and $3.7 million and tax benefits realized approximated $24,000 and $1.3 million in 2008 and 2007, respectively (none in 2009).
F-77
NOTES TO CONSOLIDATED FINANCIAL STATEMENTS
Capitol Bancorp Limited
NOTE K—EMPLOYEE RETIREMENT PLANS
The Corporation has a contributory employee retirement savings 401(k) plan (the Plan) which covers substantially all full-time employees, over age 21, of Capitol and certain subsidiaries. The Plan provides for employer contributions in amounts determined annually by Capitol's board of directors. Eligible employees make voluntary contributions to the Plan. Employer contributions to the Plan, a partial match based on employee contributions (50%, subject to certain limitations through December 31, 2008; none in 2009), charged to expense for the years ended December 31, 2008 and 2007 approximated $2.4 million and $2.2 million, respectively (none in 2009).
Capitol also has a defined contribution employee stock ownership plan (ESOP) which covers substantially all employees of Capitol and certain subsidiaries. ESOP contributions charged to expense, based upon amounts determined annually by Capitol's board of directors, approximated $1.3 million in 2007 (none in 2009 and 2008). As of December 31, 2009, the ESOP held approximately 317,000 shares of Capitol's common stock which have been allocated to participants' accounts; there were no unallocated shares as of that date.
NOTE L—INCOME TAXES
Income taxes include the following components (in $1,000s):
| 2009 | 2008 | 2007 | ||||||||||
| Federal: | ||||||||||||
| Current expense (benefit) | $ | (43,594 | ) | $ | (823 | ) | $ | 13,003 | ||||
| Deferred (benefit) | (39,173 | ) | (26,029 | ) | (10,397 | ) | ||||||
| (82,767 | ) | (26,852 | ) | 2,606 | ||||||||
| State: | ||||||||||||
| Current expense (benefit) | 868 | (1,748 | ) | 218 | ||||||||
| Deferred (benefit) | (4,181 | ) | (1,548 | ) | ||||||||
| (3,313 | ) | (3,296 | ) | 218 | ||||||||
| (86,080 | ) | (30,148 | ) | 2,824 | ||||||||
Establishment of valuation allowance for deferred tax assets not meeting the more-likely-than-not criteria for realization | 104,498 | |||||||||||
| Total income tax expense (benefit) | $ | 18,418 | $ | (30,148 | ) | $ | 2,824 | |||||
In addition to state income taxes, certain states in which the banks operate impose taxes based on measures other than income. Tax expense associated with those jurisdictions approximated $646,000 in 2009 ($585,000 in 2008 and $1.5 million in 2007) and is excluded from income tax expense (included as a component of other noninterest expense).
F-78
NOTES TO CONSOLIDATED FINANCIAL STATEMENTS
Capitol Bancorp Limited
NOTE L—INCOME TAXES—Continued
Federal income taxes paid in 2009, 2008 and 2007 approximated $1.0 million, $7.3 million and $10.1 million, respectively. Federal income taxes refunded in 2009 approximated $9.0 million. State income taxes approximating $85,000 were paid in 2009 ($248,000 was paid in 2008 and $521,000 was received in refunds for a net refund of $273,000 in 2008; $735,000 was paid in 2007). Federal income taxes payable at December 31, 2007 were reduced by tax benefits approximating $1.9 million arising from the exercise of stock options (no material benefit in 2009 and 2008).
Differences between income tax expense recorded and amounts computed using the statutory tax rate are reconciled below (in $1,000s):
| 2009 | 2008 | 2007 | ||||||||||
Federal income tax expense (benefit) computed at statutory rate of 35% | $ | (86,143 | ) | $ | (28,910 | ) | $ | 2,155 | ||||
| State income taxes (benefit) | (3,313 | ) | (3,296 | ) | 218 | |||||||
Valuation allowance on deferred state income tax assets | 8,622 | |||||||||||
| Federal tax effect of: | ||||||||||||
| Amortization of intangibles | 1,213 | 19 | 54 | |||||||||
| State income taxes | 1,160 | 1,154 | (76 | ) | ||||||||
| Valuation allowance on state taxes | (3,018 | ) | ||||||||||
Valuation allowance recorded for deferred federal income tax assets | 95,876 | |||||||||||
| Other | 4,021 | 885 | 473 | |||||||||
| Total income tax expense (benefit) | $ | 18,418 | $ | (30,148 | ) | $ | 2,824 | |||||
Capitol recorded a valuation allowance for deferred income tax assets to reduce such net assets to an amount which was deemed to be realizable on a more-likely-than-not basis as of December 31, 2009. The valuation allowance may reduce future income tax expense to the extent of Capitol's profitability.
[The remainder of this page intentionally left blank]
F-79
NOTES TO CONSOLIDATED FINANCIAL STATEMENTS
Capitol Bancorp Limited
NOTE L—INCOME TAXES—Continued
Net deferred income tax assets, which are a component of other assets, consisted of the following at December 31 (in $1,000s):
| 2009 | 2008 | |||||||
| Allowance for loan losses | $ | 54,725 | $ | 35,936 | ||||
| Net operating losses of subsidiaries | 36,018 | 25,719 | ||||||
| Deferred compensation | 3,363 | 3,685 | ||||||
| Depreciation | (3,549 | ) | (4,253 | ) | ||||
Start-up costs of de novo banks | 4,450 | 5,372 | ||||||
Fair value adjustment for investment securities available for sale | 32 | (74 | ) | |||||
| Other real estate owned | 11,112 | 2,858 | ||||||
| Net deferred costs of loan originations | (5,978 | ) | (6,268 | ) | ||||
| Nonaccrued interest | 6,879 | 2,410 | ||||||
| Other, net | 2,828 | 1,035 | ||||||
| 109,880 | 66,420 | |||||||
| Less valuation allowance | (104,498 | ) | -- | |||||
| $ | 5,382 | $ | 66,420 | |||||
Certain subsidiaries (generally less than 80%-owned entities) have federal and state net operating loss carryforwards which may reduce income taxes payable in future periods, which have been recognized for deferred tax purposes (subject to a valuation allowance as of December 31, 2009) and, as of December 31, 2009, expire as follows (in $1,000s):
| Federal | State | |||||||
| 2013-2015 | $ | 42,739 | ||||||
| 2016-2018 | 3,660 | |||||||
| 2019-2021 | 16,455 | |||||||
| 2022-2024 | $ | 40 | 3,707 | |||||
| 2025-2027 | 32,678 | 9,293 | ||||||
| 2028-2029 | 62,741 | 13,723 | ||||||
| $ | 95,459 | $ | 89,577 | |||||
In conjunction with its annual review, management concluded that there were no significant uncertain tax positions requiring recognition in the consolidated financial statements. The evaluation was performed for the tax years 2006, 2007, 2008 and 2009, which are the tax years which remain subject to examination by major tax jurisdictions and was updated as of December 31, 2009.
The Internal Revenue Service (IRS) commenced and completed an examination of the Corporation's consolidated federal income tax return for the year ended December 31, 2005 during 2007. During 2008, the IRS commenced an examination of the Corporation's consolidated federal income tax return for the year ended December 31, 2006; the examination was completed in 2009. No significant adjustments to taxable income or taxes due arose from those examinations.
F-80
NOTES TO CONSOLIDATED FINANCIAL STATEMENTS
Capitol Bancorp Limited
NOTE L—INCOME TAXES—Continued
Capitol may from time to time be assessed interest or penalties associated with tax liabilities by major tax jurisdictions, although any such assessments would be estimated to be minimal and immaterial. To the extent Capitol may receive an assessment for interest and/or penalties, it is classified in the consolidated statements of operations as a component of other noninterest expense.
NOTE M—NET INCOME (LOSS) PER SHARE ATTRIBUTABLE TO CAPITOL
BANCORP LIMITED
The computations of basic and diluted net income (loss) per share were as follows (in 1,000s):
| 2009 | 2008 | 2007 | |||||||||
Numerator—net income (loss) attributable to Capitol Bancorp Limited | $ | (195,169 | ) | $ | (28,607 | ) | $ | 21,937 | |||
| Denominator: | |||||||||||
Weighted average number of shares outstanding, excluding unvested restricted shares (denominator for basic net income (loss) per share attributable to Capitol Bancorp Limited) | 17,302 | 17,147 | 16,967 | ||||||||
| Effect of dilutive securities: | |||||||||||
| Unvested shares of restricted stock | -- | -- | 70 | ||||||||
| Stock options | -- | -- | 179 | ||||||||
| Potential dilution | -- | -- | 249 | ||||||||
Denominator for diluted net income (loss) per share— weighted average number of shares and potential dilution | 17,302 | 17,147 | 17,216 | ||||||||
Number of antidilutive stock options excluded from diluted net income (loss) per share computation | 2,504 | 2,374 | 1,063 | ||||||||
Number of antidilutive unvested shares of restricted stock excluded from diluted net income (loss) per share computation | 145 | 136 | 26 | ||||||||
Number of antidilutive warrants excluded from net loss per share computation | 76 | ||||||||||
Additional disclosures regarding restricted shares and stock options are set forth in Note J.
F-81
NOTES TO CONSOLIDATED FINANCIAL STATEMENTS
Capitol Bancorp Limited
NOTE N—FAIR VALUE
Accounting standards establish a hierarchy that prioritizes the use of fair value inputs used in valuation methodologies into the following three levels:
Level 1: Quoted prices (unadjusted) for identical assets or liabilities in active markets that the entity has the ability to access as of the measurement date.
Level 2: Significant observable inputs other than Level 1 prices such as quoted prices for similar assets or liabilities in active markets; quoted prices for identical or similar assets or liabilities in markets that are not active; or other inputs that are observable or can be derived from or corroborated by observable market data by correlation or other means.
Level 3: Significant unobservable inputs that reflect the reporting entity's own assumptions about the assumptions that market participants would use in pricing an asset or liability.
The following is a description of Capitol's valuation methodologies used to measure and disclose the fair values of its financial assets and liabilities on a recurring or nonrecurring basis:
Investment securities available for sale: Securities available for sale are recorded at fair value on a recurring basis. Fair value measurement is based on quoted prices, when available (Level 1). If quoted prices are not available, fair values are measured using independent pricing models, as Level 2 values.
Loans held for sale: Mortgage loans held for sale are carried at the lower of cost or fair value and are measured on a nonrecurring basis. Loans held for sale written down to fair value are included in the table below (none at December 31, 2009 and 2008). Fair value is based on independent quoted market prices, where applicable, or the prices for other mortgage whole loans with similar characteristics.
Portfolio loans: The Corporation does not record portfolio loans at fair value on a recurring basis. However, from time to time, nonrecurring fair value adjustments to collateral-dependent loans are recorded to reflect partial write-downs based on the observable market price or current appraised value of the collateral or other estimates of fair value.
Other real estate owned: At the time of foreclosure, foreclosed properties are adjusted to estimated fair value less estimated costs to sell upon transfer from portfolio loans to other real estate owned, establishing a new accounting basis. The Corporation subsequently adjusts fair value on other real estate owned on a nonrecurring basis to reflect partial write-downs based on the observable market price, current appraised value of the asset or other estimates of fair value.
Long-lived and indefinite lived assets: The Corporation does not record long-lived or indefinite lived assets at fair value on a recurring basis. However, from time to time, nonrecurring fair value adjustments to a long-lived or indefinite asset are recorded to reflect partial write-downs based on the observable market price or other estimate of fair value.
F-82
NOTES TO CONSOLIDATED FINANCIAL STATEMENTS
Capitol Bancorp Limited
NOTE N—FAIR VALUE—Continued
Fair value measurements for assets and liabilities where there exists limited or no observable market data and, therefore, which are based primarily upon estimates, are often calculated based on current pricing policy, the economic and competitive environment, the characteristics of the asset or liability and other such factors. Therefore, the results cannot be determined with precision and may not be realized in an actual sale or immediate settlement of the asset or liability. Additionally, there may be inherent weaknesses in any calculation technique and, further, changes in the underlying assumptions used, including discount rates and estimates of future cash flows, could significantly affect the results of current or future values.
Assets and liabilities measured at fair value on a recurring basis as of December 31 were as follows (in $1,000s):
| 2009 | 2008 | |||||||||||||||
Total | Significant Other Observable Inputs (Level 2) | Total | Significant Other Observable Inputs (Level 2) | |||||||||||||
| Investment securities available for sale: | ||||||||||||||||
| United States treasury | $ | 1,500 | $ | 1,500 | ||||||||||||
| United States government agencies | 13,941 | 13,941 | $ | 9,913 | $ | 9,913 | ||||||||||
| Mortgage-backed | 24,598 | 24,598 | 4,890 | 4,890 | ||||||||||||
| Municipalities | 739 | 739 | 781 | 781 | ||||||||||||
| $ | 40,778 | $ | 40,778 | $ | 15,584 | $ | 15,584 | |||||||||
Assets and liabilities measured at fair value on a nonrecurring basis as of December 31 were as follows (in $1,000s):
| 2009 | 2008 | |||||||||||||||
Total | Significant Unobservable Inputs (Level 3) | Total | Significant Other Observable Inputs (Level 2) | |||||||||||||
Impaired Loans (1) | $ | 138,982 | $ | 138,982 | $ | 103,580 | $ | 103,580 | ||||||||
Other real estate owned (1) | $ | 111,820 | $ | 111,820 | $ | 67,171 | $ | 67,171 | ||||||||
| (1) | Represents carrying value based on the appraised value of the applicable collateral or foreclosed property or other estimates of fair value. |
Many of Capitol's collateral-dependent impaired loans and other real estate owned are located in severely depressed real estate markets. In those markets, appraisal data may be of limited usefulness in estimating fair value because comparable sale transactions are infrequent, not orderly and are often distressed or forced.
F-83
NOTES TO CONSOLIDATED FINANCIAL STATEMENTS
Capitol Bancorp Limited
NOTE N—FAIR VALUE—Continued
Updated appraisals are generally obtained when it has been determined that a collateral-dependent loan has become impaired or when it is likely a real-estate loan is likely to be foreclosed. Adjustments to a loan's carrying value (or requirements for the allowance for loan losses) are made, when appropriate, after review of the appraisal or subsequently if market conditions significantly decline further. The timing of the recognition of a collateral-dependent loan as nonperforming is dependent on several factors, including the performance of the loan, the payment history of the loan or the receipt of updated borrower financial information.
When borrower performance has deteriorated (for example, sales or leasing has not occurred as expected), the borrower has become late on the required payments or financial information received indicates adverse financial trends, the loan will be downgraded and, if appropriate, receipt of an updated appraisal will be ordered. In the period between loans being recognized as impaired and receipt of an updated appraisal, the loan will be included within loss contingency pools. Upon receipt and review of an updated appraisal and after any further fair value analysis is completed, the loan will be further evaluated for appropriate charge-down. Generally, negative differences between appraised value, less the estimated cost to sell, and the carrying value of the loan are charged to the allowance for loan losses when the appraisal has been received and reviewed. Occasionally, additional amounts may be included in the estimate of requirements for the allowance for loan losses if there are pending circumstances which may adversely impact the fair value estimate. Internally-developed evaluations may be used when the amount of the loan is less than $250,000. Internal evaluations may also be used when the most recent appraisal date is within a year and economic conditions have had corrections or deterioration. Updated fair value information is generally obtained at least annually for collateral-dependent loans and other real estate owned.
Effective January 1, 2009, in accordance with recent accounting standards, Capitol began applying the fair value measurement and disclosure provisions regarding nonfinancial assets and liabilities measured on a nonrecurring basis. The Corporation measures the fair value of the following on a nonrecurring basis: (1) long-lived assets, (2) foreclosed assets, (3) the reporting unit under step one of its goodwill impairment test and (4) indefinite lived assets.
[The remainder of this page intentionally left blank]
F-84
NOTES TO CONSOLIDATED FINANCIAL STATEMENTS
Capitol Bancorp Limited
NOTE N—FAIR VALUE—Continued
Carrying values and estimated fair values of financial instruments based upon the accounting guidance set forth in ASC 825-10 (formerly FAS 107) were as follows at December 31 (in $1,000s):
| 2009 | 2008 | |||||||||||||||
Carrying Value | Estimated Fair Value | Carrying Value | Estimated Fair Value | |||||||||||||
| Financial assets: | ||||||||||||||||
| Cash and cash equivalents | $ | 808,921 | $ | 808,921 | $ | 624,366 | $ | 624,366 | ||||||||
| Loans held for sale | 16,132 | 16,132 | 10,474 | 10,474 | ||||||||||||
| Investment securities: | ||||||||||||||||
| Available for sale | 40,778 | 40,778 | 15,584 | 15,584 | ||||||||||||
| Held for long-term investment | 30,565 | 30,565 | 32,856 | 32,856 | ||||||||||||
| 71,343 | 71,343 | 48,440 | 48,440 | |||||||||||||
| Portfolio loans: | ||||||||||||||||
| Loans secured by real estate: | ||||||||||||||||
| Commercial | 1,990,332 | 1,910,631 | 2,115,515 | 2,105,204 | ||||||||||||
| Residential (including multi-family) | 785,362 | 752,400 | 879,754 | 865,406 | ||||||||||||
Construction, land development and other land | 509,474 | 434,278 | 797,486 | 753,028 | ||||||||||||
| Total loans secured by real estate | 3,285,168 | 3,097,309 | 3,792,755 | 3,723,638 | ||||||||||||
Commercial and other business-purpose loans | 684,253 | 667,660 | 845,593 | 830,283 | ||||||||||||
| Consumer | 44,168 | 44,533 | 61,340 | 62,313 | ||||||||||||
| Other | 33,512 | 31,781 | 35,541 | 32,504 | ||||||||||||
| Total portfolio loans | 4,047,101 | 3,841,283 | 4,735,229 | 4,648,738 | ||||||||||||
| Less allowance for loan losses | (144,664 | ) | (144,664 | ) | (93,040 | ) | (93,040 | ) | ||||||||
| Net portfolio loans | 3,902,437 | 3,696,619 | 4,642,189 | 4,555,698 | ||||||||||||
| Financial liabilities: | ||||||||||||||||
| Deposits: | ||||||||||||||||
| Noninterest-bearing | 679,100 | 679,100 | 700,786 | 700,786 | ||||||||||||
| Interest-bearing: | ||||||||||||||||
| Demand accounts | 1,302,341 | 1,302,341 | 1,231,170 | 1,231,170 | ||||||||||||
| Time certificates of less than $100,000 | 942,303 | 944,579 | 1,160,221 | 1,161,411 | ||||||||||||
| Time certificates of $100,000 or more | 1,486,889 | 1,489,109 | 1,405,435 | 1,408,431 | ||||||||||||
| Total interest-bearing deposits | 3,731,533 | 3,736,029 | 3,796,826 | 3,801,012 | ||||||||||||
| Total deposits | 4,410,633 | 4,415,131 | 4,497,612 | 4,501,800 | ||||||||||||
| Notes payable and short-term borrowings | 276,159 | 276,265 | 446,925 | 447,490 | ||||||||||||
| Subordinated debentures | 167,441 | 170,841 | (1) | 167,293 | 170,841 | (1) | ||||||||||
| (1) | Represents liquidation or principal amount outstanding. The quoted market value of certain trust-preferred securities (Capitol Trust I and XII) included within subordinated debentures was substantially less than that amount. |
F-85
NOTES TO CONSOLIDATED FINANCIAL STATEMENTS
Capitol Bancorp Limited
NOTE N—FAIR VALUE—Continued
Estimated fair values of financial assets and liabilities in the table on the preceding page are based upon a comparison of current interest rates on financial instruments and the timing of related scheduled cash flows to the estimated present value of such cash flows using current estimated market rates of interest (unless quoted market values or other fair value information is more readily available). For example, the estimated fair value of portfolio loans is based on discounted cash flow computations rather than what an independent third party would pay for such assets in any potential sale transaction scenario. Similarly, the estimated fair value of time deposits, debt obligations and subordinated debentures were determined through discounted cash flow computations. Such estimates of fair value are not intended to represent market value or portfolio liquidation value and, accordingly, only represent an estimate of fair value based on current financial reporting requirements.
Given current market conditions, a portion of the loan portfolio is not readily marketable and, accordingly, market prices, if any, do not exist. Capitol has not attempted to market the loan portfolio to potential buyers, if any exist, to determine the fair value of those instruments. Since negotiated prices, if any, in illiquid markets depend upon the then present motivations of the buyer and seller, it is reasonable to assume that potential sales prices could vary widely from any estimate of fair value made without the benefit of negotiations. Additionally, changes in market interest rates commensurate with risk may dramatically impact the value of financial instruments at any time. Accordingly, fair value measurements for loans included in the table on the preceding page are unlikely to represent the instruments' liquidation values.
NOTE O—COMMITMENTS, GUARANTEES AND OTHER CONTINGENCIES
In the ordinary course of business, loan commitments are made to accommodate the financial needs of bank customers. Loan commitments include stand-by letters of credit, lines of credit, and other commitments for commercial, installment and mortgage loans. Stand-by letters of credit, when issued, commit the bank to make payments on behalf of customers if certain specified future events occur and are used infrequently by the banks ($21.7 million and $24.6 million outstanding at December 31, 2009 and 2008, respectively). Other loan commitments outstanding consist of unused lines of credit and approved, but unfunded, specific loan commitments ($509.1 million and $781.3 million at December 31, 2009 and 2008, respectively). Those loan commitments (stand-by letters of credit and unfunded loans) generally expire within one year and are reviewed periodically for continuance or renewal.
All loan commitments have credit risk essentially the same as that involved in routinely making loans to customers and are made subject to the banks' normal credit policies. In making these loan commitments, collateral and/or personal guarantees of the borrowers are generally obtained based on management's credit assessment.
F-86
NOTES TO CONSOLIDATED FINANCIAL STATEMENTS
Capitol Bancorp Limited
NOTE O—COMMITMENTS, GUARANTEES AND OTHER CONTINGENCIES—Continued
Capitol's banking subsidiaries are required to maintain average reserve balances in the form of cash on hand and balances due from the Federal Reserve Bank and correspondent banks. The amount of reserve balances required as of December 31, 2009 and 2008 was $8.2 million and $7.9 million, respectively.
Deposits at each of the banks are insured up to the maximum amount covered by FDIC insurance ($250,000 per relationship in 2009). Some of the banks have municipal government deposits which are guaranteed by Capitol ($12.7 million at December 31, 2009).
Capitol has guaranteed up to $2.5 million of secured borrowings by Amera Mortgage Corporation, a less than 50%-owned affiliate.
Generally, banks are subject to cross-guaranty liability regarding other financial institutions the FDIC determines are controlled by any multibank holding company. Pursuant to federal regulations, an insured depository institution may be liable for any loss the FDIC has incurred or expects to incur in connection with the failure of a former affiliate institution and, if the FDIC determines that remaining affiliates have a liability to the FDIC, then they would have to pay that liability to the FDIC. Payment of a cross-guaranty liability to the FDIC could have a material adverse impact on the results of operations, capital adequacy and financial position of Capitol and its banking subsidiaries.
To date, none of Capitol's subsidiary banks have received any notice of assessment of cross-guaranty liability. Capitol's banks have, however, received notice from the FDIC that the FDIC may assess a cross-guaranty liability relating to a failed community bank in Florida which ceased operations in November 2009. The FDIC alleges that the Florida bank was an affiliated institution of Capitol, although Capitol owned no securities of that bank or otherwise controlled the failed institution. The aggregate loss to the FDIC of that failed bank approximated $23.6 million. The FDIC has two years to determine whether to assess that potential cross-guaranty liability, if any.
In addition to the above-mentioned potential cross-guaranty liability, some of Capitol's banking subsidiaries were advised in December 2009 that, to mitigate the effects of any possible assessment arising from potential cross-guaranty liability, they should develop a plan to arrange a sale, merger or recapitalization such that Capitol no longer controls the bank. This guidance was preceded by Capitol's previously-announced plans to selectively divest some of its bank subsidiaries in conjunction with reallocating capital resources to the remaining banks. Capitol's pending divestitures are subject to regulatory approval which may take an extended period of time to obtain.
F-87
NOTES TO CONSOLIDATED FINANCIAL STATEMENTS
Capitol Bancorp Limited
NOTE P—CAPITAL REQUIREMENTS AND RELATED REGULATORY MATTERS
Current banking regulations restrict the ability to transfer funds from subsidiaries to their parent in the form of cash dividends, loans or advances. As of December 31, 2009, Capitol's bank subsidiaries were prohibited from making dividend payments to the Corporation without prior regulatory approval.
Each bank and Capitol are subject to complex capital requirements. Federal financial institution regulatory agencies impose certain risk-based capital requirements on financial institutions and bank holding companies. Those guidelines require all banks and bank holding companies to maintain certain minimum ratios and related amounts based on 'Tier 1' and 'Tier 2' capital and 'risk-weighted assets' as defined and periodically prescribed by the respective regulatory agencies. Failure to meet these capital requirements can result in severe regulatory enforcement action or other adverse consequences for a depository institution and, accordingly, could have a material impact on Capitol's consolidated financial statements.
Under the regulatory capital adequacy requirements and related framework for prompt corrective action, the specific capital requirements involve quantitative measures of assets, liabilities and certain off-balance-sheet items calculated under regulatory accounting practices. The capital amounts and classifications are also subject to qualitative judgments by regulatory agencies with regard to components, risk weighting and other factors.
As a condition of their charter approval, de novo banks are generally required to maintain a core capital (Tier 1) to average assets ratio of not less than 8% (4% for other banks) and an allowance for loan losses of not less than 1% for the first seven years of operations.
In September 2009, Capitol and its second-tier bank holding companies entered into a written agreement with the Federal Reserve Bank of Chicago (the Reserve Bank) under which Capitol agreed to refrain from the following actions without the prior written consent of the Reserve Bank: (i) declare or pay dividends; (ii) receive dividends or any other form of payment representing a reduction in capital from Michigan Commerce Bank or from any of Capitol's subsidiary institutions that are subject to any restriction by the institution's federal or state regulator that limits the payment of dividends or other intercorporate payments; (iii) make any distributions of interest, principal, or other sums of subordinated debentures or trust-preferred securities; (v) incur, increase or guarantee any debt; or (vi) purchase or redeem any shares of the stock of Capitol, the second-tier bank holding companies, nonbank subsidiaries or any of the subsidiary banks that are held by shareholders other than Capitol.
F-88
NOTES TO CONSOLIDATED FINANCIAL STATEMENTS
Capitol Bancorp Limited
NOTE P—CAPITAL REQUIREMENTS AND RELATED REGULATORY MATTERS—Continued
Capitol has also agreed to: (i) submit to the Reserve Bank, a written plan to maintain sufficient capital at Capitol on a consolidated basis and at Michigan Commerce Bank (as a separate legal entity on a stand-alone basis); (ii) notify the Reserve Bank no more than 30 days after the end of any quarter in which Capitol's consolidated or Michigan Commerce Bank's capital ratios fall below the approved capital plan's minimum ratios, as well as if any subsidiary institution's ratios fall below the minimum ratios required by the institution's federal or state regulator; (iii) review and revise its allowance for loan losses (ALLL) methodology for loans held by Capitol and submit to the Reserve Bank a written program for maintenance of an adequate ALLL for loans held by Capitol; (iv) take all necessary actions to ensure each of its subsidiary institutions comply with Federal Reserve regulations; (v) refrain from increasing any fees or charging new fees to any subsidiary institution without the prior written consent of the Reserve Bank; (vi) submit to the Reserve Bank a written plan to enhance the consolidated organization's risk management practices, a strategic plan to improve the consolidated organization's operating results and a cash flow projection; (vii) comply with laws and regulations regarding senior executive officer positions and severance payments; and (viii) provide quarterly reports to the Reserve Bank regarding these undertakings.
Certain of Capitol's bank subsidiaries have entered into formal agreements or consent orders with their applicable federal and state bank regulatory agencies in response to elevated levels of nonperforming assets, loan losses and adverse operating results. Those agreements provide for certain restrictions and other guidelines and/or limitations to be followed by those banks. Generally, those agreements require the banks to maintain an adequate ALLL, reduce levels of nonperforming and other classified assets and implement revised budgets and liquidity and capital adequacy projections to improve financial performance. When a bank enters into a formal regulatory agreement, it is generally precluded from meeting the criteria as a “well-capitalized” institution although it may meet or exceed such threshold on a computational basis. In addition, the banks' capital classification places limitations on some of their activities, such as the permissibility of accepting or renewing brokered deposits, among other things. Additionally, such banks are subject to higher levels of FDIC insurance assessments, although they may receive some relief from up front payment of the FDIC's advance insurance assessments relating to future years at December 31, 2009.
F-89
NOTES TO CONSOLIDATED FINANCIAL STATEMENTS
Capitol Bancorp Limited
NOTE P—CAPITAL REQUIREMENTS AND RELATED REGULATORY MATTERS—Continued
Management believes, as of December 31, 2009, that Capitol and its banks meet all capital adequacy requirements to which the entities are subject, except for certain banks which did not meet capital ratios specified in their respective formal regulatory agreements. Five bank subsidiaries were deemed to be less than adequately capitalized as of December 31, 2009; management intends to bring those banks' capital levels up to and above the adequately-capitalized minimum.
The following table summarizes the amounts (in $1,000s) and related ratios of Capitol's consolidated regulatory capital position:
| December 31 | ||||||||||
| 2009 | 2008 | |||||||||
| Tier 1 capital to average adjusted total assets: | ||||||||||
| Minimum required amount | ≥ | $ | 210,651 | ≥ | $ | 219,176 | ||||
| Actual amount | $ | 242,547 | $ | 587,475 | ||||||
| Ratio | 4.61 | % | 10.72 | % | ||||||
| Tier 1 capital to risk-weighted assets: | ||||||||||
Minimum required amount(1) | ≥ | $ | 162,089 | ≥ | $ | 194,689 | ||||
| Actual amount | $ | 242,547 | $ | 587,475 | ||||||
| Ratio | 5.99 | % | 12.07 | % | ||||||
Combined Tier 1 and Tier 2 capital to risk- weighted assets: | ||||||||||
Minimum required amount(2) | ≥ | $ | 324,177 | ≥ | $ | 389,379 | ||||
Amount required to meet 'Well-Capitalized' category(3) | ≥ | $ | 405,222 | ≥ | $ | 486,724 | ||||
| Actual amount | $ | 383,449 | $ | 669,113 | ||||||
| Ratio | 9.46 | % | 13.75 | % | ||||||
| (1) | The minimum required ratio of Tier 1 capital to risk-weighted assets is 4%. |
| (2) | The minimum required ratio of Tier 1 and Tier 2 capital to risk-weighted assets is 8%. |
| (3) | In order to be classified as a 'well-capitalized' institution, the ratio of Tier 1 and Tier 2 capital to risk- weighted assets must be 10% or more. |
[The remainder of this page intentionally left blank]
F-90
NOTES TO CONSOLIDATED FINANCIAL STATEMENTS
Capitol Bancorp Limited
NOTE Q—ACQUISITION OF NONCONTROLLING INTERESTS
Effective May 31, 2009, Capitol completed a share-exchange transaction with the noncontrolling shareholders of Bank of Auburn Hills, previously a 51%-owned subsidiary. In conjunction with the share exchange, Capitol issued 227,000 previously unissued shares of its common stock and warrants for the purchase of 76,000 shares of its common stock. The exercise price of the warrants is $20.37 per warrant, and the warrants expire May 31, 2012. As a result of the share-exchange transaction, Bank of Auburn Hills became wholly-owned. Capitol's results of operations would not have been materially different if the share-exchange transaction had occurred at the beginning of the periods presented.
During early 2007, a share-exchange transaction was completed, whereby approximately 371,000 shares of Capitol's common stock were exchanged for noncontrolling interests in CDBL II. Had this acquisition occurred at the beginning of 2007, pro forma consolidated net income attributable to Capitol would have approximated $21.7 million in 2007 and diluted earnings per share would have been $1.24 in 2007.
NOTE R—PARENT COMPANY FINANCIAL INFORMATION
Condensed Balance Sheets
| -December 31- | ||||||||
| 2009 | 2008 | |||||||
| (in $1,000s) | ||||||||
| Assets | ||||||||
| Cash on deposit, principally with subsidiary banks | $ | 2,081 | $ | 2,037 | ||||
Money market funds on deposit, principally with subsidiary banks | 880 | 25,058 | ||||||
| Cash and cash equivalents | 2,961 | 27,095 | ||||||
| Investment securities | 3,151 | 3,401 | ||||||
| Loans, net | 9,931 | 18,691 | ||||||
| Investments in and advances to subsidiaries | 355,840 | 492,776 | ||||||
| Investment in and advances to Amera Mortgage Corporation | 432 | 482 | ||||||
| Investment in and advances to CDBL III | 1,495 | -- | ||||||
| Equipment, software and furniture, net | 7,159 | 9,359 | ||||||
| Other assets | 19,751 | 31,496 | ||||||
| Total assets | $ | 400,720 | $ | 583,300 | ||||
| Liabilities and Stockholders' Equity | ||||||||
| Liabilities: | ||||||||
| Accounts payable, accrued expenses and other liabilities | $ | 26,486 | $ | 10,702 | ||||
| Debt obligations | 14,011 | 20,011 | ||||||
| Subordinated debentures | 198,888 | 198,739 | ||||||
| Total liabilities | 239,385 | 229,452 | ||||||
| Stockholders' equity | 161,335 | 353,848 | ||||||
| Total liabilities and stockholders' equity | $ | 400,720 | $ | 583,300 | ||||
F-91
NOTES TO CONSOLIDATED FINANCIAL STATEMENTS
Capitol Bancorp Limited
NOTE R—PARENT COMPANY FINANCIAL INFORMATION—Continued
Condensed Statements of Operations
| -Year Ended December 31- | ||||||||||||
| 2009 | 2008 | 2007 | ||||||||||
| (in $1,000s) | ||||||||||||
| Income: | ||||||||||||
| Intercompany fees | $ | 35,243 | $ | 28,847 | $ | 24,854 | ||||||
| Dividends from subsidiaries | 964 | 19,634 | 32,750 | |||||||||
| Interest | 1,596 | 169 | 610 | |||||||||
| Other | 2,870 | 3,318 | 2,021 | |||||||||
| Total income | 40,673 | 51,968 | 60,235 | |||||||||
| Expenses: | ||||||||||||
| Interest | 15,292 | 14,372 | 12,174 | |||||||||
| Salaries and employee benefits | 24,032 | 22,415 | 11,756 | |||||||||
| Occupancy | 2,297 | 2,509 | 2,049 | |||||||||
| Equipment rent and depreciation | 6,236 | 4,700 | 3,366 | |||||||||
| Other | 9,831 | 5,332 | 8,933 | |||||||||
| Total expenses | 57,688 | 49,328 | 38,278 | |||||||||
Income (losses) before equity in undistributed net losses of consolidated subsidiaries and income taxes (credit) | (17,015 | ) | 2,640 | 21,957 | ||||||||
Equity in undistributed net losses of consolidated subsidiaries | (175,482 | ) | (39,320 | ) | (4,469 | ) | ||||||
| Income (loss) before income taxes (credit) | (192,497 | ) | (36,680 | ) | 17,488 | |||||||
| Income taxes (credit) | 2,672 | (8,073 | ) | (4,449 | ) | |||||||
| Net income (loss) | $ | (195,169 | ) | $ | (28,607 | ) | $ | 21,937 | ||||
[The remainder of this page intentionally left blank]
F-92
NOTES TO CONSOLIDATED FINANCIAL STATEMENTS
Capitol Bancorp Limited
NOTE R—PARENT COMPANY FINANCIAL INFORMATION—Continued
Condensed Statements of Cash Flows
| -Year Ended December 31- | ||||||||||||
| 2009 | 2008 | 2007 | ||||||||||
| (in $1,000s) | ||||||||||||
| OPERATING ACTIVITIES | ||||||||||||
| Net income (loss) | $ | (195,169 | ) | $ | (28,607 | ) | $ | 21,937 | ||||
Adjustments to reconcile net income (loss) to net cash used by operating activities: | ||||||||||||
Equity in undistributed net earnings (losses) of subsidiaries | 175,482 | 39,320 | 4,469 | |||||||||
| Depreciation and amortization of intangibles | 2,624 | 2,583 | 2,189 | |||||||||
| Loss on sale of equipment and furniture | 116 | |||||||||||
Decrease (increase) in amounts due from subsidiaries and other assets | 1,687 | (25,179 | ) | (33,586 | ) | |||||||
Increase in accounts payable, accrued expenses and other liabilities | 15,784 | 932 | 1,428 | |||||||||
NET CASH PROVIDED (USED) BY OPERATING ACTIVITIES | 524 | (10,951 | ) | (3,563 | ) | |||||||
| INVESTING ACTIVITIES | ||||||||||||
| Net cash investments in subsidiaries | (25,073 | ) | (35,145 | ) | (16,830 | ) | ||||||
| Purchases of investment securities | (772 | ) | (1,800 | ) | ||||||||
| Net decrease (increase) in loans | 8,760 | 9,551 | (16,928 | ) | ||||||||
| Proceeds from sales of equipment and furniture | 35 | 126 | ||||||||||
| Purchases of equipment and furniture | (575 | ) | (1,622 | ) | (3,170 | ) | ||||||
| NET CASH USED BY INVESTING ACTIVITIES | (17,625 | ) | (29,016 | ) | (36,802 | ) | ||||||
| FINANCING ACTIVITIES | ||||||||||||
| Net borrowings (payments) from debt obligations | (6,000 | ) | 20,011 | |||||||||
| Net proceeds from issuance of subordinated debentures | 34,555 | 55,000 | ||||||||||
| Net proceeds from issuance of common stock | 1,950 | 4,706 | ||||||||||
| Tax benefit (effect) from share-based payments | (169 | ) | 20 | 1,688 | ||||||||
| Acquisition of shares for employee benefit trust | (2,482 | ) | ||||||||||
| Cash dividends paid | (864 | ) | (8,658 | ) | (17,196 | ) | ||||||
NET CASH PROVIDED (USED) BY FINANCING ACTIVITIES | (7,033 | ) | 47,878 | 41,716 | ||||||||
INCREASE (DECREASE) IN CASH AND CASH EQUIVALENTS | (24,134 | ) | 7,911 | 1,351 | ||||||||
| Cash and cash equivalents at beginning of year | 27,095 | 19,184 | 17,833 | |||||||||
| CASH AND CASH EQUIVALENTS AT END OF YEAR | $ | 2,961 | $ | 27,095 | $ | 19,184 | ||||||
F-93
NOTES TO CONSOLIDATED FINANCIAL STATEMENTS
Capitol Bancorp Limited
NOTE S—DECONSOLIDATION OF SUBSIDIARIES
Community Bank of Rowan and Summit Bank of Kansas City are majority-owned subsidiaries of CDBL III of which Capitol ceased to have majority voting control effective September 30, 2009 when the previously nonvoting Class B shares of CDBL III became voting. Accordingly, those banks and CDBL III ceased to be consolidated subsidiaries of Capitol and assets approximating $257.7 million and related equity amounts were removed from the consolidated balance sheet.
NOTE T—SALE OF SUBSIDIARY BANK AND PENDING SALES
In September 2009, Capitol completed the sale of Yuma Community Bank, previously a wholly-owned subsidiary. Capitol received $9.5 million in proceeds from the sale and recorded a pre-tax gain of approximately $1.2 million. Capitol's consolidated results of operations would not have been materially different if the sale had occurred at the beginning of the periods presented. In November 2009, the sale of Bank of Santa Barbara, a subsidiary of CDBL III, was completed for aggregate cash consideration of $3.9 million and a pre-tax gain of approximately $1.1 million.
During 2009, Capitol announced plans to pursue divestiture of some of its bank subsidiaries (or those which are subsidiaries of Capitol's bank-development subsidiaries) on a selective basis for the purpose of reallocating capital to enhance the capital of its retained bank subsidiaries, to the extent such sales may be completed with a desirable gain upon sale. Capitol and/or its bank-development subsidiaries have entered into definitive agreements to sell its interests (or controlling interest held by bank-development subsidiaries) in the following banks in 2010: Adams Dairy Bank, Bank of Belleville, Bank of Las Colinas, Community Bank of Lincoln, Community Bank of Rowan, Mountain View Bank of Commerce, Ohio Commerce Bank and Napa Community Bank. The pending bank sales are subject to regulatory approval and other contingencies. If completed, the pending bank divestitures would result in Capitol receiving estimated proceeds approximating $53.8 million and a pre-tax gain on sale of approximately $15.1 million.
[The remainder of this page intentionally left blank]
F-94
NOTES TO CONSOLIDATED FINANCIAL STATEMENTS
Capitol Bancorp Limited
NOTE U—PROPOSED SPIN-OFF
In July 2009, Capitol announced its intention to formally and legally separate the operations of Michigan Commerce Bancorp Limited (MCBL) as an independent publicly-traded company through a spin-off transaction. If completed, Capitol would continue to be a publicly-held bank holding company with national banking operations and MCBL would become a separate publicly-traded bank holding company consisting of the substantial majority of Capitol's prior Michigan-based banks. Total assets of MCBL which would be included in the proposed spin-off approximated $1.1 billion at December 31, 2009 and its net loss from operations approximated $73.5 million and $13.8 million in 2009 and 2008, respectively (net income of $6.1 million in 2007). Completion of the proposed spin-off transaction is subject to regulatory approval and other contingencies and is unlikely to occur without a significant infusion of additional capital.
[The remainder of this page intentionally left blank]
F-95
[This page intentionally left blank]