Table of Contents
| | | | | |
| Selected Consolidated Financial Data | | | 2 | |
| Information Regarding Capitol’s Common Stock | | | 3 | |
| Availability of Form 10-K and Certain Other Reports | | | 3 | |
| Other Corporate and Shareholder Information | | | 4 | |
| Cautions Regarding Forward-Looking Statements | | | 5 | |
| Management’s Discussion and Analysis of Financial Condition and Results of Operations: | | | | |
| Preface | | | 6 | |
| Capitol Bancorp and its Banking Business | | | 7 | |
| Highlights of 2003 | | | 8 | |
| Critical Accounting Policies Affecting Capitol’s Financial Statements | | | 8 | |
| Capitol’s Results of Operations | | | 9 | |
| Capitol’s Financial Position | | | 12 | |
| Liquidity, Capital Resources and Capital Adequacy | | | 17 | |
| Trends Affecting Operations | | | 21 | |
| New Accounting Standards | | | 24 | |
| Consolidated Financial Statements: | | | | |
| Report of Independent Auditors | | | 25 | |
| Consolidated Balance Sheets | | | 26 | |
| Consolidated Statements of Income | | | 27 | |
| Consolidated Statements of Changes in Stockholders’ Equity | | | 28 | |
| Consolidated Statements of Cash Flows | | | 29 | |
| Notes to Consolidated Financial Statements | | | 30 | |
1
Selected Consolidated Financial Data
(in $1,000s, except per share data)
| | | | | | | | | | | | | | | | | | | | | |
| | | As of and for the Year Ended December 31
|
| | | 2003(1)
| | 2002(2)
| | 2001(3)
| | 2000(4)
| | 1999(5)
|
| For the year: | | | | | | | | | | | | | | | | | | | | |
| Interest income | | $ | 164,416 | | | $ | 156,454 | | | $ | 153,797 | | | $ | 132,311 | | | $ | 93,602 | |
| Interest expense | | | 49,490 | | | | 55,860 | | | | 73,292 | | | | 65,912 | | | | 46,237 | |
| Net interest income | | | 114,926 | | | | 100,594 | | | | 80,505 | | | | 66,399 | | | | 47,365 | |
| Provision for loan losses | | | 9,861 | | | | 12,676 | | | | 8,167 | | | | 7,216 | | | | 4,710 | |
| Noninterest income | | | 20,087 | | | | 14,982 | | | | 9,585 | | | | 6,137 | | | | 4,714 | |
| Noninterest expense | | | 88,113 | | | | 77,151 | | | | 64,136 | | | | 52,846 | | | | 40,257 | |
| Income before cumulative effect of change in accounting principle | | | 23,380 | | | | 16,653 | | | | 10,718 | | | | 8,035 | | | | 5,606 | (6) |
| Net income | | | 23,380 | | | | 16,653 | | | | 10,718 | | | | 8,035 | | | | 5,409 | |
| Net income per share: | | | | | | | | | | | | | | | | | | | | |
| Basic | | | 1.86 | | | | 1.64 | | | | 1.38 | | | | 1.14 | | | | .84 | |
| Diluted | | | 1.77 | | | | 1.57 | | | | 1.35 | | | | 1.13 | | | | .83 | |
| Cash dividends paid per share | | | .51 | | | | .44 | | | | .40 | | | | .36 | | | | .36 | |
| |
| At end of year: | | | | | | | | | | | | | | | | | | | | |
| Total assets | | $ | 2,737,062 | | | $ | 2,409,288 | | | $ | 2,044,006 | | | $ | 1,630,076 | | | $ | 1,305,987 | |
| Total earning assets | | | 2,521,375 | | | | 2,226,969 | | | | 1,920,621 | | | | 1,517,350 | | | | 1,227,976 | |
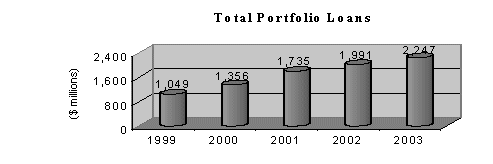
| Portfolio loans | | | 2,247,440 | | | | 1,991,372 | | | | 1,734,589 | | | | 1,355,798 | | | | 1,049,204 | |
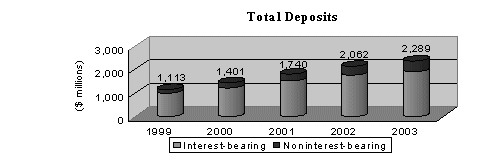
| Deposits | | | 2,288,664 | | | | 2,062,072 | | | | 1,740,385 | | | | 1,400,899 | | | | 1,112,793 | |
| Notes payable | | | 92,774 | | | | 93,398 | | | | 89,911 | | | | 58,150 | | | | 47,400 | |
| Trust-preferred securities | | | 90,816 | | | | 51,583 | | | | 48,621 | | | | 24,327 | | | | 24,291 | |
| Minority interests in consolidated subsidiaries | | | 30,946 | | | | 28,016 | | | | 70,673 | | | | 62,575 | | | | 54,593 | |
| Stockholders’ equity | | | 218,897 | | | | 160,037 | | | | 80,172 | | | | 70,404 | | | | 54,668 | |
| |
| | | | | | | Quarterly Results of Operations (unaudited)
|
| | | Total for | | Fourth | | Third | | Second | | First |
| | | the Year
| | Quarter
| | Quarter
| | Quarter
| | Quarter
|
Year ended December 31, 2003:(1) | | | | | | | | | | | | | | | | | | | | |
| Interest income | | $ | 164,416 | | | $ | 41,859 | | | $ | 41,484 | | | $ | 41,087 | | | $ | 39,986 | |
| Interest expense | | | 49,490 | | | | 11,305 | | | | 12,065 | | | | 13,121 | | | | 12,999 | |
| Net interest income | | | 114,926 | | | | 30,554 | | | | 29,419 | | | | 27,966 | | | | 26,987 | |
| Provision for loan losses | | | 9,861 | | | | 3,253 | | | | 2,892 | | | | 1,826 | | | | 1,890 | |
| Net income | | | 23,380 | | | | 6,324 | | | | 6,049 | | | | 5,694 | | | | 5,313 | |
| Net income per share: | | | | | | | | | | | | | | | | | | | | |
| Basic | | | 1.86 | | | | .47 | | | | .46 | | | | .46 | | | | .45 | |
| Diluted | | | 1.77 | | | | .45 | | | | .44 | | | | .45 | | | | .44 | |
| Cash dividends paid per share | | | .51 | | | | .15 | | | | .12 | | | | .12 | | | | .12 | |
| |
Year ended December 31, 2002:(2) | | | | | | | | | | | | | | | | | | | | |
| Interest income | | $ | 156,454 | | | $ | 40,176 | | | $ | 40,462 | | | $ | 38,561 | | | $ | 37,255 | |
| Interest expense | | | 55,860 | | | | 13,019 | | | | 14,269 | | | | 14,140 | | | | 14,432 | |
| Net interest income | | | 100,594 | | | | 27,157 | | | | 26,193 | | | | 24,421 | | | | 22,823 | |
| Provision for loan losses | | | 12,676 | | | | 3,984 | | | | 3,918 | | | | 2,684 | | | | 2,090 | |
| Net income | | | 16,653 | | | | 5,249 | | | | 4,447 | | | | 3,913 | | | | 3,044 | |
| Net income per share: | | | | | | | | | | | | | | | | | | | | |
| Basic | | | 1.64 | | | | .47 | | | | .42 | | | | .37 | | | | .39 | |
| Diluted | | | 1.57 | | | | .45 | | | | .40 | | | | .35 | | | | .38 | |
| Cash dividends paid per share | | | .44 | | | | .12 | | | | .12 | | | | .10 | | | | .10 | |
| (1) | | Includes Bank of Escondido (located in Escondido, California), effective October 2003. |
| |
| (2) | | Includes Bank of Las Vegas (located in Las Vegas, Nevada), effective February 2002 and Napa Community Bank (located in Napa, California), effective March 2002. |
| |
| (3) | | Includes Sunrise Bank of San Diego (located in San Diego, California), effective January 2001. |
| |
| (4) | | Includes Black Mountain Community Bank effective March 2000 (located in Henderson, Nevada), Sunrise Bank of Albuquerque effective April 2000 (located in Albuquerque, New Mexico), Arrowhead Community Bank effective September 2000 (located in Glendale, Arizona), Goshen Community Bank effective September 2000 (located in Goshen, Indiana) and Yuma Community Bank effective December 2000 (located in Yuma, Arizona). |
| |
| (5) | | Includes East Valley Community Bank effective June 1999 (located in Chandler, Arizona); Desert Community Bank (effective August 1999) and Red Rock Community Bank (effective November 1999), both located in Las Vegas, Nevada; and Elkhart Community Bank effective September 1999 (located in Elkhart, Indiana). |
| |
| (6) | | Implementation of a new accounting standard requiring the write-off of previously capitalized start-up costs resulted in a one-time charge of $197,000 (net of income tax effect) or $.03 per share effective January 1, 1999. |
2
INFORMATION REGARDING CAPITOL’S COMMON STOCK
On June 24, 2003, Capitol’s common stock began trading on the New York Stock Exchange (NYSE) under the symbol “CBC”. Capitol’s common stock was previously traded on the National Market System of The Nasdaq Stock MarketSM under the symbol “CBCL”. Market quotations regarding the range of high and low sales prices of Capitol’s common stock, which reflect inter-dealer prices without retail mark-up, mark-down or commissions, were as follows:
| | | | | | | | | | | | | | | | | |
| | | 2003
| | 2002
|
| | | Low
| | High
| | Low
| | High
|
| Quarter Ended: | | | | | | | | | | | | | | | | |
| March 31 | | $ | 19.000 | | | $ | 24.250 | | | $ | 13.300 | | | $ | 16.820 | |
| June 30 | | | 20.000 | | | | 27.880 | | | | 16.450 | | | | 23.860 | |
| September 30 | | | 23.100 | | | | 28.490 | | | | 15.810 | | | | 24.250 | |
| December 31 | | | 25.720 | | | | 30.100 | | | | 15.130 | | | | 23.780 | |
During 2003, Capitol paid cash dividends of $0.12 per share in the first, second and third quarters and $0.15 per share in the fourth quarter. In 2002, Capitol paid cash dividends of $0.10 per share in the first and second quarters and $0.12 per share in the third and fourth quarters.
As of February 12, 2004, there were 6,999 beneficial holders of Capitol’s common stock, based on information supplied to Capitol from its stock transfer agent and other sources. At that date, 14,057,998 shares of common stock were outstanding. Capitol’s stock transfer agent is UMB Bank, n.a., 928 Grand Ave., P.O. Box 410064, Kansas City, Missouri 64141-0064 (telephone 800/884-4225). The web site for UMB Bank, n.a. ishttp:\\www.umb.com.
Capitol has a Shareholder Investment Program which offers a variety of convenient features including dividend reinvestment, certain fee-free transactions, certificate safekeeping and other benefits. For a copy of the program prospectus, informational brochure and enrollment materials, contact UMB Bank, n.a. at 800/884-4225 or Capitol at 517/487-6555.
In addition to Capitol’s common stock, trust-preferred securities of Capitol Trust I (a subsidiary of Capitol) are listed on NYSE under the symbol “CBCPrA”. Those trust-preferred securities consist of 2,530,000, 8.5% cumulative preferred securities, with a liquidation amount of $10 per preferred security. The trust-preferred securities are guaranteed by Capitol and mature in 2027, are currently callable and may be extended to 2036 if certain conditions are met.
AVAILABILITY OF FORM 10-K AND CERTAIN OTHER REPORTS
A copy of Capitol’s 2003 report on Form 10-K, without exhibits, is available to holders of its common stock or trust-preferred securities without charge, upon written request. Form 10-K includes certain statistical and other information regarding Capitol and its business. Requests to obtain Form 10-K should be addressed to Investor Relations, Capitol Bancorp Limited, Capitol Bancorp Center, 200 Washington Square North, Lansing, Michigan 48933.
Form 10-K, and certain other periodic reports, are filed with the Securities and Exchange Commission (SEC). The SEC maintains an internet web site that contains reports, proxy and information statements and other information regarding companies which file electronically (which includes Capitol). The SEC’s web site address ishttp:\\www.sec.gov. Capitol’s filings with the SEC are also available at Capitol’s web site,http:\\www.capitolbancorp.com.
3
| | | |
OTHER CORPORATE INFORMATION | | |
| | | |
CORPORATE OFFICES | | |
| Capitol Bancorp Center | | 2777 East Camelback Road |
| 200 Washington Square North | | Suite 375 |
| Lansing, Michigan 48933 | | Phoenix, Arizona 85016 |
| 517/487-6555 | | 602/955-6100 |
| www.capitolbancorp.com | | www.capitolbancorp.com |
INDEPENDENT AUDITORS
BDO Seidman, LLP, Grand Rapids, Michigan
SHAREHOLDER INFORMATION
ANNUAL MEETING
Capitol’s Annual Meeting will be held on Thursday, May 6, 2004 at 4:00 p.m. at the Lansing Center, located at 333 E. Michigan Avenue, Lansing, Michigan.
COMMON STOCK TRADING INFORMATION
Capitol’s common stock trades on the New York Stock Exchange (NYSE) under the trading symbol “CBC”.
COMMON STOCK TRANSFER AGENT
UMB Bank, n.a.
928 Grand Avenue
P.O. Box 410064
Kansas City, Missouri 64141-0064
800/884-4225
SHAREHOLDER INVESTMENT PROGRAM
Capitol offers an easy and affordable way to invest in Capitol’s common stock through its Shareholder Investment Program. The program’s benefits include reinvestment of dividends in additional common stock, direct deposit of dividends, ability to purchase as little as $50 in common stock as frequently as once a month, and the option to make transfers or gifts of Capitol’s common stock to another person. Participation in the program is voluntary and all shareholders are eligible. Purchases under the program are not currently subject to any brokerage fees or commissions. For further information regarding Capitol’s Shareholder Investment Program or a copy of the program’s prospectus, informational brochure and enrollment materials, contact UMB Bank, n.a. at 800/884-4225 or Capitol at 517/487-6555.
TRUST-PREFERRED SECURITIES TRADING INFORMATION
Preferred securities of Capitol Trust I (a subsidiary of Capitol) trade on NYSE under the trading symbol “CBCPrA”.
TRUST-PREFERRED SECURITIES TRUSTEE
Bank One Investment Management Group – Chicago, Illinois
4
CAUTIONS REGARDING FORWARD-LOOKING STATEMENTS
Some of the statements contained in this annual report that are not historical facts are forward-looking statements. Those forward-looking statements, within the meaning of the Private Securities Litigation Reform Act of 1995, are subject to known and unknown risks, uncertainties and other factors which may cause the actual future results, performance or achievements of Capitol and/or its subsidiaries and other operating units to differ materially from those contemplated in such forward-looking statements. The words “intend”, “expect”, “project”, “estimate”, “predict”, “anticipate”, “should”, “will”, “may”, “believe” and similar expressions also identify forward-looking statements. Important factors which may cause actual results to differ from those contemplated in such forward-looking statements include, but are not limited to: (i) the results of Capitol’s efforts to implement its business strategy, (ii) changes in interest rates, (iii) legislation or regulatory requirements adversely impacting Capitol’s banking business and/or expansion strategy, (iv) adverse changes in business conditions or inflation, (v) general economic conditions, either nationally or regionally, which are less favorable than expected and that result in, among other things, a deterioration in credit quality and/or loan performance and collectability, (vi) competitive pressures among financial institutions, (vii) changes in securities markets, (viii) actions of competitors of Capitol’s banks and Capitol’s ability to respond to such actions, (ix) the cost of capital, which may depend in part on Capitol’s asset quality, prospects and outlook, (x) changes in governmental regulation, tax rates and similar matters, (xi) changes in management and (xii) other risks detailed in Capitol’s other filings with the Securities and Exchange Commission. If one or more of these risks or uncertainties materialize, or if underlying assumptions prove incorrect, actual outcomes may vary materially from those indicated. All subsequent written or oral forward-looking statements attributable to Capitol or persons acting on its behalf are expressly qualified in their entirety by the foregoing factors. Investors and other interested parties are cautioned not to place undue reliance on such statements, which speak as of the date of such statements. Capitol undertakes no obligation to release publicly any revisions to these forward-looking statements to reflect events or circumstances after the date of such statements or to reflect the occurrence of unanticipated events.
[The remainder of this page intentionally left blank]
5
Management’s Discussion and Analysis of Financial Condition and
Results of Operations
Preface
This section of Capitol’s annual report is a narrative which discusses, through the eyes of management, the Corporation’s results of operations, financial condition and other important matters. It is not intended to be a line-by-line review of Capitol’s financial statements, but rather a review of the most important items in the financial statements and the Corporation’s business. One critical assumption and expectation is made here, and that is that the reader has read the accompanying consolidated financial statements and footnotes.
This section of the annual report includes the use of some forward-looking statements. The accompanying consolidated financial statements are based on historical information. Forward-looking statements are those which speak to potential future events or outcomes. Those forward-looking statements are believed to be reasonably accurate as of the date this narrative was written but, obviously, future facts and circumstances will change and actual results can differ materially. Readers are cautioned about those forward-looking statements and Capitol has no obligation to update those statements at a later date.
The total assets and revenues of each bank and the consolidated totals are summarized below as of year-end 2003 and 2002 (in $1,000s):
| | | | | | | | | | | | | | | | | |
| | | Total Assets
| | Total Revenues
|
| | | 2003
| | 2002
| | 2003
| | 2002
|
| Great Lakes Region: | | | | | | | | | | | | | | | | |
| Ann Arbor Commerce Bank | | $ | 329,191 | | | $ | 309,152 | | | $ | 22,722 | | | $ | 22,890 | |
| Brighton Commerce Bank | | | 92,184 | | | | 78,382 | | | | 5,767 | | | | 5,689 | |
| Capitol National Bank | | | 221,426 | | | | 206,130 | | | | 13,220 | | | | 13,032 | |
| Detroit Commerce Bank | | | 44,954 | | | | 30,589 | | | | 2,329 | | | | 2,288 | |
| Elkhart Community Bank | | | 53,586 | | | | 53,210 | | | | 3,168 | | | | 2,934 | |
| Goshen Community Bank | | | 46,751 | | | | 38,115 | | | | 2,943 | | | | 2,305 | |
| Grand Haven Bank | | | 122,076 | | | | 123,505 | | | | 9,346 | | | | 9,226 | |
| Kent Commerce Bank | | | 81,437 | | | | 73,801 | | | | 5,439 | | | | 5,797 | |
| Macomb Community Bank | | | 86,001 | | | | 87,050 | | | | 5,702 | | | | 5,812 | |
| Muskegon Commerce Bank | | | 85,908 | | | | 86,465 | | | | 6,255 | | | | 6,538 | |
| Oakland Commerce Bank | | | 120,059 | | | | 115,916 | | | | 7,848 | | | | 7,568 | |
| Paragon Bank & Trust | | | 104,602 | | | | 103,044 | | | | 8,238 | | | | 8,292 | |
| Portage Commerce Bank | | | 161,028 | | | | 139,068 | | | | 10,599 | | | | 10,499 | |
| | | |
| | | |
| | | |
| | | |
| |
| Great Lakes Region Total | | | 1,549,203 | | | | 1,444,427 | | | | 103,576 | | | | 102,870 | |
| Southwest Region: | | | | | | | | | | | | | | | | |
| Arrowhead Community Bank | | | 56,192 | | | | 47,427 | | | | 4,135 | | | | 3,500 | |
| Bank of Las Vegas | | | 35,374 | | | | 26,880 | | | | 2,005 | | | | 1,157 | |
| Bank of Tucson | | | 157,717 | | | | 132,094 | | | | 9,582 | | | | 9,907 | |
| Black Mountain Community Bank | | | 83,760 | | | | 63,202 | | | | 4,849 | | | | 4,004 | |
| Camelback Community Bank | | | 81,649 | | | | 82,387 | | | | 5,736 | | | | 6,052 | |
| Desert Community Bank | | | 61,537 | | | | 55,170 | | | | 3,761 | | | | 4,183 | |
| East Valley Community Bank | | | 43,925 | | | | 37,640 | | | | 2,868 | | | | 2,765 | |
| Mesa Bank | | | 70,308 | | | | 66,312 | | | | 5,549 | | | | 5,036 | |
| Red Rock Community Bank | | | 104,944 | | | | 96,906 | | | | 6,817 | | | | 6,829 | |
| Southern Arizona Community Bank | | | 84,374 | | | | 75,253 | | | | 5,370 | | | | 5,011 | |
| Sunrise Bank of Albuquerque | | | 66,359 | | | | 46,898 | | | | 4,511 | | | | 2,840 | |
| Sunrise Bank of Arizona | | | 126,114 | | | | 82,126 | | | | 10,605 | | | | 6,526 | |
| Valley First Community Bank | | | 47,069 | | | | 42,127 | | | | 3,032 | | | | 3,573 | |
| Yuma Community Bank | | | 46,143 | | | | 38,214 | | | | 3,297 | | | | 2,623 | |
| | | |
| | | |
| | | |
| | | |
| |
| Southwest Region Total | | | 1,065,465 | | | | 892,636 | | | | 72,117 | | | | 64,006 | |
| California Region: | | | | | | | | | | | | | | | | |
| Bank of Escondido | | | 26,843 | | | | | | | | 136 | | | | | |
| Napa Community Bank | | | 53,509 | | | | 36,042 | | | | 2,808 | | | | 1,241 | |
| Sunrise Bank of San Diego | | | 67,235 | | | | 50,450 | | | | 4,431 | | | | 3,977 | |
| | | |
| | | |
| | | |
| | | |
| |
| California Region Total | | | 147,587 | | | | 86,492 | | | | 7,375 | | | | 5,218 | |
| Other, net | | | (25,193 | ) | | | (14,267 | ) | | | 1,435 | | | | (658 | ) |
| | | |
| | | |
| | | |
| | | |
| |
| Consolidated totals | | $ | 2,737,062 | | | $ | 2,409,288 | | | $ | 184,503 | | | $ | 171,436 | |
| | | |
| | | |
| | | |
| | | |
| |
6
Capitol Bancorp and its Banking Business
Capitol considers itself to be the most unique company in the banking business in the United States today. In legal structure, Capitol is a bank-holding company (which means it has banks as subsidiaries). Capitol defines itself as abank developmentcompany. What sets Capitol apart from other bank-holding companies is its focus on bank development as an exclusive business and a finely-tuned community bank model in an environment when other bank-holding companies have focused on branch banking. Big banks focus on transaction volume. Capitol’s banks are small and focus on relationships.
At December 31, 2003, Capitol’s banking network consisted of 30 separately-chartered community banks. All of those banks have different names, typically directly associated with their individual communities. Locally, those banks have a minimally visible identity with Capitol. The banks’ individual focus is on their community, their customers, their business and financial performance. Each bank has its own board of directors, comprised of business leaders and other professionals drawn from that bank’s community. Each bank has full, local decision-making authority in all matters affecting the customer both in lending and deposit transactions.
Capitol’s role with its banks is as investor, mentor and back-office service provider. As investor, Capitol closely monitors the financial performance of its bank subsidiaries, providing assistance and guidance when and where necessary to enhance bank performance. Capitol’s mentoring role is most active in its youngest affiliates where guidance is needed through the banks’ early formative stages. Capitol provides efficient back-office services to all of its banks, in the following areas which can be done centrally and do not involve a direct interface with the bank customer:
| | • | | Accounting |
| |
| | • | | Data processing |
| |
| | • | | Human resources administration |
| |
| | • | | Legal support |
| |
| | • | | Internal audit |
| |
| | • | | Risk management |
| |
| | • | | Credit administration |
| |
| | • | | Capital adequacy |
Capitol has an especially unique approach to the formation ofde novo, or new, banks. When forming a start-up bank, Capitol invests at least 51% of the initial capital and the remainder of the capital is raised in the community where thede novobank will be located. Typically, this involves about 150 local investors. Not surprisingly, those investors become early customers of the bank when it opens and, as they tell their friends and associates about the new bank, they refer additional customers to the new bank. When the bank nears its third anniversary of operation, Capitol may offer an ‘exit opportunity’ regarding the shares of the bank not owned by Capitol, to exchange those shares for Capitol’s common stock at a premium, usually at about 50% over the book value of the bank stock. When Capitol has made these share exchange proposals, which are always subject to the approval of those minority shareholders, they have been overwhelmingly approved.
7
Highlights of 2003
2003 was another record year for Capitol Bancorp. Earnings for the year exceeded $23 million. By the close of the third quarter of the year, 2003 earnings had exceeded the $17 million record earnings for 2002. 2003 earnings surpassed 2002 by 40%. Earnings per share increased 13% for 2003, while the Corporation’s share base increased 24%.
2003 also recorded some very significant changes within the Capitol family:
| | • | | An increase of $100 million in the Corporation’s total capital. |
| |
| | • | | Eight of Capitol’s banks became wholly-owned during the year, through share-exchange transactions. |
| |
| | • | | An increase in the Corporation’s quarterly cash dividend to $.15 per share. |
| |
| | • | | Formation of a new and unique bank development unit, Capitol Development Bancorp Limited 1, to foster additionalde novobank formation and potential acquisitions. |
| |
| | • | | Announcement of a potential North Carolina bank acquisition. |
Total consolidated assets approximated $2.7 billion at December 31, 2003, an increase of about $328 million or 14% for the year. Capitol’s largest single asset, loans, exceeded $2 billion for the first time in the Corporation’s history. Capitol continued to maintain a strong allowance for loan losses which, at December 31, 2003, approximated 1.40% of portfolio loans. Nonperforming loans increased marginally, compared to year-end 2002. Net loan charge-offs, as a percentage of average loans, decreased slightly in 2003.
Critical Accounting Policies Affecting Capitol’s Financial Statements
Note B of the notes to the consolidated financial statements is captionedSignificant Accounting Policies. That footnote spans several pages and at least 15 topics, all of which are deemed significant and required disclosures under generally accepted accounting principles (GAAP). For purposes of this narrative, current SEC guidance suggests the selection of two or three of those, for discussion, as “critical accounting policies”. The selection of which two or three will differ from company to company, even within a common industry, such as banking. Capitol considers its critical accounting policies to include the following:
Use of estimates in determining the allowance for loan losses. Bank regulatory agencies, accounting standard setters and the SEC have all issued commentary, guidance and a variety of rule-making on how financial institutions are to determine the amount of their allowance for loan losses. Determining the allowance is really a process and methodology which is inherently judgmental in how and when to recognize and record a loss reserve for loans. It is not a process or methodology which can be merely reduced to a strict absolute computation, like a mathematical formula to compute taxes. The process and methodology will differ from one company to another and there is no ‘one size fits all’ format or approach to loss reserving. All of Capitol’s banks use a consistent computational template to determine their respective allowances for loan losses. Management believes its process and methodology for determining the allowance for loan losses is appropriate and adequate to properly estimate losses inherent in the loan portfolio at the balance-sheet date; however, actual future losses will differ from amounts considered in the allowance methodology. Further, bank regulatory agencies may have differing perspectives on the process, methodology and adequacy of the allowance for loan losses when examining the banks. At
8
December 31, 2003, Capitol’s allowance for loan losses approximated 1.40% of portfolio loans outstanding. Based on portfolio loans outstanding at that date, any 1 basis-point (.01%) change in the allowance would have an approximate $225,000 impact on the allowance for loan losses and income before income taxes.
Accounting for goodwill and other intangibles.At December 31, 2003, Capitol has $34.4 million of goodwill and other intangibles on its balance sheet, which consists principally of goodwill. Goodwill arises in acquisition accounting. In Capitol’s transactions, most of this goodwill is the premium which relates to the share exchange transactions when Capitol has issued its shares of common stock at a modest premium (usually around 50%) over the book value of the minority interest of a subsidiary bank’s shares. Up to 2002, Capitol’s goodwill was amortized over an estimated useful life of generally 15 years. Effective at the beginning of 2002, a new accounting rule stopped the amortization of goodwill and, instead, requires a periodic review of goodwill for potential impairment. If any amount of the goodwill is deemed to be impaired, such amount is to be written off in the period the determination is made. This is an area involving significant judgement. Based on management’s review, no amount of goodwill was deemed to be impaired at December 31, 2003.
Classification of trust-preferred securities.Capitol has $93.3 million of trust-preferred securities outstanding at December 31, 2003. These are a hybrid debt security with a maturity of 30 years (from the date of issue), are issued by trusts which are wholly-owned by Capitol, consolidated with Capitol for financial reporting purposes and are classified as debt obligations on Capitol’s consolidated balance sheet. One of the key features of these securities is that they are considered, for regulatory purposes, as an element of capital. In 2003 an accounting rule interpretation was issued which requires ‘deconsolidation’ of the trusts related to those securities from Capitol’s balance sheet in 2004. Deconsolidation of the trusts will have virtually no effect on Capitol’s consolidated financial statements. This is because, while the trusts will no longer be consolidated, the underlying subordinated debentures will be reported as debt obligations on Capitol’s consolidated balance sheet. It is unclear what effect, if any, such deconsolidation may have on the current capital treatment of those securities by the Federal Reserve Board. When this narrative was written, it was management’s understanding that the staff of the Federal Reserve was reviewing this issue, but no clarification guidance had been issued. It is possible that the Federal Reserve Board may ‘grandfather’ certain trust- preferred securities for capital purposes; however, there is no assurance that may occur. Exclusion of trust-preferred securities or the underlying subordinated debentures from Capitol’s regulatory capital computations would have a materially adverse effect on meeting certain of the related ratio requirements.
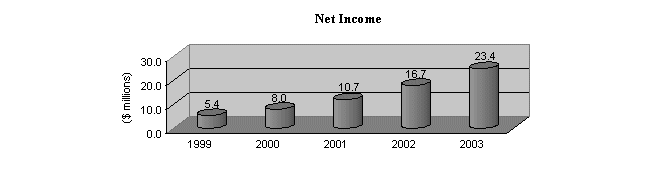
Capitol’s Results of Operations
As stated previously, 2003 was another record year of earnings for Capitol with net income of $23.4 million, a 40.4% increase over the $16.7 million earned in 2002. 2002’s net income was a 55.4% increase over the $10.7 million earned in 2001. 2001’s earnings exceeded the preceding year by 33.4%. For each of these years, the percentage increase in the amount of earnings per share was less than the increase in the amount of earnings due to growth in the Corporation’s share base, primarily due to share exchange transactions with minority owners of some of its affiliate banks.
9
The following table summarizes for each of the banks, and on a consolidated basis, net income and the related rates of return on average equity and assets, where applicable (in $1,000s):
| | | | | | | | | | | | | | | | | | | | | | | | | | | | | | | | | | | | | |
| | | Net Income
| | Return on Average Equity
| | Return on Average Assets
|
| | | 2003
| | 2002
| | 2001
| | 2003
| | 2002
| | 2001
| | 2003
| | 2002
| | 2001
|
| Great Lakes Region: | | | | | | | | | | | | | | | | | | | | | | | | | | | | | | | | | | | | |
| Ann Arbor Commerce Bank | | $ | 4,800 | | | $ | 5,022 | | | $ | 4,200 | | | | 19.45 | % | | | 22.40 | % | | | 22.02 | % | | | 1.52 | % | | | 1.72 | % | | | 1.64 | % |
| Brighton Commerce Bank | | | 1,104 | | | | 973 | | | | 597 | | | | 15.28 | % | | | 15.26 | % | | | 10.55 | % | | | 1.29 | % | | | 1.28 | % | | | 0.90 | % |
| Capitol National Bank | | | 3,575 | | | | 3,176 | | | | 2,647 | | | | 22.84 | % | | | 22.68 | % | | | 22.04 | % | | | 1.71 | % | | | 1.69 | % | | | 1.66 | % |
| Detroit Commerce Bank | | | (440 | ) | | | (517 | ) | | | (187 | ) | | | | | | | | | | | | | | | | | | | | | | | | |
| Elkhart Community Bank | | | 422 | | | | 257 | | | | 14 | | | | 7.33 | % | | | 5.48 | % | | | 0.30 | % | | | 0.61 | % | | | 0.61 | % | | | 0.04 | % |
| Goshen Community Bank | | | 386 | | | | 125 | | | | (413 | ) | | | 8.18 | % | | | 2.83 | % | | | | | | | 0.91 | % | | | 0.36 | % | | | | |
| Grand Haven Bank | | | 1,670 | | | | 1,924 | | | | 1,060 | | | | 15.43 | % | | | 20.51 | % | | | 15.39 | % | | | 1.29 | % | | | 1.67 | % | | | 1.21 | % |
| Kent Commerce Bank | | | 821 | | | | 992 | | | | 113 | | | | 10.28 | % | | | 13.72 | % | | | 2.03 | % | | | 1.06 | % | | | 1.33 | % | | | 0.20 | % |
| Macomb Community Bank | | | 262 | | | | 530 | | | | 1,145 | | | | 2.91 | % | | | 5.47 | % | | | 12.33 | % | | | 0.29 | % | | | 0.60 | % | | | 1.08 | % |
| Muskegon Commerce Bank | | | 1,427 | | | | 1,472 | | | | 816 | | | | 16.38 | % | | | 18.68 | % | | | 12.73 | % | | | 1.68 | % | | | 1.83 | % | | | 1.17 | % |
| Oakland Commerce Bank | | | 1,439 | | | | 1,414 | | | | 1,328 | | | | 15.14 | % | | | 16.01 | % | | | 16.62 | % | | | 1.16 | % | | | 1.32 | % | | | 1.27 | % |
| Paragon Bank & Trust | | | 891 | | | | 771 | | | | 231 | | | | 8.36 | % | | | 8.04 | % | | | 3.23 | % | | | 0.84 | % | | | 0.77 | % | | | 0.26 | % |
| Portage Commerce Bank | | | 2,393 | | | | 2,005 | | | | 1,556 | | | | 20.78 | % | | | 18.69 | % | | | 15.62 | % | | | 1.63 | % | | | 1.49 | % | | | 1.21 | % |
| | | |
| | | |
| | | |
| | | | | | | | | | | | | | | | | | | | | | | | | |
| Great Lakes Region Total | | | 18,750 | | | | 18,144 | | | | 13,107 | | | | | | | | | | | | | | | | | | | | | | | | | |
| Southwest Region: | | | | | | | | | | | | | | | | | | | | | | | | | | | | | | | | | | | | |
| Arrowhead Community Bank | | | 442 | | | | 117 | | | | (386 | ) | | | 9.77 | % | | | 2.70 | % | | | | | | | 0.85 | % | | | 0.27 | % | | | | |
| Bank of Las Vegas | | | (8 | ) | | | (611 | ) | | | | | | | | | | | | | | | | | | | | | | | | | | | | |
| Bank of Tucson | | | 2,776 | | | | 2,312 | | | | 2,095 | | | | 25.27 | % | | | 21.87 | % | | | 22.64 | % | | | 1.93 | % | | | 1.99 | % | | | 1.89 | % |
| Black Mountain Community Bank | | | 914 | | | | 439 | | | | 12 | | | | 14.23 | % | | | 9.26 | % | | | 0.27 | % | | | 1.32 | % | | | 0.81 | % | | | 0.03 | % |
| Camelback Community Bank | | | 567 | | | | 714 | | | | 534 | | | | 6.73 | % | | | 9.74 | % | | | 10.80 | % | | | 0.65 | % | | | 0.90 | % | | | 0.93 | % |
| Desert Community Bank | | | 389 | | | | 209 | | | | 35 | | | | 6.39 | % | | | 4.16 | % | | | 0.76 | % | | | 0.68 | % | | | 0.35 | % | | | 0.07 | % |
| East Valley Community Bank | | | (279 | ) | | | (336 | ) | | | 18 | | | | | | | | | | | | 0.58 | % | | | | | | | | | | | 0.05 | % |
| Mesa Bank | | | 1,366 | | | | 848 | | | | 386 | | | | 19.48 | % | | | 14.51 | % | | | 8.53 | % | | | 1.98 | % | | | 1.44 | % | | | 0.87 | % |
| Red Rock Community Bank | | | (69 | ) | | | 243 | | | | 635 | | | | | | | | 2.71 | % | | | 7.64 | % | | | | | | | 0.26 | % | | | 0.96 | % |
| Southern Arizona Community Bank | | | 1,152 | | | | 668 | | | | 320 | | | | 15.60 | % | | | 10.67 | % | | | 7.42 | % | | | 1.35 | % | | | 0.94 | % | | | 0.67 | % |
| Sunrise Bank of Albuquerque | | | 664 | | | | (40 | ) | | | 28 | | | | 15.45 | % | | | | | | | 0.77 | % | | | 1.14 | % | | | | | | | 0.09 | % |
| Sunrise Bank of Arizona | | | 1,138 | | | | (194 | ) | | | 830 | | | | 15.61 | % | | | | | | | 15.24 | % | | | 1.15 | % | | | | | | | 1.27 | % |
| Valley First Community Bank | | | 282 | | | | 113 | | | | 328 | | | | 4.85 | % | | | 1.99 | % | | | 5.94 | % | | | 0.64 | % | | | 0.23 | % | | | 0.61 | % |
| Yuma Community Bank | | | 473 | | | | 147 | | | | (438 | ) | | | 11.96 | % | | | 4.05 | % | | | | | | | 1.11 | % | | | 0.43 | % | | | | |
| | | |
| | | |
| | | |
| | | | | | | | | | | | | | | | | | | | | | | | | |
| Southwest Region Total | | | 9,807 | | | | 4,629 | | | | 4,397 | | | | | | | | | | | | | | | | | | | | | | | | | |
| California Region: | | | | | | | | | | | | | | | | | | | | | | | | | | | | | | | | | | | | |
| Bank of Escondido | | | (491 | ) | | | | | | | | | | | | | | | | | | | | | | | | | | | | | | | | |
| Napa Community Bank | | | 290 | | | | (609 | ) | | | | | | | 3.64 | % | | | | | | | | | | | 0.64 | % | | | | | | | | |
| Sunrise Bank of San Diego | | | 498 | | | | 342 | | | | (806 | ) | | | 6.40 | % | | | 4.53 | % | | | | | | | 0.85 | % | | | 0.68 | % | | | | |
| | | |
| | | |
| | | |
| | | | | | | | | | | | | | | | | | | | | | | | | |
| California Region Total | | | 297 | | | | (267 | ) | | | (806 | ) | | | | | | | | | | | | | | | | | | | | | | | | |
| Other, net | | | (5,474 | ) | | | (5,853 | ) | | | (5,980 | ) | | | | | | | | | | | | | | | | | | | | | | | | |
| | | |
| | | |
| | | |
| | | |
| | | |
| | | |
| | | |
| | | |
| | | |
| |
| Consolidated totals | | $ | 23,380 | | | $ | 16,653 | | | $ | 10,718 | | | | 12.97 | % | | | 13.33 | % | | | 15.22 | % | | | 0.91 | % | | | 0.75 | % | | | 0.58 | % |
| | | |
| | | |
| | | |
| | | |
| | | |
| | | |
| | | |
| | | |
| | | |
| |
10
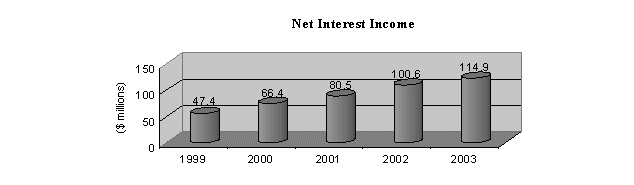
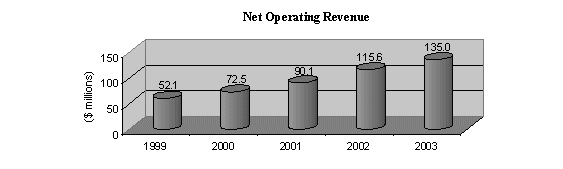
The principal revenue source for the Corporation’s banks is interest income from loans. Total interest income or total interest expense is of little significance individually. Net interest income is the total of all interest income minus all interest expense. This is an important measure that is used to help determine the amount of net operating revenues for financial institutions. Net operating revenue is the sum of net interest income and noninterest income.
Net interest income totaled $114.9 million in 2003, a 14.2% increase over the $100.6 million reported in 2002. This increase is a combination of several factors. In total, net interest income increased $14.3 million, which was comprised of an increase in interest income of about $8 million and a decrease in interest expense of about $6.4 million. These variances can be analyzed further in terms of their association with changes in interest rates versus changes in volume of the interest-bearing asset or liability. For example, the net increase in interest income is the result of approximately $18.9 million of additional interest income from higher levels of loans outstanding in 2003 (i.e., volume), but that increase was offset by $11.0 million in lower levels of interest income due to decreased rates as loans repriced or were refinanced at lower rates in 2003. Most of the decrease in interest expense in 2003 is associated with lower rates paid on time deposits.
Net interest income increased about $20 million in 2002. Most of that net increase came from decreased interest expense, primarily associated with lowered interest rates on deposits. In 2002, the net change in interest income compared to 2001 was small, which was the result of income growth coming from loan portfolio growth largely offset by lower interest rates during that period.
With the addition of noninterest income, total net operating revenue approximated $135.0 million in 2003, $115.6 million in 2002 and $90.1 million in 2001. Noninterest income for these periods was $20.1 million, $15.0 million and $9.6 million, respectively.
11
Noninterest income has increased significantly in each of these periods largely as the result of fees from the origination of non-portfolio residential mortgage loans. In 2000, this revenue source was $1.5 million. In 2003, 2002 and 2001, this revenue amounted to $8.7 million, $6.8 million and $3.2 million, respectively. A very substantial portion of this mortgage fee revenue has been derived from mortgage refinancing activity, during periods of record-low interest rates. The future of interest rates is uncertain and it is reasonable to expect that this revenue source may decrease, perhaps materially, if there are adverse changes in mortgage interest rates or other unfavorable conditions impacting the residential housing market.
Other noninterest income increased from $1.7 million in 2002 to $4.4 million in 2003. Of this increase, $1.9 million relates to income associated with Capitol’s mortgage banking affiliate, Amera Mortgage Corporation. The 2003 income from Amera is not expected to continue at that level in the future due to a reduction in residential mortgage refinancing activity.
The provision for loan losses approximated $9.9 million, $12.7 million and $8.2 million in 2003, 2002 and 2001, respectively. The amount of the provision for loan losses is determined based on management’s analysis of amounts necessary for the allowance for loan losses; this is discussed in greater detail later in theFinancial Positionsection of this narrative.
Noninterest expense totaled $88.1 million, $77.2 million and $64.1 million in 2003, 2002 and 2001, respectively. In total, these expenses increased 14.2% in 2003, 20.3% in 2002 and 21.4% in 2001. The lower rate of increase in 2003 is the result of a slower pace of adding new banks (only one new bank was added during the year). Increases in the components of noninterest expense are primarily associated with added staffing and other costs associated with growing young banks and adding new banks.
The Corporation’s effective tax rate was 35.5% in 2003, 34.3% in 2002 and 35.2% in 2001. The statutory federal income tax rate applicable to Capitol is currently 35%. The effective tax rate was less than the statutory rate in 2002 due to the revaluation of deferred tax assets to reflect the 35% effective tax rate.
Capitol’s Financial Position
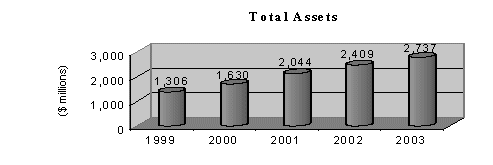
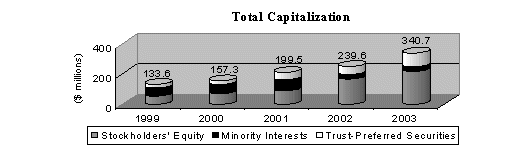
Capitol completed 2003, as in years past, with a very strong financial position. Total assets grew to $2.7 billion, from $2.4 million at the end of 2002 and just over $2 billion at the beginning of 2002. Key to the balance-sheet strength of Capitol is its liquidity (cash and cash equivalents of $283.6 million or 10.4% of total assets) and its total capital position (trust-preferred securities, minority interests in consolidated subsidiaries and stockholders’ equity approximating $340.7 million or 12.4% of total assets) at December 31, 2003. Both of those key elements are discussed in the next section,Liquidity and Capital Resources.
12
When looking at Capitol’s financial position, as shown in its consolidated balance sheet, it is clear that the single largest asset category is portfolio loans, and that is what most of this section of this narrative will discuss.
There are other asset categories, such as loans held for resale ($43.0 million and $75.4 million at December 31, 2003 and 2002, respectively). Those are loans which are presold to the secondary market (mainly home mortgages) that generally are collected in 30-60 days. There is also a modest amount of investment securities on the balance sheet ($93.2 million and $34.1 million at December 31, 2003 and 2002, respectively). All other asset categories are individually less than $35 million at December 31, 2003 and 2002.
Net portfolio loans (total portfolio loans minus the allowance for loan losses) approximated $2.2 billion at December 31, 2003 and $2.0 billion at December 31, 2002. These amounts approximate 81% of total consolidated assets at both balance-sheet dates.
The banks emphasize commercial loans, consistent with their focus on lending to local entrepreneurs, professionals and other businesses. All of Capitol’s banks use an enterprise-wide credit policy; however, as emphasized earlier, all credit decisions are made at the local level at each community bank. The utilization of a consistent enterprise-wide credit policy has several key benefits to Capitol and its banks, such as procedural guidance for:
| | • | | Loan underwriting and documentation. |
| |
| | • | | Credit granting authorities within the bank. |
| |
| | • | | Acceptable collateral and loan structuring. |
| |
| | • | | Loan participations when proposals exceed individual bank limitations. |
| |
| | • | | Collections and workouts. |
| |
| | • | | Evaluating and documenting the adequacy of the allowance for loan losses. |
| |
| | • | | Establishing corporate credit administration resources to aid the banks when needed. |
13
As part of the banks’ emphasis on commercial lending, commercial real estate is frequently sought as the primary source of collateral for commercial loans. This emphasis on use of commercial real estate as collateral has been a consistent practice of Capitol and its banks from their earliest days of operation, based on the use of conservative loan-to-value ratios, avoidance of aggressively over-leveraged real estate development projects and that, even in soft economies, commercial real estate has tended to have substantially less loss potential than other types of business-asset collateral, such as receivables and inventory.
A downside aspect of commercial real estate as a primary source of collateral for commercial loans is that when some commercial loans develop performance difficulties and reach nonperforming status (i.e., becoming 90 days past due or being placed on nonaccrual status), the resolution period is longer because the real estate security will inevitably take an extended period to liquidate. In contrast, a commercial loan secured by receivables and inventory which becomes nonperforming tends to have a higher loss potential because little collateral value is left by the time it reaches that status.
Nonperforming loans approximated $26.9 million and $22.9 million at December 31, 2003 and 2002, respectively. Such amounts approximated 1.20% and 1.15% of portfolio loans and 0.98% and 0.95% of total assets, respectfully. Of the nonperforming loans at December 31, 2003, about 60% were real-estate secured. Management believes that nonperforming loans have been properly considered in its evaluation of the adequacy of the allowance for loan losses, which is discussed later in this narrative.
In addition to the identification of nonperforming loans involving borrowers with payment performance difficulties (i.e., nonaccrual loans and loans past-due 90 days or more), management utilizes an internal loan review process to identify other potential problem loans which may warrant additional monitoring or other attention. This loan review process is a continuous activity which periodically updates internal loan classifications. At inception, all loans are individually assigned a classification which grade the credits on a risk basis, based on the type and discounted value of collateral, financial strength of the borrower and guarantors and other factors such as nature of the borrowers’ business climate, local economic conditions and other subjective factors. The loan classification process is fluid and subjective.
Potential problem loans include loans which are generally performing as agreed; however, because of loan review’s and/or lending staff’s risk assessment, increased monitoring is deemed appropriate. In addition, some loans are identified for monitoring because of specific performance issues or other risk factors requiring closer management and development of specific remedial action plans.
14
At December 31, 2003, potential problem loans (including nonperforming loans) approximated $113 million or about 5% of total consolidated portfolio loans. Such totals typically approximate 4% to 5% of loans outstanding and are an important part of management’s ongoing and augmented loan review activities which are designed to early-identify loans which warrant close monitoring at the bank and corporate credit-administration levels. It is important to note that these potential problem loans do not necessarily have significant loss exposure (nor are they necessarily deemed ‘impaired’), but rather are identified by management in this manner to aid in loan administration and risk management. Management believes these loans to be adequately considered in its evaluation of the adequacy of the allowance for loan losses.
As was noted in theCritical Accounting Policiessection of this narrative, the discussion regarding use of estimates in determining the allowance for loan losses is very important to an understanding of Capitol’s consolidated financial statements. Simply stated, the allowance for loan losses is management’s estimate of loan losses inherent in the loan portfolio at the balance-sheet date. The allowance for loan losses is increased by provisions for loan losses which are charged against operations and reduced by loan write-offs which are charged against the allowance. There are many ways to estimate losses or ‘loss reserves’ and, arguably, there is no one ‘right’ way.
Capitol currently has 30 separately chartered banks. Each bank separately documents the adequacy of its respective allowance for loan losses. As mentioned earlier, Capitol has a uniform, enterprise-wide credit policy which, among other things, provides the banks guidance on evaluating and documenting the adequacy of the allowance for loan losses. Essentially, a standardized computational template is used consistently for all of Capitol’s banks. The template factors in allowance elements for all portfolio loan categories for performing loans, nonperforming loans, watch credits and environmental factors. While a standardized template is utilized, no computational methodology relieves management from applying judgment in determining the amount of the allowance needed at the bank level. Further, the combined results of the banks’ separate analyses are evaluated at the Capitol, or parent, level on a judgmental basis. The process used to evaluate and determine the adequacy of the allowance for loan losses is labor intensive and requires significant judgment.
[The remainder of this page intentionally left blank]
15
The following table summarizes portfolio loans, the allowance for loan losses and nonperforming loans for each of the banks, and on a consolidated basis:
| | | | | | | | | | | | | | | | | | | | | | | | | | | | | | | | | | | | | | | | | |
| | | | | | | | | | | | | | | Allowance as a | | | | | | | | |
| | | | | | | | | | | Allowance for | | Nonperforming | | % of Total | | | | | | | | |
| | | Total Portfolio Loans
| | Loan Losses
| | Loans
| | Portfolio Loans
| | | | | | | | |
| | | 2003
| | 2002
| | 2003
| | 2002
| | 2003
| | 2002
| | 2003
| | 2002
| | | | | | | | |
| Great Lakes Region: | | | | | | | | | | | | | | | | | | | | | | | | | | | | | | | | | | | | | | | | |
| Ann Arbor Commerce Bank | | $ | 287,766 | | | $ | 272,604 | | | $ | 3,912 | | | $ | 3,840 | | | $ | 2,926 | | | $ | 2,624 | | | | 1.36 | % | | | 1.41 | % | | | | | | | | |
| Brighton Commerce Bank | | | 79,554 | | | | 68,239 | | | | 795 | | | | 851 | | | | 1,000 | | | | 170 | | | | 1.00 | % | | | 1.25 | % | | | | | | | | |
| Capitol National Bank | | | 177,599 | | | | 158,651 | | | | 2,211 | | | | 2,322 | | | | 1,440 | | | | 1,753 | | | | 1.24 | % | | | 1.46 | % | | | | | | | | |
| Detroit Commerce Bank | | | 38,363 | | | | 26,799 | | | | 595 | | | | 627 | | | | 633 | | | | 751 | | | | 1.55 | % | | | 2.34 | % | | | | | | | | |
| Elkhart Community Bank | | | 48,388 | | | | 43,277 | | | | 616 | | | | 658 | | | | 89 | | | | 245 | | | | 1.27 | % | | | 1.52 | % | | | | | | | | |
| Goshen Community Bank | | | 39,810 | | | | 35,408 | | | | 578 | | | | 532 | | | | 101 | | | | | | | | 1.45 | % | | | 1.50 | % | | | | | | | | |
| Grand Haven Bank | | | 101,645 | | | | 114,616 | | | | 1,887 | | | | 1,626 | | | | 3,178 | | | | 1,605 | | | | 1.86 | % | | | 1.42 | % | | | | | | | | |
| Kent Commerce Bank | | | 76,093 | | | | 68,848 | | | | 829 | | | | 830 | | | | 651 | | | | 293 | | | | 1.09 | % | | | 1.21 | % | | | | | | | | |
| Macomb Community Bank | | | 81,776 | | | | 73,915 | | | | 1,102 | | | | 1,136 | | | | 1,973 | | | | 3,012 | | | | 1.35 | % | | | 1.54 | % | | | | | | | | |
| Muskegon Commerce Bank | | | 79,223 | | | | 77,247 | | | | 1,026 | | | | 966 | | | | 2,677 | | | | 1,806 | | | | 1.30 | % | | | 1.25 | % | | | | | | | | |
| Oakland Commerce Bank | | | 93,920 | | | | 86,049 | | | | 1,459 | | | | 1,119 | | | | 3,022 | | | | 1,805 | | | | 1.55 | % | | | 1.30 | % | | | | | | | | |
| Paragon Bank & Trust | | | 89,499 | | | | 86,571 | | | | 1,365 | | | | 1,291 | | | | 1,446 | | | | 2,628 | | | | 1.53 | % | | | 1.49 | % | | | | | | | | |
| Portage Commerce Bank | | | 150,783 | | | | 129,710 | | | | 1,915 | | | | 1,815 | | | | 2,746 | | | | 3,135 | | | | 1.27 | % | | | 1.40 | % | | | | | | | | |
| | | |
| | | |
| | | |
| | | |
| | | |
| | | |
| | | | | | | | | | | | | | | | | |
| Great Lakes Region Total | | | 1,344,419 | | | | 1,241,934 | | | | 18,290 | | | | 17,613 | | | | 21,882 | | | | 19,827 | | | | | | | | | | | | | | | | | |
| Southwest Region: | | | | | | | | | | | | | | | | | | | | | | | | | | | | | | | | | | | | | | | | |
| Arrowhead Community Bank | | | 46,135 | | | | 36,185 | | | | 527 | | | | 543 | | | | | | | | | | | | 1.14 | % | | | 1.50 | % | | | | | | | | |
| Bank of Las Vegas | | | 27,398 | | | | 19,404 | | | | 337 | | | | 292 | | | | | | | | | | | | 1.23 | % | | | 1.50 | % | | | | | | | | |
| Bank of Tucson | | | 102,244 | | | | 90,176 | | | | 1,149 | | | | 1,461 | | | | | | | | 187 | | | | 1.12 | % | | | 1.62 | % | | | | | | | | |
| Black Mountain Community Bank | | | 63,184 | | | | 52,240 | | | | 725 | | | | 784 | | | | 571 | | | | 324 | | | | 1.15 | % | | | 1.50 | % | | | | | | | | |
| Camelback Community Bank | | | 66,260 | | | | 63,516 | | | | 882 | | | | 960 | | | | 140 | | | | 232 | | | | 1.33 | % | | | 1.51 | % | | | | | | | | |
| Desert Community Bank | | | 42,543 | | | | 43,351 | | | | 626 | | | | 675 | | | | 675 | | | | 734 | | | | 1.47 | % | | | 1.56 | % | | | | | | | | |
| East Valley Community Bank | | | 31,916 | | | | 25,932 | | | | 440 | | | | 389 | | | | 10 | | | | 17 | | | | 1.38 | % | | | 1.50 | % | | | | | | | | |
| Mesa Bank | | | 61,714 | | | | 55,588 | | | | 664 | | | | 834 | | | | 375 | | | | 242 | | | | 1.08 | % | | | 1.50 | % | | | | | | | | |
| Red Rock Community Bank | | | 71,138 | | | | 80,152 | | | | 1,812 | | | | 1,203 | | | | 2,613 | | | | 861 | | | | 2.55 | % | | | 1.50 | % | | | | | | | | |
| Southern Arizona Community Bank | | | 69,965 | | | | 60,913 | | | | 767 | | | | 914 | | | | | | | | | | | | 1.10 | % | | | 1.50 | % | | | | | | | | |
| Sunrise Bank of Albuquerque | | | 54,078 | | | | 38,577 | | | | 593 | | | | 521 | | | | 14 | | | | | | | | 1.10 | % | | | 1.35 | % | | | | | | | | |
| Sunrise Bank of Arizona | | | 111,148 | | | | 65,195 | | | | 1,337 | | | | 881 | | | | 59 | | | | 205 | | | | 1.20 | % | | | 1.35 | % | | | | | | | | |
| Valley First Community Bank | | | 34,769 | | | | 29,075 | | | | 491 | | | | 620 | | | | | | | | 261 | | | | 1.41 | % | | | 2.13 | % | | | | | | | | |
| Yuma Community Bank | | | 31,409 | | | | 25,485 | | | | 437 | | | | 383 | | | | | | | | | | | | 1.39 | % | | | 1.50 | % | | | | | | | | |
| | | |
| | | |
| | | |
| | | |
| | | |
| | | |
| | | | | | | | | | | | | | | | | |
| Southwest Region Total | | | 813,901 | | | | 685,789 | | | | 10,787 | | | | 10,460 | | | | 4,457 | | | | 3,063 | | | | | | | | | | | | | | | | | |
| California Region: | | | | | | | | | | | | | | | | | | | | | | | | | | | | | | | | | | | | | | | | |
| Bank of Escondido | | | 9,273 | | | | | | | | 120 | | | | | | | | | | | | | | | | 1.29 | % | | | | | | | | | | | | |
| Napa Community Bank | | | 35,033 | | | | 20,177 | | | | 492 | | | | 303 | | | | | | | | | | | | 1.40 | % | | | 1.50 | % | | | | | | | | |
| Sunrise Bank of San Diego | | | 43,410 | | | | 39,116 | | | | 577 | | | | 577 | | | | 533 | | | | | | | | 1.33 | % | | | 1.48 | % | | | | | | | | |
| | | |
| | | |
| | | |
| | | |
| | | |
| | | |
| | | | | | | | | | | | | | | | | |
| California Region Total | | | 87,716 | | | | 59,293 | | | | 1,189 | | | | 880 | | | | 533 | | | | -0- | | | | | | | | | | | | | | | | | |
| Other, net | | | 1,404 | | | | 4,356 | | | | 1,138 | | | | | | | | | | | | | | | | | | | | | | | | | | | | | |
| | | |
| | | |
| | | |
| | | |
| | | |
| | | |
| | | |
| | | |
| | | | | | | | | |
| Consolidated totals | | $ | 2,247,440 | | | $ | 1,991,372 | | | $ | 31,404 | | | $ | 28,953 | | | $ | 26,872 | | | $ | 22,890 | | | | 1.40 | % | | | 1.45 | % | | | | | | | | |
| | | |
| | | |
| | | |
| | | |
| | | |
| | | |
| | | |
| | | |
| | | | | | | | | |
At December 31, 2003, the consolidated allowance for loan losses approximated $31.4 million or 1.40% of total portfolio loans outstanding, compared with $29.0 million or 1.45% at December 31, 2002 and $23.2 million or 1.34% at the beginning of 2002. The allowance ratio was increased significantly in 2002 in concert with higher estimated losses which were incurred through loan charge-offs in 2002 and 2003. The lower allowance ratio at December 31, 2003 is based on management’s analysis of inherent losses in the portfolio at the balance sheet date, after giving effect to those charge-offs and is deemed adequate as of that date.
The primary source of funding of loans is deposits, which is discussed in the next section of this narrative.
16
Liquidity, Capital Resources and Capital Adequacy
Asset liquidity for financial institutions typically consists of cash and cash equivalents, loans held for resale and investment securities available for sale. These categories totaled $410 million at year-end 2003, or about 15% of total assets. This compares to $352 million or about 15% of total assets at year-end 2002. Liquidity is important for financial institutions because of their need to meet loan funding commitments, depositor withdrawal requests and various other commitments discussed in the accompanying notes to consolidated financial statements. Liquidity varies significantly daily, based on customer activity.
Most of the investment securities portfolio is classified as available for sale, although the banks generally have not sold investments to meet liquidity needs. Also, to the extent warranted, the banks may sell loans from time to time.
Loans held for resale, as previously mentioned, approximated $43 million at December 31, 2003. These loans are residential real estate mortgages originated by the banks, primarily through Capitol’s mortgage affiliate, Amera Mortgage Corporation. These loans are subsequently sold into the secondary market, rather than being held in the banks’ portfolios, to reduce interest rate risk. Mortgage loan origination volume in 2003 increased 42%, to approximately $1.3 billion compared to $891.5 million in 2002 and $651.1 million in 2001. Most of this volume was achieved through record low interest rates and Amera’s activities expanding to include all of Capitol’s affiliate banks in 2003. Future volume will depend on whether interest rates remain low and the strength of residential real estate market conditions.
The primary source of funds for the banks is deposits. The banks emphasize interest-bearing time deposits as part of their funding strategy. The banks also seek noninterest-bearing deposits, or checking accounts, which reduce the banks’ cost of funds. Noninterest-bearing deposits were about 19% of total deposits at year-end 2003 (about 17% at year-end 2002) and increased $75 million, or 21%, during the year.
17
In recent periods, many banks within the industry have experienced some competitive challenges in obtaining additional deposits to fuel growth. Capitol’s banks have had similar experiences in their individual markets. As depositors have wider access to the Internet and other real-time interest rate monitoring resources, deposit pricing has become more competitive. Deposit growth is achievable, but at a competitive price, with tight net interest margins, especially during these most recent periods of low interest rates. The banks do not generally rely on brokered deposits as a key funding source (approximately $185 million at year-end 2003 or 10% of interest-bearing deposits compared to 11.8% in 2002); however, brokered deposits are a ready resource to help meet urgent funding needs, such as loan commitments (which are discussed in greater detail in Note O of the consolidated financial statements).
To supplement their funding sources, some of the banks have lines of credit from the Federal Home Loan Bank system. At year-end 2003, a total of approximately $93 million ($79 million at year-end 2002) was borrowed under those facilities and additional borrowing availability approximated $47 million. Some of the banks also have smaller lines of credit with their correspondent banks. Borrowings under these facilities are generally at short-term market rates of interest and, although the repayment dates can be extended, are generally outstanding for brief periods of time.
Capitol has a credit facility aggregating $25 million from an unaffiliated bank. At year-end 2003, no money was borrowed under this facility ($12.5 million at year-end 2002). Borrowings under this credit facility have been reduced in recent years through use of available corporate funds within the consolidated group.
Capitol’s longer-term contractual obligations are disclosed in the notes to the consolidated financial statements. Such obligations consist principally of time deposits of the banks, debt and lease obligations and trust-preferred securities, summarized as follows (in $1,000s):
| | | | | | | | | | | | | | | | | | | | | |
| | | | | | | Payments Due by Period
|
| | | | | | | Within | | Within | | Within | | After |
| | | Total
| | 1 Year
| | 1-3 Years
| | 3-5 Years
| | 5 Years
|
| Time deposits | | $ | 881,186 | | | $ | 595,713 | | | $ | 241,560 | | | $ | 43,896 | | | $ | 17 | |
| Debt obligations | | | 92,774 | | | | 37,100 | | | | 18,324 | | | | 4,000 | | | | 33,350 | |
| Rent commitments under noncancelable leases | | | 33,081 | | | | 5,607 | | | | 10,690 | | | | 8,251 | | | | 8,533 | |
| Trust-preferred securities | | | 93,300 | | | | — | | | | — | | | | — | | | | 93,300 | |
| | | |
| | | |
| | | |
| | | |
| | | |
| |
| Total | | $ | 1,100,341 | | | $ | 638,420 | | | $ | 270,574 | | | $ | 56,147 | | | $ | 135,200 | |
| | | |
| | | |
| | | |
| | | |
| | | |
| |
Loan commitments of Capitol’s banks (stand-by letters of credit and unfunded loans) generally expire within one year.
A significant source of capital has been investments provided by minority shareholders in the subsidiaries which are consolidated for financial reporting purposes. Total minority interests in consolidated subsidiaries amounted to $30.9 million at year-end 2003, a net increase of $2.9 million from the $28.0 million level at year-end 2002. The change in minority interests in 2003 resulted mainly from Capitol’s formation of one new bank and a bank-development subsidiary less acquisitions of minority interests of the eight banks which became wholly-owned in 2003.
18
Eight majority-owned banks also became wholly-owned in 2003. In each of these transactions, the shares acquired from the minority shareholders were exchanged for Capitol’s common stock according to fixed, but differing, exchange ratios. The exchanges with Black Mountain Community Bank, Desert Community Bank, Elkhart Community Bank and Red Rock Community Bank were completed effective July 31, 2003 and resulted in the issuance of approximately 982,000 Capitol shares. Share exchanges regarding Arrowhead Community Bank, Goshen Community Bank, Sunrise Bank of Albuquerque and Yuma Community Bank were completed effective December 31, 2003 and resulted in the issuance of about 345,000 shares of Capitol.
While it is likely that similar share exchange transactions, as a harvest strategy to gain full ownership of some bank subsidiaries, may occur in the future, any such transactions depend upon whether Capitol (or one of its subsidiary bank holding companies) offers such an exchange and whether minority shareholders vote in favor of it on a transaction-by-transaction basis.
Total stockholders’ equity approximated $219 million at year-end 2003, an increase of $59 million for the year. The 2003 increase in stockholders’ equity includes earnings (less dividends paid), the previously-mentioned share-exchange transactions and proceeds from the issuance of common stock. The book value per share of common stock was $15.60 at year-end 2003, compared with $13.72 at year-end 2002. Cash dividends of $0.51 were paid in 2003, compared to $0.44 in 2002 and $0.40 in 2001. Future payment of dividends is subject to approval by Capitol’s board of directors, future operating performance and management’s assessment of the consolidated organization’s capital adequacy.
Capitol’s capital structure consists of these primary elements:
| | • | | Trust-preferred securities, |
| |
| | • | | Minority interests in consolidated subsidiaries, and |
| |
| | • | | Stockholders’ equity. |
19
In 2003, there were three private placements of pooled trust-preferred securities totaling $40 million. In June 2002, Capitol participated in the private placement of a pooled trust-preferred security totaling $3 million. In 2001, Capitol participated in two private placements of pooled trust-preferred securities totaling $25 million. These securities, along with Capitol Trust I (a $25 million public offering of trust-preferred securities in 1997), are treated as elements of capital for regulatory purposes. As noted in the accompanying financial statements, the trusts relating to Capitol’s trust-preferred securities are classified as debt obligations and, as noted in theCritical Accounting Policiesof this narrative, the accounting treatment will be changing in 2004 and there is some uncertainty as to their future regulatory capital treatment.
Total capitalization at year-end 2003 amounted to $340.7 million or 12.4% of total assets. This compares to $239.6 million or 9.9% at year-end 2002.
Capitol and each of its banks and bank development subsidiaries are subject to a complex series of regulatory rules and requirements which require specific levels of capital adequacy at both the bank level and on a consolidated basis. Under those rules and regulations, banks are categorized aswell capitalized,adequately capitalizedorinadequately capitalizedusing several ratio measurements, including a risk-weighting approach to assets and financial commitments. Banks falling into theinadequately capitalizedcategory are subject to the prompt corrective action provisions of the FDIC Improvement Act, which can result in significant regulatory agency intervention and other adverse action. Although it is permissible to maintain capital adequacy at theadequately capitalizedlevel, Capitol operates with the objective of its banks meeting thewell capitalizedstandard. The well capitalized banks benefit from lower FDIC deposit insurance costs and less restrictive limitations on some banking activities.
New banks, as a condition of regulatory charter approval, are required to maintain higher ratios of capital adequacy. Generally, they are required to keep a specific ratio of capital-to-average-total-assets of not less than 8% during their first three years of operation.
In the opinion of management, all of the affiliated banks met the criteria to be classified aswell capitalizedat year-end 2003.
[The remainder of this page intentionally left blank]
20
Trends Affecting Operations
The most significant trends which can impact the financial condition and results of operations of financial institutions are changes in market rates of interest and changes in general economic conditions.
Changes in interest rates, either up or down, have an impact on net interest income (plus or minus), depending on the direction and timing of such changes. At any point in time, there is an imbalance between interest rate-sensitive assets and interest rate-sensitive liabilities. This means that when interest rates change, the timing and magnitude of the effect of such interest rate changes can alter the relationship between asset yields and the cost of funds. This timing difference between interest rate-sensitive assets and interest rate-sensitive liabilities is characterized as a “gap” which is quantified by the distribution of rate-sensitive amounts within various time periods in which they reprice or mature. The following table summarizes the consolidated financial position in relation to “gap” at December 31, 2003 (in $1,000s):
| | | | | | | | | | | | | | | | | | | | | |
| | | Interest Rate Sensitivity
| | |
| | | 0 to 3 | | 4 to 12 | | 1 to 5 | | Over 5 | | |
| | | Months
| | Months
| | Years
| | Years
| | Total
|
| ASSETS | | | | | | | | | | | | | | | | | | | | |
| Federal funds sold | | $ | 124,157 | | | | | | | | | | | | | | | $ | 124,157 | |
| Money market and interest-bearing deposits | | | 13,570 | | | | | | | | | | | | | | | | 13,570 | |
| Investment securities | | | 57,297 | | | $ | 1,506 | | | $ | 19,907 | | | $ | 14,497 | | | | 93,207 | |
| Portfolio loans: | | | | | | | | | | | | | | | | | | | | |
| Commercial | | | 1,066,062 | | | | 197,136 | | | | 752,573 | | | | 17,326 | | | | 2,033,097 | |
| Real estate mortgage | | | 88,407 | | | | 11,149 | | | | 39,807 | | | | 3,980 | | | | 143,343 | |
| Installment | | | 9,214 | | | | 19,570 | | | | 41,201 | | | | 1,015 | | | | 71,000 | |
| Loans held for resale | | | 43,001 | | | | | | | | | | | | | | | | 43,001 | |
| Non-earning assets | | | | | | | | | | | | | | | | | | | 215,687 | |
| | | |
| | | |
| | | |
| | | |
| | | |
| |
| Total assets | | $ | 1,401,708 | | | $ | 229,361 | | | $ | 853,488 | | | $ | 36,818 | | | $ | 2,737,062 | |
| | | |
| | | |
| | | |
| | | |
| | | |
| |
| LIABILITIES AND STOCKHOLDERS’ EQUITY | | | | | | | | | | | | | | | | | | | | |
| Interest-bearing deposits: | | | | | | | | | | | | | | | | | | | | |
| Time deposits under $100,000 | | $ | 42,508 | | | $ | 141,289 | | | $ | 113,178 | | | $ | 17 | | | $ | 296,992 | |
| Time deposits $100,000 and over | | | 192,548 | | | | 219,368 | | | | 172,278 | | | | | | | | 584,194 | |
| All other interest-bearing deposits | | | 850,631 | | | | 110,086 | | | | 11,162 | | | | | | | | 971,879 | |
| | | |
| | | |
| | | |
| | | |
| | | |
| |
| Total interest-bearing deposits | | | 1,085,687 | | | | 470,743 | | | | 296,618 | | | | 17 | | | | 1,853,065 | |
| Notes payable | | | 16,650 | | | | 20,450 | | | | 22,324 | | | | 33,350 | | | | 92,774 | |
| Trust-preferred securities | | | 48,000 | | | | | | | | | | | | 45,300 | | | | 93,300 | |
| Noninterest-bearing liabilities | | | | | | | | | | | | | | | | | | | 448,080 | |
| Minority interests in consolidated subsidiaries | | | | | | | | | | | | | | | | | | | 30,946 | |
| Stockholders’ equity | | | | | | | | | | | | | | | | | | | 218,897 | |
| | | |
| | | |
| | | |
| | | |
| | | |
| |
| Total liabilities and stockholders’ equity | | $ | 1,150,337 | | | $ | 491,193 | | | $ | 318,942 | | | $ | 78,667 | | | $ | 2,737,062 | |
| | | |
| | | |
| | | |
| | | |
| | | |
| |
| Interest rate sensitive period gap | | $ | 251,371 | | | $ | (261,832 | ) | | $ | 534,546 | | | $ | (41,849 | ) | | | | |
| | | |
| | | |
| | | |
| | | |
| | | | | |
| Interest rate sensitive cumulative gap | | $ | 251,371 | | | $ | (10,461 | ) | | $ | 524,085 | | | $ | 482,236 | | | | | |
| | | |
| | | |
| | | |
| | | |
| | | | | |
| Period rate sensitive assets/period rate sensitive liabilities | | | 1.22 | | | | 0.47 | | | | 2.68 | | | | 0.47 | | | | | |
| Cumulative rate sensitive assets/cumulative rate sensitive liabilities | | | 1.22 | | | | 0.99 | | | | 1.27 | | | | 1.24 | | | | | |
| Cumulative gap to total assets | | | 9.18 | % | | | (0.38 | )% | | | 19.15 | % | | | 17.62 | % | | | | |
21
The “gap” changes daily based upon changes in the underlying assets and liabilities at the banks. Analyzing exposure to interest rate risk is prone to imprecision because the “gap” is constantly changing, the “gap” differs at each of the banks and it is difficult to predict the timing, amount and direction of future changes in market interest rates and the potential corresponding effect on customer behavior.
The banks endeavor to manage and monitor interest rate risk in concert with market conditions and risk parameters. Management strives to maintain a reasonably balanced position of interest rate-sensitive assets and liabilities. Capitol and its banks have not engaged in speculative positions, for example, through the use of derivatives, in anticipation of interest rate movements. In periods of relatively lower interest rates, the banks emphasize variable rate loans and time deposits to the extent possible in a competitive environment; however, competitive influences often result in making fixed rate loans, although the banks seek to limit the duration of such loans. These most recent periods of record low interest rates have created a huge volume of fixed-rate mortgage refinancing activity; those loans are sold to the secondary market and are not retained for the banks’ loan portfolios. Similarly, low interest rates generally make competition more intense for deposits, since loan demand will typically increase during periods of lower rates and, accordingly, result in higher interest costs on deposits as competitors bid-up rates, adversely impacting interest margins. Future interest rates and the impact on earnings are difficult to predict. In addition to interest rate risk relating to interest-bearing assets and liabilities, changes in interest rates also can impact future transaction volume of loans and deposits at the banks. For activities which are influenced by levels of interest rates for transaction volume (for example, origination of residential mortgage loans), pricing margins and demand can become impacted significantly by changes in interest rates.
As a means of monitoring and managing exposure to interest rate risk, management uses a computerized simulation model which is intended to estimate pro forma effects of changes in interest rates. Using the simulation model, the following table illustrates, on a consolidated basis, changes which would occur in annual levels of interest income, interest expense and net interest income (in $1,000s) assuming both one hundred and two hundred basis point (“bp”) parallel increases and decreases in interest rates:
| | | | | | | | | | | | | | | | | | | | | |
| | | | | Pro Forma Effect of | | Pro Forma Effect of |
| | | Pro Forma
Assuming No | | Interest Rate Increases
| | Interest Rate Decreases
|
| | | Change in | | | | | | | | |
| | | Interest Rates
| | +100 bp
| | +200 bp
| | -100 bp
| | -200 bp
|
| Interest income | | $ | 142,332 | | | $ | 155,531 | | | $ | 168,730 | | | $ | 129,159 | | | $ | 117,254 | |
| Interest expense | | | 32,698 | | | | 36,893 | | | | 42,958 | | | | 28,812 | | | | 27,439 | |
| | | |
| | | |
| | | |
| | | |
| | | |
| |
| Net interest income | | $ | 109,634 | | | $ | 118,638 | | | $ | 125,772 | | | $ | 100,347 | | | $ | 89,815 | |
| | | |
| | | |
| | | |
| | | |
| | | |
| |
The pro forma analysis above is intended to quantify theoretical changes in interest income based on stated assumptions. The pro forma analysis excludes the effect of numerous other variables such as borrowers’ ability to repay loans, the ability of banks to obtain deposits in a radically changed interest-rate environment and how management would revise its asset and liability management priorities in concert with rate changes.
22
While the pro forma analysis above is intended to estimate the impact of an immediate 100 and 200 basis point change in rates, actual results will be different. Those results will differ (and may be materially different) because a sudden rate change in market rates does not result in an instantaneous parallel shift in rates on loans and deposits at banks. Further, any financial model intended to estimate the impact of interest rate changes will not necessarily incorporate other variables, including management’s efforts to manage its asset and liability interest rate sensitivity, nor customer behavior.
General economic conditions also have a significant impact on both the results of operations and the financial condition of financial institutions. Local economic conditions, and to some extent national economic conditions, have a significant impact on levels of loan demand as well as the ability of borrowers to repay loans and the availability of funds for customers to make deposits.
At the time this narrative was written, uncertainties of domestic economic health and global stability preclude prediction of near-term trends and their potential effects.
Continuing consolidation of the banking industry on a national basis, and in the markets of Capitol’s banks, has presented opportunities for growth. As a result of consolidation of the banking industry and the conversion of customer relationships into perceived ‘commodities’ by the larger banks, many customer relationships have been displaced, generating opportunities for development by Capitol’s banks. For many retail customers, banking services have become a commodity in an environment that is dominated by larger mega-bank or mass-merchandising institutions. For the professional, entrepreneur and other customers seeking a more service-oriented, customized banking relationship, Capitol’s banks fill that need through their focus on single-location banks with full, local decision-making authority. As Capitol’s banks focus on service delivery and keeping their size at a manageable level, only a modest market share of deposits and loan activity is necessary to achieve profitability and investor-oriented earnings performance.
Start-up banks generally incur operating losses during their early periods of operations. Recently-formed start-up banks will detract from consolidated earnings performance and additional start-up banks formed in 2003 and beyond will similarly negatively impact short-term profitability. On a consolidated basis, such operating losses reduce net income by the pro rata share of Capitol’s ownership percentage in those banks. When those banks become profitable, their operating results will contribute to consolidated earnings to the extent of Capitol’s ownership percentage.
Commercial banks continue to be subject to significant regulatory requirements which impact current and future operations. In addition to the extent of regulatory interaction with financial institutions, extensive rules and regulations governing lending activities, deposit gathering and capital adequacy (to name a few), translate into a significant cost burden of financial institution regulation. Such costs include the significant amount of management time and expense which is incurred in maintaining compliance and developing systems for compliance with those rules and regulations as well as the cost of examinations, audits and other compliance activities. The future of financial institution regulation, and its costs, is uncertain and difficult to predict.
23
Premiums for FDIC insurance have historically been a significant cost of doing business as financial institutions, but in the last several years, deposit insurance premiums have been maintained at a stable and modest level. Future deposit insurance premium levels are difficult to predict inasmuch as deposit insurance premiums will be determined based on general economic conditions, the relative health of the banking and financial institution industry and other unpredictable factors. It is reasonable to expect that deposit insurance premiums may increase at some point in the future.
International bank regulatory agencies are currently contemplating revisions to the existing risk-based capital adequacy framework through the Basel II proposals. As currently proposed, management does not expect those proposals to have a material impact on Capitol and its banks.
New Accounting Standards
There were several new accounting standards which were issued or became effective in 2003, in addition to some which have later effective dates. They are listed and discussed in Note B of the consolidated financial statements, beginning on page 35.
[The remainder of this page intentionally left blank]
24
Board of Directors and Stockholders
Capitol Bancorp Ltd.
We have audited the accompanying consolidated balance sheets of Capitol Bancorp Ltd. and subsidiaries as of December 31, 2003 and 2002, and the related consolidated statements of income, changes in stockholders’ equity and cash flows for each of the three years in the period ended December 31, 2003. These financial statements are the responsibility of the Corporation’s management. Our responsibility is to express an opinion on these financial statements based on our audits.
We conducted our audits in accordance with auditing standards generally accepted in the United States of America. Those standards require that we plan and perform the audit to obtain reasonable assurance about whether the financial statements are free of material misstatement. An audit includes examining, on a test basis, evidence supporting the amounts and disclosures in the financial statements. An audit also includes assessing the accounting principles used and significant estimates made by management, as well as evaluating the overall financial statement presentation. We believe that our audits provide a reasonable basis for our opinion.
In our opinion, the consolidated financial statements referred to above present fairly, in all material respects, the financial position of Capitol Bancorp Ltd. and subsidiaries as of December 31, 2003 and 2002, and the results of their operations and their cash flows for each of the three years in the period ended December 31, 2003, in conformity with accounting principles generally accepted in the United States of America.
/s/ BDO Seidman, LLP
Grand Rapids, Michigan
January 30, 2004
25
Consolidated Balance Sheets
| | | | | | | | | |
| | | - December 31 - |
| | | 2003
| | 2002
|
| | | (in $1,000s) |
| ASSETS | | | | | | | | |
| Cash and due from banks | | $ | 145,896 | | | $ | 125,146 | |
| Money market and interest-bearing deposits | | | 13,570 | | | | 42,301 | |
| Federal funds sold | | | 124,157 | | | | 83,737 | |
| | | |
| | | |
| |
| Cash and cash equivalents | | | 283,623 | | | | 251,184 | |
| Loans held for resale | | | 43,001 | | | | 75,420 | |
| Investment securities—Note C: | | | | | | | | |
| Available for sale, carried at market value | | | 83,386 | | | | 25,355 | |
| Held for long-term investment, carried at amortized cost which approximates market value | | | 9,821 | | | | 8,784 | |
| | | |
| | | |
| |
| Total investment securities | | | 93,207 | | | | 34,139 | |
| Portfolio loans, less allowance for loan losses of $31,404 in 2003 and $28,953 in 2002—Note D | | | 2,216,036 | | | | 1,962,419 | |
| Premises and equipment—Note F | | | 24,793 | | | | 21,737 | |
| Accrued interest income | | | 9,533 | | | | 9,286 | |
| Goodwill and other intangibles—Note B | | | 34,449 | | | | 24,739 | |
| Other assets | | | 32,420 | | | | 30,364 | |
| | | |
| | | |
| |
| TOTAL ASSETS | | $ | 2,737,062 | | | $ | 2,409,288 | |
| | | |
| | | |
| |
| LIABILITIES AND STOCKHOLDERS’ EQUITY | | | | | | | | |
| Deposits: | | | | | | | | |
| Noninterest-bearing | | $ | 435,599 | | | $ | 360,669 | |
| Interest-bearing—Note G | | | 1,853,065 | | | | 1,701,403 | |
| | | |
| | | |
| |
| Total deposits | | | 2,288,664 | | | | 2,062,072 | |
| Debt obligations: | | | | | | | | |
| Notes payable—Note H | | | 92,774 | | | | 93,398 | |
| Trust-preferred securities—Note I | | | 90,816 | | | | 51,583 | |
| | | |
| | | |
| |
| Total debt obligations | | | 183,590 | | | | 144,981 | |
| Accrued interest on deposits and other liabilities | | | 14,965 | | | | 14,182 | |
| | | |
| | | |
| |
| Total liabilities | | | 2,487,219 | | | | 2,221,235 | |
| |
| MINORITY INTERESTS IN CONSOLIDATED SUBSIDIARIES—Note A | | | 30,946 | | | | 28,016 | |
| |
| STOCKHOLDERS’ EQUITY—Notes B, J and P | | | | | | | | |
| Common stock, no par value, 25,000,000 shares authorized; issued and outstanding: | | | | | | | | |
| 2003—14,027,982 shares | | | | | | | | |
| 2002—11,663,412 shares | | | 180,957 | | | | 135,234 | |
| Retained earnings | | | 43,135 | | | | 26,318 | |
| Market value adjustment (net of tax effect) for investment securities available for sale (accumulated other comprehensive income) | | | (200 | ) | | | 191 | |
| | | |
| | | |
| |
| | | | 223,892 | | | | 161,743 | |
| Less unearned compensation regarding restricted stock and other | | | (4,995 | ) | | | (1,706 | ) |
| | | |
| | | |
| |
| Total stockholders’ equity | | | 218,897 | | | | 160,037 | |
| | | |
| | | |
| |
| TOTAL LIABILITIES AND STOCKHOLDERS’ EQUITY | | $ | 2,737,062 | | | $ | 2,409,288 | |
| | | |
| | | |
| |
See notes to consolidated financial statements.
26
Consolidated Statements of Income
| | | | | | | | | | | | | |
| | | - Year Ended December 31 - |
| | | 2003
| | 2002
| | 2001
|
| | | (in $1,000s, except per share data) |
| Interest income: | | | | | | | | | | | | |
| Portfolio loans (including fees) | | $ | 157,114 | | | $ | 149,785 | | | $ | 144,417 | |
| Loans held for resale | | | 3,299 | | | | 2,674 | | | | 3,002 | |
| Taxable investment securities | | | 749 | | | | 1,422 | | | | 2,201 | |
| Federal funds sold | | | 1,344 | | | | 1,376 | | | | 3,186 | |
| Other | | | 1,910 | | | | 1,197 | | | | 991 | |
| | | |
| | | |
| | | |
| |
| Total interest income | | | 164,416 | | | | 156,454 | | | | 153,797 | |
| Interest expense: | | | | | | | | | | | | |
| Deposits | | | 41,260 | | | | 47,848 | | | | 65,655 | |
| Debt obligations and other | | | 8,230 | | | | 8,012 | | | | 7,637 | |
| | | |
| | | |
| | | |
| |
| Total interest expense | | | 49,490 | | | | 55,860 | | | | 73,292 | |
| | | |
| | | |
| | | |
| |
| Net interest income | | | 114,926 | | | | 100,594 | | | | 80,505 | |
| Provision for loan losses—Note D | | | 9,861 | | | | 12,676 | | | | 8,167 | |
| | | |
| | | |
| | | |
| |
| Net interest income after provision for loan losses | | | 105,065 | | | | 87,918 | | | | 72,338 | |
| Noninterest income: | | | | | | | | | | | | |
| Service charges on deposit accounts | | | 4,319 | | | | 4,020 | | | | 3,251 | |
| Trust fee income | | | 2,614 | | | | 2,434 | | | | 1,839 | |
| Fees from origination of non-portfolio residential mortgage loans | | | 8,710 | | | | 6,837 | | | | 3,165 | |
| Other | | | 4,444 | | | | 1,691 | | | | 1,330 | |
| | | |
| | | |
| | | |
| |
| Total noninterest income | | | 20,087 | | | | 14,982 | | | | 9,585 | |
| Noninterest expense: | | | | | | | | | | | | |
| Salaries and employee benefits | | | 55,264 | | | | 47,454 | | | | 37,970 | |
| Occupancy | | | 7,723 | | | | 6,528 | | | | 5,772 | |
| Equipment rent, depreciation and maintenance | | | 4,847 | | | | 4,544 | | | | 4,646 | |
| Other | | | 20,279 | | | | 18,625 | | | | 15,748 | |
| | | |
| | | |
| | | |
| |
| Total noninterest expense | | | 88,113 | | | | 77,151 | | | | 64,136 | |
| | | |
| | | |
| | | |
| |
| Income before federal income taxes and minority interest | | | 37,039 | | | | 25,749 | | | | 17,787 | |
| Federal income taxes—Note L | | | 12,874 | | | | 8,701 | | | | 5,824 | |
| | | |
| | | |
| | | |
| |
| Income before minority interest | | | 24,165 | | | | 17,048 | | | | 11,963 | |
| Minority interest in net income of consolidated subsidiaries | | | (785 | ) | | | (395 | ) | | | (1,245 | ) |
| | | |
| | | |
| | | |
| |
| NET INCOME | | $ | 23,380 | | | $ | 16,653 | | | $ | 10,718 | |
| | | |
| | | |
| | | |
| |
| NET INCOME PER SHARE—Note M: | | | | | | | | | | | | |
| Basic | | $ | 1.86 | | | $ | 1.64 | | | $ | 1.38 | |
| | | |
| | | |
| | | |
| |
| Diluted | | $ | 1.77 | | | $ | 1.57 | | | $ | 1.35 | |
| | | |
| | | |
| | | |
| |
See notes to consolidated financial statements.
27
Consolidated Statements of Changes in Stockholders’ Equity (in $1,000s)
| | | | | | | | | | | | | | | | | | | | | | | |
| | | | | | | | | | | | | | | | | Unearned | | | | |
| | | | | | | | | | | | | Accumulated | | Compensation | | | | |
| | | | | | | | | | | | | Other | | Regarding | | | | |
| | | | | Common | | Retained | | Comprehensive | | Restricted Stock | | | | |
| | | | | Stock | | Earnings | | Income | | and Other | | Total |
| | | | |
| |
| |
| |
| |
|
| Balances at January 1, 2001 | | $ | 65,939 | | | $ | 6,569 | | | $ | (108 | ) | | $ | (1,996 | ) | | $ | 70,404 | |
| Proceeds from the sale of 130,000 shares of common stock and 32,500 warrants to purchase common stock | | | 1,495 | | | | | | | | | | | | | | | | 1,495 | |
| Issuance of 7,465 shares of common stock upon exercise of warrants | | | 82 | | | | | | | | | | | | | | | | 82 | |
| Issuance of 18,350 shares of common stock upon exercise of stock options | | | 176 | | | | | | | | | | | | | | | | 176 | |
| Allocation of shares to ESOP participants’ accounts | | | | | | | | | | | | | | | 145 | | | | 145 | |
| Cash dividends paid ($.40 per share) | | | | | | | (3,114 | ) | | | | | | | | | | | (3,114 | ) |
| Components of comprehensive income: | | | | | | | | | | | | | | | | | | | | |
| | Net income for 2001 | | | | | | | 10,718 | | | | | | | | | | | | 10,718 | |
| | Market value adjustment for investment securities available for sale (net of income tax effect) | | | | | | | | | | | 266 | | | | | | | | 266 | |
| | | | | | | | | | | | | | | | | | | |
| |
| | | Comprehensive income for 2001 | | | | | | | | | | | | | | | | | | | 10,984 | |
| | | |
| | | |
| | | |
| | | |
| | | |
| |
| BALANCES AT DECEMBER 31, 2001 | | | 67,692 | | | | 14,173 | | | | 158 | | | | (1,851 | ) | | | 80,172 | |
| |
| Issuance of 3,606,306 shares of common stock to acquire minority interests in bank and bank holding-company subsidiaries | | | 64,801 | | | | | | | | | | | | | | | | 64,801 | |
| Issuance of 138,447 shares of common stock upon exercise of stock options | | | 1,693 | | | | | | | | | | | | | | | | 1,693 | |
| Issuance of 54,859 shares of common stock upon exercise of warrants | | | 608 | | | | | | | | | | | | | | | | 608 | |
| Issuance of 34,622 shares of common stock in exchange for investment security | | | 440 | | | | | | | | | | | | | | | | 440 | |
| Allocation of shares to ESOP participants’ accounts | | | | | | | | | | | | | | | 145 | | | | 145 | |
| Cash dividends paid ($.44 per share) | | | | | | | (4,508 | ) | | | | | | | | | | | (4,508 | ) |
| Components of comprehensive income: | | | | | | | | | | | | | | | | | | | | |
| | Net income for 2002 | | | | | | | 16,653 | | | | | | | | | | | | 16,653 | |
| | Market value adjustment for investment securities available for sale (net of income tax effect) | | | | | | | | | | | 33 | | | | | | | | 33 | |
| | | | | | | | | | | | | | | | | | | |
| |
| | | Comprehensive income for 2002 | | | | | | | | | | | | | | | | | | | 16,686 | |
| | | |
| | | |
| | | |
| | | |
| | | |
| |
| BALANCES AT DECEMBER 31, 2002 | | | 135,234 | | | | 26,318 | | | | 191 | | | | (1,706 | ) | | | 160,037 | |
| |
| Issuance of 1,327,378 shares of common stock to acquire minority interests in bank subsidiaries | | | 29,134 | | | | | | | | | | | | | | | | 29,134 | |
| Issuance of 280,842 shares of common stock upon exercise of stock options, net of common stock surrendered to facilitate exercise | | | 2,028 | | | | | | | | | | | | | | | | 2,028 | |
| Issuance of 22,512 shares of common stock upon exercise of warrants | | | 259 | | | | | | | | | | | | | | | | 259 | |
| Private placement of 549,000 shares of common stock | | | 10,226 | | | | | | | | | | | | | | | | 10,226 | |
| Surrender and cancellation of 74,179 shares of common stock in repayment of note receivable from exercise of stock options | | | (1,561 | ) | | | | | | | | | | | 1,561 | | | | — | |
| Issuance of 259,017 shares of restricted common stock | | | 5,637 | | | | | | | | | | | | (5,637 | ) | | | — | |
| Recognition of compensation expense relating to restricted common stock | | | | | | | | | | | | | | | 642 | | | | 642 | |
| Allocation of shares to ESOP participants’ accounts | | | | | | | | | | | | | | | 145 | | | | 145 | |
| Cash dividends paid ($.51 per share) | | | | | | | (6,563 | ) | | | | | | | | | | | (6,563 | ) |
| Components of comprehensive income: | | | | | | | | | | | | | | | | | | | | |
| | Net income for 2003 | | | | | | | 23,380 | | | | | | | | | | | | 23,380 | |
| | Market value adjustment for investment securities available for sale (net of income tax effect) | | | | | | | | | | | (391 | ) | | | | | | | (391 | ) |
| | | | | | | | | | | | | | | | | | | |
| |
| | | Comprehensive income for 2003 | | | | | | | | | | | | | | | | | | | 22,989 | |
| | | |
| | | |
| | | |
| | | |
| | | |
| |
| BALANCES AT DECEMBER 31, 2003 | | $ | 180,957 | | | $ | 43,135 | | | $ | (200 | ) | | $ | (4,995 | ) | | $ | 218,897 | |
| | | |
| | | |
| | | |
| | | |
| | | |
| |
See notes to consolidated financial statements.
28
Consolidated Statements of Cash Flows
| | | | | | | | | | | | | | | |
| | | | | - Year Ended December 31 - |
| | | | | 2003 | | 2002 | | 2001 |
| | | | |
| |
| |
|
| | | | | (in $1,000s) |
| OPERATING ACTIVITIES | | | | | | | | | | | | |
| | Net income | | $ | 23,380 | | | $ | 16,653 | | | $ | 10,718 | |
| | Adjustments to reconcile net income to net cash provided (used) by operating activities: | | | | | | | | | | | | |
| | | Provision for loan losses | | | 9,861 | | | | 12,676 | | | | 8,167 | |
| | | Depreciation of premises and equipment | | | 4,102 | | | | 3,451 | | | | 3,340 | |
| | | Amortization of goodwill and other intangibles | | | 532 | | | | 399 | | | | 979 | |
| | | Net amortization (accretion) of investment security premiums (discounts) | | | 74 | | | | (22 | ) | | | (94 | ) |
| | | Loss (gain) on sales of premises and equipment | | | (83 | ) | | | 64 | | | | 100 | |
| | | Minority interest in net income of consolidated subsidiaries | | | 785 | | | | 395 | | | | 1,245 | |
| | | Deferred income taxes | | | 325 | | | | (2,224 | ) | | | (1,345 | ) |
| | Originations and purchases of loans held for resale | | | (1,261,078 | ) | | | (891,498 | ) | | | (651,149 | ) |
| | Proceeds from sales of loans held for resale | | | 1,293,497 | | | | 878,565 | | | | 609,984 | |
| | Increase in accrued interest income and other assets | | | (232 | ) | | | (2,187 | ) | | | (1,883 | ) |
| | Decrease (increase) in accrued interest expense on deposits and other liabilities | | | 783 | | | | (62 | ) | | | 523 | |
| | | | |
| | | |
| | | |
| |
| | | NET CASH PROVIDED (USED) BY OPERATING ACTIVITIES | | | 71,946 | | | | 16,210 | | | | (19,415 | ) |
| |
| INVESTING ACTIVITIES | | | | | | | | | | | | |
| | Proceeds from sales of investment securities available for sale | | | 25,451 | | | | 8,672 | | | | 500 | |
| | Proceeds from calls, prepayments and maturities of investment securities | | | 16,786 | | | | 67,938 | | | | 67,393 | |
| | Purchases of investment securities | | | (101,971 | ) | | | (66,989 | ) | | | (42,159 | ) |
| | Net increase in portfolio loans | | | (263,478 | ) | | | (263,744 | ) | | | (381,169 | ) |
| | Proceeds from sales of premises and equipment | | | 1,733 | | | | 60 | | | | 306 | |
| | Purchases of premises and equipment | | | (8,808 | ) | | | (8,871 | ) | | | (5,536 | ) |
| | | | |
| | | |
| | | |
| |
| | | NET CASH USED BY INVESTING ACTIVITIES | | | (330,287 | ) | | | (262,934 | ) | | | (360,665 | ) |
| |
| FINANCING ACTIVITIES | | | | | | | | | | | | |
| | Net increase in demand deposits, NOW accounts and savings accounts | | | 223,164 | | | | 271,571 | | | | 268,677 | |
| | Net increase in certificates of deposit | | | 3,428 | | | | 50,116 | | | | 70,809 | |
| | Net borrowings from (payments on) debt obligations | | | (624 | ) | | | 3,487 | | | | 31,761 | |
| | Net proceeds from issuance of trust-preferred securities | | | 39,160 | | | | 2,899 | | | | 24,248 | |
| | Resources provided by minority interests | | | 19,559 | | | | 8,351 | | | | 6,853 | |
| | Net proceeds from issuance of common stock | | | 12,656 | | | | 2,301 | | | | 1,753 | |
| | Cash dividends paid | | | (6,563 | ) | | | (4,508 | ) | | | (3,114 | ) |
| | | | |
| | | |
| | | |
| |
| | | NET CASH PROVIDED BY FINANCING ACTIVITIES | | | 290,780 | | | | 334,217 | | | | 400,987 | |
| | | | |
| | | |
| | | |
| |
| | | INCREASE IN CASH AND CASH EQUIVALENTS | | | 32,439 | | | | 87,493 | | | | 20,907 | |
| Cash and cash equivalents at beginning of year | | | 251,184 | | | | 163,691 | | | | 142,784 | |
| | | | |
| | | |
| | | |
| |
| | | CASH AND CASH EQUIVALENTS AT END OF YEAR | | $ | 283,623 | | | $ | 251,184 | | | $ | 163,691 | |
| | | | |
| | | |
| | | |
| |
See notes to consolidated financial statements.
29
NOTES TO CONSOLIDATED FINANCIAL STATEMENTS
Capitol Bancorp Limited
NOTE A—NATURE OF OPERATIONS, BASIS OF PRESENTATION AND PRINCIPLES OF CONSOLIDATION
Capitol Bancorp Limited (“Capitol” or the “Corporation”) is a multibank holding company. Consolidated bank subsidiaries consist of the following:
| | | | | | | | | | | | | | |
| | | | | | | | Percentage | | | | |
| | | | | | | | Owned at | | | | |
| | | | | | | | December 31, | | Year Formed |
| Affiliate | | Location | | 2003 | | or Acquired |
| |
| |
| |
|
| Great Lakes Region Banks: | | | | | | | | | | | | |
| | Ann Arbor Commerce Bank | | | Ann Arbor, Michigan | | | | 100 | % | | | 1990 | |
| | Brighton Commerce Bank | | | Brighton, Michigan | | | | 100 | % | | | 1997 | |
| | Capitol National Bank | | | Lansing, Michigan | | | | 100 | % | | | 1982 | |
| | Detroit Commerce Bank | | | Detroit, Michigan | | | | 100 | % | | | 1998 | |
| | Elkhart Community Bank | | | Elkhart, Indiana | | | | 100 | % | | | 1999 | |
| | Goshen Community Bank | | | Goshen, Indiana | | | | 100 | % | | | 2000 | |
| | Grand Haven Bank | | | Grand Haven, Michigan | | | | 100 | % | | | 1995 | |
| | Kent Commerce Bank | | | Grand Rapids, Michigan | | | | 100 | % | | | 1998 | |
| | Macomb Community Bank | | | Clinton Township, Michigan | | | | 100 | % | | | 1996 | |
| | Muskegon Commerce Bank | | | Muskegon, Michigan | | | | 100 | % | | | 1997 | |
| | Oakland Commerce Bank | | | Farmington Hills, Michigan | | | | 100 | % | | | 1992 | |
| | Paragon Bank & Trust | | | Holland, Michigan | | | | 100 | % | | | 1994 | |
| | Portage Commerce Bank | | | Portage, Michigan | | | | 100 | % | | | 1988 | |
| Southwest Region Banks: | | | | | | | | | | | | |
| | Arrowhead Community Bank | | | Glendale, Arizona | | | | 100 | % | | | 2000 | |
| | Bank of Las Vegas | | | Las Vegas, Nevada | | | | 51 | % | | | 2002 | |
| | Bank of Tucson | | | Tucson, Arizona | | | | 100 | % | | | 1996 | |
| | Black Mountain Community Bank | | | Henderson, Nevada | | | | 100 | % | | | 2000 | |
| | Camelback Community Bank | | | Phoenix, Arizona | | | | 100 | % | | | 1998 | |
| | Desert Community Bank | | | Las Vegas, Nevada | | | | 100 | % | | | 1999 | |
| | East Valley Community Bank | | | Chandler, Arizona | | | | 100 | % | | | 1999 | |
| | Mesa Bank | | | Mesa, Arizona | | | | 100 | % | | | 1998 | |
| | Red Rock Community Bank | | | Las Vegas, Nevada | | | | 100 | % | | | 1999 | |
| | Southern Arizona Community Bank | | | Tucson, Arizona | | | | 100 | % | | | 1998 | |
| | Sunrise Bank of Albuquerque | | | Albuquerque, New Mexico | | | | 100 | % | | | 2000 | |
| | Sunrise Bank of Arizona | | | Phoenix, Arizona | | | | 100 | % | | | 1998 | |
| | Valley First Community Bank | | | Scottsdale, Arizona | | | | 100 | % | | | 1997 | |
| | Yuma Community Bank | | | Yuma, Arizona | | | | 100 | % | | | 2000 | |
| California Region Banks: | | | | | | | | | | | | |
| | Bank of Escondido | | | Escondido, California | | | | 26 | % | | | 2003 | |
| | Napa Community Bank | | | Napa, California | | | | 26 | % | | | 2002 | |
| | Sunrise Bank of San Diego | | | San Diego, California | | | | 64 | % | | | 2001 | |
At December 31, 2003, Capitol owned a majority interest in two bank holding company subsidiaries, First California Northern Bancorp and First California Southern Bancorp, each with majority-owned bank subsidiaries, Napa Community Bank and Bank of Escondido, respectively.
30
NOTES TO CONSOLIDATED FINANCIAL STATEMENTS
Capitol Bancorp Limited
NOTE A—NATURE OF OPERATIONS, BASIS OF PRESENTATION AND PRINCIPLES OF CONSOLIDATION—Continued
In late 2003, Capitol formed a new bank-development subsidiary, Capitol Development Bancorp Limited 1 (“CDBL1”). CDBL1 was capitalized with two classes of common stock, voting and nonvoting. All of the voting common stock (an aggregate investment of $1 million) is owned by Capitol. All of the nonvoting common stock (an aggregate investment of approximately $10.9 million) was sold in a private offering to accredited investors, some of whom are related parties of Capitol. CDBL1 will be engaged in bank development activities, either on ade novobasis or through acquisition opportunities. CDBL1 was inactive at December 31, 2003 and has been included as a consolidated subsidiary of Capitol.
Capitol views itself as a bank-development company. It is engaged in the formation ofde novobanks through majority ownership made directly by Capitol, or through a subsidiary bank-development company, with the remainder of the banks’ start-up capital provided by local investors in the bank’s community. When thede novobank reaches a point of development near its third year of operation, Capitol may offer the bank’s minority shareholders an opportunity to exchange their bank shares for shares of Capitol. Capitol has made similar exchange proposals regarding the minority interests of some of its bank-development-company subsidiaries. In each instance, however, Capitol is under no obligation to offer such a share exchange and such share exchange proposals are generally subject to approval by the minority shareholders in each proposed transaction. Capitol also pursues bank development activities through exploring acquisition opportunities.
Capitol and its subsidiaries are engaged in a single business activity—banking. The bank affiliates provide a full range of banking services to individuals, businesses and other customers located in their respective communities. Each of the banks generally operate from a single location and focus their activities on meeting the various credit and other banking needs of entrepreneurs, professionals and other businesses and individuals. A variety of deposit products are offered, including checking, savings, money market, individual retirement accounts and certificates of deposit. In addition, trust and investment services are offered through Paragon Bank & Trust. The principal markets for the banks’ financial services are the communities in which they are located and the areas immediately surrounding those communities. In addition to commercial banking units, mortgage banking activities are offered through Amera Mortgage Corporation, a less than 50%-owned affiliate.
Each bank is viewed by management as being a separately identifiable business or segment from the perspective of monitoring performance and allocation of financial resources. Although the banks operate independently and are managed and monitored separately, each bank is substantially similar in terms of business focus, type of customers, products and services. Further, each of the banks and the Corporation are subject to substantially similar laws and regulations unique to the banking industry. Accordingly, the Corporation’s consolidated financial statements reflect the presentation of segment information on an aggregated basis.
31
NOTES TO CONSOLIDATED FINANCIAL STATEMENTS
Capitol Bancorp Limited
NOTE A—NATURE OF OPERATIONS, BASIS OF PRESENTATION AND PRINCIPLES OF CONSOLIDATION—Continued
The consolidated financial statements include the accounts of the Corporation and its majority-owned subsidiaries, after elimination of intercompany accounts and transactions, and after giving effect to applicable minority interests. Banks formed during 2001, 2002 and 2003 are included in the consolidated financial statements for periods after joining the consolidated group. Certain 2002 and 2001 amounts have been reclassified to conform to the 2003 presentation.
NOTE B—SIGNIFICANT ACCOUNTING POLICIES
Estimates:The preparation of consolidated financial statements in conformity with generally accepted accounting principles requires management to make certain estimates and assumptions that affect the reported amounts of assets and liabilities at the date of the consolidated financial statements and the reported amounts of revenues and expenses during the reporting period. Actual results could differ from those estimates.
Cash and Cash Equivalents:Cash and cash equivalents include cash on hand, amounts due from banks (interest-bearing and noninterest-bearing), money-market funds and federal funds sold. Generally, federal funds transactions are entered into for a one-day period.
Loans Held For Resale:Loans held for resale represent residential real estate mortgage loans held for sale into the secondary market. Loans held for resale are stated at the aggregate lower of cost or market. Fees from the origination of loans held for resale are recognized in the period the loans are originated.
Investment Securities:Investment securities available for sale (generally most debt investment securities of Capitol’s banks) are carried at market value with unrealized gains and losses reported as a separate component of stockholders’ equity, net of tax effect (accumulated other comprehensive income). All other investment securities are classified as held for long-term investment and are carried at amortized cost which approximates market value (see Note C). Investments are classified at the date of purchase based on management’s analysis of liquidity and other factors. The adjusted cost of the specific securities sold is used to compute realized gains or losses. Premiums and discounts are recognized in interest income using the interest method over the period to maturity.
Loans, Credit Risk and Allowance for Loan Losses:Portfolio loans are carried at their principal balance based on management’s intent and ability to hold such loans for the foreseeable future until maturity or repayment.
32
NOTES TO CONSOLIDATED FINANCIAL STATEMENTS
Capitol Bancorp Limited
NOTE B—SIGNIFICANT ACCOUNTING POLICIES—Continued
Credit risk arises from making loans and loan commitments in the ordinary course of business. Substantially all portfolio loans are made to borrowers in the banks’ geographic areas. Consistent with the banks’ emphasis on business lending, there are concentrations of credit in loans secured by commercial real estate, equipment and other business assets. The maximum potential credit risk to Capitol, without regard to underlying collateral and guarantees, is the total of loans and loan commitments outstanding. Management reduces Capitol’s exposure to losses from credit risk by requiring collateral and/or guarantees for loans granted and by monitoring concentrations of credit, in addition to recording provisions for loan losses and maintaining an allowance for loan losses.
The allowance for loan losses is maintained at a level believed adequate by management to absorb estimated losses inherent in the portfolio at the balance sheet date. Management’s determination of the adequacy of the allowance is an estimate based on evaluation of the portfolio (including potential impairment of individual loans and concentrations of credit), past loss experience, current economic conditions, volume, amount and composition of the loan portfolio, loan commitments outstanding and other factors. The allowance is increased by provisions charged to operations and reduced by net charge-offs.
Interest and Fees on Loans:Interest income on loans is recognized based upon the principal balance of loans outstanding. Fees from origination of portfolio loans generally approximate the direct costs of successful loan originations.
The accrual of interest is generally discontinued when a loan becomes 90 days past due as to interest. When interest accruals are discontinued, interest previously accrued (but unpaid) is reversed. Management may elect to continue the accrual of interest when the estimated net realizable value of collateral is sufficient to cover the principal balance and accrued interest and the loan is in process of collection.
Premises and Equipment:Premises and equipment are stated on the basis of cost. Depreciation, which relates primarily to equipment and furniture with estimated useful lives of approximately three to seven years, is computed principally by the straight-line method. Buildings are generally depreciated on a straight-line basis with estimated useful lives of approximately 40 years. Leasehold improvements are generally depreciated over the respective lease term.
Goodwill and Other Intangibles:Goodwill is reviewed periodically by management for impairment and, accordingly, impairment adjustments of goodwill are charged against earnings, when determined. Other intangibles, which generally consist of core deposit intangibles, are amortized over varying periods of less than 10 years and are not material.
33
NOTES TO CONSOLIDATED FINANCIAL STATEMENTS
Capitol Bancorp Limited
NOTE B—SIGNIFICANT ACCOUNTING POLICIES—Continued
Other Real Estate:Other real estate (included as a component of other assets, and at December 31, 2003 and 2002 approximated $4,248,000 and $4,605,000, respectively) comprises properties acquired through a foreclosure proceeding or acceptance of a deed in lieu of foreclosure. These properties held for sale are carried at the lower of cost or estimated fair value (net of estimated selling cost) at the date acquired and are periodically reviewed for subsequent impairment.
Stock-Based Compensation:No stock-based compensation expense is recorded upon granting of stock options because such stock options are accounted for under the provisions of Accounting Principles Board (APB) Opinion 25 (and related interpretations) and are granted at an exercise price equal to the market price of common stock at grant date. Compensation expense for awards of restricted stock is recognized ratably over the vesting periods of such awards (generally four years), based on the fair value of the common stock on the date of grant.
Statement of Financial Accounting Standards No. 123,Accounting for Stock-Based Compensation, establishes an alternative fair value method of accounting for stock options whereby compensation expense would be recognized based on the computed fair value of the options on the grant date. By not electing this alternative, certain pro forma disclosures of the expense recognition provisions of Statement No. 123 are required, which are as follows:
| | | | | | | | | | | | | | | |
| | | | | 2003 | | 2002 | | 2001 |
| | | | |
| |
| |
|
| Fair value assumptions: | | | | | | | | | | | | |
| | Risk-free interest rate | | | 3.6 | % | | | 4.5 | % | | | 5.0 | % |
| | Dividend yield | | | 2.1 | % | | | 2.5 | % | | | 2.8 | % |
| | Stock price volatility | | | .44 | | | | .46 | | | | .39 | |
| | Expected option life | | 7 years | | 7 years | | 7 years |
| Aggregate estimated fair value of options granted (in thousands) | | $ | 6,117 | | | $ | 11,548 | | | $ | 95 | |
| Net income (in thousands): | | | | | | | | | | | | |
| | As reported | | | 23,380 | | | | 16,653 | | | | 10,718 | |
| | Pro forma | | | 19,404 | | | | 8,078 | | | | 9,809 | |
| Net income per share: | | | | | | | | | | | | |
| | Basic: | | | | | | | | | | | | |
| | | As reported | | | 1.86 | | | | 1.64 | | | | 1.38 | |
| | | Pro forma | | | 1.54 | | | | 0.80 | | | | 1.26 | |
| | Diluted: | | | | | | | | | | | | |
| | | As reported | | | 1.77 | | | | 1.57 | | | | 1.35 | |
| | | Pro forma | | $ | 1.47 | | | $ | 0.76 | | | $ | 1.24 | |
Trust Assets and Related Income:Customer property, other than funds on deposit, held in a fiduciary or agency capacity by Capitol’s banks is not included in the consolidated balance sheet because it is not an asset of the banks or Capitol. Trust fee income is recorded on the accrual method.
34
NOTES TO CONSOLIDATED FINANCIAL STATEMENTS
Capitol Bancorp Limited
NOTE B—SIGNIFICANT ACCOUNTING POLICIES—Continued
Federal Income Taxes:Capitol and subsidiaries owned 80% or more by Capitol file a consolidated federal income tax return. Deferred income taxes are recognized for the tax consequences of temporary differences by applying enacted tax rates applicable to future years to differences between the financial statement carrying amounts and the tax bases of existing assets and liabilities. The effect on deferred income taxes of a change in tax laws or rates is recognized in income in the period that includes the enactment date.
Comprehensive Income:Comprehensive income is the sum of net income and certain other items which are charged or credited to stockholders’ equity. For the periods presented, Capitol’s only element of comprehensive income other than net income was the net change in the market value adjustment for investment securities available for sale. Accordingly, the elements and total of comprehensive income are shown within the statement of changes in stockholders’ equity presented herein.
New Accounting Standards:Financial Accounting Standards Board (FASB) Statement No. 142,Goodwill and Other Intangible Assets, requires that goodwill no longer be amortized and charged against earnings, but instead be reviewed for impairment. Amortization of goodwill ceased upon adoption of the Statement in 2002. Upon implementation, this new standard did not have a material effect on Capitol’s consolidated financial statements, other than the elimination of goodwill amortization ($979,000 in 2001) in future periods. If this standard had been adopted at the beginning of 2001, net income for 2001 would have approximated $11.7 million ($1.50 and $1.47 per basic and diluted share, respectively).
The FASB has also recently issued Statement No. 149,Amendment of Statement 133 on Derivative Instruments and Hedging Activities, which amends and clarifies financial accounting and reporting for derivative instruments, including certain embedded derivatives, and for hedging activities under Statement No. 133. This Statement amends Statement No. 133 to reflect the decisions made as part of FASB’s Derivatives Implementation Group and in other FASB projects or deliberations. This new standard had no material impact on Capitol’s consolidated financial statements upon implementation.
Statement No. 150,Accounting for Certain Financial Instruments with Characteristics of both Liabilities and Equity, clarifies how some instruments or securities should be classified on an issuer’s balance sheet and their related impact on income and results of operations. As it applies to its financial instruments that were within its scope, the Statement was effective for Capitol’s consolidated financial statements beginning July 1, 2003. Implementation of this new standard resulted in the reclassification of Capitol’s trust-preferred securities from their prior “mezzanine” classification (between liabilities and equity) to part of debt obligations on Capitol’s consolidated balance sheet. Although trust-preferred securities are now classified for balance-sheet purposes as debt securities, they continue to be treated as an element of capital for regulatory purposes. Trust-
35
NOTES TO CONSOLIDATED FINANCIAL STATEMENTS
Capitol Bancorp Limited
NOTE B—SIGNIFICANT ACCOUNTING POLICIES—Continued
preferred securities outstanding at December 31, 2002 have been similarly reclassified in the accompanying balance sheet for comparative purposes. This new standard had no impact on Capitol’s results of operations upon implementation.
FASB Interpretation No. 45,Guarantor’s Accounting and Disclosure Requirements for Guarantees, Including Indirect Guarantees and Indebtedness of Others(FIN 45), expands disclosures about obligations under certain guarantees and, in addition, requires recording a liability for the fair value of the obligations undertaken in issuing the guarantee, applicable to guarantees issued or modified after December 31, 2002.
Capitol has stand-by letters of credit outstanding (see Note O) that, when issued, commit the banks to make payments on behalf of customers if certain specified future events occur, generally being non-payment by the customer. They generally expire within one year and require collateral and/or personal guarantees based on management’s credit assessment. The maximum credit risk associated with these instruments equals their contractual amounts and assumes that the counterparty defaults and the collateral proves to be worthless. The total contractual amounts do not necessarily represent future cash requirements since many of these guarantees may expire without being drawn upon. FIN 45 requires that an initial liability be recorded, generally equal to the fees received, for these stand-by letters of credit. In addition to stand-by letters of credit, Capitol has guaranteed certain obligations of its affiliates (see Note O), which are also subject to the provisions of FIN 45. Because stand-by letters of credit are used infrequently by the banks and Capitol’s guarantees are similarly infrequent, this new guidance had no material effect on Capitol’s consolidated financial position or results of operations upon implementation.
FASB Interpretation No. 46,Consolidation of Variable Interest Entities, (as revised December 2003—FIN46(R)), clarifies when some entities previously not consolidated under prior accounting guidance, should be. In some instances, it also requires certain previously consolidated entities to be deconsolidated. FIN 46(R) is effective for periods ending after December 15, 2003 for special purpose entities and for periods ending after March 15, 2004 for other types of variable interest entities that are not defined as special purpose entities. Capitol is evaluating the impact of FIN 46(R) and believes that it will not have a material impact on its consolidated financial position or results of operations upon implementation. Implementation of this new guidance requires Capitol to deconsolidate its trusts which issued trust-preferred securities that are classified as debt obligations on Capitol’s consolidated balance sheet (see Note I).
Although those trusts will no longer be consolidated, the underlying subordinated debentures will continue to be reported as debt obligations on Capitol’s consolidated balance sheet. It is, however, unclear what effect, if any, such deconsolidation will have on the regulatory-capital treatment of those securities.
36
NOTES TO CONSOLIDATED FINANCIAL STATEMENTS
Capitol Bancorp Limited
NOTE B—SIGNIFICANT ACCOUNTING POLICIES—Continued
AICPA Statement of Position 03-3,Accounting for Certain Loans or Debt Securities Acquired in a Transfer(SOP 03-3), addresses the accounting for differences between contractual cash flows and cash flows expected to be collected from the initial investment in loans acquired in a transfer if those differences are attributable, at least in part, to credit quality. It includes such loans acquired in purchase business combinations and does not apply to loans originated by the entity. The SOP prohibits carrying over or creation of valuation allowances in the initial accounting for loans acquired in a transfer. It is effective for loans acquired in fiscal years beginning after December 15, 2004. The effects of this new guidance on Capitol’s consolidated financial statements will depend on future acquisition activity, thus, its impact is not readily determinable.
A variety of proposed or otherwise potential accounting standards are currently under study by standard-setting organizations and various regulatory agencies. Because of the tentative and preliminary nature of these proposed standards, management has not determined whether implementation of such proposed standards would be material to Capitol’s consolidated financial statements.
NOTE C—INVESTMENT SECURITIES
Investment securities consisted of the following at December 31 (in $1,000s):
| | | | | | | | | | | | | | | | | | |
| | | | 2003 | | 2002 |
| | | |
| |
|
| | | | | | | | Estimated | | | | | | Estimated |
| | | | Amortized | | Market | | Amortized | | Market |
| | | | Cost | | Value | | Cost | | Value |
| | | |
| |
| |
| |
|
| Available for sale: | | | | | | | | | | | | | | | | |
| | United States Treasury securities | | $ | 832 | | | $ | 835 | | | $ | 2,505 | | | $ | 2,586 | |
| | United States government agency securities | | | 25,431 | | | | 25,597 | | | | 22,460 | | | | 22,668 | |
| | Mutual funds | | | 57,424 | | | | 56,954 | | | | | | | | | |
| | States and political subdivisions | | | | | | | | | | | 101 | | | | 101 | |
| | | |
| | | |
| | | |
| | | |
| |
| | | | 83,687 | | | | 83,386 | | | | 25,066 | | | | 25,355 | |
| Held for long-term investment: | | | | | | | | | | | | | | | | |
| | Federal Reserve Bank stock | | | 483 | | | | 483 | | | | 424 | | | | 424 | |
| | Federal Home Loan Bank stock | | | 6,732 | | | | 6,732 | | | | 5,950 | | | | 5,950 | |
| | Corporate stock | | | 1,271 | | | | 1,271 | | | | 1,075 | | | | 1,075 | |
| | Other | | | 1,335 | | | | 1,335 | | | | 1,335 | | | | 1,335 | |
| | | | |
| | | |
| | | |
| | | |
| |
| | | | 9,821 | | | | 9,821 | | | | 8,784 | | | | 8,784 | |
| | | | |
| | | |
| | | |
| | | |
| |
| | | $ | 93,508 | | | $ | 93,207 | | | $ | 33,850 | | | $ | 34,139 | |
| | | | |
| | | |
| | | |
| | | |
| |
At December 31, 2003, securities with a market value approximating $23.6 million were pledged to secure public and trust deposits and for other purposes as required by law. Investments in Federal Reserve Bank stock and Federal Home Loan Bank stock are restricted and may only be resold to, or redeemed by, the issuer.
37
NOTES TO CONSOLIDATED FINANCIAL STATEMENTS
Capitol Bancorp Limited
NOTE C—INVESTMENT SECURITIES—Continued
Gross unrealized gains and losses on investment securities available for sale, which also include unrealized gains/losses on mutual funds, were as follows at December 31 (in $1,000s):
| | | | | | | | | | | | | | | | | |
| | | 2003 | | 2002 |
| | |
| |
|
| | | Gains | | Losses | | Gains | | Losses |
| | |
| |
| |
| |
|
| United States Treasury securities | | $ | 3 | | | $ | — | | | $ | 81 | | | $ | — | |
| United States government agency securities | | | 187 | | | | 21 | | | | 217 | | | | 9 | |
| Mutual funds | | | — | | | | 470 | | | | — | | | | — | |
| | | |
| | | |
| | | |
| | | |
| |
| | | $ | 190 | | | $ | 491 | | | $ | 298 | | | $ | 9 | |
| | | |
| | | |
| | | |
| | | |
| |
There were no unrealized losses with a duration of one year or more at December 31, 2003. Management does not believe any individual unrealized loss as of December 31, 2003 represents other-than-temporary losses.
Gross realized gains and losses from sales and maturities of investment securities were insignificant for each of the periods presented.
Scheduled maturities of investment securities held as of December 31, 2003 were as follows (in $1,000s):
| | | | | | | | | |
| | | | | | | Estimated |
| | | Amortized | | Market |
| | | Cost | | Value |
| | |
| |
|
| Due in one year or less | | $ | 59,262 | | | $ | 58,803 | |
| After one year, through five years | | | 19,800 | | | | 19,907 | |
| After five years, through ten years | | | 324 | | | | 339 | |
| After ten years | | | 4,301 | | | | 4,337 | |
| Securities held for long-term investment, without stated maturities | | | 9,821 | | | | 9,821 | |
| | | |
| | | |
| |
| | | $ | 93,508 | | | $ | 93,207 | |
| | | |
| | | |
| |
NOTE D—LOANS
Portfolio loans consisted of the following at December 31 (in $1,000s):
| | | | | | | | | | |
| | | | 2003 | | 2002 |
| | | |
| |
|
| Commercial | | $ | 2,033,097 | | | $ | 1,789,036 | |
| Real estate mortgage | | | 143,343 | | | | 127,855 | |
| Installment | | | 71,000 | | | | 74,481 | |
| | | |
| | | |
| |
| | Total portfolio loans | | | 2,247,440 | | | | 1,991,372 | |
| Less allowance for loan losses | | | (31,404 | ) | | | (28,953 | ) |
| | | |
| | | |
| |
| | Net portfolio loans | | $ | 2,216,036 | | | $ | 1,962,419 | |
| | | |
| | | |
| |
38
NOTES TO CONSOLIDATED FINANCIAL STATEMENTS
Capitol Bancorp Limited
NOTE D—LOANS—Continued
Transactions in the allowance for loan losses are summarized below (in $1,000s):
| | | | | | | | | | | | | | |
| | | | 2003 | | 2002 | | 2001 |
| | | |
| |
| |
|
| Balance at January 1 | | $ | 28,953 | | | $ | 23,238 | | | $ | 17,449 | |
| Provision charged to operations | | | 9,861 | | | | 12,676 | | | | 8,167 | |
| Loans charged off (deduction) | | | (8,791 | ) | | | (7,703 | ) | | | (2,929 | ) |
| Recoveries | | | 1,381 | | | | 742 | | | | 551 | |
| | | |
| | | |
| | | |
| |
| | Balance at December 31 | | $ | 31,404 | | | $ | 28,953 | | | $ | 23,238 | |
| | | |
| | | |
| | | |
| |
Impaired loans (i.e., loans for which there is a reasonable probability that borrowers would be unable to repay all principal and interest due under the contractual terms of the loan documents) were not material. Nonperforming loans (i.e., loans which are 90 days or more past due and loans on nonaccrual status) are summarized below (in $1,000s):
| | | | | | | | | | |
| | | | December 31 |
| | | |
|
| | | | 2003 | | 2002 |
| | | |
| |
|
| Nonaccrual loans: | | | | | | | | |
| | Commercial | | $ | 19,852 | | | $ | 15,444 | |
| | Real estate | | | 632 | | | | 560 | |
| | Installment | | | 376 | | | | 613 | |
| | | | |
| | | |
| |
| Total nonaccrual loans | | | 20,860 | | | | 16,617 | |
| |
| Past due (>90 days) loans: | | | | | | | | |
| | Commercial | | | 4,544 | | | | 5,728 | |
| | Real estate | | | 1,083 | | | | 323 | |
| | Installment | | | 385 | | | | 222 | |
| | | | |
| | | |
| |
| Total past due loans | | | 6,012 | | | | 6,273 | |
| | | | |
| | | |
| |
| Total nonperforming loans | | $ | 26,872 | | | $ | 22,890 | |
| | | | |
| | | |
| |
If nonperforming loans had performed in accordance with their contractual terms during the year, additional interest income of $2,046,000, $1,514,000 and $694,000 would have been recorded in 2003, 2002 and 2001, respectively. Interest income recognized on loans in nonaccrual status in 2003, 2002 and 2001 operations approximated $866,000, $385,000 and $513,000, respectively. At December 31, 2003, there were no material amounts of loans which were restructured or otherwise renegotiated as a concession to troubled borrowers.
39
NOTES TO CONSOLIDATED FINANCIAL STATEMENTS
Capitol Bancorp Limited
NOTE D—LOANS—Continued
The amounts of the allowance for loan losses allocated in the following table (in $1,000s) are based on management’s estimate of losses inherent in the portfolio at the balance sheet date, and should not be interpreted as an indication of future charge-offs:
| | | | | | | | | | | | | | | | | |
| | | December 31, 2003 | | December 31, 2002 |
| | |
| |
|
| | | | | | | Percentage | | | | | | Percentage |
| | | | | | | of Total | | | | | | of Total |
| | | | | | | Portfolio | | | | | | Portfolio |
| | | Amount | | Loans | | Amount | | Loans |
| | |
| |
| |
| |
|
| Commercial | | $ | 29,001 | | | | 1.29 | % | | $ | 27,226 | | | | 1.37 | % |
| Real estate mortgage | | | 1,408 | | | | 0.06 | | | | 1,009 | | | | 0.05 | |
| Installment | | | 995 | | | | 0.05 | | | | 718 | | | | 0.03 | |
| | | |
| | | |
| | | |
| | | |
| |
| Total allowance for loan losses | | $ | 31,404 | | �� | | 1.40 | % | | $ | 28,953 | | | | 1.45 | % |
| | | |
| | | |
| | | |
| | | |
| |
NOTE E—RELATED PARTIES TRANSACTIONS
In the ordinary course of business, Capitol’s banking subsidiaries make loans to officers and directors of Capitol and its subsidiaries including their immediate families and companies in which they are principal owners. At December 31, 2003 and 2002, total loans to these persons were $99 million and $94.3 million, respectively. During 2003, $79.4 million of new loans were made to these persons and repayments totaled $74.7 million. Such loans are made at the banking subsidiaries’ normal credit terms.
Officers and directors of Capitol (and their associates, family and/or affiliates) are also depositors of the banking subsidiaries. Such deposits are similarly made at the banks’ normal terms as to interest rate, term and deposit insurance.
NOTE F—PREMISES AND EQUIPMENT
Major classes of premises and equipment consisted of the following at December 31 (in $1,000s):
| | | | | | | | | |
| | | 2003 | | 2002 |
| | |
| |
|
| Land, buildings and improvements | | $ | 8,220 | | | $ | 7,344 | |
| Leasehold improvements | | | 10,066 | | | | 7,965 | |
| Equipment and furniture | | | 23,314 | | | | 20,120 | |
| | | |
| | | |
| |
| | | | 41,600 | | | | 35,429 | |
| Less accumulated depreciation | | | (16,807 | ) | | | (13,692 | ) |
| | | |
| | | |
| |
| | | $ | 24,793 | | | $ | 21,737 | |
| | | |
| | | |
| |
40
NOTES TO CONSOLIDATED FINANCIAL STATEMENTS
Capitol Bancorp Limited
NOTE F—PREMISES AND EQUIPMENT—Continued
Capitol and certain subsidiaries rent office space under operating leases. Rent expense (net of sublease income) under these lease agreements approximated $5,313,000, $4,394,000 and $3,652,000 (including rent expense of $1,871,000, $1,457,000 and $1,138,000 under leases with related parties) in 2003, 2002 and 2001, respectively.
At December 31, 2003, future minimum rental payments under operating leases that have initial or remaining noncancelable lease terms in excess of one year were as follows (in $1,000s):
| | | | | |
| 2004 | | $ | 5,607 | |
| 2005 | | | 5,374 | |
| 2006 | | | 5,316 | |
| 2007 | | | 4,609 | |
| 2008 | | | 3,642 | |
| 2009 and thereafter | | | 8,533 | |
| | | |
| |
| | | $ | 33,081 | |
| | | |
| |
NOTE G—DEPOSITS
The aggregate amount of time deposits of $100,000 or more approximated $584.2 million and $564.6 million as of December 31, 2003 and 2002, respectively.
At December 31, 2003, the scheduled maturities of such time deposits were as follows (in $1,000s):
| | | | | |
| 2004 | | $ | 411,916 | |
| 2005 | | | 113,451 | |
| 2006 | | | 35,596 | |
| 2007 | | | 14,767 | |
| 2008 and thereafter | | | 8,464 | |
| | | |
| |
| | | $ | 584,194 | |
| | | |
| |
Interest paid approximates amounts charged to operations on an accrual basis for the periods presented.
NOTE H—NOTES PAYABLE
Notes payable consisted of the following at December 31 (in $1,000s):
| | | | | | | | | |
| | | 2003 | | 2002 |
| | |
| |
|
| Borrowings from Federal Home Loan Bank | | $ | 92,774 | | | $ | 79,198 | |
| Notes payable to unaffiliated bank | | | — | | | | 12,500 | |
| Federal funds purchased | | | — | | | | 1,700 | |
| | | |
| | | |
| |
| | | $ | 92,774 | | | $ | 93,398 | |
| | | |
| | | |
| |
41
NOTES TO CONSOLIDATED FINANCIAL STATEMENTS
Capitol Bancorp Limited
NOTE H—NOTES PAYABLE—Continued
Borrowings from Federal Home Loan Bank (FHLB) represent advances secured by certain portfolio residential real estate mortgage loans and other eligible collateral. Such advances become due at varying dates and bear interest at market short-term rates (approximately 3.37% at December 31, 2003). At December 31, 2003, unused lines of credit under these facilities approximated $47 million.
Notes payable to unaffiliated bank represents borrowings under a line of credit. Up to $25 million can be borrowed pursuant to a one-year revolving credit agreement which bears interest at a variable rate (3.75% at December 31, 2003), payable monthly and a quarterly facility fee on the unused portion. There were no amounts drawn on the line of credit at December 31, 2003. The credit facility is reviewed annually for continuance and requires Capitol, among other things, to maintain certain minimum levels of capital, rates of return on assets and other ratios or requirements and is secured by the common stock of certain bank subsidiaries.
For the periods presented, interest paid on all debt obligations approximates amounts charged to expense.
At December 31, 2003, scheduled debt maturities of notes payable were as follows (in $1,000s):
| | | | | |
| 2004 | | $ | 37,100 | |
| 2005 | | | 13,324 | |
| 2006 | | | 5,000 | |
| 2007 | | | 3,000 | |
| 2008 and thereafter | | | 34,350 | |
| | | |
| |
| | | $ | 92,774 | |
| | | |
| |
In addition to the foregoing, Capitol has guaranteed some obligations of its subsidiaries (see Note O).
[The remainder of this page intentionally left blank]
42
NOTES TO CONSOLIDATED FINANCIAL STATEMENTS
Capitol Bancorp Limited
NOTE I—TRUST-PREFERRED SECURITIES
Trust-preferred securities represent interests in subordinated debentures of Capitol which are summarized as follows:
| | | | | | | | | | | | | | | | | | | | | |
| | | | | | | | | | | | | | | Net Carrying Amount |
| | | | | | | | | | | Aggregate | | at December 31 |
| | | Interest Rate at | | | | | | Liquidation | |
|
| | | December 31, | | Scheduled | | Amount | | (in $1,000s) |
| Description | | 2003 | | Maturity | | (in $1,000s) | | 2003 | | 2002 |
| |
| |
| |
| |
| |
|
| Capitol Trust I | | 8.50% fixed | | | 2027 | | | $ | 25,300 | | | $ | 24,435 | | | $ | 24,399 | |
| Capitol Trust II | | 10.25% fixed | | | 2031 | | | | 10,000 | | | | 9,723 | | | | 9,713 | |
| Capitol Statutory Trust III | | 4.74% variable | | | 2031 | | | | 15,000 | | | | 14,585 | | | | 14,570 | |
| Capitol Trust IV | | 4.77% variable | | | 2032 | | | | 3,000 | | | | 2,904 | | | | 2,901 | |
| Capitol Trust VI | | 4.45% variable | | | 2033 | | | | 10,000 | | | | 9,707 | | | | | |
| Capitol Trust VII | | 7.78% fixed | | | 2033 | | | | 10,000 | | | | 9,851 | | | | | |
| Capitol Statutory Trust VIII | | 4.74% variable | | | 2033 | | | | 20,000 | | | | 19,611 | | | | | |
| | | | | | | | | | | |
| | | |
| | | |
| |
| | | | | | | | | | | $ | 93,300 | | | $ | 90,816 | | | $ | 51,583 | |
| | | | | | | | | | | |
| | | |
| | | |
| |
Securities of Capitol Trust I were issued in a 1997 public offering. Capitol Trust II and Capitol Statutory Trust III were formed in 2001 in conjunction with private placements of pooled trust-preferred securities. Capitol Trust IV was formed in 2002 and Capitol Trust VI, Capitol Trust VII and Capitol Statutory Trust VIII were formed in 2003. Each of these securities have similar terms and, subject to certain provisions, may be called by the issuer five years after issuance. The liquidation amount of these securities is guaranteed by Capitol.
Interest paid to the Trusts by Capitol (which is recorded as interest expense in its consolidated financial statements) is distributed by the Trusts to the holders of the trust-preferred securities. Under certain conditions, Capitol may defer payment of interest on the subordinated debentures for periods of up to five years.
Because these Trusts are subsidiaries (due to Capitol’s ownership of the common interests of the Trusts), they are consolidated for financial reporting purposes. The carrying amount of outstanding trust-preferred securities is net of issuance costs, which are being amortized over the life of the securities. Under current regulatory guidelines, such trust-preferred securities are included as capital for purposes of meeting certain ratio requirements.
As discussed in Note B, trust-preferred securities are classified as debt obligations for financial reporting purposes at December 31, 2003 and 2002. As also discussed in Note B, the Trusts will no longer be consolidated for periods ending after March 15, 2004 (however, the underlying subordinated debentures will continue to be reported as debt obligations of Capitol) and the future regulatory capital treatment of trust-preferred securities remains uncertain at January 1, 2004.
43
NOTES TO CONSOLIDATED FINANCIAL STATEMENTS
Capitol Bancorp Limited
NOTE J—RESTRICTED COMMON STOCK AND STOCK OPTIONS
Restricted common stock has been granted to certain officers. Compensation expense relating to the award of restricted stock is recognized ratably over the vesting periods of such awards (generally four years). The weighted-average grant-date fair value of restricted stock awards in 2003 was $21.76 per share. Compensation expense related to restricted stock in 2003 approximated $642,000.
Stock options have been granted to certain officers and directors which provide for the purchase of shares of common stock. Generally, stock options are granted at an exercise price equal to the fair value of common stock on the grant date. All such stock options expire seven years after the date granted.
Stock option activity is summarized as follows:
| | | | | | | | | | | | | | | | | | | | | |
| | | Number | | | | | | | | | | | | | | Weighted |
| | | of Stock | | | | | | | | | | | | | | Average |
| | | Options | | Exercise | | Exercise |
| | | Outstanding | | Price Range | | Price |
| | |
| |
| |
|
| Outstanding at January 1, 2001 | | | 1,204,162 | | | $ | 4.92 | | | to | | $ | 25.10 | | | $ | 12.39 | |
| Granted in 2001 | | | 17,311 | | | | 11.50 | | | to | | | 14.48 | | | | 11.95 | |
| Exercised in 2001 | | | (18,350 | ) | | | 4.92 | | | to | | | 11.00 | | | | 7.18 | |
| | | |
| | | |
| | | |
| | | |
| | | |
| |
| Outstanding at December 31, 2001 | | | 1,203,123 | | | | 4.92 | | | to | | | 25.10 | | | | 12.46 | |
| |
| Granted in 2002 | | | 1,669,004 | | | | 13.50 | | | to | | | 23.24 | | | | 16.39 | |
| Exercised in 2002 | | | (138,447 | ) | | | 8.17 | | | to | | | 16.17 | | | | 9.68 | |
| Cancelled or expired in 2002 | | | (185,144 | ) | | | | | | | | | | | | | | | | |
| | | |
| | | |
| | | |
| | | |
| | | |
| |
| Outstanding at December 31, 2002 | | | 2,548,536 | | | | 4.92 | | | to | | | 25.10 | | | | 15.23 | |
| |
| Granted in 2003 | | | 577,200 | | | | 20.36 | | | to | | | 27.23 | | | | 24.45 | |
| Exercised in 2003 | | | (801,448 | ) | | | 4.92 | | | to | | | 25.92 | | | | 14.41 | |
| Cancelled or expired in 2003 | | | (26,221 | ) | | | | | | | | | | | | | | | | |
| | | |
| | | |
| | | |
| | | |
| | | |
| |
| Outstanding at December 31, 2003 | | | 2,298,067 | | | $ | 9.88 | | | to | | $ | 27.23 | | | $ | 16.95 | |
As of December 31, 2003, stock options outstanding had a weighted average remaining contractual life of 4.3 years. The following table summarizes stock options outstanding segregated by exercise price range:
| | | | | | | | | | | | | |
| | | | | | | Weighted Average |
| | | | | | |
|
| | | | | | | | | | | Remaining |
| Exercise Price | | Number | | Exercise | | Contractual |
| Range | | Outstanding | | Price | | Life |
| |
| |
| |
|
| Less than $10.00 | | | 55,718 | | | $ | 9.88 | | | 4.0 years |
| $10.00 to 14.99 | | | 548,205 | | | | 11.54 | | | 3.3 years |
| $15.00 to 19.99 | | | 905,379 | | | | 17.88 | | | 4.4 years |
| $20.00 to 24.99 | | | 452,071 | | | | 21.37 | | | 5.7 years |
| $25.00 or more | | | 336,694 | | | $ | 26.15 | | | 4.1 years |
| | | |
| | | | | | | | | |
| | | | 2,298,067 | | | | | | | | | |
44
NOTES TO CONSOLIDATED FINANCIAL STATEMENTS
Capitol Bancorp Limited
NOTE K—EMPLOYEE RETIREMENT PLANS
Capitol has a contributory employee retirement savings 401(k) plan which covers substantially all full-time employees of Capitol and certain subsidiaries over age 21. The Plan provides for employer contributions in amounts determined annually by Capitol’s board of directors. Eligible employees make voluntary contributions to the Plan. Contributions to the Plan, which are an employer match (50%, subject to certain limitations) for employee contributions, charged to expense for the years ended December 31, 2003, 2002 and 2001 were $918,000, $717,000 and $691,000, respectively.
Capitol also has a defined contribution employee stock ownership plan (ESOP) which covers substantially all employees of Capitol and certain subsidiaries. Certain common stock purchases by the ESOP were financed by long-term debt. ESOP contributions charged to expense in 2003, 2002 and 2001 approximated $642,000, $405,000 and $525,000 (including ESOP note payable interest of $12,000, $24,000 and $37,000), respectively. Certain shares of common stock held by the ESOP which were not allocated to participants’ accounts were shown as a reduction of stockholders’ equity through December 31, 2002. As of December 31, 2003, the ESOP held approximately 252,500 shares of Capitol’s common stock which have been allocated to participants’ accounts; there were no unallocated shares as of that date.
NOTE L—INCOME TAXES
Federal income taxes consist of the following components (in $1,000s):
| | | | | | | | | | | | | |
| | | 2003 | | 2002 | | 2001 |
| | |
| |
| |
|
| Current | | $ | 12,549 | | | $ | 10,925 | | | $ | 7,169 | |
| Deferred expense (credit) | | | 325 | | | | (2,224 | ) | | | (1,345 | ) |
| | | |
| | | |
| | | |
| |
| | | $ | 12,874 | | | $ | 8,701 | | | $ | 5,824 | |
| | | |
| | | |
| | | |
| |
Federal income taxes paid in 2003, 2002 and 2001 approximated $9.7 million, $11.9 million and $8.4 million, respectively.
Differences between federal income tax expense recorded and amounts computed using the statutory tax rate are reconciled below (in $1,000s):
| | | | | | | | | | | | | | |
| | | | 2003 | | 2002 | | 2001 |
| | | |
| |
| |
|
Federal income tax computed at statutory rate(1) | | $ | 12,964 | | | $ | 9,012 | | | $ | 6,048 | |
| Tax effect of: | | | | | | | | | | | | |
| | Amortization of goodwill and other intangibles | | | 186 | | | | 139 | | | | 333 | |
| | Minority interest | | | (423 | ) | | | (213 | ) | | | (641 | ) |
| | Adjustment of deferred income taxes to
effective tax rate of 35% | | | | | | | (221 | ) | | | | |
| | Other | | | 147 | | | | (16 | ) | | | 84 | |
| | | |
| | | |
| | | |
| |
| | | $ | 12,874 | | | $ | 8,701 | | | $ | 5,824 | |
| | | |
| | | |
| | | |
| |
| (1) | | 35% in 2003 and 2002; 34% in 2001. |
45
NOTES TO CONSOLIDATED FINANCIAL STATEMENTS
Capitol Bancorp Limited
NOTE L—INCOME TAXES—Continued
Net deferred income tax assets consisted of the following at December 31 (in $1,000s):
| | | | | | | | | |
| | | 2003 | | 2002 |
| | |
| |
|
| Allowance for loan losses | | $ | 9,493 | | | $ | 8,541 | |
| Net operating losses of subsidiaries | | | 745 | | | | 1,116 | |
| Deferred compensation | | | 1,515 | | | | 1,370 | |
| Market value adjustment for investment securities available for sale | | | 102 | | | | (98 | ) |
| Other, net | | | (408 | ) | | | 643 | |
| | | |
| | | |
| |
| | | $ | 11,447 | | | $ | 11,572 | |
| | | |
| | | |
| |
Certain consolidated subsidiaries have net operating loss carryforwards which may reduce income taxes payable in future periods. Such carryforwards approximate $2.1 million at December 31, 2003, have been recognized for financial reporting purposes and expire at the following dates and amounts (in $1,000s):
| | | | | |
| 2021 | | $ | 12 | |
| 2022 | | | 1,153 | |
| 2023 | | | 963 | |
| | | |
| |
| | | $ | 2,128 | |
| | | |
| |
NOTE M—NET INCOME PER SHARE
The computations of basic and diluted net income per share were as follows (in 1,000s):
| | | | | | | | | | | | | | | | |
| | | | | | 2003 | | 2002 | | 2001 |
| | | | | |
| |
| |
|
| Numerator—net income | | $ | 23,380 | | | $ | 16,653 | | | $ | 10,718 | |
| | | |
| | | |
| | | |
| |
| Denominator: | | | | | | | | | | | | |
| | Weighted average number of shares outstanding, excluding unvested restricted shares (denominator for basic earnings per share) | | | 12,602 | | | | 10,139 | | | | 7,784 | |
| | Effect of dilutive securities: | | | | | | | | | | | | |
| | | Unvested restricted shares | | | 157 | | | | | | | | | |
| | | Warrants | | | | | | | 12 | | | | 15 | |
| | | Stock options | | | 416 | | | | 449 | | | | 136 | |
| | | |
| | | |
| | | |
| |
| | | | Potential dilution | | | 573 | | | | 461 | | | | 151 | |
| | | |
| | | |
| | | |
| |
| Denominator for diluted earnings per share—weighted average number of shares and potential dilution | | | 13,175 | | | | 10,600 | | | | 7,935 | |
| | | |
| | | |
| | | |
| |
| Number of antidilutive stock options excluded from diluted earnings per share computation | | | 337 | | | | 243 | | | | 159 | |
| | | |
| | | |
| | | |
| |
Additional disclosures regarding stock options are set forth in Note J.
46
NOTES TO CONSOLIDATED FINANCIAL STATEMENTS
Capitol Bancorp Limited
NOTE N—ESTIMATED FAIR VALUE OF FINANCIAL INSTRUMENTS
Carrying values and estimated fair values of financial instruments were as follows at December 31 (in $1,000s):
| | | | | | | | | | | | | | | | | | | | | |
| | | | | | | 2003 | | 2002 |
| | | | | | |
| |
|
| | | | | | | | | | | Estimated | | | | | | Estimated |
| | | | | | | Carrying | | Fair | | Carrying | | Fair |
| | | | | | | Value | | Value | | Value | | Value |
| | | | | | |
| |
| |
| |
|
| Financial Assets: | | | | | | | | | | | | | | | | |
| | Cash and cash equivalents | | $ | 283,623 | | | $ | 283,623 | | | $ | 251,184 | | | $ | 251,184 | |
| | Loans held for resale | | | 43,001 | | | | 43,001 | | | | 75,420 | | | | 75,420 | |
| | Investment securities: | | | | | | | | | | | | | | | | |
| | | Available for sale | | | 83,386 | | | | 83,386 | | | | 25,355 | | | | 25,355 | |
| | | Held for long-term investment | | | 9,821 | | | | 9,821 | | | | 8,784 | | | | 8,784 | |
| | | | |
| | | |
| | | |
| | | |
| |
| | | | 93,207 | | | | 93,207 | | | | 34,139 | | | | 34,139 | |
| | Portfolio loans: | | | | | | | | | | | | | | | | |
| | | Fixed rate | | | 849,446 | | | | 853,931 | | | | 932,198 | | | | 932,209 | |
| | | Variable rate | | | 1,397,994 | | | | 1,411,701 | | | | 1,059,174 | | | | 1,059,753 | |
| | | | |
| | | |
| | | |
| | | |
| |
| | | | Total portfolio loans | | | 2,247,440 | | | | 2,265,632 | | | | 1,991,372 | | | | 1,991,962 | |
| | | Less allowance for loan losses | | | (31,404 | ) | | | (31,404 | ) | | | (28,953 | ) | | | (28,953 | ) |
| | | | |
| | | |
| | | |
| | | |
| |
| | | Net portfolio loans | | | 2,216,036 | | | | 2,234,228 | | | | 1,962,419 | | | | 1,963,009 | |
| |
| Financial Liabilities: | | | | | | | | | | | | | | | | |
| | Deposits: | | | | | | | | | | | | | | | | |
| | | Noninterest-bearing | | | 435,599 | | | | 435,599 | | | | 360,669 | | | | 360,669 | |
| | | Interest-bearing: | | | | | | | | | | | | | | | | |
| | | | Demand accounts | | | 971,879 | | | | 973,042 | | | | 805,883 | | | | 807,182 | |
| | | | Time certificates of less than $100,000 | | | 296,992 | | | | 293,897 | | | | 330,960 | | | | 331,852 | |
| | | | Time certificates of $100,000 or more | | | 584,194 | | | | 590,374 | | | | 564,560 | | | | 567,319 | |
| | | | |
| | | |
| | | |
| | | |
| |
| | | | | Total interest-bearing | | | 1,853,065 | | | | 1,857,313 | | | | 1,701,403 | | | | 1,706,353 | |
| | | | |
| | | |
| | | |
| | | |
| |
| | | | | Total deposits | | | 2,288,664 | | | | 2,292,912 | | | | 2,062,072 | | | | 2,067,022 | |
| | Notes payable | | | 92,774 | | | | 92,867 | | | | 93,398 | | | | 93,385 | |
| | Trust-preferred securities | | | 90,816 | | | | 93,300 | | | | 51,583 | | | | 53,300 | |
Estimated fair values of financial assets and liabilities are based upon a comparison of current interest rates on financial instruments and the timing of related scheduled cash flows to the estimated present value of such cash flows using current estimated market rates of interest (unless quoted market values or other fair value information is more readily available). Such estimates of fair value are not intended to represent market value or portfolio liquidation value, and only represent an estimate of fair values based on current financial reporting requirements.
47
NOTES TO CONSOLIDATED FINANCIAL STATEMENTS
Capitol Bancorp Limited
NOTE O—COMMITMENTS, GUARANTEES AND OTHER CONTINGENCIES
In the ordinary course of business, loan commitments are made to accommodate the financial needs of bank customers. Loan commitments include stand-by letters of credit, lines of credit, and other commitments for commercial, installment and mortgage loans. Stand-by letters of credit, when issued, commit the bank to make payments on behalf of customers if certain specified future events occur and are used infrequently by the banks ($25.4 million and $17.3 million outstanding at December 31, 2003 and 2002, respectively). Other loan commitments outstanding consist of unused lines of credit and approved, but unfunded, specific loan commitments ($510.9 million and $455.6 million at December 31, 2003 and 2002, respectively). These loan commitments (stand-by letters of credit and unfunded loans) generally expire within one year and are reviewed periodically for continuance or renewal.
All loan commitments have credit risk essentially the same as that involved in routinely making loans to customers and are made subject to the banks’ normal credit policies. In making these loan commitments, collateral and/or personal guarantees of the borrowers are generally obtained based on management’s credit assessment.
The banking subsidiaries are required to maintain average reserve balances in the form of cash on hand and balances due from the Federal Reserve Bank and correspondent banks. The amount of reserve balances required as of December 31, 2003 and 2002 were $4.5 million and $3.5 million, respectively.
Deposits at each of the banks are insured up to the maximum amount covered by FDIC insurance. Some of the banks have municipal government deposits which are guaranteed by Capitol ($20.5 million at December 31, 2003).
Capitol has guaranteed up to $7.5 million of secured borrowings by Amera Mortgage Corporation, a less than 50%-owned affiliate.
48
NOTES TO CONSOLIDATED FINANCIAL STATEMENTS
Capitol Bancorp Limited
NOTE P—DIVIDEND LIMITATIONS OF SUBSIDIARIES AND OTHER CAPITAL REQUIREMENTS
Current banking regulations restrict the ability to transfer funds from subsidiaries to their parent in the form of cash dividends, loans or advances. Subject to various regulatory capital requirements, bank subsidiaries’ current and retained earnings are available for distribution as dividends to Capitol (and other bank shareholders, as applicable) without prior approval from regulatory authorities. Substantially all of the remaining net assets of the subsidiaries are restricted as to payments to Capitol.
Each bank and Capitol are subject to certain other capital requirements. Federal financial institution regulatory agencies have established certain risk-based capital guidelines for banks and bank holding companies. Those guidelines require all banks and bank holding companies to maintain certain minimum ratios and related amounts based on ‘Tier 1’ and ‘Tier 2’ capital and ‘risk-weighted assets’ as defined and periodically prescribed by the respective regulatory agencies. Failure to meet these capital requirements can result in severe regulatory enforcement action or other adverse consequences for a depository institution and, accordingly, could have a material impact on Capitol’s consolidated financial statements.
Under the regulatory capital adequacy guidelines and related framework for prompt corrective action, the specific capital requirements involve quantitative measures of assets, liabilities and certain off-balance-sheet items calculated under regulatory accounting practices. The capital amounts and classifications are also subject to qualitative judgements by regulatory agencies with regard to components, risk weighting and other factors.
As a condition of their charter approval,de novobanks are generally required to maintain a core capital (Tier 1) to average assets ratio of not less than 8% (4% for other banks) and an allowance for loan losses of not less than 1% for the first three years of operations.
As of December 31, 2003, the most recent notifications received by the banks from regulatory agencies have advised that the banks are classified as ‘well capitalized’ as defined by the applicable agencies. There are no conditions or events since those notifications that management believes would change the regulatory classification of the banks.
Management believes, as of December 31, 2003, that Capitol and the banks meet all capital adequacy requirements to which the entities are subject.
49
NOTES TO CONSOLIDATED FINANCIAL STATEMENTS
Capitol Bancorp Limited
NOTE P—DIVIDEND LIMITATIONS OF SUBSIDIARIES AND OTHER CAPITAL REQUIREMENTS—Continued
The following table summarizes the amounts (in $1,000s) and related ratios of the individually significant subsidiaries (assets of $200 million or more) and consolidated regulatory capital position as of December 31, 2003 and 2002:
| | | | | | | | | | | | | | | | |
| | | | | | Ann Arbor | | Capitol | | | | |
| | | | | | Commerce | | National | | | | |
| | | | | | Bank | | Bank | | Consolidated |
| | | | | |
| |
| |
|
| December 31, 2003 | | | | | | | | | | | | |
| | Tier 1 capital to average adjusted total assets: | | | | | | | | | | | | |
| | | Minimum required amount | | ³$ | 12,531 | | | ³$ | 8,543 | | | ³$ | 104,133 | |
| | | Actual amount | | $ | 25,262 | | | $ | 16,405 | | | $ | 287,071 | |
| | | | Ratio | | | 8.06 | % | | | 7.68 | % | | | 11.03 | % |
| |
| | Tier 1 capital to risk-weighted assets: | | | | | | | | | | | | |
| | | Minimum required amount(1) | | ³$ | 11,502 | | | ³$ | 7,415 | | | ³$ | 93,751 | |
| | | Actual amount | | $ | 25,262 | | | $ | 16,405 | | | $ | 287,071 | |
| | | | Ratio | | | 8.79 | % | | | 8.85 | % | | | 12.25 | % |
| |
| | Combined Tier 1 and Tier 2 capital to risk- weighted assets: | | | | | | | | | | | | |
| | | Minimum required amount(2) | | ³$ | 23,003 | | | ³$ | 14,829 | | | ³$ | 187,503 | |
| | | Amount required to meet ‘Well-Capitalized’ category(3) | | $ | 28,754 | | | $ | 18,537 | | | $ | 234,379 | |
| | | Actual amount | | $ | 28,860 | | | $ | 18,616 | | | $ | 335,429 | |
| | | | Ratio | | | 10.04 | % | | | 10.04 | % | | | 14.31 | % |
| |
| December 31, 2002 | | | | | | | | | | | | |
| | Tier 1 capital to average adjusted total assets: | | | | | | | | | | | | |
| | | Minimum required amount | | ³$ | 12,445 | | | ³$ | 8,092 | | | ³$ | 95,670 | |
| | | Actual amount | | $ | 23,512 | | | $ | 14,631 | | | $ | 216,965 | |
| | | | Ratio | | | 7.56 | % | | | 7.23 | % | | | 9.07 | % |
| �� |
| | Tier 1 capital to risk-weighted assets: | | | | | | | | | | | | |
| | | Minimum required amount(1) | | ³$ | 10,707 | | | ³$ | 6,628 | | | ³$ | 82,506 | |
| | | Actual amount | | $ | 23,512 | | | $ | 14,631 | | | $ | 216,965 | |
| | | | Ratio | | | 8.78 | % | | | 8.83 | % | | | 10.52 | % |
| |
| | Combined Tier 1 and Tier 2 capital to risk- weighted assets: | | | | | | | | | | | | |
| | | Minimum required amount(2) | | ³$ | 21,413 | | | ³$ | 13,256 | | | ³$ | 165,011 | |
| | | Amount required to meet ‘Well-Capitalized’ category(3) | | $ | 26,767 | | | $ | 16,569 | | | $ | 206,264 | |
| | | Actual amount | | $ | 26,864 | | | $ | 16,705 | | | $ | 242,787 | |
| | | | Ratio | | | 10.04 | % | | | 10.08 | % | | | 11.77 | % |
| (1) | | The minimum required ratio of Tier 1 capital to risk-weighted assets is 4%. |
| |
| (2) | | The minimum required ratio of Tier 1 and Tier 2 capital to risk-weighted assets is 8%. |
| |
| (3) | | In order to be classified as a ‘well-capitalized’ institution, the ratio of Tier 1 and Tier 2 capital to risk-weighted assets must be 10% or more. |
50
NOTES TO CONSOLIDATED FINANCIAL STATEMENTS
Capitol Bancorp Limited
NOTE Q—PARENT COMPANY FINANCIAL INFORMATION
Condensed Balance Sheets
| | | | | | | | | | | |
| | | | | - December 31 - |
| | | | | |
| | | | | 2003 | | 2002 |
| | | | |
| |
|
| | | | | (in $1,000s) |
| Assets | | | | | | | | |
| | Cash on deposit principally with subsidiary banks | | $ | 2,228 | | | $ | 1,642 | |
| | Money market funds on deposit principally with subsidiary banks | | | 15,194 | | | | 5,272 | |
| | Time deposits principally with subsidiary banks | | | 20,116 | | | | 110 | |
| | Investments in and amounts due from subsidiaries | | | 256,741 | | | | 197,851 | |
| | Notes receivable, net | | | 417 | | | | 1,130 | |
| | Investment in and advances to Amera Mortgage Corporation | | | 859 | | | | 889 | |
| | Equipment and furniture, net | | | 1,853 | | | | 1,340 | |
| | Goodwill and other intangibles | | | 15,703 | | | | 16,235 | |
| | Other assets | | | 7,417 | | | | 7,073 | |
| | | | |
| | | |
| |
| | | Total assets | | $ | 320,528 | | | $ | 231,542 | |
| | | | |
| | | |
| |
| Liabilities and Stockholders’ Equity | | | | | | | | |
| | Accounts payable, accrued expenses and other liabilities | | $ | 7,927 | | | $ | 6,640 | |
| | Debt obligations payable to unaffiliated entities | | | | | | | 12,500 | |
| | Subordinated debentures | | | 93,704 | | | | 52,365 | |
| | | | |
| | | |
| |
| | | Total liabilities | | | 101,631 | | | | 71,505 | |
| | Stockholders’ equity | | | 218,897 | | | | 160,037 | |
| | | | |
| | | |
| |
| | | Total liabilities and stockholders’ equity | | $ | 320,528 | | | $ | 231,542 | |
| | | | |
| | | |
| |
Condensed Statements Of Income
| | | | | | | | | | | | | | | |
| | | | | - Year Ended December 31 - |
| | | | | |
| | | | | 2003 | | 2002 | | 2001 |
| | | | |
| |
| |
|
| | | | | (in $1,000s) |
| Income: | | | | | | | | | | | | |
| | Dividends from subsidiaries | | $ | 13,675 | | | $ | 10,755 | | | $ | 7,896 | |
| | Intercompany fees | | | 14,752 | | | | 9,722 | | | | 6,130 | |
| | Interest | | | 118 | | | | 253 | | | | 200 | |
| | Other | | | 2,047 | | | | 51 | | | | 69 | |
| | | | |
| | | |
| | | |
| |
| | | Total income | | | 30,592 | | | | 20,781 | | | | 14,295 | |
| Expenses: | | | | | | | | | | | | |
| | Interest | | | 4,874 | | | | 5,016 | | | | 5,102 | |
| | Salaries and employee benefits | | | 11,950 | | | | 7,662 | | | | 4,997 | |
| | Occupancy | | | 963 | | | | 590 | | | | 399 | |
| | Amortization, equipment rent and depreciation | | | 1,483 | | | | 963 | | | | 1,086 | |
| | Other | | | 3,131 | | | | 2,224 | | | | 908 | |
| | | | |
| | | |
| | | |
| |
| | | Total expenses | | | 22,401 | | | | 16,455 | | | | 12,492 | |
| | | | |
| | | |
| | | |
| |
| Income before equity in undistributed net earnings of consolidated subsidiaries and federal income taxes | | | 8,191 | | | | 4,326 | | | | 1,803 | |
| Equity in undistributed net earnings of consolidated subsidiaries | | | 13,494 | | | | 9,861 | | | | 6,496 | |
| | | | |
| | | |
| | | |
| |
| Income before federal income taxes | | | 21,685 | | | | 14,187 | | | | 8,299 | |
| Federal income taxes (credit) | | | (1,695 | ) | | | (2,466 | ) | | | (2,419 | ) |
| | | | |
| | | |
| | | |
| |
| | | Net income | | $ | 23,380 | | | $ | 16,653 | | | $ | 10,718 | |
| | | | |
| | | |
| | | |
| |
51
NOTES TO CONSOLIDATED FINANCIAL STATEMENTS
Capitol Bancorp Limited
NOTE Q—PARENT COMPANY FINANCIAL INFORMATION—Continued
Condensed Statements of Cash Flows
| | | | | | | | | | | | | | | | |
| | | | | | - Year Ended December 31 - |
| | | | | | 2003 | | 2002 | | 2001 |
| | | | | |
| |
| |
|
| | | | | | (in $1,000s) |
| OPERATING ACTIVITIES | | | | | | | | | | | | |
| | Net income | | $ | 23,380 | | | $ | 16,653 | | | $ | 10,718 | |
| | Adjustments to reconcile net income to net cash provided by operating activities: | | | | | | | | | | | | |
| | | | Equity in undistributed net earnings of subsidiaries | | | (13,494 | ) | | | (9,861 | ) | | | (6,496 | ) |
| | | | Depreciation and amortization of intangibles | | | 996 | | | | 889 | | | | 613 | |
| | Loss on sale of premises and equipment | | | | | | | 50 | | | | | |
| | Decrease (increase) in amounts due from subsidiaries and other assets | | | 31,935 | | | | 48,978 | | | | (1,061 | ) |
| | Increase in accounts payable, accrued expenses and other liabilities | | | 1,287 | | | | 2,908 | | | | 608 | |
| | | | |
| | | |
| | | |
| |
| | | | NET CASH PROVIDED BY OPERATING ACTIVITIES | | | 44,104 | | | | 59,617 | | | | 4,382 | |
| |
| INVESTING ACTIVITIES | | | | | | | | | | | | |
| | Net cash investments in subsidiaries | | | 45,396 | | | | (47,543 | ) | | | (18,598 | ) |
| | Net payments from (advances to) Amera Mortgage Corporation | | | 30 | | | | 570 | | | | (213 | ) |
| | Purchases of investment securities | | | | | | | (440 | ) | | | | |
| | Proceeds from sales and maturities of securities | | | | | | | 838 | | | | 334 | |
| | Proceeds from sales of equipment and furniture | | | | | | | 100 | | | | 1 | |
| | Purchases of equipment and furniture | | | (977 | ) | | | (1,318 | ) | | | (268 | ) |
| | | | |
| | | |
| | | |
| |
| | | | NET CASH USED BY INVESTING ACTIVITIES | | | (46,343 | ) | | | (47,793 | ) | | | (18,744 | ) |
| |
| FINANCING ACTIVITIES | | | | | | | | | | | | |
| | Net payments on debt obligations | | | (12,500 | ) | | | (6,500 | ) | | | (8,050 | ) |
| | Net proceeds from issuance of common stock | | | 12,656 | | | | 2,301 | | | | 1,753 | |
| | Net proceeds from issuance of subordinated debentures | | | 39,160 | | | | 2,899 | | | | 24,248 | |
| | Cash dividends paid | | | (6,563 | ) | | | (4,508 | ) | | | (3,114 | ) |
| | | | |
| | | |
| | | |
| |
| | | | NET CASH PROVIDED (USED) BY FINANCING ACTIVITIES | | | 32,753 | | | | (5,808 | ) | | | 14,837 | |
| | | | |
| | | |
| | | |
| |
| | | | INCREASE IN CASH AND CASH EQUIVALENTS | | | 30,514 | | | | 6,016 | | | | 475 | |
| Cash and cash equivalents at beginning of year | | | 7,024 | | | | 1,008 | | | | 533 | |
| | | | |
| | | |
| | | |
| |
| CASH AND CASH EQUIVALENTS AT END OF YEAR | | $ | 37,538 | | | $ | 7,024 | | | $ | 1,008 | |
| | | | |
| | | |
| | | |
| |
52
NOTES TO CONSOLIDATED FINANCIAL STATEMENTS
Capitol Bancorp Limited
NOTE R—ACQUISITION OF MINORITY INTERESTS
During 2003, several share-exchange transactions were completed, whereby certain previously majority-owned consolidated subsidiaries became wholly-owned. These share exchange transactions involved the issuance of previously unissued shares of Capitol’s common stock for the minority interests of the following subsidiaries:
| | | | | | | | | |
| | | | | | | Number of Common |
| Entity | | Effective Date | | Shares Issued |
| |
| |
|
| Black Mountain Community Bank | | July 31, 2003 | | | 223,287 | |
| Desert Community Bank | | July 31, 2003 | | | 209,203 | |
| Elkhart Community Bank | | July 31, 2003 | | | 197,927 | |
| Red Rock Community Bank | | July 31, 2003 | | | 351,778 | |
| Arrowhead Community Bank | | December 31, 2003 | | | 44,452 | |
| Goshen Community Bank | | December 31, 2003 | | | 137,312 | |
| Sunrise Bank of Albuquerque | | December 31, 2003 | | | 43,325 | |
| Yuma Community Bank | | December 31, 2003 | | | 120,094 | |
Had these acquisitions occurred at the beginning of 2003, consolidated net income would have approximated $24.4 million and diluted earnings per share would have been $1.73. Each of these acquisitions have been accounted for under the purchase method of accounting. Total consideration for these transactions approximated $29.1 million which resulted in the recording of goodwill of approximately $10.2 million and acquisition of minority interests approximating $18.9 million.
During 2002, several share-exchange transactions were also completed, whereby certain previously majority-owned consolidated subsidiaries similarly became wholly-owned:
| | | | | | | | | |
| | | | | | | Number of Common |
| Entity | | Effective Date | | Shares Issued |
| |
| |
|
| Sun Community Bancorp Limited | | March 31, 2002 | | | 2,721,749 | |
| Sunrise Capital Corporation | | September 30, 2002 | | | 266,406 | |
| Indiana Community Bancorp Limited | | September 30, 2002 | | | 181,235 | |
| East Valley Community Bank | | December 31, 2002 | | | 37,827 | |
| Detroit Commerce Bank | | December 31, 2002 | | | 16,371 | |
| Nevada Community Bancorp | | December 31, 2002 | | | 382,720 | |
Had those acquisitions occurred at the beginning of 2002, consolidated net income would have approximated $17 million and diluted earnings per share would have been $1.20.
53
NOTES TO CONSOLIDATED FINANCIAL STATEMENTS
Capitol Bancorp Limited
NOTE S—PROPOSED ACQUISITIONS
At December 31, 2003, a proposed acquisition was pending regarding First Carolina State Bank, a state-chartered bank with assets of approximately $62.3 million, located in Rocky Mount, North Carolina. Under the terms of the acquisition proposal, Capitol would acquire First Carolina for aggregate consideration approximating $10 million, of which half consists of previously unissued shares of Capitol’s common stock and the remainder in cash. The proposed acquisition is subject to approval by First Carolina’s shareholders, regulatory approvals and other contingencies.
In early January 2004, Capitol announced that it had entered into a definitive agreement to acquire AEA Bancshares, Inc., a Seattle, Washington one-bank holding company with total assets approximating $148 million. As proposed, the transaction consideration consists of a combination of Capitol’s common stock and cash approximating $17 million plus an additional $6 million, contingent on the bank subsidiary’s future earnings performance. The proposed acquisition is subject to several significant contingencies, including Capitol’s satisfactory due diligence review of the bank subsidiary, approval by AEA Banchares’ shareholders and regulatory approvals, among other things.
[The remainder of this page intentionally left blank]
54