First Litchfield Financial (FLFL) Inactive
Filed: 20 May 09, 12:00am

2008 Annual Meeting
2009 Annual Meeting

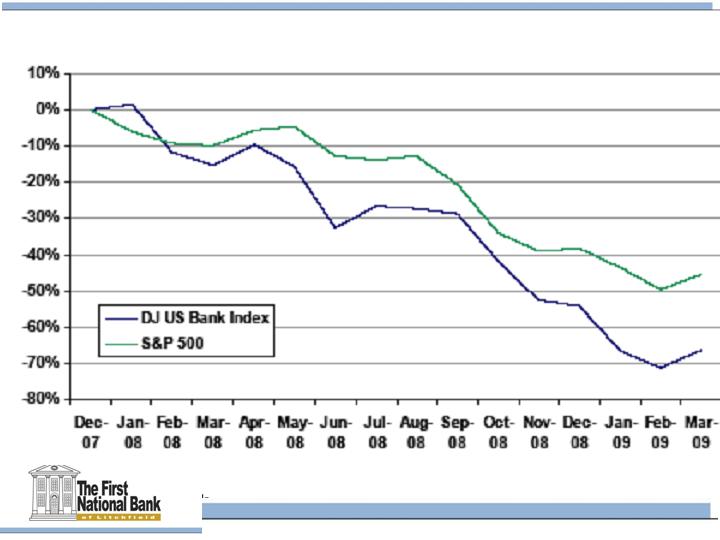
The Economy
Worst economy in 30 years
Longest recession since the great
depression
Severe depression in real estate values
All industries impacted
Bank failures since Jan of 2008 = 57
The Economy

The impact on us:
Treasury take over of Fannie Mae and
Freddie Mac:
2 investments totaling $5 million
OTTI write-down of $5 million

The impact on us:
Crisis in the financial sector
2 investments in pooled trust secured debt
OTTI write-down of $4.4 million in 2008
Total OTTI impairment of $9.4 million

Our strategy: weather the
financial storm
Shore up the balance sheet with an increased
provision for loan and lease losses
Utilize Treasury CPP funds to strengthen
capital
Preserve capital
Continue the commitment to lend to our
communities
Maintain asset quality in the balance sheet

Strategic Decisions
Reasons:
Uncertainty relative to the depths of the
recession
Enables us to focus on servicing our
communities and customers through lending
Enables us to maintain capital ratios above
the well-capitalized regulatory guidelines

2008 Operating Performance
Net interest income up 13%
Loan growth
Deposit growth
Leasing subsidiary break-even
Growth of net interest margin

2008 Operating Performance
Continued core asset base:
Loan growth 12%
Loan growth was organic within our footprint
Leasing growth – $11 million
Continued the strategy of shifting the mix of
earning assets from investments to loans
Continuation of the strategy to shift the mix of
loans from residential to commercial.
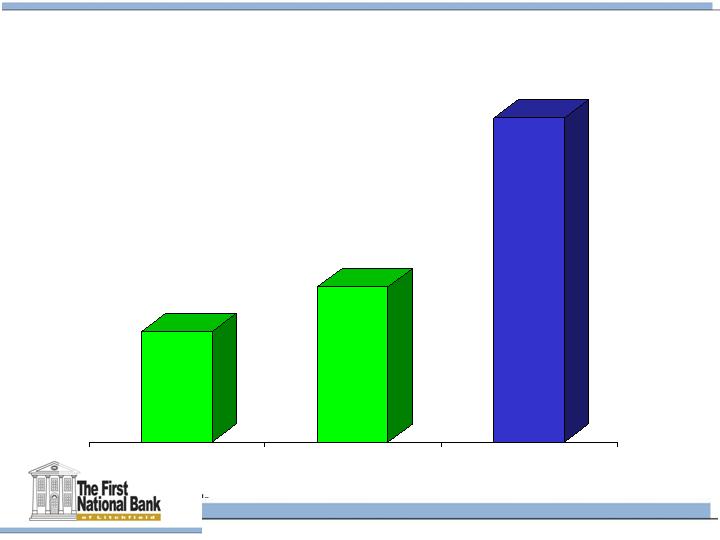
Total Assets
$501
2006
2007
2008
$532
$508
In millions
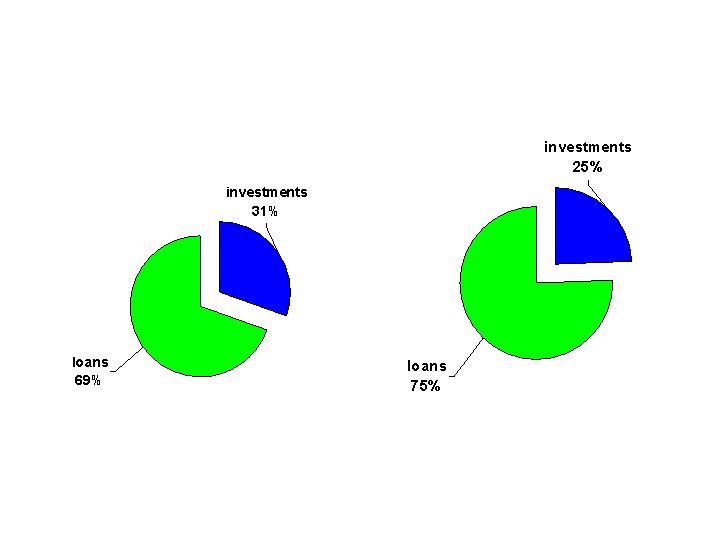
Mix of Earning Assets
2008
2007
Investments include interest –bearing cash and due and restricted stock

Mix of loans
2008
2007
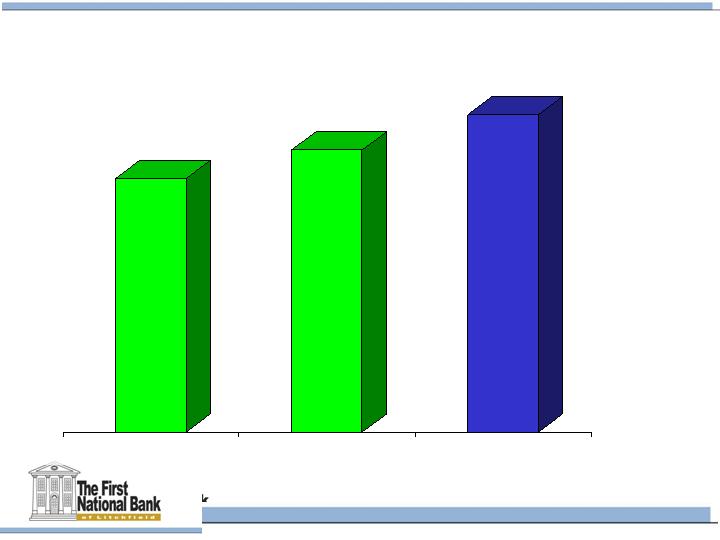
Loans
$296
2006
2007
2008
$329
$370
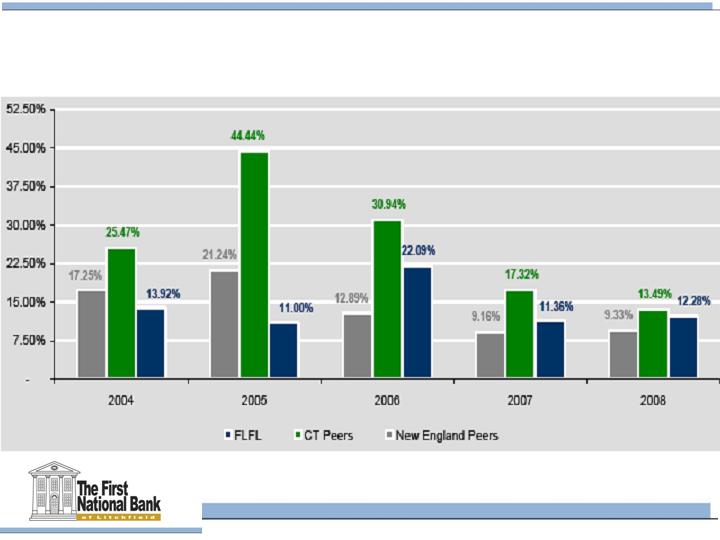
2004-2008 Gross Loan Growth %

Deposits
$333
2006
2007
2008
$343
$336
In millions
Net Interest Income
$14,940
$13,213
$12,691
2006
2007
2008
In thousands

Net Interest Margin
2.91%
3.13%
2.99%
2006
2007
2008
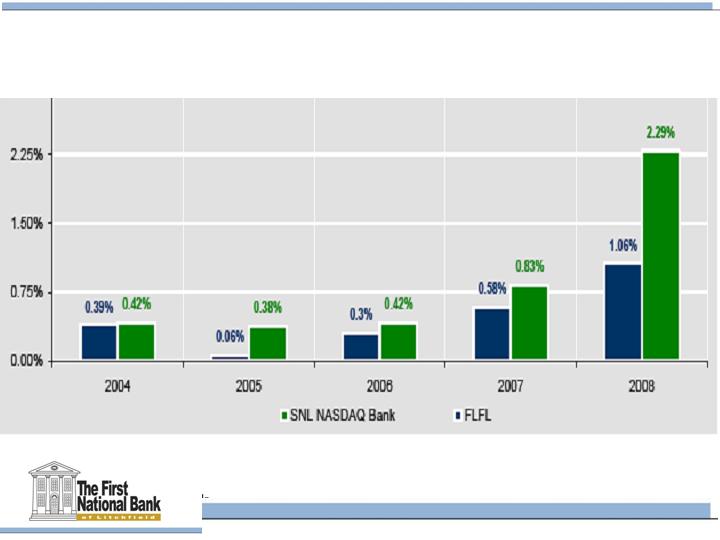
Nonperforming Assets to Total Assets

Non-interest income
Without security gains or losses
2006
2007
2008
$2,940,000
$3,412,000
$3,522,000

Exhibit 99.1
Presentation Materials
Forward-looking Statements
Statements in this presentation regarding First Litchfield Financial
Corporation’s business that are not historical facts are “forward-looking
statements” within the meaning of the Private Securities Litigation Reform
Act of 1995. These statements are based on the beliefs and expectations
of management as well as the assumption made using information
currently available to management. Since these statements reflect the
views of management concerning future events, these statements involve
risks, uncertainties and assumptions, including, among others: changes
in market interest rates and general and regional economic conditions;
changes in government regulations; changes in accounting principles;
and the quality of composition of the loan and investment portfolios and
other factors that may be described in the Company’s quarterly reports on
Form 10-Q and its annual report on Form 10-K, each filed with the
Securities and Exchange Commission, which are available at the
Securities and Exchange Commission’s internet website (www.sec.gov)
and to which reference is hereby made. Therefore, actual future results
may differ significantly from results discussed in the forward-look
ing statements.

2008 Annual Meeting
2009 Annual Meeting