| Overview | Consolidated
Performance Review | Segment
Performance Review | Liquidity & Capital
Resources | Quarterly Financial
Highlights | Non-IFRS Financial
Measures | Other Information &
Advisories |
Management’s Discussion & Analysis
For the three months ended April 30, 2017
| Dominion Diamond Corporation | First Quarter Fiscal 2018 Management’s Discussion & Analysis | 1 |
| Overview | Consolidated
Performance Review | Segment
Performance Review | Liquidity & Capital
Resources | Quarterly Financial
Highlights | Non-IFRS Financial
Measures | Other Information &
Advisories |
Introduction and Cautions
Introduction
This management’s discussion and analysis (“MD&A”) of the results of operations for Dominion Diamond Corporation and its subsidiaries (“DDC,” “the Company,” “we,” “us” or “our”) includes information that will help you understand management’s perspective of the unaudited interim condensed consolidated financial statements and notes for the three months ended April 30, 2017, and the Company’s financial position as at April 30, 2017. The information is based on what we knew as of June 12, 2017 and updates our annual MD&A included in our fiscal 2017 Annual Report. This MD&A is a supplement to and should be read in conjunction with our unaudited interim condensed consolidated financial statements and related notes thereto for the three months ended April 30, 2017 and with our audited consolidated financial statements for the year ended January 31, 2017.
The unaudited interim condensed consolidated financial statements are expressed in United States (“US”) dollars, which is our functional currency, and prepared in accordance with International Accounting Standards 34 (“IAS 34”), as issued by the International Accounting Standards Board (“IASB”). Unless otherwise specified, all financial information is presented in United States dollars. Unless otherwise indicated, all references to (i) “first quarter,” “Q1 fiscal 2018” and “Q1 2018” refer to the three months ended April 30, 2017; (ii) “Q1 fiscal 2017” and “Q1 2017” refer to the three months ended April 30, 2016.
Caution Regarding Forward-Looking Information
This MD&A includes statements and information about our expectations for the future which constitute forward-looking information within the meaning of Canadian and United States securities laws. Forward-looking information can generally be identified by the use of terms such as “may,” “will,” “should,” “could,” “would,” “expect,” “plan,” “anticipate,” “foresee,” “appears,” “believe,” “intend,” “estimate,” “predict,” “potential,” “continue,” “objective,” “modelled,” “hope,” “forecast” or other similar expressions concerning matters that are not historical facts. Forward-looking information represents our current views and can change significantly.
Forward-looking information included in this MD&A relates to management’s strategy, plans, future outlook and anticipated events or results and includes, but is not limited to:
- statements or information regarding plans for mining, development, production, reclamation and exploration activities at our mineral properties;
- projected capital expenditure requirements, liquidity and working capital requirements;
- estimated mineral reserves and resources and production from the Ekati Diamond Mine and Diavik Diamond Mine;
- expectations concerning the diamond industry and diamond pricing;
- results of our strategic review process;
- the estimated timeline to complete the relocation of our corporate head office from Yellowknife, Northwest Territories, to Calgary, Alberta; and
- outlook for our Ekati Diamond Mine and Diavik Diamond Mine segments and other forward-looking information as set out under “Business Outlook.”
Forward-looking information is based on certain factors and assumptions described below and elsewhere in this MD&A, including, among other things:
- mining methods and the current mine plans for each of the Ekati Diamond Mine and the Diavik Diamond Mine;
- mining, production, construction and exploration activities at our mineral properties;
- the timely receipt of required regulatory approvals;
- currency exchange rates;
- estimates related to the capital expenditures required to bring the Jay, Sable, Misery Deep and A-21 pipes into production;
- required operating and capital costs, labour costs and fuel costs;
- world, China, India and US economic conditions;
- future diamond prices and demand for diamond jewelry; and
- the level of worldwide diamond production.
| Dominion Diamond Corporation | First Quarter Fiscal 2018 Management’s Discussion & Analysis | 2 |
| Overview | Consolidated
Performance Review | Segment
Performance Review | Liquidity & Capital
Resources | Quarterly Financial
Highlights | Non-IFRS Financial
Measures | Other Information &
Advisories |
While we consider these assumptions to be reasonable based on the information currently available to us, they may prove to be incorrect. Forward-looking information is subject to certain factors, including risks and uncertainties that could cause actual results to differ materially from what we currently expect. These factors include, among other things:
- the uncertain nature of mining activities, including risks associated with underground construction and mining operations;
- risks associated with joint venture operations, including risks associated with the inability to control the timing and scope of future capital expenditures;
- risks associated with the estimates related to the capital expenditures required to bring the Jay, Sable, Misery Deep and A-21 pipes into production;
- the risk that Rio Tinto plc, the operator of the Diavik Diamond Mine, may make changes to the mine plan, and other risks arising because of the nature of joint venture activities;
- risks associated with the remote location of, and harsh climate at, our mineral property sites;
- variations in mineral resource and mineral reserve estimates or expected recovery rates;
- failure of plant, equipment or processes to operate as anticipated;
- risks resulting from macro-economic uncertainty in financial markets and other world economic conditions;
- risks associated with regulatory requirements and the ability to obtain all necessary regulatory approvals and permits;
- the risk that future diamond price assumptions may prove to be incorrect;
- modifications to existing practices so as to comply with any future permit conditions that may be imposed by regulators;
- delays in obtaining approvals and lease renewals;
- the risk of fluctuations in diamond prices and changes to consumer demand in the principal markets of US, China and India;
- the risk of increased demand for synthetic diamonds or the presence of undisclosed synthetic diamonds in jewelry, negatively impacting demand for diamond jewelry;
- uncertainty as to whether dividends will be declared by our Board of Directors or whether our dividend policy will be maintained;
- the risk of fluctuations in the Canadian/US dollar exchange rate;
- cash flow and liquidity risks; and
- uncertainties related to our strategic review process.
Please see page 46 of this MD&A, as well as our current Annual Information Form available at www.sedar.com and www.sec.gov, for a discussion of these and other risks and uncertainties involved in our operations. Actual results may vary from the forward-looking information.
Readers are cautioned not to place undue importance on forward-looking information, which speaks only as of the date of this MD&A; they should not rely upon this information as of any other date. Due to assumptions, risks and uncertainties, including the assumptions, risks and uncertainties identified above and elsewhere in this MD&A, actual events may differ materially from current expectations. We use forward-looking statements because we believe such statements provide useful information with respect to the currently expected future operations and financial performance of the Company, and caution readers that the information may not be appropriate for other purposes. While we may elect to do so, we are under no obligation and do not undertake to update or revise any forward-looking information, whether as a result of new information, future events or otherwise at any particular time, except as required by law.
Caution Regarding Non-IFRS Measures
We use a number of financial measures including cash cost and total cost of production, cash cost and total cost per tonne processed, cash cost and total cost per carat produced, cash cost and total cost of sales per carat sold, EBITDA, Adjusted EBITDA, EBITDA margin, free cash flow, cash from operating activities before changes in non-cash operating working capital, working capital, working capital ratio, sustaining capital expenditure, and growth capital expenditure to monitor and evaluate our performance. These measures are not prescribed by International Financial Reporting Standards (“IFRS”) and will differ from measures determined in accordance with IFRS. Other companies may calculate these non-IFRS financial measures differently. These non-IFRS measures should not be considered as a substitute for, or superior to, measures of financial performance prepared in accordance with IFRS. Please refer to the section “Non-IFRS Financial Measures” of this MD&A for further details, including a reconciliation of each such measure to its most directly comparable measure calculated in accordance with IFRS.
| Dominion Diamond Corporation | First Quarter Fiscal 2018 Management’s Discussion & Analysis | 3 |
| Overview | Consolidated
Performance Review | Segment
Performance Review | Liquidity & Capital
Resources | Quarterly Financial
Highlights | Non-IFRS Financial
Measures | Other Information &
Advisories |
Overview
Operating and Financial Highlights
(All dollar figures are in United States dollars unless otherwise indicated)
We are a Canadian company focused on the mining and marketing of rough diamonds to the global market. We have interests in two producing diamond mines and a pipeline of development and exploration projects in the Northwest Territories in Canada. We also have sorting and related sales operations in Canada, Belgium and India. In Q1 fiscal 2018, on a consolidated basis (Ekati Diamond Mine 100% and Diavik Diamond Mine 40%), production was 2.1 million carats, sales were 2.3 million carats, and the average price per carat sold was $90 per carat.
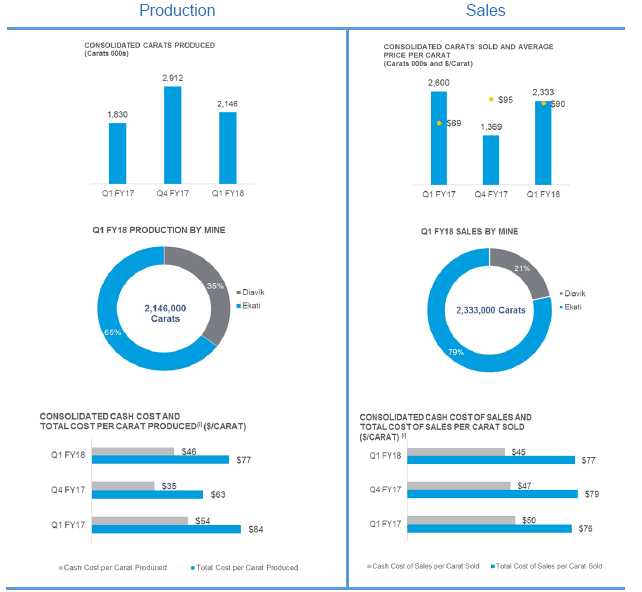
| (i) | The terms “cash cost per carat produced,” “total cost per carat produced,” “cash cost of sales per carat sold” and “total cost of sales per carat sold” do not have standardized meanings according to IFRS. See “Non-IFRS Financial Measures” for additional information. |
Our consolidated cash cost and total cost per carat produced were $46 and $77, respectively, in the first quarter of fiscal 2018, reflecting the processing of relatively high-grade ore. The consolidated cash cost of sales per carat sold was $45 during the quarter.
| Dominion Diamond Corporation | First Quarter Fiscal 2018 Management’s Discussion & Analysis | 4 |
| Overview | Consolidated
Performance Review | Segment
Performance Review | Liquidity & Capital
Resources | Quarterly Financial
Highlights | Non-IFRS Financial
Measures | Other Information &
Advisories |
| Highlights | | | | | | |
| (in millions of US dollars, except where otherwise noted) | | Three months ended | |
| Operating | | April 30, 2017 | | | April 30, 2016 | |
| Tonnes processed (000s) | | 1,118 | | | 1,195 | |
| Carats recovered (000s) | | 2,146 | | | 1,830 | |
| Cash cost per tonne processed(i)($/tonne) | $ | 85 | | $ | 81 | |
| Total cost per tonne processed(i)($/tonne) | $ | 149 | | $ | 129 | |
| Cash cost per carat produced(i)($/carat) | $ | 46 | | $ | 54 | |
| Total cost per carat produced(i)($/carat) | $ | 77 | | $ | 84 | |
| Financial | | April 30, 2017 | | | April 30, 2016 | |
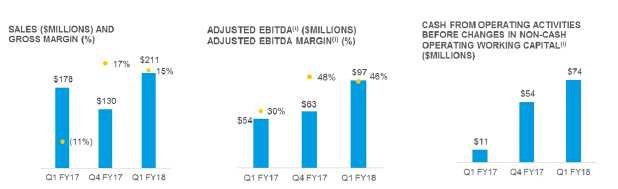
| Sales | $ | 211.0 | | $ | 178.3 | |
| Carats sold (000s) | | 2,333 | | | 2,600 | |
| Average price per carat sold ($/carat) | $ | 90 | | $ | 69 | |
| Cash cost of sales per carat sold(i)($/carat) | $ | 45 | | $ | 50 | |
| Gross margin (%) | | 15% | | | (11% | ) |
| Net (loss) income | $ | (7.8 | ) | $ | (5.3 | ) |
| Adjusted EBITDA(i) | $ | 97.0 | | $ | 54.3 | |
| Adjusted EBITDA margin(i)(%) | | 46% | | | 30% | |
| Earnings (loss) per share attributable to shareholders ($/share) | $ | (0.09 | ) | $ | (0.01 | ) |
| Cash from operating activities before changes in non-cash operating working capital(i) | $ | 73.5 | | $ | 11.2 | |
| Capital expenditures (sustaining capital) | $ | 47.9 | | $ | 27.7 | |
| Capital expenditures (growth capital) | $ | 29.3 | | $ | 83.7 | |
| Free cash flow(i) | $ | (15.5 | ) | $ | (90.0 | ) |
| (i) | The terms “cash cost per tonne processed,” “total cost per tonne processed,” “cash cost per carat produced,” “total cost per carat produced,” “cash cost of sales per carat sold,” “Adjusted EBITDA,” “Adjusted EBITDA margin,” “cash from operating activities before changes in non-cash operating working capital” and “free cash flow” do not have standardized meanings according to IFRS. See “Non-IFRS Financial Measures” for additional information. |
Carats recovered increased in the first quarter of fiscal 2018 due to the processing of high-grade Misery Main ore at the Ekati Diamond Mine, despite fewer tonnes processed due to reduced plant availablity resulting from unplanned maintenance, and to a lesser extent seasonal weather-related material handling. Mining performance was strong in Q1 fiscal 2018 as was safety and environmental performance.
Consolidated sales were also strong in the first quarter of fiscal 2018 with an improved gross margin over the comparable period in the previous year. The improvement was largely attributable to the sale of diamonds recovered from higher-value kimberlite pipes at the Ekati Diamond Mine, combined with continued strong performance from the Diavik Diamond Mine.
| Dominion Diamond Corporation | First Quarter Fiscal 2018 Management’s Discussion & Analysis | 5 |
| Overview | Consolidated
Performance Review | Segment
Performance Review | Liquidity & Capital
Resources | Quarterly Financial
Highlights | Non-IFRS Financial
Measures | Other Information &
Advisories |

| Dominion Diamond Corporation | First Quarter Fiscal 2018 Management’s Discussion & Analysis | 6 |
| Overview | Consolidated
Performance Review | Segment
Performance Review | Liquidity & Capital
Resources | Quarterly Financial
Highlights | Non-IFRS Financial
Measures | Other Information &
Advisories |
| Dominion Diamond Corporation | First Quarter Fiscal 2018 Management’s Discussion & Analysis | 7 |
| Overview | Consolidated
Performance Review | Segment
Performance Review | Liquidity & Capital
Resources | Quarterly Financial
Highlights | Non-IFRS Financial
Measures | Other Information &
Advisories |
| Dominion Diamond Corporation | First Quarter Fiscal 2018 Management’s Discussion & Analysis | 8 |
| Overview | Consolidated
Performance Review | Segment
Performance Review | Liquidity & Capital
Resources | Quarterly Financial
Highlights | Non-IFRS Financial
Measures | Other Information &
Advisories |
Corporate Developments
On November 7, 2016, we announced the relocation of our corporate head office from Yellowknife, Northwest Territories, to Calgary, Alberta, as part of a series of measures taken to reduce operating costs and support the long-term strength of the Company. The move is projected to be completed by the middle of calendar year 2017 and result in annual savings of approximately CDN $19 million.
On January 31, 2017, we announced that Mr. Brendan Bell will step down from his role as Chief Executive Officer (CEO) of the Company and as a member of the Board of Directors. Mr. Bell will continue to serve in his role as CEO until June 30, 2017 while a successor is identified.
On February 1, 2017, we determined that our participating interest in the Buffer Zone had increased from 65.3% to 72.0%, in accordance with the Buffer Zone Joint Venture agreement. The increase in ownership resulted from the decision of Archon Minerals Limited (“Archon”) not to participate in the full fiscal year 2017 capital program for the Buffer Zone. We funded those elements of the program that were not funded by Archon.
On March 27, 2017, we announced that our Board of Directors had commenced a strategic review process to explore strategic alternatives focused on maximizing shareholder value, which could include the Company pursuing its long-term strategic plan as an independent Company, the sale of the Company, or other strategic transactions. In connection with the strategic review process, the Board of Directors of the Company established a special committee to oversee the strategic review process. The Board of Directors has not set a timetable for the strategic review process nor has it made any decisions related to strategic alternatives at this time, and there can be no assurance that the strategic review process will result in any transaction or change in strategy.
On March 31, 2017, we announced that we had filed an updated technical report under National Instrument 43-101 for the Diavik Diamond Mine with an effective date of January 31, 2017 (“2017 Technical Report”). The 2017 Technical Report reflects a 16% increase in mineral reserves, or an increase of 6.3 million carats, for the calendar years 2017 through the end of mine life compared to the comparable period in the previous technical report. The 2017 Technical Report also reflects an extension of the mine life from calendar 2023 to calendar 2025 and an after-tax net present value of approximately $2.6 billion at a 7% discount rate, based on the assumptions and analysis contained therein.
On May 23, 2017, we announced positive results of a pre-feasibility study on the development of an underground operation below the Misery open pit at the Ekati Diamond Mine. See the section “Development Projects” for additional detail.
On May 30, 2017, we announced that the Wek’èezhìi Land and Water Board (“WLWB”) amended the Type A Water Licence for the Ekati Diamond Mine to include the Jay Project, and recommends that the amended Water Licence be approved by the Minister of Environment and Natural Resources. See the section “Development Projects” for additional detail.
On June 5, 2017, we reached an agreement with Archon to convert Archon’s participating interest in the Buffer Zone at the Ekati Diamond Mine to a royalty equal to 2.3% of all future gross revenue from diamonds produced from the Buffer Zone. As a result of this transaction, our ownership interest in the Buffer Zone increased to 100.0% .
| Dominion Diamond Corporation | First Quarter Fiscal 2018 Management’s Discussion & Analysis | 9 |
| Overview | Consolidated
Performance Review | Segment
Performance Review | Liquidity & Capital
Resources | Quarterly Financial
Highlights | Non-IFRS Financial
Measures | Other Information &
Advisories |
Business Outlook
Market and Diamond Price Update
The diamond market has become more positive than in recent months and, overall, prices have improved from early fiscal 2018 levels after a slight dip associated with the residual effects of the November 2016 demonetization of the Indian rupee. In India, there has been a recovery of demand in the retail jewelry market following demonetization, and a noticeable rise in activity in the lower end price ranges, notably from the larger jewelry chains. It is expected there will be a full return to normal trading activity as work resumes at the Indian diamond polishing factories after the May break. This is the most active time of year for purchases by the jewelry manufacturing segment, as it prepares for the end of year sales season.
The diamond jewelry retail industry in the US failed to meet market expectations in the first quarter of calendar 2017, however, it is anticipated that the Las Vegas jewelry show in June will provide a shift towards more positive activity. The improvement in mainland Chinese demand early in the quarter has persisted and there is increased activity in Hong Kong and Macau, both of which have suffered a retail downturn in recent months.
In the table below we have modelled the approximate rough diamond average price per carat for each Ekati and Diavik kimberlite process plant feed type based on the average prices per carat achieved in our February 2017 sale. Between the February 2017 sale and the May 2017 sale, average prices have increased by 3% and 1% for the Ekati Diamond Mine and Diavik Diamond Mine, respectively. These average price changes represent an aggregate net change in prices for all goods from each separate mine, both higher value and lower value. Prices for the higher-value and lower-value market segments can move independently of one another, depending on relative demand. As such, strengthening prices in one market segment can offset weakening prices in another, resulting in minimal average price change. In particular, the increase in average prices from February 2017 to May 2017 reflects some recovery in demand for lower priced rough diamonds following the demonetization of the Indian rupee in November 2016 and the ensuing disruption in normal trading activity in these goods. Prices for higher-value goods were not as significantly impacted by demonetization and have remained relatively stable. While prices have not recovered as quickly for the smaller white goods, there has been more marked improvement in prices for brown goods, leading to a greater average price increase for the Ekati segment.
| | | February 2017 sales | Average % change |
| | | cycle average price | to May 2017 sales |
| Mine | Feed type | per carat | cycle |
| Ekati Diamond Mine | Koala | $ 280 | |
| | Misery Main | 53 | 3% |
| | Misery Southwest Extension | 37 | |
| | Pigeon | 138 | |
| Diavik Diamond Mine | A-154 South | 111 | |
| | A-154 North | 147 | 1% |
| | A-418 | 80 | |
| | COR | 40 | |
| Dominion Diamond Corporation | First Quarter Fiscal 2018 Management’s Discussion & Analysis | 10 |
| Overview | Consolidated
Performance Review | Segment
Performance Review | Liquidity & Capital
Resources | Quarterly Financial
Highlights | Non-IFRS Financial
Measures | Other Information &
Advisories |
Operations
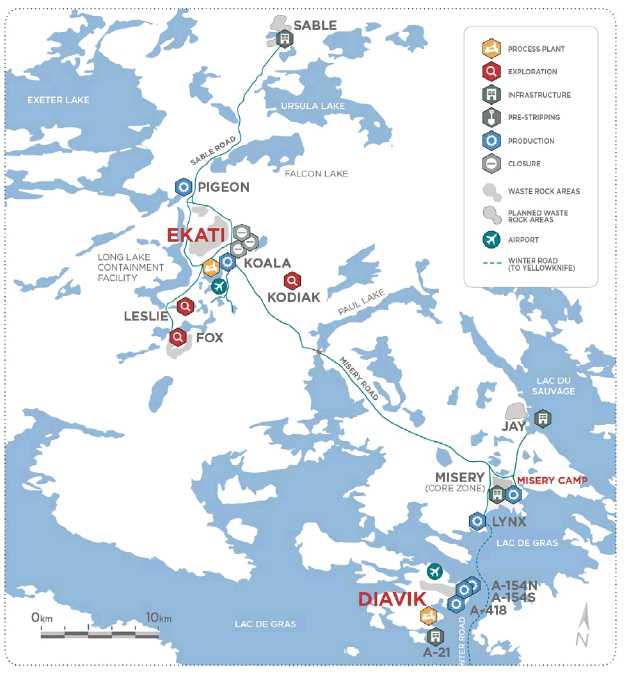
Our mining operations are located in Canada’s Northwest Territories. At the Ekati Diamond Mine, the Koala, Misery, Pigeon and Lynx kimberlite pipes are currently in production. Additional material is sourced as necessary from the Misery Satellites (Misery South and Misery Southwest pipes) and coarse ore rejects (“COR”), which are not classified as mineral reserves and do not have demonstrated economic viability. We hold a 40% ownership interest in the Diavik Diamond Mine where there are three pipes currently in production: A-418, A-154 South and A-154 North. We are also advancing a number of exploration and development projects at both mines.
NORTHWEST TERRITORIES, CANADA
| Dominion Diamond Corporation | First Quarter Fiscal 2018 Management’s Discussion & Analysis | 11 |
| Overview | Consolidated
Performance Review | Segment
Performance Review | Liquidity & Capital
Resources | Quarterly Financial
Highlights | Non-IFRS Financial
Measures | Other Information &
Advisories |
Mining Operations
In fiscal 2018, we expect to recover 6.3 –7.0 million carats at the Ekati Diamond Mine from 3.7 –4.0 million tonnes processed (on a 100% basis) and 7.1 –7.6 million carats at the Diavik Diamond Mine from 2.0 –2.2 million tonnes processed (on a 100% basis). Mining activities by kimberlite pipe as well as the approximate proportions of processed material and recovered carats that are expected to be sourced from each kimberlite pipe in fiscal 2018 for the Ekati Diamond Mine and calendar 2017 for the Diavik Diamond Mine are indicated in the table below.
| | | | | | | | % of tonnes | % of carats |
| Mine | Pipe | | Q1 FY18 | Q2 FY18 | Q3 FY18 | Q4 FY18 | processed | recovered |
| Ekati Diamond | Misery Main | Open pit | Continuing production | 20% | 60% |
| Mine | Koala | Underground | Continuing production | 30% | 10% |
| | Pigeon | Open pit | Continuing production | 30% | 5% |
| | Misery | Open pit | Continuing production | 15% | 20% |
| | Southwest | | | | | | | |
| | Lynx | Open pit | Waste stripping | First ore | Continuing production | 5% | 5% |
| | Sable | Open pit | Site construction | Waste stripping | – | – |
| Diavik Diamond | A-154 South | Underground | Continuing production | 20% | 20% |
| Mine | A-154 North | Underground | Continuing production | 35% | 25% |
| | A-418 | Underground | Continuing production | 45% | 55% |
| | A-21 | Open pit | Dike completion | De-watering | De-watering | – | – |
| | | | | | Waste stripping | | |
At the Ekati Diamond Mine, open pit mining will take place at all pipes, with the exception of Koala, where mining is underground. A high-value blend of primarily Misery Main and Koala ore was processed in Q1 fiscal 2018. The processing of significant amounts of Pigeon ore began in the second quarter of fiscal 2018, with a corresponding reduction of Misery Main and Koala ore. The initial production of high-value carats from the Lynx pipe is also expected in the second quarter of fiscal 2018.
A fines dense media separation (“Fines DMS”) unit was commissioned at the Ekati Diamond Mine in Q4 fiscal 2017 in order to improve the recovery of small diamonds. In Q1 fiscal 2018, the unit ramped up to its design throughput. The recovery of small diamonds, which have low values per carat, has not met our expectations to date. However, we expect the recovery of small diamonds to achieve planned amounts in the second half of the year.
Both the production guidance and approximate proportions of tonnes processed and carats recovered per pipe reflect the operating case at the Ekati mine; this includes the Misery Southwest pipe which is currently an inferred mineral resource. Mineral resources that are not mineral reserves do not have demonstrated economic viability. Inferred mineral resources are considered too speculative geologically to have economic considerations applied to them that would enable them to be categorized as mineral reserves. There is no certainty that the operating case will be realized.
We prepared and verified the foregoing scientific and technical information for the Ekati Diamond Mine under the supervision of Peter Ravenscroft, FAuslMM, of Burgundy Mining Advisors Ltd., an independent mining consultancy. Mr. Ravenscroft is a Qualified Person within the meaning of National Instrument 43-101 of the Canadian Securities Administrators.
At the Diavik Diamond Mine, underground mining will continue at A-418, A-154 South and A-154 North pipes. Production from coarse ore rejects (“COR”) is expected to be negligible in calendar 2017. Production from COR is not included in our ore reserves, and is therefore incremental.
The aforementioned mine plan for the Diavik Diamond Mine was prepared and verified by DDMI, operator of the Diavik Diamond Mine, under the supervision of Calvin Yip, P. Eng., Principal Advisor, Strategic Planning of DDMI, and a Qualified Person within the meaning of National Instrument 43-101 of the Canadian Securities Administrators.
| Dominion Diamond Corporation | First Quarter Fiscal 2018 Management’s Discussion & Analysis | 12 |
| Overview | Consolidated
Performance Review | Segment
Performance Review | Liquidity & Capital
Resources | Quarterly Financial
Highlights | Non-IFRS Financial
Measures | Other Information &
Advisories |
Development Projects
A number of medium and longer-term development opportunities continue to be advanced in fiscal 2018.
| | | |
| Mine | Project | Update |
| | | |
| Ekati Diamond Mine | Jay Project (open pit) | The Jay Project is a significant undeveloped deposit at the Ekati Diamond Mine and is currently in the final stages of permitting. On May 30, 2017, we received a recommendation on our water licence and land use permit from the WLWB. The WLWB has recommended approval to the Minister of Environment and Natural Resources, Government of the Northwest Territories (“GNWT”), whose decision is expected this summer. To date in fiscal 2018 we have completed the stockpiling of clean granite from Lynx, our road building material. In June 2017, we started crushing this road base material, and expect to begin road construction to the project site in mid-calendar 2017. |
| | | |
| Ekati Diamond Mine | Sable Project (open pit) | Final site infrastructure at the Sable pipe is nearing completion and we expect the initial development capital for the project to be approximately 25% below the pre-feasibility investment case. Pre-stripping is expected to commence by July 2017, significantly ahead of the schedule outlined in the pre-feasibility study. Following waste stripping, the first production of high-value carats from the Sable pipe is anticipated in fiscal 2020. |
| | | |
| Ekati Diamond Mine | Misery Deep Project (underground) | On May 23, 2017, we announced the results of a pre-feasibility study on the development of an underground operation below the Misery Main open pit. The pre-feasibility study is based on the mining of Misery Deep from calendar 2018 to calendar 2022 and involves the extraction of 1.8 million tonnes of kimberlite and 8.7 million carats. Our Board of Directors has approved the construction of the project and we expect to file permit applications in the third quarter of calendar 2017. |
| | | |
| Ekati Diamond Mine | Fox Deep (underground) | Based on successful results from the Fox Deep drilling program, indicated resources at the Fox kimberlite pipe increased to 45.6 million tonnes and 16.5 million carats in April 2017. Work continues on the evaluation of an underground mine below the large Fox open pit at the Ekati Diamond Mine. A preliminary economic analysis on the project is expected in the third quarter of fiscal 2018 and a pre-feasibility study is scheduled for completion by the end of the fiscal year. If successful, this project has the potential to extend the life of the Ekati Diamond Mine significantly. |
| | | |
| Diavik Diamond Mine | A-21 Project (open pit) | Development of the A-21 pipe continues to progress on time and on budget, with the completion of the dike and the start of de-watering expected in late calendar 2017. The start of waste stripping is now expected in late calendar 2017, concurrent with de-watering. Following waste stripping, processing of ore from the A-21 pipe is expected to commence in calendar 2018. |
| Dominion Diamond Corporation | First Quarter Fiscal 2018 Management’s Discussion & Analysis | 13 |
| Overview | Consolidated
Performance Review | Segment
Performance Review | Liquidity & Capital
Resources | Quarterly Financial
Highlights | Non-IFRS Financial
Measures | Other Information &
Advisories |
Exploration Activities
The Lac de Gras region in Canada’s Northwest Territories hosts some of the richest kimberlite pipes in the world and is the focus of our exploration efforts.
| Location | Update |
| | |
| Ekati Diamond Mine | A renewed greenfield exploration program has commenced in calendar 2017 at the Ekati Diamond Mine. There are 150 kimberlites on the property, of which approximately 110 have not been significantly tested through follow- up bulk sampling programs. A four-part program is planned including an assessment of historical geophysical data, till sample data analysis, an evaluation of known kimberlites to prioritize targets, and a summer 2017 field program comprising geophysics and diamond drilling of high priority targets. |
| In May 2017, we announced a maiden inferred mineral resource of 51 million tonnes and 16 million carats at the Leslie kimberlite pipe, the highest priority amongst pipes at the Ekati Diamond Mine that have been bulk sampled but not yet included in the mine plan. A concept study is planned for the Leslie pipe in 2017, and future work plans are under consideration. |
| A second priority kimberlite pipe that has not been bulk sampled is the land-based Kodiak pipe, located approximately seven kilometres east of the central infrastructure at the Ekati Diamond Mine. The work plan for calendar 2017 includes a follow-up vertical drill hole in the centre of the pipe. Remodelling of the pipe size and geology, microdiamond estimation and quality assessment should be completed by the fall of 2017 and, pending the results of this program, a reverse circulation bulk sample program may be planned for winter 2018. |
| | |
| Diavik Diamond Mine | After start-up of the Diavik Diamond Mine in 2002, exploration continued until 2013. In 2017, exploration activities have resumed. |
| Three priority kimberlites – C42, T29 and A61 – have been highlighted for additional work based on potential size and proximity to the existing infrastructure. The goal for calendar 2017 is to delineate these kimberlites further using core drilling, and to collect sufficient material for mineral chemistry and microdiamond sampling. |
| | |
| Lac de Gras Property | The Lac de Gras Joint Venture (“LDGJV”) property is located south of and adjacent to the existing Ekati and Diavik Diamond Mines within the geological terrain known as the Slave Craton. We are the operator of the LDGJV and, as of February 1, 2017, had a participating interest of approximately 60%, the remaining interest being held by North Arrow Minerals Inc. |
| Exploration work by prior operators has resulted in the discovery of three kimberlites within the LDGJV property and has produced a large database of sampling, drilling and geophysical information. A comprehensive review of this database was conducted during 2016. A spring 2017 ground geophysics program utilizing magnetic, gravity and resistivity techniques has been completed over the 20 selected targets. The data is currently being interpreted and will be used to guide the selection of targets for possible drill testing later this summer. Additionally, a 400 square kilometre area in the southern part of the property will be covered by a new airborne geophysical survey during the summer of 2017. |
| | |
| Glowworm Lake Property | The Glowworm Lake leases were acquired in early 2016 and are located north and east of the Diavik Diamond Mine. The property is favourably located on the central Slave Craton, but does not currently have any known kimberlite pipes. There are, however, several pipes in adjacent areas, pointing to the prospectivity of the region. |
| | A re-evaluation of the historical data on the Glowworm Lake property is underway, including sampling, drilling and geophysical data from the previous exploration work, including more than 5,000 till sample results. A study of the known kimberlite pipes in the region is ongoing to better understand kimberlite characteristics in the area in order to refine targeting techniques. A field program is planned for 2017 with targets being selected for follow-up with ground geophysics (magnetic, gravity and resistivity). The data collected from the ground surveys will be used to select future drill targets. |
| Dominion Diamond Corporation | First Quarter Fiscal 2018 Management’s Discussion & Analysis | 14 |
| Overview | Consolidated
Performance Review | Segment
Performance Review | Liquidity & Capital
Resources | Quarterly Financial
Highlights | Non-IFRS Financial
Measures | Other Information &
Advisories |
Sensitivity Analysis
Our financial results are sensitive to a number of factors that affect our operations. The following table sets out on an annual basis the estimated impact of some key variables on our financial results, based on expected activity levels for the year ended January 31, 2018.
The sensitivity analyses below should be used with caution. For the purpose of these analyses, the effect of a variation in a particular factor was calculated independently of a change in any other factor. Our financial results are anticipated to fluctuate between quarters, resulting from variations in the factors set out below, as well as other factors, including variations in the volume, size and quality distribution of rough diamonds sold.
(in millions of United States dollars, except where otherwise noted)
| | | Change in | | | Impact on | | | Impact on | | | Impact on | |
| Factor | | factor | | | sales | | | Adjusted EBITDA | | | profit (loss) before tax | |
| Diamond prices | | 1% | | $ | 9 | | $ | 9 | | $ | 9 | |
| Exchange rate from USD to CAD | $ | 0.01 | | $ | – | | $ | 1 | | $ | 1 | |
| Diesel (per litre)(i) | $ | 0.01 | | $ | – | | $ | – | | $ | – | |
| (i) | The sensitivity for diesel is for the current fiscal year only. See additional discussion under the heading “Diesel” below. |
Diamond Prices
Diamond prices will fluctuate depending on the volume, size and quality distribution of rough diamonds delivered from our mineral properties and eventually sold. Additionally, diamond prices fluctuate and are affected by numerous factors beyond our control, including worldwide economic trends, manufacturing activity, available liquidity and inventory levels amongst diamond cutters and polishers, worldwide levels of diamond discovery and production, and the level of consumer demand for, and discretionary spending on, luxury goods such as diamonds.
Foreign Exchange
Diamond sales are predominantly conducted in US dollars. Accordingly, we use the US dollar as our functional and reporting currency. However, the majority of our mine operating costs, relating primarily to labour and other overhead costs, are incurred in Canadian dollars and these costs will therefore increase or decrease in US dollar terms as the Canadian dollar strengthens or weakens. As a result, a weakening Canadian dollar relative to the US dollar will reduce our US dollar denominated operating costs, and therefore increase our Adjusted EBITDA and profit (loss) before tax on an annual basis as set out above. We manage this exposure to movements in foreign exchange rates with an objective to reduce volatility in cash flows and earnings.
Movements in foreign exchange rates, particularly the weakening or strengthening of the Canadian dollar against the US dollar, will influence our financial results in two other ways, neither of which are reflected in the sensitivity above.
First, a portion of our monetary assets and liabilities are denominated in Canadian dollars and translated at each period-end date at the prevailing exchange rate. Monetary assets and liabilities denominated in Canadian dollars include a portion of cash, restricted cash, accounts payable and accruals and employee benefit obligations. These monetary assets and liabilities will give rise to foreign exchange gains and losses in our income statement each period as the Canadian dollar strengthens or weakens and will also depend on the relative amounts of monetary assets and liabilities held. The sensitivity above does not consider this effect of foreign exchange rates on these monetary assets and liabilities.
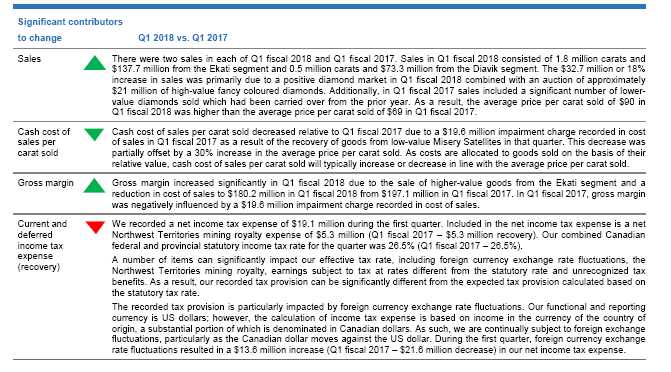
Second, our recorded tax provision is particularly influenced by foreign exchange fluctuations as the Canadian dollar strengthens or weakens. Our functional and reporting currency is US dollars; however, the calculation of income tax expense is based on income in the currency of the country of origin, a substantial portion of which is denominated in Canadian dollars. As a result, a weakening Canadian dollar against the US dollar will typically lead to an increase in our US dollar denominated net income tax expense and a strengthening Canadian dollar will typically lead to a reduction in our net income tax expense. The sensitivity above does not consider this effect of foreign exchange rates on net income tax expense.
| Dominion Diamond Corporation | First Quarter Fiscal 2018 Management’s Discussion & Analysis | 15 |
| Overview | Consolidated
Performance Review | Segment
Performance Review | Liquidity & Capital
Resources | Quarterly Financial
Highlights | Non-IFRS Financial
Measures | Other Information &
Advisories |
Diesel
Diesel fuel, and the related costs to transport it, is a significant component of costs at both of the Ekati and Diavik Diamond Mines. In fiscal 2018, diesel is expected to be between approximately 15% and 20% of total cash operating costs. Due to the remote location of both mines, annual supplies of diesel are purchased at prevailing rack rates, transported to the mines on the seasonal winter road in February and March, and then consumed throughout the following twelve months. As a result, changes in the rack price of diesel during the remainder of fiscal 2018 will have a negligible impact on production costs in fiscal 2018 but would impact diesel costs for fiscal 2019.
Outstanding Share Information
| | As at June 12, 2017 |
| Authorized | Unlimited |
| Issued and outstanding shares | 80,574,557 |
| Options and share RSU outstanding | 2,779,116 |
| Fully diluted | 83,353,673 |
| | |
| Dominion Diamond Corporation | First Quarter Fiscal 2018 Management’s Discussion & Analysis | 16 |
| Overview | Consolidated
Performance Review | Segment
Performance Review | Liquidity & Capital
Resources | Quarterly Financial
Highlights | Non-IFRS Financial
Measures | Other Information &
Advisories |
Consolidated Performance Review
Financial Performance
Consolidated sales were strong in the first quarter of fiscal 2018 with an improved gross margin over the comparable period in the previous year. The improvement was largely attributable to the sale of diamonds recovered from higher-value kimberlite pipes at the Ekati Diamond Mine, combined with continued strong performance from the Diavik Diamond Mine.
| (in millions of United States dollars, except where otherwise noted) | | Three months ended April 30 | |
| | | 2017 | | | 2016 | | | Change | |
| Sales | $ | 211.0 | | $ | 178.3 | | $ | 32.7 | |
| Carats sold (000s) | | 2,333 | | | 2,600 | | | (267 | ) |
| Average price per carat sold ($/carat) | $ | 90 | | $ | 69 | | $ | 21 | |
| Cash cost of sales per carat sold(i)($/carat) | $ | 45 | | $ | 50 | | $ | (5 | ) |
| Gross margin | $ | 30.8 | | $ | (18.8 | ) | $ | 49.6 | |
| Gross margin (%) | | 15% | | | (11% | ) | | 26% | |
| Selling, general and administrative expenses | $ | 8.3 | | $ | 8.0 | | $ | 0.3 | |
| Current and deferred income tax expense (recovery) | $ | 19.1 | | $ | (30.6 | ) | $ | 49.7 | |
| Net (loss) income | $ | (7.8 | ) | $ | (5.3 | ) | $ | (2.5 | ) |
| Adjusted EBITDA(i) | $ | 97.0 | | $ | 54.3 | | $ | 42.7 | |
| Adjusted EBITDA margin(i)(%) | | 46% | | | 30% | | | 16% | |
| Depreciation and amortization | $ | 75.8 | | $ | 61.5 | | $ | 14.3 | |
| Earnings (loss) per share attributable to shareholders ($/share) | $ | (0.09 | ) | $ | (0.01 | ) | $ | (0.08 | ) |
| Cash from operating activities before changes in non-cash operating working capital(i) | $ | 73.5 | | $ | 11.2 | | $ | 62.3 | |
| Free cash flow(i) | $ | (15.5 | ) | $ | (90.0 | ) | $ | 74.5 | |
| (i) | The terms “cash cost of sales per carat sold,” “Adjusted EBITDA,” “Adjusted EBITDA margin,” “cash from operating activities before changes in non-cash operating working capital" and “free cash flow” do not have standardized meanings according to IFRS. See “Non-IFRS Financial Measures” for additional information. |
| Dominion Diamond Corporation | First Quarter Fiscal 2018 Management’s Discussion & Analysis | 17 |
| Overview | Consolidated
Performance Review | Segment
Performance Review | Liquidity & Capital
Resources | Quarterly Financial
Highlights | Non-IFRS Financial
Measures | Other Information &
Advisories |

| Diamond Inventory | | | | | | | | | | | | |
| (in millions of United States dollars, except where otherwise noted) | | | | | | | | | | | | |
| | | April 30, 2017 | | | January 31, 2017 | | | Change | | | % Change | |
| | | | | | | | | | | | | |
| Carats in inventory available-for-sale (000s) | | 3,551 | | | 3,674 | | | (123 | ) | | (3% | ) |
| | | | | | | | | | | | | |
| Estimated market value of inventory available-for-sale | $ | 200 | | $ | 212 | | $ | (12 | ) | | (6% | ) |
| | | | | | | | | | | | | |
| Estimated average market value per carat available-for-sale ($/carat) | $ | 56 | | $ | 58 | | $ | (2 | ) | | (3% | ) |
| | | | | | | | | | | | | |
| Cost of inventory available-for-sale | $ | 159 | | $ | 182 | | $ | (23 | ) | | (13% | ) |
Rough diamond inventory classified as available-for-sale represents carats that have completed the sorting and valuation process. Carats still undergoing sorting and valuation are classified as work-in-progress inventory.
The 3% decrease in carats in inventory available-for-sale from 3.7 million at January 31, 2017 to 3.6 million at April 30, 2017 reflects 2.2 million carats transferred to available-for-sale during the quarter compared to 2.3 million carats sold. Due to the time required for initial sorting and valuation, carats transferred to available-for-sale diamond inventory in a given period will differ from the number of carats recovered in that period. At April 30, 2017, we also had approximately 0.6 million carats of rough diamond inventory that was work in progress in the Ekati segment (January 31, 2017 – 0.5 million carats).
The estimated market value of diamond inventory available-for-sale decreased by 6% from approximately $212 million at January 31, 2017 to approximately $200 million at April 30, 2017 primarily as a result of the decrease in carats in inventory. The decrease was also due to the auction of approximately $21 million of higher-value fancy coloured diamonds in Q1 fiscal 2018; these diamonds had a higher average price per carat as compared to the estimated average market value of inventory available-for-sale. Sales in Q1 fiscal 2018 were at an average price per carat sold of $90 as compared to an average price per carat of $58 in opening inventory. This led to a lower-than-average estimated market value per carat of $56 for the remaining goods in available-for-sale inventory at the end of the quarter. The lower-than-average estimated market value reflects a slower recovery of the market for lower-value white goods relative to other segments of the market from the disruption in trading following the demonetization of the Indian rupee in November 2016. Cost of inventory available-for-sale decreased in line with decreases in carats and market value.
| Dominion Diamond Corporation | First Quarter Fiscal 2018 Management’s Discussion & Analysis | 18 |
| Overview | Consolidated
Performance Review | Segment
Performance Review | Liquidity & Capital
Resources | Quarterly Financial
Highlights | Non-IFRS Financial
Measures | Other Information &
Advisories |
Operational Performance
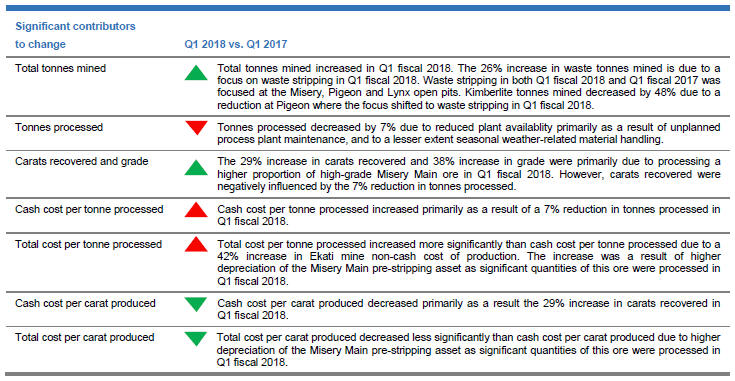
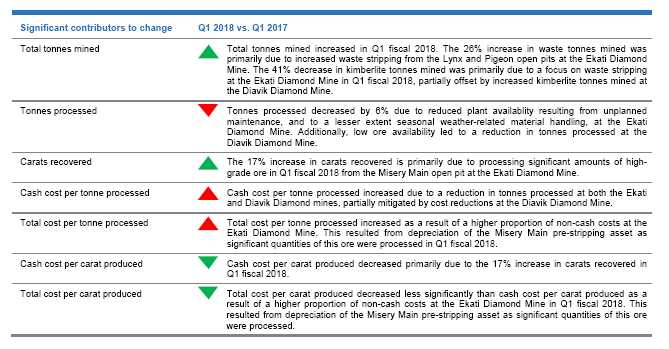
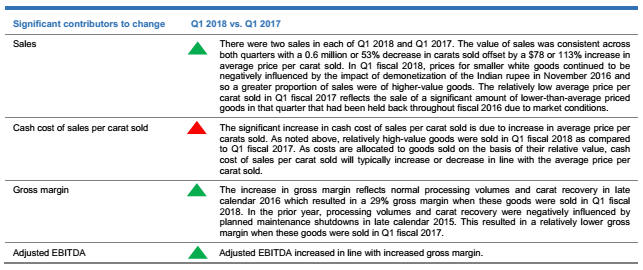
Carats recovered in Q1 fiscal 2018 increased to 2.1 million carats from 1.8 million carats in Q1 fiscal 2017. While the production mix at Diavik Diamond Mine remained relatively consistent quarter-on-quarter, continued processing of higher proportions of high-grade ore from the Misery Main open pit at the Ekati Diamond Mine resulted in a 17% increase in carats recovered in Q1 fiscal 2018. Mining performance was strong in Q1 fiscal 2018 with total tonnes moved exceeding plan at both the Ekati and Diavik Diamond Mines. However, carat recoveries in Q1 fiscal 2018 were negatively influenced by a 6% decrease in tonnes processed as compared to Q1 fiscal 2017 due to reduced plant availablity resulting from unplanned maintenance, and to a lesser extent seasonal weather-related material handling, at the Ekati Diamond Mine. Additionally, low ore availability led to a reduction in tonnes processed at the Diavik Diamond Mine. Cash cost and total cost per tonne processed increased in Q1 fiscal 2018 due to the decrease in tonnes processed. However, cash cost and total cost per carat produced decreased as a result of the increase in carats recovered. Significant contributors to change in Q1 2018 are outlined below.
| (i) | The terms “cash cost per tonne processed,” “total cost per tonne processed,” “cash cost per carat produced” and “total cost per carat produced” do not have standardized meanings according to IFRS. See “Non-IFRS Financial Measures” for additional information. |
| Dominion Diamond Corporation | First Quarter Fiscal 2018 Management’s Discussion & Analysis | 19 |
| Overview | Consolidated
Performance Review | Segment
Performance Review | Liquidity & Capital
Resources | Quarterly Financial
Highlights | Non-IFRS Financial
Measures | Other Information &
Advisories |
Segment Performance Review
Our operating segments include the Ekati Diamond Mine, the Diavik Diamond Mine and the Corporate segment. The Corporate segment captures costs not specifically related to operating the Ekati and Diavik mines. Our segmented analysis reflects how we manage our business and classify our operations for planning and measurement purposes.
Ekati Diamond Mine (100% basis)
| Financial Performance | | | | | | | | | |
| (in millions of United States dollars, except where otherwise noted) | | Three months ended April 30 | |
| | | 2017 | | | 2016 | | | Change | |
| Sales | $ | 137.7 | | $ | 105.1 | | $ | 32.6 | |
| Carats sold (000s) | | 1,834 | | | 1,545 | | | 289 | |
| Average price per carat sold ($/carat) | $ | 75 | | $ | 68 | | $ | 7 | |
| Cash cost of sales per carat sold(i)($/carat) | $ | 39 | | $ | 59 | | $ | (20 | ) |
| Gross margin | $ | 9.8 | | $ | (31.8 | ) | $ | 41.6 | |
| Gross margin (%) | | 7% | | | (30% | ) | | 37% | |
| Adjusted EBITDA(i) | $ | 64.3 | | $ | 25.9 | | $ | 38.4 | |
| Adjusted EBITDA margin(i)(%) | | 47% | | | 25% | | | 22% | |
| Depreciation and amortization | $ | 56.0 | | $ | 38.9 | | $ | 17.1 | |
| (i) | The terms “cash cost of sales per carat sold,” “Adjusted EBITDA” and “Adjusted EBITDA margin” do not have standardized meanings according to IFRS. See “Non-IFRS Financial Measures” for additional information. |
| Dominion Diamond Corporation | First Quarter Fiscal 2018 Management’s Discussion & Analysis | 20 |
| Overview | Consolidated
Performance Review | Segment
Performance Review | Liquidity & Capital
Resources | Quarterly Financial
Highlights | Non-IFRS Financial
Measures | Other Information &
Advisories |
| Diamond Inventory | | | | | | | | | | | | |
| (in millions of United States dollars, except where otherwise noted) | | | | | | | | | | | | |
| | | April 30, 2017 | | | January 31, 2017 | | | Change | | | % Change | |
| | | | | | | | | | | | | |
| Carats in inventory available-for-sale (000s) | | 2,491 | | | 3,046 | | | (555 | ) | | (18% | ) |
| | | | | | | | | | | | | |
| Estimated market value of inventory available-for-sale | $ | 125 | | $ | 156 | | $ | (31 | ) | | (20% | ) |
| | | | | | | | | | | | | |
| Estimated average market value per carat available-for-sale ($/carat) | $ | 50 | | $ | 51 | | $ | (1 | ) | | (2% | ) |
| | | | | | | | | | | | | |
| Cost of inventory available-for-sale | $ | 115 | | $ | 143 | | $ | (28 | ) | | (20% | ) |
Rough diamond inventory classified as available-for-sale represents carats that have completed the sorting and valuation process. Carats still undergoing sorting and valuation are classified as work-in-progress inventory.
The 18% decrease in carats in inventory available-for-sale from 3.0 million at January 31, 2017 to 2.5 million at April 30, 2017 reflects 1.3 million carats transferred to available-for-sale during the quarter compared to 1.8 million carats sold. Due to the time required for initial sorting and valuation, carats transferred to available-for-sale diamond inventory in a given period will differ from the number of carats recovered by the mine in that period. At April 30, 2017, we also had approximately 0.6 million carats of rough diamond inventory that was work-in-progress (January 31, 2017 – 0.5 million carats) and that were primarily from Misery Main, with lesser amounts from Koala underground and Pigeon.
The estimated market value of diamond inventory available-for-sale decreased by 20% from approximately $156 million at January 31, 2017 to approximately $125 million at April 30, 2017, primarily as a result of the decrease in carats in inventory. The decrease was also due to the auction of approximately $21 million of high-value fancy coloured diamonds in Q1 fiscal 2018, predominantly from the Misery Main pipe. These diamonds had a higher average price per carat as compared to the estimated average market value of inventory available-for-sale. Ekati segment sales in Q1 fiscal 2018 were at an average price per carat sold of $75 as compared to an average price per carat of $51 in opening inventory. While there was some accumulation of lower-than-average value goods in inventory at the end of Q1 fiscal 2018, this was less pronounced than in the Diavik segment given some improvement in demand for lower-value brown diamonds, of which there is a greater proportion in the Ekati segment. Cost of inventory available-for-sale decreased in line with decreases in carats and market value.
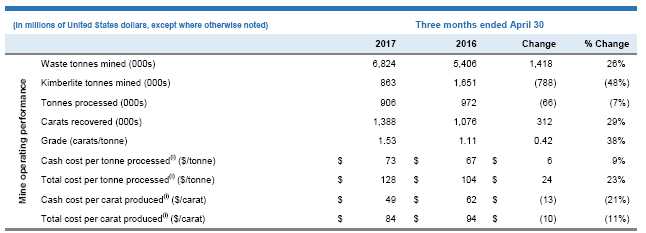
Operational Performance
During Q1 fiscal 2018, the Ekati Diamond Mine recovered, on a 100% basis, 1.4 million carats from 0.9 million tonnes processed (Q1 fiscal 2017 – 1.1 million carats from 1.0 million tonnes processed). Carat production was positively influenced in the quarter by the continued processing of a large proportion of high-grade Misery Main ore, resulting in a 29% increase in carat production from 1.1 milion carats in Q1 fiscal 2017. In Q1 fiscal 2017, the recovered grade of Misery Main ore was lower than modelled grade due to dilution experienced in the initial processing of this ore prior to the start of comercial production at Misery Main in May 2016. Carat production in Q1 fiscal 2018 was negatively influenced by a 7% decrease in tonnes processed from Q1 fiscal 2017 due to reduced plant availablity resulting from unplanned maintenance, and to a lesser extent seasonal weather-related material handling.
| | For the three months ended April 30, 2017 | | For the three months ended April 30, 2016 |
| | Tonnes | | | | Tonnes | | |
| | processed | Carats | Grade | | processed | Carats | Grade |
| | (000s tonnes) | (000s) | (carats/tonne) | | (000s tonnes) | (000s) | (carats/tonne) |
| Koala | 500 | 221 | 0.44 | | 314 | 197 | 0.63 |
| Misery Main | 258 | 1,115 | 4.30 | | 75 | 204 | 2.72 |
| Pigeon | 148 | 52 | 0.35 | | 248 | 109 | 0.44 |
| Misery Satellites | – | – | – | | 335 | 566 | 1.69 |
| Total | 906 | 1,388 | 1.53 | | 972 | 1,076 | 1.11 |
| Dominion Diamond Corporation | First Quarter Fiscal 2018 Management’s Discussion & Analysis | 21 |
| Overview | Consolidated
Performance Review | Segment
Performance Review | Liquidity & Capital
Resources | Quarterly Financial
Highlights | Non-IFRS Financial
Measures | Other Information &
Advisories |
Mining activities in Q1 fiscal 2018 were focused at the Misery, Pigeon and Lynx open pits and at Koala underground. Approximately 1.8 million tonnes of kimberlite material remained in stockpiles at the end of Q1 fiscal 2018, primarily from Pigeon and Misery Satellites. Both cash cost per tonne processed and total cost per tonne processed increased in Q1 fiscal 2018 as a result of reduced tonnes processed, although cash cost per carat produced and total cost per carat produced decreased in the same period as a result of increased carat production. Significant contributors to change in Q1 2018 are outlined below.
| (i) | The terms “cash cost per tonne processed,” “total cost per tonne processed,” “cash cost per carat produced” and “total cost per carat produced” do not have standardized meanings according to IFRS. See “Non-IFRS Financial Measures” for additional information. |
| Dominion Diamond Corporation | First Quarter Fiscal 2018 Management’s Discussion & Analysis | 22 |
| Overview | Consolidated
Performance Review | Segment
Performance Review | Liquidity & Capital
Resources | Quarterly Financial
Highlights | Non-IFRS Financial
Measures | Other Information &
Advisories |
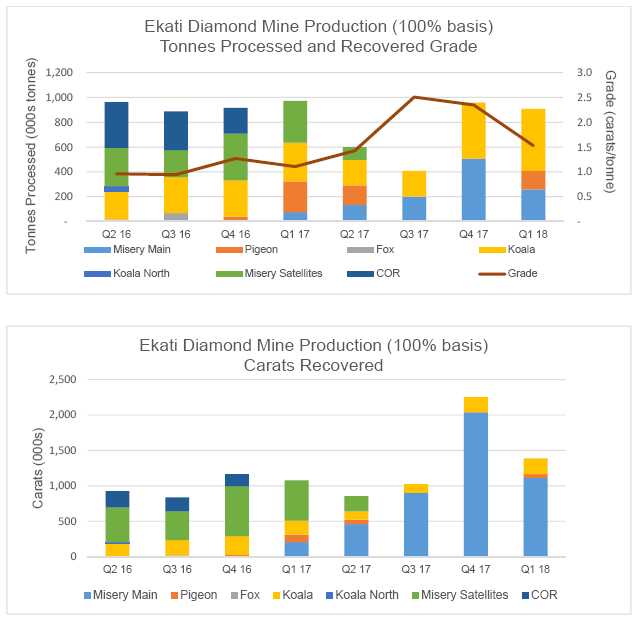
The charts below show the Ekati Diamond Mine tonnes processed, recovered grade and carats recovered for the eight most recent fiscal quarters. Carat recovery reflected the expected shift in the mine plan beginning in fiscal 2016 from higher-value production from the Koala, Koala North and Fox ore bodies to lower-value material from Misery Satellites and COR, while pre-stripping was being completed in the high-value Misery Main open pit. Misery Main commenced commercial production in May 2016 and initial sales began in late fiscal 2017. A fire at the Ekati Diamond Mine process plant that occurred in June 2016 resulted in a shutdown of the process plant between June and September 2016 and negatively impacted tonnes processed and carats recovered in the second and third fiscal quarters of 2017. The processing of material from the high-grade Misery Main open pit led to a greater number of carats recovered in Q4 fiscal 2017 and Q1 fiscal 2018.
| Dominion Diamond Corporation | First Quarter Fiscal 2018 Management’s Discussion & Analysis | 23 |
| Overview | Consolidated
Performance Review | Segment
Performance Review | Liquidity & Capital
Resources | Quarterly Financial
Highlights | Non-IFRS Financial
Measures | Other Information &
Advisories |
Capital Expenditure
The chart below sets out the year to date capital expenditure by project for fiscal 2018 at the Ekati Diamond Mine. Capital expenditure in Q1 fiscal 2018 included $44 million of sustaining capital and $20 million of growth capital, primarily at the Sable Project. Capital expenditure includes development projects, capitalized evaluation activity and sustaining capital, and is presented on an accrual basis. There may be differences in timing between the recording of capital expenditure on an accrual basis for accounting purposes and the date of cash payment.
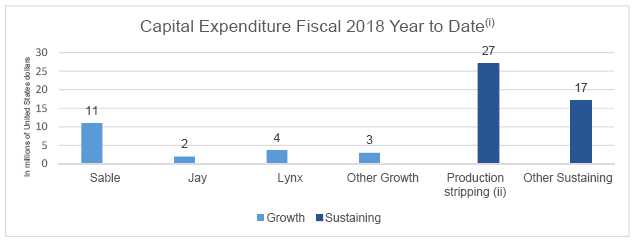
| (i) | Presented on an accrual basis. |
| | |
| (ii) | Represents excess waste stripping in open pits that have achieved commercial production. Costs are capitalized as deferred stripping assets and amortized on a unit-of-production basis as the associated material is processed. |
| Project | Update |
| | |
| Sable | A strong winter construction season focused on the completion of a frozen core dam at the outlet of Two Rock Lake, which began in December and was finished in early April. Expenditure in Q1 fiscal 2018 was below budget. As a result of strong progress on the Sable Project, we expect initial development capital for the project to be approximately 25% below the pre-feasibility investment case. |
| | |
| Jay | Expenditure for the Jay Project in Q1 fiscal 2018 related primarily to preparing materials and equipment for road construction and were below budget for the quarter. |
| | |
| Lynx | Waste stripping continued at the Lynx open pit in Q1 fiscal 2018 and first ore was mined in March 2017. Processing of high- value Lynx ore is planned to commence in Q2 fiscal 2018. The Lynx pipe achieved commercial production on April 1, 2017 and subsequent expenditure will be expensed as a cost of production. |
| | |
| Other growth | Other growth projects in Q1 fiscal 2018 included the start of construction on a new maintenance facility for the Dual-Powered Road Trains and improvements to the diamond cleaning and sorting process. |
| | |
| Production stripping | Expenditure related primarily to production stripping at the Pigeon open pit where mining was focused on waste removal. To a lesser extent, some excess waste was also removed from the Misery open pit and capitalized in Q1 fiscal 2018 as production stripping. |
| | |
| Other sustaining | Other sustaining capital expenditure included receipt of equipment and construction materials on the seasonal winter road in February and March 2017, including the delivery of two Dual-Powered Road Trains. |
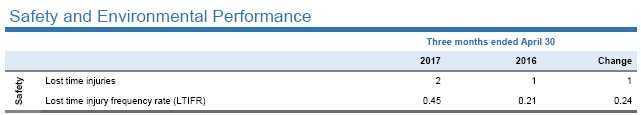
Two lost time injuries were experienced in Q1 fiscal 2018, corresponding to a frequency rate per 200,000 hours worked (“LTIFR”) of 0.45 (Q1 fiscal 2017 – one lost time injury for an LTIFR of 0.21) .
In Q1 fiscal 2018, there were no significant environmental incidents at the Ekati Diamond Mine.
| Dominion Diamond Corporation | First Quarter Fiscal 2018 Management’s Discussion & Analysis | 24 |
| Overview | Consolidated
Performance Review | Segment
Performance Review | Liquidity & Capital
Resources | Quarterly Financial
Highlights | Non-IFRS Financial
Measures | Other Information &
Advisories |
Diavik Diamond Mine (40% basis)
| Financial Performance | | | | | | | | | |
| (in millions of United States dollars, except where otherwise noted) | | Three months ended April 30 | |
| | | 2017 | | | 2016 | | | Change | |
| Sales | $ | 73.3 | | $ | 73.1 | | $ | 0.2 | |
| Carats sold (000s) | | 499 | | | 1,055 | | | (556 | ) |
| Average price per carat sold ($/carat) | $ | 147 | | $ | 69 | | $ | 78 | |
| Cash cost of sales per carat sold(i)($/carat) | $ | 66 | | $ | 36 | | $ | 30 | |
| Gross margin | $ | 21.0 | | $ | 13.0 | | $ | 8.0 | |
| Gross margin (%) | | 29% | | | 18% | | | 11% | |
| Adjusted EBITDA(i) | $ | 40.3 | | $ | 34.5 | | $ | 5.8 | |
| Adjusted EBITDA margin(i)(%) | | 55% | | | 47% | | | 8% | |
| Depreciation and amortization | $ | 19.5 | | $ | 22.4 | | $ | (2.9 | ) |
| (i) | The terms “cash cost of sales per carat sold,” “Adjusted EBITDA” and “Adjusted EBITDA margin” do not have standardized meanings according to IFRS. See “Non-IFRS Financial Measures” for additional information. |
| Dominion Diamond Corporation | First Quarter Fiscal 2018 Management’s Discussion & Analysis | 25 |
| Overview | Consolidated
Performance Review | Segment
Performance Review | Liquidity & Capital
Resources | Quarterly Financial
Highlights | Non-IFRS Financial
Measures | Other Information &
Advisories |
| Diamond Inventory | | | | | | | | | | | | |
| (in millions of United States dollars, except where otherwise noted) | | | | | | | | | | | | |
| | | April 30, 2017 | | | January 31, 2017 | | | Change | | | % Change | |
| Carats in inventory available-for-sale (000s) | | 1,060 | | | 628 | | | 432 | | | 69% | |
| Estimated market value of inventory available-for-sale | $ | 75 | | $ | 56 | | $ | 19 | | | 34% | |
| Estimated average market value per carat available-for-sale ($/carat) | $ | 71 | | $ | 89 | | $ | (18 | ) | | (20% | ) |
| Cost of inventory available-for-sale | $ | 44 | | $ | 38 | | $ | 6 | | | 16% | |
Rough diamond inventory classified as available-for-sale represents carats that have completed the sorting and valuation process. Carats still undergoing sorting and valuation are classified as work-in-progress inventory.
The 69% increase in carats in inventory available-for-sale from 0.6 million at January 31, 2017 to 1.1 million at April 30, 2017 reflects 1.0 million carats transferred to available-for-sale during the quarter compared to 0.5 million carats sold. As we receive rough diamonds from the Diavik Diamond Mine in periodic shipments, carats transferred to available-for-sale diamond inventory in a given period will differ from the number of carats recovered by the mine in that period.
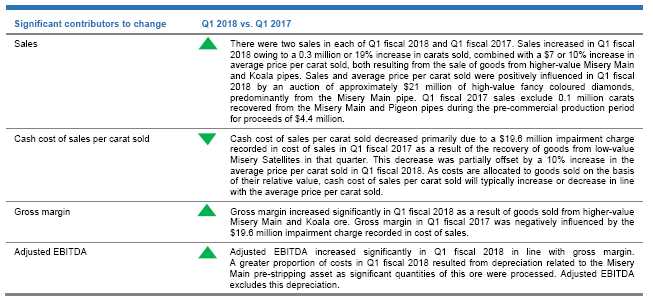
The estimated market value of diamond inventory available-for-sale increased by 34% from approximately $56 million at January 31, 2017 to approximately $75 million at April 30, 2017 as a result of the increase in carats, but was offset by the 20% decrease in average value per carat available-for-sale from $89 to $71. Diavik segment sales in Q1 fiscal 2018 were at an average price per carat sold of $147 as compared to an average price per carat of $89 in opening inventory. This led to a lower-than-average estimated market value per carat of $71 for the remaining goods in available-for-sale inventory at the end of the quarter. The lower-than-average estimated market value reflects a relatively slower recovery of the market for lower-value white goods due to the disruption in trading following the demonetization of the Indian rupee in November 2016. Cost of inventory available-for-sale increased in line with increases in carats and market value.
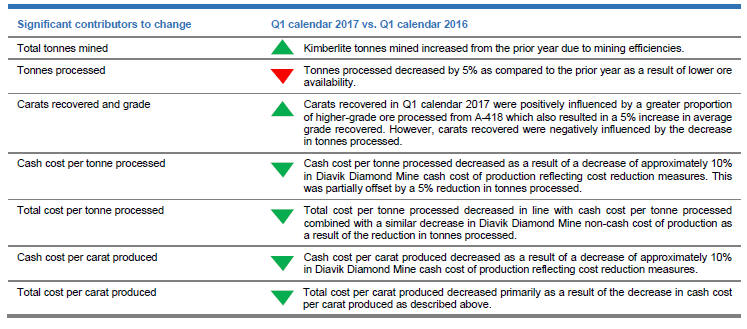
Operational Performance
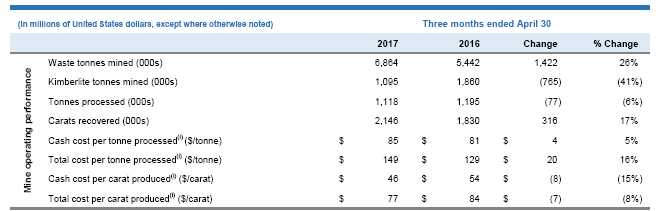
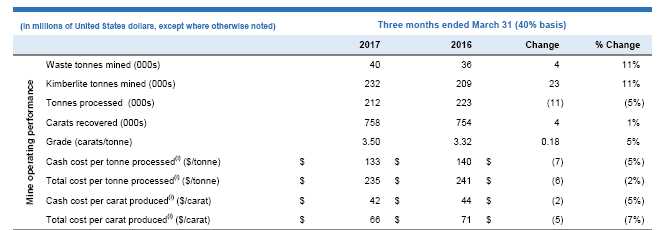
During Q1 calendar 2017, the Diavik Diamond Mine recovered, on a 40% basis, 0.8 million carats from 0.2 million tonnes processed (Q1 calendar 2016 – 0.8 million carats from 0.2 million tonnes processed). Carat production and average grade were positively influenced in Q1 calendar 2017 by the processing of a relatively high proportion of higher-grade A-418 ore. This was offset by a 5% reduction in the volume of tonnes processed such that carats recovered remained relatively consistent with the comparable period of the prior year.
| | For the three months ended March 31, 2017 | For the three months ended March 31, 2016 |
| | Tonnes | | | Tonnes | | |
| | processed | Carats | Grade | processed | Carats | Grade |
| | (000s tonnes) | (000s) | (carats/tonne) | (000s tonnes) | (000s) | (carats/tonne) |
| A-154 South | 40 | 132 | 3.25 | 49 | 142 | 2.90 |
| A-154 North | 61 | 163 | 2.65 | 71 | 166 | 2.34 |
| A-418 | 110 | 447 | 4.08 | 102 | 430 | 4.22 |
| COR | 1 | 16 | – | 1 | 16 | – |
| Total | 212 | 758 | 3.50(i) | 223 | 754 | 3.32(i) |
| (i) | Grade has been adjusted to exclude COR. |
| Dominion Diamond Corporation | First Quarter Fiscal 2018 Management’s Discussion & Analysis | 26 |
| Overview | Consolidated
Performance Review | Segment
Performance Review | Liquidity & Capital
Resources | Quarterly Financial
Highlights | Non-IFRS Financial
Measures | Other Information &
Advisories |
Mining activities in Q1 calendar 2017 were focused at the A-154 South, A-154 North and A-418 underground operations. As kimberlite mined at Diavik in Q1 calendar 2017 and Q1 calendar 2016 was exclusively from underground sources, waste tonnes mined were minimal in both quarters.
| (i) | The terms “cash cost per tonne processed,” “total cost per tonne processed,” “cash cost per carat produced” and “total cost per carat produced” do not have standardized meanings according to IFRS. See “Non-IFRS Financial Measures” for additional information. |
| Dominion Diamond Corporation | First Quarter Fiscal 2018 Management’s Discussion & Analysis | 27 |
| Overview | Consolidated
Performance Review | Segment
Performance Review | Liquidity & Capital
Resources | Quarterly Financial
Highlights | Non-IFRS Financial
Measures | Other Information &
Advisories |
The charts below show our 40% share of Diavik Diamond Mine tonnes processed, recovered grade and carats recovered for the eight most recent calendar quarters. The production mix has remained relatively consistent, with carat production largely driven by changes in processing volumes, and some lower recovered grades in calendar 2016 as a result of higher levels of underground dilution encountered in the A-418 and A-154 South kimberlite pipes.

| Dominion Diamond Corporation | First Quarter Fiscal 2018 Management’s Discussion & Analysis | 28 |
| Overview | Consolidated
Performance Review | Segment
Performance Review | Liquidity & Capital
Resources | Quarterly Financial
Highlights | Non-IFRS Financial
Measures | Other Information &
Advisories |
Capital Expenditure
The chart below sets out the year to date capital expenditure by project for Q1 calendar 2017 at the Diavik Diamond Mine (40% basis). Capital expenditure in Q1 calendar 2017 included $4 million of sustaining capital and $9 million of growth capital. Capital expenditure includes development projects, underground development and sustaining capital, and is presented on an accrual basis. There may be differences in timing between the recording of capital expenditure on an accrual basis for accounting purposes and the date of cash payment.
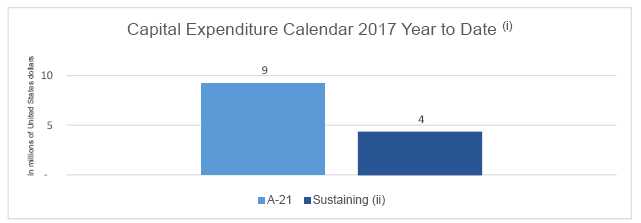
| (i) | Presented on an accrual basis. |
| (ii) | Sustaining includes underground mine development. |
| Project | Update |
| A-21 | In Q1 calendar 2017, the primary focus of construction activities was continued curtain grouting of the cut-off wall for the A-21 dike. The winter road mobilization for the final year of construction was also successfully completed. The A-21 Project remains on schedule and on budget. |
| Sustaining | Expenditure primarily related to continued underground development. |
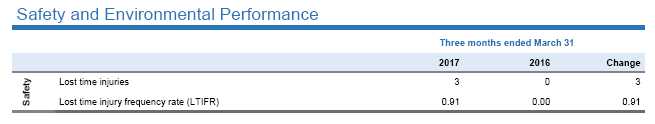
Three lost time injuries were experienced in Q1 calendar 2017, corresponding to an LTIFR of 0.91 (Q1 calendar 2016 – no lost time injuries for an LTIFR of 0.00) .
In Q1 calendar 2017, there were no significant environmental incidents at the Diavik Diamond Mine.
| Dominion Diamond Corporation | First Quarter Fiscal 2018 Management’s Discussion & Analysis | 29 |
| Overview | Consolidated
Performance Review | Segment
Performance Review | Liquidity & Capital
Resources | Quarterly Financial
Highlights | Non-IFRS Financial
Measures | Other Information &
Advisories |
Corporate Segment
| Financial Performance | | | | | | | | | |
| (in millions of United States dollars) | | Three months ended April 30 | |
| | | 2017 | | | 2016 | | | Change | |
| Selling, general and administrative expenses | $ | 5.9 | | $ | 6.3 | | $ | (0.4 | ) |
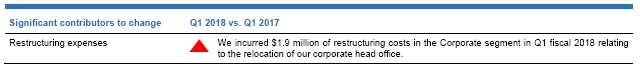
| Restructuring expenses | | 1.9 | | | – | | | 1.9 | |
| Dominion Diamond Corporation | First Quarter Fiscal 2018 Management’s Discussion & Analysis | 30 |
| Overview | Consolidated
Performance Review | Segment
Performance Review | Liquidity & Capital
Resources | Quarterly Financial
Highlights | Non-IFRS Financial
Measures | Other Information &
Advisories |
Liquidity and Capital Resources
Financial Condition
We maintained a strong balance sheet at April 30, 2017, with total unrestricted cash resources of $131.2 million, debt of $10.6 million, and $210 million available under our revolving credit facility. Cash and cash equivalents decreased by $5.0 million in the first quarter mainly as a result of $72.2 million in capital investments relating to growth and sustaining capital projects at the Ekati and Diavik Diamond Mines and $13.1 million of shares that were repurchased under our normal course issuer bid (“NCIB”). Cash outflows were partially offset by $56.7 million of net cash from operating activities and $14.6 million of restricted cash released. Our investment in working capital has historically been higher in the first fiscal quarter of the year due to bulk purchases of supplies for shipment to the Ekati and Diavik Diamond Mine sites on the seasonal winter access road.
Balance Sheet Review
| | | April 30, | | | January 31, | |
| (in millions of United States dollars) | | 2017 | | | 2017 | |
| Cash and cash equivalents | $ | 131.2 | | $ | 136.2 | |
| Other current assets | | 511.8 | | | 473.6 | |
| Other non-current assets | | 1,397.4 | | | 1,394.1 | |
| Total assets | $ | 2,040.4 | | $ | 2,003.9 | |
| Current portion of loans and borrowings | | 10.6 | | | 10.6 | |
| Other current liabilities | | 231.5 | | | 164.7 | |
| Other non-current liabilities | | 508.8 | | | 499.7 | |
| Total equity | | 1,289.5 | | | 1,328.9 | |
| Total liabilities and equity | $ | 2,040.4 | | $ | 2,003.9 | |
| Significant contributors to change | April 30, 2017 versus January 31, 2017 |
| | |
| Cash and cash equivalents | Cash and cash equivalents decreased due to $72.2 million of capital investments relating to growth and sustaining capital projects at the Ekati and Diavik Diamond Mines and $13.1 million of shares that were repurchased under our NCIB. This was partially offset by $56.7 million of net cash from operating activities and an increase in unrestricted cash of approximately $14.6 million as a result of the release of a portion of our restricted cash. |
| | |
| Other current assets | Other current assets have increased primarily due to the delivery of supplies inventory to both Ekati and Diavik Diamond Mine sites on the seasonal winter road in Q1 fiscal 2018. This was partially offset by a reduction in diamond inventory. |
| | |
| Other non-current assets | Additions to property, plant and equipment were largely offset by the depreciation of assets, an increase in deferred income tax assets and a decrease in restricted cash as discussed above. |
| | |
| Loans and borrowings | The current portion of loans and borrowings represents the final installment of a promissory note that was issued in October 2015 and fully paid in May 2017. |
| | |
| Other current liabilities | Current liabilities increased in Q1 fiscal 2018 as a result of an increase in income tax payable, dividends declared during the quarter and deliveries on the seasonal winter road, which increased accounts payable at April 30, 2017. |
| | |
| Other non-current liabilities | Other non-current liabilities include our provisions for reclamation at the Ekati and Diavik Diamond Mines, employee benefit plans, and deferred income tax liabilities. There were minimal changes to these balances in Q1 fiscal 2018. |
| | |
| Total equity | The $39.4 million decrease in equity is primarily due to a reduction of share capital as a result of our share repurchases under the NCIB and dividends declared in the quarter. |
| Dominion Diamond Corporation | First Quarter Fiscal 2018 Management’s Discussion & Analysis | 31 |
| Overview | Consolidated
Performance Review | Segment
Performance Review | Liquidity & Capital
Resources | Quarterly Financial
Highlights | Non-IFRS Financial
Measures | Other Information &
Advisories |
| Cash Flow Movement | | | | | | |
| | | | | | | |
| (in millions of United States dollars) | | Three months ended April 30 | |
| | | 2017 | | | 2016 | |
| Opening cash at February 1, 2016 and February 1, 2017 | $ | 136.2 | | $ | 320.0 | |
| Cash from operating activities before changes in non-cash operating working capital, interest paid and income and mining taxes paid | | 73.7 | | | 58.5 | |
| Changes in non-cash operating working capital | | (16.8 | ) | | 6.8 | |
| Interest paid | | (0.1 | ) | | (0.1 | ) |
| Income and mining taxes paid | | (0.1 | ) | | (47.3 | ) |
| Capital expenditures for the period | | (72.2 | ) | | (111.7 | ) |
| Net proceeds from pre-production sales | | – | | | 3.7 | |
| Decrease in restricted cash | | 14.6 | | | – | |
| Share repurchase | | (13.1 | ) | | – | |
| Repayment of debt | | – | | | (0.2 | ) |
| Contributions from and distributions made to minority partners, net | | – | | | (4.0 | ) |
| Other | | 9.0 | | | 0.8 | |
| Closing cash at April 30, 2016 and April 30, 2017 | $ | 131.2 | | $ | 226.5 | |
Cash Flows from Operating Activities
As at April 30, 2017, we had unrestricted cash and cash equivalents of $131.2 million and restricted cash of $48.0 million, compared to $136.2 million and $65.7 million, respectively, at January 31, 2017. The restricted cash is used to support letters of credit to the GNWT in the amount of CDN $5.4 million to secure the reclamation obligations for the Ekati Diamond Mine and CDN $60 million to secure the reclamation obligations at the Diavik Diamond Mine. In February 2017, CDN $20 million of letters of credit were cancelled, with the corresponding amount of restricted cash released. The security was replaced by an additional CDN $20 million of surety bonds posted with the GNWT. A total of CDN $273 million of surety bonds were posted with the GNWT as at April 30, 2017. During Q1 fiscal 2018, we reported net cash from operating activities of $56.7 million, compared to $18.0 million in Q1 fiscal 2017. The increase was primarily due to $47.3 million of cash taxes paid for income and royalty taxes in Q1 fiscal 2017 whereas payments were lower in Q1 fiscal 2018 due to timing differences. Working capital decreased to $400.9 million at April 30, 2017 from $434.5 million at January 31, 2017. During Q1 fiscal 2018, our non-cash operating working capital fluctuations were as follows: accounts receivable increased by $3.2 million, other current assets increased by $2.6 million, inventory and supplies increased by $43.7 million, and trade and other payables increased by $32.7 million.
The process plant fire at the Ekati Diamond Mine that occurred on June 23, 2016 resulted in a temporary suspension of processing and the resumption of process plant operations at full capacity on September 21, 2016. A $6.7 million expected insurance recovery for property damage relating to the fire was recorded in Q3 fiscal 2017, of which CDN $2.5 million was received in Q4 fiscal 2017. The remaining amount receivable will be combined with our business interruption claim. We hold business interruption insurance covering losses as a result of the fire, but due to the complex nature of this claim, total amounts receivable under the business interruption claim cannot be determined at this time.
Cash Flows from Investing Activities
On February 1, 2017, we determined that our participating interest in the Buffer Zone had increased from 65.3% to 72.0% in accordance with the Buffer Zone Joint Venture agreement. The change resulted from a decision by Archon not to participate in the full year fiscal 2017 program and budget for the Buffer Zone.
| Dominion Diamond Corporation | First Quarter Fiscal 2018 Management’s Discussion & Analysis | 32 |
| Overview | Consolidated
Performance Review | Segment
Performance Review | Liquidity & Capital
Resources | Quarterly Financial
Highlights | Non-IFRS Financial
Measures | Other Information &
Advisories |
On June 5, 2017, we reached an agreement with Archon to convert Archon’s participating interest in the Buffer Zone to a royalty equal to 2.3% of all future gross revenue from diamonds produced from the Buffer Zone. As a result of this transaction, our ownership interest in the Buffer Zone increased to 100.0% .
During the first quarter, investment in property, plant and equipment was $72.2 million, of which $59.6 million related to the Ekati Diamond Mine and $12.6 million related to the Diavik Diamond Mine. Expenditures related primarily to construction and development of new kimberlite pipes at both mines, as well as excess waste stripping in open pits which is capitalized as production stripping.
| | | Three months ended | | | Three months ended | |
| (in millions of United States dollars) | | April 30, 2017 | | | April 30, 2016 | |
| Ekati sustaining capital expenditures | $ | 16.6 | | $ | 18.6 | |
| Ekati production stripping expenditures | | 27.0 | | | 3.1 | |
| Diavik sustaining capital expenditures | | 4.3 | | | 6.0 | |
| Total sustaining capital expenditures | $ | 47.9 | | $ | 27.7 | |
| Sable expenditures | | 11.0 | | | 9.6 | |
| Lynx expenditures | | 3.7 | | | 13.7 | |
| Jay expenditures | | 2.1 | | | 23.4 | |
| Misery expenditures | | – | | | 19.8 | |
| A-21 expenditures | | 9.2 | | | 12.0 | |
| Other expenditures | | 3.3 | | | 5.2 | |
| Total growth capital expenditures | $ | 29.3 | | $ | 83.7 | |
| Reconciliation to capital cash additions: | | | | | | |
| Capitalized depreciation | | (3.4 | ) | | (2.7 | ) |
| Capital accruals | | (1.6 | ) | | 3.0 | |
| Total cash capital additions | $ | 72.2 | | $ | 111.7 | |
Cash Flows from Financing Activities
During the first quarter, we had a cash outflow from financing activities of $12.8 million, which consisted primarily of share repurchases.
On April 7, 2015, we entered into a $210 million senior secured corporate revolving credit facility with a syndicate of commercial banks. The facility has a four-year term, and it may be extended for an additional period of one year with the consent of the lenders. Proceeds received by us under the credit facility are to be used for general corporate purposes. We are in compliance with the required financial covenants, which are customary for a financing of this nature. As at April 30, 2017, no amounts were outstanding under our senior secured corporate revolving credit facility. In May 2017, our restricted cash of $48.0 million was released and letters of credit were issued under our senior secured corporate revolving credit facility. As a result, unrestricted cash increased by $48.0 million and availability under the credit facility was reduced by the same amount.
On July 15, 2016, the Toronto Stock Exchange (“TSX”) approved our NCIB to purchase for cancellation up to 6,150,010 common shares, representing approximately 10% of the public float as of July 6, 2016, from July 20, 2016 to no later than July 19, 2017. On July 28, 2016, the TSX accepted our entry into an automatic securities purchase plan in order to facilitate repurchases under the NCIB. Common shares repurchased under the NCIB will be cancelled. Purchases under the NCIB may be made through the facilities of the TSX, the New York Stock Exchange or alternative trading platforms in Canada or the United States by means of open market transactions or by such other means as may be permitted by the TSX and applicable US securities laws. Purchases under the NCIB began in August 2016 and resulted in the purchase of approximately 4.7 million shares as of April 30, 2017 for approximately CDN $58.8 million. An additional 0.1 million shares were purchased in May 2017 for approximately CDN $1.9 million. A shareholder of the Company may obtain a copy of the notice filed with the TSX in relation to the NCIB, without charge, by contacting our Corporate Secretary at P.O. Box 4569, Station “A,” Toronto, Ontario M5W 4T9.
On April 12, 2017, the Board of Directors declared a dividend of $0.20 per share that was paid on June 5, 2017, to shareholders of record at the close of business on May 17, 2017. The dividend will be an eligible dividend for Canadian income tax purposes.
| Dominion Diamond Corporation | First Quarter Fiscal 2018 Management’s Discussion & Analysis | 33 |
| Overview | Consolidated
Performance Review | Segment
Performance Review | Liquidity & Capital
Resources | Quarterly Financial
Highlights | Non-IFRS Financial
Measures | Other Information &
Advisories |
Working Capital and Liquidity
The following chart shows our working capital balances for the eight most recent quarters, as well as the working capital ratios for the same periods. Working capital is calculated as total current assets less total current liabilities, and working capital ratio is calculated as total current assets divided by total current liabilities.
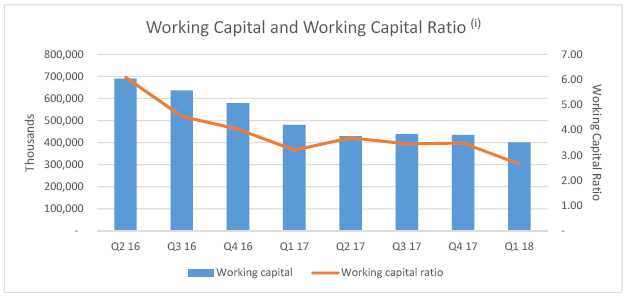
| (i) | The terms “working capital” and “working capital ratio” do not have standardized meanings according to IFRS. See “Non-IFRS Financial Measures” for additional information. |
As at April 30, 2017, we had $131.2 million in unrestricted cash and cash equivalents as well as $210 million in availability under our revolving credit facility. Our requirements for cash are operating expenses, working capital, contractual debt requirements and capital expenditures. We believe that we will generate sufficient liquidity to meet our anticipated requirements for at least the next twelve months. Given the remote nature of both the Ekati and Diavik Diamond Mines, operational costs associated with construction of the winter road and delivery of supplies inventory and capital equipment typically result in higher cash expenditure in the first half of each fiscal year.
In May 2017, our restricted cash of $48.0 million was released and amounts were secured under our senior secured corporate revolving credit facility. As a result, unrestricted cash increased by $48.0 million and availability under the credit facility was reduced by the same amount.
Our liquidity requirements fluctuate year over year and quarter over quarter depending on, among other factors, the seasonality of production at our mineral properties; the seasonality of mine operating expenses; capital expenditure programs; the number of rough diamond sales events conducted during the year; and the volume, size and quality distribution of rough diamonds delivered from our mineral properties and sold in the year. We assess liquidity and capital resources on a consolidated basis.
| Dominion Diamond Corporation | First Quarter Fiscal 2018 Management’s Discussion & Analysis | 34 |
| Overview | Consolidated
Performance Review | Segment
Performance Review | Liquidity & Capital
Resources | Quarterly Financial
Highlights | Non-IFRS Financial
Measures | Other Information &
Advisories |
Free Cash Flow
The term “free cash flow” is a non-IFRS measure, which is defined as net cash from operating activities, less sustaining capital expenditure and less growth capital expenditure. We believe that free cash flow is a useful indicator of our ability to operate without reliance on additional borrowing or usage of existing cash.
| (in millions of United States dollars) | | Three months ended April 30 | |
| | | 2017 | | | 2016 | |
| Net cash from operating activities | $ | 56.7 | | $ | 18.0 | |
| Sustaining capital expenditure(i) | | (47.1 | ) | | (44.2 | ) |
| Free cash flow before development | | 9.6 | | | (26.2 | ) |
| Growth and exploration capital expenditure(ii) | | (25.1 | ) | | (63.8 | ) |
| Free cash flow | $ | (15.5 | ) | $ | (90.0 | ) |
| (i) | Sustaining capital expenditure includes production stripping. |
| (ii) | Growth capital expenditure is net of proceeds from pre-production sales. |
Contractual Obligations
Since January 31, 2017, there have been no material changes to our long-term contractual obligations other than as outlined below.
| | | | | | Less than | | | Year | | | Year | | | After | |
| (in millions of United States dollars) | | Total | | | 1 year | | | 2–3 | | | 4–5 | | | 5 years | |
| Operating lease obligations | $ | 19,722 | | $ | 4,114 | | $ | 7,766 | | $ | 5,438 | | $ | 2,404 | |
| Other | | 1,209 | | | 1,209 | | | – | | | – | | | – | |
We have entered into non-cancellable operating leases for the rental of fuel tanks and office premises which expire at various dates through 2025. The leases have varying terms, escalation clauses and renewal rights.
Other contractual obligations at January 31, 2017 were primarily associated with purchase commitments relating to supplies to be shipped on the seasonal winter road to the Ekati and Diavik Diamond Mine sites. These commitments were fulfilled as at April 30, 2017.
| Dominion Diamond Corporation | First Quarter Fiscal 2018 Management’s Discussion & Analysis | 35 |
| Overview | Consolidated
Performance Review | Segment
Performance Review | Liquidity & Capital
Resources | Quarterly Financial
Highlights | Non-IFRS Financial
Measures | Other Information &
Advisories |
Quarterly Financial Highlights
Consolidated Financial Results
The following is a summary of our consolidated quarterly results for the eight most recent quarters ended April 30, 2017.
(in millions of United States dollars, except per share amounts and where otherwise noted)
| | | 2018 | | | | | | 2017 | | | | | | | | | 2016 | | | | |
| | | Q1 | | | Q4 | | | Q3 | | | Q2 | | | Q1 | | | Q4 | | | Q3 | | | Q2 | |
| Sales | $ | 211.0 | | $ | 129.9 | | $ | 102.7 | | $ | 160.0 | | $ | 178.3 | | $ | 178.2 | | $ | 145.02 | | $ | 209.7 | |
| Gross margin | $ | 30.8 | | $ | 22.2 | | $ | 22.2 | | $ | 0.9 | | $ | (18.8 | ) | $ | (13.7 | ) | $ | 18.5 | | $ | 22.7 | |
| Gross margin (%) | | 14.6% | | | 17.1% | | | 21.6% | | | 0.5% | | | (10.5% | ) | | (7.7% | ) | | 12.7% | | | 10.8% | |
| Net (loss) income | $ | (7.8 | ) | $ | 5.3 | | $ | 25.2 | | $ | (37.9 | ) | $ | (5.3 | ) | $ | (37.8 | ) | $ | 6.5 | | $ | (18.9 | ) |
| Net (loss) income attributable to: | | | | | | | | | | | | | | | | | | | | | | | | |
| Shareholders | $ | (7.9 | ) | $ | 5.6 | | $ | 28.8 | | $ | (32.9 | ) | $ | (1.0 | ) | $ | (3.0 | ) | $ | 7.2 | | $ | (18.2 | ) |
| Non-controlling interest | $ | 0.1 | | $ | (0.3 | ) | $ | (3.4 | ) | $ | (5.0 | ) | $ | (4.3 | ) | $ | (2.8 | ) | $ | (0.7 | ) | $ | (0.7 | ) |
| Earnings (loss) per share attributable to shareholders | | | | | | | | | | | | | | | | | | | | | | | | |
| Basic | $ | (0.09 | ) | $ | 0.07 | | $ | 0.34 | | $ | (0.39 | ) | $ | (0.01 | ) | $ | (0.41 | ) | $ | 0.08 | | $ | (0.21 | ) |
| Diluted | $ | (0.09 | ) | $ | 0.07 | | $ | 0.34 | | $ | (0.39 | ) | $ | (0.01 | ) | $ | (0.41 | ) | $ | 0.08 | | $ | (0.21 | ) |
| Cash dividends declared per share | $ | 0.20 | | $ | – | | $ | 0.20 | | $ | – | | $ | 0.20 | | $ | – | | $ | 0.20 | | $ | – | |
| Cash from operating activities before changes in non-cash operating working capital(i) | $ | 73.5 | | $ | 53.8 | | $ | 27.6 | | $ | 23.9 | | $ | 11.2 | | $ | 42.3 | | $ | 48.0 | | $ | 43.7 | |
| Adjusted EBITDA(i) | $ | 97.0 | | $ | 62.7 | | $ | 26.6 | | $ | 38.6 | | $ | 54.3 | | $ | 49.1 | | $ | 49.2 | | $ | 60.4 | |
| (i) | The terms “cash from operating activities before changes in non-cash operating working capital” and “Adjusted EBITDA” do not have standardized meanings according to IFRS. See “Non-IFRS Financial Measures” for additional information. |
| Important items of note | |
| | |
| Sales | Sales from quarter to quarter will be influenced by the number of sales held in that quarter as well as market demand. Quarterly results are not a good indicator of annual results due to seasonal variability. Typically two sales occur in the first and third fiscal quarters, with three sales in the second and fourth fiscal quarters. Sales may also be timed to take advantage of strength in a particular segment of the market. |
| | |
Ekati Diamond Mine
process plant fire | A fire at the process plant of the Ekati Diamond Mine in June 2016 resulted in a processing shutdown of approximately three months and negatively influenced results in fiscal 2017. Mine standby costs of approximately $22 million were expensed in each of Q2 fiscal 2017 and Q3 fiscal 2017. Mine standby costs in Q3 fiscal 2017 were net of a 6.7 million expected insurance recovery for property damage relating to the fire. |
| | |
| Production mix | Financial results are strongly influenced by the mix of kimberlite material processed at each of the Ekati and Diavik Diamond Mines. The mix of material processed at the Diavik Diamond Mine remained relatively consistent over the quarters presented. However, a planned shift in the mine plan at the Ekati Diamond Mine resulted in the processing of greater proportions of material from lower-value sources in late fiscal 2016 and in most of fiscal 2017, with a shift to higher-value sources in late fiscal 2017. This has resulted in higher gross margins in more recent quarters. |
| | |
| Foreign exchange | Monetary assets and liabilities that are denominated in currencies other than the US dollar will give rise to foreign exchange gains and losses as the Canadian dollar strengthens or weakens and will therefore increase or decrease Adjusted EBITDA and net income (loss). |
| Dominion Diamond Corporation | First Quarter Fiscal 2018 Management’s Discussion & Analysis | 36 |
| Overview | Consolidated
Performance Review | Segment
Performance Review | Liquidity & Capital
Resources | Quarterly Financial
Highlights | Non-IFRS Financial
Measures | Other Information &
Advisories |
Non-IFRS Financial Measures
In addition to discussing earnings measures in accordance with IFRS, this MD&A provides several non-IFRS financial measures, which we also use to monitor and evaluate our performance. These measures do not have any standardized meanings prescribed by IFRS and differ from measures determined in accordance with IFRS. These performance measures are intended to provide additional information and should not be considered in isolation or as a substitute for measures of performance prepared in accordance with IFRS. These measures are not necessarily indicative of net income or cash flow from operations as determined under IFRS. Other issuers may calculate these non-IFRS financial measures differently. The following table outlines the non-IFRS financial measures, their definitions and why we use these measures.
Non-IFRS financial
measure | |
Definition | | Why we use the measure and why it is useful
to investors |
| | | | | |
| Cash cost of production | | Cash cost of production includes mining cash cost of production, other cash costs relating to sorting and valuation activities, and private royalties. Mining cash cost of production includes site operating costs such as mining, processing and administration, but is exclusive of amortization, capital, and exploration and development costs. Mine standby costs incurred in fiscal 2017 when the Ekati Diamond Mine processing plant was temporarily shut down have been excluded from cash cost of production. |
| | This information is used to assess the efficiency of the mine production with non-cash items separated to more easily assess the impact of production costs on free cash flow and cash flow from operating activities. The majority of mine operating costs, relating primarily to labour and overhead costs, are incurred in Canadian dollars and will therefore increase or decrease in US dollar terms as the Canadian dollar strengthens or weakens. |
| |
| |
| |
| |
| |
| |
| | | | |
| Total cost of production | | Total cost of production includes cash cost of production, as defined above, and non-cash cost of production, representing depreciation and amortization associated with mine site operations. This includes the depreciation of mine site infrastructure as well as the depreciation of deferred stripping assets. | |
| |
| |
| |
| | |
| | | | | |
| Cash cost and total cost per tonne processed | | Cash cost per tonne processed is calculated by dividing mining cash cost of production by total tonnes processed, and total cost per tonne processed is calculated by dividing total cost of production by total tonnes processed. | | We believe these measures will assist analysts, investors and other stakeholders in understanding the costs associated with extracting diamonds. This information is used to assess the efficiency of mine production with non-cash items separated to more easily assess the impact of production costs on free cash flow and cash from operating activities. |
| |
| |
| |
| | | | |
| Cash cost and total cost per carat produced | | Cash cost per carat produced is calculated by dividing total cash cost of production by total carats produced, and total cost per carat produced is calculated by dividing total cost of production by total carats produced. | |
| |
| |
| | |
| | | | | |
| Cash cost of sales and total cost of sales per carat sold | | Cash cost of sales per carat sold is calculated by dividing the cash component of cost of sales, excluding depreciation and amortization, by total carats sold. Total cost of sales per carat sold is calculated by dividing total cost of sales by total carats sold. Total cost of sales includes non-cash cost of sales which is the non-cash expense attributable to our sales. | | We believe these measures will assist analysts, investors and other stakeholders in understanding the costs associated with extracting diamonds. This information is used to assess how well each of the Ekati Diamond Mine and Diavik Diamond Mine is performing compared to the respective mine plan and prior periods. |
| |
| |
| |
| |
| |
| |
| | | | | |
| EBITDA and EBITDA margin | | Defined as net income (loss) before interest expense (income), income taxes, and depreciation and amortization. EBITDA margin is calculated by dividing EBITDA by total sales for the period. | | We believe that EBITDA, EBITDA margin, Adjusted EBITDA and Adjusted EBITDA margin are important indicators commonly reported and widely used by investors and analysts as indicators of our operating performance, ability to invest in capital expenditures and to incur and service debt, and also as a valuation metric. We believe that these adjustments will result in more meaningful valuation measures for investors and analysts to evaluate our performance and assess our ability to generate operating cash flow. |
| |
| |
| | | | |
| Adjusted EBITDA and Adjusted EBITDA margin | | Adjusted EBITDA removes from EBITDA the effects of impairment charges, foreign exchange gains (losses), exploration costs and the gain on the sale of our Toronto office building. Impairment charges and foreign exchange gains (losses) are not reflective of our ability to generate liquidity by producing operating cash flow. Exploration costs and the gain on sale of the Toronto office building do not reflect our underlying operating performance and are not necessarily indicative of future operating results. Adjusted EBITDA margin is calculated by dividing Adjusted EBITDA by total sales for the period. | |
| |
| |
| |
| |
| |
| |
| |
| | |
| | | | | |
| | | | | |
| Cash from operating activities before changes in non-cash operating working capital | | Defined as net cash from operating activities before changes in non- cash operating working capital. Due to the remote nature of our mines, working capital balances will typically increase in certain times of the year as supplies are purchased and delivered, resulting in more significant cash outflows in certain periods. | | We believe that cash from operating activities before changes in non-cash operating working capital is a useful indicator of our operating performance and our ability to generate operating cash flow. |
| Dominion Diamond Corporation | First Quarter Fiscal 2018 Management’s Discussion & Analysis | 377 |
| Overview | Consolidated
Performance Review | Segment
Performance Review | Liquidity & Capital
Resources | Quarterly Financial
Highlights | Non-IFRS Financial
Measures | Other Information &
Advisories |
| Non-IFRS financial | | | | Why we use the measure and why it is useful |
| measure | | Definition | | to investors |
| | | | | |
| Working capital and working capital ratio | | Working capital is calculated as total current assets less total current liabilities. Working capital ratio is calculated as total current assets divided by total current liabilities. | | We believe that working capital is a useful supplemental measure as it provides an indication of our ability to settle debts as they come due. |
| | | | | |
| Sustaining capital expenditure | | Sustaining capital expenditure is generally defined as expenditures that support the ongoing operation of the assets or business without any associated increase in capacity, life of assets or future earnings. Sustaining capital expenditure also includes excess waste stripping in open pits that have achieved commercial production. These stripping costs are capitalized as deferred stripping assets and amortized on a unit-of-production basis as the associated material is processed. | | This measure is used by management and investors to assess the extent of non-discretionary capital spending incurred each period. |
| | | | | |
| Growth and exploration capital expenditure | | Growth (development) capital expenditure is generally defined as capital expenditures that expand existing capacity, increase life of assets and/or increase future earnings. Exploration and evaluation capital expenditure is defined as capital expenditures that relate to activities involved in evaluating the technical feasibility and commercial viability of extracting mineral resources. These activities are only capitalized when the activity relates to proven and probable reserves. | | This measure is used by management and investors to assess the extent of discretionary capital spending being undertaken each period. |
Cash Cost of Production and Total Cost of Production
The following tables provide a reconciliation, on a consolidated and segmented basis, of cash cost of production and total cost of production to cost of sales for the three months ended April 30, 2017 and April 30, 2016.
Consolidated
| | | Three months ended | | | Three months ended | |
| (in millions of United States dollars) | | April 30, 2017 | | | April 30, 2016 | |
| Mining cash cost of production | $ | 94.8 | | $ | 96.6 | |
| Private royalties | | 2.8 | | | 1.5 | |
| Other cash costs | | 2.0 | | | 1.5 | |
| Total cash cost of production | | 99.6 | | | 99.6 | |
| Non-cash cost of production | | 66.6 | | | 54.9 | |
| Total cost of production | | 166.2 | | | 154.5 | |
| Impairment losses on inventory | | – | | | 19.6 | |
| Adjusted for stock movements | | 14.0 | | | 23.0 | |
| Cost of sales | $ | 180.2 | | $ | 197.1 | |
| Ekati Diamond Mine Segment | | | | | | |
| | | | | | | |
| | | Three months ended | | | Three months ended | |
| (in millions of United States dollars) | | April 30, 2017 | | | April 30, 2016 | |
| Ekati mine cash cost of production(i) | $ | 66.5 | | $ | 65.3 | |
| Other cash costs | | 1.3 | | | 1.1 | |
| Total Ekati cash cost of production | | 67.8 | | | 66.4 | |
| Non-cash cost of production(i) | | 48.6 | | | 34.3 | |
| Total Ekati cost of production | | 116.4 | | | 100.7 | |
| Impairment losses on inventory | | – | | | 19.6 | |
| Adjusted for stock movements(i) | | 11.5 | | | 16.7 | |
| Ekati segment cost of sales | $ | 127.9 | | $ | 137.0 | |
| (i) | Q1 fiscal 2017 has been recast for consistency with subsequent periods. See the definition of cash cost of production on page 37. |
| Dominion Diamond Corporation | First Quarter Fiscal 2018 Management’s Discussion & Analysis | 38 |
| Overview | Consolidated
Performance Review | Segment
Performance Review | Liquidity & Capital
Resources | Quarterly Financial
Highlights | Non-IFRS Financial
Measures | Other Information &
Advisories |
| Diavik Diamond Mine Segment | | | | | | |
| | | | | | | |
| | | Three months ended | | | Three months ended | |
| (in millions of United States dollars) | | April 30, 2017 | | | April 30, 2016 | |
| Diavik mine cash cost of production | $ | 28.3 | | $ | 31.3 | |
| Private royalty | | 2.8 | | | 1.5 | |
| Other cash costs | | 0.7 | | | 0.4 | |
| Total Diavik cash cost of production | | 31.8 | | | 33.2 | |
| Non-cash cost of production | | 18.0 | | | 20.6 | |
| Total Diavik cost of production | | 49.8 | | | 53.8 | |
| Adjusted for stock movements | | 2.5 | | | 6.3 | |
| Diavik segment cost of sales | $ | 52.3 | | $ | 60.1 | |
Cash Cost per Tonne Processed and Cash Cost per Carat Produced
The following tables demonstrate, on a consolidated and segmented basis, our calculation of cash cost per tonne processed, total cost per tonne processed, cash cost per carat produced and total cost per carat produced for the three months ended April 30, 2017 and April 30, 2016. Mining cash cost of production and total cost of production are reconciled to cost of sales above.
Consolidated
| | | Three months ended | | | Three months ended | |
| (in millions of United States dollars, except where otherwise noted) | | April 30, 2017 | | | April 30, 2016 | |
| Mining cash cost of production | $ | 94.8 | | $ | 96.6 | |
| Total tonnes processed (000s) | | 1,118 | | | 1,195 | |
| Mining cash cost per tonne processed ($/tonne) | $ | 84.8 | | $ | 80.8 | |
| | | Three months ended | | | Three months ended | |
| (in millions of United States dollars, except where otherwise noted) | | April 30, 2017 | | | April 30, 2016 | |
| Total cost of production | $ | 166.2 | | $ | 154.5 | |
| Total tonnes processed (000s) | | 1,118 | | | 1,195 | |
| Total cost per tonne processed ($/tonne) | $ | 148.7 | | $ | 129.3 | |
| | | Three months ended | | | Three months ended | |
| (in millions of United States dollars, except where otherwise noted) | | April 30, 2017 | | | April 30, 2016 | |
| Total cash cost of production | $ | 99.6 | | $ | 99.6 | |
| Total carats produced (000s) | | 2,146 | | | 1,830 | |
| Cash cost per carat produced ($/carat) | $ | 46.4 | | $ | 54.4 | |
| | | Three months ended | | | Three months ended | |
| (in millions of United States dollars, except where otherwise noted) | | April 30, 2017 | | | April 30, 2016 | |
| Total cost of production | $ | 166.2 | | $ | 154.5 | |
| Total carats produced (000s) | | 2,146 | | | 1,830 | |
| Total cost per carat produced ($/carat) | $ | 77.4 | | $ | 84.4 | |
| Dominion Diamond Corporation | First Quarter Fiscal 2018 Management’s Discussion & Analysis | 39 |
| Overview | Consolidated
Performance Review | Segment
Performance Review | Liquidity & Capital
Resources | Quarterly Financial
Highlights | Non-IFRS Financial
Measures | Other Information &
Advisories |
| Ekati Diamond Mine Segment | | | | | | |
| | | | | | | |
| | | Three months ended | | | Three months ended | |
| (in millions of United States dollars, except where otherwise noted) | | April 30, 2017 | | | April 30, 2016 | |
| Ekati mine cash cost of production(i) | $ | 66.5 | | $ | 65.3 | |
| Total tonnes processed (000s) | | 906 | | | 972 | |
| Ekati mine cash cost per tonne processed(i)($/tonne) | $ | 73.4 | | $ | 67.2 | |
| (i) | Q1 fiscal 2017 has been recast for consistency with subsequent periods. See the definition of cash cost of production on page 37. |
| | | Three months ended | | | Three months ended | |
| (in millions of United States dollars, except where otherwise noted) | | April 30, 2017 | | | April 30, 2016 | |
| Total Ekati cost of production | $ | 116.4 | | $ | 100.7 | |
| Total tonnes processed (000s) | | 906 | | | 972 | |
| Ekati total cost per tonne processed ($/tonne) | $ | 128.5 | | $ | 103.6 | |
| | | Three months ended | | | Three months ended | |
| (in millions of United States dollars, except where otherwise noted) | | April 30, 2017 | | | April 30, 2016 | |
| Total Ekati cash cost of production(i) | $ | 67.8 | | $ | 66.4 | |
| Total carats produced (000s) | | 1,388 | | | 1,076 | |
| Ekati cash cost per carat produced(i)($/carat) | $ | 48.8 | | $ | 61.7 | |
| (i) | Q1 fiscal 2017 has been recast for consistency with subsequent periods. See the definition of cash cost of production on page 37. |
| | | Three months ended | | | Three months ended | |
| (in millions of United States dollars, except where otherwise noted) | | April 30, 2017 | | | April 30, 2016 | |
| Total Ekati cost of production | $ | 116.4 | | $ | 100.7 | |
| Total carats produced (000s) | | 1,388 | | | 1,076 | |
| Ekati total cost per carat produced ($/carat) | $ | 83.9 | | $ | 93.6 | |
| Diavik Diamond Mine Segment | | | | | | |
| | | | | | | |
| | | Three months ended | | | Three months ended | |
| (in millions of United States dollars, except where otherwise noted) | | April 30, 2017 | | | April 30, 2016 | |
| Diavik mine cash cost of production | $ | 28.3 | | $ | 31.3 | |
| Total tonnes processed (000s) | | 212 | | | 223 | |
| Diavik mine cash cost per tonne processed ($/tonne) | $ | 133.5 | | $ | 140.4 | |
| | | Three months ended | | | Three months ended | |
| (in millions of United States dollars, except where otherwise noted) | | April 30, 2017 | | | April 30, 2016 | |
| Total Diavik cost of production | $ | 49.8 | | $ | 53.8 | |
| Total tonnes processed (000s) | | 212 | | | 223 | |
| Diavik total cost per tonne processed ($/tonne) | $ | 234.9 | | $ | 241.3 | |
| Dominion Diamond Corporation | First Quarter Fiscal 2018 Management’s Discussion & Analysis | 40 |
| Overview | Consolidated
Performance Review | Segment
Performance Review | Liquidity & Capital
Resources | Quarterly Financial
Highlights | Non-IFRS Financial
Measures | Other Information &
Advisories |
| | | Three months ended | | | Three months ended | |
| (in millions of United States dollars, except where otherwise noted) | | April 30, 2017 | | | April 30, 2016 | |
| Total Diavik cash cost of production | $ | 31.8 | | $ | 33.2 | |
| Total carats produced (000s) | | 758 | | | 754 | |
| Diavik cash cost per carat produced ($/carat) | $ | 42.0 | | $ | 44.0 | |
| | | Three months ended | | | Three months ended | |
| (in millions of United States dollars, except where otherwise noted) | | April 30, 2017 | | | April 30, 2016 | |
| Total Diavik cost of production | $ | 49.8 | | $ | 53.8 | |
| Total carats produced (000s) | | 758 | | | 754 | |
| Diavik total cost per carat produced ($/carat) | $ | 65.7 | | $ | 71.4 | |
Cash Cost of Sales per Carat Sold and Total Cost of Sales per Carat Sold
The following tables provide a reconciliation, on a consolidated and segmented basis, of cash cost of sales per carat sold to cost of sales for the three months ended April 30, 2017 and April 30, 2016.
| Consolidated | | | | | | |
| | | | | | | |
| | | Three months ended | | | Three months ended | |
| (in millions of United States dollars, except where otherwise noted) | | April 30, 2017 | | | April 30, 2016 | |
| Cost of sales | $ | 180.2 | | $ | 197.1 | |
| Non-cash cost of sales | | (75.5 | ) | | (67.8 | ) |
| Cash cost of sales | | 104.7 | | | 129.3 | |
| Total carats sold (000s) | | 2,333 | | | 2,600 | |
| Cash cost of sales per carat sold ($/carat) | $ | 44.9 | | $ | 49.7 | |
| | | Three months ended | | | Three months ended | |
| (in millions of United States dollars, except where otherwise noted) | | April 30, 2017 | | | April 30, 2016 | |
| Total cost of sales | $ | 180.2 | | $ | 197.1 | |
| Total carats sold (000s) | | 2,333 | | | 2,600 | |
| Total cost of sales per carat sold ($/carat) | $ | 77.2 | | $ | 75.8 | |
| Ekati Diamond Mine Segment | | | | | | |
| | | | | | | |
| | | Three months ended | | | Three months ended | |
| (in millions of United States dollars, except where otherwise noted) | | April 30, 2017 | | | April 30, 2016 | |
| Ekati segment cost of sales | $ | 127.9 | | $ | 137.0 | |
| Non-cash cost of sales | | (56.0 | ) | | (45.5 | ) |
| Ekati segment cash cost of sales | | 71.9 | | | 91.5 | |
| Total carats sold (000s) | | 1,834 | | | 1,545 | |
| Ekati segment cash cost of sales per carat sold ($/carat) | $ | 39.2 | | $ | 59.2 | |
| Dominion Diamond Corporation | First Quarter Fiscal 2018 Management’s Discussion & Analysis | 41 |
| Overview | Consolidated
Performance Review | Segment
Performance Review | Liquidity & Capital
Resources | Quarterly Financial
Highlights | Non-IFRS Financial
Measures | Other Information &
Advisories |
| | | Three months ended | | | Three months ended | |
| (in millions of United States dollars, except where otherwise noted) | | April 30, 2017 | | | April 30, 2016 | |
| Ekati segment total cost of sales | $ | 127.9 | | $ | 137.0 | |
| Total carats sold (000s) | | 1,834 | | | 1,545 | |
| Ekati segment total cost of sales per carat sold ($/carat) | $ | 69.7 | | $ | 88.7 | |
| Diavik Diamond Mine Segment | | | | | | |
| | | | | | | |
| | | Three months ended | | | Three months ended | |
| (in millions of United States dollars, except where otherwise noted) | | April 30, 2017 | | | April 30, 2016 | |
| Diavik segment cost of sales | $ | 52.3 | | $ | 60.1 | |
| Non-cash cost of sales | | (19.5 | ) | | (22.3 | ) |
| Diavik segment cash cost of sales | | 32.8 | | | 37.8 | |
| Total carats sold (000s) | | 499 | | | 1,055 | |
| Diavik segment cash cost of sales per carat sold ($/carat) | $ | 65.7 | | $ | 35.8 | |
| | | Three months ended | | | Three months ended | |
| (in millions of United States dollars, except where otherwise noted) | | April 30, 2017 | | | April 30, 2016 | |
| Diavik segment total cost of sales | $ | 52.3 | | $ | 60.1 | |
| Total carats sold (000s) | | 499 | | | 1,055 | |
| Diavik segment total cost of sales per carat sold ($/carat) | $ | 104.8 | | $ | 57.0 | |
| Dominion Diamond Corporation | First Quarter Fiscal 2018 Management’s Discussion & Analysis | 42 |
| Overview | Consolidated
Performance Review | Segment
Performance Review | Liquidity & Capital
Resources | Quarterly Financial
Highlights | Non-IFRS Financial
Measures | Other Information &
Advisories |
EBITDA, EBITDA Margin, Adjusted EBITDA and Adjusted EBITDA Margin
The following tables provide a reconciliation of consolidated and segmented EBITDA and Adjusted EBITDA for the last eight quarters.
Consolidated
| (in millions of US dollars) | | 2018 | | | | | | 2017 | | | | | | | | | 2016 | | | | |
| | | Q1 | | | Q4 | | | Q3 | | | Q2 | | | Q1 | | | Q4 | | | Q3 | | | Q2 | |
| Net income (loss) | $ | (7.8 | ) | $ | 5.4 | | $ | 25.3 | | $ | (37.9 | ) | $ | (5.3 | ) | $ | (37.7 | ) | $ | 6.5 | | $ | (19.0 | ) |
| Finance expense | $ | 3.6 | | $ | 5.8 | | $ | 4.9 | | $ | 1.7 | | $ | 2.2 | | $ | 2.2 | | $ | 2.0 | | $ | 2.9 | |
| Income tax expense (recovery) | $ | 19.1 | | $ | (5.4 | ) | $ | 7.9 | | $ | – | | $ | (30.7 | ) | $ | 9.9 | | $ | 0.8 | | $ | 19.5 | |
| Depreciation and amortization | $ | 75.8 | | $ | 50.6 | | $ | 35.7 | | $ | 62.6 | | $ | 61.5 | | $ | 53.6 | | $ | 39.6 | | $ | 52.8 | |
| EBITDA | $ | 90.7 | | $ | 56.4 | | $ | 73.8 | | $ | 26.4 | | $ | 27.7 | | $ | 28.0 | | $ | 48.9 | | $ | 56.2 | |
| Foreign exchange loss (gain) | $ | 5.6 | | $ | 5.2 | | $ | (3.3 | ) | $ | 4.4 | | $ | 3.4 | | $ | 2.0 | | $ | (0.2 | ) | $ | 2.2 | |
| Exploration costs | $ | 0.7 | | $ | 1.1 | | $ | 0.9 | | $ | 1.4 | | $ | 3.6 | | $ | (0.7 | ) | $ | 0.5 | | $ | 2.0 | |
| Impairment losses on inventory | $ | – | | $ | – | | $ | – | | $ | 6.4 | | $ | 19.6 | | $ | 19.8 | | $ | – | | $ | | |
| Gain on sale of building | $ | – | | $ | – | | $ | (44.8 | ) | $ | – | | $ | – | | $ | – | | $ | – | | $ | – | |
| Adjusted EBITDA | $ | 97.0 | | $ | 62.7 | | $ | 26.6 | | $ | 38.6 | | $ | 54.3 | | $ | 49.1 | | $ | 49.2 | | $ | 60.4 | |
| Adjusted EBITDA margin | | 46% | | | 48% | | | 26% | | | 24% | | | 30% | | | 28% | | | 34% | | | 29% | |
Ekati Diamond Mine Segment
| (in millions of US dollars) | | 2018 | | | | | | 2017 | | | | | | | | | 2016 | | | | |
| | | Q1 | | | Q4 | | | Q3 | | | Q2 | | | Q1 | | | Q4 | | | Q3 | | | Q2 | |
| Segment net income (loss) | $ | 5.5 | | $ | (7.5 | ) | $ | (10.3 | ) | $ | (31.5 | ) | $ | (29.8 | ) | $ | (22.5 | ) | $ | (4.6 | ) | $ | (5.7 | ) |
| Finance expense | $ | 2.3 | | $ | 2.6 | | $ | 3.7 | | $ | 1.1 | | $ | 1.1 | | $ | 2.1 | | $ | 0.9 | | $ | 1.8 | |
| Income tax expense (recovery) | $ | 10.1 | | $ | (7.3 | ) | $ | (5.3 | ) | $ | (8.7 | ) | $ | (25.0 | ) | $ | (1.6 | ) | $ | 1.1 | | $ | 7.7 | |
| Depreciation and amortization | $ | 56.0 | | $ | 30.2 | | $ | 22.8 | | $ | 43.5 | | $ | 38.9 | | $ | 34.7 | | $ | 25.0 | | $ | 34.4 | |
| EBITDA | $ | 73.9 | | $ | 18.0 | | $ | 10.9 | | $ | 4.4 | | $ | (14.8 | ) | $ | 12.7 | | $ | 22.4 | | $ | 38.2 | |
| Foreign exchange loss (gain) | $ | (9.9 | ) | $ | 9.7 | | $ | (5.5 | ) | $ | (8.1 | ) | $ | 17.5 | | $ | (2.8 | ) | $ | (0.4 | ) | $ | (3.4 | ) |
| Exploration costs | $ | 0.3 | | $ | 1.2 | | $ | 0.6 | | $ | 1.4 | | $ | 3.6 | | $ | (0.8 | ) | $ | 0.6 | | $ | 1.9 | |
| Impairment losses on inventory | $ | – | | $ | – | | $ | – | | $ | 6.4 | | $ | 19.6 | | $ | 19.8 | | $ | – | | | – | |
| Adjusted EBITDA | $ | 64.3 | | $ | 28.8 | | $ | 6.0 | | $ | 4.1 | | $ | 25.9 | | $ | 29.0 | | $ | 22.5 | | $ | 36.9 | |
| Adjusted EBITDA margin | | 47% | | | 55% | | | 11% | | | 5% | | | 25% | | | 26% | | | 26% | | | 27% | |
| Dominion Diamond Corporation | First Quarter Fiscal 2018 Management’s Discussion & Analysis | 43 |
| Overview | Consolidated
Performance Review | Segment
Performance Review | Liquidity & Capital
Resources | Quarterly Financial
Highlights | Non-IFRS Financial
Measures | Other Information &
Advisories |
| Diavik Diamond Mine Segment | | | | | | | | | | | | | | | | | | | | | | | | |
| | | | | | | | | | | | | | | | | | | | | | | | | |
| (in millions of US dollars) | | 2018 | | | | | | 2017 | | | | | | | | | 2016 | | | | |
| | | Q1 | | | Q4 | | | Q3 | | | Q2 | | | Q1 | | | Q4 | | | Q3 | | | Q2 | |
| Segment net income (loss) | $ | (7.5 | ) | $ | 20.2 | | $ | 2.9 | | $ | (1.0 | ) | $ | 29.2 | | $ | (8.7 | ) | $ | 16.0 | | $ | (4.1 | ) |
| Finance expense | $ | 1.3 | | $ | 3.2 | | $ | 1.2 | | $ | 0.6 | | $ | 1.1 | | $ | 0.1 | | $ | 1.1 | | $ | 1.1 | |
| Income tax expense (recovery) | $ | 11.1 | | $ | 4.7 | | $ | 8.7 | | $ | 10.7 | | $ | (4.0 | ) | $ | 13.9 | | $ | 1.4 | | $ | 15.1 | |
| Depreciation and amortization | $ | 19.5 | | $ | 19.3 | | $ | 11.6 | | $ | 19.2 | | $ | 22.4 | | $ | 18.6 | | $ | 14.2 | | $ | 18.1 | |
| EBITDA | $ | 24.4 | | $ | 47.4 | | $ | 24.4 | | $ | 29.5 | | $ | 48.7 | | $ | 23.9 | | $ | 32.7 | | $ | 30.2 | |
| Foreign exchange loss (gain) | $ | 15.5 | | $ | (4.5 | ) | $ | 2.2 | | $ | 12.5 | | $ | (14.2 | ) | $ | 4.8 | | $ | 0.2 | | $ | 5.5 | |
| Exploration costs | $ | 0.4 | | $ | (0.1 | ) | $ | 0.3 | | $ | – | | $ | – | | $ | – | | $ | – | | $ | – | |
| Adjusted EBITDA | $ | 40.3 | | $ | 42.8 | | $ | 26.9 | | $ | 42.0 | | $ | 34.5 | | $ | 28.7 | | $ | 32.9 | | $ | 35.7 | |
| Adjusted EBITDA margin | | 55% | | | 55% | | | 56% | | | 55% | | | 47% | | | 43% | | | 58% | | | 50% | |
| Corporate Segment | | | | | | | | | | | | | | | | | | | | | | | | |
| | | | | | | | | | | | | | | | | | | | | | | | | |
| (in millions of US dollars) | | 2018 | | | | | | 2017 | | | | | | | | | 2016 | | | | |
| | | Q1 | | | Q4 | | | Q3 | | | Q2 | | | Q1 | | | Q4 | | | Q3 | | | Q2 | |
| Segment net income (loss) | $ | (5.8 | ) | $ | (7.3 | ) | $ | 32.7 | | $ | (5.4 | ) | $ | (4.7 | ) | $ | (6.5 | ) | $ | (4.9 | ) | $ | (9.2 | ) |
| Income tax expense (recovery) | $ | (2.1 | ) | $ | (2.7 | ) | $ | 4.5 | | $ | (2.0 | ) | $ | (1.7 | ) | $ | (2.4 | ) | $ | (1.7 | ) | $ | (3.3 | ) |
| Depreciation and amortization | $ | 0.3 | | $ | 1.1 | | $ | 1.3 | | $ | (0.1 | ) | $ | 0.2 | | $ | 0.3 | | $ | 0.3 | | $ | 0.2 | |
| EBITDA | $ | (7.6 | ) | $ | (8.9 | ) | $ | 38.5 | | $ | (7.5 | ) | $ | (6.2 | ) | $ | (8.6 | ) | $ | (6.3 | ) | $ | (12.3 | ) |
| Gain on sale of building | $ | – | | $ | – | | $ | (44.8 | ) | $ | – | | $ | – | | $ | – | | $ | – | | $ | – | |
| Adjusted EBITDA | $ | (7.6 | ) | $ | (8.9 | ) | $ | (6.3 | ) | $ | (7.5 | ) | $ | (6.2 | ) | $ | (8.6 | ) | $ | (6.3 | ) | $ | (12.3 | ) |
Free Cash Flow
Our calculation of free cash flow on a consolidated basis is provided in the table below.
| Consolidated | | | | | | | | | | | | | | | | | | | | | | | | |
| | | | | | | | | | | | | | | | | | | | | | | | | |
| (in millions of US dollars) | | 2018 | | | | | | 2017 | | | | | | | | | 2016 | | | | |
| | | Q1 | | | Q4 | | | Q3 | | | Q2 | | | Q1 | | | Q4 | | | Q3 | | | Q2 | |
| Net cash from operating activities | $ | 56.7 | | $ | 47.6 | | $ | 17.4 | | $ | 33.9 | | $ | 18.0 | | $ | 83.6 | | $ | 60.8 | | $ | 52.8 | |
| Sustaining capital expenditure(i) | $ | (47.1 | ) | $ | (50.4 | ) | $ | (30.6 | ) | $ | (25.2 | ) | $ | (44.2 | ) | $ | (8.0 | ) | $ | (15.0 | ) | $ | (7.0 | ) |
| Free cash flow before development | $ | 9.6 | | $ | (2.8 | ) | $ | (13.2 | ) | $ | 8.7 | | $ | (26.2 | ) | $ | 75.6 | | $ | 45.8 | | $ | 45.8 | |
| Growth and exploration capital expenditure(ii) | $ | (25.1 | ) | $ | (16.8 | ) | $ | (22.2 | ) | $ | (29.6 | ) | $ | (63.8 | ) | $ | (48.1 | ) | $ | (37.3 | ) | $ | (22.9 | ) |
| Free cash flow | $ | (15.5 | ) | $ | (19.6 | ) | $ | (35.4 | ) | $ | (20.9 | ) | $ | (90.0 | ) | $ | 27.5 | | $ | 8.5 | | $ | 22.9 | |
| (i) | Sustaining capital expenditure includes production stripping and is presented on a cash basis. |
| (ii) | Growth capital expenditure is net of proceeds from pre-production sales and is presented on a cash basis. |
| Dominion Diamond Corporation | First Quarter Fiscal 2018 Management’s Discussion & Analysis | 44 |
| Overview | Consolidated
Performance Review | Segment
Performance Review | Liquidity & Capital
Resources | Quarterly Financial
Highlights | Non-IFRS Financial
Measures | Other Information &
Advisories |
Cash from Operating Activities before Changes in Non-Cash Operating Working Capital
Our calculation of cash from operating activities before changes in non-cash operating working capital and taxes paid on a consolidated basis is provided in the table below.
Consolidated
| (in millions of US dollars) | | 2018 | | | | | | 2017 | | | | | | | | | 2016 | | | | |
| | | | | | | | | | | | | | | | | | | | | | | | | |
| | | Q1 | | | Q4 | | | Q3 | | | Q2 | | | Q1 | | | Q4 | | | Q3 | | | Q2 | |
| | | | | | | | | | | | | | | | | | | | | | | | | |
| Net cash from operating activities | $ | 56.7 | | $ | 47.5 | | $ | 17.4 | | $ | 33.9 | | $ | 18.0 | | $ | 87.0 | | $ | 60.4 | | $ | 68.3 | |
| | | | | | | | | | | | | | | | | | | | | | | | | |
| Changes in non-cash operating working capital | $ | 16.8 | | $ | 6.3 | | $ | 10.2 | | $ | (10.0 | ) | $ | (6.8 | ) | $ | (41.3 | ) | $ | (12.8 | ) | $ | (9.1 | ) |
| | | | | | | | | | | | | | | | | | | | | | | | | |
| Cash from operating activities before changes in non-cash operating working capital | $ | 73.5 | | $ | 53.8 | | $ | 27.6 | | $ | 23.9 | | $ | 11.2 | | $ | 45.7 | | $ | 47.6 | | $ | 59.2 | |
Working Capital and Working Capital Ratio
Our calculation of working capital on a consolidated basis is provided in the table below.
| Consolidated | | | | | | | | | | | | | | | | | | | | | | | | |
| | | | | | | | | | | | | | | | | | | | | | | | | |
| (in millions of US dollars) | | 2018 | | | | | | 2017 | | | | | | | | | 2016 | | | | |
| | | Q1 | | | Q4 | | | Q3 | | | Q2 | | | Q1 | | | Q4 | | | Q3 | | | Q2 | |
| Current assets | $ | 643.0 | | $ | 609.8 | | $ | 617.4 | | $ | 588.1 | | $ | 698.4 | | $ | 769.2 | | $ | 816.5 | | $ | 825.8 | |
| Less: Current liabilities | $ | (242.1 | ) | $ | (175.3 | ) | $ | (179.2 | ) | $ | (159.2 | ) | $ | (218.4 | ) | $ | (190.7 | ) | $ | (179.9 | ) | $ | (135.6 | ) |
| Working capital | $ | 400.9 | | $ | 434.5 | | $ | 438.2 | | $ | 428.8 | | $ | 480.0 | | $ | 578.5 | | $ | 636.5 | | $ | 690.1 | |
| Working capital ratio | | 2.66 | | | 3.48 | | | 3.45 | | | 3.69 | | | 3.20 | | | 4.03 | | | 4.54 | | | 6.09 | |
| Dominion Diamond Corporation | First Quarter Fiscal 2018 Management’s Discussion & Analysis | 45 |
| Overview | Consolidated
Performance Review | Segment
Performance Review | Liquidity & Capital
Resources | Quarterly Financial
Highlights | Non-IFRS Financial
Measures | Other Information &
Advisories |
Other Information and Advisories
Changes in Internal Controls over Financial Reporting
During the first quarter of fiscal 2018, there were no changes in our disclosure controls and procedures or internal controls over financial reporting that materially affected, or are reasonably likely to materially affect, our disclosure controls and procedures or internal control over financial reporting.
Significant Judgments and Accounting Estimates
The preparation of the consolidated financial statements in conformity with IFRS requires us to make judgments, estimates and assumptions that affect the application of accounting policies and reported amounts of assets, liabilities and contingent liabilities at the date of the consolidated financial statements, as well as the reported amounts of sales and expenses during the period. Estimates and assumptions are continually evaluated and are based on management’s experience and other factors, including expectations of future events that are believed to be reasonable under the circumstances. However, actual outcomes can differ from these estimates. Revisions to accounting estimates are recognized in the period in which the estimates are revised and in any future periods affected.
For further information on our significant judgments and accounting estimates, refer to note 3 of our audited consolidated financial statements for the year ended January 31, 2017. There have been no subsequent material changes to these significant judgments and accounting estimates.
Changes in Accounting Policies
The accounting policies applied in our consolidated financial statements for the three months ended April 30, 2017 are the same as those applied in our audited consolidated financial statements for the year ended January 31, 2017. Refer to note 3 to the condensed consolidated interim financial statements for the three months ended April 30, 2017 for information on issued accounting pronouncements that will be effective in future periods.
Risks and Uncertainties
We are subject to a number of risks and uncertainties as a result of our operations. For a comprehensive discussion of these and other risks facing the Company, refer to the section “Risks and Uncertainties” in our most recent Annual Information Form and the section titled “Risks and Uncertainties” in our Management’s Discussion and Analysis for the year ended January 31, 2017, both filed on SEDAR atwww.sedar.com. There were no significant changes to those risks or to our management of exposure to those risks during the three months ended April 30, 2017.
| Dominion Diamond Corporation | First Quarter Fiscal 2018 Management’s Discussion & Analysis | 46 |