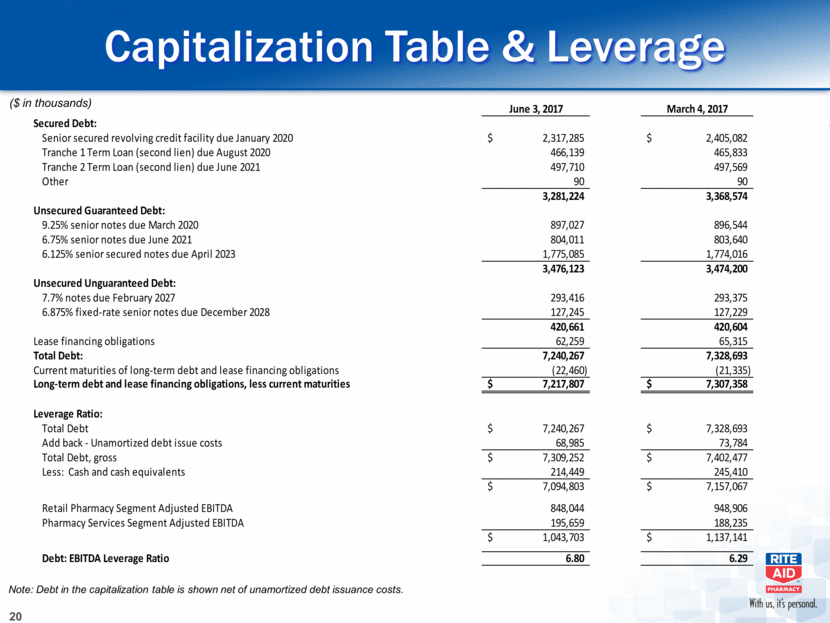
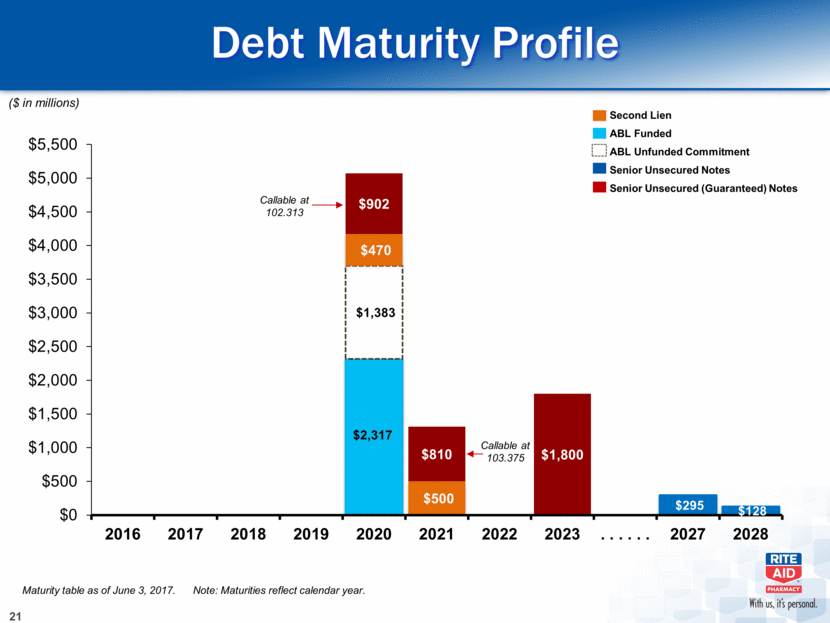
Capitalization Table & Leverage 20 ($ in thousands) Note: Debt in the capitalization table is shown net of unamortized debt issuance costs. Capitalization Table & Leverage ($ in thousands) June 3, 2017 March 4, 2017 Secured Debt: Senior secured revolving credit facility due January 2020 $ 2,317,285 $ 2,405,082 Tranche 1 Term Loan (second lien) due August 2020 466,139 465,833 Tranche 2 Term Loan (second lien) due June 2021 497,710 497,569 Other 90 90 3,281,224 3,368,574 Unsecured Guaranteed Debt: 9.25% senior notes due March 2020 897,027 896,544 6.75% senior notes due June 2021 804,011 803,640 6.125% senior secured notes due April 2023 1,775,085 1,774,016 3,476,123 3,474,200 Unsecured Unguaranteed Debt: 7.7% notes due February 2027 293,416 293,375 6.875% fixed-rate senior notes due December 2028 127,245 127,229 420,661 420,604 Lease financing obligations 62,259 65,315 Total Debt: 7,240,267 7,328,693 Current maturities of long-term debt and lease financing obligations (22,460) (21,335) Long-term debt and lease financing obligations, less current maturities $ 7,217,807 $ 7,307,358 Leverage Ratio: Total Debt $ 7,240,267 $ 7,328,693 Add back - Unamortized debt issue costs 68,985 73,784 Total Debt, gross $ 7,309,252 $ 7,402,477 Less: Cash and cash equivalents 214,449 245,410 $ 7,094,803 $ 7,157,067 Retail Pharmacy Segment Adjusted EBITDA 848,044 948,906 Pharmacy Services Segment Adjusted EBITDA 195,659 188,235 $ 1,043,703 $ 1,137,141 Debt: EBITDA Leverage Ratio 6.80 6.29 Note: Debt in the capitalization table is shown net of unamortized debt issuance cost
