Cautionary Statement Regarding Forward Looking Statements Statements in this presentation that are not historical, are forward-looking statements made pursuant to the safe harbor provisions of the Private Securities Litigation Reform Act of 1995. Such statements include, but are not limited to, statements regarding Rite Aid’s outlook for fiscal 2019; the expected timing and the ability to complete the subsequent closings of the sale of the remaining Rite Aid distribution centers and related assets to Walgreens Boots Alliance, Inc. ("WBA"); Rite Aid’s competitive position and ability to implement new strategies following completion of such transaction with WBA and following the termination of the proposed merger with Albertsons Companies, Inc. (“ACI”); and any assumptions underlying any of the foregoing. Words such as “anticipate,” “believe,” “continue,” “could,” “estimate,” “expect,” “intend,” “may,” “plan,” “predict,” “project,” “should,” and “will” and variations of such words and similar expressions are intended to identify such forward-looking statements. These forward-looking statements are not guarantees of future performance and involve risks, assumptions and uncertainties, including, but not limited to, our high level of indebtedness and our ability to make interest and principal payments on our debt and satisfy the other covenants contained in our debt agreements; general economic, industry, market, competitive, regulatory and political conditions; our ability to improve the operating performance of our stores in accordance with our long term strategy; the impact of private and public third-party payers continued reduction in prescription drug reimbursements and efforts to encourage mail order; our ability to manage expenses and our investments in working capital; outcomes of legal and regulatory matters; changes in legislation or regulations, including healthcare reform; our ability to achieve the benefits of our efforts to reduce the costs of our generic and other drugs; risks related to the pending sale of the remaining Rite Aid distribution centers and related assets to WBA, including the possibility that the transactions may not close, or the business of Rite Aid may suffer as a result of uncertainty surrounding the pending transactions; risks resulting from the termination of the proposed merger with ACI, including the risk that the termination could have an adverse effect on Rite Aid’s ability to retain customers and retain and hire key personnel and maintain relationships with suppliers and customers and on our operating results and businesses generally; the risk of litigation related to the termination of the merger agreement with ACI or the proposed merger; and potential changes to our strategy following the termination of the proposed merger with ACI, which may include delaying or reducing capital or other expenditures, selling assets or other operations, attempting to restructure or refinance our debt, or seeking additional capital, and other business effects. These and other risks, assumptions and uncertainties are more fully described in Item 1A (Risk Factors) of our most recent Annual Report on Form 10-K and in other documents that we file or furnish with the Securities and Exchange Commission (the “SEC”), which you are encouraged to read. Should one or more of these risks or uncertainties materialize, or should underlying assumptions prove incorrect, actual results may vary materially from those indicated or anticipated by such forward-looking statements. Accordingly, you are cautioned not to place undue reliance on these forward- looking statements, which speak only as of the date they are made. Rite Aid expressly disclaims any current intention to update publicly any forward-looking statement after the distribution of this presentation, whether as a result of new information, future events, changes in assumptions or otherwise. SAFE HARBOR STATEMENT 2
Cautionary Note Regarding Pro Forma Information The following presentation provides certain pro forma information regarding the impact of Rite Aid’s pending sale of distribution centers and assets to WBA on Rite Aid’s results of operations and capital structure. The pro forma information is for illustrative purposes only, was prepared by management in response to investor inquiries and is based upon a number of assumptions. The pro forma information assumes the completion of all the asset sales when they will actually take place over an extended period of time. Additional items that may require adjustments to the pro forma information may be identified and could result in material changes to the information contained herein. The information in this presentation is not necessarily indicative of what actual financial results of Rite Aid would have been had the sale occurred on the dates or for the periods indicated, nor does it purport to project the financial results of Rite Aid for any future periods or as of any date. Such pro forma information has not been prepared in conformity with Regulation S-X. Rite Aid’s independent auditors have not audited, reviewed, compiled or performed any procedures with respect to this preliminary financial information. Accordingly, they do not express an opinion or provide any form of assurance with respect thereto. The information in this presentation should not be viewed in replacement of results prepared in compliance with Generally Accepted Accounting Principles or any pro forma financial statements subsequently required by the rules and regulations of the Securities and Exchange Commission. SAFE HARBOR STATEMENT 3
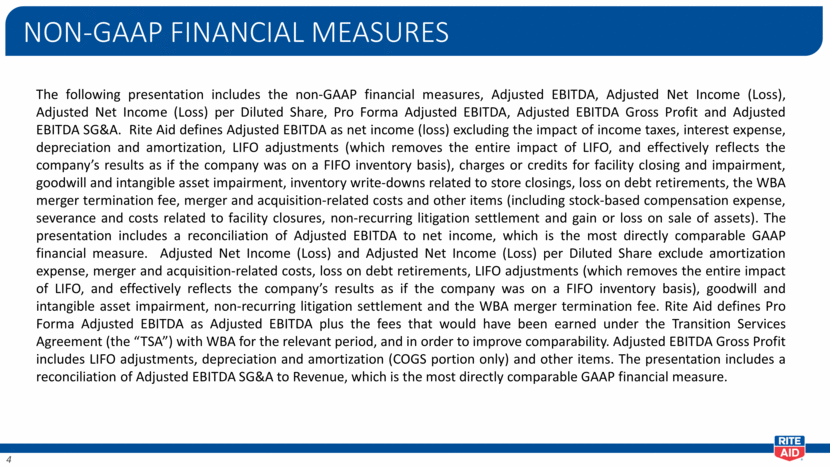
NON-GAAP FINANCIAL MEASURES The following presentation includes the non-GAAP financial measures, Adjusted EBITDA, Adjusted Net Income (Loss), Adjusted Net Income (Loss) per Diluted Share, Pro Forma Adjusted EBITDA, Adjusted EBITDA Gross Profit and Adjusted EBITDA SG&A. Rite Aid defines Adjusted EBITDA as net income (loss) excluding the impact of income taxes, interest expense, depreciation and amortization, LIFO adjustments (which removes the entire impact of LIFO, and effectively reflects the company’s results as if the company was on a FIFO inventory basis), charges or credits for facility closing and impairment, goodwill and intangible asset impairment, inventory write-downs related to store closings, loss on debt retirements, the WBA merger termination fee, merger and acquisition-related costs and other items (including stock-based compensation expense, severance and costs related to facility closures, non-recurring litigation settlement and gain or loss on sale of assets). The presentation includes a reconciliation of Adjusted EBITDA to net income, which is the most directly comparable GAAP financial measure. Adjusted Net Income (Loss) and Adjusted Net Income (Loss) per Diluted Share exclude amortization expense, merger and acquisition-related costs, loss on debt retirements, LIFO adjustments (which removes the entire impact of LIFO, and effectively reflects the company’s results as if the company was on a FIFO inventory basis), goodwill and intangible asset impairment, non-recurring litigation settlement and the WBA merger termination fee. Rite Aid defines Pro Forma Adjusted EBITDA as Adjusted EBITDA plus the fees that would have been earned under the Transition Services Agreement (the “TSA”) with WBA for the relevant period, and in order to improve comparability. Adjusted EBITDA Gross Profit includes LIFO adjustments, depreciation and amortization (COGS portion only) and other items. The presentation includes a reconciliation of Adjusted EBITDA SG&A to Revenue, which is the most directly comparable GAAP financial measure. 4
Quarter Ended September 1, 2018 STRATEGY UPDATE

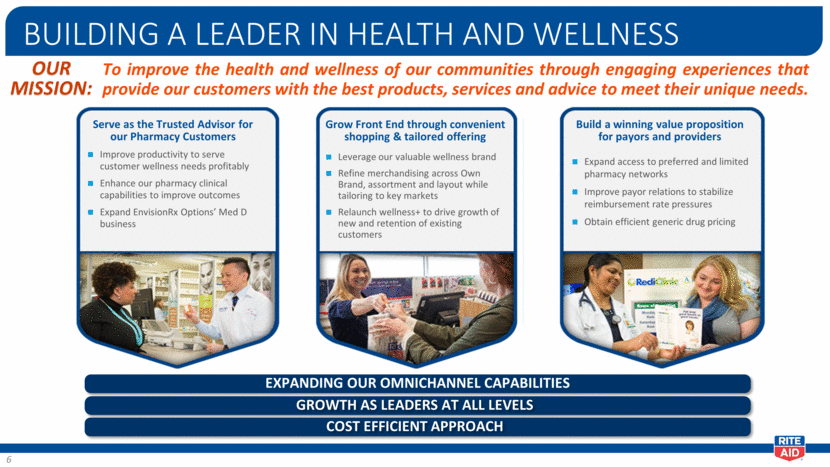
BUILDING A LEADER IN HEALTH AND WELLNESS 6 EXPANDING OUR OMNICHANNEL CAPABILITIES Grow Front End through convenient shopping & tailored offering Leverage our valuable wellness brand Refine merchandising across Own Brand, assortment and layout while tailoring to key markets Relaunch wellness+ to drive growth of new and retention of existing customers Serve as the Trusted Advisor for our Pharmacy Customers Improve productivity to serve customer wellness needs profitably Enhance our pharmacy clinical capabilities to improve outcomes Expand EnvisionRx Options’ Med D business Build a winning value proposition for payors and providers Expand access to preferred and limited pharmacy networks Improve payor relations to stabilize reimbursement rate pressures Obtain efficient generic drug pricing GROWTH AS LEADERS AT ALL LEVELS COST EFFICIENT APPROACH To improve the health and wellness of our communities through engaging experiences that provide our customers with the best products, services and advice to meet their unique needs. OUR MISSION:
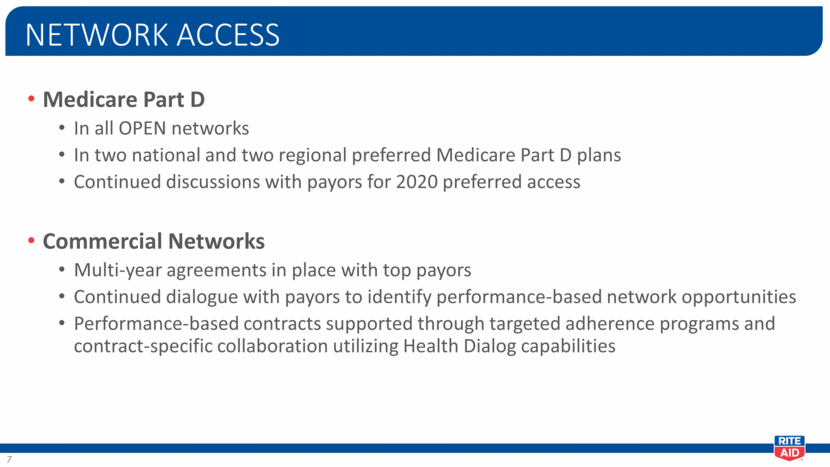
Medicare Part D In all OPEN networks In two national and two regional preferred Medicare Part D plans Continued discussions with payors for 2020 preferred access Commercial Networks Multi-year agreements in place with top payors Continued dialogue with payors to identify performance-based network opportunities Performance-based contracts supported through targeted adherence programs and contract-specific collaboration utilizing Health Dialog capabilities NETWORK ACCESS 7
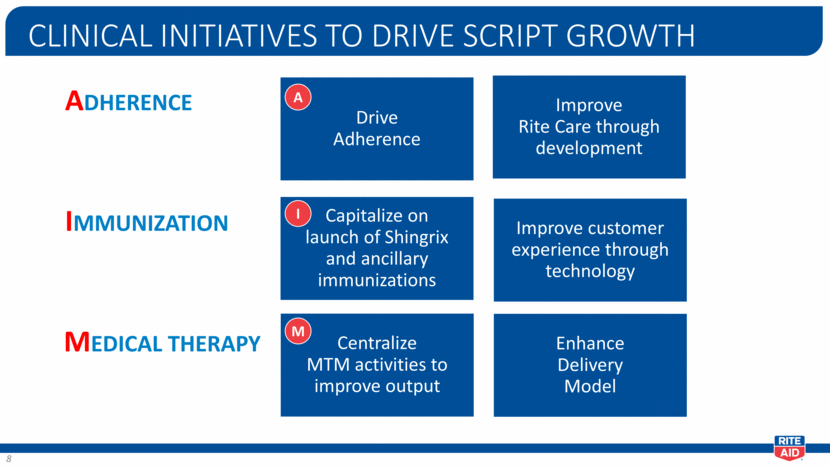
CLINICAL INITIATIVES TO DRIVE SCRIPT GROWTH Drive Adherence Capitalize on launch of Shingrix and ancillary immunizations Centralize MTM activities to improve output Improve Rite Care through development Improve customer experience through technology Enhance Delivery Model A I M ADHERENCE IMMUNIZATION MEDICAL THERAPY 8
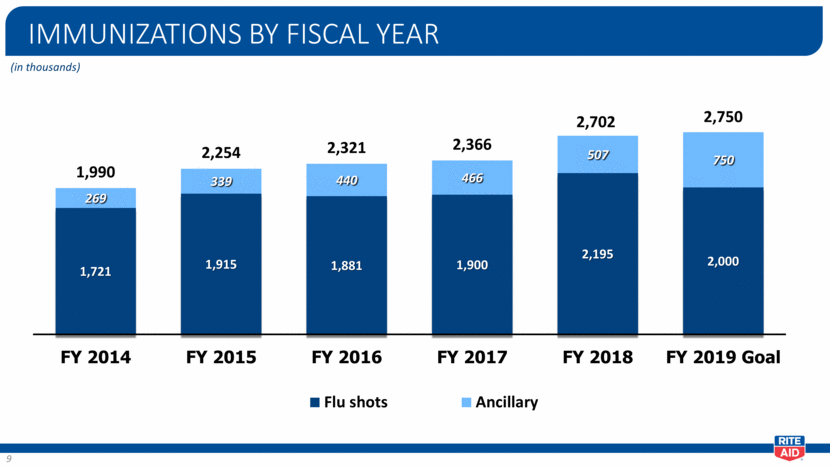
Immunizations by fiscal year (in thousands) 9
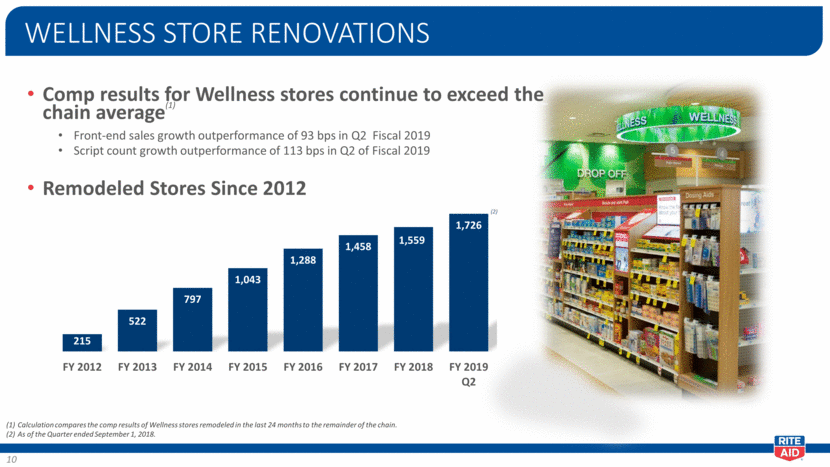
Comp results for Wellness stores continue to exceed the chain average(1) Front-end sales growth outperformance of 93 bps in Q2 Fiscal 2019 Script count growth outperformance of 113 bps in Q2 of Fiscal 2019 Remodeled Stores Since 2012 WELLNESS STORE RENOVATIONS Calculation compares the comp results of Wellness stores remodeled in the last 24 months to the remainder of the chain. As of the Quarter ended September 1, 2018. (2) 10 215 522 797 1,043 1,288 1,458 1,559 1,726 FY 2012 FY 2013 FY 2014 FY 2015 FY 2016 FY 2017 FY 2018 FY 2019 Q2
Wellness+ rewards program Program changes in January 2018 have been successful Customer/member engagement has grown significantly with introduction of Bonus Cash Integration of industry leading loyalty management platforms (Symphony Retail, Amplify and Redpoint) is currently being integrated to drive enhanced personalization Integrated marketing campaign to drive share of wallet and new customer acquisition 11
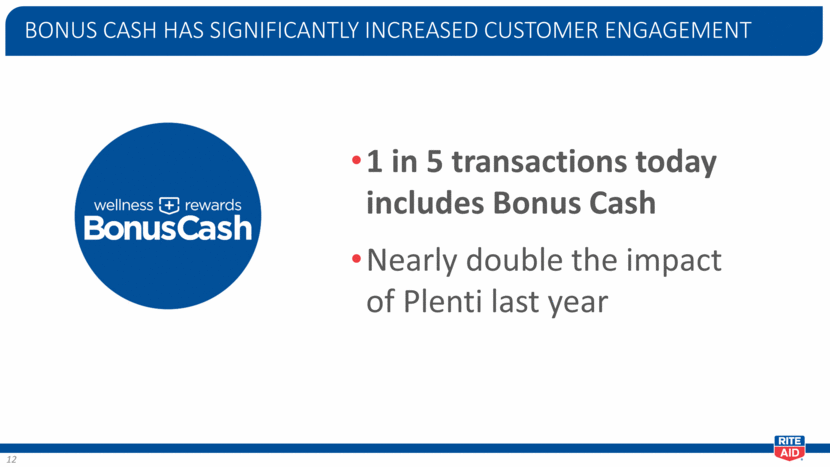
1 in 5 transactions today includes Bonus Cash Nearly double the impact of Plenti last year BONUS CASH HAS SIGNIFICANTLY INCREASED CUSTOMER ENGAGEMENT 12
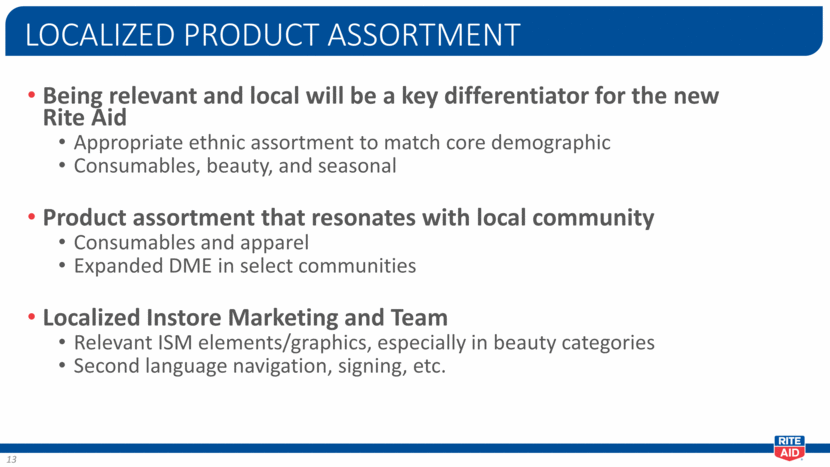
Being relevant and local will be a key differentiator for the new Rite Aid Appropriate ethnic assortment to match core demographic Consumables, beauty, and seasonal Product assortment that resonates with local community Consumables and apparel Expanded DME in select communities Localized Instore Marketing and Team Relevant ISM elements/graphics, especially in beauty categories Second language navigation, signing, etc. LOCALIZED PRODUCT ASSORTMENT 13
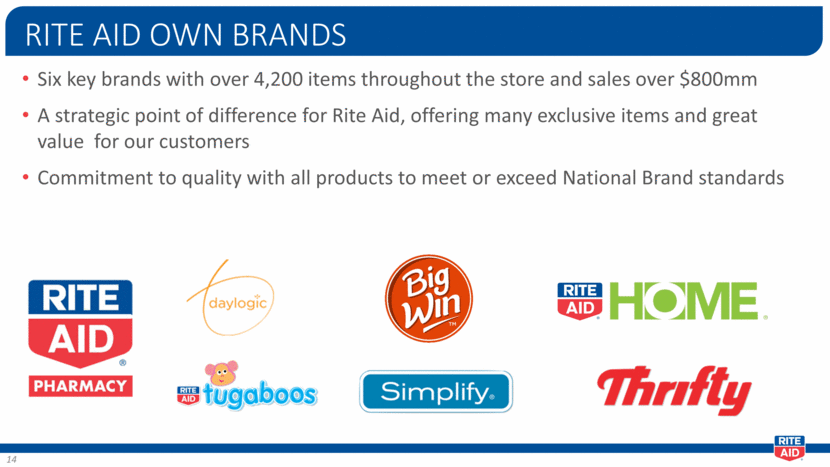
Six key brands with over 4,200 items throughout the store and sales over $800mm A strategic point of difference for Rite Aid, offering many exclusive items and great value for our customers Commitment to quality with all products to meet or exceed National Brand standards RITE AID OWN BRANDS 14
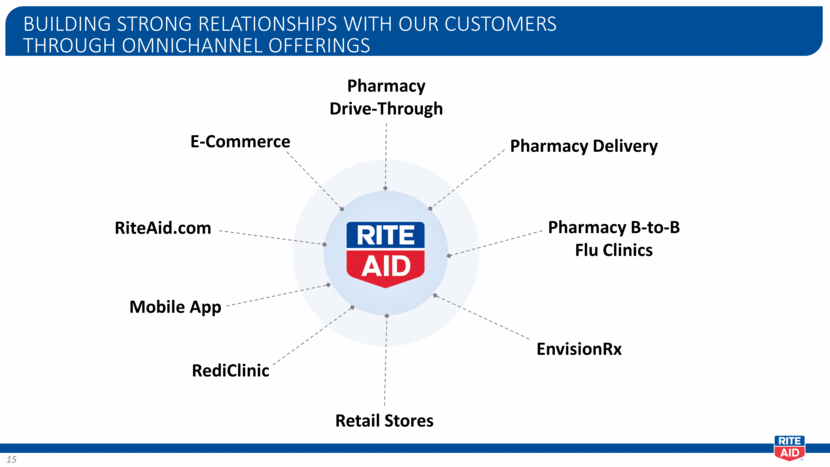
BUILDING STRONG RELATIONSHIPS WITH OUR CUSTOMERS THROUGH OMNICHANNEL OFFERINGS Pharmacy Drive-Through Pharmacy Delivery Pharmacy B-to-B Flu Clinics EnvisionRx Retail Stores RediClinic Mobile App RiteAid.com E-Commerce 15
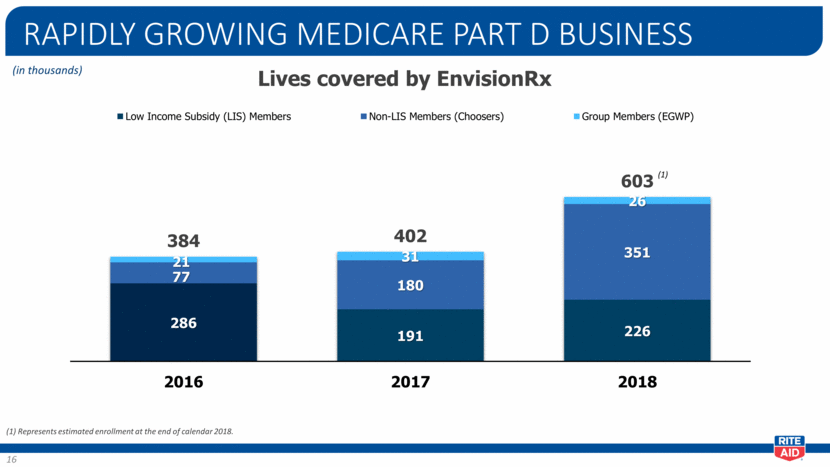
RAPIDLY GROWING MEDICARE PART D BUSINESS (in thousands) Lives covered by EnvisionRx (1) Represents estimated enrollment at the end of calendar 2018. (1) 16
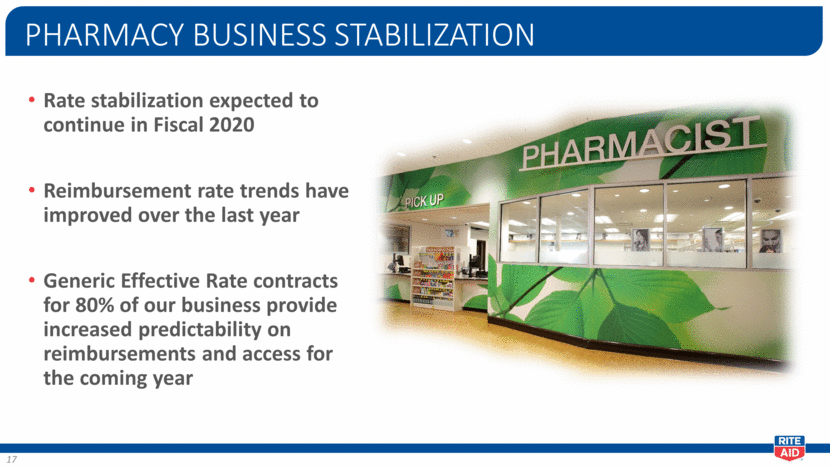
Rate stabilization expected to continue in Fiscal 2020 Reimbursement rate trends have improved over the last year Generic Effective Rate contracts for 80% of our business provide increased predictability on reimbursements and access for the coming year PHARMACY BUSINESS STABILIZATION 17
WBAD generic purchasing option Option expires May 2019 Requires brands to be sourced through ABC Benefit being verified in clean room process RFP process to achieve lowest possible drug cost prior to exercising option WBAD option, possible bids from McKesson and Cardinal Timing Evaluation process to be completed in the fall of calendar 2018 McKesson contract expires March 31, 2019 OPTIMIZE PHARMACY PURCHASING 18

Reduce near-term operating costs Store and field labor efficiency Advertising – optimize circular costs with better balance of digital Indirect procurement – goods not for resale Targeted long-term reduction of $96 million of administrative costs Process reengineering at corporate office Reduction of workload due to store count reduction Continue to evaluate underperforming stores Increased operational focus to improve results at actionable stores Target negative cash flow stores with short leases for closure or real estate solutions Optimize store footprint – evaluating options, including closure of up to 100 under-performing “watch list” stores CONTINUE TO IMPLEMENT COST CONTROL & SAVINGS INITIATIVES 19
Quarter Ended September 1, 2018 FINANCIAL UPDATE
Q2 - FISCAL 2019 SUMMARY 21 ($ in millions, except per share amounts) Note: Data on this slide and throughout the presentation is on a continuing operations basis. 13 Weeks Ended Sept. 1, 2018 13 Weeks Ended Sept 2, 2017 Revenue $ 5,421.4 $ 5,345.0 Net (Loss) $ (352.3) $ 188.4 Net (Loss) Income per Diluted Share $ (0.33) $ 0.18 Adjusted Net (Loss) Income per Diluted Share $ (0.01) $ 0.02 Adjusted EBITDA $ 148.6 2.74% $ 136.9 2.56% Pro Forma Adjusted EBITDA $ 148.6 $ 160.9

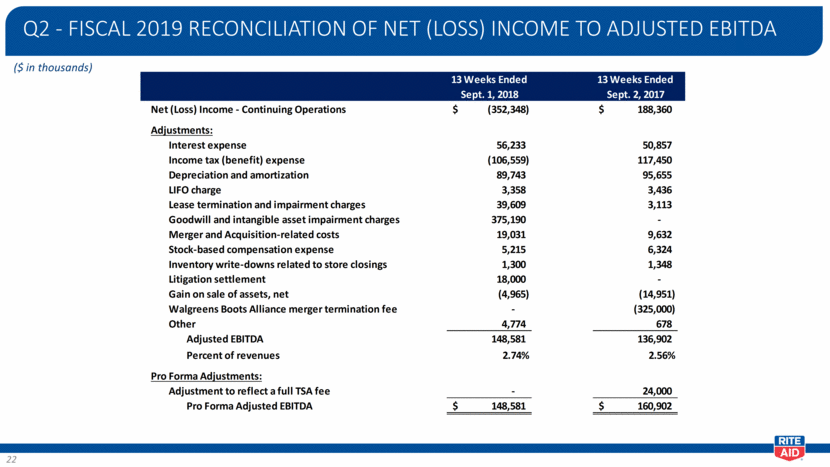
Q2 - FISCAL 2019 RECONCILIATION OF NET (LOSS) INCOME TO ADJUSTED EBITDA 22 ($ in thousands) ($ in thousands) 13 Weeks Ended Sept. 1, 2018 13 Weeks Ended Sept. 2, 2017 Net (Loss) Income - Continuing Operations $ (352,348) $ 188,360 Adjustments: Interest expense 56,233 50,857 Income tax (benefit) expense (106,559) 117,450 Depreciation and amortization 89,743 95,655 LIFO charge 3,358 3,436 Lease termination and impairment charges 39,609 3,113 Goodwill and intangible asset impairment charges 375,190 - Merger and Acquisition-related costs 19,031 9,632 Stock-based compensation expense 5,215 6,324 Inventory write-downs related to store closings 1,300 1,348 Litigation settlement 18,000 - Gain on sale of assets, net (4,965) (14,951) Walgreens Boots Alliance merger termination fee - (325,000) Other 4,774 678 Adjusted EBITDA 148,581 136,902 Percent of revenues 2.74% 2.56% Pro Forma Adjustments: Adjustment to reflect a full TSA fee - 24,000 Pro Forma Adjusted EBITDA $ 148,581 $ 160,902
Q2 - FISCAL 2019 RECONCILIATION OF NET (LOSS) INCOME TO ADJUSTED NET LOSS 23 ($ in thousands, except per share amounts) ($ in thousands) 13 Weeks Ended Sept. 1, 2018 13 Weeks Ended Sept. 2, 2017 Net (Loss) Income $ (352,348) $ 188,360 Add back - Income tax (benefit) expense (106,559) 117,450 (Loss) Income before income taxes $ (458,907) $ 305,810 Adjustments: Amortization expense 32,500 36,321 LIFO charge 3,358 3,436 Goodwill and intangible asset impairment charges 375,190 - Merger and Acquisition-related costs 19,031 9,632 Litigation settlement 18,000 - Walgreens Boots Alliance merger termination fee - (325,000) Adjusted (loss) income before income taxes $ (10,828) $ 30,199 Adjusted income tax (benefit) expense (2,951) 12,838 Adjusted net (loss) income $ (7,877) $ 17,361 Net (loss) income per diluted share $ (0.33) $ 0.18 Adjusted net (loss) income per diluted share $ (0.01) $ 0.02

Q2 - FISCAL 2019 SUMMARY - RETAIL PHARMACY SEGMENT 24 ($ in millions) (1) Refer to slides 27 and 28 for the reconciliations of these non-GAAP measures to their applicable GAAP measures. 13 Weeks Ended Sept. 1, 2018 13 Weeks Ended Sept. 2, 2017 Revenue $ 3,911.5 $ 3,901.8 Adjusted EBITDA Gross Profit (1) $ 1,057.7 27.04% $ 1,065.3 27.30% Adjusted EBITDA SG&A(1) $ 954.1 24.39% $ 977.7 25.06% Adjusted EBITDA $ 103.6 2.65% $ 87.6 2.25%
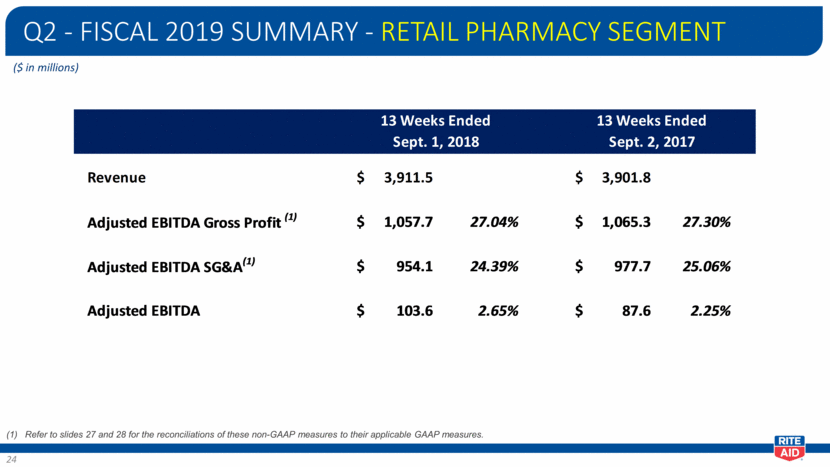
Retail Pharmacy Segment revenue increased $9.7 million. Same store sales increased 1.0%, driven primarily by a 1.1% increase in same store script growth. Adjusted EBITDA Gross Profit decreased $7.6 million and Adjusted EBITDA Gross Margin decreased by 26 bps. The Gross Margin decrease was driven by a decline in reimbursement rates that we could not fully offset with generic purchasing efficiencies. Adjusted EBITDA SG&A was $23.6 million better than the prior year due primarily to TSA fees received in the current year. Q2 - FISCAL 2019 SUMMARY – RETAIL PHARMACY SEGMENT 25
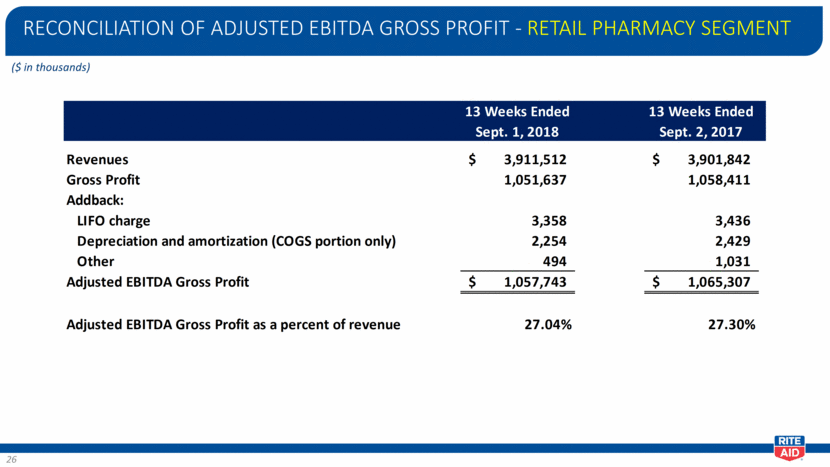
RECONCILIATION OF ADJUSTED EBITDA GROSS PROFIT - RETAIL PHARMACY SEGMENT 26 ($ in thousands) Reconciliation of Adjusted EBITDA Gross Profit Retail Pharmacy Segment ($ in thousands) 13 Weeks Ended Sept. 1, 2018 13 Weeks Ended Sept. 2, 2017 Revenues $ 3,911,512 $ 3,901,842 Gross Profit 1,051,637 1,058,411 Addback: LIFO charge 3,358 3,436 Depreciation and amortization (COGS portion only) 2,254 2,429 Other 494 1,031 Adjusted EBITDA Gross Profit $ 1,057,743 $ 1,065,307 Adjusted EBITDA Gross Profit as a percent of revenue 27.04% 27.30%
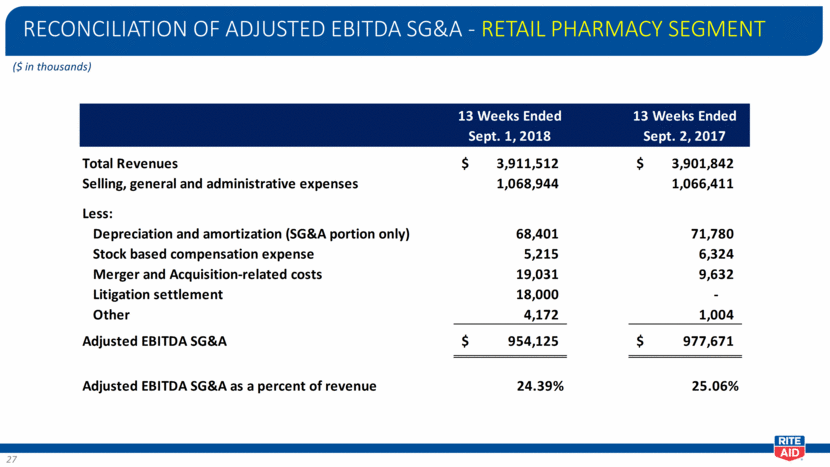
RECONCILIATION OF ADJUSTED EBITDA SG&A - RETAIL PHARMACY SEGMENT 27 ($ in thousands) Reconciliation of Adjusted EBITDA SG&A Retail Pharmacy Segment ($ in thousands) 13 Weeks Ended Sept. 1, 2018 13 Weeks Ended Sept. 2, 2017 Total Revenues $ 3,911,512 $ 3,901,842 Selling, general and administrative expenses 1,068,944 1,066,411 Less: Depreciation and amortization (SG&A portion only) 68,401 71,780 Stock based compensation expense 5,215 6,324 Merger and Acquisition-related costs 19,031 9,632 Litigation settlement 18,000 - Other 4,172 1,004 Adjusted EBITDA SG&A $ 954,125 $ 977,671 Adjusted EBITDA SG&A as a percent of revenue 24.39% 25.06%
PHARMACY SERVICES SEGMENT RESULTS 28 ($ in millions) 13 Weeks Ended Sept. 1, 2018 13 Weeks Ended Sept. 2, 2017 Revenues $ 1,561.8 $ 1,492.8 Cost of Revenues 1,452.3 1,389.6 Gross Profit 109.5 103.2 Selling, General and Administrative Expense (85.0) (75.4) Addback: Depreciation and Amortization 20.5 20.0 Other - 1.5 Adjusted EBITDA - Pharmacy Services Segment $ 45.0 $ 49.3

Revenues increased $69.0 million, primarily due to an increase in our Medicare Part D membership Adjusted EBITDA decreased $4.3 million, primarily due to margin compression in our commercial business and SG&A investments we have made to support our current year and future growth Q2 - FY 2019 SUMMARY – PHARMACY SERVICES SEGMENT 29

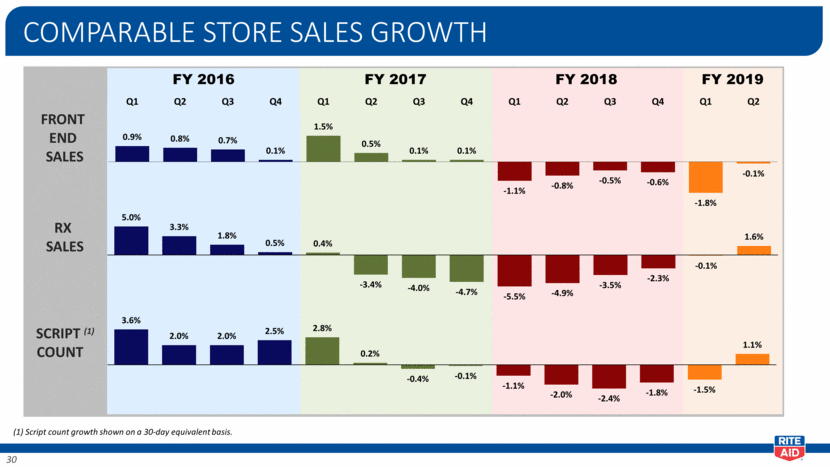
FY 2018 FY 2016 FY 2017 Front End Sales Rx Sales COMPARABLE STORE SALES GROWTH 30 Script Count (1) (1) Script count growth shown on a 30-day equivalent basis. FY 2019 5.0% 3.3% 1.8% 0.5% 0.4% - 3.4% - 4.0% - 4.7% - 5.5% - 4.9% - 3.5% - 2.3% - 0.1% 1.6% 0.9% 0.8% 0.7% 0.1% 1.5% 0.5% 0.1% 0.1% - 1.1% - 0.8% - 0.5% - 0.6% - 1.8% - 0.1% Q1 Q2 Q3 Q4 Q1 Q2 Q3 Q4 Q1 Q2 Q3 Q4 Q1 Q2 3.6% 2.0% 2.0% 2.5% 2.8% 0.2% - 0.4% - 0.1% - 1.1% - 2.0% - 2.4% - 1.8% - 1.5% 1.1%
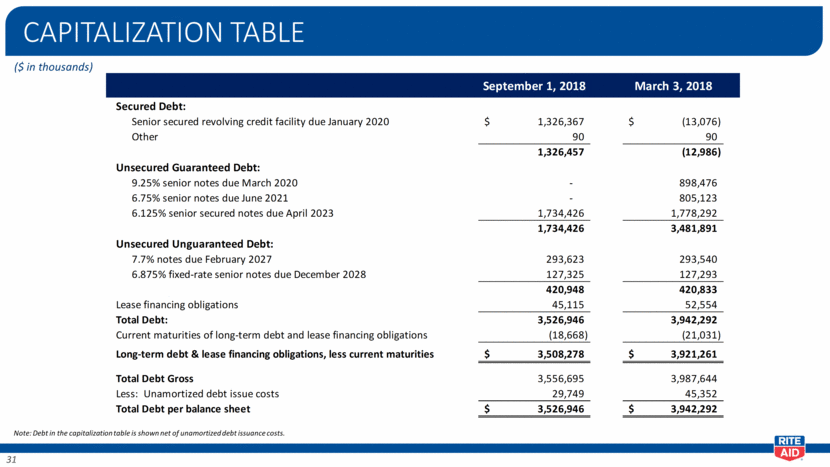
CAPITALIZATION TABLE 31 ($ in thousands) Note: Debt in the capitalization table is shown net of unamortized debt issuance costs. Capitalization Table & Leverage ($ in thousands) ############### March 3, 2018 Secured Debt: Senior secured revolving credit facility due January 2020 $ 1,326,367 $ (13,076) Other 90 90 1,326,457 (12,986) Unsecured Guaranteed Debt: 9.25% senior notes due March 2020 - 898,476 6.75% senior notes due June 2021 - 805,123 6.125% senior secured notes due April 2023 1,734,426 1,778,292 1,734,426 3,481,891 Unsecured Unguaranteed Debt: 7.7% notes due February 2027 293,623 293,540 6.875% fixed-rate senior notes due December 2028 127,325 127,293 420,948 420,833 Lease financing obligations 45,115 52,554 Total Debt: 3,526,946 3,942,292 Current maturities of long-term debt and lease financing obligations (18,668) (21,031) Long-term debt & lease financing obligations, less current maturities $ 3,508,278 $ 3,921,261 Total Debt Gross 3,556,695 3,987,644 Less: Unamortized debt issue costs 29,749 45,352 Total Debt per balance sheet $ 3,526,946 $ 3,942,292
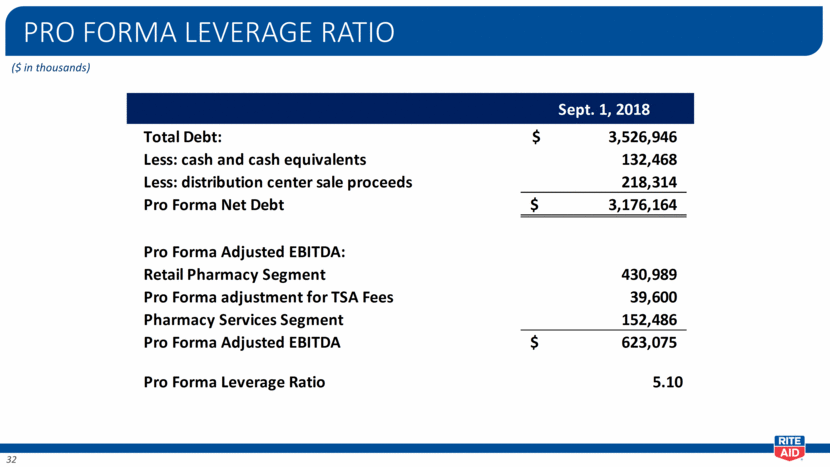
PRO FORMA LEVERAGE RATIO 32 ($ in thousands) Sept. 1, 2018 Total Debt: $ 3,526,946 Less: cash and cash equivalents 132,468 Less: distribution center sale proceeds 218,314 Pro Forma Net Debt $ 3,176,164 Pro Forma Adjusted EBITDA: Retail Pharmacy Segment 430,989 Pro Forma adjustment for TSA Fees 39,600 Pharmacy Services Segment 152,486 Pro Forma Adjusted EBITDA $ 623,075 Pro Forma Leverage Ratio 5.10
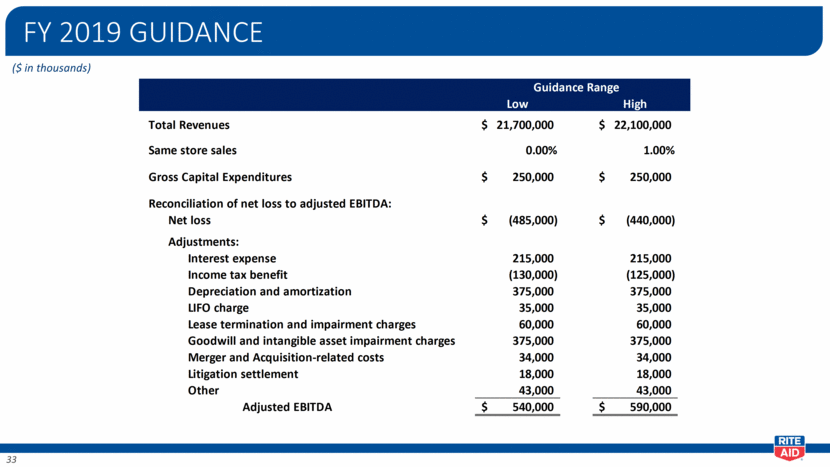
FY 2019 GUIDANCE 33 ($ in thousands) RITE AID CORPORATION AND SUBSIDIARIES SUPPLEMENTAL INFORMATION RECONCILIATION OF NET LOSS GUIDANCE TO ADJUSTED EBITDA GUIDANCE YEAR ENDING MARCH 2, 2019 (In thousands, except per share amounts) (unaudited) Guidance Range Low High Total Revenues $ 21,700,000 $ 22,100,000 Same store sales 0.00% 1.00% Gross Capital Expenditures $ 250,000 $ 250,000 Reconciliation of net loss to adjusted EBITDA: Net loss $ (485,000) $ (440,000) Adjustments: Interest expense 215,000 215,000 Income tax benefit (130,000) (125,000) Depreciation and amortization 375,000 375,000 LIFO charge 35,000 35,000 Lease termination and impairment charges 60,000 60,000 Goodwill and intangible asset impairment charges 375,000 375,000 Merger and Acquisition-related costs 34,000 34,000 Litigation settlement 18,000 18,000 Other 43,000 43,000 Adjusted EBITDA $ 540,000 $ 590,000
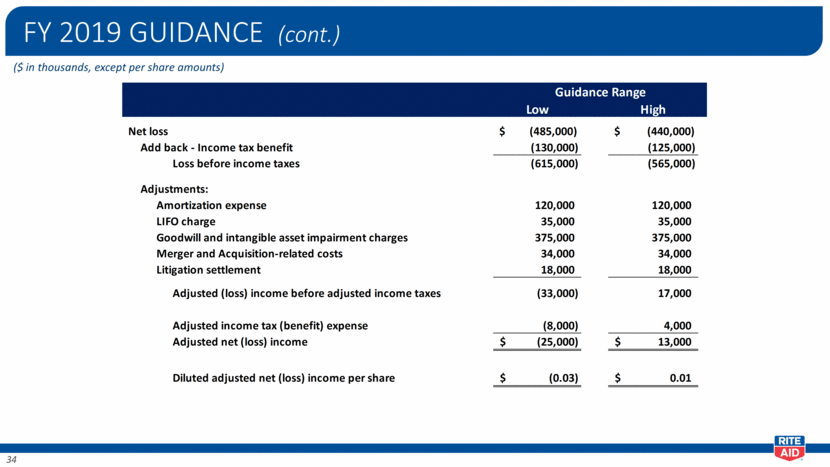
FY 2019 GUIDANCE (cont.) 34 ($ in thousands, except per share amounts) RITE AID CORPORATION AND SUBSIDIARIES SUPPLEMENTAL INFORMATION RECONCILIATION OF NET LOSS GUIDANCE TO ADJUSTED NET INCOME GUIDANCE YEAR ENDING MARCH 2, 2019 (In thousands, except per share amounts) (unaudited) Guidance Range Low High Net loss $ (485,000) $ (440,000) Add back - Income tax benefit (130,000) (125,000) Loss before income taxes (615,000) (565,000) Adjustments: Amortization expense 120,000 120,000 LIFO charge 35,000 35,000 Goodwill and intangible asset impairment charges 375,000 375,000 Merger and Acquisition-related costs 34,000 34,000 Litigation settlement 18,000 18,000 Adjusted (loss) income before adjusted income taxes (33,000) 17,000 Adjusted income tax (benefit) expense (8,000) 4,000 Adjusted net (loss) income $ (25,000) $ 13,000 Diluted adjusted net (loss) income per share $ (0.03) $ 0.01
[LOGO]