Exhibit 99.2

THIRD QUARTER FISCAL 2023 Earnings Conference Call Heyward Donigan Chief Executive Officer Matt Schroeder Chief Financial Officer 12/21/2022
Cautionary Statement Regarding Forward Looking Statements Deepen Grow by Driven Initiatives in Core Areas Create Leverage Assets to Develop New Offering 2 Statements in this presentation that are not historical, are forward - looking statements made pursuant to the safe harbor provisions of the Private Securities Litigation Reform Act of 1995 . Such statements include, but are not limited to, statements regarding Rite Aid Corporation’s (the “Company”) outlook and guidance for fiscal 2023 , including its expectation to generate positive free cash flow in fiscal 2023 ; the continued impact of the global coronavirus (COVID - 19 ) pandemic on the Company’s business ; our key growth initiatives, including our plans to improve adherence ; our timing and plans to expand growth in new markets, upgrade our propriety pharmacy workflow technology, and add central fill facilities in the West Coast and Ohio ; and any assumptions underlying any of the foregoing . Words such as "anticipate," "believe," "continue," "could," "estimate," "expect," "intend," "may," "plan," "predict," "project," "should," and "will" and variations of such words and similar expressions are intended to identify such forward - looking statements . These forward - looking statements are not guarantees of future performance and involve risks, assumptions and uncertainties, including, but not limited to : risks related to the prolonged impact of the COVID - 19 global pandemic, and the emerging new variants, including government actions and restrictive measures implemented in response, and other impacts to the business, or on the Company’s ability to execute business continuity plans, as a result of the COVID - 19 pandemic ; the impact of COVID - 19 on the Company’s workforce, operations, stores, expenses, and supply chain, and the operations or behaviors of the Company’s customers, suppliers and business partners ; the Company’s ability to successfully implement the Company’s store closure program and other strategies ; the impact of the Company’s high level of indebtedness, the ability to refinance such indebtedness on acceptable terms (including the impact of rising interest rates, market volatility, and continuing actions by the United States Federal Reserve) and the Company’s ability to satisfy its obligations and the other covenants contained in the Company’s debt agreements ; outcome of pending or new litigation including related to Opioids, “usual and customary” pricing or other matters ; the Company’s ability to monetize (and on reasonably available terms) the CMS receivable created in the Company’s Part D business ; general competitive, economic, industry, market, political (including healthcare reform) and regulatory conditions (including changes to laws or regulations relating to labor or wages), and regulatory conditions, including continued impacts of inflation or other pricing environment factors on our costs, liquidity and our ability to pass on price increases to our customers, including as a result of inflationary and deflationary pressures, a decline in consumer spending or deterioration in consumer financial position, whether due to inflation or other factors, as well as other factors specific to the markets in which we operate ; the impact of private and public third - party payers continued reduction in prescription drug reimbursements and efforts to encourage mail order ; the Company’s ability to manage expenses and its investments in working capital ; the Company’s ability to achieve the benefits of the Company’s efforts to reduce the costs of its generic and other drugs ; the Company’s ability to achieve cost savings and other benefits of its organizational restructuring within its anticipated timeframe, if at all ; the outcome and impact of the Company’s continuing efforts to monitor and comply with applicable laws, regulations, policies and procedures ; the Company’s ability to increase adherence in certain specific target areas ; and the Company’s ability to partner and have relationships with health plans and health systems . These and other risks, assumptions and uncertainties are more fully described in Item 1 A (Risk Factors) of the Company’s most recent Annual Report on Form 10 - K and in other documents that it files or furnishes with the Securities and Exchange Commission (the “SEC”), which you are encouraged to read . To the extent that COVID - 19 adversely affects the Company’s business and financial results, it may also have the effect of heightening many of such risk factors . Should one or more of these risks or uncertainties materialize, or should underlying assumptions prove incorrect, actual results may vary materially from those indicated or anticipated by such forward - looking statements . Accordingly, you are cautioned not to rely on these forward - looking statements, which speak only as of the date they are made . The degree to which COVID - 19 may adversely affect the Company’s results and operations, including its ability to achieve its outlook for fiscal 2023 guidance, will depend on numerous evolving factors and future developments, which are highly uncertain, including, but not limited to, federal, state and local governmental policies and initiatives designed to reduce the transmission of COVID - 19 and emerging new variants, and how quickly and to what extent normal economic and operating conditions can resume . As a result, the impact on the Company’s financial and operating results cannot be reasonably estimated with specificity at this time, but the impact could be material . The Company expressly disclaims any current intention, and assumes no duty, to update publicly any forward - looking statement after the distribution of this presentation, whether as a result of new information, future events, changes in assumptions or otherwise .
Deepen Grow by Driven Initiatives in Core Areas Create Leverage Assets to Develop New Offering Non - GAAP Financial Measures The following presentation includes the non - GAAP financial measures Adjusted Net Income (Loss), Adjusted Net Income (Loss) per Diluted Share, Adjusted EBITDA, Adjusted EBITDA Gross Profit and Adjusted EBITDA SG&A, which are non - GAAP financial measures . See the attached tables for a reconciliation of Adjusted Net Income (Loss), Adjusted Net Income (Loss) per Diluted Share and Adjusted EBITDA to net income (loss), and net income (loss) per diluted share, which are the most directly comparable GAAP financial measures . Adjusted Net Income (Loss) and Adjusted Net Income (Loss) per Diluted Share exclude amortization expense, merger and acquisition - related costs, non - recurring litigation and other contractual settlements, gains or losses on debt modifications and retirements, LIFO adjustments, goodwill and intangible asset impairment charges, restructuring - related costs, the gains or losses on Bartell acquisition, and change in estimate related to manufacturer rebate receivables . The Company believes Adjusted Net Income (Loss) and Adjusted Net Income (Loss) per Diluted Share serve as appropriate measures to be used in evaluating the performance of its business and help its investors better compare its operating performance over multiple periods . Adjusted EBITDA is defined as net income (loss) excluding the impact of income taxes, interest expense, depreciation and amortization, LIFO adjustments, charges or credits for facility exit and impairment, goodwill and intangible asset impairment charges, inventory write - downs related to store closings, gains or losses on debt modifications and retirements, change in estimate related to manufacturer rebate receivables, and other items (including stock - based compensation expense, merger and acquisition - related costs, non - recurring litigation and other contractual settlements, severance, restructuring - related costs, costs related to facility closures, gain or loss on sale of assets, and the gain or loss on Bartell acquisition) . The add back of LIFO (credit) charge when calculating Adjusted EBITDA, Adjusted Net Income (Loss) and Adjusted Net Income (Loss) per Diluted Share removes the entire impact of LIFO (credits) charges, and effectively reflects the Company's results as if the company was on a FIFO inventory basis . The Company believes Adjusted EBITDA serves as an appropriate measure in evaluating the performance of its business and helps its investors better compare its operating performance with its competitors . Adjusted EBITDA Gross Profit includes LIFO adjustments, depreciation and amortization (COGS portion only) and other items . See the attached tables for a reconciliation of Adjusted EBITDA Gross Profit to Revenue, which is the most directly comparable GAAP financial measure . Adjusted EBITDA SG&A excludes depreciation and amortization (SG&A portion only), stock - based compensation expense, merger and acquisition - related costs, non - recurring litigation and other contractual settlements, and other items . See the attached tables for a reconciliation of Adjusted EBITDA SG&A to Revenue, which is the most directly comparable GAAP financial measure . The Company believes Adjusted EBITDA Gross Profit and Adjusted EBITDA SG&A serve as appropriate measures in evaluating the performance of its business and helps its investors better compare its operating performance with its competitors . 3

Q3FY23 FINANCIAL REVIEW
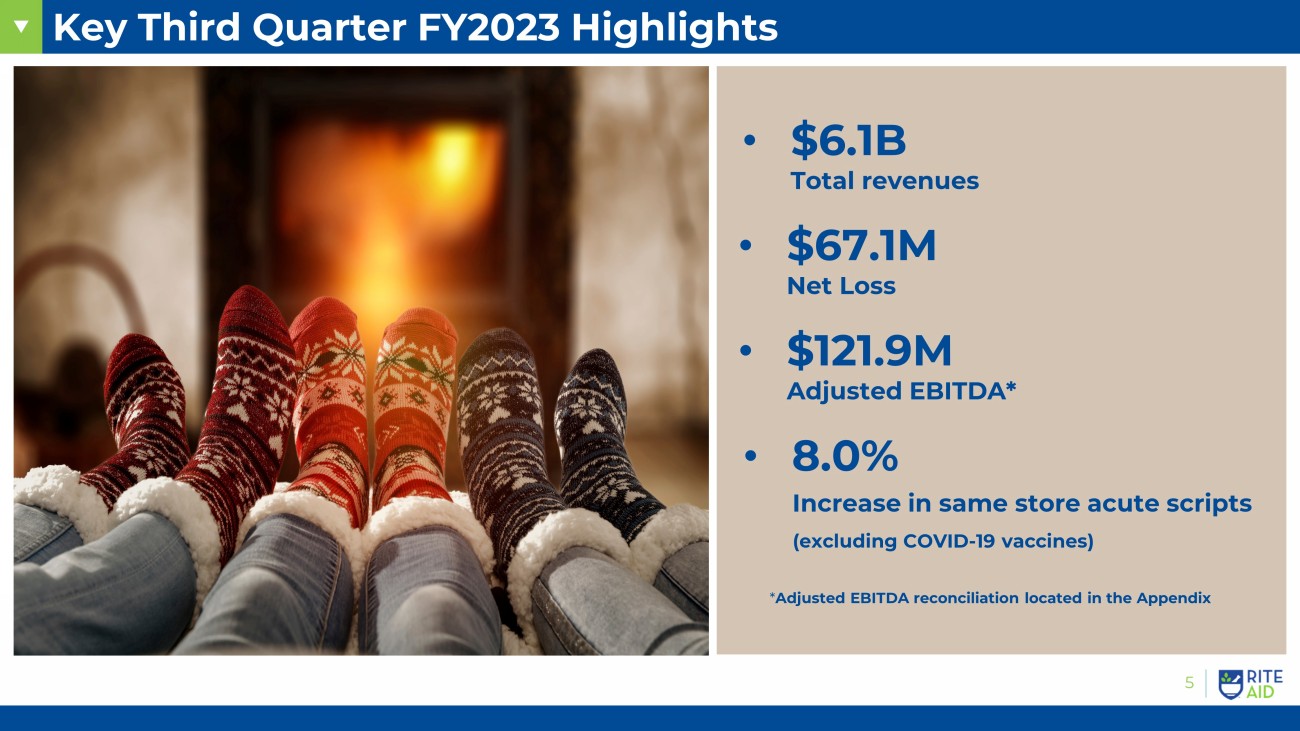
Key Third Quarter FY2023 Highlights 5 • $6.1B Total revenues • $ 121.9M Adjusted EBITDA* • 8.0% Increase in same store a cute scripts (excluding COVID - 19 vaccines) * Adjusted EBITDA reconciliation located in the Appendix • $67.1M Net Loss
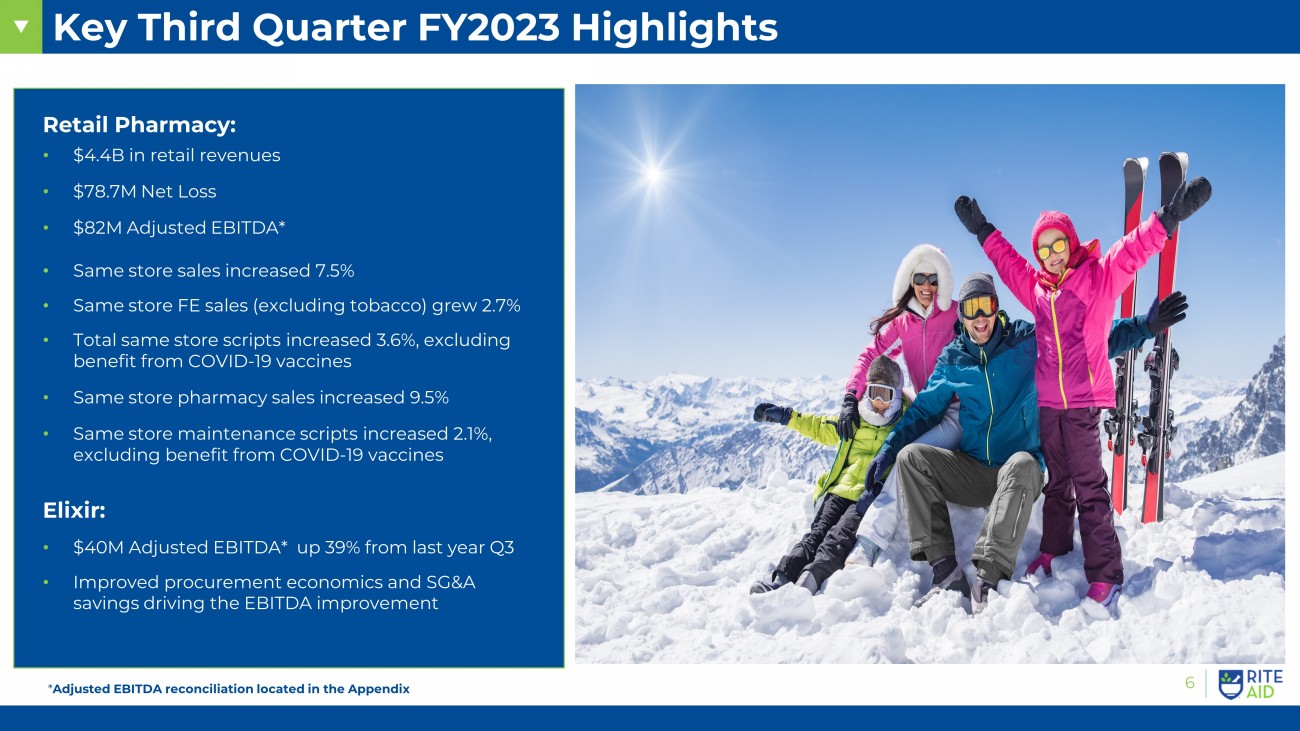
Key Third Quarter FY2023 Highlights 6 Retail Pharmacy: • $4.4B in retail revenues • $78.7M Net Loss • $82M Adjusted EBITDA* • Same store sales increased 7.5% • Same store FE sales (excluding tobacco) grew 2.7% • Total same store scripts increased 3.6%, excluding benefit from COVID - 19 vaccines • Same store pharmacy sales increased 9.5% • Same store maintenance scripts increased 2.1%, excluding benefit from COVID - 19 vaccines Elixir: • $40M Adjusted EBITDA* up 39% from last year Q3 • Improved procurement economics and SG&A savings driving the EBITDA improvement * Adjusted EBITDA reconciliation located in the Appendix
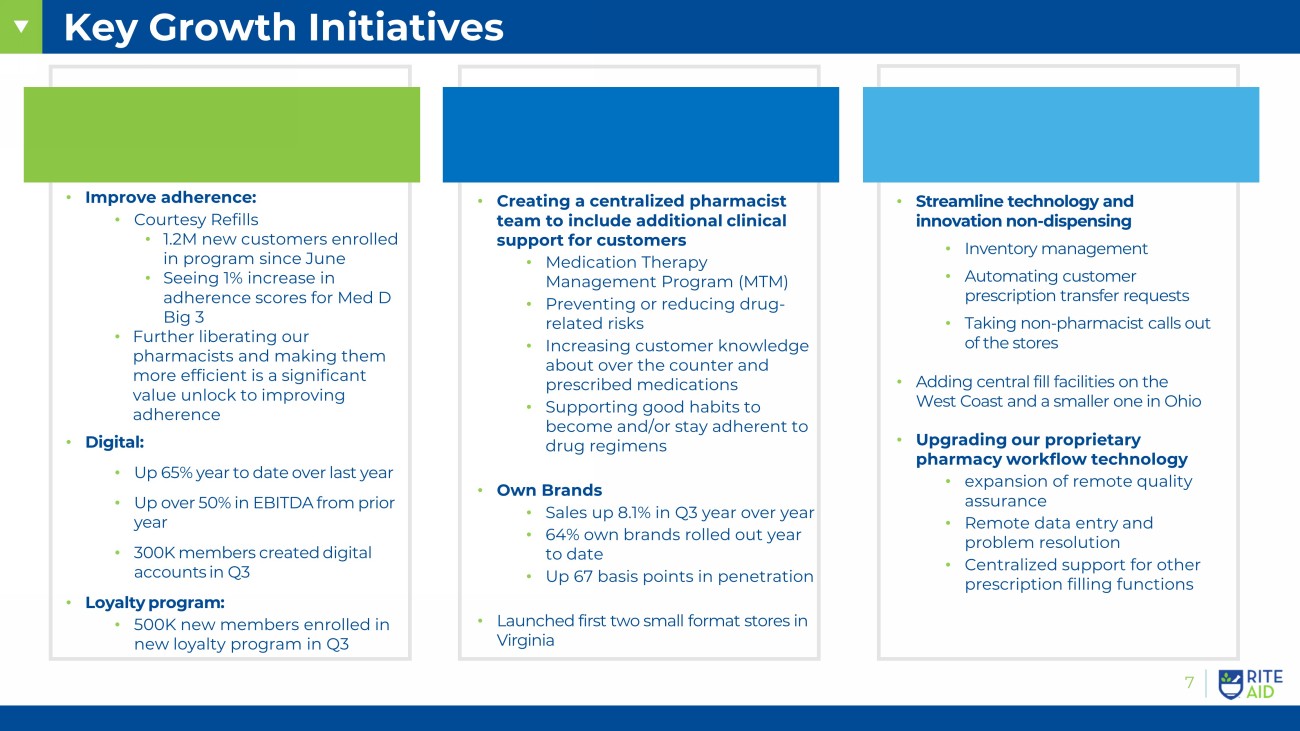
Key Growth Initiatives • Improve adherence: • Courtesy Refills • 1.2M new customers enrolled in program since June • Seeing 1% increase in adherence scores for Med D Big 3 • Further liberating our pharmacists and making them more efficient is a significant value unlock to improving adherence • Digital: • Up 65% year to date over last year • Up over 50% in EBITDA from prior year • 300K members created digital accounts in Q3 • Loyalty program: • 500K new members enrolled in new loyalty program in Q3 • Creating a centralized pharmacist team to include additional clinical support for customers • Medication Therapy Management Program (MTM) • Preventing or reducing drug - related risks • Increasing customer knowledge about over the counter and prescribed medications • Supporting good habits to become and/or stay adherent to drug regimens • Own Brands • Sales up 8.1% in Q3 year over year • 64% own brands rolled out year to date • Up 67 basis points in penetration • Launched first two small format stores in Virginia • Streamline technology and innovation non - dispensing • Inventory management • Automating customer prescription transfer requests • Taking non - pharmacist calls out of the stores • Adding central fill facilities on the West Coast and a smaller one in Ohio • Upgrading our proprietary pharmacy workflow technology • expansion of remote quality assurance • Remote data entry and problem resolution • Centralized support for other prescription filling functions 7
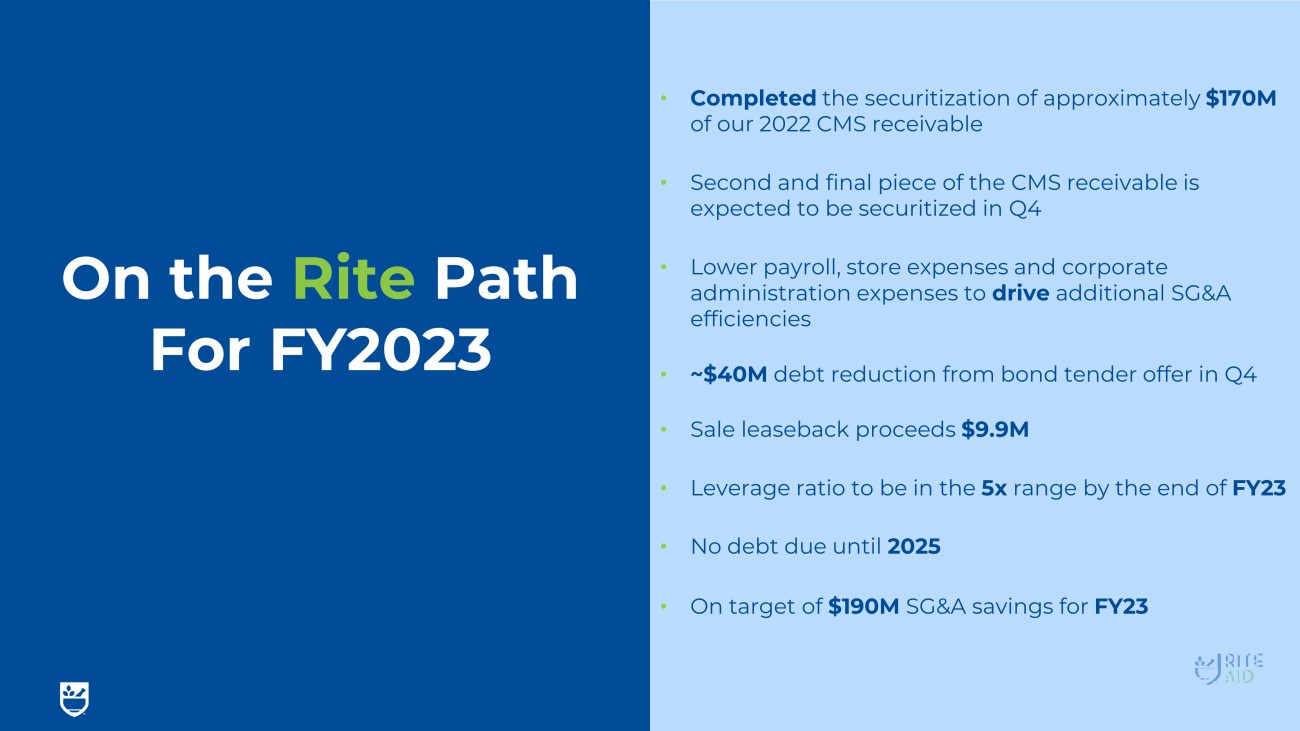
8 8 On the Rite Path For FY2023 • C ompleted the securitization of approximately $170M of our 2022 CMS receivable • Second and final piece of the CMS receivable is expected to be securitized in Q4 • Lower payroll, store expenses and corporate administration expenses to drive additional SG&A efficiencies • ~$40M debt reduction from bond tender offer in Q4 • Sale leaseback proceeds $9.9M • Leverage ratio to be in the 5x range by the end of FY23 • No debt due until 2025 • On target of $190M SG&A savings for FY23

GUIDANCE
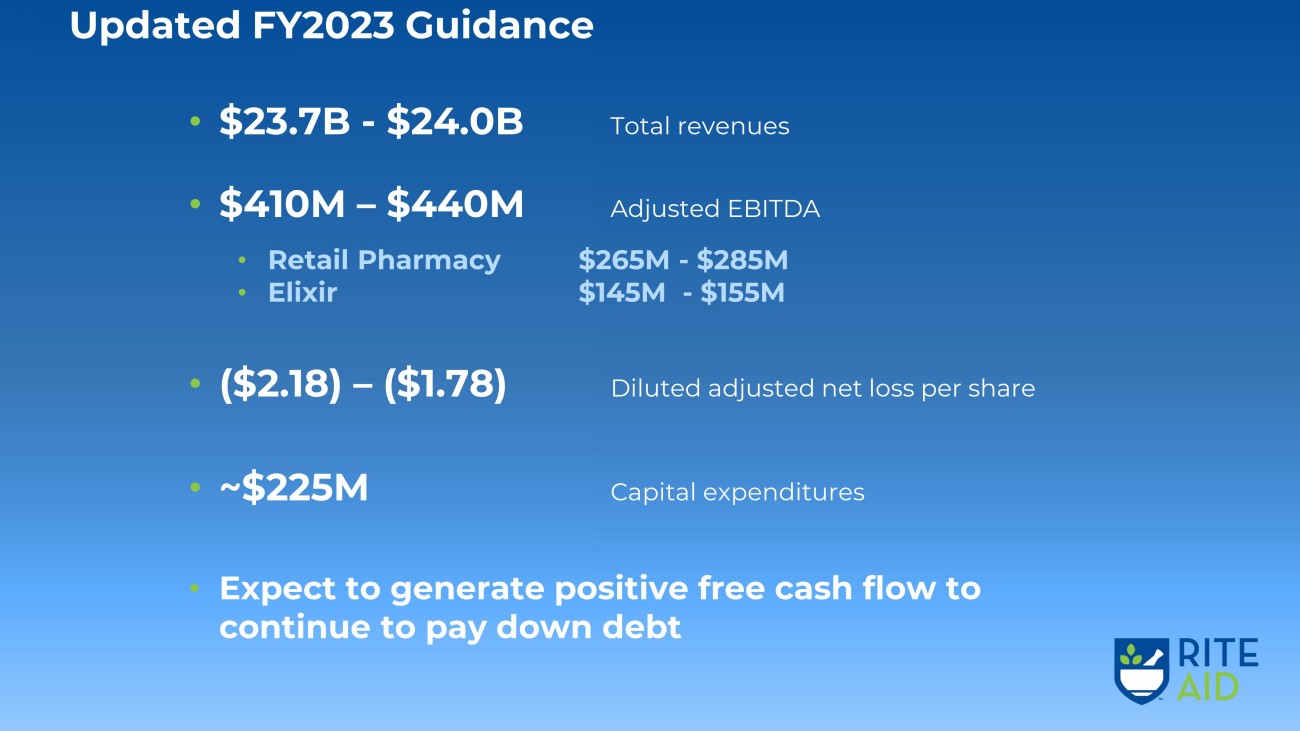
Updated FY2023 Guidance • $23.7B - $24.0B Total revenues • $410M – $440M Adjusted EBITDA • Retail Pharmacy $265M - $285M • Elixir $145M - $155M • ($2.18) – ($1.78) Diluted adjusted net loss per share • ~$225M Capital expenditures • Expect to generate positive free cash flow to continue to pay down debt

APPENDIX
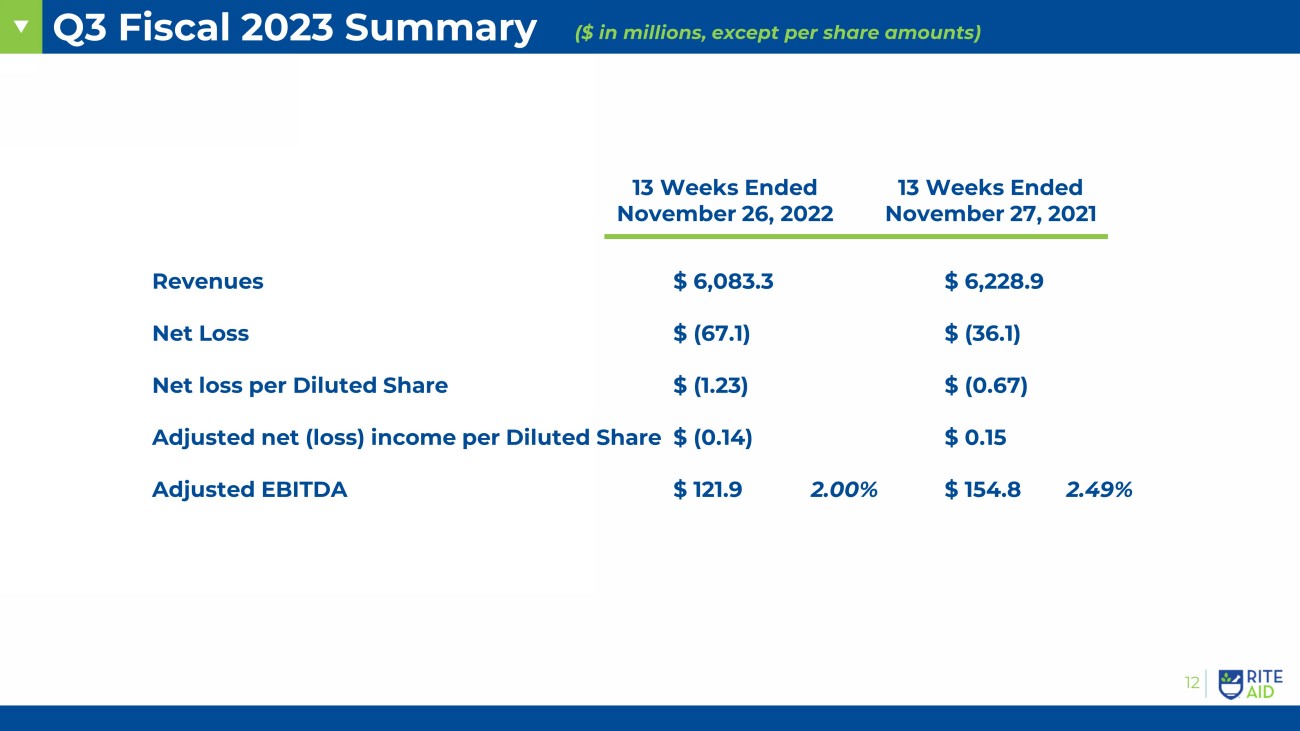
Q3 Fiscal 2023 Summary Create Leverage Assets to Develop New Offering ($ in millions, except per share amounts) 13 Weeks Ended November 26, 2022 13 Weeks Ended November 27 , 2021 Revenues $ 6,083.3 $ 6,228.9 Net Loss $ (67.1) $ (36.1) Net loss per Diluted Share $ (1.23) $ (0.67) Adjusted net (loss) income per Diluted Share $ (0.14) $ 0 .15 Adjusted EBITDA $ 121.9 2.00% $ 154.8 2.49% 12
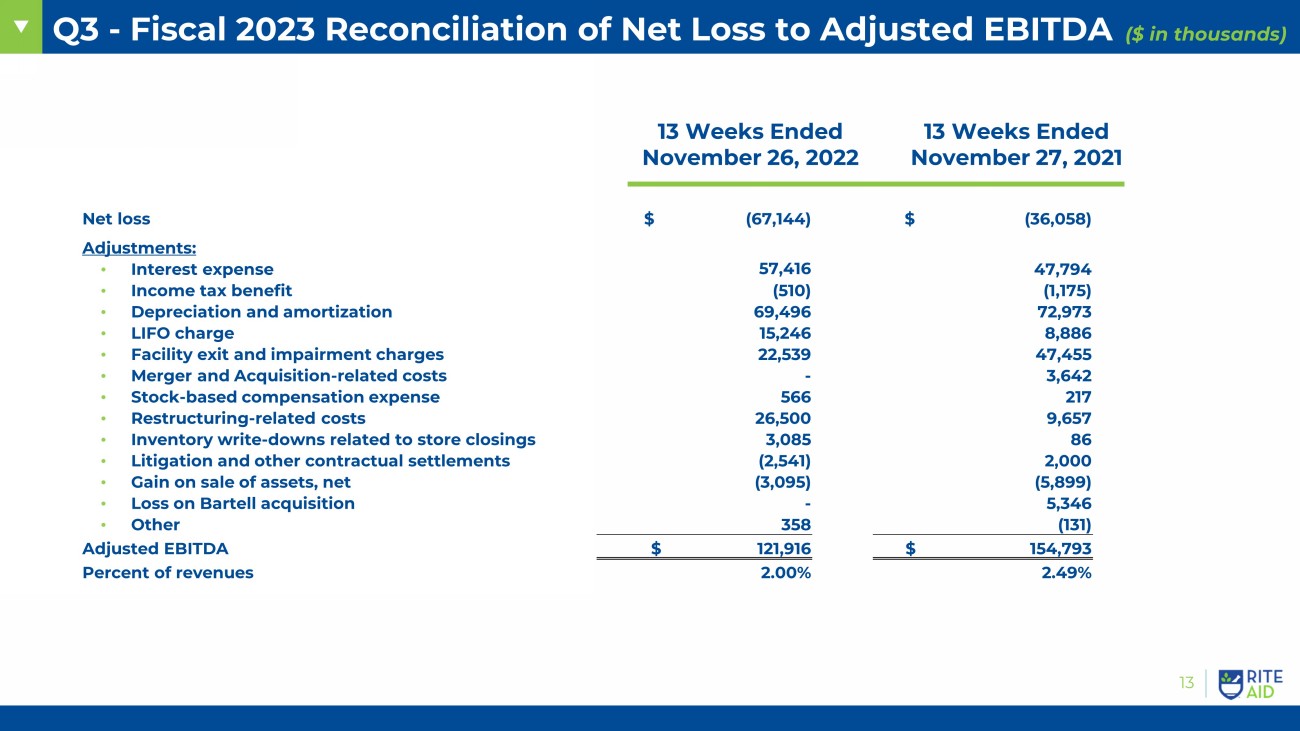
Q3 - Fiscal 2023 Reconciliation of Net Loss to Adjusted EBITDA 13 ($ in thousands) 13 Weeks Ended November 26, 2022 13 Weeks Ended November 27, 2021 Net loss $ (67,144) $ (36,058) Adjustments: • Interest expense 57,416 47,794 • Income tax benefit (510) (1,175) • Depreciation and amortization 69,496 72,973 • LIFO charge 15,246 8,886 • Facility exit and impairment charges 22,539 47,455 • Merger and Acquisition - related costs - 3,642 • Stock - based compensation expense 566 217 • Restructuring - related costs 26,500 9,657 • Inventory write - downs related to store closings 3,085 86 • Litigation and other contractual settlements (2,541) 2,000 • Gain on sale of assets, net (3,095) (5,899) • Loss on Bartell acquisition - 5,346 • Other 358 (131) Adjusted EBITDA $ 121,916 $ 154,793 Percent of revenues 2.00% 2.49%
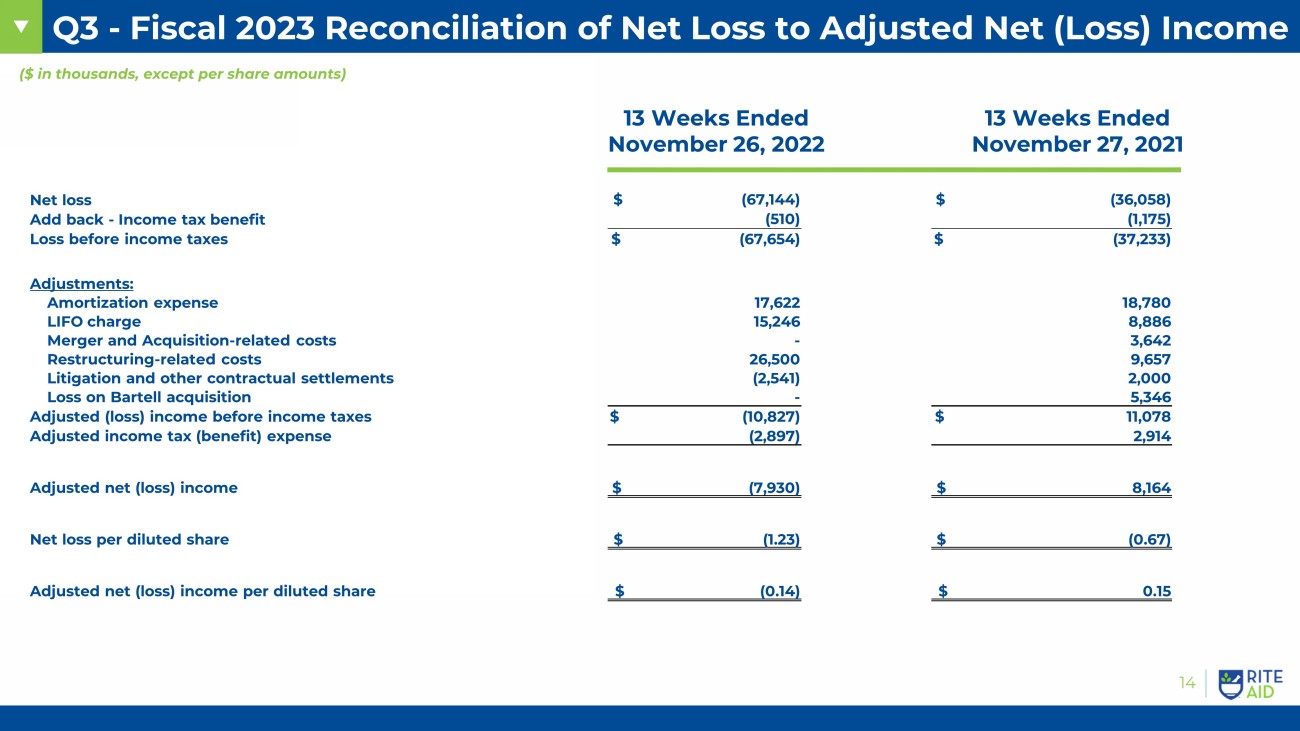
Q3 - Fiscal 2023 Reconciliation of Net Loss to Adjusted Net (Loss) Income Create Leverage Assets to Develop New Offering 14 ($ in thousands, except per share amounts) Net loss $ (67,144) $ (36 ,058) Add back - Income tax benefit (510) (1,175) Loss before income taxes $ (67,654) $ ( 37,233) Adjustments: Amortization expense 17,622 18,780 LIFO charge 15,246 8,886 Merger and Acquisition - related costs - 3,642 Restructuring - related costs 26,500 9,657 Litigation and other contractual settlements (2,541) 2,000 Loss on Bartell acquisition - 5,346 Adjusted (loss) income before income taxes $ ( 10 ,827) $ 11,078 Adjusted income tax (benefit) expense (2,897) 2,914 Adjusted net (loss) income $ (7,930) $ 8,164 Net loss per diluted share $ (1.23) $ (0.67) Adjusted net (loss) income per diluted share $ (0 .14) $ 0.15 13 Weeks Ended November 26, 2022 13 Weeks Ended November 27, 2021
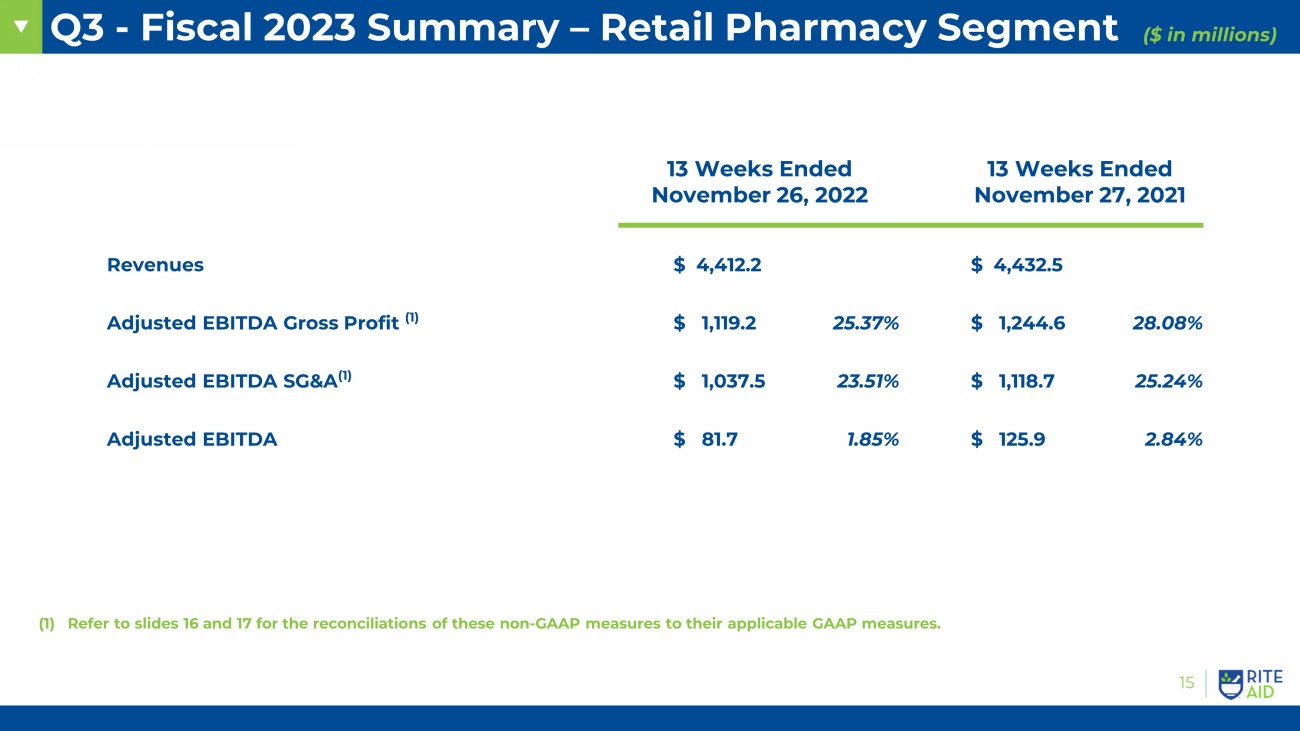
Q3 - Fiscal 2023 Summary – Retail Pharmacy Segment Create Leverage Assets to Develop New Offering 15 ($ in millions) Revenues $ 4,412.2 $ 4,432.5 Adjusted EBITDA Gross Profit (1) $ 1,119.2 25.37% $ 1,244.6 28.08% Adjusted EBITDA SG&A (1) $ 1,037.5 23.51% $ 1,118.7 25.24% Adjusted EBITDA $ 81.7 1.85% $ 125.9 2.84% (1) Refer to slides 16 and 17 for the reconciliations of these non - GAAP measures to their applicable GAAP measures. 13 Weeks Ended November 26, 2022 13 Weeks Ended November 27, 2021
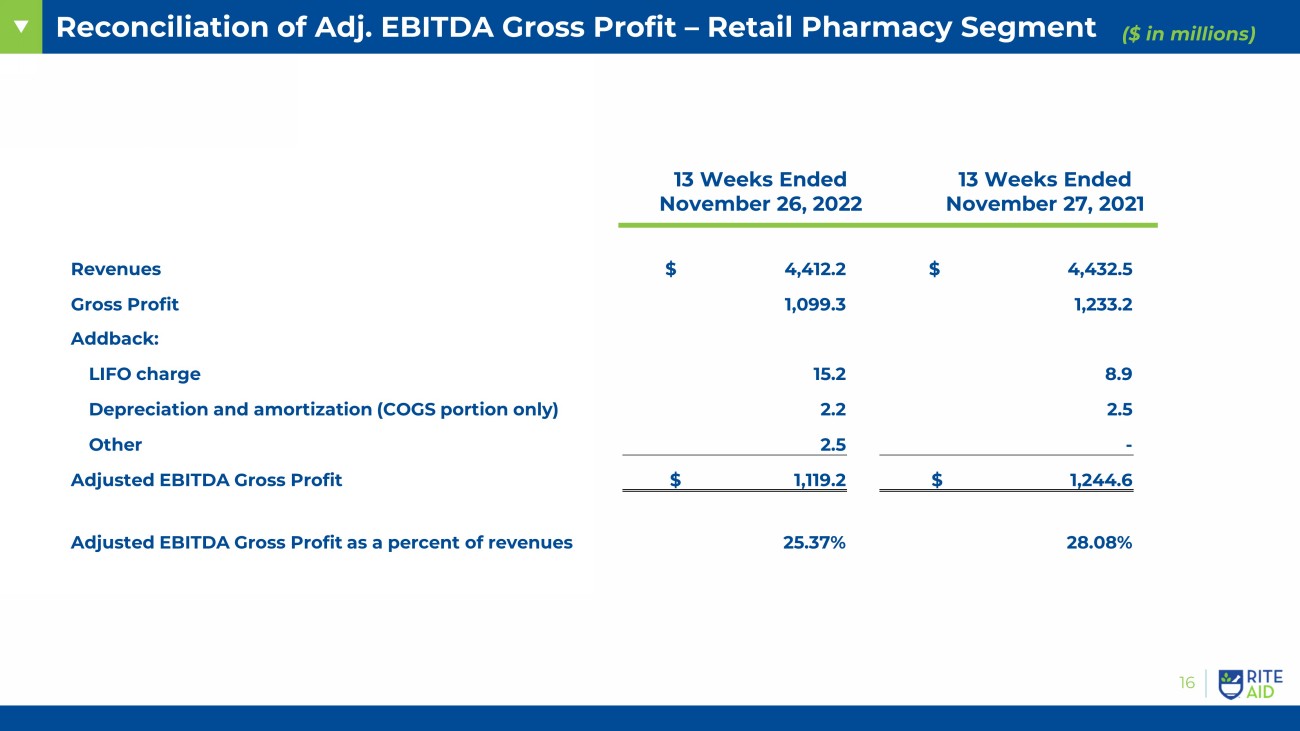
Reconciliation of Adj. EBITDA Gross Profit – Retail Pharmacy Segment Create Leverage Assets to Develop New Offering 16 ($ in millions) 13 Weeks Ended November 26, 2022 13 Weeks Ended November 27, 2021 Revenues $ 4,412.2 $ 4,432.5 Gross Profit 1,099.3 1,233.2 Addback: LIFO charge 15.2 8.9 Depreciation and amortization (COGS portion only) 2.2 2.5 Other 2.5 - Adjusted EBITDA Gross Profit $ 1,119.2 $ 1,244.6 Adjusted EBITDA Gross Profit as a percent of revenues 25.37% 28.08%
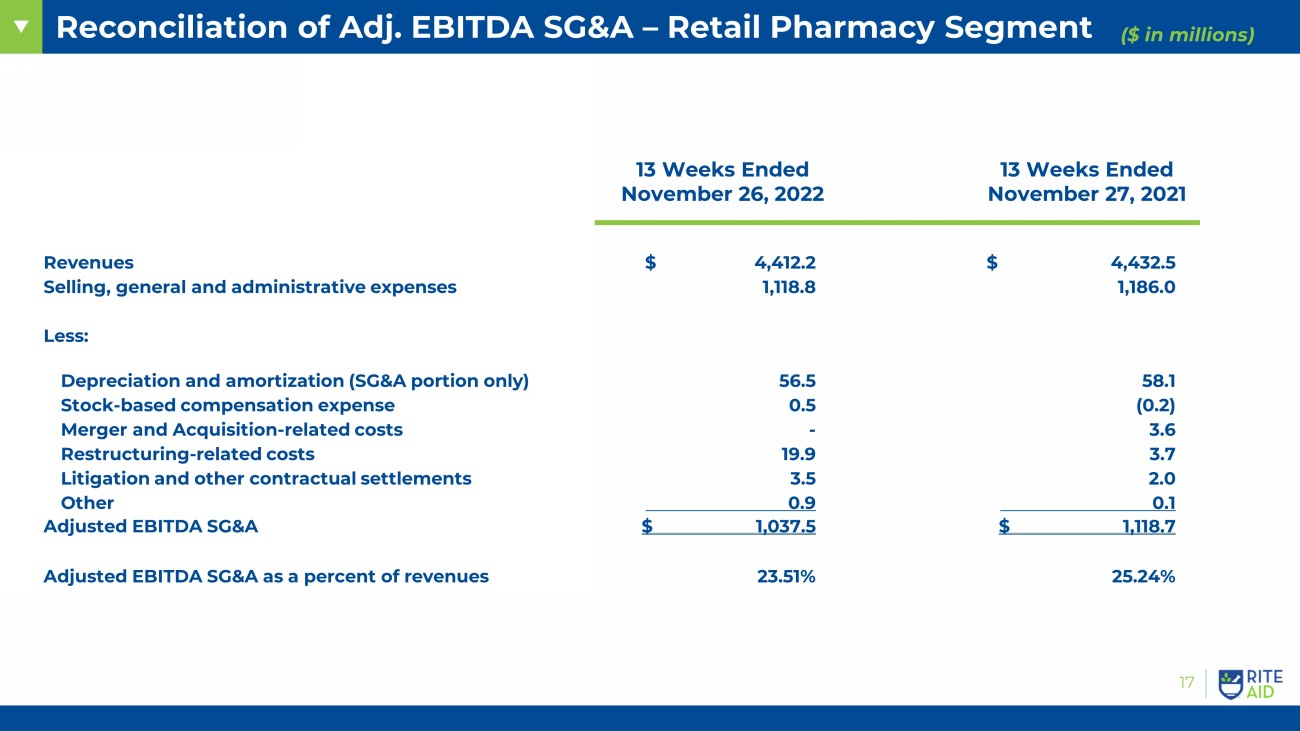
Reconciliation of Adj. EBITDA SG&A – Retail Pharmacy Segment Create Leverage Assets to Develop New Offering 17 ($ in millions) 13 Weeks Ended November 26, 2022 13 Weeks Ended November 27 , 2021 Revenues $ 4,412.2 $ 4,432.5 Selling, general and administrative expenses 1,118.8 1,186.0 Less: Depreciation and amortization (SG&A portion only) 56.5 58 .1 Stock - based compensation expense 0.5 (0.2) Merger and Acquisition - related costs - 3.6 Restructuring - related costs 19 .9 3.7 Litigation and other contractual settlements 3.5 2.0 Other 0.9 0.1 Adjusted EBITDA SG&A $ 1,037.5 $ 1,118.7 Adjusted EBITDA SG&A as a percent of revenues 23.51% 25.24%
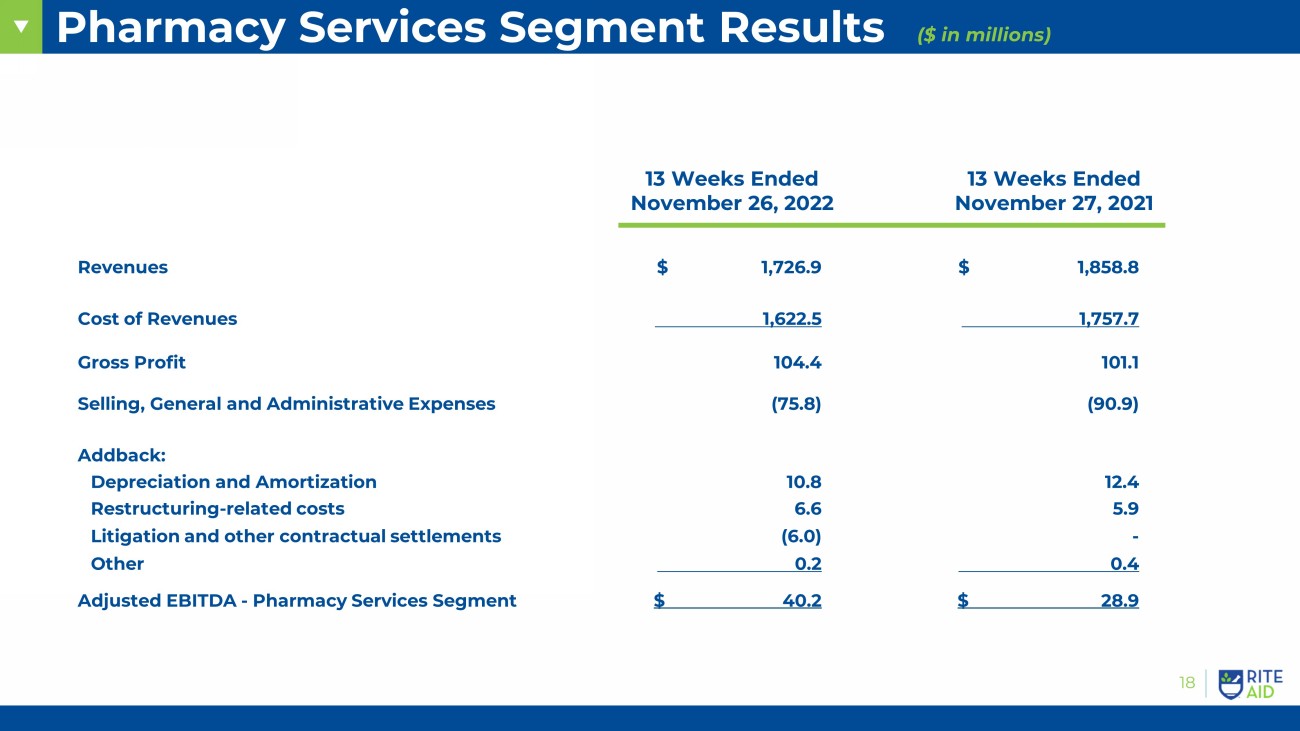
Pharmacy Services Segment Results 18 ($ in millions) Revenues $ 1,726.9 $ 1,858.8 Cost of Revenues 1,622.5 1,757.7 Gross Profit 104 .4 101.1 Selling, General and Administrative Expenses (75.8) (90.9) Addback: Depreciation and Amortization 10.8 12.4 Restructuring - related costs 6.6 5.9 Litigation and other contractual settlements (6.0) - Other 0.2 0.4 Adjusted EBITDA - Pharmacy Services Segment $ 40.2 $ 28.9 13 Weeks Ended November 26, 2022 13 Weeks Ended November 27, 2021
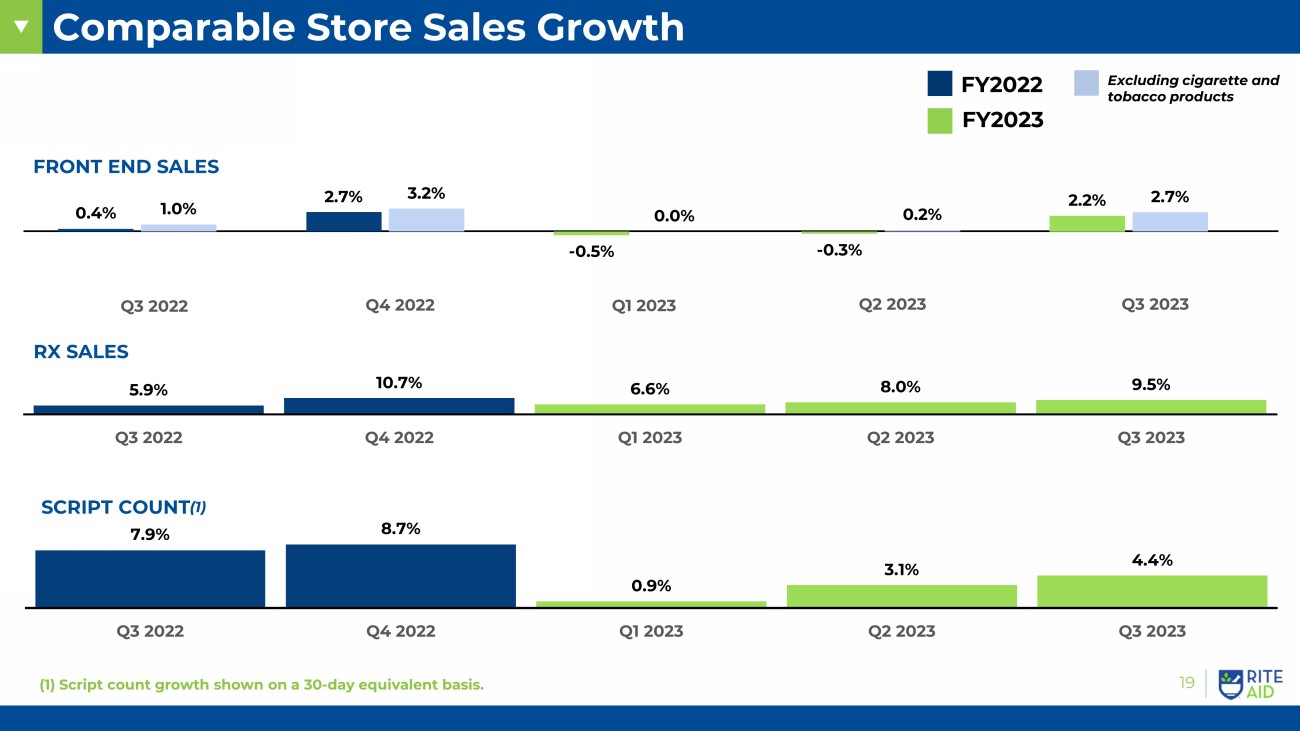
Comparable Store Sales Growth 10 Create Leverage Assets to Develop New Offering 19 FY2022 FY2023 Excluding cigarette and tobacco products Q3 2022 Q4 2022 Q1 2023 5.9% 10.7% 6.6% 8.0% 9.5% Q3 2022 Q4 2022 Q1 2023 Q2 2023 Q3 2023 RX SALES 0.4% 2.7% - 0.5% - 0.3% 2.2% 1.0% 3.2% 0.0% 0.2% 2.7% Q2 2023 FRONT END SALES Q3 2023 7.9% 8.7% 0.9% 3.1% 4.4% Q3 2022 Q4 2022 Q1 2023 Q2 2023 Q3 2023 SCRIPT COUNT (1) (1) Script count growth shown on a 30 - day equivalent basis.

Capitalization Table Create Leverage Assets to Develop New Offering 20 ($ in thousands) November 26, 2022 February 26, 2022 Secured Debt: Senior secured revolving credit facility due August 2026 1,335,044$ 690,990$ FILO Term Loan due August 2026 348,054 347,656 1,683,098 1,038,646 Second Lien Secured Debt: 7.5% senior secured notes due July 2025 480,780 593,176 8.0% senior secured notes due November 2026 837,830 835,521 1,318,610 1,428,697 Unguaranteed Unsecured Debt: 7.7% notes due February 2027 185,265 236,744 6.875% fixed-rate senior notes due December 2028 2,040 28,899 187,305 265,643 Lease financing obligations 19,077 20,374 Total debt 3,208,090 2,753,360 Current maturities of long-term debt and lease financing obligations (6,107) (5,544) Long-term debt and lease financing obligations, less current maturities 3,201,983$ 2,747,816$ Total debt, gross 3,241,790$ 2,795,679$ Less: Unamortized debt issuance costs (33,700) (42,319) Total Debt per balance sheet: 3,208,090$ 2,753,360$
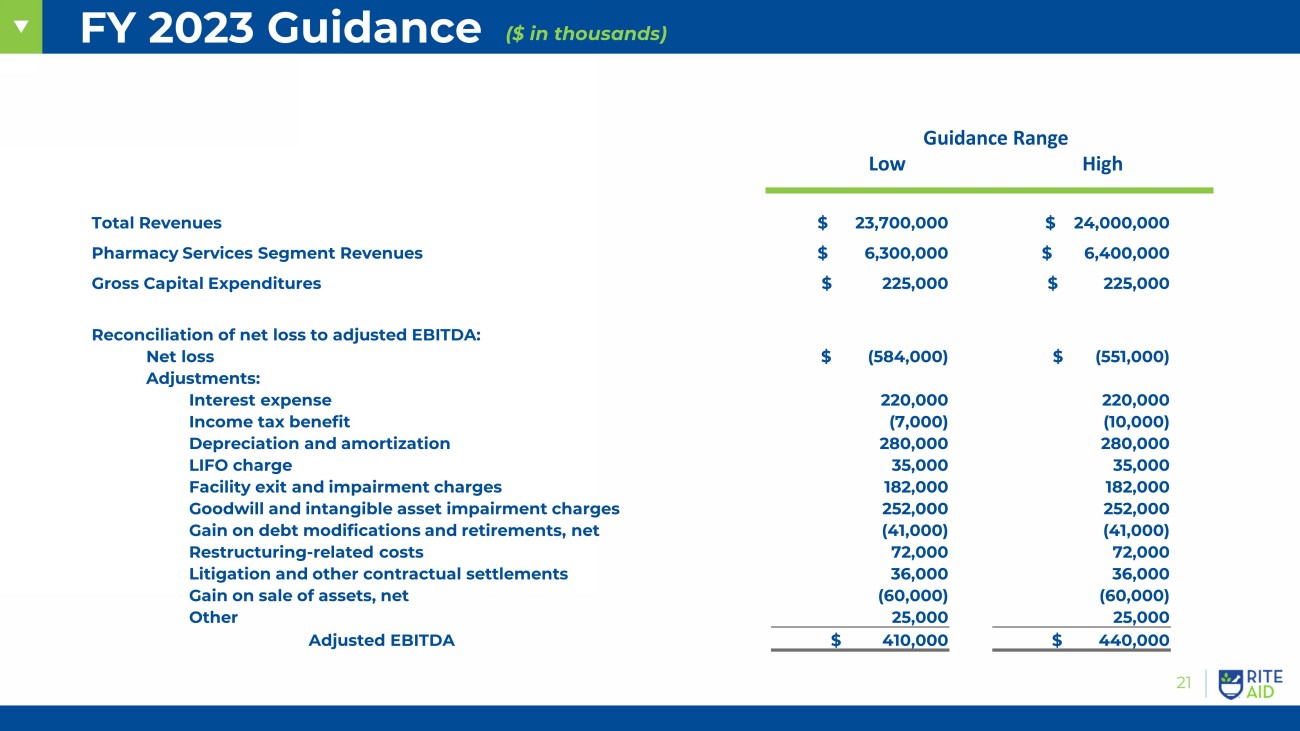
Expand Growth in New Markets 21 FY 2023 Guidance ($ in thousands) Total Revenues $ 23,700,000 $ 24,000,000 Pharmacy Services Segment Revenues $ 6,300,000 $ 6,400,000 Gross Capital Expenditures $ 225,000 $ 225,000 Reconciliation of net loss to adjusted EBITDA: Net loss $ (584,000) $ (551,000) Adjustments: Interest expense 220,000 220,000 Income tax benefit (7,000) (10,000) Depreciation and amortization 280,000 280,000 LIFO charge 35,000 35,000 Facility exit and impairment charges 182,000 182,000 Goodwill and intangible asset impairment charges 252,000 252,000 Gain on debt modifications and retirements, net (41,000) (41,000) Restructuring - related costs 72,000 72,000 Litigation and other contractual settlements 36,000 36,000 Gain on sale of assets, net (60,000) (60,000) Other 25,000 25,000 Adjusted EBITDA $ 410,000 $ 440,000 Guidance Range Low High
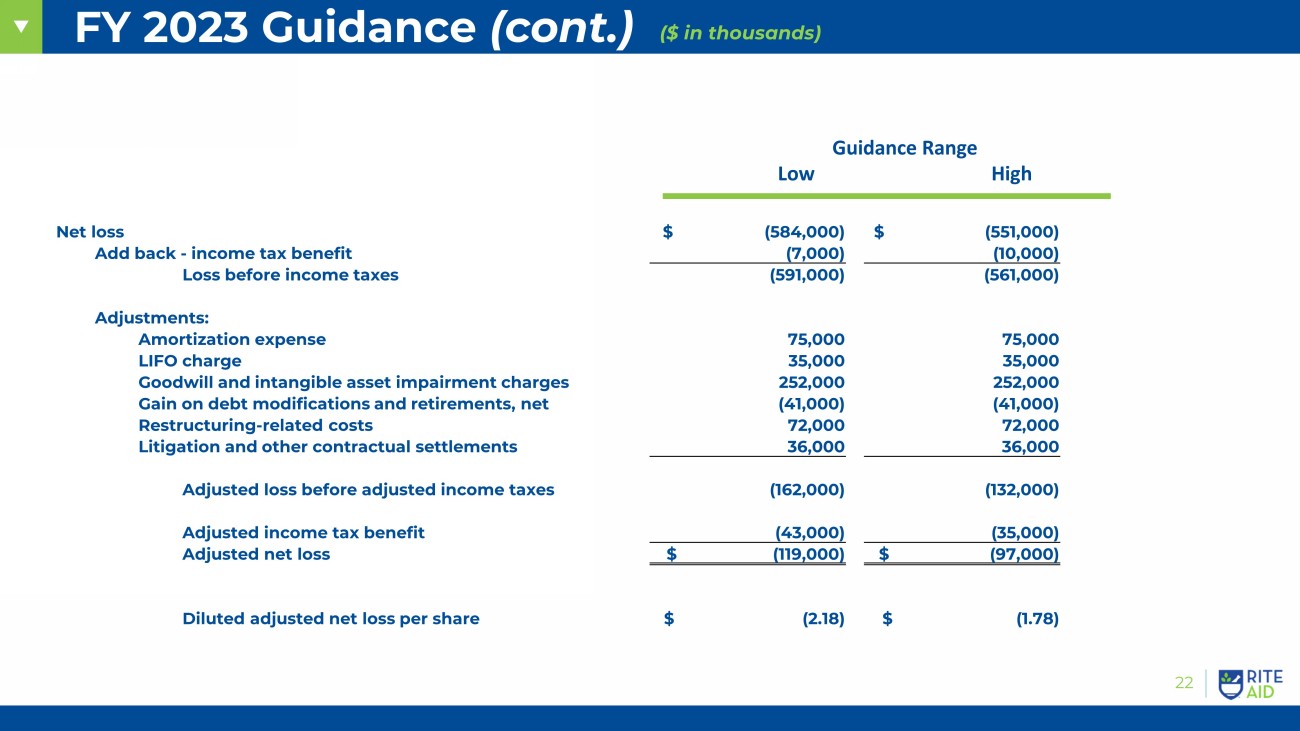
FY 2023 Guidance (cont.) Expand Growth in New Markets 22 FY 2023 Guidance ($ in thousands) Guidance Range Low High Net loss $ (584,000) $ (551,000) Add back - income tax benefit (7,000) (10,000) Loss before income taxes (591,000) (561,000) Adjustments: Amortization expense 75,000 75,000 LIFO charge 35,000 35,000 Goodwill and intangible asset impairment charges 252,000 252,000 Gain on debt modifications and retirements, net (41,000) (41,000) Restructuring - related costs 72,000 72,000 Litigation and other contractual settlements 36,000 36,000 Adjusted loss before adjusted income taxes (162,000) (132,000) Adjusted income tax benefit (43,000) (35,000) Adjusted net loss $ (119,000) $ (97,000) Diluted adjusted net loss per share $ (2.18) $ (1.78)