Exhibit 99.1
January 10, 2018
Statements in this presentation that are not historical, are forward - looking statements made pursuant to the safe harbor provisions of the Private Securities Litigation Reform Act of 1995 . Such statements include, but are not limited to, statements regarding the expected timing of the closing of the sale of remaining stores and assets to WBA ; the ability of the parties to complete the sale and related transactions considering the limited remaining closing conditions ; the outcome of legal and regulatory matters in connection with the sale of store and assets of Rite Aid to WBA ; the expected benefits of the transactions such as improved operations, growth potential, market profile and financial strength ; the competitive ability and position of Rite Aid following completion of the proposed transactions ; the ability of Rite Aid to implement new business strategies following the completion of the proposed transactions and any assumptions underlying any of the foregoing . Words such as “anticipate,” “believe,” “continue,” “could,” “estimate,” “expect,” “intend,” “may,” “plan,” “predict,” “project,” “should,” and “will” and variations of such words and similar expressions are intended to identify such forward - looking statements . These forward - looking statements are not guarantees of future performance and involve risks, assumptions and uncertainties, including, but not limited to, our high level of indebtedness and our ability to make interest and principal payments on our debt and satisfy the other covenants contained in our debt agreements ; general economic, industry, market, competitive, regulatory and political conditions ; our ability to improve the operating performance of our stores in accordance with our long term strategy ; the impact of private and public third - party payers continued reduction in prescription drug reimbursements and efforts to encourage mail order ; our ability to manage expenses and our investments in working capital ; outcomes of legal and regulatory matters ; changes in legislation or regulations, including healthcare reform ; our ability to achieve the benefits of our efforts to reduce the costs of our generic and other drugs ; risks related to the proposed asset sale transactions with Walgreens Boots Alliance, Inc . (WBA), including the possibility that the remaining transactions may not close, or the business of Rite Aid may suffer as a result of uncertainty surrounding the proposed transactions ; risks related to the ability to realize the anticipated benefits of the proposed transactions ; disruption from the proposed transaction making it more difficult to maintain business and operational relationships ; the effect of the pending sale on Rite Aid's business relationships (including, without limitation, customers and suppliers) operating results and business generally ; risks related to diverting management's or employees' attention from ongoing business operations ; the risk that Rite Aid's stock price may decline significantly if the remaining proposed transactions are not completed ; significant transaction costs ; unknown liabilities ; the risk of litigation and/or regulatory actions related to the proposed transactions ; potential changes to our strategy in the event the remaining proposed transactions do not close, which may include delaying or reducing capital or other expenditures, selling assets or other operations, attempting to restructure or refinance our debt, or seeking additional capital, and other business effects . These and other risks, assumptions and uncertainties are more fully described in Item 1 A (Risk Factors) of our most recent Annual Report on Form 10 - K, and in other documents that we file or furnish with the Securities and Exchange Commission, which you are encouraged to read . Should one or more of these risks or uncertainties materialize, or should underlying assumptions prove incorrect, actual results may vary materially from those indicated or anticipated by such forward - looking statements . Accordingly, you are cautioned not to place undue reliance on these forward - looking statements, which speak only as of the date they are made . Rite Aid expressly disclaims any current intention to update publicly any forward - looking statement after the distribution of this presentation, whether as a result of new information, future events, changes in assumptions or otherwise . Safe Harbor Statement 2
CAUTIONARY NOTE REGARDING PRO FORMA INFORMATION : The following presentation provides certain pro forma information regarding the impact of Rite Aid’s proposed sale of stores and assets to WBA on Rite Aid’s results of operations and capital structure . The pro forma information is for illustrative purposes only, was prepared by management in response to investor inquiries and is based upon a number of assumptions . The pro forma information assumes the completion of all the asset sales when they will actually take place over an extended period of time . Additional items that may require adjustments to the pro forma information may be identified and could result in material changes to the information contained herein . The information in this presentation is not necessarily indicative of what actual financial results of Rite Aid would have been had the sale occurred on the dates or for the periods indicated, nor does it purport to project the financial results of Rite Aid for any future periods or as of any date . Such pro forma information has not been prepared in conformity with Regulation S - X . Rite Aid’s independent auditors have not audited, reviewed, compiled or performed any procedures with respect to this preliminary financial information . Accordingly, they do not express an opinion or provide any form of assurance with respect thereto . The information in this presentation should not be viewed in replacement of results prepared in compliance with Generally Accepted Accounting Principles or any pro forma financial statements subsequently required by the rules and regulations of the Securities and Exchange Commission . Safe Harbor Statement 3
Non - GAAP Financial Measures The following presentation includes a non - GAAP financial measure, Adjusted EBITDA . Rite Aid defines Adjusted EBITDA as net income (loss) excluding the impact of income taxes, interest expense, depreciation and amortization, LIFO adjustments, charges or credits for facility closing and impairment, inventory write - downs related to store closings, debt retirements, the WBA merger termination fee, and other items (including stock - based compensation expense, merger and acquisition - related costs, severance and costs related to distribution center closures, gain or loss on sale of assets and revenue deferrals related to our customer loyalty program) . The presentation includes a reconciliation of Adjusted EBITDA to net income, which is the most directly comparable GAAP financial measure . Adjusted Net Income (Loss) and Adjusted Net Income (Loss) per Diluted Share exclude amortization of EnvisionRx intangible assets, merger and acquisition - related costs, loss on debt retirements, LIFO adjustments, and the WBA merger termination fee . 4
5
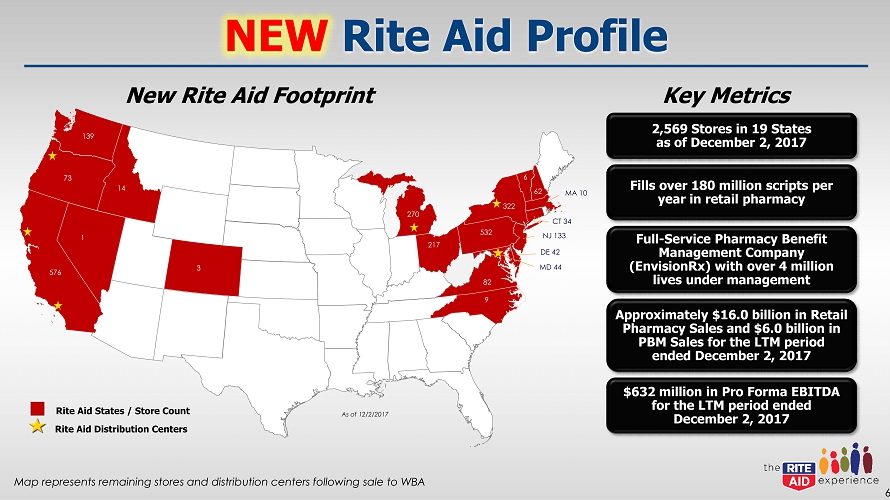
NEW Rite Aid Profile 6 Key Metrics 2,569 Stores in 19 States as of December 2, 2017 Full - Service Pharmacy Benefit Management Company (EnvisionRx) with over 4 million lives under management Fills over 180 million scripts per year in retail pharmacy Approximately $16.0 billion in Retail Pharmacy Sales and $6.0 billion in PBM Sales for the LTM period ended December 2, 2017 $632 million in Pro Forma EBITDA for the LTM period ended December 2, 2017 New Rite Aid Footprint Rite Aid States / Store Count Rite Aid Distribution Centers As of 12/2/2017 139 14 73 1 576 3 270 217 9 532 82 6 62 MA 10 CT 34 NJ 133 DE 42 . 322 MD 44 Map represents remaining stores and distribution centers following sale to WBA
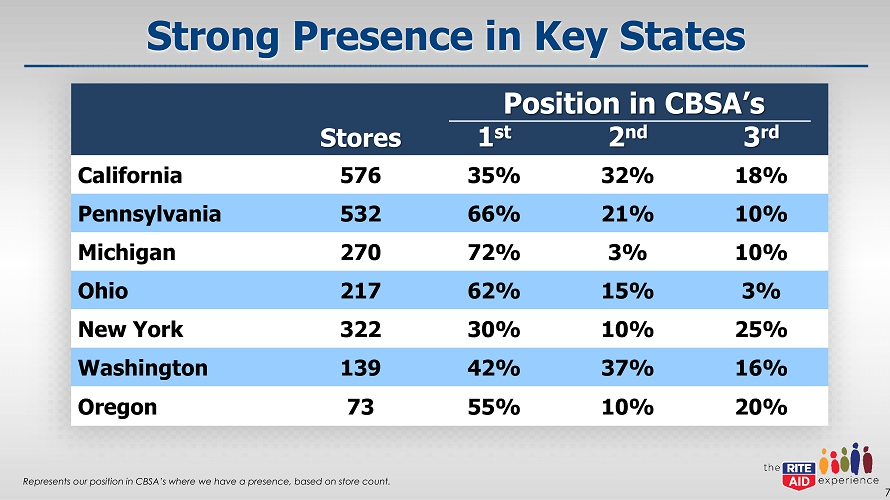
Strong Presence in Key States 7 Represents our position in CBSA’s where we have a presence, based on store count. Stores 1 st 2 nd 3 rd California 576 35% 32% 18% Pennsylvania 532 66% 21% 10% Michigan 270 72% 3% 10% Ohio 217 62% 15% 3% New York 322 30% 10% 25% Washington 139 42% 37% 16% Oregon 73 55% 10% 20% Position in CBSA’s
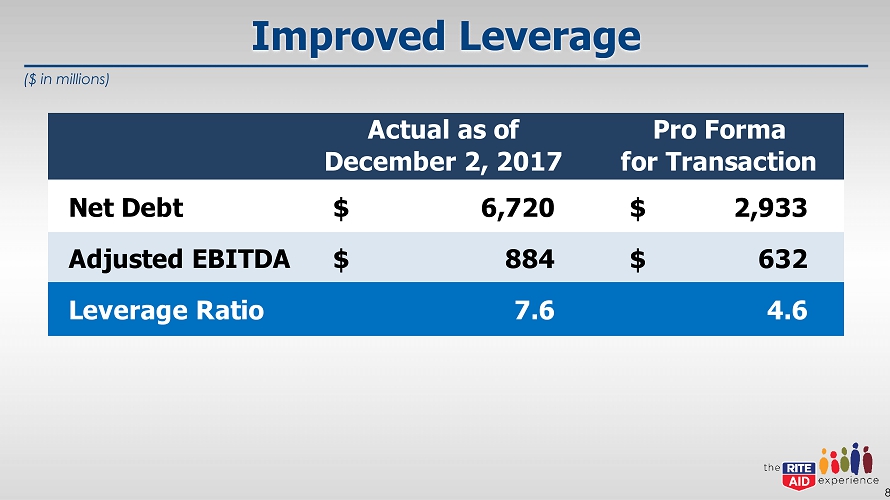
Improved Leverage 8 ($ in millions) Actual as of December 2, 2017 Pro Forma for Transaction Net Debt 6,720$ 2,933$ Adjusted EBITDA 884$ 632$ Leverage Ratio 7.6 4.6
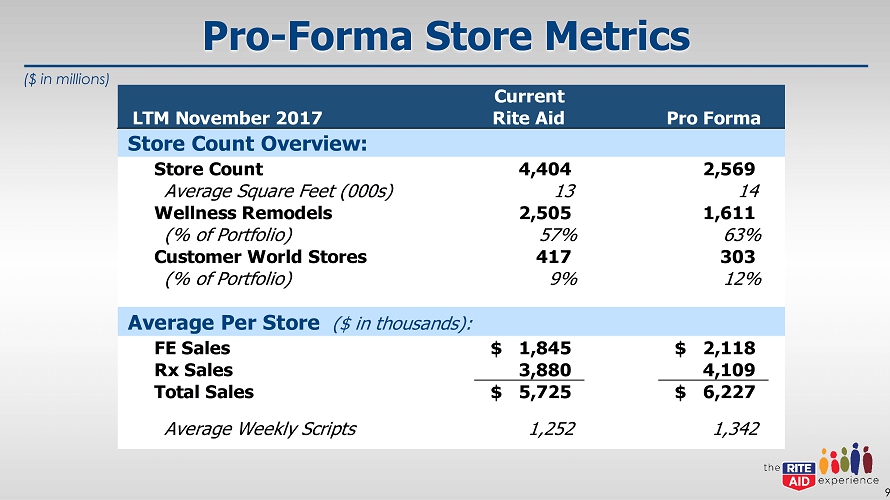
Pro - Forma Store Metrics 9 LTM November 2017 Current Rite Aid Pro Forma Store Count Overview: Store Count 4,404 2,569 Average Square Feet (000s) 13 14 Wellness Remodels 2,505 1,611 (% of Portfolio) 57% 63% Customer World Stores 417 303 (% of Portfolio) 9% 12% Average Per Store ($ in thousands): FE Sales 1,845$ 2,118$ Rx Sales 3,880 4,109 Total Sales 5,725$ 6,227$ Average Weekly Scripts 1,252 1,342 ($ in millions)
10
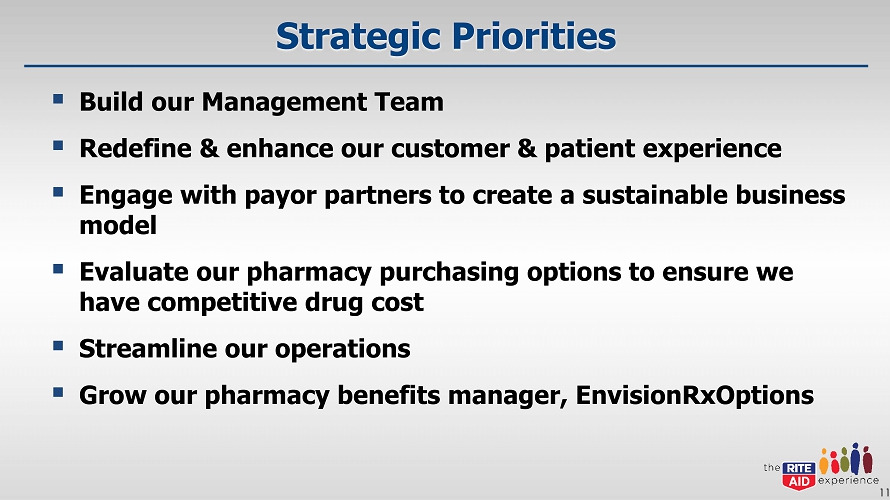
Strategic Priorities ▪ Build our Management Team ▪ Redefine & enhance our customer & patient experience ▪ Engage with payor partners to create a sustainable business model ▪ Evaluate our pharmacy purchasing options to ensure we have competitive drug cost ▪ Streamline our operations ▪ Grow our pharmacy benefits manager, EnvisionRxOptions 11
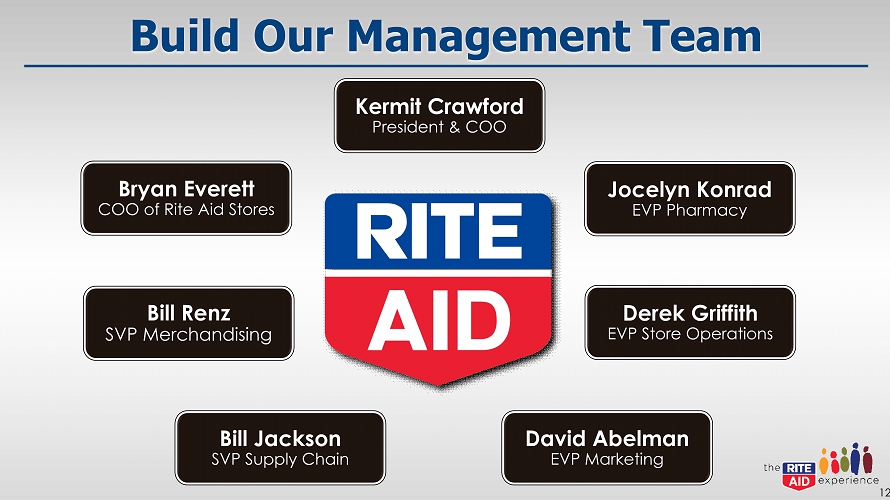
Build Our Management Team 12 Kermit Crawford President & COO Jocelyn Konrad EVP Pharmacy Derek Griffith EVP Store Operations David Abelman EVP Marketing Bill Jackson SVP Supply Chain Bill Renz SVP Merchandising Bryan Everett COO of Rite Aid Stores
Redefine & Enhance Customer & Patient Experience ▪ Immunizations ▪ Wellness Stores ▪ Wellness+ Loyalty Program ▪ Localized Product Assortment ▪ Private Brand ▪ Omni - Channel 13
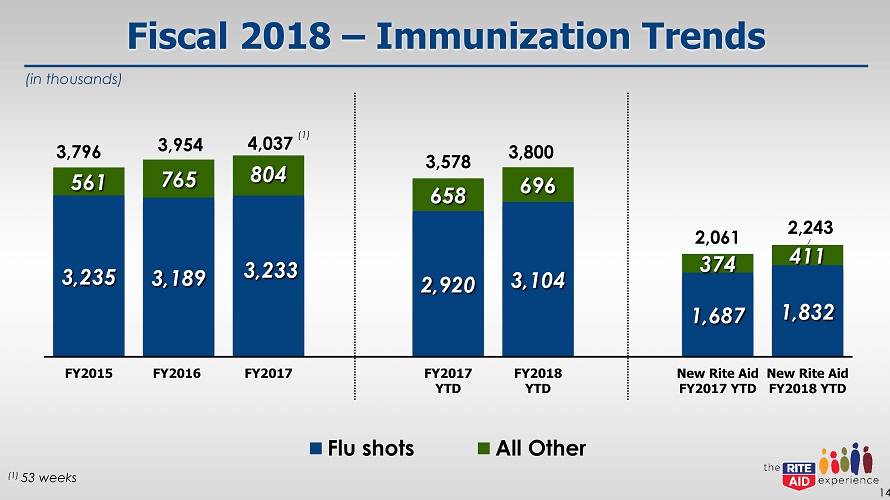
Fiscal 2018 – Immunization Trends 14 3,235 3,189 3,233 2,920 3,104 1,687 1,832 561 765 804 658 696 374 411 3,796 3,954 4,037 3,578 3,800 2,061 2,243 FY2015 FY2016 FY2017 FY2017 YTD FY2018 YTD New Rite Aid FY2017 YTD New Rite Aid FY2018 YTD Flu shots All Other (1) 53 weeks (in thousands) (1)
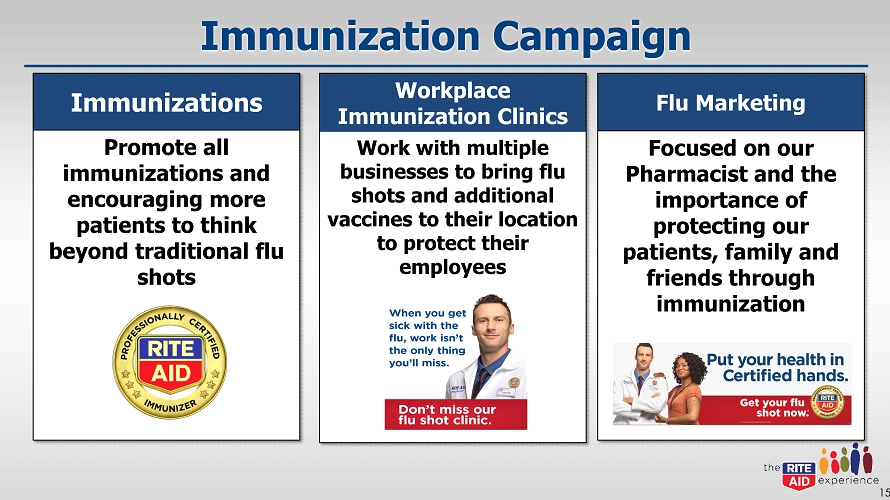
Immunization Campaign 15 Immunizations Promote all immunizations and encouraging more patients to think beyond traditional flu shots Workplace Immunization Clinics Work with multiple businesses to bring flu shots and additional vaccines to their location to protect their employees Flu Marketing Focused on our Pharmacist and the importance of protecting our patients, family and friends through immunization

Wellness Store Renovations ▪ Comp results for Wellness stores continue to exceed the chain average (1) − Front - end sales growth outperformance of 176 bps in Q3 Fiscal 2018 − Script count growth outperformance of 246 bps in Q3 of Fiscal 2018 ▪ Remodeled Stores Since 2012 (2) : 16 (1) Calculation compares the comp results of Wellness stores remodeled in the last 24 months to the remainder of the chain. (2) Shows remodels in stores that will be with Rite Aid post asset sale. (3) As of the Quarter ended December 2, 2017. 280 533 816 1,079 1,345 1,535 1,610 FY 2012 FY 2013 FY 2014 FY 2015 FY 2016 FY 2017 FY 2018 YTD (3)
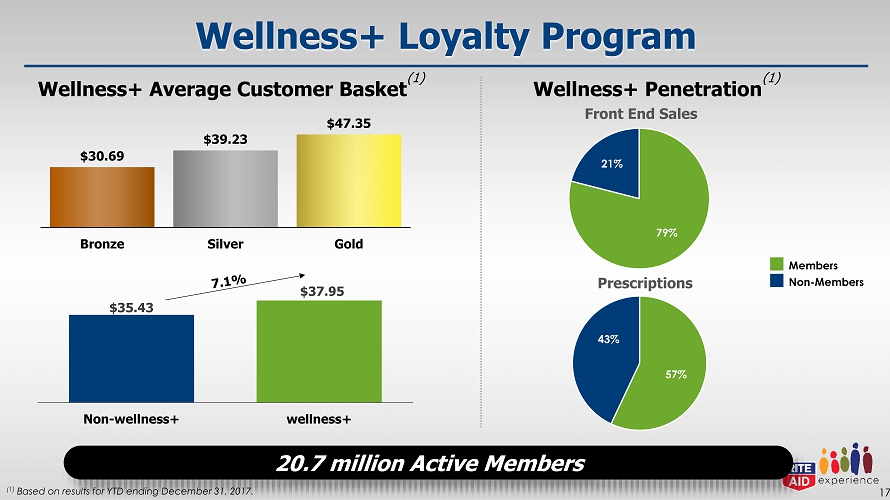
Wellness+ Loyalty Program 17 $30.69 $39.23 $47.35 Bronze Silver Gold Wellness+ Penetration (1) Wellness+ Average Customer Basket (1) 79% 21% Front End Sales 57% 43% Prescriptions Members Non - Members $35.43 $37.95 Non-wellness+ wellness+ (1) Based on results for YTD ending December 31, 2017. 20.7 million Active Members
Localized Product Assortment ▪ Being relevant and local will be a key differentiator for the new Rite Aid − Appropriate ethnic assortment to match core demographic − Consumables, beauty, and seasonal ▪ Product assortment that resonates with local community − Consumables and apparel − Expanded DME in select communities ▪ Localized Instore Marketing and Team − Relevant ISM elements/graphics, especially in beauty categories − Second language navigation, signing, etc. − Associates that represent and understand the local community 18
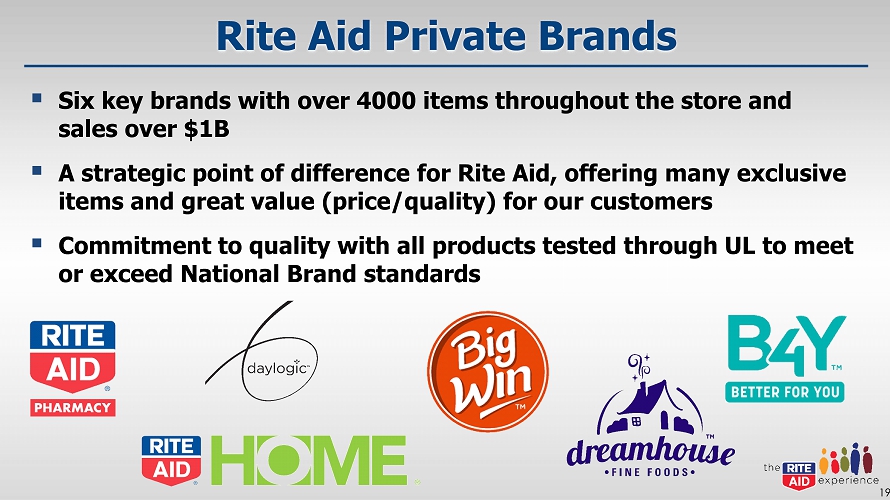
Rite Aid Private Brands ▪ Six key brands with over 4000 items throughout the store and sales over $1B ▪ A strategic point of difference for Rite Aid, offering many exclusive items and great value (price/quality) for our customers ▪ Commitment to quality with all products tested through UL to meet or exceed National Brand standards 19
Omni - Channel ▪ Wellness+ loyalty program has enabled us to personalize communications, enhancing reach, frequency, and relevancy − Over 20M active members − Personalized offers and content in email and direct mail − Mobile app usage continues to grow ▪ Recent enhancements have led to 4.7/5.0 rating in iOS/Apple app store − Increased engagement in Pharmacy services features including prescription refills − Our circular reach has transitioned, and is balanced between print and digital ▪ On - line marketing is targeted and segmented based on our loyalty data and use of machine learning technology partners/platforms 20
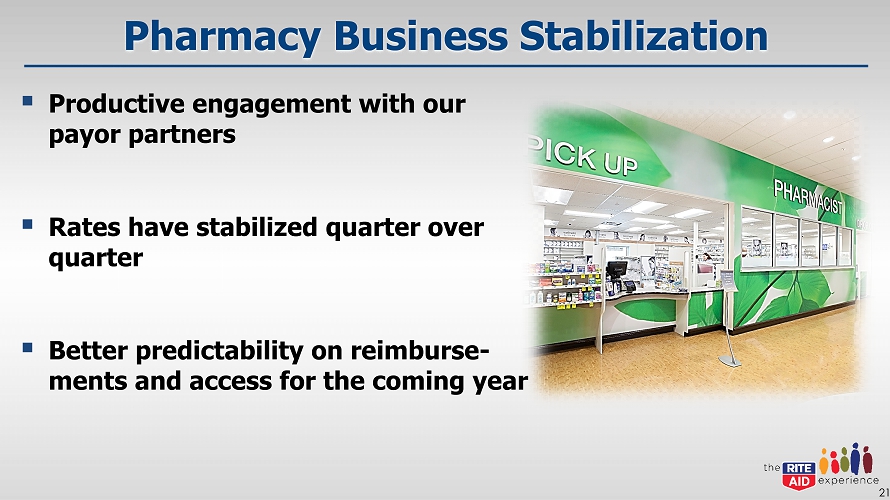
Pharmacy Business Stabilization ▪ Productive engagement with our payor partners ▪ Rates have stabilized quarter over quarter ▪ Better predictability on reimburse - ments and access for the coming year 21
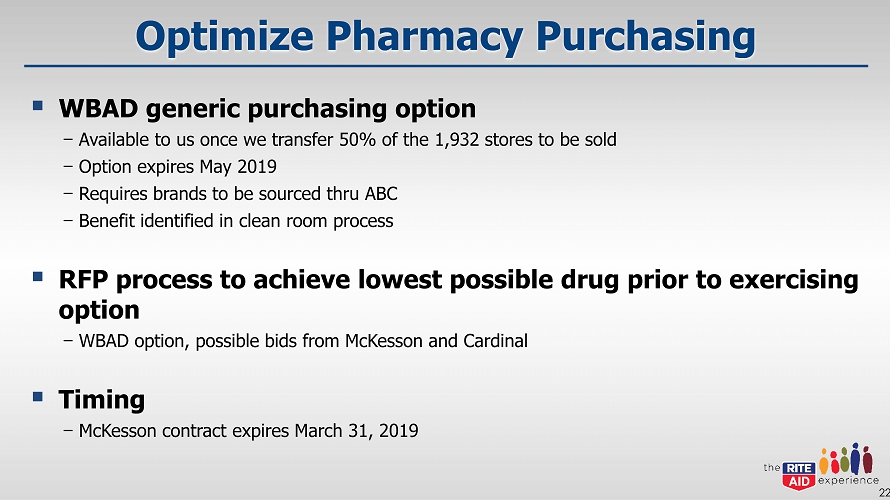
Optimize Pharmacy Purchasing ▪ WBAD generic purchasing option − Available to us once we transfer 50% of the 1,932 stores to be sold − Option expires May 2019 − Requires brands to be sourced thru ABC − Benefit identified in clean room process ▪ RFP process to achieve lowest possible drug prior to exercising option − WBAD option, possible bids from McKesson and Cardinal ▪ Timing − McKesson contract expires March 31, 2019 22
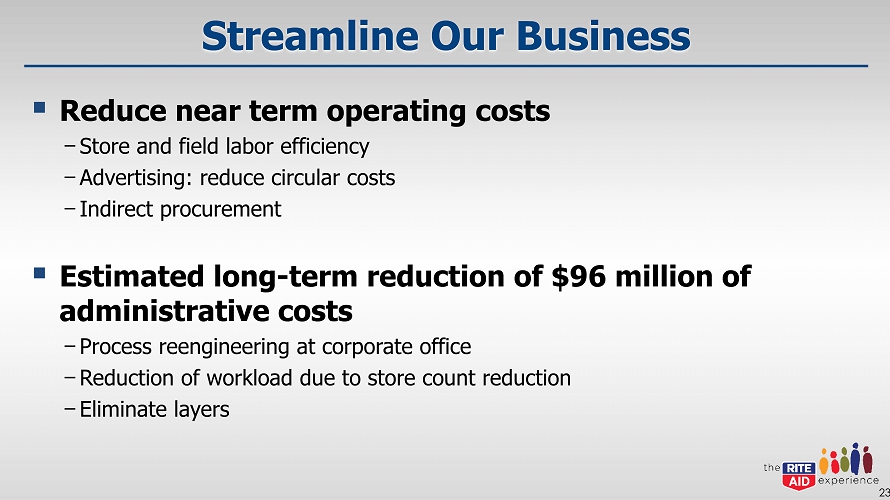
Streamline Our Business ▪ Reduce near term operating costs − Store and field labor efficiency − Advertising: reduce circular costs − Indirect procurement ▪ Estimated long - term reduction of $96 million of administrative costs − Process reengineering at corporate office − Reduction of workload due to store count reduction − Eliminate layers 23
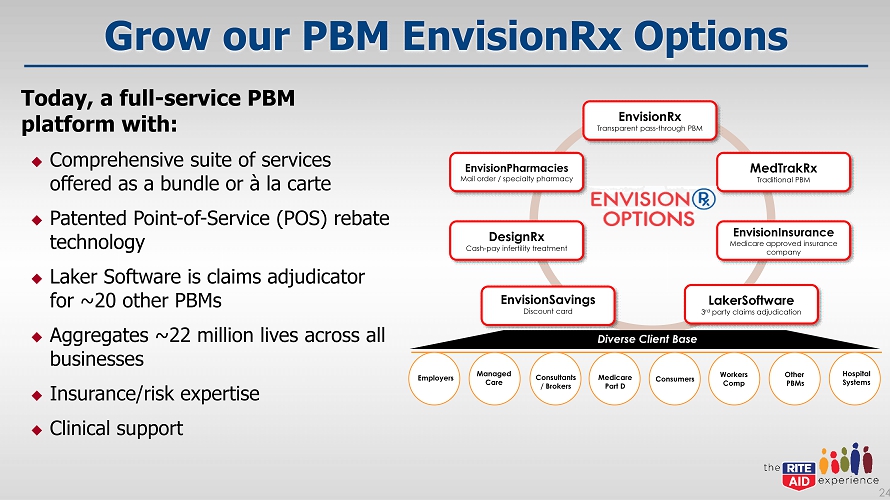
Grow our PBM EnvisionRx Options Today, a full - service PBM platform with: ; Comprehensive suite of services offered as a bundle or à la carte ; Patented Point - of - Service (POS) rebate technology ; Laker Software is claims adjudicator for ~20 other PBMs ; Aggregates ~22 million lives across all businesses ; Insurance/risk expertise ; Clinical support 24 MedTrakRx Traditional PBM EnvisionInsurance Medicare approved insurance company LakerSoftware 3 rd party claims adjudication EnvisionSavings Discount card EnvisionPharmacies Mail order / specialty pharmacy EnvisionRx Transparent pass - through PBM DesignRx Cash - pay infertility treatment Diverse Client Base Employers Managed Care Consultants / Brokers Medicare Part D Consumers Workers Comp Other PBMs Hospital Systems
Envision Specialty Pharmacy ▪ Injectable, infused, oral, blood, and inhaled biologic products ▪ Limited distribution drug access ▪ Specialty therapy programs to drive adherence and improve patient outcomes ▪ Cost saving programs that focus on waste reduction ▪ Medical specialty programs that address additional drug saving opportunities ▪ Approximately 5,000 active specialty patients 25
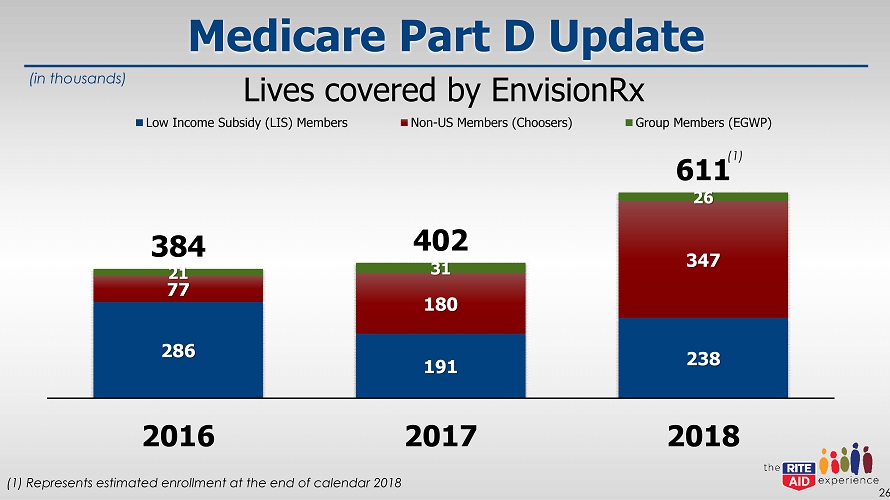
Medicare Part D Update 286 191 238 77 180 347 21 31 26 384 402 611 2016 2017 2018 Low Income Subsidy (LIS) Members Non-US Members (Choosers) Group Members (EGWP) 26 (in thousands) Lives covered by EnvisionRx (1) (1) Represents estimated enrollment at the end of calendar 2018
27
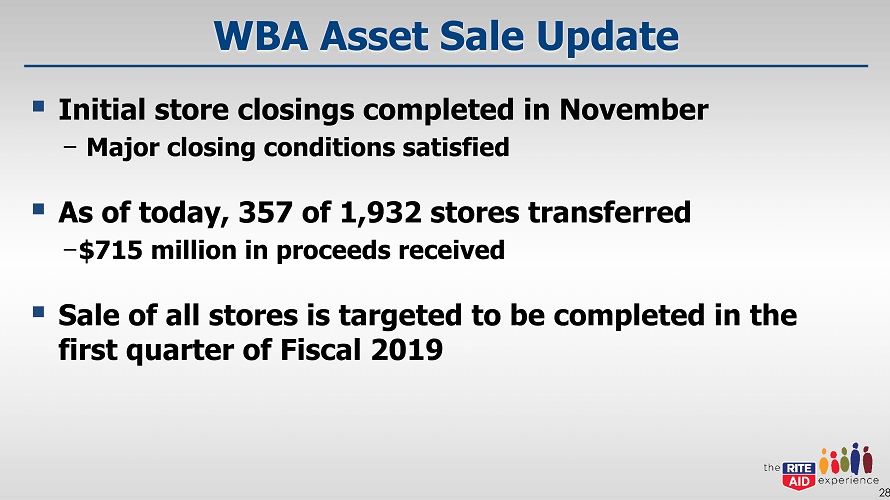
WBA Asset Sale Update ▪ Initial store closings completed in November − Major closing conditions satisfied ▪ As of today, 357 of 1,932 stores transferred − $715 million in proceeds received ▪ Sale of all stores is targeted to be completed in the first quarter of Fiscal 2019 28

Pro - Forma Sources & Uses 29 (1) Based on net liability balances as of December 2, 2017. (2) Based on the expected ability as of the date hereof to use the company’s current federal and state tax net operating loss car ryf orwards, and assumes no change in control for purposes of Section 382 under the Internal Revenue Code occurs prior to the closing of the transaction. Sources Estimated Purchase Price 4,375$ Total Sources 4,375$ Uses Estimated Accrued Liabilities (Net of Retained Assets) (1) 200$ Estimated Restructuring Charges and Transaction Costs 65 Estimated Income Tax Expense on Sale of Assets (2) 85 Estimated Debt Repayments 4,025 Total Uses 4,375$ Pro Forma EBITDA - LTM Ended December 2, 2017 632$ ($ in millions)
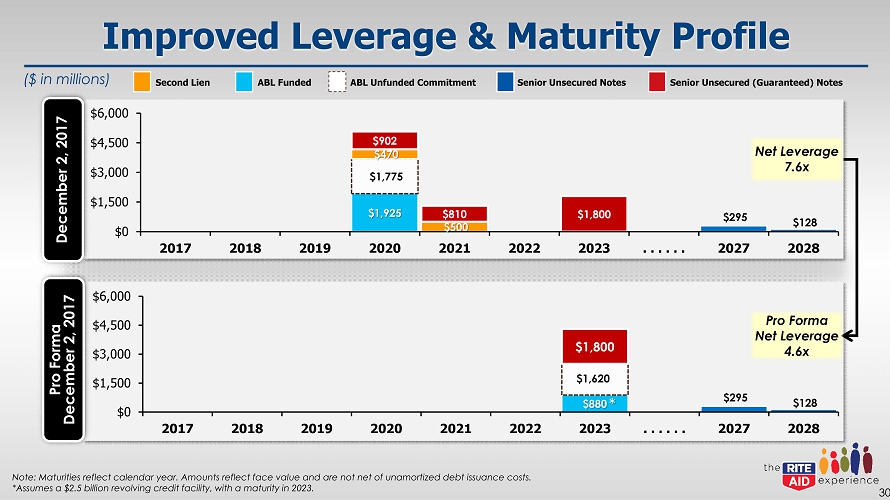
$880 $1,620 $295 $128 $1,800 $0 $1,500 $3,000 $4,500 $6,000 2017 2018 2019 2020 2021 2022 2023 . . . . . . 2027 2028 Improved Leverage & Maturity Profile 30 Note: Maturities reflect calendar year. Amounts reflect face value and are not net of unamortized debt issuance costs. *Assumes a $2.5 billion revolving credit facility, with a maturity in 2023. $1,925 $1,775 $295 $128 $470 $500 $902 $810 $1,800 $0 $1,500 $3,000 $4,500 $6,000 2017 2018 2019 2020 2021 2022 2023 . . . . . . 2027 2028 December 2, 2017 Pro Forma December 2, 2017 Net Leverage 7.6x Pro Forma Net Leverage 4.6x Second Lien ABL Funded ABL Unfunded Commitment Senior Unsecured Notes Senior Unsec ured (Guaranteed) Notes * ($ in millions)
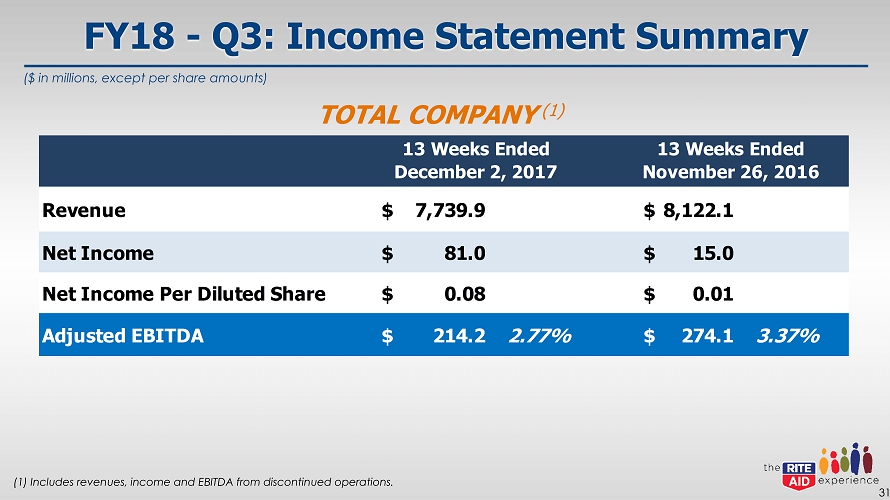
FY18 - Q3: Income Statement Summary 31 (1) Includes revenues, income and EBITDA from discontinued operations. TOTAL COMPANY (1) Revenue 7,739.9$ 8,122.1$ Net Income 81.0$ 15.0$ Net Income Per Diluted Share 0.08$ 0.01$ Adjusted EBITDA 214.2$ 2.77% 274.1$ 3.37% 13 Weeks Ended December 2, 2017 13 Weeks Ended November 26, 2016 ($ in millions, except per share amounts)
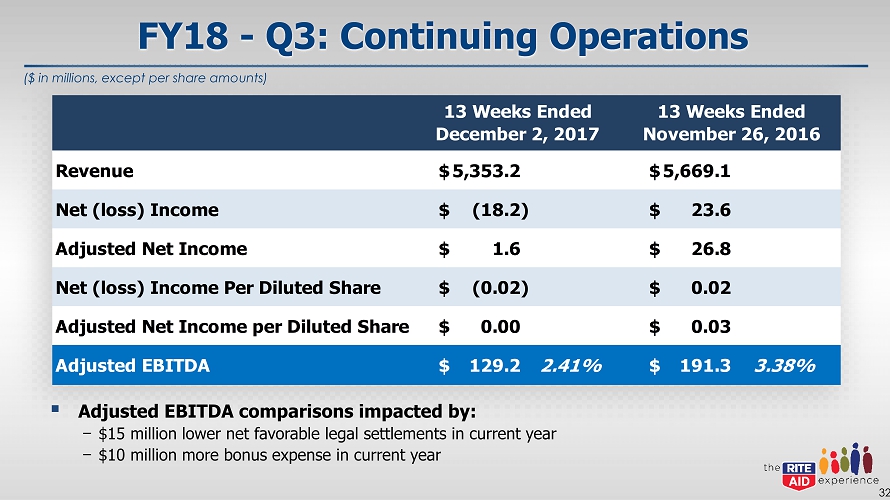
FY18 - Q3: Continuing Operations 32 Revenue 5,353.2$ 5,669.1$ Net (loss) Income (18.2)$ 23.6$ Adjusted Net Income 1.6$ 26.8$ Net (loss) Income Per Diluted Share (0.02)$ 0.02$ Adjusted Net Income per Diluted Share 0.00$ 0.03$ Adjusted EBITDA 129.2$ 2.41% 191.3$ 3.38% 13 Weeks Ended December 2, 2017 13 Weeks Ended November 26, 2016 ▪ Adjusted EBITDA comparisons impacted by: − $15 million lower net favorable legal settlements in current year − $10 million more bonus expense in current year ($ in millions, except per share amounts)
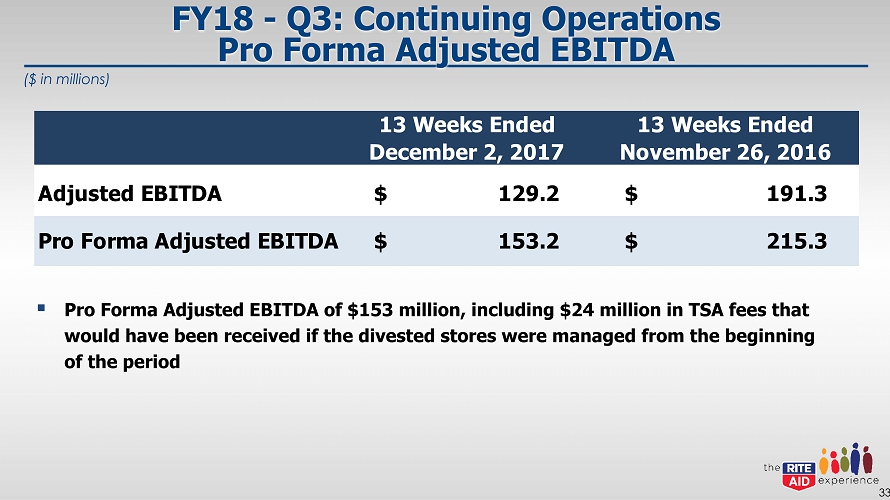
FY18 - Q3: Continuing Operations Pro Forma Adjusted EBITDA ▪ Pro Forma Adjusted EBITDA of $153 million, including $24 million in TSA fees that would have been received if the divested stores were managed from the beginning of the period 33 13 Weeks Ended December 2, 2017 13 Weeks Ended November 26, 2016 Adjusted EBITDA 129.2$ 191.3$ Pro Forma Adjusted EBITDA 153.2$ 215.3$ ($ in millions)
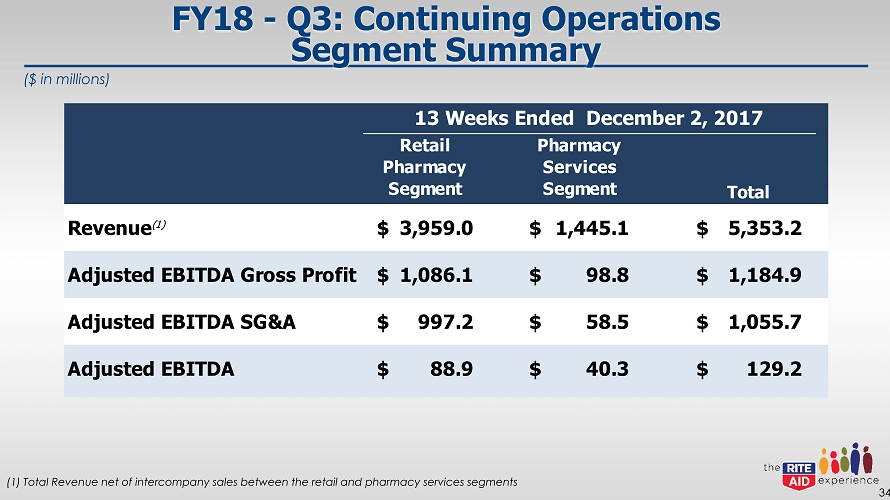
Retail Pharmacy Segment Pharmacy Services Segment Total Revenue (1) 3,959.0$ 1,445.1$ 5,353.2$ Adjusted EBITDA Gross Profit 1,086.1$ 98.8$ 1,184.9$ Adjusted EBITDA SG&A 997.2$ 58.5$ 1,055.7$ Adjusted EBITDA 88.9$ 40.3$ 129.2$ 13 Weeks Ended December 2, 2017 FY18 - Q3: Continuing Operations Segment Summary 34 (1) Total Revenue net of intercompany sales between the retail and pharmacy services segments ($ in millions)
35
36
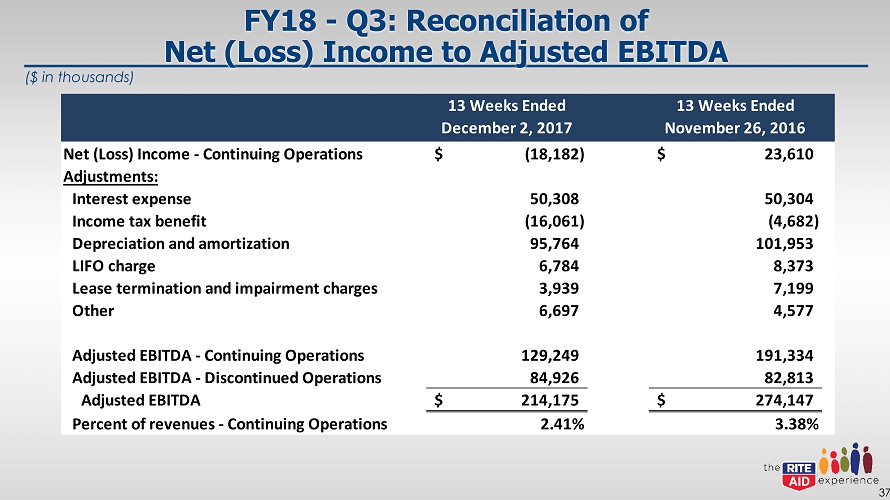
FY18 - Q3: Reconciliation of Net (Loss) Income to Adjusted EBITDA 37 ($ in thousands) 13 Weeks Ended December 2, 2017 13 Weeks Ended November 26, 2016 Net (Loss) Income - Continuing Operations (18,182)$ 23,610$ Adjustments: Interest expense 50,308 50,304 Income tax benefit (16,061) (4,682) Depreciation and amortization 95,764 101,953 LIFO charge 6,784 8,373 Lease termination and impairment charges 3,939 7,199 Other 6,697 4,577 Adjusted EBITDA - Continuing Operations 129,249 191,334 Adjusted EBITDA - Discontinued Operations 84,926 82,813 Adjusted EBITDA 214,175$ 274,147$ Percent of revenues - Continuing Operations 2.41% 3.38%
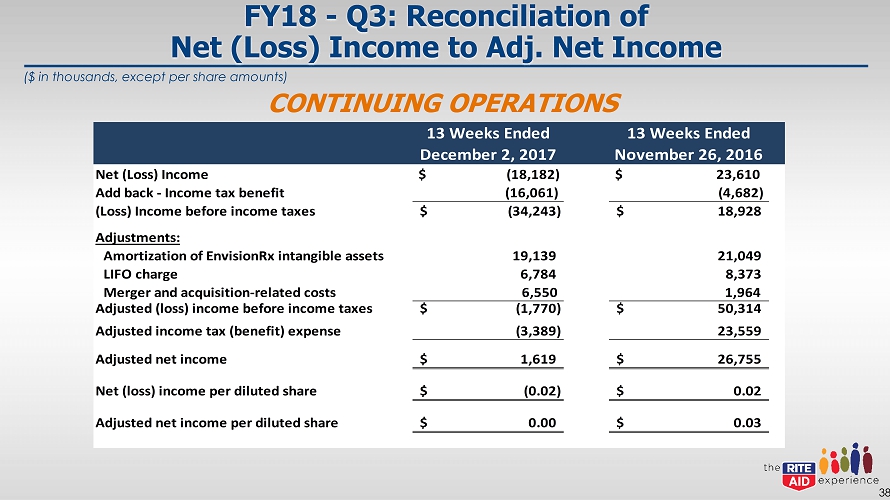
FY18 - Q3: Reconciliation of Net (Loss) Income to Adj. Net Income 38 ($ in thousands, except per share amounts) 13 Weeks Ended December 2, 2017 13 Weeks Ended November 26, 2016 Net (Loss) Income $ (18,182) $ 23,610 Add back - Income tax benefit (16,061) (4,682) (Loss) Income before income taxes (34,243)$ 18,928$ Adjustments: Amortization of EnvisionRx intangible assets 19,139 21,049 LIFO charge 6,784 8,373 Merger and acquisition-related costs 6,550 1,964 Adjusted (loss) income before income taxes (1,770)$ 50,314$ Adjusted income tax (benefit) expense (3,389) 23,559 Adjusted net income 1,619$ 26,755$ Net (loss) income per diluted share (0.02)$ 0.02$ Adjusted net income per diluted share 0.00$ 0.03$ CONTINUING OPERATIONS
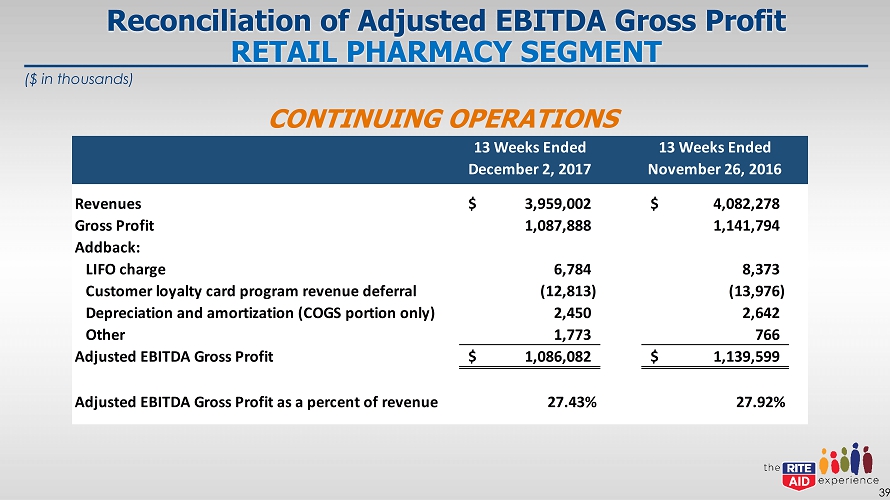
Reconciliation of Adjusted EBITDA Gross Profit RETAIL PHARMACY SEGMENT 39 ($ in thousands) 13 Weeks Ended December 2, 2017 13 Weeks Ended November 26, 2016 Revenues 3,959,002$ 4,082,278$ Gross Profit 1,087,888 1,141,794 Addback: LIFO charge 6,784 8,373 Customer loyalty card program revenue deferral (12,813) (13,976) Depreciation and amortization (COGS portion only) 2,450 2,642 Other 1,773 766 Adjusted EBITDA Gross Profit 1,086,082$ 1,139,599$ Adjusted EBITDA Gross Profit as a percent of revenue 27.43% 27.92% CONTINUING OPERATIONS

Reconciliation of Adjusted EBITDA SG&A RETAIL PHARMACY SEGMENT 40 13 Weeks Ended December 2, 2017 13 Weeks Ended November 26, 2016 Total Revenues 3,959,002$ 4,082,278$ Selling, general and administrative expenses 1,086,857 1,095,409 Less: Depreciation and amortization (SG&A portion only) 72,128 76,701 Stock based compensation expense 7,187 13,070 Other 10,345 4,954 Adjusted EBITDA SG&A 997,197$ 1,000,684$ Adjusted EBITDA SG&A as a percent of revenue 25.19% 24.51% CONTINUING OPERATIONS ($ in thousands)
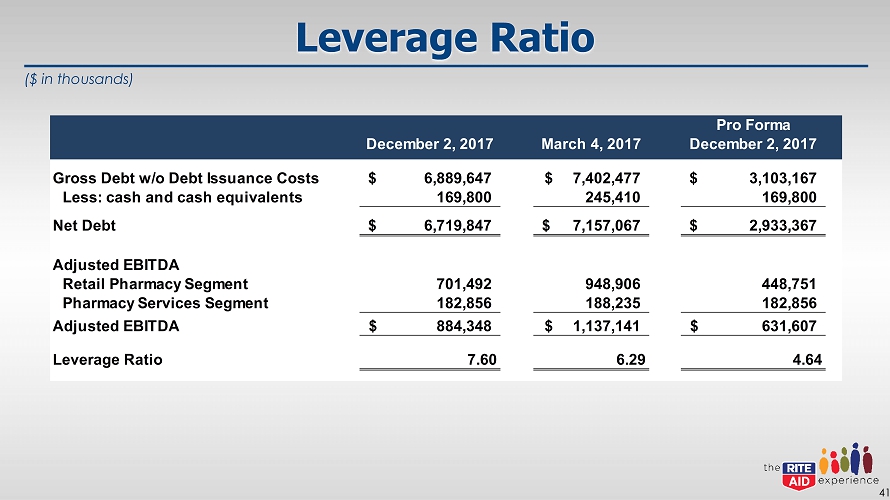
Leverage Ratio 41 Pro Forma December 2, 2017 March 4, 2017 December 2, 2017 Gross Debt w/o Debt Issuance Costs 6,889,647$ 7,402,477$ 3,103,167$ Less: cash and cash equivalents 169,800 245,410 169,800 Net Debt 6,719,847$ 7,157,067$ 2,933,367$ Adjusted EBITDA Retail Pharmacy Segment 701,492 948,906 448,751 Pharmacy Services Segment 182,856 188,235 182,856 Adjusted EBITDA 884,348$ 1,137,141$ 631,607$ Leverage Ratio 7.60 6.29 4.64 ($ in thousands)
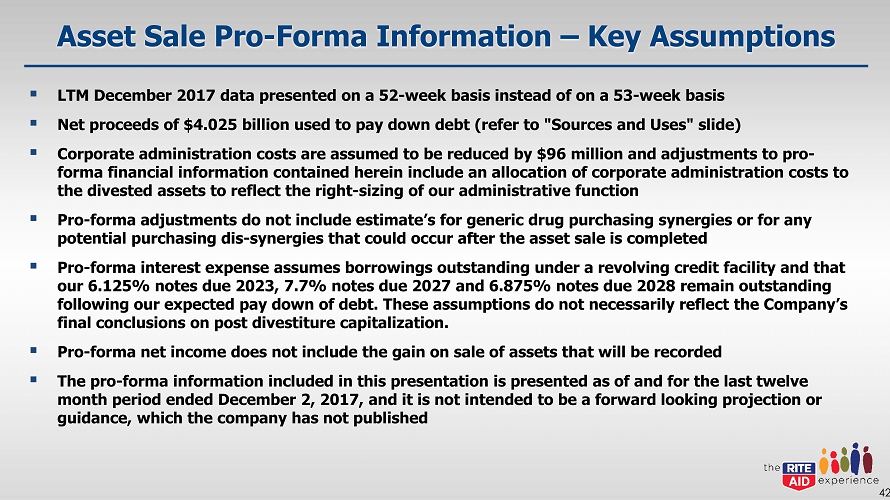
Asset Sale Pro - Forma Information – Key Assumptions ▪ LTM December 2017 data presented on a 52 - week basis instead of on a 53 - week basis ▪ Net proceeds of $4.025 billion used to pay down debt (refer to "Sources and Uses" slide) ▪ Corporate administration costs are assumed to be reduced by $96 million and adjustments to pro - forma financial information contained herein include an allocation of corporate administration costs to the divested assets to reflect the right - sizing of our administrative function ▪ Pro - forma adjustments do not include estimate’s for generic drug purchasing synergies or for any potential purchasing dis - synergies that could occur after the asset sale is completed ▪ Pro - forma interest expense assumes borrowings outstanding under a revolving credit facility and that our 6.125% notes due 2023, 7.7% notes due 2027 and 6.875% notes due 2028 remain outstanding following our expected pay down of debt. These assumptions do not necessarily reflect the Company’s final conclusions on post divestiture capitalization. ▪ Pro - forma net income does not include the gain on sale of assets that will be recorded ▪ The pro - forma information included in this presentation is presented as of and for the last twelve month period ended December 2, 2017, and it is not intended to be a forward looking projection or guidance, which the company has not published 42
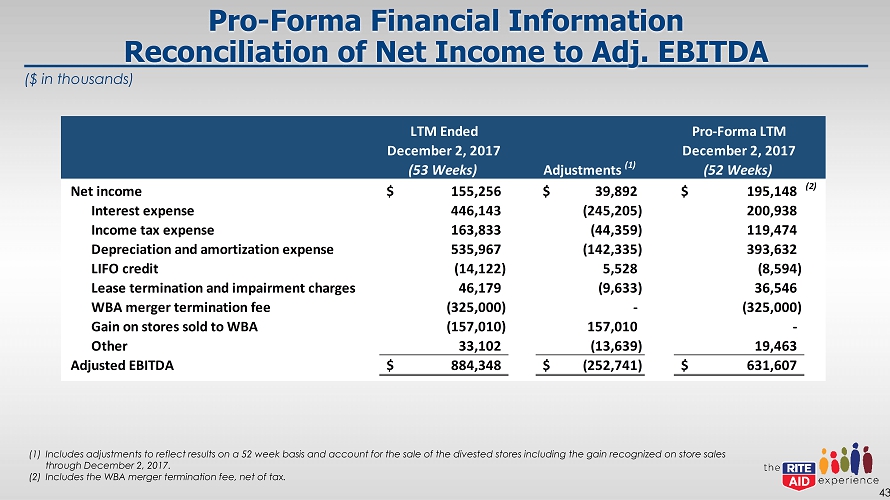
Pro - Forma Financial Information Reconciliation of Net Income to Adj. EBITDA 43 (1) Includes adjustments to reflect results on a 52 week basis and account for the sale of the divested stores including the gain re cognized on store sales through December 2, 2017. (2) Includes the WBA merger termination fee, net of tax. LTM Ended December 2, 2017 (53 Weeks) Adjustments (1) Pro-Forma LTM December 2, 2017 (52 Weeks) Net income 155,256$ 39,892$ 195,148$ (2) Interest expense 446,143 (245,205) 200,938 Income tax expense 163,833 (44,359) 119,474 Depreciation and amortization expense 535,967 (142,335) 393,632 LIFO credit (14,122) 5,528 (8,594) Lease termination and impairment charges 46,179 (9,633) 36,546 WBA merger termination fee (325,000) - (325,000) Gain on stores sold to WBA (157,010) 157,010 - Other 33,102 (13,639) 19,463 Adjusted EBITDA 884,348$ (252,741)$ 631,607$ ($ in thousands)

44