Exhibit 99.2

June 27, 2018
Cautionary Statement Regarding Forward Looking Statements Statements in this presentation that are not historical, are forward - looking statements made pursuant to the safe harbor provisions of the Private Securities Litigation Reform Act of 1995 . Such statements include, but are not limited to, statements regarding Rite Aid’s outlook for fiscal 2019 , the pending merger (the “Merger”) between Rite Aid and Albertsons Companies, Inc . (“Albertsons”) ; the expected timing of the closing of the Merger and the subsequent closings of the sale of Rite Aid distribution centers and assets to Walgreens Boots Alliance, Inc . (WBA) ; the ability of the parties to complete the Merger considering the various closing conditions to the Merger ; the ability of the parties to complete the distribution center closings considering the various closing conditions applicable to the distribution centers and related assets being transferred at such distribution center closing ; the outcome of legal and regulatory matters in connection with the Merger ; expected the benefits of the proposed Merger, integration plans, expected synergies and revenue opportunities, anticipated future financial and operating performance and results, including estimates for growth, the expected management and governance of the combined company ; the competitive ability and position of Rite Aid following completion of the proposed transactions ; the ability of Rite Aid to implement new business strategies following the completion of the proposed transactions and any assumptions underlying any of the foregoing . Words such as “anticipate,” “believe,” “continue,” “could,” “estimate,” “expect,” “intend,” “may,” “plan,” “predict,” “project,” “should,” and “will” and variations of such words and similar expressions are intended to identify such forward - looking statements . These forward - looking statements are not guarantees of future performance and involve risks, assumptions and uncertainties, including, but not limited to, our high level of indebtedness and our ability to make interest and principal payments on our debt and satisfy the other covenants contained in our debt agreements ; general economic, industry, market, competitive, regulatory and political conditions ; our ability to improve the operating performance of our stores in accordance with our long term strategy ; the impact of private and public third - party payers continued reduction in prescription drug reimbursements and efforts to encourage mail order ; our ability to manage expenses and our investments in working capital ; outcomes of legal and regulatory matters ; changes in legislation or regulations, including healthcare reform ; our ability to achieve the benefits of our efforts to reduce the costs of our generic and other drugs ; risks related to the pending transactions with WBA, including the possibility that the remaining transactions may not close, or the business of Rite Aid may suffer as a result of uncertainty surrounding the pending transactions ; risks related to the expected timing and likelihood of completion of the pending Merger , including the risk that the Merger may not close due to one or more closing conditions to the Merger not being satisfied or waived, such as regulatory approvals not being obtained, on a timely basis or otherwise, or that a governmental entity prohibited, delayed or refused to grant approval for the consummation of the Merger or required certain conditions, limitations or restrictions in connection with such approvals, or that the required approval of the merger agreement by the stockholders of Rite Aid was not obtained ; risks related to the ability to realize the anticipated benefits of the proposed transactions with Albertsons, including the risk that the combined company may be unable to achieve its guidance, its cost - cutting synergies, its incremental revenue opportunities or it may take longer or cost more than expected to achieve those synergies and opportunities ; risks associated with the financing of the proposed transaction ; risks related to diverting management's or employees' attention from ongoing business operations ; the risk that any announcements relating to the Merger could have adverse effects on the market price of Rite Aid’s common stock, and the risk that the Merger and its announcement could have an adverse effect on the ability of Rite Aid to retain customers and retain and hire key personnel and maintain relationships with their suppliers and customers and on their operating results and businesses generally ; the risk that Rite Aid's stock price may decline significantly if the Merger or sale of distribution centers and related assets to WBA is not completed ; the occurrence of any event, change or other circumstances that could give rise to the termination of the merger agreement (including circumstances requiring Rite Aid to pay Albertsons a termination fee pursuant to the merger agreement) ; significant transaction costs ; unknown liabilities ; the risk of litigation and/or regulatory actions related to the proposed transactions ; potential changes to our strategy in the event the remaining proposed transactions do not close, which may include delaying or reducing capital or other expenditures, selling assets or other operations, attempting to restructure or refinance our debt, or seeking additional capital, and other business effects . These and other risks, assumptions and uncertainties are more fully described in Item 1 A (Risk Factors) of our most recent Annual Report on Form 10 - K and in the definitive registration statement on Form S - 4 , that was filed with the SEC by Albertsons on June 25 , 2018 in connection with the Merger, and in other documents that we file or furnish with the Securities and Exchange Commission (the “SEC”), which you are encouraged to read . Should one or more of these risks or uncertainties materialize, or should underlying assumptions prove incorrect, actual results may vary materially from those indicated or anticipated by such forward - looking statements . Accordingly, you are cautioned not to place undue reliance on these forward - looking statements, which speak only as of the date they are made . Rite Aid expressly disclaims any current intention to update publicly any forward - looking statement after the distribution of this presentation, whether as a result of new information, future events , changes in assumptions or otherwise . All information regarding Rite Aid assumes completion of Rite Aid’s previously announced transaction with Walgreens Boots Alliance, Inc . There can be no assurance that the consummation of such transaction will be completed on a timely basis, if at all . For further information or such transaction, see Rite Aid’s Form 8 - K filed with the SEC on March 28 , 2018 . Safe Harbor Statement
Additional Information and Where to Find It In connection with the Merger involving Rite Aid and Albertsons, Rite Aid and Albertsons have prepared and Albertsons has filed with the SEC on June 25 , 2018 a definitive registration statement on Form S - 4 that includes a proxy statement of Rite Aid that also constitutes a prospectus of Albertsons . The registration statement has been declared effective by the SEC . Rite Aid has mailed the definitive proxy statement/prospectus and a proxy card to each stockholder entitled to vote at the special meeting relating to the Merger . Rite Aid and Albertsons also plan to file other relevant documents with the SEC regarding the Merger . INVESTORS ARE URGED TO READ THE DEFINITIVE PROXY STATEMENT/PROSPECTUS, AS WELL AS OTHER DOCUMENTS FILED WITH THE SEC, BECAUSE THEY WILL CONTAIN IMPORTANT INFORMATION . RITE AID’S EXISTING PUBLIC FILINGS WITH THE SEC SHOULD ALSO BE READ, INCLUDING THE RISK FACTORS CONTAINED THEREIN . Investors and security holders may obtain copies of the Form S - 4 , including the proxy statement/prospectus, as well as other filings containing information about Rite Aid, free of charge, from the SEC’s website (www . sec . gov) . Investors and security holders may also obtain Rite Aid’s SEC filings in connection with the transaction, free of charge, from Rite Aid’s website (www . RiteAid . com) under the link “Investor Relations” and then under the tab “SEC Filings,” or by directing a request to Rite Aid, Byron Purcell, Attention : Senior Director, Treasury Services & Investor Relations . Copies of documents filed with the SEC by Albertsons will be made available, free of charge, on the SEC’s website (www . sec . gov) and on Albertsons ’ website at www . albertsonscompanies . com . Non - Solicitation This communication shall not constitute an offer to sell or the solicitation of an offer to sell or the solicitation of an offer to buy any securities, nor shall there be any sale of securities in any jurisdiction in which such offer, solicitation or sale would be unlawful prior to registration or qualification under the securities laws of any such jurisdiction . No offer of securities shall be made except by means of a prospectus meeting the requirements of Section 10 of the Securities Act of 1933 , as amended . Safe Harbor Statement
Cautionary Note Regarding Pro Forma Information : The following presentation provides certain pro forma information regarding the impact of Rite Aid’s proposed sale of stores and assets to Walgreens Boots Alliance, Inc . on Rite Aid’s results of operations and capital structure . The pro forma information is for illustrative purposes only, was prepared by management in response to investor inquiries and is based upon a number of assumptions . The pro forma information assumes the completion of all the asset sales when they will actually take place over an extended period of time . Additional items that may require adjustments to the pro forma information may be identified and could result in material changes to the information contained herein . The information in this presentation is not necessarily indicative of what actual financial results of Rite Aid would have been had the sale occurred on the dates or for the periods indicated, nor does it purport to project the financial results of Rite Aid for any future periods or as of any date . Such pro forma information has not been prepared in conformity with Regulation S - X . Rite Aid’s independent auditors have not audited, reviewed, compiled or performed any procedures with respect to this preliminary financial information . Accordingly, they do not express an opinion or provide any form of assurance with respect thereto . The information in this presentation should not be viewed in replacement of results prepared in compliance with Generally Accepted Accounting Principles or any pro forma financial statements subsequently required by the rules and regulations of the Securities and Exchange Commission . The outlook provided herein does not reflect the impact, including opportunities to cut costs and grow revenues, of the pending transaction with Albertsons Companies, Inc . Safe Harbor Statement
Non - GAAP Financial Measures The following presentation includes the non - GAAP financial measures, Adjusted EBITDA, Adjusted Net Income (Loss), Adjusted Net Income (Loss) per Diluted Share, Pro Forma Adjusted EBITDA, Adjusted EBITDA Gross Profit and Adjusted EBITDA SG&A . Rite Aid defines Adjusted EBITDA as net income (loss) excluding the impact of income taxes, interest expense, depreciation and amortization, LIFO adjustments, charges or credits for facility closing and impairment, goodwill impairment, inventory write - downs related to store closings, debt retirements, the WBA merger termination fee, and other items (including stock - based compensation expense, merger and acquisition - related costs, severance and costs related to distribution center closures, gain or loss on sale of assets and revenue deferrals related to our customer loyalty program) . The presentation includes a reconciliation of Adjusted EBITDA to net income, which is the most directly comparable GAAP financial measure . Adjusted Net Income (Loss) and Adjusted Net Income (Loss) per Diluted Share exclude amortization of EnvisionRx intangible assets, merger and acquisition - related costs, loss on debt retirements, LIFO adjustments, goodwill impairment, and the WBA merger termination fee . Rite Aid defines Pro Forma Adjusted as Adjusted EBITDA plus the fees that would have been earned under the Transition Services Agreement (the “TSA”) with WBA for the relevant period, and in order to improve comparability, Pro Forma Adjusted EBITDA further adjusts results so that periods contain the same number of weeks . Adjusted EBITDA Gross Profit includes LIFO credit, customer loyalty card program revenue deferral, depreciation and amortization (COGS portion only) and other items . The presentation includes a reconciliation of Adjusted EBITDA ST&A to Revenue, which is the most directly comparable GAAP financial measure .

Revenue 5,388.5$ 5,436.5$ Net Loss (41.7)$ (36.1)$ Net Loss per Diluted Share (0.04)$ (0.03)$ Adjusted Net Loss per Diluted Share (0.01)$ (0.01)$ Adjusted EBITDA 147.3$ 2.73% 136.0$ 2.50% Pro Forma Adjusted EBITDA 147.3$ 160.0$ 13 Weeks Ended June 2, 2018 13 Weeks Ended June 3, 2017 Q1 - Fiscal 2019 Summary ($ in millions, except per share amounts) CONTINUING OPERATIONS
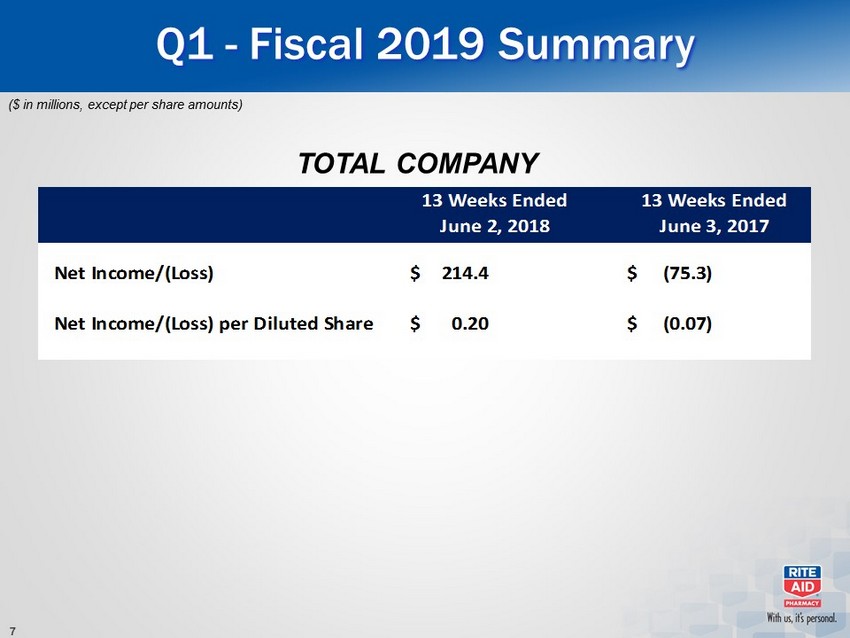
Net Income/(Loss) 214.4$ (75.3)$ Net Income/(Loss) per Diluted Share 0.20$ (0.07)$ 13 Weeks Ended June 2, 2018 13 Weeks Ended June 3, 2017 Q1 - Fiscal 2019 Summary ($ in millions, except per share amounts) TOTAL COMPANY
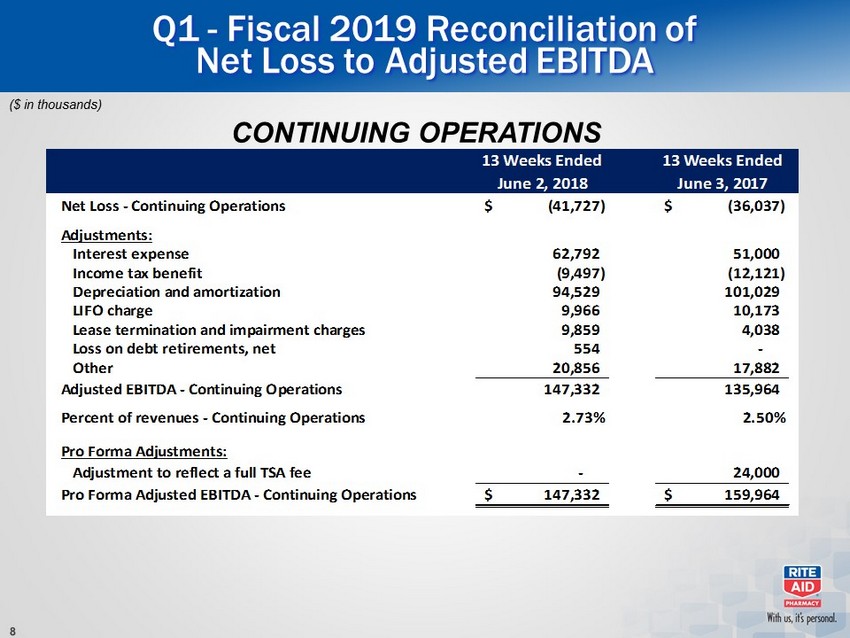
Q1 - Fiscal 2019 Reconciliation of Net Loss to Adjusted EBITDA ($ in thousands) 13 Weeks Ended June 2, 2018 13 Weeks Ended June 3, 2017 Net Loss - Continuing Operations (41,727)$ (36,037)$ Adjustments: Interest expense 62,792 51,000 Income tax benefit (9,497) (12,121) Depreciation and amortization 94,529 101,029 LIFO charge 9,966 10,173 Lease termination and impairment charges 9,859 4,038 Loss on debt retirements, net 554 - Other 20,856 17,882 Adjusted EBITDA - Continuing Operations 147,332 135,964 Percent of revenues - Continuing Operations 2.73% 2.50% Pro Forma Adjustments: Adjustment to reflect a full TSA fee - 24,000 Pro Forma Adjusted EBITDA - Continuing Operations 147,332$ 159,964$ CONTINUING OPERATIONS
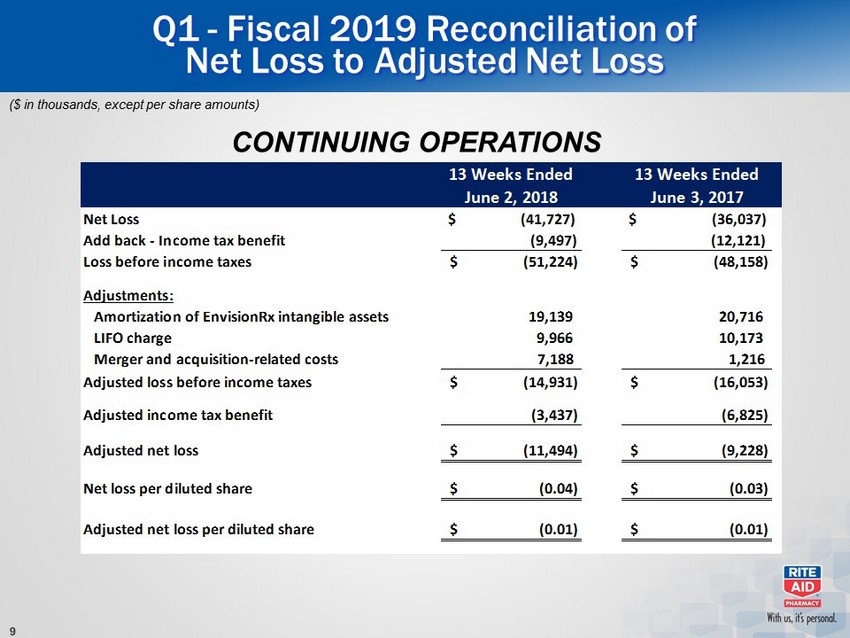
Q1 - Fiscal 2019 Reconciliation of Net Loss to Adjusted Net Loss ($ in thousands, except per share amounts) 13 Weeks Ended June 2, 2018 13 Weeks Ended June 3, 2017 Net Loss $ (41,727) $ (36,037) Add back - Income tax benefit (9,497) (12,121) Loss before income taxes (51,224)$ (48,158)$ Adjustments: Amortization of EnvisionRx intangible assets 19,139 20,716 LIFO charge 9,966 10,173 Merger and acquisition-related costs 7,188 1,216 Adjusted loss before income taxes (14,931)$ (16,053)$ Adjusted income tax benefit (3,437) (6,825) Adjusted net loss (11,494)$ (9,228)$ Net loss per diluted share (0.04)$ (0.03)$ Adjusted net loss per diluted share (0.01)$ (0.01)$ CONTINUING OPERATIONS
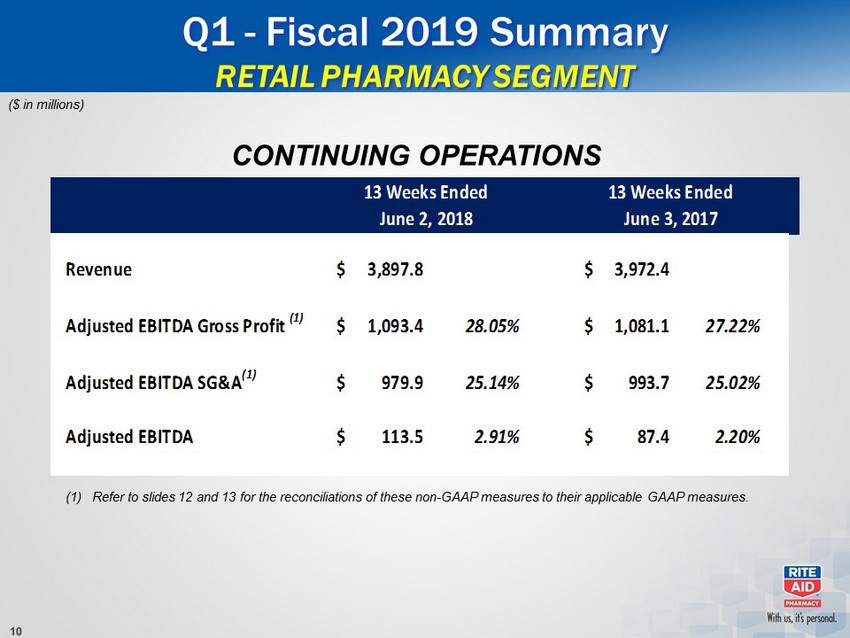
Revenue 3,897.8$ 3,972.4$ Adjusted EBITDA Gross Profit (1) 1,093.4$ 28.05% 1,081.1$ 27.22% Adjusted EBITDA SG&A (1) 979.9$ 25.14% 993.7$ 25.02% Adjusted EBITDA 113.5$ 2.91% 87.4$ 2.20% 13 Weeks Ended June 2, 2018 13 Weeks Ended June 3, 2017 Q1 - Fiscal 2019 Summary RETAIL PHARMACY SEGMENT ($ in millions) (1) Refer to slides 12 and 13 for the reconciliations of these non - GAAP measures to their applicable GAAP measures. CONTINUING OPERATIONS
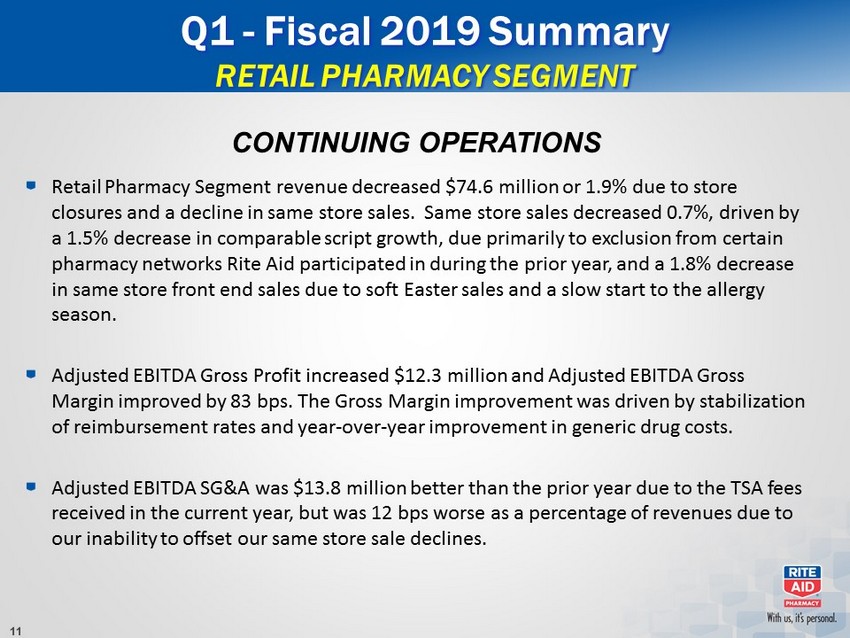
Q1 - Fiscal 2019 Summary RETAIL PHARMACY SEGMENT Retail Pharmacy Segment revenue decreased $74.6 million or 1.9% due to store closures and a decline in same store sales. Same store sales decreased 0.7%, driven by a 1.5% decrease in comparable script growth, due primarily to exclusion from certain pharmacy networks Rite Aid participated in during the prior year, and a 1.8% decrease in same store front end sales due to soft Easter sales and a slow start to the allergy season. Adjusted EBITDA Gross Profit increased $12.3 million and Adjusted EBITDA Gross Margin improved by 83 bps. The Gross Margin improvement was driven by stabilization of reimbursement rates and year - over - year improvement in generic drug costs. Adjusted EBITDA SG&A was $13.8 million better than the prior year due to the TSA fees received in the current year, but was 12 bps worse as a percentage of revenues due to our inability to offset our same store sale declines. CONTINUING OPERATIONS
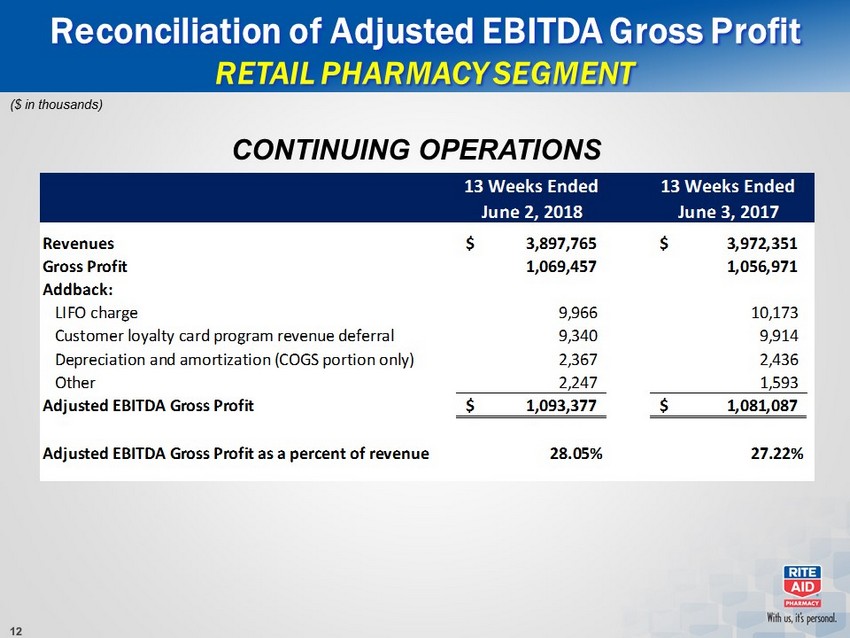
Reconciliation of Adjusted EBITDA Gross Profit RETAIL PHARMACY SEGMENT ($ in thousands) 13 Weeks Ended June 2, 2018 13 Weeks Ended June 3, 2017 Revenues 3,897,765$ 3,972,351$ Gross Profit 1,069,457 1,056,971 Addback: LIFO charge 9,966 10,173 Customer loyalty card program revenue deferral 9,340 9,914 Depreciation and amortization (COGS portion only) 2,367 2,436 Other 2,247 1,593 Adjusted EBITDA Gross Profit 1,093,377$ 1,081,087$ Adjusted EBITDA Gross Profit as a percent of revenue 28.05% 27.22% CONTINUING OPERATIONS

Reconciliation of Adjusted EBITDA SG&A RETAIL PHARMACY SEGMENT ($ in thousands) 13 Weeks Ended June 2, 2018 13 Weeks Ended June 3, 2017 Total Revenues 3,897,765$ 3,972,351$ Selling, general and administrative expenses 1,064,387 1,082,041 Less: Depreciation and amortization (SG&A portion only) 69,666 76,067 Stock based compensation expense 5,031 9,038 Other 9,781 3,227 Adjusted EBITDA SG&A 979,909$ 993,709$ Adjusted EBITDA SG&A as a percent of revenue 25.14% 25.02% CONTINUING OPERATIONS
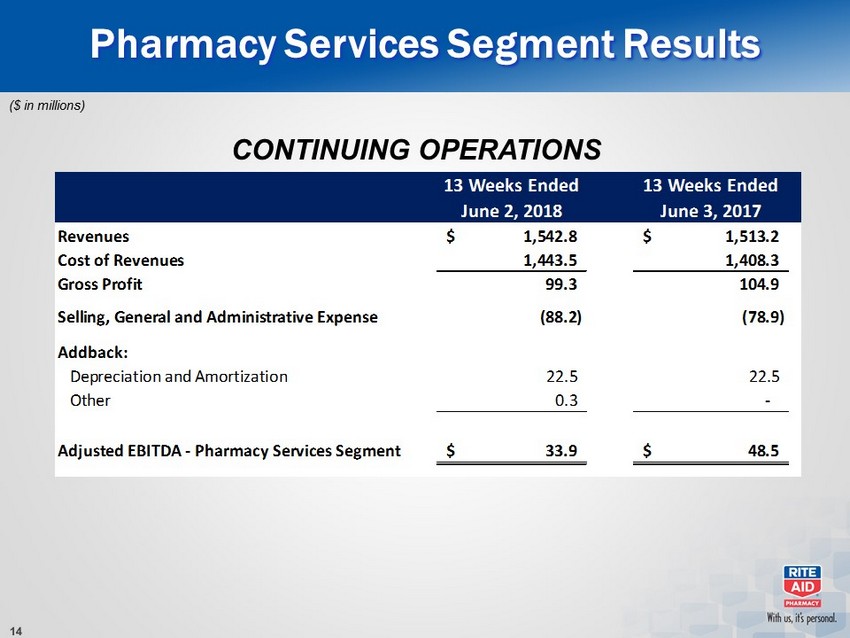
Pharmacy Services Segment Results ($ in millions) 13 Weeks Ended June 2, 2018 13 Weeks Ended June 3, 2017 Revenues 1,542.8$ 1,513.2$ Cost of Revenues 1,443.5 1,408.3 Gross Profit 99.3 104.9 Selling, General and Administrative Expense (88.2) (78.9) Addback: Depreciation and Amortization 22.5 22.5 Other 0.3 - Adjusted EBITDA - Pharmacy Services Segment 33.9$ 48.5$ CONTINUING OPERATIONS

Q1 - FY 2019 Summary PHARMACY SERVICES SEGMENT Revenues increased $29.6 million, primarily due to an increase in our Medicare Part D membership. Adjusted EBITDA decreased $14.6 million, primarily due to margin compression in our commercial business and SG&A investments we have made to support our current year and future growth.
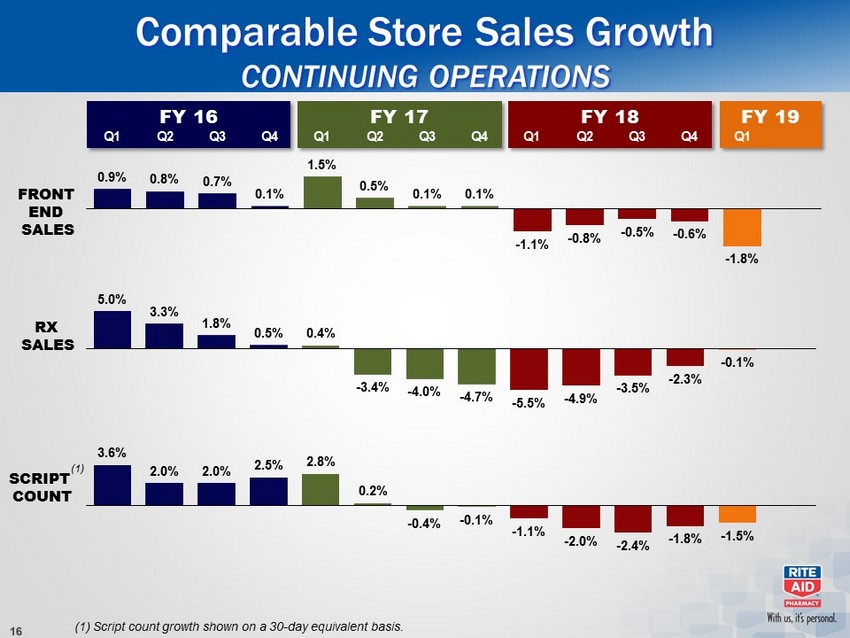
5.0% 3.3% 1.8% 0.5% 0.4% - 3.4% - 4.0% - 4.7% - 5.5% - 4.9% - 3.5% - 2.3% - 0.1% FY 18 FY 16 FY 17 FRONT END SALES RX SALES SCRIPT COUNT 3.6% 2.0% 2.0% 2.5% 2.8% 0.2% - 0.4% - 0.1% - 1.1% - 2.0% - 2.4% - 1.8% - 1.5% (1) (1) Script count growth shown on a 30 - day equivalent basis. Comparable Store Sales Growth CONTINUING OPERATIONS FY 19 0.9% 0.8% 0.7% 0.1% 1.5% 0.5% 0.1% 0.1% - 1.1% - 0.8% - 0.5% - 0.6% - 1.8% Q1 Q2 Q3 Q4 Q1 Q2 Q3 Q4 Q1 Q2 Q3 Q4 Q1

Capitalization Table ($ in thousands) Note: Debt in the capitalization table is shown net of unamortized debt issuance costs. June 2, 2018 March 3, 2018 Secured Debt: Senior secured revolving credit facility due January 2020 179,742$ (13,076)$ Other 90 90 179,832 (12,986) Unsecured Guaranteed Debt: 9.25% senior notes due March 2020 - 898,476 6.75% senior notes due June 2021 800,687 805,123 6.125% senior secured notes due April 2023 1,733,384 1,778,292 2,534,071 3,481,891 Unsecured Unguaranteed Debt: 7.7% notes due February 2027 293,582 293,540 6.875% fixed-rate senior notes due December 2028 127,309 127,293 420,891 420,833 Lease financing obligations 47,809 52,554 Total Debt: 3,182,603 3,942,292 Current maturities of long-term debt and lease financing obligations (19,025) (21,031) Long-term debt & lease financing obligations, less current maturities 3,163,578$ 3,921,261$ Total Debt Gross 3,219,558 3,987,644 Less: Unamortized debt issue costs 36,955 45,352 Total Debt per balance sheet 3,182,603$ 3,942,292$
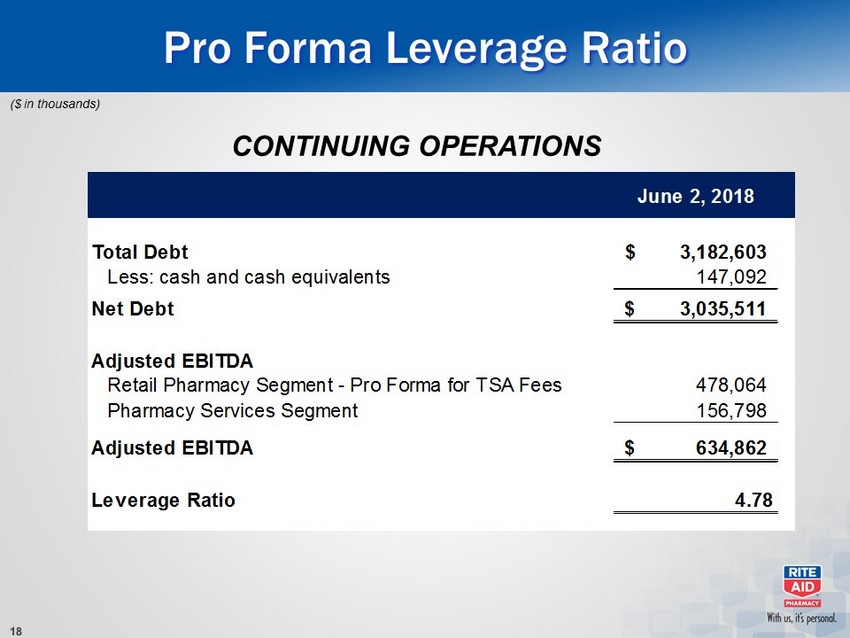
Pro Forma Leverage Ratio ($ in thousands) June 2, 2018 Total Debt 3,182,603$ Less: cash and cash equivalents 147,092 Net Debt 3,035,511$ Adjusted EBITDA Retail Pharmacy Segment - Pro Forma for TSA Fees 478,064 Pharmacy Services Segment 156,798 Adjusted EBITDA 634,862$ Leverage Ratio 4.78 CONTINUING OPERATIONS
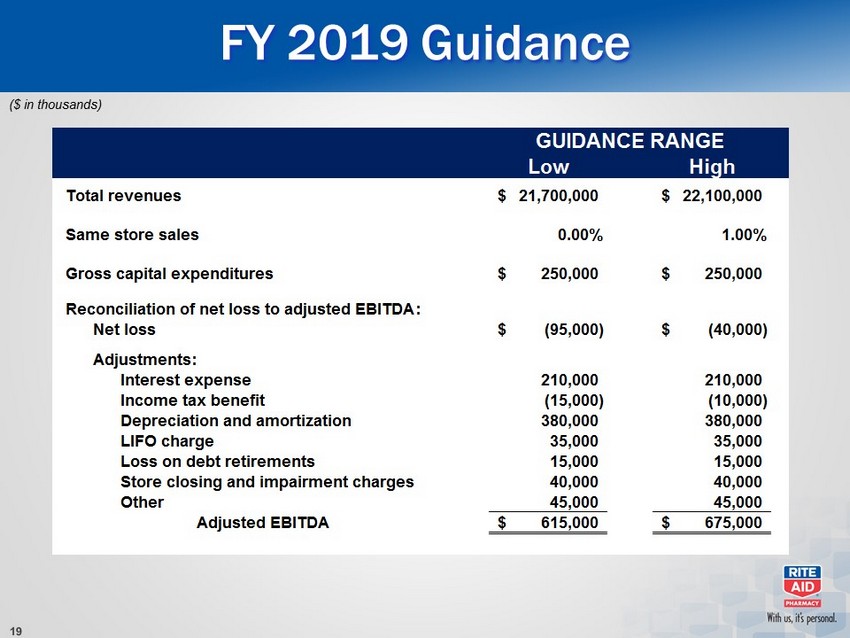
FY 2019 Guidance ($ in thousands) Low High Total revenues 21,700,000$ 22,100,000$ Same store sales 0.00% 1.00% Gross capital expenditures 250,000$ 250,000$ Reconciliation of net loss to adjusted EBITDA: Net loss (95,000)$ (40,000)$ Adjustments: Interest expense 210,000 210,000 Income tax benefit (15,000) (10,000) Depreciation and amortization 380,000 380,000 LIFO charge 35,000 35,000 Loss on debt retirements 15,000 15,000 Store closing and impairment charges 40,000 40,000 Other 45,000 45,000 Adjusted EBITDA 615,000$ 675,000$ GUIDANCE RANGE
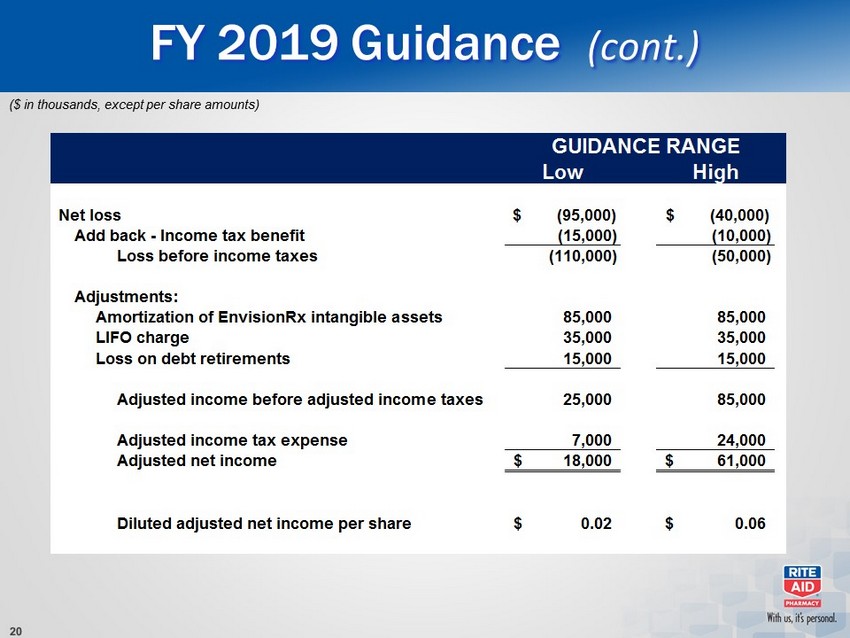
FY 2019 Guidance (cont.) ($ in thousands, except per share amounts) Low High Net loss $ (95,000) $ (40,000) Add back - Income tax benefit (15,000) (10,000) Loss before income taxes (110,000) (50,000) Adjustments: Amortization of EnvisionRx intangible assets 85,000 85,000 LIFO charge 35,000 35,000 Loss on debt retirements 15,000 15,000 Adjusted income before adjusted income taxes 25,000 85,000 Adjusted income tax expense 7,000 24,000 Adjusted net income 18,000$ 61,000$ Diluted adjusted net income per share 0.02$ 0.06$ GUIDANCE RANGE