August 2, 2007
Second-Quarter 2007 Results and
Full-Year 2007 Financial Outlook
Exhibit 99.2
Agenda
Company Overview and Business Plan
Bob Rossiter, Chairman and CEO
Second-Quarter 2007 Results and 2007 Outlook
Jim Vandenberghe, Vice Chairman and CFO
Q and A Session
2

Company Overview
and Business Plan
3
What Does the Shareholder Vote
Against the AREP Merger Proposal Mean?*
Lear’s shareholders have voted, and we respect their decision
At the time of the Merger Proposal, we had a clear strategy
and business plan for the future
Nevertheless, the Board was obligated to evaluate the AREP
offer and make a recommendation
Following a comprehensive and objective review, the Board
concluded the AREP offer was fair
While we believed there were benefits to the transaction, we
also believe a standalone, publicly traded Lear has a positive
long-term outlook
The Board and management team are focused on executing
the strategic plan we have in place
We Will Operate The Company Going Forward With The
Same Level Of Intensity And Commitment To Customer
Satisfaction And Shareholder Value We Have Always Had
*
Please see slide titled “Forward-Looking Statements” at the end of this presentation for further information.
4
Following the Offer,
Near-Term Factors Turned More Positive*
Investor Sentiment Regarding The Auto Sector
Improved In The First Half Of 2007
*
Please see slide titled “Forward-Looking Statements” at the end of this presentation for further information.
5
Auto sector valuations increased significantly
Big Three production in the first half was relatively stable
and somewhat stronger than we had forecast
Distress in the supply chain has moderated somewhat
There were no labor disruptions in the auto sector, and
there is optimism regarding the outcome of this year’s
union contract negotiations
Lear’s second-quarter operating results and full-year 2007
outlook improved
Business Assessment*
*
Please see slide titled “Forward-Looking Statements” at the end of this presentation for further information.
6
Near-Term Business Conditions Relatively Stable
Continuing priority focus on quality and business
fundamentals
Seating business performing well globally
Electrical and Electronic business needs further
improvement
Further Industry Restructuring and Volatility Expected
Substantial progress on global restructuring initiative
Continuing to diversify our sales with rapid growth in
total Asian sales
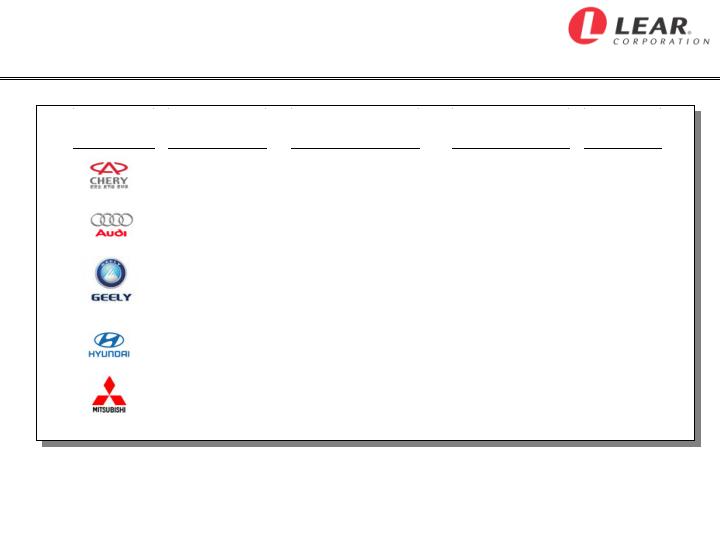
New Asian Program Awards in Second Quarter
New Asian Business Awarded In Second Quarter
Worth About $100 Million Annually *
* Includes consolidated and non-consolidated sales.
** Please see slide titled “Forward-Looking Statements” at the end of this presentation for further information.
Automaker
Market
Lear Content
Vehicle
Program(s)
SOP**
China
Seats
B13 CV
Jun-08
China
Seats
A4
Nov-08
China
Seats
FC2/3
Apr-08
China
Wire Harness/Junction Box/TPMS
FC2/3
Jun-08
North America
Junction Box
Sonata/Santa Fe
Feb-08
Australia
Tier II Seat Components
380
Apr-07
7
Going Forward,
What is Lear’s Business Plan?*
Product-Line Focus
Operating Priorities
Continue to execute the customer-focused business plan we
have in place:
* Please see slide titled “Forward-Looking Statements” at the end of this presentation for further information.
8
Focus on strengthening our core businesses:
Leverage leadership position in Seating systems
Strengthen capabilities in Electrical and Electronic segment
Expand capabilities in value-added components
Deliver world-class quality and customer satisfaction
Implement global restructuring and footprint actions
Aggressively pursue growth in Asia and with Asian OEMs globally
Continue product innovation with focus on safety and technology

Second-Quarter Results
and 2007 Outlook
9

Financial Summary*
* Core operating earnings represent seating and electrical and electronic income before interest, other expense, income taxes, restructuring costs and
other special items. Free cash flow represents net cash provided by operating activities before the net change in sold accounts receivable, less capital
expenditures. Please see slides titled “Non-GAAP Financial Information” and “Forward Looking Statements” at the end of this presentation for further
information.
10
Second-Quarter special items include:
Costs related to restructuring actions
Costs related to AREP merger transaction
Costs related to divestiture of Interior business
Second-Quarter core operating earnings were $229 million,
up $65 million from a year ago, reflecting:
Favorable cost performance and operating efficiencies
Improved operating performance in Europe and Asia
Benefit of new business, mainly Seating outside of North America
Full-Year outlook unchanged from latest status, but we now expect
earnings at or near the high end of the range:
Core operating earnings range remains at $600 to $640 million
Operating performance positive; production outlook uncertain
Free cash flow increased to $275 million, reflecting lower capital
spending

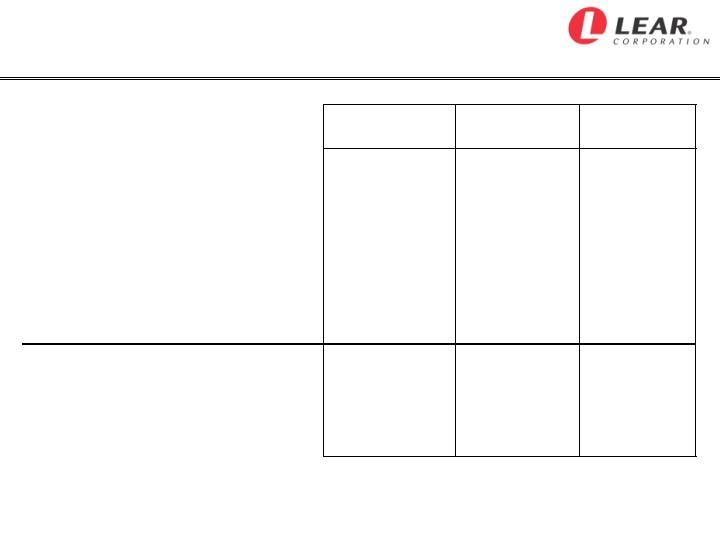
Second Quarter 2007
Industry Environment
Second Quarter
Second Quarter
2007
2007 vs. 2006
North American Production
Industry
4.0 mil
Down 2%
Big Three
2.7 mil
Down 7%
Lear's Top 15 Platforms
1.3 mil
Down 6%
European Production
Industry
5.2 mil
Up 1%
Up 1%
Lear's Top 5 Customers
2.6 mil
Up 1%
Key Commodities (Quarterly Average)
vs. Prior Quarter
Steel (Hot Rolled)
Up 5%
Down 6%
Crude Oil
Up 11%
Down 8%
Copper
Up 28%
Up 11%
11
Second Quarter 2007
Reported Financial Results
(in millions, except net income per share)
Second
Quarter 2007
Second
Quarter 2006
2Q '07
B/(W) 2Q '06
Net Sales
$4,155.3
$4,810.2
($654.9)
Income Before Interest, Other Expense and
Income Taxes*
$194.8
$113.2
$81.6
Pretax Income
$143.9
$31.5
$112.4
Net Income (Loss)
$123.6
($6.4)
$130.0
Net Income (Loss) Per Share
$1.58
($0.10)
$1.68
SG&A % of Net Sales
3.4
%
3.6
%
0.2
pts.
Interest Expense
$51.3
$53.2
$1.9
Depreciation / Amortization
$75.7
$103.5
$27.8
Other Expense, Net
$0.3
$25.6
$25.3
* Please see slides titled “Non-GAAP Financial Information” at the end of this presentation for further information.
12
Second Quarter 2007
Restructuring Costs and Other Special Items*
(in millions)
Income Before
Interest, Other
Expense and
Income Taxes
Reported Results
2007 Total Company
$ 194.8
2007 Residual Interior business
(0.6)
2007 Seating/Electrical and Electronic businesses
$ 195.4
Reported Results Include the Following Items:
COGS
SG&A
Costs related to restructuring actions
$ 29.8
24.4
$
5.4
$
Costs related to merger transaction
2.3
-
2.3
Costs related to divestiture of Interior business
1.8
1.3
0.5
2007 Core Operating Earnings
229.3
$
2006 Core Operating Earnings
164.7
$
Second Quarter
Income Statement Category
Memo:
* Please see slides titled “Non-GAAP Financial Information” at the end of this presentation for further information.
13

Second Quarter 2007
Net Sales Changes and Margin Impact Versus Prior Year
Net Sales
Margin
Performance Factor
Change
Impact
Comments
(in millions)
Industry Production /
$ (171)
Negative
Primarily lower production in
Platform Mix / Net Pricing /
All Other
North America
Global New Business
266
Positive
Nissan Qashqai, Range Rover, Fiat Bravo
and Audi TT in Europe; Hyundai Veracruz
in Asia; GMT 900 pickup and Hyundai
Santa Fe in N.A.
F/X Translation
143
Neutral
Euro up 7%, Canadian dollar up 2%
Acquisition / Divestiture
(893)
Positive
Divestiture of Interior business
Commodity
Neutral
Steel down 6% and copper up 11%, with
some prior period recovery; crude oil
down 8%
Performance
Positive
Favorable operating performance in core
businesses, including benefits from
restructuring actions and vertical
integration
14
Second Quarter 2007
Business Segment Results
Seating
Margin
Margin
Net Sales
3,264.5
$
3,096.1
$
Reported Segment Earnings*
238.8
$
7.3%
171.5
$
5.5%
Adjusted Earnings**
250.4
$
7.7%
175.4
$
5.7%
Electrical and Electronic
Net Sales
825.1
$
787.7
$
Reported Segment Earnings*
23.5
$
2.8%
38.0
$
4.8%
Adjusted Earnings**
38.6
$
4.7%
50.8
$
6.4%
Headquarters Costs
Reported Segment Earnings*
(66.9)
$
(62.0)
$
Adjusted Earnings**
(59.7)
$
(61.5)
$
Core Business
Net Sales
4,089.6
$
3,883.8
$
Reported Earnings*
195.4
$
4.8%
147.5
$
3.8%
Adjusted Earnings**
229.3
$
5.6%
164.7
$
4.2%
Total Company
Net Sales
4,155.3
$
4,810.2
$
Reported Earnings*
194.8
$
4.7%
113.2
$
2.4%
Adjusted Earnings**
233.7
$
5.6%
139.6
$
2.9%
2007
2006
Second Quarter
($ in millions)
* Reported segment earnings represent income (loss) before interest, other expense and income taxes. Please see slides titled “Non-GAAP Financial
Information” at the end of this presentation for further information.
** Adjusted earnings and margin exclude restructuring costs and other special items as follows – In the Second Quarter ended 06/30/07, adjustments for
Seating - $11.6M, Electrical and Electronic - $15.1M, HQ - $7.2M, Core Business - $33.9M and Total Company - $38.9M and in the Second Quarter
ended 07/01/06, adjustments for Seating - $3.9M, Electrical and Electronic - $12.8M, HQ - - $0.5M, Core Business - $17.2M and Total Company -
$26.4M.
15

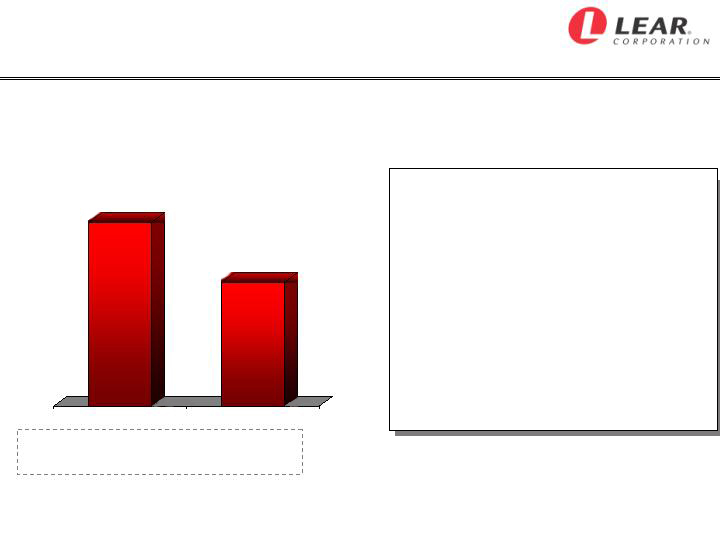
Second Quarter 2007
Seating Segment Performance*
Explanation of
Year-to-Year Change
5.7%
7.7%
Q2 2006
Q2 2007
Adj. Seg.
Earnings
(in millions)
$175.4 $250.4
Adjusted Seating Margin
16
+
Favorable cost performance from
restructuring and ongoing efficiency
actions
+
Margin improvement actions, including
selective vertical integration
+
Benefit of new business, primarily
outside of North America
+
Net raw material favorable
-
Lower production in North America
*
Please see slides titled “Non-GAAP Financial Information” at the end of this presentation for further information and refer to
slide 28 in this presentation for a reconciliation of reported segment earnings to adjusted segment earnings.
Second Quarter 2007
Electrical and Electronic Segment Performance*
Explanation of
Year-to-Year Change
6.4%
4.7%
Q2 2006
Q2 2007
Adj. Seg.
Earnings
(in millions)
$50.8 $38.6
Adjusted
Electrical and Electronic Margin
17
-
Litigation costs and other
commercial items
-
Unfavorable net pricing
-
Lower industry production in N. A.
-
Roll-off of two programs in N. A.
-/+ Higher copper prices offset by prior
period recovery
-
Improving results in Asia
*
Please see slides titled “Non-GAAP Financial Information” at the end of this presentation for further information and refer to
slide 28 in this presentation for a reconciliation of reported segment earnings to adjusted segment earnings.
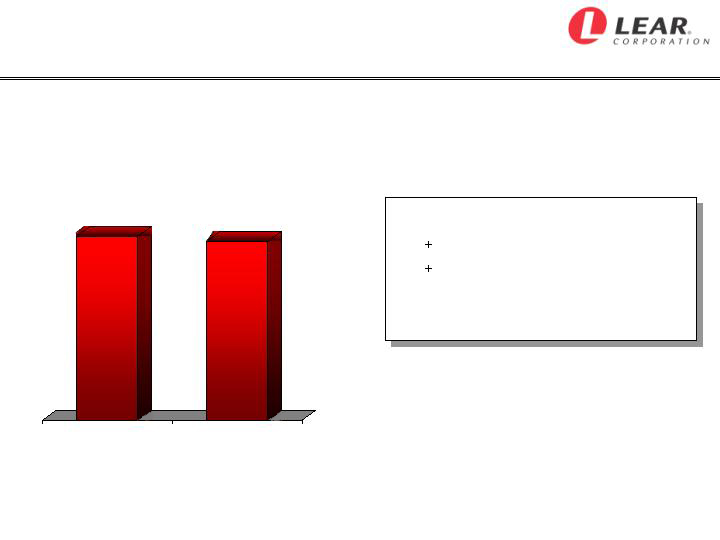
Adjusted Headquarters Expense**
Explanation of
Year-to-Year Change
Second Quarter 2007
Headquarters Performance*
(in millions)
$61.5
$59.7
Q2 2006
Q2 2007
18
SG&A efficiencies
Restructuring savings
*
Please see slides titled “Non-GAAP Financial Information” at the end of this presentation for further information and refer to slide 28 in
this presentation for a reconciliation of reported segment earnings to adjusted segment earnings.
**
Adjusted expense excludes restructuring costs of $0.5 million in 2006 and restructuring costs of $3.1 million, merger-related costs of
$2.3 million and costs related to the Interior divestiture of $1.8 million in 2007.
Second Quarter 2007
Free Cash Flow*
(in millions)
Second
Quarter
2007
Net Income
$ 123.6
Depreciation / Amortization
75.7
Working Capital / Other
43.8
Cash from Operations
$ 243.1
Capital Expenditures
(39.1)
Free Cash Flow
$ 204.0
19
*
Free Cash Flow represents net cash provided by operating activities ($289.3 million for the three months ended 6/30/07) before
net change in sold accounts receivable (($46.2) million for the three months ended 06/30/07) (Cash from Operations), less
capital expenditures. Please see slides titled “Non-GAAP Financial Information” at the end of this presentation for further
information.
2007 Outlook
Full-Year Production Assumptions*
Full-Year
Change from
2007 Outlook
Prior Year
North American Production
Total Industry
~ 15.1 mil
~
down 1%
Big Three
~ 9.8 mil
~
down 4%
Lear’s Top 15 Platforms
~ 4.6 mil
~
down 7%
European Production
Total Industry
~ 19.7 mil
~
up 3%
Lear’s Top 5 Customers
~ 9.9 mil
~
up 2%
Euro
$1.34 / Euro
up 6%
Key Commodities
moderating
slightly lower
(except copper)
(except copper)
Please see slide titled “Forward-Looking Statements” at the end of this presentation for further information.
20
2007 Outlook
Full-Year Financial Forecast*
2007 Full-Year
Financial Forecast
for Core Business
(Seating and Electrical and Electronic businesses)
Net Sales
~
~
$15 billion
Core Operating Earnings
$600 to $640 million
Income before interest, other expense,
income taxes, restructuring
costs and other special items
Interest Expense
$210 to $215 million
Pretax Income
$335 to $375 million
before restructuring costs
and other special items
Estimated Tax Expense
~
~
$120 million
**
Pretax Restructuring Costs
~
~
$100 million
Capital Spending
~
~
$235 million
Depreciation and Amortization
~
~
$310 million
Free Cash Flow
~
~
$275 million
** Subject to actual mix of financial results by country.
* Please see slides titled “Non-GAAP Financial Information” and “Forward-Looking Statements” at the end of this presentation for
further information.
21
Summary and Outlook*
Lear is Financially Sound
Successfully refinanced major debt maturities through 2010
Operating results improving; cash flow now solidly positive
Making Progress on Strategic Priorities
Completed divestiture of Interior business
Expanding our presence in Asia and growing Asian sales
globally
Implementing global restructuring actions
Automotive industry conditions, particularly in North
America, remain challenging
Longer-term outlook for Lear continues to be positive
Please see slide titled “Forward-Looking Statements” at the end of this presentation for further information.
22
ADVANCE RELENTLESSLY™
www.lear.com
LEA
NYSE
Listed
R
23

Non-GAAP Financial Information
In addition to the results reported in accordance with accounting principles generally accepted in the United States (“GAAP”) included
throughout this presentation, the Company has provided information regarding “income before interest, other expense and income taxes,”
“seating and electrical and electronic income before interest, other expense, income taxes, restructuring costs and other special items” (core
operating earnings), “pretax income before restructuring costs and other special items” and “free cash flow” (each, a non-GAAP financial
measure). Other expense includes, among other things, state and local non-income taxes, foreign exchange gains and losses, fees
associated with the Company’s asset-backed securitization and factoring facilities, minority interests in consolidated subsidiaries, equity in
net income of affiliates and gains and losses on the sale of assets. Free cash flow represents net cash provided by operating activities
before the net change in sold accounts receivable, less capital expenditures. The Company believes it is appropriate to exclude the net
change in sold accounts receivable in the calculation of free cash flow since the sale of receivables may be viewed as a substitute for
borrowing activity.
Management believes the non-GAAP financial measures used in this presentation are useful to both management and investors in their
analysis of the Company’s financial position and results of operations. In particular, management believes that income before interest, other
expense and income taxes, core operating earnings and pretax income before restructuring costs and other special items are useful
measures in assessing the Company’s financial performance by excluding certain items (including those items that are included in other
expense) that are not indicative of the Company’s core operating earnings or that may obscure trends useful in evaluating the Company’s
continuing operating activities. Management also believes that these measures are useful to both management and investors in their
analysis of the Company’s results of operations and provide improved comparability between fiscal periods. Management believes that free
cash flow is useful to both management and investors in their analysis of the Company’s ability to service and repay its debt. Further,
management uses these non-GAAP financial measures for planning and forecasting in future periods.
Income before interest, other expense and income taxes, core operating earnings, pretax income before restructuring costs and other
special items and free cash flow should not be considered in isolation or as a substitute for pretax income, net income, cash provided by
operating activities or other income statement or cash flow statement data prepared in accordance with GAAP or as a measure of
profitability or liquidity. In addition, the calculation of free cash flow does not reflect cash used to service debt and therefore, does not reflect
funds available for investment or other discretionary uses. Also, these non-GAAP financial measures, as determined and presented by the
Company, may not be comparable to related or similarly titled measures reported by other companies.
Set forth on the following slides are reconciliations of these non-GAAP financial measures to the most directly comparable financial
measures calculated and presented in accordance with GAAP. Given the inherent uncertainty regarding special items, other expense and
the net change in sold accounts receivable in any future period, a reconciliation of forward-looking financial measures to the most directly
comparable financial measures calculated and presented in accordance with GAAP is not feasible. The magnitude of these items, however,
may be significant.
24
Non-GAAP Financial Information
Cash from Operations and Free Cash Flow
Three Months
(in millions)
Q2 2007
Net cash provided by operating activities
$ 289.3
Net change in sold accounts receivable
(46.2)
Net cash provided by operating activities
before net change in sold accounts receivable
(cash from operations)
243.1
Capital expenditures
(39.1)
Free cash flow
$ 204.0
25
Non-GAAP Financial Information
Core Operating Earnings
Three Months
(in millions)
Q2 2007
Q2 2006
Pretax income
$ 143.9
$ 31.5
Goodwill impairment charge related to Interior business
-
2.9
Divestiture of Interior business
(0.7)
-
Interest expense
51.3
53.2
Other expense, net *
0.3
25.6
Income before interest, other expense and income taxes
$ 194.8
$ 113.2
Costs related to divestiture of Interior business (included in COS and SG&A)
1.8
-
Fixed asset impairment charges related to Interior business
-
7.2
Costs related to restructuring actions
34.8
19.2
Costs related to merger transaction
2.3
-
Income before interest, other expense, income taxes,
restructuring costs and other special items
233.7
$
139.6
$
Less: Interior business
(4.4)
25.1
Seating and electrical and electronic income before interest, other
expense, income taxes, restructuring costs and other special items
$ 229.3
$ 164.7
(core operating earnings)
* Includes minority interests in consolidated subsidiaries and equity in net income of affiliates.
26
Non-GAAP Financial Information
Segment Earnings Reconciliation
Three Months
(in millions)
Q2 2007
Q2 2006
Seating
$ 238.8
$ 171.5
Electrical and electronic
23.5
38.0
Interior
(0.6)
(34.3)
Segment earnings
261.7
175.2
Corporate and geographic headquarters and elimination of
intercompany activity
(66.9)
(62.0)
Income before interest, other expense and income taxes
$ 194.8
$ 113.2
Goodwill impairment charge related to Interior business
-
2.9
Divestiture of Interior business
(0.7)
-
Interest expense
51.3
53.2
Other expense, net
0.3
25.6
Pretax income
$ 143.9
$ 31.5
27

Non-GAAP Financial Information
Adjusted Segment Earnings
Three Months Q2 2007
Three Months Q2 2006
Electrical and
HQ/
Core
Electrical and
HQ/
Core
(in millions)
Seating
Electronic
Other
Business
Seating
Electronic
Other
Business
Segment earnings
238.8
$
23.5
$
(66.9)
$
195.4
$
171.5
$
38.0
$
(62.0)
$
147.5
$
Costs related to divestiture of
Interior business
-
-
1.8
1.8
-
-
-
-
Costs related to restructuring actions
11.6
15.1
3.1
29.8
3.9
12.8
0.5
17.2
Costs related to merger transaction
-
-
2.3
2.3
-
-
-
-
Adjusted segment earnings
250.4
$
38.6
$
(59.7)
$
229.3
$
175.4
$
50.8
$
(61.5)
$
164.7
$
28

Forward-Looking Statements
This presentation contains forward-looking statements within the meaning of the Private Securities
Litigation Reform Act of 1995, including statements regarding anticipated financial results and
liquidity. Actual results may differ materially from anticipated results as a result of certain risks and
uncertainties, including but not limited to, general economic conditions in the markets in which the
Company operates, including changes in interest rates or currency exchange rates, the financial
condition of the Company’s customers or suppliers, fluctuations in the production of vehicles for
which the Company is a supplier, disruptions in the relationships with the Company’s suppliers,
labor disputes involving the Company or its significant customers or suppliers or that otherwise
affect the Company, the Company’s ability to achieve cost reductions that offset or exceed
customer-mandated selling price reductions, the outcome of customer productivity negotiations, the
impact and timing of program launch costs, the costs and timing of facility closures, business
realignment or similar actions, increases in the Company's warranty or product liability costs, risks
associated with conducting business in foreign countries, competitive conditions impacting the
Company's key customers and suppliers, raw material costs and availability, the Company's ability
to mitigate the significant impact of increases in raw material, energy and commodity costs, the
outcome of legal or regulatory proceedings to which the Company is or may become a party,
unanticipated changes in cash flow, including the Company’s ability to align its vendor payment
terms with those of its customers, the success of the Company's restructuring initiative and other
risks described from time to time in the Company's Securities and Exchange Commission filings.
The forward-looking statements in this presentation are made as of the date hereof, and the
Company does not assume any obligation to update, amend or clarify them to reflect events, new
information or circumstances occurring after the date hereof.
29