November 6, 2007
Third-Quarter 2007 Results and
Financial Outlook
Exhibit 99.2

Agenda
Company Overview
Bob Rossiter, Chairman, CEO and President
Business Conditions
Jim Vandenberghe, Vice Chairman
Third-Quarter 2007 Results and Outlook
Matt Simoncini, Chief Financial Officer
Q and A Session
2

Company Overview
3

Company Overview
Lear has implemented a number of significant actions
to improve shareholder value
Despite challenging business conditions, we are
continuing to improve our financial results
Seating business performing well; electrical and
electronic business needs further improvement
Aggressively growing in Asia and with Asian
manufacturers globally
Priority focus on delivering superior quality and
customer service continues
4
Actions to Improve Shareholder Value*
Implementing global restructuring initiative
Refinanced 2007-2009 debt maturities
Divested Interior business; retained minority interest
in IAC joint ventures
Revitalized strategic focus on “growth”
Strategic Actions To Improve Shareholder Value Have
Improved Financial Results, Increased Financial
Flexibility And Enhanced Future Competitiveness
* Please see slide titled “Forward-Looking Statements” at the end of this presentation for further information.
5

Strategic Assessment
Seating Systems*
Lear has a strong competitive position globally
Business performing well today
Market Environment
Please see slide titled “Forward-Looking Statements” at the end of this presentation for further information.
Core Strategies
Business Outlook
Core strategies support a leading competitive position globally
Leverage global leadership in systems integration
Achieve lowest cost global footprint
Expand capabilities in value-added components
Further sales growth and diversification
6
Strategic Assessment
Electrical and Electronic Segment*
Fierce global competition is depressing margins
Increasing consumer demand for electrical content in vehicles
(i.e., safety-related features, infotainment and power equipment )
Please see slide titled “Forward-Looking Statements” at the end of this presentation for further information.
Business Outlook
Core Strategies
Market Environment
Further develop system integration capabilities
Achieve lowest cost global footprint
Capitalize on emerging technologies in power distribution and
growth in value-added electronic products
Margin pressure as industry restructures and consolidates
Significant new business coming on line over next few years
Solid future opportunity by strengthening global position in
power distribution and growing electronic business
7

Update on IAC Joint Ventures
IAC provides opportunity for future success of Interior business
Industry consolidation, restructuring and business integration in this
segment is on-track
Lear positioned to participate in improving business fundamentals
IAC–Europe
Annual sales of over $1 billion
Lear holds a 34% minority interest in IAC-Europe
IAC–North America
Recently completed acquisition of Collins & Aikman’s (C&A) soft
trim business
Annual sales now total about $3 billion
Lear settled contingent liabilities and invested an additional
$32 million for its share of the C&A acquisition
Lear now holds a 19% minority interest in IAC-NA
8
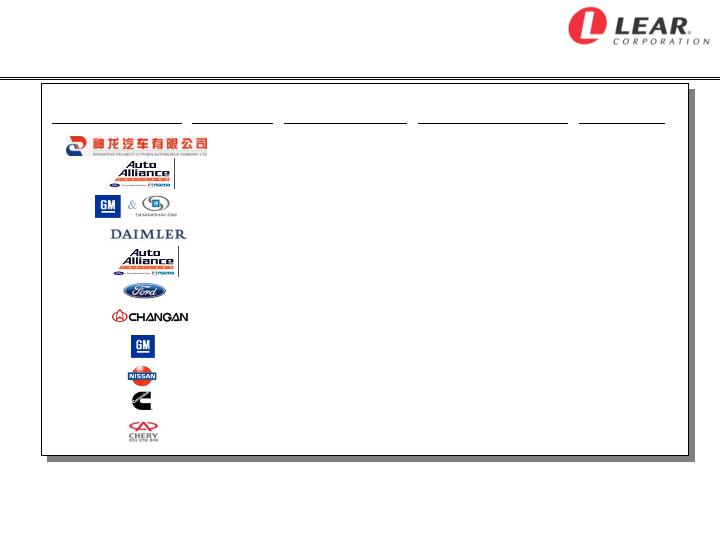
New Asian Program Awards in Third Quarter**
New Asian Business Awarded In Third Quarter
Worth About $245 Million Annually*
* Includes consolidated and non-consolidated sales.
** Please see slide titled “Forward-Looking Statements” at the end of this presentation for further information.
Automaker
Market
Lear Content
Future Vehicle
Program(s)
SOP
DPCA
China
Seats
W2/X7
2009/2011
Ford/AAT
Thai/S.Afr.
Wire Harnesses
T6 Ranger
2010/2011
*GM
China/India
Seats
M300/T300
2009/2010
DCX
China
Seats
W204/C Class
January 2008
Australia
Seat Trim/Map Pocket
Orion/Territory
November 2007
Thai/S.Afr.
Junction Box
T6 Ranger
2010/2011
China
Seats
CM9/V101
October 2007
India
Wire Harnesses
M300
February 2010
Nissan
Global
Wire Harnesses
Dualis
December 2007
China
Wire Harnesses
Cummins Diesel
January 2009
China
TPMS
B12/B21/B22/B23
2008/2009
China
Door Trim/Headliner
CM9
Oct-07
9
Major Customer Awards and Industry Recognition
“Supplier of the Year” for global Seating Systems
3 World Excellence Awards--
"Gold Award” at Genk, Belgium seating plant
"Silver Award” and "Recognition of Achievement for consumer-driven Six-Sigma”
at St. Thomas, Ontario Canada seating plant
“Superior Supplier Diversity” and
“Excellence in Quality” at Edinburgh, Indiana
“Outstanding Performance – Quality and Delivery”
at East London, South Africa
“Excellence in Performance” for Wire Harnesses
“Outstanding Supplier Performance Award” at Boeblingen, Germany
“Value Analysis / Value Engineering Performance Award” and
“Value Analysis Award” for most cost saving ideas generated
“Supplier Award for Successful Partnership” in Brazil
“Supplier of the Year” at Liuzhou, China
“…Most Impressive Stereo Sound in the World”
(from March 2007 review of Lear’s premium sound system in the BMW M5)
Environmental Innovation Award 2007 for SoyFoam™
(Institute for Transport Management)
Customer Awards
Industry Recognition
10

Business Conditions
11
Present Business Environment
Macro Economic Factors
Positives: U.S. interest rates and key commodity prices moderating
Risks: consumer credit, weak housing sector and high oil prices
Volatile capital markets
Industry Production
Relatively stable in North America and Europe
Full-size pick-up trucks and large SUVs down from 2004 peak
Continued growth and business development in key Asian markets
Industry Developments
Supplier consolidation and restructuring continues
New pattern UAW labor agreement in place
12
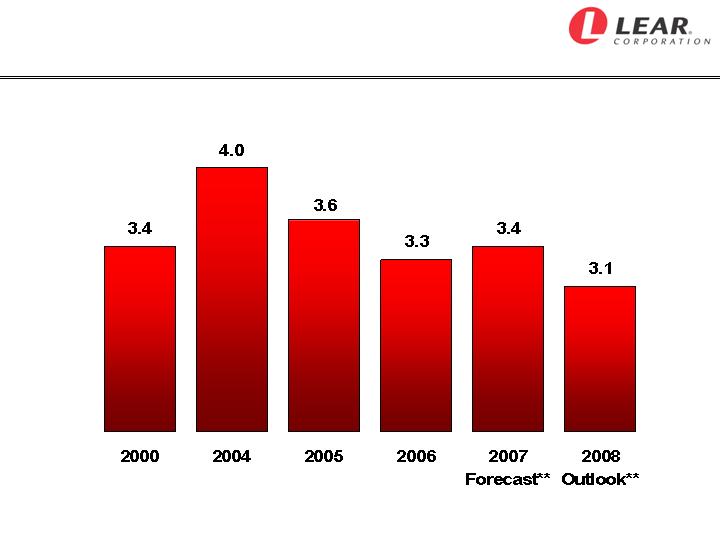
Lower Production Of Full-Size Pick-Ups And
Large SUVs In North America Since 2004 Peak*
* Please see slide titled “Forward-Looking Statements” at the end of this presentation for further information.
** 2007 Forecast and 2008 Outlook reflects CSM Worldwide forecast/outlook.
Production of Full-Size Pick-Ups and Large SUVs in North America
(in millions of units)
13
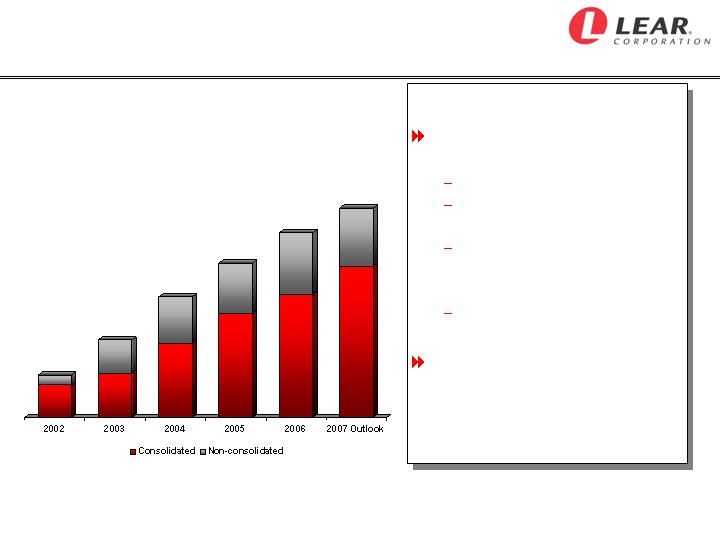
Aggressively Growing Total Asian Sales***
Total Asian Sales -- Core Businesses **
($ in millions)
2007 Highlights
Significant market position
in China:
Total sales > $700 million*
Supply 20+ OEMs on
> 100 vehicle programs
19 manufacturing facilities
with approximately 6,000
employees
Lear’s fastest growing
market
11 new facilities in China
and India supporting Ford,
Mazda, Chery, Tata, M&M,
BMW and Hyundai
* Includes consolidated and non-consolidated sales.
$500
$950
$1,450
$1,850
~$2,850
$2,200
Targeting Continued Asian Growth
** Includes sales in Asia and with Asian manufacturers globally.
*** Please see slide titled “Forward-Looking Statements” at the end of this presentation for further information.
14

Restructuring Plan Update
$104
~$125
~
$100
0
25
50
75
100
125
150
2005
2006
2007 Outlook
~$70
~
~$125
~
~$150
~
0
50
100
150
2006
2007 Outlook
Ongoing Annual
Restructuring Investments
Estimated Annual Savings
($ in millions)
($ in millions)
$
YTD $88
$
Objectives: eliminate excess capacity, improve operating efficiency in
response to structural changes within the industry and accelerate our move
move to low-cost countries.
Present Status: closure of 17 manufacturing facilities, numerous
consolidations of administrative centers and technical locations, reduced
global headcount by over 5% and increased sourcing and engineering in
low-cost countries.
Investment: implementing a $300 million overall restructuring plan. We
now expect to invest an additional $25 million this year, bringing the total to
about $325 million.
Savings: estimated savings for 2007 and ongoing increased to reflect
additional investment and improved payback.
15

New Pattern UAW Labor Agreement
New pattern UAW contract reached without a major production disruption
Major contract provisions significantly improve automaker competitiveness
and preserve union benefits
Agreements include an innovative VEBA trust for retiree health care
liability, a second-tier wage and benefit structure and restrictions on further
outsourcing
We intend to maintain a fully-competitive wage and benefit structure going
forward
We do not see a fundamental change in the overall sourcing patterns for
our core seating, electrical distribution and electronic products
16

Third-Quarter 2007
Results and Outlook
17
Third-Quarter special items include:
Costs related to restructuring actions
Costs related to AREP merger transaction
Settlement of transaction-related items from divestiture of Interior
business
Third-Quarter core operating earnings were $170 million, up $70 million
from a year ago, reflecting:
Favorable cost performance and operating efficiencies
Net savings from restructuring initiative
Benefit of new business outside of North America
Full-Year outlook increased to reflect lower production risk and more
favorable operating performance:
Core operating earnings increased to $680 million range
Free cash flow now expected in the $350 million range
Financial Summary*
* Core operating earnings represent income before interest, other expense, income taxes, restructuring costs and other special items, excluding the
divested Interior business. Free cash flow represents net cash provided by operating activities before the net change in sold accounts receivable, less
capital expenditures. Please see slides titled “Non-GAAP Financial Information” and “Forward Looking Statements” at the end of this presentation for
further information.
18
Third Quarter 2007
Industry Environment
Third Quarter
Third Quarter
2007
2007 vs. 2006
North American Production
Industry
3.5 mil
Up 4%
Big Three
2.2 mil
Up 1%
Lear's Top 15 Platforms
1.1 mil
Down 1%
European Production
Industry
4.3 mil
Up 2%
Lear's Top 5 Customers
2.2 mil
Up 2%
Key Commodities (Quarterly Average)
vs. Prior Quarter
Steel (Hot Rolled)
Down 6%
Down 15%
Crude Oil
Up 16%
Up 7%
Copper
Flat
Down 1%
19
Third Quarter 2007
Reported Financial Results
20
* Please see slides titled “Non-GAAP Financial Information” at the end of this presentation for further information.
(in millions, except net income per share)
Third
Quarter 2007
Third
Quarter 2006
3Q '07
B/(W) 3Q '06
Net Sales
$3,574.6
$4,069.7
($495.1)
Income Before Interest, Other Expense and
Income Taxes*
$108.0
$28.8
$79.2
Pretax Income (Loss)
$60.1
($65.9)
$126.0
Net Income (Loss)
$41.0
($74.0)
$115.0
Net Income (Loss) Per Share
$0.52
($1.10)
$1.62
SG&A % of Net Sales
4.5
%
3.9
%
(0.6)
pts.
Interest Expense
$47.5
$56.6
$9.1
Depreciation / Amortization
$70.7
$98.1
$27.4
Other Expense, Net
$17.5
$9.4
($8.1)
Third Quarter 2007
Restructuring Costs and Other Special Items*
21
* Please see slides titled “Non-GAAP Financial Information” at the end of this presentation for further information.
Third Quarter
(in millions)
Income Before
Interest, Other
Expense and
Income Taxes
Reported Results
2007 Total Company
$ 108.0
Reported Results Include the Following Items:
COGS
SG&A
Costs related to restructuring actions
$ 37.3
35.3
$
2.0
$
Costs related to merger transaction
25.1
-
25.1
2007 Core Operating Earnings
170.4
$
2006 Core Operating Earnings
100.1
$
Income Statement Category

Third Quarter 2007
Net Sales Changes and Margin Impact Versus Prior Year
22
Net Sales
Margin
Performance Factor
Change
Impact
Comments
(in millions)
Industry Production /
Platform Mix / Net Pricing
$ (64)
Negative
Primarily industry pricing and unfavorable
platform mix in North America offset in part
by favorable industry production
Global New Business
174
Positive
Mainly seating programs outside North
America
F/X Translation
149
Neutral
Euro up 8%, Canadian dollar up 7%
Acquisition / Divestiture
(754)
Positive
Divestiture of Interior business
Performance
Positive
Favorable operating performance in core
businesses, including benefits from
restructuring actions and efficiency actions
Third Quarter 2007
Business Segment Results***
23
* Reported segment earnings represent income (loss) before interest, other expense and income taxes.
** Adjusted earnings and margin exclude restructuring costs and other special items as follows – in the third quarter of 2007, adjustments for seating -
$19.5M, electrical and electronic - $9.8M, HQ - $33.1M and core business and total company - $62.4M and in the third quarter of 2006, adjustments for
seating - $7.8M, electrical and electronic - $7.1M, HQ - $0.6M, core business - $15.5M and total company - $17.4M.
*** Please see slides titled “Non-GAAP Financial Information” at the end of this presentation for further information.
($ in millions)
Seating
Margin
Margin
Net Sales
2,881.4
$
2,633.0
$
Reported Segment Earnings*
181.2
$
6.3%
125.6
$
4.8%
Adjusted Earnings**
200.7
$
7.0%
133.4
$
5.1%
Electrical and Electronic
Net Sales
693.2
$
682.6
$
Reported Segment Earnings*
4.0
$
0.6%
16.4
$
2.4%
Adjusted Earnings**
13.8
$
2.0%
23.5
$
3.4%
Headquarters Costs
Reported Segment Earnings*
(77.2)
$
(57.4)
$
Adjusted Earnings**
(44.1)
$
(56.8)
$
Core Business
Net Sales
3,574.6
$
3,315.6
$
Reported Earnings*
108.0
$
3.0%
84.6
$
2.6%
Adjusted Earnings**
170.4
$
4.8%
100.1
$
3.0%
Total Company
Net Sales
3,574.6
$
4,069.7
$
Reported Earnings*
108.0
$
3.0%
28.8
$
0.7%
Adjusted Earnings**
170.4
$
4.8%
46.2
$
1.1%
2007
2006
Third Quarter
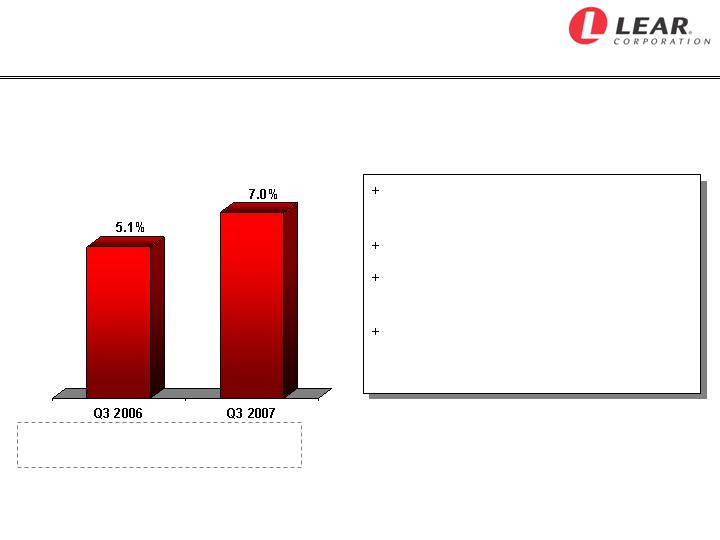
Third Quarter 2007
Seating Segment Performance*
Explanation of
Year-to-Year Change
Favorable cost performance from
restructuring
On-going efficiency actions
Margin improvement actions,
including selective vertical integration
Benefit of new business, primarily
outside of North America
* Please see slides titled “Non-GAAP Financial Information” at the end of this presentation for further information.
Adj. Seg.
Earnings
(in millions)
$133.4 $200.7
Adjusted Seating Margin
24
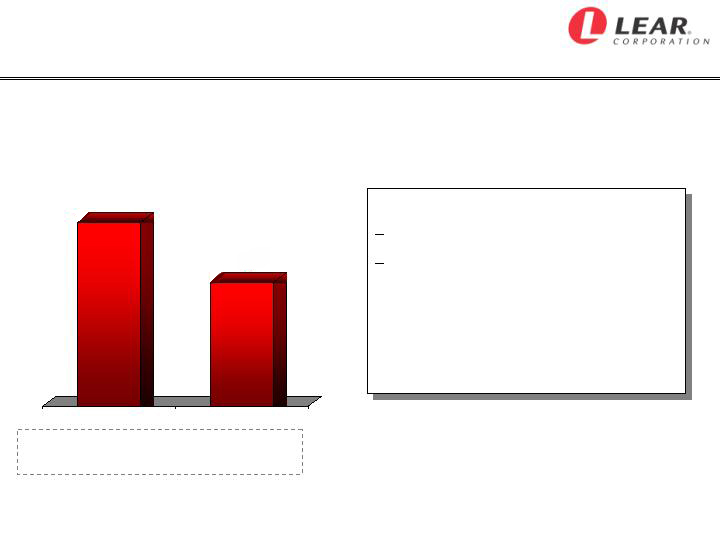
Third Quarter 2007
Electrical and Electronic Segment Performance*
Explanation of
Year-to-Year Change
Unfavorable net pricing
Roll-off of several large programs
in North America
+ Slightly lower copper prices and
favorable prior period recovery
3.4%
2.0%
Q3 2006
Q3 2007
Adj. Seg.
Earnings
(in millions)
$23.5 $13.8
Adjusted
Electrical and Electronic Margin
* Please see slides titled “Non-GAAP Financial Information” at the end of this presentation for further information.
25

Third Quarter 2007
Free Cash Flow*
* Free Cash Flow represents net cash provided by operating activities ($62.0 million for the three months and $309.5 million for
the nine months ended 9/29/07) before net change in sold accounts receivable ($74.6 million for the three months and $67.3
million for the nine months ended 09/29/07) (Cash from Operations), less capital expenditures. Please see slides titled “Non-
GAAP Financial Information” at the end of this presentation for further information.
Third
Quarter 2007
Nine Months
2007
Net Income
$ 41.0
$ 214.5
Depreciation / Amortization
70.7
220.9
Working Capital / Other
24.9
(58.6)
Cash from Operations
$ 136.6
$ 376.8
Capital Expenditures
(45.8)
(114.1)
Free Cash Flow
$ 90.8
$ 262.7
(in millions)
26
2007 Outlook
Full-Year Production Assumptions*
Full-Year
Change from
2007 Outlook
Prior Year
North American Production
Total Industry
~ 15.0 mil
~
down 2%
Big Three
~ 9.4 mil
~
down 6%
Lear's Top 15 Platforms
~ 4.5 mil
~
down 8%
European Production
Total Industry
~ 19.7 mil
~
up 3%
Lear's Top 5 Customers
~10.1 mil
~
up 3%
Euro
$1.35 / Euro
up 8%
* Please see slide titled “Forward-Looking Statements” at the end of this presentation for further information.
27
2007 Outlook
Full-Year Financial Forecast*
2007 Full-Year
Financial Forecast
for Core Businesses
Net Sales
~ $15 billion
~
Core Operating Earnings
~ $680 million
~
Income before interest, other expense,
income taxes, restructuring
costs and other special items
Interest Expense
~ $200 million
~
Pretax Income
~ $430 million
~
before restructuring costs
and other special items
Estimated Tax Expense
~ $135 million
~
**
Pretax Restructuring Costs
~ $125 million
~
Capital Spending
~ $200 million
~
Depreciation and Amortization
~ $300 million
~
Free Cash Flow
~ $350 million
~
** Subject to actual mix of earnings by country.
* Please see slides titled “Non-GAAP Financial Information” and “Forward-Looking Statements” at the end of this presentation for
further information.
28
Preliminary 2008 Outlook*
Industry Production Preliminary 2008 Assessment
North America - Generally in-line with 2007 outlook
Europe - Up slightly from 2007 outlook
Lear Factors
Sales Backlog - About $300 million
N.A. Platform Mix - Negative, reflecting lower production of
�� full-size pick-up trucks and large SUVs
Selected 2008 Financial Metrics
Net Sales - About flat with 2007 outlook
Core Operating Earnings - Generally in-line with 2007 outlook
(excluding restructuring-related costs)
* Please see slide titled “Forward-Looking Statements” at the end of this presentation for further information.
29

Summary and Outlook*
Lear is financially sound
Nine months financial results show solid improvement
Full-year 2007 earnings and cash flow forecast increased
Making progress on strategic priorities
Completed divestiture of Interior business
Expanding in Asia and growing Asian sales globally
Implementing global restructuring initiative
Actively evaluating options to strengthen and grow our
Electrical and Electronic business
Preliminary 2008 financial outlook in-line with 2007
Despite lower forecast production for full-size pick-ups and
large SUVs in North America
Longer-term outlook for Lear continues to be positive
Please see slide titled “Forward-Looking Statements” at the end of this presentation for further information.
30
ADVANCE RELENTLESSLY™
www.lear.com
LEA
NYSE
Listed
R
31

In addition to the results reported in accordance with accounting principles generally accepted in the United States (“GAAP”) included
throughout this presentation, the Company has provided information regarding “income before interest, other expense and income taxes,”
“income before interest, other expense, income taxes, restructuring costs and other special items, excluding the divested Interior business”
(core operating earnings), “pretax income before restructuring costs and other special items” and “free cash flow” (each, a non-GAAP
financial measure). Other expense includes, among other things, state and local non-income taxes, foreign exchange gains and losses,
fees associated with the Company’s asset-backed securitization and factoring facilities, minority interests in consolidated subsidiaries,
equity in net income of affiliates and gains and losses on the sale of assets. Free cash flow represents net cash provided by operating
activities before the net change in sold accounts receivable, less capital expenditures. The Company believes it is appropriate to exclude
the net change in sold accounts receivable in the calculation of free cash flow since the sale of receivables may be viewed as a substitute
for borrowing activity.
Management believes the non-GAAP financial measures used in this presentation are useful to both management and investors in their
analysis of the Company’s financial position and results of operations. In particular, management believes that income before interest, other
expense and income taxes, core operating earnings and pretax income before restructuring costs and other special items are useful
measures in assessing the Company’s financial performance by excluding certain items (including those items that are included in other
expense) that are not indicative of the Company's core operating earnings or that may obscure trends useful in evaluating the Company’s
continuing operating activities. Management also believes that these measures are useful to both management and investors in their
analysis of the Company's results of operations and provide improved comparability between fiscal periods. Management believes that free
cash flow is useful to both management and investors in their analysis of the Company’s ability to service and repay its debt. Further,
management uses these non-GAAP financial measures for planning and forecasting in future periods.
Income before interest, other expense and income taxes, core operating earnings, pretax income before restructuring costs and other
special items and free cash flow should not be considered in isolation or as a substitute for pretax income (loss), net income (loss), cash
provided by operating activities or other income statement or cash flow statement data prepared in accordance with GAAP or as a measure
of profitability or liquidity. In addition, the calculation of free cash flow does not reflect cash used to service debt and therefore, does not
reflect funds available for investment or other discretionary uses. Also, these non-GAAP financial measures, as determined and presented
by the Company, may not be comparable to related or similarly titled measures reported by other companies.
Set forth on the following slides are reconciliations of these non-GAAP financial measures to the most directly comparable financial
measures calculated and presented in accordance with GAAP. Given the inherent uncertainty regarding special items, other expense and
the net change in sold accounts receivable in any future period, a reconciliation of forward-looking financial measures to the most directly
comparable financial measures calculated and presented in accordance with GAAP is not feasible. The magnitude of these items, however,
may be significant.
Non-GAAP Financial Information
32
Non-GAAP Financial Information
Core Operating Earnings
Three Months
(in millions)
Q3 2007
Q3 2006
Pretax income (loss)
$ 60.1
$ (65.9)
Divestiture of Interior business
(17.1)
28.7
Interest expense
47.5
56.6
Other expense, net *
17.5
9.4
Income before interest, other expense and income taxes
$ 108.0
$ 28.8
Costs related to restructuring actions
37.3
17.4
Costs related to merger transaction
25.1
-
Income before interest, other expense, income taxes,
restructuring costs and other special items
170.4
$
46.2
$
Less: Interior business
-
53.9
Income before interest, other expense, income taxes, restructuring
costs and other special items, excluding the divested Interior
business
$ 170.4
$ 100.1
(core operating earnings)
* Includes minority interests in consolidated subsidiaries and equity in net income of affiliates.
33

Non-GAAP Financial Information
Segment Earnings Reconciliation
Three Months
(in millions)
Q3 2007
Q3 2006
Seating
$ 181.2
$ 125.6
Electrical and electronic
4.0
16.4
Interior
-
(55.8)
Segment earnings
185.2
86.2
Corporate and geographic headquarters and elimination of
intercompany activity
(77.2)
(57.4)
Income before interest, other expense and income taxes
$ 108.0
$ 28.8
Divestiture of Interior business
(17.1)
28.7
Interest expense
47.5
56.6
Other expense, net
17.5
9.4
Pretax income (loss)
$ 60.1
$ (65.9)
34
Non-GAAP Financial Information
Adjusted Segment Earnings
35
Three Months Q3 2007
Electrical and
HQ/
Core
Total
(in millions)
Seating
Electronic
Other
Businesses
Interior
Company
Segment earnings
181.2
$
4.0
$
(77.2)
$
108.0
$
-
$
108.0
$
Costs related to restructuring actions
19.5
9.8
8.0
37.3
-
37.3
Costs related to merger transaction
-
-
25.1
25.1
-
25.1
Adjusted segment earnings
200.7
$
13.8
$
(44.1)
$
170.4
$
-
$
170.4
$
Three Months Q3 2006
Electrical and
HQ/
Core
Total
(in millions)
Seating
Electronic
Other
Businesses
Interior
Company
Segment earnings
125.6
$
16.4
$
(57.4)
$
84.6
$
(55.8)
$
28.8
$
Costs related to restructuring actions
7.8
7.1
0.6
15.5
1.9
17.4
Adjusted segment earnings
133.4
$
23.5
$
(56.8)
$
100.1
$
(53.9)
$
46.2
$

Non-GAAP Financial Information
Cash from Operations and Free Cash Flow
36
Three Months
Nine Months
(in millions)
Q3 2007
Q3 2007
Net cash provided by operating activities
$ 62.0
$ 309.5
Net change in sold accounts receivable
74.6
67.3
Net cash provided by operating activities
before net change in sold accounts receivable
(cash from operations)
136.6
376.8
Capital expenditures
(45.8)
(114.1)
Free cash flow
$ 90.8
$ 262.7

Forward-Looking Statements
This presentation contains forward-looking statements within the meaning of the Private Securities
Litigation Reform Act of 1995, including statements regarding anticipated financial results and liquidity.
Actual results may differ materially from anticipated results as a result of certain risks and uncertainties,
including but not limited to, general economic conditions in the markets in which the Company operates,
including changes in interest rates or currency exchange rates, the financial condition of the Company’s
customers or suppliers, fluctuations in the production of vehicles for which the Company is a supplier, the
loss of business with respect to, or the lack of commercial success of, a vehicle model for which the
Company is a significant supplier, disruptions in the relationships with the Company’s suppliers, labor
disputes involving the Company or its significant customers or suppliers or that otherwise affect the
Company, the Company's ability to achieve cost reductions that offset or exceed customer-mandated
selling price reductions, the outcome of customer productivity negotiations, the impact and timing of
program launch costs, the costs, timing and success of restructuring actions, increases in the Company's
warranty or product liability costs, risks associated with conducting business in foreign countries,
competitive conditions impacting the Company's key customers and suppliers, raw material costs and
availability, the Company's ability to mitigate the significant impact of increases in raw material, energy and
commodity costs, the outcome of legal or regulatory proceedings to which the Company is or may become
a party, unanticipated changes in cash flow, including the Company’s ability to align its vendor payment
terms with those of its customers and other risks described from time to time in the Company's Securities
and Exchange Commission filings.
This presentation also contains information on the Company’s sales backlog. The Company’s incremental
sales backlog reflects: anticipated net sales from formally awarded new programs and open replacement
programs, less phased-out and cancelled programs. The calculation of backlog does not reflect customer
price reductions on existing or newly awarded programs. The backlog may be impacted by various
assumptions embedded in the calculation, including vehicle production levels on new and replacement
programs, foreign exchange rates and the timing of major program launches. Lear’s preliminary 2008
sales backlog is based on an exchange rate of $1.40/per Euro and industry production assumptions: in
North America, generally in line with 15.0 million units in 2007; and in Europe, up slightly from 19.7 million
units in 2007.
The forward-looking statements in this presentation are made as of the date hereof, and the Company
does not assume any obligation to update, amend or clarify them to reflect events, new information or
circumstances occurring after the date hereof.
37