
July 29, 2008
Second Quarter Results and
2008 Financial Outlook
Exhibit 99.2

Agenda
Company Overview
Bob Rossiter, Chairman, CEO and President
Second Quarter Results and 2008 Financial Outlook
Matt Simoncini, SVP and CFO
Q and A Session

Company Overview
Business Conditions Very Challenging*
North American industry production down sharply:
Second quarter down 15% from a year ago
Full-year outlook lowest since the early 1990s
Dramatic shift away from full-size pickups and large SUVs in
North America:
Second quarter down 37% from a year ago
Full-year outlook down 42% from peak in 2004
Continued restructuring at major North American customers
High raw material and energy prices persist
European production relatively stable
Continued strong growth in emerging markets
* Please see slide titled “Forward-Looking Statements” at the end of this presentation for further information.
Challenging Conditions Likely To Continue Into 2009
Lear is Proactively Addressing the Challenges*
Maintained solid operating fundamentals globally
Accelerating progress on global restructuring initiative
Winning significant new business globally
Continuing to diversify our sales mix
Investing in our electrical and electronic business
Proactively managing our liquidity position
* Please see slide titled “Forward-Looking Statements” at the end of this presentation for further information.
Maintaining Solid Operating Results As We
Aggressively Restructure And Reposition The Company
Sales Growth and Diversification*
Net new business wins since January total about $600 million:
˜ $60 million in 2009
˜ $300 million in 2010
˜ $240 million beyond 2010
Composition of net new business further diversifies sales:
Primarily outside of North America
55% in electrical and electronics
25% Domestic Three and 75% European and Asian automakers
In addition, non-consolidated new business wins total
approximately $150 million
Continuing To Grow And Diversify Global Sales
* Please see slide titled “Forward-Looking Statements” at the end of this presentation for further information.
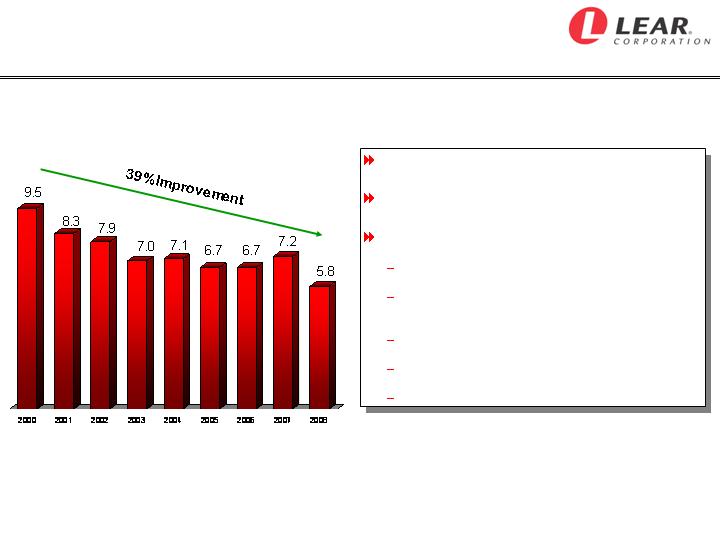
19% Year-Over-Year Improvement in TGW
39% Improvement since 2000 in TGW
Lear leads the industry in key segments:
Best Compact Premium Seat Quality–Porsche Cayman
Best Midsize Premium Sporty Seat Quality–Chevrolet
Corvette Coupe
Best Midsize Utility Seat Quality–Dodge Durango
Best Large Pickup Seat Quality–Dodge Ram HD
Best Midsize CUV Seat Quality–Hyundai Santa Fe
Source: 2008 J.D. Power Seat Quality and Satisfaction Report
Lear’s Highlights from
2008 J.D. Power Survey
Things Gone Wrong (TGW)
per 100 vehicles
Leadership in Seat Quality
Highest Quality Major Seat Manufacturer
For 7 Of Last 8 Years
Operating Priorities
Business conditions in North America have deteriorated
rapidly this year and are likely to remain challenging into
2009
In response, the Lear team is focused on:
Maintaining operational excellence
Further diversifying our sales outside of North America
Implementing structural cost reduction actions
Selectively investing in growth opportunities
Proactively managing our liquidity position
We are well positioned to weather the downturn and to
emerge even stronger when external factors improve
Improving Our Business Structure
For Long-Term Success

Second Quarter Results
and 2008 Financial Outlook
Second Quarter 2008
Financial Summary*
Major Factors Impacting Second-Quarter 2008 Results
Difficult North American production environment, with industry down
15% and Domestic Three down 21% from a year ago
Raw material and energy prices remained high
Continued benefits of restructuring actions
Second-Quarter 2008 Results Solid
Net sales of $4.0 billion
Core operating earnings of $164 million**
Free cash flow of $16 million**
Full-Year 2008 Earnings Outlook Updated to Reflect
Lower North American industry production of 13.5 million units vs.
13.8 million units in June 4 outlook
Core operating earnings reduced to $550 to $600 million, reflecting
the lower production outlook in North America
** Core operating earnings represents income before interest, other expense, income taxes, restructuring costs and other special items. Free cash
flow represents net cash provided by operating activities before the net change in sold accounts receivable, less capital expenditures.
Please see slides titled “Non-GAAP Financial Information” and “Forward-Looking Statements” at the end of this presentation for further information.
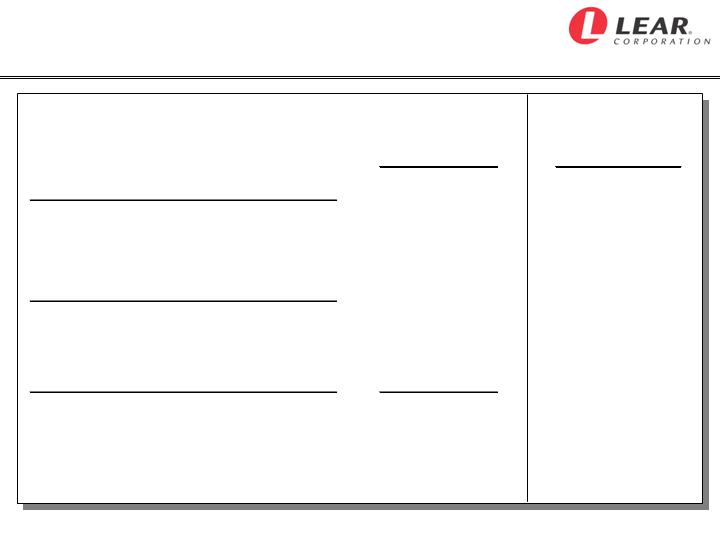
Second Quarter 2008
Industry Environment
Second Quarter
Second Quarter
2008
2008 vs. 2007
North American Production
Industry
3.4 mil
down 15%
Domestic Three
2.1 mil
down 21%
Lear's Top 15 Platforms
0.8 mil
down 30%
European Production
Industry
5.5 mil
up 4%
Lear's Top 5 Customers
2.8 mil
up 3%
Key Commodities (Quarterly Average)
vs. Prior Quarter
Steel (Hot Rolled)
up 37%
up 64%
Copper
up 7%
up 10%
Crude Oil
up 27%
up 91%
Foam-Related Chemicals
up 3%
up 13%

Second Quarter 2008
Reported Financials
* Please see slides titled “Non-GAAP Financial Information” at the end of this presentation for further information.
(in millions, except net income per share)
Second
Quarter 2008
Second
Quarter 2007
2Q '08
B/(W) 2Q '07
Net Sales
$3,979.0
$4,155.3
($176.3)
Income Before Interest, Other Expense and
Income Taxes*
$105.5
$194.8
($89.3)
Pretax Income
$55.8
$143.9
($88.1)
Net Income
$18.3
$123.6
($105.3)
Net Income Per Share
$0.23
$1.58
($1.35)
SG&A % of Net Sales
3.9
%
3.4
%
(0.5)
pts.
Interest Expense
$45.6
$51.3
$5.7
Depreciation / Amortization
$77.4
$75.7
($1.7)
Other Expense, Net
$4.1
$0.3
($3.8)
Second Quarter 2008
Restructuring Impact*
Second Quarter
Income Before Interest,
Other Expense
and Income Taxes
* Please see slides titled “Non-GAAP Financial Information” at the end of this presentation for further information.
(in millions)
Reported Results
2008 Total Company
$ 105.5
Reported Results Include the Following Items:
COGS
SG&A
Costs related to restructuring actions
$ 58.3
47.9
$
10.4
$
2008 Core Operating Earnings
163.8
$
2007 Core Operating Earnings
229.3
$
Income Statement Category
Second Quarter 2008
Net Sales Changes and Margin Impact
Net Sales
Margin
Performance Factor
Change
Impact
Comments
(in millions)
Industry Production /
Platform Mix / Net Pricing
$ (554)
Negative
Lower production and unfavorable platform
mix in North America, including impact of
American Axle strike
Global New Business
64
Neutral
Lincoln MKS and Saturn VUE in North
America, Audi A4 in Europe and numerous
programs in Asia
F/X Translation
314
Neutral
Euro up 16%, Canadian dollar up 9%
Performance
Positive
Favorable operating performance, including
efficiency actions and benefits from
restructuring actions
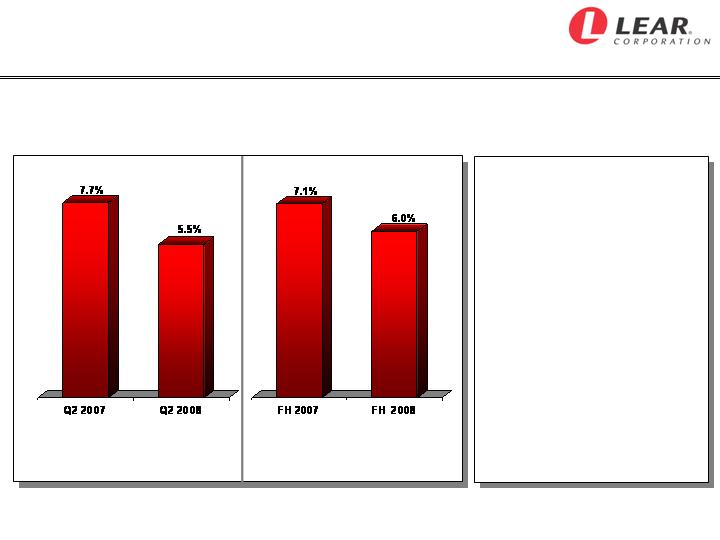
Second Quarter 2008
Seating Performance*
Explanation of
Year-to-Year Change Q2
* Please see slides titled “Non-GAAP Financial Information” at the end of this presentation for further information.
Second Quarter
(in mils)
Sales
Earnings**
Adj. Earnings**
$3,264.5 $3,141.2
$ 238.8 $ 130.0
$ 250.4 $ 173.2
** Reported segment earnings represents income before interest, other expense and income taxes; adjusted segment earnings represents
reported segment earnings adjusted for restructuring costs and other special items.
Adjusted Seating Segment Margins
Sales Factors
Decreased, driven by lower
industry production and
unfavorable platform mix in North
America, partially offset by
favorable foreign exchange
Margin Performance
Declined, reflecting the impact of
lower production in North
America, offset in part by
favorable cost performance,
including restructuring savings
First Half
$6,258.7 $6,177.3
$ 435.9 $ 313.3
$ 442.9 $ 370.1
Explanation of
Year-to-Year Change Q2
* Please see slides titled “Non-GAAP Financial Information” at the end of this presentation for further information.
Second Quarter
(in mils)
Sales
Earnings**
Adj. Earnings**
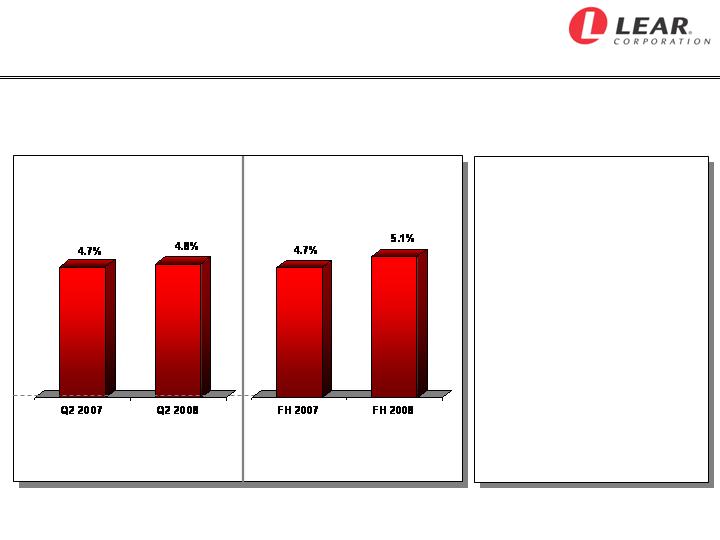
$ 825.1 $ 837.8
$ 23.5 $ 31.2
$ 38.6 $ 40.6
** Reported segment earnings represents income before interest, other expense and income taxes; adjusted segment earnings represents
reported segment earnings adjusted for restructuring costs and other special items.
Sales Factors
Increased, driven by favorable
foreign exchange and the
addition of new business,
partially offset by lower industry
production in North America
Margin Performance
Improved slightly, reflecting
favorable operating performance,
including restructuring savings,
as well as the recovery of
previously-incurred program-
related engineering expenditures
First Half
$1,613.8 $1,659.3
$ 41.0 $ 66.5
$ 76.1 $ 85.4
Second Quarter 2008
Electrical and Electronic Performance*
Adjusted Electrical and Electronic Segment Margins
Second Quarter 2008
Free Cash Flow*
* Free cash flow represents net cash provided by operating activities ($68.4 million for the three months ended 6/28/08) before net
change in sold accounts receivable (($2.7) million for the three months ended 6/28/08) (Cash from Operations), less capital
expenditures. Please see slides titled “Non-GAAP Financial Information” at the end of this presentation for further information.
(in millions)
Second
Quarter
2008
Net Income
$ 18.3
Depreciation / Amortization
77.4
Working Capital / Other
(30.0)
Cash from Operations
$ 65.7
Capital Expenditures
(50.0)
Free Cash Flow
$ 15.7
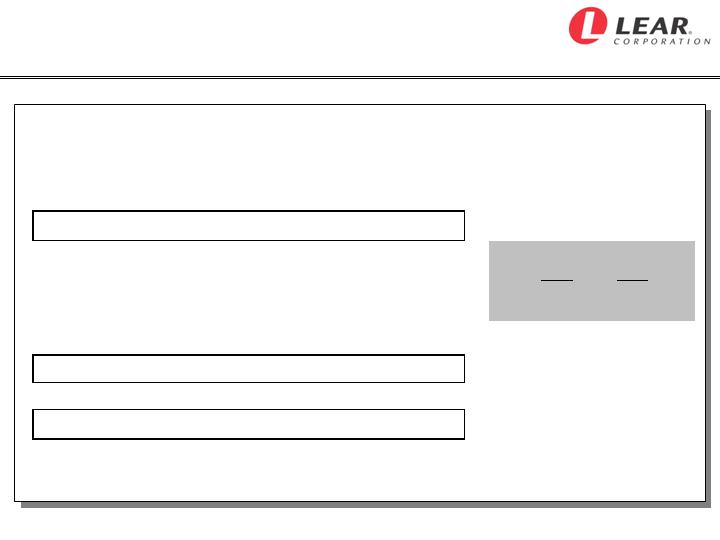
2008 Outlook
Global Industry Production*
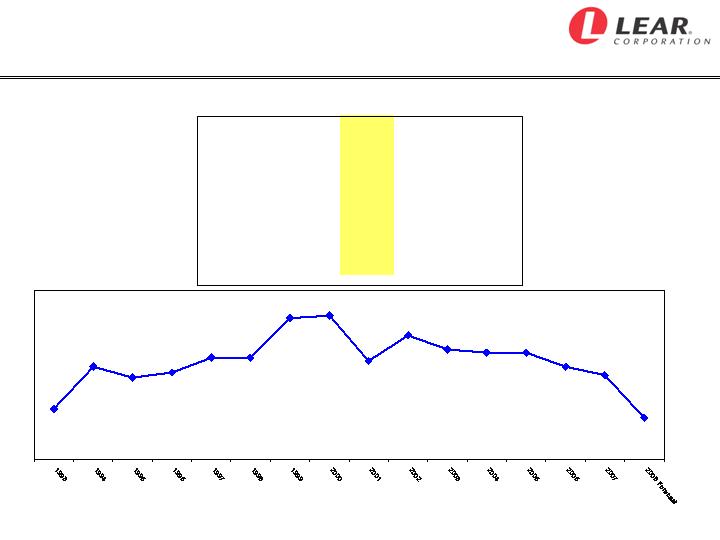
2008 Industry Production Forecast
(in millions of vehicles)
North American Production
13.8
17.2
13.5
Global Automotive Industry Production Up 2% For 2008
(in millions)
* Please see slide titled “Forward-Looking Statements” at the end of this presentation for further information.
Source: CSM Worldwide & Company estimates
B/(W) 2007
2008
Major Market
up 2%
˜ 70.0
Global
11%
1.7
Russia
27%
2.4
India
15%
3.0
Brazil
14%
7.9
China
1%
20.3
Europe
(10)%
13.5
North America
2008 Outlook
Full-Year Financial Forecast*
* Please see slides titled “Non-GAAP Financial Information” and “Forward-Looking Statements” at the end of this presentation for
further information.
** Subject to actual mix of earnings by country.
2008 Full-Year
Financial Forecast
Net Sales
˜ $15.0 billion
Core Operating Earnings
$550 to $600 million
Income before interest, other expense,
income taxes, restructuring
costs and other special items
Interest Expense
$190 to $200 million
Pretax Income
$325 to $375 million
before restructuring costs
and other special items
Estimated Tax Expense
˜ $125 million
**
Pretax Restructuring Costs
˜ $140 million
Capital Spending
$230 to $250 million
Depreciation and Amortization
˜ $300 million
Free Cash Flow
˜ $150 million
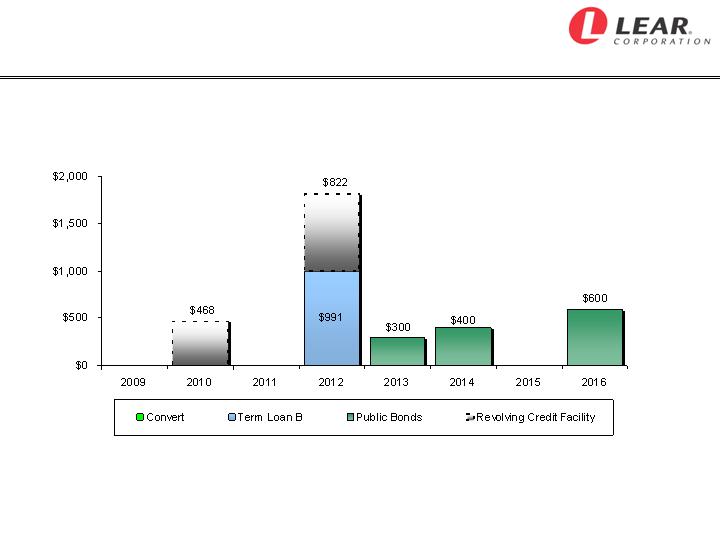
Committed Liquidity Until 2012*
($ in millions)
2 $1.0 billion term loan amortizes at $6.0m per year, with $967 million due at maturity in 2012.
3 Excludes $0.8M of convertible notes that can be called by Lear at any time.
1 Revolving line of credit of $1.3 billion, $468 million of which matures on March 23, 2010 and $822 million of which matures on January 31, 2012.
Debt Maturities Following July 2008 Bank Amendment
2
3
1
4
4 An irrevocable call notice for the remaining $41 million of outstanding bonds due 2009 was executed in connection with the July 2008 bank
amendment. These bonds will be retired on August 4, 2008 with cash.
1
* Please see slide titled “Forward-Looking Statements” at the end of this presentation for further information.
Summary and Outlook*
Business structure improvements being aggressively implemented to
improve long-term competitiveness:
Aggressive actions to improve cost structure
Continued sales diversification
Further low-cost footprint expansion
Selective vertical integration
Adopted global operating structure for business units
Implementing improvement plan for electrical and electronics
Second quarter 2008 financial results:
Net sales of $4.0 billion
Core operating earnings of $164 million
Continued focus on quality, service and innovation
Lear remains solidly profitable with full-year 2008 outlook for core
operating earnings of $550 to $600 million
Recent bank amendment provides committed liquidity until 2012
Longer-term financial outlook continues to be positive
Please see slides titled “Non-GAAP Financial Information” and “Forward-Looking Statements” at the end of this presentation for further
information.
ADVANCE RELENTLESSLY™
www.lear.com
LEA
NYSE
Listed
R

In addition to the results reported in accordance with accounting principles generally accepted in the United States (“GAAP”) included throughout this
presentation, the Company has provided information regarding “income before interest, other expense and income taxes,” “income before interest, other
expense, income taxes, restructuring costs and other special items” (core operating earnings), “pretax income before restructuring costs and other special
items” and “free cash flow” (each, a non-GAAP financial measure). Other expense includes, among other things, non-income related taxes, foreign
exchange gains and losses, discounts and expenses associated with the Company’s asset-backed securitization and factoring facilities, minority interests
in consolidated subsidiaries, equity in net income of affiliates and gains and losses on the sale of assets. Free cash flow represents net cash provided by
operating activities before the net change in sold accounts receivable, less capital expenditures. The Company believes it is appropriate to exclude the
net change in sold accounts receivable in the calculation of free cash flow since the sale of receivables may be viewed as a substitute for borrowing activity.
Management believes the non-GAAP financial measures used in this presentation are useful to both management and investors in their analysis of the
Company’s financial position and results of operations. In particular, management believes that income before interest, other expense and income taxes,
core operating earnings and pretax income before restructuring costs and other special items are useful measures in assessing the Company’s financial
performance by excluding certain items (including those items that are included in other expense) that are not indicative of the Company's core operating
earnings or that may obscure trends useful in evaluating the Company’s continuing operating activities. Management also believes that these measures
are useful to both management and investors in their analysis of the Company's results of operations and provide improved comparability between fiscal
periods. Management believes that free cash flow is useful to both management and investors in their analysis of the Company’s ability to service and
repay its debt. Further, management uses these non-GAAP financial measures for planning and forecasting in future periods.
Income before interest, other expense and income taxes, core operating earnings, pretax income before restructuring costs and other special items and
free cash flow should not be considered in isolation or as a substitute for pretax income, net income, cash provided by operating activities or other income
statement or cash flow statement data prepared in accordance with GAAP or as a measure of profitability or liquidity. In addition, the calculation of free
cash flow does not reflect cash used to service debt and therefore, does not reflect funds available for investment or other discretionary uses. Also, these
non-GAAP financial measures, as determined and presented by the Company, may not be comparable to related or similarly titled measures reported by
other companies.
Set forth on the following slides are reconciliations of these non-GAAP financial measures to the most directly comparable financial measures calculated
and presented in accordance with GAAP. Given the inherent uncertainty regarding special items, other expense and the net change in sold accounts
receivable in any future period, a reconciliation of forward-looking financial measures to the most directly comparable financial measures calculated and
presented in accordance with GAAP is not feasible. The magnitude of these items, however, may be significant.
Non-GAAP Financial Information

Non-GAAP Financial Information
Core Operating Earnings
Three Months
(in millions)
Q2 2008
Q2 2007
Pretax income
$ 55.8
$ 143.9
Divestiture of Interior business
-
(0.7)
Interest expense
45.6
51.3
Other expense, net *
4.1
0.3
Income before interest, other expense and income taxes
$ 105.5
$ 194.8
Restructuring costs and other special items -
Costs related to restructuring actions
58.3
34.8
Additional costs related to Interior divestiture (COS and SG&A)
-
1.8
Costs related to merger transaction
-
2.3
Less: Interior business
-
(4.4)
Income before interest, other expense, income taxes,
restructuring costs and other special items
$ 163.8
$ 229.3
(core operating earnings)
* Includes minority interests in consolidated subsidiaries and equity in net income of affiliates.
Non-GAAP Financial Information
Segment Earnings Reconciliation
Three Months
Six Months
(in millions)
Q2 2008
Q2 2007
Q2 2008
Q2 2007
Seating
$ 130.0
$ 238.8
$ 313.3
$ 435.9
Electrical and electronic
31.2
23.5
66.5
41.0
Interior
-
(0.6)
-
8.2
Segment earnings
161.2
261.7
379.8
485.1
Corporate and geographic headquarters and elimination of
intercompany activity
(55.7)
(66.9)
(111.4)
(105.9)
Income before interest, other expense and
income taxes
$ 105.5
$ 194.8
$ 268.4
$ 379.2
Divestiture of Interior business
-
(0.7)
-
24.9
Interest expense
45.6
51.3
93.0
102.8
Other expense, net
4.1
0.3
10.1
25.3
Pretax income
$ 55.8
$ 143.9
$ 165.3
$ 226.2

Non-GAAP Financial Information
Adjusted Segment Earnings
Three Months Q2 2008
Three Months Q2 2007
Electrical and
Electrical and
(in millions)
Seating
Electronic
Seating
Electronic
Sales
3,141.2
$
837.8
$
3,264.5
$
825.1
$
Segment earnings
130.0
$
31.2
$
238.8
$
23.5
$
Costs related to restructuring actions
43.2
9.4
11.6
15.1
Adjusted segment earnings
173.2
$
40.6
$
250.4
$
38.6
$
Six Months Q2 2008
Six Months Q2 2007
Electrical and
Electrical and
(in millions)
Seating
Electronic
Seating
Electronic
Sales
6,177.3
$
1,659.3
$
6,258.7
$
1,613.8
$
Segment earnings
313.3
$
66.5
$
435.9
$
41.0
$
Costs related to restructuring actions
56.8
18.9
7.0
35.1
Adjusted segment earnings
370.1
$
85.4
$
442.9
$
76.1
$
Non-GAAP Financial Information
Cash from Operations and Free Cash Flow
Three Months
(in millions)
Q2 2008
Net cash provided by operating activities
68.4
$
Net change in sold accounts receivable
(2.7)
Net cash provided by operating activities before net
change in sold accounts receivable
(cash from operations)
65.7
Capital expenditures
(50.0)
Free cash flow
15.7
$

Forward-Looking Statements
This presentation contains forward-looking statements within the meaning of the Private Securities Litigation
Reform Act of 1995, including statements regarding anticipated financial results and liquidity. Actual results may
differ materially from anticipated results as a result of certain risks and uncertainties, including but not limited to,
general economic conditions in the markets in which the Company operates, including changes in interest rates
or currency exchange rates, the financial condition of the Company’s customers or suppliers, changes in actual
industry vehicle production levels from the Company’s current estimates, fluctuations in the production of
vehicles for which the Company is a supplier, the loss of business with respect to, or the lack of commercial
success of, a vehicle model for which the Company is a significant supplier, including declines in sales
of full-size pickup trucks and large sport utility vehicles, disruptions in the relationships with the Company’s
suppliers, labor disputes involving the Company or its significant customers or suppliers or that otherwise affect
the Company, the Company's ability to achieve cost reductions that offset or exceed customer-mandated selling
price reductions, the outcome of customer productivity negotiations, the impact and timing of program launch costs,
the costs, timing and success of restructuring actions, increases in the Company's warranty or product liability
costs, risks associated with conducting business in foreign countries, competitive conditions impacting the
Company's key customers and suppliers, the cost and availability of raw materials and energy, the Company's
ability to mitigate increases in raw material, energy and commodity costs, the outcome of legal or regulatory
proceedings to which the Company is or may become a party, unanticipated changes in cash flow, including
the Company’s ability to align its vendor payment terms with those of its customers, the Company’s ability to
access capital markets on commercially reasonable terms and other risks described from time to time in the
Company's Securities and Exchange Commission filings. In particular, the Company’s financial outlook for 2008
is based on several factors, including the Company’s current industry vehicle production and raw material pricing assumptions. The Company’s actual financial results could differ materially as a result of significant changes
in these factors.
The forward-looking statements in this presentation are made as of the date hereof, and the Company does not
assume any obligation to update, amend or clarify them to reflect events, new information or circumstances
occurring after the date hereof.