Exhibit 99.2
Third Quarter 2011 Financial Results
October 28, 2011
Agenda
Company Highlights
– Matt Simoncini, President and CEO
• Third Quarter 2011 Financial Results and 2011 Outlook Quarter 2011 Financial
Jason Cardew, Interim CFO
Summary
Matt Simoncini, President and CEO
Q and A Session
2
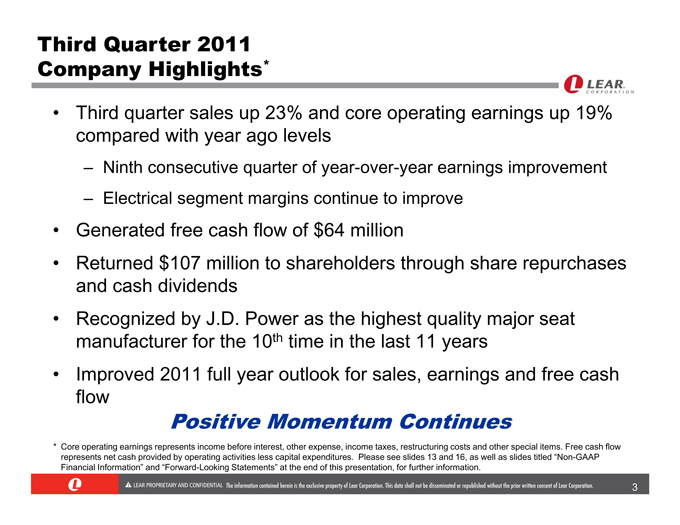
Third Quarter 2011 Company Highlights*
Third quarter sales up 23% and core operating earnings up 19% compared with year ago levels
Ninth consecutive quarter of year-over-year earnings improvement
Electrical segment margins continue to improve
Generated free cash flow of $64 million
Returned $107 million to shareholders through share repurchases and cash dividends
Recognized by J.D. Power as the highest quality major seat manufacturer for the 10th time in the last 11 years
Improved 2011 full year outlook for sales, earnings and free cash flow
Positive Momentum Continues
Core operating earnings represents income before interest, other expense, income taxes, restructuring costs and other special items. Free cash flow represents net cash provided by operating activities less capital expenditures. Please see slides 13 and 16, as well as slides titled “Non-GAAP Financial Information” and “Forward-Looking Statements” at the end of this presentation, for further information.
3
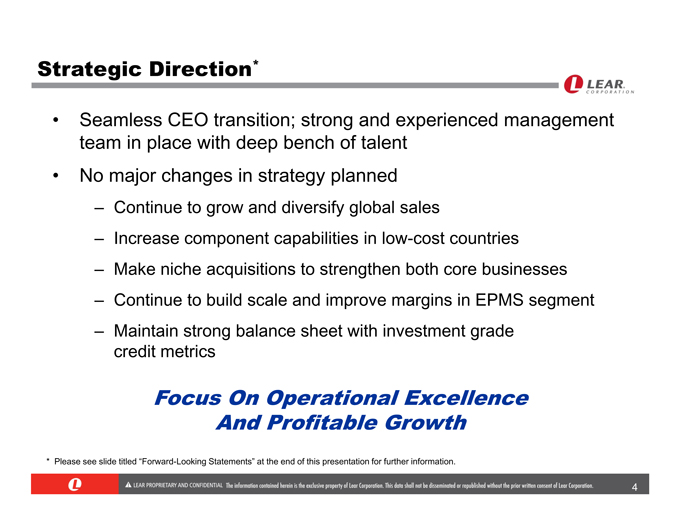
Strategic Direction*
Seamless CEO transition; strong and experienced management team in place with deep bench of talent
No major changes in strategy planned
Continue to grow and diversify global sales
Increase component capabilities in low-cost countries
Make niche acquisitions to strengthen both core businesses
Continue to build scale and improve margins in EPMS segment
Maintain strong balance sheet with investment grade credit metrics
Focus On Operational Excellence And Profitable Growth
Please see slide titled “Forward-Looking Statements” at the end of this presentation for further information.
4
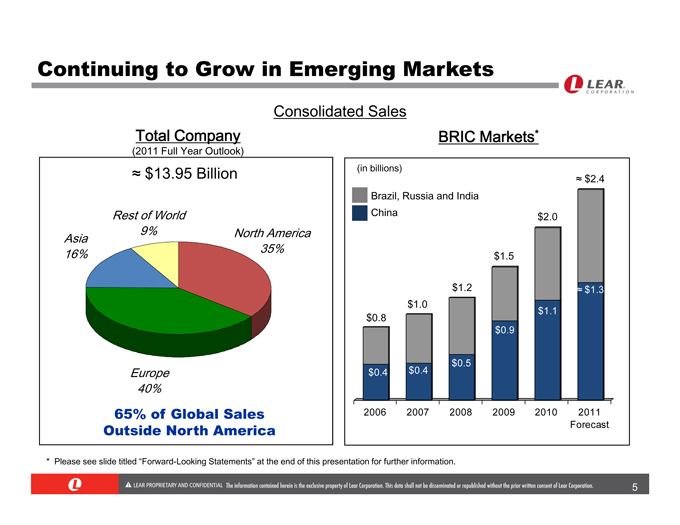
Continuing to Grow in Emerging Markets
Consolidated Sales
Total Company
(2011 Full Year Outlook)
$13.95 Billion
Rest of World 9%
North America 35%
Asia
16%
Europe 40%
65% of Global Sales Outside North America
BRIC Markets*
(in billions)
Brazil, Russia and India
China
$0.8
$1.0
$1.2
$1.5
$2.0
$2.4
$0.4
$0.4
$0.5
$0.9
$1.1
$1.3
2006
2007
2008
2009
2010
2011
Forecast
Please see slide titled “Forward-Looking Statements” at the end of this presentation for further information.
5
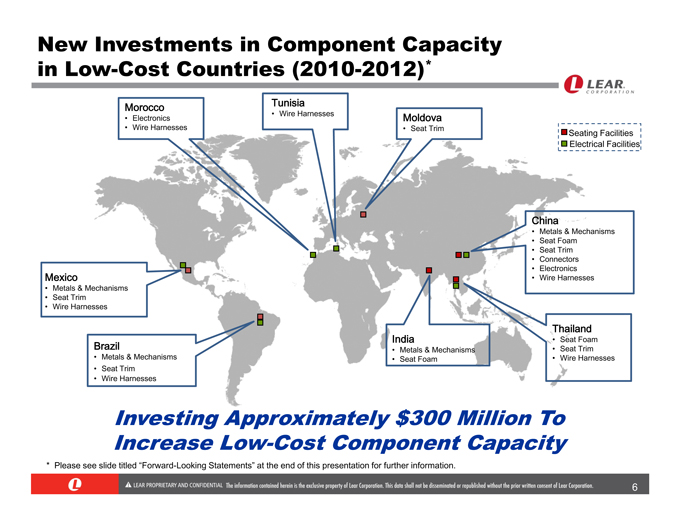
New Investments in Component Capacity in Low-Cost Countries (2010-2012)*
Morocco
• Electronics
• Wire Harnesses
Tunisia
• Wire Harnesses
Moldova
• Seat Trim
Mexico
• Metals & Mechanisms
• Seat Trim
• Wire Harnesses
Brazil
• Metals & Mechanisms
• Seat Trim
• Wire Harnesses
India
• Metals & Mechanisms
• Seat Foam Foam
Thailand
• Seat Foam
• Seat Trim
• Wire Harnesses
China
• Metals & Mechanisms
• Seat Foam
• Seat Trim
• Connectors
• Electronics
• Wire Harnesses
Seating Facilities Electrical Facilities
Investing Approximately $300 Million To Increase Low-Cost Component Capacity
Please see slide titled “Forward-Looking Statements” at the end of this presentation for further information.
6
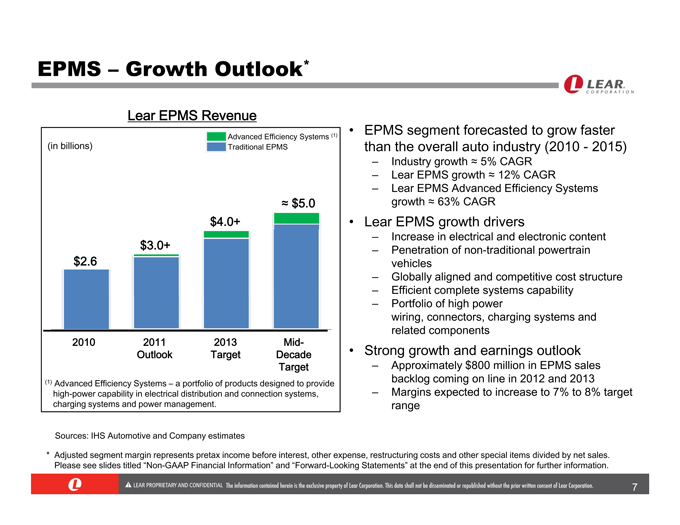
EPMS – Growth Outlook*
Lear EPMS Revenue
(in billions)
Advanced Efficiency Systems(1)
Traditional EPMS
$2.6
$3.0+
$4.0+
$5.0
2010
2011 Outlook
2013
Target
Mid-Decade Target
(1) Advanced Efficiency Systems – a portfolio of products designed to provide high-power capability in electrical distribution and connection systems, charging systems and power management.
EPMS segment forecasted to grow faster than the overall auto industry (2010 — 2015)
Industry growth 5% CAGR
Lear EPMS growth 12% CAGR
Lear EPMS Advanced Efficiency Systems growth 63% CAGR
Lear EPMS growth drivers
Increase in electrical and electronic content
Penetration of non-traditional powertrain vehicles
Globally aligned and competitive cost structure
Efficient complete systems capability
Portfolio of high power wiring, connectors, charging systems and related components
Strong growth and earnings outlook
Approximately $800 million in EPMS sales backlog coming on line in 2012 and 2013
Margins expected to increase to 7% to 8% target range
Sources: IHS Automotive and Company estimates
* Adjusted segment margin represents pretax income before interest, other expense, restructuring costs and other special items divided by net sales. Please see slides titled “Non-GAAP Financial Information” and “Forward-Looking Statements” at the end of this presentation for further information.
7
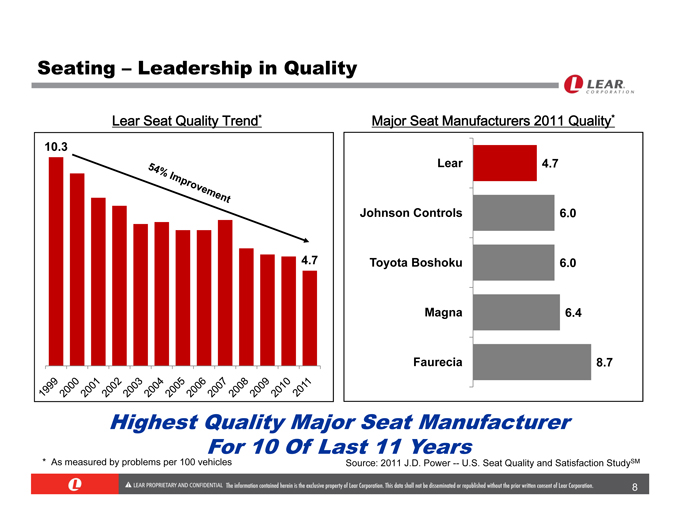
Seating – Leadership in Quality
Lear Seat Quality Trend*
54% Improvement
10.3
4.7
1999
2000
2001
2002
2003
2004
2005
2006
2007
2008
2009
2010
2011
Major Seat Manufacturers 2011 Quality*
Lear
Johnson Controls
Toyota Boshoku
Magna
Faurecia
4.7 6.0 6.0 6.4 8.7
Highest Quality Major Seat Manufacturer For 10 Of Last 11 Years
* As measured by problems per 100 vehicles
Source: 2011 J.D. Power — U.S. Seat Quality and Satisfaction StudySM
8
Third Quarter 2011 Financial Results
9
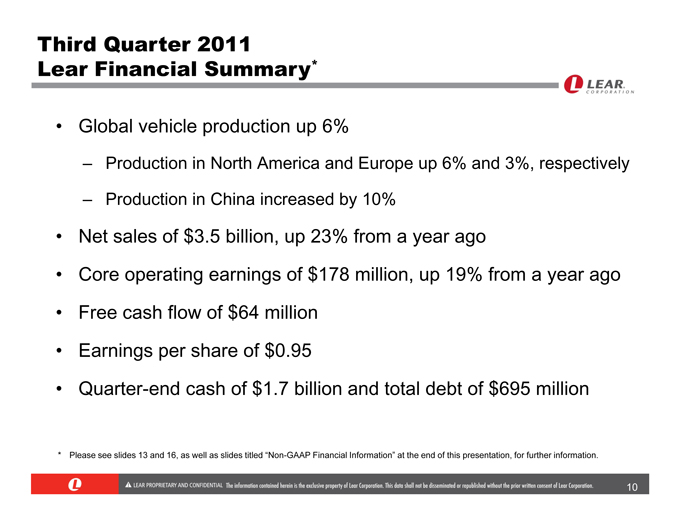
Third Quarter 2011 Lear Financial Summary*
Global vehicle production up 6%
Production in North America and Europe up 6% and 3%, respectively
Production in China increased by 10%
Net sales of $3.5 billion, up 23% from a year ago
Core operating earnings of $178 million, up 19% from a year ago
Free cash flow of $64 million
Earnings per share of $0.95
Quarter-end cash of $1.7 billion and total debt of $695 million
* Please see slides 13 and 16, as well as slides titled “Non-GAAP Financial Information” at the end of this presentation, for further information.
10
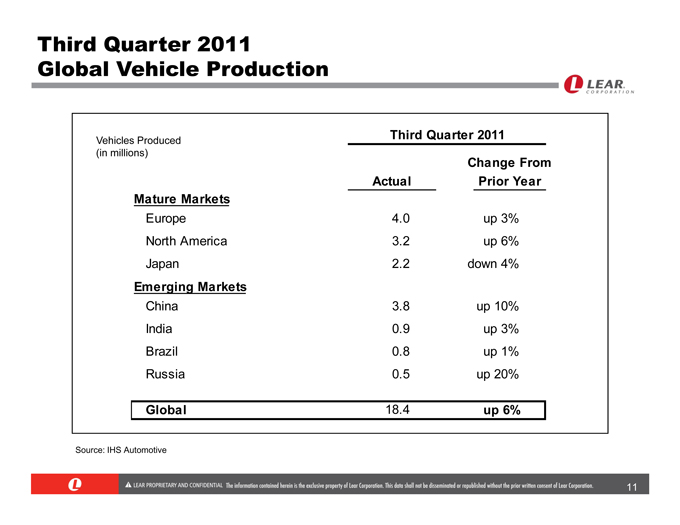
Third Quarter 2011 Global Vehicle Production
Vehicles Produced Third Quarter 2011
(in millions)
Change From
Actual Prior Year
Mature Markets
Europe 4.0 up 3%
North America 3.2 up 6%
Japan 2.2 down 4%
Emerging Markets
China 3.8 up 10%
India 0.9 up 3%
Brazil 0.8 up 1%
Russia 0.5 up 20%
Global 18.4 up 6%
Source: IHS Automotive
11
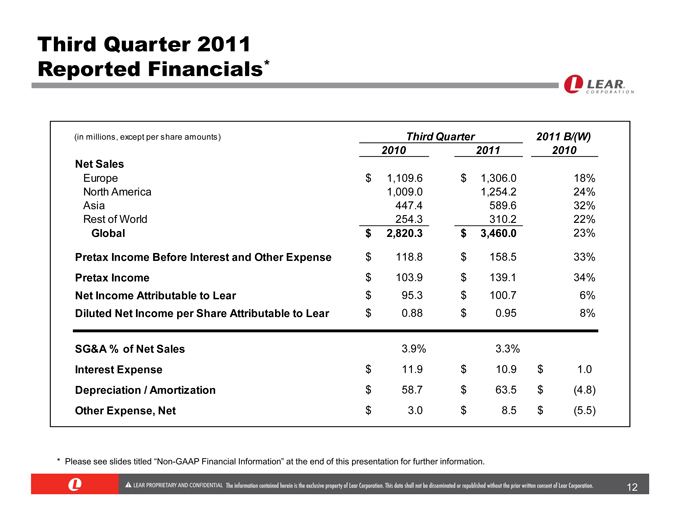
Third Quarter 2011 Reported Financials*
(in millions, except per share amounts) Third Quarter 2011 B/(W)
2010 2011 2010
Net Sales
Europe $ 1,109.6 $ 1,306.0 18%
North America 1,009.0 1,254.2 24%
Asia 447.4 589.6 32%
Rest of World 254.3 310.2 22%
Global $ 2,820.3 $ 3,460.0 23%
Pretax Income Before Interest and Other Expense $ 118.8 $ 158.5 33%
Pretax Income $ 103.9 $ 139.1 34%
Net Income Attributable to Lear $ 95.3 $ 100.7 6%
Diluted Net Income per Share Attributable to Lear $ 0.88 $ 0.95 8%
SG&A % of Net Sales 3.9% 3.3%
Interest Expense $ 11.9 $ 10.9 $ 1.0
Depreciation / Amortization $ 58.7 $ 63.5 $(4.8)
Other Expense, Net $ 3.0 $ 8.5 $(5.5)
* Please see slides titled “Non-GAAP Financial Information” at the end of this presentation for further information.
12
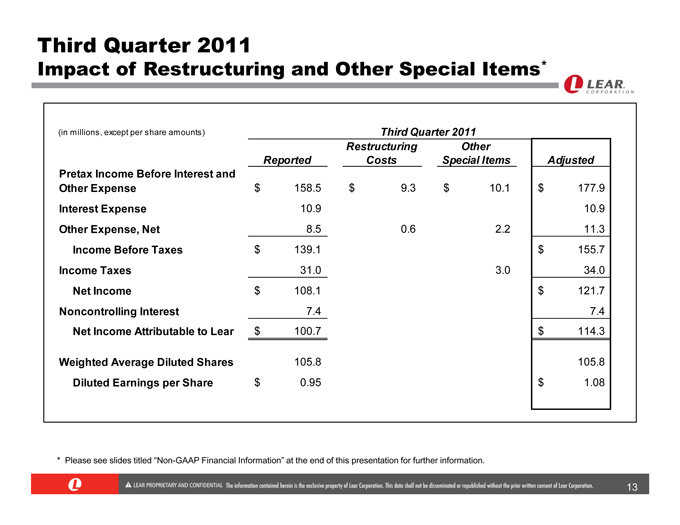
Third Quarter 2011
Impact of Restructuring and Other Special Items*
(in millions, except per share amounts) Third Quarter 2011
Restructuring Other
Reported Costs Special Items Adjusted
Pretax Income Before Interest and
Other Expense $ 158.5 $ 9.3 $ 10.1 $ 177.9
Interest Expense 10.9 10.9
Other Expense, Net 8.5 0.6 2.2 11.3
Income Before Taxes $ 139.1 $ 155.7
Income Taxes 31.0 3.0 34.0
Net Income $ 108.1 $ 121.7
Noncontrolling Interest 7.4 7.4
Net Income Attributable to Lear $ 100.7 $ 114.3
Weighted Average Diluted Shares 105.8 105.8
Diluted Earnings per Share $ 0.95 $ 1.08
* Please see slides titled “Non-GAAP Financial Information” at the end of this presentation for further information.
13
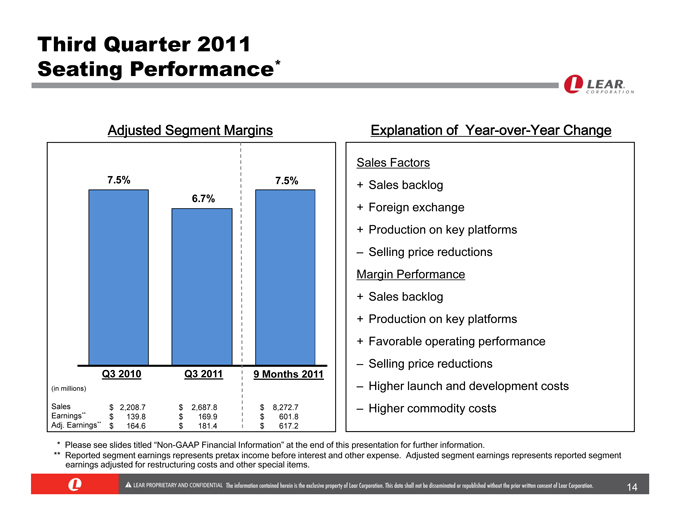
Third Quarter 2011 Seating Performance*
Adjusted segement Margins
7.5%
6.7%
7.5%
Q3 2010
Q3 2011
9 Months 2011
(in millions)
Sales $ 2,208.7 $ 2,687.8 $ 8,272.7
Earnings** $ 139.8 $ 169.9 $ 601.8
Adj. Earnings** $ 164.6 $ 181.4 $ 617.2
Explanation of Year-over-Year Change
Sales Factors
+ Sales backlog
+ Foreign exchange
+ Production on key platforms
– Selling price reductions Margin Performance
+ Sales backlog
+ Production on key platforms
+ Favorable operating performance
– Selling price reductions
– Higher launch and development costs
– Higher commodity costs
* Please see slides titled “Non-GAAP Financial Information” at the end of this presentation for further information.
** Reported segment earnings represents pretax income before interest and other expenses. Adjusted segment earnings represents reported segment earnings adjusted for restructuring costs and other special items.
14
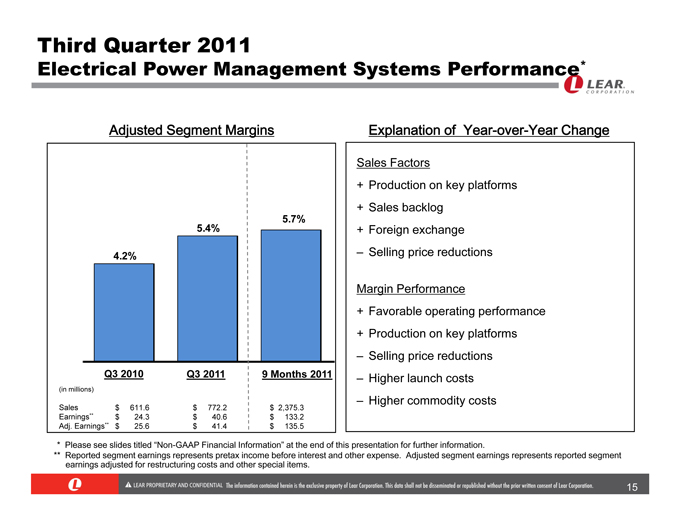
Third Quarter 2011
Electrical Power Management Systems Performance*
Adjusted Segment Margins
4.2%
5.4%
5.7%
Q3 2010 Q3 2011 9 Months 2011
(in millions)
Sales $ 611.6 $ 772.2 $ 2,375.3
Earnings** $ 24.3 $ 40.6 $ 133.2
Adj. Earnings** $ 25.6 $ 41.4 $ 135.5
Explanation of Year-over-Year Change
Sales Factors
+ Production on key platforms
+ Sales backlog
+ Foreign exchange
– Selling price reductions
Margin Performance
+ Favorable operating performance
+ Production on key platforms
– Selling price reductions
– Higher launch costs
– Higher commodity costs
* Please see slides titled “Non-GAAP Financial Information” at the end of this presentation for further information.
** Reported segment earnings represnts pretax income before interest and other expense. Adjusted segment earnings represents reported segment earnings adjusted for restructuring costs and other special items.
15
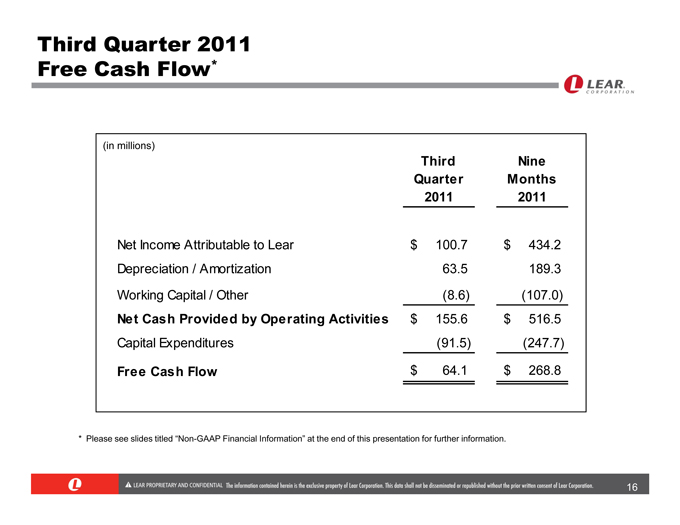
Third Quarter 2011 Free Cash Flow*
(in millions)
Third Nine
Quarter Months
2011 2011
Net Income Attributable to Lear $ 100.7 $ 434.2
Depreciation / Amortization 63.5 189.3
Working Capital / Other (8.6) (107.0)
Net Cash Provided by Operating Activities $ 155.6 $ 516.5
Capital Expenditures (91.5) (247.7)
Free Cash Flow $ 64.1 $ 268.8
* Please see slides titled “Non-GAAP Financial Information” at the end of this presentation for further information.
16
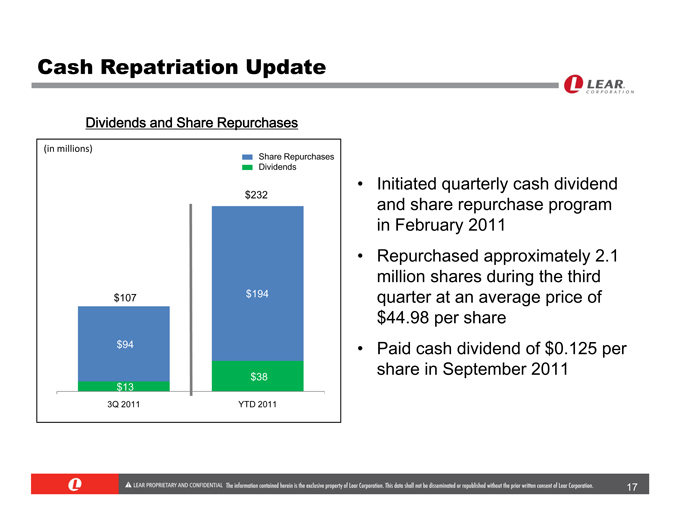
Cash Repatriation Update
Dividends and Share Repurchases
(in millions)
Share repurchases
Dividends
$232
$107
$94
$13
3Q 2011
$194
$38
YTD 2011
Initiated quarterly cash dividend and share repurchase program in February 2011
Repurchased approximately 2.1 million shares during the third quarter at an average price of $44.98 per share
Paid cash dividend of $0.125 per share in September 2011
17
2011 Outlook
18
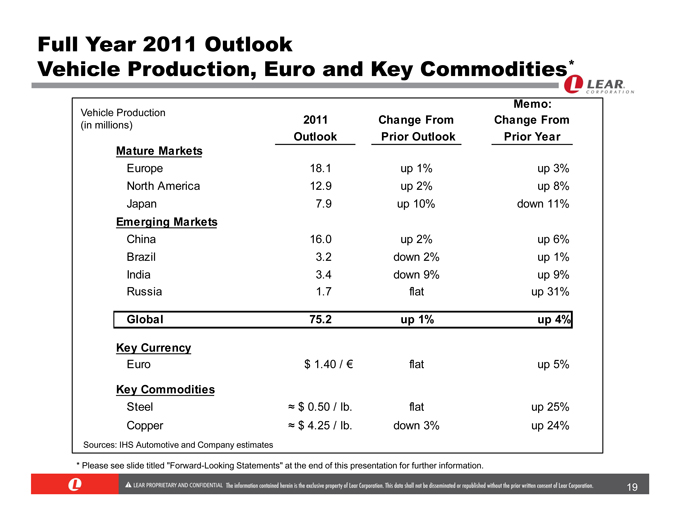
Full Year 2011 Outlook
Memo: Vehicle Production, Euro and Key Commodities*
Vehicle Production
(in millions) 2011 Change From Change From
Outlook Prior Outlook Prior Year
Mature Markets
Europe 18.1 up 1% up 3%
North America 12.9 up 2% up 8%
Japan 7.9 up 10% down 11%
Emerging Markets
China 16.0 up 2% up 6%
Brazil 3.2 down 2% up 1%
India 3.4 down 9% up 9%
Russia 1.7 flat up 31%
Global 75.2 up 1% up 4%
Key Currency
Euro $ 1.40 / € flat up 5%
Key Commodities
Steel $ 0.50 / lb. flat up 25%
Copper $ 4.25 / lb. down 3% up 24%
Sources: IHS Automotive and Company estimates
* Please see slide titled “Forward-Looking Statements” at the end of this presentation for further information.
19
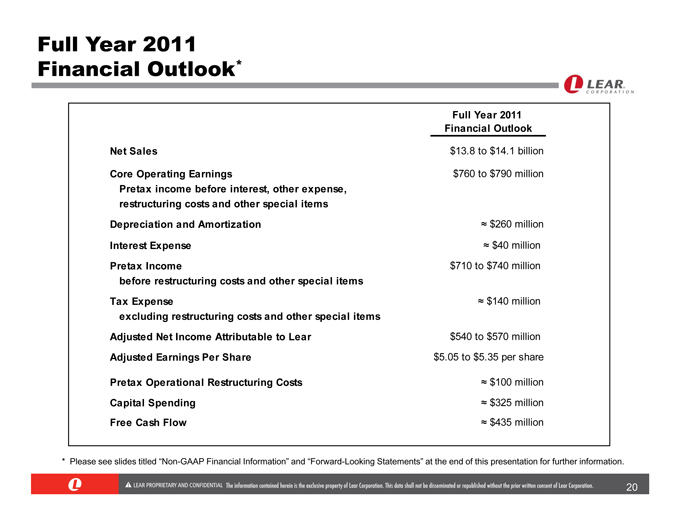
Full Year 2011 Financial Outlook*
Full Year 2011
Financial Outlook
Net Sales $13.8 to $14.1 billion
Core Operating Earnings $760 to $790 million
Pretax income before interest, other expense,
restructuring costs and other special items
De preciation and Amortization $260 million
Interest Expense $40 million
Pretax Income $710 to $740 million
before restructuring costs and other special items
Tax Expense $140 million
excluding restructuring costs and other special items
Adjusted Net Income Attributable to Lear $540 to $570 million
Adjusted Earnings Per Share $5.05 to $5.35 per share
Pretax Operational Restructuring Costs $100 million
Capital Spending $325 million
Free Cash Flow $435 million
* Please see slides titled “Non-GAAP Financial Information” and “Forward-Looking Statements” at the end of this presentation for further information.
20
Summary
21
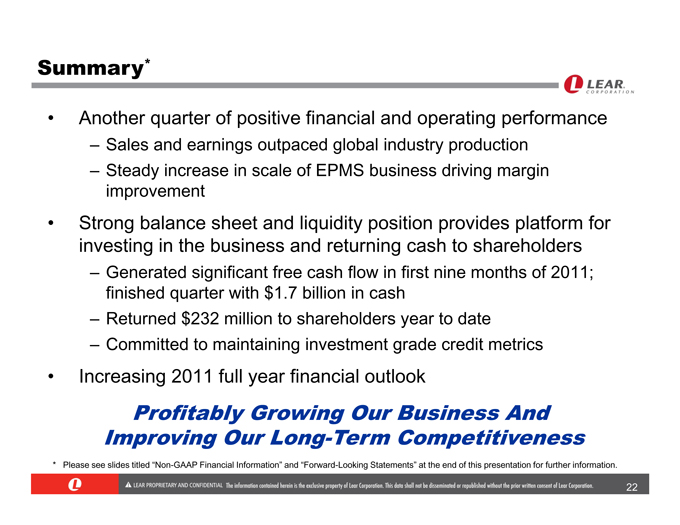
Summary*
Another quarter of positive financial and operating performance
Sales and earnings outpaced global industry production
Steady increase in scale of EPMS business driving margin improvement
Strong balance sheet and liquidity position provides platform for investing in the business and returning cash to shareholders
Generated significant free cash flow in first nine months of 2011; finished quarter with $1.7 billion in cash
Returned $232 million to shareholders year to date
Committed to maintaining investment grade credit metrics
Increasing 2011 full year financial outlook
Profitably Growing Our Business And Improving Our Long-Term Competitiveness
* Please see slides titled “Non-GAAP Financial Information” and “Forward-Looking Statements” at the end of this presentation for further information.
22
Non-GAAP Financial Information
In addition to the results reported in accordance with accounting principles generally accepted in the United States (“GAAP”) included throughout this presentation, the Company has provided information regarding “pretax income before interest and other expense,” “pretax income before interest, other expense, restructuring costs and other special items” (core operating earnings), “pretax income before restructuring costs and other special items,” “adjusted net income attributable to Lear,” “adjusted diluted net income per share attributable to Lear” (adjusted earnings per share), “tax expense excluding impact of restructuring costs and other special items” and “free cash flow” (each, a non-GAAP financial measure). Other expense includes, among other things, equity in net income of affiliates, non-income related taxes, foreign exchange gains and losses, gains and losses related to certain derivative instruments and hedging activities and gains and losses on the sales of assets. Adjusted net income attributable to Lear and adjusted earnings per share represent net income attributable to Lear and diluted net income per share attributable to Lear, respectively, adjusted for restructuring costs and other special items, including the tax effect thereon, and other discrete tax items. Free cash flow represents net cash provided by operating activities less capital expenditures.
Management believes the non-GAAP financial measures used in this presentation are useful to both management and investors in their analysis of the Company’s financial position and results of operations. In particular, management believes that pretax income before interest and other expense, core operating earnings, pretax income before restructuring costs and other special items, adjusted net income attributable to Lear, adjusted earnings per share and tax expense excluding impact of restructuring costs and other special items are useful measures in assessing the Company’s financial performance by excluding certain items that are not indicative of the Company’s core operating performance or that may obscure trends useful in evaluating the Company’s continuing operating activities. Management also believes that these measures are useful to both management and investors in their analysis of the Company’s results of operations and provide improved comparability between fiscal periods. Management believes that free cash flow is useful to both management and investors in their analysis of the Company’s ability to service and repay its debt. Further, management uses these non-GAAP financial measures for planning and forecasting future periods.
Pretax income before interest and other expense, core operating earnings, pretax income before restructuring costs and other special items, adjusted net income attributable to Lear, adjusted earnings per share, tax expense excluding impact of restructuring costs and other special items and free cash flow should not be considered in isolation or as a substitute for pretax income, net income attributable to Lear, diluted net income per share attributable to Lear, cash provided by operating activities or other statement of operations or cash flow statement data prepared in accordance with GAAP or as a measure of profitability or liquidity. In addition, the calculation of free cash flow does not reflect cash used to service debt and therefore, does not reflect funds available for investment or other discretionary uses. Also, these non-GAAP financial measures, as determined and presented by the Company, may not be comparable to related or similarly titled measures reported by other companies.
Set forth on the slides 13 and 16, as well as the following slides, are reconciliations of these non-GAAP financial measures to the most directly comparable financial measures calculated and presented in accordance with GAAP. Given the inherent uncertainty regarding special items and other expense in any future period, a reconciliation of forward-looking financial measures to the most directly comparable financial measures calculated and presented in accordance with GAAP is not feasible. The magnitude of these items, however, may be significant.
23
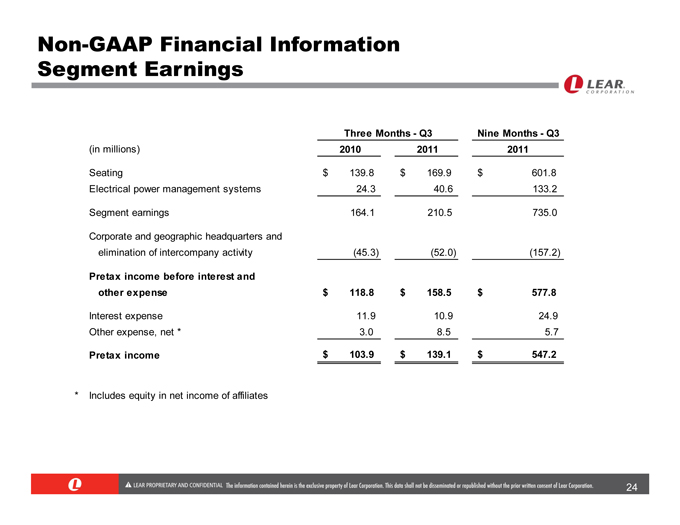
Non-GAAP Financial Information Segment Earnings
Three Months—Q3 Nine Months—Q3
(in millions) 2010 2011 2011
Seating $ 139.8 $ 169.9 $ 601.8
Electrical power management systems 24.3 40.6 133.2
Segment earnings 164.1 210.5 735.0
Corporate and geographic headquarters and
elimination of intercompany activity (45.3) (52.0) (157.2)
Pretax income before interest and
other expense $ 118.8 $ 158.5 $ 577.8
Interest expense 11.9 10.9 24.9
Other expense, net * 3.0 8.5 5.7
Pretax income $ 103.9 $ 139.1 $ 547.2
* Includes equity in net income of affiliates
24
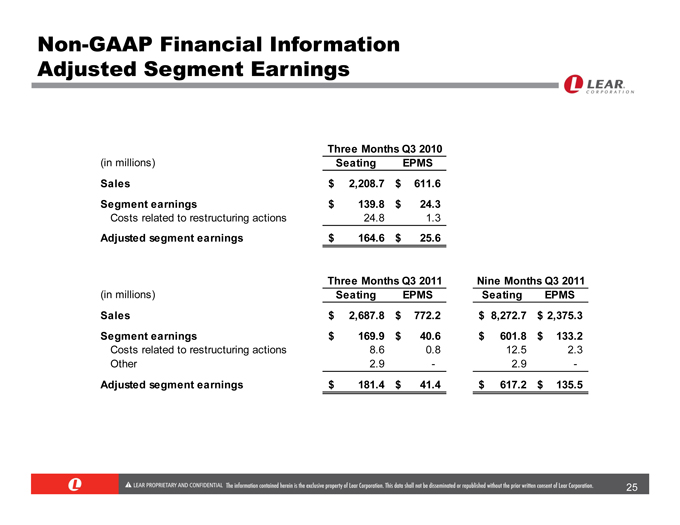
Non-GAAP Financial Information Adjusted Segment Earnings
Three Months Q3 2010
(in millions) Seating EPMS
Sales $ 2,208.7 $ 611.6
Segment earnings $ 139.8 $ 24.3
Costs related to restructuring actions 24.8 1.3
Adjusted segment earnings $ 164.6 $ 25.6
Three Months Q3 2011 Nine Months Q3 2011
(in millions) Seating EPMS Seating EPMS
Sales $ 2,687.8 $ 772.2 $ 8,272.7 $ 2,375.3
Segment earnings $ 169.9 $ 40.6 $ 601.8 $ 133.2
Costs related to restructuring actions 8.6 0.8 12.5 2.3
Other 2.9 - 2.9 -
Adjusted segment earnings $ 181.4 $ 41.4 $ 617.2 $ 135.5
25
Forward-Looking Statements
This presentation contains forward-looking statements within the meaning of the Private Securities Litigation Reform Act of 1995, including statements regarding anticipated financial results and liquidity. The words “will,” “may,” “designed to,” “outlook,” “believes,” “should,” “anticipates,” “plans,” “expects,” “intends,” “estimates,” “forecasts” and similar expressions identify certain of these forward-looking statements. The Company also may provide forward-looking statements in oral statements or other written materials released to the public. All such forward-looking statements contained or incorporated in this presentation or in any other public statements which address operating performance, events or developments that the Company expects or anticipates may occur in the future, including, without limitation, statements related to business opportunities, awarded sales contracts, sales backlog and ongoing commercial arrangements, or statements expressing views about future operating results, are forward-looking statements. Actual results may differ materially from any or all forward-looking statements made by the Company. Important factors, risks and uncertainties that may cause actual results to differ materially from anticipated results include, but are not limited to, general economic conditions in the markets in which the Company operates, including changes in interest rates or currency exchange rates; the financial condition and restructuring actions of the Company’s customers and suppliers; changes in actual industry vehicle production levels from the Company’s current estimates; fluctuations in the production of vehicles or the loss of business with respect to, or the lack of commercial success of, a vehicle model for which the Company is a significant supplier; disruptions in the relationships with the Company’s suppliers; labor disputes involving the Company or its significant customers or suppliers or that otherwise affect the Company; the outcome of customer negotiations and the impact of customer-imposed price reductions; the impact and timing of program launch costs and the Company’s management of new program launches; the costs, timing and success of restructuring actions; increases in the Company’s warranty, product liability or recall costs; risks associated with conducting business in foreign countries; competitive conditions impacting the Company and its key customers and suppliers; the cost and availability of raw materials, energy, commodities and product components and the Company’s ability to mitigate such costs; the outcome of legal or regulatory proceedings to which the Company is or may become a party; the impact of pending legislation and regulations or changes in existing federal, state, local or foreign laws or regulations; unanticipated changes in cash flow, including the Company’s ability to align its vendor payment terms with those of its customers; limitations imposed by the Company’s existing indebtedness and the Company’s ability to access capital markets on commercially reasonable terms; impairment charges initiated by adverse industry or market developments; the Company’s ability to execute its strategic objectives; changes in discount rates and the actual return on pension assets; costs associated with compliance with environmental laws and regulations; developments or assertions by or against the Company relating to intellectual property rights; the Company’s ability to utilize its net operating loss, capital loss and tax credit carryforwards; the impact of any failure by the United States or any other country to satisfy its obligations, a downgrade (or the prospect of a downgrade) of credit ratings assigned to any such obligations and other similar developments relating to the global credit markets and economic conditions; the impact of pending and future governmental actions in the United States or any other country to address budget deficits through reductions in spending and/or revenue increases; and other risks described from time to time in the Company’s Securities and Exchange Commission filings. Future operating results will be based on various factors, including actual industry production volumes, commodity prices and the Company’s success in implementing its operating strategy.
Information in this presentation relies on assumptions in the Company’s sales backlog. The Company’s sales backlog reflects anticipated net sales from formally awarded new programs net of lost and cancelled programs. The calculation of the sales backlog does not reflect customer price reductions on existing or newly awarded programs. The sales backlog may be impacted by various assumptions embedded in the calculation, including vehicle production levels on new programs, foreign exchange rates and the timing of major program launches. Sales backlog assumes volumes based on the most recent IHS Automotive production forecast and a Euro exchange rate of $1.40/Euro. For purposes of this presentation, the sales backlog includes data for the full years 2011-2013.
The forward-looking statements in this presentation are made as of the date hereof, and the Company does not assume any obligation to update, amend or clarify them to reflect events, new information or circumstances occurring after the date hereof.
26